Editors: Ali Ghaffarianhoseini Amirhosein Ghaffarianhoseini Nicola ...
1402
The 54th International Conference of the Architectural Science Association 26 & 27 November 2020 Editors: Ali Ghaffarianhoseini Amirhosein Ghaffarianhoseini Nicola Naismith Imaginable Futures: Design Thinking, and the Scientific Method
-
Upload
khangminh22 -
Category
Documents
-
view
0 -
download
0
Transcript of Editors: Ali Ghaffarianhoseini Amirhosein Ghaffarianhoseini Nicola ...

The 54th International Conference of the Architectural Science Association 26 & 27 November 2020
Editors:
Ali Ghaffarianhoseini Amirhosein Ghaffarianhoseini
Nicola Naismith
Imaginable Futures: Design Thinking, and the Scientific Method


i
The 54th International Conference of the Architectural Science Association (ANZAScA) 2020
Edited by: Ali Ghaffarianhoseini, Amirhosein Ghaffarianhoseini, and Nicola Naismith
Co-Editors: Mahesh Babu Purushothaman, Dat Doan, Esther Aigwi, Funmi Rotimi, Nariman Ghodrati
Published by: The Architectural Science Association (ANZAScA)
Hosted by: School of Future Environments, Built Environment Engineering, Auckland University of Technology, Auckland, NewZealand
Printed in Auckland, New Zealand
Example of how to cite a paper from these proceedings: Lastname, A. (2020) Example Title of ASA 2020, in A. Ghaffarianhoseini, A. Ghaffarianhoseini and N. Nasmith (eds), Imaginable Futures: Design Thinking, and the Scientific Method, 54th International Conference of the Architectural Science Association 2020, 26-27 November 2020, Auckland University of Technology, Auckland, New Zealand, pp. 1-10.
©2020, All rights reserved and published by The Architectural Science Association (ANZAScA), Australia ISBN 978-0-9923835-7-2
The copyright in these proceedings belongs to the Architectural Science Association (ANZAScA). Copyright of the papers contained in these proceedings remains the property of the authors. Apart from fair dealing for the purpose of private study, research or review, as permitted under the Copyright Act, no part of this book may be reproduced by any process without the prior permission of the publishers and authors.

The 54th International Conference of the Architectural Science Association (ANZAScA) 2020
ii
The Australia and New Zealand Architectural Science Association (ANZScA) is an international organisation, the objective of which is to promote architectural science, theory and practice primarily in relation to teaching and research in institutions of higher education. ANZScA is a membership-based non-profit organisation that was formed on the initiative of Professor Henry (Jack) Cowan, Derrick Kendrick and other Architectural Science academics to enable them to meet, discuss, and exchange information about their research and teaching. The membership is drawn from architecture schools in Australia and New Zealand and is open to students and professionals who also contribute to the research and teaching of other technical subjects.
ANZScA has a membership of several thousand professionals, academics and students from many countries. The first meeting was held in 1963 in Adelaide. A few years later, annual conferences were introduced, hosted by one of the universities in the region. The annual conference brings together Architectural science researchers, educators, students, and industry from Australasia and other regions, and provides them with a robust platform for knowledge sharing, collaboration, disciplinary reflections, institutional exchange, and collective growth.
The 54th International Conference of the Architectural Science Association (ANZAScA) 2020 was held virtually, from 26th to 28th November 2020, under the auspices of the School of Future Environments, Auckland University of Technology, New Zealand. The conference theme was ‘Imaginable Futures: Design Thinking, and Scientific Methods’. The theme explored various facets of explicit relevance and tangible contribution to the interdisciplinary areas of architectural design, building science and technology, healthy and intelligent buildings, digital environments, urban design, and future cities. The topic categories include: ‘Acoustics’, ‘Architectural Science, Design and Environment Science, Urban Science’, ‘Building Case Studies and Post Occupancy Evaluation’, ‘Building, Tectonics and Energy’, ‘Carbon Reduction in Built Environments’, ‘Construction, Building Materials and Integrated Technology’, ‘Daylighting/Lighting’, ‘Design Education and Research’, ‘Design Thinking and Innovation’, ‘Digital Architecture, BIM and City Information Modelling (CIM)’, ‘History and Theory in Architectural Science’, ‘Modes of Production and Mass Customisation’, ‘Natural Ventilation’, ‘Practice-Based and Interdisciplinary Design and Research’, ‘Simulation, Prediction and Evaluation’, ‘Smart and Intelligent Cities’, ‘Thermal Comfort and Indoor Air Quality’, ‘Slow Urban Environments’, and ‘Social Cities - Inter-Generational Cities.
Each paper in these proceedings has undergone a rigorous peer review process. Following the call for abstracts in March 2020, a total of 291 abstracts were submitted for review. Each abstract was blind peer reviewed by two members of our International Scientific Committee, made up of 158 experts from 15 countries, across four continents. Of these, 188 abstracts were accepted for development into a full paper. Following this, 188 full papers were submitted, each of which was again blind peer reviewed by two to three members of our International Scientific Committee. Based on the reviewers’ recommendations, 143 papers were accepted for presentation at the conference, and 140 are included in this publication.
Foreword

The 54th International Conference of the Architectural Science Association (ANZAScA) 2020
iii
To maintain and assure the quality of the conference proceedings, each abstract received was peer-reviewed. The authors received anonymous reviewers’ comments on their abstracts and were invited to submit their initial full papers. All the initial full papers were peer-reviewed with anonymous reviewers’ comments before final acceptance to the conference. The accepted final papers were included in the conference presentation programme and the proceedings.
Ali Ghaffarianhoseini, Amirhosein Ghaffarianhoseini and Nicola Naismith
Auckland 2020

The 54th International Conference of the Architectural Science Association (ANZAScA) 2020
iv
Organising Committee
Chairs:
Dr Ali Ghaffarianhoseini, AUT, NZ Prof Charles Walker, AUT, NZ Prof John Tookey, AUT, NZ
Co-chairs:
Dr Amirhosein Ghaffarianhoseini, AUT, NZ Dr Timothy Anderson, AUT, NZ Assoc Prof Nicola Naismith, AUT, NZ
Steering Committee
Dr Dat Doan, AUT, NZ Dr Esther Aigwi, AUT, NZ Dr Funmi Rotimi, AUT, NZ Dr Mahesh Babu, AUT, NZ Dr Nariman Ghodrati, AUT, NZ
International Scientific Committee:
Assoc Prof Farzad Pourrahimian Teesside University, UK Assoc Prof Robert Crawford, University of Melbourne, Australia Assoc Prof Umberto Berardi, Ryerson University, Canada Assoc Prof Michael Donn, Victoria University of Wellington, NZ Dr Paola Boarin, The University of Auckland, NZ Dr Reza Hosseini, Deakin University, Australia Dr Alessandro Premier, The University of Auckland, NZ Guy Marriage, Victoria University of Wellington, NZ Prof Allesandro Melis, University of Portsmouth, UK Prof Derek Clements-Croome, University of Reading, UK Prof Marc Aurel Schnabel, Victoria University of Wellington, NZ Prof Robyn Phipps, Massey University, NZ Assoc Prof. Zhihua Wang, Arizona State University, USA Prof David Sailor, Arizona State University, USA Dr Jeremy Trombley, Charles Darwin University, AUS Dr Chamil Erik Ramanayaka, Curtin University, Australia Assoc Prof Danny Hin Wa LI, City University of Hong Kong, Hong Kong Assoc Prof James Rotimi, Massey University, NZ Assoc Prof Stefano Schiavon, University of Berkeley, USA Dr Ruggiero Lovreglio, Massey University, NZ Dr Vicente Gonzales, University of Auckland, NZ Dr Karam Al-Obaidi, Sheffield Hallam University, UK Prof Yahaya Ahmad, University of Malaya, Malaysia Dr Negin Nazarian, University of New South Wales, Australia Assoc Prof. Ann Morrison, AUT, NZ Dr Alstan Jakubiec, University of Toronto, Canada Prof Jaffer AA Khan, Jaff Design Studio, NZ and India Dr Roberto Garay Martinez, Tecnalia, Spain
Prof George Baird, Victoria University of Wellington, NZ
Committees

The 54th International Conference of the Architectural Science Association (ANZAScA) 2020
v
Prof Norhaslina Hassan, University of Malaya, Malaysia Assoc Prof Mohsen Tabassi, Azad University, Iran Prof Edward NG, Chinese University of Hong Kong, Hong Kong Prof Frances Joseph, AUT, NZ Dr Mohammad Heidarinejad, Illinois Institute of Technology, USA Dr Mohammad Taleghani, University of Salford, UK Dr Zahra Hamedani, Griffith University, AUS Dr Maibritt Pedersen Zari, Victoria University of Wellington NZ Dr Nur Dalilah Dahlan, UPM, Malaysia Dr Mohd Shahrudin, UPM, Malaysia Assoc Prof Dr Nasrin Aghamohammadi, University of Malaya, Malaysia
Reviewing Committee:
Afolabi Dania, University College of Estate Management, UK Dr Alessandro Premier, University of Auckland, NZ Dr Ali GhaffarianHoseini, AUT, NZ Dr Alessandro Melis, University of Portsmouth, UK Amarachukwu Nwadike, Massey University, NZ Dr Amirhosein GhaffarianHoseini, AUT, NZ An Le, Massey University, NZ Assoc Prof Anders Hermund, Royal Danish Academy, Denmark Andrea Jia, University of Melbourne, Australia Dr Anthony Okakpu, AUT, NZ Attiq Ur Rehman, AUT, NZ Dr Ayokunle Olanipekun, Massey University, NZ Azin Jalali, Tehran University, NZ Assoc Prof Chunlu Liu, Deakin University, Australia Damiloju Adeyina, AUT, NZ Prof. LI Hin Wa, City University of Hong Kong, Hong Kong Dr Dat Doan, AUT, NZ Prof David Sailor, Arizona State University, US Dr Don Samarasinghe, Otago Polytechnic, NZ Dr Anne Staal, AUT, NZ Prof Edward Ng Yan Yung, Chinese University of Hong Kong, Hong Kong Dr Emina Petrovic, Victoria University of Wellington, NZ Dr Esther Aigwi, AUT, NZ Dr Eziaku Rasheed, Massey University, NZ Dr Funmilayo Ebun Rotimi, AUT, NZ Prof George Baird, Victoria University of Wellington, NZ Dr Gou Zhonghua, Griffith University, Australia Guy Marriage, Victoria University of Wellington, NZ Hossein Omrany, University of Adelaide, Australia Dr Ifigenia Psarra, Hanze University of Applied Sciences, Netherlands Jad Kmail, AUT, NZ Dr Jaffer Khan, Vellore Institute of Technology, India Assoc Prof James Rotimi, Massey University, NZ Jas Qadir Abdul, AUT, NZ Dr Jasim Azhar, King Fahd University of Petroleum and Miner, Saudi Arabia Dr Jeff Seadon, AUT, NZ Dr Jeremy Trombley, Charles Darwin University, Australia Dr Jin Woo, RMIT University, Australia Kara Rosemeier, Passive House Academy, NZ Dr Kerry Francis, Unitec Institute of Technology, NZ Dr M. Reza Hosseini, Deakin University, Australia Mahdi Valitabar, University of Zanjan, Islamic Republic of Iran Dr Mahesh Babu Purushothaman, AUT, NZ Dr Mani Poshdar, AUT, NZ

The 54th International Conference of the Architectural Science Association (ANZAScA) 2020
vi
Dr Mark Dewsbury, University of Tasmania, Australia Dr Mark Olweny, University of Lincoln, UK Dr Mary Myla Andamon, RMIT University, Australia Megan Burfoot, AUT, NZ Milad Moradibistouni, Victoria University of Wellington, NZ Dr Mohammad Heidarinejad, Illinois Institute of Technology, US Dr Mohammad Taleghani, Leeds Beckett University, UK Dr Mohd Shahrudin Abd Manan, Universiti Putra Malaysia, Malaysia Dr Mohsen Tabassi, Islamic Azad University, Islamic Republic of Iran Dr Morten Gjerde, Victoria University of Wellington, NZ Nan Zhao, AUT, NZ Dr Nariman Ghodrati, AUT, NZ Assoc Prof Nasrin Aghamohammadi, University of Malaya, Malaysia Assoc Prof Nicola Naismith, AUT, NZ Dr Nigel Isaacs, Victoria University of Wellington, NZ Dr Niluka Domingo, Massey University, NZ Prof Norhaslina Hassan, University of Malaya, Malaysia Dr Okechukwu Nwadigo, AUT, NZ Dr Paola Boarin, University of Auckland, NZ Dr Peter Horan, Deakin University, Australia Prof Priya Rajagopalan, RMIT University, Australia Prof Jimoh Richard Ajayi, Federal University of Technology Minna, Nigeria Assoc Prof Robert H. Crawford, University of Melbourne, Australia Dr Roberto Garay Martinez, Tecnalia, Spain Prof Robyn Phipps, Massey University, NZ Dr Roohollah Kalatehjari, AUT, NZ Dr Ruggiero Lovreglio, Massey University, NZ Sameh Azzazy, AUT, NZ Sammy Chalangar, Architectural Designer, NZ Dr Shahab Ramhormozian, AUT, NZ Dr Shuva Chowdhury, Southern Institute of Technology, NZ Dr Sue Wake, Unitec Institute of Technology, NZ Dr Tim Anderson, AUT, NZ Tineke van der Schoor, Hanze University of Applied Sciences, Netherlands Assoc Prof Umberto Berardi, Ryerson University, Canada Dr Wajiha Shahzad, Massey University, NZ Yusef Patel, Unitec Institute of Technology, NZ Zahra Balador, Victoria University of Wellington, NZ Zahra Hamedani, Griffith University, Australia
SPONSORS AND SUPPORTERS

The 54th International Conference of the Architectural Science Association (ANZAScA) 2020
vii
Table of Contents
A bio-hygrothermal mould growth analysis of typical Australian residential wall systems ................. 1 Shruti Nath, Mark Dewsbury, Phillipa Watson, Heather Lovell and Hartwig Künzel
A comparative study between Daylight Factor Based Metric and other Daylight Metrics for Daylighting Design......................................................................................................................... 11 Shuyang Li, Danny H.W. Li and Wenqiang Chen
A computer vision deep learning method for the detection and recognition of manual window openings for effective operations of HVAC systems in buildings ......................................... 21 Paige Wenbin Tien, Shuangyu Wei, John Kaiser Calautit, Jo Darkwa and Christopher Wood
A conceptual framework for construction and demolition waste prevention in building’s design phase ....................................................................................................................................... 31 Gabriela Dias Guimaraes1, Ning Gu, Vanessa Gomes, and Jorge Ochoa Paniagua
A content analysis of sustainability declaration in Australian universities ......................................... 41 Maryam Khoshbakht, Mahsa Zomorodian, Mohamad Tahsildoost
A critical review of the system-wide waste in the construction industry .......................................... 51 Mahesh Babu Purushothaman and Jeff Seadon
A cultural perspective to manage conflicts in cross cultural project teams: A literature review ................................................................................................................................................. 61 Miyami Dasandara, Nirusika Rajenthiran, Piumi Dissanayake and Aparna Samaraweera
A deep learning approach to personal thermal comfort models for an ageing population ............... 71 Larissa Arakawa Martins, Veronica Soebarto, Terence Williamson and Dino Pisaniello
A Framework for Optimizing Tall Building Form to Reduce Solar Reflection Impacts ........................ 81 Mahnaz Farahani, Mohammadjavad Mahdavine and Peiman Pilechiha
A Framework for Quantifying the Temporal Visual Experience of Architecture ................................ 91 Sayyed Amir Hossain Maghool, Marc Aurel Schnabel and Tane Moleta
A Framework to Assess Publicness in Multicultural Streets ............................................................. 101 Maryam Lesan
A novel approach to understanding people’s housing preferences ................................................. 111 Morten Gjerde and Rebecca Kiddle
A numerical study on the non-local effects of urban form in the lower atmosphere: implications for urban climate modeling .......................................................................................... 121 Yanle Lu and Qi Li
A simulation study to assess the energy efficiency and thermal comfort performance of internal wall assemblies for residential construction in warm and humid climate .......................... 131 Shailee Goswami and Vinay Natrajan
A study of illuminance data generation using the luminous efficacy approach: A case study of Hong Kong .................................................................................................................................... 141 Emmanuel Aghimien, Danny Li

The 54th International Conference of the Architectural Science Association (ANZAScA) 2020
viii
An Analysis on the Benefits of Vernacular Architecture to Design Passivhaus Buildings in Kurdistan ........................................................................................................................................... 151 Ban Jalal Ahmed and Carlos Jimenez-Bescos
An empirical measurement of the water vapour resistivity properties of typical Australian pliable membrane ............................................................................................................................. 161 Toba Samuel Olaoye, Mark Dewsbury, Hartwig K unzel, Gregory Nolan
An integrated approach towards hillside building design for automated construction ................... 171 Philip Tong and Hans-Christian Wilhelm
Application of a performance-based framework to prioritise underutilised historical buildings for adaptive reuse in Auckland, New Zealand ................................................................... 181 Itohan Esther Aigwi, James Rotimi, Reza Jafarzadeh, Tanya Sorrell, Amarachukwu Nnadozie Nwadike,An Le and Ravindu Kahandawa
AR enabled informative design to plan site layouts ......................................................................... 191 Abhishek Raj Singh and Venkata Santosh Kumar Delhi
A study of the implementation of BIM in the AEC industry in New Zealand .................................... 201 Thi Nhat Thanh Pham, Lorraine Skelton and Don Amila Sajeevan Samarasinghe
Blockchain: a new building block for the built environment? .......................................................... 211 Dermott McMeel, Alex Sims
Building Information Modelling Workflow for Heritage Maintenance ............................................ 220 Tatiana Ermenyi, Wallace Imoudu Enegbuma, Nigel I saacs and Regan Potangaroa
CFD simulation of Hydrodynamic Behavior of Four-Sided Wind- catcher integrated to the Earth ducts (Nay-Kesh) on the mean Temperature of the basement (traditional passive cooling in Kashan Iran) ..................................................................................................................... 226 Mina Lesan, Marzie Mirjafari, Maryam Lesan and Abbas Yazdanfar
Climate change adaptation in New Zealand’s building sector .......................................................... 236 Thao Thi Phuong Bui, Suzanne Wilkinson, Niluka Domingo
Comparative Energetic and Economic Analysis of anaerobic digestion of organic and farm animal waste for regional digesters in Tasmania. ............................................................................ 246 Murray Herron, Mark Dewsbury, David Beynon , David S Jones
Comparative study of the life cycle embodied greenhouse gas emissions of panelised prefabricated residential walling systems in Australia ..................................................................... 256 Soheila Ghafoor and Robert H. Crawford
Concept proofing a proposed early-stage project complexity assessment tool .............................. 266 Paulo Vaz-Serra, Peter Edwards and Guillermo Aranda-Mena
Concepts for a prefabricated wall panel to increase the uptake of straw and wool insulation in New Zealand ................................................................................................................ 276 Jacob Coleman, Hans-Christian Wilhelm
Conceptualising future proof homes ................................................................................................ 286 Carla Resendiz, Farzad Rahimian , Nashwan Dawood , Sergio Rodriguez and Phillippa Carnemolla

The 54th International Conference of the Architectural Science Association (ANZAScA) 2020
ix
Condensation Analysis Extension to the Nationwide House Energy Rating Scheme (NatHERS) Software .......................................................................................................................... 296 Tim Law, Dong Chen
Consolidating construction loads: A future pathway to sustainability? ........................................... 306 Kamal Dhawan, John E. Tookey, Ali GhaffarianHoseini, and Amirhosein GhaffarianHoseini
Contributions of urban traffics to increase in road surface temperature – A case study in New York City ................................................................................................................................... 316 Zhou Yu and Qi Li
Decolonising Landscape Architecture Education in Aotearoa New Zealand .................................... 325 Jacqueline Paul and Sibyl Bloomfield
Delivering Smart Heritage to Local Governments ............................................................................ 335 David Batchelor, Marc Aurel Schnabel, Karl Lofgren
Design and develop smart asset management leveraging BIM for life cycle management of building assets in Vietnam ............................................................................................................ 345 Quynh To Thi Huong
Design for Dematerialisation: an approach for reducing a building’s embodied environmental flows ......................................................................................................................... 355 Katie Skillington and Robert H. Crawford
Designing Biodiverse Façade Microbiomes ...................................................................................... 365 Christiane M. Herr and Yawen Duan
Designing the Olkola Cultural Knowledge Centre: A Traditional Owner-Led Integrated Research and Education Process ...................................................................................................... 375 Hannah Robertson, Debbie Ross-Symonds and Pippa Connolly
Developing virtual classroom environments for intelligent acoustic simulations ............................ 385 Megan Burfoot, Ali GhaffarianHoseini, Nicola Naismith, Amirhosein GhaffarianHoseini
Development of a BIM-based LCA Tool to Support Sustainable Building Design during the Early Design Stage ............................................................................................................................ 395 Bartlomiej Marek Kotula and Aliakbar Kamari
Development of a virtual construction approach for steel structures considering structural and non- structural elements, and installation equipment .............................................................. 405 Thai Phan, Shahab Ramhormozian, Charles Clifton, Gregory MacRae, Rajesh Dhakal, Liang-Jiu Jia,and Stefan Marks
Disparity between reality and theoretical models - predicting moisture and mould growth in houses. .......................................................................................................................................... 415 Sarah Buet, and Dr Nigel Isaacs
Double Envelope Unitized Curtain Wall for solar preheating of ventilation air ............................... 425 Roberto Garay-Martinez, Diego Gonzalez, Izaskun Alvarez, Beñat Arregi and Gorka Sagarduy
Ecosystem services assessment tools for regenerative urban design in Oceania ............................ 432 Fabian Delpy and Maibritt Pedersen Zari

The 54th International Conference of the Architectural Science Association (ANZAScA) 2020
x
Embedding Digital Technology into Contemporary Māori and Pasifika Architectural Practise. ............................................................................................................................................ 442 Rick Kaufusi, Yusef Patel, Semisi Potauaine, and Rameka Alexander-Tuinukuafe
Embedding Flexible design to endure long-term preservation of Industrial building in Australia ............................................................................................................................................ 451 Marisa Claudia Martínez, Sarah Shuchi and Susan Ang
Energy and Cost Optimization for Residential Improvement Options ............................................. 461 Arezoo Shiraziand Amirpooya Shirazi
Energy retrofit of historic buildings in Aotearoa New Zealand: current practice, challenges and opportunities ............................................................................................................................. 471 Priscila Besen, Paola Boarin
Enhancement of cooling performance of metal ceiling radiant cooling system by a novel panel with a concave and segmented surface ................................................................................. 481 Ahmed A. Serageldin, Minzhi Ye and Katsunori Nagano
Environment, resource and surroundings based dynamic project schedule model for road construction industry in New Zealand .............................................................................................. 491 Mahesh Babu Purushothaman and Sumit Kumar
Framework for building defects and their identification technologies: case studies of domestic buildings in Melbourne, Australia ..................................................................................... 501 Shruthy Pamera, and Argaw Gurmu
Framework for the refurbishment of modernist social housing ...................................................... 511 Sarah Pells and Hans-Christian Wilhelm
Green infrastructure design and performance evaluation: A practice-based interdisciplinary design and research ............................................................................................... 521 David Dziubanski, Bo Yang, Thomas Meixner
Greenhouse gas emissions performance of cross laminated timber construction using hybrid life cycle assessment ............................................................................................................. 531 Xavier Cadorel, and Robert H. Crawford
Hindrances to the adoption of green walls: a hybrid fuzzy-based approach ................................... 541 Saeed Reza Mohandes, Amir Mahdiyar, Haleh Sadeghi, Sanaz Tabatabaee, M. Reza Hosseini
How Young and Old Men and Women Perceive the Streets ............................................................ 551 Sherina Rezvaniour, Norhaslina Hassan, Amirhosein Ghaffarianhoseini and Mahmoud Danaee
Human response to greeneries in public spaces .............................................................................. 561 Victor Momoh, Dorcas, A. Ayeni, Ali GhaffarianHoseini, and Funmilayo Ebun Rotimi
Identification of Parameters to Develop an Evidence-based Framework to Improve Building Code Amendment in New Zealand ..................................................................................... 570 Amarachukwu Nnadozie Nwadike, Suzanne Wilkinson and Itohan Esther Aigwi
Illumination Condition Effect on the Performance of CNN- based Equipment Load Detection for Energy Demand Estimation ........................................................................................ 580 Shuangyu Wei, Paige Tien, John Calautit, Yupeng Wu

The 54th International Conference of the Architectural Science Association (ANZAScA) 2020
xi
Impact of curtainwall facades on apartment overheating ............................................................... 590 Christopher A. Jensen, Erika Bartak, Roberto Petruzzi, Sisi He
Improving empathic evaluations in virtual reality for marketing of housing projects ..................... 600 Athira Azmi, Rahinah Ibrahim, Maszura Abd Ghafar and Ali Rashidi
Indoor air quality in South East Queensland dwellings during 2019-2020 bushfires ....................... 610 Fan Zhang, and Rodney Stewart
Influence of sustainable streetscape to augment social interaction in the low-density suburbs of regional Victoria .............................................................................................................. 620 Nishat Rashida and Sarah Shuchi
Insights into the New Zealand Prefabrication Industry .................................................................... 630 Guy Brown, Rashika Sharma and Lydia Kiroff
Interlocking Blocks in Social Construction of Housing: Collaboration of Local Government, NGO and the Urban Poor .................................................................................................................. 640 Isidoro Malaque III
Investigating Natural Ventilation Behaviour of Passivhaus PHPP Using CFD Building Simulations ....................................................................................................................................... 650 Ibrahim Alhindawi and Carlos Jimenez-Bescos
Land Stewardship in the Climate Wrung Epoch ............................................................................... 660 Yue Yu and Sibyl Bloomfield
Landscape phenology and soil moisture dynamics influenced by irrigation in a desert urban environment ........................................................................................................................... 670 Chenghao Wang
Learning from the biology of evolution: Exaptation as a design strategy for future cities .............. 680 Alessandro Melis, J. Antonio Lara-Hernandez and Barbora Foerster
Less Structure, More Impact? An evaluation of structured design thinking methods in higher education in architecture. ..................................................................................................... 689 Christos Chantzaras
Life cycle energy assessment of retrofitting alternatives for mass social housing ........................... 699 Victor Bunster, Waldo Bustamante, Cristian Schmitt, Mathew Aitchison
Low carbon rules: an interdisciplinary approach to writing standards for earth and straw construction in Aotearoa New Zealand. ........................................................................................... 705 Min Hall, Hugh Morris and Graeme North
Low-tech Geometry-based Node Design for Spatial Structures ...................................................... 715 Esmaeil Motaghi, Arman Khalil Beigi, Ali Ghazvinian, Sina Salimzadeh, Katayoun Taghizadeh Azari
Measuring intensity and frequency of human activities. ................................................................. 724 YeeKee Ku
Methods to assess the risk of condensation from thermal bridges in timber-framed houses: a systematic literature review. ............................................................................................ 735 Griffin Cherrill, Dr Michael Donn

The 54th International Conference of the Architectural Science Association (ANZAScA) 2020
xii
Mid-Rise Mass Timber in the Contemporary .................................................................................... 745 Shannon Bridget Griffiths, Michael Donn, Joanna Merwood-Salisbury and Marc Woodbury
Modelling biogenic and anthropogenic carbon dioxide exchange in urban area - a data fusion approach ................................................................................................................................ 755 Peiyuan Li and Zhi-Hua Wang
More is More: The No Free Lunch Theorem in Architecture ............................................................ 765 Inês Pereira and António Leitão
Multi-objective optimization objectives for building envelopes: a review study ............................. 775 Muhammad Hegazy, Kensuke Yasufuku, and Hirokazu Abe
Nature City. How our cities can adapt to climate change. ............................................................... 785 Matthew Bradbury
New Zealand House Indoor Microclimate and Allergens ................................................................. 795 Bin Su, Lian Wu, Peter McPherson and Renata Jadresin-Milic
Occupant Energy Behaviours – A Review of Indoor Environmental Quality (IEQ) and Influential factors ............................................................................................................................. 805 Achini Shanika Weerasinghe, Eziaku Rasheed and James Olabode Bamidele Rotimi
Occupants’ satisfaction in BREEAM Excellent Certified Buildings .................................................... 815 Azadeh Montazami, Sepideh Korsavi, and Gideon Howell
Opportunities to reduce brick waste disposal .................................................................................. 825 Salman Shooshtarian, Tayyab Maqsood, Carl Barrett, Peter SP Wong4, Rebecca J. Yang, and Malik Khalfan
Optimising New Zealand construction consolidation centres: Defining a research framework ........................................................................................................................................ 835 Kamal Dhawan, John E. Tookey, Ali GhaffarianHoseini, and Amirhosein GhaffarianHoseini
Outdoor Thermal Comfort ................................................................................................................ 845 Kasun Perera, Michael Donn, Marc Aurel Schnabel
PARAMTR: Enhanced generative design tools for large-scale housing developments within a prefabrication context ................................................................................................................... 855 Joshua Joe, Antony Pelosi and Christopher Welch
“Plug and play” modular façade construction system for building renovation to achieve nearly Zero Energy Building (nZEB)................................................................................................... 865 Jorge Torres, Dr. Roberto Garay Martinez, J. Ignacio Torrens-Galdiz, Amaia Uriarte, Alessandro Pracucci, Oscar Casadei, Sara Magnani, Noemi Arroyo, Angel M. Cea
Practical understandings and use of smart city concepts in Australia ............................................. 875 Fanni Melles, Jeni Paay, Ian Woodcock and Gergana Rusenova
Preservation issues and controversies: Challenges of underutilised and abandoned places .......................................................................................................................................................... 885 Julia Hamilton, Renata Jadresin Milic
The 54th International Conference of the Architectural Science Association (ANZAScA) 2020
xiii
Privacy in the houses of eastern parts of Iran, during the transition period with an emphasis on the architecture of housing entrances ........................................................................ 895 Mohsen Tabassi, Sepideh Mousavi
Recognition of the architecture of Safavid caravanserais from the view of passive defense .......................................................................................................................................................... 905 Mohsen Tabassi, Hasan Naseri Azghandi
Research trends in construction and demolition waste management in Australia ......................... 915 Yuchen She, Nilupa Udawatta and Olubukola Tokede
Reviewing indoor environmental quality of high-rise social housing ............................................... 925 Felipe Jara Baeza, Priyadarsini Rajagopalan and Mary Myla Andamon
Rewind on imagining future cities through drama and design......................................................... 935 Susan J. Wake
Semi-passive Architecture Facade Design ........................................................................................ 946 Pei-Hsien Hsu and Hong Cing Tung
Sentiment analysis on social media for identifying public awareness of type 2 diabetes ................ 956 Yuezhong Liu, Rudi Stouffs and Yin Leng Theng
Smart solar urban furniture: design, application, limits and potentials ........................................... 966 Alessandro Premier
Social Dimension of Sustainability: A Least Investigated Criterion for Built Environment Assessment Tools ............................................................................................................................. 976 Keerthi Priya Ramineni, Susan Ang and Sarah Shuchi
Space Vehicle-Building Design Process Issues and Models. ............................................................. 986 Zhelun, Zhu, Antonio Fioravanti and Ugo Maria Coraglia
Spaces of Empowerment: Shaping Inclusive Public Places through Decolonising Participatory Design in Aotearoa New Zealand ................................................................................ 996 Rosie Evans, Dr. Adele Leah and Dr. Emina Kristina Petrović
Street Design in a Different Cultural Context: The Case of Great South Road in Auckland, New Zealand ................................................................................................................................... 1006 Maryam Lesan, Morten Gjerde
Study on Integrated Conservation Strategy of the Buffer Zones of Historical Ancient Cities from the Perspective of Coordinated Development of New and Old Urban Areas:A Case Study on the Space Around Jingzhou Ancient City ......................................................................... 1016 Kexin Chen, Zhe Hu and Yi He
Sustainable renovation of heritage buildings through IPDish and BIM: a case Study .................... 1026 Bani Feriel Brahmi, Souad Sassi Boudemagh, Ilham Kitouni, and Aliakbar Kamari
System Fail: A review of the systems approach as a decision makingMethod for lifeline infrastructure systems .................................................................................................................... 1036 Chris Ford and Jan Auernhammer
Te aitanga pepeke me ngā pūngāwerewere/The world of insects and spiders. ............................ 1046 Kerry Francis

The 54th International Conference of the Architectural Science Association (ANZAScA) 2020
xiv
The Collaborative Algorithmic Design Notebook ........................................................................... 1056 Renata Castelo-Branco, Inês Caetano, Inês Pereira, and António Leitão
The eco-friendliness of Bio-Structural Insulated Panels (SIPs) ....................................................... 1066 Melissa Chan and Funmilayo Ogunjobi
The effect of COVID-19 on household energy demand .................................................................. 1075 Robert H. Crawford
The effect of data age on the assessment of a building’s embodied energy ................................. 1085 Robert H. Crawford and André Stephan
The Effect of Parapets on the Performance of Unglazed Solar Collectors ..................................... 1095 Delight M. Sedzro, T. N. Anderso and Roy Nates
The evolution of information flows in construction projects: a contemporary study on the embracing of Augmented Reality ................................................................................................... 1105 Akila Rathnasinghe, Lesaja Weerasinghe, Mahesh Abeynayake and Udayangani Kulatunga
The global sand shortage: study of the role of glass in contemporary New Zealand residential architecture .................................................................................................................. 1115 Lauren Hayes, Emina Kristina Petrović
The influence of green design elements on the visibility of low- rise houses in hot and humid climate ................................................................................................................................. 1125 Molood Seifi, Aaldrin Abdullah, Danielle M. Reynald
The influence of work-group numbers and demographic characteristics on frequency of interruptions and perceived productivity of building users. .......................................................... 1135 Eziaku Rasheed, Maryam Khoshbakht and George Baird
The intersection of carbon sequestration and habitat provision in built environments: building rating tools comparison .................................................................................................... 1145 Kamiya Varshney, Maibritt Pedersen Zari and Nilesh Bakshi
The life cycle embodied energy and greenhouse gas emissions of an Australian housing development: comparing 1997 and 2019 hybrid life cycle inventory data .................................... 1155 Alejandro Lara Allende, André Stephan and Robert H.
The New Zealand Construction Industry and Sustainable Construction through C&D waste minimisation: a review of the life cycle approach .......................................................................... 1165 Rohit Gade, Jeff Seadon and Mani Poshdar.
The presentation of local data on site through augmented reality ................................................ 1175 Faruk Can Ünal and Yüksel Demir
The reintroduction of Japanese metabolism to sustainable architecture ...................................... 1183 Alexander Trudelle and Fan Zhang
Thermal Performance of School Building not only Impact Indoor Thermal Comfort ..................... 1193 Bin Su, Renata Jadresin-Milic, Peter McPherson and Lian Wu
To improve the strategic decision making for effective governance of public-spend regenerative projects. .................................................................................................................... 1203 Jas Qadir, Dave Moore, Ali Ghaffarian Hoseini, Clare Tedestedt George, James O. Rotimi

The 54th International Conference of the Architectural Science Association (ANZAScA) 2020
xv
To understand the systemic and contextual factors to improve the strategic decision making of regenerative projects. .................................................................................................... 1213 Jas Qadir, Dave Moore, Ali Ghaffarian Hoseini, Clare Tedestedt George, James O. Rotimi
Toward a Pre-Assessment Framework for Green Star: A survey on New Zealand building professionals ................................................................................................................................... 1223 Jisun Mo, Paola Boarin, and Alessandro Premier
Towards an understanding of the potential to reuse and recycle building materials in New Zealand ........................................................................................................................................... 1233 Zahra Balador, Morten Gjerde, Brenda Vale and Nigel Isaacs
Towards Creative Systems in Architectural Design ........................................................................ 1243 Manuel Mühlbauer
Two minds are better than one: Breeding collaborative mindsets for emerging design-led transdisciplinary practices .............................................................................................................. 1253 Zhengping Liow
Understanding resilience in the built environment: Going beyond disaster mitigation ................ 1263 Sameh Shamout, Paola Boarin, and Sandeeka Mannakkara
Understanding the Benefits of BIM/Lean/IPD framework when carried-out simultaneously ........................................................................................................................................................ 1273 Caio Schmitz Machado, Bani Feriel Brahmi, Aliakbar Kamari
Understanding the challenges of circular economy construction through full-scale prototyping ..................................................................................................................................... 1283 Gerard Finch, Guy Marriage, Morten Gjerde, Antony Pelosi and Yusef Patel
Understanding the performance gap of nearly zero-energy schools in Belgium ........................... 1293 Shady Attia
Uniclass 2015 for Smart Cities ........................................................................................................ 1303 John Gelder
Unmanned Aerial Vehicle (UAV) Technology Based Safety Monitoring for Expressway Construction Projects ..................................................................................................................... 1313 Udaraka Iroshana, Mathusha F rancis and Shanika Vidana Gamage
Unmanned Aerial Vehicle Sustainability Assessment of Heritage Buildings ..................................1323 Tatiana Ermenyi, Wallace Imoudu Enegbuma, Nigel I saacs and Regan Potangaroa
Urban resilience: potential for rainwater harvesting in a heritage building .................................. 1331 Rachel Paschoalin, Ronnie Pace, Nigel Isaacs
User-specific predictive affective modeling for enclosure analysis and design assistance ............ 1341 Rohit Priyadarshi Sanatani
Virtual Reality Activity Based Workplace Simulation Impact on Healthcare Facilities Space Management .................................................................................................................................. 1351 Collin, A., Enegbuma, W.I., McIntosh, J. and Tamati, G.

The 54th International Conference of the Architectural Science Association (ANZAScA) 2020
xvi
We don’t need sustainable buildings – We need sustainable people ............................................ 1360 Ben Slee
Weather Information Management in Major Construction Projects: State of the Technology ..................................................................................................................................... 1370 Andrea Y. Jia
Authors Index ................................................................................................................................. 1380

The 54th International Conference of the Architectural Science Association (ANZAScA) 2020
1
A bio-hygrothermal mould growth analysis of typical Australian residential wall systems
Shruti Nath1, Mark Dewsbury1, Phillipa Watson1, Heather Lovell1 and Hartwig Künzel2 1 University of Tasmania, Launceston, Australia and University of Tasmania, Hobart, Australia
{[email protected] , [email protected] , [email protected] , [email protected] }
2 Fraunhofer Institute for Building Physics, Stuttgart, Germany [email protected]
Abstract: Since 2014, Australian scholars and design and construction professionals have raised concerns about the increased presence of mould and condensation within new stand-alone and multi-residential buildings. Several studies have identified significant material decay and mould growth within external wall systems due to long-term moisture accumulation. This paper focusses on moisture and mould growth in buildings by providing an in-depth analysis of the most common external wall system for Australian residential buildings (cavity brick veneer). This wall’s moisture accumulation over a ten-year period was simulated using multi-year transient hygrothermal software. Transient hygrothermal simulation is novel within the Australian research and regulatory context. Mould growth was simulated and analysed using a post-processing mould growth software. To assist in informing regulatory development, simulations were completed for three temperate Australian climate zones. The modelled wall system applied typical and regulation-compliant building material configurations for pre-2003, 2004, 2007 and 2010. The results of the modelled wall system will be used to inform national building regulations in Australia. A key component of this paper includes the evaluation of internationally accepted methods for mould growth simulation.
Keywords: Mould; health; WUFI®; biohygrothermal software
1. IntroductionMoisture accumulation leads to condensation and mould formation within habitable environments, and has
emerged as a serious challenge for many Australian homes (CBOS, 2018). Moreover, recent enhancements to energy efficiency requirements within the National Construction Code (NCC) have resulted in warmer interior environments in standalone single dwellings (Class 1) and apartment buildings (Class 2) buildings within Australia's temperate and cool temperate climates (NCC climate zones 2 to 7). Many new buildings in these climates are now presenting the co-related problems of condensation and mould (Dewsbury and Law, 2017).
Condensation has been identified as a national problem by the Australian Building Codes Board (ABCB) and industry-based partners (Dewsbury et al., 2016; Law, 2019). In a nationwide survey, conducted by the ABCB, respondents identified that up to 40% of Class 1 and Class 2 contemporary homes were showing the presence of interior surface condensation and mould (Dewsbury and Law, 2016). Law (2019) states that 1 in 3 homes throughout Australia may be water or mould damaged.
Managing water vapour diffusion is essential to reduce the occurrence of mould sporing in homes. Mould growth and the accumulation of interstitial and surface moisture can take place due to the combination of warmer internal temperature and higher relative humidity (hereafter RH) coming onto contact with cooler surfaces or interacting with a cooler airflow (Dewsbury and Law, 2017). This is significant because moisture accumulation or mould growth within the habitable environments and interstitial spaces leads to building material decay, structural failure and has adverse effects on occupant health (WHO, 2009 ). Nath et al. (2019) stressed the importance of controlling mould exposure and moisture related damage within buildings to prevent adverse health effects. WHO (2009 ) highlighted that there is a 50% increase in asthma rates when there is residential dampness. Asthma is known to be exacerbated by mould and is the leading disease in children aged 0–14 years in Australia, accounting for 12.3% of the total asthma burden (Knibbs et al., 2018). Compounding this, children spend around 60-75% of their time indoors (Knibbs et al., 2018). Exposure to damp housing and sensitization to dust allergens and mould are the key risk factors for asthma (Douwes and Pearce, 2003).
Dewsbury and Law (2016) strongly emphasized the requirement for building regulations in Australia to mitigate moisture accumulation and mould growth, and to require construction methods that manage the causes
Imaginable Futures: Design Thinking, and the Scientific Method. 54th International Conference of the Architectural Science Association 2020, Ali Ghaffarianhoseini, et al (eds), pp. 1–10. © 2020 and published by the Architectural Science Association (ANZAScA).

Shruti Nath, Mark Dewsbury, Phillipa Watson, Heather Lovell and Hartwig Künzel
2
of moisture accumulation. To assist in informing regulatory development, in this research simulations were completed for three different Australian climate zones, (CZ7 – cool temperate, CZ6 - temperate, CZ2 – warm and humid) in compliance with Australian regulations for external wall fabric configurations for pre-2003, 2004, 2007 and 2010. Figure 1, below, shows the ABCB climate zones across Australia, with: CZ7 as dark blue, CZ6 as light blue and CZ2 as yellow. These three climate zones include Australia’s largest centres of population and residential building construction.
This paper reports on the most common external wall systems used in residential buildings in Australia as a part of a larger research project on “Healthy built fabric systems for zero energy residential buildings in Australia.” Research activities of the larger project include the detailed hygrothermal analysis of common external wall types used for residential buildings: cavity brick veneer, compressed fibre cement sheet weatherboard (timber) and sheet-metal. This paper focusses on a regulation compliant cavity brick veneer wall system, representing approximately 50% of new stand-alone dwellings. This paper provides an indication of the likely performance of a notable proportion of houses in these climate zones, further progressing understanding of moisture and mould challenges that may arise in homes built to NCC energy efficiency requirements.
In this paper, results for moisture accumulation for cavity brick veneer wall type were simulated for a ten- year period using the transient hygrothermal simulation software, WUFI®Pro, version 6.5, (2020) (hereinafter referred to as the hygrothermal simulation/software). Hygrothermal simulation calculates heat, air and moisture movement. Mould growth was simulated using two add-on (post-processing) software, WUFI®VTT and WUFI®Bio. These post processors are vital software add-ons when wishing to ascertain the full impact of moisture accumulation and its likely relationship to mould growth in buildings. This paper reports on the results from the WUFI®VTT mould growth simulation (here after referred to as bio-hygrothermal simulation/software).
This paper supports research on moisture and mould in buildings by providing an in-depth analysis of a common external wall system for Australian residential buildings. Learnings from this paper and the larger project will inform national heath and amenity regulations within the NCC.
Figure 1: ABCB Australian climate zone map (2019) 2. Background & Literature Review
In Australia, over the last two decades, building regulations for energy efficiency have increased substantially with the focus on reducing greenhouse gas emissions via the provision of more energy efficient and sustainable homes (ABCB, 2019). Energy security and environmental sustainability are the two main policy issues which drove improvements in energy efficiency in the building industry (Berry and Marker, 2015). Energy efficiency provisions for stand-alone homes are discussed in the NCC Volume 2 (ABCB, 2019). To meet NCC energy efficiency requirements, broadly, houses need to use insulation and weather sealing building materials (Dewsbury and Law, 2017). Weather sealing is required because it prevents air leakage and improves the energy efficiency of the building envelope. The energy efficiency regulation for the building envelope is established by setting minimum insulation levels (R-values) required by walls, roofs and floors in different climate zones (Ambrose and Syme, 2017). The thermal transmittance (U value) of the windows also plays a vital role in the energy efficiency provisions of the residential buildings (Ballinger and Lyons, 1996). The commensurate changes in the energy efficiency standards of the NCC have created more airtight homes (Ambrose and Syme, 2017).
Airtightness has not been considered as an area of concern by the building industry for many years (Ambrose and Syme, 2017). Research conducted by the CSIRO, on a selection of relatively new homes, found that the airtightness results varied from quite leaky to quite airtight. The more air-tight houses showed a much higher

3
A bio-hygrothermal analysis of typical Australian residential wall systems
than required air-tightness value for contemporary homes (Ambrose and Syme, 2017). Interestingly, the airtightness profile of New Zealand houses has been extensively studied as one feature for a new industry design tool to inform and guide indoor moisture risks identified in the New Zealand Building Code (Leardini and Van Raamsdonk, 2010). The combination of warmer well insulated homes combined with greater airtightness levels can lead to moisture accumulation in the built environment, creating a perfect condition for “Sick Building Syndrome” (Ghaffarianhoseini et al., 2018). The NCC currently provides inadequate guidance to deal with condensation and residential dampness in contemporary code-compliant homes (Bulic et al., 2019). This lack of focus has unintentionally given rise to condensation problems in homes (Dewsbury et al., 2016). The current Australian regulatory framework provides inadequate guidance for the Design, Construction and Certifying professions regarding the design methods, management and mitigation of moisture accumulation strategies in residential buildings (Bulic et al., 2019). Inappropriate material assemblages combined with a lack of ventilation, will lead to unacceptable moisture levels in the built fabric and mould growth (Chang et al., 2020). The Presence of mould within the habitable environment could also impact the indoor air quality (Douwes and Pearce, 2003).
The passive management of inward and outward moisture and water vapour is a critical part of designing an integrated building enclosure. Internationally, moisture control design of the built structure commonly uses either project specific hygrothermal simulation or envelope regulations informed by hygrothermal simulation (Künzel and Zirkelbach, 2013). Currently, moisture control design of the built structure using hygrothermal simulation is state-of-the-art (Künzel and Zirkelbach, 2013). In a multi-layered external wall system, adjacent elements also play a major role in the functioning of the building (Nath and Dewsbury, 2019). In Tasmania, and Australia, the cavity brick veneer wall is the most common type of external wall (CSIRO, 2020). This wall type has a high barrier for wind driven rain and a relative low cavity ventilation rate (Vanpachtenbeke, 2019). Additionally, the clay brick can store significant amounts of moisture. In addition to the normal outward flow of water vapour, in this wall type, the moisture levels within the cavity may become high, which could lead to an inward vapour flow and a higher moisture content in the internal layers of the wall. Furthermore, there might be significant interstitial condensation risk in case of solar driven inward vapour transport (Vanpachtenbeke, 2019). Lstiburek (2002) stated that interstitial condensation on the plastic vapour barrier can be caused by solar driven inward vapour transport due to wet cavity brick veneer cladding. The usage of the varied terms has led to the existence of terminologies like Air Barrier, Water Barrier, Vapour Barrier and ventilated cavities (Nath and Dewsbury, 2019; Olaoye and Dewsbury, 2019). Since no material can provide a permanent or perfect barrier, many researchers are striving to amend the term from Barrier to Control Layer (Nath and Dewsbury, 2019).
In a framed wall construction the critical area where moisture build-up usually takes place is within the internal portion of the weather control layer (Nelson, 2017). The movement of water vapour within the built fabric should be passively controlled to avoid high interior relative humidity conditions, mould growth and moisture accumulation in the wall assembly (Smith, 2017). The air movement within a wall is much more complex than modelled by many one-dimensional hygrothermal simulation tools. Due to any differences between the simulation of the perfect wall and the construction of a real wall, the wall may be unable to manage water vapour and moisture accumulation. Furthermore, these features must also be applied to other building enclosure elements, such as the roof, floor, footings and foundation condition, to minimise serious moisture-related damage (Vanpachtenbeke, 2019).
A preliminary simulation study found that in NCC Climate Zone 7, there were varying amounts of moisture accumulation in the North, East, West, and South facing walls. The west wall showed the greatest amount of moisture accumulation (Nath and Dewsbury, 2019). This extensive desktop study found similarities with observed moisture contents in the external walls of Tasmanian houses. The output data from the hygrothermal simulation software was then used as input data in the bio-hygrothermal post processing simulation.
Complex transient hygrothermal calculation tools model dynamic changes within the built fabric (walls, floors and roofs or building elements), on an hourly basis throughout the year, and for multiple years (Mumovic et al., 2006). Künzel et al. (2005) highlighted that to understand the hygrothermal processes in the building envelope requires an understanding of water vapour control strategies which prevent mould formation on the internal, interstitial, and external surfaces of the building. An added feature of the hygrothermal simulation software, is its ability to analyse and assess mould growth conditions (Viitanen et al., 2015). Mould growth models are available as post processors in WUFI® and other world leading hygrothermal simulation tools.
3. MethodologyTo establish whether Australian regulatory compliant, commonly constructed residential Australian external
wall types may have caused increased levels of moisture accumulation within the built fabric, required a multi- facetted approach. As the hygrothermal simulation software had already been selected (Nath and Dewsbury, 2019), the methodology included several steps, namely:

Shruti Nath, Mark Dewsbury, Phillipa Watson, Heather Lovell and Hartwig Künzel
4
□ the selection of a typical Australian regulatory compliant residential wall systems from pre-2003, 2004,2007 and 2010;
□ the selection of appropriate NatHERS Climate Zones; and □ the selection of an appropriate mould growth model.
The National Construction Code applies eight climate types to Australia’s building regulatory framework, as shown in Figure 1 above. However, the regulatory approved climate data for use in Nationwide House Energy Rating Scheme (NatHERS) energy efficiency calculations include 69 climate types. For the purposes of this research, and recognising a combination of State (Tasmania) and National relevance, the NatHERS climate data that was selected include: Hobart (NCC CZ 7), Melbourne (NCC CZ 6), and Amberley (NCC CZ 2).
In this research project simulations for different wall types (cavity brick veneer, compressed fibre cement sheet and weatherboard) were completed for three different climate zones (CZ7, CZ6 and CZ2) using hygrothermal simulation software for the span of 10 years. The simulations were completed for all the four orientations – north, south, east and west. The international practice of single years, 3 years and 5 years has been significantly critiqued as inadequate (Arena and Mantha, 2013). The selection of longer span provides a more suitable long-term analysis of moisture accumulation within the built fabric. This paper focusses on moisture and mould growth in buildings by providing an in-depth analysis of the most common external wall system for Australian residential buildings (cavity brick veneer) in CZ7. The biohygrothermal simulation results discussed in this paper are for the West orientation wall simulated for a span of 10 years. Due to the need to keep a tight scope in this paper, we present findings for western orientations. This orientation was chosen due to previous empirical and preliminary hygrothermal simulation data, which showed this to be the most moisture effected wall orientation. This wall orientation also experiences notable swings in temperature, which is instructive in this instance.
Since 2003 the changes made in the construction of a cavity brick veneer wall type is shown in Figure 2 below. Before 2003 a cavity brick veneer wall comprised of 110mm clay brick, 130 mm air gap (90mm structural frame and 40 mm cavity), 10mm paper faced gypsum plasterboard and the painted interior surface layer, respectively. Later there was an addition of 1mm pliable membrane to the external wall system. According to AS/NZ 4200 a pliable membrane could be installed to perform as a sarking membrane, vapour barrier, thermal insulation, or even as a combination of all three. A pliable membrane can be a vapour impermeable membrane (vapour barrier) or vapour permeable membrane (breathable). In 2003, most pliable membranes available in Australia were vapour impermeable. As per the later enhancements in the NCC (2003-2019), a cavity brick veneer wall comprises of 110mm clay brick, 40mm air cavity, 1mm pliable membrane, 90mm insulated timber frame, 10mm paper faced gypsum plasterboard and the painted interior surface layer, respectively. Since 2014, the research team has conducted empirical and hygrothermal simulation research to understand the impact of vapour permeable and vapour impermeable membranes within the Australian residential wall systems.
Figure 2: Sectional details of a code compliant cavity brick veneer wall in Climate Zone 7 A mould prediction model or bio hygrothermal simulation software can be used to predict the mould
growth risk in the design phase, allowing assessment of the building envelope and construction details at a time when they can still be changed before construction (Vereecken et al., 2011). Several models are found in the literature (e.g. temperature ratio, isopleth systems, biohygrothermal model, ESP-r mould prediction model, empirical VTT-model) (Vereecken et al., 2011). The WUFI® Bio model and the VTT/Viitanen model are two internationally recognised mould growth simulation methods (Viitanen et al., 2015).

5
A bio-hygrothermal analysis of typical Australian residential wall systems
3.1 Biohygrothermal simulation software, (WUFI® VTT)
The hygrothermal simulation software has two internationally recognised mould growth models; WUFI® Bio model, and the updated VTT/Viitanen model (WUFI® VTT). The resulsy from the updated Viitanen model are describe in this paper. The VTT/Viitanen model was developed by Hukka and Viitanen at the VTT (Technical Research Centre of Finland) (Vereecken et al., 2011). This method uses a six-step assessment approach, with the final step generating the Mould Index (MI), which indicates the concentration of mould growth on the surface as a percentage (Viitanen et al., 2015). Mould indexes, discussed in Table 1 below, show mould growth intensities, otherwise called growth rates or colonization rates. This model also calculates the amount of mould growth in mm (Viitanen et al., 2015) which we report in tables in the results section.
Table 1: Mould index for empirical validation as used in the VTT model
Index Description of the growth rate 0 No growth 1 Small amounts of microscopic mould growth on surfaces 2 Several local colonization of microscopic mould growth on surfaces 3 Visual results of mould on surface, < 10 % coverage, or < 50 % coverage of microscopic mould 4 Visual results of mould on surface, 10 - 50 % coverage, or >50 % coverage of microscopic mould 5 High colonization of mould growth on surface, > 50 % coverage (visual) 6 Very high and tight colonization of mould growth on the surface, coverage about 100 %
The material selection list in this model is broad. Factors for each material are predefined and can also be modified based on individual requirements. The different factors include the sensitivity class, material class, and type of wood. The sensitivity class allows the selection of four different sensitivity class – very sensitive, sensitive, medium resistant and resistant. The selection of specific sensitivity class can be done depending on the material selection. The material class establishes the four different material specific mould decline classes and allows for user defined settings. The type of wood (hardwood or softwood) can also be selected. Both bio-hygrothermal post processing mould growth models (WUFI® Bio and WUFI® VTT) were used in the research, but due to size limitations, this paper reports on the results from WUFI® VTT.
4. Results & DiscussionThis section discusses the typical building material arrangement in an Australian code compliant cavity brick
veneer wall in climate zone 7. Section 4.1 discusses the results from the hygrothermal simulations that were completed to assess likely moisture accumulation. Section 4.2 discusses the results from the mould growth model that were completed to assess likely mould growth conditions using the postprocessor bio-hygrothermal post processing simulation tool. Results from the analysis of compressed-fibre-cement-sheet, timber and sheet metal clad external framed walls and masonry construction external wall systems are not discussed here and will be discussed in future publications.
4.1 Hygrothermal results using transient state hygrothermal simulation software, WUFI®Pro
This section discusses the hygrothermal results in a cavity brick veneer wall model in climate zone 7 using the hygrothermal simulation tool (described above). Simulations have been completed for the span of ten years to investigate the condensation risk analysis. Temperature and dewpoint fluctuations and moisture accumulation findings are presented first. Figure 3 shows a graphical sample of the simulation result from a typical west facing cavity brick veneer wall in Hobart’s climate, constructed according to the NCC 2019 regulations. This graphical representation of the wall comprises from left to right; 110mm clay brick, 40mm cavity, 1mm (impermeable) pliable membrane, insulated timber frame (R2.8 glass-wool batt insulation), 10mm paper faced gypsum plasterboard and acrylic paint. The top portion of the Figure 3 shows the temperature fluctuations between the interior and exterior of the wall. In this case the exterior temperature fluctuates between 1°C to 30°C. The red horizontal line indicates temperature and the purple horizontal line indicates dew point temperature. The lower portion of the figure shows relative humidity and moisture accumulation. The green line and the green fill show the variation in relative humidity, which varies between 20% and 100% through the various components of the wall. The blue fill indicates moisture accumulation, the Figure 3 also shows moisture accumulation in the clay brick, vapour cavity and insulated timber frame (inside surface of pliable membrane) layers. Viitanen and Ojanen (2007), affirmed that conducive environments for mould growth occur when the internal temperature is between

Shruti Nath, Mark Dewsbury, Phillipa Watson, Heather Lovell and Hartwig Künzel
6
20°C and 50°C and the relative humidity is above 75%. Therefore, Figure 3 shows simulated moisture accumulation results which is likely to lead to mould growth.
The temperature at which the water vapour condenses is known as dew point (Dewsbury et al., 2016). Dew point temperature constantly varies, as it responds to air temperature, the amount of water vapour in the air and air pressure (Dewsbury et al., 2016). It is important to simulate the occurrence of dewpoint because it provides detailed results on various aspects of water vapour transport and moisture accumulation within and through the built fabric. Hygrothermal software (in this instance WUFI®Pro) is used to validate and review the various dew points that occur within a building and its construction elements. Figure 4 shows the dewpoint and temperature fluctuations on the exterior surface of the brick. The red lines show the annual temperature fluctuations, whilst the purple lines show the annual dewpoint fluctuations. Where temperature and dewpoint lines converge in the graph shows where moisture will form. It is evident in this graph that air temperature and dewpoint temperature often converge.
Figure 3: Graphical output of a West orientation cavity brick veneer wall in climate zone 7 as per NCC 2019
Figure 4: Graph showing the temperature and dewpoint fluctuations in the exterior surface of the brick
4.2 Mould growth results using bio-hygrothermal simulation software, (WUFI® VTT)
This section discusses the mould growth simulation results for a cavity brick veneer wall, in climate zone 8. The ten years of output data from the hygrothermal simulation software was used as input data for the post- processing bio-hygrothermal simulation tool. The critical moisture content of moulds spores was analysed using the bio-hygrothermal software. When critical moisture content is reached, the germination of the spore takes place and mycelium starts to grow. In the results below, each element of the cavity brick veneer wall system isanalysed for dew point, moisture accumulation and mould growth.
The first element analysed is the clay brick. Figure 5 shows the relative humidity, critical relative humidity, and temperature fluctuations from the bio-hygrothermal software. The critical relative humidity required for the germination of mould spores or mould growth (mould index) is a function of temperature and exposure time (Viitanen and Ojanen, 2007). The simulation result for this layer from this post-processing software is a red traffic light, which indicates that the mould growth rate is at an unacceptable level. This is further supported by Figure 6 from bio-hygrothermal software, which shows the simulated mould growth over the ten-year period. This shows a continual mould growth pattern for the ten-year period. Figure 7 shows the mould growth indices from bio-hygrothermal software. The graph shows a mould growth index range from 0 to 4 with a gradual increase from 0 to 4 in the first seven years. This indicates that this form of construction supports dangerous levels of moisture accumulation and mould growth on the inside surface of the clay brick.
Figure 5: Graph showing temperature and relative humidity fluctuations in the brick layer
using bio- hygrothermal software
Figure 6: Graph showing the mould growth rate in the brick layer using bio-hygrothermal software

7
A bio-hygrothermal analysis of typical Australian residential wall systems
Figure 7: Graph showing the mould index in the brick layer using bio-hygrothermal software
The next element analysed is the 40mm air cavity. Figure 8 shows the relative humidity, critical relative humidity, and temperature fluctuations from bio-hygrothermal software. Like the clay brick results discussed above the resultant red traffic light indicates that the mould growth rate is at unacceptable level. Figure 9 from bio-hygrothermal software, shows the simulated mould growth over the ten-year period. The graph shows a continual mould growth pattern over the ten-year period. Figure 10 shows the mould growth indices from bio- hygrothermal software. The graph shows a mould growth index range from 0 to 5 or 6. The graph shows a gradual increase from 0 to 4 in the first year, with an increase to 5 in the second and subsequent years. This indicates that this form of construction supports dangerous levels of moisture accumulation and mould growth in the air cavity space.
Figure 8: Graph showing temperature and relative humidity fluctuations in the air cavity layer using bio-
hygrothermal software
Figure 9: Graph showing the mould growth rate in the air cavity layer using bio-hygrothermal software
Figure 10: Graph showing the mould index in the air cavity layer using bio-hygrothermal software
The next element analysed is the 1mm pliable membrane. Figure 11 shows the relative humidity, critical relative humidity, and temperature fluctuations from bio-hygrothermal software. The results include the red traffic light indicating that the mould growth rate is unacceptable. Figure 12 from bio-hygrothermal software, shows the simulated mould growth over the ten-year period. The graph shows a continual mould growth pattern over the ten-year period. Figure 13 shows the mould growth indices from bio-hygrothermal software. The graph shows a mould growth index range from 0 to 4. The graph shows a gradual increase from 0 to 2 in the first year, with an increase to 4 in the third and subsequent years. This indicates that this form of construction supports dangerous levels of moisture accumulation and mould growth on the inside surface of the pliable membrane.
Figure 11: Graph showing temperature and relative humidity fluctuations in the vapour
impermeable membrane layer using bio-hygrothermal software
Figure 12: Graph showing the mould growth rate in the vapour impermeable membrane layer using bio-
hygrothermal software

Shruti Nath, Mark Dewsbury, Phillipa Watson, Heather Lovell and Hartwig Künzel
8
Figure 13: Graph showing the mould index in the vapour impermeable membrane using bio-hygrothermal software
The next element analysed is the 90mm insulated timber frame. Figure 14 shows the relative humidity, critical relative humidity, and temperature fluctuations from bio-hygrothermal software. The results include the red traffic light indicating that the mould growth rate is at an unacceptable level. Figure 15 from bio-hygrothermal software, shows the simulated mould growth over the ten-year period. This shows a continual mould growth pattern. Figure 16 shows the mould growth indices from bio-hygrothermal software. The graph shows a mould growth index range from 0 to 5. The graph shows a gradual increase from 0 to 2 in the first year, with an increase to 5 by the fourth and subsequent years. This indicates that this form of construction supports dangerous levels of moisture accumulation and mould growth within the insulated timber frame.
Figure 14: Graph showing temperature and relative humidity fluctuations in the brick layer
using bio- hygrothermal software
Figure 15: Graph showing the mould growth rate in the insulation layer using bio-hygrothermal
software
Figure 16: Graph showing the mould index in the insulation layer using bio-hygrothermal software
The final element analysed is the 10mm gypsum paper faced plasterboard layer. Figure 17 shows the relative humidity, critical relative humidity, and temperature fluctuations from bio-hygrothermal software. The results include the green traffic light indicating that moisture accumulation and mould growth are at an acceptable level. Figure 18 from bio-hygrothermal software, shows the simulated mould growth over the ten- year period to be zero. Figure 19 shows the mould growth indices from bio-hygrothermal software. The graphs show a nil mould growth index. This indicates that this form of construction does not support dangerous levels of moisture accumulation and mould growth within the paper faced plasterboard lining.
Figure 17: Graph showing temperature and relative humidity fluctuations in the plasterboard layer using bio-hygrothermal software
Figure 18: Graph showing the mould growth rate in the plasterboard layer using bio-hygrothermal software

9
A bio-hygrothermal analysis of typical Australian residential wall systems
Figure 19: Graph showing the mould index in the plasterboard layer using bio-hygrothermal software
The simulation results presented above, show that the clay brick, air cavity, pliable membrane and insulated wall frame layers of this wall system will have significant moisture accumulation and mould growth over a ten-year period. The bio-hygrothermal post-processing software bio-hygrothermal software identified the risk with a red traffic light graphic, indicating this wall type composition, as it was detailed, is unsuitable in this climate type. The results from this simulation and analysis is of concern, as this method of construction is very common in much of Australia. The aspect of mould growth on the inside surface of the clay brick or the outside surface of the pliable membrane requires further investigation, as this would lead to mould spores leaking out from weep holes in the wall system. The aspect of moisture accumulation and mould growth on the inside surface of the pliable membrane and within the insulated timber frame also requires further research, as the timber structure may decay prematurely and mould spores could enter the interior environment via gaps in the plasterboard wall lining (i.e., electrical and plumbing fittings).
As noted in the methods, the results presented above are for the west orientation of this façade system in NCC climate zone 7. Table 2 below shows the mould growth results for this wall system in the other cardinal orientations where red indicates that the mould growth rate is at an unacceptable level, yellow indicates that moisture accumulation and mould growth at an attained level requires further investigation and green indicates that moisture accumulation and mould growth are at an acceptable level. The west oriented cavity brick veneer wall, constructed in this typical manner in climate zone 7, can be seen in table 2 to be likely to have significant moisture accumulation and mould growth in CZ7. Additionally, the south and eastern oriented walls have some risk of moisture accumulation and mould growth in the 4, 5 & 6-Star construction typologies. All four wall orientations showed significant risk of moisture accumulation and mould growth in the likely insulated framed wall system for a 7 Star wall system.
Table 2 : Mould growth results of a typical cavity brick veneer wall in other cardinal orientations in CZ7
5. ConclusionSince 2014, Australian scholars and design and construction professionals have raised concerns about the
increased presence of mould and condensation within new stand-alone and multi-residential buildings. Architectural design, documentation, and construction practices (including building product selection) need to change to include a focus on minimizing moisture accumulation and mould growth within the built fabric. This paper documents an in-depth analysis of the most common residential façade system, namely, and insulated cavity brick veneer wall. In this research, the cavity brick veneer wall was simulated for NCC climate zone 7 within a hygrothermal and a bio-hygrothermal simulation software. The detailed data presented in this paper is for the west orientation of this wall system. The simulation results clearly document that this facade system supports long term moisture accumulation. The software identified this wall as supporting long term mould growth over the ten-year calculation period. This would indicate that this façade system is inappropriate for use in this climate type. By inference, this would also support concern from the design and construction professions about an increased presence of condensation and mould in new homes. This research identifies that this wall system, which is currently an approved method of facade construction in all Australian climates, may need significant adjustments if the NCC goal for safe housing is to be maintained. As mentioned in the introduction, the greater research program is analysing this and other typical residential façade systems in three Australian climate types. A key component of this paper includes the evaluation of internationally accepted methods for mould growth.

Shruti Nath, Mark Dewsbury, Phillipa Watson, Heather Lovell and Hartwig Künzel
10
This research is still progressing and will be reported in due course. Future publications will report on other external wall systems in different climate zones.
6. ReferencesABCB (2019) National Construction Code: Volume 2, The Australian Building Codes Board. Ambrose, M. and Syme, M. (2017) Air tightness of new Australian residential buildings, ScienceDirect, 180, 33-40. Arena, L. and Mantha, P. (2013) Moisture Research-Optimizing Wall Assemblies, National Renewable Energy Lab.(NREL), Golden,
CO (United States). Ballinger, J. A. and Lyons, P. R. (1996) Advanced glazing technology for Australia - research and application, Renewable Energy,
8(1-4), 61-65. Berry, S. and Marker, T. (2015) Residential energy efficiency standards in Australia: where to next?, Energy Efficiency, 8(5),
963-974. Bulic, T., Cole, V. P. and Erbas, B. (2019) Review of the effects of condensation in low-rise residential buildings, 43RD AUBEA, 321. CBOS (2018) Guide for control of condensation and mould in Tasmanian homes, in D. o. Justice (ed.), Consumer, Building and
Occupational Services, Tasmania, 22. Chang, S. J., Wi, S., Kang, S. G. and Kim, S. (2020) Moisture risk assessment of cross-laminated timber walls: Perspectives on climate
conditions and water vapor resistance performance of building materials, Building and Environment, 168, 106502. CSIRO (2020) External wall types. Dewsbury, M. and Law, T. (2016) Recent increases in the occurrence of condensation and mould within new Tasmanian
housing,50th International Conference of the Architectural Science Association 2016, 715-724. Dewsbury, M. and Law, T. (2017) Temperate climates, warmer houses and built fabric challenges, Procedia Engineering, 180,
1065-1074. Dewsbury, M., Law, T., Potgieter, J., Fitz-Gerald, D., McComish, B., Chandler, T. and Soudan, A. (2016) Scoping study of
condensation in residential buildings-Final report. Douwes, J. and Pearce, N. (2003) Invited commentary: is indoor mold exposure a risk factor for asthma?, American journal of
epidemiology, 158(3), 203-206. Ghaffarianhoseini, A., AlWaer, H., Omrany, H., Ghaffarianhoseini, A., Alalouch, C., Clements-Croome, D. and Tookey, J. (2018) Sick
building syndrome: are we doing enough?, Architectural Science Review, 61(3), 99-121. Knibbs, L. D., Woldeyohannes, S., Marks, G. B. and Cowie, C. T. (2018) Damp housing, gas stoves, and the burden of childhood asthma
in Australia, Medical Journal of Australia, 208(7), 299-302. Künzel, H. M., Holm, A., Zirkelbach, D. and Karagiozis, A. N. (2005) Simulation of indoor temperature and humidity conditions
including hygrothermal interactions with the building envelope, Solar Energy, 78(4), 554-561. Künzel, H. M. and Zirkelbach, D. (2013) Advances in hygrothermal building component simulation: modelling moisture sources
likely to occur due to rainwater leakage, Journal of Building Performance Simulation, 6(5), 346-353. Law, T. (2019) Submission for the Parliamentary Inquiry into Biotoxin-related Illnesses in Australia, Archsciences. Leardini, P. M. and Van Raamsdonk, T. (2010) Design for airtightness and moisture control in New Zealand
housing,Proceedings of the New Zealand Sustainable Building Conference, Wellington, New Zealand. Lstiburek, J. (2002) Investigating & diagnosing moisture problem, ASHRAE journal, 44(12), 36. Mumovic, D., Ridley, I., Oreszczyn, T. and Davies, M. (2006) Condensation risk: comparison of steady-state and transient
methods, Building Services Engineering Research and Technology, 27(3), 219-233. Nath, S. and Dewsbury, M. (2019) The use of an innovative hygrothermal simulation method to develop built fabric
recommendations for southern Australia,53rd International Conference of the Architectural Science Association (ANZAScA), Architectural Science Association (ANZAScA), IIT Roorkee, India, 1-10.
Nath, S., Dewsbury, M. and Douwes, J. (2019) Has a singular focus of building regulations created unhealthy homes?, Architectural Science Review, 1-15.
Nelson, T. B. (2017) Moisture Safety in Highly Insulated Wood-Frame Wall Constructions, NTNU. Olaoye, T. S. and Dewsbury, M. (2019) Establishing an environmentally controlled room to quantify water vapour resistivity
properties of construction materials,53rd International Conference of the Architectural Science Association, . Smith, M. (2017) Avoidance and diagnosis of problems associated with internal wall insulation, Journal of Building Survey,
Appraisal & Valuation, 6(1), 11-25. Vanpachtenbeke, M. (2019) Timber frame walls with brick veneer cladding: reliability to fungal decay, Civil Engineering, KU
Leuven, Belgium. Vereecken, E., Saelens, D. and Roels, S. (2011) A comparison of different mould prediction models,Proceedings of Building
Simulation 2011: 12th Conference of International Building Performance Simulation Association, Sydney, Australia. Viitanen, H., Krus, M., Ojanen, T., Eitner, V. and Zirkelbach, D. (2015) Mold risk classification based on comparative evaluation of
two established growth models, 6th International Building Physics Conference, IBPC 2015, Torino, Italy, 1425 – 1430. Viitanen, H. and Ojanen, T. (2007) Improved model to predict mold growth in building materials, Buildings X. WHO (2009 ) WHO guidelines for indoor air quality: dampness and mould, Copenhagen, World Health Organization, ed.

11
The 54th International Conference of the Architectural Science Association (ANZAScA) 2020
A comparative study between Daylight Factor Based Metric and other Daylight Metrics for Daylighting Design
Shuyang Li1, Danny H.W. Li1 and Wenqiang Chen1
1 City University of Hong Kong, Hong Kong SAR, China [email protected]
[email protected] [email protected]
Abstract: The calculation of the daylight illuminance for a given position in a building is a key step in daylighting schemes. In order to predict the daylight performance of room space and set a scale for architects to use when comparing aspects of various daylighting schemes, there are a number of rules of thumb and design metrics. The Daylight Factor based metric is under the traditional overcast sky excluding direct sunlight. It is frequently formalized within national standards in many countries. However, such metric does not consider the dynamic variations in daylight illuminance. Recently, daylight factor calculations have been extended for all sky conditions. It means that Daylight Factor based metric is no longer static and it can take into account the building directions, solar positions and the effects of direct and reflected sunlight. This paper provides a review of the daylight factor based metric and gives an overview of the current dynamic daylight metrics. The daylight factor based metric and other dynamic daylight metrics are analysed. The findings would be useful to practitioners engaged in visual comfort, fenestration and daylighting design and evaluation.
Keywords: Daylight factor; useful daylight illuminance; daylight autonomy; dynamic daylight metrics.
1. IntroductionHong Kong is one of the most densely populated and built-up cities in the world and electricity is mainly expended by building stocks. Currently, over 90% of electricity is consumed by building sectors. Daylighting is an impressive and sustainable development strategy (Sudan et al., 2015) and the design concept is an important issue for the architecture and the building research to enhance visual comfort, physical health, energy-efficiency and green building development.
In order to predict the daylight performance of room space and set a scale for building designers to use when comparing aspects of various daylighting schemes, researchers put forward a number of rules of thumb and design metrics, such as Daylight Autonomy (DA), Useful Daylight Illuminance (UDI) and daylight factor (DF). DA was originally proposed by the Association Suisse des Electriciens. Later, Reinhart and Walkenhorst (2001) redefined the total natural lighting percentage for DA as a dynamic
Imaginable Futures: Design Thinking, and the Scientific Method. 54th International Conference of the Architectural Science Association 2020, Ali Ghaffarianhoseini, et al (eds), pp. 11–20. © 2020 and published by the Architectural Science Association (ANZAScA).

Shuyang Li, Danny H.W. Li and Wenqiang Chen
12
lighting evaluation indicator. Recently, Nabil and Mardaljevic (2005 and 2006) proposed the UDI, which is defined as the illuminances at the work plane within the range of 100lux - 2000lux. Daylight Factor Approach (DFA) is the most commonly accepted daylight performance metric, though it provides the worst daylighting condition (Hopkinson et al., 1966) under the traditional overcast sky. Such DFA is not flexible enough to predict the dynamic variations in daylight illuminance when the sun’s location varies and the sky condition becomes non-overcast (Littlefair, 1989). Moreover, DF has limitations in assessing the daylighting performance of a room space under a real daylight climate (Bian and Ma, 2017). Lately, DF calculations have been extended under all sky conditions (Li et al, 2018). It means that Daylight Factor Based Metric (DFBM) is no longer static and it can take into account the building directions, solar positions and the effects of direct and reflected sunlight. This paper provides an overview of the DFBM as well as the latest Dynamic Daylight Metrics (DDM). The DFBM and other DDM are analyzed and the design implications are discussed.
2. Daylight metrics
2.1. Daylight autonomy
The minimum Daylight Autonomy (DAmin) is defined as the percentage of year when a minimum illuminance requirement is met by daylight alone and it is often used as the typical recommendation for a given task (BS8260,1992; IES, 1993). It means that DAmin would be quite appropriate for estimating the lighting energy saving under standard daylight-linked on-off lighting controls. However, DAmin cannot reflect excessive indoor daylight. To deal with visual glare issue, maximum Daylight Autonomy (DAmax) was proposed. The threshold is typically ten times the design illuminance of a space. This upper threshold criterion is a measure of the appearance of direct sunlight or other glare conditions, and it gives an indication of the frequency and location for large illuminance contrasts in a given space. In 2006, Zach Rogers (2006) proposed continuous Daylight Autonomy (DAcon) as a basic modification of DA. DAcon represents the percentage of the floor area that exceeds 300 lux for at least 50% of the time giving partial credit below 300 lux. For example, if an interior grid point has 150 lux in a given time due to daylight, DA300 would give it 0 point whereas DAcon300 would give it 150/300=0.5 point. This daylight metric would be useful for estimating the energy savings for dimming or multi-level switching controls. Spatial Daylight Autonomy (DAspa) describes how much of a space receives sufficient daylight (IES, 2012). Specifically, it describes the percentage of floor area that receives the threshold illuminance for a standard percentage (e.g. 50%) of the annual occupied hours. Unlike DA, DAspa returns a single number for space. The main limitation is that DAspa does not include glare or direct sunlight. DA is not limited to the type of all-overcast skies. Considering the dynamic variations of sky brightness distribution throughout the year, it can more accurately evaluate the natural lighting quality of office space during the year.
2.2. Useful daylight illuminance
For each point in the room, there is a set of three metrics: the percentage of time that a point was less than the minimum threshold (<100 lux), which may not be any useful assistance in the perception of the visual environment or performance of visual tasks; more than the maximum threshold (>2000 lux), which may produce visual or thermal discomfort; between the bounds of minimum and maximum (100- 2000 lux), which is called useful daylight illuminance (UDI) (Nabil and Mardaljevic, 2006). UDI can reflect the natural lighting distribution in different illuminance intervals, because it can independently evaluate

13
A comparative study between Daylight Factor Based Metric and other Daylight Metrics for Daylighting Design
the natural lighting conditions above 2000lx, and can be used to predict the glare conditions in office space.
2.3. Daylight factor
Daylight factor approach (DFA) is the conventional method for calculating the interior daylight under overcast conditions (Hopkinson et al. 1966). The DFA can be logically computed via simple calculation tools (CIBSE, 1997) without the use of daylight data. Point Daylight Factor (PDF) is defined as the ratio of illuminance due to daylight at a point on the indoors working plane to simultaneous outdoor illuminance on a horizontal plane from an unobstructed hemisphere of CIE standard overcast sky. The DF has shown the effectiveness of daylight-linked controls in saving energy on electric lighting (Leslie et al, 2005). Average Daylight Factor (ADF) indicates the visual adequacy of the daylighting in space as a whole rather than any particular point (Longmore, 1975). ADF is directly related to the window area and less-detailed input data than those provided by the PDF, which is useful in the sketch design stage (Lynes and Littlefair, 1990). Vertical Daylight Factor (VDF) accounting for light approaching from the sky and daylight reflected from opposite buildings and the ground onto a vertical surface has been appropriately used for compact city regions with vast external obstructions (Ng, 2003). In Hong Kong, the VDF has been used to specify the daylighting performance of buildings (Buildings Department, 2015).
In 2003, CIE adopted a series of 15 sky luminance distributions as the international standard models (ISO, 2004), representing the sky conditions in many places and covering the entire possible sky spectrum found in nature. The calculation of DFs can be extended to include non-overcast skies. It means that DFA is no longer a static metric. Compared with DA and UDI, the main advantage of DFA is that DFs are strongly correlated with the room parameters, particularly the window area, the visual transmittance and building orientation. It could be easily to change the room parameters (i.e. t and W) to meet the DF criteria. In addition, DFs can be obtained based on simple design tools such as chart, diagrams and simple formula.
3. Case study and proposed methodology
3.1. Case study
The PDF, ADF, VDF, UDI and different forms of DA for the 15 unobstructed CIE Standard Skies were estimated based on the following case study. The centre of the vertical window faces south. The reflectance of wall, ceiling and floor is 0.5, 0.8 and 0.2, respectively. Totally, 9 reference points were used to demonstrate the proposed approach. The spacing of 1 m between the reference points and a height of 1 m above the floor. Fig. 1 presents the layout of the room and the reference points arrangement for estimating the DFs and other daylight metrics.
Figure 1: Room layout and reference points.

Shuyang Li, Danny H.W. Li and Wenqiang Chen
14
3.2. Proposed methodology
The PDF can be calculated as the sum of three components, namely the Sky Component (SC), the Internally Reflected Component (IRC) and the Externally Reflected Component (ERC). Under an unobstructed sky, there is no outdoor illuminance reflected from opposing external vertical surfaces to the interior point (i.e. no ERC):
DF = SC + ERC (1)
Previously, a nomograph and a Waldram diagram for calculating the SC were established (Li et al., 2006), the detailed calculation procedures can be referred to the previous papers (Longmore, 1975). The computation of the IRC can be based on the theory of the split-flux principle. Mathematically, IRC can be given as:
IRC = t × W × [(C × Rfw + D × Rcw) / A × (1 - R)] (2)
Where: A = total area of all the interior surfaces m2; C and D = the configuration factors of the daylight flux
incident on the mid-height of the window pane from above and below the horizon, respectively, dimensionless; R = the average reflectance of all the interior surfaces, dimensionless; Rcw = the average reflectance of the ceiling and upper walls above the mid-height of the window, excluding the window wall, dimensionless; Rfw = the average reflectance of the floor and lower parts of the walls below the mid-height of the window, excluding the window wall, dimensionless; t = the visual transmittance of the window, dimensionless; W = window area, m2.
The VDF is the sum of C and D. For an unobstructed sky, C is the vertical sky component (VSC) which is the ratio of the vertical illuminance to the horizontal sky-diffuse illuminance available at the same point. Constant VSC values of 40, 46 and 50% representing, respectively, the Standard Skies 1, 3 and 5 were obtained. For other 12 CIE Standard Skies, the VSC substantially relies on the solar location and the VSC could be identified by the scattering angle (χ). To provide precise VSC values for subsequent study, the template of Gaussian functions (Li et al., 2016) that depict the symmetric bell curve shape were used to correlate VSC with the χ for the 12 CIE Standard Skies as shown in Equation 3.
VSC = A1 × exp {- [(χ – B1) / C1]2} + A2 × exp {- [(χ – B2) / C2]2} (3)
Where: A1, B1, C1, A2, B2 and C2 = the regression coefficients. For non-overcast skies (i.e. Skies 7 to 15) the ground reflected component due to direct sunlight (𝐸𝐸𝐻𝐻𝐻𝐻)
should be included. Mathematically, D can be expressed as:
D = (EHD + EHB) ×ρg / (2 × EHD) (with EHB) (4)
D = 0.5 × ρg / EHD (without EHB) (5)
EHB = ENB × sinαS (6)
EHB = horizontal direct solar illuminance, lux; EHD = unobstructed horizontal sky-diffuse illuminance (lux); ENB = direct normal sunlight, lux; αS = solar altitude, degree; ρg = ground reflectance, dimensionless.
The approximate EHD and ENB may be either measured or obtained from a number of articles (Kittler et al., 1998). Under non-overcast skies, the sun can cast a large and well defined shadow in front of the window facade. To cater such effect, it can be assumed that only diffuse component was considered for

15
A comparative study between Daylight Factor Based Metric and other Daylight Metrics for Daylighting Design
those shaded areas (using Equation 5) (Li, 2006). According to the ADF equation proposed by Longmore (1975), the extra item is C over the floor area and lower parts of the walls under the mid-height of the window (Afw) as presented in Equation (7).
ADF = t × W × (C / Afw) + IRC (7)
Obtaining the C and D, the IRC, PDF, VDF and ADF under the 15 unobstructed CIE Standard Skies can then be computed for further analysis. Use Eqs. 1 to 7 based on measured global, diffuse and direct daylight illuminance in 2005 for computing the daylight metrics.
3.3. Sky classification
The measured data included the daylight illuminance were recorded from January 2005 to December 2005. The centre of the vertical window faces south from 9:00 to 16:00 in True Solar Time under the 15 CIE unobstructed skies. It is inevitable that there are some periods of missing data for various reasons, including instrumentation malfunction, power failure and photometers damage. After the quality- control test, a total of 17640 sets of databased on intervals of 10 min measurement were analysed in this study.
Figure 2: Frequency of occurrence of the 15 sky standards. Accordingly, the frequency of occurrence of the 15 standard skies using the best-fitting sky luminance
distributions approach is presented in Figure 2 (Li et al, 2014). It revealed that Skies 1, 8 and 13 are the typical sky conditions in Hong Kong, representing 25%, 29% and 16%, respectively. The overcast and intermediate skies (Skies. 1–10) represent about 78.7% of the Hong Kong sky conditions. The clear skies (i.e. Skies. 11–15) account for the remaining 21.3%.
4. Results and discussions
4.1 The performances of DFs
Figure 3 presents the VDF at various χ under the 15 unobstructed CIE Standard Skies. It indicates that VDFs strongly depend on the sun position. Except from Skies 1, 3 and 5, maximum VDFs for individual skies appear at low χ of around 20° and drop with increase of χ. When χ is between 115°and 125°, VDFs are at their minimum values and then increase slightly as the χ goes further. For overcast sky conditions (Figure 3(a)), VDFs do not vary according to the χ under Skies 1, 3 and 5, which are 50%, 56% and 60%. Under Skies 2 and 4, the curves of VDFs vs. ꭓ vary gently. The C is the dominant value of VDFs because the D is just a constant of 10% for overcast skies. For intermediate (Figure 3(b)) and clear (Figure 3(c)) sky conditions containing certain amount of direct component, the VDFs vary substantially with χ. The

Shuyang Li, Danny H.W. Li and Wenqiang Chen
16
largest and lowest VDFs are respectively, 207% and 36% both occurring in Sky 15. The correlation of VDF and ꭓ indicates that VDF is an important parameter for building orientation designs.
(a) Overcast sky conditions (b) Intermediate sky conditions (c) Clear sky conditions
Figure 3: Vertical daylight factor vs. scattering angle (χ).
In order to obtain ADF equal to 1%, 2%, 3%, 4% and 5% under Sky 1, different window areas and transmittances were set. Table 1 shows the results. As the window area and transmittance increase, ADF rises gradually. It indicates that ADF can be obtained easily by changing these two parameters. This is very useful during the initial design phase of building scheme as complex calculations to get the suitable indoor daylight environment are not required.
Table 1: Correlations between window area, window transmittance and ADF under Sky No.1.
Cases Average daylight factor (%) Window area (m2) Window transmittance 1 1 2 0.4 2 2 4 0.45 3 3 4 0.7 4 4 5 0.75 5 5 6 0.75
The ranges of ADFs under 15 CIE Standard Skies are shown in Table 2. Under overcast sky conditions, the change of ADFs in each case is not obvious. Therefore, it is necessary to evaluate the ADFs under intermediate and clear sky conditions to reflect the indoor daylight performance. When ADF is less than 2% under Sky 1, the average ADFs of Skies 6-15 are not more than 4.5%, and the maximum ADF is 6.2% under Sky 13. However, as the window transmittance and area increase, the ADFs become larger and average ADF under Sky 13 can be three times more than under Sky 1. It will not only cause visual discomfort, but also will generate a large amount of cooling load.
Similarly, the ranges of PDFs at 9 reference points under all sky conditions in the whole year are shown in Table 3. The minimum and maximum average PDF are found to be 0.8% at Points 6 and 9 for Case 1 and 14.7% at Point 1 under Case 5. Generally, the PDF at each reference point rises as the ADF increases from Case 1 to Case 5. However, the increments for different points are distinct. Specifically, Points 1, 4 and 7 which are closer to the window have the largest increases of average PDF (around 10%), while Points 3, 6 and 9 have the lowest increases (around 5%). PDFs of Points 5 and 8 and Points 6 and 9 on both side of the room are equal, which are less than the PDFs at the points in the centre of the room. It indicates that the points away from the window centre are less affected by daylight. Point daylight illuminance can be obtained by multiplying the PDFs with the EHD. It means that PDF can be used for calculating the UDI and different forms of DAs.

17
A comparative study between Daylight Factor Based Metric and other Daylight Metrics for Daylighting Design
Table 2: Ranges of average daylight factor under 15 CIE Standard Skies (%)
Sky Case 1 Case 2 Case 3 Case 4 Case 5 No. Range Avg. Range Avg. Range Avg. Range Avg. Range Avg.
1 1 1 2 2 3 3 4 4 5 5 2 0.75-1.17 0.96 1.57-2.42 1.97 2.42-3.74 3.05 3.26-5.04 4.11 3.83-5.91 4.83 3 1.13 1.13 2.32 2.32 3.59 3.59 4.83 4.83 5.67 5.67 4 0.86-1.36 1.1 1.78-2.79 2.2 2.76-4.31 3.51 3.71-5.81 4.73 4.36-6.82 5.55 5 1.22 1.22 2.5 2.5 3.87 3.87 5.21 5.21 6.12 6.12 6 0.96-1.5 1.17 1.97-3.08 2.42 3.05-4.76 3.74 4.11-6.41 5.04 4.83-7.52 5.91 7 0.83-1.68 1.2 1.72-3.44 2.47 2.66-5.32 3.83 3.58-7.17 5.16 4.2-8.41 6.05 8 0.7-2 1.2 1.46-4.16 2.5 2.26-6.42 3.86 3.04-8.65 5.21 3.58-10.2 6.12 9 1.21-1.7 1.4 2.48-3.48 2.87 3.84-5.38 4.45 2.17-7.25 5.99 6.06-8.49 7.03
10 1.05-2.04 1.53 2.17-4.17 3.15 3.36-6.46 4.87 4.52-8.7 6.56 5.31-10.2 7.7 11 0.89-2.19 1.53 1.84-4.49 3.15 2.84-6.95 4.86 3.83-9.37 6.56 4.5-1.099 7.69 12 1.03-1.85 1.58 2.12-3.79 3.26 3.28-5.86 5.04 4.42-7.89 6.79 5.19-9.25 7.96 13 0.87-2.96 2.06 1.81-6.2 4.27 2.8-9.57 6.59 3.78-12.9 8.88 4.44-15.19 10.44 14 1.19-2.11 1.94 2.45-4.33 3.97 2.78-6.7 6.14 5.1-9.03 8.28 5.98-10.58 9.7 15 1.68-2.71 2.08 3.46-5.67 4.28 2.35-8.75 6.62 7.2-11.79 8.92 8.45-13.88 10.47
Table 3: Ranges of point daylight factor at 9 reference points (%).
Reference Case 1 Case 2 Case 3 Case 4 Case 5 points Range Avg. Range Avg. Range Avg. Range Avg. Range Avg.
1 1.67- 3.12 5.08- 6.64 7.88- 10.3 9.86- 12.97 11.08- 14.7 6.31 9.66 14.95 19.05 21.81
2 0.64- 1.47 2.26- 3.6 3.5- 5.57 4.43- 7.07 4.9- 8.03 3.67 6.48 10.01 12.83 14.84
3 0.38- 0.82 1.25- 2.24 1.92- 3.46 2.63- 4.72 2.98- 5.39 2.2 4.75 7.32 9.93 11.42
4 1.19- 2.34 3.79- 5.15 5.88- 7.99 8- 10.85 9.09- 12.35.04 7.97 12.33 16.68 18.96
5 0.54- 1.21 1.83- 3 2.83- 4.65 3.92- 6.4 4.3- 7.18 3.04 5.69 8.78 12.01 13.73
6 0.37- 0.8 1.22- 2.19 1.88- 3.37 2.44- 4.38 2.79- 5.1 2.14 5.69 7.18 9.41 11
7 1.23- 2.42 3.79- 5.15 5.88- 7.99 8- 10.82 9.09- 12.272.05 8 12.37 16.73 19.01
8 0.54- 1.21 1.83- 3 2.83- 4.64 3.92- 6.4 4.3- 7.17 2.98 5.7 8.79 12.03 13.73
9 0.37- 0.8 1.22- 2.19 1.88- 3.37 2.44- 4.38 2.79- 5.09 2.11 4.67 7.2 9.41 11.02
4.2. Analysis of UDI and different DAs
UDIs were calculated based on PDFs (indoor illuminance = PDF x EHD) at 9 reference points. Table 4 shows the results. Daylight illuminances in the ranges of 100-2000lux account for a high proportion of annual daylight illuminance for some points in Cases 1 and 2. This means that the indoor daylight environment available for people to live or work, should be neither too dim nor too bright to cause
visual discomfort. As the ADFs increases (i.e. Cases 3, 4 and 5), the proportion of daylight illuminances greater than 2000lux become more, especially at the reference points near the window. In Case 5, the percentage of daylight illuminances greater than 2000lux is 75% at Point 1, while at Point 9 is only 20%. It

Shuyang Li, Danny H.W. Li and Wenqiang Chen
18
indicates that points close to the window get more daylight and are more prone to glare, while points farther away from the window receive less daylight. It seems that the centre point (i.e. Point 2) may represent the overall daylight performance of the room. If the daylight factor of centre point is known, the corresponding UDI for the room may be computed.
Table 4: Useful daylight illuminance at 9 reference points (%).
The calculation results of DA and DAcon at 9 reference points are shown in Figure 4. Three indoor illuminance thresholds (100, 300, and 500 lux) were set. Since daylight illuminance below the threshold will also be counted as a credit in the DAcon, DA is generally less than DAcon for all the cases, especially, when ADF is less than 2% under Sky 1 (i.e. Cases 1 and 2). When ADF further increases (from Case 2 to Case 5), the difference between DA and DAcon at each point becomes smaller. DA and DAcon would be increase as the window area and light transmittance increase. As the minimum threshold was set from 100 lux to 500 lux, both DA and DAcon distinctly decrease for all the cases with the reductions of DAcon less than that of DA. The reduction of DAcon or DA at the rear points is generally greater than that at the points near the window. The above analysis indicates that these two forms of DA can be used for evaluating the energy savings of dimming or multi-level switching daylight-linked lighting control systems with different target illuminance settings.
Table 5 shows the results of spatial daylight autonomy (50%, 70% and 80% of the occupied hours) with different illuminance thresholds (100 lux, 300 lux, 500lux and 700 lux). With the exception of DAspa 100,50%
and DAspa 100,70%, the values of other DAspa are below 50% because of the small window area and low transmittance of Case 1. For other four cases, the values of DAspa 50% with 100lux, 300lux and 500lux are equal to 100%. It indicates that 50% of the total occupied hours may be too small to evaluate the annual daylighting performance. The values of DAspa decrease significantly by increasing both the percentage of occupied hours and illuminance threshold. DAspa can only represent the percentage of the total floor area that can meet the defined criteria, but it cannot reflect which part of the room fulfilling the criteria. Besides, the DAspa cannot indicate the excessive daylight in the room, especially for non- overcast skies in which the direct sunlight dominants.

19
A comparative study between Daylight Factor Based Metric and other Daylight Metrics for Daylighting Design
(a) target illuminance > 100lux (b) target illuminance > 300lux (c) target illuminance > 500lux
Figure 4: Comparisons of daylight autonomy and continuous daylight autonomy.
Table 5: Spatial daylight autonomy (%).
Cases DAspa
100, 50%
DAspa
100, 70%
DAspa
100, 80%
DAspa
300, 50%
DAspa
300, 70%
DAspa
300, 80%
DAspa
500, 50%
DAspa
500, 70%
DAspa
500, 80%
DAspa
700, 50%
DAspa
700, 70%
DAspa
700, 80%
1 100 100 44 44 33 0 33 0 0 11 0 0 2 100 100 100 100 100 67 100 44 33 67 33 11 3 100 100 100 100 100 100 100 67 44 100 67 33 4 100 100 100 100 100 100 100 100 67 100 67 44 5 100 100 100 100 100 100 100 100 78 100 100 67
5. ConclusionsUseful Daylight Illuminance (UDI) and Daylight Autonomy (DA) are useful daylight metrics, but they require typical annual daylight data which may not be always available for many places. Climate-based daylighting metrics and daylight factor based metrics have been studied in this paper. The absolute daylight illuminances at the indoor points can be obtained by multiplying the daylight factor by the corresponding horizontal sky diffuse illuminance. The computed daylight illuminances can be used for estimating the UDI and different forms of DA. The results show that the centre point could represent the overall daylight performance of the room, DAs and UDI can be computed by using the daylight factor of a particular point. DA and DAcon have similar patterns as the PDFs, these two forms of DA can be used for evaluating the energy savings of dimming or multi-level switching daylight-linked lighting control systems with different target illuminance settings. The criterion “50% of the total occupied hours” for DAspa may not be appropriate to evaluate the annual daylighting performance. It cannot indicate the excessive daylight in the room under non-overcast skies. As the 15 CIE skies represent the actual skies for many places and cover the whole probable spectrum of skies found in nature, the daylight factor approach (DFA) could be globally adopted and would be useful to practitioners engaged in architectural and daylighting designs and evaluations. In future works, the grid density would be further increased to minimize the uncertainties. The effects of other room parameters (i.e. window orientation and surface reflectance) on daylight metrics will be analysed. A series of computer simulations will be conducted for the validations.
Acknowledgements Work described was fully supported by a General Research Fund from the Grant Council of HKSAR [Project No. 9042504 (CityU 11209217)]. Wenqiang Chen was supported by a City University of Hong Kong Postgraduate Studentship.

Shuyang Li, Danny H.W. Li and Wenqiang Chen
20
References Bian, Y. and Ma, Y. (2017) Analysis of daylight metrics of side-lit room in Canton, south China: A comparison
between daylight autonomy and daylight factor, Energy and Buildings, 138, 347-354. Buildings Department (2015) Practice Note for Authorized Persons, Registered Structural Engineers and Registered
Geotechnical Engineers APP-130, Lighting and Ventilation Requirements-Performance-based Approach. Code of Practice for Daylighting. (1992) British Standard Institution, London, UK, British Standard BS8206 Part 2. CIBSE (1997). Code for interior lighting. London, UK. Hopkinson, R.G., Petherbridge, P. and Longmore, J. (1966) Daylighting, Heinemann, London, UK. IES. (1993) Lighting Handbook Reference & Application, ed., Illuminating Engineering Society of North America, New
York. IES. (2012) Approved Method: Spatial Daylight Autonomy and Annual Sunlight Exposure, IES LM-83e12, USA. ISO. (2004) CIE S 011/E:2003. Spatial Distribution Daylight-CIE Standard General Sky. In (Vol. ISO Standard 15469),
Geneva. Kittler, R., Darula, S. and Perez, R. (1998) A set of standard skies, Polygrafia, Bratislave.
Leslie, R.P., Raghavan, R., Howlett, O. and Eaton, C. (2005) The potential of simplified concepts for daylight, Lighting
Research and Technology, 37(1), 21-40. Li, D.H.W. (2007) Daylight and energy implication for the CIE standard skies, Energy Conversion and Management,
48(3), 745-755. Li, D.H.W., Cheung, G.H.W. and Lau, C.C.S. (2006) A simplified procedure for determining indoor daylight
illuminance using daylight coefficient concept, Building and Environment, 41(5), 578-589. Li, D.H.W., Cheung, Chau, T.C. and Wan, K.K.W. (2014) A review of the CIE general sky classification approaches,
Renewable and Sustainable Energy Reviews, 31, 563-574. Li, D.H.W., Li, C., Lou, S.W., Tsang, E.K.W. and Lam, J.C. (2015) Analysis of vertical sky components under various CIE
Standard General Skies, Indoor and Building Environment, 25(4), 703-711. Li, D.H.W., Li, S.Y., Chen, W.Q. and Lou, S. (2018) Analysis of Point Daylight Factor (PDF) Average Daylight Factor (ADF)
and Vertical Daylight Factor (VDF) under various unobstructed CIE Standard Skies, Paper presented at the The 9th edition of the international SOLARIS conference, Chengdu.
Littlefair, P.J. (1989) Predicting hourly internal daylight illuminances for dynamic building energy modelling, Garston, UK: Building Research Establishment.
Longmore, J. (1975) Daylighting: a current view, Light and Lighting, 68, 113-119. Lynes, J.A. and Littlefair, P.J. (1990) Lighting energy savings from daylight: Estimation at the sketch design stage,
Lighting Research and Technology, 22(3), 129-137. Nabil, A., and Mardaljevic, J. (2005) Useful daylight illuminance: a new paradigm for assessing daylight in buildings,
Lighting Research and Technology, 37(1), 41-59. Nabil, A. and John Mardaljevic, J. (2006) Useful daylight illuminances: A replacement for daylight factors, Energy and
Buildings, 38, 905-913. Ng, E. (2003) Studies on daylight design and regulation of high density residential housing in Hong Kong, Lighting
Research and Technology, 35(2), 127-139. Reinhart, C.F. and Walkenhorst O. (2001) Validation of dynamic RADIANCE-based daylight simulations for a test
office with external blinds, Energy and Buildings, 33, 683-697. Reinhart, C.F., Mardaljevic, J. and Rogers, Z. (2006) Dynamic daylight performance metrics for sustainable building
design, Leukos, 3(1), 7-31. Sudan, M., Tiwari, G.N. and Al-Helal, I.M. (2015) A daylight factor model under clear sky conditions for building: An
experimental validation, Solar Energy, 115, 379–389.

21
The 54th International Conference of the Architectural Science Association (ANZAScA) 2020
A computer vision deep learning method for the detection and recognition of manual window openings for effective
operations of HVAC systems in buildings
Paige Wenbin Tien1, Shuangyu Wei2, John Kaiser Calautit3, Jo Darkwa4 and Christopher Wood5 1, 2 ,3, 4, 5 University of Nottingham, Nottingham, NG7 2RD, UK
{paige.tien1, shuangyu.wei2, john.calautit13, j.darkwa4, christopher.wood5}@nottingham.ac.uk
Abstract: Manual opening of windows by occupants can lead to substantial heat loss and consequent energy consumption. It is important to develop control strategies that can detect and recognise the period of the window opening in real-time and adjust HVAC systems to minimise energy wastage and maintain indoor thermal comfort. This paper presents a computer vision deep learning framework for the detection and recognition of the manual window operations. A trained deep learning model is deployed into an artificial intelligence-powered camera. To assess the model’s capabilities, building energy simulation was used with various operation profiles of the windows; fixed profile, actual observation profile, and the deep learning influenced profile (DLIP) generated via the framework which uses data obtained from the real-time detection. The total heating load for a 2-hour period was 24.56kW when windows were opened and 3.46kW when closed, while actual heating requirement of the room was 8.01kW. This suggests the typical “static” scheduled window profiles cannot provide an accurate estimation of the building energy demand. The framework is capable of identifying if a window is open or close and help adjust the HVAC set point. It also enables alerts to occupants or building managers to prevent unnecessary heat losses.
Keywords: Deep learning; window detection; buildings; energy management.
1. Introduction and Literature ReviewHeating, ventilation and air-conditioning (HVAC) systems and its associated operations is currently the
largest contributor to the energy consumption of the built environment (Li, 2019). Reducing the energy consumption of buildings is crucial towards meeting global carbon emission reduction targets. Ventilation systems and its associated strategies are critical, as ventilation accounts for 30% of the heat loss in commercial buildings and 25% in industrial buildings (CIBSE, 2015). Energy-efficient strategies are continuously being developed to reduce ventilation heat loss; such solutions include implementing various types of heat recovery-based systems, strategies to help avoid uncontrolled air infiltration losses and to reduce the demand of controlled ventilation.
Imaginable Futures: Design Thinking, and the Scientific Method. 54th International Conference of the Architectural Science Association 2020, Ali Ghaffarianhoseini, et al (eds), pp. 21–30. © 2020 and published by the Architectural Science Association (ANZAScA).

Paige Wenbin Tien, Shuangyu Wei, John Kaiser Calautit, Jo Darkwa and Christopher Wood
22
Window opening is a common method for naturally ventilating buildings. It relies on natural forces of wind and temperature differences to ventilate and cool building spaces. However, the effectiveness of this strategy is highly dependent on the conditions between the indoor and outdoor environment and the window opening patterns (Kyritsi and Michael, 2019). Occupancy presence and behaviour can influence building indoor thermal conditions, air quality and building energy loads (Tahmasebi and Mahdavi, 2017) (Andersen et al., 2013). This leads to concerns towards ineffective usage of window openings which impacts building energy consumption (Wang and Grennberg, 2015). This indicates the need for the development of solutions such as demand-based controls that adapts to occupancy behaviour while also optimising building operations and comfort conditions.
Artificial intelligence (AI) is increasingly being adopted to enhance buildings performance (Panchalingam and Chan, 2014). AI techniques such as Deep Learning (DL) is becoming a popular and widely used tool for solving building-related problems and improve building HVAC systems (Dounis, 2010). This includes the use of DL based models for detecting and recognising problems in buildings such as damage, faults and diagnosis issues (Guo at al., 2018). Other applications include energy prediction methods (Singaravel, 2018) and energy management and control (Zhang et al., 2019) to improve building energy efficiency (Konstantakopoulos et al., 2019). This suggests that emerging deep learning- based methods are becoming a fundamental technique that can provide solutions to several building problems, in particular related to occupancy behaviour within buildings (Dong and Lam, 2011).
Deep learning techniques have recently been adopted for the development of window opening models. Markovic et al. (2018) used a deep feed-forward neural network to model the opening of windows in offices which showed a prediction accuracy between 86 and 89%. In addition, Markovic et al. (2019) suggest that deep learning can be used as a prediction method to address the time when window opening actions are performed by occupants. This study shows the potential of using deep learning techniques for enhancing building system operations.
Since most buildings do not have strict operational times, it leads to uncontrolled operations of windows. This is also strongly influenced by occupancy behaviour and the variation within the indoor- outdoor conditions. It results in windows being frequently left opened and increases building energy losses. This suggests that there are still limitations towards the developed approaches. The time delay between the prediction results and the ability to inform of the occupants of the situation and the effectiveness of the system performance is important. In addition, the approach suggested by Markovic et al. (2019) only focuses on the accuracy of the detection and prediction of the window opening. Future works should quantify the impact of the approach on energy performance and practicality. In addition, there is a need for further developments towards the use of DL techniques for building window detection specifically for the application of natural ventilation (NV) systems (O’Keefe and Roach, 2017). Additionally, Fabi et al. (2012) indicates that existing studies on window opening behaviour are aimed at investigating the state of the window itself instead of the transition from one state to another (opening and closing). Hence, there is a need to develop a solution which recognises the condition between open and closing along with the time when these actions were performed.
1.1. Aims and Objectives
This study aims to develop a vision-based deep learning framework that enables the real-time detection and recognition of the conditions of windows being opened or closed by occupants. To achieve this aim, objectives focusing on the development of a faster region-based convolutional neural network (Faster R-CNN) for classification and detection of windows using a camera must be performed.

23
A computer vision deep learning method for the detection and recognition of manual window openings for effective operations of HVAC systems in buildings
Furthermore, it is necessary to perform validation through testing and analysis of the developed deep learning model via the use of a set of testing data and through a series of live experimental detections. Experiments would be carried out within a case study university lecture room. This is to test the capabilities of the proposed approach. Using building energy simulation, the case study building will be simulated with both ‘static’ and deep learning influenced profiles (DLIP) to assess the potential energy savings that can be achieved.
2. Proposed Approach and Method
2.1. The Proposed Approach
Figure 1 presents an overview of the proposed framework. It is based on a data-driven deep learning framework that enables the detection and recognition of window openings, and the data is used to form Deep learning Influenced Profiles (DLIP). This method can inform occupants about the window condition and whether changes to the window conditions should be made. In addition, the profiles would feed into the control system of the HVAC system to make adjustments to minimise unnecessary loads. To initially test the approach, various types of window profiles were assigned to a building energy simulation (BES) model to identify potential reductions in building energy consumption and changes within the indoor environment.
Figure 1: Overview of the proposed framework-for data-driven deep learning method for detection and recognition of window conditions.
2.2. The Deep Learning Method
The initial step of the proposed framework was to develop a suitable deep learning model to enable live detection of window openings. For a CNN based deep learning method, images were gathered and labelled to form the input training datasets with the desired format. Images from the two categories opened and closed windows were specifically selected to form the large input dataset used to define the condition of windows. Training dataset consisted of a total of 200 images, and 272 labels and the testing dataset consisted of 50 images and 64 labels. Figure 2 shows an example of the images used

Paige Wenbin Tien, Shuangyu Wei, John Kaiser Calautit, Jo Darkwa and Christopher Wood
24
in the datasets of window open and window closed. Additionally, it shows how bounding boxes are drawn manually around the specific region interest of each image.
Figure 2: Example dataset images of windows and the region of interest (ROI) of labelled images. Images are obtained via Google image search of the relevant keywords.
A Faster R-CNN (With Inception V2) based CNN model was used progressively used to identify
window openings through live detection. The architecture and the pipeline configuration of the model used are given in Figure 3.
Figure 3: Image of the configured deep learning model for window detection.
As shown in Figure 3, the pre-existing CNN TensorFlow Object detection Application Programming Interface (API), Huang et al. (2016) was used as the base configuration for this current detection model. This object detection model is part of the TensorFlow official pre-defined model’s repository, it has the ability to localise and identify multiple objects in a single image. For the initial development of the deep learning model, the COCO-trained model of Faster R-CNN (with Inception V2) was selected as the initial model used for training of the network. Tests using different training model

25
A computer vision deep learning method for the detection and recognition of manual window openings for effective operations of HVAC systems in buildings
types would be implemented in future cases to provide an analysis and validation of the most suitable training model application.
2.3. The Application of the Deep Learning Method
Once the model was trained to a sufficient level where losses did not decrease any further, the associated inference graph was exported. Directly, the model was prepared for live detection via the deployment to a camera. During the live detection, continuous predictions of the window were classified to one of the two desired predicted output responses ‘open’ or ‘closed’, while also displaying the accuracy of the recognition in terms of percentages.
The building simulation tool IESVE was used to predict the building energy consumption. A lecture room located within the first floor of the Marmont Centre at the University Park Campus, University of Nottingham, UK was used as a case study building to provide a platform to support various stages of this framework. This includes the location for live occupant detection utilising the developed deep learning method and the desired building for energy simulation. The lecture room has a floor area of 96.9m2, with a floor to ceiling height of 2.5m. The room consists of three sets of windows, one external and internal door. Figure 4 shows an image of the Marmont Centre and the experimental setup. The setup consists of a ‘detection camera’, which is a standard 1080p camera with a wide 90-degree field of view connected to a laptop which runs the trained deep learning model and it also highlights the selected window used in the initial experiment. The windows have a top guided opening strategy and was double glazed with a U-value of 2.20 W/m2k.
Figure 4: a). Case Study Building: Marmont Centre, University Park, University of Nottingham. b). Selected experimental room: Marmont Lecture Room B5 with set up.
For the simulations, the IES simulation weather files for Nottingham, UK was used as the assigned weather data file for the selected building model. Assignment of the building operational hours of 08:00 to 18:00 with correlated typical profiles for heating and cooling was used to maintain the room at 21°C. Associated profiles for ventilation and occupancy were also assigned. For the air exchanges, infiltration rate value was set to 0.5ach.

Paige Wenbin Tien, Shuangyu Wei, John Kaiser Calautit, Jo Darkwa and Christopher Wood
26
3. Results and Discussions
3.1. Deep Learning Model Training
Using the Faster-RCNN with InceptionV2 as the training model, the calculation for 91,339 steps showed a maximum loss of 1.516 and a minimum loss of 0.000038. The training results are shown in Figure 5. The convergence of the loss function implies that the model has been effectively trained. Observationsmade for this proposed approach can be used to compare with the results of different modelconfigurations. Further modifications to the model configuration include the assignment of more trainingand test data and to also apply different types of models that can be used for training. Images locatedwithin the test dataset with the true assignment of 64 labels were used to perform evaluation of the model performance. The results suggest 24 labels were correctly assigned to opened windows and 28 labels forclosed windows respectively. However, 5 labels indicated the windows as open, when windows wereactually closed. Similarly, 7 labels of closed were assigned to opened windows. Table 1 presents asummary of the model performance. An average detection accuracy of 81.82% were achieved. Asindicated by the F1 Score, it suggests closed windows were better classified than opened windows.Overall, it indicated that majority of the images of windows were correctly classified. This validates themodel being suitable for window detection and recognition.
Figure 5: Deep learning model training using the Faster-RCNN with InceptionV2 model. Graphs showing the total loss against the number of steps and the training time (hours).
Table 1: Window detection model performance based on images assigned in the test dataset.
Class Window Accuracy Precision Recall F1 Score 1 Open 81.82% 0.8148 0.7586 0.7857 2 Closed 81.82% 0.82.05 0.8649 0.8421 Average for both types 81.82% 0.8148 0.8118 0.8139
3.2. Live Detection and Window Profile Results
Along with the selected case study building, a time frame of 13:00 -15:00 was used to perform the initial live detection. The response output window detection data were recorded to form the ‘Deep Learning Influenced Profile (DLIP)’. For the analysis of the impact of DLIP towards building energy

27
A computer vision deep learning method for the detection and recognition of manual window openings for effective operations of HVAC systems in buildings
performances using building simulations, this profile was compared along with four other profiles; constant open, constant closed, opened during typical office hours and the actual observation. The Actual Observation Profile represents the true window condition during the experimental time frame, which enables verification of the results obtained for the DLIP.
Figure 6: Formation process of the deep learning influenced profile from window detection data.
Figure 6 shows an example of the process of DLIP formation. It presents several snapshots of the recorded frame indicating the detected window condition and the percentage of prediction accuracy. This led to the formation of the profile results indicated in Figure 7 for the desired 2-hour experimental test. The results present the comparison of the DLIP with the Actual Observation. The DLIP provided an average detection accuracy of 77.78%. This shows that the DLIP still alternates between the two conditions, indicating further improvements is required to enhance the detection accuracy.
Figure 7: Generated deep Learning Influenced Profile (DLIP) results for window A, B, C, D with corresponding actual observation

Paige Wenbin Tien, Shuangyu Wei, John Kaiser Calautit, Jo Darkwa and Christopher Wood
28
3.3. Building Energy Performance Analysis
Various window profiles were assigned to the building model to enable the performance of a series of building energy simulation to enable the analysis of the impact towards building performance when the DLIP approach was used instead of typical window profiles.
Figure 8 presents the results of the total heating load achieved between 12:30 – 15:30 with the inclusive of the 2-hour test period. It suggested that windows were assumed to be constantly opened required a heating load of 24.56kWh. This is based on a worst-case scenario which indicates the maximum amount of heating that is required to maintain the room temperature at 21°C. In comparison for constantly closed windows, heating of 3.47kWh is needed. Due to the closed window, there are no heat losses through windows, which potentially reduces the heating requirements to the minimum. Besides this, occupancy was assigned to the lecture room, which indicated that due to the significant amounts of occupancy gains within the room, less heating was needed. Based on the Actual Observation, the predicted total demand is 8.01kW. This suggests that typical static profiles for windows cannot accurately represent the actual window conditions for the determination of the building heating loads.
It presents a considerable large difference as compared to Constant Opened (206.45%) and Constant Closed (56.78%), 16.55kWh higher and 4.55kWh lower in heating demands. Since many current HVAC system model assume windows have a fixed schedule within BES, a significant difference between prediction and actual exists.
Figure 8: Heating load results for a winter day (8th January) within the two-hour test duration in the lecture room.
Figure 9 presents the ventilation losses within the lecture room. The losses are influenced by the outdoor air conditions on the selected day and directly with the window profiles given in Figure 10. From the Constant Opened and Constant Closed results, it generally shows the maximum and minimum

29
A computer vision deep learning method for the detection and recognition of manual window openings for effective operations of HVAC systems in buildings
possible ventilation heat losses. The actual observation results indicate the importance of knowing whether windows are either opened or closed, as it can significantly affect the ventilation conditions within an indoor environment, which therefore justifies the importance of the deep learning detection method.
Figure 9: Ventilation loss results for a winter day (8th January) within the two-hour test duration in the lecture room.
4. Conclusion and Future WorksThe main aim of the study was to develop a data-driven deep learning framework for the detection
and recognition of window conditions; open or close. This was designed to provide data which supports building energy management systems to optimise energy loads and the development of more effective building HVAC systems. A faster region-based convolutional neural network (Faster R-CNN) was developed and trained for classification and detection of windows using a camera.
Initial deep learning model was validated with a detection accuracy of 77.78%. This will be optimised by adding more training data to improve the detection accuracy in future works. Also, the deep learning model performance can be improved by making modification to the DL model architecture. The experiment was performed at 13:00 – 15:00 within the case study building. Window conditions of ‘opened’ and ‘closed’ were detected. Five types of window profiles were utilised: ‘Constant Opened and Closed’, ‘Opened During Typical Office Hours’, ‘Actual Observation’ and ‘DLIP’.
The case study office building was simulated using different window profiles to evaluate the effect on energy consumption. This initial approach showed the capabilities of this framework for detecting windows and the benefits of monitoring window conditions. The most effective approach in using this DL detection method is to also inform occupancy about the condition so window adjustments can be made. In addition, the DLIP data could be used to make an adjustment to the HVAC based on the detected conditions and make suitable changes to provide better indoor conditions and to minimise building energy losses.

Paige Wenbin Tien, Shuangyu Wei, John Kaiser Calautit, Jo Darkwa and Christopher Wood
30
Acknowledgements This work was supported by the Department of Architecture and Built Environment, University of
Nottingham and the PhD studentship from EPSRC, Project References: 2100822 (EP/R513283/1).
References Andersen, R., V. Fabi, J. Toftum, S.P. Corgnati, B.W. Olesen (2013). Window opening behaviour modelled from
measurements in Danish dwellings. Building and Environment 69, 101-113. CIBSE Charted Institution of Building Services Engineers (2015). CTT1 CIBSE Top Tips 1: Ventilation in Buildings.
https://www.cibse.org/knowledge/knowledge-items/detail?id=a0q20000006oamlAAA. (Accessed 20 February 2020).
Dong, B., K.P. Lam (2011) Building energy and comfort management through occupant behaviour pattern detection based on a large-scale environmental sensor network. Journal of Building Performance Simulation 4(4), 359- 369.
Dounis, A.I. (2010). Artificial intelligence for energy conservation in buildings. Advances in Building Energy Research 4(1), 267-299.
Fabi, V., R.V. Andersen, S. Corgnati, B.W. Olesen (2012). Occupants' window opening behaviour: A literature review of factors influencing occupant behaviour and models. Building and Environment 58, 188-198.
Guo, Y., Z. Tan, H. Chen, G. Li, J. Wang, R. Huang, J. Liu, T. Ahmad (2018). Deep learning-based fault diagnosis of variable refrigerant flow air-conditioning system for building energy saving. Applied Energy 225, 732-745.
Huang, J., C. Sun, M., Zhu, A. Korattikara, A. Fathi, I. Fischer, Z. Wojna, Y. Song, S. Guadarrama, K. Murphy (2016). Speed/accuracy trade-offs for modern convolutional object detectors
Konstantakopoulos, I.C., A.R. Barkan, S. He, T. Veeravalli, H. Liu, C. Spanos (2019). A deep learning and gamification approach to improving human-building interaction and energy efficiency in smart infrastructure. Applied Energy 237, 810-821.
Kyritsi, E. and A. Michael (2019). An assessment of the impact of natural ventilation strategies and window opening patterns in office buildings in the mediterranean basin. Building and Environment 106384.
Li, X., Y. Zhou, S. Yu, G. Jia, H. Li, W. Li, (2019). Urban heat island impacts on building energy consumption: A review of approaches and findings, Energy 174, 407-419.
Markovic, R., E. Grintal, D. Wölki, J. Frisch, C. van Treeck (2018). Window opening model using deep learning methods. Building and Environment 145, 319-329. 41.
Markovic, R., J. Frisch, C. van Treeck (2019). Learning short-term past as predictor of window opening-related human behavior in commercial buildings. Energy and Buildings 185, 1-11.
O'Keefe, R.M. and J.W. Roach (2017). Artificial Intelligence Approaches to Simulation. Journal of the Operational Research Society 38(8), 713-722.
Panchalingam, R. and K.C. Chan (2019). A state-of-the-art review on artificial intelligence for Smart Buildings. Intelligent Buildings International, 1-24.
Shen, W. Chuanqi, X., Song, P., Jiale, S., Yunmo, W., Xiaoyan, L., Tarek, H., Steven, F., Farid, F., Rory J., D.W. Pieter (2016). Analysis of factors influencing the modelling of occupant window opening behaviour in an office building in Beijing, China. Proceedings of BS2015: 14th Conference of International Building Performance Simulation Association, Hyderabad, India, Dec. 7-9, 2015.
Singaravel, S., J. Suykens, P. Geyer (2018), Deep-learning neural-network architectures and methods: Using component-based models in building-design energy prediction, Advanced Engineering Informatics 38, 81-90.
Tahmasebi, F. and A. Mahdavi (2017). The sensitivity of building performance simulation results to the choice of occupants’ presence models: a case study. Journal of Building Performance Simulation 10(5-6), 625-635.
Wang, L. and S. Greenberg (2015). Window operation and impacts on building energy consumption, Energy and Buildings 92 (2015) 313-321.
Zhang, Z., A. Chong, Y. Pan, C. Zhang, K.P. Lam (2019), Whole building energy model for HVAC optimal control: A practical framework based on deep reinforcement learning. Energy and Buildings 199, 472-490.

31
The 54th International Conference of the Architectural Science Association (ANZAScA) 2020
A conceptual framework for construction and demolition waste prevention in building’s design phase
Gabriela Dias Guimaraes1, Ning Gu2, Vanessa Gomes3, and Jorge Ochoa Paniagua4 1, 2, 4 University of South Australia, Adelaide, Australia
{gabriela.dias_guimaraes1, ning.gu2, jorge.ochoapaniagua4}@unisa.edu.au 3 University of Campinas, Campinas, Brazil
Abstract: Increasing urbanization results in significant generation of Construction and Demolition (C&D) waste and, although waste prevention is considered one of the most effective methods of management, its practical implementation lacks effective integration during the planning of a new building, hence its application is not widely implemented among design industry and academy. Aiming to support proper decision-making at the early planning and design phases with suitable tools that support different stakeholders, considering a range of waste-prevention solutions, this paper presents a conceptual framework to help in the modelling refinement of C&D waste environmental impact quantification. The framework was based on a literature search of Building Information Modelling (BIM) and Life Cycle Assessment (LCA) integration papers and it will respond to the complexity of this process, considering materials and their corresponding waste streams and environmental impacts of the building’s entire life cycle, in order to indicate priority waste sources and formulate approaches for refinement of parameters. To be more seamlessly integrated into the industry, the proposed framework will be BIM- enable. This is a part of an on-going research to develop a multi-stage model for reducing C&D waste with BIM and LCA, supporting various stakeholders’ collaboration throughout the entire project life cycle.
Keywords: Construction and demolition waste; Design; LCA; BIM.
1. IntroductionOver the past few decades, with so many constructions and demolitions of buildings taking place, C&D waste started to gain global attention. Without any consideration, this type of waste can have a significant impact on both the economy and environment, mainly due to land depletion and deterioration, energy consumption and air emissions. There is an urgency in managing C&D waste in order to minimize those impacts and sustainable measures from government, industry and academy can be seen nowadays (Jin et al, 2019).
The prevention of waste, considered a preferable management option, is best applied during the design phase of a building, where there is a higher chance of optimizing project alternatives for
Imaginable Futures: Design Thinking, and the Scientific Method. 54th International Conference of the Architectural Science Association 2020, Ali Ghaffarianhoseini, et al (eds), pp. 31–40. © 2020 and published by the Architectural Science Association (ANZAScA).

Gabriela Dias Guimaraes1, Ning Gu, Vanessa Gomes, and Jorge Ochoa Paniagua
32
waste efficiency (S.O. Ajayi et al., 2015). In that scenario, Building Information Modelling (BIM) technologies can help storage, manage and share information regarding construction materials, processes and local data, to help quantify environmental impacts related to waste and evaluate design options. Still, C&D waste is generated in different phases of a building’s life cycle (Arghavan Akbarieh et al., 2020), and the type and amount are dependent on how these phases interact with each other. As such, a Life Cycle Assessment (LCA) methodology is required to comprehensively analyse all possible sources and factors of waste.
Although currently widespread as suitable approaches for quantifying and analysing environmental impact during early stages of a building’s construction, the interoperability between BIM and LCA still faces many challenges both from a technical and informational view. When it comes to C&D waste management, this integration is usually used to quantify waste and minimize it based on volume/weight, which can be misleading in terms of environmental impacts as there are several parameters linked to material’s waste streams that should be accounted for. The problem becomes more evident when processes that involve temporal aspects are included in the assessment, which is usually the case for C&D waste causes and factors. This means that any proposed waste stream is limited by time and assumptions that restrains the proper consideration of waste during the decision-making process. Hence, even in assessments that consider the environmental impact of C&D waste for its prevention, it is still not comprehensively calculated.
For this reason, this paper aims to support proper decision-making regarding C&D waste during the design phase of a building by firstly conducting a literature search on review papers that focus on the integration of LCA and BIM and analysing potential challenges through a waste minimization perspective; afterwards, a conceptual framework is proposed to introduce the LCA parameters that need refinement in order to better assess each material’s waste streams and environmental impact at the early stages of a building’s life cycle. This is the first step to properly assess C&D waste based on the environmental impacts of each material, which, in turn, is part of an on-going research to develop a BIM-enabled model to design out C&D waste.
2. BIM and LCA for minimizing C&D waste productionWaste prevention is considered one of the most effective methods of management as it can contribute to reduction of environmental impacts related to waste management options such as landfill and incineration facilities, promote resource efficiency by reducing material and energy use, cut down on harmful processes such as extraction, manufacturing and distribution and improve conditions for public health by minimizing hazardous waste (European Commission Directorate - General Environment, 2012).
In the construction industry, previous studies pointed out diverse aspects affecting C&D waste reduction in buildings, such as design changes, management cost, legislative measures, construction technologies, site space for managing strategies and stakeholders’ perception (Yuan and Qiu, 2012). However, particularly for buildings, the best way to apply waste prevention as a management strategy is during the design phase, as it is, at this moment, when materials, systems and strategies for energy/water savings are decided, enabling simulations and processes for less environmental impact. Inappropriate design decision-making and unexpected design changes have been shown to increase the quantity of C&D waste by 33% (Osmani et al., 2008), and errors at this stage are widespread due to the contribution of different participants (Won et al., 2016). Besides preventing pollution and lowering carbon emissions, the process of “design out” waste can change consumption patterns, enable equality locally and globally and promote new manufacturing processes.

33
A conceptual framework for construction and demolition waste prevention in building’s design phase
Furthermore, since 80% of all environmental costs are predetermined during the design phase, it can reduce costs (Baker-Brown, 2017). The conventional waste management approach is to consider construction waste steps from generation to disposal separately, as independent operations. However, C&D waste are a result of different actions in all stages of construction, from design to demolition (Ajayi et al., 2015) and when it comes to whole-buildings evaluation, there are inherent imprecisions caused by several life cycle particularities. A good example is the longer lifespan, which makes future decision hard to tackle. In addition, the numerous changes in shape and function that occur during the life cycle of a building can be as significant as the original product. Finally, the high number of professionals involved in the construction of a building, usually with little contact between them, need to take several decisions based on their experience and knowledge (Khasreen et al., 2009). As such, to properly prevent waste through design it is necessary to evaluate the building in a holistic matter, to understand how it will perform over its lifecycle and to identify when, where and why waste is produced. As a well-known technique to estimate and analyse all environmental impacts implications in a general matter (Rebitzer et al., 2004), LCA is commonly used in the construction industry for environmental quantification. It is a method to evaluate the whole life cycle of a building, from raw material extraction until its demolition. However, the gathering of all the necessary information regarding construction materials, processes, use patterns, End of Life scenarios and so on, is a time- consuming and exhausting step, as most tasks are usually manual and data is not easily found (Soust- Verdaguer et al., 2017). To reduce these efforts and optimize the process, BIM is seen as a good option, since it can manage essential building design and project data, with good level of detail, through the whole life cycle of a building. BIM is an object-oriented model and it allows users to create digital 3D models with both geometric and non-geometric properties of all included elements, with automatic modifications in all possible views of the project (Akbarieh et al., 2020). Specially in the design phase, when LCA integration is still not mainstream and there are uncertainties on how to best align demands throughout construction phases and stakeholders, it is important to enable professionals to understand which decisions (regarding materials and dimensions) are most influential in a building’s environmental impact (Basbagill et al., 2013). Wastiels and Decuypere (2019) divide the process for designing a building with BIM and LCA in six different steps: (1) Modelling, (2) Setting up a bill of quantities, (3) Establishing LCA profiles, (4) LCA profile attribution, (5) Calculation of environmental impact, and (6) Visualization and analysis. While the literature recognizes the advantages of combining BIM and LCA (Soust-Verdaguer et al., 2017), its integration still faces some challenges in each step, such as interoperability, methodology, user- friendly interface and level of detail. The development of methods to properly combine BIM and LCA is growing, especially in terms of design flow, as well as the attempts to classify and standardize its integration (Obrecht et al., 2020)., however, beyond the technical integration issues, there are critical matters regarding information and modelling inside the LCA that need to be addressed and are currently understudied – Figure 1. During the design phase, if the user has access to the BIM model and LCA results - regardless of how the integration is done, the data from the life cycle calculation (LCA profile, based on (Wastiels and Decuypere, 2019) definition) needs to be accurate to properly help the decision-making process. However, there are several parameters that are commonly based on assumptions or generic data, usually provided by the designer as are not contained in BIM objects (product phase).

Gabriela Dias Guimaraes1, Ning Gu, Vanessa Gomes, and Jorge Ochoa Paniagua
34
Specifically for C&D waste, this is a critical issue. Papers that research waste management usually focus on reduction based on volume/weight, without assessing the environmental impact of each waste stream. To prevent waste during the design phase, it is important to inform the designer of the environmental impact of each material, taking in consideration the waste stream linked to it, however, in order to do so, the building’s LCA needs refining. Phases that involve assumptions of production and demolition are well understudied (Crippa et al., 2020), which influences LCA’s result and hinders the overall impact analysis.
Figure 1: Current state of BIM and LCA integration at the design phase of a building
3. Conceptual framework developmentTo address the challenges of C&D waste prevention on building’s design phase, this study uses a combination of literature review and the introduction of a conceptual framework. Firstly, a thorough literature search on review papers discussing BIM and LCA integration has been carried out to establish an understanding of the current state of the topic, as well as focus on its use for managing C&D waste. Afterwards, with the prevalent scenario assessed, a conceptual framework was introduced to address the necessary refinements needed for an improvement on its potential to optimize the decisions for C&D waste minimization during the design phase.
3.1. Literature discussion
After a comprehensive review of the papers, the overall challenges of LCA and BIM integration were better identified through different viewpoints. Similar to Volk et al. (2014) and Obrecht et al. (2020), the issues were structured in separate perspectives; mainly divided in the following groups: technical, organizational, informational and modelling.
Technical and Organizational issues are related to the automatization and classification of the integration process, such as interoperability between different software systems, data exchange

35
A conceptual framework for construction and demolition waste prevention in building’s design phase
approaches, options of tools and plug-ins and standardization of workflows. Although crucial for the proper integration and automation of the link between BIM and LCA, as well as interconnected to the occurrence of other issues, it is not the focus of this paper, which targets the information management and modelling refinement. Hence, these main points are categorised and presented in the following sections:
3.1.1 Informational issues
From the BIM model’s point of view, the level of development (LOD) is strongly correlated to the design phase information. The LOD defines the level of detailing provided by the model, of both geometrical and nongeometrical attributes, and is quantified from 100 to 500 – increasingly adding information. The appropriate LOD must be taken into account, as it will define the amount and quality of data that will be provided to the LCI, however, despites Soust-Verdaguer et al (2017) recommendation of a minimum of 300, most papers don’t define its use (Obrecht et al., 2020). Regarding waste minimization, the level of detailing is important, as it can ensure less on-site waste generation (Kim et al., 2017). Beyond that, it can help the calculation of end of life impacts, as a higher LOD gives precise information on materials, that can later be divided in waste typology (hazardous or normal), which is important to formulate precise waste streams. From the LCA’s point of view, information related to the goal and scope of the system are required, such as functional unit, lifespan and assumed phases. They will strongly depend on the case study in analysis but should be explicitly defined. Data regarding environmental characteristics from the building materials, elements and processes to develop the LCI are also necessary and will be provided by databases and Environmental Product Declarations (EPDs). This information can be presented at different levels of granularity (raw material, construction material, sub-component and building element) (Obrecht et al., 2020), although most studies consider the level of construction materials (Soust-Verdaguer et al., 2017; Obrecht et al., 2020). There are several databases available and the choice for the LCA calculation should be align with the scope of the study, even though most software already has specific databases linked to them. The challenge is that most times the amount of information regarding environmental impacts stored on databases are not enough, even with the use of EPDs. (Crippa et al., 2020). Cavalliere et al. (2019) suggested the use of different databases to improve the LCA reach during the project development, however this is not always the best option. Most regions do not have fully refined databases, which are mostly generated in developed countries, and the use of generic ones hinders the assessment of realistic environmental impacts (Obrecht et al., 2020). Even when databases have data based on a broader life cycle approach, that calculates processes up to the end of life, it is usually based on generic information, or even a generalization of common End of Life scenarios – such as landfill disposal for most building materials. As a result, C&D waste is not properly accounted for on the overall building impact, and it is not considered during the decision- making process at the design phase. Even in studies that actually take C&D waste environmental impact into account, since there is no standardization of factors and sources, the comparability of results is limited. In addition, the parameters required for the modelling of temporal-influenced phases are commonly based on the user’s preference or local knowledge, or are not included in the assessment, such as distance of disposal facilities, percentage of wastage during construction and material replacement factor.

Gabriela Dias Guimaraes1, Ning Gu, Vanessa Gomes, and Jorge Ochoa Paniagua
36
3.1.2. Modelling issues
A building LCA is divided in four main stages, product, construction, use and end of life (CEN, 2011), and each one requires different information. Moreover, the benefits and loads beyond the system boundary can also be added to the assessment. Theoretically, the choice of stages will be based on the scope of the analysis, as well as the aim of the study, yet in reality it is critically linked to the availability of information. It is clear that there is a tendency to focus on the product phase (Soust- Verdaguer et al., 2017; Obrecht et al., 2020), which can be explained by the temporal facilitation of it: during the design of a building, most of the product phase already happened (raw material supply, transport to manufacture and manufacturing) so the data is available and precise. After the construction phase, limitations based on scenarios and assumptions start to arise. In addition, the use of EPD’s to assess the product phase is more accurate. This means that the development of a proper “cradle-to-grave” BIM-based environmental assessment is still scarce. Although waste is generated during different stages of a building’s life cycle, only 27% of BIM-based LCA studies consider C&D waste production (Hossain and Ng, 2018). Processes that involve temporal aspects, such as repair, replacement, refurbishment, deconstruction, waste processing, disposal and recycling and reuse potential are usually not included in the assessments, since information is limited by time and assumptions.
3.2. Conceptual framework
There are a few existing models focused on the minimization of waste during the design phase, however a few gaps remain. Current ones focus on the production phase, with a cradle-to-site approach (Solís-Guzmán et al., 2018; Bertin et al., 2020; Hao et al., 2020); or the construction phase, with waste reduction strategies for onsite waste being measured by volume of material (Llatas and Osmani, 2016); or even processes that address construction waste causes specifically across design stages (Liu et al., 2015). In models that provide a holistic assessment, most of the parameters that influence the generation of waste are based on assumptions or generic information, besides still having insufficient information about the end of life cycle (Ahmadian et al., 2017; Jalaei et al., 2019; Xu et al., 2019). In addition, most waste prevention strategies are developed considering quantifications of volume or weight, not environmental impact, which means that problematic materials can be neglected for being small in quantity. In order to improve the development of C&D waste prevention models, the environmental impact assessment needs to be more comprehensive. The waste streams of building materials require reliability, with less data presumptions, in order to result in well-grounded environmental impact quantifications. Beyond the information that should be provided by the manufactures (through databases or EPD’s), there is another type of information that is specified during the design phase and it is closely linked to the production of C&D waste, however it is usually based on one probable scenario. This information is based on project details such as transportation data, material handling, building’s service life and waste scenarios for materials and the parameters used in the calculation are often generic and non-correspondent to the study being conducted. To start the development of a platform for designing out C&D waste, a conceptual framework is proposed as a first step to guide the refinement of modelling processes and improve the material’s waste streams. Figure 2 shows the parameters required to develop a comprehensive LCA, based on

37
A conceptual framework for construction and demolition waste prevention in building’s design phase
the sources and factors of waste during a building’s life cycle (Rajendran and Pathrose, 2012; Osmani and Villoria-Sáez, 2019; Santos et al., 2019; Obrecht et al., 2020). The framework indicates the level of difficulty for obtaining these parameters, in which accessible is somewhat defined currently, medium is still dependable on user behaviour and challenging is highly uncertain.
Figure 2: Proposed conceptual framework
To refine the modelling of life cycle stages, the presented parameters need a standardized method of calculation – based not on assumptions or local information, but a statistical estimation. During the construction phase, causes of C&D waste are linked to the transportation and construction/installation processes. Actions such as damaging goods during transportation, difficulties for delivery vehicles to access the construction site, insufficient protection during unloading, inadequate material handling, off-cuts and application processes are potential drivers, hence a wastage percentage per building material is required to account for the necessary over manufacturing. In addition, the density of materials should be known, as the weight influences the transportation. The use phase, specifically the stages of maintenance, repair, replacement and refurbishment, required data on each building material replacement factor, based on the lifespan of the studied building. Due to long building lifespans, the end of life phase and the potential benefits and loads have the highest assumption rates, as well as non-accountability in papers. The deconstruction stage requires knowledge on the type of demolition (conventional, partial selective or complete selective), in order to enable calculations on energy, water and diesel consumptions. The transport to disposal firstly needs the EoL scenarios of the building materials, which means what type of ending it will have, from landfill to reuse, so that the distance and type of transport can be assessed. The waste processing stage will take into account the chosen EoL scenario of each building material. Lastly, the potential benefits and loads require information beyond the system boundary, based on the EoL scenarios of each material. Even though it is not mandatory (CEN, 2011), this phase gives a better representation of reality by adding the benefits of any recovery, reuse and recycle to the calculation.

Gabriela Dias Guimaraes1, Ning Gu, Vanessa Gomes, and Jorge Ochoa Paniagua
38
4. ConclusionC&D waste is usually perceived as inevitable; however, a good percentage can be avoided at the design phase. The combination of BIM and LCA is seen as an important step towards waste minimization during the early stages of a building, because of one’s potential to store information and share it with multiple stakeholders and the other’s holistic environmental assessment. And even though BIM and LCA integration is still being refined, it can be done; however, the refinement of parameters to improve environmental impact reliability is still understudied. In order to optimize the prevention of C&D waste, it is necessary to properly inform the designer about the environmental impact of his decisions during the project phase, taking into consideration the overall waste that will be produced by it.
As a first step towards it, this paper proposes a conceptual framework that addresses the critical parameters of C&D waste modelling throughout the life cycle of a building. The points are also evaluated based on the level of difficulty for obtaining information, between accessible, medium and challenging. Transportation data, both distance and type, are more easily attainable, as currently are already defined on databases and even EPD’s – although they are still not included in the evaluation of impacts because are part of the end of life phase. Some parameters are dependable on construction technology and user/professional behaviour, such as wastage during construction and demolition consumption of energy/water/diesel, hence are highlighted are medium difficulty. Finally, some points are defined as challenging: building material replacement factor, that nowadays is not standardized between materials and it is commonly used as a generic average for all building components; and the type of treatment and percentage of waste that is going to it, which also hinders the potential of recyclability and reusability that can be added to the assessment and are usually not included on the calculation because of the building’s service life.
With these parameters identified and evaluated, future work will be focused on the refinement of each one with the use of statistical estimation and uncertainty analysis. The modelling refinement will enhance the LCA potential to optimize the decision-making process of waste prevention during the design phase, as it will give more reliable environmental impact results. This is part of an on- going project to develop a multi-stage model for reducing C&D waste with BIM and Life Cycle Assessment (LCA), supporting various stakeholders’ collaboration throughout the entire project life cycle.
References Ahmadian, F. F. A., Rashidi, T.H., Akbarnezhad, A. and Waller, S.T. (2017) ‘BIM-enabled sustainability assessment of
material supply decisions’, Engineering Construction and Architectural Management, 24(4), pp. 668–695. Ajayi, S.O., Oyedele, L.O, Bilal, M., Akinade, O.O, Alak, H.A., Owolabi, H.A. and Kadiri, K.O. (2015) ‘Waste effectiveness
of the construction industry: Understanding the impediments and requisites for improvements’, Resources, Conservation and Recycling, 102, pp. 101–112.
Akbarieh, A., Jayasinghe, L.B., Waldmann, D. and Teferle, F.N. (2020) ‘BIM-based end-of-lifecycle decision making and digital deconstruction: Literature review’, Sustainability (Switzerland), 12(7).
Basbagill, J., Flager, F., Lepech, M. and Fischer, M. (2013) ‘Application of life-cycle assessment to early stage building design for reduced embodied environmental impacts’, Building and Environment, 60, pp. 81–92.
Bertin, I., Mesnil, R., Jaeger, J., Feraille, A. and Roy, R.L. (2020) ‘A BIM-based framework and databank for reusing load-bearing structural elements’, Sustainability (Switzerland), 12(8), pp. 1–24.

39
A conceptual framework for construction and demolition waste prevention in building’s design phase
European Committee for Standardization - CEN (2011) BS EN 15978: Sustainability of construction works. Assessment of environmental performance of buildings. Calculation method, British Standards Institute.
Crippa, J., Araujo, A.M.F, Bem, D., Ugaya, C.M.L. and Scheer, S. (2020) ‘A systematic review of BIM usage for life cycle impact assessment’, Built Environment Project and Asset Management.
European Commission Directorate - General Environment (2012) ‘Preparing a waste prevention programme - Guidance document’, European Commission Directorate-General Environment, pp. 1–62.
Hao, J. L. Cheng, B., Lu, W., Xu, J., Wang, J., Bu, W. and Guo, Z. (2020) ‘Carbon emission reduction in prefabrication construction during materialization stage: A BIM-based life-cycle assessment approach’, Science of the Total Environment, 723, p. 137-170.
Hossain, M.U. and Ng, S.T. (2018) ‘Critical consideration of buildings’ environmental impact assessment towards adoption of circular economy: An analytical review’, Journal of Cleaner Production., 205, pp. 763–780.
Jalaei, F., Zoghi, M. and Khoshand, A. (2019) ‘Life cycle environmental impact assessment to manage and optimize construction waste using Building Information Modeling (BIM)’, International Journal of Construction Management.
Jin, R., Yuan, H. and Chen, Q. (2019) ‘Science mapping approach to assisting the review of construction and demolition waste management research published between 2009 and 2018’, Resources, Conservation and Recycling., 140, pp. 175–188..
Khasreen, M.M., Banfill, P.F. and Menzies, G.F. (2009) ‘Life-cycle assessment of buildings: a Review Life-Cycle Assessment and the Environmental Impact of Buildings: A Review’, Sustainability (Switzerland), 1, pp. 674–701.
Kim, Y.C., Hong, W.H., Park, J.W. and Cha, G.W. (2017) ‘An estimation framework for building information modeling (BIM)-based demolition waste by type’, Waste Management and Research, 35(12), pp. 1285–1295.
Liu, Z., Osmani, M., Demian, P. and Baldwin, A. (2015) ‘A BIM-aided construction waste minimisation framework’, Automation in Construction, 59(2015), pp. 1–23.
Llatas, C. and Osmani, M. (2016) ‘Development and validation of a building design waste reduction model’, Waste Management, 56, pp. 318–336.
Obrecht, T., Rock, M., Hoxha, E. and Passer, A. (2020) ‘BIM and LCA Integration : A Systematic Literature Review’, Sustainability, 12, 5534.
Osmani, M., Glass, J. and Price, A.D.F. (2008) ‘Architects’ perspectives on construction waste reduction by design’, Waste Management, 28(7), pp. 1147–1158..
Osmani, M. and Villoria-Sáez, P. (2019) ‘Current and Emerging Construction Waste Management Status, Trends and Approaches’, in Waste, 2, pp. 365–380.
Rajendran, P. and Pathrose, C.P. (2012) ‘Implementing BIM for waste minimisation in the construction industry’, in Proceedings of the 2nd International Conference on Management, pp. 557–570.
Rebitzer, G., Ekvall, T., Frischknecht, R., Hunkeler, D., Norris, G., Rydberg, T., Schmidt, W.P., Suh, S., Weidema, B.P. and Pennington, D.W. (2004) ‘Life cycle assessment Part 1: Framework, goal and scope definition, inventory analysis, and applications’, Environment International, 30(5), pp. 701–720.
Santos, R., Costa, A.A., Silvestre, J.D. and Pyl, L. (2019) ‘Integration of LCA and LCC analysis within a BIM-based environment’, Automation in Construction, 103, pp. 127–149.
Solís-Guzmán, J., Rivero-Camacho, C., Alba-Rodriguez, D. and Martinez-Rocamora, A. (2018) ‘Carbon footprint estimation tool for residential buildings for non-specialized users: OERCO2 project’, Sustainability (Switzerland), 10(5), 1359.
Soust-Verdaguer, B., Llatas, C. and Garcia-Martinez, A. (2017) ‘Critical review of bim-based LCA method to buildings’, Energy and Buildings, 136, pp. 110–120.
Volk, R., Stengel, J. and Schultmann, F. (2014) ‘Building Information Modeling (BIM) for existing buildings - Literature review and future needs’, Automation in Construction, 38, pp. 109–127.
Wastiels, L. and Decuypere, R. (2019) ‘Identification and comparison of LCA-BIM integration strategies’, in IOP Conference Series: Earth and Environmental Science, Sustainable Built Environment Conferece 2019 (SBE19), Graz.
Won, J., Cheng, J.C.P. and Lee, G. (2016) ‘Quantification of construction waste prevented by BIM-based design validation: Case studies in South Korea’, Waste Management, 49, pp. 170–180.

Gabriela Dias Guimaraes1, Ning Gu, Vanessa Gomes, and Jorge Ochoa Paniagua
40
Xu, J., Shi, Y., Xie, Y. and Zhao, S. (2019) ‘A BIM-Based construction and demolition waste information management system for greenhouse gas quantification and reduction’, Journal of Cleaner Production, 229, pp. 308–324.
Yuan, L. and Qiu, J. (2012) ‘An analysis of embodied carbon of different types of residential buildings in China’, Advanced Materials Research, pp. 1557–1561.

41
The 54th International Conference of the Architectural Science Association (ANZAScA) 2020
A content analysis of sustainability declaration in Australian universities
Maryam Khoshbakht1, Mahsa Zomorodian2, Mohamad Tahsildoost3 1 Cities Research Institute, Griffith University, Australia
[email protected] 2,3 School of Architecture, Shahid Beheshti University, Iran
{z_zomorodian2, m_tahsildoost 3}@sbu.ac.ir
Abstract: This paper aims to provide an overview of a content analysis of the sustainability declaration status of Australian universities. The report presents findings on the orientations evident in the published policies, reports and plans attributed to sustainability. A sample of 27 documents from Australian universities was selected based on the availability of sustainability reports, plan and policies. A collaborative coding approach was used to conduct a qualitative thematic content analysis of these sustainability documents. Results show that most sustainability documents described three pillars of sustainability principles, environmental, social and economic; however, most institutions have placed a great emphasis on environmental assessments. Campus sustainability implementations in universities can be broadly categorized into three classes of teaching, research and operations. Discussions in relation to curriculum and research were vague, and instrumental strategies to implement sustainability in education and research were less discussed. Most institutions emphasized operations, and energy, waste, water and transport were discussed by most documents, while the concepts of procurement and supply chain, and pollution appeared less frequently in the studied documents. This critical review paper provides a broad overview of sustainability declarations from Australian universities, and endeavors to present a comparison of sustainability concepts and priorities in universities.
Keywords: Higher education; campus sustainability; sustainability transformation; content analysis.
1. IntroductionMany universities across the world have recognized the great opportunity that lies in campus sustainability adaptations and have transformed campuses by implementing sustainability initiatives. Adopting sustainability initiatives in universities and promoting the integration of environmental and sustainability principles enhance sustainable community developments through promoting sustainability efforts and supporting research on sustainable development issues. Sustainable campuses, used as testbeds, offer comprehensive sustainability solutions to mitigate the current environmental challenges while providing safe and comfortable living and working environments. A further economic benefit of
Imaginable Futures: Design Thinking, and the Scientific Method. 54th International Conference of the Architectural Science Association 2020, Ali Ghaffarianhoseini, et al (eds), pp. 41–50. © 2020 and published by the Architectural Science Association (ANZAScA).

Maryam Khoshbakht, Mahsa Zomorodian, Mohamad Tahsildoost
42
adopting sustainability principles in universities is in reducing operating costs and facilitating healthier and more productive working and learning spaces for students and academics.
As more universities are recognizing the significance of campus sustainability transformation and showcasing their efforts by publishing policies, reports and plans to be available to both campus and public community, there seems to be a need to provide a comparative study on the progress and implications of the campus sustainability declaration. In the Australian context, no research in the past has provided the overview of campus sustainability declaration status and systematically evaluated campus sustainability declaration documents. This study offers a systematic approach for the implementing, monitoring and evaluation of campus green building initiatives reflected in sustainability declaration documents across Australian universities.
Australian authorities and decision makers recognize the importance of the leading role of universities in sustainability transformations and is leading several projects to enhance sustainability educations (Tilbury, 2011). However, in Australia there is only very limited professional campus sustainability development activity, which explains the limited progress in Australian universities (Holdsworth, Wyborn, Bekessy, & Thomas, 2008). Many universities in Australia are currently undertaking massive sustainable transformations yet facing several impediments to prioritize actions and achieve their goals. It is essential that the produced knowledge, experience and progress is communicated among universities to help authorities with decision making and restructuring initiatives. This report provides an overview and content analysis of sustainability policies, reports and plans across Australian universities and with an aim to investigate key themes, scopes, sustainability elements, and cohesion.
2. MethodologyA combination of qualitative and quantitative review of sustainability policies, reports and plans of Australian universities is used in this study. There is a total of 42 accredited universities in Australia across the six states. Analysis and comparison studies are performed based on scopes and schemes, strategies and initiative history.
2.1. Data Collection
The three main document types are sustainability policies, sustainability reports, and sustainability plans. Sustainability policies are usually a brief policy statements on sustainability commitments, while sustainability report and plans are more in-depth, lengthier documents with a stronger focus on policy adaptations. To identify the relevant sustainability documents for 42 Australian universities, Google search engine was utilised.
2.2. Data analysis
Following the collection of relevant documents from the universities, content analysis was performed. The goal of content analysis is the systematic examination of communicative material to make
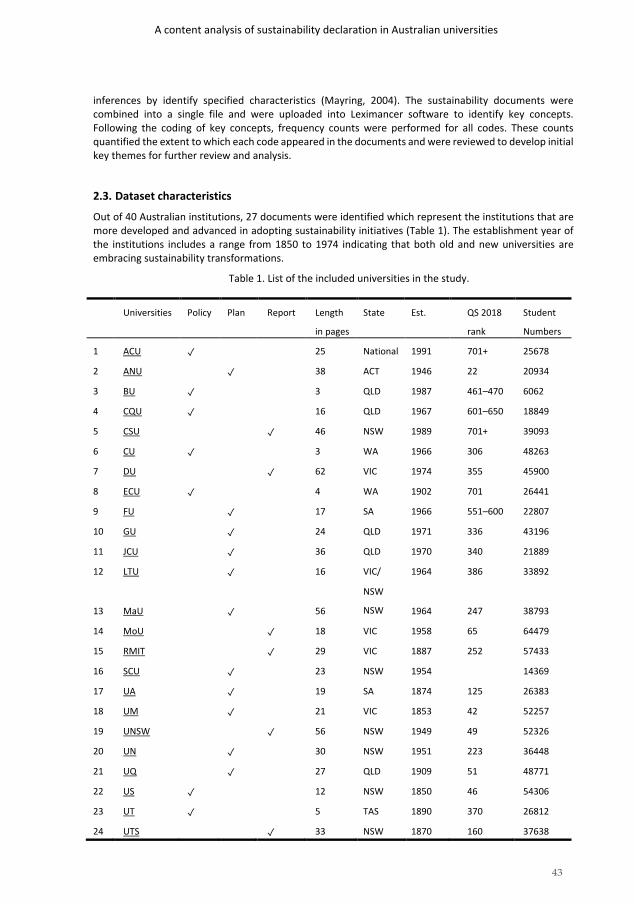
43
A content analysis of sustainability declaration in Australian universities
inferences by identify specified characteristics (Mayring, 2004). The sustainability documents were combined into a single file and were uploaded into Leximancer software to identify key concepts. Following the coding of key concepts, frequency counts were performed for all codes. These counts quantified the extent to which each code appeared in the documents and were reviewed to develop initial key themes for further review and analysis.
2.3. Dataset characteristics
Out of 40 Australian institutions, 27 documents were identified which represent the institutions that are more developed and advanced in adopting sustainability initiatives (Table 1). The establishment year of the institutions includes a range from 1850 to 1974 indicating that both old and new universities are embracing sustainability transformations.
Table 1. List of the included universities in the study.
Universities Policy Plan Report Length
in pages
State Est. QS 2018
rank
Student
Numbers
1 ACU ✓ 25 National 1991 701+ 25678
2 ANU ✓ 38 ACT 1946 22 20934
3 BU ✓ 3 QLD 1987 461–470 6062
4 CQU ✓ 16 QLD 1967 601–650 18849
5 CSU ✓ 46 NSW 1989 701+ 39093
6 CU ✓ 3 WA 1966 306 48263
7 DU ✓ 62 VIC 1974 355 45900
8 ECU ✓ 4 WA 1902 701 26441
9 FU ✓ 17 SA 1966 551–600 22807
10 GU ✓ 24 QLD 1971 336 43196
11 JCU ✓ 36 QLD 1970 340 21889
12 LTU ✓ 16 VIC/ 1964 386 33892
13 MaU ✓ 56
NSW
NSW 1964 247 38793
14 MoU ✓ 18 VIC 1958 65 64479
15 RMIT ✓ 29 VIC 1887 252 57433
16 SCU ✓ 23 NSW 1954 14369
17 UA ✓ 19 SA 1874 125 26383
18 UM ✓ 21 VIC 1853 42 52257
19 UNSW ✓ 56 NSW 1949 49 52326
20 UN ✓ 30 NSW 1951 223 36448
21 UQ ✓ 27 QLD 1909 51 48771
22 US ✓ 12 NSW 1850 46 54306
23 UT ✓ 5 TAS 1890 370 26812
24 UTS ✓ 33 NSW 1870 160 37638
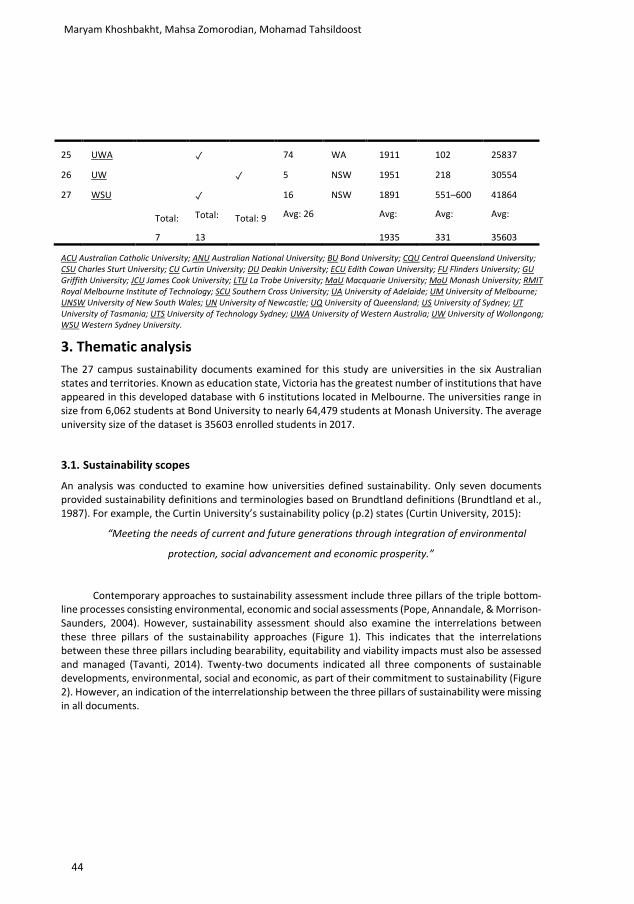
Maryam Khoshbakht, Mahsa Zomorodian, Mohamad Tahsildoost
44
25 UWA ✓ 74 WA 1911 102 25837
26 UW ✓ 5 NSW 1951 218 30554
27 WSU
Total:
✓
Total: Total: 9
16
Avg: 26
NSW 1891
Avg:
551–600
Avg:
41864
Avg:
7 13 1935 331 35603
ACU Australian Catholic University; ANU Australian National University; BU Bond University; CQU Central Queensland University; CSU Charles Sturt University; CU Curtin University; DU Deakin University; ECU Edith Cowan University; FU Flinders University; GU Griffith University; JCU James Cook University; LTU La Trobe University; MaU Macquarie University; MoU Monash University; RMIT Royal Melbourne Institute of Technology; SCU Southern Cross University; UA University of Adelaide; UM University of Melbourne; UNSW University of New South Wales; UN University of Newcastle; UQ University of Queensland; US University of Sydney; UT University of Tasmania; UTS University of Technology Sydney; UWA University of Western Australia; UW University of Wollongong; WSU Western Sydney University.
3. Thematic analysisThe 27 campus sustainability documents examined for this study are universities in the six Australian states and territories. Known as education state, Victoria has the greatest number of institutions that have appeared in this developed database with 6 institutions located in Melbourne. The universities range in size from 6,062 students at Bond University to nearly 64,479 students at Monash University. The average university size of the dataset is 35603 enrolled students in 2017.
3.1. Sustainability scopes
An analysis was conducted to examine how universities defined sustainability. Only seven documents provided sustainability definitions and terminologies based on Brundtland definitions (Brundtland et al., 1987). For example, the Curtin University’s sustainability policy (p.2) states (Curtin University, 2015):
“Meeting the needs of current and future generations through integration of environmental
protection, social advancement and economic prosperity.”
Contemporary approaches to sustainability assessment include three pillars of the triple bottom- line processes consisting environmental, economic and social assessments (Pope, Annandale, & Morrison-Saunders, 2004). However, sustainability assessment should also examine the interrelations between these three pillars of the sustainability approaches (Figure 1). This indicates that the interrelations between these three pillars including bearability, equitability and viability impacts must also be assessed and managed (Tavanti, 2014). Twenty-two documents indicated all three components of sustainable developments, environmental, social and economic, as part of their commitment to sustainability (Figure 2). However, an indication of the interrelationship between the three pillars of sustainability were missing in all documents.

45
A content analysis of sustainability declaration in Australian universities
Figure 1. Typical representation of sustainability as three interesting circles.
Figure 2. Sustainability scopes in the university sustainability documents.
Two documents only mentioned environmental sustainability in their documents, while three institutions specified their institutional approach into sustainability by focusing on environmental and social sustainability. This analysis showed that environmental sustainability was the most frequent conceptualization and sustainability approach by the institutions. Although economic feasibility is an important aspect of campus decision making and planning strategies, economic sustainability appears comparatively less frequently in the sustainability documents. Details concerning the financing of campus sustainability plan activities only appeared in the sustainability plan from the University of Queensland, which provide details of the procedures and actions to review investing or financing activities. Social sustainability appears more frequently than economic feasibility, yet less frequent than environmental sustainability (Figure 3). Social sustainability is discussed in twenty-five campus sustainability documents with relatively a wide range of topics and focus including gender equity, well- being and health, pay equity, access and equity in education, staff equity and diversity, and social justice.
In order to compare the emphasis on the three sustainability pillars across the documents, the frequency of appearance of the terms environmental, social and economic were counted in the documents. This analysis provided a more detail comparison of the approaches to the three pillars
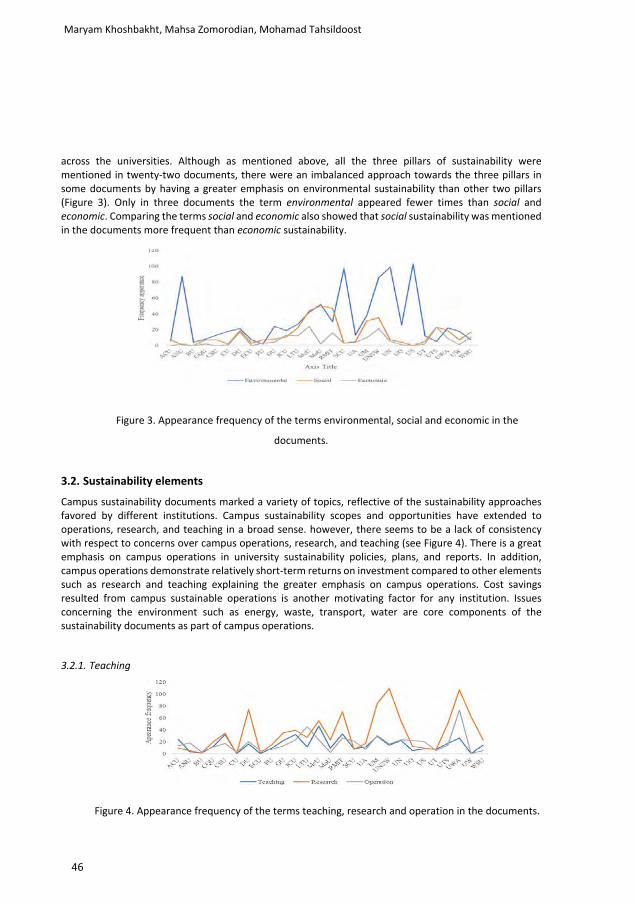
Maryam Khoshbakht, Mahsa Zomorodian, Mohamad Tahsildoost
46
across the universities. Although as mentioned above, all the three pillars of sustainability were mentioned in twenty-two documents, there were an imbalanced approach towards the three pillars in some documents by having a greater emphasis on environmental sustainability than other two pillars (Figure 3). Only in three documents the term environmental appeared fewer times than social and economic. Comparing the terms social and economic also showed that social sustainability was mentioned in the documents more frequent than economic sustainability.
Figure 3. Appearance frequency of the terms environmental, social and economic in the
documents.
3.2. Sustainability elements
Campus sustainability documents marked a variety of topics, reflective of the sustainability approaches favored by different institutions. Campus sustainability scopes and opportunities have extended to operations, research, and teaching in a broad sense. however, there seems to be a lack of consistency with respect to concerns over campus operations, research, and teaching (see Figure 4). There is a great emphasis on campus operations in university sustainability policies, plans, and reports. In addition, campus operations demonstrate relatively short-term returns on investment compared to other elements such as research and teaching explaining the greater emphasis on campus operations. Cost savings resulted from campus sustainable operations is another motivating factor for any institution. Issues concerning the environment such as energy, waste, transport, water are core components of the sustainability documents as part of campus operations.
3.2.1. Teaching
Figure 4. Appearance frequency of the terms teaching, research and operation in the documents.

47
A content analysis of sustainability declaration in Australian universities
While 23 institutions confirmed sustainability teaching and curriculum as a main part of sustainability adaptations, strategies and the academic topics were rarely discussed in detail. Only nine sustainability documents included plans and changes to degree programs and course works. For example, Australian National University implemented waste management as part of their teaching programs. Macquarie University specified targets for bringing sustainability into teaching courses. Some other institutions described the faculties that are actively implementing sustainability in educational programs.
3.2.2. Research
Implementing research into campus sustainability programs is highly individualized, as a diverse range of approaches by promoting sustainability research was discussed in the documents. Most sustainability documents, 23 out of 27, address research and promote sustainability-oriented research activities. Several institutions mentioned the idea of a campus as a living laboratory and discussed the unique opportunity that universities have in finding solutions to current sustainability challenges. Nevertheless, most documents provided vague and brief statements about strategies to develop sustainability research.
3.2.3. Operation
Out of 27, 26 documents discussed campus energy occupying relatively the largest proportion of the sustainability documents in comparison with other elements. Only sixteen institutions indicated climate change and greenhouse gas emission reduction targets as part of their campus operation strategies. Sustainable energy management was discussed either in terms of reducing energy or on-campus energy generation. Renewable energy generation was indicated by eleven universities as a target for future. Some universities highlighted the importance of energy generation research and confirmed their investment to provide a valuable learning tool for students and pushing knowledge boundaries. Increasing the energy efficiency of existing and new developments has also been mentioned by most institutions. In some sustainability documents, there is a discussion regarding the construction of new green buildings. Most institutions had an emphasis on water management strategies and discussed initiative to reduce water consumption on the campus. Some documents specified details of implementing water conservation strategies such as water efficient appliances, fittings and tapware installations. Strategies include water conservation, distribution, harvesting, measurement, and improving quality. Some universities also mentioned strategies for benchmarking and identifying leaks by monitoring and recording to enable data capture and inform decision-making.
Twenty-two institutions discussed waste management as part of campus sustainable operations. Waste management initiatives involve reducing, reusing, recycling and composting. While some universities reported on waste management achievements, other showed their waste reduction targets. Increasing recycling rates have been aimed by some universities by enhancing bin labelling and placement. Waste is not just an institutional responsibility and many institutions comply waste

Maryam Khoshbakht, Mahsa Zomorodian, Mohamad Tahsildoost
48
management with government obligations and develops strategy in alignment and collaboration with key national and state waste policies. Waste education has been implemented as part of increasing awareness and engagement activities to further improve recycling rates in two institutions.
Twenty institutions implemented transportation as part of their sustainability strategies and encouraged low-carbon transport methods of travel including car-pooling, cycling, walking, and public transport such as buses, trains, and trams instead of solo-driving. Some details regarding the design and construction of walking pathways, biking routes and racks, and end-of trip facilities on campuses. However, all institutions focused on increasing the efficiency of transport method rather than reducing the number of commuters. Strategies such as providing campus accommodations for staff and students were not discussed in any of the sustainability documents. The University of Adelaide stated 82% of students use low-carbon transport methods to travel to campus. The University of Newcastle implement a fleet vehicle policy that limits campus vehicle purchases below an agreed carbon emission rating.
5. DiscussionWhile institutions expressed their plans and ambitions to coordinate sustainability into their educational programs only a few documents offered detail descriptions and strategies to explain the effect of the sustainability implementations in curricula. Only a few institutions described the exact courses and faculties that had introduced sustainability focused programs. Similarly, research has been described by the institutions as a major part of campus sustainability efforts, yet strategies remain vague and unclear in most cases. Some institutions also expressed their focus on community engagement efforts and stated some plans to integrate sustainability transformations into the public community. The support from upper levels of campus administration appeared in most documents, which seems to be a key to successful implementation of campus sustainability transformations.
Campus sustainability practices are a relatively new concept, and it is perhaps too early to reach a consensus on the best practice. Nonetheless, evaluation and comparisons of these plans offer a great opportunity to create sophisticated and clear plans and strategies while accelerating campus sustainability adaptations. Sustainability planning evaluations would become more significant as more Australian universities express their commitments towards sustainability practices. However, appropriate criteria are needed to evaluate the quality of plans and identify strengths and weaknesses.
Technical failings such as vagueness, ambiguity, inconsistency and generality may uphold the success of plans in general (Baer, 1997). As discussed earlier, vagueness and ambiguity particularly in regard with social and economic sustainability were the most common weaknesses among the reviewed documents. Nevertheless, plans need to be expressive as well as instrumental. Some levels of ambiguity may assist to promote innovative ideas and solutions. Creating a balance of expressiveness and instrumentality is a key to enhance the quality and effectiveness of these types of documents. Another important criteria for the evaluation of plans and policies are the strengths of the linkages between plans and the techniques to implement these policies (Laurian et al., 2004). In most sustainability documents reviewed in this study, there seemed to be a lack of connection between different elements of sustainability approaches by the campuses that connect efforts in operation, teaching and research

49
A content analysis of sustainability declaration in Australian universities
on the campus. It would be interesting to bridge the knowledge produced in sustainability research could enhance campus operations and teaching qualities, or how campus operations could be more actively used as living laboratories and students and researcher learn from their campuses as testbeds. Besides, approaches such as whole-of-university, as introduced by Mcmillin & Dyball (2009), could link research, education and operation activities by engaging students in all elements. Using sustainability curricula models is another recommended strategy that has the potential to provide a broader notion of teaching and learning sustainability to incorporate sustainability education into curricula (Savelyeva & McKenna, 2010).
Previous studies in relation to plan evaluation criteria indicate that plans with greater stakeholder involvement provide a more comprehensive and stronger proposals and the likelihood of implementations are higher (Burby, 2003). Many of the documents developed their documents internally and the involvement of external stakeholders were limited in most cases. Greater participation of key stakeholders in sustainable developments would yield better plan implementation. Another key criteria for the assessment of plans and policies are performance measurements (Berke et al., 2006). Another observation from the reviewed documents was that there is a lack of sustainability frameworks among the documents and most institutions are rather focused on sustainability initiatives. The lack of development frameworks may result in a piecemeal, ad-hoc manner with temporary solutions and losing the greater opportunity of implementing a comprehensive strategies (Saha & Paterson, 2008). Therefore, the development and use of campus sustainability frameworks such as the system framework by Posner & Stuart (2013) is recommended to further enhance the consistency and comprehensiveness of sustainability plans and policies in the future.
6. ConclusionAlthough vagueness and ambiguity particularly in regard with social and economic sustainability were common among most institutions, creating a balance between expressiveness and instrumentality is recommended for future. The three main elements of campus sustainability teaching research and operations seemed as three separate concepts in the reviewed documents. Creating a strong bridge between these elements could further assist in improving the implementation of sustainability principles and initiatives. Greater engagement with external sustainability stakeholders for the developments of plans and policies are recommended to increase the success likelihood of sustainability initiative implementations. The development of campus sustainability frameworks and utilization for the development of campus sustainability initiatives and plans are recommended for future.
Acknowledgement This research was funded by Griffith University, Australia.

Maryam Khoshbakht, Mahsa Zomorodian, Mohamad Tahsildoost
50
References Baer, W. C. (1997). General plan evaluation criteria: An approach to making better plans. Journal of the
American Planning Association, 63(3), 329-344. Berke, P., Backhurst, M., Day, M., Ericksen, N., Laurian, L., Crawford, J., & Dixon, J. (2006). What makes
plan implementation successful? An evaluation of local plans and implementation practices in New Zealand. Environment and Planning B: Planning and Design, 33(4), 581-600.
Brundtland, G., Khalid, M., Agnelli, S., Al-Athel, S., Chidzero, B., Fadika, L., . . . de Botero, M. M. (1987). Our common future (\'brundtland report\').
Burby, R. J. (2003). Making plans that matter: Citizen involvement and government action. Journal of the American Planning Association, 69(1), 33-49.
Curtin University. (2015). Environmental Sustainability Policy. Retrieved from https://policies.curtin.edu.au/local/docs/policy/Environmental_Sustainability_Policy.pdf
Holdsworth, S., Wyborn, C., Bekessy, S., & Thomas, I. (2008). Professional development for education for sustainability: how advanced are Australian universities? International Journal of Sustainability in Higher Education, 9(2), 131-146.
Laurian, L., Day, M., Berke, P., Ericksen, N., Backhurst, M., Crawford, J., & Dixon, J. (2004). Evaluating plan implementation: A conformance-based methodology. Journal of the American Planning Association, 70(4), 471-480.
Mayring, P. (2004). Qualitative content analysis. A companion to qualitative research, 1, 159-176. McMillin, J., & Dyball, R. (2009). Developing a whole-of-university approach to educating for sustainability:
Linking curriculum, research and sustainable campus operations. Journal of education for sustainable development, 3(1), 55-64.
Pope, J., Annandale, D., & Morrison-Saunders, A. (2004). Conceptualising sustainability assessment. Environmental impact assessment review, 24(6), 595-616.
Posner, S. M., & Stuart, R. (2013). Understanding and advancing campus sustainability using a systems framework. International Journal of Sustainability in Higher Education, 14(3), 264-277.
Saha, D., & Paterson, R. G. (2008). Local government efforts to promote the “Three Es” of sustainable development: survey in medium to large cities in the United States. Journal of Planning Education and Research, 28(1), 21-37.
Savelyeva, T., & McKenna, J. R. (2011). Campus sustainability: emerging curricula models in higher education. International Journal of Sustainability in Higher Education, 12(1), 55-66.
Tavanti, M. (2014). Sustainable Development Capitalism: Changing Paradigms and Practices for a More Viable, Equitable, Bearable, and Just Economic Future for All Capitalism and the Social Relationship (pp. 163-182): Springer.
Tilbury, D. (2011). Higher education for sustainability: a global overview of commitment and progress. Higher education in the world, 4, 18-28.

51
The 54th International Conference of the Architectural Science Association (ANZAScA) 2020
A critical review of the system-wide waste in the construction industry
Mahesh Babu Purushothaman1 and Jeff Seadon2 1, 2 Auckland University of Technology, Auckland, New Zealand
{[email protected], jeff. [email protected]}
Abstract: The purpose of this review paper is to unravel the various types of waste in the Construction Industry and its influencing factors. The construction industry worldwide has been working on waste reduction, which primarily focuses on material waste. Construction is a $30 billion industry in New Zealand and literature estimate a 23% waste in the construction Industry. However, the estimate excludes certain factors such as the wastage due to design factors, environmental factors, and goal conflicts between architects, structural designers, and contractors. The literature focuses on the types of wastage of the construction process, which would aid to improve productivity, reduce cost, and optimise resources.
Keywords: Construction waste; Waste; System-wide- waste; Lean waste.
1. Introduction
1.1 Review Question:
What are the types of waste generated in the construction industry?
1.2 Review significance and rationale
The construction industry wastes a considerable quantum of its materials and labour in a project. A BRANZ report suggests that in New Zealand, 23% of the material, labour and time are wasted during a residential build (Burgess, Buckett & Page, 2013). However, the report does not include wastes other than the material, labour and time. For example, at every stage of the construction, the human factors influence the process to generate waste. The effective tackling, of the factors, would aid in the timely completion of the project. Identifying those other wastes would aid in the reduction of wastes and optimal use of resources. The waste reduction would improve profitability, paving the way for optimal resource consumption, and in turn, reduce environmental damages. If the study on wastes could bring 5% savings, that would add $1.5 billion to the bottom line of the industry (MBIE, 2017). Practical implications are multi-fold. The tracking of wastes could be used to compare estimated and actual resources at every stage of the
Imaginable Futures: Design Thinking, and the Scientific Method. 54th International Conference of the Architectural Science Association 2020, Ali Ghaffarianhoseini, et al (eds), pp. 51–60. © 2020 and published by the Architectural Science Association (ANZAScA).

Mahesh Babu Purushothaman and Jeff Seadon
52
process. It aids to reduce wastage stress on people, and environmental impacts while improving productivity and profit. Once a reasonable set of data is available, it can be used for budgeting and costing to gain a competitive advantage.
1.3 Research methodology
This systematic literature review tries to identify, evaluate and answer a given research question by blending all the empirical evidence that meets pre-specified eligibility criteria as specified by Creswell and Creswell (2017). The process used was similar to (Pedrini & Ferri Laura, 2019). Five databases were selected to search for articles published from 2001 to 2020. The keywords used were Construction waste; Waste; System-wide- waste; Construction and Lean waste. Starting from 34911 articles identified using the keywords search, 90 key journal articles were systematically reviewed using both bibliometric and qualitative methods for analysis. The articles were sourced globally from different journals and books, the top article referred in this paper on wastes was cited 19833 times and the least was cited 12 times. The steps followed are given below in Table 1.
Table 1: Steps of the systematic review.
Process Individual steps Analysis resulting No. of articles
Search process and data collection
1 Identification of keywords: Previous research and reviews (Construction waste; Waste; System- wide- waste; Construction Lean waste)
2 Development of exclusion and inclusion Quality of the article and criteria, methodology limitations
12
3 Specification of relevant search engines Title and abstracts (automated and execution of the search (5 engines: based on keywords) GOOGLE SCHOLAR, A WEB OF SCIENCE, EMERALD, SCIENCE DIRECT, SCOPUS)
34,911
4 Development of A-, B-, and C-list: C-list Key words w.r.t construction
search 17,431
B-list Title and abstracts that referred construction-related waste
1354
A-list Full text (strong focus construction-related waste)
90
Narrative inclusions in this article Full text 54 Descriptive and thematic analysis
5 Descriptive categories (e.g., journals Waste categories in construction covered, methodologies applied)
90
6 Deductive and inductive categories to Definition of Waste categories, its identify central themes and interpret influence on construction phases, results and correlation of waste to critical
factors
90
2. Construction PhasesThe construction industry works on six phases (Styhre, Josephson, & Knauseder, 2004):

53
A critical review of the system-wide waste in the construction industry
➢ Planning and Development: In this stage, the identification of the project, its location, and conceptdesign are worked out.
➢ Construction Planning: The next stage is working on the feasibility study and design of the building.➢ Pre-construction: This stage includes preparation of material list, obtaining quotes, preparing
contracts, obtaining building approval, and completing insurance formalities. ➢ Procurement: At this stage, the contracts, material supply orders, and labour sourcing are
completed. ➢ Construction: This stage is from site preparation until the physical build is completed. ➢ Post-Construction: The last stage is preparing the building for occupancy, checking the construction
specification, auditing for defects, completing handing over formalities and physical handing over is done.
3. Waste
Figure 1: Construction Phases
The construction industry focuses on waste reduction and managing the flow of the construction process (Teo & Loosemore, 2001). Waste is the disproportionate consumption of resources and materials: the resources means human effort, energy, air, water, land, and biodiversity (Cobra et al., 2015). The material or substance waste managers focus on reduce, reuse, recycle, rethink and recover while the resource waste managers focus on reduction and elimination (Womack & Jones, 2010). This study draws on research conducted in an organisational resource waste management context.
Corvellec (2016) argues that waste happens in all stages of design, extraction, construction, distribution, consumption, and waste management. Likewise, LeMahieu, Nordstrum, and Greco (2017) suggested underutilised skill, knowledge, experience, talent or innovation as waste. In addition, individual, project team, and organizational factors influence the work and productivity of a construction project (Thevendran & Mawdesley, 2004). Substantiating, Mokhtar, Mahmood, Che Hassan, Masudi, and Sulaiman (2011) stated that construction method, storage method, human error and a technical problem can affect the amount of waste generated at the construction sites. Likewise, Durdyev and Mbachu (2011) study on on-site labour productivity of New Zealand construction Industry affirmed wastes due to statutory compliance, unforeseen events, reworks, the method of construction, supervision, and coordination. Further, Sajedeh, Fleming, Talebi, and Underwood (2016) related decision-making deficiencies to waste. Waste includes the excessive use or underutilisation of anything to the optimum requirement of resources like men; machine; method; measurement and material for adding value to the product (Prasad, Khanduja, & Sharma, 2016).

Mahesh Babu Purushothaman and Jeff Seadon
54
Organisations engage people to perform activities that enhance, create, or add value. Do organisations define and measure the errors or waste that happen due to activity?
Literature capture the waste generated by the construction process and its resultant discharge that to harm the environment. However, the waste generated by information technology function, the individual’s activities, limitations of department boundaries and hierarchical system of the construction industry are not well-defined. It is noteworthy to relate all these segments to the appropriate categories, ascertain the waste in an organisation for elimination. Following similar lines of Purushothaman, M. B., Seadon, J. & Moore, D. (2020) the wastes are shown in Table 2 below.
Table 2: waste categories
Waste type Description Remarks
Lean waste (LW)
The waste generated by the process of construction, which affects the organisation, is referred to as Lean waste: Overproduction; Waiting; Transportation; Over Processing; Inventory; Movement; Defective products, Health (Waste generated due to ill health) and Space (more than optimal space occupied).
The construction industry accounts for one-third of work fatalities, injuries, and ill health (Haslam et al., 2005). New Zealand waste strategy (MFE, 2010) and The United Nations Conference on the Environment and Development (Leka, Griffiths, and Cox,2005) emphasis workplace health. The risk of exposure to toxic chemicals, heavy equipment, electrocution (Curtis, Meischke, Simcox, Laslett, and Seixas, 2016), onsite slips, trips, falls (Bentley et al., 2006), and prolonged workplace sitting affects health (Crandall, Zagdsuren, Schafer, and Lyons,2016) and in turn the productivity (Org et al., 2016). Space is limited for on-site operations and excess space hard to find. The storage space for unwanted material, scrap, and excess inventory increases handling and storage cost and reduces performance levels (Shah & Khanzode, 2017).
Environmental waste (EW)
Environmental waste defined as the unnecessary or excess use of resources or its material constituent disposed to the air, water, or land that could harm human health or the environment (Cobra et al., 2015)
The construction Industry views waste as an unavoidable by-product, however reduction of waste is important for the environment and organisation (Teo & Loosemore, 2001). Reducing, Recycling, waste prevention or recovery (Garlapati, 2016), keeping track and solve spills and waste (Bianciardi, Credi, Levi, Rosa, & Zecca, 2017) lessen the environmental concerns. Various governments are focusing on environmental concerns. For example, the New Zealand waste strategy focused on managing and minimising waste and set targets to move New Zealand towards zero waste (MFE, 2010).
Information technology waste (ITW):
Decision- making individual waste (DMIW)
Waste triggered by the information technology function, such as defects due to delay, programming, hardware, connectivity, training, documentation, and storage. Waste generated by the individuals’ delay, lack of decision and wrong decision-making.
As the digital era had its impact on industries, information technology (IT) has become a critical and indispensable tool in the construction industry (Cherian & Kumaran, 2016) that connects the construction process internally through ‘building information modelling’ systems (Sacks, Koskela, Dave, & Owen, 2010). Any deficiencies such as security threats, hardware defects, software bugs, and connectivity issues (McFarlane, Troutman, Noble, & Allen, US9329922 B1/2016) causes waste. Decision-making is an important aspect in every phase of the construction project (Ning, Lam, & Lam, 2011). Imperfection and selfishness in decision-making create waste (Guy, Karny, and Wolpert, 2015). Self-factors that influence decision-making includes intuition, feeling, experience, procrastination, bias, fear, carefulness, motivation

55
A critical review of the system-wide waste in the construction industry
Waste type Description Remarks and ignorance (Tonetti et al., 2016). Situation factors are the gravity of the problem, doubt on fact, the uncertainty of the situation, goal clarity, supervisor support, autonomy and team support (Lingens, Winterhalter, Krieg, & Gassmann, 2016). The solution factor includes focus on the outcome, buck-passing, being adamant, personal judgement, emotion, and confusion on others’ perspective (Bernal, 2017).
Department or Function Waste (DFW)
The waste generated by adopting boundaries, procedures, policies, and hierarchies is Department or Function Waste.
The decision-making process is constrained by the well- established departmental hierarchy and boundaries that are established to achieve fast and positive results and logically implant the right controls (Amadei,2016) but frequently fail in practice, (Floyd,2017). Hierarchy, bureaucracy and inflexible procedures (Ghoshal & Westney, 2016), block communication, delay and initiate defects in the construction industry (Wilensky, 2015).
Decision- making cross- functional team waste (CFTW)
The waste generated by the teams’ delay, lack of decision, or wrong decision.
The cross-functional team (CFT) deliver innovative solutions in the construction industry (Shulzhenko, 2016). However, CFT shows negative results due to poor coordination (Littlepage, Hein, Moffett, Craig, and Georgiou, 2016), trust deficit, leadership, lack uniqueness, accept workable arguments (Saaty, 2012).
Human Resources waste (HRW)
Enterprise engagement waste (EEW)
Waste as a result of imparting non-rewarding training, underutilisation of talents, absenteeism, and overstaffing. Deficiencies created by external experts, consultants, and auditors are enterprise engagement waste.
People with limited ability, authority and responsibility produce defects in the Construction industry (Biazzo, Panizzolo, and de Crescenzo, 2016). There are instances of underutilisation of the people where their skills, talents, and intellectual abilities are underutilised (Womack & Jones, 2010), which is a form of waste. Organisation engages external agencies. Notably, architects and contractors do not resolve their issues on time impacting construction projects (Kumaar, Deventhiran, Kumar, Kumar, & Suresh, 2016). Similarly, enterprises face conflict due to the engagement of consultants (Brandon-Jones, Lewis, Verma, & Walsman, 2016), audit firms (Ayres, Neal, Reid, & Shipman, 2016), and external certifiers (Dranove & Jin, 2010).
Stress Waste (SW)
The waste caused by stress to the people.
Work stress is a challenge worldwide and attains significance as the working methods continue to change (Jahanian, Tabatabaei, & Behdad, 2012). The consequences of work-related stress are emotional exhaustion, dwindled enthusiasm, demotivation and lower productivity (Hobfoll and Shirom,2001).
Methods Waste (Design, Overhead and Eagerness & error) Waste (MW)
The waste created by the methods of design, overhead, and eagerness.
Tauriainen, Marttinen, Dave, and Koskela (2016) and Shaar, K., Assaf, S., Bambang, T., Babsail, M., & Fattah, A. A. E. (2017) affirm that design methods generate waste. Likewise, Chipeta, Bradley, Chimwaza-Manda, and McAuliffe (2016) indicate that overheads in an organisation generate waste. Similarly, Nezam, Ataffar, Isfahani, and Shahin (2016) point out that eagerness to conduct experiment trigger significant waste.
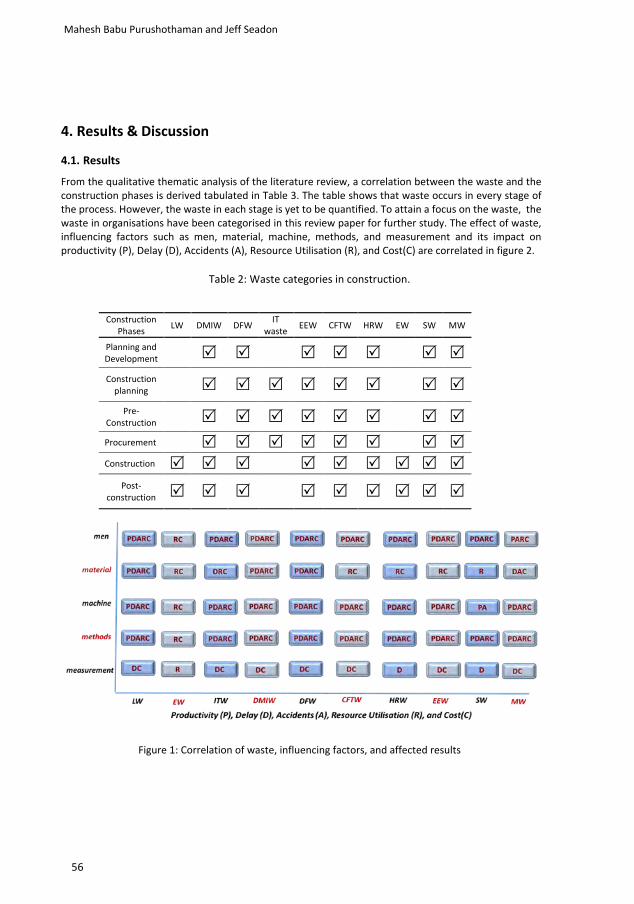
Mahesh Babu Purushothaman and Jeff Seadon
56
4. Results & Discussion
4.1. Results
From the qualitative thematic analysis of the literature review, a correlation between the waste and the construction phases is derived tabulated in Table 3. The table shows that waste occurs in every stage of the process. However, the waste in each stage is yet to be quantified. To attain a focus on the waste, the waste in organisations have been categorised in this review paper for further study. The effect of waste, influencing factors such as men, material, machine, methods, and measurement and its impact on productivity (P), Delay (D), Accidents (A), Resource Utilisation (R), and Cost(C) are correlated in figure 2.
Table 2: Waste categories in construction.
Construction Phases LW DMIW DFW IT
waste EEW CFTW HRW EW SW MW
Planning and Development
Construction planning
Pre-Construction
Procurement Construction
Post-construction
Figure 1: Correlation of waste, influencing factors, and affected results

57
A critical review of the system-wide waste in the construction industry
4.2. Discussion
The construction industry views waste as an unavoidable by-product (Teo & Loosemore, 2001), it focuses on strategies to reduce physical waste, human effort, energy, air, water, land, and biodiversity (Cobra et al., 2015). The construction industry and governments supporting the environmental concerns, sustainability and cost factors are focused on managing and minimising waste and set targets to move New Zealand towards zero waste (MFE, 2010). However, the construction industry and governments focus do not reach behind material, labour, time, and environment. This paper through its descriptive analyses qualitative thematic analysis identified 10 waste types or groups that researchers had identified globally over two decades that could be used reduce cost improve productivity and address sustainability and environmental concerns of the construction industry.
Traditionally material, labour, and time wasted are considered during a residential build (Burgess, Buckett & Page, 2013). Many researchers as well as industry have not included waste other than the material, labour, and time. However, systematic analysis shows that various other waste had been identified, which had not been correlated to construction phases and its impact on productivity (P), Delay (D), Accidents (A), Resource Utilisation (R), and Cost(C) holistically. This article discussed and defined the decision-making waste, departmental waste, stress waste, methods waste, human resources waste and IT waste (refer to the section 3) and linked to 6 construction phases (refer to Table 2) and plotted (refer to Figure 2) the impact on productivity (P), Delay (D), Accidents (A), ResourceUtilisation (R), and Cost(C). An effective tracking and systematic elimination of these waste that are notfocused till date would largely benefit the organisation and the country’s economy.
5.0 Conclusion Waste in any form consumes time, resource, and effort and in turn influence cost, delivery, and value. Continuous efforts are needed to reduce or eliminate waste to attain optimum efficiency; the process induces considerable stress in the system, which tends to affect the people associated with the organisation. This critical review identified, defined (refer to the section 3), and highlighted the relationships laid out by researchers on 10 types of construction-related waste on the six construction phases and its impact on productivity (P), Delay (D), Accidents (A), Resource Utilisation (R), and Cost(C) that had not been focused by the construction industry (refer to Table 2 and Figure 2). Future research could focus on quantifying each waste type and identify factors influencing them. The purpose of the literature review is to point out that the various organisational wastes exist that are yet to be quantified and a study would be beneficial to the construction industry. If the study could bring a 5% savings, it would yield a $1.5 billion to the bottom line of New Zealand’s construction industry.
References
Amadei, L. (2016). Why policies and procedures matter. Risk Management, 63(9), 12. Retrieved from http://ezproxy.aut.ac.nz/login?url=https://search.proquest.com/docview/1845754095?accountid=8440
Ayres, D. R., Neal, T. L., Reid, L. C., & Shipman, J. E. (2016). Auditing goodwill in the post-amortization era: Challenges for auditors. Quaternary International. doi:http://dx.doi.org/10.2139/ssrn.2474674
Bentley, T. A., Hide, S., Tappin, D., Moore, D., Legg, S., Ashby, L., & Parker, R. (2006). Investigating risk factors for slips, trips and falls in New Zealand residential construction using incident-centred and incident-independent methods. Ergonomics, 49(1), 62-77. doi:http://dx.doi.org.ezproxy.aut.ac.nz/10.1080/00140130612331392236

Mahesh Babu Purushothaman and Jeff Seadon
58
Bernal, A. C. A. L. (2017). Conflict management message styles and decision-making patterns in Mexican adolescent high-school students. Indian Journal of Applied Research, 6(10).
Bianciardi, A., Credi, C., Levi, M., Rosa, F., & Zecca, A. (2017). Biomimicry Thinking: Methodological Improvements and Practical Implementation. Bioinspired, Biomimetic and Nanobiomaterials, 1-53. doi:https://doi- org.ezproxy.aut.ac.nz/10.1680/jbibn.16.00007
Biazzo, S., Panizzolo, R., & de Crescenzo, A. M. (2016). Lean management and product innovation: a critical review. In A. Chiarini, P. Found, & N. Rich (Eds.), Understanding the Lean Enterprise (pp. 237-260). Cham, Switzerland: Springer. doi:https://doi-org.ezproxy.aut.ac.nz/10.1007/978-3-319-19995-5_11
Brandon-Jones, A., Lewis, M., Verma, R., & Walsman, M. C. (2016). Examining the characteristics and managerial challenges of professional services: An empirical study of management consultancy in the travel, tourism, and hospitality sector. Journal of operations management, 42, 9-24. doi:https://doi- org.ezproxy.aut.ac.nz/10.1371/journal.pone.0048596
Burgess, J., Buckett, N., & Page, I. (2013). Prefabrication impacts in the New Zealand construction industry. BRANZ study report 279. Retrieved from https://www.branz.co.nz/cms_show_download.php?id=2935644f1d998595f3a2d8f5e8167dd08a42a179
Cherian, T. M., & Kumaran, L. A. (2016). E-Business in Construction Industry: Opportunities and Challenges. Indian Journal of Science and Technology, 9(32). doi:10.17485/ijst/2016/v9i32/98655
Chipeta, E., Bradley, S., Chimwaza-Manda, W., & McAuliffe, E. (2016). Working relationships between obstetric care staff and their managers: a critical incident analysis. BMC health services research, 16(1), 441. doi:https://doi.org/10.1186/s12913-016-1694-x
Corvellec, H. (2016). A performative definition of waste prevention [Article]. Waste Management, 52, 3-13. doi:10.1016/j.wasman.2016.03.051
Crandall, K. J., Zagdsuren, B., Schafer, M. A., & Lyons, T. S. (2016). Static and Active Workstations for Improving Workplace Physical Activity and Sitting Time. International Journal of Human Movement and Sports Sciences, 4(2), 20-25. doi:10.13189/saj.2016.040202
Creswell, J. W. & Creswell, J. D. (2017). Research design: Qualitative, quantitative, and mixed methods approaches, Thousand Oaks, CA, USA, Sage publications.
Curtis, H. M., Meischke, H., Simcox, N., Laslett, S., & Seixas, N. (2016). P343 Addressing health and safety risks for tradeswomen in the construction industry. Occupational and Environmental Medicine, 73(Suppl 1), A236-A237. doi:http://dx.doi.org.ezproxy.aut.ac.nz/10.1136/oemed-2016-103951.658
Dranove, D., & Jin, G. Z. (2010). Quality disclosure and certification: Theory and practice. Journal of Economic Literature, 48(4), 935-963. doi:10.1257/jel.48.4.935
Durdyev, S., & Mbachu, J. (2011). On-site labour productivity of New Zealand construction industry: Key constraints and improvement measures. Construction Economics and Building, 11(3), 18-33. doi:http://dx.doi.org/10.5130/AJCEB.v11i3.2120
Floyd, R. E. (2017). The Development and Maintenance of Process Procedures. IEEE Potentials, 36(1), 6-9. doi:10.1109/MPOT.2013.2265656
Garlapati, V. K. (2016). E-waste in India and developed countries: Management, recycling, business and biotechnological initiatives. Renewable and Sustainable Energy Reviews, 54, 874-881. doi:https://doi- org.ezproxy.aut.ac.nz/10.1016/j.rser.2015.10.106
Ghoshal, S., & Westney, E. (2016). Organization Theory and the Multinational Corporation (2 ed.). Cambridge, Massachusetts, USA: St. Martin Press / Springer.
Guy, T. V., Karny, M., & Wolpert, D. (Eds.). (2015). Decision Making: Uncertainty, Imperfection, Deliberation and Scalability (Vol. 538). Switzerland: Springer.
Haslam, R. A., Hide, S. A., Gibb, A. G., Gyi, D. E., Pavitt, T., Atkinson, S., & Duff, A. (2005). Contributing factors in construction accidents. Applied Ergonomics, 36(4), 401-415. doi:https://doi- org.ezproxy.aut.ac.nz/10.1016/j.apergo.2004.12.002
Hobfoll, S. E., & Shirom, A. (2001). Conservation of resources theory: Applications to stress and management in the workplace. In R. T. Golembiewski (Ed.), Handbook of organizational behaviour (pp. 57-80). New York, USA: Marcel Dekker.

59
A critical review of the system-wide waste in the construction industry
Jahanian, R., Tabatabaei, S. M., & Behdad, B. (2012). Stress Management in the Workplace. International Journal of Academic Research in Economics and Management Sciences, 1(6), 1. Retrieved from http://www.hrmars.com/admin/pics/1269.pdf
Kumaar, A. N., Deventhiran, K., Kumar, M. S., Kumar, M. M., & Suresh, R. (2016). A Study on Targeted Relationships between Contractors and Consultants in Construction Industry. Indian Journal of Science and Technology, 9(16). doi:10.17485/ijst/2016/v9i16/92191
Leka, S., Griffiths, A., & Cox, T. (2005). Protecting Workers’ Health Series No 3, Systematic Problem Approaches For Employers, Managers And Trade Union Representatives. Nottingham, United Kingdom: Institute Of Work, Health & Organizations, University of Nottingham
LeMahieu, P. G., Nordstrum, L. E., & Greco, P. (2017). Lean for education. Quality Assurance in Education, 25(1). doi:http://dx.doi.org/10.1108/QAE-12-2016-0081
Lingens, B., Winterhalter, S., Krieg, L., & Gassmann, O. (2016). Archetypes and Basic Strategies of Technology Decisions: Understanding the likely impact of a new technology and the uncertainty associated with it can help managers determine the most efficient, effective approach to decision-making. Research-Technology Management, 59(2), 36-46. doi:10.1080/08956308.2015.1137192
Littlepage, G. E., Hein, M. B., Moffett, R. G., Craig, P. A., & Georgiou, A. M. (2016). Team Training for Dynamic Cross- Functional Teams in Aviation Behavioral, Cognitive, and Performance Outcomes. Human Factors: The Journal of the Human Factors and Ergonomics Society, 0018720816665200. doi:10.1177/0018720816665200
Llatas, C., & Osmani, M. (2016). Development and validation of a building design waste reduction model. Waste Management, 56, 318-336. doi:https://doi-org.ezproxy.aut.ac.nz/10.1016/j.wasman.2016.05.026
Maki, T. (2015). Multi-disciplinary discourse on design-related issues in construction site meetings. Procedia Economics and Finance, 21, 231-238. doi:https://doi-org.ezproxy.aut.ac.nz/10.1016/S2212-5671(15)00172-0
McFarlane, J. W., Troutman, A. T., Noble, M. R., & Allen, N. A. (2016). Defect analysis based upon hardware state changes. USA: Google Patents/Amazon Technologies, Inc. (Reprinted from May 3, 2013).
McGuire, L. A., Rengers, F. K., Kean, J. W., Coe, J. A., Mirus, B. B., Baum, R. L., & Godt, J. W. (2016). Elucidating the role of vegetation in the initiation of rainfall-induced shallow landslides: Insights from an extreme rainfall event in the Colorado Front Range. Geophysical Research Letters, 43(17), 9084-9092. doi:10.1002/2016GL070741
MFE, N. Z. (2010, October). The New Zealand Waste Strategy, Reducing harm, improving efficiency. Retrieved from http://www.mfe.govt.nz/sites/default/files/wastestrategy.pdf
Mokhtar, S. N., Mahmood, N. Z., Che Hassan, C. R., Masudi, A. F., & Sulaiman, N. M. (2011). Factors that contribute to the generation of construction waste at sitesTrans Tech Publ. Symposium conducted at the meeting of the Advanced Materials Research doi:10.4028/www.scientific.net/AMR.163-167.4501
Nezam, M. H. K., Ataffar, A., Isfahani, A. N., & Shahin, A. (2016). Human capital and new product development performance efficiency-the mediating role of organisational learning capability. International Journal of Innovation and Learning, 20(1), 26-46. doi:https://doi-org.ezproxy.aut.ac.nz/10.1504/IJIL.2016.076670
Ning, X., Lam, K.-C., & Lam, M. C.-K. (2011). A decision-making system for construction site layout planning. Automation in Construction, 20(4), 459-473. doi:https://doi- org.ezproxy.aut.ac.nz/10.1016/j.autcon.2010.11.014
Org, A., Grossmeier, J., Fabius, R., Flynn, J. P., Noeldner, S. P., Fabius, D., Anderson, D. R. (2016). Linking Workplace Health Promotion Best Practices and Organizational Financial Performance Scores on the HERO Scorecard. doi:10.1097/JOM.0000000000000631
Pedrini, M., & Ferri Laura, M. (2019). Stakeholder management: a systematic literature review. Corporate Governance: The international journal of business in society, 19(1), 44-59. https://doi.org/10.1108/CG-08-2017- 0172
Prasad, S., Khanduja, D., & Sharma, S. K. (2016). A study on implementation of lean manufacturing in Indian foundry industry by analysing lean waste issues. Proceedings of the Institution of Mechanical Engineers, Part B: Journal of Engineering Manufacture, 0954405416640169. doi:10.1177/0954405416640169
Purushothaman, M. B., Seadon, J. & Moore, D. (2020). Waste reduction using lean tools in a multicultural environment. Journal of Cleaner Production, 265, Article no :121681.

Mahesh Babu Purushothaman and Jeff Seadon
60
Saaty, T. L. (2012). Decision making for leaders: the analytic hierarchy process for decisions in a complex world (3 rd, fifth printing ed.). Pittsburgh, PA, USA: RWS Publications.
Sacks, R., Koskela, L., Dave, B. A., & Owen, R. (2010). Interaction of lean and building information modelling in construction. Journal of Construction Engineering and Management, 136(9), 968-980. doi:https://doi.org/10.1061/(ASCE)CO.1943-7862.0000203
Sajedeh, M., Fleming, A., Talebi, S., & Underwood, J. (2016, 18th - 24th July ). Development of an Experimental Waste Framework Based on Bim/Lean Concept in Construction Design. Presented at the meeting of the 24th Annual Conference of the International Group for Lean Construction, Boston, USA. Retrieved from http://iglc.net/Papers/Details/1280
Shaar, K., Assaf, S., Bambang, T., Babsail, M., & Fattah, A. A. E. (2017). Design–construction interface problems in large building construction projects. International Journal of Construction Management, 1-13. doi:http://dx.doi.org.ezproxy.aut.ac.nz/10.1080/15623599.2016.1187248
Shah, B., & Khanzode, V. (2017). Storage allocation framework for designing lean buffers in forward-reserve model: a test case. International Journal of Retail & Distribution Management, 45(1), 90-118. doi:http://dx.doi.org/10.1108/IJRDM-07-2016-0112
Shulzhenko, E. (2016). Process Thinking and Professionals' Motivation for Inter-Departmental Collaboration: A Case Study of a Danish University Hospital ISA forum of sociology. Symposium conducted at the meeting of the Third ISA Forum of Sociology (July 10-14, 2016), Vienna, Austria.
Styhre, A., Josephson, P. E., & Knauseder, I. (2004). Learning capabilities in organizational networks: case studies of six construction projects. Construction Management and Economics, 22(9), 957-966.
Tauriainen, M., Marttinen, P., Dave, B., & Koskela, L. (2016). BIM and lean construction change design management practices.
Teo, M., & Loosemore, M. (2001). A theory of waste behaviour in the construction industry. Construction Management & Economics, 19(7), 741-751. doi:http://dx.doi.org.ezproxy.aut.ac.nz/10.1080/01446190110067037
Thevendran, V., & Mawdesley, M. (2004). Perception of human risk factors in construction projects: an exploratory study. International journal of project management, 22(2), 131-137. doi:https://doi- org.ezproxy.aut.ac.nz/10.1016/S0263-7863(03)00063-2
Tonetti, L., Fabbri, M., Boreggiani, M., Guastella, P., Martoni, M., Ruiz Herrera, N., & Natale, V. (2016). Circadian preference and decision-making styles. Biological Rhythm Research, 47(4), 573-581.
Whang, S.-W., Flanagan, R., Kim, S., & Kim, S. (2016). Contractor-Led Critical Design Management Factors in High- Rise Building Projects Involving Multinational Design Teams. Journal of Construction Engineering and Management, 06016009. doi:https://doi.org/10.1061/(ASCE)CO.1943-7862.0001242
Wilensky, H. L. (2015). Organizational Intelligence: Knowledge and policy in government and industry (Original work Published in 1967 by Basic book Inc, New York and London). (Vol. 19). New Orleans, Louisiana, USA: Quid Pro Books.
Womack, J. P., & Jones, D. T. (2010). Lean thinking: banish waste and create wealth in your corporation (2 nd ed.). USA, New York: Simon and Schuster.

61
The 54th International Conference of the Architectural Science Association (ANZAScA) 2020
A cultural perspective to manage conflicts in cross cultural project teams: A literature review
Miyami Dasandara1, Nirusika Rajenthiran2, Piumi Dissanayake3 and Aparna Samaraweera4 1, 2, 3 University of Moratuwa, Colombo, Sri Lanka
[email protected], [email protected], [email protected] 4 UniSA STEM, University of South Australia
Abstract: Nowadays, majority of the construction projects are highly influenced by the foreign participants due to globalisation. Therefore, achieving the goals of these international construction projects has become a unique challenge because of the cross cultural interactions. When engaging in these projects, foreign participants such as engineers, architects, contractors have to face many situations with local parties due to different cultural patterns. Therefore, intragroup conflicts in cross cultural teamwork can be highly arisen resulting severe impacts towards these projects. Thus, these multicultural projects highly require a proper conflict management to become success. This paper, therefore, aimed to provide a culture based solution through a conceptual framework to manage intragroup conflicts in cross cultural construction projects. The research methodology of this paper was formulated on a comprehensive literature review. The developed conceptual framework presents how different types of intragroup conflicts can be managed through cross cultural indicators, which are cross cultural dimensions and cross cultural orientations. Accordingly, 08 cross cultural dimensions named communication, leadership, trust, collectivism, team selection, uncertainty, team development and management were identified and under these dimensions, altogether 32 cross cultural orientations were captured through the literature findings.
Keywords: Construction projects; Intragroup conflicts; Cross cultural dimensions; Cross cultural orientations.
1. IntroductionConstruction industry is having different human interactions throughout the whole construction process (Samaraweera and Senaratne, 2012). Further, these differences in human behaviours, which are mainly created by their own cultures are very important for the projects’ success. Hence, it can be argued that culture can be identified as a powerful force, which shapes the projects’ overall effectiveness as well as
Imaginable Futures: Design Thinking, and the Scientific Method. 54th International Conference of the Architectural Science Association 2020, Ali Ghaffarianhoseini, et al (eds), pp. 61–70. © 2020 and published by the Architectural Science Association (ANZAScA).

Miyami Dasandara, Nirusika Rajenthiran, Piumi Dissanayake and Aparna Samaraweera
62
long term success (Yitmen and Taneri, 2005). Especially in developing countries, where construction activities are heavily influenced by the foreign participants, cross-cultural interactions play a key role in negotiations, decision making and various other construction organisational transactions (Ochieng and Price, 2009). However, these cultural differences might create misunderstandings between people and businesses, forming conflicts and dissatisfactions among construction project participants (Tijhuis, 2011). Ankrah and Langford (2005) also disclosed that conflicts related to human interactions, possibly will occur in construction projects due to cultural differences and may have an adverse impact on achieving project objectives. These intragroup conflicts were categorised into three main categories as task conflict, relationship conflict and process conflict by Chen, Zhang and Zhang (2014). These conflicts create many obstacles for the path of success of the construction projects, as further emphasised by previous study. Therefore, managing these cross cultural projects has become an emerging need to mitigate the conflicts among project participants due to multiculturalism. As stated by Wu et al. (2017), different cross cultural indicators can be used for better management of cross cultural projects.
Accordingly, this paper aims to derive a culture based solution for managing intragroup conflicts in cross cultural projects through cross cultural dimensions and cross cultural orientations. The aim is achieved by developing a conceptual framework using extent literature. Few sub questions need to be answered in the process of achieving the aim of the study. First sub question raised is ‘what are cross cultural construction projects?’ next, ‘how intragroup conflicts can be occurred within these construction projects?’ and finally, ‘how these intragroup conflicts can be properly managed?’. Consequently, by answering these sub questions, the aim of this study is successfully achieved.
2. Research methodologyA traditional literature review, which provides a comprehensive background of the literature under the selected topic is used as the research methodology for this paper. Information relevant to the key words such as multicultural construction projects, intragroup conflicts, cross cultural dimensions and cross cultural orientations are obtained through various sources such as journal articles, online journals, e- books, conference papers, web sites, electronic library data base and other publications. Accordingly, a comprehensive literal analysis and arguments were brought to answer the research question through a conceptual framework since traditional literature review generally assist in developing theoretical or conceptual frameworks based on the prevailing literature (Danson and Arshad, 2014).
This paper is structured in five main sections. Initially, the background of cross cultural construction projects is discussed and then how intragroup conflicts can be occurred within these cross cultural projects is explained by highlighting three main categories of intragroup conflicts. Thereafter, the attention is drawn to the way of managing these intragroup conflicts through cross cultural dimensions and cross cultural orientations. Based on the literature findings, the conceptual framework is developed as the next section. The framework implies how intragroup conflicts can occur in cross cultural construction projects and how these intragroup conflicts can be properly managed with the use of cross cultural dimensions and cross cultural orientations. Finally, conclusions have been drawn through the empirical literature findings.
3. Cross cultural construction projectsPresently, with the impact of globalisation, foreign participation for the construction activities has become more popular all over the world (Tijhuis, 2011). As a result, individuals from different racial and ethnic backgrounds have to work together in order to achieve the goals of the construction projects

63
A cultural perspective to manage conflicts in cross cultural project teams: A literature review
(Appelbaum, Shapiro and Elbaz, 2014). These type of construction projects can be basically identified as cross cultural projects due to the cultural differences of the project participants (Nguyen, 2019). Nowadays, construction industry tends more to make full use of these international construction opportunities for their success as their contribution for the economic development of the country is considerably high (Ofori, 2015). Chan and Suen (2005) noted that these international construction projects consist of contractors, consultants, engineers, architects and other employees coming from many cultural backgrounds. A similar argument has been brought forward by Appelbaum, Shapiro and Elbaz (2014) mentioning that at least one person who works outside the country of origin can be identified in these international construction projects. As emphasised by Ankrah and Langford (2005), organisational culture is comprised of different assumptions, beliefs, norms, behaviours, manifestations and values of the participants. Further, these differences highly encourage the complexity of the nature of the organisation. Accordingly, nature of the construction projects has become more complex due to the combination of underpinning values, manifestations of behaviours and languages of the project team members from multi-cultural backgrounds (Samaraweera and Senaratne, 2012). This complexity can affect for the workers’ working styles as well as the continuation of the construction projects in numerous ways, as stated by Xiao and Boyd (2010). Thus, Nguyen (2019) argued that coordination of key behavioural dimensions regarding integration of different cultures of the project participants is highly important to achieve the goals of the projects. It is because, it helps project participants to understand the interaction of their behaviours while they are working together for a common goal, as further disclosed by the previous author. However, there are no popular studies of any empirical work that elaborate explicitly how these key behavioural dimensions can be applied in achieving successful integration of different cultural backgrounds of the project participants. According to Appelbaum, Shapiro and Elbaz (2014) these cultural changes have brought many challenges for the project stakeholders in different ways and it is discussed in detail through the next section.
4. Conflicts in cross cultural construction projectsConflicts can be identified as fundamental disagreements between two or more parties, which habitually begins when individual sees matters in different and opposite ways (Cartwright and Cooper, 2000). These disagreements, divergences and mismatched thoughts or ideas amongst project team members normally can be identified as intragroup conflicts (Boulding, 2005). Accordingly, it is proven that, cross cultural projects are more vulnerable for occurring these intragroup conflicts due to different views, opinions, perceptions and beliefs of the team members (Nguyen, 2019). As further insisted by the study, escaping from these conflicts has become a great challenge for the project stakeholders throughout the whole construction process. As a result, these conflicts highly affect for the cooperate teamwork and successful completion of the cross cultural construction projects (Cakmak and Cakmak, 2014). It was further noted by Samaraweera and Senaratne (2012) mentioning that these cultural issues are emerging significantly and influencing badly for behavioural interactions within construction projects. Therefore, cross-cultural team members are need to be proficient to ascertain the intragroup conflicts and deal with them in operative way at initial stage (Chan and Suen, 2005).
According to Chen, Zhang and Zhang (2014), these intragroup conflicts can be categorised into three main categories named task conflict, relationship conflict and process conflict. As defined by them, task conflict raises as a result of arguments among project team members with regarding their altered perspectives, attitudes and thoughts related with project activities being performed. That means, task conflict based on the tasks developed by the project team members. Guerra et al., (2005) pinpointed

Miyami Dasandara, Nirusika Rajenthiran, Piumi Dissanayake and Aparna Samaraweera
64
that task conflict can make negative impacts towards the satisfaction and affective well-being of the team members when they perceive a low support working environment due to different cultures. Moving to next category of conflicts, Wu et al. (2017) elaborated that relationship conflict defines disagreements and incompatibilities among team members from interactive inconsistencies. Hence, it is obvious that relationship conflict based on the interpersonal relationships within the project participants. Accordingly, these conflicts are highly occurred in multi-cultural projects due to discrepancies of the different cultural backgrounds of the team members, as disclosed by Guerra et al. (2005). Further, it was witnessed that these relationship conflicts highly encourages the dysfunction of group work, diminishing group decision commitment and decreasing organisational commitment towards the success of the construction projects. At the same time, the third category of conflicts, which is process conflict can be identified as an awareness of controversies about how tasks should be accomplished by the team members (Jehn and Mannix, 2014). As further stated by the study, if conflicts are occurred due to mismatches of project team members of multi-cultural projects when accomplishing the assigned tasks, it can be identified as a situation which is experiencing process conflict.
As pointed out by Appelbaum, Shapiro and Elbaz (2014), these three types of conflicts are interconnected and therefore, have the opportunity for one type of conflicts to transform into another type of conflicts. At the same time, although many authors have identified the three main types of intragroup conflicts in their studies, they have not explored insight into the interrelationships among them with reference to the cross cultural construction projects. However, interrelationship between these intragroup conflicts can be simply presented based on the existing literature as shown in Figure 1.
Figure 1 : Interrelationship between intragroup conflicts. (Source: Appelbaum, Shapiro and Elbaz, 2014)
As stated by Wu et al. (2017), both relationship and process conflicts make an adverse impact on the project success rather than task conflicts as they are human relationship oriented while task conflicts are task oriented. Thus, it is witnessed that relationship and process conflicts can be highly occurred rather than task conflicts in these multicultural projects due to different cultural interactions. However, it was proven that differences in cultural backgrounds of project participants highly encourage these intragroup conflicts within the cross cultural projects (Wu et al., 2017). Therefore, managing the culturally varied construction projects has become a timely requirement for their great success and next section focuses on the management of cross cultural projects in a proper way.

65
A cultural perspective to manage conflicts in cross cultural project teams: A literature review
5. Management of cross cultural construction projectsIntragroup conflicts play a foremost role in project delivery on time without any delay, (Wu et al., 2017). Thus, as mentioned in previous section, management of cross cultural projects is highly important in the journey of success of these projects. However, it is difficult to prepare for cross-cultural working situations since many problems are very contextual and a solution to one particular problem may not be readily applied to another situation (Jehn and Mannix, 2014). Although it was, Nguyen (2019) noted that coordination of key behavioural dimensions of project stakeholders is the best way of managing these cross cultural projects by reducing intragroup conflicts among them. As further disclosed by him, coordination of key behavioural dimensions refers to coordination and integration of project participants and their culture in different levels by helping them to understand the interaction of their behaviours during the works. Accordingly, eight (08) types of cross cultural dimensions, which were revealed by different authors can be identified as illustrated in Table 1.
Table 1: Cross cultural dimensions
Cross Cultural Dimensions Sources of References A B C D E F G
Communication Leadership Trust Collectivism Team Selection Uncertainty Team Development Management A: (Carmeli, 2003); B: (Friedman and Liu, 2006); C: (Tinsley and Brett, 2001); D: (Simons and Peterson, 2000); E: (Yuki, 2013); F: (Cakmak and Cakmak, 2014); G: (Boonsathorn, 2007)
Accordingly, as specified in the above Table 1, proper communication among project team members, good leadership for the project team, trustworthiness among team members, giving priority for each member by considering each specific cultural values, effective team selection, reducing uncertainty among team members, enhancing the performance through proper team development and proper management of the project in every aspects can be recognised as appropriate project conflict resolution strategies for cross cultural projects based on the aforementioned cross cultural dimensions. However, it was witnessed through the above Table 1 that except communication, leadership and management, other dimensions have not identified most commonly by the researchers in their studies. Although it is, all these eight cross cultural dimensions appear as the most influential factors towards determining how people from different cultures can be properly managed, as emphasised by Boonsathorn (2007). According to Yuki (2013), it is obvious that intragroup conflict management mainly depends on level of tolerance of disagreements, individual offers, team loyalty, communication and perception of the extent of appropriate intervention by a superior. It is clearly witnessed through the above Table 1 as well. In addition, with regarding these cross cultural dimensions, many cross cultural orientations can be captured, which widely elaborate the way of managing intragroup conflicts within cross cultural construction projects. These cross cultural orientations can be presented as tabulated in Table 2.

Miyami Dasandara, Nirusika Rajenthiran, Piumi Dissanayake and Aparna Samaraweera
66
Table 2: Cross cultural orientations
Cross Cultural Dimensions Cross Cultural Orientations Sources of References A B C D E F
Communication
Leadership
Trust
Emotional dependence Team effectiveness Language Empathy Responsive Inspirational Charismatic Attention Confidence Concern Obey
Collectivism
Team Selection
Uncertainty
Team Development
Management
Trustworthy Reliable Commitment Open decision making Participatory Kindness Ability to work Fit into the team Technical ability Individual offers Reduce uncertainty Interpersonal skills Team building Reward Team loyalty Recognition Individual drivers Team cohesion Cooperative Interdisciplinary Open communication
A: (Brockman, 2014) B: (Carmeli, 2003); C: (De Dreu, Harinck and Van Vianen, 2001); D: (Friedman and Liu, 2006); E: (Yuki, 2013); F: (Tinsley and Brett, 2001);
According to Table 2, it is apparent that key behavioural dimensions can be properly applied to overcome intragroup conflicts within cross cultural projects with the use of aforementioned cross cultural orientations. With relevance to the each cross cultural dimension, many cross cultural orientations were identified. As an example, proper communication among team members highly affect for controlling intragroup conflicts. At the same time, when establishing a proper communication, it is crucial to consider about the language, empathy, effectiveness and emotional dependence based on the cultural patterns of the team members. Similarly, when ensuring the trust among team members, it is essential to pay attention on concern, reliability, trustworthiness as well as obey everyone as they are having many cultural differences. Accordingly, it is proven that these cross cultural orientations can be used for better application of key behavioural dimensions for managing intragroup conflicts. These
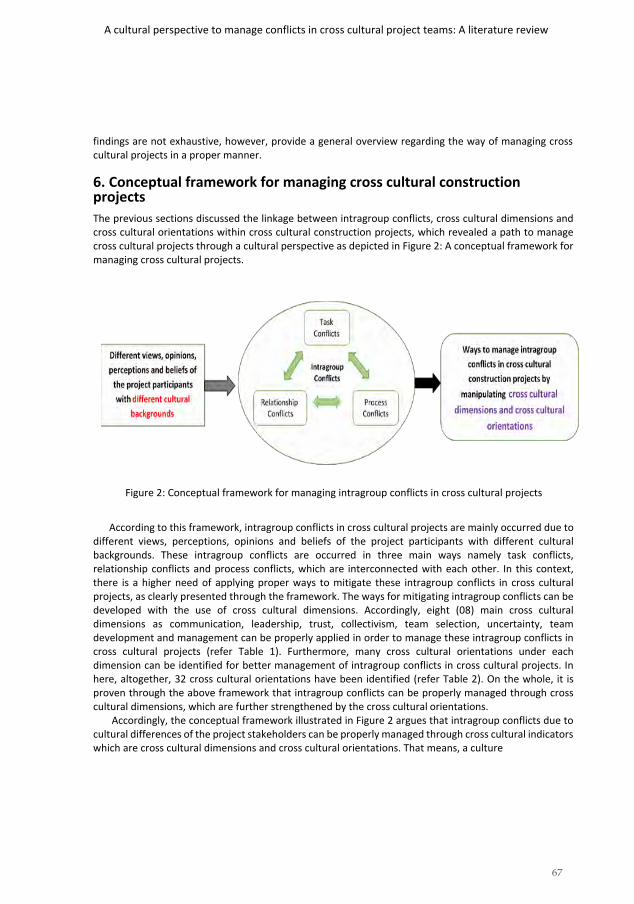
67
A cultural perspective to manage conflicts in cross cultural project teams: A literature review
findings are not exhaustive, however, provide a general overview regarding the way of managing cross cultural projects in a proper manner.
6. Conceptual framework for managing cross cultural constructionprojectsThe previous sections discussed the linkage between intragroup conflicts, cross cultural dimensions and cross cultural orientations within cross cultural construction projects, which revealed a path to manage cross cultural projects through a cultural perspective as depicted in Figure 2: A conceptual framework for managing cross cultural projects.
Figure 2: Conceptual framework for managing intragroup conflicts in cross cultural projects
According to this framework, intragroup conflicts in cross cultural projects are mainly occurred due to different views, perceptions, opinions and beliefs of the project participants with different cultural backgrounds. These intragroup conflicts are occurred in three main ways namely task conflicts, relationship conflicts and process conflicts, which are interconnected with each other. In this context, there is a higher need of applying proper ways to mitigate these intragroup conflicts in cross cultural projects, as clearly presented through the framework. The ways for mitigating intragroup conflicts can be developed with the use of cross cultural dimensions. Accordingly, eight (08) main cross cultural dimensions as communication, leadership, trust, collectivism, team selection, uncertainty, team development and management can be properly applied in order to manage these intragroup conflicts in cross cultural projects (refer Table 1). Furthermore, many cross cultural orientations under each dimension can be identified for better management of intragroup conflicts in cross cultural projects. In here, altogether, 32 cross cultural orientations have been identified (refer Table 2). On the whole, it is proven through the above framework that intragroup conflicts can be properly managed through cross cultural dimensions, which are further strengthened by the cross cultural orientations.
Accordingly, the conceptual framework illustrated in Figure 2 argues that intragroup conflicts due to cultural differences of the project stakeholders can be properly managed through cross cultural indicators which are cross cultural dimensions and cross cultural orientations. That means, a culture

Miyami Dasandara, Nirusika Rajenthiran, Piumi Dissanayake and Aparna Samaraweera
68
based issue can be successfully managed by a culture based solution as provided through this conceptual framework, which can be further strengthened by applying it in a selected context.
7. Conclusions and the way forwardThis review of literature aimed to provide a culture based solution through a conceptual framework for managing intragroup conflicts in cross cultural construction projects with the use of cross cultural dimensions and cross cultural orientations. The main research question was answered by providing literal arguments for three sub questions. First sub question was to identify what are these cross cultural projects and the next sub question was to understand how intragroup conflicts can be occurred within these construction projects. According to the prevailing literature, it is evident that nowadays, foreign participation for the construction activities has become more popular all over the world. It has encouraged the multiculturalism within construction projects resulting many intragroup conflicts among project participants due to cultural differences (Ochieng and Price, 2009). The work done by Wu et al. (2017) has identified three (03) main types of intragroup conflicts namely task conflict, relationship conflict and process conflict. One type of conflicts has the ability of transforming into another type of conflicts due to the interrelationship between them. Among these three types of conflicts, relationship conflicts and process conflicts have the higher probability of occurrence than task conflicts because they are mainly occurred due to the human relationships among project participants, which are mainly based on their cultural differences. However, in overall, these intragroup conflicts can be highly increased day by day and it is where the final sub question was emerged, how these intragroup conflicts can be properly managed. As identified through the literature, these intragroup conflicts can be successfully controlled by managing cross cultural projects using different cross cultural indicators. Accordingly, cross cultural dimensions as well as cross cultural orientations with respect of those dimensions were identified as the cross cultural indicators for managing intragroup conflicts. As per the literature findings, eight (08) main cross cultural dimensions were captured as communication, leadership, trust, collectivism, team selection, uncertainty, team development and management (refer Table 1). As depicted by Yuki (2013), cross cultural conflicts management basically depends on level of tolerance of disagreement, individual offers, team loyalty, communication and perception of the extent of appropriate intervention by a superior and that statement has presented the same findings, which proving that the aforementioned cross cultural dimensions are the most appropriate indicators for managing intragroup conflicts. Furthermore, with regarding these each dimension, many cross cultural orientations were identified, which encourage the better management of cross cultural projects (refer Table 2). When considering these identified cross cultural dimensions and orientations, it is obvious that they are mainly focusing on improving the relationships between project participants as relationship oriented conflicts are highly occurred among them due to different cultural interactions. Ultimately, mapping all these literal ideas and arguments, a conceptual framework was developed to provide a better understanding on managing intragroup conflicts in multicultural projects (refer Figure 2). The knowledge generated through this study will be the focus of future researches arising from this literature review.
8. ReferencesAnkrah, N. A. and Langford, D. A. (2005) ‘Architects and contractors : a comparative study of organizational
cultures’, Construction Management and Economics, 23(6), pp. 595–607. doi: 10.1080/01446190500126973. Appelbaum, S. H., Shapiro, B. and Elbaz, D. (2014) ‘The management of multicultural group conflict’, Team
Performance Management, 4(5), pp. 211–234. doi: 10.1108/13527599810234173.

69
A cultural perspective to manage conflicts in cross cultural project teams: A literature review
Boonsathorn, W. (2007) ‘Understanding conflict management styles of Thais and Americans in multinational corporations in Thailand’, International Journal of Conflict Management, 18(3), pp. 196–221. doi: 10.1108/10444060710825972.
Boulding, K. E. (2005) ‘Conflicts and defence’, Political Science Quarterly, 78(1), pp. 122–124. doi: DOI: 10.2307/2146675.
Brockman (2014) Cross Cultural Collaboration and Leadership in Modern Organizations. Edited by N. D. Erbe. Available at: https://books.google.lk/books?id=D4MfCgAAQBAJ&pg=PA355&lpg=PA355&dq=brockman+2013+cross+cultural +orientations&source=bl&ots=9ZvsNqPEZ- &sig=ACfU3U1ZhQkIhZhge9_bKM2e6R4mMUlllw&hl=en&sa=X&ved=2ahUKEwjUn8y6rZXqAhUZWX0KHfsNBNo Q6AEwC3oECAsQAQ#v=onepage&q=brockman 2013 cross cultural orientations&f=false.
Cakmak, E. and Cakmak, P. I. (2014) ‘An analysis of causes of disputes in the construction industry using analytical network process’, Procedia - Social and Behavioral Sciences. Elsevier B.V., 109, pp. 183–187. doi: 10.1016/j.sbspro.2013.12.441.
Carmeli, A. (2003) ‘The relationship between emotional intelligence and work attitudes , behavior and outcomes: An examination among senior managers’, Journal of Managerial Psychology, 18(8), pp. 788–813. doi: 10.1108/02683940310511881.
Cartwright, S. and Cooper, C. L. (2000) HR know-how in mergers and acquisition. London: Chartered Institute of Personnel and Development.
Chan, E. H. W. and Suen, H. C. H. (2005) ‘Dispute resolution management for international construction projects in China’, Management Decision, 43(4), pp. 589–602. doi: 10.1108/00251740510593576.
Chen, Y. Q., Zhang, Y. B. and Zhang, S. J. (2014) ‘Impacts of different types of owner-contractor conflict on cost performance in construction projects’, Journal of Construction Engineering and Managemen, 140(6). doi: 10.1061/(ASCE)CO.1943-7862.0000852.
Danson, M. and Arshad, N. (2014) ‘The Literature Review’, in Research Methods for Business and Management. GoodFellow Publishers, pp. 37–40.
De Dreu, C. K. ., Harinck, F. and Van Vianen, A. E. M. (2001) ‘Conflict and performance in groups and in organisations’, in Cooper and Roberston, I. T. (eds) International review of industrial and organizational psychology. John Wiley & Sons Ltd.
Friedman, R. and Liu, L. A. (2006) ‘An expectancy model of Chinese – American differences in conflict-avoiding’, Journal of International Business Studies, 37, pp. 76–91. doi: 10.1057/palgrave.jibs.8400172.
Guerra, J. M. et al. (2005) ‘A contingency perspective on the study of the consequences of conflict types : The role of organizational culture’, European Journal of Work and Organizational Psychology, 14(2), pp. 157–176. doi: 10.1080/13594320444000245.
Jehn, K. A. and Mannix, E. A. (2014) ‘The dynamic nature of conflict: A longitudinal study of intragroup conflict and group performance’, Academy of Management Journal, 44(2), pp. 238–251. doi: DOI: 10.2307/3069453.
Nguyen, L. H. (2019) ‘Relationships between critical factors related to team behaviors and client satisfaction in construction project organizations’, Journal of Construction Engineering and Management, 145(3), pp. 1–10. doi: 10.1061/(ASCE)CO.1943-7862.0001620.
Ochieng, E. G. and Price, A. D. F. (2009) ‘Managing cross-cultural communication in multicultural construction project teams : The case of Kenya and UK’, International Journal of Project Management. Elsevier Ltd and IPMA, 28(5), pp. 449–460. doi: 10.1016/j.ijproman.2009.08.001.
Ofori, G. (2015) ‘Nature of the construction industry, its needs and its development’, Journal of Construction in Developing Countries, 20(2), pp. 115–135. Available at: http://web.usm.my/jcdc/vol20_2_2015/JCDC 20(2) 2015-Art. 7(115-135).pdf.
Samaraweera, A. U. A. A. and Senaratne, S. (2012) ‘Understanding project culture in construction: A literature synthesis’, in World Construction Conference 2012 - Global Challenges in Construction Industry. Colombo, pp. 314–322. Available at: https://pdfs.semanticscholar.org/95d2/aba5b282e3f1e11a284fd0590f0a8ceb8bf3.pdf?_ga=2.44546790.313892 272.1592376055-1455168009.1579700978.

Miyami Dasandara, Nirusika Rajenthiran, Piumi Dissanayake and Aparna Samaraweera
70
Simons, T. L. and Peterson, R. S. (2000) ‘Task conflict and relationship conflict in top management teams : The pivotal role of intragroup trust’. doi: 10.1037/0021-9010.85.1.102.
Tijhuis, W. (2011) ‘Developments in construction culture research: Overview of activities of CIB W112 “culture in construction”’, Journal of Quantity Surveying & Construction Business, 1(2), pp. 66–76. Available at: http://docplayer.net/151356047-Developments-in-construction-culture-research-overview-of-activities-of-cib- w112-culture-in-construction.html.
Tinsley, C. H. and Brett, J. M. (2001) ‘Managing workplace conflict in the United States and Hong Kong’, Organizational Behavior and Human Decision Processes, 85(2), pp. 360–381. doi: 10.1006/obhd.2000.2944.
Wu, G. et al. (2017) ‘Effects of contractual flexibility on conflict and project success in megaprojects’, International Journal of Conflict Management. doi: 10.1108/IJCMA-06-2017-0051.
Xiao, H. and Boyd, D. (2010) ‘Learning from cross-cultural problems in international projects : A Chinese case’, Engineering Construction & Architectural Management, 17(6), pp. 549–562. doi: 10.1108/09699981011090189.
Yitmen, I. and Taneri, C. (2005) ‘Impact of culture on construction performance: North Cyprus construction industry’, in International Symposium on Procurement Systems -The Impact of Cultural Differences and Systems on Construction Performance. Las Vegas.
Yuki, M. (2013) ‘Intergroup comparison versus intragroup relationships : A cross-cultural examination of social identity theory in North American and East Asian cultural contexts’, Social Psychology Quarter, 66(2), pp. 166– 183. doi: 10.2307/1519846.

71
The 54th International Conference of the Architectural Science Association (ANZAScA) 2020
A deep learning approach to personal thermal comfort models for an ageing population
Larissa Arakawa Martins1, Veronica Soebarto1, Terence Williamson1 and Dino Pisaniello1
1 The University of Adelaide, Adelaide, Australia larissa.arakawamartins, veronica.soebarto, terence.williamson, [email protected]
Abstract: Recent years have shown an increasing number of studies on personal thermal comfort models as an alternative to the conventional approach to understanding thermal comfort in the built environment. Instead of basing on an average response from a large population, personalized models are designed to predict individuals’ thermal comfort responses, using a person’s direct feedback and personal characteristics as calibration inputs. However, personal comfort models have mainly used data from office environments and healthy younger adults. Studies on personal comfort models that focus on older people and dwellings are still absent in the literature. Nonetheless, considering the worldwide changing climate, the ageing population and older people’s heterogeneity in terms of intrinsic capacities and needs, personalized models could be the most appropriate path towards recognizing diversity and predicting individual thermal preferences in a more accurate way. This paper shows examples of personal comfort models, using deep learning algorithms and environmental and personal characteristics as inputs, derived from an on-going study that monitored people aged 65 and over in South Australia who live at home. The results have so far indicated that, on average, the individualised models improved the predictions by 69% when compared to traditional models.
Keywords: Personal comfort models; machine learning; thermal comfort; older people.
1. IntroductionInternational standards, such as ANSI/ASHRAE Standard 55, adopt the Predicted Mean Vote (PMV) model (Fanger, 1970) and the adaptive model (de Dear and Brager, 1998; Humphreys et al., 2016) as the bases to stablish the thermal requirements for human occupancy in the built environment. Both PMV and the adaptive models are aggregate models, which means they are designed to predict the average thermal comfort of large populations. However, predicting comfort at the population level might result in limitations for these two methods when used to predict occupant’s comfort in real case scenarios. These limitations include the models’ poor predictive performance when applied to different individuals and the inability of the models to be calibrated with diverse feedback or to incorporate new and personal input variables (such as age, health status, body mass index) (Kim et al., 2018a). In addition, the standards’ models have been developed based on data from mainly office buildings. Considerably fewer studies have focused on dwellings. This can also be limiting when considering the diversity of thermal conditions residential settings generally provide in comparison to controlled office environments.
Imaginable Futures: Design Thinking, and the Scientific Method. 54th International Conference of the Architectural Science Association 2020, Ali Ghaffarianhoseini, et al (eds), pp. 71–80. © 2020 and published by the Architectural Science Association (ANZAScA).

Larissa Arakawa Martins, Veronica Soebarto, Terence Williamson and Dino Pisaniello
72
In order to address these limitations, recent studies have shown an increasing number of strategies to develop personal thermal comfort models as an alternative to the conventional approaches. Instead of basing on an average response from a large population, personalized models are designed to predict individuals’ thermal comfort responses, using a single person’s direct feedback and/or personal characteristics as calibration inputs. This represents a relevant paradigm shift in the field today, replacing the centralized and fixed-set-points approach with occupant-centric and data-driven thermal conditioning management in the built environment. This also means that static environments in fixed thermal comfort zones are giving way to more flexible possibilities, transforming personalized conditioning systems in an option to absorb individual diversity (Rupp et al., 2015).
However, studies on personal comfort models that focus on older people and dwellings are still under researched in current literature (Kim et al., 2018a). Nonetheless, considering the worldwide changing climate, the ageing population and older people’s heterogeneity in terms of intrinsic capacities and needs (World Health Organization, 2015), personalized models could be the most appropriate path towards recognizing this diversity and predicting individual thermal preferences in a more accurate way.
This paper explores the development of personal comfort models, using real feedback as well as environmental and personal characteristics as input variables, to accurately respond to older people’s thermal needs in their homes. This study also aims to test the modelling methodology proposed using deep learning as the engine behind the prediction of individual people’s thermal preferences.
2. Study designThe sample for this study came from a research project that collected data from 71 participants (23 males and 48 females) aged 65 years and over from 57 households located in South Australia, in 3 climate zones - hot dry (BSk), warm temperate (Csa) and cool temperate (Csb), according to the Köppen–Geiger climate classification system. They were drawn from the first two stages of the research project entitled “ARCDP180102019 - Improving the thermal environment of housing of older Australians” (Soebarto et al., 2019a; van Hoof et al., 2019) and through press releases in various media formats. Data were collectedduring a period of 9 months, from mid-January to mid-October in 2019.
Each dwelling was visited twice. During the first visit, a questionnaire about sociodemographic information, health and overall thermal preferences was applied and an open-ended interview was conducted about house details. In addition, indoor environment data loggers (Soebarto et al., 2019b) were installed in each house’s main living room and main bedroom. A thermal comfort survey tablet was also installed to be used by the participants to answer a survey about their thermal environment and their preferences and sensations at least once a week, throughout the 9-month period.
The thermal comfort survey tablet allowed participants to complete surveys electronically about their clothing, activity levels, window and door state, heating, cooling, and fan state, as well as their thermal sensation (TSV) and thermal preference (TPV). Thermal sensation was assessed using the question “How do you feel right now?” with possible responses being Cold, Cool, Slightly cool, Neutral, Slightly warm, Warm or Hot. Thermal preference was assessed using the question “Would you prefer to be...” with possible responses being Cooler, No change or Warmer. The survey also included a question about their self-reported health and wellbeing status at that point in time.
The indoor environment data logger contained sensors that measured air temperature, globe temperature, air speed, relative humidity, carbon dioxide (CO2), and Volatile Organic Compounds (VOC). The data logger coordinates measurements from the sensors, undertaken at 30-minute intervals and when a participant completes a comfort survey.

73
A deep learning approach to personal thermal comfort models for an ageing population
During the second visit to each dwelling, conducted at the end of the monitoring period, an additional questionnaire was used to collect further information about the participants. Each participant’s body composition was also assessed to measure height, weight and body mass index (BMI), using a Tanita Inner Scan RD-953 scale (Tanita Corporation, 2016).
3. Modelling methodology
3.1. Learning technique and task
This preliminary study applies artificial neural networks, also known as deep learning (Goodfellow et al., 2016), to develop personalized comfort models for a subset of the participants involved in the monitoring study. Deep learning is a class of machine learning technology, based on the representation- learning method (LeCun et al., 2015). It solves tasks such as classification, regression, and anomaly detection, by introducing multiple layers of representations, or features, expressed in terms of other simpler representations. By learning from previously seen data, this method avoids the need of a human engineer to formally specify theses multiple layers of representations (Goodfellow et al., 2016).
The models were developed to perform a multiclass classification task of occupants’ thermal preference (TPV) on a 3-point-scale (preferring to be cooler, preferring no change or preferring to be warmer), and according to seven environmental and personal input features. The survey’s thermal TPV was used as the ground truth to train the models and later verify the predicted values. Instead of the thermal sensation vote (TSV) scale ― which is commonly used in thermal comfort studies ―, the thermal preference scale (TPV) was used because it not only represents a measure of what ideal conditions would be for each person, but also suggests to which direction the change is desired. This is particularly relevant when considering the use of these models for the control of Heating, Ventilation, and Air Conditioning systems. In addition, using TPV rather than TSV avoids the assumption of associating comfort with neutral thermal sensation, which may not always be true (Humphreys and Hancock, 2007).
The details of the algorithms and functions used in these models are presented in the next sections. Note that, in this study, following common practices in computer sciences studies, the input variables are called “features” and the thermal preferences classes corresponding to each of these combinations of input variables are called “labels”. The modelling process involves the following stages: (1) data set balancing and pre-processing; (2); model tuning and selection; and (3) model evaluation. Each of these phases are described in the next sections. Anaconda version 2019.3 (Anaconda, 2019) was used as the platform to run all models using Python version 3.7 and PyTorch tensor library (Paszke et al., 2017).
3.2. Input features selected for preliminary study
For this preliminary study, both environmental and personal variables were used as input features for the personalized models. In total, seven input variables were used, four of which representing the environmental conditions of participant’s rooms (i.e. dry bulb temperature, radiant temperature, relative humidity and air speed) and three of which representing participant’s personal characteristics (i.e. corrected metabolic rate, clothing level and health status). Note that the corrected metabolic rate variable was calculated from participant’s activity level survey answers. These were first converted to MET values according to the Compendium of Physical Activities (Ainsworth et al., 2011), and then later corrected based on participants’ sex, height, weight and age, according to Byrne et al. (2005) and Kozey et al. (2010) studies. Table 1 shows the activity level scale points and corresponding MET values.

Larissa Arakawa Martins, Veronica Soebarto, Terence Williamson and Dino Pisaniello
74
These seven variables were selected to cover a wide range of variables and factors known in the architectural science, medicine, and public health fields of study to influence thermal comfort, sensation, and preference. However, it is important to highlight that personal characteristics such as height, weight, or health status, although present in thermoregulation and physiology studies, are often overseen by architectural sciences and building systems engineering studies. Each input feature’s data collection tool and unit or scale is shown in Table 1.
Table 1: Input features and units or scales
Type Input features Data collection tool Unit or scale Environmental Dry Bulb
Temperature Environmental Radiant
Thermometer in Data logger °C
Globe thermometer in Data logger °C
Temperature Environmental Relative Humidity Hygrometer in Data logger % Environmental Air Speed Air speed sensor in Data logger m/s Personal Corrected
Metabolic Rate Survey in Thermal Comfort Tablet - “Describe your activity in the last 15 min in this space.”
Very relaxed activity = 1 MET1 2; Relaxed activity = 1.3 MET1 2; Light activity = 1.5 MET1 2; Moderate activity = 2.5 MET1 2; Active activity = 3.3 MET1 2
Personal Clothing Survey in Thermal Comfort Tablet - Very light = 1; Light = 2; Moderate = 3; Heavy = 4; “How are you currently dressed?” Very heavy = 5
Personal Health status Survey in Thermal Comfort Tablet - “How would you describe your health and wellbeing at the moment?”
1 MET values according to the Compendium of Physical Activities (Ainsworth et al., 2011).
Very good = 1; Good = 2; Reasonable = 3; Poor = 4; Very poor = 5
2 MET values corrected according to sex, height, weight and age, according to Byrne et al. (2005) and Kozey et al. (2010).
3.3. Participant selection for preliminary study
At the end the monitoring period, 10,787 survey votes were recorded from all 71 participants involved. For this preliminary study, however, only seven of these participants’ individual datasets were selected for modelling. These seven data sets represent the participants with (1) the highest vote count and (2) the most balanced individual data sets among the 71 involved. Having a balanced data set means voting in each thermal preference class (wanting to be warmer, no change, or cooler) with similar frequency. These criteria for participant selection were chosen because larger data set sizes and balanced class stratification can positively impact neural networks’ learning performance. In addition, these participants are diverse between each other, comprehending different age groups, weights, heights, health and frailty status, temperature preferences and climate zones of homes, all of which can provide relevant insights on the influence of personal parameters in thermal response. Note that the next phase of this study aims to analyse all 71 participants involved. Table 2 presents each of the selected participants’ personal characteristics.
Table 2: Selected participants’ personal characteristics, organized by age
ID Sex Age (years)
Height (cm)
Weight (kg)
BMI (kg/m2)
Frailty Score1 Preferred Temperature in Warm
Preferred Temperature in Cool
Climate Zone
Season (°C) Season (°C) 46 F 66 166.5 117.0 42.2 Not Frail 23.9 16.2 Csb 15 M 68 178.0 80.6 25.4 Not Frail 20.7 18.5 BSk

75
A deep learning approach to personal thermal comfort models for an ageing population
51 F 72 150.5 64.5 28.5 Apparently vulnerable 20.6 19.3 Csb 35 M 73 160.0 119.0 46.5 Mild Frailty 22.2 18.6 Csa 23 F 76 164.5 86.4 31.9 Apparently vulnerable 22.8 21.2 Csb 5 F 79 161.0 97.5 37.6 Not Frail 22.9 19.8 Csa 32 F 82 145.0 63.9 30.4 Apparently vulnerable 26.8 17.6 BSk
1 Assessed according to the Modified Reported Edmonton Scale (MRES) (Rose et al., 2018).
3.4. Data set balancing and pre-processing
Although the seven participants selected had the most balanced individual datasets, these datasets still exhibited unequal distributions in thermal preferences classes. Therefore, the datasets were randomly resampled to obtain classes with the exact same number of data points. This procedure consisted of sizing all majority classes according to the size of the minority class. Classes were also assigned a code from 0 to 2, where 0 is the preferring cooler class, 1 is the preferring no change class and 2 the preferring warmer class.
Finally, each input variable was normalized to a single range from 0 to 1. This created new values for the datapoints but maintained the general distribution and ratios in the original data. This avoids the different scales of each variable to influence the performance of the models.
3.5. Hyperparameters, model tuning, model selection and model evaluation
Deep learning algorithms have hyperparameters, which are settings used to control the model’s behaviour and capacity. These settings cannot be directly estimated from the data and are not learned by the training process, but rather appropriately chosen by the model’s developer while tuning different model options to select the best performing one.
In order to choose the best set of hyperparameters for a model, the first step is to divide the available data set into three separate subsets, namely training set, validation set and test set. The training set is the subset of examples, or data points, used for learning (i.e. fitting the internal coefficients or weights of the classifier). The validation set is the set of examples used to guide the selection of the hyperparameters of a classifier, a process also called as model tuning. Lastly, the test set is an independent subset of examples used only to assess the performance of a fully trained classifier. The purpose of the test set is to simulate the model with data it has never seen before. This test performance is also called the generalization performance (Ripley, 1996). In this study, these three subsets of data were divided as follows. First, each participants’ total datasets were randomly divided in two groups with 20% and 80% of the total data. The 20% portion was set aside as the test set. The remaining 80% of the data was then divided once again into two subsets with 70% being used for the training set and 30% for the validation set. The training and validation split was performed using 10 iterations of the Monte Carlo cross validation method. Note that the subsets splits were done in a stratified way, to maintain the balance of each subset, with the same number of data points for each classification category within the subsets.
Although deep learning algorithms have multiple hyperparameters to be tuned, this study selected 3 of them, which are known to have a higher effect on the model’s behaviour: (1) the learning rate of the optimization algorithm, (2) the number of hidden neurons in the neural network and (3) the batch size of each iteration. The learning rate was varied from 0.001 to 0.05. The number of hidden neurons in the hidden layer of the model was varied between 10, 15 and 20. Lastly, the batch size varied between 10 and 20 data points. Note that the varying ranges of the hyperparameters tuned were chosen according to common practice in computer science studies.

Larissa Arakawa Martins, Veronica Soebarto, Terence Williamson and Dino Pisaniello
76
All models use Rectified Linear Unit (ReLU) and Softmax (Agarap, 2018) as the activation functions between neural layers. The Stochastic Gradient Descent was used as the learning algorithm, and the Cross Entropy function was used to measure the loss – or error – of the classification rounds (Goodfellow et al., 2016). Considering the low number of input layers and the task undertaken by the model, the complexity of the neural network was kept to minimal, with only one hidden layer.
The following steps, based on the framework detailed by Raschka (2018), were used for the model tuning, selection and evaluation process of this study.
• Step 1: Each participant’s total dataset was divided into three subsets, a training set for modelfitting, a validation set for model selection, and a test set for model evaluation.
• Step 2 (model tuning): The learning algorithm is then used for different hyperparameter settingsto fit models to the training dataset.
• Step 3 (model selection): These models’ performances were evaluated using the validation set. The performance estimates were then compared, and the hyperparameters settings associated withthe best model performance were chosen. Note that each participants’ best performing modeland hyperparameters can differ between each other, depending on individuals’ data sizes,personal patterns, and data quality.
• Step 4: To increase the dataset and enhance the models’ performance, training and validation sets were then merged into one dataset and the best hyperparameter settings from the previous step were used to fit a new model to this larger dataset.
• Step 5 (model evaluation): Finally, the independent test set was used to estimate the generalizationperformance the model resulted from step 4.
• Step 6: The final model could then be trained with the use of all the dataset. Note that this finalstep was not performed in this preliminary study because the main objective was to test the model selection and evaluation rather than preparing for model deployment.
3.6. Performance indicators
The performance indicators used in steps 3 and 5 of the modelling methodology were the Testing Accuracy and the Cohen’s Kappa Coefficient. Testing Accuracy was calculated as the percentage of correct predictions in relation to the total number of predictions. The Cohen’s Kappa Coefficient (Cohen, 1960) is a measure of reliability for two classifiers that are rating the same thing, corrected to exclude the frequency in which the classifiers may agree by random chance. It is defined by Equation 1:
К= (рo - рe)/(1 - рe) (1)
Where рo is the relative agreement among classifiers, which is the same as the accuracy measure, and рe is the hypothetical probability of a chance agreement. The Cohen’s Kappa Coefficient ranges from negative values to 1, where 1 means perfect agreement, 0 means no agreement among the classifiers other than what would be expected by chance, and negative values mean the agreement is worse than random.
4. Results and discussionTable 3 presents a summary of the performance of each selected participant’s models in predicting thermal preference. The Validation Accuracy and Validation Cohen’s Kappa Coefficient shown in the table correspond to the model selection step (i.e. step 3) and represent the performance of the intermediate model with the best performing set of hyperparameters for each person. The Testing Accuracy and Testing Cohen’s Kappa Coefficient, as explained in step 5, represent the generalization

77
A deep learning approach to personal thermal comfort models for an ageing population
performance of the personalized models when using the merged training and validation sets for learning, and the test set for assessment.
As can be seen, the generalization accuracy of the personal comfort models analysed ranges from 60 to 100%, with a mean of 78.1%, and the Cohen’s Kappa indicator ranges from 0.4 to 1.0, with a mean of 0.7. According to Cohen (1960), a Cohen’s Kappa of 0.41 - 0.60 can be considered a moderate agreement between prediction and ground truth, 0.61 - 0.80 as substantial, and 0.81–1.00 as a perfect agreement. Therefore, the results of this preliminary study, although not optimal when considering the individual performances of ID 5 (60% accuracy and 0.4 Cohen’s Kappa) and ID 23’s (66.7% accuracy and 0.5 Cohen’s Kappa) models, for example, still show a significant improvement in performance when compared to other similar studies in the field. Liu et al. (2019), for instance, reported an average Cohen’s Kappa of 0.24 when analysing personal comfort models of 14 participants using different algorithms and input feature sets, in both indoor and outdoor environments. Likewise, Kim et al. (2018b) reported a slightly lower median accuracy of 73%, when considering the best performing algorithm from each of the 34 individual models developed.
Table 3 provides the prediction results of the PMV model for each of the selected participants. As the PMV uses a 7-point scale to predict thermal sensation, the results were converted into 3 thermal preference categories to enable a comparison, in the same scale, with the personal comfort models developed in this study. Therefore, when the PMV value is between 0.5 and −0.5, the votes are labelled as “no change”; when PMV > 0.5, the votes are labelled as “prefer to be cooler”; and when PMV < -0.5, the votes are labelled as “prefer to be warmer”. As seen in Table 3, on average, PMV predicted individual preferences with an accuracy of 46.1% and a Cohen’s Kappa indicator of 0.2 (i.e. slightly better than random guessing). In comparison, the personal comfort models improved the predictions of the PMV by 69% on average for the seven participants analysed.
The results also suggest that the models’ generalization performance may vary among participants, even after individual hyperparameter tuning. ID 32, for instance, reached the highest predictive performance with an accuracy of 100% and a Cohen’s Kappa of 1.0. ID 5, while on the other hand only reached an accuracy of 60% and a Cohen’s Kappa of 0.4 after several rounds of hyperparameter tuning. The poor performance of models such as the one from ID 5 might have been a result of a low sample size for training, the presence of anomalous data points, or the absence of input features that might also be influencing this particular person’s thermal preference. Furthermore, when considering diverse individuals such as older people, it is expected that these other intrinsic characteristics play different roles for each person in different intensities and frequencies. In addition, as pointed out by Liu et al. (2019), it is reasonable to expect that some individuals might be harder to predict than others.
Table 3: Performance of personal comfort models (PCM) and Predicted Mean Vote (PMV)
Person ID
Dataset size
Dataset size after balancing
PCM Validation Accuracy (%)
PCM Validation Cohen's Kappa
PCM Testing Accuracy (%)
PCM Testing Cohen's Kappa
PMV Accuracy (%)
PMV Cohen’s Kappa
5 215 75 60.0 0.4 60.0 0.4 54.4 0.3 15 139 60 67.3 0.5 91.7 0.9 45.3 0.2 23 204 75 76.1 0.6 66.7 0.5 43.6 0.1 32 218 75 77.8 0.7 100.0 1.0 33.5 -0.135 117 45 93.6 0.9 88.9 0.8 53.8 0.2 46 285 135 79.1 0.7 70.4 0.6 47.4 0.2 51 146 66 58.8 0.4 69.2 0.6 44.5 0.1 Mean 73.2 0.6 78.1 0.7 46.1 0.2

Larissa Arakawa Martins, Veronica Soebarto, Terence Williamson and Dino Pisaniello
78
Additionally, the results from the worse performing models indicate signs of overfitting. Observing the training learning curves of these models, which represent the training and testing loss by epoch (i.e. the number of passes of the entire dataset through the model), it can be seen that the gap between the training loss and the testing loss is significantly large. This means that the model has learned the training dataset too well, including errors in the data and possible statistical noise. As a result, the fit obtained is not able to produce accurate estimates on new observations that were not part of the original training dataset (James et al., 2013). Figure 1 exemplifies this hypothesis. When observing the learning curve from ID 23, who yield a Validation Cohen’s Kappa of 0.6 and a subsequent Testing Cohen’s Kappa of 0.5, it can be seen that the gap between the training and testing loss is vastly large compared to ID 32’s model, who reached the optimal performance. Possible reasons for overfitting could, again, be related to the small data size, the input features used or the cross validation procedure used. Moreover, overfitting might be a result of using a test set that does not represent well the entire dataset. Although strategies for preventing overfitting were explored in this study, such as early stopping, these models would still benefit from further explorations. Note that the scale of the x axis (number of epoch) and y axis (Loss) differ between ID 23 and ID 32 learning curves because each model is based in different data sets and hyperparameters. The images were added to highlight how overfitting can be identified, rather than a comparison between models.
Figure 1:Training learning curves for (a) ID 23 and (b) for ID 32.
5. Applications and next steps The personal comfort models derived from this study have the potential to be deployed in different scenarios. Considering the most commonly researched application of individualized thermal comfort models, the predictions yielded from these models could be used as control strategies for HVAC set points, closing the human-building interaction loop in built environments. Jung and Jazizadeh (2019), for instance, proposed an HVAC agent that decided the optimal temperature setpoint according to different personalized thermal profiles, using 3 different strategies, namely thermal vote-based predictions, thermal preference-based and the thermal preference and sensitivity-based. Likewise, Auffenberg et al. (2018) developed an HVAC control algorithm using personalized models to retain user comfort while also minimizing energy consumption. These models can also be integrated into personal comfort devices, allowing the conditioning of individuals in a more cost-effective scenario. Shetty et al. (2019), for example, learned individual desk fans usage patterns that could be used for smart and responsive indoor environment management. Kim et al. (2018b) explored the possibility of using heated chairs usage not only as a data collection tool for individual thermal responses, but also to manage individual thermal environments in a more efficient way.
Considering personalized models specifically designed for older people, the information gathered from this approach can lead to design guidelines that better orient thermal environment management

79
A deep learning approach to personal thermal comfort models for an ageing population
in older people’s houses. This could improve the quality of their dwellings, thus helping them to maintain their autonomy while ageing. Furthermore, individualized models can also provide a better understating of older people’s specific requirements, which could again lead to design guidelines for environments that directly meet their needs and therefore efficiently enhance their wellbeing.
From a public health perspective, the findings of this research could assist the development of more personalized health care systems, comprehending both public and private service providers. Personal models from individuals with similar characteristics and preferences could be used to create a set of different “profiles” or “personas”. This means individual models could be grouped according to trends between their statistically significant variables, allowing them to be applied to other individuals requiring only a small set of relevant information and no monitoring period. Therefore, individualized models could be applied in a broader sense, without, however, disregarding personal preferences.
It is important to highlight that modelling methodology, learning algorithms and input variables may differ depending on the complexity required for each sort of application envisioned. Therefore, the next steps of this research study aim to explore other possibilities of application and model development. The researchers intend to analyse details such as seasonal differences in individual comfort, other personal input features (e.g. skin temperature), as well as different feature combinations.
6. ConclusionResponding accurately to older people’s thermal preferences in their homes is essential to enable healthy ageing. In this paper, preliminary examples of personal comfort models for older people are explored as an alternative to the traditional comfort modelling approaches used in the field. Through the use of deep learning algorithms and both environmental and personal characteristics as modelling inputs, the results have so far indicated that the personal comfort models improved predictions by 69% on average for the seven participants analysed, when compared to the PMV models’ results. Such preliminary results indicate that approaching thermal comfort through individualized models can significantly improve comfort predictions of older people in their own homes. Furthermore, the outcomes of the study have provided relevant insights on the methodology chosen, leveraging deep learning as useful tool for thermal comfort model in the future.
Acknowledgements The authors thank all participants of the study. This study is supported by the Australian Research Council (project ARCDP180102019). LAM is a recipient of the Faculty of Professions Divisional Scholarship from The University of Adelaide, and the Australian Housing and Urban Research Institute Supplementary Top-up Scholarship. The project has approval from The University of Adelaide Human Research Ethics Committee (approval number H-2018-042).
References Agarap, A. F. M. (2018) Deep Learning using Rectified Linear Units (ReLU), eprint arXiv:1803.08375. Ainsworth, B. E., Haskell, W. L., Herrmann, S. D., Meckes, N., Jr, D. R. B., Tudor-Locke, C., Greer, J. L., Vezina, J., Whitt-
Glover, M. C. and Leon, A. S. (2011) 2011 Compendium of Physical Activities: a second update of codes and MET values. , Medicine and Science in Sports and Exercise, 43(8), 1575-1581.
Anaconda (2019) Anaconda Software Distribution. Computer software. Vers. 2019.03. Auffenberg, F., Snow, S., Stein, S. and Rogers, A. (2018) A Comfort-Based Approach to Smart Heating and Air
Conditioning, ACM Transactions on Intelligent Systems and Technology, 9(3), 1-20.

Larissa Arakawa Martins, Veronica Soebarto, Terence Williamson and Dino Pisaniello
80
Byrne, N. M., Hills, A. P., Hunter, G. R., Weinsier, R. L. and Schutz, Y. (2005) Metabolic equivalent: one size does not fit all, J. Appl. Physiol., 99(3), 1112-1119.
Cohen, J. (1960) A Coefficient of agreement for nominal scales, Educational and Psychological Measurement, XX(1). de Dear, R. and Brager, G. S. (1998) Developing an adaptive model of thermal comfort and preference, ASHRAE
Transactions, 104(1). Fanger, P. O. (1970) Thermal comfort Analysis and applications in environmental engineering, ed., McGraw-Hill Book
Company, New York. Goodfellow, I., Bengio, Y. and Courville, A. (2016) Deep Learning, ed., MIT Press, Cambridge. Humphreys, M., Nicol, F. and Roaf, S. (2016) Adaptive Thermal Comfort: Foundations and Analysis, ed., Routledge,
London. Humphreys, M. A. and Hancock, M. (2007) Do people like to feel ‘neutral’?, Energy and Buildings, 39(7), 867-874. James, G., Witten, D., Hastie, T. and Tibshirani, R. (2013) An Introduction to Statistical Learning: with Applications in
R, Springer Texts in Statistics, ed., Springer. Jung, W. and Jazizadeh, F. (2019) Comparative assessment of HVAC control strategies using personal thermal comfort
and sensitivity models, Building and Environment, 158, 104-119. Kim, J., Schiavon, S. and Brager, G. (2018a) Personal comfort models – A new paradigm in thermal comfort for
occupant-centric environmental control, Building and Environment, 132, 114-124. Kim, J., Zhou, Y., Schiavon, S., Raftery, P. and Brager, G. (2018b) Personal comfort models: Predicting individuals'
thermal preference using occupant heating and cooling behavior and machine learning, Building and Environment, 129, 96-106.
Kozey, S., Lyden, K., Staudenmayer, J. and Freedson, P. (2010) Errors in MET estimates of physical activities using 3.5 ml x kg(-1) x min(-1) as the baseline oxygen consumption. , J Phys Act Health, 7(4), 508-516.
LeCun, Y., Bengio, Y. and Hinton, G. (2015) Deep learning, Nature, 521(7553), 436-444. Liu, S., Schiavon, S., Das, H. P., Jin, M. and Spanos, C. J. (2019) Personal thermal comfort models with wearable
sensors, Building and Environment, 162. Paszke, A., Gross, S., Chintala, S., Chanan, G., Yang, E., DeVito, Z., Lin, Z., Desmaison, A., Antiga, L. and Lerer, A. (2017)
Automatic differentiation in PyTorch, 31st Conference on Neural Information Processing Systems (NIPS 2017), Long Beach, CA, USA.
Raschka, S. (2018) Model Evaluation, Model Selection, and Algorithm Selection in Machine Learning, ed., University of Wisconsin – Madison Department of Statistics.
Ripley, B. D. (1996) Pattern Recognition and Neural Networks, ed., Cambridge University Press. Rose, M., Yang, A., Welz, M., Masik, A. and Staples, M. (2018) Novel modification of the Reported Edmonton Frail
Scale, Australasian Journal on Ageing, 37(4), 305-308. Rupp, R. F., Vásquez, N. G. and Lamberts, R. (2015) A review of human thermal comfort in the built environment,
Energy and Buildings, 105, 178-205. Shetty, S. S., Hoang, D. C., Gupta, M. and Panda, S. K. (2019) Learning desk fan usage preferences for personalised
thermal comfort in shared offices using tree-based methods, Building and Environment, 149, 546-560. Soebarto, V., Bennetts, H., Hansen, A., Zuo, J., Williamson, T., Pisaniello, D., van Hoof, J. and Visvanathan, R. (2019a)
Living environment, heating-cooling behaviours and well-being: Survey of older South Australians, Building and Environment, 157, 215-226.
Soebarto, V., Williamson, T., Carre, A. and Arakawa Martins, L. (2019b) Understanding indoor environmental conditions and occupant’s responses in houses of older people, IOP Conference Series: Materials Science and Engineering, 609 042096. doi:10.1088/1757-899X/609/4/042096.
Tanita Corporation (2016) Innerscan Dual RD-953 Instruction Manual, Japan. van Hoof, J., Bennetts, H., Hansen, A., Kazak, J. K. and Soebarto, V. (2019) The Living Environment and Thermal
Behaviours of Older South Australians: A Multi-Focus Group Study,. International Journal of Environmental Research and Public Health, 16(6): 935. doi: 10.3390/ijerph16060935
World Health Organization (2015) World Report on Ageing and Health, Luxembourg.

81
The 54th International Conference of the Architectural Science Association (ANZAScA) 2020
A Framework for Optimizing Tall Building Form to Reduce Solar Reflection Impacts
Mahnaz Farahani1, Mohammadjavad Mahdavine2 and Peiman Pilechiha3
1, 2 Pars University of Architecture & Art, Tehra , Iran [email protected], [email protected] 2
3 Tarbiat Modares University, Tehran, Iran [email protected] 3
Abstract: Reflection of sunlight from tall buildings covered with glass facades creates many problems for residents and pedestrians in urban environments. Proper design in the early stages of construction can eliminate or reduce most of these problems and it can also considerably curb the environmental consequences and post-construction costs. Most of the research conducted in this field is focused on the façade materials to reduce or eliminate reflection and the existing body of research scarcely consider the design solutions in the early stage of design to minimize the effects of reflection. This study aims to provide a framework for simulation and optimization of solar reflection effect caused by the façades of tall buildings. The reflected sunlight from the studied façade of parametric forms were traced. Then the reflected points on surrounding and distances between them studied for each form. Finally genetic algorithm is adopted to find the optimum found with maximum distance between reflected points. The innovative proposed method can be applied to similar cases and it enables researchers and designers to analyze and optimize reflected sunlight.
Keywords: Glare; Solar Reflection; Ray-Tracing; Optimization.
1. IntroductionBuildings can influence the environment through the design of their façades. Reflective surfaces on the building façade can reflect the sunlight in urban environments and lead to different problems like over-reflection. The reflected sunlight from the façades can bother drivers, pedestrians, and residents and, in some cases, can lead to visual disorders. Development of new glass technologies has led to an increasing usage of glass on the façade of the buildings. Furthermore, high-reflection façades are increasingly used by designers to reduce energy consumption and facilitate cooling of the building during summer. The visible sunlight, which is beneficial for the indoor spaces, are mostly absorbed through the window glasses, but the solar rays are unwantedly reflected from the surface of the window. Hence, the sunlight is reflected in the street and the surrounding environment. Lack of precise material analysis can increase the reflection chance and create annoyance for the neighbours. In some extreme cases, there have been reports about burning of people’s hairs or melting of plastic glasses (Whitely, 2010). In most cases, these reflections are only an annoying sunlight, but these reflections have caused serious damages in recent years (Hayward, 2012), such as property damage (Wornick, 2012).
Despite potential dangers due to reflection, these problems are rarely considered in the early stages of the design. This is due to the fact the reflection effect from the façade of the buildings is a relatively new phenomenon and the process of testing the reflection has been difficult and almost impossible in the past years (Danks and Good, 2016). There have been growing concerns regarding light-reflection-related issues, especially in crowded cities with high glass-façade buildings (Schiler and Valmont, 2005). It has been noted that the façade of the building has various influences on visual and thermal comfort of the residents and the reflection poses threats to the comfort of the people living outside the building.
Imaginable Futures: Design Thinking, and the Scientific Method. 54th International Conference of the Architectural Science Association 2020, Ali Ghaffarianhoseini, et al (eds), pp. 81–90. © 2020 and published by the Architectural Science Association (ANZAScA).

Mahnaz Farahani, Mohammadjavad Mahdavine and Peiman Pilechiha
82
1.1. Review of Existing Literatures Regarding Reflected sunlight Some media reports have shown that sunlight reflected from newly-constructed buildings has caused various problems. Vdara Hotel in Las Vegas is another instance that reflects a considerable amount of sunlight off its southern façade, which has turned to a serious concern for the health and comfort of hotel customers near the pool (Mayerowitz, 2010). Walt Disney Concert Hall (WDCH) is another example of light reflection discomfort. Since its completion in 2004, WDCH has been a source of thermal and visual discomfort for residents. Research has shown that the temperature is more than 58°C near the building in the roadbed focal point (Suk, Schiler, et al. 2016). Other example include the Walkie-Talkie building, This building is a 160 m high skyscraper, located in the financial district of the City of London The construction work finished in 2014. News about plastic parts (wing mirror, panels, and badge) of a car parked at street level near the building being melted was first reported in early September 2013 (Verity, 2013). The south façade of the Walkie-Talkie has a concave shape covered with highly reflective glass panes to reduce the energy consumption inside the building. The architect of the building at 20 Fenchurch Street told the media that he knew reflected sunlight could cause problems but that there was a lack of tools and software to assess and prevent these problems. The actual temperature of hotspots induced by the building was more than twice as high as the estimated temperature (Wainwright, 2013( reports are suggesting that fixing the problem could cost millions of pounds. Potential long-term solutions could include treating the glass, applying an external film, adding external shading elements, or replacing one or more of the facades. The estimated costs of the solutions range from £60,000 to several million pounds, reported Building magazine. It seems that due to the problems caused by the reflection of sunlight during the day, these and similar buildings have been offered post-construction solutions, but these solutions create a lot of costs and It also affects the design of the building aesthetically, so providing solutions before construction and in the design, phase can prevent these problems.
Several strategies, such as changing the façade materials or adding louvre to the façade, have been applied to decrease the damaging façade reflections after it’s initially being noticed. Officials have enacted regulations to eliminate the problem of façade reflection in some countries and most of them are based on controlling the amount of reflected light from the construction materials. Several Australian cities have restricted the amount of reflection from the glass façade to a maximum of 20% and Sydney has achieved the highest restriction for the façade materials (Council, 2012).
On the other, researchers have proposed different methods for the evaluation of sunlight from the façade. Shih proposed a computer model for the absorbance of sun light reflected from the glass-façade of the buildings. Border of Reflection Area has been proposed as a functionality index to evaluate the glare which could simulates the received reflections. Quantitative evaluation finally led to suggestions like employing inclined walls.The limitation of this method is that reflectivity of façade material is not considered in the calculation and only simple massing geometry could be analyzed.
Analysis conducted by Hassall in 1991 estimated the brightness range for the comfort of drivers of vehicles 500 cd/ m². In addition to drivers and vehicles, this area will be satisfactory for pedestrians. In the study, the effect of glare on the residents of neighboring buildings has also been investigated (Hassall, 1991). In this method, the facades of a constructed building are imaged and the areas that are affected by the reflection of sunlight are identified. The application of this method is limited to built buildings and therefore can not predict the potential problems caused by sunlight reflected in the design phase. Another limitation of this approach is that it ignores the amount of time that reflections occur on adjacent buildings.
Due to the problems and lack of methods for simulating the reflection of sunlight from the facades of buildings, most of the research of researchers has been done on the built buildings and after the problems caused by the reflection of the sun and little research has been done on the pre-construction stage. Despite the expansion of high-rise buildings with glass facades and the emergence of problems mentioned earlier, one of the factors that can be considered in the design phase of such buildings is the study of the effect of light reflection from its facades. So there is a lack of a way to simulate and study the effects of light reflection.
1.2. Visual Glare Glare is a visual condition in which the discomfort of the capacity reduction to see the details of things is caused by the inappropriate distribution of light in the luminance threshold or the existence of high contrasts. Glare is a direct result of distribution of light in the eye, which reduces the luminance contrast of the eye (Brotas and Wienold, 2014). The glare in outdoor space is a topic worthy of attention, since not any acceptable indicator measuring the reflection glare in the outdoor space has been introduced. Glare in the outdoor space is the result of the unwanted light reflection from the façade, which leads to thermal and visual discomfort. This definition is similar to that of excessive light or light pollution produced by unwanted light in urban areas

83
A Framework for Optimizing Tall Building Form to Reduce Solar Reflection Impacts
during the night (Schiler and Valmont, 2005). Researchers believe that glare happens when the eyes are exposed to a distracting or blinking light. It is also a well-established fact that surfaces with higher luminance lead to glare regardless of the contrast level. Reflection is also classified as a bothering discomfort. Discomfort can be discussed in three parts: the process which creates the glare, the amount of glare perceived by the person, and the results of the glare (Jakubiec and Reinhart, 2010).
While excessive light and light pollution affect comfort, productivity and health at night, glare during the day also affects thermal or visual comfort and, in some cases, can influence both of them. Light pollution is appropriately discussed in the studies on current buildings and several regulations have been proposed, but the issue of glare in outdoor spaces has not been thoroughly discussed.
1.3. Glare-Causing Factors Unwanted reflection of sunlight can be considered as sun glare. However, the reflected light has several distinct features that distinguishes it from the sun as a glaring source. The features are as follows: The reflected sunlight happens unexpectedly in some situations, while the location and movement of the sun are predictable. The highest glare is due to new buildings and the people who have never experienced any problems before the establishment of the building encounter unexpected visual and thermal glare from the reflection of light from the building’s façade (Schiler and Valmont, 2005). The height of the neighboring buildings and their façade should be considered simultaneously according to the movement of the sun to obtain the potential sources of the reflection. The location of neighboring buildings, the geometry of the building, its nature, and occupancy type are among the vital issues and the method used for analysis is of the highest importance (Danks, Good et al. 2016). So the following key factors contributing to glare:
• The location of the sun in the sky • the location of the observer • the angle of reflection, type of the material
The location of the sun in the sky is one of the most important factors regarding glare. Unwanted reflections are mostly in low degrees of the sunlight. The reflections meet the sightline of the pedestrians and drivers lead to potentially dangerous eye distortions (Jung, 2010). As well, unlike an overhead solar angle, a glancing reflection will potentially travel further from the facade affecting a larger area of the surrounding urban areas and thus have a greater potential for offending neighbours. Therefore, the most “unruly” reflections from a visual glare standpoint will often occur while the sun is lower in the sky in the first few hours before sunset or after sunrise. Conversely, this also means that the impacts of visible reflections from overhead (southern, midday) can be less problematic as the angle of incidence is less likely to align with the required line of sight of a pedestrian or driver. However, it is important to note that the thermal impacts of reflections during midday periods are more of a concern due to the greater intensity of solar insolation at these times (Danks, Good et al. 2016).
Glare is also dependent on the sun angle and the angle from which the building is observed. The chance of glare is higher when the reflected light is in line with the viewing angle of the drivers. The reflection increases by up to 15% in the double-glazed glass. If the angle of the sun and the façade is 45 and 60 degrees, the reflection will be 22% and 49%, respectively. Existence of a glaring source on one side or higher than observer eye level can also increase the chance of glare. Generally, glare source positioned upper than 25° compared to the sightline can reduce the glare effect. The worst condition happens when the drivers move directly toward the building. In this condition, the light is directly reflected in the driver's eyes. This usually happens in the lower sections of the building (Corporation, 2017).
When there is a reflection in the façade, the reflected area may be a relatively small due to the ray concentration. This area creates various side-effects: damage to the eyes of people, especially the retina; burning of the skin due to touching fences or doorknobs; higher temperature in the building; damage to the paint of the cars. The reflection can also affect plastic, rubber, tar, and asphalt of the road and it is possible to see damages to the trash cans and other tools in the street. In some extreme cases, the reflection can lead to a fire. There is little convergence cause for the sunlight. This only happens when the building has elements with a concave form, which converge the light. This element can be in the plan or the cross-section of the building. Flat and convex façade can also lead to glare, but they do not converge the light. It should be noted that the reflections from concave façades are called deadly rays. Convex facades it should be noted that the reflections from concave façades are called deadly rays. Convex facades create scattered reflections and can affect various locations during the day. It should be noted that depending on the façade form glare can affect various.

Mahnaz Farahani, Mohammadjavad Mahdavine and Peiman Pilechiha
84
locations during the day. Although this kind of reflection affects less heat-related issues, it can lead to glare annoyance in a large area because of scattered light (Danks, Good et al. 2016). The flat façade reflects the light but does not concentrate it. The concave façade reflects the light but its reflection radius is different. The Concave façade converges the light and the reflection is concentrated on one location. Facade slope is another contributing factor that should be taken into consideration. For vertical facades, the worst condition happens when the sun approaches the earth. The façade with a backward slope can reflect the sunlight in more angles. This form is very acute since it is not expected by the drivers and the sunlight does not end until reaching the windshield of the car. The façade with a forward slope creates less reflection (Dwyer, 2013).
However, all buildings with concave façades do not lead to problems and the existence of different forms of facades differentiates them from other façades. Lack of uniformity in the façades creates several focal points instead of one significant point. These points usually reflect the light to the roofs of other neighboring houses and they are usually outside the pedestrian area. This can be done by changing the radius of the façade curve, using balconies and shades (Danks, Good et al. 2016). According to the literature, the methods currently used can increase the post-construction costs. It is possible to analyse and choose a suitable form to reduce the adverse effects of the reflection.
Figure 5: Light reflection from convex form (Danks, 2016) Figure 2: Light reflection from Concave form
According to what was mentioned above, the shape of the building, the position of the sun and the position of the observer are important and influential factors on the reflection of light from the building. By parametric simulation of these factors, the reflection of light from the building can be tracked and examined and a solution can be provided to reduce the reflection of light.
2. Methodology
2.1. Research Framework This study provides a framework to simulate sunlight reflection of studied building façade on its surroundings. Figure 3 illustrates proposed 4-step optimization framework.The first step is dedicated to identifying studied building form variables in a parametric model. This step helps considering various parameters, such as impure area, the height of the building, and the ratio of the area to volume to study their impacts on urban glare. Parametric model in this study is simulated in Grasshopper which is a visual programming language runs within the Rhinoceros. Selected form parameters in this study are the coordinates of the façade points in different levels. In the second step, sunlight simulation is conducted for each generated form and its surroundings. Sunlight simulation is the process in which the sun rays are followed before reaching the façade until they reflect on the surrounding area. This simulation helps identifying the sunlight reflected contact points on surrounding and studding the distance between them. The greater the distance between these points, the less glare this generated model produce. To Study the sun rays and their reflectance, Ladybug plugin used. So, the optimization objective in the third step is set on the maximum average distance between the second step points. This step is conducted by the Galapagos, adopting Genetic algorithm to find the optimum form. In the final step after the optimization process ends, the objective, parameters and the solutions are investigated more.

85
A Framework for Optimizing Tall Building Form to Reduce Solar Reflection Impacts
Figure 3: research proposed framework
2.2. Case Study Building To test the proposed framework a case study in Tehran, Iran has been chosen. Geographically, Tehran is located in the B category of the Koppen climate classification (dry), like most parts of Iran. The weather file used in this research is belongs to Mehrabad International Airport with the latitude of 35.683 and longitude of 51.317, located in an elevation of 1190.0 m. Figure 4 is illustrate a sun path diagram of Tehran, shows that the lowest altitude angle of the sun is 30 degrees which occurs in December 21. It is also noteworthy that on this day before 7:00 AM and after 4:45 PM, the lowest altitude angle is exist. The studied site area is 2813 m2 and is located near the main street and an alley (Figure 5). There are various commercial, residential, and official buildings in surroundings. The studied building has twenty-five storeys with 4 m height for each. The façade is covered by glass. The surrounding area is highly dense and the reflection effect of the glass façade can have negative visual effects on the surrounding buildings.
Figure 4: Sun Path Diagram for Tehran (www.HarvestingRainwater.com.)

Mahnaz Farahani, Mohammadjavad Mahdavine and Peiman Pilechiha
86
Figure 5: The information about the studied context. The studied building site is highlighted by red.
2.3. Objective Simulation and Optimization In this study, Rhinoceros 3D and its Grasshopper add-on were adopted to simulate several building form. Rhinoceros add-on lets designers discover various creative and new forms without having any programming knowledge. Changing the complex form using main parameters facilitates obtaining desired forms by the architect. It is interesting to note that the building form created by this software can be transferred to other energy analysis software thanks to Ladybug tools which is set of several environmental analyse tools.
Through Ladybug, ray tracing simulation method is adopted to evaluate the reflected sunlight from the façade. The colour, intensity, and orientation of the sunlight changes at different times and this makes it difficult to analyse it after reflection from the façade. Ray tracing is very useful in this situation and identifies the places that have been under the influence of the reflected sunlight. This method can trace the light all day and it can provide information about the amount of reflection in different seasons or each hour of day. The surrounding content of the studied building with a radius of 280 meters was modelled in Rhinoceros. The building has 25 stories with the total height of 100 meters. The geometrical plan of the building is considered a circle with a radius of 20.6 meters divided into 8 equal parts to select 8 points with equal distances. Then those 8 points were connected and created an octagonal structure. This octagon was copied vertically 5 times with a distance of 20 meters. The points on each curve were connected and the base form was made (Figure 4). These points are capable of moving from 0 to 3 meters in vertical and radial orientation. This has led to 192 different building forms.
Figure 6: Form the Modelling Process

87
A Framework for Optimizing Tall Building Form to Reduce Solar Reflection Impacts
After modelling the surrounding area and the building form, reflection simulation was conducted through Ladybug. The whether file (EPW file) of Tehran imported to Ladybug-Sunpath to trace the sun rays. As noted earlier, the lower the sun angle (winter and a couple hours after the sunrise and also before the sunset), the greater the chance of glare. Hence, the simulation times were set on the 22nd of September for 7, 8, and 10 AM and also noon and 2, 4, 5, and 6 PM (Figure 7). The reflected points were identified tracing the sun rays. The chance of glare are directly related to the density of the points on the surrounding surface. Increasing the distance of the point and reducing the density leads to a reduction in the heat effect. Hence, the distance of the points in the algorithm was calculated and the average distance of them was used as a function for optimization.
Figure 7: Ray Tracing after Hitting the Building and its Reflection on the Surrounding Area
Figure 8: The Reflection Angle on the Base Form at 7 AM, 12, and 4 PM.

Mahnaz Farahani, Mohammadjavad Mahdavine and Peiman Pilechiha
88
Figure 9: Instances of Form Change in the Optimization Process
Optimization was conducted in Galapagos which uses evolutionary algorithms to solve the problems. In this research, the genome are the surface points of the studied building, creating the several forms. The average distance of the points on surrounding area was set as fitness objective in the Galapagos set to be maximum. The location of the surface points, were captured and illustrated as graphs after optimization to find the best optimum form (Figures 10 and 11).
Figure 10: Radar Chart of the Final Optimized Form
Figure 11: Linear Graph of the Final Optimized Form

89
A Framework for Optimizing Tall Building Form to Reduce Solar Reflection Impacts
3. Results and DiscussionThe initial results of the base form simulation showed that the reflected point distribution in surrounding area were in radius form and point’s accumulation in some area were obvious. In this model, the lowest distance between two points was approximately zero and the highest was 4197 meters. The average distances after in optimize model are 1154 meters. Figure 9 illustrates the location (0 to 3) of each point (A to F) in each vertical level (1 to 8). Figure 11 compares movements on the levels in optimised form. The highest movement is belongs to the middle and base of the form.
Figure 11-A shows the scattering of the reflected points in the basic form at different times of the day. In this case, the scattering of the reflected points on the surrounding urban space is radial and concentrated in some places. However, in the optimized form of the building, the shape of Figure 11-B is a scattering of points with non-uniform distribution with appropriate distances, which has prevented the points from concentrating in one place. This facade has a zigzag form, which affects the scattering of the sun rays. Adopting different angles reduces chance of glare.As mentioned earlier, in research and measures, the lack of a suitable criterion for measuring the glare caused by sunlight reflection in urban spaces during the day and the lack of a suitable method for simulating light reflection in the design phase has led to the creation of predictions. Visual Glare is somewhat difficult and impossible in urban spaces. The method and model presented in this study, due to tracking sunlight and measuring the density of reflected points from the building facade in urban space, eliminates the need to have a standard for glare and also provides the possibility to both in the design and after construction. At different times, he simulated and calculated the creation of glare points due to light reflection.
Figure 11: Scattering of Points. A: Before Optimization, B: After Optimization

Mahnaz Farahani, Mohammadjavad Mahdavine and Peiman Pilechiha
90
4. ConclusionsThis study proposed a method for the simulation of sunlight reflection from the building in urban settings. Furthermore, this study also analysed the optimization of a high-rise building during the initial stages of design to reduce the effect of reflections. The optimization process includes parametric design, sunlight simulation, and form optimization with a genetic algorithm.
This method can generate a form with a less harmful for its surroundings according to the sunlight reflection. The function and efficacy of this method were analysed in a 25-floor office building with a glass façade in a dry climate. The parametric and flexible form generating method of this building made it possible to analyse the different distribution of sunlight reflection by a genetic algorithm.
The proposed framework in the Rhinoceros and Grasshopper helps the designers and researchers to have a better evaluation of the sunlight reflection from the façades at different times of the year. The result of the evaluation can be expanded and improved in the future, which can be done by adding various materials in the façade, analysis of different geometric shapes on the basic form, the influence of shading of buildings in this process, and applying this process to the building before its construction, problems caused by glaring and light reflection, and the addition of the heat produced due to the light reflection in the algorithm.
References Brotas, L. and J. Wienold (2014). Solar reflected Glare. 13th International Radiance Workshop 2014. Corporation, C.o.L. (2017). Solar Convergence, Guidelines and best practice for assessing solar convergence in
the City of London. C. o. L. Corporation. Council, S. (2012). "Sydney Development Control Plan 2012 Section 3 – General Provisions." Danks, R. and J. Good (2016). Urban Scale Simulations of Solar Reflections in the Built Environment: Methodology
& Validation. 2016 Proceedings of the Symposium on Simulation for Architecture and Urban Design. London. Danks, R., et al. (2016). "Assessing reflected sunlight from building facades: A literature review and proposed
criteria." Building and Environment 103: 193-202. Danks, R., et al. (2016). Avoiding the Dreaded Death Ray–Controlling Façade ReflectionsThrough Purposeful
Design. Façade Tectonics World Congress, Los Angeles, CA. Hassall, D. N. (1991). "Reflectivity: Dealing with rogue solar reflections." published by author. Hayward, M. (2012). "Airport controllers complain of solar panels’ glare."New Hampshire Union Leader 30. Jakubiec, A. and C. Reinhart (2010). The use of glare metrics in the design of daylit spaces: recommendations
for practice. 9th international Radiance workshop. Mayerowitz, S. (2010). "Vegas Hotel Pool ‘Death Ray’Burns Tourists." ABC News, September 28. Schiler, M. and E. Valmont (2005). Microclimatic Impact: Glare around the Walt Disney Concert Hall. Proceedings
of the Solar World Congress 2005 Joint American Solar Energy Society/International Solar Energy Society Conference.
Shih, N.-J. and Y.-S. Huang (2001). "A study of reflection glare in Taipei." Building Research & Information 29(1): 30-39.
Suk, J. Y., et al. (2016). DISCOMFORT GLARE METRICS. Building Research & InformationConference: Facade Tectonics World Congress, At Los Angeles, USA.
Verity, A. )2013(. “Who, What, Why: How Does a Skyscraper Melt a Car?.” Accessed November 3, 2015. http://www.bbc.co.uk/ news/magazine-23944679.
Wainwright, O. (2013). "Walkie Talkie architect “didn't realise it was going to be so hot”’." The Guardian 6. Whitely, J. (2010). "Vdara visitor:‘Death ray’scorched hair." Las Vegas Review-Journal. Wornick, S. (2012). "Melting cars, homes tied to energy-efficient windows. Retrieved from WCVB Boston."
http://www.wcvb.com/investigative/Melting-cars-homes-tied-to-energy-efficient- windows/15409652#!bDU8o6.

91
The 54th International Conference of the Architectural Science Association (ANZAScA) 2020
A Framework for Quantifying the Temporal Visual Experience of Architecture
A Case Study of the Sheikh Lotfollah Mosque
Sayyed Amir Hossain Maghool1, Marc Aurel Schnabel2 and Tane Moleta3 1, 2, 3 Victoria University of Wellington, Wellington, New Zealand
{sayyedamirhossain.maghool1, marcaurel.schnabel2, tane.moleta3}@vuw.ac.nz
Abstract: In this paper, we propose a framework for the quantification of the temporal visual experience of architecture. This framework provides quantification of low-level visual features of architectural experience in the temporal domain. It facilitates the investigation of the interrelation between architecture and automatic physiological responses, resulting in more insights about how architecture impacts emotion. Thus, we implement four computational algorithms developed upon the processing fluency theory which were initially used for the study of visual regularities of abstract artworks. Furthermore, we illustrate the potentials of this framework by applying it to data gathered from a VR simulation of an existing building. Our case study suggests that this framework can be used for systematic quantification of low-level visual features of architectural experience that account for the role of movement.
Keywords: Visual features; Virtual Reality; Architectural Experience; Fractal Dimension.
1. IntroductionArchitectural experience is generated as a result of humans’ perception of external information in the built environment through humans’ sensory systems. Review of empirical findings from the field of environmental psychology, aesthetics, and neuroscience reveals that, among all sensory mechanisms, vision is the dominant human sense that heavily influences humans’ affective system. As a result, a considerable amount of research has sought to find the interrelation between architecture and emotions evoked because of visual stimuli (Mehrabian and Russell, 1974; Bower et al., 2019). However, we still know little about this interrelation. With the recent advancement of technology such as virtual reality (VR) and photogrammetry, researchers and designers can visually simulate an experience of a building before its construction or accurately simulate the experience of existing buildings (Rushton and Schnabel, 2020) in a lab environment.
Conversely, computational methods have shown their capabilities in predicting human perception of visual stimuli in an objective way (Machado et al., 2015). To elaborate, quantification of low-level visual
Imaginable Futures: Design Thinking, and the Scientific Method. 54th International Conference of the Architectural Science Association 2020, Ali Ghaffarianhoseini, et al (eds), pp. 91–100. © 2020 and published by the Architectural Science Association (ANZAScA).

Sayyed Amir Hossain Maghool, Marc Aurel Schnabel and Tane Moleta
92
features (Mayer and Landwehr, 2018) provides potentials for decoding the link between humans’ preferences and their surrounding environment. In this paper, we present a framework that combines these two recent research streams into one system that can be used for a computerised quantification of the temporal visual experience of architecture. This framework employs VR and image processing techniques for quantifying temporal low-level visual features of architectural images. To the best of our knowledge, this is the first time that the human visual experience of architecture has been investigated using a VR setup through the concept of algorithmic quantification of multiple visual features.
2. The FrameworkTo quantify the visual features of architectural experiences, we propose a framework comprised of two main parts. The first part includes the acquisition of visual material from an architectural experience. This part introduces simulation of architectural experiences and a mechanism for extracting sequential visual data from it. The second part includes the extraction of low-level visual features on the material provided from the last part. For the second part, we propose the adoption of four algorithms introduced by Mayer and Landwehr (2018). These two combined parts produce valuable low-level time-series data about the visual perception of a building for a moving inhabitant. Later we will illustrate the potential of this framework by applying it to data gathered from a simulation of a specific architectural experience. We expect that quantification of low-level visual features of an architectural walk-through in time domain will facilitate the investigation of interrelation between architecture and automatic physiological responses, resulting in new insights about how architecture impacts emotion.
3. Acquisition of Sequential Visual Data of ArchitectureHumans are hardwired to make spontaneous unconscious reactions to their external world (Diano et al., 2017). Kandel et al. (2000) state that: ‘most of our impressions about the world and our memories of it are based on sight’ (cited in Hutmacher, 2019). It has been shown that even judgments about auditory information can be manipulated by exposure to different visual information (Tsay, 2013). Likewise, in most cases, architects are expected to design buildings that can be seen by humans’ visual system. Thus, many times, buildings are judged based on their visual features.
Similarly, many studies conducted at the intersection of psychology and neuroscience (Mehrabian and Russell, 1974) have attempted to conduct experiments to study the visual qualities of architecture using 2D architectural images. Although these studies provide insight into the interrelation between visual features of the surrounding environment and humans’ preferences, these studies are limited in terms of providing a comprehensive understanding of this enigmatic topic. It is mostly because these studies use orthogonal images as the foundational material for these investigations (Vaughan and Ostwald, 2014). Furthermore, the studies that have addressed this deficiency by using photographs or computer-generated human views of buildings (Vartanian et al., 2015; Choo et al., 2017; Jamalabadi et al., 2018) are limited in both scope and findings. To elaborate, it crucial to define the importance of movement in the perception of architecture. This is a critical component which is absent from much current literature.
As Rasmussen (1964) says, ‘It is not enough to see architecture; you must experience it’. In contrast to many other types of creative practice, the user of a space exposes him or herself to the various visual characteristics of space through movement around a building. As a matter of fact, ‘architecture owes its existence to form and space, whose perception owes a great deal to movement’ (Ahmadi, 2019). This characteristic has been discussed in critical architectural texts. Christopher Alexander argues how

93
A Framework for Quantifying the Temporal Visual Experience of Architecture
movement and spatial sequence regarding the parameter of time create the fourth dimension of our perceptual realm (Alexander et al., 1977, cited in Barrie, 1996). Similarly, Barrie (1996) argues how shifting view alongside variations of physical attributes of the surrounding environment are essential components of the experience of architecture. Correspondingly, modern theories of emotion emphasise the role of regularities and patterns in the stream of sensory information on triggering human emotional responses (Fridman et al., 2019). As Barrett (2017) argues, ‘the brain does not process individual stimuli—it processes events across temporal windows. Emotion perception is event perception, not object perception.’ In a research study, Vaughan and Ostwald (2014) use computer-generated images of an architectural experience based on a specific path inside Frank Lloyd Wright’s Robie House. In that work, they apply mathematical operations on 2D CAD images generated from a simulation of movement inside Robie House for investigation of change in the fractal dimension. However, the number of images, the method of simulation of the path of movement, and the abstract nature of the 2D perspective used for this purpose limits the findings of that piece of work. Following Vaughan and Ostwald’s (2014) argument and Barrett’s (2017) theory of emotion, we argue that a static perspective view is incapable of revealing the truth about architectural experiences.
A review of recent empirical literature illustrates that studies address this point by utilising in situ or VR tests that involve real movements to investigate the impact of architecture on observers (Homolja et al., 2020). Among all the presentation methods, VR can provide the richest simulation of an architectural space, because VR is effective in terms of evoking a sense of presence and is capable of conveying relatively accurate information about the scale and the size of a space (Cha et al., 2019). Additionally, VR is valuable because it provides an opportunity for users to walk inside architectural spaces naturally. To address the importance of movement in the perception of architecture in our framework, screen records of what a person is looking at during an immersive architectural experience simulation will be extracted for further analyses, as explained in the next section.
4. Visual Features ExtractionSince humans’ visual perception system has evolved through the evolution process, some theories state that the presence of some visual statistical regularities can impact humans emotionally (Graham and Field, 2007). Based on the understanding of emotion and affect state explained earlier, the question here is which visual characteristics of the surrounding environmental setting can trigger unconscious affective responses? Moreover, how can we effectively decode those characteristics? In an attempt to answer these questions, a well-established body of knowledge from the fields close to architecture has already proposed a series of methods for decoding low-level visual stimuli (El-gayar et al., 2013; Lin et al. 2018). These methods shed light on the possibility of using computational power to gain a deeper understanding of architecture that accounts for the role of human visual perception as an integral parameter of the human-environment equation.
In this part, we explain four computerized algorithms that can provide objective and repeatable indicators for temporal visual regularities of interior architecture. The rationale behind how these visual features are linked to human perception and aesthetic preferences are discussed more in-depth in Mayer and Landwehr’s article (2018). In that article, the authors describe how they have adopted the “processing fluency theory” to explain the psychological mechanism of these algorithms, which decode low-level visual features. Here we provide a brief explanation about each of these features and how we have utilised them for the benefit of our framework.

Sayyed Amir Hossain Maghool, Marc Aurel Schnabel and Tane Moleta
94
4.1. The Measure of Self-Similarity (Fractal Dimension)
Self-similarity can be defined as the level of the resemblance of a form to its components. It has been suggested that humans are more efficient while processing visual stimuli with fractal characteristics (Menzel et al., 2015) and show a preference for it. Also, it has been proposed that people express preferences for fractal-like patterns in the context of architecture (Sala, 2003, 2006). Likewise, Hagerhall et al. (2004), which investigated the fractal dimension of landscape silhouette as a correlate of landscape preferences, state that “fractal dimension could provide part of the explanation to the well- documented connection between preference and naturalness.” Fractal dimension can be systematically quantified using a technique named Power Spectral Analysis (PSA). It has been found that for a 2D image, the fractal dimension is a linear function of the slope of a line that is fitted to the log-log graph of spatial frequency amplitude spectrum (Graham and Field, 2007). Moreover, the visual structure of natural images computed via PSA tends to show a 1/f2 characteristic (Mayer and Landwehr, 2018). To elaborate, when the rotational average of the PSA (Ruzanski, 2020) is plotted against frequency on a log- log plane, a slope close to -2 is expected for images that have similar visual regularities to natural images.
4.2. The Measure of Visual Complexity
Simple visual data contain little information, and as a result, they need less cognitive processes. In contrast, complex images have more information and are subject to less information fluency (Reber et al., 2004). Mayer and Landwehr (2018) introduce visual complexity and visual simplicity as another low- level measure for information embedded in a visual stimulus. There are some pieces of evidence of how variation in the level of visual information rate can positively influence an observer’s preference toward a stimulus (Grütter, 1987). For instance, it has been shown that more straightforward sequences of visual stimuli are less pleasant compared to complex stimuli, as their information rate decline over time (Berlyne, 1970). In the context of architecture, visual complexity can be manipulated with different design decisions such as the amount and diversity of decoration and ornamentation contained in a space. Jang et al. (2018), which have studied the impact of visual complexity of store designs on consumer responses, argue that visual complexity of an interior form triggers higher emotional arousal in users of a space.
Furthermore, visual complexity has been quantified through the concept of algorithmic information theory. According to empirical studies, visual metrics such as edge density and the size of 2D image files after applying compression methods have been shown to be efficient indicators for the level of visual complexity (Fernandez-Lozano et al., 2019). Similarly, Mayer and Landwehr (2018) state that ‘... picture simplicity can be measured accurately by image compression rates because complex images are denser and have fewer redundancies than simple images’. They propose a standardised way of using the file size of compressed images to measure visual complexity with an algorithmic approach. Since it is difficult for a regular person to grasp the logic behind this method, we replaced this algorithm with an edge density algorithm that has also been shown as a strong predictor of human complexity perception (Machado et al., 2015).
4.3. The Measure of Symmetry
Visual symmetry can be defined as ‘the similarity of part of an image under transformations such as translation or reflection’ (Mayer and Landwehr, 2018). A picture or an image is symmetrical when it is

95
A Framework for Quantifying the Temporal Visual Experience of Architecture
mirrored along one axis or multiple axes. In addition to its use in architecture, symmetry plays an essential role in nature, industry, and art (Enquist and Arak, 1994). Symmetry affects aesthetic judgement (Gartus and Leder, 2013), perhaps because the presence of symmetry causes a sense of balance or equilibrium in architecture (Williams, 1999).
Humans are hardwired to react to visual symmetry; they are highly proficient at the perception and detection of symmetry (Treder, 2010). Following Mayer and Landwehr’s procedure, it is possible to measure visual symmetry using computational algorithms. To achieve that an image can be split into two separate pieces along the middle vertical axis. Then, the correlation between the values of each part will be used as an indicator of vertical symmetry. Through our test, we only examined global vertical symmetry; however, other types of symmetry can be evaluated using similar algorithms.
4.4. The Measure of Contrast
According to Mayer and Landwehr (2018), the contrast of visual stimuli is not a well-defined topic in visual data quantification literature. However, it can be described as the extent to which the components of an image have a similar level of luminance. Furthermore, Näsänen et al. (2001) suggest that contrast of stimuli has a strong effect on the speed of eye movement in visual tasks, which provides evidence of the interrelation between this low-level feature and unconscious body reactions.
Mayer and Landwehr (2018) argue that measuring contrast via measuring root mean squared (RMS) of all pixels in an image provides valuable insight into the fluency of an image. Likewise, we developed an algorithm to measure the level of contrast for computing low-level visual data in our framework. We predict that the contrast feature in the immediate surroundings caused by various architectural decisions plays an essential role in the perception of architecture.
5. Case Study of the Sheikh Lotfollah MosqueTo test the computerized version of algorithms mentioned above, we conducted a case study. The building used to test this approach is the Sheikh Lotfollah Mosque constructed in the 16th century in Isfahan, Iran. We selected this building since it is rich in terms of visual elements such as the ornamentations which are inspired by Mandalas art. Another motivation for selecting this building is that it is designed in a way that there is only one way of entering and exiting the building. Therefore, the path of movement for this building is well defined.
First, to create a virtual simulation of this building, we generated a 3D model using the photogrammetry technique (Schnabel and Aydin, 2015). To achieve that, we collected 3111 images of the building. ‘Meshroom’ photogrammetry software has been used for generating a 3D model of the mosque based on those photos. Later, we re-scaled and cleaned up the 3D model by utilising Autodesk 3DS MAX 2018 and Autodesk Meshmixer. Finally, the model was imported to Unreal Engine 4 to generate an immersive VR experience.
To extract visual material of the field of view (FOV) through the test, we attached a virtual camera to the VR user’s head location. A module was coded to store the location and rotation of that virtual camera during the testing session. Later, we used the recorded tracking data to extract a perspective view of the user during the duration of the experience. We exported the visual data presented in the user’s FOV during the VR exploration to image files formatted as PNG at the temporal rate of 30Hz.

Sayyed Amir Hossain Maghool, Marc Aurel Schnabel and Tane Moleta
96
One of the authors of this paper was asked to wear an HTC VIVE PRO EYE and walk naturally through the VE. This natural movement occurred at three sub-pathways of the building (Figure 1): The entrance, hallway, and the main hall. It produced 800 distinct time-stamped PNG files for each of the three spaces (total number of 2400 images). We converted the images to the greyscale using OpenCV’s “rgb2gray” function to standardise the data and make analyses more time-efficient. Alongside that, we lowered the resolution to 1920*1080 pixels. Also, since our visual similarity algorithm works better on square images, we cropped all images to a square shape (1080*1080 pixels).
To implement the second part of the framework, the four computational algorithms for quantifying low-level visual features were applied to all images. It has been achieved by using OpenCV library for Python and a series of Python modules developed by the authors of this paper based on the instructions provided in (Mayer and Landwehr, 2018) and (Machado et al., 2015).
6. Results
Figure 1: The path of movement.
Figure 1 shows the schematic path of movement of the user inside the virtual simulation of the Sheikh Lotfollah Mosque. The values of each visual parameter calculated for each of the 2400 images are presented in Figure 2. To remove noise from the data, we applied a temporal noise filter with a window size of 100 frames. The data visualised in Figure 2 reveals that most of the visual features during the exploration of the Sheikh Lotfollah Mosque vary over time, especially while transitioning between different spaces (at frames 800 and 1600). The overall trend in the variations of the features alongside the data trends for each space is captured by fitting a linear regression model to the data using the “polyfit” function of the NumPy library for Python. The coefficient of the regression line indicates whether there is an overall increase or decrease associated with any of the features for the duration of the test.
In general, as illustrated in Figure 2, there is a significant increase over self-similarity characteristics from the beginning to the end of the test. The path starts with a medium degree of fractal dimension. After entering the second space, the overall value of this parameter increases slightly, but with less fluctuations compared to the previous space. Interestingly, there is a significant increase in this value when users enter the main hall. It seems that this measure is influenced by the geometry of decoration

97
A Framework for Quantifying the Temporal Visual Experience of Architecture
and ornamentation designed in each space. The highest points in the graph relate to the situations where the user is looking toward the decoration of the dome in the main hall.
According to Figure 2, visual complexity calculated via edge density has an overall increase. Also, a clear change in the visual complexity of the space is demonstrated while entering the main hall; A significant increase in visual complexity at the 1600th frame is noticeable. Like the self-similarity parameter, the geometry and richness of the decorations in the main hall are the primary reasons for this increase (Figure 2). Interestingly, although visual complexity and self-similarity measure different visual features, there are similar behaviours for both measures on the data analysed.
Furthermore, the building’s physically symmetrical attributes are reflected through analyses of vertical symmetry on image sequences. It seems that there is no noticeable overall trend in this parameter while looking at the slope of the fitted line into all data. There is a big decrease in measure vertical symmetry around the 1500th data-point. Interestingly, this fluctuation is happening when the user enters the main hall.
An analysis of the contrast feature (Figure 2) reveals that there is a marginal decline over this parameter for the whole experience. However, the difference between the level of contrast is more apparent within adjacent spaces. To elaborate, entering the hallway decreases the level of contrast significantly. Moreover, by entering the next space, we can observe an overall increase over the same feature. The variation of contrast seems to be a function of the number and the size of openings for each space. In this building, there are 18 small shaded openings and one big opening for the main hall compared to the three small shaded openings of the whole hallway. Also, this parameter can be a function of the lightness of the materials used on the interior surface of the space.
7. Discussion and ConclusionIn this paper, we presented a framework that is designed to address the challenge of quantification of architectural experiences. The effectiveness of this framework for computing the visual aspect of the architectural experience has been demonstrated via a case study. The use of VR as a medium to conduct a simulation of movement inside a virtual building provided an opportunity for a systematic investigation of visual features associated with the experience of Sheikh Lotfollah Mosque.
Data provided from this framework reveals how low-level visual features of a building can vary because of the movement inside the building. It is noteworthy to mention that the current version of this framework is capable of capturing part of the visual features of a space. However, there are no limits to implementing more algorithms to capture other low-level visual features. Concretely, data provided via this framework can be combined with objective physiological data (bio-signals) and subjective data about affect (pleasure, dominance, and arousal) to find patterns between the sequence of visual features and corresponding emotion and affect responses in architecture (Maghool et al., 2020). This task can be done by employing machine learning algorithms that create multi-variable mathematical models.
It is noteworthy to mention that although we have used VR for collecting the sequence of visual data during an architectural experience, the same computation can be applied for real exploration of existing buildings. Therefore, a method should be implemented to record what a person is looking at during the exploration of the building. Finally, we expect that using eye-trackers will refine this framework by providing more accurate data about the exact visual stimuli at each instance of time during an architectural experience in VR or a real environment.

Sayyed Amir Hossain Maghool, Marc Aurel Schnabel and Tane Moleta
98
Figure 2: The edge detection and PSA algorithms applied on three images from each of the three spaces (left side). Time-series data produced after applying four algorithms on all images (right side).

99
A Framework for Quantifying the Temporal Visual Experience of Architecture
Acknowledgements We wish to thank Mr Yazdirad for his help in providing a part of the materials used in the photogrammetry process of Sheikh Lotfollah Mosque.
References Ahmadi, M. (2019) The experience of movement in the built form and space: A framework for movement evaluation
in architecture, Cogent Arts & Humanities, 6(1), 1588090. Alexander, C., Ishikawa, S., Silverstein, M., Jacobson, M., Fiksdahl-King, I. and Angel, S. (1977) A Pattern Language:
Towns, Buildings, Construction, ed., Oxford University Press, New York. Barrett, L. F. (2017) The theory of constructed emotion: an active inference account of interoception and
categorization, Social Cognitive and Affective Neuroscience, 12(1), 1-23. Barrie, T. (1996) Spiritual Path, Sacred Place: Myth, Ritual, and Meaning in Architecture, ed., Shambhala. Berlyne, D.E. (1970) Novelty, complexity, and hedonic value, Perception & Psychophysics, 8(5), 279-286. Bower, I., Tucker, R. and Enticott, P. G. (2019) Impact of built environment design on emotion measured via
neurophysiological correlates and subjective indicators: A systematic review, Journal of Environmental Psychology, 66.
Cha, S.H., Koo, C., Kim, T.W. and Hong, T. (2019) Spatial perception of ceiling height and type variation in immersive virtual environments, Building and Environment, 163, 106285.
Choo, H., Nasar, J.L., Nikrahei, B. and Walther, D.B. (2017) Neural codes of seeing architectural styles, Scientific Reports, 7(1), 40201.
Diano, M., Celeghin, A., Bagnis, A. and Tamietto, M. (2016) Amygdala Response to Emotional Stimuli without Awareness: Facts and Interpretations, Frontiers in Psychology, 7, 2029.
El-Gayar, M., Soliman, H. H. and Meky, N. (2013) A comparative study of image low level feature extraction algorithms, Egyptian Informatics Journal, 14(2), 175-181.
Enquist, M. and Arak, A. (1994) Symmetry, beauty and evolution, Nature, 372(6502), 169-172. Fernandez-Lozano, C., Carballal, A., Machado, P., Santos, A. and Romero, J. (2019) Visual complexity modelling
based on image features fusion of multiple kernels, PeerJ, 7:e7075. Fridman, J., Barrett, L. F., Wormwood, J. B. and Quigley, K. S. (2019) Applying the Theory of Constructed Emotion to
Police Decision Making, Frontiers in Psychology, 10, 1946. Gartus, A. and Leder, H. (2013) The small step toward asymmetry: Aesthetic judgment of broken symmetries, i-
Perception, 4(5), 361-364. Graham, D. J. and Field, D. J. (2007) Statistical regularities of art images and natural scenes: spectra, sparseness and
nonlinearities, Spatial Vision, 21(1-2), 149-164. Grütter, J. K. (1987) Ästhetik der Architektur: Grundlagen der Architektur-Wahrnehmung, ed., W. Kohlhammer. Hagerhall, C. M., Purcell, T. and Taylor, R. (2004) Fractal dimension of landscape silhouette outlines as a predictor of
landscape preference, Journal of Environmental Psychology, 24(2), 247-255. Homolja, M., Maghool, S. A. H. and Schnabel, M. A. (2020) The Impact of Moving through the Built Environment on
Emotional and Neurophysiological State: a Systematic Literature Review, RE: Anthropocene - Design in the Age of Humans - Proceedings of the 25th CAADRIA Conference, 643-652.
Hutmacher, F. (2019) Why Is There So Much More Research on Vision Than on Any Other Sensory Modality?, Frontiers in Psychology, 10, 2246.
Jamalabadi, H., Alizadeh, S., Schönauer, M., Leibold, C. and Gais, S. (2018) Multivariate classification of neuroimaging data with nested subclasses: Biased accuracy and implications for hypothesis testing, PLOS Computational Biology, 14(9), e1006486.
Jang, J. Y., Baek, E., Yoon, S. and Choo, H. J. (2018) Store Design: Visual Complexity and Consumer Responses, International Journal of Design, 12(2).

Sayyed Amir Hossain Maghool, Marc Aurel Schnabel and Tane Moleta
100
Kandel, E. R., Schwartz, J. H., Jessell, T. M., Siegelbaum, S. A. and Hudspeth, A. J. (2012) Principles of Neural Science, Fifth Edition, 5th Edition ed., McGraw-Hill Education / Medical.
Lin, S., Zhenguo, X., Xiangzeng, M. and Wu, A.-G. (2018) Emotional Semantic Recognition of Visual Scene in Flash Animation, Journal of Control Science and Engineering, 3768741.
Machado, P., Romero, J., Nadal, M., Santos, A., Correia, J. and Carballal, A. (2015) Computerized measures of visual complexity, Acta Psychologica, 160, 43-57.
Maghool, S. A. H., Homolja, M. and Schnabel, M. A. (2020) Cybernetics Approach to Virtual Emotional Spaces - An Electrodermal Activity Actuated Adaptive Space, Anthropologic: Architecture and Fabrication in the Cognitive Age (Proceedings of the 38th eCAADe Conference), 537-546.
Mayer, S. and Landwehr, J. R. (2018) Quantifying visual aesthetics based on processing fluency theory: Four algorithmic measures for antecedents of aesthetic preferences, Psychology of Aesthetics Creativity and the Arts, 12(4), 399-431.
Mehrabian, A. and Russell, J. A. (1980) An Approach to Environmental Psychology, ed., The MIT Press, Cambridge, Mass.
Menzel, C., Hayn-Leichsenring, G. U., Langner, O., Wiese, H. and Redies, C. (2015) Fourier power spectrum characteristics of face photographs: attractiveness perception depends on low-level image properties, PloS One, 10(4), e0122801.
Näsänen, R., Ojanpää, H. and Kojo, I. (2001) Effect of stimulus contrast on performance and eye movements in visual research, Vision Research, 41(14), 1817-1824.
Rasmussen, S. E. (1964) Experiencing Architecture, 2nd Edition ed., The MIT Press, Cambridge, Mass. Reber, R., Schwarz, N. and Winkielman, P. (2016) Processing Fluency and Aesthetic Pleasure: Is Beauty in the
Perceiver's Processing Experience?, Personality and Social Psychology Review, 8(4), 364-382. Rushton, H. and Schnabel, M. A. (2020) Immersive Architectural Legacies: The Construction of Meaning in Virtual
Realities, Visual Heritage in the Digital Age, Springer. Ruzanski, E. (2020) Radially averaged power spectrum of 2D real-valued matrix, MATLAB Central File Exchange,
Retrieved November 12, 2020. Sala, N. (2003) Fractal Geometry And Self-Similarity In Architecture: An Overview Across The Centuries, Isama- Bridge
2003 Conference. 235–244. Sala, N. (2006) Fractal Geometry and Architecture: Some Interesting Connections, WIT Transactions on The Built
Environment, 86, 163–173. Schnabel, M.A. and Aydin, S. (2015) Amphiboly of Digital Heritage, in G. Guidi, R. Scopigno, J.C. Torres, H. Graf (eds.),
2nd International Congress on Digital Heritage 2015, VSMM, EUROGRAPHICS, CIPA ICOMOS/ISPRS, IEEE, Granada, 2, 129–132.
Treder, M. S. (2010) Behind the Looking-Glass: A Review on Human Symmetry Perception, Symmetry, 2(3), 1510- 1543.
Tsay, C.-J. (2013) Sight over sound in the judgment of music performance, Proceedings of the National Academy of Sciences of the United States of America, 110(36), 14580-14585.
Vartanian, O., Navarrete, G., Chatterjee, A., Fich, L. B., Gonzalez-Mora, J. L., Leder, H., Modroño, C., Nadal, M., Rostrup, N. and Skov, M. (2015) Architectural design and the brain: Effects of ceiling height and perceived enclosure on beauty judgments and approach-avoidance decisions, Journal of Environmental Psychology, 41, 10- 18.
Vaughan, J. and Ostwald, M. J. (2014) Quantifying the changing visual experience of architecture: combining movement with visual complexity, Across: Architectural Research through to Practice: 48th International Conference of the Architectural Science Association 2014, 557–568.
Williams, K. (1999) Symmetry in Architecture.

101
The 54th International Conference of the Architectural Science Association (ANZAScA) 2020
A Framework to Assess Publicness in Multicultural Streets
Maryam Lesan, Babol Noshirvani University of Technology, Babol, Iran
Abstract: Public space is the domain of interest for urban designers and streets are one of the most relevant forms of public space. In multicultural societies, public space users come from a diverse range of social and ethnic backgrounds with varying interests and needs. Therefore, streets should act as inclusive spaces that are intended for use by a broader public. While the streets may be public, to what extent is it their publicness that plays a significant role in promoting multiculturalism? This paper aims to develop a framework for assessing publicness in streets in multicultural societies. In other words, it responds to the question of “what constitutes a good and ideal model of publicness (regarding cultural diversity) of streets in multicultural societies”. The study builds on the dimensions of publicness described by previous models and adjusts it to the street environment. The central dimensions of publicness include: accessibility, management, and inclusiveness.
Keywords: Streets, Multiculturalism, Publicness, Cultural Diversity
1. IntroductionPublic spaces are known as the ‘theatre of everyday life’ where individuals and groups can observe
and encounter other people beyond their normal circle of acquaintances, people who might have different customs, behaviours and cultures (Berman, 1986; Shaftoe, 2009; Walzer, 1986; Young, 1990). One way to promote social tolerance of diverse communities and peaceful relationships between people is to ensure that urban spaces where all groups join each other and mingle remain public and open. Such places allow for everyone to learn, recreate, and relax, where “interpersonal and intergroup cooperation and conflict can be worked out in a safe and public forum” (Low, Taplin, & Scheld, 2005, p. 3). Good quality public spaces are known as spaces that are multicultural “where ethnically and culturally diverse groups can co-exist peacefully” (Mulgan et al., 2006, p. 28). In diverse multicultural societies the design of public space becomes more challenging since people from different ethnicity, age and socio-economic backgrounds have special space requirements for their preferred activities (Carr, Francis, Rivlin, & Stone, 1992) and ``symbols are neither fixed nor shared`` between different cultures (Rapoport, 1982, p. 45).
Imaginable Futures: Design Thinking, and the Scientific Method. 54th International Conference of the Architectural Science Association 2020, Ali Ghaffarianhoseini, et al (eds), pp. 101–110© 2020 and published by the Architectural Science Association (ANZAScA).

Maryam Lesan
102
Streets and their footpaths represent an important part of urban public open space systems and have a significant role in enriching public life of cities. Many urban scholars and practitioners have stressed the importance of streets as social spaces in addition to their role as movement channels (Appleyard, 1981; A. Jacobs, 1993; J. Jacobs, 1961; Mehta, 2013). Streets can provide a means for sociability, including arange of passive and active encounters, each of which can also be formal or casual. Therefore, as withother urban public spaces, streets can be places to encounter differences, to educate and learn aboutdifferent viewpoints, to tolerate and to resolve conflict (Mehta, 2013). In order to allow for a civilizingsocial life and social encounter among citizens, streets in multicultural societies need to be open andinclusive to a wide breadth of ethnic groups. The term “democratic street” was first coined by MarkFrancis (1987) in the field of urban design. Francis defines “Democratic streets" as “streets that are wellused, have meaning for people, invite access for all, encourage use and direct participation, provideopportunities for discovery and adventure, are loved, and are well cared for and locally controlled”. Heargues the fact that “street democracy” grows out of the concept of publicness.
Publicness is a quality that evaluates the public character of public spaces. Publicly accessible places are where all members of the public engage in different types of activities (Mitchell, 2003). Few studies in urban design address the subject of culture-related social behaviour with reference to the street. This research interrogates the idea that streets are public spaces capable of fostering multiculturalism. But what are the characteristics of streets in multicultural societies that make them become more or less public? How do streets meet the goal of publicness in multicultural societies? The aim of this paper is to develop a framework for assessing publicness in streets in multicultural societies. The proposed model gives a new insight into the assessment of multicultural streets.
2. The dimensions of publicnessScholars and urban practitioners have developed specific dimensions to assess and evaluate the publicness of public spaces. The main dimensions of publicness have been defined by various commentators. These dimensions are slightly different, although there is a high degree of congruence among them and with definitions of public space, as this term includes the concept of publicness. Madanipour (1999) develops a framework provided by Benn and Gauss (1983) and highlights “access”, “agency”, and “interest” as the main dimensions of publicness. Access refers to having access to a place and activities within, agency relates to the consequences of control and decision making of an agent (acting privately or on behalf of a community), and interest refers to the targeted recipients of particular engagements impacting on a place. Kohn (2004, p. 11) identifies “ownership”, “accessibility”, “inter- subjectivity” as the main dimensions of public space. The term inter-subjectivity relates to the types of encounters and interactions that are supported in the place. Franck and Paxon (1989) claim that the publicness of public spaces is based on a range of characteristics, which include design, location and provision/management. Del Magalhães (2010) suggests rights of access, rights of use and ownership/control as the dimensions that determine the public character of public spaces. Nemeth and Schmidt (2011) propose a model that categorises publicness as the interaction between ownership, management and uses/users of a space. Varna and Tiesdell (2010) provide a more in depth and situated exploration of publicness of public spaces. They identify ownership, control, civility, physical configuration and animation as the five key dimensions of publicness. Each dimension ranges from more public to less public. Ownership refers to the legal status of a place. The dimension of control refers to the presence of an explicit control; civility refers to the management and maintenance of a space; physical configuration refers to macro scale design-oriented dimensions of publicness and animation is a

103
A Framework to Assess Publicness in Multicultural Streets
design-oriented dimension which regards micro design of a space. Langstraat and Van Melik (2013) provide the OMAI model. They summarise the main indicators of publicness as Ownership, Management, Accessibility and Inclusiveness. (ie OMAI). Ownership refers to the legal status of a place. Management refers to maintenance and civility of a space; it also comprises the practices of control such as the presence of CCTV or security guards. Accessibility refers to the physical connectivity of a place as well as the design of the place itself. Inclusiveness is about the level that the needs of different individuals and groups are met in the place. Mantey (2017) presents as new model that assesses the publicness of publicly accessible places. Her model includes three dimensions, each of which consisting of two indicators: diversity (diversity of users and diversity of activities), management (type of management; and freedom of access, use and behaviour), and accessibility (financial and spatial barriers).
3. The proposed model for assessing publicness in multicultural streetsThis study builds on the dimensions of publicness described by previous models and adjusts it to the street environment. The four central dimensions of publicness include: ownership, accessibility, management, and inclusiveness. Streets are considered as space in municipal ownership and as an area that is open and accessible to the general public. Therefore, this study contributes to the ongoing discussion on publicness alongside its other important dimensions such as accessibility, management, and diversity/inclusiveness. Figure 1 shows the proposed model for assessing publicness in multicultural streets. The following sections discuss each dimension in more detail.
Figure 1: the model for assessing the publicness of multicultural streets

Maryam Lesan
104
4. AccessibilityOne of the essential qualities of public space which is basic to its use is accessibility; it is one of the fundamental dimensions of publicness (Langstraat & Van Melik, 2013; Staeheli & Mitchell, 2008) and a mean for public spaces to become more successful. Many urban commentators and practitioners declare that good urban spaces are ones that are accessible and are well-used by a wide range of people (Cooper Marcus & Francis, 1998; Gehl, 1987). A public space becomes “open” when it is “publicly accessible” (Jackson, 1984; Lynch, 1981; Madanipour, 2004). In other words, without open and unconditional access a public space is not completely public. Carr et al. (1992, pp. 138-151) identify three different forms of accessibility to public space; physical access, visual access and symbolic access.
The current models of publicness mainly focus on the physical access and the extent that the location of public space is central and connected to the city’s movement pattern (Varna & Tiesdell, 2010). The existence of entrances and gateways may obstruct physical accessibility to an public space and negatively affect its publicness (Varna & Tiesdell, 2010). Other aspects that can also have an impact are the quality of the built environment, public transport routes, and the provision for walking and cycling (Dempsey, Bramley, Power, & Brown, 2009). Visual access relates to the extent of visibility of public space. It is considered an important issue, according to one’s feeling of safety and comfort, in making a decision before entering a public space. Public spaces that obstruct visual access are likely to be exclusive (Loukaitou-Sideris & Banerjee, 1998).
4.1. Socio-symbolic access
But what makes a neighbourhood street more accessible for different ethnic groups residing in the community? Spatial barriers (including physical and visual) is not an issue for obstructing community access in neighbourhood commercial streets. The openness of public spaces should not only be limited to physical accessibility but also should include social accessibility which means having access to the place and to the activities within it (Madanipour, 1999, 2004). In this regard, Low (2000) suggests that a place or landscape could be interpreted through “the social behaviour accommodated by the place, and the symbolic and communicative aspects of the place”. Staeheli and Mitchell (2008, p. 116) suggest that “access is conditioned by feelings of receptivity, welcome, and comfort”. Therefore, socio-symbolic accessibility could be related to the social behaviour and activities that a place accommodates as well as their symbolic, communicative and meaningful features.
Symbolic access concerns the presence of visual symbols and cues, in the form of individuals and groups of people or design elements affecting an entrance to public space. The presence of individuals or groups can be perceived as threatening or pleasing and inviting. Particular design elements also, for example, certain shop frontages, act as symbolic signage and cues suggesting the type of people who are welcomed. Socio-symbolic access regards different non-human factors such as specific facilities or design elements as cues and symbols which invite the intended type of people; the type of shops and activities may be both inviting and repelling to the public; for example; the presence of affordable shops, eating places, vendors may act as a signage that welcomes the general public. On the other hand, the presence of expensive shops and cafés (the beautification and modernization of the businesses) has the potential to alter the sense of place, leading to a luxury and prosperous atmosphere and therefore

105
A Framework to Assess Publicness in Multicultural Streets
orienting towards more affluent and middle class users, excluding users with lower socio-economic status (Loukaitou-Sideris, Blumenberg, & Ehrenfeucht, 2005; Zukin et al., 2009).
Figure 2 and 3: Certain shop frontages, act as symbolic signage and cues suggesting the type of people who are welcomed. Great South Road, South Auckland.
4.2. Economic Access
Carmona et al. (2010) mention economic access as another form of access to public spaces which is most common in quasi-public spaces such as cinemas and theatres and less common in public parks or civic spaces. This type of access can exclude some groups of society by charging entry fees. However, there are also other, more indirect ways people can be kept out, such as the way space is organised suggesting that consumption is a prerequisite for access. Thus, although no fees or entries are charged, these spaces are treated tentatively and become uncomfortable, undesirable and unwelcome.
Figure 4 and 5: A second-hand shop and an Asian flat-rate shop. The type of businesses and the way they express themselves in their frontages conveys different meaning for different users.
Ethnicity and economic disparity are often tied together in the formation of ethnic minorities (Pearson, 2012). Therefore, socio-economic circumstances play an important role for leisure participation among

Maryam Lesan
106
ethnic minority groups in public spaces (Rishbeth, 2001). Economic access in streets is mainly related to the semi-public space (businesses lining the street). Financial barriers may affect the accessibility of different ethnic groups to the street environment. In this regard, streets could become more public if a wide range of goods and prices are offered by the semi-public space. On the other hand, streets become less public where there is a narrow range of goods and prices.
5. ManagementManagement and governance of urban spaces have “a key role in shaping the terms on which inter- ethnic relations are organised and conducted” (Fincher & Iveson, 2008). Management relates to maintenance (civility) and control in the investigated models of publicness. Maintenance is one of the qualities of good urban spaces (Carmona et al., 2010). The level of required maintenance in public spaces could be different and is related to their social, economic and environmental context (Dempsey & Burton, 2011). Management of public spaces may control freedom of use, access and behaviour (Mantey, 2017). In the star model control is related to security guards and systems of surveillance which is mostly applicable towards privately managed public spaces such as shopping malls and some urban plazas. But management could also happen through the types of businesses that line a street and their associate characteristics (the spatial and political representation of different ethnic groups in the street environment).
5.1. Characteristics of business agglomerations along the street Retail tenant mix is the most significant factor in attracting people to a street (Teller, 2008). In multicultural streets the familiar and unfamiliar together shape the environment. Therefore, their level of success is mainly dependent on the right management of the mix of its retailers. The businesses, elements and characteristics which are familiar for one culture might be unfamiliar for the others. If business activities along the street create an exotic and non-familiar image for ethnic cultures, it is less likely to be used as place for recreation. Having a right mixture of activities on the street that supports a wide range of necessary, optional and social activities for different cultural groups is critical for streets to become more public.
5.2. Engagement, spatial, and political representation of different groups Malone (2002, pp. 166-167) mentions three political guidelines of an open street that lie in the organised and conceptual means for recognising and supporting different groups and their needs in spatial terms; “first, by giving political representation to group interest; second, by celebrating the distinctive cultures and characteristics of different groups; and finally, by re-imagining the role of streets as sites of collective culture, and culture production and reproduction”. Therefore, political representation is an important aspect to support different groups on the street. Social accessibility of a group to public spaces is also reliant on their political representation. According to Madanipour (2003), political exclusion is another type of social exclusion, which follows on from a lack of political representation. This form of exclusion develops when some groups of society and immigrants are underrepresented or even excluded from political decision making. But it is not only decisions that are taken by politicians that can serve to exclude or to be inclusive of people from different backgrounds and means. Private owners of land, buildings and the businesses that establish along the street also make decisions that affect public space. The management and the operation of a street’s retail spaces could also be an important factor in terms of political representation and social accessibility. Social relations within a space, and the ethnic group(s) that a semi-public space is managed by might have a

107
A Framework to Assess Publicness in Multicultural Streets
great influence on how welcome and comfortable users of varied ethnic cultures feel about adjoining the street environment. These trades (buying and selling) activities might be associated with important social interactions (Rapoport, 2005) between cultures.
Many shops are owned and operated by ethnic minorities in ethnic enclaves; for example, over half of the shops in Korea Town in Japan are owned and managed by Koreans (Hester, 2002) and about 85 percent of the shops in Little Shanghai in Sydney are Chinese small businesses (Lu & He, 2013). This could be considered as one of the reasons ethnic enclaves become popular destinations among ethnic groups of the countries of origin (Koreans in Korea Town). Managing a shop by a specific cultural group however does not necessarily mean that they would run a cultural shop or ethnic restaurant. Businesses owned or operated by immigrants do not target ethnic populations necessarily; many serve mainstream markets and non-ethnic clients (Qadeer, 1997).
Representing different ethnic groups in the social and cultural characteristics of premises is an important aspect to retain a meaningful place for people of various backgrounds and help streets become more multicultural. The trade communications between patrons and sellers are associated with social interactions between cultures (Rapoport, 2005) and have a potential in creating a sense of social comfort among ethnic minorities.
6. Inclusiveness/DiversityInclusiveness is one of the main dimensions of publicness that has been discussed in different definitions and models of publicness, although with slightly different terminologies. The extent that a neighbourhood commercial street is inclusive could be measured and understood by the type and range of activities and the actors that it supports (Mehta, 2014). T In their proposed model for publicness, Nemeth and Schmidt (2011, p. 12) indicate that between the three axes (ownership, management and uses and users), uses and users is the most difficult axis to be measured and needs a multistage methodology; “operationalizing the uses and users axis, for example, requires a multistage methodology likely requiring both unobtrusive observation techniques and user-intercept surveys. Once all axes have operationalised, one could potentially plot several spaces to compare their relative publicness”. he percentages of each ethnic group participating in stationary, static and social activities of a street could be recorded and compared with the percentages of each ethnic group residing in the relative neighbourhood. Similarly, the range of activities (necessary, optional, and social) of each ethnic group can be used to measure how each street serves different ethnic groups. Whether each ethnic group visits the street alone or in groups, and their types of activities is an indicator on how well each group perceives a streets environment as a social space. Table 1 summarises different dimensions in a multicultural street that make it more or less public.

Maryam Lesan
108
Table1: Descriptors of ‘more public’ and ‘less public’ for access, management, and inclusiveness dimensions in a multicultural street
Dimensions Indicators More Public situation Less Public situation
Acc
ess
Economic access Wide Range of goods and prices offered on the street [for socio-cultural groups]
Narrow range of goods and prices support for a limited
range of potential users Socio-Symbolic access Each culture’s signs-
symbols/ products available on the Street based on
population ratios
One or two culture’s signs- symbols/products dominate
the space
Man
agem
ent
Business agglomeration The mix of businesses target a diverse range of cultures
The mix of businesses target the mainstream or specific
ethnic groups
Engagement, spatial, and political representation
Percentage of Businesses owned by each cultural
group is based on population ratios
Percentage of Businesses owned by cultural groups is
not based on population ratios
Incl
usiv
enes
s
Diversity of users The percentages of each ethnic group participating in stationary, static and social activities coincide with the percentages of each ethnic group residing in the relative
neighbourhood
The percentages of each ethnic group participating in stationary, static and social activities does not coincide
with the percentages of each ethnic group residing in the
relative neighbourhood Diversity of activities All different ethnic groups
participate in a range of necessary, optional and
social activities on the street
Some groups only take part in necessary activities on the
street
7. ConclusionWith an increasing cultural diversity, a key challenge for urban planners is to consciously manage public spaces so that people having different socio-cultural backgrounds can gather there. Streets are known as external public space, “accessible to all” and which “constitute public space in its purest form” (Carmona, Heath, Oc, & Tiesdell, 2003, p. 111). In multicultural societies, they become places where different ethnic groups meet, encounter and socialize. However, not all streets may be able to support social activities of diverse cultural groups equally. While the idea of an inclusive street (as any other public space), a street claimed and used by people of diverse backgrounds at the same time, is seldom possible, it is worth to pursue. This paper provided a framework to understand how streets can meet the goal of publicness in multicultural societies. The central dimensions affecting publicness: accessibility, management, and inclusiveness, each of which having their specific definitions. Figure 1 shows the model for assessing the publicness of streets in multicultural streets. Based on the provided dimensions and their indicators, different streets a\or different sections of a street can be studied and compared together for being more or less public to a broader range of ethno-cultural groups.

109
A Framework to Assess Publicness in Multicultural Streets
References Appleyard, D. (1981). Livable Streets. Berkeley and Los Angeles, CA: University of California Press. Benn, S. I., & Gauss, G. F. (1983). The public and the private. In S. I. Benn & G. F. Gauss (Eds.), Public and private in social life (pp. 3-30). New York: St. Martin’s Press. Berman. (1986). Take it to the Streets: Conflict and Community in Public Space. Dissent, 33(4), 476-485. Carmona, M., Heath, T., Oc, T., & Tiesdell, S. (2003). Public Places, Urban Spaces. Oxford, UK: Architectural Press. Carmona, M., Tiesdell, S., Heath, T., & Oc, T. (2010). Public places, Urban spaces (Second ed.). Oxford: Elsevier Ltd. Carr, S., Francis, M., Rivlin, L., & Stone, A. (1992). Public Space: Cambridge University Press. Cooper Marcus, C., & Francis, C. (1998). People Places: Design Guidelines for Urban Open Space. New York: John Wiley & Sons. De Magalhaes, C. (2010). Public Space and the Contracting-out of Publicness: A Framework for Analysis. Journal of Urban Design, 15(4), 559-574. Dempsey, N., Bramley, G., Power, S., & Brown, C. (2009). The Social Dimension of Sustainable Development: Defining Urban Social Sustainability. Sustainable Development(19), 289-300. Dempsey, N., & Burton, M. (2011). Defining place-keeping: The long-term management of public spaces. Urban Forestry & Urban Greening, 11(1), 11-20. Fincher, R., & Iveson, K. (2008). Planning and Diversity in the City: Redistribution, Recognition and Encounter. Basingstoke: Palgrave. Francis, M. (1987). The making of democratic streets. In A. Vernez-Moudon (Ed.), Public streets for public use (pp. 23-39). New York: Columbia university press. Franck, K. A., & Paxon, L. (1989). Women and urban public space. In I. Altman & E. H. Zube (Eds.), Public Places and Spaces (Vol. 10, pp. 121-146). New York: Plenum Press. Gehl, J. (1987). Life between buildings using public space. New York: VNR. Hester, J. T. (2002). Repackaging Difference: The Korean Theming of an Osaka, Japan. In F. Colombijn & A. Erdentug (Eds.), Urban Ethnic Encounters: The Spatial Consequences (pp. 177-191). London: Routledge. Jackson, J. B. (1984). Discovering the Vernacular Landscape. New Haven: Yale University Press. Jacobs, A. (1993). Great Streets. Cambridge, MA: The MIT Press. Jacobs, J. (1961). The Death and Life of Great American Cities. New York: Vintage Books. Kohn, M. (2004). Brave New Neighborhoods: The Privatization of Public Space. London: Routledge. Langstraat, F., & Van Melik, R. (2013). Challenging the ‘End of Public Space’: A Comparative Analysis of Publicness in British and Dutch Urban Spaces. Journal of Urban Design, 18(3), 429-448. Loukaitou-Sideris, A., & Banerjee, T. (1998). Urban Design Downtown: Poetics and Politics of Form. Berkeley, CA: University of California Press. Loukaitou-Sideris, A., Blumenberg, E., & Ehrenfeucht, R. (2005). Sidewalk Democracy : Municipalities and theRegulation of Public Space. In E. Ben-Joseph & T. S. Szold (Eds.), Regulating Place: standards and the shaping of urbanAmerica. New York: Routledge. Low, S. (2000). On the plaza: the politics of public space and culture. Austin: University of Texas Press. Low, S., Taplin, D., & Scheld, S. (2005). Rethinking Urban Parks: Public Space and Cultural Diversity. Austin: The University of Texas Press. Lu, D., & He, H. (2013). The Transcultural Production of Space: Making "Little Shanghai" in Sydney. In J. Hou (Ed.), Transcultural Cities: Border-Crossing and Placemaking. New York: Routledge. Lynch, K. (1981). A Theory of Good City Form. Cambridge: MIT Press. Madanipour, A. (1999). Why are the design and development of public spaces significant for cities? Environmentand Planning, 26, 879-891. Madanipour, A. (2004). Marginal public spaces in European cities. Journal of Urban Design, 9(3), 267-286. Retrieved from http://dx.doi.org/10.1080/1357480042000283869 Malone, K. (2002). Street life: youth, culture and competing uses of public spaces. Environment and Urbanization, 14(2), 157-168.

110
Maryam Lesan
Mantey, D. (2017). The ‘publicness’ of suburban gathering places: The example of Podkowa Leśna (Warsaw urban region, Poland). Cities, 60, 1-12. Mehta, V. (2013). The Street: A Quintessential Social Public Space. Mehta, V. (2014). Evaluating Public Space. Journal of Urban Design, 19(1), 53-88. Mitchell, D. (2003). The Right to the City: Social Justice and the Fight for Public Space. New York: The Guilford Press. Mulgan, G., Potts, G., Audsley, J., Carmona, M., De Magalhaes, C., Sieh, L., & Sharpe, C. (2006). Mapping Value in the Built Urban Environment. Retrieved from London: Nemeth, J., & Schmidt, S. (2011). The privatization of public space: modeling and measuring publicness. Planning and Design, 38, 5-23. Pearson, D. (2012, 13-Jul). Ethnic inequalities - Occupation and education. Retrieved from http://www.TeAra.govt.nz/en/ethnic-inequalities/ Qadeer, M. A. (1997). Pluralistic Planning for Multicultural Cities: The Canadian Practice. Journal of American Planning Association, 63(4), 481-494. Rapoport, A. (1982). The meaning of the built environment: a nonverbal communication approach. Beverly Hills: Sage Publications. Rapoport, A. (2005). Culture, Architecture, and Design. Chicago: Locke Science Rishbeth, C. (2001). Ethnic Minority Groups and the Design of Public Open Space: an inclusive landscape? Landscape Research, 26(4), 351-366. Retrieved from http://dx.doi.org/10.1080/01426390120090148 Shaftoe, H. (2009). Convivial Urban Spaces: Creating Effective Public Places. London: Sterling. Staeheli, L. A., & Mitchell, D. (2008). The People's Property?: Power, Politics, and the Public. New York: Routledge. Varna, G., & Tiesdell, S. (2010). Assessing the Publicness of Public Space: The Star Model of Publicness. Journal of Urban Design, 15(4), 575-598. Walzer, M. (1986). Pleasures and cost of urbanity. Dissent, 33, 470-484. Young, I. M. (1990). Justice and the Politics of Difference. Princeton, NJ: Princeton University Press. Zukin, S., Trujillo, V., frase, P., Jackson, D., Recuber, T., & Walker, A. (2009). New retail capital and neighborhood change: boutiques and gentrification in New York City. City & Community 8(1), 47-64. Retrieved from http://onlinelibrary.wiley.com/doi/10.1111/j.1540-6040.2009.01269.x/full

111
The 54th International Conference of the Architectural Science Association (ANZAScA) 2020
A novel approach to understanding people’s housing preferences
Morten Gjerde1 and Rebecca Kiddle2 1, 2 Victoria University of Wellington, Wellington, New Zealand
{morten.gjerde1, rebecca.kiddle2}@vuw.ac.nz
Abstract: Housing in Aotearoa/New Zealand is produced largely as a commercial activity. The vast majority of housing ‘consumers’ are left with the narrow range of housing types favoured by developers to choose between. Earlier research has noted that people’s increasingly diverse housing preferences are rarely taken into account, even if they are known, in the production cycle. This paper discusses the methods used to elicit needs and expectations of people with an expressed interest in medium density housing. A 16-square matrix of demographic characteristics was developed to help ensure a wide range of housingpreferences could be explored. Half the participants were Māori, reflecting an aim to address the gap in knowledge about Māori housing preferences. In recognition that the ideal dwelling is a rarity and that people make trade-offs, the research team developed a set of different neighbourhood and dwellingconditions that required respondents to make choices. Their choices were made in a financiallyconstrained context and the nature of the trade-offs were then discussed in free ranging interviews. Thisdiscussion of a methodology developed to enable better understanding of housing preferences will be of particular interest to other researchers.
Keywords: Housing preferences studies; Medium density housing; Housing crisis; Qualitative research methods.
1. IntroductionFor more than a decade now, increases in demand for housing has outstripped the increases in the supply of housing in New Zealand’s largest cities. With each passing year the deficit has grown in number and it seems that the shortfall is now somewhere in the region of 40,000 homes (Kiernan, 2019). This has in turn led to increases in land and house prices, making housing less and less affordable for New Zealanders (Grimes et al., 2006; Chapman, 2013). Central and local governments have taken steps to enable more housing to be built in the most impacted areas of the country. These steps include streamlining of regulatory planning processes, expanding areas in which new medium and high-density housing can be built and by releasing policy statements that aim to advocate for, if not require, housing to be built more quickly and feasibly. On the consumer side, central government has targeted first time home buyers with legislation aimed at freeing up lending services and working with developers to supply housing for this part of the market. Considerable effort then, has gone into stimulating the property development industry to increase housing supply to address the current housing crisis.
Imaginable Futures: Design Thinking, and the Scientific Method. 54th International Conference of the Architectural Science Association 2020, Ali Ghaffarianhoseini, et al (eds), pp. 111–120. © 2020 and published by the Architectural Science Association (ANZAScA).

112
Morten Gjerde and Rebecca Kiddle
While these and other programmes are aimed at reducing the housing shortfall, what is being done to help ensure that the housing being built meets the needs and preferences of the people who will live there? And, in particular, how is this housing meeting the needs and preferences of Māori whānau? Questions such as this are addressed through an investigation into people’s housing needs and preferences. The current paper reports on the effectiveness of the design of the unique methodology used in the scoping study, as compared to the research findings.
2. BackgroundNot only is New Zealand’s population increasing in numbers, it is also becoming more diverse, through immigration and by changes stimulated by people’s personal choices and by an ever-evolving social climate. People’s lifestyle preferences, their family sizes, their cultural backgrounds and socioeconomic circumstances all inform their specific housing needs. In addition, housing needs and preferences are known to change over time, a fact that is clearly evident with the ongoing development of large retirement village style housing in and around many cities (Shiran, 2019). Perhaps a deeper issue, if only for the fact that it has remained unresolved since the time of colonial settlement, is whether the housing needs of Māori are provided for. Māori have traditionally lived collectively, in rural settlements, and yet the majority today find themselves living in more urban forms of housing and in circumstances not dissimilar to those of Pākehā. It is unclear, largely due to a lack of research on the topic, whether the needs of Māori are being met through the housing they live in. Overall then, it seems that New Zealand’s population is much richer and diverse than it was half a century ago. It would therefore be appropriate to ask whether the market has been able to respond in ways that enable people to meet their housing needs and preferences.
Yeoman and Akehurst (2015) found that only half of the people they consulted with would choose to live in a detached dwelling, even with the financial means to do so, whereas the other half would prefer to live in housing at a range of higher densities in central locations. And yet large tracts of peripheral land continues to be developed as standalone housing. In Auckland particularly, this has left neighbourhoods outside the city centre with significant shortfalls in medium and higher density dwellings (Cityscope Consultants, 2011; Auckland Council Research and Evaluation Unit, 2015). The problem of a lack in these kinds of dwellings is compounded by the need to use land efficiently, thus increase densities to create neighbourhoods that are walkable and able to offer their inhabitants access to good quality amenity supported by a critical mass of people. An important factor here is the reliance placed on the private market to deliver the housing that is needed in Aotearoa. Housing developed in contexts such as this is produced as a commodity, where the developer is motivated to build at a low enough cost and to sell at a high enough price to be able to claim sufficient profit in the process. This causes the vast majority of developers to continue to work with housing products that have been known to sell successfully in the past. Particularly in a market dominated by high consumer demand, there is little incentive for developers to vary from previous examples. Demand for housing models popularised last century remains high, influenced at least in part by the fact there are few alternatives to choose between. Concerns about increased risk that a project would not sell appears to continue to disincentivise housing innovation.
Generally then, it appears that housing in New Zealand continues to be produced according to models developed some time ago, when society and the population were less diverse than they are today (Cityscope Consultants, 2011; Buckenberger, 2013). The industry that is charged with producing the housing that New Zealanders need appears unable or unwilling to investigate and respond to changes in preference. As demand for housing has never been higher than it is today, without such information there

113
A novel approach to understanding people’s housing preferences
is a risk that new housing will fall short of fully supporting residents’ needs. This paper outlines the means by which such research has recently been conducted, looking specifically at people’s preferences for different forms of medium density housing and how they are located.
3. LiteratureIntensive forms of housing (compared with detached suburban formats) offer a range of social and
environmental benefits, including more efficient uses of social, economic and physical infrastructures, opportunities for social interaction and access to services. Housing intensification can encourage development of public transport services and, in comparison with continued expansion of urban boundaries, can help preserve productive rural land and natural ecosystems. The attributes of medium density housing (MDH) are described in much more detail elsewhere and there is insufficient space in this paper to repeat these in detail. See e.g. Dupuis and Dixon (2002), Haarhoff et al. (2016b) and Bryson and Allen (2017). In light of the strong incentives to create more medium density housing, understanding people's perspectives and experiences around these forms is an important part of ensuring that, when delivered, such housing is well-liked (Dodge, 2017).
Housing studies undertaken in New Zealand can be grouped into three categories; housing choice (reasons for choosing), housing experience, and housing preferences. In an earlier review, Wildish (2015) suggested that while housing choice relates to the real decisions and trade-offs that people make, housing preference has a more aspirational and long-term orientation. Conceptually, research on housing experience, including experiences of satisfaction and dissatisfaction, can be seen to occupy a middle ground between housing choice, where the two areas overlap in their consideration of lived experiences, and housing preference, as these studies are not designed to shed light on how experience (and the preferences that experiences of satisfaction and dissatisfaction indicate) may be acted on in future housing decision-making.
Limitations of studies of housing choice (people’s reasons for choosing to buy or rent their home) include the notion that choices will reflect people’s (constrained) preferences at the time of buying or choosing to rent. Research participants may not clearly remember their decision-making processes, and their preferences may also have changed in the intervening period. In terms of these limitations however, it is also interesting to note that in Dodge’s (2017) study, which included questions related to both housing choice and constrained housing preferences, ratings of past priorities were found to be consistent with people’s currently stated preferences. While this could suggest that people’s housing preferences remain relatively stable over time, Dodge also noted that it is also possible that respondents had difficulty recalling past preferences and instead substituted their current preferences, which would be easier to recall. As noted earlier, an additional limitation of housing choice studies is that people are constrained by what is actually available on the market at the time they choose. Current planning constraints on residential development in many cities make it difficult to determine what true consumer housing and travel preferences are, as unconstrained choices cannot be revealed in the current marketplace (Dodge, 2017). Different approaches would be necessary if we are interested in exploring demand for a broader variety of housing options than currently exists, such as new forms of medium density housing (Yeoman and Akehurst, 2015).
Housing preferences have been explored previously in several ways. It has been noted that most of this earlier work has looked at unconstrained preferences, thus neglecting how price influences choice and preference for compact development (Mead and McGregor, 2007; Wildish, 2015). These studies have simply sought to illuminate preferences through direct questions, or through the ranking of the

114
Morten Gjerde and Rebecca Kiddle
importance of various housing qualities, unconstrained by cost or people’s personal circumstances. More recently however, there has been increasing interest in looking at how people’s preferences might be affected by such constraints. Inclusion of financial constraints allows a more accurate approximation of real-life decision-making. Thus, Haarhoff et al. (2016a) stressed that unconstrained aspirations do not reflect real life conditions that people face when making housing choices and Saville-Smith and James (2010) noted that housing demand involves not just a desire for a form of housing, but also a willingness and ability to pay for that housing.
Constrained preferences also enable consideration of the trade-offs people are willing to make in order to achieve housing attributes they rank more highly. One approach to studying constrained preferences was utilised by (Ivory et al., 2013), who invited participants to select among different degrees of chosen housing qualities, within a constrained budget. Such an approach creates challenges around the costing of housing characteristics, given that they are disaggregated from the cost of the whole house. The study authors noted that establishing the most appropriate values for each feature and stage proved to be challenging given the level of uncertainty and the need for simplification and comparability across the tool. Limitations of research on constrained preferences should also be recognised, however. While offering a greater degree of realism in comparison with research that solely considers unconstrained preferences, the approach is still experimental, insofar as it is based on hypothetical choice sets and preferences being explored. It therefore has the potential to be less realistic than research on housing choice and housing experience (Yeoman and Akehurst, 2015).
Research around housing choice, experience and preference have taken several approaches to data collection and analysis. These have been grouped under the headings shown in table 1 below.
Table 1: Methods used in the New Zealand studies involving primary research with residents of medium density housing and the general public.
Method Survey Interviews and/or Focus Groups
Both: Survey plus Interviews and/or Focus Groups
Review Other Unknown
Number of studies
32 19 7 2 2 3
Of the 65 studies reviewed, 39 (60%) adopted quantitative methods, either fully or in part. The subjects of these studies ranged from the perceptions members of the public have about MDH to resident experiences of MDH to evaluations of the preferences people hold, whether or not they have experienced higher density housing formats. Many of the quantitative studies provided value in terms of the breadth of responses they were able to generate, particularly those that were conducted through digital platforms and where they included visual images to prompt responses. However, such studies are also limited by the fixed nature of questions put to respondents, necessary to generate data that can be statistically analysed. The 26 studies that included qualitative data collection – noting that seven studies fell into both quantitative and qualitative categories through their mixed methods approaches – were shown in many cases to be more responsive to individual circumstances that arose during the interviews and focus group discussions. This led those studies to be able to discuss details of the reasoning behind people’s preferences or experiences. However, these studies were rather more limited in the breadth they could cover, in some cases basing their findings on as few as 10 households.
Referring only to previous research, the Pacific people and housing in Auckland: a stocktake of issues, experiences and initiatives report notes that Pacific people are more likely to live in larger households

115
A novel approach to understanding people’s housing preferences
than other ethnic groups and that both Māori and Pacific people have a tendency to live in multi- generational arrangements and to host cultural activities within the home (Joynt et al., 2016). Beyond this, none of the 65 studies reviewed here specifically addressed people’s housing preferences or needs through the lens of ethnic culture. This is surprising, in an increasingly ethnically diverse Aotearoa. (Dodge, 2017) noted the underrepresentation of minority groups in earlier studies of housing preferences in Aotearoa New Zealand and Bryson & Allen (2017) confirmed that a consistent theme in the literature is the lack of both qualitative and quantitative data regarding Māori preferences and choices.
4. Research designThe present study was designed to capture preferences for eight different housing characteristics held by Māori and non-Māori residents and non-residents of medium density housing in Aotearoa New Zealand, using qualitative interviews to develop detailed knowledge in this area. The specific project is part of a broader study seeking to identify key success factors for medium density housing in Aotearoa. The broader project also includes a systematic review of the New Zealand literature on housing preferences and medium density housing experiences, an investigation of the Resource Management Act and several district plans, and interviews with developers and council staff.
4.1. Housing and neighbourhood characteristics for examination
Following review of the attributes and constraints of the methods utilised in other studies, a methodology based around interviews with people about their housing preferences was developed. The interviews were arranged in three parts, with each part emphasising one of the three focus areas identified through the literature: housing choice, housing experience (satisfaction) and housing preference. The following discussion is centred on the third area of focus, as this was seen to hold the greatest potential to expand the forms of housing people have to choose from.
Several studies of constrained preferences (Yeoman & Akehurst 2015; Dodge 2017; Holmes 2017) have included discrete choice experiments, where participants have been asked to choose between hypothetical housing options. A more complex approach was adopted by Ivory, Burton & Harding (2013), who developed an exercise using five housing qualities, with the request that participants choose between different levels of these housing qualities within a constrained budget. Such an approach adds difficulties to the costing of qualities, given that they are disaggregated from the cost of the whole house (Ivory et al., 2013).
Variables may be restricted to reduce the cognitive burden on the research participants, as well as to limit the complexity of any quantitative analysis that might be undertaken. Thus, Dodge (2017) took a relatively simplistic view of preferences for housing, neighbourhood, and accessibility attributes, measuring preferences for six housing and neighbourhood attributes: dwelling type, outdoor space, neighbourhood density, destination accessibility, parking, and dwelling price, assuming that all other attributes were equal.
Table 2 lists the housing and neighbourhood attributes that were investigated in each of four earlier preference studies and those that are utilised in the present one. Yeoman & Akehurst (2015) referred to eight variables in the housing options of their discrete choice experiment; however, they only specifically analysed four of these. Later, Dodge (2016) suggested that in-depth interviews could also provide valuable findings in the area, acknowledging the complexity of factors at play when studying medium density housing preferences.
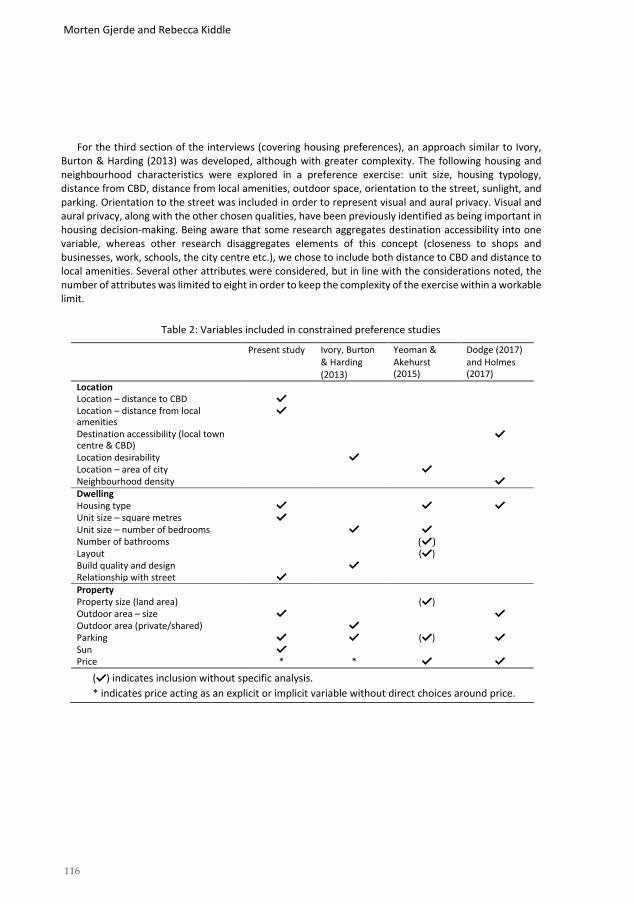
116
Morten Gjerde and Rebecca Kiddle
For the third section of the interviews (covering housing preferences), an approach similar to Ivory, Burton & Harding (2013) was developed, although with greater complexity. The following housing and neighbourhood characteristics were explored in a preference exercise: unit size, housing typology, distance from CBD, distance from local amenities, outdoor space, orientation to the street, sunlight, and parking. Orientation to the street was included in order to represent visual and aural privacy. Visual and aural privacy, along with the other chosen qualities, have been previously identified as being important in housing decision-making. Being aware that some research aggregates destination accessibility into one variable, whereas other research disaggregates elements of this concept (closeness to shops and businesses, work, schools, the city centre etc.), we chose to include both distance to CBD and distance to local amenities. Several other attributes were considered, but in line with the considerations noted, the number of attributes was limited to eight in order to keep the complexity of the exercise within a workable limit.
Table 2: Variables included in constrained preference studies
Present study Ivory, Burton & Harding (2013)
Yeoman & Akehurst (2015)
Dodge (2017) and Holmes (2017)
Location Location – distance to CBD Location – distance from local amenities
Destination accessibility (local town centre & CBD)
Location desirability Location – area of city Neighbourhood density Dwelling Housing type Unit size – square metres Unit size – number of bedrooms Number of bathrooms () Layout () Build quality and design Relationship with street Property Property size (land area) () Outdoor area – size Outdoor area (private/shared) Parking () Sun Price * *
() indicates inclusion without specific analysis. * indicates price acting as an explicit or implicit variable without direct choices around price.

117
A novel approach to understanding people’s housing preferences
4.2. Interview props
Two sets of cards were created, with three or four options in relation to each of the eight neighbourhood and housing characteristics of interest (see table 2 above). The two sets of cards differed only in relation to one set including a points value (refer 4.3 below) for the specific characteristic. The preference exercise was carried out twice with each research participant during the interview, using the set of cards without the points values attached first, exploring research participants’ unconstrained preferences – their “dream home”. Following discussion of their choices, a set of cards identical to the first, only with point values added, were presented to explore the participant’s constrained preferences. An identical point limit was stated to each participant, restricting the second set of choices to a total of 70 points (representing a house purchase price of approximately $700,000). While it could be argued that
Figure 1: Example of cards used to prompt people's constrained preferences for eight housing characteristics.
this reduced the level of realism in terms of the decision-making process, as different people have different financial constraints, this was considered appropriate given that it would be awkward to discuss people’s financial means with them. Other studies that have discussed such information have been anonymous.
4.3. Setting values for housing and neighbourhood characteristics
Different studies have integrated cost considerations in different ways. Ivory, Burton & Harding (2013), Yeoman & Akehurst (2015), Dodge (2017), and Holmes (2017) all go to some lengths to ensure that the pricing they use is realistic. Ivory, Burton & Harding (2013) noted that participant decision-making must be reasonably grounded in order to validate the research findings. Dodge (2017) and Holmes (2017) included price as a variable, while Ivory, Burton & Harding (2013) and Yeoman & Akehurst (2015) went a

118
Morten Gjerde and Rebecca Kiddle
step further, restricting participants’ choices based on what they could afford given the financial information they had provided. Interestingly, Holmes (2017) felt that many respondents did not treat the price variable seriously, illustrating that simply including a price variable is not sufficient in itself to ensure realistic results.
As noted, disaggregating housing qualities from the house as a whole makes pricing these qualities a challenging task. Two property valuers were consulted in the process of assigning values to each of the variables used in the constrained choice exercise. The valuations were tested by comparing costs against recent sales in several Wellington suburbs. Although values were assigned based on realistic costings, the decision was made to assign a points value rather than a dollar value for each of the variables. This was done for two main reasons. Firstly, interviewees included both renters and home owners, and in advance we considered the possibility that some renters would not be in a financial position to buy a house, so a way of representing both purchasing price and renting price of the housing variables was needed. Secondly, because financial information was not requested, it would be difficult to create a suitable constraint for participants in the manner earlier studies had done.
4.4. Participant recruitment
Dodge (2017) cautioned about the underrepresentation of minority groups in previous studies of housing preferences in Aotearoa New Zealand. Accordingly, the present research sought to include Māori respondents in sufficient numbers to redress this shortcoming. The study was conceived around equal representation of Māori and Pākehā. In addition, while as a qualitative study we have not sought to include a representative sample, we chose to vary our participants as much as feasible given the low sample size., seeking to achieve a degree of diversity while also filling categories that were important for our analysis. Sixteen separate respondent types were identified around the four dimensions of ethnicity, gender, owner/non-owner and resident/non-resident of MDH. These are summarized in table 3.
Table 3: Matrix of targeted interview respondent demographics.
Property owner Renter Current MDH resident
Non-MDH resident
Māori √ √ √ √
Non-Māori √ √ √ √
Male √ √ √ √
Female √ √ √ √
We chose to interview both residents and non-residents of medium density housing. We felt that this offered the opportunity for comparisons between residents of different typologies, based on a standard format interview (as opposed to basing such comparisons on studies with different methodologies). The experiences of both residents and non-residents of medium density housing are important for the future of medium density housing, insofar as medium density residents have valuable direct experience of this housing typology, and research with those not living in medium density housing can help us understand whether or not those who do not currently live in medium density housing would consider such housing, and what barriers exist to choosing medium density housing.

119
A novel approach to understanding people’s housing preferences
Recruitment of interview participants was conducted through social media platforms, including the Neighbourly website, by placing advertisements inviting interested parties to contact the researchers. A brief discussion was had with each, either by phone or email, to elicit their key demographic characteristics. Those that fitted with one of the still available demographic classifications were then invited to a more in-depth interview about their housing preferences and choices.
5. Discussion & conclusionsThe designed methodology enabled collection and analysis of rich information about the housing
preferences of the 15 people we spoke to, including the trade-offs they were willing to make to retain those housing or neighbourhood attributes they rated most highly. It is not our intention to discuss the findings of the research here, but instead elaborate on the positive and negative attributes of this methodological approach. Participant recruitment through social media channels proved very effective and we could have interviewed several more participants in many categories. There seems to be a strong community interest in housing and willingness to work with researchers to help address questions around housing preference. In the end, we were unable to fill each of the 16 demographic classifications, falling short just one.
The value of engaging with Māori participants became immediately clear as differences emerged in the housing choices made by these participants and in their medium- and long-term intentions when compared with those made by Pākehā participants. The methodology enabled the researchers to probe areas where differences may lie and the background reasons for them.
The interviews were transcribed and coded for analysis. The preferences experiment, first involving unconstrained selection of preferred characteristics under eight different neighbourhood and dwelling attribute, helped identify several areas of common preference, particularly around the locations people would prefer to live in. As the project developed, it became clear to the research team that while the methodology returned rich information a larger sample size was really needed to draw stronger conclusions around housing preferences. Although it was not intended to generate a representative sample, the interviews revealed a diverse range of housing experiences if not of preference. Accordingly, the present study acts as a scoping study to test the methods and potential findings in order to support applications for funding to extend the study in numbers and geographic location. The merits of the methodology, demonstrated through the initial fieldwork and analysis, were certainly taken into account in forming this plan for extension.
Successful deployment of the methodology has proven its value in teasing out preferences and trade- offs people are willing to making in their housing selections. These preferences and trade-offs can then be discussed in relation to the forms of housing currently provided by the market. A gap analysis, even of this limited sample, identifies opportunity for MDH developers. This, and how to address the gaps, will be explored further in future research.
6. ReferencesAuckland Council Research and Evaluation Unit (2015) Auckland Council Research Strategy and Priority Research Areas
2013 - 2016: Research Plans, Auckland Council, Auckland, 186. Bryson, K. and Allen, N. (2017) Defining medium density housing, Building Research Association of New Zealand,
Porirua, 63. Buckenberger, C. B. (2013) Housing qualities: Myths and meanings in Auckland, New Zealand, PhD Thesis, The
University of Auckland.

120
Morten Gjerde and Rebecca Kiddle
Chapman, R. (2013) Affordable housing in New Zealand cities: an economic and policy analysis, in S. Bierre, P. Howden-Chapman and L. Early (eds.), Homes People can Afford: How to Improve Housing in NZ, Steele Roberts Aotearoa, Wellington, 49-56.
Cityscope Consultants (2011) Improving the Design, Quality and Affordability of Residential Intensification in New Zealand, CityScope Consultants Ltd prepared for Centre for Housing Research Aotearoa.
Dodge, N. (2017) A Quarter Acre Pavlova Paradise lost? The Role of Preferences and Planning in Achieving urban Sustainability in Wellington, New Zealand, PhD Thesis, Victoria University of Wellington, Wellington.
Dupuis, A. and Dixon, J. (2002) Intensification in Auckland: Issues and Policy Implications, Adequate & Affordable housing for All: Research, Policy, Practice, University of Toronto.
Grimes, A., Aitken, A., Mitchell, I. and Smith, V. (2006) Housing Supply in the Auckland Region 2000-2005,Motu Working Paper, Motu Economic and Public Policy Research, Wellington.
Haarhoff, E., Beattie, L. and Dupuis, A. (2016a) Does higher density housing enhance liveability?, Cogent Social Sciences, 2.
Haarhoff, E., Beattie, L. and Dupuis, A. (2016b) Does higher density housing enhance liveability? Case studies of housing intensification in Auckland, Cogent Social Sciences, 2(1), 1243289.
Ivory, V., Burton, J. and Harding, A. (2013) Testing successful central city living in Christchruch: What will it take for people to live there?, in C. C. Council (ed.), Opus International Consultants, Christchurch.
Joynt, J., Tuatagaloa, P. and Lysnar, P. (2016) Pacific people and housing in Auckland: A stocktake of issues, experiences and initiatives Auckland Council, Auckland.
Kiernan, G. (2019) NZ short by nearly 40,000 houses. Available from: Infometrics <https://www.infometrics.co.nz/nz- short-by-nearly-40000-houses/> (accessed.
Mead, D. and McGregor, A. (2007) Regional Intensification: Intensive Housing Demand and Supply Issues, Auckland. Saville-Smith, K. and James, B. (2010) The Determinants of Tenure and Location Choices of 20-40 Year Old Households
in the Auckland Region, Centre for Housing Research. Shiran, M. (2019) The Role of Architectural Design in Enhancing Place Attachment for Older Adults in Retirement
Communities, School of Architecture, Victoria University of Wellington, Wellington. Wildish, B. (2015) Housing Choice and Preference: A Review of the Literature, in A. Council (ed.), Aucklland Council,
Auckland, 23. Yeoman, R. and Akehurst, G. (2015) The housing we'd choose: a study of housing preferences, choices and tradeoffs
in Auckland. Auckland Council technical report, TR2015/016, Market Economics Ltd for Auckland Council, Auckland.

121
The 54th International Conference of the Architectural Science Association (ANZAScA) 2020
A numerical study on the non-local effects of urban form in the lower atmosphere: implications for urban climate modeling
Yanle Lu1 and Qi Li2 1, 2 Cornell University, Ithaca, US
{yl29481, ql562}@cornell.edu
Abstract: Increasing urbanization motivates the studies of urban boundary processes, and mesoscale models with urban canopy parameterizations, such as the Weather Research and Forecast model, have been widely used. However, the simplified urban canopy model without considering detailed urban forms could lead to large uncertainties in predicting mesoscale weather and climate in cities. Using obstacle- resolving large-eddy simulations, we investigate the impact of variable vertical extent of the profiles of urban form in streamwise direction on the atmospheric boundary layer (ABL). Three types of idealized urban forms with the same mean building height but different streamwise inhomogeneity are designed and conducted under neutral condition. The non-local effects of different urban forms on the ABL are characterized by demarcating the ‘zones of urban influence’ in the upwind, downwind and vertical regions using objective metrics of the velocity field. This work highlights the importance of capturing urban forms, especially the height variation of buildings, in the current mesoscale-modelling framework. Further analysis of the difference in the transportation of heat and momentum among cases will be investigated in the future.
Keywords: Urban form; urban heat island; mesoscale modelling; large-eddy simulations.
1. IntroductionUrban population has increased significantly in the past 50 years, and it is projected that 68 percent of the world’s population will live in urban areas by 2050, from 54 percent in 2016 (Ritchie and Roser, 2018). They live in cities of different urban forms, which refer to the fabric, land cover and urban morphology (Oke, 2017).
The morphology of cities is determined by how building complexes are spatially organized in a city. The urban morphology impacts weather and climates due to modifications of the exchange of momentum, energy and water vapor between surfaces and the atmospheric boundary layer (ABL) (Garratt, 1994; Collier, 2006; Yang et al., 2016). Furthermore, the modification of ABL by urban morphology is not localized. For example, the impacts of urban morphology can also extend downwind due to wakes caused by urban building complexes (Zhang et al., 2019) and extend vertically by changing the characteristics of vertical profiles of important fluid parameters, such as streamwise velocity, in the urban areas (Carpentieri and Robins, 2015).
Imaginable Futures: Design Thinking, and the Scientific Method. 54th International Conference of the Architectural Science Association 2020, Ali Ghaffarianhoseini, et al (eds), pp. 121–130. © 2020 and published by the Architectural Science Association (ANZAScA).

122
Yanle Lu and Qi Li
Therefore, it is highly important to understand the spatial extent of how distinct urban morphologies influence the flows and the transfer of energy and water vapor. Even though high-resolution computer simulations and extensive field measurements of urban flows have made progress, our knowledge of the impacts of urban area remains incomplete. In addition, the effects of urban morphology in mesoscale weather and climate models, such as the Weather Research and Forecasting model (WRF), on the overall urban land-atmosphere coupling are over-simplified. Nevertheless, building-resolving large-eddy simulations are promising in probing into the primary mechanisms and processes, in which urban morphology perturbs the ABL.
Therefore, this study conducts a series of large-eddy simulations (LES) to assess the impact of variable vertical extent of the profiles of urban form in streamwise direction on the atmospheric boundary layer (ABL). Based on the simulations, several questions relevant to the non-local effects of urban form can be answered: what are the ‘zones of urban influence’ in the upwind, downwind and vertical regions respectively, and how the type of urban forms influences them.
The LES model and the setup of simulations are described in Section 2. The analysis of statistics of the numerical data are given in Section 3. The last section summarizes the findings at present and proposes future research direction and questions.
2. Methods
2.1. LES
The LES is one type of computational fluid dynamics models that is commonly used to simulate turbulent flow over urban surface (Kanda et al., 2004; Bou-Zeid et al., 2009; Li et al., 2020), in which directly computes large-scale motions and parameterizes the subgrid-scale (SGS) terms (Su et al., 1998). It assumes the eddies larger than the filtered size contain most of the energy and the transport of momentum and mass.
The LES model used in this study implements the immersed boundary method (IBM) to resolve the complex buildings structure explicitly. The governing Navier-Stokes equation and scalar conservation equation are given below. Previous studies contain the details of the numerical procedures, subgrid models and validation (Bou-zeid et al., 2005; Chester et al., 2007; Li et al., 2016).
Where: Subscript 𝑖𝑖 represents the variables in streamwise, spanwise and vertical directions; 𝑢𝑢I is the resolved
velocity vector; 𝑡𝑡 refers to time; 𝜏𝜏ij is the deviatoric part of the subgrid stress tensor; 𝑝𝑝 is the modified pressure, 𝐹𝐹i is the body force applied to the domain and is a steady pressure gradient along the streamwise direction in this study; 𝐻𝐻i is the immersed boundary force representing the action of the obstacles on the fluid; 𝜃𝜃 is the resolved temperature; 𝑞𝑞i denotes the subgrid scale heat flux. All the variables in the equations are filtered components.

123
A numerical study on the non-local effects of urban form in the lower atmosphere: implications for urban climate modeling
2.2. Simulations setup
In order to understand the non-local effects of different urban forms on the ABL, a series of simulations are performed. The computational domain is (Lx, Ly, Lz) = (4500, 1500, 750) m with (216, 72, 36) grids in streamwise, spanwise and vertical directions. The characteristic length scale is defined as zi = 500m. Six arrays of cubic buildings with three different types of streamwise inhomogeneity form the idealized urban morphology. The mean building height for all cases is same, but the height of buildings varies in streamwise direction according to three different shapes, namely hill, flat, and valley shape (Figure 1). They will be referred as Case Hill, Case Flat and Case Valley in the following sections in order to be concise and clear. In addition, three different building heights are represented by 3, 5, and 7 grids respectively, and their heights are normalized by zi when showing in Figure 1. This design has guaranteed three different urban areas have the same surface area to volume ratio.
The boundary condition for the domain is horizontally periodic. For velocity, it is no-slip bottom boundary condition and stress-free top boundary condition. The boundary condition for temperature is keeping the heat flux on all surfaces (i.e. ground, wall, and roof) fixed at nondimensional value 0.05, and zero flux at the top of the domain. A prescribed pressure gradient is imposed to the domain and consistent for all the cases. Neutral condition is considered, and the buoyant force is neglected.
All simulations are run for 40 eddy turnover times, defined as the characteristic length scale, i.e. zi, divided by the friction velocity, to reach the statistical steady state, and then run for another 20 eddy turnover times to collect and analyse the data. Convergence tests results proved 40 eddy turnover times are sufficient.
Figure 1: Domain setup for urban areas with hill shape (left), same height (middle), and valley shape (right).
Additionally, because of the horizontally periodic boundary condition, the simulated domain actually consists of an infinite number of the repeated patch shown in Figure 1 in streamwise and spanwise direction. It is not important for spanwise direction since when consider the non-local effect, the spatial average will be taken at this direction. However, the repeated occurrence of buildings in streamwise may influence the judgment of horizontal extent of urban area and corresponding transportations of momentum and heat. Therefore, sensitivity tests are conducted to explore the effects of the streamwise domain size, in which Lx is elongated to 5250m with 288 grids and other settings remain same (Figure 2).

124
Yanle Lu and Qi Li
Figure 2: Top view of the original domain (top) and sensitivity test domain (bottom)
3. Results and discussionIn this section, the basic distribution of velocity field is analysed and compared. Afterwards, the difference of non-local effects of three cases is investigated by the horizontal extent and vertical extend. <>xirepresents the spatial average of some quantity in 𝑥𝑥* direction, and the bar over a text refers to the time average.
3.1. Mean Velocity
The distribution of velocity field is shown as below, both streamwise velocity < 𝑢𝑢 >y (Figure 3) and vertical velocity < 𝑤𝑤 >y (Figure 4) are taken average on time and the spanwise direction.
The structure for streamwise velocity above the urban domain, indicated by the black contour line, is similar in Case Flat and Case Hill. They both show one down and up shape and have one trough in the domain. However, for Case Valley, there is a shallow trough just above the first and the second columns of buildings and then followed by another deeper trough at the end of the columns of buildings.
Distinct differences of vertical velocity among cases are illustrated in Figure 4: Time and spanwise averaged vertical velocity, original (left) and sensitivity test (right). For Case Flat and Case Hill, they both have one upward deflection and downward deflection in the domain. The buildings decelerate the incoming flow and therefore lead to an upward vertical motion at the upwind region of the canopy, and the majority of the urban area as shown in the figure has positive vertical velocity. From near the end of the building complex, <w >y becomes negative because of the requirement for continuity. The only difference between these two cases is that the dividing position of positive and negative vertical velocity in Case Flat is more downwind than Case Hill.
However, in Case Valley, there are two positive and two negative vertical velocity centres correspond to the two troughs identified from the distribution of streamwise velocity. Therefore, we can reasonably conjecture that the occurrence of two arrays of tall buildings on the two edges of the urban area will lead to two upward deflections, which contribute to the main difference compared to the other two cases.

125
A numerical study on the non-local effects of urban form in the lower atmosphere: implications for urban climate modeling
To summarize, the Case Flat and Case Hill show similar velocity fields characteristics. However, Case Valley shows apparent different features. In addition, the results for sensitivity test domain remain similar to the original setup, which indicates Lx equals to 4500m with 216 grids is sufficient for the simulations. Therefore, the following sections will only show the results from original domain setup.
Figure 3: Time and spanwise averaged streamwise velocity, original (left) and sensitivity test (right)
Figure 4: Time and spanwise averaged vertical velocity, original (left) and sensitivity test (right)

126
Yanle Lu and Qi Li
3.2. Horizontal extent
In order to characterize the horizontal extent (i.e., the impact region) of the urban area, momentum deficit (or velocity deficit) is considered. It represents the loss of the momentum associated with the drag exerted by the buildings on the ambient flow. It is traditionally assessed by the velocity deviation from the mean flow and is always used to analyse the influence of the test element to the background flow (Belcher et al., 2003; Banta et al., 2015). Here we use the metric scaled streamwise velocity, which is defined in Equation 3, to evaluate it:
Where:
(3)
< 𝑢𝑢 >x, y (𝑧𝑧) and < 𝑢𝑢 >y(𝑥𝑥, 𝑧𝑧) represent the vertical profile of horizontally averaged streamwise velocity and spanwise averaged streamwise velocity, respectively.
Similarly, scaled temperature is also computed to analyse the influence in terms of heat, and it is defined by:
Where:
(4)
< �̅�𝜃 >x,y (𝑧𝑧) and < �̅�𝜃 >y (𝑥𝑥, 𝑧𝑧) refer to the vertical profile of horizontally averaged temperature and spanwise averaged temperature, respectively.
The results of scaled streamwise velocity and scaled temperature are shown below (Figure 5). The horizontal extent is determined by the location where the scaled velocity changes signs. Then the dividing lines for Case Flat and Case Hill are at the grid number 140, and 150 for Case Valley, which suggests that Case Valley has a longer impact region in the downwind direction than the other two cases.
As for the scaled temperature, there is a more obvious high temperature region in Case Hill between the middle and the end of the arrays of buildings. It has been clarified in the section 2 that the heat flux and the surface area are the same in the three types of urban areas. Therefore, this feature indicates that the ability of Case Hill to transport heat is not as good as the other two forms and may aggravate the Urban Heat Island (UHI) phenomenon. It is only a conjecture and needs to be further explored by analysing the heat budget and detailed heat flux terms, which will be examined in future studies. The dividing lines for sign changing show a similar characteristic to the scaled velocity field, where the location is further for Case Valley.
Therefore, the horizontal extent is longer for Case Valley, and similar for Case Flat and Case Hill.

127
A numerical study on the non-local effects of urban form in the lower atmosphere: implications for urban climate modeling
Figure 5: Scaled streamwise velocity (left) and scaled temperature (right)
3.3. Vertical extent
Apart from the horizontal extent, we also investigate if there is any difference in the vertical extent. The vertical extent is defined as some specific height above where the turbulent structure becomes statistically spatially homogeneously in streamwise direction. In other words, the influence of the underneath buildings cannot be observed, and the turbulent properties become indistinguishable from one another.
There are several methods to indicate and determine the vertical extent. Here we first consider the vertical extent of urban influence being commensurate with the lower bound where the mean streamwise velocity, i.e. 𝑢𝑢, profile follows the prediction by the Monin-Obukhov similarity (MOS) (Monin and Obukhov, 1954). Under neutral stability, 𝑢𝑢 recovers to the logarithmic profile. In essence, this method assumes that even though urban forms impact the starting height where 𝑢𝑢2 follows MOS, above the vertical extent of urban influence, different urban forms in these three cases can be succinctly accounted for via the roughness length z0m and displacement height d in the similarity profiles. Therefore, comparison of the difference of this starting height is indicative of the vertical influence of urban form.
The mean vertical profiles of streamwise velocity is calculated for the urban area, which is defined by the horizontal extent in section 3.2, and also the non-urban area. The velocity is first averaged in time and spanwise direction, and then take average on different ranges on streamwise direction and eventually get the vertical profiles to represent the vertical structure of < 𝑢𝑢2 >- at urban area and non-urban area. The notation of it is described below, in which the right-hand side denotes the logarithmic relation (i.e., MOS relationship under neutral stability), and the left-hand side refers to the vertical profile calculated from the simulation data:
(5)

128
Yanle Lu and Qi Li
where 𝑘𝑘 = 0.41 is Von Kármán constant; 𝑧𝑧 denotes to height; 𝑑𝑑 is the displacement height, defined as the height where the wind speed is zero due to obstacles such as buildings, and here we get it based on the log law fit for urban area; 𝑧𝑧9: is the roughness length scale; 𝑥𝑥& − 𝑥𝑥; represents the ranges of streamwise grids.
After performing a least-square regression to according to Equation 5 for different starting heights for the urban area, we can find the height with best coefficient of determination (𝑅𝑅;) for three cases(Figure 6). The best fit height is almost the same, and the values for 𝑅𝑅; are also similar, which indicate that the vertical extent is almost the same for different cases. In other word, even though their local influence may different from case to case, the influence on the atmosphere above the urban or where the influence caused by the different streamwise inhomogeneity extends to a similar height. The result for non-urban area is also shown in Figure 6 used to compare with the urban area and indicate the local influence caused by buildings in the vertical direction. In addition, the results for three cases are almost the same, which further prove that the horizontal extent we defined earlier is reasonable.
To increase the robustness of the determination of the vertical extent of urban influence, another metric, i.e. the blending height, is also considered here, which refers to the critical height above which there is a well-mixed boundary layer and no localized deviations from the domain average exist. This trend can be visualized by the deviation of the local streamwise velocity vertical gradient from the whole domain averaged value, and it is calculated by Equation 6 and the contours are shown in Figure 7.
(6)
Figure 7 clearly shows the large effect of the buildings to the local area and the area just above the canopy, and the estimation of the blending height. The blending heights are almost identifying, which is consistent with results given.
Figure 6: 𝑅𝑅; of the log law fit of streamwise velocity vertical profile for urban area (left) and non-urban area(right)

129
A numerical study on the non-local effects of urban form in the lower atmosphere: implications for urban climate modeling
Figure 7: Deviation of local streamwise velocity vertical gradient from domain average, and the blending height (red dash line)
4. Conclusions and further workThree different types of urban forms with same mean building height but different streamwise inhomogeneity, i.e. the height of columns of buildings with hill, flat, and valley shape, are designed to investigate the non-local effects of different urban forms on the ABL.
The Case Valley shows apparent different features in the distribution of velocity field compared to the other two forms. At the same time, we explored the horizontal extent and the vertical extent with several objective metrics to quantify the difference among urban forms. Our preliminary results show the horizontal extent varies among different urban forms, even though they have same surface area to volume ratio and same mean building height. Case Valley has longer horizontal extent than the other two cases. However, they do share similar characteristic in terms of the vertical extent.
Future work will focus on the difference in the momentum and heat budgets and the bulk heat transfer coefficient and compare quantitatively to understand the difference of transportation of momentum and heat, and the corresponding local and reginal impact among different urban forms. In addition, unstable condition will be considered to understand the effects of buoyant force on these processes. With all the simulations and analysis, we will establish a clear understanding of the impact of streamwise inhomogeneity of urban forms, and further explore using different statistical metrics of building height information to better represent the certain urban form when parameterize surface effects in mesoscale models.
which may further influence the momentum and heat budgets and lead to huge differences with respect to the non-local effect.

130
Yanle Lu and Qi Li
Acknowledgements This work is supported by the National Science Foundation (NSF-AGS-2028644). The simulations were conducted on the supercomputing clusters of the National Centre for Atmospheric Research through projects UCOR0029.
References Banta, R. M. et al. (2015) ‘3D Volumetric Analysis of Wind Turbine Wake Properties in the Atmosphere Using High-
Resolution Doppler Lidar’, Journal of Atmospheric and Oceanic Technology, 32(5), pp. 904–914. doi: 10.1175/JTECH-D-14-00078.1.
Belcher, S. E., Jerram, N. and Hunt, J. C. R. (2003) ‘Adjustment of a turbulent boundary layer to a canopy of roughness elements’, Journal of Fluid Mechanics, 488(488), pp. 369–398. doi: 10.1017/S0022112003005019.
Bou-Zeid, E. et al. (2009) ‘The Effects of Building Representation and Clustering in Large-Eddy Simulations of Flows in Urban Canopies’, pp. 415–436. doi: 10.1007/s10546-009-9410-6.
Bou-zeid, E., Meneveau, C. and Parlange, M. (2005) ‘A scale-dependent Lagrangian dynamic model for large eddy simulation of complex turbulent flows’, 025105(October 2004). doi: 10.1063/1.1839152.
Carpentieri, M. and Robins, A. G. (2015) ‘Influence of urban morphology on air flow over building arrays’, Jnl. of Wind Engineering and Industrial Aerodynamics. Elsevier, 145, pp. 61–74. doi: 10.1016/j.jweia.2015.06.001.
Chester, S., Meneveau, C. and Parlange, M. B. (2007) ‘Modeling turbulent flow over fractal trees with renormalized numerical simulation’, 225, pp. 427–448. doi: 10.1016/j.jcp.2006.12.009.
Collier, C. G. (2006) ‘The impact of urban areas on weather’, Quarterly Journal of the Royal Meteorological Society. John Wiley & Sons, Ltd, 132(614), pp. 1–25. doi: 10.1256/qj.05.199.
Kanda, M., Moriwaki, R. Y. O. and Kasamatsu, F. (2004) ‘Large-eddy Simulation of Turbulent Organized Structures within and above Explicitly Resolved Cube Arrays’, Boundary-Layer Meteorology, 112(2), pp. 343–368. Available at: https://doi.org/10.1023/B:BOUN.0000027909.40439.7c.
Li, Q. et al. (2020) ‘Revisiting the relation between momentum and scalar roughness lengths of urban surfaces’, Quarterly Journal of the Royal Meteorological Society. John Wiley & Sons, Ltd, n/a(n/a). doi: 10.1002/qj.3839.
Li, Q., Bou-zeid, E. and Anderson, W. (2016) ‘The impact and treatment of the Gibbs phenomenon in immersed boundary method simulations of momentum and scalar transport’, 310, pp. 237–251. doi: 10.1016/j.jcp.2016.01.013.
Monin, A. S. and Obukhov, A. M. (1954) ‘Basic laws of turbulent mixing in the surface layer of the atmosphere’, 24(151), pp. 163–187.
Oke, T., Mills, G., Christen, A., & Voogt, J. (2017). Introduction. In Urban Climates (pp. 1-13). Cambridge: Cambridge University Press. doi:10.1017/9781139016476.002
Ritchie, H., & Roser, M. (2018) ‘Urbanization’, Published online at OurWorldInData.org. Retrieved from: https://ourworldindata.org/urbanization
Su, H. B. et al. (1998) ‘Turbulent statistics of neutrally stratified flow within and above a sparse forest from large-eddy simulation and field observations’, Boundary-Layer Meteorology, 88(3), pp. 363–397. doi: 10.1023/A:1001108411184.
Yang, L. et al. (2016) ‘Contrasting impacts of urban forms on the future thermal environment: example of Beijing metropolitan area’, Environmental Research Letters. IOP Publishing, 11(3), p. 34018. doi: 10.1088/1748- 9326/11/3/034018.
Zhang, D. et al. (2019) ‘The Influences of Urban Building Complexes on the Ambient Flows over the Washington – Reston Region’, pp. 1325–1336. doi: 10.1175/JAMC-D-19-0037.1.

131
The 54th International Conference of the Architectural Science Association (ANZAScA) 2020
A simulation study to assess the energy efficiency and thermal comfort performance of internal wall assemblies for residential
construction in warm and humid climate
Shailee Goswami1 and Vinay Natrajan2 1,2Saint Gobain India Pvt. Ltd. (R&D), Chennai, India
{shailee.goswami1, vinay.natrajan2}@saint-gobain.com
Abstract: Wall assemblies, both external and internal, have an impact on the thermal comfort and energy performance of the buildings. While the effect of external envelope is well documented in literature, the studies on influence of internal wall partitions remain limited. Thus, a simulation study is conducted to understand the performance of different internal wall partitions in a residential apartment located in warm and humid climate (Chennai, India). The two properties of wall assemblies that impact the energy and comfort in a space are thermal transmittance (U-value) and thermal mass. Four different internal partitions are simulated in the model: brick, concrete, AAC, and drywalls, which have varied thermal conductivity and thermal capacity. The external wall in the model is considered to be of brick wall in all four cases. The TRNSYS simulation results for the considered model indicate that lightweight partitions, like drywalls and AAC, can reduce the cooling consumption by 12% and increasing the occupied thermal comfort hours by 6-19% as compared to the base case (internal and external wall – brick). Furthermore, the data is also processed in MATLAB to yield spatial distribution of operative temperature in the room, highlighting the ability of lightweight materials to lose heat faster.
Keywords: cooling consumption, thermal comfort, TRNSYS, MATLAB
1. IntroductionTotal energy consumption in buildings accounts for 35% of energy use in India, and this energy demand is expected to grow by 8% annually (Rawal et al., 2012). A significant part of the energy need can be attributed to the heating, ventilation, and air-conditioning (HVAC) systems (PACE-D, 2014) which are used to regulate indoor thermal comfort and indoor air quality (IAQ). In this regard, the use of suitable high performing building materials can help in improving the building performance.
The thermophysical properties of building materials have a significant role to play in affecting the cooling energy consumption and thermal comfort within a space (Vincelas et al., 2017). Thermal transmittance or the U-value (W/m2K) is the heat transfer rate through the material and is inversely proportional to the thermal resistance or R-value (m2K/W) (Jannat et al., 2020). The overall R-value of an assembly is calculated by adding the thermal resistance of each material layer, which is derived from
Imaginable Futures: Design Thinking, and the Scientific Method. 54th International Conference of the Architectural Science Association 2020, Ali Ghaffarianhoseini, et al (eds), pp. 131–140. © 2020 and published by the Architectural Science Association (ANZAScA).

132
Shailee Goswami and Vinay Natrajan
its thermal conductivity (W/mK) and thickness. High R-value (or low U-value) means lower heat transmission through the assembly, which aids in reducing the cooling loads.
Another thermal property that governs a material’s performance is its Thermal mass: the ability of a material to absorb and store heat. The spaces with higher thermal mass exhibit a delayed reaction to the surrounding ambient changes, while spaces with lower thermal mass react more quickly to it (Reilly and Kinnane, 2017). Thermal mass reduces the internal temperature fluctuation and is often perceived as an effective passive strategy to reduce the cooling loads. For instance, a study by Saldanha and Piñon (2013) showed that massive walls can reduce the peak cooling or heating loads by 15%. Another study by Kumar et al. (2018) demonstrated that in a naturally ventilated office space located in Jaipur (composite climate), high thermal mass walls could provide an additional 40% and 98% of comfort hours in summers and winters, respectively. As opposed to the common belief that thermal mass is good, its inappropriate use could be a hindrance to energy savings and thermal comfort. The simulation results by Karlsson et al. (2013) showed that the use of heavy walls resulted in increased heating energy.
Thus, it is necessary to study different use cases in detail to prescribe an optimal thermal mass for a space. The resulting energy savings and thermal comfort greatly depend on other factors as well, such as, transient cooling or heating schedule (Gregory et al., 2008), design, orientation, window to wall ratio, and external climate conditions.
1.1 Research Objective
The external weather conditions and construction types in India are diverse and the existing body of literature concerning the impact of building materials and their performance remains limited (Kumar et al., 2018). This scientific study intends to showcase developed simulation protocol along with analyzing the impact of internal partitions on energy consumption and thermal comfort which is specific to Indian climatic conditions. The simulation study is performed for the warm and humid climate type, for the city of Chennai, India. A residential apartment is simulated as a test case to characterize the impact of internal partitions in a space. The external walls configuration is considered to be same in all cases.
The main objectives of the study are: • Comparison of the impact of four selected internal wall assemblies on cooling consumption and
thermal comfort in the given residential apartment. To recommend the optimal wall systems thegiven model and climate (warm and Humid).
• Showcase an integrated simulation approach that combines TRNSYS and MATLAB for computingoperative temperature contours along with analyzing the cooling consumption and thermalcomfort.
2. Methodology
2.1 Simulation Methodology
The overall methodology is divided into two parts. Firstly, TRNSYS is used for building energy simulation and then MATLAB is used to post process and visualize the thermal comfort data. TRNSYS is a graphical based whole building software environment, which is capable of simulating the behavior of transient systems. It uses ‘kernel’ as its simulation engine that can read and process the input file along with plotting system variables. The inputs to this software are the building geometry, weather data, material properties, scheduling of the air-conditioning and internal gains: lighting, equipment and occupants. The

133
A simulation study to assess the energy efficiency and thermal comfort performance of internal wall assemblies for residential construction in warm and humid climate
TRNSYS output of cooling power helps with the energy analysis, and the other outputs like surface temperature, room air temperature, incident solar radiation are used as an input in MATLAB.
Figure 1 Integrated simulation methodology: TRNSYS and MATLAB
MATLAB is used in this study as a post-processing tool for visualizing the thermal comfort within the
room. It utilizes the TRNSYS outputs of room air temperature, surface temperature for all six surfaces and incident solar radiation to compute the contour plots of the operative temperature in a space. Operative temperature is a simplified method of quantifying perceived thermal comfort and is calculated using the below equation –
Top x, t = αTair t + 1 − α TMRT(x, t) (1)
Where,
Top = operative temperature; Tair = air temperature; TMRT = mean radiant temperature and α = ratio of convective to radiative heat transfer
The operative temperature (Top) is the weighted sum of ambient air temperature (Tair) and mean radiant temperature (TMRT) and alpha (α) is the ratio of convective to radiative heat transfer perceived on the human skin. MATLAB computes the calculated operative temperature ranges in the form of contours, which provides better visualization for the thermal comfort across the occupied space. The method is capable of further analyzing the thermal conditions in terms of percentage time comfort and percentage area comfort, however, in this study it is only utilized for visualizing and assessing the operative temperature contours.
2.2 Simulation Cases
A residential multi-zone model is used for analyzing the impact of internal wall partitions on the energy consumption and thermal comfort in a space. The glazing percentage or the window to wall ratio (WWR) for the external envelope is considered around 20%, which is representative of typical Indian residences.
The AC scheduling in simulations is set to mimic typical air-conditioning usage in apartments i.e., evening and night-time cooling. The AC operation is as follows: Living room (cooling ON- 6pm to 10pm),

134
Shailee Goswami and Vinay Natrajan
Bedroom (cooling ON- 10pm to 6am) along with an adjacent non-AC space which represents areas like kitchen, multipurpose room (study/dinning) and washrooms. The AC set point temperature is considered to be 24℃ with air change rate of 0.35 ACH as per ASHRAE 62.1, in all four simulation cases.
Figure 2 Residential apartment layout and simulation model in TRNSYS
Table 1 Building model details and input parameters
Parameter Value
Location and climate Chennai (Warm and Humid climate)
Weather file TMY2
Room dimensions (L*W*H)
Glazing dimensions (L*H)
Living room - 3m*4m*3m Bedroom - 3m*4m*3m Non air-conditioned space (multipurpose room, kitchen, toilet) - 6m*3.5m*3m
West - 1m*1m (Living) South - 1.75m*2.1m (Living); 2m*1m (Bedroom) East - 2m*1m (Bedroom); 0.75m*1m (Kitchen); 0.75m*1m (Multipurpose room)
Overall WWR 20%
Glazing specification Clear glass (U-value 5.5 W/m2K; SHGC 0.8)
Living room - 6pm to 10pm Bedroom - 10pm to 6am
AC Set-point 24
Simulation period 8760 hours (1 year)
External wall Brick wall for all four cases
Case 1 - Brick (Base case) Internal wall partitions Case 2 - Concrete
Case 3 - Autoclaved aerated concrete (AAC) blocks
AC Schedule

135
A simulation study to assess the energy efficiency and thermal comfort performance of internal wall assemblies for residential construction in warm and humid climate
Case 4 - Drywalls (with thermal bridging)
Table 2 summarizes the thermal properties of the materials: thermal conductivity, specific heat capacity and density along with the thickness of each layer. The heat transmittance (U-value) and thermal mass for the assemblies are further calculated using these properties. Apart from the primary material (brick, concrete and AAC), the 12.5 mm thick cement plaster finish on either sides of the partition wall is considered in all cases except drywalls.
Table 2 Thermal properties of building materials
Assembly details
Material layer
(In to out)
Thickness
m
Conductivity
W/mK
Specific Capacity
Kj/kgK
Heat Density
kg/m3
U value
W/m2K
Thermal mass
Wh/m2K
Brick wall Cement plaster 0.0125 0.72 0.84 1762
(external) Burnt Brick 0.2 0.98 0.8 1920 2.4 96.4
225 mm Cement plaster 0.0125 0.72 0.84 1762
Brick wall Cement plaster 0.0125 0.72 0.84 1762
125 mm Burnt Brick 0.1 0.98 0.8 1920 3.2 53.4
Cement plaster 0.0125 0.72 0.84 1762
Concrete Cement plaster 0.0125 0.72 0.84 1762
125 mm Concrete block 0.1 1.41 0.88 2349 3.6 68.2
Cement plaster 0.0125 0.72 0.84 1762
AAC wall Cement plaster 0.0125 0.72 0.84 1762
125 mm AAC block 0.1 0.18 0.79 642 1.3 24.6
Cement plaster 0.0125 0.72 0.84 1762
Drywall Gypsum board* 0.0125 0.16 0.84 1200
120 mm Air Cavity** 0.095 0.026 1 1.16 0.51+ 7.1
Gypsum board* 0.0125 0.16 0.84 1200 +Derived U-value after considering the effect of thermal bridging due to metal stud (structural component). Source – ECBC (2017); *Gyproc Drywall handbook; **Air @30n (Klein and Alvarado, 2012)
The drywalls are made of 12.5 mm thick gypsum boards on both sides with C-shape metal stud in- between that holds the boards together and provide structural strength. These metal studs have high thermal conductivity and act as thermal bridges for the assembly, resulting in increased overall heat transmittance (U-value). This effect of thermal bridging is taken into account during simulation. Most of the material properties are taken from the energy conservation building code (2017) of India.
3. Results and AnalysisAs explained in the methodology section, the simulation for quantifying the performance of internal wall partitions is performed using the combination of TRNSYS and MATLAB. This section discusses the result outcome for each of the simulated case in terms its impact on energy savings and thermal comfort.

136
Shailee Goswami and Vinay Natrajan
3.1 Energy analysis
To study the impact of internal partition on cooling energy savings, a comparison of monthly and annual cooling consumption (kWh) for the conditioned spaces (living room and bedroom) is done for different cases. As seen in Figure 3, the relatively heavyweight wall systems like brick and concrete walls consume more energy compared to the lightweight assemblies like AAC and drywalls. The lightweight walls have lower thermal mass and therefore are capable of rejecting heat quickly during the night time. This ability of the drywall partition to cool down faster directly impacts the energy consumption of the HVAC system. Table 3 summarizes the annual cooling energy savings for the simulated cases. The numbers indicate that the lightweight systems like AAC and drywall could provide the energy savings of around 7%-12% as compared to the base case (brick walls).
400
Monthly cooling consumption (kWh) Annual cooling consumption (kWh)
[VALU[VEALUE
350 5000 ] ] [VALU[VEALUE
300 250 200 150 100 50
] ] 4000
3000
2000
1000
0
0 Jan Feb Mar AprMay Jun Jul Aug Sep Oct Nov Dec Brick Concrete AAC Drywalls
Figure 3 Monthly and annual cooling energy consumption (kWh)
Table 3 Annual cooling energy consumption (kWh) and percentage savings for different partition walls
Internal wall Annual cooling energy consumption (kWh)
Energy savings compared to Base case
Brick 4123 Base case Concrete 4241 -2.9% AAC 3825 7.2% Drywalls 3620 12.2%
The thermal mass and U-value of the wall assemblies primarily affect its surface temperature, which results in reduced cooling consumption and enhanced thermal comfort in a space. Figure 4 shows the details for North facing internal partition wall in bedroom. For each of the four iteration cases, the hourly variation is plotted for surface temperature and cooling energy consumption. The steeper drop in the surface temperature of the drywall partition is attributed to its lower thermal capacity. As highlighted in Figure 4, the drywalls are exhibiting 1 -3 lower surface temperature during the occupied hours as compared to brick or concrete. Lightweight wall assemblies respond more quickly to
Cool
ing
cons
umpt
ion
(kW
h)
Cool
ing
cons
umpt
ion
(kW
h)

137
A simulation study to assess the energy efficiency and thermal comfort performance of internal wall assemblies for residential construction in warm and humid climate
the AC set point temperature and hence the room cools down faster as compared to heavyweight walls like brick and concrete.
Figure 4 Hourly cooling energy consumption and surface temperature for bedroom North partition wall on May 1st (summer)
3.2 Thermal comfort analysis
As explained in the previous section, the use of lightweight partition walls is resulting in reduced energy consumption in the space. To compare the wall assembly’s thermal comfort performance, the hourly operative temperatures of the primarily occupied air-conditioned spaces (living and bedroom) are analyzed. The Indian model for adaptive thermal comfort (IMAC) standard, which is given in National building code (2016) of India, is referred for the thermal comfort analysis. The total comfort hours falling under the comfort band for each case are computed for the air-conditioned living room and bedroom by considering 90% acceptability range.
Table 4 compares the calculated values of annual comfort hours for both the air-conditioned rooms. The simulation analysis is done by considering the space to be occupied only during the night-time when

138
Shailee Goswami and Vinay Natrajan
the AC is ON in both the rooms (living and bedroom). As seen in the results, drywall partitions are providing maximum comfort hours in the room followed by AAC. The low surface temperature of drywalls at night-time helps in reducing the resultant operative temperature thereby increasing the comfort hour for the occupants. Drywalls and AAC partitions can increase total comfort hours in the range of 6%-19% as compared to conventional wall systems like brick or concrete.
Table 4 Annual comfort hours for conditioned spaces (Living and bedroom)
Internal partition
Living –
Comfort hours
% increase in comfort hours compared to Base case
Bedroom –
Comfort hours
% increase in comfort hours compared to Base case
Brick 512 Base case 1923 Base case
Concrete 507 -1% 1830 -5%
AAC 543 6% 2233 14%
Drywall 560 9% 2365 19%
2500
2000
1500
1000
500
0
Annual Comfort Hours
2233 2365
1923 1830
512 507 543 560
Brick Concrete AAC Drywall
Living
Bedroom
Figure 5 Total comfort hours for conditioned spaces (Living and bedroom)
Figure 6 shows the spatial thermal comfort contours for bedroom, which are computed using the surface temperatures of walls, ceiling and floor and room air temperature. The contours are plotted at three time intervals during the occupied hours at night: 11pm, 1 am, and 3am. Results are shown for all four internal wall partitions: brick, concrete, AAC, and drywall. It can be observed from the contour plots that at all time steps, the operative temperatures in case of high mass assemblies like brick and concrete are higher as compared to lightweight systems like drywalls and AAC.
It can also be observed that due to low thermal mass, the operative temperature in case of drywall and AAC falls sharply as compared to the massive walls that store heat for longer period. At 3 am, the temperature distribution inside the room having drywalls is more uniform and much lower, compared to room with brick and concrete. As such, this is consistent with the fact that the thermal heat capacity for the lightweight assemblies is much lower than high mass walls. Consequently, the indoor room temperature also approaches the AC set point temperature more quickly in case of drywalls that results in reduces energy consumption and increased comfort hours.
Com
fort
hou
rs

139
A simulation study to assess the energy efficiency and thermal comfort performance of internal wall assemblies for residential construction in warm and humid climate
Figure 6 Thermal comfort contours for bedroom showing operative temperature (x and y axis) during occupied hours on May 1st (summer)
4. ConclusionThe thermal properties of internal wall partitions are demonstrated to have a significant impact on the indoor conditions of a space. Therefore, only the careful selection of internal wall partitions would result in reduced cooling loads and enhanced thermal comfort for the occupants. The simulation study conducted on the different internal walls concludes that the wall selection significantly impacts the indoor energy and comfort levels in the spaces. The thermal mass of the internal wall systems governs its ability to lose or gain heat as a function of time. The conventional wall partitions like brick and

140
Shailee Goswami and Vinay Natrajan
concrete take more time in losing the heat stored within them and hence exhibit higher surface temperature during night-time. In typical residential spaces like bedrooms, this could result in higher operative temperature and hence could cause thermal discomfort to the occupants. On the other hand, lightweight systems like drywalls and AAC lose heat much faster and provide a sufficient reduction in the indoor temperature. As per the calculation for bedroom space, the drywalls were able to increase around 9% - 19% of comfort hours followed by AAC block which is exhibiting 6% - 14% of the increase.
The operative temperatures of the room directly impact cooling energy consumption. A room with massive walls takes more time to reach the AC set-point. The high thermal mass inhibits the surface temperature fluctuation and results in higher operative temperature which increases the cooling energy loads at night-time. On the other hand, the lightweight systems like AAC and drywalls lose heat much faster and help in reducing the cooling energy consumption. The drywalls can reduce around 12% of the annual cooling load compared to the conventional brick wall. Thus, for a residential space where the AC is operational during night-time, it is recommended to use lightweight internal wall partitions.
Future scope of the study The current findings of the study are based on one type of residential apartment situated in a warm and humid climate (Chennai) and can be further studied in terms of different apartment layouts and weather types. Furthermore, the effect of natural ventilation and other type of mixed-mode functioning could be analysed.
References Rawal, R., Vaidya, P., Ghatti, V., Seth, S., Jain, A., Parthasarathy, T., (2012) Energy code enforcement for beginners: a
tiered approach to energy code in India, American Council for an Energy-Efficient Economy, Pacific Grove, California, 313-324
P.A.C.E.-D. Technical Assistance Program, (2014) HVAC Market Assessment and Transformation Approach for India Vincelas, F.F.C., Ghislain, T., Robert, T., (2017) Influence of the types of fuel and building material on energy savings
into building in tropical region of Cameroon, Applied Thermal Engineering 122, 806–819 Jannat, N., Hussien, A., Abdullah, B., Cotgrave, A., (2020) A Comparative Simulation Study of the Thermal Performances
of the Building Envelope Wall Materials in the Tropics, Sustainability 2020, Vol. 12, 4892 Reilly, A., Kinnane, O, (2017) Impact of thermal mass on building energy consumption, Applied Energy, 198, 108–121
Saldanha, C., Piñon, J., (2013) Influence of Building Design on Energy Benefit of Thermal Mass Compared to Prescriptive U-Factors, Thermal Performance of the Exterior Envelopes of Whole Buildings XII International
Conference, Florida, USA Kumar, S., Singh, M., Mathur, A., Mathur, S., Mathur, J., (2018) Thermal performance and comfort potential estimation
in low-rise high thermal mass naturally ventilated office buildings in India, Journal of Building Engineering, 20, 569–584
Karlsson, J., Wadsö, L., Öberg, M., (2013) A conceptual model that simulates the influence of thermal inertia in building structures Energy and Buildings, 60, 146–151
Gregory, K., Moghtaderi, B., Sugo, H., Page, A. (2008) Effect of thermal mass on the thermal performance of various Australian residential constructions systems, Energy Buildings, 40, 459-465
ECBC - Energy conservation code (2017), Bureau of Energy Efficiency, New Delhi, India Gyproc Drywall handbook, Saint Gobain, Available from: <https://www.gyproc.in/pdf/Drywall-Handbook.pdf> Klein, S.A., and Alvarado, F.L., Property tables and charts, EES software (2012) Available from:
https://www.me.psu.edu/cimbala/me433/Links/Table_A_9_CC_Properties_of_Air.pdf; (accessed 20 Feb 2020) NBC - National Building Code of India (2016), Bureau of Indian Standards, New Delhi, India

141
The 54th International Conference of the Architectural Science Association (ANZAScA) 2020
A study of illuminance data generation using the luminous efficacy approach: A case study of Hong Kong
Emmanuel Aghimien1, Danny Li2 1, 2 City University of Hong Kong, Kowloon, Hong Kong
{[email protected], [email protected]}
Abstract: In Hong Kong, the building sector accounts for 90% of the total electrical energy consumption and 13% of this is used on achieving visual comfort through artificial lighting. An alternative approach to this can be the use of daylighting, which brings about significant savings in lighting costs. In view of this, illuminance data is required for obtaining efficient design solutions. However, the generation of illuminance data poses a problem because of the limited number of measuring stations. Thus, an alternative approach, such as deriving illuminance data through luminous efficacy models, is highly desired. Furthermore, the whole spectrum of skies in the world was classified into a range of 15 standard skies by the International Commission on Illumination (CIE) in 2003. This study, therefore, presents the work of modelled global, diffuse and direct luminous efficacy under the 15 CIE skies. Sky luminance distribution of June 2019 to February 2020 was used for CIE Sky classification. It went further to propose a vertical luminous efficacy model needed for the prediction of vertical illuminance data. Results from prediction and other statistical analysis are presented in this study.
Keywords: Daylighting, Luminous Efficacy, Energy Savings, CIE Standard Skies
1. Introduction
The tremendous growth of world energy use has led to concerns over its impacts on the ecosystems (GhaffarianHoseini et al., 2013). Studies show that the building sector is one of the major consumers of energy by contributing 40% of the world’s total energy consumption (Seyedzadeh et al., 2018). One key issue addressed by literature is achieving a balance between supplying adequate lighting and reducing energy demand. In terms of evaluating passive and active energy-saving practices, solar radiation and daylight data are essential (Lou et al., 2019). Hence, the use of a solar-based conversion system and daylighting schemes are alternative design strategies in building energy efficiency. Daylighting is also useful for enhancing visual comfort and reducing environmental pollution (Li et al., 2008).
Over time, long-term ground measurement is the most effective way of deriving databases for solar radiation, daylight data and other climatic parameters (He and Ng, 2010). Usually, the recording practice favours solar irradiance data with emphasis on horizontal global and diffuse components (Li et al., 2008). However, unlike solar irradiance, there is difficulty in deriving illuminance data since there is a scarcity of facilities devoted to measuring it (Mayhoub and Carter, 2011). Also, the required data in
Imaginable Futures: Design Thinking, and the Scientific Method. 54th International Conference of the Architectural Science Association 2020, Ali Ghaffarianhoseini, et al (eds), pp. 141–150. © 2020 and published by the Architectural Science Association (ANZAScA).

142
Emmanuel Aghimien, Danny Li
most building façade designs is that of the vertical and inclined surfaces (Li et al., 2008). This data is necessary due to the impact of solar radiation and daylight on building facade. In the absence of measured daylight illuminance data, an approach might be its prediction using the luminous efficacy (K) approach (Ahmad and Tiwari, 2010).
Luminous efficacy is not constant but varies with sky condition. It is, therefore, pertinent to carry out luminous efficacy predictions under various sky conditions. In 2003, the Commission International de Eclairage (CIE) adopted 15 standard sky distributions and these cover the whole spectrum of the skies in the world (Li et al., 2014). For this classification, sky conditions of the same category would have similar sky luminance patterns, and this allows for easy identification (Li et al., 2008). These sky models are valuable for the designers while considering the use of daylighting in buildings. This study focuses on generating horizontal luminous efficacy for the 15 CIE standard skies in Hong Kong. It also went further to determine the luminous efficacy and illuminance on four vertical surfaces.
2. Data measurements
The City University of Hong Kong houses a meteorological station which was established in 1991 to investigate the solar and sky characteristics. This meteorological station provided solar irradiance, daylight illuminance, and luminance distributions data for this study. Measured horizontal global, direct and diffuse illuminance and irradiance data were derived from the STR-22G sun tracker, which has a pointing accuracy of < 0.01o. The MS-80 Pyranometer provided data on vertical irradiance. This measuring instrument is designed to offer a measuring range of 0 to 4000W/m2 at a response time of < 0.5 secs. At a measuring range of 0.01 to 299,900 lux, the T-10M illuminance sensor provided data on vertical irradiance and illuminance, respectively. For sky classification, a sky scanner (EKO MS 300LR with an accuracy angle of 0.2o) provided a record of sky luminance measured at 145 points by scanning the entire skydome. These measurements cover data recorded between sunrise and sunset. In general, nine months of meteorological data measured at 10 minutes intervals between June 2019 and February 2020 were used in the analysis. Due to the need to remove erroneous measured data, data quality control tests were carried out as follows;
• Rejecting all data with solar altitude (∝) less than 5o. • Rejecting all data with horizontal global irradiance less than 20 Wm-2. • Rejecting all global data that were greater than the corresponding extra-terrestrial solar
components. • Rejecting all diffuse data that were greater than the corresponding global values. • Rejecting all diffuse data that were greater than half of the corresponding extra-terrestrial solar
components. • Rejecting all data when the direct-normal values exceed the corresponding extra-terrestrial solar
component. • Rejecting all horizontal and vertical data when the computed vertical direct beam data was
greater than the corresponding measured global vertical components. • Rejecting all-sky luminance data when the differences between the Dv and the corresponding
integrated Dv based on the 145 scanned sky luminance points were greater than 30%.

143
A study of illuminance data generation using the luminous efficacy approach: A case study of Hong Kong
Z S
2
3. The CIE standard sky
The CIE standard skies contain five clear, five partly cloudy and five overcast sky types covering the whole spectrum of skies in the world. These distributions are made up of mathematical expressions that change in luminance from the horizon to the zenith and with angular distance from the sun. The relative luminance distribution of any standard sky is given by the combination of the gradation function φ(Z) and the indicatrix function f(χ). The gradation function describes the luminance gradation between the horizon and the zenith, while the indicatrix function relates the sky luminance with the angular distance from the sun. The formula defining the relative luminance distribution is expressed in Eqn 1;
L f (χ )ϕ (Z ) = (1)
L f (Z )ϕ (00 ) where L is the sky luminance in an arbitrary sky element (cd/m2), LZ the zenith luminance (cd/m2), Z
the zenith angle of a sky element (rad), ZS the zenith angle of the sun (rad) and χ is the scattering angle, the shortest angular distance between the sun and a sky element (rad) (Tregenza, 2004). Eqn 2 and 3 represent models of the standard φ(Z) and relative scattering f(χ) defined by variables a,b,c,d and e.
ϕ (Z ) 1 + a exp(b / cos Z ) =
ϕ (00 ) 1 + a exp b
f ( χ ) 1 + c [exp(d χ ) − exp(dπ / 2)] + e cos 2
χ
(2)
= f (Z ) 1 + c [exp(dZ ) − exp(dπ / 2)] +
e cos Z
(3)
s s s
The exponential term exp(dχ) denotes the effect of Mie scattering, which decreases rapidly with distance from the sun. The cos2χ term is caused by the Rayleigh scattering, and this is 0o at 90o to the sun. These combinations form a number of skies, but only 15 types were selected to be the standard set.
Table 1: Description of the 15 CIE standard skies
No. Code
Type of Sky For Gradation
For indicatrix
a b c d e 1 (I1) CIE standard overcast sky, steep luminance gradation 4 -0.7 0 -1 0
towards zenith, azimuthal uniformity 2 (I2) Overcast, with steep luminance gradation and slight 4 -0.7 2 -1.5 0.15
brightening towards the sun 3 (II1) Overcast, moderately graded with azimuthal 1.1 -0.8 0 -1 0
uniformity 4 (II2) Overcast, moderately graded and slight brightening 1.1 -0.8 2 -1.5 0.15
towards the sun 5 (III1) Sky of uniform luminance 0 -1 0 -1 0 6 (III2) Partly cloudy sky, no gradation towards the zenith, 0 -1 2 -1.5 0.15
slight brightening towards the sun 7 (III3) Partly cloudy sky, no gradation towards zenith, 0 -1 5 -2.5 0.3
brighter circumsolar region 8 (III4) Partly cloudy sky, no gradation towards zenith, distinct 0 -1 10 -3 0.45
solar corona

144
Emmanuel Aghimien, Danny Li
9 (IV2) Partly cloudy, with the obscured sun -1 -0.55 2 -1.5 0.15 10 (SIV3) Partly cloudy, with brighter circumsolar region -1 -0.55 5 -2.5 0.3 11 (IV4) White-blue sky with distinct solar corona -1 -0.55 10 -3 0.45 12 (V4) CIE standard clear sky, low luminance turbidity -1 -0.32 10 -3 0.45 13 (V5) CIE standard clear sky, polluted atmosphere -1 -0.32 16 -3 0.3 14 (VI5) Cloudless turbid sky with broad solar corona -1 -0.15 16 -3 0.3 15 (VI6) White-blue turbid sky with broad solar corona -1 -0.15 24 -2.8 0.15
Source: CIE S 011/E, (2003)
3.1. Sky luminance approach for 15 CIE sky classification
The sky luminance approach was adopted for standard sky classification because of its accuracy (Li et al., 2014). To determine the 15 standard skies, luminance distributions of each standard sky were modelled using Eqs. 1–3 and compared with the recorded sky luminance readings of the same period. The modelled sky luminance is normalised to the horizontal diffuse illuminance by multiplying all the luminance values by the normalisation ratio (NR) as depicted by Eqn 4:
∑ lmea cos θ sin θ dθ dφ NR =
∑ lpred cos θ sin θ dθ dφ (4)
where lmea is measured sky point luminance (cd/m2), lpred is the modelled sky point luminance in relative form, θ is the altitude of a sky patch (rad), and ϕ is the azimuth of a sky patch (rad). Determination of the relative sky luminance distribution was further executed. After each modelled sky luminance was multiplied by the NR, the performance of each standard sky luminance model was assessed by the root-mean-square error (RMSE). The standard sky with the lowest RMSE was selected as the best-fitting standard sky. The data used for this study were measured based on typical sunrise to sunset hours from 5:20 to 18:50. Due to instrumentation malfunction, power failure, among several factors, the possibility of missing data cannot be overruled. However, a total of about 22,000 ten minutes of readings were obtained. Frequency distribution curves were used in this study for presenting data. For sky classification, sky luminance data were analysed into the three major sky types. Findings show that within the nine months of data measurement, the overcast skies (Sky 1 to 5) represented 21.33% of the sky condition while partly cloudy skies (Sky 6 to 10) and clear skies (Sky 11 to 15) represented 51.69% and 26.99% respectively. To further classify the skies into the 15 CIE standard skies, Sky number 1, 8 and 13 are the most represented sky types with a frequency of occurrence (FOC), 8.93%, 46.59% and 21.65% respectively. Sky 1, 8 and 13 also represent the most occurring sky types among the three typical sky condition, and similar findings were made by Ng et al. (2007) and Lou et al. (2019). For the overcast skies, Sky number 1 and 2 dominate the sky condition with a FOC of 15.52%. Lastly, Sky type 11 and 13 have the most FOC for clear sky conditions and this total 26.98%.
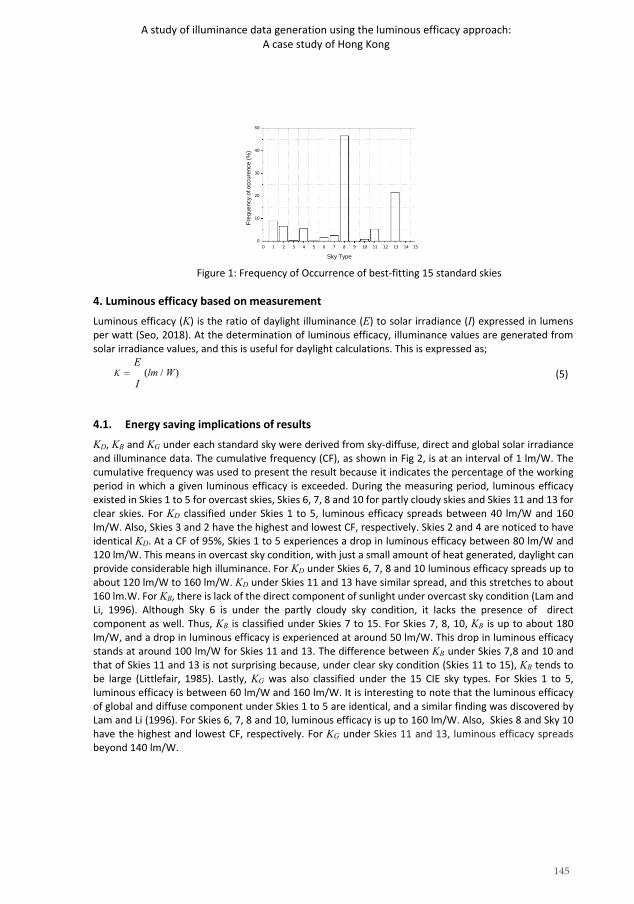
145
A study of illuminance data generation using the luminous efficacy approach: A case study of Hong Kong
50
40
30
20
10
0 0 1 2 3 4 5 6 7 8 9 10 11 12 13 14 15
Sky Type
Figure 1: Frequency of Occurrence of best-fitting 15 standard skies
4. Luminous efficacy based on measurement
Luminous efficacy (K) is the ratio of daylight illuminance (E) to solar irradiance (I) expressed in lumens per watt (Seo, 2018). At the determination of luminous efficacy, illuminance values are generated from solar irradiance values, and this is useful for daylight calculations. This is expressed as;
E K = (lm / W )
I (5)
4.1. Energy saving implications of results
KD, KB and KG under each standard sky were derived from sky-diffuse, direct and global solar irradiance and illuminance data. The cumulative frequency (CF), as shown in Fig 2, is at an interval of 1 lm/W. The cumulative frequency was used to present the result because it indicates the percentage of the working period in which a given luminous efficacy is exceeded. During the measuring period, luminous efficacy existed in Skies 1 to 5 for overcast skies, Skies 6, 7, 8 and 10 for partly cloudy skies and Skies 11 and 13 for clear skies. For KD classified under Skies 1 to 5, luminous efficacy spreads between 40 lm/W and 160 lm/W. Also, Skies 3 and 2 have the highest and lowest CF, respectively. Skies 2 and 4 are noticed to have identical KD. At a CF of 95%, Skies 1 to 5 experiences a drop in luminous efficacy between 80 lm/W and 120 lm/W. This means in overcast sky condition, with just a small amount of heat generated, daylight can provide considerable high illuminance. For KD under Skies 6, 7, 8 and 10 luminous efficacy spreads up to about 120 lm/W to 160 lm/W. KD under Skies 11 and 13 have similar spread, and this stretches to about 160 lm.W. For KB, there is lack of the direct component of sunlight under overcast sky condition (Lam and Li, 1996). Although Sky 6 is under the partly cloudy sky condition, it lacks the presence of direct component as well. Thus, KB is classified under Skies 7 to 15. For Skies 7, 8, 10, KB is up to about 180 lm/W, and a drop in luminous efficacy is experienced at around 50 lm/W. This drop in luminous efficacy stands at around 100 lm/W for Skies 11 and 13. The difference between KB under Skies 7,8 and 10 and that of Skies 11 and 13 is not surprising because, under clear sky condition (Skies 11 to 15), KB tends to be large (Littlefair, 1985). Lastly, KG was also classified under the 15 CIE sky types. For Skies 1 to 5, luminous efficacy is between 60 lm/W and 160 lm/W. It is interesting to note that the luminous efficacy of global and diffuse component under Skies 1 to 5 are identical, and a similar finding was discovered by Lam and Li (1996). For Skies 6, 7, 8 and 10, luminous efficacy is up to 160 lm/W. Also, Skies 8 and Sky 10 have the highest and lowest CF, respectively. For KG under Skies 11 and 13, luminous efficacy spreads beyond 140 lm/W.
Freq
uenc
y of
occ
uren
ce (%
)

146
Emmanuel Aghimien, Danny Li
Cum
lativ
e fr
eque
ncy
(%)
Cum
lativ
e fr
eque
ncy
(%)
Cum
ulat
ive
freq
uenc
y (%
)
100
80
60
Sky no. 1 Sky no. 2 Sky no. 3 Sky no. 4 Sky no. 5
100
80
60
Sky no. 6 Sky no. 7 Sky no. 8 Sky no. 10
40 40
20 20
0 40 60 80 100 120 140 160 180 200
Sky diffuse luminous efficacy (lm/W)
0 40 60 80 100 120 140 160 180 200
Sky diffuse luminous efficacy (lm/W)
100
80
60
Sky no. 11 Sky no. 13
100
80
60
Sky no. 1 Sky no. 2 Sky no. 3 Sky no. 4 Sky no. 5
40 40
20 20
0
100
40 60 80 100 120 140 160 180 200
Sky diffuse lumious efficacy (lm/W)
0 40 60 80 100 120 140 160 180 200
Global luminous efficacy (lm/W)
Sky no. 6 Sky no. 7
80 Sky no. 8 Sky no. 10
100
80
Sky no. 11
Sky no. 13
60 60
40 40
20 20
0 40 60 80 100 120 140 160 180 200
Global luminous efficacy (lm/W)
0 40 60 80 100 120 140 160 180 200
Global luminous efficacy (lm/W)
100
80
Sky no. 7
Sky no. 8
Sky no. 10
100
80
Sky no. 11
Sky no. 13
60 60
40 40
20 20
0 40 60 80 100 120 140 160 180 200
Direct luminous efficacy (lm/W)
0 40 60 80 100 120 140 160 180 200
Direct luminous efficacy (lm/W)
Figure 2: Cumulative frequency of sky diffuse, global and direct horizontal luminous efficacy under the 15 CIE skies
Cum
ulat
ive
freq
uenc
y (%
) Cu
mul
ativ
e fre
quen
cy (%
) Cu
mul
ativ
e fr
eque
ncy
(%)
Cum
ulat
ive
freq
uenc
y (%
)
Cum
ulat
ive
freq
uenc
y (%
)

147
A study of illuminance data generation using the luminous efficacy approach: A case study of Hong Kong
4.2. Vertical luminous efficacy
For examining orientation effects, the CF for vertical global luminous efficacy (KVG) facing north, east, south and west were computed from August 2019 to February 2020 and presented in Fig 3. With the availability of the measured vertical solar radiation and daylight illuminance data, the KVG was determined. When vertical surfaces receive direct components, relatively low K values were obtained. With K less than 90 lm/W, the north-facing surface has the highest CF, and this is due to the absence of the direct component. All other vertical surfaces (i.e., east, south and west) have similar, but smaller percentage values. Also, all vertical surfaces show a rapid drop in the CF when K lies between 90 and 120 lm/W. This high efficacy value region corresponds to the diffuse-dominant condition where there is little to no direct component.
100
80
East South West North
60
40
20
0 20 40 60 80 100 120 140 160 180 200
Vertical global luminous efficacy (lm/W)
Figure 3: Cumulative frequency (CF) of vertical global luminous efficacy for the four cardinal orientations
4.2.1. Vertical luminous efficacy model description
For daylighting applications, it is essential to have solar irradiance and daylight illuminance data on inclined surfaces. The daylight illuminance on an inclined plane (EβG) with an inclination angle (β = 0o to 90o) can be evaluated as the sum of the direct beam, sky-diffuse and ground-reflected components (Li et al., 2008). In Eqn 6 and 7, using the luminous efficacy (i.e. when β = 90o), EβG can be illustrated as;
Eβ G = Eβ B + Eβ D + Eβ R
Eβ G = IβG KβG
(6)
(7)
where EβB is the direct beam illuminance on a plane (lx), EβD is the sky-diffuse illuminance on a plane (lx), EβR is the ground reflected illuminance on a plane (lx), IβG is the global irradiance on a plane (W/m2) and KβG is the global luminous efficacy (lm/W) on a plane.
Also, the KVG (i.e., β= 90) can be expressed by Eqn 8 and 9 as;
K = EVG = EVB + EVD + EVR (8)
VG I I + I + I VG VB VD VR
Cum
ulat
ive
frequ
ency
(%)

148
Emmanuel Aghimien, Danny Li
VR hG
i i
= IVB EVB + IVD EVD + IVR EVR
IVG IVB IVG IVD IVG IVR
(9)
where EVG is the global illuminance on a vertical plane (lx), EVB the direct-beam illuminance on a vertical plane (lx), EVD the sky-diffuse illuminance on a vertical plane (lx), EVR the ground-reflected illuminance on a vertical plane (lx), IVG the global irradiance on a vertical plane (W/m2), IVB the direct- beam irradiance on a vertical plane (W/m2), IVD the sky-diffuse irradiance on a vertical plane (W/m2) and IVR is the ground-reflected irradiance on a vertical plane (W/m2).
Due to the strong forward scattering effect of aerosols, the sky-diffuse component is anisotropic. Different surfaces will receive these different amounts of sky-diffuse components. For daylight calculation, the method for predicting solar irradiance can be used because solar irradiance and illuminance have very similar characteristics (Muneer and Angus, 1995). For luminous efficacy, the variations would be minimal from one surface to another. It is reasonable to assume that the same amount of sky-diffuse luminous efficacy can be used for both the horizontal and vertical surfaces. From the sun’s position and orientation of the plane, the direct-beam component on a vertical surface can be calculated using solar geometry. For estimating the ground-reflected component, the vertical surface is considered to receive half of the global component reflected isotropically from the ground. If the same average ground reflectivity is used for ground-reflected illuminance and irradiance determinations, the amount of ground-reflected luminous efficacy would be equal to the global luminous efficacy on a horizontal plane. Eqn 10, 11, 12 and 13 represent IVB, IVR, EVB, and EVR mathematically as follows:
I = hB (cos α cos γ )
VB sin α E I
(10)
= hB (cos α cos γ ) = hB (cos α cos γ )K
(11)
sin α I = 0.5ρ I
sin α (12)
E = 0.5ρ I K (13) VR hG G
where IhB is the direct-beam irradiance on a horizontal plane (W/m2), IhG the global irradiance on a horizontal plane (W/m2), γ the difference between solar azimuth and azimuth angle of the normal of the surface (O), ρ the ground reflectance (dimensionless), and KG is the global luminous efficacy on a horizontal plane (lm/W). The common ground reflectivity ( ρ ) of 0.2 is used in this study.
As the scanning pattern divided the whole skydome when the standard sky types are determined, it is possible to determine IVD numerically (Li et al., 2008). This is expressed in Eqn 14 below;
∑145 L cos2 θ cos φδθδφ
I = I i i (14)
VD hD ∑145 L sin θ cosθδθδφ
KVG is a combination of the luminous efficacies of global, diffuse and direct on a horizontal surface with different proportions. Hence, Eqn (9) can be rewritten as Eqn 15. With KB, KD and KG derived from measured horizontal data, KVG can be determined.
I I I = VB K
VG I B + VD K I D
+ VR K I G
(15)
VG VG VG
With the above equations, KVG and IVG can be estimated and further used for daylight prediction.
VB E
KVG
I
B
K

149
A study of illuminance data generation using the luminous efficacy approach: A case study of Hong Kong
4.3. Daylight Prediction
This study estimated vertical outdoor illuminance from the developed KVG using modelled solar irradiance data from August 2019 to February 2020. To evaluate the performance of the proposed KVG, the mean bias error (MBE) and the RMSE were used. Table 2 describes the MBE and RMSE of KVG for the four cardinal points. From the analysis, the proposed model overestimated throughout the period and this ranged from a monthly MBE value of 0.7% in August to 34.4% in October. The computed RMSE values also show that the proposed model can estimate vertical global illuminance more accurately in the summer months (August and September) than any other month. Also, the RMSE values ranged from 10.6% in August for the south-facing surface and 39.9% in January for the north-facing surface. Furthermore, lower RMSE values are observed in the south-facing surface, and these values ranged from 10.6% to 23.3%. The north-facing surface, which receives mainly diffuse components has the highest RMSE values. Thus, the proposed model is more effective in predicting along the south-facing surface.
Table 2: Summary of MBE and RMSE of global illuminance on vertical surfaces using modelled vertical global irradiance
Aug Sep Oct Nov Dec Jan Feb North %MBE 11.1 22.2 34.4 33.0 34.2 27.7 27.9
% RMSE 18.1 27.3 36.1 35.8 39.3 39.9 34.7 East
%MBE 10.0 14.6 14.6 27.2 27.9 9.3 22.9 %RMSE 17.30 22.5 21.9 35.9 39.5 25.3 33.5 South %MBE 0.7 7.8 16.1 20.5 20.3 8.3 13.2
%RMSE 10.6 14.2 17.2 22.5 23.3 20.1 16.7 West
%MBE 16.9 19.0 19.3 22.3 28.1 16.9 19.5 % RMSE 22.9 25.7 21.1 26.8 36.5 29.1 24.9
5.0 Conclusions
Daylight is essential in achieving visual comfort and building energy efficiency; therefore, daylight data are necessary for building designs. In the absence of measured daylight data, estimation from solar irradiance using luminous efficacy is an alternative. This study estimated vertical global luminous efficacy from horizontal solar irradiance data. The best-fitting standard sky was determined using sky luminance data, and Skies 1, 8 and 13 were predominant. The KG, KB and KD under the 15 CIE standard skies were obtained using measured data from June 2019 to February 2020. It was discovered that luminous efficacy spreads from 40 lm/W to 180 lm/W with a drop of 95%. This shows the sufficiency of daylight to aid visibility during working hours. Furthermore, KVG was developed from horizontal measured data, and it was used to predict vertical daylight illuminance for the four cardinal orientations. Measured data between August 2019 and February 2020 were used to develop the model. Generally, the vertical illuminance data were overpredicted with an MBE of up to 34.4%. From the statistical analysis, the proposed model is considered more efficient in predicting vertical global illuminance on the south-facing surface. Also, from the monthly RMSE value, the model is preferable for prediction in the summer months. An overview of the results shows that the estimated results have good agreement with

150
Emmanuel Aghimien, Danny Li
the measured vertical illuminance data. The proposed approach is based on seven months of measured data in the subtropical region and the 15 CIE standard skies which cover the whole spectrum of the skies in the world. To establish a more reliable model, further work with more data is required. Also, other meteorological parameters and climatic indices aside the ones used in this model will be considered in subsequent studies, and their influence on the established model will be ascertained. Lastly, the possibility of fitting the model for various climates in future research will also be considered.
Acknowledgement
Work described was fully supported by a General Research Fund from the Grant Council of HKSAR [Project no. 90421773 (CityU 11211719)]. Emmanuel Imuetinyan Aghimien was supported by a City University of Hong Kong Postgraduate Studentship.
References Ahmad, M. J., and Tiwari, G. N. (2010). Estimation of luminous efficacy of daylight and illuminance for composite
climate. International Journal of Energy and Environment, 257–276. CIE S 011/E. (2003). Spatial Distribution of Daylight – CIE. Standard General Sky. Standard, C.I.E. central bureau:
Vienna, 1 - 7. Fakra, A. H., Boyer, H., Miranville, F., and Bigot, D. (2011). A simple evaluation of global and diffuse luminous
efficacy for all sky conditions in tropical and humid climate. Renewable Energy, 36(1), 298–306. GhaffarianHoseini, A., Dahlan, N.D., Berardi, U. and Makaremi, N. (2013). Sustainable energy performances of green
buildings: A review of current theories, implementations and challenges. Sustainable Energy Reviews, Elsevier. 25, 1–17.
Hammid, A. T., Sulaiman, M. H.Bin, and Abdalla, A. N. (2018). Prediction of small hydropower plant power production in Himreen Lake dam (HLD) using artificial neural network. Alexandria Engineering Journal, 211– 221.
He, J., and Ng, E. (2010). Using satellite-based methods to predict daylight illuminance for subtropical Hong Kong. Lighting Research and Technology, 135–147.
Lam, J. C., and Li, D. H. W. (1996). Luminous efficacy of daylight under different sky conditions. Energy Conversion and Management, 1703–1711.
Li, D. H. W., Chau, T. C., and Wan, K. K. W. (2014). A review of the CIE general sky classification approaches. Renewable and Sustainable Energy Reviews, 563–574.
Li, D. H. W., Lam, T. N. T., Cheung, K. L., and Tang, H. L. (2008). An analysis of luminous efficacies under the CIE standard skies. Renewable Energy, 2357–2365.
Littlefair, P. J. (1985). The luminous efficacy of daylight: A review. In Lighting Research & Technology, 162–182). Lou, S., Li, D. H. W., and Chen, W. (2019). Identifying overcast, partly cloudy and clear skies by illuminance
fluctuations. Renewable Energy, March, 198–211. Mayhoub, M. S., and Carter, D. J. (2011). A model to estimate direct luminous efficacy based on satellite data. Solar
Energy, 234–248. Muneer, T. and Angus, R.C (1995). Luminous efficacy: evaluation of models for the United Kingdom. Lighting
Research and Technology, 27(2):71–77. Ng, E., Cheng V., Gadi, A., Mu, J., Lee, M. and Gadi, A. (2007). Defining standard skies for Hong Kong. Building and
Environment, 42: 866 - 876. Seo, D. (2018). Comparative analysis of all-sky luminous efficacy models based on calculated and measured solar
radiation data of four worldwide cities. International Journal of Photoenergy, 1-9. Seyedzadeh, S., Rahimian, F.P., Glesk, I., and Roper, M. (2018). Machine learning for estimation of building energy
consumption and performance: A review. Visualisation in Engineering, 6 (1) :1-9. Tregenza, P. R. (2004). Analysing sky luminance scans to obtain frequency distributions of CIE. Standard General
Skies. Lighting Research and Technology, 36(4), 271–281.

151
The 54th International Conference of the Architectural Science Association (ANZAScA) 2020
An Analysis on the Benefits of Vernacular Architecture to Design Passivhaus Buildings in Kurdistan
Ban Jalal Ahmed1 and Carlos Jimenez-Bescos2 1 First University of Sulaimani, Sulaymaniyah, Iraq
[email protected] 2 University of Nottingham, Nottingham, United Kingdom
Abstract: Design features have shifted towards more climatic responsive buildings, in respond to the effect that the building industry has on the environment and the global climate. The Passivhaus standard generates ultra-low energy building performance reducing the energy demand. The Vernacular Architecture of the Kurdistan Region of Iraq has evolved through the influence of Islamic architecture, with concepts such as privacy and opening towards the inside rather than to the outside. Most houses feature a central courtyard used for lighting and ventilation, while keeping the privacy of the occupants. The aim of this paper was to investigate the implementation of vernacular architecture into domestic building design to achieve Passivhaus in the Kurdistan region of Iraq. The methodology used computer simulation using Revit, SketchUp, DesignPH and Passive House Planning Packed (PHPP) to model a domestic building design in the city of Sulaymaniyah with five different cases to assess the benefits of vernacular architecture to achieve passivhaus. The results show the Iwan in case 1 reducing overheating by almost 5%, while the courtyard in case 2 can reduce overheating by 15.6% with a ventilation rate of 0.33 acph. Cases 5 does not achieve Passivhaus certification but reduce massively the overheating and cooling demand
Keywords: Passivhaus; Vernacular Architecture; Courtyard; Thermal Comfort.
1. IntroductionIn recent years, design features have shifted towards more climatic responsive buildings, in respond to the effect that the building industry has on the environment and the global climate. One of the main goal of designer and engineers worldwide has been to design carbon neutral buildings generating a small environmental impact (Heywood, 2015).
Following this trend, the Passivhaus standard generates ultra-low energy building performance reducing the energy demand (Hopfe and Mcleod, 2015). According to the International Passivhaus Association, there are over 40,000 passive houses already constructed all across the world (Passivehouse-international.org, 2019).
Imaginable Futures: Design Thinking, and the Scientific Method. 54th International Conference of the Architectural Science Association 2020, Ali Ghaffarianhoseini, et al (eds), pp. 151–160. © 2020 and published by the Architectural Science Association (ANZAScA).

152
Ban Jalal Ahmed and Carlos Jimenez-Bescos
Khalfan (2017) states that the Passive house standard is not confined as a building type or an architectural style but it's a worldwide standard that originated in Germany and rapidly grew to become a global standard.
The climate of the Kurdistan Region is semi-arid continental: very hot and dry in summer, cold and wet in winter. (Kurdistan Climate, 2019) The city is under the effect of cool breezes of the Mediterranean in the winter and warm winds coming from the Sahara from the south during the summer. The climatic region in which this area has is a very fluctuating and diverse climate throughout the year which has resulted from being under the influence and effect of the complex geography. the City of As Sulaimaneyah located in the south east of Kurdistan Region at it falls under the cold semi aired climate, the average temperature ranges and fluctuates between 2 – 20 degree Celsius during winter while during summer average mean temperature rises up to 40 degree Celsius as shown in the graph below in Figure1 (Meteobluecom. 2019)
Figure 1: Annual average mean and maximum temperatures temperature (Meteobluecom. 2019)
The Vernacular Architecture and the Housing Styles of Kurdistan Region like all other Iraqi Houses are characterized by structural and planning features of similar character. Like most countries in the area and Middle East the traditional architecture of this particular region has been under the influence of Islamic architecture. Islamic architecture is not just standards and forms, and is not just limited to patterns applied in places conquered by Muslims. It recognizes the content to demonstrate building character with a distinct identity (Yassin and Utaberta, 2012)
From early ages some characteristics of the Islamic houses has been passed down, and are present in houses of Iraq and Kurdistan region. The concept of privacy and opening towards inside rather than to outside is one of the traits of the architecture. (Asad, 1989) Most traditional houses used to have a central courtyard used for lighting, ventilation while kept the houses as private as possible.
Selmi and Ismail (1996) studied the construction materials suitable for a passive house for a typical Qatari residential unit in a hot arid region. Their research suggested the use of thermostone instead of hollow concrete walls for the structure and revealed a 25% energy reduction and a 30% less cost would result from using thermostone.

153
An Analysis on the Benefits of Vernacular Architecture to Design Passivhaus Buildings in Kurdistan
In Libya, Bossi (2013) recommended that the best first step for passivhaus is to establish a good building envelope, then choose a method for cooling the spaces.
Mohammed and Abdulsada (2015) performed an experimental study to evaluate the performance of an Iraqi passive house especially in the summer. An experimental small scale model was built in the city of Kirkuk in the Kurdistan region and the researchers investigated the thermal behaviour of two 1.8 m × 1.8 m × 2 m models, one built according to traditional standards and the other according to passive house standards, the comparison in results shows the improvement to the indoor air environment of the building model with the Passivhaus standard August and September. They concluded that the indoor temperature dropped from 42 degrees centigrade to 31 degrees centigrade, and the energy consumptions was reduced by 80%, however there was no mention whether the model could be certified to Passivhaus standard.
Raof (2018) described the courtyard as one of the most significant features of houses in Middle East and in Kurdistan regions vernacular architecture. She explains how a courtyard is a main source of lighting and ventilation, as well as an inner courtyard creates an open environment for air flow even in the cases of poor air movement in outer spaces. Raof (2018) agreed with Abdulkareem (2012) in his demonstration of properties of air and air movement, where hot air rises and gets expelled through small openings resulting in clod air getting sucked into the courtyards and a current is produced within the house during summer. Hence the opening placements and sizing of the traditional houses have aided in maintain a comfortable indoor temperature.
Khoshnaw(2019) suggested that aside from historical identity and climate responsive advantages courtyards in Kurdistan has a social additive to the family structure as it Provide a space for socializing and family time in the open air away from street noises and indoor environment – He implies that healthy living promotes a healthy life.
El Saray and Omar (2017) discussed the importance of courtyards and the positive impact it could have on modern buildings, thus they aimed to develop a courtyard house into a zero energy building. They concluded that the courtyard volume should be broken to multi-small courts scattered in the house for the sake of enhancing cross natural ventilation and daylighting. The house envelope should be a multi-functional element to filter the outside environment to a set off the free sources of energy of the wind and the sun.
Another feature of vernacular architecture is the Iwan, which is covered hall that has three halls and the fourth side is open towards the courtyard for the sake of getting fresh air, usually it falls at a height of 1.5 meters from the courtyard floor for the purpose of lighting and ventilation, as described by Petersen (1996). The Iwan has another function, according to Mahmoudi (2005), which is to provide shelter from the sun and act as a buffer zone between the heat of the outside and the interior spaces. Agreeing with this theory, Ibrahim (2016) suggested that Iwans In Kurdistan are best if oriented to the south or the east, to prevent the afternoon heat and dial down its intensity, thus this orientation would give a priority for the space to be used as a sitting, resting and dining space for the users. Samples of Iwans are provided in Figure 2.

154
Ban Jalal Ahmed and Carlos Jimenez-Bescos
Figure 2: Iwan Samples from Sulaymaniyah City (Abdurahman and Abtar, 2019).
Abdurahman and Abtar (2019) exposed a lack of research in the solar performance of Iwan in the local architecture of Sulaymaniyah city, thus their research concluded that the Iwan could be used as a traditional architectural element as well as a climatic responsive strategy in the city of Sulaymaniyah. Furthermore, they established that the annual solar performance of Iwan with lower depth to width proportions is better than those with higher proportions.
The aim of this paper is to investigate the implementation of vernacular architecture into domestic building design to achieve Passivhaus in the Kurdistan region of Iraq.
2. MethodologyThe research methods involves the usage of computer simulation using Revit, SketchUp, DesignPH and Passive House Planning Packed (PHPP) to model a domestic building design in the city of Sulaymaniyah in the Kurdistan region of Iraq with coordinates of 35.5° N 45.4° E. The Passivhaus standard, through DesignPH was used to calculate heating and cooling loads of the buildings.
The building design follows the typical existing buildings currently being constructed in the Kurdistan region with a challenging layout and limited access to natural lighting and fresh air, as presented in Figure 2.
The climatic data to be used in PHPP for Sulaymaniyah city was collected from a climate data website suggested by the Passivhaus Institut (Klimadaten.passiv.de).
A base case scenario building was developed with U-value for the wall of 0.15 W/m2K and formed with thermostone blocks (lightweight cement based material), external render, polyurethane insulation foam and interior finishing. The concrete floor slap has a U-value of 0.25 W/m2K, while the Passivhaus roof achieved 0.15 W/m2K. All windows and door were selected from the certified Passivhaus components with 0.5 g-values, 0.8 U-values and airtight frames. Airtightness was considered as 0.6 air changes per hour (acph). The total Treated Floor Area for the base case scenario is 303.22 m2. Moreover

155
An Analysis on the Benefits of Vernacular Architecture to Design Passivhaus Buildings in Kurdistan
the building has a 2.65 form factor, 21 m2 of window surfaces, no thermal bridges and a condensed thermal envelope. The Yellow areas in Figure 3 represent the Treated floor Area per level. The grey areas are treated as non-thermal zones. The red shaded areas in the model indicates external ambient walls and roof.
The Passivhaus Institute considers overheating as temperatures above 25°C as one of the main criteria for Passivhaus Standard (Hopfe and Mcleod, 2015)
Figure 3: DesignPH base model of the building.
Five different cases were modelled to assess the benefits of vernacular architecture on the base case building to enhance the Passivhaus performance through adaptation.
Case 1 includes the addition of an overhang (Iwan) on the first floor, as shown in Figure 4, creating a shaded area and acting as a buffer zone between the outside and the main living room space in the first floor thus reducing the amount of direct solar radiation entering into the spaces, this overhang cantilever is a separate structure and does not act as a thermal bridge and a reason for heat loss during lower outside temperatures
Figure 4: DesignPH case 1 model.
Case 2 adds the benefits of window opening for natural ventilation during day and night to remove the heats gathered up within the living spaces.

156
Ban Jalal Ahmed and Carlos Jimenez-Bescos
Case 3 simulates the building performance more realistically, as the buildings in Kurdistan contain only one external façade to the street. In a more realistic case has been modelled by changing the walls of the model from external ambient walls to partition with neighbouring properties around it.
Case 4 is modelled with overhangs position on all windows in the street elevation, in an attempt to further reduce solar gains during summer. The dimension of the overhand extends 40 cm from the window surfaces which is enough to prevent a great portion of summer sun entering into the living spaces, however at the same time, allowing the lower winter sun to enter the building and provide the required solar gains to reduce heating demand.
Case 5 takes into account the realistic height of surrounded buildings and contain all the previous improvements form case 1 to case 4 as shown in Figure 5.
Figure 5: DesignPH case 5 model.
3. Results and DiscussionThe results for the base case scenario building are presented in Table 1 and compare to the Passivhaus standard requirements.
Considering the large windows facing South, the high insulation levels and airtightness, it is no surprise that the heating criteria for Passivhaus are well achieved with a space heating demand of 9 kWh/m2a and a heating load of 9 W/m2, which would allow the heating to be delivered through the ventilation system. In terms of cooling, the performance of the buildings is far off from the requirements with a cooling demand of 29 kWh/m2a and a cooling load of 11.9 W/m2. All due to very high levels of overheating with a 57% overheating frequency, where the temperature rises above 25°C, mainly due to the high levels of airtightness and the lack of ventilation to deal with the solar and internal gains generated in the building. Extra measures to deal with cooling and overheating are employed through the adaptation modelled cases.

157
An Analysis on the Benefits of Vernacular Architecture to Design Passivhaus Buildings in Kurdistan
Table 1: Building performance against Passivhaus standard.
Passivhaus Requirement Value Fullfield
Table 2 shows the Passivhaus parameter results for the base case scenario and the five adaptation cases presented in the methodology. While the cooling and overheating issues have not been fully reduced to Passivhaus standard levels, a good reduction on cooling demand of over 40% can be achieved, with a reduction on overheating of 40% in comparison to the base case scenario.
Case 1 presents an overheating reduction of almost 5% by the addition of the Iwan on the first floor, providing a much needed shading and protection from solar gains, while performing its function inherited from the vernacular architecture of the region.
Passivhaus
Table 2: Building performance for each case.
over heating
Case 2 provides the biggest reduction on overheating, accounting for a reduction of 15.6%, by the application of natural ventilation through opening windows with a ventilation rate of 0.33 acph. This is a design feature, which in coordination with the courtyard, can be applied while still keeping the privacy of the home. Also the indoor temperature has come closer to the outdoor temperature, with the peak indoor temperature dropping from 40 degrees centigrade to around 35 degrees centigrade, as presented in Figure 6.
Criteria
Heating Demand 15 kWh/m2 a 9 Yes
Heating Load 10 W/m2 9 Yes
Cooling Demand 15 kWh/m2 29 No
Cooling Load 10 W/m2 11.9 No Frequency of over heating less than 10% 57% No
Airtightness 0.6 acph 0.6 Yes Form factor 2.65
Criteria Base Case 1 Case 2 Case 3 Case 4 Case 5
Heating Demand 9 10 10 9 8 9
Heating Load 9 9 9 8 8 8
Cooling Demand 29 25 23 19 17 17
Cooling Load 11.9 11.1 15 14.3 13.8 13.5 Frequency of 57.0% 52.4% 36.8% 35.3% 34.7% 34.0%

158
Ban Jalal Ahmed and Carlos Jimenez-Bescos
Figure 6: Temperature comparison for case 5 model.
Case 3 presents a reduction on the cooling demand to 19 kWh/m2a. It however did not have a large effect of reducing the overheating frequency with only a reduction of 1.5 %. In this case, the space heating demand and heating load also decreased, due to less surface area of the envelope in direct contact with the outdoor air thus lowering the heat loss in winter and heat gains in summer that might occur thorough radiation, convection and conduction.
In case 4, the cooling demand decreased to 17 kWh/m2a and the overheating frequency decreased to 34.7% thanks to the overhangs, which are separate structures and so not generate any thermal bridges, as shown in the overhangs employed in the TAO house (James and Bill, 2016).
Cases 5 further reduce the overheating frequency to 34% with a cooling demand reaching 17 kWh/m2a, which dropped from 29 kWh/m2a of the original baseline case. The cooling demand still has not achieved the 15 kWh/m2a required for Passivhaus standard certification, however that drop in the demand is very advantageous, providing clear reduction in energy use even if air conditioning was implemented to achieve thermal comfort. It must be noted that case 5 presents a more realistic simulation of the building in its setting and corroborate the potential for Passivhaus standard in the Kurdistan region.
Similar case stimulations where performed on another design suggestion shown in figure 7 with the same area utilizations and in the same location but with the integration of more elements of traditional vernacular architecture. Such as Integration of an interior courtyard, attempt of re-implementation of an Iwan and Installation of Mashrabyia on the windows. This alternative design suggestion is to estimate how easily the building performance would be affected.
Figure 7: Temperature comparison for case 5 model.

159
An Analysis on the Benefits of Vernacular Architecture to Design Passivhaus Buildings in Kurdistan
Table 3 shows the Passivhaus parameter results for the base case scenario of the alternative design suggestion and the five adaptation cases presented similarly in the original design.
Table 3: Building performance for each case of the alternative design.
Passivhaus
over heating
All the values compared to the original sample tested have changed by the addition of the courtyards and Iwan, the compactness ration has been decreased as a result the building performs less efficiently according to the passive house standard in terms of integrating a courtyard within a modern house built with passive house standard further research could be done on the effects of shapes, sizes and locations of the courtyards within the house to establish which alternative could prove to be the most efficient in order for bringing into action the possibility of actually re-implementing courtyards into modern low energy housings.
4. ConclusionThe results for the base case scenario demonstrate than in terms of heating, Passivhaus is effective in the Kurdistan region, and further reducing the heating requirements through the adaptation cases
The research shows that overheating will be still an issue, although the overheating frequency was reduced from 57% to 34% but further analysis and adaptation strategies must be put in place if use of cooling must be reduced or avoided.
The features of vernacular architecture simulated through the use of courtyards, which increases the form factor due to the increase in surface area, allows a better management of ventilation and thermal comfort as presented from case 3 to case 5. At the same time, features such as the Iwan implemented in case 1, performs several tasks, providing shading, privacy and character to the architecture of the Kurdistan region of Iraq.
Acknowledgements The authors would like to acknowledge the Foreign and Common Wealth Office for the support through the Chevening Scholarship and the Passivhaus Trust for providing access to DesignPH.
Criteria Base Case 1 Case 2 Case 3 Case 4 Case 5
Heating Demand 16 15 18 18 12 13
Heating Load 10 10 11 11 9 9
Cooling Demand 27 27 23 22 19.6 18
Cooling Load 12.3 11.9 11 11.2 14.1 14.2 Frequency of 53.0% 52.8% 50.8% 36.9% 36.7% 34.6%

160
Ban Jalal Ahmed and Carlos Jimenez-Bescos
References Abdulkareem S. (2012). The Adaptation of Vernacular Design Strategies for Contemporary Building Design in
Kurdistan. MSc. Thesis, Architectural Department, Faculty of Texas Tech University, August 2012. Abdulrahman H. and Abtar A. (2019). Parametric studies on solar performance of Iwan in Traditional houses in
Sulaymaniyah's Old town. Sulaimani Journal for Engineering Sciences, 6, 2. Asad, Y. G. (1989). The privacy of Iraqi architecture. Baghdad. Seminar in the privacy of contemporary Arab
architecture. Baghdad. Bossi L. (2013). Passive Houses and Low Energy Buildings: New Realizations and Retrofits in Hot Weathers (Libya).
The Third Skin Passive House Services, 2013. Bot.gov.krd.(2019) Climate unbelievable Kurdistan – official cite of Kurdistan. [online] available at:
http://bot.gov.krd/about-kurdistan/climate [Accessed 15Jul.2019]. El Saray S. and Omar O. (2017). Re-Thinking Courtyard Housing: Development of Traditional Islamic Courthouse into
Zero-Energy Buildings. World Sustainable built environment conference, Hong Kong, Track 5. Heywood, H., (2015). 101 Rules of Thumb for sustainable Buildings and Cities. RIBA Enterprises Ltd, Newcastle upon
Tyne. Hopfe, C.J. and Mcleod, R. S., (2015). The Passivhaus Designer's Manual, A technical guide to low and zero energy
buildings. Roughledge, New York. Ibrahim R. KH. (2016). A critical review of the built environment in Kurdistan-Iraq in the light of sustainable design.
Procedia Social and Behavioral Sciences, 00. James M. and Bill J. (2016). Passive House in different Climates, the path to net zero. Taylor & Francis, New York. 75-
82 Khalfan M., (2017). An Assessment of the passive house standard for a hot and arid climate, A case study in Qatar.
University of Liverpool, department of architecture. Khoshnaw R. (2019). Sustainable construction in Kurdish vernacular architecture, Department of Urban Planning
and Design, Faculty of Architecture, Budapest University of Technology and Economics. Mahmoudi, A. (2005). Review of iwan importance in traditional houses (with a special consideration of Bam).
Journal of Honarhaye Ziba. Meteobluecom. 2019. Meteoblue. [Online]. [1 May 2019]. Available from:
https://www.meteoblue.com/en/weather/forecast/modelclimate/ iraq_98463 Mohammed T. and Abdulsada G. (2015). Experimental study to evaluate the performance of Iraqi passive house in
summer season. Journal of Energy and Power Engineering, 9, David Publishing. Passivehouse-international.org, (2019). International Passive House Association | Advantages. [online] ) Available
from: < https://passivehouse-international.org/index.php?page_id=79> (accessed 9 July 2019). Raof B. (2018). Developing vernacular passive cooling strategies in Kurdistan–Iraq, International journal of scientific
and technology research, 7. Selmi M. and Ismail A. (1996). Economic and Thermal Performance of Thermostone in Qatar, Engineering Journal of
University of Qatar, 9, 171-190. Yassin A. A, and Utaberta N. (2012). Architecture in the Islamic civilization, Journal of Islamic architecture, 2 (2). “Web page without author info” Available from: Klimadaten.passiv.de <http://klimadaten.passiv.de/?lang=en_EN>
(accessed 4 August 2020).

161
The 54th International Conference of the Architectural Science Association (ANZAScA) 2020
An empirical measurement of the water vapour resistivity properties of typical Australian pliable membrane
Toba Samuel Olaoye1, Mark Dewsbury2 Hartwig Kunzel3 Gregory Nolan 1, 2 Architecture and Design, University of Tasmania, Launceston, Australia
{[email protected], [email protected], [email protected]} 3 Department of Hygrothermics, Fraunhofer Institute for Building Physics IBP,
Holzkirchen, Germany {[email protected]}
Abstract: International experience has shown that the duo of better insulated and more air-tight envelopes has often demonstrated an increased potential of moisture accumulation, interstitial condensation, and mould growth within the building envelope. Recent Australian research has documented high levels of indoor relative humidity and moisture accumulation in external walls. It is accepted that the materials that comprise the external envelope play a pivotal role in managing moisture accumulation and household generated water vapour diffusion. Internationally, to inform external envelope design, long-term transient hygrothermal analysis tools are used to simulate the water vapour diffusion and moisture accumulation process. To complete the hygrothermal analysis, the water vapour resistance properties of each envelope component must be known. At this stage, the vapour resistivity properties of most Australian construction materials are unknown. In this research, the vapour resistivity properties for some selected pliable membrane materials has been tested using variable relative humidity and variable temperature conditioned room. This novel method has been developed in response to international concern that the current vapour resistivity testing method may be inadequate, due to the variable conditions that exist within new buildings. This paper reports on the results from tests completed at 23oC and relative humidity values of 35% and 50%
Keywords: Interstitial condensation; Mould growth; Hygrothermal analysis; Vapour resistivity; Pliable membrane
1. IntroductionFor more than three decades, the enhancement of well-insulated and airtight building envelopes has been driven by the primary aim of reducing heating and cooling energy consumption in buildings (Mark Bomberg, Furtak, & Yarbrough, 2017; Hall, Casey, Loveday, & Gillott, 2013; Hong, Kim, Lee, Eom, & Choi, 2017; Ma, Li, Shao, & Jiang, 2013). However, internationally and within Australia, these same well insulated, airtight and energy efficient buildings have been identified as having a significant potential for trapping water vapour and accumulating moisture (Dewsbury & Law, 2017; Kaynakli, Bademlioglu, & Ufat, 2018; H. Künzel, 2005). Acknowledging this issue, significant building physics research investigating water vapour transport/diffusion, hygrothermal analysis and moisture accumulation properties of building construction materials and building construction systems is well developed in some other nations (Mark Bomberg et al., 2017; Galbraith, Kelly, & McLean, 2003; Hagentoft et al., 2004; H. Künzel, 2005; Libralato, Saro, De Angelis, & Spinazzè, 2019; Moon, Ryu, & Kim, 2014). As this field of science has developed, many nations have included clauses within national building regulations, standards and industry developed guidelines, which expect new homes to demonstrate passive capability to manage water vapour diffusion and the capability for individual elements to become wet and dry without material affecting moisture accumulation or mould growth. As nations develop this regulatory framework, minimum water vapour diffusion and condensation risk mitigation compliance is often informed by the use of empirically validated hygrothermal simulation software (Aynsley, 2012; Dean et al., 2011; Hall et al., 2013; H. Künzel, 2005; Marincionia & Altamirano-Medina, 2017).
Since 2003, the Australian national building regulations have been regularly enhanced, with the aim to reduce greenhouse gas emissions that maybe caused from energy used for household heating and cooling, hot water, and electric lighting. More recent Australia national policy is exploring the advancement towards zero energy new homes in the next decade. Initially, specified thermal insulation requirements for the external envelope were the focus of the regulations (ABCB, 2007). Since 2010, aspects of building sealing and airtightness have also been added (ABCB, 2010), with a goal in 2022 for quantitative air-tightness measurement. The duo of well
Imaginable Futures: Design Thinking, and the Scientific Method. 54th International Conference of the Architectural Science Association 2020, Ali Ghaffarianhoseini, et al (eds), pp. 161–170. © 2020 and published by the Architectural Science Association (ANZAScA).

162
Toba Samuel Olaoye, Mark Dewsbury, Hartwig Kunzel, Gregory Nolan
insulated facades and building airtightness has often demonstrated an increased potential of interstitial condensation, moisture accumulation and mould growth within the construction materials of the external envelope. The powerful forces of water vapour diffusion are caused by to the varying vapour pressure gradients that exist within the interior and exterior of the building envelope (H. Künzel, 2005; Lacasse & Morelli, 2017; Marincionia & Altamirano-Medina, 2017). More recently, Australian research has documented high levels of indoor relative humidity and moisture accumulation in external walls (M. Dewsbury, T. Law, et al., 2016; Nath & Dewsbury, 2019).
Whilst hygrothermal simulation and assessment has been evolving for several decades in many other developed nations, in Australia, this field of research is still in its infancy (Olaoye & Dewsbury, 2019). This may be due to fact that there were no building regulations requiring façade, floor, and roof insulation until 2003, and no building regulations regarding condensation risk management until 2019. The new condensation risk management regulations were in response to significant market-based concerns about the visible presence of condensation and mould in new buildings (Olaoye & Dewsbury, 2019). This knowledge gap and its long-term impact on building durability and human health is now a critical aspect of Australian regulatory development. Finally, early adopters of hygrothermal simulation in Australia, are merely deploying knowledge without appropriate empirical evaluation or understanding of its applicability to Australia envelope systems and the physical properties of Australian construction materials.
After consultations with relevant construction industry, product manufacturer and state and federal government agency stakeholders, it was recommended that capability and capacity must be developed prior to the broad deployment of hygrothermal simulation in Australia (M. Dewsbury, T. Law, et al., 2016). In 2016, the Commonwealth Scientific Industrial Research Organisation (CSIRO), identified hygrothermal research within its work plan for the Australian Nationwide House Energy Rating Scheme (Administrator). For hygrothermal simulation to occur, the hygrothermal properties, including water vapour diffusion properties of construction materials must be known. Preliminary research in 2016 (ABCB, 2016; Aynsley, 2012; M. Dewsbury, T. Law, et al., 2016) identified the need to establish water vapour resistivity and other physical hygrothermal properties for Australian construction materials. Internationally, water vapour resistivity properties of materials are obtained through empirical measurements from laboratory testing.
The testing method for this research included the use of a hygrothermally controlled test room. The establishment of the hygrothermal testing room is comprehensively discussed in Olaoye and Dewsbury (2019). The operation of this test room required the capability to independently, and precisely, control the internal temperature and internal relative humidity conditions. A key aspect of hygrothermal design that has been identified by the University of Tasmania hygrothermal research team, is the variability of temperature and relative humidity inside Australian residential buildings. These observations have been made since 2014 by the University of Tasmania, CSIRO, and independent building consultants (Nath & Dewsbury, 2019). To better understand how these conditions may impact the vapour diffusion properties of pliable membranes, the test room was operated in a manner which reflected the observed interior conditions within Australian buildings. Reflecting these needs, this hygrothermal test room has been designed to deliver an interior Relative Humidity between 35% and 85% with ± 2.5% deviation, and an interior temperature between 13℃ and 33℃, with ± 1.5 ℃ deviations (Olaoye & Dewsbury, 2019)
The most accepted laboratory test method is the gravimetric measurement of water vapour diffusion into or out of a test dish assembly, often referred to as the wet-cup or dry-cup method. The material being tested is applied to the top surface of the test dish. Depending on whether it is a wet cup or dry cup test, salt solutions, distilled water or desiccant are used to establish a predetermined relative humidity within the test dish (ASTM, 2010; Borjesson, 2013; Couturier & Boucher, 2011; International Standard Organization, 2012; Olaoye & Dewsbury, 2019). The dishes are either placed in a temperature and humidity controlled cabinet or a temperature and humidity controlled room (H. Künzel, 2005; Olaoye & Dewsbury, 2019). The humidity outside the cup is controlled such that a desired relative humidity condition outside of the cup assembly is achieved (Couturier & Boucher, 2011; Galbraith et al., 2003). Regular measurements are taken until the mass of the test dish remains unchanged.
In Australia, early research has identified that pliable membranes are likely to play a pivotal role in managing water vapour diffusion and mitigating moisture accumulation and mould growth (M. Dewsbury, T. Law, et al., 2016). The critical role that pliable membranes provide in external envelopes constructed from an insulated structural frame has also been identified in other developed nations (H. Künzel, 2005; Lstiburek & Eng, 2004; Mukhopadhyaya et al., 2007). Pliable membranes are regularly used in Australian buildings. They provide an additional water control layer under roofing materials and are applied to the outside surface of steel and timber framed walls to assist façade thermal, water and air control. In Australia’s temperate climates, when a pliable membrane is applied to the external surface of an insulated steel or timber structural framed wall it needs to

163
An empirical measurement of the water vapour resistivity properties of typical Australian pliable membrane
allow for the controlled dynamic diffusion of water vapour from its warm side to its cool side. Generally, this would be from the interior to the exterior. Similarly, in warm and humid Australian climates, when a pliable membrane is applied to the external surface of an insulated steel or timber framed wall, it also needs to allow for the controlled dynamic diffusion of water vapour, but this is generally from the exterior to the interior. This demonstrates that a pliable membrane, applied to the façade of a building needs to perform many simultaneous functions, (H. Künzel, 2005; H. M. Künzel & Zirkelbach, 2013; Lstiburek & Eng, 2004; Mukhopadhyaya et al., 2007), namely:
• Air Control layer,• Thermal Control layer, (as some products have a published thermal resistance property), • Water Control layer, • Fire Control layer (in multistory construction), and • Vapour Control layer.
Therefore, it is essential to understand the statutory function of a pliable membrane before it is selected for use in a façade system. For a pliable membrane to provide a climatically appropriate Vapour Control Layer, it must have climatically appropriate rates of water vapour diffusion. Table 1 below shows some generic classifications of building material water vapour diffusion characteristics. These classifications are non-specific and not specific enough to provide appropriate inputs for contemporary hygrothermal calculations. The 2015 review of the Australian Standard for Pliable Membranes (AS4200) identified the need for the detailed inclusion of water vapour resistivity/permeance properties for all pliable membranes (M. Dewsbury, T. Law, et al., 2016). This would require all pliable membrane manufacturers to prove the vapour resistivity properties of their products and for products to include appropriate labelling. As the final updated version of the vapour diffusion requirement did not require manufacturers to specifically declare the vapour diffusion value, many manufacturers only applied the general classification on labelling. A preliminary market survey, that was conducted as a part of this research revealed that some products had no vapour diffusion information on packaging, whilst others had material property data sheets which only indicated the general AS4200 2017 classification of their product (AS/NZS, 2017). The lack of appropriate pliable membrane vapour diffusion properties creates a distinct challenge for researchers and design professionals who may want to undertake energetic hygrothermal simulations to inform building envelope/facade design (Olaoye & Dewsbury, 2018).
Table 1: Construction material general vapour classification
Vapour Impermeable
Vapour semi-impermeable
Vapour semi-permeable
Vapour permeable
Polyethylene Oil based paints Wood Unpainted paper-faced plasterboard
Vinyl Some vinyl wall coverings
Plywood Unpainted plaster
Glass Extruded polystyrene Expanded polystyrene
Bulk insulation (rock wool, glass wool and polyester)
Sheet metal Paper faced bulk insulation
Most plastic paints Cellulose insulation, timber Clay bricks and Concrete blocks
Since 2019, condensation mitigation regulation has been included in the National Construction Code (NCC). The NCC refers to AS/NZ 4200:1 - Pliable Membranes. To establish water vapour diffusion properties, AS4200.1 refers to the wet-cup test method as described within ASTM E96M. Additionally, the Australian Standard does not adequately recognise or describe the hygrothermal function of pliable membrane and how it should be considered as a critical component in the envelope/facade construction process. This lack of adequate guidance or requirement is the likely reason why adequate water vapour resistivity properties are not included in the material datasheet by the manufacturers.
Another possible shortcoming of the Australian Standard is the reference to the North American Testing Method, ASTM E96. This wet cup method has been critiqued internationally, due to its singular focus on a single environmental condition, namely; 23°C and 50%RH (ASTM, 2010). This research and others has identified that the standard vapour resistivity testing method, where a single relative humidity of 50% and temperature of 23°C is adopted, may be inadequate due to the variable conditions that exist within new homes (ASTM, 2010; M. Bomberg, 1989; Couturier & Boucher, 2011; Olaoye & Dewsbury, 2018). During any given season, the temperature and relative humidity conditions inside Australian homes varies somewhat the exterior conditions. The amount of insulation and approaches to airtightness create significant differences in vapour pressure

164
Toba Samuel Olaoye, Mark Dewsbury, Hartwig Kunzel, Gregory Nolan
through the external envelope (façade). In many major Australian population centres, dew point may often be occurring at different locations within the envelope and be contributing to moisture accumulation. In addition, research has also shown that the temperature and humidity gradient in conditioned European and North American building interiors contrast significantly to what has been observed in Australia’s intermittently conditioned, energy efficient buildings (Mark Bomberg et al., 2017; Mark Bomberg & Pazera, 2010; Dewsbury, Law, & Henderson, 2016; H. Künzel, 2005; S. Nath, M. Dewsbury, & K. Orr, 2018). This background has informed need to develop an innovative testing methodology for materials which may be used in envelope/façade design.
As Australia is now considering what is the most appropriate method to test the vapour diffusion properties of all construction materials, a key component of this research is to test that validity of the above claim. That is, do construction materials display different vapour diffusion properties when subjected to different environmental conditions. If it is proven that construction materials do display different water vapour diffusion properties under different temperature and relative humidity conditions, the ASTM that is currently referenced is inadequate. This situation will require the development and specification of a new variable temperature and variable relative humidity test method. The new testing method may also establish whether the water vapour resistivity properties of construction materials are temperature dependent, humidity dependent or temperature and humidity dependent.
Considering that pliable membranes may play a pivotal role in the management of water vapour diffusion in new Australian residential and non-residential buildings, establishing their static or dynamic water vapour diffusion properties is essential. In 2019, this research reported on the development of an environmental test room (Olaoye & Dewsbury, 2019). This was commissioned in early 2020. Since commissioning, select pliable membrane materials have been tested under varying relative humidity and temperature conditions. The next section describes the empirical testing and vapour diffusion calculation methodology.
2. MethodologyThis section describes the methodology for this research. Due to the limitations of the current international
test method, the method adopted in this research included varying the relative humidity and temperature within the test room. This variable environment was established to determine if varying hygrothermal load has any influence on the water vapour resistivity properties of the tested pliable membranes. This paper reports on the water diffusion results from tested pliable membranes, when the test room has been continuously operated at 23°C, but the Relative Humidity has been operated at 35%, and 50%.
2.1 Test room operation
As mentioned above, the vapour diffusion testing method adopted in this research utilised a hygrothermally controlled test room. The procedure for this experiment generally followed the international guidelines for quantifying the water vapour diffusion properties of construction materials (ASTM, 2010; ISO, 2016). The standard test method required the test room to be maintained with a temperature of 23℃ (±5℃) and a relative humidity of 50% (±-5%), for both the dry-cup and wet-cup methods. However, as mentioned above, in this research, the test room was to be operated at 23°C and at relative humidity values is 35% and 50%.
For the first material diffusion test, the room was operated at a fixed condition of 23°C and 35% RH. For the second material diffusion test, the test room was then operated at 23°C and 50% RH. Later tests have included higher relative humidity conditions and different temperature conditions. The results from these later experiments will be included in future publications.
2.2 Wet-cup and dry-cup test dishes
To measure water vapour diffusion, there must be a different relative humidity condition created between the inside surface and outside surface of the material being tested. Due to the room conditioning, the temperature will be constant on both sides of the material being tested. In this research, both wet-cup and dry- cup methods were used. The dishes were 60mm deep and had a diameter of 200mm, as shown in Figure 1, below. To achieve the desired wet-cup humidity testing condition within wet-cup dishes, ammonium dihydrogen phosphate solution was placed in the dish, as shown below in Figure 2. This achieved a dish relative humidity of 93%. To achieve the desired testing humidity condition within the dry-cup test dishes, a silica gel bead was used, as shown below in Figure 3. This achieved a dish relative humidity of 3%. The chemicals are gently poured into the dishes ensuring a 20mm air space is maintained between the top surface of the chemical and the bottom surface of the test specimen.
The research project has included the testing of several pliable membranes; however, only two products are discussed in this paper. The two products selected met the AS4200.1 requirement for a Class 3 and a Class 4

165
An empirical measurement of the water vapour resistivity properties of typical Australian pliable membrane
pliable membrane. For each vapour diffusion test, ten specimens were prepared for testing: five for the dry-cup test method, and five for the wet-cup test method. The pliable membrane was then glued to the top edge of the dish. To ensure there is no opportunity for air leakage between the dish and the pliable membrane, the junction between the materials was then taped and sealed with paraffin wax, as shown in Figure 4 below. The dishes were then placed on shelving within the test room, as shown in Figure 6. Regular measurements to the dish mass in grams were taken until equilibrium was achieved, as shown in Figure 5.
Figure 1: Round glass dish Figure 2: Glass dishes for dry -cup test Figure 3: Glass dishes for wet-cup test
Figure 4: Application of wax seal Figure 5: weighing of test dish Figure 6: Rack of dishes in Test Room
2.3 Water vapour diffusion calculation
To establish water vapour diffusion properties, several values need to be calculated based on the measured change in mass form the test dishes. These include the water vapour flow rate, the water vapour permeance, water vapour resistivity and the water vapour resistance factor. Each of these equations are described below.
Equation 1: Water vapour resistivity g(ISO, 2016)
g = G/A in kg/ (s.m2),
A is the arithmetic mean of the exposed area of the test specimen in m2 G is the regression line between the mass change rate over the time interval.
Equation 2: Water vapour permeance (W)(ISO, 2016)
W= g/ ∆pv in kg/ (s.m2. Pa), where - ∆pv is the is the difference in the partial vapour pressure, - Psat, of each side of the test specimen (Psat = φ · 610.5 · e 17.269·θ /237.3+θ), - thus ∆pv= Psat wet side - Psat dry side, where θ is the temperature and φ is the relative humidity RH.
Equation 3: Water vapour resistance Z (ISO, 2016)
Z = 1/W in (s.m2. Pa)/kg.
Equation 4: Water vapour permeability δ(ISO, 2016)
δ = W*d in kg/(s.m.Pa), where d is the mean thickness of the test specimen measured with a micrometre screw gauge.
Equation 5: Water vapour resistance factor (µ)(ISO, 2016)
µ = δa/ δ, where δa is the water vapour permeability of air around the laboratory site.

166
Toba Samuel Olaoye, Mark Dewsbury, Hartwig Kunzel, Gregory Nolan
The water vapour permeability of air at 23oc is extrapolated from the figure below, as indicated in ISO 12572 once the mean barometric pressure of the site over the period of the measurement has been obtained. However, the water vapour diffusion-equivalent air layer thickness denoted by Sd is calculated as µ*d. X Barometric pressure in hPa · Y Water vapour permeability 10 -10 kg/ (m. s. Pa)
Figure 7: Water vapour permeability of air as a function of barometric pressure at 23 °c: (ISO, 2016)
3 Results and discussion This section discusses the result from the climatic control of the hygrothermal test room, observation from the test dishes measurement, result of the water vapour resistance factor and the air layer thickness from the two experiment.
3.1 Climatic control of the test room
The test room was appropriately monitored before measurement of mass of the dishes’ assembly began, however, it was found that the room would take up to four days to initially reach the desired temperature and relative humidity. It was also found that it would take an additional forty-eight hours for the room to remain stable at the desired temperature and humidity. Dishes were only placed in the room once stability was achieved.
Test method 1, which required the room the be kept at 23°C, with a Relative Humidity of 35%, took seven days for the test dishes to reach equilibrium. Figure 8 below shows a box plot of the temperature and Figure 9 below shows a box plot of the relative humidity conditions from this test. In the test room there were nine temperature sensors. The blue box plot shows the observations from three temperature sensors located 1800mm above the floor, whilst the orange box plot, grey box plot and yellow box plot show the 1200mm, globe temperature (mean radiant) and 600mm above floor level respectively. Figure 8 shows that aside from occasional outliers, the temperature in the room was maintained between 22.1°C and 23.0°C. In the test room, there were three relative humidity sensors located at mid room height (1200mm). Figure 9 shows that aside from occasional outliers, the relative humidity was maintained between 35.0% and 36.9%.
Test method 2, which required the room the be kept at 23°C, with a Relative Humidity of 50%, took 14 days for the test dishes to reach equilibrium. Figure 10 below shows a box plot of the temperature and Figure 11 below shows a box plot of the relative humidity conditions from this test. In the test room there were nine temperature sensors. The blue box plot shows the observations from three temperature sensors located 1800mm above the floor, whilst the orange box plot, grey box plot and yellow box plot show the 1200mm, globe temperature (mean radiant) and 600mm above floor level respectively.
Figure 8: Box and whisker plot of temperature
observations during test 1 Figure 9: Box and whisker plot of relative
humidity observations during test 1
Figure 10 shows that aside from occasional outliers, the temperature in the room was maintained between 23.2°C and 22.6°C. In the test room, there were three relative humidity sensors located at mid room height

167
An empirical measurement of the water vapour resistivity properties of typical Australian pliable membrane
(1200mm). Figure 11 shows that aside from occasional outliers, the relative humidity was maintained between 49.8.% and 50.8% as the average humidity was 50.4%.
Figure 10: Box and whisker plot of temperature observations during test 2.
Figure 11: Box and whisker plot of relative humidity observations during test 2
The international test methods also suggest that the barometric pressure at testing laboratory should be measured daily. In this research, the barometric pressure was obtained from the Bureau of Meteorology observations at the Low Head weather station. Low head is approximately 40km from Launceston and was selected due to its closeness to mean sea level, which closely corresponds to the height of the test building.
3.2 Result of the water vapour diffusion properties
The gravimetric measurement of change in mass over a particular period commenced as soon as the dishes were placed in the test room. Initially, weighing was completed at two hourly intervals. This was to establish if the dish gained or lost weight, (depending on the dry-cup or wet-cup chemical substrate). As samples from these two pliable membranes were tested, the result show that each has variable vapour resistant properties with varying relative humidity, and each took a different amount of time to reach equilibrium. Table 2 shows the minimum and the maximum time for each tested material to reach equilibrium, while Table 3 and 4 shows the measured water vapour properties of specimen A at 35%RH and 50%RH respectively. The water vapour properties of specimen B at 35%RH and 50%RH are tabulated in Table 5 and 6, respectively. The summary of these results in table 7 indicates the average water vapour resistance factors and the diffusion-equivalent air layer for Test 1 at 35 %RH and Test 2 at 50% RH, respectively. Figure 12 below, shows the variability of the water vapour resistance factor of Pliable Membrane 1, between Test A (35% RH) and Test B (50% RH). Figure 13 shows the variability of the diffusion equivalent air layer of Pliable Membrane 1, between Test A (35% RH) and Test B (50% RH). Figure 14 below, shows the variability of the water vapour resistance factor of Pliable Membrane 2, between Test A (35% RH) and Test B 50% RH). Figure 15 shows the variability of the diffusion equivalent air layer of Pliable Membrane 1, between Test A (35% RH) and Test B 50% RH). Each of these shows mild to significant difference in water vapour diffusion properties, subject to the relative humidity condition in the room.
Table 2: Testing period for the measurement
Test Specimen Shortest time until equilibrium achieved Longest time until equilibrium achieved Pliable membrane 1 Sample A – 2 days 7 days Pliable membrane 2 Sample B – 5 days 15 days
Table 3: Measured water vapour properties of specimen A @ 35%RH Specimen test Mean thickness Mass change rate Area Water vapour flux Water vapour permeance Water vapour resistance Water vapour permeability ater vapour resistance Diffusion-equivalent @23°C 35%RH d( m) /time (G in kg/s) m^2 g = G/A in kg/(s*m^2) W = g/dp in kg/(s*m^2*Pa) Z = 1/W in (s*m^2*Pa)/kg δ = W*d in kg/(s*m*Pa) factor µ air layer thickness Sd
A-Dry test 1 8.18E-04 4.76E-08 2.75E-02 1.73E-06 1.92E-09 5.20E+08 1.57E-12 9.96E+01 8.15E-02 A-Dry test 2 8.32E-04 5.30E-08 2.69E-02 1.97E-06 2.19E-09 4.58E+08 1.82E-12 8.32E+01 6.92E-02 A-Dry test 3 8.06E-04 5.38E-08 2.69E-02 2.00E-06 2.20E-09 4.50E+08 1.79E-12 8.44E+01 6.80E-02 A-Dry test 4 8.13E-04 5.16E-08 2.69E-02 1.92E-06 2.13E-09 4.70E+08 1.73E-12 8.80E+01 7.16E-02 A-Dry test 5 8.04E-04 5.10E-08 2.66E-02 1.92E-06 2.13E-09 4.70E+08 1.71E-12 8.92E+01 7.17E-02 Mean 8.15E-04 5.14E-08 2.70E-02 1.91E-06 2.11E-09 4.74E+08 1.72E-12 88.8834 7.24E-02 SD 6.47599319 0.005326789
A-Wet test 6 8.25E-04 7.52E-08 2.69E-02 2.80E-06 1.72E-09 5.82E+08 1.42E-12 1.14E+02 9.39E-02 A-Wet test 7 8.25E-04 1.02E-07 2.66E-02 3.84E-06 2.36E-09 4.24E+08 1.95E-12 7.65E+01 6.31E-02 A-Wet test 8 8.04E-04 8.97E-08 2.63E-02 3.41E-06 2.10E-09 4.77E+08 1.68E-12 9.18E+01 7.35E-02 A-Wet test 9 8.24E-04 9.84E-08 2.75E-02 3.58E-06 2.20E-09 4.54E+08 1.82E-12 8.36E+01 6.89E-02 A-Wet test 10 8.01E-04 8.16E-08 2.83E-02 2.88E-06 1.77E-09 5.65E+08 1.42E-12 1.13E+02 9.06E-02 Mean 8.16E-04 8.94E-08 2.71E-02 3.30E-06 2.03E-09 5.00E+08 1.66E-12 9.58E+01 7.80E-02 SD 1.22E-05 1.12E-08 8.04E-04 4.50E-07 2.77E-10 6.95E+07 2.36E-13 1.71E+01 1.36E-02

168
Toba Samuel Olaoye, Mark Dewsbury, Hartwig Kunzel, Gregory Nolan
Table 4: Measured water vapour properties of specimen A @ 50%RH Specimen test Mean thickness Mass change rate Area Water vapour flux Water vapour permeance Water vapour resistance Water vapour permeabili Water vapour resistan Diffusion-equivalen @23°C 50%RH d( m) /time (G in kg/s) m^2 g = G/A in kg/(s*m^2) W = g/dp in kg/(s*m^2*Pa) Z = 1/W in (s*m^2*Pa)/kg δ = W*d in kg/(s*m*Pa) factor µ air layer thickness Sd A-Dry test 1 8.04E-04 5.71E-08 2.78E-02 2.06E-06 1.56E-09 6.42E+08 1.25E-12 1.28E+02 1.03E-01 A-Dry test 2 8.19E-04 8.47E-08 2.75E-02 3.08E-06 2.33E-09 4.28E+08 1.91E-12 7.60E+01 6.23E-02 A-Dry test 3 7.94E-04 8.06E-08 2.66E-02 3.03E-06 2.30E-09 4.35E+08 1.82E-12 8.01E+01 6.36E-02 A-Dry test 4 7.84E-04 1.03E-07 2.60E-02 3.98E-06 3.01E-09 3.32E+08 2.36E-12 5.58E+01 4.37E-02 A-Dry test 5 8.08E-04 5.23E-08 2.75E-02 1.90E-06 1.44E-09 6.93E+08 1.17E-12 1.40E+02 1.13E-01 Mean 8.02E-04 7.56E-08 2.71E-02 2.81E-06 2.13E-09 5.06E+08 1.70E-12 9.60E+01 7.72E-02 SD
A-Wet test 6 8.36E-04 7.39E-08 2.78E-02 2.26E-06 2.20E-09 4.54E+08 1.84E-12 8.53E+01 6.80E-02 A-Wet test 7 8.24E-04 9.17E-08 2.75E-02 3.34E-06 2.76E-09 3.62E+08 2.76E-12 6.10E+01 5.03E-02 A-Wet test 8 8.08E-04 9.97E-08 2.78E-02 3.59E-06 2.98E-09 3.36E+08 2.40E-12 5.60E+01 4.52E-02 A-Wet test 9 8.04E-04 9.86E-08 2.78E-02 3.55E-06 2.94E-09 3.40E+08 2.37E-12 5.72E+01 4.59E-02 A-Wet test 10 8.05E-04 9.33E-08 2.75E-02 3.40E-06 2.81E-09 3.55E+08 2.27E-12 6.08E+01 4.90E-02 Mean 8.15E-04 9.14E-08 2.76E-02 3.23E-06 2.74E-09 3.69E+08 2.33E-12 6.41E+01 5.17E-02
Table 5: Measured water vapour properties for specimen B @ 35%RH Specimen test Mean thicknes Mass change rate Area Water vapour flux Water vapour permeance Water vapour resistance Water vapour permeabilit Water vapour resistanc Diffusion-equivalen @23°C 35%RH d( m) /time (G in kg/s) m^2 g = G/A in kg/(s*m^2) W = g/dp in kg/(s*m^2*Pa Z = 1/W in (s*m^2*Pa)/kg δ = W*d in kg/(s*m*Pa) factor µ air layer thickness Sd B-Dry test 1 4.49E-04 2.03E-08 2.75E-02 7.38E-07 8.19E-10 1.22E+09 3.68E-13 4.88E+02 2.19E-01 B-Dry test 2 4.49E-04 1.99E-08 2.75E-02 7.23E-07 8.03E-10 1.25E+09 3.60E-13 4.99E+02 2.24E-01 B-Dry test 3 4.79E-04 2.14E-08 2.69E-02 7.95E-07 8.82E-10 1.13E+09 4.23E-13 4.22E+02 2.02E-01 B-Dry test 4 4.57E-04 2.56E-08 2.63E-02 9.75E-07 1.08E-09 9.24E+08 4.94E-13 3.53E+02 1.61E-01 B-Dry test 5 4.76E-04 1.73E-08 2.63E-02 6.55E-07 7.26E-10 1.38E+09 3.46E-13 5.25E+02 2.50E-01 Mean 4.62E-04 2.09E-08 2.69E-02 7.77E-07 8.62E-10 1.18E+09 3.98E-13 4.57E+02 2.11E-01 SD
B-Wet test 6 4.12E-04 3.00E-08 2.63E-02 1.14E-06 7.03E-10 1.42E+09 2.89E-13 6.11E+02 2.52E-01 B-Wet test 7 4.72E-04 3.00E-08 2.57E-02 1.17E-06 7.18E-10 1.39E+09 3.39E-13 5.21E+02 2.46E-01 B-Wet test 8 4.87E-04 3.43E-08 2.63E-02 1.30E-06 8.02E-10 1.25E+09 3.91E-13 4.48E+02 2.18E-01 B-Wet test 9 4.68E-04 3.61E-08 2.80E-02 1.29E-06 7.92E-10 1.26E+09 3.71E-13 4.73E+02 2.21E-01 B-Wet test 10 4.65E-04 4.14E-08 2.75E-02 1.50E-06 9.25E-10 1.08E+09 4.30E-13 4.01E+02 1.86E-01 Mean 4.61E-04 3.44E-08 2.68E-02 1.28E-06 7.88E-10 1.28E+09 3.64E-13 4.91E+02 2.25E-01
Table 6: Measured water vapour properties for specimen B @ 50% RH
Table 7: Summary of the water vapour resistivity properties of tested materials
Specimen test
Water vapour resistance factor (µ) at 35%RH
Water vapour resistance factor (µ) at 50%RH
Diffusion-equivalent air layer thickness Sd (m) at 35%
Diffusion-equivalent air layer thickness Sd (m) at 50%
A-Dry test 88.88 96.01 0.0724 0.0772 A-wet test 95.80 64.06 0.0780 0.0517 B-Dry test 457.48 599.00 0.2113 0.2842 B-Wet test 490.83 365.9 0.2248 0.1744
Figure 12: Graph showing variation in the vapour resistance factor µ for specimen A
Figure 13: Graph showing variation in the diffusion- equivalent air layer thickness Sd (m) for specimen A
Furthermore, Figures 12 and 14 indicate a dynamic behaviour, as these pliable membranes diffused water vapour in different manner for the wet-cup test, as opposed to the dry-cup test. Similarly, Figures 13 and 15, indicate a dynamic relationship in the air thickness layer. Between the 35% RH test and the 50% RH test the dry- cup vapour resistance values increase. Whereas, between the 35% RH test and the 50%RH test the wet-cup vapour resistivity values decrease. This inverse pattern requires further investigation.
Specimen test Mean thicknes Mass change rate Area Water vapour flux Water vapour permeance Water vapour resistance Water vapour permeabilit Water vapour resistanc Diffusion-equivalen @23°C 50%RH d( m) /time (G in kg/s) m^2 g = G/A in kg/(s*m^2) W = g/dp in kg/(s*m^2*Pa Z = 1/W in (s*m^2*Pa)/kg δ = W*d in kg/(s*m*Pa) factor µ air layer thickness Sd B-Dry test 1 4.73E-04 2.17E-08 2.75E-02 7.90E-07 6.00E-10 1.67E+09 2.84E-13 6.34E+02 3.00E-01 B-Dry test 2 4.67E-04 2.02E-08 2.75E-02 7.35E-07 5.57E-10 1.79E+09 2.60E-13 6.95E+02 3.25E-01 B-Dry test 3 4.70E-04 2.39E-08 2.78E-02 8.61E-07 6.52E-10 1.53E+09 3.07E-13 5.84E+02 2.74E-01 B-Dry test 4 4.85E-04 2.62E-08 2.78E-02 9.43E-07 7.15E-10 1.40E+09 3.47E-13 5.13E+02 2.48E-01 B-Dry test 5 4.78E-04 2.39E-08 2.78E-02 8.63E-07 6.54E-10 1.53E+09 3.13E-13 5.72E+02 2.74E-01 Mean 4.75E-04 2.32E-08 2.76E-02 8.39E-07 6.36E-10 1.58E+09 3.02E-13 6.00E+02 2.84E-01
B-Wet test 6 4.81E-04 3.35E-08 2.77E-02 1.21E-06 1.00E-09 9.99E+08 4.83E-13 3.56E+02 1.71E-01 B-Wet test 7 4.90E-04 2.57E-08 2.75E-02 9.37E-07 7.76E-10 1.29E+09 3.80E-13 4.64E+02 2.27E-01 B-Wet test 8 4.62E-04 4.23E-08 2.75E-02 1.54E-06 1.28E-09 7.80E+08 5.90E-13 2.82E+02 1.30E-01 B-Wet test 9 4.77E-04 2.68E-08 2.80E-02 9.57E-07 7.93E-10 1.26E+09 3.78E-13 4.66E+02 2.22E-01 B-Wet test 10 4.61E-04 4.52E-08 2.75E-02 1.65E-06 1.36E-09 7.33E+08 6.29E-13 2.62E+02 1.21E-01 Mean 4.74E-04 3.47E-08 2.76E-02 1.26E-06 1.04E-09 1.01E+09 4.92E-13 3.66E+02 1.74E-01

169
An empirical measurement of the water vapour resistivity properties of typical Australian pliable membrane
Figure 14: Graph showing variation in resistance factor µ for specimen B
Figure 15: Graph showing variation in the diffusion- equivalent air layer thickness Sd (m) for
specimen B
Whilst these preliminary results indicate that pliable membranes behave differently when they are exposed to different relative humidity conditions, their behaviour is treated as static with hygrothermal simulations and within product classifications in AS4200.1. A static material may exhibit a linear characteristic to relative humidity, while a dynamic material behaves in a non-linear manner relative to changes in humidity. As only two tests have been completed, the future tests at greater relative humidity values will provide further evidence of a linear or non-linear relationship.
4.0 Conclusion and recommendation International experience has shown that the duo of better insulated and more air-tight envelopes has often demonstrated an increased potential of moisture accumulation, interstitial condensation, and mould growth within the building envelope. As materials that are used to construct the external envelope play a pivotal role in the passive management of water vapour diffusion, the need for correct data about their physical properties are critically needed as inputs for hygrothermal simulation of Australian envelope assemblies, in Australian climates.
At this stage, the vapour diffusion properties of most Australian construction materials are not known and a key aim of this research was to ascertain if the current referenced water vapour diffusion test method as described in ISO:12572 and AS4200.1 (ASTM:E96M) is appropriate. This method stipulates a single point of measurement where the test room has a temperature of 23℃ (±5℃) and a relative humidity of 50% (±-5%). It has been identified that this method may provide inadequate information about the physical properties of construction materials, which experience continuously varying temperature and relative humidity conditions.
In this research the results from two testing periods are discussed. Test I required the test room to be maintained at 23℃ (±5℃) and 35%RH (±5%). Test 2 required the test room to be maintained at 23℃ (±5℃) and 50%RH (±5%). This research documented that both pliable membrane products demonstrated different vapour diffusion properties between Test 1 and Test 2. This initial finding demonstrates that the current method, as described in ISO:12572 and AS4200.1 (ASTM: E96M) may be inappropriate. To ascertain whether different Relative Humidity conditions further affect the water vapour diffusion properties of the tested pliable membranes, the next stages of the research will see the test room kept at at 23℃ (±5℃) but the relative humidity will be changed to 65%RH, followed by 85%RH. This will then be followed by testing the materials at a constant relative humidity, but the room temperature will be varied.
Acknowledgement This research acknowledges financial support from the CSIRO.
References ABCB. (2007). The Building Code of Australia: Volume 2. Australian Building Codes Board ABCB. (2010). The Building Code of Australia: Volume 2. Australian Building Codes Board ABCB. (2016). NCC 2016 Building Code of Australia - Volume One. ABCB Canberra: Australian Building Codes Administrator, N. N. (2012). NatHERS Software Accreditation Protocol. In. Pliable building membranes and underlays, Part 1 C.F.R. (2017). ASTM. (2010). Standard Test Methods for Water Vapor Transmission of Materials. In A. International (Ed.), E96/E96M: ASTM,
West Conshohocken, PA, America. Aynsley, R. (2012). Condensation in residential buildings part 1: review. EcoLibrium, October 2012, 48-52. Bomberg, M. (1989). Testing water vapor transmission : unresolved issues. ASTM STP 1039, H. R. Trechsel and M. Bomberg,
Eds, American Society for Testing and Materials 191 6 Race Street, Philadelphia, 157-167. Bomberg, M., Furtak, M., & Yarbrough, D. (2017). Buildings with environmental quality management: Part 1: Designing
multifunctional construction materials. Journal of Building Physics, 41(3), 193-208.

170
Toba Samuel Olaoye, Mark Dewsbury, Hartwig Kunzel, Gregory Nolan
Bomberg, M., & Pazera, M. (2010). Methods to check reliability of material characteristics for use of models in real time hygrothermal analysis. Paper presented at the Research in Building Physics—Proceedings of the First Central European Symposium on Building Physics.
Borjesson, F. (2013). An investigation of the water vapour resistance-The humidity detection sensor method in Versmaperm MkIV compared to the gravimetric method,. (Master thesis). Chalmers University of Technology Gothenburg, Sweden,
Couturier, M., & Boucher, C. (2011). DYNAMIC WATER VAPOR PERMEANCE OF BUILDING MATERIALS AND THE BENEFITS TO BUILDINGS. Paper presented at the 26th RCI International convention and trades show, USA.
Dean, S. W., Mukhopadhyaya, P., Batcheller, D., Kumaran, K., Lackey, J., van Reenen, D., & Normandin, N. (2011). Correlation Between Water Vapor and Air Permeability of Building Materials: Experimental Observations. Journal of ASTM International, 8(3). doi:10.1520/jai102924
Dewsbury, M., & Law, T. (2017). Temperate Climates, Warmer Houses and Built Fabric Challenges. Procedia Engineering, 180, 1065-1074. doi:10.1016/j.proeng.2017.04.266
Dewsbury, M., Law, T., Fitz-Gerald, D., McComish, B., Potgieter, J., Chandler, T., & Soudan, A. (2016). Scoping study of condensation in residential buildings: final report. Retrieved from
Dewsbury, M., Law, T., & Henderson, A. (2016). Investigation of destructive condensation in Australian cool-temperate buildings. DoJ Building Standards and Occupational Licensing, Editor.
Dewsbury, M., Law, T., Potgieter, J., Fitzgerald, D., McComish, B., Chandler, T., & Soudan, A. (2016). Scoping Study of Condensation in Residential Buildings: Final Report. Retrieved from Australian Building Codes Board:
Galbraith, G., Kelly, D., & McLean, R. (2003). Alternative methods for measuring moisture transfer coefficients of building materials. Research in building physics, 249-254.
Hagentoft, C.-E., Kalagasidis, A. S., Adl-Zarrabi, B., Roels, S., Carmeliet, J., Hens, H., . . . Djebbar, R. (2004). Assessment Method of Numerical Prediction Models for Combined Heat, Air and Moisture Transfer in Building Components: Benchmarks for One-dimensional Cases. Journal of Thermal Envelope and Building Science, 27(4), 327-352.
Hall, M. R., Casey, S. P., Loveday, D. L., & Gillott, M. (2013). Analysis of UK domestic building retrofit scenarios based on the E. ON Retrofit Research House using energetic hygrothermics simulation–Energy efficiency, indoor air quality, occupant comfort, and mould growth potential. Building and Environment, 70, 48-59.
Hong, J., Kim, D., Lee, M., Eom, J., & Choi, C.-H. (2017). An Advanced Process of Condensation Performance Evaluation by BIM Application. Advances in Materials Science & Engineering, 1-8. doi:10.1155/2017/1064064
International Standard Organization. (2012). Hygrothermal performance of building components and building elements - Internal surface temperature to avoid critical surface humidity and interstitial condensation - Calculation methods (ISO 13788:). In EVS-EN ISO 13788:2012. Estonian Centre or Standardization, Brussels.
I. S. O. E. (2016). Hygrothermal performance of building materials and products - Determination of water vapour transmission properties - Cup method ISO 12572. In EVS-EN ISO 12572:2016. Estonian Centre or Standardization, Brussels Kaynakli, O., Bademlioglu, A. H., & Ufat, H. T. (2018). Determination of Optimum Insulation Thickness for Different Insulation
Applications Considering Condensation. Tehnicki vjesnik / Technical Gazette, 25, 32-42. Künzel, H. (2005). Adapted vapour control for durable building enclosures. Paper presented at the 10th International
Conference on Durability of Building Materials & Components, Lyon (France). Künzel, H. M., & Zirkelbach, D. (2013). Advances in hygrothermal building component simulation: modelling moisture sources
likely to occur due to rainwater leakage. Journal of Building Performance Simulation, 6(5), 346-353. Lacasse, M. A., & Morelli, M. (2017). Approach to assessing the long-term performance of wall assemblies–durability of low-
rise wood-frame walls. Paper presented at the XIV DBMC: 14th International Conference on Building Materials and Components.
Libralato, M., Saro, O., De Angelis, A., & Spinazzè, S. (2019). Comparison between Glaser Method and Heat, Air and Moisture Transient Model for Moisture Migration in Building Envelopes. Applied Mechanics & Materials, 887, 385-392.
Lstiburek, J. W., & Eng, P. (2004). Understanding vapor barriers. ASHRAE journal, 46, 40-51. Ma, X., Li, X., Shao, X., & Jiang, X. (2013). An algorithm to predict the transient moisture distribution for wall condensation
under a steady flow field. Building and Environment, 67, 56-68. doi:10.1016/j.buildenv.2013.04.028 Marincionia, V., & Altamirano-Medina, H. (2017). Analysis of the suitability of mould growth models for the risk assessment
of woodfibre internal wall insulation a. Paper presented at the Energy Procedia, Trondheim, Norway. Moon, H. J., Ryu, S. H., & Kim, J. T. (2014). The effect of moisture transportation on energy efficiency and IAQ in residential
buildings. Energy and Buildings, 75, 439-446. Mukhopadhyaya, P., Kumaran, M. K., Lackey, J., Normandin, N., Reenen, D. v., & Tariku, F. (2007). Hygrothermal Properties
of Exterior Claddings, Sheathing Boards, Membranes, and Insulation Materials for Building Envelope Design. ASHRAE. Nath, S., & Dewsbury, M. (2019). The use of an innovative hygrothermal simulation method to develop built fabric
recommendations for southern Australia. Paper presented at the Revisiting the role of Architecture for 'Surviving’ Development: 53rd International Conference of the Architectural Science Association 2019. , IIT Roorkee, India.
Olaoye, T. S., & Dewsbury, M. (2018). Australian Building Materials and Vapour Resistivity. Paper presented at the Building Physics forum, Wollogong, Australia.
Olaoye, T. S., & Dewsbury, M. (2019). Establishing an environmentally controlled room to quantify water vapour resistivity properties of construction materials. Paper presented at the Revisiting the Role of Architecture for 'Surviving’ Development. 53rd International Conference of the Architectural Science Association 2019, Roorkee, India.
S. Nath, M. Dewsbury, & K. Orr. (2018). Is new housing health hazard? Paper presented at the Engaging Architectural Science: Meeting the Challenges of Higher Density,52nd International Conference of the Architectural Science Association, RMIT University, Australia.

171
The 54th International Conference of the Architectural Science Association (ANZAScA) 2020
An integrated approach towards hillside building design for automated construction
Philip Tong1 and Hans-Christian Wilhelm2 1, 2 Victoria University of Wellington, Wellington, New Zealand [email protected], [email protected]
Abstract: In many cities under urbanisation pressures, sloping topographies tend to be under-utilised due to complex designs and difficult access/navigation on-site, resulting in low construction productivity and high cost. Extensive research has been conducted on increasing productivity in the building industry through automation. A similarly prolific area of research from the 1970s and 80s are hillside dwellings that resulted, however, mostly in high-end individual houses. This research combines concepts for automated and prefabricated construction with hillside dwelling design and proposes a method of design that integrates both aspects, generating innovative, site-specific design outcomes. The aim is to develop a parametric framework of design in which site infrastructure for automated construction on hillsides is integrated with the dwelling design to improve productivity and use more affordable hillside sites. Analysis of design typologies for hillside housing and research into automated construction allows for development of high-density, low-rise dwelling structures suited for serial, automation-assisted construction, with the topography as a design-generator. The design method is tested and refined on a case-study site in Wellington, New Zealand. Investigation into the geometric implications of automated construction on hillside sites allows for architects to design so that such processes are incorporated into the building from the start.
Keywords: Automated; construction; parametric design; hillside dwelling
1. Problem Statement and RelevanceDuring the process of urbanisation, many cities have sites with sloping or undulating topographies that tend to be either left to informal settlement or to low-density villa-type dwellings. Urbanisation competes with green spaces, which often are limited to hillsides considered too difficult to access for standard construction. The spatial and environmental qualities of urban hillsides therefore often appear compromised and under-utilised, in relation to sustainable urbanism and dwelling design. Undulated topographies also often require complicated design, access, and navigation on-site, resulting in low construction productivity and high cost in turn.
In New Zealand (NZ), where several cities and towns feature complex topographies, low construction productivity has long been identified a major driver of high cost of dwellings (New Zealand Productivity Commission, 2012). One factor of this is a workforce unable to keep up with the growing demand, as indicated by a 2019 Oceania construction market survey (Rider Levett Bucknall, 2019). Introduction of
Imaginable Futures: Design Thinking, and the Scientific Method. 54th International Conference of the Architectural Science Association 2020, Ali Ghaffarianhoseini, et al (eds), pp. 171–180. © 2020 and published by the Architectural Science Association (ANZAScA).

172
Philip Tong and Hans-Christian Wilhelm
innovative construction techniques, including prefabrication and the use of automation-assisted practices, can address this labour shortage and increase construction productivity. This in turn would reduce cost of construction on sloped sites and could therefore increase affordable housing supply in cities with undulating topography. However, most existing automation-assisted practices are carried out on flat sites. Given that hillside dwelling typologies tend to be a design typology totally distinct to dwellings on flat sites, application of automation-assisted construction processes to hillside dwellings may require development of a site infrastructure for support. For this purpose, a conceptual shift seems required, away from engineering slopes out (by way of excavation and retaining walls for example), towards a fine-grained analysis of the topography itself, which in turn is combined with parameters driven by dwelling design and construction techniques.
Though often a more affordable land type to purchase, sloped sites offer distinct challenges, and the response to these limitations in NZ tends to be either development of bespoke dwellings, as high-end individual houses, or non-utilisation. Construction of individual houses still represents the largest portion of new dwelling production each year (Stats NZ, 2019), reflecting a largely small scale, traditional construction industry. The requirement for denser urban models and smaller dwelling footprints has been widely acknowledged but lacks implementation. Therefore, exploration of innovative design and construction techniques, including automation, seems best suited to Medium Density Housing (MDH) or low-rise, high density housing typologies, allowing for a higher urban density within cities. This typology would also allow for an increase in affordable housing; compared to traditional low-density typologies, greater density means also greater supply.
With this in mind, the paper focuses on exploration of options for increasing construction productivity, through application of contemporary technologies such as prefabrication and automation; it also focuses on development of a hillside medium density housing typology that fits within the New Zealand context and integrates principles of sustainable urbanism including higher densities and ample green spaces; and finally, exploration of the potential for the adaptation of existing automation-assisted construction practices for hillside sites, in order to allow the less-expensive hillside land type to be more affordable to build on, thereby achieving more sustainable and liveable dwelling models within cities.
2. Background Research, Proposition, MethodologyLiterature Review. The tension or antithetic relationship between construction productivity and adaption to changing sites and requirements is inherent to architecture and construction. With the establishing of industrial production, in the early 1900s, architects and engineers have aimed to transfer concepts from mass production of consumer goods to production of dwellings or buildings. Research by Seelow (2018) on these early concepts shows that, though technology has changed drastically since then, ideas developed by Walter Gropius are still of interest for the conceptualisation of the construction site as an assembly line and the idea of serial construction from a flexible kit of components. The rationality behind Gropius’ concepts is that the component itself, being manufactured as a mass-produced item, could have flexibility in terms of configuration within the resulting structure. While the assembly-line principle has been readily adopted, the construction kit approach towards construction has not seen the same level of adoption. The industry is well-suited to the adoption of components and modules, as reinforced by prefabrication design guides by both Knaack et al. (2012) and Smith (2012), which look at both theory and practical considerations for designing using prefabricated elements.

173
An integrated approach towards hillside building design for automated construction
Current research into application of in-situ automated construction focuses on strategies and techniques for assembly, and, with few exceptions, are carried out on flat sites or in controlled production environments (for example, the in-situ fabricator and the mesh-mould wall, as explored by ETH Zurich) (Hack, 2018). For on-site automation, advanced navigation assisted by real-time scanning of the surrounding space has been explored for developing mobile robots with varying tools. Further explorations of potential for in-situ processes have been investigated (among others) by Helm et al. (2012) and Keating et al. (2017). Helm et al. discuss the requirements for on-site processes, including the limitations, whereas Keating et al. investigates architecture-scale robotic prefabrication and application of the processes. An assessment of the effects of the robotic fabrication process on design has been discussed by Bonwetsch (2012): inclusion of the principles of the fabrication process into the design can result in the design being inherently buildable without requiring analysis and adaptation to a buildable product, and can reduce losses between the conception and the construction of the design.
There is a significant amount of research carried out in terms of construction and design on sloped topography, primarily around the 1980s. Rouillard (1987) and Levin (1991) identify general principles of hillside structural, aesthetic, and programmatic decisions, while Simpson and Purdy (1984) examine the pragmatics of construction on hillsides. A more contemporary analysis of hillside designs by Burns and Kahn (2004) focuses on how site can be used a design driver, to result in architecture that is properly integrated with the environment. These examples are limited to the technologies of the time, and to bespoke projects, as opposed to affordable dwellings. In light of the above, the research gap identified is for an integrated design method, comprising site specific responses, automation-assisted production and assembly, and a design and construction kit allowing for economy of scale.
Research proposition. This paper proposes that adaptation of automation-assisted construction practices for hillsides, and the development of a design method in which the required site infrastructure is integrated, can increase construction productivity on sites with sloped topography. The focus of the paper is on adaptation of existing techniques and processes for hillside construction, for the purpose of developing low-rise, medium-density housing.
Methodology. The research comprises three main methodological steps: firstly, establishing typologies for the relationship between site and dwelling, and general research into hillside dwelling design. Secondly, analysis of typologies of current techniques for construction automation. In a final step, the findings from the initial steps are used to formulate a parametric framework for design and siting of medium-density, low-rise dwelling structures suited for serial, automation-assisted construction. The topography will be used as the main parameter in this process. The resulting design method is tested and refined on a case-study site in Wellington (NZ).
3. Research Steps and Findings
3.1 Typological analysis of hillside dwellings and construction automation/robotics
Typologies of hillside dwellings. The initial steps focus on case studies: identification of hillside dwelling typologies that have a strong relationship to the sloped topography is important, as the desire is to develop a dwelling that is specific to hillsides. Establishment of general hillside typologies allows for a basic knowledge of some design strategies for how the geometric form of the building could relate to the slope. With the learning from the general typologies, a matrix of precedent hillside dwellings has

174
Philip Tong and Hans-Christian Wilhelm
been established from both international and NZ projects. The elevated typology, or more colloquially the stilt house (Figure 1a), is a prominent response within NZ to the hillside condition. In combination with the fact that stilts have less of an impact on the site itself and require less earthworks, this typology has been chosen for further exploration into adaptation for an automation-assisted construction typology.
Figure 1: Examples of hillside typologies
Typologies of current techniques for construction automation. A similar analysis of the general techniques for construction automation has been carried out, exploring the geometric implications of using automation-assisted construction processes. The characteristics that serve as the primary focus for this matrix are firstly the mobility of the automation, or the ability for the automation to relocate itself; secondly the reach of the automation, or the range in which the automation could work in before requiring relocation. These general automation typologies range from the factory setting automation, wherein the automation is permanently fixed inside a structure, but has a greater range and payload (Figure 2a); to the mounted unit automation, where the automation is attached to a mobile platform of some kind, but tends to have lower range and payload (Figure 2e).
Figure 2: Examples of automation typologies
Conceptual assembly strategies. The two discussed categories of analysis then have been overlaid with each other to develop three initial concepts, that incorporated theoretical automated construction processes:
a. The sequential fabrication process, in which an initial structural assembly is constructed, and thenused to support a robotic crane. Further assemblies are then constructed to support modules moved into place. Using the built assemblies as support, the robotic crane (or a pair) can be progressivelymoved, allowing for construction to continue uphill (Figure 3a).
b. The spine and unit process, in which a spine assembly is constructed first by a mobile automation,which then uses the spine to advance and continue building. The units are then constructed out

175
An integrated approach towards hillside building design for automated construction
from the spine (Figure 3b). During and after construction, access and service infrastructure is located in the spine.
c. The funicular assembly process, in which a funicular railway system is used as a central point fromwhich the automation works, as it constructs the dwelling around it. This limits the dwelling to arelatively linear shape, due to how the funicular functions (Figure 3c).
Figure 3: Conceptual assembly strategies
3.2 Developing an integrated, analytical design method
Case study. In order to test and develop the initial concepts, a complex and steep hillside at Shelley Bay on the Miramar Peninsula in Wellington (NZ) has been identified. This area is likely to be developed for densified urban development, and exemplifies the problems associated to hillsides as described in section 1. Furthermore, Shelly Bay has garnered criticism for issues such as a lack of affordable housing and public spaces, inadequate scale of buildings perceived as to large, and infringing excessively on the forestedgreen spaces. The specific site selection identifies an area between Shelly Bay Road and Main Road, justsouth of Carter Park, on the edge of a forested area. Based on the initial design concepts, aspects of thesequential fabrication and spine and unit processes are selected for further development on the specificsite. The sequential fabrication strategy has the greatest potential for adaptation to for a modularprefabricated system. The spine and unit concept has a better programmatic layout, however, with ashared pathway for access and infrastructure from which all dwellings can be accessed.
Formulation of parameters for a design method. For the envisaged method of design, the strategy comprises two steps and a combination of parametric and manual design processes: firstly, developing a script able to determine possible sites on an input topography, and generate a structure. Secondly, manual manipulation of the output, dependant on qualitative criteria, into a dwelling. The script here is understood as an analytical design method or tool, which can be applied to other instances of the same environment, with an output that allows for automation-assisted construction. Vice-versa, the output from the script is not understood as an entire design in and of itself.
The first structural decision to be made is around the foundations of the site. Screw piles present an opportunity for automation-assisted processes: there are existing practices that incorporate machinery

176
Philip Tong and Hans-Christian Wilhelm
in the screw pile installation process, simply requiring a rotary hydraulic powerhead to wind the pile into the ground. The potential for adaptation of an automation such as the In-Situ Fabricator (a caterpillar- tracked mounted unit) for installation of screw piles is evident, due to the similarity of some existing machines for screw pile installation. Indicative values for maximum slope are taken from the Caterpillar Performance Handbook (Caterpillar Inc., n.d.), where any slope above 25° is to be treated as Extreme. Prefabricated volumes or pods, comprising 1-2 rooms, are laid out on a grid generated where the robot can access, and are supported on bearers and the screw-in foundations. The volumes are positioned to have interstitial spaces that can either form part of the dwelling, or used as accessway (Figure 4a-c).
Defining a three-dimensional grid for spatial slope analysis. The scale of the repetitive grid, and of the floorplates, is driven by both the story height and the requirements for stairs. The storey height of each volume was decided to be 3.2m, to allow for comfortable floor-to-ceiling height. The resulting 1.6m half- storey height informed the stair dimensions: given that the accessway should conform to Accessible stair standards as set by NZBC Clause D1, the maximum pitch of the stairs should be 32°. To rise 1.6m, the stairs would require a minimum length in plan of approximately 4.5m including landings at the top and bottom. To accommodate the stairs, the volumes are intended to have side lengths of 5.1m. In combination with the width of the stairway itself, the overall grid spacing was input as 7.2m (Figure 4d) .
Figure 4: Interstitial space purposes and volume dimensions
The grid itself was angled at 45° from the face of the slope, as it resulted in the volumes staying better connected adjacently, compared to un-angled. Other site-specific advantages of angling the grid include two of the faces of each volume now having better potential for good views across the harbour, compared to one, and the potential for better access to sunlight (especially when regarding the hill).
Visual scripting (Rhino Grasshopper) has been used for slope analysis and generating the geometry for developing the design. There are benefits to using generative design tools for certain purposes: generative design tools manage to take input parameters, and using a specific set of rules, develop a response. In this way, generative design can be viewed as a quantitative response, as opposed to the qualitative characteristics that manual design is more suitable for. In finding the rules for an automation-assisted construction process, it is possible for a script to be developed.

177
An integrated approach towards hillside building design for automated construction
3.3 Defining the generative script
Slope angle analysis and location of a valid point grid on the topography mesh. Initial scripted generation requires identification of the areas of the topography that can be accessed by the robotic unit, and application of the point grid (of dimensions decided beforehand) to the valid areas.
a. Generate a NURBS surface, representative of the sloped site, from contour polylines b. Explode the NURBS surface into constituent triangular faces, and analyse to find slope of the face c. Group the faces by slope, depending on a maximum angle input parameter (in this case, 25° is the
maximum slope, so faces are grouped by whether they are faces of desired slope or not) d. Input analysed faces into a green-to-red colour gradient, and blur, for visual representation e. Generate a field of points on the XY-plane that corresponds to a square grid. The size of the square
grid is an input parameter and decides the distances between interstitial intersection points. This gridis rotated 45°
f. Project the faces that have the desired slope down flat onto the XY-plane, and find the points of the grid that fit inside the projected faces
g. Project these select points up onto the topography mesh, so that they land on the surface, but onlyon the faces with desired slope. This method ensures that only the faces of the desired domains willhave points applied to them.
Locate floorplates in valid positions and generate stilts and volumes. Once the point grid has been applied to the valid areas, floorplates are generated where piles can support all four corners and moved to the input storey spacing. Floorplates can be used to generate stilts and can be extruded to volumes.
a. All floorplates are moved up to the nearest altitude of a specific factor: the input parameter that defines the levels of the floorplates (the vertical spacing between floorplates)
b. Find all floorplates that intersect the topography mesh and translate vertically, for properly validfloorplate location
c. From the corners of the floorplates, project lines straight down to the topography mesh,representing stilts, and allowing for identification of pile locations (Figure 5)
d. Extrude the floorplates into volumes.
Figure 5: Floorplates located in valid positions

178
Philip Tong and Hans-Christian Wilhelm
Accessway Pathfinding. A base pathway for the shared accessway can be generated from a set of criteria including maximum vertical coverage, use of paths that have correct stair pitch, number of household units that can be accessed, and maximum straight sections.
a. Floorplates are grouped into the overall clusters of floorplates, and three points are generated fromthese, all in the interstitial intersections: a randomized selection of one point each from the lowest20%, middle 20% and highest 20% of all interstitial intersections (in terms of z-value)
b. The three points are used to generate a polyline representing the general trend for the accessway to follow. The actual accessway path is generated from lines representing all possible locations for apathway to follow that conforms to stair requirements, and follows the general trend polyline asclosely as possible
c. An algorithm solver manipulates the three generated points many times in quick succession,generating many possible pathways that are then analysed to best fit a set of criteria: • Pathways that maximise vertical distance covered between top and bottom points • Pathways that do not double back on themselves• Pathways that have relatively even numbers of volumes on either side • Pathways that have as few corners to turn as possible The algorithm provides a number of different paths that can then be manually reviewed: however, all
paths identified with this method require further development. Due to the limitations of the pathfinding tool, unnecessary corners are often added. It is desirable to maximise the straight sections of the accessway path for visual confirmation of where the pedestrian is going, as well as to increase safety by minimizing corners that conceal the path ahead (Figure 6a).
Household unit identification and volume refinement. Manual decision-making allows for the volumes to then be further refined into dwellings, starting with volumes around the accessway: the removal of certain volumes at some of the corners of the shared accessway can introduce views to those selected corners, providing destinations along the accessway.
Manual identification of the household units is possible once the accessway path has been recognised. A connection to the accessway is always required, and the household units therefore branch off from the central path. The household units consist of clusters of 3-5 volumes, with or without a void volume to form a courtyard (Figure 6b). Clustering of households needs to take into account factors such as vertical displacement between adjacent volumes, to allow internal stairways to be possible. The household units consist of varying numbers of volumes due to the variance in requirements for households in NZ, allowing for a range of household occupant numbers. The varying number of volumes also allows for more adaptability when laying-out the household units themselves (Figure 6c).
Manual identification of the household units is desirable, as there are many potential qualitative factors alongside the quantitative factors (e.g. the requirement for volumes to be on similar levels for access). These qualitative factors could include aspects such as the views possible from certain locations, or which volumes would be most appropriate for removal and use as a garden/courtyard, and how those voided volumes can then be used as part of select households. Given the limitations of parametric generation as a quantitative tool, qualitative decision-making is not a possibility for the script, hence the manual input.

179
An integrated approach towards hillside building design for automated construction
Figure 6: Further refinement of the generated dwelling
Further considerations. Volume scale will need to consider the specific structure and design of the prefabricated components. As the current method of construction is for combination of robotic caterpillars and robotic cranes to place modules on-site, the ability for a module to be transported is major factor for scale: the maximum width of a module without requiring oversized load approval is 2.50-2.55m, 4.25-4.30m tall, and 20m long (NZ Transport Agency, 2017). The material for the structure itself will also affect the dimensions of the volumes.
Planning out the household floorplans themselves have many further considerations. There is potential for the volumes to be two- or three-level volumes instead, increasing the size of the floor area per household, though this would increase shading in the interstitial spaces. The implication of investigating this could affect the method for identifying household units themselves: if the volumes contain multiple levels, less volumes are required per household. Another aspect that needs to be considered is the requirement for privacy, avoiding overlooking windows in adjacent households.
The proposed system identifies methods for applying automated construction to hillsides for the purpose of increasing construction productivity, as the inherent advantages of automation-assisted construction can allow for an increase in the efficiency of the work carried out on-site. Through the use a parametric framework, the topography of the site itself can be used as an input for generation of a structure that allows for the identified processes to be carried out, and can support manual development into a multi-unit dwelling.

180
Philip Tong and Hans-Christian Wilhelm
Implications The design tool developed in this paper allows for synthesis of the efficiency of hillside automation-
assisted construction, through the input parameters. The modular approach allows for efficient space use and easier application of prefabricated design principles. The proposed system appears to have high potential within the NZ context: maximising the amount of work carried out by automated means decreases the need for a large number of manual workers, thereby lessening the impact of a decreasing available workforce. In combination with prefabrication, less time on-site is also required. By integrating the requirements for automation-assisted construction into the design process, buildability is incorporated into the building from inception, lessening the potential for transfer loss between design and construction when analysing the design for buildability at later stages. These characteristics are indicative of an integrated design method with the potential to positively impact hillside construction and allow for better design and more efficient use of hillside sites.
References: Bonwetsch, T. (2012) Robotic Assembly Processes as a Driver in Architectural Design. Available from: ETH Zurich
<https://www.research-collection.ethz.ch/handle/20.500.11850/59658> (accessed 19 June 2020). Burns, C. and Kahn, A. (2004) Site Matters: Design Concepts, Histories and Strategies, Routledge, New York. Caterpillar Inc. (n.d.) Caterpillar Performance Handbook. Available from: Caterpillar Inc
<http://nees.ucsd.edu/facilities/docs/Performance_Handbook_416C.pdf> (accessed 21 July 2020). Hack, N.P. (2018) Mesh Mould: A Robotically Fabricated Structural Stay-in-Place Formwork System. PhD Thesis, ETH
Zurich, Zurich. Helm, V., Ercan, S., Gramazio, F. and Kohler, M. (2012) Mobile Robotic Fabrication on Construction Sites: dimRob,
IEEE/RSJ International Conference on Intelligent Robots and Systems, 7-12 October. Vilamoura: IEEE. Keating, S.J., Leland, J.C., Cai, L. and Oxman, N. (2017) Toward site-specific and self-sufficient robotic fabrication on
architectural scale, Science Robotics, 2(5), 1-15. Knaack, U., Chung-Klatte, S. and Hasselbach, R. (2012) Prefabricated Systems: Principles of Construction, Walter de
Gruyter GmbH, Berlin. Levin, A.H. (1991) Hillside Building: Design and Construction, Arts + Architecture Press, Santa Monica. New Zealand Productivity Commission (2012) Housing Affordability Inquiry. Available from: New Zealand Productivity
Commission <https://www.productivity.govt.nz/assets/Documents/9c8ef07dc3/Final-report- v5.pdf> (accessed 29 July 2020).
NZ Transport Agency (2017) Vehicle dimensions and mass: guide to the factsheet 13 series. Available from: New Zealand Transport Agency <https://www.nzta.govt.nz/resources/factsheets/13> (accessed 23 July 2020).
Rouillard, D. (1987) Building the Slope: Hillside Houses 1920-1960, Arts + Architecture Press, Santa Monica. Rider Levett Bucknall (2019) Oceania Report: Construction Market Intelligence. Available from: Rider Levett Bucknall
<https://s28259.pcdn.co/wp-content/uploads/2019/01/RLB-Oceania-Report_Q1_2019_2.pdf> (accessed 18 July 2020).
Seelow, A.M. (2018) The Construction Kit and the Assembly Line – Walter Gropius’ Concepts for Rationalizing Architecture, Arts, 7(4), 95-124.
Simpson, B.J. and Purdy, M.T. (1984) Housing on sloping sites: a design guide, Construction Press, London. Smith, R.E. (2010) Prefab Architecture: A Guide to Modular Design and Construction, Wiley, Hoboken. Stats NZ (2019) Building Consents Issued: December 2019. Available from: Stats NZ
<https://www.stats.govt.nz/information-releases/building-consents-issued-december-2019> (accessed 28 July 2020).

181
The 54th International Conference of the Architectural Science Association (ANZAScA) 2020
Application of a performance-based framework to prioritise underutilised historical buildings for adaptive reuse in Auckland,
New Zealand
Itohan Esther Aigwi1, James Rotimi2, Reza Jafarzadeh3, Tanya Sorrell4, Amarachukwu Nnadozie Nwadike5, An Le6 and Ravindu Kahandawa7
1 School of Future Environment, Auckland University of Technology, Auckland, New Zealand [email protected]
2, 5, 6, 7 School of Built Environment, Massey University, Auckland, New Zealand {j.rotimi, a.nwadike, a.lethihohai, r.kahandawa}@massey.ac.nz
3 ,4 Auckland Council, Auckland, New Zealand {reza.jafarzadeh, tanya.sorrell}@aucklandcouncil.govt.nz
Abstract: The adaptive reuse of historical buildings is currently trending as a practical approach to urban andseismic resilience, relying on expertise from different professional backgrounds ranging from conservation, planning, architecture, engineering, to interior design. This paper explores the applicability of a performance-based Multiple Criteria Decision Assessment (MCDA) framework to prioritise underutilised historical buildings for adaptive reuse in Auckland, New Zealand, while balancing the diverse interest of all relevant stakeholders. Findings from this study revealed the significant potentials of the performance-based framework, both as an evidence-based measurement tool to prioritise underutilised earthquake-prone historical buildings in Auckland's central business district and as an effective decision-making strategy. Also, the framework allowed the inclusion of diverse stakeholders' through the integration of collaborative rationality, hence, ensuring consistency and transparency in the decision-making process. The performance-based methodology has exciting implications for local councils, heritage agencies, architects, urban planners, policymakers, building owners and developers in New Zealand, as a guide to advance their understandings of (i) the intangible values of optimal historical buildings perceived by the community as worthy of protection through adaptive reuse; and (ii) the targeted needs of communities in the new functions of an optimal alternative from a group of representative historical building alternatives.
Keywords: Adaptive reuse; performance-based framework; prioritise; historical buildings
1. Introduction and Overview of the StudyHistorical buildings are buildings or structures that have some form of architectural or historic interests which
connects people to past events. While historical buildings also provide excellent narration of the existence of urban areas by creating physical links and the advancement of cultural evidence with the past (Goodwin, Tonks, & Ingham, 2009), not all historical buildings have heritage significance. In New Zealand, heritage buildings are historical buildings with heritage significance, that are listed in the national heritage register or local district plans (Heritage New Zealand, 2019). Current society still perceives some derelict and underutilised historical buildings as eyesores to the public, therefore, underestimating the strive for conservation activities in New Zealand (Aigwi, Filippova, Ingham, & Phipps, 2020). As owners of existing historical buildings are mandated by legislation to protect
Imaginable Futures: Design Thinking, and the Scientific Method. 54th International Conference of the Architectural Science Association 2020, Ali Ghaffarianhoseini, et al (eds), pp. 181–190. © 2020 and published by the Architectural Science Association (ANZAScA).

182
Itohan Esther Aigwi, James Rotimi, Reza Jafarzadeh, Tanya Sorrell, Amarachukwu Nnadozie Nwadike, An Le and Ravindu Kahandawa
derelict historical buildings, most of them would prefer to apply the 'wait and see' approach, especially when their buildings are earthquake-prone, due to uncertainty in return on investment to seismically retrofit their buildings (Aigwi, Egbelakin, et al., 2019). Accordingly, the affected owners would choose to wait for the stipulated timeframes to pass, hence, facilitating urban shrinkage through 'demolition by neglect' (Beauregard, 2013). There are usually extensive implications of the 'wait and see' decision on the general community due to the downstream effects on the socio-economic environment of the local area. In active seismic countries such as New Zealand, the unintended consequences of the earthquake-prone building legislation have contributed to 'plaguing' many city centres with underutilised historical buildings (Yakubu et al., 2017), which has now created a significant opportunity for the local authorities of such affected areas to pursue city-centre regeneration strategies (Aigwi, Filippova, et al., 2020).
The adaptive reuse approach is currently trending as a practical pathway to urban regeneration and resilience, relying on expertise from diverse professional backgrounds ranging from conservation, planning, architecture, engineering, to interior design (Aigwi, Egbelakin, & Ingham, 2018). Embracing the adaptive reuse approach as part of urban regeneration activities provides opportunities for repurposing and reusing extensive collections of underutilised historical buildings and abandoned urban areas (Aigwi et al., 2018), reviving old urban fabric, managing prevalent urban sprawl, and tackling sequential economic, social and environmental challenges (Roberts, Sykes, & Granger, 2016). Though urban regeneration has been argued to be a pragmatic approach to address the issues of urban decay and enhance the diverse socio-economic objectives , past experiences have reflected some negative consequences associated with urban regeneration programs, even with the involvement of invigorating policies. Although these negative consequences, including loss of unique local characteristics, social exclusion and gentrification, and soaring housing prices exists (Larsen & Hansen, 2008), some valuable lessons have emerged as well. These lessons include an emphasis on (i) the importance of local social networks; (ii) the incomplete and limited nature of physical solutions to urban challenges; (iii) the fact that total clearance of existing urban fabric should only be considered when rehabilitation is not attainable; and (iv) the importance of involving local neighbourhood residents in participatory decision-making as experts do not have all the solutions (Rohe, 2009).
According to Bhatnagar and Williams (1992), participatory decision-making could be viewed as both an 'end' (i.e., participation develops skills and enhances individuals' capability for action and for improving their lives), and a 'means' (i.e., participation contributes to improved development policies and projects). While the adaptive reuse decision-making process involves the cooperation and contribution from different stakeholders (Aigwi, Phipps, Ingham, & Filippova, 2020), combining it with the urban regeneration process would unavoidably involve multiple stakeholders with diverse interests, which would complicate the planning, implementation, and evaluation of potential solutions (Zheng, Shen, & Wang, 2014). Community-based stakeholder collaborative involvement in decision-making is essential for the sustainable development of a locality through the contributions of the stakeholders to the management and monitoring of community development interventions, investment choices, design alternatives, and policy formulation (International Institute for Sustainable Development, 2014). Hence, the conservation of heritage buildings cannot be sustained without effective stakeholder participation (ICOMOS, 2010).
The application of the performance-based planning philosophy to a collaborative adaptive reuse decision- making process involves the practical assessment of relevant priority aspects and criteria with fixed quantitative limits on satisfactory adaptive reuse standards for effective outcomes (Aigwi, Ingham, Phipps, & Filippova, 2020; Aigwi, Phipps, et al., 2020). Accordingly, the critical mechanisms of the performance-based planning approach to prioritise historical buildings for adaptive reuse should include priority aspects and criteria that would give a detailed description of efficient and effective adaptive reuse outcome. As performance-based planning approaches continue to inspire adaptive reuse decision-makers to promote urban resilience through the retention of historical buildings (Aigwi, Egbelakin, et al., 2019), no study has applied the performance-based MCDA methodology to weigh the influences of identified adaptive reuse parameters on the optimal adaptive reuse outcome in Auckland, New Zealand.
This paper, therefore, explores the applicability of the performance-based MCDA framework developed by Aigwi, Ingham, et al. (2020) to prioritise underutilised historical buildings for adaptive reuse in Auckland, New Zealand, while balancing the diverse interest of the relevant adaptive reuse stakeholders.

183
Application of a performance-based framework to prioritise underutilised historical buildings for adaptive reuse in Auckland, New Zealand
2. Materials and MethodsThis study focuses on applying a performance-based framework to (i) prioritise underutilised historical building
alternatives for adaptive reuse interventions; and (ii) balance the diverse interests of all relevant adaptive reuse stakeholders. The performance-based MCDA framework (Aigwi, Egbelakin, et al., 2019; Aigwi, Ingham, et al., 2020) is adopted to guide the formalised process for the provision of the systemic and transparent adaptive reuse decision-making process (Belton & Stewart, 2010). Accordingly, four significant phases will be explored when applying the performance-based MCDA technique (Aigwi, Egbelakin, et al., 2019): (i) identification, interpretation and establishment of alternatives and criteria; (ii) definition and interpretation of qualitative information, inter- criteria preferences such as scores, and intra-criteria preferences such as weightings; (iii) ranking of best alternative through the aggregation of choice functions; and (iv) sensitivity analysis of the optimal outcome when all measured parameters are varied.
2.1. Data collection A focus group workshop was conducted with relevant adaptive stakeholders in Auckland, New Zealand, on
Wednesday 29th August 2018, from 9:00 am to 1:00 pm, to prioritise optimal selection of underutilised historical buildings from four proposed building alternatives while exploring and balancing their diverse opinions. The profile of the focus group participants cut through different categories including: (i) their profession – Building owners/users/developers (25%), Building professionals – Engineer, architect, quantity surveyor, urban planner (20%), Local council representatives – Asset management team; Heritage policy team (25%), Local heritage representatives (25%), and Legal representatives (5%); (ii) their organisational portfolio – Senior management (50%), Middle management (25%), Supervisor/team leader (15%), and other (10%); (iii) their level of professional experience – 0 to 1 year (5%), 1 to 5 years (15%), 6 to 10 years (10%), 11 to 15 years (25%), 16 to 20 years (15%), and over 20 years (20%); and (iv) their gender – Male (65%) and Female (35%). The theme of the workshop was 'Building Resilient Urban Areas through Sustainable Adaptive Reuse'. The focus group data collection method was selected as the most suitable technique for this study because it presents an opportunity to test the assumptions of the diverse adaptive reuse experts and gather their beliefs and opinions through deliberations till a consensus is reached (Krueger & Casey, 2014).
Four buildings were nominated by Auckland Council to be used as case study building alternatives (i.e., A1, A2, A3, and A4) for this study. Some comparative characteristics of these four buildings are provided in Table 1.
Table 1. Comparative characteristics of the four alternatives
Source: Authors – Physical observation and review of existing building documents

184
Itohan Esther Aigwi, James Rotimi, Reza Jafarzadeh, Tanya Sorrell, Amarachukwu Nnadozie Nwadike, An Le and Ravindu Kahandawa
2.2. Application of the performance-based framework The focus group participants were engaged in exploring the validation of the performance-based framework
developed by Aigwi, Ingham, et al. (2020), to prioritise underutilised historical building alternatives for adaptive reuse interventions in Auckland, New Zealand, while balancing the diverse interests of all relevant stakeholders. Accordingly, to avoid bias in the decision-making process, the 20 workshop participants were randomly grouped into four teams (i.e., five participants per team), with unique colour codes (i.e., blue, green, purple, and red) attributed to each team.
During the validation exercise, the participants assigned weights to each priority aspects (i.e., building usability, economic sustainability, built heritage preservation, socio-cultural, and regulatory aspects) and their respective criteria. They also attributed scores to different case study buildings (i.e., the alternatives). The weighting and scoring process is an essential aspect of generating learning outcomes through consensus from the MCDA process (Belton & Stewart, 2010) while reflecting the relative importance of the value judgement of decision-makers (Wright & Goodwin, 2009). The linear additive statistical technique was followed to test the performance-based framework, due to the varying nature of the different criteria, and the absence of uncertainty in the framework (Belton & Stewart, 2010).
2.3. Selection of the preferred alternatives Following the weighting and scoring process, a decision was reached on the optimal alternative building through
consensus (Aigwi, Phipps, et al., 2020). Next, a decision matrix was used to analyse the results from the weighting and scoring process to provide the information required to make a final decision. Weights were then assigned to each criterion, which was later multiplied by the relative scores of each of the four alternative buildings (see Tables 3 to 6). The total weighted scores for alternatives A1, A2, A3, and A4 were compared and converted to a percentage to realise the total weighted score of the MCDA process. The alternative with the highest total score (in percentage) became the optimal choice.
3. Results and Analysis of FindingsApplying the performance-based framework to prioritise underutilised historical buildings for adaptive reuse in
Auckland, New Zealand, enabled the focus group participants to select the optimal historical building alternative. From the four building alternatives that were presented, A3 was an alternative with the highest total weighted score; hence, the optimal choice.
3.1. Sum weightings of all four focus groups Based on the total standardised results from the weighting and scoring process, A3 (31%) was given the most
priority by all four focus groups, closely followed by A1 (30%) and A4 (29%). In comparison, A2 was given the least priority (10%). For the optimal priority aspects, built heritage preservation – P3 was prioritised the most (31%) by all four focus groups, followed by building usability – P1 (24%), socio-cultural aspects – P4 (23%), and economic sustainability – P2 (17%), while regulatory aspects – P5 (6%) was given the least priority. Accordingly, a decision matrix of the total standardised weighted scores from the four focus groups is presented in Table 2.
Table 2. Decision matrix for the performance-based framework from all four groups
Total Standardised weighted scores (%)
Priority Blue Green Purple Red
Wi A1 A2 A3 A4 A1 A2 A3 A4 A1 A2 A3 A4 A1 A2 A3 A4
P1 3.99 1.90 5.80 3.57 6.37 2.76 4.55 4.19 9.82 12.64 11.75 6.96 8.06 3.73 7.32 3.42 W1 = 24%
P2 4.58 0.62 5.23 5.10 7.28 1.73 5.34 4.88 2.84 2.75 3.33 2.00 6.35 3.73 4.85 5.23 W2 = 16.5%
P3 8.59 2.06 13.22 14.69 8.84 0.00 10.10 12.62 7.32 0.00 8.21 8.43 8.96 0.00 10.08 11.20 W3 = 31%
P4 7.65 1.15 6.46 8.29 7.36 2.63 8.41 7.89 5.99 0.00 6.15 5.82 6.35 1.87 6.35 7.47 W4 = 23%
P5 2.37 0.97 2.34 1.43 1.82 0.95 1.26 1.02 1.93 0.00 1.93 2.13 1.72 0.80 1.55 0.97 W5 = 5.5%
27.18 6.70 33.05 33.08 31.67 8.06 29.67 30.60 27.90 15.39 31.37 25.34 31.43 10.14 30.15 28.28 100%

185
Application of a performance-based framework to prioritise underutilised historical buildings for adaptive reuse in Auckland, New Zealand
3.2. Determination of optimal prioritised adaptive reuse alternative The weighted sum model (WSM) technique (Triantaphyllou, 2013) is adopted to evaluate the optimal prioritised
alternative and optimal ordered priority aspects, given the four alternatives (A1, A2, A3, and A4) and five priority aspects (P1, P2, P3, P4, and P5) for this study.
Pi = for i = 1,2,3, …, M. (1) According to Triantaphyllou (2013), the WSM operates based on the additive utility supposition. Hence, the
optimal selection would be that which matches up with the most significant priority value. Table 3 presents a decision matrix for the optimal chosen alternatives and ranks.
Table 3. Decision matrix for the optimal chosen alternative
Total standardised weighted scores (%)
Focus groups Alternatives
A1 A2 A3 A4 Blue 27.18 6.70 33.05 33.08 Green 31.67 8.06 29.67 30.60 Purple 27.90 15.39 31.37 25.34 Red 31.43 10.14 30.15 28.28 Final prioritised alternatives 30% 10% 31% 29%
Priority aspects (Pi) Wi Building Usability (P1) W1 = 24 6.99 5.05 7.27 4.45 Economic sustainability (P2) W2 = 16.5 5.31 2.21 4.72 4.38 Built heritage preservation (P3) W3 = 31 8.46 0.54 10.48 11.82 Socio-cultural aspects (P4) W4 = 23 6.85 1.44 6.83 7.41 Regulatory aspects (P5) W5 = 5.5 1.96 0.70 1.77 1.37 Final ordered priority aspects 30% 10% 31% 29%
Ranking 3 1 4* 2
* indicates the optimal chosen alternative; (Rank 4 = best, Rank 1 = worst)
3.3. Sensitivity analysis to determine the most critical priority aspect A sensitivity analysis is done to measure the stability of the optimal chosen alternative (i.e., A3) assuming the
recorded weights and scores are adjusted, in order to avoid the potential weaknesses from MCDA processes when weights and scores are subjectively allocated (Caterino, Iervolino, Manfredi, & Cosenza, 2008). Also, the sensitivity
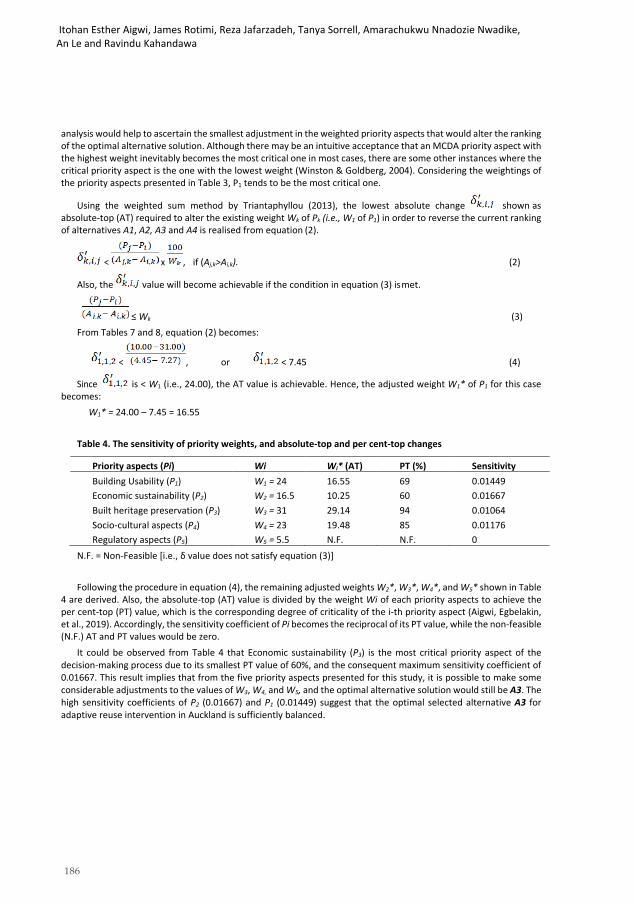
186
Itohan Esther Aigwi, James Rotimi, Reza Jafarzadeh, Tanya Sorrell, Amarachukwu Nnadozie Nwadike, An Le and Ravindu Kahandawa
analysis would help to ascertain the smallest adjustment in the weighted priority aspects that would alter the ranking of the optimal alternative solution. Although there may be an intuitive acceptance that an MCDA priority aspect with the highest weight inevitably becomes the most critical one in most cases, there are some other instances where the critical priority aspect is the one with the lowest weight (Winston & Goldberg, 2004). Considering the weightings of the priority aspects presented in Table 3, P1 tends to be the most critical one.
Using the weighted sum method by Triantaphyllou (2013), the lowest absolute change shown as absolute-top (AT) required to alter the existing weight Wk of Pk (i.e., W1 of P1) in order to reverse the current ranking of alternatives A1, A2, A3 and A4 is realised from equation (2).
< x , if (Aj,k>Ai,k). (2)
Also, the value will become achievable if the condition in equation (3) is met.
≤ Wk (3) From Tables 7 and 8, equation (2) becomes:
< , or < 7.45 (4)
Since is < W1 (i.e., 24.00), the AT value is achievable. Hence, the adjusted weight W1* of P1 for this case becomes:
W1* = 24.00 – 7.45 = 16.55
Table 4. The sensitivity of priority weights, and absolute-top and per cent-top changes
Priority aspects (Pi) Wi Wi* (AT) PT (%) Sensitivity Building Usability (P1) W1 = 24 16.55 69 0.01449 Economic sustainability (P2) W2 = 16.5 10.25 60 0.01667 Built heritage preservation (P3) W3 = 31 29.14 94 0.01064 Socio-cultural aspects (P4) W4 = 23 19.48 85 0.01176 Regulatory aspects (P5) W5 = 5.5 N.F. N.F. 0
N.F. = Non-Feasible [i.e., δ value does not satisfy equation (3)]
Following the procedure in equation (4), the remaining adjusted weights W2*, W3*, W4*, and W5* shown in Table 4 are derived. Also, the absolute-top (AT) value is divided by the weight Wi of each priority aspects to achieve the per cent-top (PT) value, which is the corresponding degree of criticality of the i-th priority aspect (Aigwi, Egbelakin, et al., 2019). Accordingly, the sensitivity coefficient of Pi becomes the reciprocal of its PT value, while the non-feasible (N.F.) AT and PT values would be zero.
It could be observed from Table 4 that Economic sustainability (P3) is the most critical priority aspect of the decision-making process due to its smallest PT value of 60%, and the consequent maximum sensitivity coefficient of 0.01667. This result implies that from the five priority aspects presented for this study, it is possible to make some considerable adjustments to the values of W3, W4, and W5, and the optimal alternative solution would still be A3. The high sensitivity coefficients of P2 (0.01667) and P1 (0.01449) suggest that the optimal selected alternative A3 for adaptive reuse intervention in Auckland is sufficiently balanced.

187
Application of a performance-based framework to prioritise underutilised historical buildings for adaptive reuse in Auckland, New Zealand
4. DiscussionThis paper focused on the applicability of a performance-based framework to prioritise underutilised historical
buildings for adaptive reuse in Auckland, New Zealand, while balancing the diverse opinions of relevant stakeholders. Accordingly, 20 stakeholders were randomly grouped into four teams with unique colour codes (i.e., blue, green, purple, and red). They were engaged in a focus group workshop to explore the validation of the performance-based framework developed by Aigwi, Ingham, et al. (2020). Four building alternatives were presented to the workshop participants, as shown in Table 1. The alternatives include the Grey Lynn Community Library building (A1), Sandringham Reserve Toilet building (A2), Toi Tū – Studio One building (A3), and the Leys Institute Library & Gymnasium building (A4). These alternatives are government-owned and are representative examples of underutilised historical buildings in strategic locations in Auckland. All the buildings are listed in Auckland Council's heritage plan as 'Class B' heritage buildings, with one of them also listed as a 'Category 1' heritage building in New Zealand's national heritage register (Heritage New Zealand, 2019). Also, five priority aspects (i.e., building usability, economic sustainability, built heritage preservation, socio-cultural, and regulatory aspects) with their respective criteria were weighted and scored against the four alternatives (A1, A2, A3, and A3) presented to the workshop participants.
The total standardised results from the weighting and scoring process revealed that A3 (31%) was given the overall priority by all four focus groups, as the optimal underutilised historical building alternative for adaptive reuse intervention. A3 was closely followed by A1 (30%) and A4 (29%), while A2 was given the least priority (10%). For the optimal priority aspects, built heritage preservation – P3 was prioritised the most (31%) by all four focus groups, followed by building usability – P1 (24%), socio-cultural aspects – P4 (23%), and economic sustainability – P2 (16.5%), while regulatory aspects – P5 (5.5%) was given the least priority. Based on the weighting and scoring results for each of the four focus groups, the 'blue', 'green', 'purple', and 'red' focus group workshop participants selected A4 (33%), A1 (32%), A3 (31%), and A1 (31%) as their respective optimal alternative for adaptive reuse intervention. Irrespective of the diverse choice of alternatives by the different focus groups, participants of the 'blue', 'green' and 'red' focus groups prioritised 'built heritage preservation – P3' the most, and agreed that changing the use of A1 and A4 would influence the following aspects of built heritage preservation because A1 and A4 have: (i) intrinsic heritage links that exhibit positive public image over its lifecycle, thereby maintaining a sense of place; (ii) significant heritage fabric that can be preserved to promote the historical and cultural development of the area; (iii) aesthetic features that would sustain the visual heritage appeal of the surrounding streetscape; and (iv) original inherent fabric that would sustain the architectural history and narration of Auckland's existence.
On the other hand, participants of the 'purple' focus group prioritised 'building usability – P1' the most, and agreed that the conversion of A3 for new functions would influence the following aspects of building usability because A3: (i) offers a better opportunity for the introduction of spatial and structural transformations; (ii) is located in a sitethat has excellent proximity to transport facilities that would provide easy access for vehicular and pedestrianmovement; (iii) has significant components or arrangements that can support functional alterations for future reuse; (v) has been designed in a way that can maximise natural lighting and indoor air quality without significant mechanical involvement; (vi) displays higher prospects for undergoing innovative construction finishes that would be consistent with current technological trends; and (vii) has an orientation that can be maximised to provide great opportunities for solar passive gains. Accordingly, the 'purple' group prioritised the target new use for A3 as a cultural (arts centre),and the target users as commercial (e.g., retailers, offices, cinema, hotel, cafés, and restaurants) and cultural groups.
The next most preferred priority aspects following 'built heritage preservation' are 'socio-cultural aspects – P4' and 'economic sustainability – P2'. Accordingly, all focus group participants believe that the adaptive reuse of A3 for new functions would maximise the following socio-cultural aspects because A3: (i) has features that would help to sustain a shared cultural identity of place; (ii) is capable of promoting a feeling of belonging and attachment to place; (iii) has tremendous potential to trigger the public's interest in refurbished historical buildings, through a culturallysustainable new use; and (iv) is capable of serving as a practical social amenity to its neighbourhood. Also, theparticipants believe that the adaptive reuse of A3 for new functions would promote the economic sustainability

188
Itohan Esther Aigwi, James Rotimi, Reza Jafarzadeh, Tanya Sorrell, Amarachukwu Nnadozie Nwadike, An Le and Ravindu Kahandawa
of A3 through (i) potential increase in property and land value including that of neighbouring buildings, gained from potential viable new use; (ii) potential cost savings from the reuse of construction materials; (iii) potential shorter construction period due to already existing structural elements of main structure; (iv) its location in a site with suitable topography, plot size, and scenery, that would be attractive to potential tenants or buyers; (v) increased job creation from potential viable new building function; and (vi) potential financial gain through increased revenue from tourism.
'Regulatory aspects' was the least prioritised by all four focus groups. All focus group participants believe that the conversion of A3 for new functions would compromise compliance with the following regulatory aspects: (i) the current Building Act in assuring a safe, healthy, and resilient place for its users (Building Act, 2004); (ii) the existing earthquake-prone building legislation to minimise injury or death, property damage, and business interruption in the event of an earthquake (MBIE, 2016); (iii) the conservation of significant building features with heritage values, according to the current provisions of the Heritage New Zealand Pouhere Taonga Act (HNZPT, 2014); (iv) the current Building Act by providing a means of disability, fire protection and safety, and emergency escape systems (Building Act, 2004); (v) the relevant environmental standards by offering enhanced living space for its users such as comfort, indoor air quality, acoustics, etc; and (vi) the current urban masterplan, zoning and planning specifications for Auckland city.
The findings from this study are slightly aligned in the least priority aspects with a previous New Zealand study (Aigwi, Egbelakin, et al., 2019), that tested the performance-framework with relevant stakeholders in Whanganui District Council (i.e., the least priority is given to regulatory aspects in both studies). However, the findings are different in the most priority aspects (i.e., the most priority attributed to economic sustainability by the workshop participants in Whanganui and built heritage preservation by the workshop participants in Auckland). The rationale for this difference could be linked to the size of the two cities. Auckland is a bigger city and also the economic hub of New Zealand (Aigwi, Phipps, Ingham, & Filippova, 2019), is currently experiencing rapid growth in its built environment sector due to housing shortage, hence, the quest to protect its remaining heritage assets. On the flip side, Whanganui is a provincial city in New Zealand, currently undergoing a socio-economic decline in its city-centre (Aigwi, Phipps, et al., 2019), hence, the active quest to regenerate its city-centre through adaptive reuse of its abundant underutilised historical buildings, to create more jobs and potential financial gains from tourism.
5. ConclusionsThe study presented in this paper explored the application of a performance-based framework to prioritise
underutilised historical buildings for adaptive reuse in Auckland, New Zealand. This study's focus is of particular importance to Auckland city due to the increasing trend of adaptive reuse of underutilised historical buildings in New Zealand, and the need to protect the remaining significant heritage assets that constitute numerous benefits for relevant stakeholders (Aigwi et al., 2018; Aigwi, Ingham, et al., 2020). The performance-based framework which involved different scenarios developed by (Aigwi, Ingham, et al., 2020) was used to prioritise five priority aspects (i.e., building usability, economic sustainability, built heritage preservation, socio-cultural, and regulatory aspects) and four alternatives (A1, A2, A3, and A4). The focus group participants assigned weights to the priority aspects and the respective criteria, and scores to the alternatives involved in the evaluation process. The application of the performance-based framework in Auckland proved to be very beneficial, especially in the planning of adaptive reuse interventions to endorse complex decisions about alternative historical building scenarios. Therefore, it is essential to choose an alternative historical building that can incorporate the diverse viewpoints and involvement of experts in the evaluation process. Accordingly, the evaluation process using the performance-based framework was well-structured in this study to integrate the collaboration of all focus group participants to define a 'shared solution' that is sustainable from a 'built heritage preservation' perspective and has the capacity to meet local community needs.
The overall results from all four focus groups, identifies 'A3' as the optimal representative historical building alternative to be reused for newer functions in Auckland because it is in an excellent functional condition and offers excellent opportunities for the introduction of spatial and structural transformations; it is located in a site that has excellent proximity to transport facilities that would provide easy access for vehicular and pedestrian movement; it

189
Application of a performance-based framework to prioritise underutilised historical buildings for adaptive reuse in Auckland, New Zealand
has significant components or arrangements that can support functional alterations for future reuse; it has been designed in a way that can maximise natural lighting and indoor air quality without significant mechanical involvement; (vi) displays higher prospects for undergoing innovative construction finishes that would be consistent with current technological trends; and it has an orientation that can be maximised to provide excellent opportunities for solar passive gains. Accordingly, A1 and A4 would promote built heritage preservation the most in Auckland because of their intrinsic heritage links that exhibit positive public image over their lifecycle, to maintain a sense of place, their significant heritage fabric that can be preserved to promote the historical and cultural development of Auckland, their aesthetic features that would sustain the visual heritage appeal of the surrounding streetscape, and their original, inherent fabric that would sustain the architectural history and narration of Auckland's existence. Although A2 was the least preferred representative historical building alternative by all four focus groups, its previous use as a public toilet which has now been closed for public use since 2004, and replaced by modern toilets provided by Novaloo in the NW corner of the Sandringham reserve, may have contributed to its least preference by the workshop participants. However, A2 makes an interesting case for the preservation of other heritage public toilets in Auckland.
The performance-based MCDA methodology through the integration of collaborative rationality (Aigwi, Phipps, et al., 2020), allowed the inclusion of diverse stakeholders' opinions in the decision-making process, hence, ensuring consistency and transparency in the process. Also, the local community involvement in the decision-making process presented strong background support for the successful validation of the framework in Auckland, due to the high level of familiarity of the participants with the representative historical building alternatives. The synergy between the local community and other experts in the focus group workshop ensures a greater level of acceptance of the results, which was reached through consensus, hence, facilitates strategic choices better.
The findings from this study which have been validated through a sensitivity analysis, are consistent in defining an optimal historical building alternative for adaptive reuse in Auckland while balancing the diverse interest of all stakeholders involved. This study has interesting implications for policy regulators. The performance-based MCDA methodology has exciting implications for local councils, heritage agencies, architects, urban planners, policymakers, building owners and developers as a guide to advance their understanding of (i) the intangible values of optimal historical buildings perceived by the community as worthy of protection; and (ii) the targeted needs of a community for the new function of an optimal alternative from a group of representative historical building alternatives. Also, the framework would serve as a valuable tool for the planning and designing of general strategies focused on renegotiating and enhancing the enormous benefits of reusing underutilised historical buildings to serve newer functions, towards promoting sustainable urban regeneration in Auckland. The new challenge for local authorities in New Zealand should be to regenerate underutilised historical buildings with heritage significance through the involvement of diverse stakeholders and the local community. This challenge would foster the creation of new models for governance that would assure the built heritage preservation, economic sustainability, socio- cultural development, building usability, and regulatory aspects of underutilised historical buildings in New Zealand, as in the cases of Auckland and Whanganui.
Acknowledgements The authors wish to thank the Auckland City Council for their support with providing the workshop venue. Also, all participants of the Auckland focus group workshop are highly appreciated.
References Aigwi, I. E., Egbelakin, T., & Ingham, J. (2018). Efficacy of adaptive reuse for the redevelopment of underutilised historical buildings:
Towards the regeneration of New Zealand’s provincial town centres. International journal of building pathology and adaptation, 36(4), 385-407.
Aigwi, I. E., Egbelakin, T., Ingham, J., Phipps, R., Rotimi, J., & Filippova, O. (2019). A performance-based framework to prioritise underutilised historical buildings for adaptive reuse interventions in New Zealand. Sustainable Cities and Society, 48, 101547. doi:https://doi.org/10.1016/j.scs.2019.101547

190
Itohan Esther Aigwi, James Rotimi, Reza Jafarzadeh, Tanya Sorrell, Amarachukwu Nnadozie Nwadike, An Le and Ravindu Kahandawa
Aigwi, I. E., Filippova, O., Ingham, J., & Phipps, R. (2020). Unintended consequences of the earthquake-prone building legislation: An evaluation of two city centre regeneration strategies in New Zealand's provincial areas. International Journal of Disaster Risk Reduction, 49, 101644. doi:10.1016/j.ijdrr.2020.101644
Aigwi, I. E., Ingham, J., Phipps, R., & Filippova, O. (2020). Identifying parameters for a performance-based framework: Towards prioritising underutilised historical buildings for adaptive reuse in New Zealand. Cities, 102, 102756. doi:10.1016/j.cities.2020.102756
Aigwi, I. E., Phipps, R., Ingham, J., & Filippova, O. (2019). Urban transformation trajectories of New Zealand’s earliest cities undergoing decline: Identifying links to the newly enforced Building (Earthquake-Prone Buildings) Amendment Act 2016. Paper presented at the 43RD AUBEA Conference, 6 – 8 November 2019, Noosa QLD, Australia. pp 591-611. https://www.researchgate.net/publication/339138793_Urban_transformation_trajectories_of_New_Zealand's_earliest_cities _undergoing_decline_Identifying_links_to_the_newly_enforced_Building_Earthquake- Prone_Buildings_Amendment_Act_2016.
Aigwi, I. E., Phipps, R., Ingham, J., & Filippova, O. (2020). Characterisation of Adaptive Reuse Stakeholders and the Effectiveness of Collaborative Rationality Towards Building Resilient Urban Areas. Systemic Practice and Action Research, 33(3), 1-11. doi:https://doi.org/10.1007/s11213-020-09521-0
Beauregard, R. A. (2013). Voices of decline: The postwar fate of US cities: Routledge. Belton, V., & Stewart, T. (2010). Problem structuring and multiple criteria decision analysis. In Trends in multiple criteria decision
analysis (pp. 209-239): Springer. Bhatnagar, B., & Williams, A. C. (1992). Participatory development and the World Bank: Potential directions for change. In World
Bank discussion papers: World Bank Group. Building Act. (2004). Building Act. Retrieved from http://www.legislation.govt.nz/act/public/2004/0072/141.0/DLM306036.html Caterino, N., Iervolino, I., Manfredi, G., & Cosenza, E. (2008). Multi-criteria decision making for seismic retrofitting of RC
structures. Journal of Earthquake Engineering, 12(4), 555-583. Goodwin, C., Tonks, G., & Ingham, J. (2009). Identifying heritage value in URM buildings. SESOC Journal, 22(2), 16-28. Heritage New Zealand. (2019). The List. Retrieved from http://www.heritage.org.nz/the-list HNZPT. (2014). Heritage New Zealand Pouhere Taonga Act. Public Act No 26. Ministry of Culture and Heritage Retrieved from
http://www.legislation.govt.nz/act/public/2014/0026/26.0/DLM4005414.html ICOMOS. (2010). The New Zealand Charter for the Conservation of Places of Cultural Heritage Value. Auckland: ICOMOS New
Zealand. International Institute for Sustainable Development. (2014). Earth Negotiations Bulletin on United Nations Conference on
Sustainable Development, Rio+20. Retrieved from https://enb.iisd.org/enb/vol12/ Krueger, R. A., & Casey, M. A. (2014). Focus groups: A practical guide for applied research (5th ed.). New Delhi: Sage. Larsen, H. G., & Hansen, A. L. (2008). Gentrification—gentle or traumatic? Urban renewal policies and socioeconomic
transformations in Copenhagen. Urban Studies, 45(12), 2429-2448. MBIE. (2016). Building (Earthquake-prone Buildings) Amendment Act. Wellington: Ministry of Business Innovation & Employment
Retrieved from http://www.legislation.govt.nz/act/public/2016/0022/22.0/DLM5616102.html Roberts, P., Sykes, H., & Granger, R. (2016). Urban regeneration. London: Sage. Rohe, W. M. (2009). From local to global: One hundred years of neighborhood planning. Journal of the American Planning
Association, 75(2), 209-230. Triantaphyllou, E. (2013). Multi-criteria decision making methods. In Multi-criteria decision making methods: A comparative study
(pp. 5-21): Springer. Winston, W. L., & Goldberg, J. B. (2004). Operations research: applications and algorithms (Vol. 3): Thomson/Brooks/Cole
Belmont^ eCalif Calif. Wright, G., & Goodwin, P. (2009). Decision analysis for management judgment: John Wiley and sons. Yakubu, I. E., Egbelakin, T., Dizhur, D., Ingham, J., Sungho Park, K., & Phipps, R. (2017). Why are older inner-city buildings vacant?
Implications for town centre regeneration. Journal of Urban Regeneration & Renewal, 11(1), 44-59. Zheng, H. W., Shen, G. Q., & Wang, H. (2014). A review of recent studies on sustainable urban renewal. Habitat International, 41,
272-279.

191
The 54th International Conference of the Architectural Science Association (ANZAScA) 2020
AR enabled informative design to plan site layouts
Abhishek Raj Singh1 and Venkata Santosh Kumar Delhi2 1, 2 Indian Institute of Technology Bombay, Mumbai, India
{arsingh1, venkatad2}@iitb.ac.in
Abstract: The site layout plan is an informative design document used to represent space. It often lacks in delivering the embedded information. This drawback is attributed to the 2D representation of the 3D site objects and surroundings. A little transformation has happened in the construction industry form representing the site space on 2D drawings to 3D digital models utilizing building information modelling (BIM). The adoption of BIM has revolutionized certain phases of construction projects but has affected the planning in a minimalistic way. This study proposes a method of informative design to improve the process of layout planning. To achieve this goal, an approach is developed utilizing BIM and a gaming engine to integrate the missing information from 2D drawings to 3D digital models. The developed approach demonstrates an augmented reality (AR) integrated framework, intended to aid construction planners involved in the task of layout planning to plan with informative annotations. These annotations are primarily targeted to depict values of modelled cost objectives. The utilization of informative design enabled with AR, resulted out to be promising in terms of evidence-based decision making and effortless design communication. Future work includes refining and verifying application on real-life projects.
Keywords: Augmented Reality, Layout planning, Design communication, Building Information Modelling
Introduction Architects are the one responsible for producing design documents for a construction project. These documents are expected to aid in accomplishing certain tasks in subsequent phases of the project. Often to generate efficient design, the engineers and other project stakeholders get involved in the development of design (Mäki, 2015). The design process is benefited by the involvement of stakeholders from other disciplines, and the vice-versa has also affected the planning positively. Still, construction sites face the problem of low productivity due to inefficient planning (Jha, 2013). The designing task involves the architects conceptualizing and transforming concepts into a design document. This is among the primary tasks to be accomplished in the design phase of the project. These design documents not only help in construction but also aid the project stakeholders to plan for the project. The initial planning for a construction project involves site layout planning among the preliminary tasks to be accomplished (Johansen and Wilson, 2006). Although, the two-dimensional (2D) plans generated to aid the layout planning process are intended to ease out the decision-making task concerning the positioning of temporary facilities (TFs) on a construction site. Unfortunately, the layouts generated utilizing these 2D representations are often found sub-optimal. Thus congestion, safety issues and
Imaginable Futures: Design Thinking, and the Scientific Method. 54th International Conference of the Architectural Science Association 2020, Ali Ghaffarianhoseini, et al (eds), pp. 191–200. © 2020 and published by the Architectural Science Association (ANZAScA).

192
Abhishek Raj Singh and Venkata Santosh Kumar Delhi
accidents are evident on construction sites; and finally, it results in productivity loss, cost and time overrun. The prime design documents employed for the purpose of SLP are 2D drawings. These are traditional design documents employed to communicate the idea of space utilization in the task of SLP. The task of SLP involves multiple stakeholders’ participation and the understanding of ideas embedded in the design documents are regularly left for the cognitive mental ability of the users (Waly and Thabet, 2003). The involvement of multiple stakeholders sometimes makes the information extraction and dissemination hard to accomplish utilizing 2D drawings. Some technological advancements in the construction industry have helped to overcome the limitations of the 2D drawings. Building Information Modelling (BIM), a successor to computer-aided drawings and three-dimensional (3D) models has proved its applicability in planning space for construction sites (Shou et al., 2015). This study presents an effort to make SLP an informative decision-making task. In an attempt to do so, a case study based research is presented that demonstrates an opportunity for the architects to aid the stakeholders involved in the task of SLP. The study demonstrates a framework to integrate data-driven results of optimization utilizing the inputs from the 3D design with augmented reality (AR). Consequently, the modelled objective being optimized and integrated with AR is expected to aid the stakeholders involved in the task of SLP in making informed decisions.
Design for SLP Construction drawings have been a media to communicate ideas on construction projects for decades. These 2D representations are also referred as computer-aided-design (CAD) drawings (Pierce Meyer, 2016). Utilization of these design documents is popular among the planners to plan layouts for construction projects. This form of media helps to carry information along onto the project site and aids in discussion to plan the positioning of TFs. This handiness comes with a limitation of cross-referring 2D drawings to interpret the embedded information in the drawings. Utilizing the advancements in technology, the stitching of 2D drawings to form 3D models provides orthogonal perspective. Such projections enable project stakeholders to understand the design idea in a better manner. The availability of 3D model eliminates the requirement of tailoring different design views that are frequently not available in a single document. Even though the impact of SLP is well recognized in construction management research, there exists no standard method to execute SLP (Sadeghpour, Moselhi and Alkass, 2004) and the layout planners still rely on their experience of the past to plan layouts for a current construction project (Johansen and Wilson, 2006) using these 2D drawings for the purpose. In the absence of any standard procedure to follow and multiple stakeholders with a varying individual interest and technical understanding makes the task cumbersome. The project managers and planners employ hand gestures and cut-outs to make the perspective clearer to the stakeholders involved in SLP (Winch et al., 2003). The increasing complexity of projects and the involvement of stakeholders with limited understanding of 2D drawings demands the use of 3D prototypes and digital models. Utilization of 3D representation partially bridges the gap of perspective exchange for the task of spatial planning, as the information pertaining to make decisions still exist in paper-based documents. Although the 3D models benefited the construction industry in certain aspects of visualization but still to make decisions, the planners have to rely on other paper based specifications and data. BIM bridges this limitation of 3D models and miniature prototypes by embedding the necessary required information along with the 3D model of the construction project. This enables the project planners to extract the required information from a single source to make decisions. Provided the implementation of BIM has resolved certain barriers like clash resolution in the planning phase of the project due to better visualization (Bryde, Broquetas and Volm, 2013), the task of planning layouts with conflicts in objectives

193
AR enabled informative design to plan site layouts
is under research to receive benefits from BIM. The BIM models are developed on a computer system and are visualized using 2D screens. In spite of representing the 3D object, the 2D screen limits the viewing of the full 3D component and with multiple stakeholders involved in the task; the exchange of perspective comes out as a challenge. The existing research highlight the adaptability of holographic techniques and AR based solutions to visualize 3D view over 2D drawings. Such technological implementations are still at an infancy stage in the construction industry. The adoption of AR to plan layouts using 2D drawings has been explored in a few existing studies and how it enabled 3D digital prototyping for better collaboration and coordination among the stakeholders involved in the SLP task is discussed in the following section.
AR for SLP The augmented reality, as the name suggests, is the superimposition of information onto the real world. Figure 1 explains the mixed reality continuum for better understanding (Meža, Turk and Dolenc, 2014). The AR differs significantly from the others situated on the left, considering the user’s awareness of the actual world around them. The augmented reality helps the user to access the information in the real world while maintaining consciousness about the real surroundings. Whereas the virtual reality (VR) obstructs the real world view with virtual information and does not facilitate simultaneous real environment visualization and interaction during a VR session.
Virtual World
Virtual Reality User is subjected to
an immersive experience to a total
virtual world
Augmented Virtuality
User experiences the real world
instances virtually
Augmented Reality User remains aware of the real world, while the virtual information is overlaid onto
real surroundings
Real World
Figure 1: Mixed Reality Continuum Explained The functionality of visualizing information in the AR environment was developed at a Boeing facility
to assist the workers to efficiently perform the information dependent tasks (Nee et al., 2012). Similarly, the SLP task requires access to information and visual aid to better understand the construction site and make decisions on the TF layout in an optimum manner. Considering the complexity involved in the process of SLP and traditional drawings limiting the essential perspective exchange between the project stakeholders, the existing studies have demonstrated some frameworks to transform 2D drawings to 3D digital augmented models (Wang, 2007). This augmentation of traditional drawings with 3D models enabled better collaboration and coordination among the project teams involved in SLP. A few researchers proposed planning of layouts while being on actual project site and formulated a possible way to carry the required information to plan layouts on a project site (Meža, Turk and Dolenc, 2014). This feature of AR enabled planning for SLP with all required information available along with the 3D digital objects to plan with on the actual project site. Nevertheless, another problem that persists in SLP is to satisfy certain objectives that could be sometimes conflicting or congruent. In an effort to tackle this, the construction management research presents numerous algorithms to plan SLP, but a few construction projects employ such practices, and the construction practitioners still rely on their experience.

194
Abhishek Raj Singh and Venkata Santosh Kumar Delhi
SLP: A decision-making problem The task of planning a site layout involves a multiple intertwined tasks to be accomplished. Among these tasks, the macro planning of site layout concentrates upon identifying locations to accommodate the required TFs, sizing of the TFs and finally positioning them on the construction site. This is done seeking an optimal solution while satisfying some specific objectives. With an intention to achieve a better layout plan among several other possibilities, the researches have proposed a couple of optimization algorithms; primarily can be classified into three categories as heuristics, exact and hybrid. The existing studies conceptualized the SLP problem as an optimization problem sought to find optimal solutions using the above-mentioned algorithms to solve for the formulated objective function(s) while considering no violations of the constrains should occur. The optimization module helps in formulating the subjective task of SLP in an objective way while leaving the other major problem of decision making unaddressed. Any decision support system (DSS) comprises a basic three-component structure of the model, data and user interface (UI). The literature review highlights the focus of researchers been limited to the data and the model component of the DSS, whereas a little is studied on the UI component essential to plan SLP. In the absence of UI, the problem of SLP does not get enough support from the optimization module. The results from the optimization remain numerically encrypted in the absence of UI for the planners involved in the SLP task (Rwamamara, Olofsson and Lagerqvist, 2010). This study presents a framework to visualize the results generated from the optimization module for an SLP problem. Supplementing UI component to plan site layouts is envisaged to help the stakeholders in attaining optimality and make informed decisions. Thus, to explain the developed framework of DSS for SLP, the following sections contribute to the work.
Framework development This study is part of an ongoing project taken up by the authors to make the task of SLP efficient by bridging the gaps of the existing literature. The unavailability of data is among major challenges in the construction industry. The researchers identified BIM implementation as a potential way out of this problem. However, a few studies have presented the development of a detailed model of the proposed construction as a barrier at the SLP stage. Alongside some studies highlighted, the BIM model developed to the level of detail (LOD) 300 satisfactory to get data required to plan site layouts (Kumar and Cheng, 2015). Even though the design for a large project to be completed to a level of LOD 300 to plan layout at an early stage of the project is unrealistic. The abstract data from similar previous projects can suffice the need. Referring to the existing construction project of a similar nature is a common practice in the construction industry. Once the data is available, the decisions are to be made in the SLP while satisfying the objectives like minimum time for travel, reduction in multiple handling of material, maximization of safety on site and many more. In the existing literature, the objectives that site planners deal utilizing their experience and rules of thumb are modelled as an optimization model and are solved utilizing certain algorithms. This research also attempts to do the same but with prime focus to make the stakeholders of SLP understand the results from the optimization model. Therefore, a systematic understanding from the literature is gathered, and the following framework is proposed to make SLP efficient. Figure 2 is an integrated representation of the developed framework to form an efficient and functional DSS and the workflow of this study along with the output in the Venn diagram.

195
AR enabled informative design to plan site layouts
Figure 2: Framework and Systematic Workflow of the Research The above Figure 2 is to be understood in layers. The outermost layer is the framework where the
inputs to each element come from BIM modelling software, computer-programming language and a game engine. Further details are provided in the following sections. All three components are equally required to produce beneficial results and must interact back and forth. The bidirectional arrows represent the interaction among these components. Another layer with pictorial representation in the form of directional arrows depicts the workflow of this research. The green arrow represents the accomplished work by the researchers and is summarised in this study. Another arrow in amber indicates the work for the future. The innermost layer presents the Venn diagram to elaborate on the components of any DSS. An approach is established and is demonstrated in the following section of this study.
Case study The work presented in this study targets efficient dissemination of information among the stakeholders involved in the SLP task. A case study is proposed to demonstrate the applicability of the developed framework, and the benefits of utilizing it for layout planning are reported.
BIM model
As discussed above the requirement of data to plan layouts for a construction project is a prime need and to fulfil this requirement, a BIM model for a hypothetical site is prepared. The BIM model is prepared, confirming the LOD 300 specifications. Once the model was complete, the data required to plan layouts is extracted and stored in a specific format to be utilized in other components of the framework presented in Figure 2. This research being part of ongoing research the BIM model and the procedural steps to extract the parameters required in other modules is explained in other studies by the authors (Singh, Patil and Delhi, 2019). Thus, this section limits to explain the hypothetical case scenario in brief. An industrial building is undertaken as a case study in which the structural frame for the building is supposed to be constructed. The building is divided into four quadrants, and the locations to position TFs are identified. Figure 3 describes the test case considered a discrete site layout problem in this study.

196
Abhishek Raj Singh and Venkata Santosh Kumar Delhi
Figure 3: Test Case Description On the development of the LOD 300 model for the test case, the required data is acquired for the
mathematical model representing the site. Following this, the site layout problem is modelled as an optimization problem and is explained in the succeeding section. The required data as input to the optimization model is presented in Table 1 and Table 2. The Table 1 depicts the value of the trips required to transport the required material and the Table 2 stores data related to distance between the locations for TFs and the quadrants.
Table 1: Quantity of Material Transformed to Required Number of Trips
Material Q1
Trips
Q2
Trips
Q3
Trips
Q4
Trips M1 - Reinforcement Steel 4 4 4 4
M2 - Quantity of Prefab Steel 0 88 0 0 M3 - Quantity of Concrete 164 164 164 164
M4 - Quantity of Excavated Soil 30 30 30 30 M5 - Formwork Material 4 4 4 4
Table 2: Location to Quadrant Distance Extracted from BIM Model
Q1 Q2 Q3 Q4 L1 88 108 110 88 L2 93 114 113 83 L3 102 82 82 103 L4 122 100 98 120 L5 121 101 77 105
Mathematical representation of the site
The efforts to capture construction site instances closer to the reality are evident in the construction management research. This study presents optimization of an objective of major concern to the layout planners i.e. minimization of transportation cost of the materials. The assumptions and a detailed
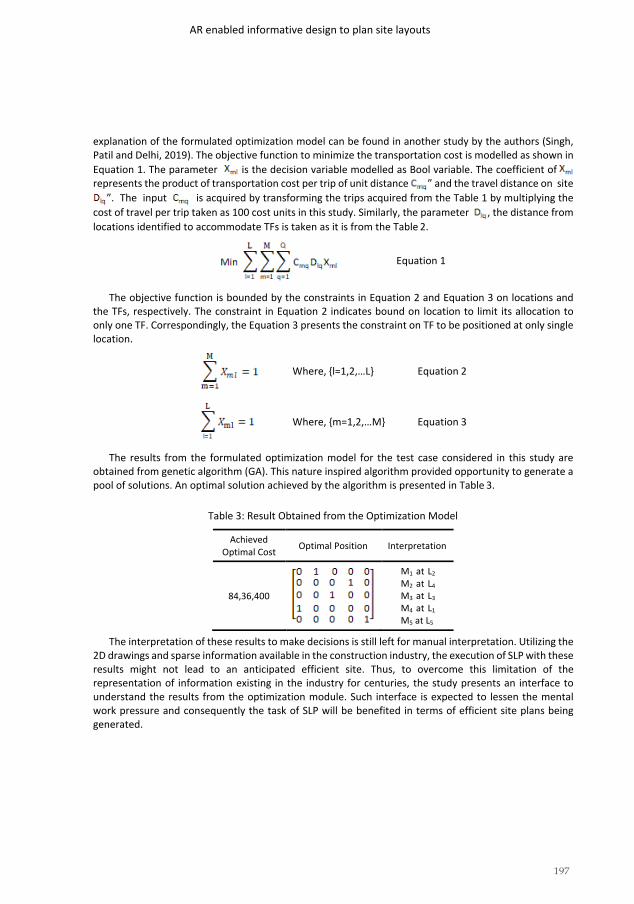
197
AR enabled informative design to plan site layouts
explanation of the formulated optimization model can be found in another study by the authors (Singh, Patil and Delhi, 2019). The objective function to minimize the transportation cost is modelled as shown in Equation 1. The parameter is the decision variable modelled as Bool variable. The coefficient of represents the product of transportation cost per trip of unit distance ” and the travel distance on site
”. The input is acquired by transforming the trips acquired from the Table 1 by multiplying the cost of travel per trip taken as 100 cost units in this study. Similarly, the parameter , the distance from locations identified to accommodate TFs is taken as it is from the Table 2.
Equation 1
The objective function is bounded by the constraints in Equation 2 and Equation 3 on locations and the TFs, respectively. The constraint in Equation 2 indicates bound on location to limit its allocation to only one TF. Correspondingly, the Equation 3 presents the constraint on TF to be positioned at only single location.
Where, {l=1,2,…L} Equation 2
Where, {m=1,2,…M} Equation 3
The results from the formulated optimization model for the test case considered in this study are obtained from genetic algorithm (GA). This nature inspired algorithm provided opportunity to generate a pool of solutions. An optimal solution achieved by the algorithm is presented in Table 3.
Table 3: Result Obtained from the Optimization Model
Achieved Optimal Cost Optimal Position Interpretation
84,36,400
M1 at L2 M2 at L4 M3 at L3 M4 at L1 M5 at L5
The interpretation of these results to make decisions is still left for manual interpretation. Utilizing the 2D drawings and sparse information available in the construction industry, the execution of SLP with these results might not lead to an anticipated efficient site. Thus, to overcome this limitation of the representation of information existing in the industry for centuries, the study presents an interface to understand the results from the optimization module. Such interface is expected to lessen the mental work pressure and consequently the task of SLP will be benefited in terms of efficient site plans being generated.

198
Abhishek Raj Singh and Venkata Santosh Kumar Delhi
UI component
The advantage of 3D representation over 2D has been acknowledged as advantageous in recent studies (Victoria Zhao, Lopez and Tucker, 2019). It is noteworthy that sometimes the 3D model also lacks in delivering the idea when the counterpart in the SLP task do not possess prior knowledge of SLP. In such scenarios, the additional information is made available either verbally or in paper-based format. This indeed adds up to the missing functionality of the 3D models. The researchers proposed a BIM based framework to have data integrated 3D models to plan SLP. This research also highlights the possible advantages of AR over 3D model. Thus, to accomplish the target of having a DSS for SLP is fulfilled in this study. Since the optimized results obtained from the mathematical model of the site remains numerically encrypted. This task of understanding the numerical output from the optimization module requires the stakeholders to know about optimization alongside the civil engineering learnings. Even the availability of 3D models sometimes lacks to aid the exchange of perspective due to visualization restricted to 2D view on the screen. This study adopts AR to mitigate the limitations of traditional 2D and 3D representations used for SLP. This research utilizes AR to generate information embedded digital prototype to plan layouts for the construction site. In addition, to provide 3D visualization of site conditions, the information tags are also added to the AR scene. These information tags indicate the position of the TF located by the backend GA. Consequently, minimizing the efforts of stakeholders to interpret the results of the optimization. The flow of activities in the system architecture of the developed approach in this research is demonstrated in Figure 4. The system architecture of the developed AR application consists of BIM model to furnish the need of data for optimization and 3D model for visualization, GA code to optimize the layout planning objectives, a gaming engine to combine all the three major components of the DSS and provide a UI. Thus, explained the simple system architecture; the operations in the developed application also remains easy considering the user friendliness. The solid blue colour directional arrow indicates the procedural steps required to render the 3D site scenario on to the real world to understand the project site better for efficient SLP. Figure 4 presents a single run to demonstrate the working of the developed application. The initial screen Figure 4(a) make the users familiarize with the project along with the required TFs. If initialized the option to continue becomes active as confirmation of successful completion of the instruction to initialize. Another change that user can observe after initializing the scene is the position transform of the TFs to the origin of the project. Along with this, the locations to accommodate TFs shows the selection in green indicating its availability to accommodate TF. Once initialized, the backend algorithm is signalized to be ready for calculation. On continuation, another scene Figure 4(b) is rendered in AR mode with three UI elements. These UI elements are intractable, but a specific sequence is necessary to follow to activate some options. The run button on the interface allows the user to execute the optimization algorithm. Following which the generated optimum result is rendered in the field of view (FoV), as shown in Figure 4(c). A single run of GA adopted for optimization in this study generates a pool of solution, but for the purpose of demonstration in this study, a single optimum result is used. The application provides the option of finding the cost of the solution rendered in the AR scene. This option is activated only after the run of the optimization algorithm is complete. The interface presents the optimum value of the modelled objective function for a single layout rendered in the FoV, as presented in Figure 4(d).

199
AR enabled informative design to plan site layouts
Figure 4: One Iteration of the Developed Application The research presented in this study incorporates the major elements of a research cycle, starting from
identifying gaps to providing a method to bridge these gaps. Although this is not the only way to accomplish an efficient SLP but can be a stepping-stone for the researchers targeting DSS for the task of SLP.
Discussion The deficient productivity of a construction project can be attributed to several activities apart from
SLP but mismanagement of site space leading to congestion, safety issues, and wastages in terms of time and money do exist on construction sites. The impact of preconstruction activities like planning of layouts has significant potential to impact productivity, and the evidence supporting the argument exists in the literature (Johansen and Wilson, 2006). This study proposes an AR based layout site planning DSS. Although the team of researchers involved in this study is small, and thus the developed DSS incorporates a limited functionality, it is proposed that the project teams utilizing the architects can have a robust DSS. The DSS presented in this study presents the numerical results of optimization rendered in an AR environment making the information available to all the stakeholders and thus making the process of idea dissemination efficient during SLP. This research utilizes the functionality of AR to render information, as shown in Figure 5. The functionality of the developed framework demonstrated in this study presents a case of decision making for site layouts in an office environment, where stakeholders now can exchange perspective using the AR enabled DSS setup. The design of a construction project being a task for architects; it is suggested that involving architects in the process of developing DSS will fulfil the requirement of informative design. The process depicted in this study highlights the transformation of a simple design process to an informed design framework. The AR environment rendering the optimal solution is a result of the informed design prepared for the SLP problem.
Figure 5: Numerical Result Transformed to Corresponding AR Rendering

200
Abhishek Raj Singh and Venkata Santosh Kumar Delhi
Conclusion The current practice of site layout planning lags in providing efficient solutions continuing to adversely impact site productivity. By identifying the limitations in the existing researches, this study presents an approach to benefit the SLP process by proposing a framework for SLP-DSS. The components of SLP-DSS are discussed utilizing a hypothetical case of construction for an industrial setup. The UI component of the developed DSS is the major contribution of this research where the role of architects is expected to be enlarged from just designing for construction to design for planning. Thus, resulting in an informed design following which the process of SLP is expected to be benefitted and consequently improving the productivity of the project. The limitation of this study is that the objective considered being just one and the discrete site space misses out the actual dynamics of construction. The implementation of the proposed framework on an actual construction project is in scope for the future.
References Bryde, D., Broquetas, M. and Volm, J. M. (2013) ‘The Project Benefits of Building Information Modelling (BIM)’,
International Journal of Project Management, 31, pp. 971–980. Jha, K. N. (2013) Determinants of Construction Project Success in India. Springer. Johansen, E. and Wilson, B. (2006) ‘Investigating First Planning in Construction’, Construction Management and
Economics, 24, pp. 1305–1314. Kumar, S. S. and Cheng, J. C. P. (2015) ‘A BIM-Based Automated Site Layout Planning Framework for Congested
Construction Sites’, Automation in Construction, 59, pp. 24–37. Mäki, T. (2015) ‘Multi-disciplinary Discourse on Design-related Issues in Construction Site Meetings’, Procedia
Economics and Finance, 21, pp. 231–238. Meža, S., Turk, Ž. and Dolenc, M. (2014) ‘Component based Engineering of a Mobile BIM-based Augmented Reality
System’, Automation in Construction, 42, pp. 1–12. Nee, A. Y. C. et al. (2012) ‘Augmented Reality Applications in Design and Manufacturing’, CIRP Annals -
Manufacturing Technology, 61, pp. 657–679. Pierce Meyer, K. (2016) ‘Technology in Architectural Practice: Transforming Work with Information, 1960s–1990s’,
Information & Culture, 51, pp. 249–266. Rwamamara, R., Olofsson, T. and Lagerqvist, O. (2010) ‘Using Visualization Technologies for Design and Planning of
A Healthy Construction Workplace’, Construction Innovation, 10, pp. 248–266. Sadeghpour, F., Moselhi, O. and Alkass, S. (2004) ‘A CAD-Based Model for Site Planning’, Automation in
Construction, 13, pp. 701–715. Shou, W. et al. (2015) ‘A Comparative Review of Building Information Modelling Implementation in Building and
Infrastructure Industries’, Archives of Computational Methods in Engineering, 22, pp. 291–308. Singh, A. R., Patil, Y. and Delhi, V. S. K. (2019) ‘Optimizing Site Layout Planning utilizing Building Information
Modelling’, in 36th International Symposium on Automation and Robotics in Construction, pp. 376–383. Victoria Zhao, Z., Lopez, C. E. and Tucker, C. S. (2019) ‘Evaluating the Impact of Idea Dissemination Methods on
Information Loss’, Journal of Computing and Information Science in Engineering, 19, pp. 031006(1–12). Waly, A. F. and Thabet, W. Y. (2003) ‘A Virtual Construction Environment for Preconstruction Planning’, Automation
in Construction, 12, pp. 139–154. Wang, X. (2007) ‘Using Augmented Reality to Plan Virtual Construction Worksite’, International Journal of Advanced
Robotic Systems, 4, pp. 1729–8806. Winch, G. M. et al. (2003) Construction Communication. Blackwell Publishing Ltd.

201
The 54th International Conference of the Architectural Science Association (ANZAScA) 2020
A study of the implementation of BIM in the AEC industry in New Zealand
Thi Nhat Thanh Pham1, Lorraine Skelton2 and Don Amila Sajeevan Samarasinghe3
1, 2,3 Otago Polytechnic Auckland International Campus, Auckland, New Zealand [email protected],
{lorraine.skelton2, don.samarasinghe3}@op.ac.nz
Abstract: In the most recent two decades, Building Information Modelling (BIM) has been considered one of the most significant global technological innovations in the context of the Architecture, Engineering & Construction (AEC) industry. Notably, several developed countries such as Finland, Singapore, Denmark, and Norway have successfully implemented BIM in both the government and private sectors. Modern research shows wider use and acceptance of BIM would benefit the AEC industry in New Zealand, with gains such as more effective processes, better cost-control and significant quality improvement of buildings and infrastructure. Even though there is a support mechanism to advocate the employment of BIM into the AEC industry in New Zealand, there are numerous barriers for its successful implementation. Past literature shows that only a few studies have analysed the reasons for lack of BIM use in New Zealand despite its well-recognised benefits and the available support mechanism. Therefore, this study aims to explore the barriers of BIM implementation in New Zealand. The study employed a qualitative approach. Selected subject matter experts from academia and the AEC industry in New Zealand were interviewed. The study found that the BIM adoption support mechanism in New Zealand is inefficient due to a lack of government leadership for supporting Small and Medium Enterprises (SMEs) in the construction industry. An inconsistency of standards and classifications has also resulted in loose collaboration and a lack of coordination between members in the AEC industry. It is expected that the research findings will contribute to a deeper understanding of the barriers for BIM application in New Zealand.
Keywords: BIM implementation; Architecture, Engineering & Construction (ACE), New Zealand.
1. Introduction BIM can be understood interchangeably by two terms: “Building Information Modelling” and “Building Information Model”. In fact, the two interpretations focus on one object which is both a process and a product respectively (Wong, Wong & Nadeem, 2009). BIM is generally a set of technologies and solutions that address and improve coordination and collaboration between stakeholders in the AEC industry (Wood & Samarasinghe, 2020). Initially, BIM was introduced as 3D modelling based on
Imaginable Futures: Design Thinking, and the Scientific Method. 54th International Conference of the Architectural Science Association 2020, Ali Ghaffarianhoseini, et al (eds), pp. 201–210. © 2020 and published by the Architectural Science Association (ANZAScA).

202
Thi Nhat Thanh Pham, Lorraine Skelton and Don Amila Sajeevan Samarasinghe
Computer Aided Design (CAD) technologies. As computerisation has thrived, BIM functionalities have grown to include designing, engineering, construction, and operating and managing the building, which is significantly more advanced than the original perceived uses (Ghaffarianhoseini, 2017).
Notably, BIM is popular within the AEC industry in many countries, such as the United States of America (USA), the United Kingdom (UK), Scandinavian nations (Finland, Norway, Denmark), Singapore, Hong Kong, Australia and New Zealand (Ghaffarianhoseini, 2017; McGraw Hill, 2014; NBS, 2014; NBS, 2020; Smith, 2014; Wong, Wong & Nadeem, 2009). There are number of researchers comparing BIM leaders regarding their adoption strategy. Gordon and Curtis (2018), Smith (2014) and Wong, Wong and Nadeem (2009) conducted a literature review into the implementation strategies of BIM-advanced countries and concluded key driver factors of success in BIM uptake. McGraw Hill (2014), NBS (2014) and NBS (2020) conducted a global survey of BIM clients, practitioners and professionals, which gave a holistic view of BIM application around the world and of efficient BIM adoption policies. The BIM Acceleration Committee (BAC) also executes an annual survey on BIM adoption in New Zealand, providing information on BIM implementation circumstances, benefits of BIM and barriers to BIM uptake.
Meanwhile, the growing interest in BIM around the world in both industrial and scholar segments, New Zealand’s BIM implementation is still modest, and the number of scholar articles is few. The searching keywords “BIM New Zealand” in Google scholar only shows 14 results. However, those articles also revealed crucial issues in BIM adopting in New Zealand. For instance, the study of Doan et al. (2020) identified benefits and challenges to BIM adoption amongst the countries and regions and concluded those factors also similar to New Zealand. Therefore, learning the success and failure lessons from other countries may contribute to New Zealand’s BIM implementation uptake. David (2017) recommended a lack of BIM status as a professional role in New Zealand prevented practitioners increase their interest, education and involvement in BIM using. Besides, there are several articles mentioned about the technical aspect of BIM applying, such as the study of Harrison and Thurnell (2015) examined the BIM implementation in quantity surveying practice, the study of GhaffarianHoseini et al. (2017) and Doan et al. (2019) proposed another BIM applying as a sustainable practice in AEC industry. In addition, there are quality reports of agencies collaborating between industry and government (BRANZ, BCITO, PGDITO & DBH) analyses the BIM implementing context, proceed, benefits and obstacles in New Zealand. Even though the key barriers in BIM uptake were revealed, there was not good reactions and progress. The authors noticed that the New Zealand support mechanism of BIM adoption had not been investigated in previous studies and reports. Despite its support agencies available in New Zealand, the BIM uptake is still slow. Hence a more in-depth analysis and comparison New Zealand’s support mechanism to other countries may uncover, confirm BIM uptake barriers, and issue valuable recommendations.
One of the key factors that drives BIM implementation in a country is the presence of a support mechanism. This can be understood as the decisions, programmes, committees, and funding made by a government to improve BIM adoption. This project aims to explore the efficiency of New Zealand’s support mechanism in increasing BIM adoption rates and consider what solutions New Zealand may learn from global BIM leaders. The ensuing research questions were proposed to accomplish the project’s purpose:
1. Compared with developed countries’ BIM adoption, how is New Zealand's support mechanism
working? 2. Based on the BIM maturity model, where is New Zealand's position?

203
A study of the implementation of BIM in the AEC industry in New Zealand
3. How could New Zealand improve its rates of BIM adoption?
2. Research methodologyThis study adopted a qualitative approach using mixed method semi-structured interviews and a literature review to collect data. Due to the nature of the research aim, the study needed to explore and describe the BIM uptake support mechanism in various countries, hence a qualitative method was determined as suitable for the study (Drew, Hardman & Hosp, 2007). Moreover, the research also aims to provide a holistic view of BIM implementation in New Zealand and the qualitative method is well suited to this context (Drew, Hardman & Hosp, 2007). Despite difficulty in data interpretation, the qualitative method is appropriate to management research (Gummesson, 2000). The study aims to analyse the management aspect of BIM adoption strategy, so while it could be time consuming to code and interpret data, the results would provide a holistic perspective (Drew, Hardman & Hosp, 2007; Gummesson, 2000).
In searching the subject “BIM adoption/implementation” + “BIM strategy” + “BIM New Zealand” on Google Scholar, a number of academic journals, books and reports were listed. These resources were filtered by following criteria: the abstract should focus on BIM adoption policy/strategy; and the mentioned countries are the US, the UK, Scandinavian countries, Australia, Singapore and New Zealand. Articles were skimmed and downloaded according to the filtered list, and the author then critically reviewed the downloaded articles. Following the researching criteria, twenty-one peer-reviewed articles were used for further examination. Finally, useful information was extracted, summarised and clustered in relevant summary and analysis matrices. Then, the coded data were evaluated, analysed and discussed. Additionally, a semi-structured interview was conducted to collect more necessary data. The selection of participants was based on purposive sampling. The qualified participants were project managers, project coordinators, contractors, and BIM researchers with at least three years of working experience. Ethics Approval was sought from the Otago Polytechnic Ethics Committee “to ensure that the privacy, safety, health, social sensitivities and welfare of human participants are adequately protected” before conducting the interviews.
3. Literature reviewUK: Since 1994, the UK construction industry recognised better collaboration between clients and contractors may improve the quality of building (Latham, 1994). A programme and supporting group was established to research this and execute strategic planning, however, progress was slow and insignificant (Gordon & Curtis, 2018). According Wolstenholme (2009), an inefficient strategic plan was the result for the following reasons: (1) The best implementation changes only occurred with large firms and clients in repeat product and services. Meanwhile, there was no improvement among SMEs which are dominant in the AEC industry, perhaps due to the lack of a single voice for the industry; (2) A lack of experienced workforces, maybe because of limited industry accreditation and career pathways preventing young workers from joining the industry.
In July 2011, the launch of a Government Construction Strategy (Cabinet Office, 2011) mandated the use of BIM in public sector construction projects from April 2016. Following this strategic decision, the Construction Industry Council (CIC) and industry formed BIM Task, standards and protocols for effective construction information management and integration: BS1192: 2007, PAS1192 series, CIC BIM Protocol, BIM Overlay to the RIBA Plan of Work, NBS BIM Toolkit, etc. The action plan was devised with

204
Thi Nhat Thanh Pham, Lorraine Skelton and Don Amila Sajeevan Samarasinghe
the involvement of private sector clients, trade bodies (especially SMEs), professionals and education institutions to ensure smooth integration. According NBS (2020), the development of BIM adoption in the UK from 2011 to the present proved the UK’s adoption strategy was heading in the right direction. It seems the government mandate of BIM implementation was the key driver to the success BIM uptake in the UK (Ghaffarianhoseini, 2017; McGraw Hill, 2014; Smith, 2014). In addition, private sector awareness of BIM benefits and an efficient working group issuing national standards and protocols contributed significantly.
Scandinavian countries: The Scandinavian countries are BIM leader countries (Smith, 2014). Their implementation strategy was initiated by the public sector (Jensen & Jóhannesson, 2013; NBS, 2014; Wong, Wong & Nadeem, 2009). According to BuildingSmart Australasia (2012), Finland’s BIM adoption development was initiated by Senate Properties, a large government firm in charge of managing the country’s property assets. Senate Properties played the role of BIM leader, requiring BIM and IFC compliance since 2007 (Smith, 2014). Similarly, the Danish and Norwegian governments strongly supported BIM adoption by mandating BIM use in public projects. Mandatory demands on BIM from the Danish state clients in 2007 moved the use of BIM to a higher level in Denmark (Wong, Wong & Nadeem, 2009). Moreover, Denmark is the leader in forming BIM classification standards which are being considered in the European Union (Smith, 2014).
Australia: The Australian government proposed number of actions in order to improve productivity and innovation in the AEC industry, however there was no mandatory requirement to use BIM (Puolitaival et al., 2016; Smith, 2014). Three main organisations are promoting BIM in the construction sector in Australia:
• Australasian Procurement and Construction Council Inc – APCC
• Australian Construction Industry Forum – ACIF
• Australasian BIM Advisory Board – ABAB The National Specification (NATSPEC) seems the most active workgroup in promoting BIM adoption.
The introduction of a national BIM guide, National Guidelines for Digital Modelling by the Corporate Research Centre for Construction Innovation (CRC-CI), the Australian and New Zealand Revit Standards (ANZRS) and the BIM-MEPAUS guidelines and models, demonstrate the high level of preparedness for BIM implementation. The private sector is leading BIM application in Australia. BuildingSmart is spearheading BIM uptake progress by founding the Open BIM Alliance of Australia, a collective of software suppliers to boost the concept of “Open BIM” (Smith, 2014). Despite significant initiatives to promote BIM uptake, the application of BIM in Australia is varied among the industry. The study of Hosseini et al. (2016) showed inconsistency in the BIM adoption rate of Australian SMEs reported in research. It cited the immaturity of BIM implementation within Australian SMEs – close to 5% of SMEs had used BIM to Level 3; 8% had utilised Level 2 BIM on their projects; while 42% had Level 1 uptake. Hence, integrated collaboration among these businesses might not occur due to the huge gap in BIM maturity levels.
To accelerate BIM adoption in New Zealand, New Zealand National Technical Standards Committee (NTSC) was established in 2012, and BAC and National BIM Education Working Group (NBEWG) in 2014 (Puolitaival et al, 2016). Members of NTSC and BAC are representatives of industry and government, while members of NBEWG are delegates of tertiary institutes. Each committee represents different stakeholders. NTSC is responsible for the industry standards and location data; hence, the government is the most crucial stakeholder. BAC targets BIM clients to promote the implementation of BIM through

205
A study of the implementation of BIM in the AEC industry in New Zealand
training and raising awareness of BIM’s benefits. NBEWG promotes the integration of BIM into all architectural, engineering and construction programmes in New Zealand by providing national curriculum guidelines. The three groups closely coordinate in their tasks, sharing information to smooth the implementation of New Zealand’s BIM strategy from government to industry to education. The website www.biminnz.co.nz, which is managed by BAC, provides a wide range of necessary information and reports the results of New Zealand’s supporting mechanism.
EBOSS is an online library of product catalogues from 211 of New Zealand's leading architectural product suppliers. EBOSS conducts an annual survey in New Zealand to examine the circumstances of BIM adoption and to record the feedback of internal stakeholders (architecture, engineers, contractors) in order to improve the situation. Notably, the survey has shown consistent demand for a stronger government leadership role in pushing BIM implementation (Eboss, 2018; Eboss, 2019).
4. FindingsAccording to NBS (2014), New Zealand is one of four countries of BIM leaders (along with the US, the UK and Canada). However, BIM adoption in New Zealand has not made significant progress, even though an annual BAC survey (2019) revealed a dramatic increase in project BIM implementation. It is necessary to collect, analyse and learn more from BIM practitioners and academic researchers to confirm these findings and identify more potential solutions for improving BIM adoption in New Zealand. There were six semi-structured interviews: three interviewees were BIM academic researchers and three were BIM practitioners. The findings are presented below.
4.1 BIM definition
Interviewees were asked to define BIM from their perspective. There were various BIM definitions put forward by each interviewee. On the one hand, BIM academic researchers defined BIM as a process and methodology to manage the whole lifecycle of a building: “BIM is, like, methodology, like, it's not a single software or a bunch of software” (#3) and, “BIM can be seen from different perspective as a database that collects information” (#1). On the other hand, BIM practitioners characterised BIM as a computer software involving a specific process of a construction project, such as “different computer software to make a 3D models of a building” (#4), “BIM is modelling for services (electricity, HVAC)” (#5) and, “use BIM to actually design a building and construct it” (#6). It seems researchers defined BIM as modelling, while practitioners described BIM as per its function related to their job.
4.2 Benefit and obstacles of BIM implementation
BIM practitioners were asked about BIM strategy adoption in their companies via a range of questions about implementation process, benefits and obstacles of the adoption process. All interviewees agreed that BIM implementation benefits the project in particular and the business in general. The benefits are improving coordination (#4, #5, #6), decreasing clashes and rework (#5, #6), and making the work easier to visualise (#4, #6). They highlighted a number of obstacles to adopting BIM in a project. A lack of leadership was the most chosen factor that might threaten implementation success (#4, #6, #2), and differences in software use among project stakeholders also had a negative impact on BIM application (#2, #4, #5, #6). Finally, a significant factor preventing the use of BIM was the initial investment on the software and the overall profitability of BIM application depending on the scale of a project (#2, #3, #4). These benefits and obstacles were also consistent with the benefits generating from literature review.

206
Thi Nhat Thanh Pham, Lorraine Skelton and Don Amila Sajeevan Samarasinghe
4.3 BIM knowledge and understanding
To identify the awareness of BIM in New Zealand, a range of questions was put to the interviewees, such as: how do you define BIM? What did you use BIM for? What are the benefits and obstacles of using BIM in a project? Is there anything you want to share about BIM? The answers were varied. Meanwhile, interviewee #4 considered BIM as a 3D software, and thought adding virtual reality (VR) might be a good development. Interviewee #5 believed BIM was a modelling service especially useful for the design and planning phases, hence that the process onsite would be beneficial and eliminate potential clashes. Interviewee #6, who is in charge of instructing other staff members to use BIM, did not have updated knowledge of BIM’s functions except those for which they had previous understanding: “I don't know much about the building's management using BIM because I work in a structural consulting company”. The design function was the most mentioned in using BIM. Interviewees #4, #5, #6 cited this function in their interviews more than three times. For instance, interviewee #4 noted it in three parts of their interview: (1) “BIM is the use of different computer software to make a 3D models of a building before it's beingviewed just to facilitate the process of designing it between different disciplines”; (2) “BIM is the use ofdifferent computer software to make a 3D models”; (3) a better implementation of BIM is “start to useVR”. In conclusion, the BIM knowledge of interviewees varied as per their perception of BIM capabilitiesand functions. Design function was the most cited task.
4.4 The efficiency of the New Zealand support mechanism
There are different ideas about the efficiency of the official support mechanism for the development of BIM adoption in New Zealand. Interviewee #1 believed the education system and independent institutions supporting BIM regulations played a significant role in enhancing BIM usage, however, not all of these documents have reached end users yet. Meanwhile, interviewee #3 supposed that support from authorities was not enough compared to other countries such as Singapore and the UK. The interviewees #6, #4, #5 did not mention any exterior support to enhance BIM adoption, but only clients’ requirements and company strategy, indicating they were not aware of the available support mechanism. The finding reveals the inefficiency of the support mechanism for communicating information in AEC academic and practitioner communities.
4.5 New Zealand’s government’s role in BIM’s adoption
All the interviewees agreed that government should take more action to improve the adoption of BIM in New Zealand. They believed tighter regulations on using BIM would result in a wider spread of BIM in the AEC industry. However, the type of management varied according to each interviewee’s point of view. Interviewees #2 and #6 suggested that the government needs support the BIM knowledge resources as opposed to providing financial support for BIM implementation. They thought each business should be in charge of profitability on each BIM project, rather than pushing this pressure on to the government’s budget. Meanwhile, interviewees #4 and #5 noted regulations on BIM use would encourage the relevant stakeholders to consistently use one platform, from input data to maintenance building. Finally, all the interviewees acknowledged the crucial role of government in BIM implementation in New Zealand and expected more efficient action and programmes to advance adoption progress.

207
A study of the implementation of BIM in the AEC industry in New Zealand
6. Discussion
6.1 New Zealand’s BIM support mechanism
The establishment of a supporting working group in New Zealand is similar to that of the UK and Scandinavian countries. One committee works with government to enhance BIM interoperability and open data standards, another includes both government and industry to increase and accelerate the use of BIM, and the other is made up of representatives from tertiary institutes, which have interest in integrating BIM as part of their AEC programme delivery. The study of Puolitaival et al. (2016) also confirmed New Zealand has an adequate support mechanism compared to other BIM advanced countries. Moreover, Doan et al. (2020) examined the BIM uptake barriers in New Zealand, finding these were similar to those in other countries – and the support mechanism was not on the list. Therefore, New Zealand’s support mechanism is going in the right direction as per the best practices of BIM leader countries.
The supporting group also completed its task by issuing BIM guidelines and standards. However, the survey of BIM implementation in New Zealand in 2019 revealed the most prevalent barrier to adopting BIM was a “lack of experience / knowledge on integrating spatial data within the asset / operations / facilities management” (BAC, 2019). This could be explained by an unawareness of BIM Knowledge resources, and it seems BAC should improve its efficiency in approaching BIM clients. Nonetheless, due to the complexity of the product and the dynamism of the market in New Zealand, the instruction documentation may be insufficient for implementation. Acknowledging the flaws of the BIM framework, the NBS team continues to research and update the instruction documents. The UK BIM Framework replaces the bim-level2.org website and consolidates the knowledge resources in one place. The ISO 19650 guidance aims to add insight, clarity and tips for practical implementation the 1192 series (NBS, 2020). Additionally, the adoption of Uniclass 2015 in Australia demonstrated the appropriate classification for Australia’s AEC industry, which is similar to New Zealand’s. Therefore, New Zealand may learn from these useful instructions from the UK along with successful application in Australia, and modify these to suit the New Zealand circumstance.
6.2 New Zealand is seeking BIM maturity
The BIM resources are modest with only two issued documents – International BIM Object Standard (Masterspec, 2016) and BIM Handbook third edition (BAC, 2019a) – which hardly reflects the country’s BIM maturity level. Moreover, results from the national BIM survey also revealed a gap between members in the industry. From an industry perspective, 59% of projects used BIM in 2019, however, only 31% used 3D control and planning (BAC, 2019a). From a contractor perspective, 43% of subcontractors’ projects used BIM, however, the adoption rate differed for different functions. Mechanical contractors reached 33%, while electrical contractors’ rates were only 11% and the rest were 64%. The varied and disjointed adoption rate among members in AEC industry and the minimal BIM guidelines demonstrate that New Zealand is still at a low level of BIM maturity, although there is insufficient data to identify the precise level. This result is parallel to study of Dat et al. (2020), which shows that, compared to the UK’s work, what has been done in New Zealand is still limited. As such, it is difficult to apply the UK’s BIM maturity model to New Zealand.

208
Thi Nhat Thanh Pham, Lorraine Skelton and Don Amila Sajeevan Samarasinghe
Figure 1: BIM development in UK and New Zealand (Dat et al., 2020)
The reason might be the fragmentation of the industry and a lack of government leadership in BIM uptake levels. In fact, a lack of government direction was revealed as one of the significant challenges for BIM adoption in New Zealand (EBOSS, 2018). Additionally, very few studies focusing on BIM adoption in New Zealand have been conducted. This suggests that BIM adoption in New Zealand is still in its early stages, which was also stated by Boon and Prigg (2012). In addition, as New Zealand does not mandate BIM use, software use in projects is also varied. The inconsistency in applied software and processes is another barrier to developing BIM implementation in New Zealand (BAC, 2019a). It is the nature of New Zealand industry that its members are fragmented. Therefore, New Zealand’s low BIM maturity level may be explained by the absence of government requirements to use BIM and insufficient documented guidelines in a complex product industry. This outcome is similar to the Australian context, which may be due to similarities in the AEC industries of both countries.
6.3 The need for government leadership
The research confirms government leadership is the most critical factor for successful BIM adoption. Despite the significant contribution of a supporting working group from both government and industry, the government’s role is not a key driver in New Zealand. The study of McGraw Hill (2014) also stated that government mandates are the most critical factor for successful uptake of BIM, due to the fragmented nature of AEC industries across the world. As a result of the lack of government leadership, there is inconsistent practical application. Meanwhile, the study of Wong, Wong and Nadeem (2009) also found that government support would be significant in BIM adoption across the country. It appears there is a requirement for government promotion of BIM use in all current and potential members of the AEC industry, for whom being without BIM would be a huge competitive disadvantage. Hence, the practitioners would automatically implement BIM in their working process. What is more, the available support mechanism would promote a faster and more productive adoption process. However, government mandates should be carefully analysed, as there are number of industry challenges that would need to be well-examined before mandating BIM use in New Zealand.
10. Conclusions and Recommendations The study examined the efficiency of New Zealand’s BIM adoption support mechanism in the AEC industry. The literature review showed various methods that the UK, Scandinavian countries, Australia

209
A study of the implementation of BIM in the AEC industry in New Zealand
and New Zealand used to spread BIM adoption nationally. The UK and Scandinavian countries are known as BIM leaders, and their governments have actively demonstrated their readiness in applying BIM in the AEC industry by mandating BIM for government projects. Moreover, the supporting groups (both from government and industry) collaborate efficiently and creatively in BIM education, training, research, development of standard BIM product databases, and online libraries. The governments of Australia and New Zealand also expressed the intention of using BIM in the AEC industry, and supporting groups produced many programmes and documentation to boost BIM uptake, however, without a government mandate for BIM adoption, progress is not as advanced as expected. The semi-structured interviews with three BIM researchers and three BIM practitioners provided a holistic view of BIM awareness and BIM application in New Zealand, and the findings are also consistent with the result of literature review part of the study. Moreover, the findings also confirmed that BIM users expected the government to take a leadership role to enhance BIM uptake. The results (1) justify the readiness of the BIM adoption support mechanism, however (2) a lack of government mandate has slowed down the adoption of BIM across New Zealand. Based on these results, this article proposes three recommendations to tackle the issue.
Recommendation 1: To improve the BIM adoption rate in New Zealand, we recommend the BAC action plan should add more programmes addressing small and medium enterprises (SMEs). BAC is playing the most active role in approaching ongoing and future BIM users, however, it seems BAC is focusing on conglomerate and large firms only. Most participants of the annual BIM survey conducted by BAC are conglomerates and large firms. Meanwhile SMEs – the dominant members of the AEC industry – make up about 5%-10% of the survey sample from 2014 to 2019 (BAC, 2019a). Supporting activities aimed at SMEs would increase BIM awareness and knowledge. For instance, the more SMEs become aware of www.biminnz.co.nz, the more likely it is that they will understand the benefits of BIM adoption. Smith (2014) stated free and accessible BIM data online would be positively affected by BIM adoption levels. Briefly, a greater focus on SME customers would be beneficial in increasing the BIM adoption rate.
Recommendation 2: To improve the BIM adoption rate in New Zealand, we recommend New Zealand agrees to use Uniclass 2015 as a national classification with modifications to fit the New Zealand context. The UK is now one of the leaders in BIM research, and the UK and New Zealand share many of the same values (e.g. democracy, language). Learning from them may help New Zealand to minimise time spent on research and reduce costs. The study of Ghaffarianhoseini et al., (2016) revealed that consistent standards and qualifications would decrease obstacles to BIM uptake.
Recommendation 3: To improve the BIM adoption rate in New Zealand, we recommend adding BIM knowledge into trade training programmes. New Zealand’s government implemented a $1.6 billion Trades and Apprenticeships Training Package to support New Zealand’s economy during the global Covid-19 pandemic, especially SMEs. The study of Doan et al. (2020) concluded the skills gap is one of the barriers to increasing the BIM adoption rate. Therefore, the more BIM training provided to practitioners, the faster the BIM adoption rate will rise.
11. ReferencesBAC (2019a). BIM in New Zealand: An industry-wide view 2019. Retrieved from Retrieved from
https://www.eboss.co.nz/assets/Uploads/BIM-Benchmark-Survey-2019.pdf BAC (2019b). BIM in New Zealand: A subcontractor view 2019. Retrieved from Retrieved from
https://www.eboss.co.nz/assets/Uploads/BIM-Subcontractor-Survey-2019.pdf

210
Thi Nhat Thanh Pham, Lorraine Skelton and Don Amila Sajeevan Samarasinghe
Boon, J., & Prigg, C. (2012). Evolution of quantity surveying practice in the use of BIM–the New Zealand experience.
In Proceedings of the CIB International Conference on Management and Innovation for a Sustainable Built Environment (pp. 84-98).
Cabinet Office (2012). Government construction strategy. London, UK: HM Government. Davies, K. (2017). ‘Being’BIM: An exploration of BIM practice and practitioners (Doctoral dissertation,
ResearchSpace@ Auckland). Doan, D. T., Ghaffarianhoseini, A., Naismith, N., Ghaffarianhoseini, A., Zhang, T., & Tookey, J. (2019). Examining Green
Star certification uptake and its relationship with Building Information Modelling (BIM) adoption in New Zealand. Journal of Environmental Management, 250, 109508.
Doan, D. T., GhaffarianHoseini, A., Naismith, N., Ghaffarianhoseini, A., Zhang, T., & Tookey, J. (2020). Examining critical perspectives on Building Information Modelling (BIM) adoption in New Zealand. Smart and Sustainable Built Environment.
Drew, C. J., Hardman, M. L., & Hosp, J. L. (2007). Designing and conducting research in education. Sage Publications. GhaffarianHoseini, A., Doan, D. T., Naismith, N., Tookey, J., & GhaffarianHoseini, A. (2017). Amplifying the practicality
of contemporary building information modelling (BIM) implementations for New Zealand green building certification (Green Star). Engineering, Construction and Architectural Management.
Gordon, G. & Curtis, M. (2018). Building-quality issues: A literature review. BRANZ Study Report SR375. Judgeford, New Zealand: BRANZ Ltd.
Gummesson, E. (2000). Qualitative methods in management research. Sage. Harrison, C., & Thurnell, D. (2015). BIM implementation in a New Zealand consulting quantity surveying practice.
International Journal of Construction Supply Chain Management, 5(1), 1-15. Hosseini, M. R., Banihashemi, S., Chileshe, N., Namzadi, M. O., Udeaja, C. E., Rameezdeen, R., & McCuen, T. (2016).
BIM adoption within Australian Small and Medium-sized Enterprises (SMEs): an innovation diffusion model. Construction Economics and Building, 16(3), 71-86.
Jensen, P. A., & Jóhannesson, E. I. (2013). Building information modelling in Denmark and Iceland. Engineering, Construction and Architectural Management, 20(1), 99-110.
Latham, S. M. (1994). Constructing the team. Lobo, Y. B., & Wilkinson, S. (2008). New approaches to solving the skills shortages in the New Zealand construction
industry. Engineering, Construction and Architectural Management. McGraw Hill (2014). The Business Value of BIM for Construction in Major Global Markets: How Contractors Around
the World Are Driving Innovation With Building Information Modelling. Retrieved from http://images.marketing.construction.com/Web/DDA
NBS (2014). NBS National BIM report 2014. Retrieved from https://www.thenbs.com/knowledge/nbs-national-bim- report-2014
NBS (2020). NBS’ 10th National BIM Report. Retrieved from https://www.thenbs.com/knowledge/national-bim- report-2020
Puolitaival, T., Amor, R., GhaffarianHoseini, A., & Park, K. S. (2016). Supporting BIM adoption and implementation Case New Zealand.
Samarasinghe, D. A. S. (2014). Building materials supply chains: An evaluative study of the New Zealand residential construction. Construction Management. Auckland, AUT University, New Zealand. PhD.
Smith, P. (2014). BIM implementation–global strategies. Procedia Engineering, 85, 482-492. Wolstenholme, A., Austin, S. A., Bairstow, M., Blumenthal, A., Lorimer, J., McGuckin, S., ... & Guthrie, W. (2009).
Never waste a good crisis: a review of progress since Rethinking Construction and thoughts for our future. Wong, A. K. D., Wong, F. K., & Nadeem, A. (2009). Comparative roles of major stakeholders for the implementation
of BIM in various countries. In Proceedings of the International Conference on Changing Roles: New Roles, New Challenges, Noordwijk Aan Zee, The Netherlands (Vol. 5).
Wood, E., & Samarasinghe, D. A. S. (2020). Adding some BIM to the boom. Auckland, New Zealand: Retrieved from https://www.researchgate.net/publication/340006504_Adding_some_BIM_to_the_boom

211
The 54th International Conference of the Architectural Science Association (ANZAScA) 2020
Blockchain: a new building block for the built environment?
Dermott McMeel1, Alex Sims2 1 School of Architecture and Planning, University of Auckland, Auckland, New Zealand
{[email protected]} 2 Department of Commercial Law, University of Auckland, Auckland, New Zealand
Abstract: This paper explores the innovations that are presented to the architecture, engineering and construction sector through blockchain. The authors consider blockchain, as a technology and methodology that allows us to rethink the fundamental building blocks and principles on which the sector is based. First, we provide some historical context, returning to and discussing the hypothesis that brought blockchain technology into being. Second, we review specific use cases that represent key differentiators between conventional approaches and the opportunities made possible through blockchain. Our analysis reveals how blockchain challenges the traditional structures of industry. It offers a new distributed methodology for replacing centralised and de- centralised structures of organisation and is disrupting notions of trust and authority that have been the default for industry—and indeed civilisation—for centuries. Finally, we report on original research where blockchain design workshops are held with industry stakeholders to map these opportunities into the architecture, engineering and construction sector.
Keywords: blockchain; distributed ledger technology; design; innovation; construction; built environment
1. IntroductionThe twenty-first century has been dominated by the emergence of the platform economy or PE (Kenney and Zysman, 2016; Fabo, Karanovic and Dukova, 2017). More than online shopping websites, PE’s mark a shift where the asset is the platform, not the things or services being delivered through it. The twentieth century was dominated by push economies enabled by the likes of Ford, Kellogg’s and Heinz. Who made things and pushed them onto consumers; the more they could push the more profit they made. Towards the end of the 20th century concepts such as ebay and craigslist—for example—provide a platform where people would ‘push’ things back into the economy. People, not corporations, could profit through these platforms. Amazon, Uber and Airbnb are the most recent evolution of platform economies with several key features (1) they do not own the core assets for their core business. Uber do not own their cars and much of what is sold on Amazon, are not Amazon products. (2) The platform is the thing of value. Uber has spawned Uber Eats, Amazon’s Web Services (AWS) is responsible for the most of Amazons profit – not online sales; individuals appropriate the platform to spawn micro-businesses on the platform. The twenty-first century has been defined—to date—by companies that develop powerful digital platforms, but do not own or make any of the physical products central to the economy they enable.
Blockchain is the most recent in a series of developments that constitute the evolution of the 20th century economic model to the twenty-first. A large part of which has been implementing digital technologies that have been couched as the Internet of Things, Industry 4.0, digital fabrication, digital twins and so on. This paper considers what blockchain may mean for the construction sector. There have been a number of systemic literature reviews that categorise and speculate on use cases (Turk and Klinc, 2017; Li, Greenwood and Kassem, 2019) including how blockchain might be leveraged within a BIM workflow (Erri Pradeep, Yiu and Amor, 2019). This research builds upon the earlier work and provides additional insights from social scientists, artists and designers, who look beyond the novelty of blockchain’s application and towards the implication of application not only of blockchain but also more generally to unpack the broader implications of this shift to digital ledger technology (DLT) and platform economies. We look at specific examples of ‘technology demonstrators’ being developed or proposed by these scholars to investigate specific affordances of blockchain and DLTs. These projects were used within workshops with industry partners to produce more focused delineation of specific streams of research—albeit still speculative—for blockchain in the construction sector. This work points to a
Imaginable Futures: Design Thinking, and the Scientific Method. 54th International Conference of the Architectural Science Association 2020, Ali Ghaffarianhoseini, et al (eds), pp. 211–219. © 2020 and published by the Architectural Science Association (ANZAScA).

212
Dermott McMeel, Alex Sims
fundamental shift in power as DLTs begin to find their way into business practice as well as spawning a plethora of opportunities for adding value to the construction sector.
In the next section, we explore blockchain’s origins, which was put proposed in 2008—in the form of Bitcoin— as it offers an alternative to centralised structures and helps us understand how and why blockchain differs from other technologies.
2. BlockchainThis section will explore the origins of blockchain before going on to explain what blockchain is offering that
is fundamentally different from what went before. It will conclude with an analysis of the fundamental of blockchain and a delineation of key factors in determining areas of potential implementation.
A brief history
Perhaps the easiest way of understanding blockchain is understanding its origins. In 2008 the world experienced an unprecedented global banking collapse. This was broadly as a result of banks taking undue risk combined with limited oversights within the banking system. Centralised and decentralised systems, by their nature, have very few points within the system where an overview of that system can be seen. Consequently, there are very few opportunities to see and understand the ‘big picture’ within such a system. Bankers taking risks with mortgages or loans are rewarded if the risk pays off. This imbalance in risk and reward, in this context, provides few rationales not to take risks with people’s money. This imbalance has been explained in greater detail by economist Yanis Varoufakis in ‘Talking to my Daughter About the Economy’ (Varoufakis, 2017).
Shortly after 2008, a person or persons using the alias Satoshi Nakamoto released a paper proposing a peer- to-peer digital cash system (Nakamoto, 2008). Transactions would be recorded publicly using digital ledger technology (DLT) removing the need for a third-party (a bank or bankers) to record and verify transactions. It, therefore, proposed the creation of a public banking system that did not require banks or bankers. This would facilitate significantly better oversight of the global state of transactions and remove the risk/reward imbalance by removing the need for banks and bankers acting as third-party mediators. The digital ledger technology (DLT) was blockchain and the digital cash was Bitcoin.
Implications
In its simplest terms it addresses the two fundamental problems that causes the banking crisis of 2008. First, it solves the risk/reward power asymmetry inherent in a centralised or decentralised system; no bankers mean no one person would benefit. Second, it creates a constant and updating ‘world-view’ of the entire ledger of transactions, enabling significantly more oversight. Indeed, computers on the Bitcoin network check for unauthorized attempts to alter transactional records. The importance cannot be over-stated, as virtually every human civilisation, every bank, council and local library is based on a centralised or decentralised organisational structure. Blockchain creates a technological platform to enable distributed organisational structure. Making it unnecessary to have a small number of people in positions of hierarchical power within the structure. The difference between centralised, decentralised and distributed is illustrated below (Figure 1).

213
Blockchain: a new building block for the built environment?
Figure 1: Centralized, decentralised and distributed networks (Source: Baran, 1964) In both centralised and de-centralised organization systems, things flow back to a central point or points.
There is a hierarchy or levels within these systems; people or groups with control and power over other people and groups. There is also a certain level of trust that what is flowing back to the central authority is accurate. In turn, when the central authority is called upon to disseminate information there is trust that it is somehow immutable and indisputable. The banking crisis of 2008 laid bare that such systems are fallible, and the proposal of Bitcoin and blockchain demonstrated an alternative system is possible.
The authors would like to suggest why blockchain remains an abstract concept and hard for many to grasp. It is because we—as a civilization—have no real point of reference for what a distributed (Figure 1: sub- image ‘C’) system of organization would be. Most of our history has used centralised and decentralised techniques for organisation (Figure 1: sub-image ‘A’ and ‘B’).
To summarise blockchain (1) it provides an alternative to centralised and decentralised systems of organisation required for hierarchical structures for power, control and decision-making. (2) It creates a DLT that creates trusted immutable records. (3) It distributes those records amongst the network of users increasing transparency. The questions that exist for the construction sector are: when and where would this be useful, and what new opportunities might change to a distributed system afford?
3. Case studiesIn this section, we look at four case-studies or thought experiments in applications of DLT (1) the multi-national shipping conglomerate Maersk’s implementation in supply-chain. (2) RADIUS a parent network using it to structure data for micro-seizure research. (3) BitBarista a bitcoin powered coffee machine developed by the Design Informatics Research Centre (DIRC) at the University of Edinburgh. (4) Caricrop a proposed ‘bridge’ currency to increase security within informal trading networks, also developed by DIRC. Each one of these case- studies offers insights into the application of DLT. In the following section we will analyse their affordance, before explaining how they fit into our workshop format to unpack the implications for the construction sector.
2.1. Maersk, IBM and global supply chains
Maersk is an international transport and logistics conglomerate, which was responsible—in 2018—for moving approximately 20% of the world’s shipping containers (Groenfeldt, 2017). Maersk has implemented a DLT to improve the paperwork associated with shipping. A single shipment of avocados, for example, involved 30
214
Dermott McMeel, Alex Sims
organizations, approximately 100 people and 200 discrete transactions (Godbole, 2017). The process of shipping is already a complex distributed network of individual organizations and a variety of esoteric contracts. In 2016 Maersk partnered with IBM to prototype a system based on DLT to improve the speed and efficiency of shipping. This was implemented in the 2016 avocado case-study the following four benefits were identified:
• Simplified business processes and workflows within and between organizations. • Immutable audit trail. • Resilient by nature, secure by design. • Enhanced compliance due to visibility.
In addition, the test case demonstrated significant time-saving benefits; however, the case-study noted there would be regulatory and legal barriers as well as questions surrounding the scalability of such an early stage technology.
2.2. Token economies
Second, we have two examples of the use of DLT to address short-coming in existing financial and trading structures. The first Caricrop—a proposal using DLT to reduce risk in informal agricultural trade networks (Pschetz, Dixon and Soares, 2019). Between the producer and consumer of an agricultural product, say an apple, there are many intermediaries. These intermediaries add value, for example, they package and market the product. However, payment to the producer of the product, and the intermediaries, is often dependent on that product getting to market. In some case payment is only made after the product reaches consumers and the payment trickles down through intermediaries to the producer. The process in many cases is based on informal agreements and the promise of the product making a certain price at market. This leave producers vulnerable to price fluctuations and slow to receive payment.
Caricrop proposes the creation of a ‘bridge’ currency, a coin (like bitcoin) based on the principle that a monetary transaction will happen in the future. When a sale of produce is agreed between a buyer and seller an equivalent amount of the bridge currency is immediately released to the producer. Within a specific network, this currency can be traded to buy goods or services amongst the intermediaries. Caricrop thus enables, rather than limits, intermediaries to trade. When the goods eventually make it to market and are sold for traditional (Fiat) currency the bridge currency is immediately converted and distributed throughout the network into real money.
The second example has been proposed by a health start-up, doc.ai. The doc.ai blockchain platform could be used by an informal distributed network of parents to collect data and finance research into a medical condition afflicting their children. This example solves two problems. Firstly, the problem, micro-seizures in children, is not big enough to attract significant research funding into the causes and cures. Second, the families only had information on one patient—their child—there was not enough data to be useful to the parents to identify seizure patterns. The second problem can be solved by creating a mobile phone app that serves as a journal for seizure information. Thus creating a structured database of seizure information. Money can be raised by charging for the app. Each purchase would buy a unique cryptocurrency, a ‘neuron’. Which would be used to fund research using the data collected in the mobile phone apps (De Brouwer and Borda, 2017; Doc.ai, 2018).
2.3. Agency and automated decision making
The final example is a research project from the Design Informatics Research Centre at the University of Edinburgh. Called the BitBarista, it is a coffee machine that is controlled by a small Raspberry Pi computer (Pschetz et al., 2017). The computer has a Bitcoin wallet and has been programmed to:
• Accept Bitcoin payment before making a coffee. • Pay out Bitcoin when someone fills it or cleans it. • Conducts a survey asking which time of coffee the user would like, best quality, lowest price, lowest
environmental impact or highest social responsibility.
When BitBarista accepts a bitcoin payment, the payment goes to the coffee machine’s bitcoin wallet. This contrast with typical transactions where money would be transacted between centralised back accounts. In this case the coffee machine now has money and can pay people in bitcoin for topping up its water or coffee beans or cleaning it. It now has some agency within the economy. It also purchases coffee beans online automatically based on the results of surveys it conducts on its customers. There are no people or committees intervening or mediating those decisions. In our research workshops we use these examples to seed discussion around some of the key differentiators of blockchain before beginning exploring possibilities for the construction sector.

215
Blockchain: a new building block for the built environment?
4. AnalysisEach one of the examples outlined in the previous section exploits a specific affordance of blockchain, which we will discuss in turn beginning with Maersk. We unpack these under the themes of: supply chain; contractual relationships; and new business models.
4.1. Supply chains
As a multinational conglomerate that moves things around the world, Maersk could benefit significantly from even small improvements in efficiency. This example shows just how impactful smart contracting could be in streamlining a complex distributed supply-chain network. This case however did require an invested high-level agency (Maersk) to bring the network together. Two of the main barriers Maersk identified was legal acceptance of such a new system and the recognition that it is an early-stage technology and scalability and interoperability could be problematic.
RADIUS is an example of a situation where not enough reward or incentive exists for a central authority and hierarchical structure to be established to invest in that specific things—in this case, research into micro- seizures. The group would be able to accumulate capital in a bridge cryptocurrency in parallel by using an App to generate structured data from participants. It would enable a small group to set up a cost-effective scheme that was able to organically scale. Research usually relies on large official funding organisations and authorities that are expecting financial or societal gains. RADIUS demonstrates the potential to cut out the ‘trusted third party’ and connect the researchers and the parents. Or, in more general terms, groups willing to pay for a service (parents with sick children) and groups willing to provide the service (researchers).
While the first example required a high-level agency to galvanise implementation the second one did not. The first was driven from the top down the second from the bottom up. Both were driven by the party which saw value from the opportunity. However, the second example would have been much more problematic, if not economically impossible because of its scale, if traditional techniques have been used.
4.2. Contractual relationships
Our second category uses blockchain to create a more complex Token Economy (TE) than RADUIS. Caricrop changes the relationship with third-parties or intermediaries from informal to contractual—via a smart contract. This case, however, recognises that the intermediary services add value and creates a digital application that enables a clear financial mapping of trades. The purpose here is not to de-intermediate, which is often associated with digital innovation—cutting out the middlemen. When ‘real’ money enters the system, everyone is paid pro- rata rather than the typical ‘trickle-down’. This distributes price fluctuations across the network reducing risk and incentivise efficiency. It also has secondary benefits in that what is traditionally an opaque trust-based network of trades can now be more clearly seen and audited. Organisations and people that perform well, or poorly, on the network can be clearly identified.
4.3. New business models
BitBarista also addresses the relationship to central authority. Specifically, in the case of coffee, it devolves decision-making to the individuals who use the coffee machine, the network. It removes the power asymmetry that exists between a coffee company, who profit from cheap coffee, and coffee consumers who want that coffee to reflect their values, or just taste better. The few making the decision in traditional hierarchical systems profit from and make financial gains from decisions that do not necessarily reflect the interests of the wider network of users and consumers.
Having mined into specific examples in this section, in the following section we will explain how these fit into our research workshops and what these workshops revealed about possibilities for blockchain in the construction sector. The results of the case study analysis are summarised in the table below.
Table 1: Summary of case study analysis – benefits of blockchain technology
Simpilified Audit Trail Increased Visibility Decentralised Governance Process
Supply Chains • • • Contractual • •
Relationships New Business Models
• • • •
Dermott McMeel, Alex Sims
5. ConstructionIn this section, we ask what does blockchain mean for construction? We report on our ongoing research seeking to deepen our understanding of blockchain on the construction sector—this includes associated disciplines such as engineering and architecture. The research project ‘Chip of the New Block’ runs from October 2018 to October 2020. The first phase of the project, which comprised industry workshops, is complete and we here report on our findings thus far. During 2019 the research team conducted a series of workshop with industry participants to deepen their understanding of blockchain and assist speculation on how it might reshape aspects of the sector.
The workshops are based on the format developed by the Design Informatics Research Centre at the University of Edinburgh. They are comprised of three parts (1) an introductory overview of blockchain and how it fundamentally differs from other systems. In this part of the workshop, we introduce the case-studies from the previous section. Presenting tangible examples of some of the possibilities. (2) A ‘trading’ card game where participants trade and record their trades on a blockchain made from Lego. This phase helps with a tangible understanding of digital ledger technology. (3) An ideation and brainstorming session where participants propose new forms of business potentially enabled through blockchain.
The workshops delivered a number of possible outcomes, from community cryptocurrency to support communities, smart contracts for disaster response funding and giving beehives crypto-wallets to pay people for the upkeep of flowers in the area. The themes and situations we explore in this section are directly drawn from those workshops and are limited to the construction sector. The subjects are unpacked and developed by experts in the industry, and with the help of the facilitators they have sketched out possible futures. We will delineate these findings under the themes: supply chain; smart contracts and new business models.
5.1. Supply chains
It is perhaps overstating the obvious to say construction involves a plethora of supply chains. Take an aluminium window, for example, from material extraction and processing through manufacturing to delivery and installation in a building involves hundreds of people and dozens of individual companies. It is a complex—if not always integrated—process.
Many parallels can be drawn between the supply chains in construction and the supply chains outlined in the Maersk case-study. They are comprised mainly of small to medium businesses (SMEs). Each business on the supply chain is typically only contractually bound to—and cognizant of—their immediate buyers and suppliers within the overall supply chain. Obtaining an overview of the overall supply chain is difficult. There is little originality in stating here that supply chain is an issue requiring attention in construction and others have suggested blockchain as a technology that might offer an opportunity to improve it. However, where we do make an original contribution is unpacking the Maersk case-study where we draw specific attention to overall organizational and industry differences that present challenges to implementation.
Interoperability is a well-known problem in digital systems in general. At the early stages of a new technology, there are often competing approaches before one wins out. Albeit this paper does not dwell purely on the technical issues, we are interested here in the organizational and cultural factors of implementation. These have been proven to be as impactful on successful uptake—if not more so—than technical issues (Kling, 1996).
Maersk is a global conglomerate, moving approximately 20% of shipping containers globally. The cost benefits of any improvements in efficiency would mostly benefit Maersk. In an industry with a large percentage of SMEs there is also a power geometry in this specific situation, which favours Maersk. Although it should be said Maersk foresees many benefits for SMEs, this initiative was led by Maersk and IBM. They invested whereas SMEs could not. The main obstacle to replicating this study for construction is that there is no economic equivalent to Maersk. Even the largest multinational construction organization is small in comparison. The alternative is the RADIUS example, where a sub-set interest group with a specific interest might establish a network to advance their interests. So, while various organizations are working on—and solving—the technical obstacles of the fledgling blockchain technology, these economic questions that are intertwined with organisation and culture remain in the short term unanswered.
5.2. Smart contracts
The topic of contracts, indeed procurement in general, has been identified as a significant factor in affecting change. During the 1990s the canonical Latham and Egan reports focused on this issue in the UK (Latham, 1994; Egan, 1998). These reports led to the introduction of new ways of procuring buildings, most notably public private partnerships or PPP as they were widely known. The aim of the change was to deliver a project with better and more accurate costing and construction scheduling. The results were mixed, and have been discussed by other researchers in some depth (Hill, 2001; McMeel, 2009). More recently collaborative procurements have emerged and have seen positive results (Ey, Zuo and Han, 2014). These aim to distribute profit or loss and engender a m2o1r6e collaborative spirit between participants than is found in traditional buyer/supplier contracts in the

217
Blockchain: a new building block for the built environment?
construction sector (Cox and Thompson, 1997). Although collaborative procurement is an improvement on traditional contracts, issues remain. Take a
specific form of collaborative procurement—Alliance contracting—typically used on infrastructure projects in New Zealand. While case studies report positive results, this type of novel collaborative project structure typically operates at a high level (Chang-Richards, Brown and Smith, 2019). It might include clients and several main contractors. Beneath this much of the work of sub-contractors and suppliers continues to be in the form of traditional ‘buyer supplier’ contract relations. Which usually mean meeting the terms of the agreement by delivering the cheapest possible solution. In addition, contracts are typically for one project only. Building a long- term relationship requires an informal agreement based on trust. Furthermore, it is difficult to check all indemnity insurance, professional accreditations and health and safety certifications. While it may occur at the outset of a project interim checks for expiration are more difficult and typically continue on ‘trust. So, while on the surface construction may seem to be based on formal contractual processes. Our workshops revealed that some key aspects of the industry remain informal and based on trust.
The Maersk case-study was of interest to workshop participants. Specifically (1) automatic creation and triggering of contracts for execution, and (2) provision of a worldview of the over-all relationships that would not otherwise be possible. Digital ledger technology (DLT) like blockchain has been likened to Hägerstraand’s concept of ‘time vessels’ in this regard (1970). It that they afford a perspective of a phenomenon that has not otherwise been possible. Participants further unpacked the potential for this technology to track performance over time. Thus, it would start to become possible to review accuracy and disparity between specific supplier or contractor tenders and final costs. Additionally, the idea that price fluctuations might be ameliorated across the network of participants, evoked benefits of collaborative procurement. This was preferable to profits being stripped from a project on a first come first-served basis. Smart-contracting offers the possibility of this benefit being extended beyond the high-level Alliance group to include subcontractors and suppliers. Even the area of Health and Safety, which involves significant paperwork and administrative hours, was singled out as an area, which could be streamlined using DLT.
In summary, smart contracting emerged from the workshop as an area of significant interest from the industry. While we should recognise not every instance discussed may require blockchain, looking at business practice through the lens of blockchain unpacked a plethora of potential innovations that could benefit the industry.
5.3. New business models
Returning, briefly, to our original claim that blockchain offers a novel methodology for rethinking the design and construction industry. We have touched on this idea as we have discussed smart contracts and digital ledger technology in the previous two sub-sections, and we would like to discuss it directly here. In a similar fashion to the distributed communication network we know as the internet spawning a plethora of new models of business and reshaping others, we explore what opportunities might be presented by distributed ‘trust’ networks underpinned by DLT such as blockchain. First, we will discuss how DAOs (distributed autonomous organisations) can redefine business organisation. Where a digital infrastructure, often underpinned by blockchain, replaces traditional ‘people’ roles of directing, administering and decision-making in a traditional organisation.
If we take the RADIUS case-study first, a small distributed network of people with a strong feeling about a thing and a common set of values surrounding it. Setting up a digital infrastructure to handle data and currency allowed it to scale when it attracted similar like-minded people. The distributed nature meant they too could easily participate and so the initiative grew in a ‘bottom-up’ fashion. It circumvented the need for some of the high-value people cost that might typically go with such a venture (directors, boards, administrators etc.) and establishing the centralised hierarchy.
In our workshops, the RADIUS case-study prompted a similar concept in collaboration with the Victoria University in Wellington the form of the Trash to Things Coin (TTTCoin) a unique currency that belongs to a network and can only be traded on ‘things’ reusing and reusing ‘trash’ (Figure 2). Reducing and reusing rubbish is something that people have strong feelings about are willing to invest in. It would not require large infrastructure costs and could grow organically. This idea was pushed further into its own Token Economy. Trash could conceivably now be purchased from contractors and manufacturers who could either cash out the TTTCoin to Fiat (normal) currency or use it to buy things in this economy that are reusing trash. Either way it contributes to the reduction of construction waste.

Dermott McMeel, Alex Sims
Figure 2: TTTCoin economy (source: author) The BitBarista case-study also seeded a concept of other ‘things’ you might trade with. It was furthered by
the introduction of two provocations. (1) The Whanganui river in New Zealand has been recognised as having the same rights as a person (Hsiao, 2012). (2) The 2019 labour pledge that a housing loan in the UK would belong to the house, not the people initially taking out the loan (Savage, 2019). Both concepts mark a shift towards things having rights and some autonomy of buying power. To reinforce the point, consider the decision a board of a multi-national coffee chain might make regarding which coffee to buy (cheapest or socially just) when the board members’ salaries or bonuses may be linked to profitability. Contrast this with the decision a consumer might make when asked by BitBarista which coffee they would like and even, in an extension, how much they would be prepared to pay for organic coffee that paid a living wage to the producer (Henley, 2019). The system then purchases which most consumers vote for. Irrespective of the decision – this affects a significant shift in power within the economy and industry.
6. Conclusions In summary, our research adds the following contribution to the body of knowledge. Firstly, we have mined deeper into supply chain and specifically looked at comparisons with other case-studies. We have delineated two specific contexts in which blockchain may or may not be successful. Secondly, we have explored some of the affordances of blockchain and the specific opportunities that could present in a ‘smart-contract’ environment in the construction industry. In New Zealand—which has a relatively modest economy—there is limited returns for construction companies investing in research and development and innovation within that limited economy. Blockchain, however, is a distributed technology that can support small and scalable ‘bottom up’ innovation, and does not necessarily require the large scale investment associated with ‘top down’ innovation that is associated with significant cost and structural change. Finally, we build a case showing the potential for blockchain to begin enacting a transition where other ‘things’ become part of our economy and have agency within it. Where houses have crypto-coin wallets and might autonomously search for cheap or green electricity to buy; in the same way a person might search for a cheap or ethically sourced product.
What we have seen with the internet, digital infrastructure, algorithms etc. is when new things become part of the digital infrastructure it presents what Stefan Michel calls new ‘value constellations.’ While there is no prescription here for foreseeing them, this research posits in addition to streamlining and disintermediation, blockchain and DLT’s will also spawn additional opportunities for future forms of commerce and business within the construction sector.
Acknowledgements The authors would like to thank Emina Petrovic from the Victoria University Wellington and Marie Davidova from Cardiff University who informed some of the themes in this paper. The authors would also like to acknowledge members of the blockchain special interest group Anshaal Kumar, Shaneel Singh, Alice Chang-Richards, Kingsada Se2n1g8savang, Tiantian Lyu and Abhinaw Sai Erri Pradeep, whose meeting and discussions also informed parts of this paper. This research is funded by the BRANZ Building Research Levy.

219
Blockchain: a new building block for the built environment?
References Baran, P. (1964) On Distributed Communications. RAND-Memorandum RM-3420-PR, RAND Corporation. Santa Monica,
California. Chang-Richards, A., Brown, C. and Smith, N. (2019) Building risk management strategies into the vertical construction sector. Cox, A. and Thompson, I. (1997) ‘‘Fit for purpose’contractual relations: determining a theoretical framework for construction
projects’, European journal of purchasing & supply management. Elsevier, 3(3), pp. 127–135. De Brouwer, W. and Borda, M. (2017) NeuRoN: Decentralized Artificial Intelligence,Distributing Deep Learning to the Edge of
theNetwork. Avaliable at https://static2.coinpaprika.com/storage/cdn/whitepapers/448539.pdf. Doc.ai (2018) doc.ai for Patients and consumers to initiate data trials, YouTube. Available at:
https://www.youtube.com/watch?v=nWMfRnqr_cA&t=12s. Egan, S. J. (1998) Rethinking Construction: The Report of the Construction Task Force. London: Department of Trade and
Industry. Erri Pradeep, A. S., Yiu, T. W. and Amor, R. (2019) ‘Leveraging Blockchain Technology in a BIM Workflow: A Literature Review’,
(January), pp. 371–380. doi: 10.1680/icsic.64669.371. Ey, W., Zuo, J. and Han, S. (2014) ‘Barriers and challenges of collaborative procurements: An exploratory study’, International
Journal of Construction Management. Taylor & Francis, 14(3), pp. 148–155. Fabo, B., Karanovic, J. and Dukova, K. (2017) ‘In search of an adequate European policy response to the platform economy’,
Transfer: European Review of Labour and Research. SAGE Publications Sage UK: London, England, 23(2), pp. 163–175. Godbole, S. (2017) How Blockchain can transform Global Trade Supply Chains, IBM. Available at:
https://www.unescap.org/sites/default/files/3_IBM Blockchain.pdf. Groenfeldt, T. (2017) ‘IBM and Maersk apply blockchain to container shipping’, Forbes. Available at:
https://www.forbes.com/sites/tomgroenfeldt/2017/03/05/ibm-and-maersk-apply-blockchain-to-container- shipping/#7ffdf7943f05.
Hägerstraand, T. (1970) ‘WHAT ABOUT PEOPLE IN REGIONAL SCIENCE?’, Papers in Regional Science. John Wiley & Sons, Ltd, 24(1), pp. 7–24. doi: 10.1111/j.1435-5597.1970.tb01464.x.
Henley, J. (2019) How Millions of French Shoppers are Regjecting Cut-Price Captilalism, The Guardian, Avaliable at https://www.theguardian.com/world/2019/dec/04/french-shoppers-rejecting-cut-price-capitalism-nicolas-chabanne (Accessed: 30 July 2020).
Hill, C. (2001) ‘Latham’s legacy’, Building, (50). Available at: http://www.building.co.uk/story.asp?storyCode=1014461. Hsiao, E. C. (2012) ‘Whanganui River Agreement’, Envtl. Pol’y & L. HeinOnline, 42, p. 371. Kenney, M. and Zysman, J. (2016) ‘The rise of the platform economy’, Issues in Science and Technology. Issues in Science and
Technology, 32(3), p. 61. Kling, R. (1996) Computerisation and Controversy: Value Conflicts and Social Choices. 2nd edn. San Diego: Academic Press. Latham, S. M. (1994) Constructing the team: final report. London: H.M.S.O. Li, J., Greenwood, D. and Kassem, M. (2019) ‘Blockchain in the built environment and construction industry: A systematic
review, conceptual models and practical use cases’, Automation in Construction, 102(March), pp. 288–307. doi: 10.1016/j.autcon.2019.02.005.
McMeel, D. (2009) The Artistry of Construction, Architecture. Edinburgh University. Nakamoto, S. (2008) Bitcoin: A peer-to-peer electronic cash system. Pschetz, L. et al. (2017) ‘Bitbarista: exploring perceptions of data transactions in the Internet of Things’, in Proceedings of the
2017 CHI conference on human factors in computing systems, pp. 2964–2975. Pschetz, L., Dixon, B. and Soares, L. (2019) FUNDING RESEARCH WORKSHOP: CariCrop, Design Informatics. Available at:
https://www.designinformatics.org/research_project/caricrop/ (Accessed: 30 July 2020). Savage, M. (2019) Labour plans to make 27m homes energy efficient, The Guardian. Available at:
https://www.theguardian.com/global/2019/nov/02/labour-scheme-homes-energy-efficiency (Accessed: 30 July 2020). Turk, Ž. and Klinc, R. (2017) ‘Potentials of Blockchain Technology for Construction Management’, Procedia Engineering. The
Author(s), 196(June), pp. 638–645. doi: 10.1016/j.proeng.2017.08.052. Varoufakis, Y. (2017) Talking to My Daughter about the Economy: A Brief History of Capitalism. Random House.

220
Tatiana Ermenyi, Wallace Imoudu Enegbuma, Nigel Isaacs and Regan Potangaroa
Building Information Modelling Workflow for Heritage Maintenance
Tatiana Ermenyi, Wallace Imoudu Enegbuma, Nigel Isaacs and Regan Potangaroa Victoria University of Wellington, Wellington, New Zealand
[email protected], [email protected], [email protected], [email protected]
Abstract: Tangible and intangible benefits of building information modelling (BIM) in heritage buildings presents a constant debate around the ‘value add’ of heritage building information modelling (HBIM). HBIM can create an avenue for detailed modelling of heritage elements in the building envelop, documentation of unique cultural attributes and a platform for maintenance during operational phases. And the debate is often more about the ‘how’. Currently, traditional 2D drawings form the basis for maintenance decisions which makes the process cumbersome. Moreover, such drawing sets are often incomplete. This study aims to leverage BIM from a maintenance perspective to develop a standardised workflow for heritage building maintenance. A ‘simulation’ based methodological approach was adopted in this study. A Leica BLK360 3D scanner was used to capture 100-point cloud scans, then applied to create HBIM profile for an existing heritage roof, service ducts, clock and storage space. Autodesk Recap Pro was used to register the point-cloud and analyse the roof profile. The results revealed critical risk areas to the building roof. Exterior images were relatively similar to the interior point cloud. The workflow developed provides a standard workflow for future maintenance in heritage buildings. The results directly impact decision making by policy makers for transformation to HBIM.
Keywords: Building Information Modelling (BIM); Heritage; HBIM; LiDAR; Maintenance; Workflow.
1. Introduction
Architectural Heritage serves as a physical reminder of the past, culture and thinking of days gone by. It plays an important part in shaping a places current character but also they serve as ‘placemakers’. Thus, it preserves the culture of a place and what makes it unique, but also uniquely New Zealand. Heritage places also include those of Maori culture which are integral to their whakapapa and identity (Heritage New Zealand). Heritage conservation requires accurate data to manage, maintain and operate (Lavay & Sohet, 2007; Lucas, 2012). Roofs are very difficult to survey and analyse as access to them may prove to be dangerous, time consuming and expensive. However, the use of Unmanned Aerial Vehicles (UAV) allows for safe, quick and relatively easier ‘data’ collection of any roof. The analysis of that data could considerably improve the understanding of the roof’s performance, condition and maintenance. This leads to the research question of can heritage building information modelling (HBIM) facilitate improvements in comtemporary conservation planning given the shift towards digital technology in architecture, engineering and construction (AEC). Currently, 39% of the industry’s interest group utilised integration of digital asset or spatial information with asset systems which shows a low industry-wide uptake of leveraging of the capability of BIM in asset management (EBOSS, 2019).
Given the need to constantly monitor, maintain and implement conservation plans for heritage buildings, the incorporation of BIM, LiDAR and UAV would provide solutions to the lack of as-built data repository but also the evidence based data required by management. Furthermore, the implementation of a standard BIM workflow could lead to an improvement in maintenance cost and decision making. The pilot heritage building existing roof had early signs of the end of service life and issues around functionality and conservation maintenance arose which requires adequate BIM workflow for capturing current state of the roof and simulation of future intervention plans. Therefore, the goal is to leverage BIM from a strategic maintenance perspective to develop a standard workflow for heritage building maintenance in New Zealand. This starts with a comprehensive literature review of BIM, LiDAR and UAV. The method utilised to achieve the set objectives
Imaginable Futures: Design Thinking, and the Scientific Method. 54th International Conference of the Architectural Science Association 2020, Ali Ghaffarianhoseini, et al (eds), pp. 220–225. © 2020 and published by the Architectural Science Association (ANZAScA).

221
enabled real time data capture using UAV and future development of as-built BIM model. The results of presentation to heritage stakeholder and VR immersion are outlined. The subsequent parts of this paper covers methodology, results from a pilot heritage building, and discussion and conclusion.
2. Heritage Asset Management
Heritage assets bear similar features to facilities such as healthcare, commercial buildings and recreation. Facilities Management (FM) is an interdisciplinary practice related to the management or maintenance of buildings and to facilitate the integration of buildings and building users. FM practices draw on theories and principles of engineering, architecture design, accounting, finance, management and behavioural science (Aziz et al., 2016). Moreover, FM integrates multi-disciplinary activities within the built environment to manage their impact upon people and workplace (Boateng, 2011). FM phase is typically the longest phase in the buildings life-cycle and has a higher cost compared to rest of the phases of the building (Aziz et al., 2018). However, studies such as Lucas (2012), Araszkiewicz (2017) and Haddock (2018) found that the FM phase is one of the most disconnected phases in the building life-cycle because of poorly planned handover processes and inconsistent involvement in the early stages of the building life-cycle. This is too often reflected in the lack of updated as-built drawings, as in the case for the heritage facility of this study.
In addition, the loss of information and manuals, and a paper based data-entry has a significant impact on the FM resources and budget (Lavy & Jawadekar, 2014; Araszkiewicz, 2017). This is a major source of concern for building maintenance decision making. Poor management of these buildings can lead to serious consequences relating to loss of vital heritage (Ghosh & Chasey, 2013). In addition, FM teams are also constantly faced with the challenges of reducing resources, personnel, time, and funding (Lucas, 2012). Nonetheless, successful implementation of FM in heritage buildings requires strategic planning, customer care, benchmarking, environment and staff development. Therefore, the redefining of asset management data capturing processes with a heritage user specific BIM workflow has both operational and organisational advantages with enhanced heritage protection.
3. Heritage and Building Information Modelling (BIM)
BIM is a shared data and knowledge platform for all stakeholders involved and provides a basis for decision making during the entire lifecycle of the building: design, build, maintain, operate and finally demolition (Mohanta & Das, 2016; Enegbuma et al., 2014). Application of BIM provides improvements in accurate up-to- date data for FM decisions making processes (Ohueri et al., 2018).
One way to allow for existing buildings to be entered into BIM is through the use of laser scanning. It affords stakeholders the confidence in decision making for high risk redevelopments involving threat of damage to heritage building or harmful building materials such as asbestos (Werner, 2013). The ENEA Research Center of Frascati in Rome has explored improving the quality of heritage documentation with high quality illumination of scanned heritage by using Imaging Topological Radar (ITR) such as RGB-ITR (Red Green Blue-ITR) and IR-ITR (Infrared-ITR) at various wavelengths with colour digitalisation of up to 30 metres aimed at improving the quality of heritage documentation (Francucci et al., 2018). Irrespective of the parametric building elements, cultural monuments such as archived relics can be modelled within an AR/VR environment (Karadimas et al., 2019). This opens a whole new course of revenue stream worth exploring given the challenges of travel restrictions and inability to access certain heritage sites. Access is also limited for people living with some form of disability who wish to experience the same level of customer experience.
To improve HBIM information accuracy, Carleton Immersive Media Studio (CIMS) have extended research into standardising HBIM development level into the level of details (LOD) (Graham et al., 2018). Hence, capturing accurate point cloud scans enables the gradual development of a heritage database to promote easy access to objects and relevant information. In a similar study in Malaysia, LOD 500 has been earmarked as the standard for reviving cultural values in heritage preservation (Ali et al., 2018). Identification of key LOD desirables will ensure asset teams have adequate information when embarking on maintenance decisions. This process would also assist future guidelines and implementation of HBIM.
Cultural heritage knowledge was mapped to project the well-known problems in understanding building decay (Chiabrando et al., 2017). Given the massive scale of the heritage building roof in this study, simulations into future degradation of the roof component can be achieved. To promote a cost effect laser scan, a research on Foinikaria Church preservation using unmanned aerial vehicle generated accurate point cloud data which was exported into BIM with high data accuracy (Themistocleous et al., 2016). HBIM was utilised in tracking strategic

222
Tatiana Ermenyi, Wallace Imoudu Enegbuma, Nigel Isaacs and Regan Potangaroa
building function in relation to future performance standards for components to withstand seismic risk (Palestini et al., 2018). This precedents further reinforce the position of BIM workflows in heritage asset maintenance.
4. Methodology
Solutions to challenges in heritage building maintenance as outlined in the previous section can be readily approached through a simulation (Fellows and Liu, 2015; Creswell, 2012). The first part of this ‘simulation’ approach used a drone to map and record the external roof of the building. This was done with an UAV device DJI Mavic Pro Drone. The drone was controlled by a hand set connected to an IPad mini with a preprogramed flight path using PIX4D CAPTURE. The flight was set to a grid path with an overlapping snake pattern and shown in Figure 1. The drone was completed under Part 101 and required notification to nearby helicopter services. After set up, the drone took off from its designated spot up into the air to follow its path. During its flight the drone camera would take photos every few meters which would then be stitched together in processing. The first flight was set at 50 metres above the ground. However the flight was cut short due to aggressive seagulls circling the drone. The second flight straight after was set at 70 metres from the ground but was also cut short due to strong winds. Another flight was undertaken on a different day in the morning with the assistance of a second drone which emitted hawk noises to scare off the territorial seagulls. PIX4D was utilised in processing the captured images (Arnadi et al., 2019). Several flights were flown for mapping, thermal mapping and scanning of the building facade.
The second part used a 3D Leica BLK360 scanner to scan the internal roof space, the methodological process flow is shown in Figure 1 below. The scanner was kept along the central planked path of the roof space. It was controlled via an IPad which was then placed under the scanner between scans to maintain a strong WIFI connection. The IPad was set up with Autodesk Recap Mobile to allow for manual registration during the scanning process. It was important to keep scans close together to allow for the software to readily register each scan to other scans. This was especially important because of the repetitive nature of the space (trusses, ducting, sarking etc.). Leica recommends distances no wider than 6 metres, we scanned every 2 metres. This meant that in the central section of the building we scanned on either side and on top of each truss. Each scan took around 3-4 minutes. A total of 90 scans were transferred onto a desktop computer and registered using Autodesk Recap Pro.
Figure 1. BLK360 Scanner, Scan Path and UAV Flight Path for Heritage BIM Workflow
5. Result and Discussion
The result from the processing was a realistic point cloud model of the interior and exterior heritage roof spaces shown in Figure 2. A small number of scans did not transfer dues to WIFI errors during scanning and the edges behind all the ducting that the scanner could not be reach and hence could not be modelled in the point cloud. However, the central section of the building scanned well because of the lack of obstructions. Both side wings were harder to scan due to the high density of ducting and services. Subsequent scanning sessions were required to fill in as much of the missing areas as possible. Due to safety concerns not all of the roof space could be scanned to a 100% complete model. This was because of ducting and services and the lacking of planked path way to safely get to hard to reach places.

223
Tatiana Ermenyi, Wallace Imoudu Enegbuma, Nigel Isaacs and Regan Potangaroa
Figure 2. Point Cloud Model of Heritage Building Roof
The data was then processed on PIX4D software. This software gave a variety of outputs, including a point- cloud model, aerial imaging and a geographically located KML file that could be placed in Google Earth. The Aerial imaging and point cloud was problematic around the chimneys due to the relatively low points on a vertical face, such as a chimney. Data from the first, second and subsequent flights were merged together which allowed a high quality aerial image and point cloud to be formed. However, areas around the chimneys were still blurry and remain an issue for further research.
Figure 3. Heritage Building BIM Workflow
The 3D scanning using the BLK scanner became the centre piece for this work providing not only a HBIM platform but also an ‘as built’ drawing of the building’s roof space. No previous plans were available. The resulting point cloud model gave a detailed representation of the inside of the roof which also brings an accuracy level hard to achieve from regular drawings. However, the attainament of LOD500 is was contrary to the findings of Ali et al. (2018) where this was set as the ideal target for HBIM due to data size, storage and asset teams accessibility to BIM models. Although, due to the complexity of the spaces and its various components, this stage has proved extremely valuable. This can further be used as more accurate reference for

224
Building Information Modelling Workflow for Heritage Maintenance
documentation and as an as-built copy to be used for presentational opportunities. Asset managers of heritage properties develop immersive VR environments from the developed workflow in this study which is similar to the findings of Karadimas et al. (2019).
This workflow in Figure 3 was developed for use for future heritage building assessments. However, the equipment and software was chosen due to its availability and this could vary depending on the subscription and expertise of the assessors. This workflow (or variation of) can be applied to any heritage building assessment. It can be used for another roof assessment or can be applied to a facade or a whole building. The assessment can then be passed onto a specialist that can use this assessment to distinguish the most appropriate solution. Assessing heritage buildings this way can broaden our understanding of these special buildings and allow us to take better care of them.
6. Conclusion
This study began with the aim of leveraging BIM from a maintenance perspective to develop a standardized workflow for heritage building maintenance in New Zealand. This was achieved by a comprehensive literature review which highlighted the current challenges in heritage maintenance, gaps in application of BIM workflows and potential of UAV for heritage data capture. The registered point cloud scans provided a platform for future BIM modelling and development of heritage components. The point cloud scans would also serve as documentation for future interrogation to determine changes in building property over time. The standardized workflow can be applied to future maintenance projects and extensive use in heritage maintenance. This study is limited in a couple of dimensions such as use of proprietary equipment and software, lack of cost benefit analysis and inadequate lack of measurement of as-built accuracy to point cloud scan. Future research would focus on developing the BIM model and assessment of indoor environmental quality.
Acknowledgement
The authors would like to acknowledge Heritage New Zealand Pouhere Taonga for providing funding for this research. Ronnie Pace, Calum Maclean, Anna Maria Rossi and Jonathan Howard for supporting the project and giving concise heritage insight. Victoria University of Wellington for providing supporting fund of this research.
References
Ali, M., Ismail, K. M., Hashim, H. K. S., & Mustafa, M. H. (2018). Heritage Building Preservation through Building Information Modelling: Reviving Cultural Values through Level of Development Exploration. Journal of the Malaysian Institute of Planners, 16(2), 62–72.
Araszkiewicz, K. (2017). Digital technologies in Facilities Management - the state of practice and research challenges. Creative Construction Conference (pp. 1034-1042). Szczecin: Procedia Engineering.
Aziz, N. D., Nawawi, A. H., & Ariff , N. R. (2016). ICT Evolution in Facilities Management (FM): Building Information Modelling (BIM) as the Latest Technology. AMER International Conference on Quality of Life (pp. 363-371). Indonesia: Procedia - Social and Behavioural Sciences.
Aziz, N. D., Nawawi, A. H., & Ariff, N. R. (2016). Building Information Modelling (BIM) in Facilities Management: Opportunities to be considered by Facility Managers. Procedia - Social and Behavioral Sciences, 353-362.
Boateng, E. (2011). The Future of Facility Management in Finland. Finland: Jamk University of Applied Science. Chiabrando, F., Turco, M. Lo, & Rinaudo, F. (2017). Modelling The Decay in an HBIM Starting from 3D Point Clouds: A Followed
Approach for Cultural Heritage Knowledge. In The International Archives of the Photogrammetry, Remote Sensing and Spatial Information Sciences (Vol. XLII/W5, pp. 605–612). Ottawa, Canada. https://doi.org/10.5194/isprs- archives-XLII-2-W5-605-2017
Creswell, J. (2012). Research Design. India: Sage. EBOSS (2019). BIM in New Zealand —an industry-wide view2019. Enegbuma, W. I., Aliagha, U. and Ali, K. (2014). Preliminary Building Information Modelling Adoption Model in Malaysia.
Construction Innovation, 4(14): 408-432. Fellows, R., & Liu, A. (2015). Research Methods for Construction. New York: John Wiley & Sons. Francucci, M., Ceccarelli, S., Guarneri, M., Ferri de Collibus, M., Ciaffi, M., & Danielis, A. (2018). Laser Scanners for High-
Quality 3D and IR Imaging in Cultural Heritage Monitoring and Documentation. Journal of Imaging, 4(11), 130. https://doi.org/10.3390/jimaging4110130

225
Tatiana Ermenyi, Wallace Imoudu Enegbuma, Nigel Isaacs and Regan Potangaroa
Ghosh, A., & Chasey, A. (2013). Structuring data needs for effective integration of building information modelling (BIM) with healthcare facilities management. SEC 2013 - 7th International Structural Engineering and Construction Conference, 1471-1476.
Graham, K., Chow, L., & Fai, S. (2018). Level of detail, information and accuracy in building information modelling of existing and heritage buildings. Journal of Cultural Heritage Management and Sustainable Development, 8(4), 495–507. https://doi.org/10.1108/JCHMSD-09-2018-0067
Heritage New Zealand. (2020) Introduction to Heritage New Zealand Pouhere Taonga. Retrieved from: https://www.heritage.org.nz/about-us/introduction.
Karadimas, D., Somakos, L., Bakalbasis, D., & Karadimas, G. (2019). Current and Potential Applications of AR/VR Technologies in Cultural Heritage. INCEPTION Virtual Museum HAMH : A Use Case on BIM and AR/VR Modelling for the Historical Archive Museum of Hydra Greece. In A. Moropoulou (Ed.), TMM_CH 2018 (pp. 372–381). Springer International Publishing. https://doi.org/10.1007/978-3-030-12960-6
Lavay, S., & Sohet, L. (2007). Computer-Aided Healthcare Facility Management. Computing in Civil Engineering ASCE. Lavy, S., & Jawadekar, S. (2014). A Case Study of Using BIM and COBie for Facility Management. Texas: Texas A&M University. Lucas, J. D. (2012). An Integrated BIM Framework to Support Facility Management in Healthcare Environments. Blacksburg:
ProQuest. Mohanta, A., & Das, S. (2016). ICT- Based Facilities Management Tools for Buildings. Advances in Intelligent Systems and
Computing, 125-133. Ohueri, C., Enegbuma, W. I., Kenley, R. (2018). Energy efficiency practices for Malaysian green office building occupants.
Built Environment Project and Asset Management, 2(8). Palestini, C., Basso, A., & Graziani, L. (2018). Integrated Photogrammetric Survey and BIM Modelling for the Protection of
School Heritage, Applications on a Case Study. In The International Archives of the Photogrammetry, Remote Sensing and Spatial Information Sciences (Vol. XLII-2, pp. 821–828). Riva del Garda, Italy: ISPRS.
Themistocleous, K., Agapiou, A., & Hadjimitsis, D. (2016). 3D documentation and BIM modelling of cultural heritage structures using UAVS: the case of the Foinikaria Church. In ISPRS - International Archives of the Photogrammetry, Remote Sensing and Spatial Information Sciences (Vol. XLII-2/W2, pp. 45–49). Athens, Greece: ISPRS. https://doi.org/10.5194/isprs-archives-XLII-2-W2-45-2016
Werner, T. (2013). Helping Preserve and Rejuvenate our History – 3D Laser Scanning for Heritage Buildings and Structures. In 17th Heritage Conference (pp. 137–145). Canberra, Australia.

226
The 54th International Conference of the Architectural Science Association (ANZAScA) 2020
CFD simulation of Hydrodynamic Behavior of Four-Sided Wind- catcher integrated to the Earth ducts (Nay-Kesh) on the mean Temperature of the basement (traditional passive cooling in
Kashan Iran)
Mina Lesan1, Marzie Mirjafari2, Maryam Lesan3 and Abbas Yazdanfar4 1, 2, 4 Iran University of Science & Technology, Tehran, Iran
[email protected], [email protected] 2 3 Babol Noshirvani University of Technology, Babol, Iran
Abstract: Wind-catchers are used to provide comfort in hot and dry climates. Many studies focused on the wind- catcher element features, such as height, type or the cross-sectional area of the wind-catcher and the studied wind-catchers were directly connected to the space. In Kashan, earth ducts are part of the wind-catcher system. But there are few researches conducted on the integration of wind-catcher with the earth ducts system and its effects on the mean indoor air temperature. Therefore, in this study, the effect of four-way wind-catcher system integrated to earth ducts on the mean temperature of the basement (Sardab) was analyzed by the CFD software. The K-epsilon method was used to solve the number. The numerical method by CFD software were compared with the results of the field method data to validate the results. After validation, it was determined that the temperature of 42°C of the incoming wind after passing through the system enters the basement with a temperature of 24°C and brings the mean temperature of the basement to 32°C. The circulation of the air from yard to basement causes hot air to replace in the basement, then passes through the other earth ducts and reduces the mean indoor temperature.
Key words: CFD; wind catcher; earth duct; hydrodynamic behavior.
1. IntroductionWind catchers, are passive cooling systems have been used for centuries in hot and arid climates of Iran and neighboring countries (Karakatsanis et al, 1986). They located on the roof of buildings and captures the outdoor wind and directs it to the interior (Calautit et al, 2014). Wind catcher was oriented to the prevailing winds to cool the connected Sardab space. In Kashan, which is located in hot and arid climate with high temperatures in summer, wind catchers are integrated to earth ducts (Nay-kesh) to cool Sardab space. Nay-Kesh is a burried ventilation duct. The outside warm air flows down the wind catcher and after passing the earth ducts enters the Sardab (a space that is used as cellars due to its lower temperature). Integrating wind catcher to earth ducts affects hydrodynamic behaviour of the whole system and the average temperature of Sardab. In this study, wind catcher of Tabatabai house was selected as a case study (Figure 1). The case study has a the windcatcher with a height of 17 m which is connected to two main earth ducts. The purpose of this paper is to study the hydrodynamic behavior of the wind catcher integrated to earth ducts and its effect on the average temperature of the Sardab in
Imaginable Futures: Design Thinking, and the Scientific Method. 54th International Conference of the Architectural Science Association 2020, Ali Ghaffarianhoseini, et al (eds), pp. 226–235. © 2020 and published by the Architectural Science Association (ANZAScA).

227
Mina Lesan, Marzie Mirjafari, Maryam Lesan and Abbas Yazdanfar
summer peak times. Computational Fluid Dynamics (CFD) is a powerful tool for studying the hydrodynamic behavior of systems and was used in this study for reduced scale simulation.
Figure 1: Tabatabi House wind catcher integrated to earth duct system
2. Literature review So far, wind catchers have been studied in many studies. In wind catcher studies some researchers (Montazeri and Azizian, 2009; Dehghan et al., 2013; Calautit et al., 2019) were studied one sided wind catchers. Some studies were carried out on two-sided wind catchers (Montazeri et al.,2009; Zaki, 2019) and few researches conducted on four sided wind catchers (Dehghani et al., 2018). Montazeri and Azizian (2009) found out that the one sided wind catcher has the highest efficiency, when the wind hits the wind catcher cabinet directly (at an angle of 0 degrees). Several studies have been conducted on the effect of wind catcher plan shape geometry on ventilation systems (Elmualim and Awbi, 2002. Bahadori et al. (2014) has pointed out that the wind catchers can have form of square, cube, prismatic shape and cylinders. Montazeri (2010) found out that cylindrical wind catchers have the highest aerodynamic performance. Some researches were on wind catcher dimensions (Hosseini et al.2016; Montazeri and Azizian, 2009). Hosseini et al. (2016) found out the width of the wind catcher has a considerable effect on the indoor wind velocity for ex. reducing the wind catcher width from 2.5 meters to 1.5 meters increase the wind speed in the middle area by 50%. Some studies were on the wind catcher roof configuration and its effects on ventilation (Dehghan et al, 2013; Haw Lim et al, 2015). Dehghan et al. (2013) examined the effect of roof of wind catcher on its ventilation performance by carrying out wind tunnel testing as well as and smoke flow. Their study included the effect of wind speed and direction on three types of flat, curved and inclined roofs. They concluded that the internal pressure of the wind catcher and induced air flow are directly influenced by the geometry of roof in wind-catchers. In addition to the shape and dimensions of the wind catcher, studies have been done on how the wind catcher is connected to the adjacent spaces and its effect on ventilation. For example, Karakatsanis (1986) in an aerodynamic study on an isolated tower, the tower and adjoining house, and the tower and house surrounded by a courtyard, pointed out presence of a courtyard around the structure and the angle of incidence of the wind affects the rate and the direction of wind from the tower to the house. The results also showed that depending on a presence of the yard, the wind catcher act as a suction or blowing. Most wind catcher studies have been conducted on its natural ventilation performance and fewer studies have been conducted on the wind catcher thermal performance. In the field of thermal performance of wind catchers, Calautit et al. (2020) found out that a one-sided wind catcher with heat

228
CFD simulation of Hydrodynamic Behavior of Four-Sided Wind- catcher integrated to the Earth ducts (Nay-Kesh) on the mean Temperature of the basement (traditional passive cooling in Kashan Iran)
pipes within it can reduce the internal temperature of space up to 12 °C (reduce temperature from 40°C to 28°C). and also Kalantar (2009) pointed out Using a wind catcher with evaporative cooling for a particularly dry climatic condition (10-35% relative humidity), enabled the reduction in air temperature up to 15 °C. According to the literature review, it was found that most studies have been conducted on the wind catcher element. Also, these studies have focused more on the ventilation performance in wind catchers. Few studies have been carried out on wind catchers integrated to ventilation earth ducts. Therefore, in this study, the hydrodynamic behavior and thermal performance of the wind catcher integrated to earth ducts was studied to investigate its effect on the mean internal temperature of the Sardab.
3. Research methodologyThis section introduces the experimental and numerical methods used to evaluate the hydrodynamic behaviour of wind catcher integrated into earth duct system and the effects of it on mean indoor temperature of Sardab. Field measurments was carried out for a full-scale wind catcher of Tabatabai house. The experimental case have a four sided wind catcher integrated to two main earth ducts which is connected to sardab with three branches. The CFD application is used as a numerical method to conduct the simulation of the study. The CFD is a powerful tool to model the site atmospheric boundary conditions and the energy models. To validate the accuracy of the CFD simulation, full-scale field measurements (experimental recorded temperature) were used. Once the numerical model is validated, it uses to understand the hydrodynamic behavior of the studied wind catcher system and effect of it on mean temperature of Sardab. The methodology will be discussed in more detail in the following subsections.
3.1. Experimental tests The studied building was built under the street level of Kashan. The wind catcher was built on a clay roof of the experimental house and is 6 meters above the street level. The wind catcher has 17 m height in total with rectangular-shaped plan geometry of 1.3 m length by 0.76 m width and has one direct connection to Sardab. Wind catcher is also connected to the Sardab through two main underground earth ducts with 0.3 m in diameter. The Sardab is 4.8 m below the courtyard level. A staircase was built to connect the Sardab and courtyard. Experimental field testing of the wind catcher integrated to earth ducts was conducted in the summer
month to evaluate its thermal performance under hot weather conditions. The tests were conducted during the month of July for six consecutive days (25-30, 2017) with the highest air temperature based on the last ten years of meteorological data observation (2016). Temperature data in five different times of the day such as 8 am, 12 pm, 3 pm, 6 pm and 9 pm were studied. All data were recorded during the summer days and also the warmest hours of a day were included to investigate the performance of the system during peak periods. The entering wind speed at the predominant wind direction was also monitored during the test days. The data acquisition system is given in more detail in the next section.
3.1.1. Data acquisition system
Altogether 4 temperature sensors were installed at four different locations in the wind catcher system. Temperature data at four locations were monitored. Figure. 2 shows the wind catcher section and the

229
Mina Lesan, Marzie Mirjafari, Maryam Lesan and Abbas Yazdanfar
position of the temperature and velocity sensors. The parameters for data acquisition was wind speed (m/s) and ambient temperature (c). T1 is the ambient air temperature (the same height as the air velocity sensor height) and T2 the air temperature at the lower part of the wind catcher. T3 is the temperature data recorded in front of the B-2 earth duct and T4 is the measured temperature at the center of the Sardab. The installed data logger was Kestrel 5700 Elite Weather Meter. The device had sensors with the resolution of 0.1 for temperature and velocity.
Figure 2: locations of sensors the data acquisition system, right plan and left section
To monitor the hydrodynamic and thermal behavior of the reference wind catcher case in hot and severe days, the data gathered from the temperature sensors was averaged. The overall average temperature was calculated 42°C for different times of the day in six days. This temperature was used as an inlet condition in boundary settings for the CFD simulation. Figure 3a shows the average measured temperature for different times of the day (8am, 12pm, 3pm, 6pm, 9pm) at different locations during six consecutive days. A velocity sensor was installed front wind catcher window to record the incoming wind velocity in the Northeastern direction (prevailing wind direction in summer) during the field tests (Figure 2). The studied house was oriented in a Northwest-Southeast direction with the wind catcher facing the Northwestern axis (Figure 2). Velocity sensor was mounted at 4 meters above street level as it is shown in Figure 2a. The average of wind velocity in 6 consecutive days is given in figure 3b.
a b
Figure 3: a- average measured temperature for different times of the day (8am, 12pm, 3pm, 6pm, 9pm) and Figure 3b. Mean wind velocity monitored at the wind catcher opening at NE direction

230
CFD simulation of Hydrodynamic Behavior of Four-Sided Wind- catcher integrated to the Earth ducts (Nay-Kesh) on the mean Temperature of the basement (traditional passive cooling in Kashan Iran)
This averaged temperature (42 degrees Celsius) was monitored also, on 27th of July at 12 and 6 pm and also at 3 pm on 25th of July. Table 1 indicated the temperature of different locations when the air temperature is 42 °C in more detail.
Table 1: The temperature of different locations when the air temperature was the same as a calculated mean temperature for six days
V T4 T3 T2 T1 Time Day 0.85 33°C 27°C 30°C 42°C 3pm 25th
0.46 29°C 25°C 28°C 42°C 12p 27th
0.9m/s 28°C 25°C 27°C 42°C 6pm 27th
The on-site-recorded temperature and wind data for 3 pm on 25th July were used as a boundary condition in CFD software based on the previous information. Wind speed of 1 m/s was also selected for simulation boundary conditions. The simulation will be discussed in more detail in the subsequent part.
3.2. CFD simulation In order to analysis the hydrodynamic behaviour of the wind catcher system, a reduced scale of the experimental house was modelled in CFD software and is described in more detail in this section.
3.2.1. computational model and grid
The model is a simple model of the studied wind catcher integrated into the earth duct system in reduced scale of 1/200 which is connected to Sardab and the courtyard of the experimental house. The simulation model dimensions were selected in order to have the same dimensions as in the experimental study. The wind catcher model had a dimension of 0.0038 W× 0.0085 L× 0.085 H in reduced scale which is 0.76 W× 1.7 L× 17 H in meter at full-scale. Most of the wind catcher height located below the street level and the case study wind catcher roof is 6 meters higher than the street level (0.03m in reduced scale). The Sardab space was modeled for analysis had a 64 m2 floor area with the height of 0.024 m in reduced scale. The ventilation earth ducts a had a cross section of 0.3 m× 0.3 m in full scale which are 0.0015 m× 0.0015 m in a reduced scale. The structure mesh with 4,500,567 cells was applied in this study. The gambit software was used to generate the boundary layer conditions (Figure.4a). a b
Figure 4: a- structure mesh applied to study, b- Domain and Boundary condition

231
Mina Lesan, Marzie Mirjafari, Maryam Lesan and Abbas Yazdanfar
3.2.2. computational domain and boundary condition
The computational domain was modeled base on the best practice guidelines by Franke et al. (2007) and Tominaga et al. (2008). The surrounding domain and set boundary conditions are shown in Figure 4b. According to the guideline, the spacing for the inlet boundary, between the model and inlet, be 5 x H (height of the wind catcher cabinet), and the space between the outlet wall and the model was set 10 x H. Also a vertical length of 4H above the wind catcher height was used for the computational domain. For wind direction 60 °, plane 2 is the velocity inlet, plane 3 is the pressure outlet, and plane 1 and 4 are side planes (symmetry). The domain size was 0.45 m × 0.45 m × 0.15 m in a 1:200 reduced scale, whichcorresponds to 90 × 90 × 30 m3 in full scale (Figure 4b).
3.2.2.1. Site wind data analysis
For more accurate representation of the wind, an atmospheric boundary layer (ABL) flow profile was implemented velocity inlet for boundary conditions. AS it can be seen from the wind rose (figure. 5a), the prevailing wind in summer was blowing from the north eastern direction. The overall summer wind analysis indicated that the prevailing wind is from Northeast and 24% of days have wind velocity range from 0.5 to 2.1 m/s and 6% of days have wind velocity between 2.1 and 3.6 m/s. Figure.8b indicates wind speed classification in more detail. The wind data analysis revealed that the site has low outdoor wind velocity. Due to the lower frequency of higher wind speeds, the wind speed of 3m/s recorded by the anemometer at the height of 10 m in an open terrain Based on weather station data, was chosen for simulation. Center weather station was used as a reference and provided other climatic data.
a b 100
50
0 calms 0.5-2.1 2.1-3.6 3.6-5.7
Wind class (m/s)
Figure 5: site summer wind rose diagram and wind speed classification
Equation (1) introduced by ASHRAE (2009) was used to model wind velocity profile in urban space. From this equation, wind velocity at different points could be calculated (Xie, 2012).
= = 0.98 m/s = 1m/s (1)
Where
VH = mean wind speed at height Z in the study site (m/s) ; Vm = mean wind speed at height of 10 meters in the meteorology station (m/s). Zref of the anemometer in m/s; Hm= reference height of the anemometer; H= the target height, α= an empirical exponent which depends on the surface roughness,
72.7
0.7 11.914.7
%

232
CFD simulation of Hydrodynamic Behavior of Four-Sided Wind- catcher integrated to the Earth ducts (Nay-Kesh) on the mean Temperature of the basement (traditional passive cooling in Kashan Iran)
α met= the exponent of the roughness of the meteorology station. = gradient height at the top of the boundary layer of the meteorology = the height at which “gradient velocity” is first observed in the same terrain (m) (Gradient layer thickness is introduced by δ symbol in ASHRAE Handbook and some other references). In the following, Table 2 indicates urban and atmospheric boundary layer parameters in urban spaces. In this study the site falls under Class 7: terrain type of dense spacing of low buildings. Sand-Grain roughness is an important factor for wind profile accuracy. it effects on mean velocity profile. surface roughness height is presented in table2 for urban scale and It embedded in velocity profile. Therefore, in this study the surface roughness for CFD simulation was taken equal to 0.00001 on full scale.
Table 2: Atmospheric boundary layer(ABL) parameters in different urban spaces form ASHRAE (1999).
class Terrain description Z0 a IU Exp. Zg 3 Open flat terrain,grass,few isolated obstacles 0.03 0.15 17.2 C 275
7 Regular large obstacles coverage (dense spacing of low buildings,forest)
1.0.0- 2.0(1.5)
0.33 43.4 A 460
This profile was used as an inlet boundary condition in CFD simulation. Figure 6 indicates the wind profile of the site when Vm (mean wind speed at height of 10 meters in the meteorology station) is equal to 3 m/s and this brings The wind velocity at the sensor height equal to V4 = 1 m/s which was observed previously by velocity sensor.
As observed in Fig.5 the prevailing wind direction was NE from about 60 degrees. One side of wind catcher opening oriented to the prevailing wind (NE). The entering wind speed at the opening of the wind catcher at 27th July at 6pm was monitored 0.9 m/s at the sensor height, and 1m/s was inserted in the velocity profile. The average monitored temperature during the six days in month of July (42degrees=315K) was implemented in simulation. and roughness constant was taken to 0.5 based on study by calautit et. al (2020). Table.3 provides information for CFD boundary conditions in more detail.
Table 3- Summary of the CFD model boundary conditions. 1 2
Velocity inlet (m/s) Pressure outlet
ABL flow(60°) Zero
5 6
Earth ducts temperature Walls (all)
19°C No slip
3 Temperature inlet (C) 315 k(42°C) 7 Roughness height KS 0.00001 4 Temperature of the soil 292.15 (19°C) 8 Roughness constant CKS 0.5

233
Mina Lesan, Marzie Mirjafari, Maryam Lesan and Abbas Yazdanfar
3.2.3. Solver settings
The standard k-epsilon was used as a solver, which is well known in the field of wind catcher research (Hughes et al,2012). The Finite Volume Method approach and Semi-Implicit Method for Pressure-Linked Equations velocity-pressure coupling algorithm with the second order upwind discretisation were employed by the CFD tools. The governing equations for the 1-continuity, 2-momentum, 3-energy, 5- energy dissipation rate were used. Pressure interpolation was second order and second order discretization schemes were used for both the convection terms and viscos terms of the governing equations.
4. ResultsThe effect of the wind catcher integrated to earth ducts on entering air temperature and mean temperature of Sardab were simulated. Figure 7 shows the air temperature contours when the outdoor air temperature was at 42°C (taken from the average temperature in six consecutive days in July), and the soil temperature was at 19°C. The system had a clear effect on the entering ambient air temperature (T1) reducing it to 24°C (T2) while passing through the earth ducts (Figure 7a). The mean temperature at center of the Sardab (sensor location) was calculated 32°C (Figure 7b). The data were validated with experimental measurements in the next subsection.
T1=42°C
T2=31°C
30°C T3=24°C
27°C
a Figure 7: Temperature contours in the system while the air temperature is 42 °C and wind blow
from NE. a- Plan of wind catcher, earth ducts and Sardab. b- section of the system
4.2. Comparison with experimental measurements The comparison between CFD model simulation and experimental measurements is outlined in this section. In Figure 8, the results of the CFD simulation are compared with empirical mean air temperatures. The percentage of root-mean square deviation (PRMSD) for the accuracy of the CFD simulation was used. The PRMSD between CFD simulation and the empirical results for the mean temperature for six consecutive days shows 7% deviation. Also The PRMSD between CFD simulation and the empirical results for the targeted time (25th July at 3 pm) indicates 8.2% deviation. These small discrepancies (below 10%) between experimental model and simulated model indicates the validity of the CFD simulation. Following the satisfactory validation of the CFD simulation results, the CFD was used to investigate the hydrodynamic behavior of the system and the effect on mean temperature of the Sardab in the next subsection.
T1=Air temperature= 42°C (315 k)
b

234
CFD simulation of Hydrodynamic Behavior of Four-Sided Wind- catcher integrated to the Earth ducts (Nay-Kesh) on the mean Temperature of the basement (traditional passive cooling in Kashan Iran)
Location T2 Location T3 Location T4 Empirical Mean Temperature 29.5°C 25.6°C 30.8°C
CFD Simulation 31°C 24°C 32°C empirical Temperature at targeted 30°C 27°C 33°C
Figure 8: Empirical air temperature and CFD simulation results
4.3. Findings This study was conducted to analyze the hydrodynamic behavior of the case wind catcher system and the effects of it on mean temperature of Sardab. In wind catcher of Tabatabai house, the entering wind allows the hot ambient air to flows down to the wind catcher and after passing through earth ducts that buried underground (with temperature of 19°C) cools down and enters the Sardab space with temperature of 24°C (Figure 9a). Sardab performs as an interface space between wind catcher and courtyard. Because of the temperature difference between Sardab (high pressure) and courtyard (low pressure), the colder air of Sardab (high pressure) moves toward the courtyard with lower pressure (Figure 9b). The air circulation occurs and the hot air of courtyard enters from the top of staircase toward Sardab and increase the mean temperature of Sardab. Then the hot air enters the earth duct A-3 (Figure 9c), after passing through the earth duct A it brings back to Sardab again from duct A-1 and A-2. It was determined that the temperature of 42°C of the incoming wind after passing through the system enters the Sardab with a temperature of 24°C from duct B-2 and brings the mean temperature of the left part of room to 27°C (15°C cooler than the air temperature), But the circulation of the air from courtyard to Sardab causes hot air to replace in the Sardab and increase the mean temperature of Sardab to 32°C (10°C Cooler than the air temperature). Along the wind catcher system, the courtyard has considerable effect on the mean temperature of Sardab. The dimensions of courtyard are important for system to act more efficient. The future research can be on the dimension of courtyard in the improved efficiency of the system and reducing the Sardab mean temperature.
a b c
Air with Lower pressure
Earth duct B
The colder air of Sardab moves toward yard
Higher pressure The warmer air of courtyard replaces from the top of the staircase
Figure 9: Overall hydrodynamic of the wind catcher integrated into the earth duct system
Air t
empe
ratu
re°C

235
Mina Lesan, Marzie Mirjafari, Maryam Lesan and Abbas Yazdanfar
References J.K. Calautit, B.R. Hughes, Wind tunnel and CFD study of the natural ventila-tion performance of a commercial multi- directional wind tower, Build. En-viron. 80 (2014) 71-83. V. Kalantar, Numerical simulation of cooling performance of wind tower (Baud-Geer) in hot and arid region, Renew. Energy 34 (2009) 246-254. Montazeri H, Azizian R. Experimental study on natural ventilation performance of a one-sided wind catcher. Proc Inst Mech Eng Part J Power Energy 2009; 223:387-400. https://doi.org/10.1016/j.buildenv.2008.01.005. Dehghan A.A, Kazemi Esfeh M ,Dehghan M., Natural ventilation characteristics of one sided wind catchers:experimental and analytical evaluation. Energy and Buildings. 2013; 61:366-377. https://doi.org/10.1016/j.enbuild.2013.02.048 . Calautit J.K, Tien W.P, Wei s, Calautit K, Hughes B, Numerical and experimental investigation of the indoor air quality and thermal comfort performance of a low energy cooling wind catcher with heat pipes and extended surfaces,Renewable Energy 2020; 145:744-756. https://doi.org/10.1016/j.renene.2019.06.040 . Montazeri H, Montazeri F, Azizian R, Mostafavi S. Two-sided wind catcher performance evaluation using experimental, numerical and analytical modeling. Renew Energy 2010; 35:1424-35. https://doi.org/10.1016/j.renene.2009.12.003. Zaki A, Richards P, Sharma R. Analysis of air flow inside a two-sided wind catcher building. Journal of Wind Engineering and Industrial Aerodynamics.2019;190: 71-82. https://doi.org/10.1016/j.jweia.2019.04.007 . Dehghani Mohamadabadi H, Dehghan A.A, Ghanbaran A.H, Movahedi A, Dehghani Mohamadabadi A, Numerical and experimental performance analysis of four sided wind tower adjoining parlor and courtyard at different incidentangels. Energy and Building. 2018;172: 525-536. https://doi.org/10.1016/j.enbuild.2018.05.006 . Elmualim A.A, Awbi H. B, Wind tunnel and CFD investigation of the performance of “Windcatcher’’ ventilationsystems, International Journal of Ventilation, 2016;1:53-64. https://doi.org/10.1080/14733315.2002.11683622 . Bahadori M.N, Dehghani- sanji A, Sayigh A, Wind Towers: Architecture, Climate and Sustainability,pp.1- 17,Switzerland; London: Springer International Publishing,2014. Montazeri H, Experimental and numerical study on natural ventilation performance of various multi opening windcatchers. Building and Environment.2011;46:370-378. https://doi.org/10.1016/j.buildenv.2010.07.031 . Hosseini S.H., Shokry E., Ahmadian Hosseini A.J., Ahmadi G., Calautit J.K., Evaluation of airflow and thermal comfort in buildings ventilated with wind catchers: Simulation of conditions in Yazd City, Iran. Energy for sustainableDevelopment 2016; 35:7-24. https://doi.org/10.1016/j.esd.2016.09.005 . Haw Lim C, Saadatian O, Sopian K, Sulaiman M.Y,Mat S, Salleh E,N.g K.C. Design Configuartions analysis of Wind- induced natural ventilation tower in hot humid climate using computational fluid dynamics.International Journal ofLow-Carbon Tecnologies.2015;10:332-346.https://doi.org/10.1093/ijlct/ctt039 . Karakatsanis C, Bahadori M, Vickery B.J., Evaluation of pressure coefficients and estimation of air flowrates in buildingsemployingwindtowers,Sol.Energy,1986,37(5),363–374https://doi.org/10.1016/0038-- 092X%2886%2990132-5 Behammou M, Draoui B, Zerrouki M, Marif Y. Performance analysis of an earth-to-air heat exchanger assisted by awind tower for passive cooling of building in arid hot climate. Conference paper.2015. B.R. Hughes, J.K. Calautit, S.A. Ghani, The development of commercial wind towers for natural ventilation: A review, Appl.Energy 92 (2012) 606t-627. Tominaga, Y., Mochida, A., Yoshie, R., Kataoka, H., Nozu, T., Yoshikawa, M., & Shirasawa, T. (2008). AIJ guidelines for practical applications of CFD to pedestrian wind environment around buildings. Journal of Wind Engineering and Industrial Aerodynamics, 96(10-11), 1749-1761. doi:https://doi.org/10.1016/j.jweia.2008.02.058 Franke, J., Hellsten, A., Schlünzen, H., & Carissimo, B. (2007). BEST PRACTICE GUIDELINE FOR THE CFD SIMULATION OF FLOWS IN THE URBAN ENVIRONMENT. Retrieved from Brussels: 21- American Society of Civil Engineers (ASCE). (1999) Wind Tunnel Studies of Buildings and Structures. ASCE Manuals and Reports on Engineering Practice, No.67, USA. Xie Jiming. Aerodynamic optimization in super-tall building designs. The seventh international colloquium on bluffbody aerodynamics and its applications (BBAA7) Shanghai, China; September 2–6; 2012.

236
The 54th International Conference of the Architectural Science Association (ANZAScA) 2020
Climate change adaptation in New Zealand’s building sector
Thao Thi Phuong Bui1, Suzanne Wilkinson2, Niluka Domingo3 1,2,3Massey University, Auckland, New Zealand
[email protected], [email protected], [email protected]
Abstract: Climate change is one of the major issues facing all countries and calls for a top-priority universal response from all sectors. The building sector plays a significant role in adapting to and mitigating the impacts of climate change. Researchers have aimed to assess the building sector’s knowledge, development, technology in transiting to a low carbon built environment, and the awareness and capacity to adjust to climate change impacts. This paper explores the climate change implications for the New Zealand’s building sector and examine how the sector currently adapts to climate change, using a literature review. Initial findings suggest that changes in temperature and extreme weather events are the key factors affecting the building sector, and adaptation actions are occurring predominantly at a city and neighbourhood level rather than the individual building level. More climate change adaptation actions needed require not only an urgent, joined-up and effective response across all levels of government but also industry engagement. The building sector should act in both minimising the climate change effects on buildings and reducing greenhouse gas emissions at the individual building level. Future in-depth research should emphasise more on the future actions to mitigate climate change effects for the entire building stock.
Keywords: Climate change, adaptation, building sector, New Zealand
1. Introduction and Background
1.1. The concept of climate change
Climate change is defined by the Intergovernmental Panel on Climate Change (IPPC) as:
“a change in the state of the climate that can be identified (e.g., by using statistical tests) by changes in the mean and/or the variability of its properties, and that persists for an extended period, typically decades or longer” (IPCC, 2014).
A significant increase in human-induced greenhouse gas emissions (GHGs), which have increased since the pre-industrial era and driven extensively by economic development and population growth, causes climate change. In conjunction with other human-driven factors, these impacts are possibly the main causes of global warming since the mid-20th century. In terms of
Imaginable Futures: Design Thinking, and the Scientific Method. 54th International Conference of the Architectural Science Association 2020, Ali Ghaffarianhoseini, et al (eds), pp. 236–245. © 2020 and published by the Architectural Science Association (ANZAScA).
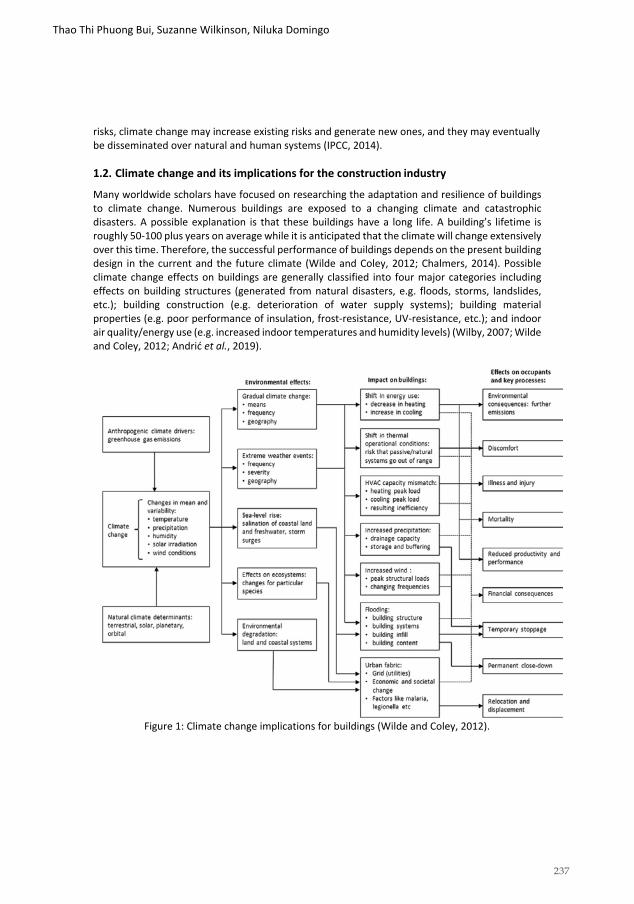
237
Thao Thi Phuong Bui, Suzanne Wilkinson, Niluka Domingo
risks, climate change may increase existing risks and generate new ones, and they may eventually be disseminated over natural and human systems (IPCC, 2014).
1.2. Climate change and its implications for the construction industry
Many worldwide scholars have focused on researching the adaptation and resilience of buildings to climate change. Numerous buildings are exposed to a changing climate and catastrophic disasters. A possible explanation is that these buildings have a long life. A building’s lifetime is roughly 50-100 plus years on average while it is anticipated that the climate will change extensively over this time. Therefore, the successful performance of buildings depends on the present building design in the current and the future climate (Wilde and Coley, 2012; Chalmers, 2014). Possible climate change effects on buildings are generally classified into four major categories including effects on building structures (generated from natural disasters, e.g. floods, storms, landslides, etc.); building construction (e.g. deterioration of water supply systems); building material properties (e.g. poor performance of insulation, frost-resistance, UV-resistance, etc.); and indoor air quality/energy use (e.g. increased indoor temperatures and humidity levels) (Wilby, 2007; Wilde and Coley, 2012; Andrić et al., 2019).
Figure 1: Climate change implications for buildings (Wilde and Coley, 2012).

238
Climate change adaptation in New Zealand’s building sector
1.3. Climate change countermeasures
Climate change countermeasures can be categorised into mitigation and adaptation. The last two decades have seen a growing trend towards both climate change mitigation and adaptation research. However, a critical question concerning how climate change mitigation and adaptation should be integrated to improve the overall performance of climate change resolutions remains unanswered. Traditionally, there was a generally independent action between climate change mitigation and adaptation (Swart and Raes, 2007). However, several academics argue that climate change adaptation should be considered together with mitigation. This was considered in many studies: (Dang et al., 2003); Laukkonen et al. (2009); Locatelli et al. (2016). In general, due to the interrelationship between climate change mitigation and adaptation, taking two together into account may classify their prospective interactions and whichever unpredicted results of confronting one another.
For the building sector, GHGs and climate change are fundamentally linked, for this reason, more attention is paid to reduce emissions as a mean of climate change mitigation. However, Smith (2010) pointed out that climate change still affects residents and their buildings despite many efforts that have gone into moderating GHGs. On that account, there is a requirement of adaptation actions, targeting to offset the impacts of global warming. In support of this view, Gregório et al. (2016) employed a method to investigate the trade-offs between climate change vulnerability and mitigation options for the residential building stock of 29 Portuguese Municipalities. The findings indicate that there are no trade-offs when adopting mitigation measures or using more effective appliances for retrofitting residential buildings. A likely explanation is that additional adaptation options are required to gain the efficiency level for mitigation actions. As far as the construction sector is concerned, adaptation actions may consist of plans for ensuring comfortable indoor air quality in spite of increased outdoor temperatures, reducing building energy demand, and developing adaptive designs for building exposed to floods (Camilleri et al., 2001; Mancini and Basso, 2020). In New Zealand, much of the research in the building sector has focused on knowledge development and technology to mitigate the climate change (Chandrakumar et al., 2020; Ghose et al., 2020). There has been limited published research regarding climate change adaptation for the building sector. Thus, this paper aims to identify the climate change implications for New Zealand’s building sector and investigate how the sector currently adapts to climate change by using a literature review.
2. MethodologyTo explore how New Zealand’s building sector currently responds to climate change, a systematic literature review approach was applied in this research. In the context of this research, an innovative application of systematic methods, proposed by Berrang-Ford et al. (2015) was applied to address the methodological challenges of synthesising and tracking adaptation to climate change. This systematic review in adaptation research can be best treated under three main components including: (1) Defining research question/aim, (2) Data source and document selection, and (3) Analysis and presentation of results. Firstly, the circumstances focusing on climate change implications and adaptation for the building sector in New Zealand were gathered from the empirical literature. Secondly, the list of suggested research was collected and categorized from some literature resources. In the beginning, various document types including

239
Thao Thi Phuong Bui, Suzanne Wilkinson, Niluka Domingo
articles, review, book chapters, conference papers published in English until May 2020 were examined using Scopus database. The researcher used the phrase “Climate change” AND “Adaptation” AND “Building” OR “Housing” AND “New Zealand” in the title, keywords, and abstract fields for the first database search. Research papers also were limited to New Zealand only. The coverage of the accessible research materials was improved by considering further sources consisting of environmental and governmental agencies’ reports. There were 26 papers retrieved from Scopus. Then, every paper was inspected by reading abstracts to confirm that they were relevant to the research context. Duplicates and those to which full text was not available were also removed. The final selection included 14 journal papers, 10 reports from government and independent organisations. Finally, the literature was analysed and synthesized through qualitative content analysis to distinguish what are the potential climate risks having impacts on New Zealand’s building sector and how does this sector respond to climate change. Qualitative analyses are often guided by thematic content analysis (manifest or latent), sometimes involving quantitative or qualitative coding (Berrang-Ford et al., 2011) Thus, the qualitative data is categorised into different themes and sub-themes. The themes are the following: (1) Potential climate change implications for the building sector; (2) Climate change adaptation at city level; (3) Climate change adaptation at neighbourhood level; (4) Climate change adaptation at individual building level.
3. Results
3.1. Potential climate change implications for New Zealand’s building sector
In New Zealand, before the work of Camilleri et al. (2001), the role of climate change impacts on buildings was largely unknown. Climate change is likely to influence buildings in both direct and indirect ways. As Camilleri et al. (2001) believed, the most significant factors are the decrease of winter space heating for houses because of the temperature increases; the decrease of water heating energy; changes in non-cyclonic wind speeds; extreme wind; degradation of organic polymers; and tropical cyclones. Among them, the decrease of winter space heating is ranked at the top of the list. It could become easier to design and construct buildings required little or no space heating due to the increase in temperature. Yet, alternative designs should be considered when buildings are first constructed, since these buildings may last for 50–150-years. There would, therefore, seem to be a definite need for effective adaptation actions before constructing buildings.
Recently, BRANZ – an independent research organisation, which aims to improve the performance of the New Zealand building system by applying an impartial evidence-based method, summarises the climate change implications for buildings in their report (see Fig 6) (MacGregor et al., 2018). The finding broadly supports the work of Camilleri et al. (2001) in terms of the significance of impacts, in which the change in temperatures and increasingly intense weather events are likely to be the most significant factors. Besides that, changes in precipitation patterns, and thermal expansion of oceans and changes in the cryosphere are also the probable scale of the adverse influence.
To date, the Climate Change Adaptation Technical Working Group has prepared a report called “Adapting to Climate Change in New Zealand”. In this report, the projected climate change impacts on New Zealand over the medium and long term are summarised and the current

240
Climate change adaptation in New Zealand’s building sector
adaptation actions are investigated. Although these climate-related influences have been determined, which include the influences on the natural environment, the built environment, economy, society, and culture, the influences on specific sectors such as the building sector have not been considered. There is a strong possibility that it is addressed in the national climate change risk assessment report, which has been released in the middle of 2020 according to the Ministry for Environment. A detailed risk assessment for the built environment revealed that risks to buildings due to extreme weather events, drought, increased fire weather on on-going sea level rise and these risks were ranked as most significant risks with 90 scored in terms of urgency (Ministry of the Environment, 2020).
Table 1: Climate change implications for New Zealand’s buildings (MacGregor et al., 2018)
Potential direct climate change impacts
Consequences for the built environment Possible scale of the negative impact
Change in temperature Increased overheating conditioning load
and air- High
Intensified urban heat island effect High Decreased winter space heating Low Decreased water heating energy Low
Increased intense weather events Damage to buildings and infrastructure High Changes in precipitation patterns Increased inland flooding High
Increased erosion, landslides and rockfalls High Changes in aquifers and urban water supply and quality
High
Heavier snow or ice loads Medium Increased fire risk associated with more frequent droughts
Medium
Damage to foundations, underground pipes and cables
Medium
Increased subsidence (clay soils) Medium Increased pressure on urban drainage system and run-off
Medium
Increased stormwater run-off and leaching of pollutants into waterways or aquifers
Low
Thermal expansion of oceans and changes in the cryosphere (ice systems) such as retreating snow lines and ice packs, and melting glaciers
Increased coastal flooding High Increased erosion and loss of land High Relocation or displacement from coastal areas
High
Changes in water tables and possible increased salinity of aquifers and estuaries
High
Loss of intertidal areas acting as buffer zones
High
Impeded drainage Medium Changes in wind patterns and intensities
Changes in wind loading on buildings Medium
Increased air pollution Impacts on interior air quality Medium management
Damage to buildings facades Low Impacts on biodiversity Changes in cooling, shading and
evapotranspiration benefits from urban biodiversity
Medium
Changes to stormwater management Low

241
Thao Thi Phuong Bui, Suzanne Wilkinson, Niluka Domingo
3.2. Climate change adaptation at the city level
As demonstrated by (Murphy, 2017), Auckland City Council has attempted to slow down the urban sprawl effects by implementing modern schemes that benefit higher density developments. An example of such schemes includes the Auckland Unitary Plan (AUP) – Auckland’s urban density strategy. Nevertheless, coastal residents, who live in lowlands or erosion-prone neighbourhoods, are likely to be exposed to flooding because of the insufficient awareness of a considerable “managed retreat”. As a result, there is a need for the additional impetus for a farsighted approach to coastal replacement, which addresses the housing sector within Auckland city as well as other areas at risk. To improve the feasibility of housing retreat, one of the best plans could be developing new design-attractive replacement homes or investigating advanced building technology and state-of-the-art construction materials (e.g. avoiding concrete slabs).
Figure 2: Sea level height comparison: Existing Legacy District Scheme and AUP (Murphy, 2017)
Comparing with Auckland City Council, Wellington City Council employs general strategies for addressing climate change risks such as sea-level rise risk assessment and flood risk management (Lawrence et al., 2015; Lawrence and Haasnoot, 2017). These approaches concentrate on the tactical scenario-based evaluation of the consequences of several sea levels regarding values and the costs of responses. However, particular adaptation plans for the building sector have not been identified in these approaches.

242
Climate change adaptation in New Zealand’s building sector
3.3. Climate change adaptation at neighbourhood level
Climate change adaptation strategies of New Zealand’s local government were first examined in the study of Lawrence et al. (2015). In this study, the authors evaluate climate change adaptation plans of Tasman District Council and Kapiti Coast District Council as case studies practice regarding flood risk assessment and coastal hazard management. Concerning the building sector, Tasman District Council introduces land-use and building controls, compared with Kapiti Coast District Council, which may impose stricter procedures to higher-risk regions. For example, “no- build” seaward of 50-year line with existing buildings restricted to the current footprint and floor area; “relocatable” buildings between 50- and the 100-year line” (Lawrence et al., 2015).
The evidence of community engagement in climate change actions can be seen in the case of Common Unity Project Aotearoa (CUPA) – a community project supported by Lower Hutt Council, Wellington (Simon et al., 2020). The project refers to a registered charitable trust, which launched in 2012, intending to increase sustainability and demonstrate characteristics of both climate change mitigation and adaptation. As far as the building sector is concerned, the key aspects can be listed as follows: controlling land use, requiring minimum floor levels for buildings, limiting new developments, identifying, and managing risks, implementing large-scale hard engineering solutions such as stop banks, and adopting flood control regulations. Whilst local government actions might be limited to the law-making requirements mentioned above, it is important to bear in mind the community-led strategy, which is an effective approach to address climate change mitigation and adaptation (Lawrence et al., 2015). Particularly in the circumstances that the strategic protections, including hard engineering solutions, cannot defend completely natural hazards, in the light of climate change uncertainties and the limitation of engineering design standards (Manning et al., 2015; Lawrence et al., 2019).
3.4. Climate change at the individual building level
In broad terms, addressing design for an individual building itself or the built environment sector, in general, can be seen as a variation of climate action (Russell et al., 2014). Much of the current literature pays particular attention to climate change mitigation at the individual building level. To date, Chandrakumar et al. (2020) devise a science-based method, which set up the climate targets for New Zealand’s detached houses using a whole life cycle assessment. The most striking result is that New Zealand’s detached housing sector would be required to reduce by no less than five times current GHG emissions to meet the 2oC Paris climate target. But Ghose et al. (2020) are much more concerned with the possible environmental impacts related to retrofitting energy efficiency of New Zealand’s pre-existing office building stock. Combining the life cycle assessment approach and stock aggregation modelling, this study emphasises that the office-building sector can achieve New Zealand’s climate change target by 2050 with the capacity to decrease 40–98 % CO2 eq. emissions.
Early examples of research into climate change adaptation on an individual building level include a BRANZ study report, conducted by Jaques and Sheridan (2006). Climate change problems with New Zealand’s domestic buildings are present in this report. In addition, reporters also suggest potential mitigation and adaptation approaches to address these issues in the design stage. For example, climate-associated adaptation actions regarding intense rainfall, intense wind, and flooding, are proposed to support construction practitioners to improve climate

243
Thao Thi Phuong Bui, Suzanne Wilkinson, Niluka Domingo
change preparedness while developing and delivering new dwellings. However, there are still many unanswered questions about how climate change mitigation and adaptation criteria can be integrated in the design process.
4. Discussion
According to the literature, recommendations towards climate change adaptation for the New Zealand’s building sector are defined. Before proceeding to examine the climate change actions, it is important to identify potential climate change risks for New Zealand’s buildings. To date, there are 25 potential direct climate change impacts on building, categorised into 7 main groups. These include change in temperatures, increased intense weather events, changes in precipitation patterns, thermal expansion of oceans and changes in cryosphere, changes in wind patterns and intensities, increased air pollution, impacts on biodiversity. Among them, the change in temperatures and increasingly intense weather events are likely to be the most significant factors (Camilleri et al., 2001; MacGregor et al., 2018; Ministry of the Environment, 2020) .
Climate change adaptation actions are occurring predominantly at a city and neighbourhood level rather than the individual building level. A number of initiatives are under way at the community, local government, and central government levels to progress adaptation for buildings and broader settlements. At the city level, there still exists extensive challenges to the local and national government and little attention has been paid to the housing retrofit strategies in the low-lying regions as an alternative to replacement. Additionally, it was suggested that new design-attractive replacement homes or investigating advanced building technology and state-of- the-art construction materials should be developed to improve the feasibility of housing retreat (Murphy, 2017). At the neighbourhood level, various strategies were implemented to limit the development and reconstruction of buildings in zones exposed to coastal hazards. However, these methods are likely to restrict more adaptive and resilient practices over time such as adaptive building designs, since the risks may change and affect other areas (Lawrence et al., 2015). Thus, more practical actions focusing on adaptive building designs should be considered, which can be particularly addressed in building regulations. Moreover, there is a demand for a greater level of community engagement on effective responses to a changing climate. This engagement, therefore, may support to accomplish some collective grasp of potential actions.
Given all that has been mentioned so far, much of the previous climate change research at the building level has been relevant to mitigation actions. There is a lack of research with respect to managing risks and adapting to climate change, which should be considered in order to create an integrated and adaptive process for building resilience and sustainability. For that reason, along with considering the reduction of GHGs, there is a need for integrating adaptive building designs such as alternative designs that combine the concept of climate change mitigation and adaptation, as one of the aspects of sustainable buildings. It is also recommended that more climate change adaptation actions needed require not only an urgent, joined-up and effective response across all levels of government but also industry engagement. There is abundant room for further progress in determining the willingness, capacity, and actions of the construction practitioners in adapting to climate change.

244
Climate change adaptation in New Zealand’s building sector
5. ConclusionIt is believed that the building sector can mitigate the impacts of climate change. This is certainly true in the case of building energy consumption. Energy efficiency strategy for buildings can help to significantly achieve the target of reducing greenhouse gas emissions and raw material extraction. Nonetheless, climate change also has implications for buildings such as the influences on building structures, buildings construction, building materials, and indoor environment. There is a relatively small body of literature that is concerned with climate change adaptation for buildings whereas climate change mitigation has been largely focused. This study sets out to the potential climate-related factors in New Zealand as well as investigate how the building sector currently adapts to a changing climate. The most significant factors are the change in temperatures and increasingly intense weather events. The research has also shown that climate change adaptation in the building sector is occurring predominantly at a city and neighbourhood level rather than the individual building level. It is argued that climate change mitigation and adaptation assessment during the planning and implementation processes of building projects is required, as a better solution to tackle climate change risk. As a building’s life cycle is about 50 years or more, construction specialists are required to design new buildings, which have alternative features to be able to perform effectively in the contemporary and future climate. The burden of greenhouse gas emissions and the building vulnerability to climate, then, would be reduced. Considerably more work will need to be done to determine the practical actions taken by the building sector, from both construction businesses and end-user’s perspectives to both minimise climate change effects and reduce greenhouse gas emission.
5. ReferencesAndrić, I., Koc, M. and Al-Ghamdi, S. G. (2019) A review of climate change implications for built environment:
Impacts, mitigation measures and associated challenges in developed and developing countries, Journal of Cleaner Production, 211, 83-102.
Berrang-Ford, L., Ford, J. D. and Paterson, J. (2011) Are we adapting to climate change?, Global Environmental Change, 21(1), 25-33.
Berrang-Ford, L., Pearce, T. and Ford, J. D. (2015) Systematic review approaches for climate change adaptation research, Regional Environmental Change, 15(5), 755-769.
Camilleri, M., Jaques, R. and Isaacs, N. (2001) Impacts of climate change on building performance in New Zealand, Building Research and Information, 29(6), 440-450.
Chalmers, P. (2014) Climate Change: Implications for Buildings - Key Findings from the Intergovernmental Panel on Climate Change Fifth Assessment Report, ed., University of Cambridge, Buildings Performance Institute Europe, Global Buildings Performance Network, World Business Council for Sustainable Development, Cambridge.
Chandrakumar, C., McLaren, S. J., Dowdell, D. and Jaques, R. (2020) A science-based approach to setting climate targets for buildings: The case of a New Zealand detached house, Building and Environment, 169.
Dang, H. H., Michaelowa, A. and Tuan, D. D. (2003) Synergy of adaptation and mitigation strategies in the context of sustainable development: the case of Vietnam, Climate Policy, 3(Supplement 1), S81-S96.
Ghose, A., McLaren, S. J. and Dowdell, D. (2020) Upgrading New Zealand's existing office buildings – An assessment of life cycle impacts and its influence on 2050 climate change mitigation target, Sustainable Cities and Society, 57.

245
Thao Thi Phuong Bui, Suzanne Wilkinson, Niluka Domingo
Gregório, V., Simões, S. and Seixas, J. (2016) Trade-Offs Between Climate Change Adaptation and Mitigation Options for Resilient Cities: Thermal Comfort in Households, Climate Change Management, 113-129.
IPCC (2014) Climate Change 2014: Synthesis Report. Contribution of Working Groups I, II and III to the Fifth Assessment Report of the Intergovernmental Panel on Climate Change, ed., IPCC, Geneva, Switzerland.
Jaques, R. and Sheridan, A. (2006) Towards Carbon-Neutral and Climate-Adapted Domestic Buildings - Background Document,BRANZ Study Report. Laukkonen, J., Blanco, P. K., Lenhart, J., Keiner, M., Cavric, B. and Kinuthia-Njenga, C. (2009) Combining
climate change adaptation and mitigation measures at the local level, Habitat International, 33(3), 287- 292.
Lawrence, J., Bell, R. and Stroombergen, A. (2019) A hybrid process to address uncertainty and changing climate risk in coastal areas using Dynamic adaptive pathways planning, multi-criteria decision analysis & Real options analysis: A New Zealand application, Sustainability (Switzerland), 11(2).
Lawrence, J. and Haasnoot, M. (2017) What it took to catalyse uptake of dynamic adaptive pathways planning to address climate change uncertainty, Environmental Science & Policy, 68, 47-57.
Lawrence, J., Sullivan, F., Lash, A., Ide, G., Cameron, C. and McGlinchey, L. (2015) Adapting to changing climate risk by local government in New Zealand: institutional practice barriers and enablers, Local Environment, 20(3), 298-320.
Locatelli, B., Fedele, G., Fayolle, V. and Baglee, A. (2016) Synergies between adaptation and mitigation in climate change finance, International Journal of Climate Change Strategies and Management, 8(1), 112- 128.
MacGregor, C., Dowdell, D., Jaques, R., Bint, L. and Berg, B. (2018) The built environment and climate change: A review of research, challenges and the future.
Mancini, F. and Basso, G. L. (2020) How climate change affects the building energy consumptions due to cooling, heating, and electricity demands of Italian residential sector, Energies, 13(2).
Manning, M., Lawrence, J., King, D. N. and Chapman, R. (2015) Dealing with changing risks: a New Zealand perspective on climate change adaptation, Regional Environmental Change, 15(4), 581.
Ministry of the Environment (2020) First national climate change risk assessment for New Zealand: Identifying risk priorities. Available from: Ministry of the Environment <https://www.mfe.govt.nz/climate-change/assessing-climate-change-risk> (accessed March 19th).
Murphy, C. (2017) Natural Hazards, Sea Level Rise and the New Auckland Unitary Plan: Implications for Low Lying Coastal Communities, Journal of Architectural Engineering Technology, 6(2), 210.
Russell, S. L., Greenaway, A., Carswell, F. and Weaver, S. (2014) Moving beyond "mitigation and adaptation": examining climate change responses in New Zealand, Local Environment, 19(7), 767-785.
Simon, K., Diprose, G. and Thomas, A. C. (2020) Community-led initiatives for climate adaptation and mitigation, Kotuitui, 15(1), 93-105.
Smith, P. F. (2010) Building for a changing climate : the challenge for construction, planning and energy, ed., Earthscan.
Swart, R. and Raes, F. (2007) Making Integration of Adaptation and Mitigation Work: Mainstreaming into Sustainable Development Policies?, Climate Policy, 7(4), 288-303.
Wilby, R. L. (2007) A Review of Climate Change Impacts on the Built Environment, Built Environment, 33(1), 31.
Wilde, D. P. and Coley, D. (2012) The implications of a changing climate for buildings, Building and Environment, 55, 1-7.

246
The 54th International Conference of the Architectural Science Association (ANZAScA) 2020
Comparative Energetic and Economic Analysis of anaerobic digestion of organic and farm animal waste for regional digesters
in Tasmania.
Murray Herron 1,2, Mark Dewsbury2, David Beynon 3, David S Jones1 1Live Smart Lab, Deakin University, Geelong, Victoria
2,3 University of Tasmania, Launceston, Australia
Abstract: The goal of this research is to increase awareness of various benefits of using animal manure and food wastes as Anaerobic Digestion (AD) inputs to produce renewable energy in regional areas of Tasmania. The results of this research will provide useful guidance to policy makers, the public, energy investors, Concentrated Animal Feeding Operations (CAFO owners), food waste generators, and businesses that are specialized in Anaerobic Digestion (AD applications). The analysis and tools developed will allow waste planners, haulers, entrepreneurs, and others to obtain many combinations of information about commercially generated organic wastes in Tasmania. This will facilitate decisions about how to best target wastes for collection, which generators to target, how to structure collection routes and infrastructure, and where to site AD systems. This paper outlines: the development of geo- spatial database to identify and locate concentrated organic waste resources in Tasmania; the design and development of a software tool to help quantify the production of food waste (especially food processing waste / municipal organic waste), and The development of an economic model to simulate the costs and benefits of on-farm co-digestion systems and or specific built facilities.
Keywords: GIS Data, anaerobic digestion; organic waste; animal waste; Tasmania.
1. Introduction
Effectively managing our waste contributes positive benefits to our economy, society, and environment. The Australian Bureau of Statistics (ABS) estimates that the supply of waste management services in Australia in 2009–10 was worth $9.5 billion (ABS 2013). Given that Tasmania contributes 2% to Australia's gross domestic product, the Northern Tasmanian Waste Management Group (NTWMG) estimates that waste services and waste products contribute $190 million and $90 million respectively to Tasmania's economy (ABS 2013; Tasmania 2015).
Anaerobic digestion is the natural process in which microorganisms break down organic matter in the absence of air (an anaerobic environment). Anaerobic digestion creates usable products such as biogas and digested material (US EPA 2020). Anerobic digestor-generated Biogas is a renewable energy source. It is produced from natural resources that are replenished in short periods of time. Biogas can replace fossil fuels to produce heat, power, and fuel. With additional processing, biogas becomes renewable natural gas, that can be used in the same place as fossil fuels (US EPA 2020). Biogas is made up of methane and carbon dioxide, which are powerful greenhouse gases. Anaerobic digesters are designed
Imaginable Futures: Design Thinking, and the Scientific Method. 54th International Conference of the Architectural Science Association 2020, Ali Ghaffarianhoseini, et al (eds), pp. 246–255. © 2020 and published by the Architectural Science Association (ANZAScA).

247
Murray Herron, Mark Dewsbury, David Beynon, and David S Jones
to capture these gases, so they do not escape to the atmosphere. In most cases, the feedstocks used in digesters would have released methane directly as they decomposed in lagoons or landfills
2. Literature Review The economics and feasibility of waste management and waste-to-energy from the international perspective, has been explored by various researchers including (GFEA 2008, Jamasb 2008, Schneider 2010, Rodríguez 2011, Danish Energy Agency 2012, Qiu 2012, Funk 2013, BES 2014, eFinancial models 2017, ecoprog 2018). The concept of waste profiles and municipal solid waste management was the focus of research by Cox (2015), EC (2012), GHD (2009), Gutberlet (2009), Al-Khatib (2010), EC (2011), Berg (2012), EC (2012), ISWA (2013), EUJCIC (2015), Deshmukh (2016), Bernard (2017), Behrsin (2018) and Kaufman (2008).
Several studies have specifically looked at the role anaerobic technologies can play in the provision of renewable energy. The majority of academic research on anaerobic digesters is currently being generated in either Europe or North America. Land Grant Universities in the United States, such as Cornell, Washington State and Minnesota, have developed programs or research institutes totally focused on the generation of bio-gas and renewable energy generated through anerobic digestion. In Canada, the University of Calgary and Guelph University, Ontario, have been the research hubs. In Australia, research about anaerobic digestion and its potential role in providing renewable energy lags behind both Europe and North America. To date, research in Australia has focussed on the Economics of Waste to Energy (Anning 2018, SA 2005a, SA 2005b) and the Feasibility of Waste to Energy (BE 2011a, BE 2011b, KSES 2016, BE 2017, AREA 2018, Douglas 2018, Phoenix Energy 2018). In Victoria, limited environmental and feasibility considerations have been examined by (EPA Victoria 2013, EPA Victoria 2017, EPA Victoria 2018, Walden 2018). Additionally, Waste to Energy Plant Designs have been reviewed and commented upon by Kitto (2016), EPA Victoria (2018), and WSP Environmental Ltd (2013).
To establish types and sources of wastes, waste profiles of Municipal solid waste management reviews, research and published reports have been completed by BDA Group (2009), BE (2011, 2013, 2016, 2018), NSW EPA (2016), EPA Victoria (2008a, 2008b, 2015, 2016) and SA (2005).
The anaerobic digestion process occurs when microorganisms break down organic matter, such as animal manure and food wastes, in the absence of oxygen. Anaerobic digestion for biogas production takes place in a sealed vessel called a reactor, which is designed and constructed in various shapes and sizes specific to the site and waste feedstock conditions. The waste to energy processes are illustrated below in Figure 1.

248
Comparative Energetic and Economic Analysis of anaerobic digestion of organic and farm animal waste for regional digesters in Tasmania.
Figure 1: Diagram of Waste to Energy Process. (Source: ONERGYS, 2020).
3. Study Area The Northern Tasmanian Waste Management Group (NTWMG) was formed in 2007 and its members include seven councils from northern Tasmania: Break O’Day, Dorset, George Town, Launceston, Meander Valley, Northern Midlands, and West Tamar. The group’s area is shown in Figure 2 below. The current population of the NTWMG area is 155,600, which includes approximately 73,599 households (iD Consulting 2020). The role of the NTWMG is to provide advice, funding and education on better managing waste and recycling within northern Tasmanian communities, businesses, and local governments.
Left: Figure 2: NTWMG Coverage Area. (Source: ecSustainability 2018).
Right: Figure 3: How CommunityViz Works. (Source: Walker 2011).

249
Murray Herron, Mark Dewsbury, David Beynon, and David S Jones
3. Methodology To better understand the future residential, commercial and industrial growth patterns in the greater Launceston area and their corresponding impacts on the Launceston environment a residential, commercial and industrial buildout was undertaken. A Build-Out projected the number, location and appearance of buildings based on land use or zoning information. The buildout analysis was performed using CommunityViz, a GIS planning and simulation software package. The software allows you to set density assumptions in dwelling units per acre (the software is based upon US acres, but data can be easily calibrated to ha), minimum lot size or floor area ratio. While there are default values, users can also assign design assumptions, including layout efficiency, building offsets, development constraints, layout pattern and building type. The results of Build-out include indicator charts summarizing building counts or impacts, point shape files depicting building locations with attributes, and real time visualizations of the buildings in context with the community.
To develop economic, demographic and planning scenarios the CommunityViz software performs four functions including: the estimation, amount and location of new development allowed in an area according to current or proposed zoning regulations; the suitability of the new development to an area; the allocation of where growth is most likely to occur over a specific time span, and finally, the development of a series of environmental indicators showing the impact of the new development on the landscape (Walker 2011). This process is shown in Figure 4. The buildout analysis showed the residential, industrial, and commercial potential from 2016 through 2050.
The buildout indicators developed show the future impacts including: • Annual CO Auto Emissions • Annual CO2 Auto Emissions • Annual Hydrocarbon Auto Emissions • Annual NOx Auto Emissions • Solid Waste Generation
• Residential Energy Usage • Residential Water Usage • Residential Dwelling Units • School Children
To better understand the Launceston municipal waste profile three new waste indicators were developed. The indicators were for municipal solid waste, organic waste and recyclable waste. The composition of municipal solid waste varies greatly from municipality to municipality, and it changes significantly with time. In municipalities which have a well-developed waste recycling system, the municipal solid waste stream mainly consists of intractable wastes such as plastic film and non- recyclable packaging materials. Organic waste consists of biodegradable waste: food and kitchen waste, green waste, paper. Most can be recycled, although some plant material is difficult to compost. Recyclable waste consists of recyclable materials: paper, cardboard, glass, bottles, jars, tin cans, aluminium cans, aluminium foil, metals, certain plastics, textiles, clothing, tires, batter ies, etc. The three new indicators; municipal solid waste, organics waste and recyclable waste, were further segmented into daily, weekly, monthly and yearly results. Initial benchmark data used for the Launceston Waste GIS came from the Tasmanian government List data open data website. The greater Launceston waste profile and bin audit was developed by ecSustainability of Sydney. The bin audit included a visual bin survey and a physical audit of the municipal waste stream. There are other forms of waste that could have been mapped and analysed. They include: • Commercial waste, which consists of waste from premises used mainly for the purposes of a trade
or business or for the purpose of sport, recreation, education or entertainment, but excluding

250
Comparative Energetic and Economic Analysis of anaerobic digestion of organic and farm animal waste for regional digesters in Tasmania.
household, agricultural or industrial waste. • Industrial waste includes dirt and gravel, masonry concrete, scrap metal, oil, solvents, chemicals,
scrap lumber, even vegetable matter from restaurants. • Construction waste consists of unwanted material produced directly or incidentally by construction or industries.
4. Results Figure 5, below, from the residential bin audit, shows the number of households per local government area, the mean household waste generation per kilogram, per week, and an extrapolated yearly council wide waste figure. The residential waste profile for each of the seven councils that form the NTWMG was segmented by volume per week and per household. The segmentation took the form of eight classes of waste (i.e., paper, organic, glass, plastic, metal, hazardous, building waste and other). Figures 6 and 7 below, show the residual waste stream composition by volume for each of the seven councils. The waste profile results were further segmented into recovered and unrecovered resources, as shown below in Figure 8 and Figure 9.
Figure 5: Waste generation across the NTWMG region. (Source: ecSustainability 2018). Figure 6: Residual waste stream composition in the NTWMG. (Source: ecSustainability 2018).

251
Murray Herron, Mark Dewsbury, David Beynon, and David S Jones
Figure 7: Residual waste stream composition for the seven councils in the NTWMG (Source: ecSustainability 2018).
Figure 8: Residential waste unrecovered for the seven NTWMG Councils – Part 1 (Source: ecSustainability 2018).

252
Comparative Energetic and Economic Analysis of anaerobic digestion of organic and farm animal waste for regional digesters in Tasmania.
Figure 9: Residential waste unrecovered for the seven NTWMG Councils – Part 2 (Source: ecSustainability 2018).
A sample of the GIS output is shown below in Figure 10. The Figure shows the weekly waste totals per
mesh block for existing buildings. Mesh Blocks are the smallest geographical area defined by the ABS (ABS) and form the building blocks for the larger regions of the Australian Statistical Geography Standard (ASGS). All other statistical areas or regions are built up from or, approximated by whole Mesh Blocks. They broadly identify land use, such as residential, commercial, primary production and parks, etc. (ABS 2019) Figure 9 shows the weekly municipal solid waste totals per mesh block. The totals range from 0 to 644 kgs of municipal solid waste per week for each mesh block.
Figure 11 shows the weekly waste for existing buildings with an overlay of proposed buildings from the Launceston build out (or simulation). The buildout provides an indication of future development and what impacts it will have on the current waste generation. Figure 11 also shows that the most likely future residential development that will occur to the south, east and north along the Tamar River boundary. The information shown in Figure 11 can be used to develop new waste collection routes, new recycling depots and new recycling programs. Additionally, the waste GIS can be used to monitor changing waste generation patterns andtrends.
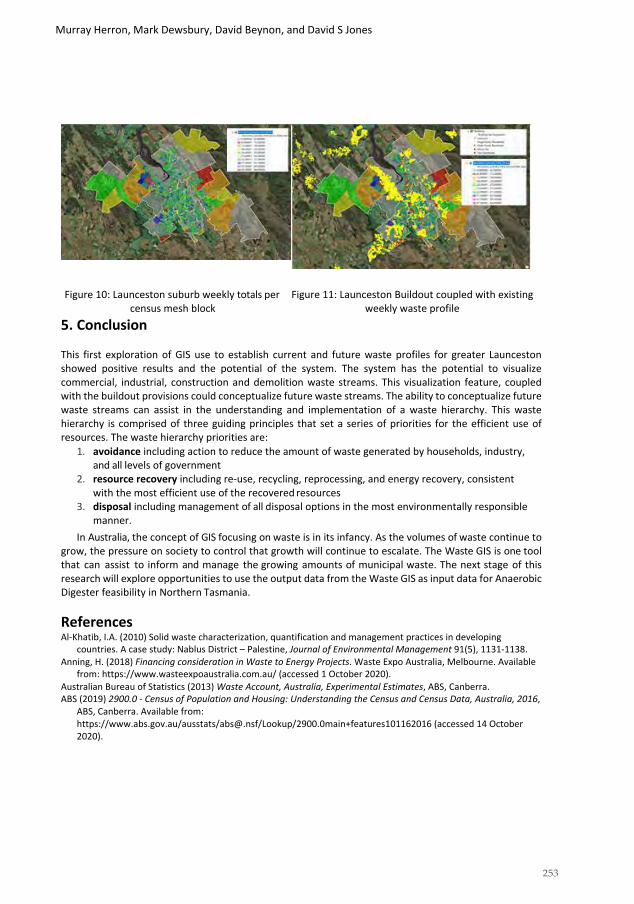
253
Murray Herron, Mark Dewsbury, David Beynon, and David S Jones
Figure 10: Launceston suburb weekly totals per
census mesh block
5. Conclusion
Figure 11: Launceston Buildout coupled with existing weekly waste profile
This first exploration of GIS use to establish current and future waste profiles for greater Launceston showed positive results and the potential of the system. The system has the potential to visualize commercial, industrial, construction and demolition waste streams. This visualization feature, coupled with the buildout provisions could conceptualize future waste streams. The ability to conceptualize future waste streams can assist in the understanding and implementation of a waste hierarchy. This waste hierarchy is comprised of three guiding principles that set a series of priorities for the efficient use of resources. The waste hierarchy priorities are:
1. avoidance including action to reduce the amount of waste generated by households, industry, and all levels of government
2. resource recovery including re-use, recycling, reprocessing, and energy recovery, consistent with the most efficient use of the recovered resources
3. disposal including management of all disposal options in the most environmentally responsible manner.
In Australia, the concept of GIS focusing on waste is in its infancy. As the volumes of waste continue to grow, the pressure on society to control that growth will continue to escalate. The Waste GIS is one tool that can assist to inform and manage the growing amounts of municipal waste. The next stage of this research will explore opportunities to use the output data from the Waste GIS as input data for Anaerobic Digester feasibility in Northern Tasmania.
References Al-Khatib, I.A. (2010) Solid waste characterization, quantification and management practices in developing
countries. A case study: Nablus District – Palestine, Journal of Environmental Management 91(5), 1131-1138. Anning, H. (2018) Financing consideration in Waste to Energy Projects. Waste Expo Australia, Melbourne. Available
from: https://www.wasteexpoaustralia.com.au/ (accessed 1 October 2020). Australian Bureau of Statistics (2013) Waste Account, Australia, Experimental Estimates, ABS, Canberra. ABS (2019) 2900.0 - Census of Population and Housing: Understanding the Census and Census Data, Australia, 2016,
ABS, Canberra. Available from: https://www.abs.gov.au/ausstats/[email protected]/Lookup/2900.0main+features101162016 (accessed 14 October 2020).

254
Comparative Energetic and Economic Analysis of anaerobic digestion of organic and farm animal waste for regional digesters in Tasmania.
Australian Renewable Energy Agency (AREA) (2018) Bioenergy and Energy from Waste opportunities in Australia. Waste Expo Australia, Melbourne. Available from: https://www.wasteexpoaustralia.com.au/ (accessed 1 October 2020).
BDA Group (2009) The full cost of landfill disposal in Australia, BDA Group, Manuka ACT Behrsin, I. (2018) Dirty, Clean, Power: Constructing and Contesting Waste as a Renewable Energy Source in the
European Union, unpublished PhD thesis, University of California, Davis. Belkorp Environmental Services (BES) (2014) Economic Analysis of New Waste-to-Energy Facility in Metro
Vancouver, BES, Vancouver. Berg, N. (2012) With urbanization comes mountains of trash, Bloomberg CityLab. Available from:
www.citylab.com/life/2012/06urbanization-comes-mountains- trash/2273 (accessed 14 October 2020). Bernard, K. (2017) Urban Population Growth and Municipal Solid Waste: Scenario Planning for Waste Generation
and Forecasting and Management, unpublished MUrbPlan thesis, Alabama A & M University, Huntsville. Blue Environment Pty Ltd (BE) (2011a) Introduction to the Waste Generation and Resource Recovery in Australia
database, Blue Environment Pty Ltd, Sydney. BE (2011b) Waste generation and resource recovery in Australia Reporting Period 2010/11, Department of
Sustainability, Environment, Water, Population and Communities, Melbourne. BE (2016) Australian National Waste Report 2016, Department of Sustainability, Environment, Water, Population
and Communities, Melbourne. BE (2018) Introduction to the National Waste Reporting Tool, Department of Sustainability, Environment, Water,
Population and Communities, Melbourne. BE (2013) Analysis of landfill survey data, Department of Sustainability, Environment, Water, Population and
Communities, Melbourne. BE (2017) Energy-from-waste micropower station network - proof of concept, Department of Sustainability,
Environment, Water, Population and Communities, Melbourne. Cox, J.A. (2015) The Sustainable Management of Household Waste – A Decision-Making Framework, unpublished
PhD thesis, University of Surrey, Guilford, UK. Danish Energy Agency (2012) EA Energy Analyses: Copenhagen, Danish Energy Agency, København. Deshmukh, R. (2016) India's Low Carbon Electricity Futures, unpublished PhD thesis, University of California,
Berkeley. Douglas, A. (2018) The Kwinana Waste to Energy Project, Waste Expo Australia, Melbourne. Available from:
https://www.wasteexpoaustralia.com.au/ (accessed 1 October 2020). Ecoprog (2018) Waste to Energy 2018/2019, Ecoprog. Available from:
https://www.ecoprog.com/fileadmin/user_upload/leseproben/extract_market_report_WtE_2018- 2019_ecoprog.pdf . (accessed 1 October 2020).
ecSustainability (2018) Appendix3-BSWWRRG_Kerbside_Bin_Audit_Raw_Data_2018_Consolidated_210818, ecSustainability, Sydney.
eFinancial Models (2017) Waste to Energy financial Template model, efinancialmodels. Available from: www.efinancialmodels.com (accessed 1 October 2020).
EPA Victoria (2008a) The future of hazardous waste management in Victoria, EPA Victoria, Melbourne. EPA Victoria (2008b) Hazwaste Fund Framework. EPA Victoria, Melbourne. EPA Victoria (2013) Energy from waste. EPA Victoria, Melbourne. EPA Victoria (2015) Siting, design, operation and rehabilitation of landfills, Publication 788.3, EPA Victoria, Melb. EPA Victoria (2016) Calculating the landfill levy and recycling rebates, Publication 332.7, EPA Victoria, Melbourne. EPA Victoria (2017) Guideline: Energy from waste. Melbourne, EPA Victoria. EPA Victoria (2018) Australian Paper waste to energy works approval decision, Publication 1717, EPA Victoria, Melb. EPA Victoria (2018) A review of the scientific literature on potential health effects in local communities associated
with air emissions from Waste to Energy facilities, Publication 1718, EPA Victoria, Melbourne. EU-Japan Centre for Industrial Cooperation (EUJCIC) (2015) Waste Management and Recycling in Japan Opportunities
for European Companies (SMEs focus), EUJCIC, Tokyo. European Commission (EC) (2011) BiWaRE-Biomass and Waste for Renewable Energy, EC, Brussels.

255
Murray Herron, Mark Dewsbury, David Beynon, and David S Jones
EC (2012) Preparing a Waste Management Plan: A methodological guidance note, EC, Munich. Funk, K. (2013) Waste Not, Want Not: Analyzing the Economic and Environmental Viability of Waste-to-Energy
(WTE) Technology for Site- Specific Optimization of Renewable Energy Options, National Renewable Energy Laboratory, Washington DC.
German Federal Environment Agency (GFEA) (2008) Waste Incineration and Waste Prevention: Not a Contradiction in Terms, GFEA, Dessau.
GHD (2009) Waste Technology and Innovation Study Final Report, Department of the Environment, Water, Heritage & the Arts, Canberra.
Gutberlet, J. (2009) Cities, consumption and the generation of waste, University of Victoria, Victoria BC. iD Consulting (2020) Northern Tasmania Region Population and Dwellings, iD Consulting. Available from
https://profile.id.com.au/northern-tasmania/population (accessed 1 October 2020). International Solid Waste Association (ISWA) (2013) Alternative Waste Conversion Technologies, ISWA, Vienna, 34. Jamasb, T. (2008) Hot Issue and Burning Options in Waste Management: A Social Cost Benefit Analysis of Waste-to-
Energy in the UK, Cambridge, UK. Kaufman, S.M. (2008) A New Screening Metric to Benchmark the Sustainability of Municipal Solid Waste
Management Systems, unpublished PhD thesis, Columbia University, New York. Keppel Seghers Engineering Singapore (KSES) (2016) Waste-To-Energy Plants – Public Private Partnership Singapore,
KSES, Singapore. Kitto, J.B. (2016) World-Class Technology for the Newest Waste-to-Energy Plant in the United States — Palm Beach
Renewable Energy Facility No. 2. Renewable Energy World International, Babcock & Wilcox Co, Orlando, Florida, New South Wales Environmental Protection Agency (NSW EPA) (2016) Household waste and recycling research
report, NSW EPA, Sydney. ONERGYS (2020) Onergy’s Parts for a Bio gas plant, Geldern, Germany. Phoenix Energy (2018) The Kwinana Waste to Energy Project, Waste Expo Australia, Melbourne. Available
from: https://www.wasteexpoaustralia.com.au/ (accessed 1 October 2020). Qiu, L. (2012) Part I: Analysis of the Economics of Waste-to-Energy Plants in China - Part II: MSW Sorting Models In
China and Potential for Improvement, unpublished MSc thesis, Columbia University, New York. Rodríguez, M.E.D.B. (2011) Cost-Benefit Analysis of a Waste to Energy Plant for Montevideo; and Waste to Energy in
Small Islands, unpublished MSc thesis, Columbia University, New York. Schneider, D.R. (2010) Cost Analysis of Waste-to-Energy Plant, Strojarstvo: časopis za teoriju i praksu u strojarstvu,
52(3): 369-378. South Australia (SA) (2005) South Australia’s Waste Strategy 2005-2010 Benefit Cost Assessment Volume 1:
Summary Report, SA, Adelaide. SA (2005a) Zero Waste SA Explanatory Paper Benefit–Cost Analysis of South Australia’s Waste Strategy 2005-2010,
SA, Adelaide. SA (2005b) South Australia’s Waste Strategy 2005-2010 Benefit Cost Assessment Volume 2: Technical Report, SA,
Adelaide. Tasmania (2015) State Accounts (ABS Cat No 5220.0) 2014–15, Department of Treasury and Finance, Hobart. US EPA (2020) Frequent Questions about Anaerobic Digestion, United States Environment Protection Agency.
Available from: https://www.epa.gov/anaerobic-digestion/frequent-questions- about-anaerobic-digestion (accessed 1 October 2020).
Walden, M. (2018) Bioenergy and Energy from Waste opportunities in Australia, Waste Expo Australia 2018, Melbourne. Available from: https://www.wasteexpoaustralia.com.au/ (accessed 1 October 2020).
Walker, D. (2011) CommunityViz: the essential tool for a new generation of planning, Planners Press, Chicago. WSP Environmental Limited (2013) Waste Technologies: Waste To Energy Facilities: A Report for the Strategic Waste
Infrastructure Planning (SWIP) Working Group, commissioned by the Government of Western Australia, Department of Environment and Conservation, WSP Environmental Limited, London.

256
The 54th International Conference of the Architectural Science Association (ANZAScA) 2020
Comparative study of the life cycle embodied greenhouse gas emissions of panelised prefabricated residential walling systems
in Australia
Soheila Ghafoor1 and Robert H. Crawford2 The University of Melbourne, Parkville, Australia
[email protected], [email protected]
Abstract: Residential buildings account for 17% of global greenhouse gas (GHG) emissions. With detached housing accounting for over 70% of all of Australia’s residential dwellings, and a projected doubling of population in the next 40 years, these houses represent a significant opportunity for GHG emissions reduction. Prefabrication can improve the environmental performance of buildings through lower resource input, reduction in waste and improved quality. However, little research exists on whether it reduces embodied GHG emissions, an increasingly significant proportion of a building’s life cycle GHG emissions. The aim of this study was to compare the embodied GHG emissions associated with the construction of detached residential housing in Australia using panelised prefabricated external wall systems. This study used a Path Exchange hybrid life cycle inventory approach to quantify the construction-related embodied GHG emissions of a typical detached house with three external wall assembly variations: cross laminated timber (CLT), structural insulated panels (SIPs) and prefabricated timber framed panels. Compared to conventional brick veneer construction, the prefabricated timber framed panel was the only one that lowered embodied GHG emissions (by 7%). The SIPs resulted in the highest embodied GHG emissions for the house (6% higher than the brick veneer option). The use of prefabrication may not always reduce GHG emissions associated with house construction. In reducing the initial embodied GHG emissions, while the construction process accounts for around 30% of these emissions, the key focus should be on selecting materials with low GHG emissions intensity.
Keywords: Panelised prefabrication; life cycle assessment; embodied greenhouse gas emissions; residential buildings.
1. Introduction Greenhouse gas (GHG) emissions have been, and contribute to be, one of the greatest contributors to the environmental effects associated with buildings, accounting for 39% of global energy-related GHG emissions (IEA and UNEP, 2018), while 17% of these emissions are associated with residential buildings (Nejat et al., 2015). This significant contribution along with population growth and increased demand for better living standards make energy consumption and the associated GHG emissions of residential
Design Thinking, and the Scientific Method. 54th International Conference of the Architectural Science Association 2020, Ali Ghaffarianhoseini, et al (eds), pp. 256–265. © 2020 and published by the Architectural Science Association (ANZAScA).

257
Soheila Ghafoor and Robert H. Crawford
buildings a serious ongoing issue which needs to be addressed properly to avoid further environmental damage (Pérez-Lombarda et al., 2008).
In Australia, several regulations such as the 6 Star Standard (BCA, 2019) for residential buildings attempt to address this issue. However, considering the population growth in Australia, which is predicted to increase to 48.3 million by 2061 (ABS, 2013) and an expanding housing industry focused on accommodating this target, strategies such as these that just focus on operational performance, although helpful, do not address the complete problem. The construction of buildings has been shown to contribute at least as much to building-related GHG emissions as their operation (Treloar et al., 2001). For this reason, it is critical to not only decrease the operational GHG emissions of residential buildings, but also to ensure minimal GHG emissions associated with their construction.
To date, in an attempt to improve the environmental performance of buildings, several strategies, methods, and technologies have been adopted. Prefabrication is one of these novel building methods that in recent years has gained more attention. Prefabrication can be defined as manufacturing the whole building unit or its major components, typically as modules or panels, in a controlled factory environment to be erected on site (Gibb, 1999). This is in contrast to traditional construction, in which basic materials like steel, timber, concrete, etc. are cast or assembled in-situ. It has been demonstrated that prefabrication can improve the environmental performance of buildings through lower resource input, reduction in waste and improved quality of the final product (Monahan and Powell, 2011; Li et al., 2014). However, little research exists on whether prefabrication reduces the construction-related GHG emissions of buildings. Several comparative analyses have been reported on the embodied emissions of different prefabricated building systems and their benefits compared to conventional methods (Mao et al., 2013; Dodoo et al., 2014; Hong et al., 2016). The results of these studies vary depending on the studied prefabricated system. Systems applicable to detached housing and their benefits are rarely studied, especially in the Australian context. Besides, almost all rely on a process analysis approach which can exclude up to 87% of the energy requirements and its associated GHG emissions (Crawford, 2008). Therefore, there is a need to investigate the potential of innovative prefabricated systems applicable to detached housing to reduce construction-related GHG emissions compared to conventional construction.
The aim of this study was to compare the construction-related embodied GHG emissions of detached residential housing in Australia using conventional construction and panelised prefabricated external wall systems. It is hoped that this would provide insight into whether panelised prefabricated walling systems are capable of reducing the construction-related GHG emissions of detached residential housing. Section 2 describes the case study house, selected external wall system scenarios and the approach used to quantify the embodied GHG emissions. Section 3 presents the results, which are discussed in Section 4.
2. Research approach This section describes the research approach used to quantify the construction-related GHG emissions of a case study house using a variety of panelised prefabricated walling systems. In order to evaluate the construction-related GHG emissions of prefabricated housing, this study focuses on the initial embodied GHG emissions, or module A1-A5 of EN 15978 (2011) (Figure 1). A typical detached dwelling was selected as a case study house (described in Section 2.1) and considered to be located in Melbourne, Australia, with three external wall assembly variations: cross-laminated timber (CLT), structural insulated panels (SIPs) and prefabricated timber framed panels (described in Section 2.2). The house’s original brick veneer construction was selected as the base case (BC) scenario, representing the main building material for external walls of detached residential buildings in Australia, accounting for 70% share of the residential

258
Comparative study of the life cycle embodied greenhouse gas emissions of panelised prefabricated residential walling systems in Australia
building stock (Beyond Zero Emissions, 2013). The alternative external wall systems were selected to be representative of emerging innovative timber-based panelised prefabricated wall systems suited to detached housing in Australia. The initial embodied GHG emissions of the alternative external wall systems were calculated and compared to that of the base case scenario as per Section 2.3.
Figure 1: System boundary for the life cycle GHG emissions analysis of the case study house. (Source: based on EN 15978, 2011)
2.1. Case study house
A standard 3-bedroom brick veneer house design was chosen as the case study house (Figure 2).
Figure 2: Floor plan of the case study house.
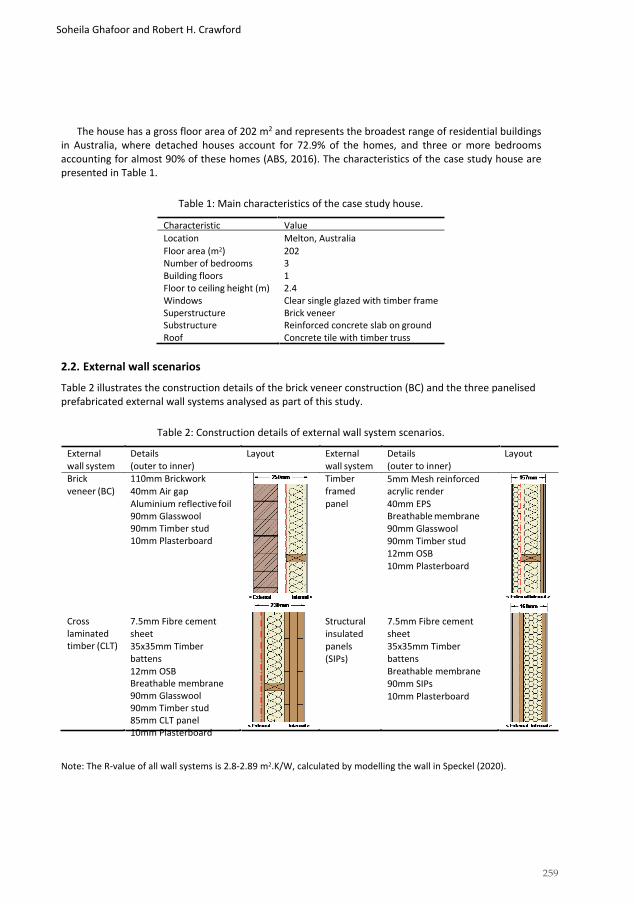
259
Soheila Ghafoor and Robert H. Crawford
The house has a gross floor area of 202 m2 and represents the broadest range of residential buildings in Australia, where detached houses account for 72.9% of the homes, and three or more bedrooms accounting for almost 90% of these homes (ABS, 2016). The characteristics of the case study house are presented in Table 1.
Table 1: Main characteristics of the case study house.
Characteristic Value Location Melton, Australia Floor area (m2) 202 Number of bedrooms 3 Building floors 1 Floor to ceiling height (m) 2.4 Windows Clear single glazed with timber frame Superstructure Brick veneer Substructure Reinforced concrete slab on ground Roof Concrete tile with timber truss
2.2. External wall scenarios
Table 2 illustrates the construction details of the brick veneer construction (BC) and the three panelised prefabricated external wall systems analysed as part of this study.
Table 2: Construction details of external wall system scenarios.
External wall system Brick veneer (BC)
Details (outer to inner) 110mm Brickwork 40mm Air gap Aluminium reflective foil 90mm Glasswool 90mm Timber stud 10mm Plasterboard
Layout External wall system Timber framed panel
Details (outer to inner) 5mm Mesh reinforced acrylic render 40mm EPS Breathable membrane 90mm Glasswool 90mm Timber stud 12mm OSB 10mm Plasterboard
Layout
Cross laminated timber (CLT)
7.5mm Fibre cement sheet 35x35mm Timber battens 12mm OSB Breathable membrane 90mm Glasswool 90mm Timber stud 85mm CLT panel 10mm Plasterboard
Structural insulated panels (SIPs)
7.5mm Fibre cement sheet 35x35mm Timber battens Breathable membrane 90mm SIPs 10mm Plasterboard
Note: The R-value of all wall systems is 2.8-2.89 m2.K/W, calculated by modelling the wall in Speckel (2020).

260
Comparative study of the life cycle embodied greenhouse gas emissions of panelised prefabricated residential walling systems in Australia
The design of the selected external wall systems is based on the common practices of companies designing and constructing these systems in Australia (Xlam, 2017; Impresa House, 2020; SIPS Industries, 2020) and to satisfy minimum regulatory requirements of a residential building in Melbourne, including a minimum external wall R-value of 2.8 m2.K/W (BCA, 2019). Finishes were selected to allow for direct comparison between scenarios. While there is variation in external wall width, the architectural details and other parameters of the case study house are identical across the four scenarios.
2.3. Quantifying initial embodied greenhouse gas emissions
The initial embodied GHG emissions are associated with the production and supply of goods and services through product and construction process stages. It includes GHG emissions associated with extraction, transportation and manufacturing of raw materials (product stage, module A1-A3), transportation of materials, components and equipment to the construction site, and the construction/installation process (construction process stage, module A4-A5). The following sections outline the quantification method of each of these stages.
2.3.1. Product stage (A1-A3)
The product stage GHG emissions of the case study house were quantified using the Path Exchange hybrid analysis technique described by Crawford et al. (2019). This technique combines process and environmentally-extended input-output data to produce comprehensive embodied flow coefficients for building materials, ensuring the entire supply chain of the material is covered, while including relevant and detailed process data. Using these coefficients, the embodied GHG emissions of the product stage was quantified as per Equation 1. Physical material quantities are determined for the entire house and for each external wall scenario. To account for the material wastage during the construction process, a wastage factor (Wm) was applied to the physical quantity of materials contained within the house. These factors are extracted from Crawford (2004) and CSIRO (2016). For the prefabricated components, the wastage factor was assumed to be 0.
Where: EGHGA1-A3 = Product stage (A1-A3) GHG emissions of the house materials (kgCO2-e); Qm = Quantity of the material m in the house; GHGCm = Hybrid GHG emission coefficient of material m (kgCO2-e per functional unit); Wm = Wastage factor for the material m.
2.3.2. Construction process stage (A4-A5)
The construction process stage GHG emissions of the case study house, excluding its external walls, was quantified as per Equation 2 by using environmentally extended input-output data (ABS, 2017) as more specific data on the GHG emissions associated with material transportation and on-site construction process was not readily available. Furthermore, as all elements of the study house are identical for every scenario, other than the external walls, the quality of data used for these elements was considered to not influence the comparison of scenarios.

261
Soheila Ghafoor and Robert H. Crawford
m=1
m=1 e=1
Where:
EGHGA4−A5exW = (TERrb − ∑m TERm) × (Ch − Cw) (2)
EGHGA4-A5exW = Construction process stage (A4-A5) GHG emissions of the house materials, excluding external walls (kgCO2-e);
TERrb = Total GHG emissions associated with the Australian Residential Building Construction sector (kgCO2-e/AUD);
TERm = Total GHG emissions associated with the input-output pathway representing material m for which coefficients were used to calculate their embodied GHG emissions (kgCO2-e/AUD);
Ch = Cost of the house (AUD); Cw = Cost of the external walls (AUD).
As the study focuses on a comparison of external wall systems, it was considered critical to maximise the reliability and accuracy of the calculation of construction process GHG emissions for the wall systems. Thus, a detailed process analysis was used to quantify the construction process stage GHG emissions of each wall system; as per Equation 3. This approach breaks down the construction process stage into transportation, construction process and supporting services, which better facilitates a detailed comparison.
EGHGA4−A5W = ∑m t
t=1 (Qm × Lm × TEFt) + ∑e ((Le × TEFe) + ( De × OEFe)) +
Where:
p p=1 (1.07 × Pp × Dp ) + (TERrb
m m=1 TERm ) × Cw (3)
EGHGA4-A5W = Construction process stage (A4-A5) GHG emissions of the external wall materials (kgCO2-e); Qm = Quantity of the material m in the external wall system including wastage (t); Lm = Distance between the production site of material m and the construction site (km); TEFt = GHG emission factor of the transportation method t (kgCO2-e/tkm); Le = Distance between the equipment supplier and the construction site (km); TEFe = GHG emission factor of transporting the construction equipment e to the site (kgCO2-e/km); De = Duration of operation of the construction equipment e (hours); OEFe = GHG emission factor of operating the construction equipment e (kgCO2-e/hour); Pp = Power of the power tool p (kW); Dp = Duration of operation of the power tool p (hours); TERm = Total GHG emissions associated with the input-output pathway representing material m, transport
and on-site construction (kgCO2-e/AUD). In calculating the transportation GHG emissions, the travel distance for materials and equipment were
measured based on the distance from the preferred supplier or manufacturer using Google Maps, and all were selected to be within Victoria. Diesel GHG emission factors were extracted from NGA (2018), with fuel consumption averaged between an outward trip (full load) and return trip (empty), and the average fuel use per tkm of each transportation method was based on the ABS (2018) survey of motor vehicle use.
In calculating the construction process GHG emissions two main types of equipment were identified to be used in the process of constructing the wall systems, namely, diesel powered equipment for lifting
∑ ∑ − ∑

262
Comparative study of the life cycle embodied greenhouse gas emissions of panelised prefabricated residential walling systems in Australia
Comparative study of the life cycle embodied greenhouse gas emissions of panelised prefabricated 7 residential walling systems in Australia
purposes and electricity powered equipment for fixing and applying finishes. The diesel and electricity GHG emission factors for Victoria for equipment and power tool use were extracted from NGA (2018), and the fuel use of construction equipment and power use of construction power tools were extracted from the manufacturers’ datasheets. The operation duration of each item of equipment for constructing the wall systems was estimated using equipment properties and industry knowledge.
The initial embodied GHG emissions (EGHG) is the sum of GHG emissions associated with the product (EGHGA1-A3) and construction process (EGHGA4-A5exW+EGHGA4-A5W ) stages.
3. ResultsThe analysis of the initial embodied GHG emissions of the BC scenario shows that a total of 122 tCO2-e or 605 kgCO2-e per m2 results from the construction of the house. The brick veneer external wall system was found to represent 15% of the total GHG emissions. This highlights the significance of exploring alternative walling systems for reducing housing-related GHG emissions. Figure 3 compares initial embodied GHG emission results of the three external wall system alternatives with the BC scenario. The timber framed panel is the only option that shows a significant reduction (by around 7.4 tCO2-e or 7% compared to the BC) while SIPs increases the initial embodied GHG emissions by around 7.13 tCO2-e or 6% compared to the BC. The CLT scenario results in an increase of 1 tCO2-e or around 1% compared to the BC.
200 180 160 140 120 100
80 60 40 20
0
Brick Veneer (BC)
Timber Framed Panel Cross Laminated Timber Structural Insulated Panel
Product Stage Construction Process Stage Initial Embodied
Figure 3: Initial embodied GHG emissions of four scenarios for the case study house showing a ±40% uncertainty.
The results emphasise the importance of product stage GHG emissions, which account for around 70% of the total initial embodied GHG emissions across the four scenarios. Among all, the prefabricated timber framed panel system presents the lowest product stage GHG emissions, with 7.97 tCO2-e or a 9% reduction compared to the BC. The use of SIPs as the external wall system results in a 6.64 tCO2-e or an 8% increase in the product stage GHG emissions compared to the BC. This is mainly because SIPs has one of the highest embodied GHG emission coefficients, which has resulted in higher product stage GHG emissions in the respective walling system.
Construction process stage results show all three alternatives lead to an increase compared to the BC results, with the highest increase for the CLT scenario (a 5% increase). This is mainly because of the necessity of heavy machinery and additional supporting services for the construction/installation process of prefabricated panels.
tCO
2-e

263
Soheila Ghafoor and Robert H. Crawford
When comparing the initial embodied GHG emissions breakdown of the three external wall system alternatives with the BC results (Figure 4), it shows a reduction in GHG emissions associated with wall material transportation with the highest reduction for the timber framed panel system. However, the use of prefabrication in alternative external wall systems has increased the GHG emissions associated with diesel powered construction equipment, because of the necessity of mobile cranes in the installation process of prefabricated panels. The GHG emissions associated with diesel powered equipment has increased from 46 kgCO2-e in the BC scenario up to 575 kgCO2-e in the prefabricated scenarios. The difference in electricity use for power tools used in the installation process of all wall systems is insignificant.
Structural Insulated
Panel
Cross Laminated
Timber
Timber Framed Panel
Brick Veneer (BC)
0 4 8 12 16 20 24 tCO2-e
Product Stage (A1-A3)
Supporting Services (A4-A5)
Material Transportation (A4)
Equipment Transportation (A4)
Diesel Powered Equipment Use (A5)
Electricity Powered Equipment Use (A5)
Figure 4: GHG emissions breakdown of the four external wall system scenarios for product and construction process stages (wall scale).
4. DiscussionThis study has demonstrated the importance of embodied GHG emissions in reducing the effect of the built environment on climate change, which was also emphasised by Treloar et al. (2001). By keeping the operational performance consistent across four scenarios through equal R-value design of wall systems, it was shown that the use of prefabrication may not always reduce the GHG emissions of a building compared to the conventional construction. Among the three panelised prefabricated external wall systems considered, only the prefabricated timber framed panel provides a reduction in initial embodied GHG emissions compared to the BC. The SIPs scenario increases the initial embodied GHG emissions by 6% (35 kgCO2-e/m2), while the CLT scenario does not provide a significant difference (less than 1% increase) compared to the BC. Therefore, it is critical while complying with regulations like the 6 Star Standard to improve the operational performance of residential buildings, we ensure that the embodied GHG emissions do not negate any operational performance improvements.
The results also emphasise the importance of selecting materials with low GHG emission intensity, supporting the findings of Hong et al. (2015). This implies that even with heavy machinery requirements for the transportation and installation processes of panelised prefabricated alternatives, the choice of materials may be a critical factor in reducing the initial embodied GHG emissions of buildings. For example, the SIPs external wall system has resulted in the highest initial embodied GHG emissions mainly

264
Comparative study of the life cycle embodied greenhouse gas emissions of panelised prefabricated residential walling systems in Australia
due to the high GHG emission intensity of SIPs (accounting for 11% of the initial embodied GHG emissions of the case study house). In contrast, for the CLT external wall system scenario, while it has lower product stage GHG emissions compared to the BC, the effect of the construction process stage has altered the equation to slightly higher initial embodied GHG emissions. Therefore, the effect of the construction process stage, although non-critical, should also not be ignored.
4.1. Limitations
This study is characterised by a series of limitations. Firstly, it does not consider the recurrent embodied GHG emissions associated with maintenance, refurbishment, replacement, and repair of building components during the life of the building. In addition, it does not consider the potential reuse, recycling, or incineration which can recover a significant amount of energy and resulting associated GHG emissions at the end of life stage for materials, considering the fact that panelised prefabricated systems may have a higher recycling rate compared to conventional construction methods (Aye et al., 2012). While care has been taken to identify a typical case study house, the use of a single case study house in this study is subject to criticism for unwarranted generalisation (Zainal, 2007). The assumptions made in the process of quantifying the construction process stage GHG emissions such as the travel distance for supplying materials and equipment to the construction site is another limitation of this study. In addition, embodied energy figures can vary by up to at least 40% when using hybrid analysis for its quantification (Crawford, 2011). Despite these limitations, this study has developed a unique detailed embodied GHG emissions analysis of panelised prefabricated walling systems.
5. ConclusionThis study has quantified the initial embodied GHG emissions of three timber-based panelised prefabricated systems, namely, CLT, SIPs and timber framed panels, and compared them to the conventional use of brick veneer construction for the external wall system of a detached Australian house. The results show among the three panelised prefabricated external wall systems only the timber framed panel scenario provides a reduction (by 7%) to the initial embodied GHG emissions of the BC. The SIPs scenario has increased the initial embodied GHG emissions by 6%, while the CLT scenario does not provide a significant difference (less than 1% increase) compared to the BC. This study reinforces that embodied GHG emissions are significant contributors to the life cycle GHG emissions of a building and need to be integrated into the decision-making process for housing to ensure savings in operational GHG emissions are not offset by increased embodied GHG emissions. The study has shown that the on-site benefits of prefabrication, such as faster construction, may not be the critical factor for reducing housing-related embodied GHG emissions. Minimising GHG emissions associated with the process stage (i.e. production of materials) may have a much greater influence on reducing embodied GHG emissions, regardless of whether it is used in a prefabricated component or not. The consideration of other building elements such as roof and internal walls constructed of panelised prefabricated systems, and other modes of prefabricating such as modular prefabrication is recommended for future research.
References ABS (2013) Population Projections Australia 2012 (base) to 2101, Australian Bureau of Statistics, Canberra. ABS (2016) Census 2016, Dwelling Structure by Dwelling Type, Australian Bureau of Statistics, Canberra. ABS (2017) 5209.0.55.001 Australian National Accounts: Input-Output Tables, 2014-15, Australian Bureau of Statistics,
Canberra.

265
Soheila Ghafoor and Robert H. Crawford
ABS (2018) 9208.0 Survey of Motor Vehicle Use, Australia, 12 months ended 30 June 2018, Australian Bureau of Statistics, Canberra.
Aye, L., Ngo, T., Crawford, R.H., Gammampila, R. and Mendis, P. (2012) Life cycle greenhouse gas emissions and energy analysis of prefabricated reusable building modules, Energy & Buildings, 47, 159-168.
BCA (2019) Building Code of Australia, Australian Building Codes Board, Australia. Beyond Zero Emissions (2013) Zero Carbon Australia Buildings Plan, Melbourne Energy Institute, The University of
Melbourne, Melbourne. Crawford, R.H. (2004) Using input-output data in life cycle inventory analysis, Ph.D Thesis, Deakin University. Crawford, R.H. (2008) Validation of a hybrid life-cycle inventory analysis method, Journal of Environmental
Management, 88, 496-506. Crawford, R.H. (2011) Life cycle assessment in the built environment, Spon Press, London. Crawford, R.H., Stephan, A. and Prideaux, F. (2019) Environmental Performance in Construction (EPiC) database, The
University of Melbourne, Melbourne. CSIRO (2016) AccuRate: helping designers deliver energy efficient homes. Dodoo, A., Gustavsson, L. and Sathre, R. (2014) Lifecycle carbon implications of conventional and low-energy multi-
storey timber building systems, Energy & Buildings, 82, 194-210. EN 15978 (2011) Sustainability of construction works–Assessment of environmental performance of buildings–
Calculation method, European Committee for Standardization, Brussels, Belgium. Gibb, A.G. (1999) Off-site fabrication: prefabrication, pre-assembly and modularisation, John Wiley & Sons,
Latheronwheel. Hong, J., Shen, G.Q., Feng, Y., Lau, W.S.-t. and Mao, C. (2015) Greenhouse gas emissions during the construction phase
of a building: a case study in China, Journal of Cleaner Production, 103, 249-259. Hong, J., Shen, G.Q., Mao, C., Li, Z. and Li, K. (2016) Life-cycle energy analysis of prefabricated building components:
an input–output-based hybrid model, Journal of Cleaner Production, 112(Part 4), 2198-2207. IEA and UNEP (2018) Global Status Report: Towards a zero-emission, efficient and resilient buildings and construction
sector, Internal Energy Agency and UN Environment Program. Impresa House (2020) Walls and cassettes. Available from: <http://impresa.house/our-products/#wall-cassets>
(accessed 19 April 2020). Li, Z., Shen, G.Q. and Alshawi, M. (2014) Full length article: Measuring the impact of prefabrication on construction
waste reduction: An empirical study in China, Resources, Conservation & Recycling, 91, 27-39. Mao, C., Shen, Q., Shen, L. and Tang, L. (2013) Comparative study of greenhouse gas emissions between off-site
prefabrication and conventional construction methods: Two case studies of residential projects, Energy & Buildings, 66, 165-176.
Monahan, J. and Powell, J.C. (2011) An embodied carbon and energy analysis of modern methods of construction in housing: A case study using a lifecycle assessment framework, Energy & Buildings, 43, 179-188.
Nejat, P., Jomehzadeh, F., Taheri, M.M., Gohari, M. and Abd. Majid, M.Z. (2015) A global review of energy consumption, CO2 emissions and policy in the residential sector (with an overview of the top ten CO2 emitting countries), Renewable and Sustainable Energy Reviews, 43, 843-862.
NGA (2018) National Greenhouse Account Factors, Department of the Environment and Energy, Australia. Pérez-Lombarda, L., Ortizb, J. and Pout, C. (2008) A review of bottom-up building stock models for energy
consumption in the residential sector, Energy & Buildings, 40(3), 394-398. SIPS Industries (2020) Typical details. Available from: <https://www.sipsindustries.com.au/products/downloads>
(accessed 19 April 2020). Speckel (2020) Building Envelope Performance Solution. Available: <https://app.speckel.io/> (accessed 19 April 2020). Treloar, G.J., Love, P.E.D. and Holt, G.D. (2001) Using national input–output data for embodied energy analysis of
individual residential buildings, Construction Management & Economics, 19(1), 49-61. Xlam (2017) Australian Cross Laminated Timber Panel Structural Guide. Available from:
<http://www.xlaminfo.com/sites/default/files/Version%201.1%20XLam%20Australia%20Design%20Guide.pdf> (accessed 19 April 2020).
Zainal, Z. (2007) Case study as a research method, Jurnal Kemanusiaan, 5(1).

266
The 54th International Conference of the Architectural Science Association (ANZAScA) 2020 Concept proofing a proposed early-stage project complexity assessment tool
Concept proofing a proposed early-stage project complexity assessment tool
Paulo Vaz-Serra1, Peter Edwards1&2 and Guillermo Aranda-Mena2
1The University of Melbourne, Melbourne, Australia [email protected]
2RMIT University, Melbourne, Australia [email protected], [email protected]
Abstract: Project complexity, as a sub-field of complexity science, is under-researched in terms of what factors contribute to it; how they can be assessed; and what can be done to deal with them. This research proof-tests the concept of a project early stage complexity assessment tool (PESCAT), based upon complexity theory, that uses project differentiation, inter-dependency and uncertainty as measures for subjective assessment. Using focus group workshops comprising a convenience sample of construction professionals, mixed methods research (including opinion survey questionnaire, hypothetical and real-life case studies) is used within a qualitative framework to explore aspects of project complexity and the application of the proposed assessment tool. The findings confirm that an early stage project complexity assessment tool is practicable and can contribute to project management practice in the construction industry. Such a tool should be applied in a small group setting by individual project stakeholders and customised according to their needs and the nature of their involvement. Tool development suggests that four measures (differentiation and its associated uncertainty, and interdependency and its uncertainty) are appropriate measures, provided that they are applied to project perspective factor sets that reflect the construction project management processes of different stakeholders.
Keywords: Project complexity, assessment, project management, construction industry
Introduction While complexity science is a large field of investigation, its application to construction projects is quite
sparse, given the size of the architecture, engineering and construction (AEC) industry, the nature of the projects undertaken, and the abundance of academic journals and commercial magazines in the field. Although some project factors may be regarded as complicated, little thought is given as to why and how the project itself should be considered complex. From a systems viewpoint, construction projects probably lie in the dynamic imposed category (situations may change within a predetermined approach). Solutions do not always take in consideration relationships between the built environment and its nature of “entangled complexity” (Sharp, 2012). Ali et al. (2020) note that delivering a construction project involves a sequence of tasks and that are performed in series and/or parallel and organising the tasks in itself creates a complex system. For example, alteration and refurbishment projects are categorized as
Imaginable Futures: Design Thinking, and the Scientific Method. 54th International Conference of the Architectural Science Association 2020, Ali Ghaffarianhoseini, et al (eds), pp. 266–275. © 2020 and published by the Architectural Science Association (ANZAScA).

267
Paulo Vaz-Serra, Peter Edwards and Guillermo Aranda-Mena
very complex in nature (Chong et al., 2017; Okakpu et al., 2020) as task organisation in such projects is associated with high levels of uncertainty.
Other than relying on previous experience, stakeholders in a project do not necessarily know in advance exactly where any complexities will lie nor their full extent. However, if it can be assessed at an early stage of project development, when little detailed information may be available, a better understanding of the nature and extent of project complexity could valuably inform project decision- making and the use of management resources. Cooke (2013) hypothesises that, for reducing uncertainty, using a singular common model in the early project design stage could be a practical solution to ensure integration of structural and engineering components.
This paper covers the design and concept-proofing of an early stage project complexity assessment tool.
Our research focuses on construction projects. Construction, as a project-driven industry, is prone to high resource demands and uncertainty that influence construction costs. Successful application of the proposed early stage project complexity assessment tool could therefore potentially yield strategic and national benefits through its contribution towards a more efficient AEC industry. This aligns with the view of Elia et al. (2020) who propose an integrated framework, a system thinking based approach, called “project management canvas” to support a contextual management of project complexity.
We commence with a brief theoretical background established through literature review. This is followed by the conceptual complexity assessment tool design; proposed research methodology; focus group workshop processes (including survey questionnaire administration and tool application testing); and data analysis flowing from these. The preliminary results are discussed; subsequent tool modifications are proposed, and conclusions are drawn.
The aim and innovative contribution of this research project is to use focus group workshops as a means of testing and validating the project complexity assessment tool concept. The proximity of industry practitioners, and the interactions between them during and following a sequence of workshop exercises should be enough to proof-test the concept, at least for a construction industry environment.
Theoretical background In this section complexity is explored from theoretical, system and project standpoints. These are drawn together in the context of project decision-making and uncertainty.
Complexity
A general dictionary definition of complexity describes it as a state of being complex, which in turn is explained as consisting of several closely-connected parts, complicated, intricate, hard to understand.
Complex systems
Remington and Pollock (2007) typify complexity in systems as structural (variability in the “what”); technological (the “how”); temporal (“when” effects); and directional (change going from “where to where”); thus adding a dynamic characteristic to complexity that might easily fit construction projects.
On the other hand, Kahane (2004) takes a social networking view, suggesting that complexity arises from differences in perspectives and interests; where cause and effect gaps are wide; where problem

268
The 54th International Conference of the Architectural Science Association (ANZAScA) 2020 Concept proofing a proposed early-stage project complexity assessment tool
solutions are not necessarily found in advance; and where people must participate in dealing with them. This also reflects construction processes.
Stacey (1996) offers complexity as two dimensional: certainty and the measure of agreement between constituents; and proposes that the relationship between them might reflect situations ranging from “simple” to “anarchic”. This proposition stems from the antecedents of complexity science in chaos theory, which proposes how meaningful order is found among chaotic systems, and conversely how extensive networks and behaviours can arise from simple ideas and connections. In construction we are probably reluctant to consider construction projects as lying at either end of the continuum, but it may be worth remembering that “complex projects” might not be far from the right-hand extreme!
Complex systems may be static (fixed in place, as in a rules-based administrative system) or dynamic (subject to change over time), and the latter may be self-organising (as in some natural systems) or imposed. From a systems viewpoint, construction projects probably lie in the dynamic imposed category. In order to explore and assess complexity in projects, a model or framework is thus needed, and Snowden and Boone (2007) created a “Cynefin” sense-making framework which essentially re-organises Stacey’s earlier model into scenario quadrants categorised as: Simple; Complicated; Complex; and Chaotic. Note how “Chaotic” in this model sits close to the “anarchic” measure suggested by Stacey and reflects its antecedents.
Complex projects
Baccarini (1996) and Williams (1999; 2002) propose that, conceptually, the complexity of a project is influenced by the level of uncertainty associated with two states relating to its constituent elements and sub-elements (parts). These states are the conditions of differentiation and inter-dependency. Differentiation refers to the number of constituent parts distinguishable – or needing to be distinguished - in a system (project). Inter-dependency arises in the extent and nature of relationships occurringbetween the differentiated parts. Uncertainty may be associated with either or both states.
Senescu, Aranda-Mena and Haymaker (2013) point to vital role of communication in managing complex projects. We emphasise that this will include intra-organisational as well as inter-organisational communication. People within construction organisations need to share an understanding of project complexity in order to make robust decisions. Project complexity also has a psychological dimension, in that decision-makers tend to perceive it in terms of their intellectual and mental capacity to deal with it (Mikkelsen, 2020). This background provides sufficient understanding to allow us to conceptualise an early-stage tool for assessing project complexity.
A conceptual early stage project complexity assessment tool Our proposed Project Early Stage Complexity Assessment Tool (PESCAT) brings together Baccarini (1996) and Williams (1999), Kahane (2004), Stacey (1996) and the Snowden and Boone (2007) Cynefin framework, with at least part of the Remington and Pollock (2007) approach. In its first iteration (Mk1) PESCAT considers the project solution space and the project decision making that accompanies it, together with their associated uncertainties. Conceptually, PESCAT application requires experiential judgment, reflective risk wisdom (since project decision-making inevitably involves uncertainty and therefore risk) and the capacity to intellectually (and even emotionally) coalesce several influencing factors. For example, in dealing with complexity, conflicts can arise between the process flexibility needed

269
Paulo Vaz-Serra, Peter Edwards and Guillermo Aranda-Mena
for high levels of uncertainty and the requirements (and expectations) for efficient performance. The project complexity assessment tool format is depicted in Figure 1.
In applying PESCAT Mk1, users first identify the project and the project stakeholder for whom complexity is being assessed. The project phase is also chosen. Four project lenses (or perspectives) are suggested for assessment: (a) the governance or organisational structure for the project; (b) the range of tasks or activities the stakeholder will carry out; (c) the technologies involved; and (d) the organisation/management that stakeholder will need to undertake the project. Five-point rating scales are applied to each lens: Very Low; Low; Moderate; High; Very High.
For each lens/perspective the “Resolution Space” is first assessed (vertical axis). This is an amalgam of solution space (as proxy for differentiation) and the degree of perceived difficulty with its associated decision-making. The horizontal axis rates the amount of “Uncertainty” associated with the Resolution Space. A stakeholder applying PESCAT must first, as a matter of strategic management, allocate the five levels of project complexity (Simple; Slightly Complex; Complex; Highly Complex; and Chaotic) into the cells in the upper grid. The tool concept is then ready for proof-testing.
Fig.1. Format for the proposed project complexity assessment tool.
Research method We adopted a mixed methods approach for the concept-proofing research. Following the PESCAT design, focus group workshops were held at the University of Melbourne in February 2020. Since complexity is to some extent a “lived” experience, focus groups were deemed appropriate for the purpose. The A workshops (duplicated to meet participant needs) were followed by Workshop B in early March 2020
Convenience (industry contacts known to the researchers) and snowball methods were used to invite participation from construction industry professionals working in the Melbourne area. In Workshop A (held on a midweek evening from 5.30 – 8.15pm on two successive weeks), the PESCAT concept was presented by the researchers. Participants then completed the questionnaire survey, mostly following a “circle your choice(s)” answer entry format.

270
The 54th International Conference of the Architectural Science Association (ANZAScA) 2020 Concept proofing a proposed early-stage project complexity assessment tool
Following completion of the survey, participants applied PESCAT Mk1 to three case studies taken from real-life projects known to the researchers, each presented as a slide of the project organogram accompanied by verbal descriptions.
Case Study 1 is an Australian correctional facility (approximate construction value AU$600 million) procured under a Public Private Partnership arrangement. Case Study 2 is an improvement programme across a metropolitan rail system, valued at more than AU$8 billion, and procured as eleven packages under Alliance or Design & Construct contracts. Case Study 3 is a foreign aid-funded project for a new civic facility (costing about AU$40 million) for a Pacific Rim island national government, procured under traditional separated design/construction.
Using the PESCAT Mk1 grids, Workshop A participants were asked to assess (individually or in small groups) the complexity of each case study project. This involved first allocating the five project complexity levels (Simple; Slightly Complex; Complex; Highly Complex; Chaotic) into the cells of the main grid. This allocation represents a strategic management decision. Participants then chose a project perspective from the list shown on the template; and subjectively assessed the resolution space (solution space differentiation and associated interdependency) and the associated uncertainty for that perspective (using 5-point scales from Very Low to Very High). They mapped their assessments onto the project grid, thus arriving at a complexity level for that perspective for that project; and then repeated the process for other perspectives. The perspective assessment which mapped into the highest complexity level cell thus indicated the overall complexity level for that case study project.
Workshop participants then repeated the whole process for the next case study. While some groups assessed only one project, others managed to do two assessments, and a few completed assessments for all three case projects. It was observed that the more projects groups assessed, the faster their assessments were completed.
At the conclusion of the workshop, additional PESCAT grids were handed out and participants were asked to take them away, apply them to current or historical projects in their own organisations, and return the completed complexity assessments to the researchers.
Workshop B was used to present the preliminary results of the survey analysis; allow discussion of these findings; and permit handing-in of any takeaway project assessments not previously submitted via email. Following the premature discussion referred to earlier during Workshop A, and survey responses to Question 9, a modified version of PESCAT (Mk2) was presented for discussion; and reflective comment on the concepts elicited. Feedback forms (about the workshop processes) were also given to participants for completion before formally closing the proceedings.
Results
Demographic characteristics of participants
The professional disciplines and age characteristics of workshop participants are shown in Table 1. All participants were male. Female construction professionals were invited, but all those who initially
accepted subsequently cancelled. The workshop timing (5.30 – 8.15pm on a midweek evening) may have influenced this. Apart from this, the workshop group is considered reasonably representative of the Australian construction industry, particularly with regard to experience.

271
Paulo Vaz-Serra, Peter Edwards and Guillermo Aranda-Mena
Table 1. Workshop participant demographics.
Profession n <30yo 31-40yo 41-50yo 51-60yo >60yoArchitect 3 3 Civil Engineer 4 1 1 1 Construction Manager 1 1 1 Project Manager 6 2 1 1 2 Quantity Surveyor 1 1 Safety Officer 1 1 Totals: 16 0 2 7 2 5
Workshop A: PESCAT Mk1 presentation
The presentation of PESCAT Mk1 in Workshop A attracted some comment and discussion, mainly concerning participant difficulty in grasping the tool concept, the validity of the tool assessment parameters (especially “Resolution Space”), and the need for project stakeholders to make individual project complexity assessments. Some resistance was expressed or detected in Workshop A to the use of “Chaotic” as a project complexity descriptor. Participants agreed to defer fuller discussion of these issues until Workshop B, after they had applied PESCAT in several project circumstances.
Workshop A: survey questionnaire responses
About two thirds of participants (10) thought that construction projects best reflected complex behaviour that emerges from simple underlying rules (Q2; dichotomous), although some support was shown (from architects) for the alternative view that complexity is about how order and patterns arise from apparently chaotic systems. Respondents were unanimous (16) in thinking that construction projects are best represented by dynamic systems and about half also reckoned that such systems were imposed rather than self-organising (Q3). All respondents thought that assessment of project complexity was important (Q4: dichotomous). For Q5 (seven options), seven respondents selected option (c) “Business case/feasibility stage” as the best stage in the project development life-cycle to assess complexity. Five chose (a) “Concept proposal stage”; while 3 selected (b) “Concept development stage”. One project manager opted for (d) “Design proposal stage”.
For Q6 (seven benefits offered), the potential benefits of project complexity assessment were perceived (in frequency count order) as: “assigning appropriate management” resources (14); “establishing appropriate budgets and establishing an appropriate tender/offer price” (13); “establishing appropriate administrative systems” (12); “better time scheduling” (11); “establishing training requirements” (9) and “better unit pricing for project activities”(8). Participants thus thought that multiple benefits could be achieved, and some suggested further benefits: “better risk management” (4); “establishing key interfaces” (1); “better project briefing” (1); “better organisational resourcing” (1); “minimising waste” (1); “aligning complexity and commitments” (1); plus a “wider benefit in terms of end value and society” (1).
Q7 explored factors (thirteen taken from listed PMBoK processes) that might influence project complexity. In rank score order of importance ratings (five interval scale with only extreme ends ‘Not important’ and ‘Highly Important’ labelled), survey participants selected: “project risks” (73); “project cost and project communications” (68); “project scope” (67); “project procurement” (66); “project integration” (64); “project quality” (63); “project timing and project safety” (63); “project finance” (62); “project HR and project environment” (56) and “project claims” (52). Additional contributory factors were

272
The 54th International Conference of the Architectural Science Association (ANZAScA) 2020 Concept proofing a proposed early-stage project complexity assessment tool
specified and invited in Q8. Importance scores (using the five-interval scale described above) for the three listed factors were: “Stakeholder management” (69); “Technology management” (51); and “Procurement systems” (48). Survey participants also offered additional contributory factors (without importance ratings): “project interfaces”; “people”; “organisational styles”; “organisational structures”; “supply chains”; “design”; “detailing”; “contracting”; “co-ordination”; “political climate or risks” (3 participants); “environmental risks”; “design management” (2 participants); “sequencing”; “work methods”; “project location”; “interdependencies”; “client type”; “previous experience with that client”; and “global events”.
Q9 tested the PESCAT concept directly (three complexity measures stated; four agreement options offered). Eleven participants agreed with the Resolution Space/Uncertainty tool parameters for assessing project complexity. One totally agreed and three somewhat disagreed. Comments included requests for better parameter definitions (3 participants), more examples, and a query about how PESCAT would fit into the project management process.
Data analysis for Q10 (participant allocation of five complexity levels into a grid) was not completed in time for Workshop B. For Q11, frequency counts for the five options listed about how project complexity is dealt with in participants’ organisations were: “No specific action” (0); “Informally by senior management” (8); “Formally by senior management using procedural guidelines” (4); “Informally by project/construction managers, etc.” (2); “Formally by project/construction managers using proformas” (4). One participant indicated that complexity is addressed as part of project risk management. In Q12, complexity knowledge management was explored by offering six options, and the selection frequencies for survey participants were: “Not at all” (0); “Left as individual staff wisdom” (2); “Informally among key staff groups” (5); “Semi-formally through meeting agendas and minutes” (7); “Formally through dedicated briefings, de-briefings and reports” (4); and “Integrated into a searchable organisational Knowledge Management System” (2).
Discussion The Workshop A survey confirmed that an informed assessment of project complexity is important and beneficial, particularly if carried out as early as possible in the project development stage. While some workshop participants had initially expressed a view that a universal assessment was desirable (ie, by all stakeholders for a project) this view changed after they had applied PESCAT Mk1 to the case study projects and after they reflected that the placement of complexity level labels in the assessment grid was a strategic management responsibility for each stakeholder.
Further development of PESCAT was indicated, especially in terms of the measures of project complexity (Q9). Refinement of the list of contributory factor options also appeared desirable, given the response scores to Q7. For PESCAT Mk2, a closer proxy to the Baccarini (1996) and Williams (1999) differentiation and interdependency approach was adopted as a dual measure on the vertical axis; and uncertainty and decision difficulty as a dual measure for the horizontal axis. The practicality of the Mk2 tool development was tested in Workshop B and while its greater practicality was acknowledged, workshop participants remarked that it was still difficult to grasp the assessment measures of the tool concept intellectually.
Tool development has since progressed to PESCAT Mk5 (Figures 2a and 2b). Four distinct assessment measures are now proposed, a revised menu of project perspectives has been adopted, and guidelines for use have been improved. This version also allocates project complexity levels into the grid based upon a “normalised” distribution derived from all the workshop and private assessments carried out by the

273
Paulo Vaz-Serra, Peter Edwards and Guillermo Aranda-Mena
research participants. The decision-making parameter has been subsumed into the differentiation and interdependency measures, since they are inherently associated with making project decisions.
Fig.2a. PESCAT Mk5 Application guide.
Fig.2b. PESCAT Mk5 Tool format

274
The 54th International Conference of the Architectural Science Association (ANZAScA) 2020 Concept proofing a proposed early-stage project complexity assessment tool
After selecting (or creating) a project perspective set, the user makes four qualitative assessments for each factor in turn. The first is for project differentiation (Figure 2b: Measure A); followed by uncertainty associated with differentiation (Measure B). Measure C assesses the extent of inter-dependency associated with the differentiation, and Measure D the uncertainty relating to the inter-dependency. Thus, for a five-factor set of project perspectives (Fig.2a: Set A), twenty subjective assessments are made and plotted on the project grid. Although this may seem a complicated process, in practice it is quite easy and rapid. It also emphasises uncertainty as a major contributor to project complexity.
PESCAT users can choose (or create) a set of project perspectives that best represents their individual involvement in the project. Designers might wish to follow their design process; while contractors would make assessments according to the construction processes. Project managers could tailor a set of perspectives related to their management activities. The conceptual acceptability of PESCAT Mk5 has still to be fully tested in practice, but informal consultation with a few workshop members indicates that it would now form a useful tool in their project management armoury.
Conclusions
The concept proof-testing research has shown that project complexity assessment at an early stage is not only desirable, but also beneficial for stakeholders directly involved in a project. Having a better understanding of the nature and extent of project complexity informs decision-making and allows better targeting of resources.
PESCAT can be used for this assessment, provided it is based upon factors that strategically and meaningfully contribute towards, or influence, complexity for that project for that stakeholder. Tool application is best done by a small group of experienced construction professionals. The PESCAT Mk5 version assesses four dimensions of complexity for a selected set of project perspectives: project differentiation and its uncertainty; and differentiation inter-dependency and its uncertainty. PESCAT then provides an overall level of complexity for a project and can indicate the strength of contributory factors. Senior management can use this information to make more nuanced decisions about resource allocation and scheduling.
As a qualitative tool based upon subjective assessments of project factors, PESCAT may be subject to personal bias, but the small group application should guard against this. Periodic re-calibration, using historic project data, would also mitigate this risk. Further research will test the latest version of PESCAT; and gather additional feedback about its use in practice. The mixed methods research approach has also shown that concept-proofing propositions in this way is a valid, practical and inexpensive means of testing new ideas in project management.
Acknowledgements The funding support of the Faculty of Architecture, Building and Planning at the University of Melbourne for this research is gratefully acknowledged. We sincerely thank the workshop participants for their continuing interest in the topic and for their unstinting contribution to our work.
References Ali Vahabi, Farnad Nasirzadeh & Anthony Mills (2020) Impact of project briefing clarity on construction project
performance. International Journal of Construction Management, DOI: 10.1080/15623599.2020.1802681

275
Paulo Vaz-Serra, Peter Edwards and Guillermo Aranda-Mena
Baccarini, D. (1996) The concept of project complexity – a review. International Journal of Project Management. 14 (4) pp210-214.
Chong H-Y, Lee C-Y, Wang X. (2017) Review: a mixed review of the adoption of Building Information Modelling (BIM) for sustainability. Journal of Cleaner Production. 142(Part 4) pp4114–4126.
Cooke, T. (2013) Can knowledge sharing mitigate the effect of construction project complexity? Construction Innovation. 13 (1) pp5-9.
Edwards, P, Vaz Serra, P and Edwards, M (2020). Managing project risks. Wiley Blackwell, Oxford. Elia, G., Margherita, A. and Secundo, G. (2020), Project management canvas: a systems thinking framework to address
project complexity. International Journal of Managing Projects in Business, Vol.(ahead-of-print) No. (ahead-of- print). https://doi.org/10.1108/IJMPB-04-2020-0128
Kahane, A. (2004). Solving tough problems. Berrett-Koehler Publishers. Oakland, CA. Koh Buck Song (2012) Perpetual Spring – Singapore’s Gardens by the Bay. Marshall Cavendish Editions. Singapore.
ISBN 978-961-4308-18-3. Mikkelsen, M.F. (2020) Perceived project complexity: a survey among practitioners of project management",
International Journal of Managing Projects in Business, Vol. (ahead-of-print) No. (ahead-of-print). https://doi.org/10.1108/IJMPB-03-2020-0095
Okakpu, A., Ghaffarianhoseini, A., Tookey, J., Haar, J., Ghaffarianhoseini, A. & Ur Rehman, A. (2020) Risk factors that influence adoption of Building Information Modelling (BIM) for refurbishment of complex building projects: stakeholders perceptions, International Journal of Construction Management, DOI: 10.1080/15623599.2020.1795985
PMI (2013) Construction Extension to the PMBok Guide. Project Management Institute, Newtown Square, Pennsylvania, PA, USA.
PMI (2013) Guide to the Project Management Body of Knowledge. Project Management Institute, Newtown Square, Pennsylvania, PA, USA.
Remington, K., and Pollack, J. (2007). Tools for Complex Projects. Gower Publishing, UK. Senescu, R.R., Aranda-Mena, G. and Haymaker, J.R. (2013) Relationships between project complexity and
communication. Journal of Management in Engineering. DOI: 10.1061/(ASCE)ME.1943-5479.0000121. Sharp, M.D. (2012). Complexity Theory: Implications for the Built Environment. In Construction Innovation and Process
Improvement (eds A. Akintoye, J.S. Goulding and G. Zawdie). Ch13, pp297. Wiley Online Library doi:10.1002/9781118280294.ch13
Snowden, D. F. and Boone, M. E. (2007). A Leader's Framework for Decision making. Harvard Business Review, pp69- 76.
Stacey, R. D. (1996). Complexity and Creativity in Organizations. Berrett-Koehler Publishers, Oakland, CA. Thompson, J. (1967). Organizations in Action. McGraw Hill, New York. Williams, T.M. (1999) The need for new paradigms for complex projects. International Journal of Project
Management. 17 (5) pp269-273. Williams, T.M. (2002). Modelling Complex Projects. John Wiley & Sons, London.

276
The 54th International Conference of the Architectural Science Association (ANZAScA) 2020
Concepts for a prefabricated wall panel to increase the uptake of straw and wool insulation in New Zealand
Jacob Coleman1, Hans-Christian Wilhelm2 1, 2 Victoria University of Wellington, Wellington, New Zealand
{[email protected], [email protected]}
Abstract: Straw and pure wool are the only bio-based insulation materials produced in New Zealand (NZ) and occupy the vast minority of the market. While in Europe and elsewhere biologically sourced and biodegradable insulation products are common, the market dominance of inorganic insulation materials in NZ is limiting the uptake of renewable, zero-waste materials. The controlled interior environment and quality assurance offered by prefabrication has the potential to reduce the perceived risk surrounding bio-based insulation materials in NZ and would allow them acceptance into the mainstream market. Prefabricated panels using straw have had success overseas in the UK and Lithuania. This paper proposes concepts for three prefabricated wall panel designs that are insulated with straw and/or wool insulation to increase the market share of bio-based insulation materials in NZ. Panel designs 1 and 2 explore the use of both straw and wool in a prefabricated panel, and panel design 3 proposes an entirely pure wool insulated panel. The design proposals are assessed, compared, and discussed in terms of their weight and thermal and vapour resistance.
Keywords: Straw; wool; bio-based; prefabrication.
1. Problem statement and relevance
1.1. Bio-based insulation materials in NZ
The term bio-based in this paper is used to refer to materials that operate within the bio-sphere or organic cycle as defined in “Cradle to cradle: Remaking the way we make things” (McDonough & Braungart, 2002). Other suitable terms for these materials include biodegradable, biological, and organic. These are natural plant-based materials that are both from renewable sources and biodegradable.
Non-biodegradable insulation materials dominate the NZ market. Fibreglass wall insulation occupies 90% of the market, and the other share is mainly polyester insulation (Brunsdon & Magan, 2017). However, overseas in countries like Germany, biologically sourced and/or biodegradable wall insulation materials such as wood fibre, cellulose, hemp, flax, straw, or wool are not uncommon, occupying up to 4% of the market (Götze & Naderer, 2019). Straw bale and wool are the only bio-based insulation
Imaginable Futures: Design Thinking, and the Scientific Method. 54th International Conference of the Architectural Science Association 2020, Ali Ghaffarianhoseini, et al (eds), pp. 276–285. © 2020 and published by the Architectural Science Association (ANZAScA).

277
Jacob Coleman, Hans-Christian Wilhelm
materials produced in NZ and represent an insignificant share of the NZ market (BRANZ, 2015, 2020). However, as recently as 2008, blown-in cellulose (macerated paper) insulation was being produced in NZ (McChesney & Cox-Smith, 2008). Bio-based insulation materials continue to battle building regulations around the world as they are deemed to have inferior durability due to their lack of moisture resistance (Sigmund, 2017). This is especially the mindset of the NZ construction industry following on from what in NZ is known as the leaky building crisis. In a political climate of building code de-regulation, a significant number of dwellings built in the 1980s and 90s manifested moisture ingress or moisture accumulation in the building fabric, caused by uninformed use of materials and constructions, and leading to substantial damage. However, the substantial market share of insulation products made from renewable raw materials in the European Union suggests that these reservations against bio-based insulation materials are unfounded (Kaiser et al., 2020). When the construction and material relationships are considered holistically to uphold good moisture management (external and internal moisture), which can be assessed through hygrothermal testing, bio-based insulation materials can highly perform.
1.2. Pure wool insulation
The potential for pure wool insulation in NZ is excellent. NZ is one of the largest producers of wool in the world, producing 11% of the world’s wool and taking 4th place behind Australia, China, and the USA (Omondi, 2017). However, despite the abundance of wool produced in NZ, only 30% remains in the country, and of that wool, very little is used in insulation (Nicol & Saunders, 2008). Also, almost all of the wool used in insulation products in NZ is blended with polyester or combined with inorganic resins which compromises the biodegradability of the product. Manufacturers use inorganic resins or blend polyester with wool to help the product holds its shape (Isaacs, 2010). Pure wool insulation can be washed, carded and treated with borax or Quassia wood chips to protect it from moths (Kennedy et al., 2014). Pure wool insulation that is not blended with polyester or inorganic resins is only available in NZ as loose blown-in roof insulation from Envirowool. The irony is that NZ wool is being used overseas in places such as the USA to produce pure wool insulation products. Havelock wool in the USA has made a partnership with Pāmu Farms of NZ to supply wool to produce their batt insulation (Hutching, 2018).
1.3. Straw bales
Straw bales also have very good potential as an insulation material in NZ. Straw is an abundant waste product of the NZ agriculture industry. Straw bales are generally underutilised but are used for fertiliser, animal bedding, and bio-fuel as well as a building material (Pringle, 2016). NZ’s grain growing sector can supply straw bales to construct 2,200 dwellings each year (Hall, 2019). Therefore, there is certainly the capacity for straw bale construction to grow in NZ. Currently, an estimated 20% of straw is simply burned after harvest (Hall, 2019). If this polluting and unsustainable practice were to cease even more straw would be available in NZ (Pringle, 2016). Straw is the stem of the cereal plant from which the valuable head of wheat, barley, oats, rice, or rye is harvested (Magwood, 2016). Bale sizes vary globally depending on the bailing machines used (Pringle, 2016). In NZ straw bales are generally 900-1000mm in length, 450mm wide, and 350mm deep (Hall, 2019).
In 2015, it was estimated that there were 300 to 400 straw bale houses in NZ (Hall, 2015). Statistics NZ’s latest data from 2017 estimates that there are 1,729,300 dwellings in NZ (Statistics New Zealand, 2017). Even with this approximate data, this shows that straw bale houses are a long way off even

278
Concepts for a prefabricated wall panel to increase the uptake of straw and wool insulation in New Zealand
representing one per cent of dwellings in NZ. However, although small, an industry for straw bale houses does exist in NZ with a handful of small companies specialising in the field.
Specifically, the uptake of straw bale construction is limited in NZ due to the absence of a straw bale building standard. The absence of a design standard means that all building code clause B1 structural compliance design must be done by a chartered professional engineer (BRANZ, 2015). This adds time, cost, and effort making straw bale construction less desirable. However, an informative straw bale construction appendix is likely to be present on the next revision of the NZ Earth Building Standards which, if accepted, will make the consenting process easier for all parties (Hall, 2019).
1.4. Straw or wool prefabricated wall panels
No straw or pure wool insulated prefabricated wall panels exist in NZ. Straw-insulated prefabricated panels are produced in the UK and Lithuania by the companies ModCell® and Ecococon respectively. However, no prefabricated panels using pure wool insulation are produced anywhere globally. In NZ, experimental prototypes of straw bale insulated prefabricated wall panels have been developed. Additionally, prefabricated wall panels that use wool-blend insulation are produced in NZ by Ecopanel. Straw bale prototype prefabricated walls have been developed in NZ by Sol design in 2011 and 2014 (Hall, 2014). In 2011, Sol Design constructed a 10m2 experimental prefabricated structure in Geraldine, Canterbury (Hall, 2014). They then began working on prefabricated straw bale panels and constructed a power shed for an off-grid property in Geraldine, Canterbury, in 2014 (Hall, 2014). More recently, in 2019, researcher academic Min Hall produced four prototype straw bale wall panels at one-third scale, using different timber framing options including laminated veneer lumber (LVL), timber I-beams, sawn timber vertical trusses, and a ‘C’ frame where sawn timber and plywood are incorporated to form a channel section (Hall, 2019).
2. Research objectivesThis paper proposes three prefabricated wall panel designs that are insulated with straw and/or pure wool insulation. This is for the purpose of increasing the uptake of straw and pure wool insulation which are NZ’s only bio-based insulation materials. We need bio-based materials because they reduce end-of-life waste, consumption of finite resources, energy consumption, and greenhouse gas emissions. These areas of sustainability have been worked on extensively in the area of energy efficiency of buildings, but a lot of work is still to be done in the area of the embodied energy of buildings. A prefabricated wall panel design is proposed that is insulated with pure wool insulation as an alternative to the wool-blend insulated panel from Ecopanel. In addition, two designs are proposed that explore the potential of combining both straw and wool insulation in a prefabricated panel.
2.1. Research proposition
A prefabricated wall panel has the potential to lower the risk associated with using bio-based insulation materials and increase their uptake. The controlled and dry interior environment within the factory drastically lowers the chance of the bio-based insulation material being compromised through moisture. For straw bale construction specifically, prefabrication offers the benefits of the possibility of plastering all year round, improved quality of plaster, and accelerated application (Hall, 2014). It is also more suitable for small urban sites, and builders on rural sites can spend less time away from home (Hall, 2014).

279
Jacob Coleman, Hans-Christian Wilhelm
The consistency and improved quality assurance of the product due to the interior factory setting will allow the straw or pure wool insulated panel to receive BRANZ CodeMark or Appraisal. This will allow the panel to gain acceptance in the mainstream market. Also, prefabrication in general offers reduced site labour which can reduce costs.
The Ecococon and ModCell® panels demonstrate the feasibility of a prefabricated panel with bio-based insulation. Ecococon has built over 100 projects in the last ten years (Ecococon, 2020b). ModCell® has built 33 projects since 2001 (ModCell®, 2020).
3. MethodologyThe Ecococon panel is used as a base for prefabricated explorations using wool in combination with straw insulation. This is because of their benefits over the ModCell® Panel. Compressed straw is used in the Ecococon panels instead of bales which allows the panels, dimensional flexibility. This makes the panels adaptable to almost any design which keeps site labour cost low (Ecococon, 2020). Ecococon also produces a range of panels for different applications. The design proposals are based on the standard (non-braced) wall panels from Ecococon with the intent that the lessons learned can be applied to the full range of panels. The panel designs are all of the consistent dimensions of 0.35m x 1.8m x 2.4m to allow direct comparison. Douglas-fir timber is selected for the panel’s structural timber frame as the timber is readily available in NZ and fit for structural application.
Data is sourced on the materials used in the proposed panel designs to compare the weight, thermal resistances and vapour resistances of using only straw or wool insulation and the effect of combing them. Specific densities, vapour resistivities and thermal conductivities of materials are sought from actual building products or physical studies, and a single source is used where possible to ensure the highest quality of data. However, multiple sources had to be used to obtain the data for most materials which is a limitation.
The calculations have been manually conducted. The weight for each panel is calculated by multiplying the density of each material by its respective volume. The thermal resistance for each panel is calculated, summing the depth of each material after being divided by its respective thermal conductivity. The vapour resistance of each panel is calculated by summing the vapour resistivity of each material after being multiplied by its respective depth. Thermal and vapour resistance are calculated, excluding the timber frame.
4. Literature reviewLiterature on prefabricated straw wall panels is reviewed to inform how wool insulation could be best be used within a straw a prefabricated wall panel. This literature also supplies suitable construction approaches for pure wool insulation as it is a material with similar moisture management requirements to straw. This informs three prefabricated wall panel designs.
Wool is more insulative and less dense than straw, making it the superior insulation material. Therefore, whatever proportion of wool that is present instead of straw produces a lighter, more

280
Concepts for a prefabricated wall panel to increase the uptake of straw and wool insulation in New Zealand
insulative panel. However, the increased density and bearing capacity of straw means that it has the benefit of being able to support heavy plaster renders. The Ecococon panel can use a vapour-permeable plaster render on its exterior (Ecococon, 2020c). Clay plaster is highly vapour-permeable, which is ideal for bio-based insulation materials as it allows them the ability to dry out (Kennedy et al., 2014). A lime wash finish is applied to the plaster to achieve weathertightness (Racusin, 2012). Clay plaster is also a bio- based material compromised of clay, sand, and straw fibres (Racusin, 2012). The only other alternatives to plaster are a magnesium oxide or gypsum sheathing, both of which are inorganic materials (Magwood, 2016). Accordingly, there is an opportunity to maintain the presence of straw in prefabricated panels, despite the thermal advantages of wool insulation, as a substrate for the vapour-permeable bio-based material of clay plaster.
A hollow timber box beam for the top and bottom plates minimises thermal bridging and provides separate cavities that require insulation (Magwood, 2016). This provides an opportunity for wool insulation within a prefabricated straw panel.
Ecopanel uses plywood, cementitious fibre board, or oriented strand board over wool-blend insulation (Ecopanel, 2018). However, pure wool insulation without the added moisture resistance of the polyester is more susceptible to moisture damage, to a similar extent as straw, and therefore requires different treatment. Straw is hygroscopic, which means it will absorb and store water (Kennedy et al., 2014). This means straw bales require a vapour-permeable construction to ensure there is reasonable drying potential (Racusin, 2012). Wool is also hygroscopic (Tuzcu, 2007). A prefabricated wool wall panel should therefore be constructed similarly to a straw wall panel and use a vapour-permeable sheathing as an alternative to a plaster render. Gypsum sheathing is the most suitable sheathing material for this purpose as it is more vapour-permeable than a magnesium oxide sheathing (Magwood, 2016). Gypsum sheathing comes in two forms, one for exterior use featuring a fibreglass and/or waxed paper coating and one for interior use (Magwood, 2016).
Table 1: Properties of materials
Density Thermal conductivities Vapour resistivities Compressed Straw (Ecococon)
110 Kg/m3 (Ecococon, 2017)
0.0494 W/mk (calculated from (Ecococon, 2017)
Straw bale: 9.71 MNs/gm (calculated from (Magwood, 2016))
Pure wool insulation 25 Kg/m3 (Tuzcu, 2007) 0.033 W/mk (Tuzcu, 2007) 10.0 MNs/gm (Black Mountain Insulation, 2020)
Douglas-Fir 462 Kg/m3 (Kimberley et al., 2017)
Clay Plaster 1500 Kg/m3 (Morton et al., 2005)
0.12 W/mk (TenWolde et al., 1988)
0.66 W/mk (Morton et al., 2005)
393.3 MNs/gm (calculated from (Nash, 2017) 26.3 MNs/gm (Vares et al., 2017)
12.7mm Exterior Gypsum Sheathing (DensGlass®) 13mm Interior Gypsum Sheathing (SHEETROCK® HD)
708.7 Kg/m3 (DensGlass®, 2017) 654 Kg/m3 (USG Boral, 2019)
0.128 W/mk (DensGlass®, 2017) 0.178 W/mk (USG Boral, 2019)
60.6 MNs/g (DensGlass®, 2017) 38.5 MNs/gm (Overton, 2015)

281
Jacob Coleman, Hans-Christian Wilhelm
5. Design proposalsA standard prefabricated timber frame is used for each design (figure 1). The timber frame weighs 169.5Kg. For each design, a pure wool batt insulation product that can hold its shape is proposed along with compressed straw. Panel 1 is comprised of the timber frame filled with compressed straw insulation and with pure wool insulation present in the hollow timber box beams used for the bottom and top plates (figure 2). The vapour and thermal resistance for this panel are calculated through the straw and clay plaster on the exterior and interior. Panel 2 (figure 3) is identical to panel 1 apart from 150mm of pure wool insulation instead of straw in the centre. Straw is present on either side of the wool insulation as a substrate to support clay plaster. Rigid self-supporting compressed straw panels will be glued into the prefabricated timber frame on one face before the pure wool batt insulation is laid in the frame and sandwiched between identical straw panels on the other face. The vapour and thermal resistance for this panel are calculated through the straw, wool, and clay plaster. Panel 3 (figure 4) is entirely insulated with pure wool batt insulation with gypsum sheathing on the exterior and interior. The vapour and thermal resistance for this panel are calculated through the wool insulation and gypsum sheathings.
Figure 1: Timber frame used in each design.
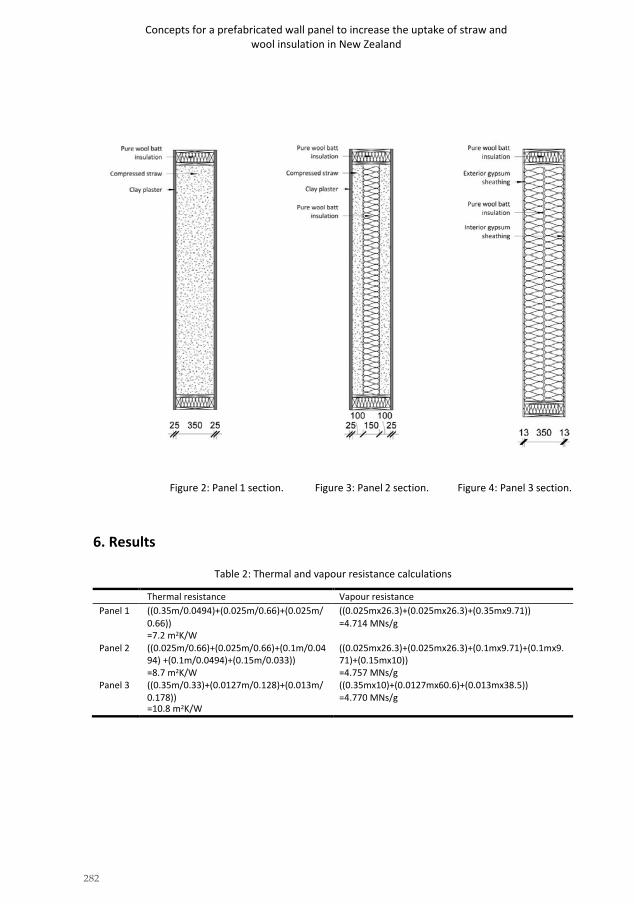
282
Concepts for a prefabricated wall panel to increase the uptake of straw and wool insulation in New Zealand
Figure 2: Panel 1 section. Figure 3: Panel 2 section. Figure 4: Panel 3 section.
6. Results
Table 2: Thermal and vapour resistance calculations
Thermal resistance Vapour resistance Panel 1 ((0.35m/0.0494)+(0.025m/0.66)+(0.025m/ ((0.025mx26.3)+(0.025mx26.3)+(0.35mx9.71))
0.66)) =7.2 m2K/W
=4.714 MNs/g
Panel 2 ((0.025m/0.66)+(0.025m/0.66)+(0.1m/0.04 ((0.025mx26.3)+(0.025mx26.3)+(0.1mx9.71)+(0.1mx9. 94) +(0.1m/0.0494)+(0.15m/0.033)) 71)+(0.15mx10)) =8.7 m2K/W =4.757 MNs/g
Panel 3 ((0.35m/0.33)+(0.0127m/0.128)+(0.013m/ ((0.35mx10)+(0.0127mx60.6)+(0.013mx38.5)) 0.178)) =10.8 m2K/W
=4.770 MNs/g

283
Jacob Coleman, Hans-Christian Wilhelm
Table 3: Properties of prefabricated panel designs.
Weight Thermal resistance Vapour resistance Panel 1 582.3 Kg 7.2 m2K/W 4.714 MNs/g Panel 2 528.1 Kg 8.7 m2K/W 4.757 MNs/g Panel 3 273.8 Kg 10.8 m2K/W 4.770 MNs/g
7. DiscussionPanel 1 only makes a minor alteration on existing prefabricated straw panels such as Ecococon and ModCell® with the addition of pure wool insulated top and bottom plates. Panel 1 is, therefore, the least speculative of the three designs. Panel 2 combines wool’s low density and superior insulative properties with straw’s ability to support the bio-based vapour-permeable material of clay plaster. It is, therefore, more insulative than panel 1 and more vapour-permeable than panel 3. Panel 2 occupies a useful middle ground in terms of vapour and thermal resistance. The presence of the clay plaster on panels 1 and 2 does make the panels significantly heavier than panel 3; however, a crane can easily be used on site. Panel 3 is a pure wool insulated substitute for the Ecopanel. As expected, panel 3 is the lightest and most insulative (table 3) of the three designs due to the exclusive use of pure wool insulation. However, panel 3 forgoes the ability to support clay plaster and as a result, suffers a mild reduction in vapour-permeability compared to panels 1 and 2, which can support clay plaster (table 3). The panels can support a timber rain screen over a vented cavity to improve weather resistance. These designs will be competing with many existing prefabricated panels already available in NZ that do not use bio-based insulation materials such as panels produced by NZSIP, Metrapanel, and SIPForm. Although prefabrication will reduce the construction cost associated with the panels, the weight of panels 1 and 2 will require more substantial foundations which will increase the cost.
8. ConclusionThere is continuing research in NZ investigating prefabricated straw bale wall panels. However, this research investigates the potential of using pure wool insulation in a prefabricated wall panel and the potential of combining it with compressed straw insulation like that used in the Ecococon panel. This paper proposes three prefabricated wall panel designs that are insulated with straw and/or wool insulation as a means to increase the market share of bio-based insulation materials in NZ. Panels 1 and 2 seek to improve upon existing prefabricated straw panels from ModCell® and Ecococon by increasing the thermal resistance and decreasing the weight of the panel by incorporating pure wool insulation. Panel 3 seeks to improve upon the wool-blend insulated Ecopanel, which is produced in NZ, by proposing a truly bio-based pure wool insulated alternative.
8.1. Limitations
The design proposals presented in this study are purely conceptual. Aspects of their design, such as window and door openings, location of services, and connections to adjacent panels, walls, floors, and roofs have not been developed as yet. Additionally, numerical simulations or physical prototypes of the designs have not been undertaken. Therefore, testing of the designs’ construction, durability, and structural and hygrothermal performance have not been physically or digitally tested.

284
Concepts for a prefabricated wall panel to increase the uptake of straw and wool insulation in New Zealand
8.2. Further Research
Hygrothermal simulation would provide verification of the designs’ hygrothermal performance in NZ’s climate. In addition, physical prototypes will be essential to carry out physical testing and provide assurance of the designs’ performance in the areas mentioned above. A feasibility study would also be valuable to determine the viability of the panels and their cost compared to existing prefabricated panels available in NZ. A life-cycle assessment, as well as calculations of the embodied energy and emitted CO2 of the panels, would also further this research and provide an understanding of the environmental impacts of the panels.
References Black Mountain Insulation. (2020). NatuWool Technical Sheet.
https://www.blackmountaininsulation.com/NatuWool_Technical_Sheet.pdf BRANZ. (2015). Straw Bale. BRANZ. (2020). Insulation. http://www.level.org.nz/fileadmin/downloads/Materials/LevelMInsul.pdf Brunsdon, N., & Magan, C. (2017). Physical characteristics of new houses 2017. BRANZ. DensGlass®. (2017). DensGlass®Sheathing Technical Guide. Georgia-Pacific. Ecococon. (2017). ENVIRONMENTAL PRODUCT DECLARATION (EPD) EcoCocon Straw Modules (Panels). Ecococon. (2020a). Planning Guide. https://ecococon.eu/professionals/downloads Ecococon. (2020b, February 13). Ecococon—Our Story. Ecococon. https://ecococon.eu/us/blog/2020/ecococon-our-
story Ecococon. (2020c). Details. Ecococon. Ecopanel. (2018). What are Ecopanels made of? Ecopanel. https://www.ecopanel.co.nz/faq Götze, S., & Naderer, G. (2019). From the attitude-behaviour-gap to a producer-people-gap? International Journal of
Sustainable Development & World Ecology, 26(5), 377–388. https://doi.org/10.1080/13504509.2019.1578701 Hall, M. (2014). Is there a place for natural building in New Zealand’s conventional housing market? - A prefabricated
straw bale case study. 26. Hall, M. (2015). Guidelines for strawbale construction in New Zealand. Hall, M. (2019). Counting straw: The capacity of New Zealand’s grain growing sector to supply straw for construction. Hutching, G. (2018). US company buys NZ wool for home insulation. https://www.stuff.co.nz/business/105955733/us-
company-buys-large-tonnage-of-nz-wool-for-home-insulation Isaacs, N. (2010). Keeping warm with rainbows of colour. BRANZ. Kaiser, C., Schöpgens, H., Spritzendorfer, J., & Tuschinski, M. (2020). Market overview: Insulation materials made from
renewable raw materials. FNR. Kennedy, J. F., Smith, M. G., & Wanek, C. (2014). The Art of Natural Building-Second Edition-Completely Revised,
Expanded and Updated: Design, Construction, Resources. New Society Publishers. http://ebookcentral.proquest.com/lib/vuw/detail.action?docID=5180757
Kimberley, M. O., McKinley, R. B., Cown, D. J., & Moore, J. R. (2017). Modelling the variation in wood density of New Zealand-grown Douglas-fir. New Zealand Journal of Forestry Science.
Magwood, C. (2016). Essential Prefab Straw Bale Construction: The Complete Step-by-Step Guide. New Society Publishers. http://ebookcentral.proquest.com/lib/vuw/detail.action?docID=4560615
McChesney, I. G., & Cox-Smith, I. R. (2008). Thermal Insulation in New Zealand homes: A status report. Beacon Pathway Limited and Foundation for Research, Science and Technology.
McDonough, W., & Braungart, M. (2002). Cradle to cradle: Remaking the way we make things. North point press. ModCell®. (2020). ModCell® Projects. ModCell® Straw Technology. https://www.modcell.com/projects/

285
Jacob Coleman, Hans-Christian Wilhelm
Morton, T., Stevenson, F., Taylor, B., & Smith, C. (2005). Low-cost earth brick construction. Arc Chartered Architects, Fife.
Nash, A. (2017). Permeability of Common Building Material to Water Vapor. University of Alaska Fairbanks, Cooperative Extension Service.
Nicol, A., & Saunders, C. (2008). Meat and wool—Wool production and processing. https://teara.govt.nz/en/meat- and-wool/page-6
Omondi, S. (2017). The World’s Top Wool Producing Countries. https://www.worldatlas.com/articles/the-world-s- top-wool-producing-countries.html
Overton, G. (2015). Water Vapour in Wall. BRANZ. Pringle, R. (2016). Straw into Gold. Racusin, J. Deva. (2012). The natural building companion: A comprehensive guide to integrative design and
construction. Chelsea Green Publishing. Sigmund, B. (2017). Prepare the way for bio-based insulation materials. https://www.detail.de/artikel/weg-fuer-
biobasierte-daemmstoffe-bereiten-30179/ Statistics New Zealand. (2017). Dwelling and Household Estimates: September 2017 quarter – tables.
http://archive.stats.govt.nz/browse_for_stats/population/estimates_and_projections/DwellingHouseholdEstim ates_HOTPSep17qtr.aspx#gsc.tab=0
TenWolde, A., McNatt, J. D., & Krahn, L. (1988). Thermal properties of wood and wood panel products for use in buildings. Oak Ridge National Lab., TN (USA); Forest Service, Madison, WI (USA). Forest ….
Tuzcu, T. M. (2007). Hygro-thermal properties of sheep wool insulation. USG Boral. (2019). USG Boral Sheetrock HD Technical Data Sheet. Vares, O., Ruus, A., Raamets, J., & Tungel, E. (2017). Determination of hygrothermal performance of clay-sand plaster:
Influence of covering on sorption and water vapour permeability. Energy Procedia, 132, 267–272.

286
The 54th International Conference of the Architectural Science Association (ANZAScA) 2020
Conceptualising future proof homes
Carla Resendiz1, Farzad Rahimian2 , Nashwan Dawood3 , Sergio Rodriguez4 and Phillippa Carnemolla5 1, 2, 3, 4 Teesside University, Middlesbrough, United Kingdom
{c.resendizvillasenor1, f.rahimian2, n.n.dawood3, s.rodriguez4}@tees.ac.uk 5 University of Technology Sydney, Sydney, Australia
Abstract: When health changes due to age, accidents or other life circumstances, the time spent at home tends to increase considerably, and comfort levels can become strained. This research aims to build a framework to conceptualise a house able to support its users’ wellbeing through time, starting with an analysis of older adults’ experiences and needs. The ongoing project follows an exploratory sequential mixed method on the Scottish Highlands, and this paper explains the qualitative stage of the research. Following a systematic literature review, ethnographic data were collected with several community groups in small towns and rural areas of Scotland. In future stages, a housing solution will be developed with an interdisciplinary focus, including potential users in participatory design activities. Findings include insights on emotional meaning about ‘home’, day to day challenges related to house space distribution and elements or resources that enable users. This analysis will set up the specification for a new future proof timber frame home concept.
Keywords: Human-centred design; elderly; wellbeing; future-proof home.
1. IntroductionA demographic shift of population ageing is happening worldwide, and countries are looking at how to increase wellbeing levels as their population age. By 2043 there will be more than 10 million households headed by someone aged 65 or more in the United Kingdom, increasing to 54% the cyphers of 2016 (Office for National Statistics, 2019). The UK Government is making efforts to improve the quality of life in this sector of the population. In 2019 the Healthy Ageing Challenge Framework was published (Centre for Ageing Better, 2019), to establish the plan on how to improve life quality in later years, promoting partnerships to deliver market solutions. Healthy ageing is defined by this framework, following the World Health Organization (WHO), as ‘the process of maintaining the functional ability that enables wellbeing in older age’. An individual achieves functional ability by an intrinsic capacity (physical and mental health) and their environment (extrinsic factors).
There is a growing trend associated with individuals needing to be uprooted from homes that can no longer adequately meet their needs and associated forced relocation. This situation can be a very stressful and costly experience, often impacting on an individual’s wellbeing at a time in their life when less change is better. The Centre for Ageing Better (2019) pointed out that 80% of the participants of a survey denied willing to move home as getting older. When forced relocation happens, the financial
Imaginable Futures: Design Thinking, and the Scientific Method. 54th International Conference of the Architectural Science Association 2020, Ali Ghaffarianhoseini, et al (eds), pp. 286–295. © 2020 and published by the Architectural Science Association (ANZAScA).

287
Carla Resendiz, Farzad Rahimian , Nashwan Dawood , Sergio Rodriguez and Phillippa Carnemolla
challenge affects not only the individuals and their families but society. Public expenditure projections on social services for older people show a rise from around £7.2 billion (0.45% of GDP) to £18.7 billion (0.75% of GDP) in 2040, based on the numbers of 2015. (Age UK, 2019) However, it is possible to reduce the demand for health and social care if people can remain in good health for longer (Centre for Ageing Better, 2019).
2. Literature review
2.1 Wellbeing and ageing
The concept of ‘wellbeing’ has evolved with time, and literature shows several definitions. For this research, it is framed by the MacArthur Model of Successful Ageing and the Wellbeing Balance Model by Dodge, Daly et al. Despite the MacArthur Model was published from the first time on 1987, is still valid and used as a reference in gerontological studies (Rowe and Kahn, 2015). The model includes the areas: a) Low Risk of disease b) Maintenance of high mental and physical function and 3) Continued engagement with life. Dodge et al. (2012) proposed a definition of wellbeing, describing it as the balance point between an individual’s resources and the challenges faced by the individual, as shown in Figure 1:
Figure 1. Wellbeing: homeostasis between resources and challenges. (Dodge et al., 2012) The WHO describes in its ‘World Report on Ageing and Health’ (2015) wellbeing and healthy ageing as
the process of developing and maintaining the functional ability, enabling wellbeing in older age, and emphasises that many older adults maintain good functional ability and experience high levels of wellbeing despite the presence of one or more diseases, again, referring to Figure 1, balance/homeostasis can be achieved despite the presence of illness and is not a state, but a changing process. Ansari (2019) explains that 60% of 70-year-olds and 20% of 90-year-olds in the UK are ‘fit’, meaning they are capable of maintaining this homeostasis, being healthy or successfully managing health conditions, and able to execute most of their activities independently.
2.2 Future proof housing
Appropriate housing can keep older people healthy, support them to live independently and reduce the need for social care (Carnemolla and Bridge, 2019). People want to remain at home as they get older, a research of the Centre for Ageing Better (Ansari, 2019) pointed out that 80% of participants responded they did not want to move as a consequence of getting older.
To understand the qualities of a home designed for ageing in place, the National Design Guide from the Ministry of Housing (Ministry of Housing, 2019) in the UK, defines “well designed” homes as

288
Conceptualising future proof homes
functional, accessible, sustainable, and providing internal environments and external spaces that support the health and wellbeing of their users. The National House Building Council (NHBC) Foundation (2016) made a historical analysis of how housing has evolved in the UK since the 1900s. It then framed the question: “Could well designed, stylish and safe homes suited to downsizing or single person occupancy become a more common new house type within 20 years?”. To make this ‘new house type’ work, even in remote locations, requires a greater level of detailed analysis.
Older people get impacted by housing characteristics as they age at home. The House of Commons (2018) lists housing characteristics that can affect them, such as low quality, un-adapted, hazardous, poorly heated and poorly insulated accommodations. Consequences can be reduced mobility, depression, chronic and acute illness, falls, social isolation, loneliness and depression. (Age UK, 2019) Literature indicates that thermal comfort is another variable to take into account for users wellbeing, considering a healthy indoor environment able to maintain a temperature of 23 C in living areas and 20 C in bedrooms (Scottish Government, 2018). The design should consider maximising direct sunlight through windows and adopt a glazing system to permit heat trap and minimise heat loss to the exterior envelope of the building (Hammad et al., 2019)
The National Health Service (better known as NHS) in the UK (2018) has a support program for older adults to make adjustments to their properties and allow them to stay at home for longer and increasing their independence. Modifications can go from adding grab rails to fitting a stairlift. Carnemolla and Bridge (2016) measured the impact of housing modifications on older people’s wellbeing and found that improving accessibility led to a 40% increase in Health-Related Quality of Life.
2.3 Scottish context
In 2019, the Scottish Government reported the demographic age shift, showing the most significant increase since 1998, 31% on the +75 group, while on the other side, the population aged 0-15 decreased by 8%. The Healthy Life Expectancy (HLE) refers to the number of years a person will enjoy good health. The gap between Life Expectancy and Healthy Life Expectancy is getting bigger, and the HLE projection for Scottish people shows that males born in 2015-2017 can expect to spend 62.3 of 77.0 years of good health. Females born between the same years can expect to enjoy 62.6 of 81.1 years of good health, variations are defined by gender and access to services (National Records of Scotland, 2019).
According to the National Records (2020), the Highlands has the 7th highest population in Scotland (235,540) as well as the lowest population density (8 persons per square kilometre), including the most remote and sparsely populated parts of the United Kingdom, and the consequence: Being isolated from various service provisions, especially healthcare. The study ‘Scotland’s Wellbeing’ shows the perception of the quality of public services such as transport and health services has been decreasing in rural areas (Scottish Government, 2019). This situation was foreseen since the publishing of the Strategy for Housing Scotland’s Older People back in 2011 (Scottish Government) and dictating “should be accessible and adaptable and meet the needs of older people”, considering the lack of availability of suitable housing for older people in remote and rural areas. The strategy remarks on the importance of new build to meet the needs of an ageing population, and specifies that new options to have an increased potential of accommodating people with mobility needs.
Some references portrait remote contexts in Scotland, such as the report from Age Scotland (Muncie, 2019), which focused on the Orkney Islands and how older people is using government support to adapt their houses to increase the level of comfort. Subjects for the study were asked about their

289
Carla Resendiz, Farzad Rahimian , Nashwan Dawood , Sergio Rodriguez and Phillippa Carnemolla
current and future housing plans, showing that 61% do not intend to move in the future. Only 11% have considered moving because their facilities are perceived as unsuitable (high running costs and single level property is preferred).
The ‘Housing our ageing population’ report, referenced as HAPPI (Best and Porteus, 2016) exhorts the industry to introduce ‘care ready’ features in houses, integrating new home technologies, keeping users connected and increasing their sense of autonomy. Ball and Nanda (2013) mention the importance of independent living and how it is correlated to health and general wellbeing.
2.4 Human-centred design
The Human-Centred Design (HCD) process puts users in the centre of a product/service development, to increase the possibilities of success of that product. Using HCD decreases the chances of bias and assumption, and provides vital information for details when selecting the best product characteristics.
Maguire(2001) explains HCD process as an iterative cycle that starts with planning, understanding and specifying the context of use, specifying the user’s requirements, producing design solutions and finally, evaluating the proposals against need; this cycle is repeated until the solution better meets the requirements, and is based on the ISO 13407 standard on human-centred design (ISO, 1999), which was already updated to a novel version (ISO, 2019). Bowmast and Tait (2018) accentuate the importance of fieldwork, as the situation of ‘making the wrong product well’ is a common mistake in the industry. Using this approach, the efforts to discover first which product to develop, making emphasis on the strategy, to afterwards, analyse reactions, interactions and usability, improving that product until it’s ready for market launch.
The World Health Organization published the Vancouver Protocol (2007) as a guide to understand the needs of older people and integrate them as specifications for new developments and adaptations in an urban context, evaluating the level of age-friendliness of a city. The protocol gives a step by step guide for gathering information from diverse groups of citizens using focus groups, sustained by the fact that the convergence of rapid demographic ageing and urbanisation makes it critical to design cities to support and enable the massive increase of older residents.
Following the literature review, it became apparent that housing characteristics affect or help their users in many ways. There is an opportunity to develop our understanding not only of housing design but locally – with very little research undertaken that explores the impact of ageing in place in more remote areas-. The researchers identified two main areas of opportunity 1. Can the age-friendliness evaluation of the Vancouver Protocol be addressed in a rural context? 2. What resources determine wellbeing for people living in remote areas?
3. MethodologyTo address these questions we undertook qualitative research, as part of an ongoing exploratory sequential mixed methods research (Cresswell and Cresswell, 2018) on the Scottish Highlands. This paper focuses on the qualitative stage of the general research and is described in Figure 3. The first phase was a systematic literature review, followed by data collection from ethnography (observation, focus groups and case studies), data analysis and report.
Delimited by the fact this project is taking place in the area of Scotland with the lowest population density, this research used convenience sampling, approaching already established institutions and groups. Care homes (staff and users), carers and community groups were included.

290
Conceptualising future proof homes
Figure 3. Methodology: Qualitative Research for the conceptualisation of a future proof home.
3.1 Systematic review
A systematic literature review took place online in scientific databases: Research Gate, Science Direct, Emerald Insight, Design and Applied Arts Index and Google Scholar, searching for the keywords: Human- centred design, universal design and design for the elderly.
3.2 Ethnographic research
The term ethnography refers to the study of shared patterns of behaviours, language and actions of a cultural group in a natural setting over a period of time (Cresswell and Cresswell, 2018), in this research data collection involved participant observation, a comparative – descriptive case study and the application of focus groups to collect people’s insights. Next, we will explain each one of these methods.
3.2.1 Participant observation
This method is used to make an embodied, visceral journey into the socially and culturally distinctive way of life of a particular group of people, in this case, the users in a residential care home, ‘in order to know what it is to inhabit their environment, live their social relations, understand their preoccupations and appreciate their values and feelings about each other and what matters in their world.’ (Evans, 2012)
3.2.2 Focus groups
Focus groups are considered a tool to provide descriptions and experiences directly from a specific group, in this case of older persons, highlighting advantages, disadvantages and suggestions for improvement. Two focus groups were executed with the participation of community groups. The Vancouver Protocol was used as a guide.
3.2.3 Case studies
A comparative - descriptive case study (Yin, 2018) took place, analysing the experience of 2 households, where the families are active users for the NHS care at home program in the Scottish Highlands. The analysis consisted of evaluating the main challenges they face at home and how they use their

291
Carla Resendiz, Farzad Rahimian , Nashwan Dawood , Sergio Rodriguez and Phillippa Carnemolla
resources. This analysis employed a Journey Map format (Folstad and Kvale, 2018), comparing the results from the two user’s inputs.
4. ResultsThe results of this research, describe how the elderly and their support group interact with their space, and which are the main challenges and resources to achieve the balance and execute their day to day activities. The study consisted of a sample of 25 participants, who signed an Informed Consent form after explaining the generalities of this research. Two participants decided to opt-out from the Focus Group sessions. The average age of the group is 68.9 years old, 13 female and 12 men, 93% are already retired. All participants were asked to self-rate their health, scoring 4 when Excellent, 3 Good, 2 Fair and 1 Poor, average answer was 2.8 , and only 6 considered that their Activities for Daily Living are limited by a health condition. Thirteen participants share the house with their couple, and the rest live by themselves. Next, the insights of each activity of the methodology will be described.
4.1. Systematic review
The systematic review highlighted the M2 Building Regulations (HM Government, 2015), the Lifetime Homes Design Guide (Goodman, 2011) and the Design Brief for Building Homes in the Highlands (The Highland Council, 2017); these documents are a relevant part of the framework as they offer details of minimum dimensions and best practices for increased accessibility, not only for elderly or people using mobility aid, but also thinking about other scenarios when increased accessibility can be beneficial, for example the case of parents with toddlers (Goodman, 2011).
4.2 Ethnography
For each method of the ethnography study, we present an analysis of the correlation between the Successful ageing model and the resources and challenges highlighted by the users.
4.2.1 Participant observation
In a care home setting, the researchers immersed in the public space of the residence and participated with the staff during weekly sessions. The sessions took place over two months, and included the welcoming and arranging of users in their seating spots of the living room, participating in the exercise sessions, serving breakfast and tea, guiding arts and crafts activities, guiding group games, and then preparing the users to move to the dining room to have lunch. Observations regarding challenges and resources were noted in a research journal, and the main insights are described in Table 1.
4.2.2 Focus groups
Based on the previously described Vancouver Protocol, a series of Focus Group sessions were executed with two community groups. First, the guide was adapted (Table 2) to have an emphasis on housing in a rural context. Data collected from the sessions were analysed, and the insights described in Table 3.

292
Conceptualising future proof homes
Table 1. Insights of wellbeing at home - Care-home Residents
Challenge Resources Low risk of disease
Maintenance of high mental and physical function.
Continued engagement with life.
Going to the toilet independently can represent a victory for walking-aid users. Food, drink and medication reminders are set by the staff. Thermal comfort in public areas of the residence can vary. Use of heating and additional warming with blankets. Activities organised and guided by the care home staff, also food intake and medication supply. Chairs, walking aids, wheelchairs are common amongst the users. Space dimensions and doors width allow use of these devices. Fire doors make it difficult to circulate between areas of the residence. Mind engaging activities, such as games, arts and crafts, music, promote residents interaction. Carers take notes of health, actions and reactions of the residents. There are members of the community who volunteer and visit the residents, taking the time to chat with them. Even family members or friends of a resident can engage with unrelated residents. Opportunity to practice their hobbies boosts energy and excitement. Television is essential for most of them to feel connected to the ‘outside’. Contact with visiting kids or pets has similar ‘boosting’ impact.
Table 2: Vancouver protocol Adaptation (Adapted from World Health Organization (2007))
Section Original questionnaire Detail of change Adapted questionnaire Context Urban: Cities and accessible towns. Adapted according
to the Scottish Government Urban/Rural Classification
Rural: Very remote small towns, accessible rural, remote rural and very remote rural settlements.
Warm-up What is it like to live in (city) as an older person? Good features? Problems?
Focus on home, make the participants share how they perceive their housing situation.
What makes a house a home? Good features? Problems?
Main Questions
Include topics: Outdoor spaces and buildings, transportation, housing, respect and social inclusion, social participation, communication and information, civic participation and employment, community support and health.
Emphasis on: Housing, community support and health services, outdoor spaces and buildings.
What is it like to step outside of your home to go for a walk to get fresh air, run errands or visit? Detail to understand the type of house they live in, acceptability (cost, comfort, physically safe, security, proximity to services) and mobility and independence in the home.
Informed consent
WHO Informed consent form. No changes WHO Informed consent form +

293
Carla Resendiz, Farzad Rahimian , Nashwan Dawood , Sergio Rodriguez and Phillippa Carnemolla
Table 3. Insights of wellbeing at home – Community groups
Challenge Resources Low risk of disease
Maintenance of high mental and physical function Continued engagement with life
Keeping the house warm and well maintained. Participants see health deterioration as a future concern, but they keep their checkups on time, and they keep as active as possible. Participants are part of the community group to maintain physical and social activity. They also do other physical activities. Use of step counters was prevalent. Hobbies and contact with nature are essential. Contact with family and friends. Physical contact preferred over a virtual connection. Loneliness was mentioned several times as a generalised feeling by the individuals living by themselves.
4.2.3 Case study
An analysis of a day in the life of two volunteers of the community took place using a journey map format, to construct the comparative - descriptive case study. The participants were asked to list the activities of a day in their week. Then, the activities were rated with a value from +3 to -3. They applied the highest value to the events where users felt more empowered and the lowest ranking, where they felt more restricted. They made a separation between ‘regular days’ and ‘bad days’, stating the second category as the ones where they are feeling more restricted because of their health. Some elements, such as extra furniture, were detected as ‘enablers’ to increase users wellbeing. Insights associated with challenges and resources are described in Table 4.
Figure 5. Extra chairs and extra space for mobility detected as elements that enable users.
Table 4. Insights of wellbeing at home - NHS care at home users.
Challenge Resources Low risk of disease
Maintenance of high mental and physical function. Continued engagement with life.
Use of extra chairs and seats and adaptations of cupboards to reach upper areas and to rest when they are tired. Use of furniture as a grab rail while moving inside the house. Afraid of falling down the stairs. Manage their social activity with a physical planner and mobile phone. Use of reminders to take medication. Both users have a mobility aid when needed for longer distances or on ‘bad days’ with even more reduced mobility. Both users evaluated with the highest rating having a space for being productive (arts and crafts studio or home-office) and watching TV. Both users live with their couple and have constant contact with their children and grandchildren. Active participation in social groups. Garden is essential but difficult to maintain. In ‘bad days’ it’s good to have contact with the outside through the windows and to feel warm and ‘cosy’.
294
Conceptualising future proof homes
5. ConclusionsThis research offers a novel approach for ethnographic study with older people living in remote non- urban areas. The framework generated so far is unique in its design and application. Due to the extensive stakeholder group formation and setup of the research, there was a high level of awareness and involvement of both the local communities and caregivers. Other projects concerning vulnerable users in non-urban settings point that the participants social, cultural and financial capacities are context-specific, and might differ with other communities or contexts (Smits Michaël Willem, 2019). This research is expected to have a positive impact in the remote areas of Scotland and to open the possibility to be the base of the design process for Elderly Villages in rural settings. The projected population changes mean that the researchers expect increasing demand from housing associations and developers seeking to provide future proof dwellings.
Next stages of this research have been adapted due to COVID-19 restrictions, and ethnography and testing should be executed using online and virtual reality technologies, as well as simulations to test the efficiency of the typologies proposed (Cody et al., 2018). New approaches to the methods should be taken into account, including ‘virtual ethnography’ (Teli et al., 2007). We expect the contributions to provide the basis for developing a set of products to be brought to market and to have a high resonance with a demand that is looking forward to building homes to ensure a high quality of life.
Acknowledgements We want to acknowledge the participation of the care homes of the Highlands: management, staff and residents who shared their space and time with the researchers for this project. A big thank you to the leaders and members of the community groups, to caregivers and volunteers who made the Case Study possible. This research is part of a Knowledge Transfer Project between Norscot Joinery, Teesside University and Innovate UK.
References
Age UK (2019) Later Life in the United Kingdom, Age UK. Ansari, L. (2019) When We're 64 : Your Guide to a Great Later Life, ed., Bloomsbury Publishing PLC, London. Ball, M. and Nanda, A. (2013) Household attributes and the future demand for retirement housing, International
Journal of Housing Markets and Analysis, 6(1), 45-62. Best, R. and Porteus, J. (2016) HAPPI 3 Housing our ageing population: Positive ideas, Housing Learning and
Improvement Network (LIN). Bowmast, N. and Tait, M. (2018) Nick Bowmast's Userpalooza: A Field Researcher's Guide, ed., Nick Bowmast. Carnemolla, P. and Bridge, C. (2016) Accessible Housing and Health-Related Quality of Life: Measurements of
Wellbeing Outcomes Following Home Modifications. , Arch Net-IJAR, 10. Carnemolla, P. and Bridge, C. (2019) Housing design and community care: How home modifications reduce care needs
of older people and people with disability. , International journal of environmental research and public health. (16)
Centre for Ageing Better (2019) Healthy Ageing Challenge Framework. Cody, B., Loeschnig, W. and Eberl, A. (2018) Operating energy demand of various residential building typologies in
different European climates, Smart and Sustainable Built Environment, 7(3/4), 226-250. Cresswell, J. W. and Cresswell, J. D. (2018) Research Design., 5th ed., Los Angeles.

295
Carla Resendiz, Farzad Rahimian , Nashwan Dawood , Sergio Rodriguez and Phillippa Carnemolla
Dodge, R., Daly, A. P., Huyton, J. and Sanders, L. (2012) The challenge of defining wellbeing, International Journal of Wellbeing, 2, 222-235.
Evans, G. (2012) Practising participant observation: an anthropologist’s account, Journal of Organizational Ethnography, 1(1), 96-106.
Folstad, A. and Kvale, K. (2018) Customer journeys: a systematic literature review, Journal of Service Theory and Practice, 28(2), 196-227.
Goodman, C. (2011) Lifetime Homes Design Guide, ed., IHS BRE Press, London. Hammad, A., Akbarnezhad, A., Grzybowska, H., Wu, P. and Wang, X. (2019) Mathematical optimisation of location
and design of windows by considering energy performance, lighting and privacy of buildings, Smart and Sustainable Built Environment, 8(2), 117-137.
HM Government (ed.) (2015) The Building Regulations 2010. Approved Document M Volume 1. House of Commons (2018) Housing for Older People. ISO (1999) ISO 13407:1999 Human-centred design processes for interactive systems. Available from: International
Organisation for Standardization <https://www.iso.org/standard/21197.html> (accessed 7 July 2020). ISO (2019) ISO 9241-210:2019 Ergonomics of human-system interaction — Part 210: Human-centred design for
interactive systems Available from: International Organisation for Standardization <https://www.iso.org/standard/77520.html> (accessed 7 July 2020).
Maguire, M. (2001) Methods to support human-centred design, International Journal of Human-Computer Studies, 55, 587-634.
Ministry of Housing, Communities & Local Government, (2019) National Design Guide, Ministry of Housing, Communities and Local Government London.
Muncie, S. (2019) Older People and Housing, Age Scotland Orkney, Edinburgh. National House Building Council Foundation (2016) Homes Through the Decades, ed. National Records of Scotland (2019) Healthy Life Expectancy in Scottish Areas 2015-2017. National Records of Scotland (2020) Highland Council Area Profile. Available from:
<https://www.nrscotland.gov.uk/files/statistics/council-area-data-sheets/highland-council-profile.html> (accessed 16 July 2020).
NHS UK (2018) Home adaptations. Available from: <https://www.nhs.uk/conditions/social-care-and-support- guide/care-services-equipment-and-care-homes/home-adaptations/29 > (accessed 29 June 2020).
Office for National Statistics (2019) National population projections: 2018-based. Rowe, J. and Kahn, R. (2015) Successful Aging 2.0: Conceptual Expansions for the 21st Century., Journals of
Gerontology, Series B: Psychological Sciences and Social Sciences,, 70, 593–596. Scottish Government (2011) Age Home and Community - a strategy for housing Scotlands Older people 2012-2021,
ed., Edinburgh. Scottish Government (2018) Health Impact of the Fuel Poverty Strategy. Available from: Scottish Government
<https://www.gov.scot/publications/fuel-poverty-target-definition-strategy-scotland-bill-fuel-poverty- strategy/> (accessed 9 May 2020).
Scottish Government (2019) Scotland’s Wellbeing – Delivering the National Outcomes, The National Performance Framework Team, Edinburgh.
Smits Michaël Willem, M. (2019) A quasi-experimental method for testing rural design support within a DRM framework, Smart and Sustainable Built Environment, 8(2), 150-187.
Teli, M., Pisanu, F. and Hakken, D. (2007) The Internet as a Library-Of-People: For a Cyberethography of Online Groups, FQS Forum: Qualitative Social Research, 8(3).
The Highland Council (2017) Design Brief: Building Homes for the Highlands, Firm Foundations. World Health Organization (2007) WHO Age-Friendly Cities Project Methodology. Vancouver Protocol, World Health
Organization, Geneva, Switzerland. World Health Organization (2015) World Report on Ageing and Health, Geneva, Switzerland. Yin, R. K. (2018) Case study research and applications: design and methods, 6th ed., Los Angeles.
http://www.nrscotland.gov.uk/files/statistics/council-area-data-sheets/highland-council-profile.html
http://www.nrscotland.gov.uk/files/statistics/council-area-data-sheets/highland-council-profile.html
http://www.nrscotland.gov.uk/files/statistics/council-area-data-sheets/highland-council-profile.html
http://www.gov.scot/publications/fuel-poverty-target-definition-strategy-scotland-bill-fuel-poverty-

296
The 54th International Conference of the Architectural Science Association (ANZAScA) 2020
Condensation Analysis Extension to the Nationwide House Energy Rating Scheme (NatHERS) Software
Tim Law1, Dong Chen2
1Victoria University, Melbourne, Australia, [email protected] 2CSIRO, Australia, [email protected]
Abstract: The Nationwide House Energy Rating Scheme (NatHERS) in Australia governs the software programs that model energy use in residential houses. Currently, these programs all utilise the Chenath engine that models energy and temperature dynamically. With the inclusion of brand-new condensation provisions into the 2019 version of the National Construction Code (NCC), there is a need to expand the functionality of NatHERS software to undertake dynamic hygrothermal analysis. A plugin has been developed to apply the Glaser method of vapour transport in the building's fabric as a step subsequent to building simulation. Although this approach is simplified and has been known to err on the side of caution, the undertaking not only assists in the valuation of the building fabric's vapour management, but also opens up ways of further inquiry into the physics of condensation, and biology of fungal growth. The extension is scripted in R and produces graphical outputs for dewpoint analysis and vapour transport. This allows building practitioners who are new to condensation analysis to be cognisant of where and how much condensation is occurring, and whether recovery is possible before mould germination commences.
Keywords: condensation; hygrothermal simulation; risk analysis; mould.
1. Introduction
In May 2019, condensation provisions were introduced for the first time into Australia's National Construction Code (ABCB, 2019). This requirement, comprising three specific clauses, was implemented across domestic detached houses and multi-residential buildings (Volume Two 3.8.7.1 and Volume One F6 respectively, ABCB, 2019). In summary, for the cooler climate zones (Zones 6-8 being temperate, cool temperate and alpine) the code requires a vapour permeable membrane on the side of the drained cavity in external walls. In addition, humid area mechanical ventilation rates were specified, and if these exhausts were discharged into the roof, a minimum amount of ventilation openings in the eaves and ridge was specified. A verification method (V2.4.7, Volume Two; or FV6, Volume One) stipulates functionality requirements for hygrothermal modelling, which needs to meet the following requirements:
Imaginable Futures: Design Thinking, and the Scientific Method. 54th International Conference of the Architectural Science Association 2020, Ali Ghaffarianhoseini, et al (eds), pp. 296–305. © 2020 and by the Architectural Science
Association (ANZAScA).

297
Tim Law, Dong Chen
2. The state of condensation software in Australia
Although condensation assessment software is far from commonplace in the Australian Building sector, two programs have been gaining a following: WUFI (by the Fraunhofer Institute for building physics) and JPA Designer. WUFI has had decades of development and represents the specialist end of sophisticated condensation analysis. Australia, having only recently included condensation provisions to the construction code, will for the time being need a simpler method of analysis, something closer to what JPA Designer provides, the software screenshot as seen in Figure 1.
Figure 1.Condensation analysis user interface from JPA Designer.
FV6 Condensation management. Compliance with Performance Requirement FP6.1 is verified when modelling that assesses the effects of— (a) indoor and outdoor temperature and humidity conditions; and(b) heating and cooling set points; and(c) rain absorption; and(d) wind pressure; and(e) solar radiation; and(f) material hygrothermal properties, determines that moisture will not accumulate— (g) interior to the primary water control layer within a building envelope; or(h) on the interior surface of the water control layer.

298
Condensation Analysis Extension to the Nationwide House Energy Rating Scheme (NatHERS) Software
The take up of condensation software is a far cry from that for energy efficiency. In Australia the four software used for evaluating projected energy use (AccuRate, First Rate, BERS and HERO) are essentially different front ends which all utilise the same simulation engine: Chenath. The name derives from a combination of the previous software, Cheetah, which featured quick computation of dynamic simulation based on algorithms developed by Muncey (1979); and the suffix “-nath” being short for NatHERS (Nationwide House Energy Rating Scheme), the Australian house energy efficiency rating system.
3. Motivations for developing an engine from scratch
The domination of the market by NatHERS software, and the lack of extensibility of it to undertake condensation risk assessments presents a natural opportunity. The common use of the Chenath engine is to generate the house energy consumption based on the climate type, reflected as a star rating. The national mandated minimum is 6-stars (with 10-star being close to, or effectively, no heating and cooling requirement with location variations). However, the Chenath engine does much more, in particular it produces a detailed hourly projection of internal temperatures which can be extracted to run a hygrothermal assessment.
The impetus to develop this hygrothermal extension came from a few quarters. The process of software introduction to the Australian construction industry is typically a long process, thus it would be far better to embed a plugin into the NatHERS workflow for which energy assessors were already familiar with. Software like JPA Designer utilises a Glaser (1958) method as published in ISO13788 (2012) which simulates condensation and evaporation on a monthly basis. However, this resolution can be too coarse to identify mould-associated condensation risks, seeing it was only a matter of days that mould germination could occur as shown in the isopleths of Figure 2, obtained from AIRAH (2016) Application manual DA20: Humid Tropical Air Conditioning and the WHO (2009) Guidelines for indoor air quality: dampness and mould. WUFI on the other hand was highly specialised and new users would be faced with a learning curve steeper than any of the NatHERS accredited programs.
Figure 2. (Left) Mould germination and growth isopleths from AIRAH (2016). (Right) Mould germination and growth isopleths from WHO (2009).

299
Tim Law, Dong Chen
Instead of developing a commercial program, the motivation was to make a condensation tool that was open-source, with the code made freely available to other building scientists for further development. Thus, instead of working around a ‘black box’ of proprietary code, this hygrothermal simulation engine would be accessible so other scientists could 'peek under the hood' and modify the engine for their own purposes, and share their code snippets, bug fixes, improvements and so forth back on GitHub. The present version has been written in the open statistical programming language R (R Core Team, 2016), for which many scientists would already be familiar with. By keeping the code legible to other building scientists, the programming script, even though slower than object-oriented programming languages, could be better distributed and co-developed. At this nascent stage, development of vapour migration principles into simulation and graphical presentation was deemed more important than computer runtime efficiency.
Chenath can be run with any climate set to the Australian Climate Data Bank Reference Meteorological Year (ACDB-RMY). The RMY picks, on a monthly basis, a characteristic month in the past 10-25 years and concatenates 12 of these months into a year (NIWA, 2017). Similar to a TMY (Typical Meteorological Year), the RMY is a selection of averages rather than extremes, resulting in an underestimating of the frequency of condensation.
This new program we have called Hyenath as a working name, being a hy-grothermal function added to Chenath, and because a hyena is ostensibly slower than a cheetah. Thus the hope is that with this disclosure, users will be more forbearing in their expectations.
4. Hyenath Simulation
As a proof of concept, a reference house is acquired based on standardised model derived from the software accreditation protocol (NatHERS, 2019). The model is situated in the cool temperate climate of Hobart, Tasmania. The wall specification taken from the ISO13788 example, seen in Table 1, has been used for running the simulation. However, to make the condensation problem more visible in the simulation, the membranes have been substituted with values taken from the Australian Standard AS4200.1 (2017) as follows:
• Vapour control layer (sd of 50m) has been replaced with a Class 2 vapour barrier of 0.0726 μg/N.s (or sd of 2.7567 m).
• Vapour permeable membrane has been substituted with an Australian Class 4 vapour permeable membrane of 1.1403 μg/N.s (or sd of 0.1754 m).
By looping the hourly simulation in Hyenath, the output g, the density of water vapour flow rate (kg/m² ·s). The values of gc for condensation, and ge for evaporation are determined hourly and concatenatedand graphed over a year of 8760 hours to show the overall moisture accumulation trend.

300
Condensation Analysis Extension to the Nationwide House Energy Rating Scheme (NatHERS) Software
Table 1. Wall properties (ISO13788,2012). Materials with asterisk (*) indicate Australian substitutions.
d (m) R (m²·K/W) μ sd (m) External resistance 0.04 Brick 0.105 0.136 8 0.840 Unventilated cavity 0.05 0.18 Permeable membrane* 0.175* Plywood 0.012 0.092 90 1.100 Insulation 0.14 3.5 1 0.200 Vapour control layer* 2.756* Plasterboard 0.0125 0.06 12 0.150 Internal resistance 0.13
To illustrate the implications of this hourly record, an arbitrary threshold of 48 hours continuous moisture (i.e. when condensation is not fully evaporated) is set as a criteria for the onset of mould growth and indicator of mould risk. At this stage the assumption is that the wall is fully shaded, and solar effects will be developed at the next step. Figure 3 (top) marks the points at which the threshold criteria was breached (blue lines), together with a more detailed view of the instance where this happened, Figure 3 (bottom). Looking closer, we can observe the germination phase of mould during the period when moisture is continuously available, and the hyphal growth phase following it.
Figure 3. Hyenath simulation (8760 hr/yr) with a snapshot of the period of onset of persistent condensation.

301
Tim Law, Dong Chen
The next step was to develop the solar-air temperature (sol-air T) so as to account for the effect of direct and diffuse radiation on different wall orientations. As a proof of concept, direct radiation was calculated from the sun position with the cosine law of incidence (Szokolay, 2004). A simplified sol-air T model was used with a static coefficient of heat transfer by radiation and convection at outer surface of h0 = 17W/(m²·K); solar absorptance =0.7, and no ground reflection. Diffuse solar was decreased by multiplying by a factor of 0.5, in line with the Chenath engine.
Initial results using a built-in climate file showed near identical results for east and west walls. On further investigation, it was found that the climate file (climat62.txt) had a rather unusual daily symmetry for both direct and diffuse radiation in contrast to actual measurements from the Bureau of Meteorology (BoM) for Hobart, as revealed in Figure 4. This suggests that the solar radiation for climate62 might be generated analytically due to lack of measurement data at the time of the weather file development, reinforcing the need to use measured data for a hygrothermal analysis.
Figure 4. Direct and diffuse solar radiation for the same time periods, comparing built in climate file climat62.txt (left), as opposed to BoM data (right).
Using BoM weather data, the results of no solar (full shade) is compared with that for the four main orientations in Figure 5. It can be seen that the south wall, even though it does not benefit from direct sunlight during winter is still much better with the presence of diffuse radiation than the case of full shade. The north wall has no condensation persisting for more than the threshold period of 48h. The west wall performs better than the east, as one would expect intuitively as the occurrence of radiation is concurrent with higher temperatures resulting in a stronger evaporation drive.
The utility of a script becomes evident in this process, offering flexibility to redefine the parameters for condensation risk analysis, which could even be a varying condition based on temperature and humidity isopleths seen previously in Figure 3. This allow the risk analysis to respond to new insights from microbiologists since presently the quantifiable interactions between microorganisms and the built environment is still emerging. What is evident is that a much higher sensitivity to the conditions for mould onset is achieved with the combination of (1) the use of measured site data and (2) undertaking hourly condensation-evaporation simulation.

302
Condensation Analysis Extension to the Nationwide House Energy Rating Scheme (NatHERS) Software
Figure 5. Hyenath simulations using full shade, and sol-air T for south, north, east and west facing walls.

303
Tim Law, Dong Chen
5. Discussion
As a proof-of-concept, the priority for this software extension was to have a simplified but complete package that included the vapour diffusion model, quantification of accumulated condensation, and a simple index to quantify the condensation risk based on a mould growth threshold. The greatest benefit of developing a condensation risk analysis engine from scratch was the ability to customise the display parameters to provide only such information that were of principal interest, in this case it was that of moisture persistence graphs for walls of different bearings. Upon this graphical output, the engine could be continually developed to incorporate other relevant considerations, such as rainfall penetrating past the wall cladding.
At the same time, it became evident to the authors that a more complete integration between Chenath and Hyenath needed to be achieved by taking the sol-air T of individual walls from Chenath as inputs for simulating the hygrothermal behaviour against the internal zone temperature and humidity. This approach would reduce the repetition and errors of data input and, more importantly, acquire the rich environmental information such as external shade objects (e.g. roof eaves, trees and neighbouring buildings) and ground cover reflectance already included and determined by the Chenath engine.
The time to execute the R scripts is listed in Table 2. As an average house can have around 50 external ‘walls’ (each zone and orientation defines the wall as a different one) it would be worth pursuing different resolutions as the need for deeper analysis justified it. A coarse resolution (with a 10h simulation time step) will flag walls that were most problematic, and these walls could then be further investigated with an hourly simulation.
Table 2. Computer run time for R scripts.
Execution time (s) Task
0.0 Define paths and scripts
2.0 Read climate file and room by room AccuRate simulation data to memory
1.4 Generate solar positions for 8760h by longitude/latitude, calc sol-air delta T for 16 wall bearings
32.4 gc ge calculations (hourly)
5.7 gc ge calculations (5 hourly)
2.9 gc ge calculations (10 hourly)
0.1 Plot accumulated moisture and breached thresholds (for 8760h)
The key differences between the ISO13788 implementation of Glaser method, and the Chenath- Hyenath variation of it is consolidated in Table 3.

304
Condensation Analysis Extension to the Nationwide House Energy Rating Scheme (NatHERS) Software
Table 3. Summary of ISO13788 core implementation and Chenath-Hyenath features. ISO 13788 Core implementation
Chenath-Hyenath
Weather file Monthly average Hourly: hourly RMY if using built in climate files; or hourly recorded if using externally sourced BoM data.
Effect of evaporation on accumulated moisture
Resolved over a year Resolved over days, enables a mould growth threshold to be set, e.g. 48 hours of continuous moisture
Internal air temperature Simplified derivation from daily mean
Internal humidity classes Selected from 5 humidity classes, with variation based on external temperature
Pre-set heating-cooling loads based on occupancy of different room types through a day, with different thermostat setpoints for awake vs sleeping occupants Moisture load based on number of occupants and typical occupant movement pattern in and out of, and within, a house.
Condensation surfaces Up to two condensing planes Currently one condensing plane. Further work planned to calculate and display multiple condensing planes
6. Conclusion
Hyenath is a script written in R that allows a Glaser type analysis in accordance with ISO13788. Hyenath extends the functionality of the Australian legislated Chenath engine by taking the simulation with a changed context of utilising BOM records in place of default weather files for better accuracy and currency. Although the ISO13788 method is simplified, the condensation-evaporation measurements can be extended by making a slight modification so as to undertake hourly simulations rather than monthly ones, providing the nuance needed to ascertain if a threshold period is breached for the germination of mould.
As a closing remark, this project derives much inspiration from the book The Cathedral & the Bazaar: Musings on Linux and Open Source by an Accidental Revolutionary (Raymond & O’Reilly, 2001), extolling the benefits of a vibrant and open exchange of programming ideas in the open-source world akin to a bazaar, as opposed to the cloistered world of secretive software development no different from artisans working on a cathedral away from the public gaze. One of the principles, and the one most pertinent here, is:
“Given a large enough beta-tester and co-developer base, almost every problem will be characterized quickly and the fix obvious to someone.”
It is the authors’ hope and invitation that any others interested in the physics of condensation and biology of mould will find the software script useful for further development.

305
Tim Law, Dong Chen
References ABCB (Australian Building Codes Board). (2019). National Construction Code: Volume 1. Australian Building Codes
Board. AIRAH, Australian Institute of Refrigeration, Air Conditioning and Heating. (2016). DA20 Humid Tropical Air
Conditioning. Australian Institute of Refrigeration, Air Conditioning and Heating. Ambrose, M., & Syme, M. (2015). House Energy Efficiency Inspections Project—Final Report. CSIRO.
http://www.nathers.gov.au/sites/prod.nathers/files/publications/House%20Energy%20Efficiency%20Inspect %20Proj.pdf
Boland, J., Ridley, B., & Brown, B. (2008). Models of diffuse solar radiation. Renewable Energy, 33(4), 575–584. https://doi.org/10.1016/j.renene.2007.04.012
Glaser, H. (1958). Simplified calculation of vapour diffusion through layered walls involving the formation of water and ice. Kalttetechnik, 10, H11, S. 358-364 und H 12 S. 386-390.
Glaser, H. (1959). Graphisches Verfahren zur Untersuchung von Diffusionsvorglinge. Kalfetechnik, 10, 345–349. ISO (International Standards Organisation). (2012). Hygrothermal performance of building components and building
elements—Internal surface temperature to avoid critical surface humidity and interstitial condensation— Calculation methods (ISO 13788:2012) (2nd ed.).
Law, T., & Dewsbury, M. (2018). The Unintended Consequence of Building Sustainably in Australia. In W. Leal Filho, J. Rogers, & U. Iyer-Raniga (Eds.), Sustainable Development Research in the Asia-Pacific Region: Education,Cities, Infrastructure and Buildings (pp. 525–547). Springer International Publishing.https://doi.org/10.1007/978-3-319-73293-0_31
NatHERS. (2012). Nationwide House Energy Rating Scheme (NatHERS) – Software Accreditation Protocol. https://www.nathers.gov.au/sites/default/files/2019- 10/NatHERS%20Software%20Accreditation%20Protocol-June%202012.pdf
NatHERS. (2019). Nationwide House Energy Rating Scheme (NatHERS) – Software Accreditation Protocol. https://www.nathers.gov.au/sites/default/files/2019- 10/2019%20NatHERS%20Software%20Accreditation%20Protocol.pdf
NIWA. (2017). Creation of NatHERS 2016 Reference Meteorological Years Including Maleny and Christmas Island. https://www.nathers.gov.au/sites/default/files/2016%2520Climate%2520File%2520NIWA%2520Report.pdf
R Core Team. (2016). R: A language and environment for statistical computing. R Foundation for Statistical Computing. https://www.R-project.org/
Raymond, E. S. (2001). The Cathedral and the Bazaar. http://www.unterstein.net/su/docs/CathBaz.pdf Raymond, E. S., & O’Reilly, T. (2001). The Cathedral & the Bazaar: Musings on Linux and Open Source by an
Accidental Revolutionary (1 edition). O’Reilly Media. Standards Australia. (2002). AS/NZS 4859.1:2002 Materials for the thermal insulation of buildings, Part 1: General
criteria and technical. Standards Australia. (2017). AS/NZS 4200.1:2017 Pliable building membranes and underlays. Part 1: Materials. Szokolay, S. (2008). Introduction to architectural science. Architectural Press. World Health Organisation (WHO). (2009). Guidelines for Indoor Air Quality: Dampness and Mould. World Health
Organization Regional Office for Europe.

306
The 54th International Conference of the Architectural Science Association (ANZAScA) 2020
Consolidating construction loads: A future pathway to sustainability?
Kamal Dhawan1, John E. Tookey2, Ali GhaffarianHoseini3, and Amirhosein GhaffarianHoseini4 1, 2, 3, 4 Auckland University of Technology, Auckland, New Zealand
[email protected] [email protected]
[email protected] [email protected]
Abstract: The New Zealand construction sector responds comparatively slowly to modern business and management philosophies, owing to its geographical isolation. The sector faces multifarious challenges, inter alia, skill shortages, poor productivity, uptake of current construction methods, insufficient knowledge sharing and collaboration, fragmentation, and limited Research and Development. Notable governmental efforts to achieve sector transformation include Construction Sector Accord (2019) and Construction Sector Transformation Plan (2020). A resultant long-term initiative is a NZ$ 2.4bn contract between Watercare and their supply chain partners, for capital water works delivery across Auckland, over 10 years; a Construction Consolidation Centre (CCC) proposed as a logistics solution. Though collaborative delivery and CCCs have been researched in in Europe, Continental America, and Australia, New Zealand is an exception. The specific geography of Auckland and associated logistical planning constraints create a unique contextual research opportunity for adding significant value to the wider corpus of construction logistics understanding in New Zealand. The paper aims to define a research direction in the domain of applying Supply Chain Management principles to the New Zealand construction sector by investigating the employment of a CCC in a collaborative environment as an infrastructure project delivery vehicle with sustainability leanings.
Keywords: Construction Consolidation Centre; Sustainability; Collaborative Delivery; Logistics.
Abbreviations used: (C) CC - (Construction) Consolidation Centre; CM - Construction Manager; EIA - Environmental Impact Assessment; GC - General Construction; H&S - Health and Safety; LC - Lean Construction; LCA - Lifecycle Assessment; LCC (A) - Lifecycle Cost (Assessment); (I) LPD (S) - (Integrated) Lean Project Delivery (System); MSME - Micro, Small and Medium Enterprise; NZBCSD - New Zealand Business Council for Sustainable Development; (s) ROI - (Sustainable) Return on Investment; SA - Sustainability Appraisal; (S) (C) SC (M) - (Sustainable) (Construction) Supply Chain (Management); SCIRT - Stronger Christchurch InfrastructureRebuild Team; SPI - Sustainability Performance Indicator; TDS - Traditional Delivery Systems.
1. The construction industry: A preambleBy 2050, circa 68% of the world’s population would live in urban areas, up from 55% in 2018 (UN DESA, 2019). Increasing inhabitants, visitors, urban complexity, and quality of life expectations require ever greater construction sector performance. The built environment continually sees increased demand for construction, repair, and renovation. Construction projects improve accessibility, functionality, and energy efficiency, leading to attractive, sustainable, economically viable, and vibrant urban areas (Balm and van Amstel, 2017). Construction is an essential component of improvement of overall quality of life and its sustainability.
“Construction is the broad process/mechanism for the realisation of human settlements and the creation of infrastructure that supports development. This includes the extraction and beneficiation of raw materials, the manufacturing of construction materials and components, the construction project cycle from feasibility to deconstruction, and the management and operation of the built environment” (Du-Pleiss, 2002, p. 4). Construction typically contributes circa 6% to GDP of developed nations (UNECE, n.d.). It generates employment, and creates and improves infrastructure, while supporting its supplier businesses. A peripatetic and project-based industry, it moves to where work is (Vrijhoef and Koskela, 2000). In producing infrastructure (the end product) at the designated location (point of use), it seeks delivery and removal of various materials and resources to and from each site at nominated times (Janné and Fredriksson, 2019). It frequently operates in urban areas, including cities and large built up areas. Construction projects are individually unique, quite distinct from mainstream manufacturing. From convergence of the SC directing all materials to the
Imaginable Futures: Design Thinking, and the Scientific Method. 54th International Conference of the Architectural Science Association 2020, Ali Ghaffarianhoseini, et al (eds), pp. 306–315. © 2020 and published by the Architectural Science Association (ANZAScA).

307
Kamal Dhawan, John E. Tookey, Ali GhaffarianHoseini, and Amirhosein GhaffarianHoseini
construction site, to operations being centred around a single “product” (the construction project) in-situ, all peculiar to the constructed project. Temporary SCs are created by repetitive reconfiguration of project organisations during each phase - design, site preparation, construction, and commissioning. Each project has a customised SC, peculiar to itself and its actors, with limited standardisation (Guerlain, Renault and Ferrero, 2019). Most construction businesses work on precedence without a systematic business strategy or process, despite increasing pressures of competition and profit (Cox and Ireland, 2002). Typically, these are not well integrated and do not embody SCM best practices. Heavy reliance on contractual sanction instead of participants agreeing on methods for achieving sound financial objectives, leads to adversarial relationships. Such operating methods invariably create a competitive – arguably confrontational and transactional environment for profit generation, leading to conflict and litigation, damaging the project at the fundamental level. It discourages responsible proponents, and attracts bidders wanting win at any cost. Anomalies cause adversarial relationships, increase transactional costs and foster “best-for-individual” instead of “best-for- project” culture (Dubois and Gadde, 2002). Fragmentation is endemic in construction. Involved parties focus primarily on achieving individual objectives and maximising their own profits, ignoring consequences to other participants or the project. It manifests multi-directionally viz Vertical (demarcation of project phases), Horizontal (each phase executed by different agencies) and Longitudinal (simultaneous management of different projects by different organisations; nearly non-existent knowledge and information dissemination due to lack of effective communication). It prevents continuity and integrated approach to work, directly influencing implemented business models and management philosophies (Balm and van Amstel, 2017).
2. The New Zealand construction sector: Specific issuesA large number of MSMEs comprise the New Zealand construction industry, with only circa 10% of the 59712 construction businesses having six employees or more (Statistics New Zealand, 2019). It is isolated from the rest of the world owing to its peculiar geographical location (Naismith, Monaghan, Zhang, Doan, GhaffarianHoseini and Tookey, 2016), and responds comparatively slowly to improved philosophy. This results in delayed introduction of new ideas; typically lagging UK initiatives by about eight years. In turn, new initiatives to upgrade construction have major knowledge, understanding and skills deficits (Ying and Tookey, 2014). Its performance (productivity), compared to peer domains, has not been very encouraging (Figure 1).
Figure 1: New Zealand construction sector productivity: A historical perspective (Source: BRANZ, 2018)
In April 2019, the Construction Sector Accord was launched between the government and industry leaders, based on the long felt need for fundamental improvements. It creates a platform for industry and government to work together to meet some of the key challenges including skills and labour shortages, unclear regulations, lack of coordinated leadership, uncertain pipeline of work, and a culture of shifting risk. An ecosystem that depends on the high performance of its components, bringing everyone together to support the collective cause. The Accord Development Group is made up of 13 sector leaders from across industry and government. Stakeholders aim to transform the sector through Increased Productivity, Raised Capability, Improved Resilience and Restored Confidence, Pride and Reputation. This was followed up by a three-year Construction Sector Transformation Plan during January 2020, a blueprint for resolving the sector’s long-term challenges around risk, overly complex contracts, and skills development. Focus areas are labour and skills shortages; poor H&S performance; sluggish innovation and adoption of new technologies; limited uptake of state-of-the-art construction methods; lack of knowledge sharing and collaboration; fragmented leadership; inadequate risk understanding and management; poor business management practices; unregulated nature of the sector; and distrust between actors (MBIE, 2019, 2020). Until the impact of COVID-19, the New Zealand construction industry had been on the upswing. It generated increased employment (circa 7.2%) and contribution to the GDP of New Zealand (from 6.29% to 6.33%) during 2019. Its worth was forecast to reach NZ$ 43bn by 2021 (MBIE, 2017, 2019; Statistics New Zealand, 2019). The long-term impact of COVID-19 on the sector, though,

308
Consolidating construction loads: A future pathway to sustainability?
remains to be seen. Whilst the current posture of the industry is sub-optimal, it does offer significant opportunities to substantially improve, a ‘benefit’ of starting low – it is much easier to demonstrate significant contribution to improved performance.
3. Supply chain management and logistics in construction
3.1. Construction supply chain management
SCM may be defined as “The systemic, strategic coordination of the traditional business functions and the tactics across these business functions within a particular company and across businesses within the supply chain, for the purposes of improving the long-term performance of the individual companies and the supply chain as a whole” (Mentzer, DeWitt, Keebler, Min, Nix, Smith and Zacharia, 2002, p. 18); and “The integration of key business processes from end-user through original suppliers, that provides products, services, and information that add value for customers and other stakeholders” (Lambert, Croxton, Garcı á-Dastugue, Knemeyer and Rogers, 2006, p. 2). The application of SCM in manufacturing has achieved substantial transferrable improvements. It views the entire SC, rather than only the neighbouring entity, level, or process, aiming to increase transparency, and align coordination and configuration, across functional and corporate boundaries. The shift is based on moving from traditional management (transformation view of production by controlling each stage independently), to SCM (flow view of production by controlling the total flow of production). The deep-rooted fragmentation in construction makes SCM particularly suited for achieving integration between internal and external actors. Since construction projects have highly customised requirements with repeated redesign of the SC during the project lifecycle, the focus needs to be project rather than organisation centric. Application of SCM principles can lead to cost and performance modelling of subcontractor and supplier production, improved scheduling methods (especially for design and placement of buffers against uncertainty and changes), improved subcontractor coordination by linking site production to resource management, and improved accounting and production control systems (Tiwari, Shepherd and Pandey, 2014). CSCM may be defined as “A system where suppliers, contractors, clients and their agents work together in coordination to install and utilise information in order to produce, deliver materials, plant, temporary works, equipment and labour and/or other resources for construction projects” (Hatmoko and Scott, 2010, p. 36). Important issues of CSCM are illustrated at Figure 2.
Figure 2: The CSC interplay (L) (Source: Vrijhoef and Koskela, 1999); Key issues affecting CSCM (Source: Adetunji, Price and Fleming, 2008)
Adoption of CSCM is driven by the need for visibility, detection of waste and problems, and integration of fragmented control (Vrijhoef and Koskela, 2000). Its primary concern is coordinating delivery of discrete quantities of materials (and associated specialty engineering services) to specific construction projects. Taking a system view of the production activities of independent production units (suppliers and sub-contractors), it focusses on their global optimisation, rather than optimising management functions separately (Tran and Tookey, 2012). CSCM demands changes in culture and behavior that have historically been adversarial, short term and opportunistic, plagued by a fluctuating demand cycle, uncertain conditions and fragmentised process. Barriers to CSCM are difficulty in creating and maintaining a shared vision and strategy; achieving and maintaining significant internal and external behavioural change; and overcoming near lack of trust and commitment in collaborative activities. The roles of CSCM may be cited as – reduction in costs and duration of site activities without disrupting the workflow (focus on the relationship between the site and direct suppliers); reduction in logistics costs, lead-time and inventory (focus on the SC); reduction in costs and duration (achieve wider concurrency between activities); and improving SC and site production, subsuming site production into SCM (Vrijhoef and Koskela, 1999, 2000).
Two routes for achieving SCM in construction have been suggested in literature. A: Operational efficiency and effectiveness by collaboration based on equitable relationships, with integration and cooperation as solutions to fragmentation, adversarial culture, and low profit margins; and B: Strategic efficiency and effectiveness by way of power-based collaboration. The strategically placed dominant player creates a structural hierarchy of relatively dependent suppliers who pose no threat to the flow of value appropriation while passing value to the dominant player (Adetunji et al., 2008).

309
Kamal Dhawan, John E. Tookey, Ali GhaffarianHoseini, and Amirhosein GhaffarianHoseini
3.2. Construction logistics
Construction logistics are integral to CSCM, in terms of project management as well as costs. They involve preparation, management, coordination, and control of product flow from raw material processing to final utilisation, and reverse logistics of waste removal and disposal. Construction project success depends heavily on coordination between Whole-project, Supply and On-site logistics, in all aspects (Ying and Tookey, 2014). Contextual definitions of logistics (management) may be taken as “…the entire complex of measures aimed at getting the right equipment, the right materials and the right workers with the right level of quality to the right construction site at the right moment and at minimum cost to meet the customer’s requirements” (Quak et al., 2011 (in Dutch) cited by Balm and van Amstel, 2017, p. 3); “…that part of supply chain management that plans, implements, and controls the efficient, effective forward and reverse flow and storage of goods, services and related information between the point of origin and the point of consumption in order to meet customers' requirements” (Calis, Kivrak and Coffey, 2018, p. 1092). Four approaches link CSCM and construction logistics viz Traditionalist - SCM is a special way of logistics; Unionist - logistics is a part of SCM, the latter being more complicated due to more variables, and involved actors and participants; Intersectionist - both have their respective elements, but also common areas and activities; and Re-labelling - renames logistics as SCM, the Unionist being the most widely accepted (Larson and Halldorsson, 2004).
4. Sustainability in construction
4.1. Sustainable construction
Sustainability is best defined from the Brundtland Report as “Development that meets the needs of the present without compromising the ability of future generations to meet their own needs.” (WECD, 1987, p. 8). It is comprised of natural environment (Planet), society (People), and economic performance (Profit) (3 P’s) (Carter and Rogers, 2008) or the “Triple Bottomline (3BL)”. It implies objective social (and environmental) performance measurement, reporting results, and using them to improve performance. In doing so, firms can expect better long-term financial performance (Norman and MacDonald, 2004). In assenting to “Agenda 21” of the Brundtland Report, New Zealand accepted that construction activities “… can be a major source of environmental damage through depletion of the natural resource base, degradation of fragile ecozones, chemical pollution and the use of building materials harmful to human health”, agreeing to adopt “… standards and other regulatory measures which promote the increased use of energy efficient designs and technologies and sustainable utilisation of natural resources in an economically and environmentally appropriate way”. In signing the “The Habitat Agenda” (1996), it committed that “…the impacts of the construction industry should be brought into harmony with the environment” (Warnock, 2005). “Sustainable construction is a holistic process aiming to restore and maintain harmony between the natural and built environments and create settlements that affirm human dignity and encourage economic equity” (Du-Pleiss, 2002, p. 8). It applies sustainability principles to every stage of the project life cycle from planning, extracting and converting raw material, constructing, usage, destruction, and waste management. Conscious design aims to decrease effects on consumption of natural resources and ecological systems (Yilmaz and Bakis, 2015). It transcends environmental domain, embracing economic and social domains for adding value to individual and communal quality of life (Du-Pleiss, 2002). New Zealand Government encourages sustainability through various programmes and legislation inter alia, Sustainable Development Programme of Action, Govt3, EECA’s Energy Wise Government Programme, Agenda 21 and Cities for Climate Protection Programme, Resource Management Act, Building Act, and an interim Green Building Council (MfE, 2005). Dimensions of sustainable construction are at Figure 3.
Figure 3: The sustainable construction process (Source: Kibert, 2005)

310
Consolidating construction loads: A future pathway to sustainability?
4.2. Sustainable construction management
Sustainability demands that the complete project be viewed from inception to completion, not only the execution phase. Significant outcomes of strategies applied in other domains, especially manufacturing, have been customized and applied to construction, departure being in terms of waste removal, iterative development, early stakeholder involvement, communication, coordination, collaboration, and value generation. Lean Project Delivery System employs the LC concept to understand, identify and eliminate causes and sources of (process and physical) waste in the end-to-end design, driving end user value by applying Transformation-Flow-Value (T-F-V) generation theory of production. Construction processes address ‘T’; ‘F’ reveals the interdependency of tasks across the project process, introducing waste reduction as a production management objective; ‘V’ brings clients, stakeholders and actors (internal and external to the project and process), into focus (Koskela, Stratton and Koskenvesa, 2010), improving integration and information flow (Ballard, 2008). 32 lean tools applicable to construction have been analysed in literature (Ansah, Sorooshian, Mustafa, Duvvuru, 2016), categorized under Design and Engineering, Planning and Control, Construction and Site Management, and H&S (Babalola, Ibem and Ezema, 2019). Virtual Design Construction, Design Structure Matrix, Last Planner System, Concurrent Engineering, and Value Stream Mapping are the more commonly applied ones. Agile Project Management advocates an enterprise structure enabling proactive and quick adaptation to change, seizing it to enhance value outcomes. Common themes include empowered, multi- disciplinary, small teams to develop value iteratively, incrementally, and continuously, transforming evolving requirements, products, or processes, to provide early enhanced value for stakeholder(s). Project evolution forces scope control to be defined from current comprehension and prioritisation of value realisation and risk mitigation. Project team learning can then be used for control and feedback, treating the project as a process and not as a series of prescoped milestones (Owen, Koskela, Heinrich and Codinhoto, 2006). Integrated Lean Project Delivery (ILPD/IPD) brings CM/GC, owner, and designer together in the early design phases, rather than at different points in time as in TDS. The strategy hinges on the IPD Team and the Core Group, each having specific functions and objectives. The IPD Team (architects, CM/GC, subcontractors, suppliers, and owner) facilitates collaborative design, construction, and commissioning, creating an open and creative environment for transparent and cooperative information exchange. The Core Group (owner’s, architect´s, and CM/GC’s representatives) applies LPD principles to project coordination, management, and administration. Operating boundaries between parties, communication protocols and authorities are established in the commercial contract (Alarcón, Mesa and Howell, 2013). Figure 4 brings out graphical representations of LPDS and ILPD.
Figure 4: LPDS (L) (Source: Ballard, 2008) and ILPD (R) (Source: Alarcón et al., 2013)
Target Value Design introduced implementation of “designing to target cost” technique, from inception to completion. It aims to eliminate waste, keeping design and cost aligned, while delivering customer value; drive design for value delivery through customer constraints, connecting design methods to the owner’s business case; and provide for IPD through stakeholder collaboration. The project value proposition creates a target value cost model, in turn creating parametric tools to inform the design and project decision process. It streamlines construction along the T-F-V perspective, with a set of tools based on lean principles, interlinked in a continuous process, as opposed to TDS that base budgets and designs on historical models, with their inefficiencies (Miron, Kaushik and Koskela, 2015; Zimina, Ballard and Pasquire, 2012).
4.3. Benchmarking sustainability
Return on Investment is a robust metric to evaluate financial performance of a business. It is the ratio between operating income and invested capital. Economic Value Added is more comprehensive, with a different accounting philosophy, considering value added if earnings are more than total costs of capital employed (borrowed and equity), and value destroyed, if not (Obaidat, 2019).
Sustainability follows the capital theory approach, encompassing man-made, human, natural, and social capitals. It ensures constant capital stocks or at least constant capital services over time. At the business level, sustainability is judged by economic, environmental, and social performance, considering the above forms of capital. Sustainable ROI addresses whether an entity is better off by adopting each investment strategy versus

311
Kamal Dhawan, John E. Tookey, Ali GhaffarianHoseini, and Amirhosein GhaffarianHoseini
“business as usual.” It defines the objectives and desired outcomes of a project, followed by investment strategies and the baseline (a method to meet objectives). Incremental economic, social, and environmental impacts of each investment strategy are then identified, quantified (LCA) and monetized (LCCA), as departure from the baseline. The net economic benefit is the difference between the economic costs and benefits. The social and the environmental benefits are the sum of the respective incremental impacts, leading to Net Present Value (difference between the present value of the incremental benefits estimated over the period of analysis and LCC). Cost effectiveness is indicated by a Benefit Cost Ratio (difference between present value of the benefits and costs) of more than 1 (Bohmholdt, 2014). Sustainable Value Added considers efficiency and effectiveness of all three sustainability dimensions, monetarily representing the extra value created, adjusted for all changes in eco- and social effectiveness. It is not a proponent of substitutability of different capital forms (weak sustainability), rather it indicates paying less eco- or social-efficient users of resources to reduce exactly the environmental and/or social impacts in question, resulting in a constant overall level of eco- and social effectiveness (strong sustainability). It indicates how much a business has contributed to more sustainability on the benchmark datum, in benchmark units, and not whether it is sustainable or not (Fiffe and Hahn, 2004). Sustainability Appraisal is an integrated assessment of economic, environmental and social effects, applied to optimise gains, while avoiding undue risks and potentially significant adverse effects. It effectively assesses development options for best practicable sustainability outcomes but can also be applied ex-post for assessing decision-making. Its framework enables an appraisal of planning options or strategies and is derived from an international three pillar model of sustainability (economic, natural and social), and from relevant international or national policies as well as local factors. The New Zealand context includes a fourth cultural dimension pillar. The two essential characteristics are an integrated analysis of the (four) effects of development proposals, and an evaluation of their significance against identified sustainable development criteria. SA evaluates alternative strategies (rather than the proposal) based on these, facilitating broader consideration of alternatives and integrated decision-making to address key impact factors simultaneously. It benchmarks strategies against sustainability criteria, rather than the current situation, and identifies objectives to be achieved. The top line of economic, environmental, and social objectives and targets, and the bottom line of key thresholds are the operating boundaries. SA has been applied successfully in the Canterbury Water Management Strategy, which grew from a narrow focus of water storage to integrated water resource management in an overall sustainability framework. The four stages were long-term water requirement and regional capacity analysis; technical investigation and multi stakeholder evaluation of water storage options; and strategy formulation with substantial stakeholder input and community engagement (Jenkins, Russel, Sadler and Ward, 2014). Table 1 illustrates evolution of impact assessment from EIA to SA in New Zealand.
Table 1. Evolving paradigm of impact assessment (Source: Jenkins et al., 2014)
4.4. Sustainable construction supply chain management
A comprehensive definition of SSCM is “The creation of coordinated supply chains through the voluntary integration of economic, environmental, and social considerations with key inter-organisational business systems designed to efficiently and effectively manage the material, information, and capital flows associated with the procurement, production, and distribution of products or services in order to meet stakeholder requirements and improve the profitability, competitiveness, and resilience of the organisation over the short- and long-term” (Ahi and Searcy, 2013). The model based on this definition is at Figure 5.
Figure 5: Sustainable CSCM Model (Source: Beske and Seuring, 2014)

312
Consolidating construction loads: A future pathway to sustainability?
The model manifests in the form of practices illustrated in Table 2.
Table 2. Sustainability practices in the CSC (Source: Pero, Moretto, Bottani and Bigliardi, 2017)
CSC sustainability dimensions and attribute categories are at Table 3. Each organisation designs customised SPIs based on its own requirements; nearly 100 such SPIs are indicated by Saeed and Kersten (2017).
Table 3. Sustainability dimensions v/s attribute categories (Source: Saeed and Kersten, 2017)
4.5. Sustainable construction logistics
Transport is the largest cost element of construction logistics. Construction materials, being low cost and high volume, account for circa 30% - 50% of a building project cost (Balm and van Amstel, 2017; Bowersox, 2013). Their transportation costs approximately 39% - 58% of the total logistics costs and between 4% - 10% of the selling price of the building (Shakantu, Tookey and Bowen, 2003). According to BRE (2003) these can vary between 10% - 20% of construction costs. Un-coordinated material supply and waste removal businesses lead to increase in vehicular traffic due to non-optimal utilisation of vehicles (DG MOVE European Commission, 2012). Most sustainable distribution strategies, at both the governmental and individual business levels, focus on reducing empty running of vehicles (McKinnon and Ge, 2006), to improve load factors which are consistently under 50%, lagging far behind other industrial domains (Vrijhoef, 2015). Sustainable transport is “…one that throughout its full life-cycle operation, allows generally accepted objectives for health and environmental quality to be met, for example, those concerning air pollutants and noise proposed by the World Health Organisation (WHO); is consistent with ecosystem integrity, for example, it does not contribute to exceedence of critical loads and levels as defined by WHO for acidification, eutrophication and ground level ozone; and does not result in worsening of adverse global phenomena such as climate change and stratospheric ozone depletion” (OECD, 2002, p. 16). Sustainable construction logistics are characterised by fewer movements, lesser handling, shortertransportation distances, better vehicle utilisation and energy efficiency (IEA, 2018; Ying and Tookey, 2014). The IPCC Report “Mitigation of Climate Change” (2014) suggests restructuring freight

313
Kamal Dhawan, John E. Tookey, Ali GhaffarianHoseini, and Amirhosein GhaffarianHoseini
logistics systems, modal shift to lower carbon transportation systems and lowering energy intensity of transportation by increasing freight load factors, as key focus areas (Kontovas and Psaraftis, 2016). Reduction in kilometres travelled by large trucks, raising their average loads, and cleaner distribution practices are focus areas in the New Zealand Energy Strategy to 2050 (Ministry of Economic Development, 2007). Auckland Regional Land Transport Plan 2018–2028 identifies adverse effects of increasing transport on the roads as a challenge (Auckland Transport, 2018). In addition to maximising profits and minimising costs and lead times, logistics systems now require focus on minimising the Total Environmental Impact (Kohn and Brodin, 2008).
5. The research opportunityWatercare is an Auckland Council owned entity providing reliable water and wastewater services in Auckland. It emphasises efficient service delivery and future proofing capabilities through infrastructure development, by planning, constructing, and delivering new water and wastewater infrastructure cost-effectively. Traditionally, Watercare projects have been procured and delivered as lump sum, design and construct or construct only (Duncan, 2019). Each project has been a standalone exercise, demonstrating short term CSCM thinking. A founding member of NZBCSD, they have been committed to sustainability since the 1992 World Earth Summit, balancing the economic dimension of 3BL against the environmental and social dimensions (Tregidga and Milne, 2006). They have recently commenced a programme to deliver capital water infrastructure works across Auckland, under a $2.4bn contract with their SC partners, over 10 years (“Watercare Inks Contract”, 2019). From previous tendering circa 11% of construction costs have been assessed as being attributable to transport (Turner, 2019). The programme proposes employing a CCC under collaborative project delivery, aiming at 20% construction cost and 40% construction carbon reduction by 2024, with 20% H&S improvements year on year (Duncan, 2019). This portfolio-based rethink of infrastructure procurement is a step change in practice, with potentially far reaching implications for future governmental procurements. An example of ‘Programme Alliancing’, not the classical ‘Project-by-project Alliancing’, it is a ‘first’ in New Zealand (though the SCIRT alliance model for rebuild, and NZTA project-by-project alliance models for road infrastructure exist) (Che Ibrahim, Costello, and Wilkinson, 2015; Wilkinson, Tookey, Potangaroa, MacGregor, Milicich, Ghodrati, Adafin, Stocchero, and Bayan, 2017). The alliance model has been adopted from the ‘Project 13 Enterprise Model’, a UK industry-led initiative to improve delivery and management of high-performing infrastructure, with an enterprise-based approach (ICE, 2018). Its duration will enable outcomes to drive change and improvement.
Figure 6: The Watercare adaptation of the P13 enterprise structure (Source: Duncan, 2019; ICE, 2018)
This provides a unique contextual research opportunity for examining the possible sustainability benefits of CCC based logistics solution for infrastructure project delivery in a collaborative environment. Previous research on the implementation of the CCC concept in continental USA, (West and East) Europe and Australia will enable contextual benchmarking of outcomes.
6. The proposed research directionA research gap regarding possible benefits of what may be called a ‘Programme Alliance’ employing a CCC as a logistics solution, towards horizontal infrastructure delivery exists in New Zealand. Precedents for implementation of collaborative delivery in the form of the SCIRT (rebuild) and NZTA (project-by-project alliancing) models exist, however, the ‘enterprise approach’ adopted by Watercare, is a ‘first’. Similarly, no precedent for employment of a CCC as a logistics solution for infrastructure projects exists in New Zealand, where-as the concept has been rigorously applied and researched in Europe, Continental USA, and Australia. With environmental and social considerations taking root slowly but surely, research possibilities are being nudged well into the sustainability domain. Discussion of energy efficiency, and creation of governmental road maps, drives research on issues concerning transport within the broader framework of logistics, to serious relevance. Innovation in project delivery models brings a whole new dimension of ‘collaboration’ into focus. Combined, these present a unique contextual research opportunity to examine impacts on 3BL, independently and against existing benchmarks. The overwhelming presence of possibilities presents multiple research directions, and even more threads. The possible research spectrum is presented in Figure 7, with research domains, questions and expected outcomes spawning outwards from the research object (the CCC), against the backdrop of sustainability.

314
Consolidating construction loads: A future pathway to sustainability?
References Figure 7: The research spectrum
Adetunji, I., Price, A. and Fleming, P. (2008) Achieving Sustainability in the Construction Supply Chain, Engineering Sustainability, 161(ES3), 161–172.
Ahi, P. and Searcy, C. (2013) A Comparative Literature Analysis of Definitions for Green and Sustainable Supply Chain Management, Journal of Cleaner Production, 52, 329–341.
Alarcón, L., Mesa, H. and Howell, G. (2013) Characterisation of Lean Project Delivery, Proceedings of the 21st Annual Conference of the International Group for Lean Construction, Fortaleza, Brazil.
Ansah, R., Sorooshian, S., Mustafa, S. and Duvvuru, G. 2016 Lean Construction Tools, Proceedings of the International Conference on Industrial Engineering and Operations Management, IEOM Society International, September 23-25, Detroit, USA.
Auckland Transport. (2018) Auckland Regional Land Transport Plan 2018-2028. Babalola, O., Ibem, E. and Ezema, I. (2019) Implementation of Lean Practices in the Construction Industry: A Systematic
Review, Building and Environment, 148, 34-43. Ballard, G. (2008) The Lean Project Delivery System: An Update. Lean Construction Journal 2018, 1–19. Balm, S. and van Amstel, W. (2017) Exploring Criteria for Tendering for Sustainable Urban Construction Logistics, in Taniguchi,
E. and Thompson, R.G. (eds.) City Logistics 1: New Opportunities and Challenges. Hoboken, USA: John Wiley & Sons, Inc,251–263.
Beske, P. and Seuring, S. (2014) Putting Sustainability into Supply Chain Management, Supply Chain Management, 19(3), 322–331.
Bohmholdt, A. (2014) Evaluating the Triple Bottom Line using Sustainable Return on Investment, REMEDIATION Autumn 2014 (Wiley Periodicals Inc). Available at: https://doi-org.ezproxy.aut.ac.nz/10.1002/rem.21404
Building Research Association New Zealand (BRANZ). (2018) Study Report SR 388 (2018) Productivity in the Construction Industry 2017.
Calis, G., Kivrak, S. and Coffey, M. (2018) The Benefits of Construction Logistics Centres in Construction Supply Chain Management, 5th International Project and Construction Management Conference (IPCMC 2018), Cyprus International University, Faculty of Engineering, Civil Engineering Department: North Cyprus.
Carter, C. and Rogers, D. (2008) A Framework of Sustainable Supply Chain Management: Moving Toward New Theory, International Journal of Physical Distribution & Logistics Management, 38(5), 360–387.
Che Ibrahim, C., Costello, S., & Wilkinson, S. (2015). Development of an Assessment Tool for Team Integration in Alliance Projects. International Journal of Managing Projects in Business, 8(4), 813-827.
Cox, A. and Ireland, P. (2002) Managing Construction Supply Chains: The Common Sense Approach, Engineering, Construction and Architectural Management, 9(5), 409–418.
DG MOVE European Commission. (2012) Study on Urban Freight Transport. Du-Pleiss, C. (2002) Agenda 21 for Sustainable Construction in Developing Countries – A Discussion Document, International Council for Research and Innovation in Building and Construction Technology, United Nations Environmental Programme International Environment Technology Centre, Pretoria, South Africa. Dubois, A. and Gadde, L. (2002) The Construction Industry as a Loosely Coupled System: Implications for Productivity and
Innovation, Construction Management and Economics, 20, 621–631. Duncan, A. (2019) Construction Lifelines. Unpublished proposal, BRANZ, New Zealand. Figge, F. and Hahn, T. (2004) Sustainable Value Added—Measuring Corporate Contributions to Sustainability Beyond Eco-
efficiency. Ecological Economics, 48(2), 173–187. Guerlain, C., Renault, S. and Ferrero, F. (2019) Understanding Construction Logistics in Urban Areas and Lowering its
Environmental Impact: A Focus on Construction Consolidation Centres, Sustainability, 11(21), 6118. Hatmoko, J. and Scott, S. (2010) Simulating the Impact of Supply Chain Management Practice on the Performance of Medium-
sized Building Projects, Construction Management and Economics, 28(1), 35–49. Institution of Civil Engineers (ICE). (2018) P13 Blueprint, London, UK. Intergovernmental Panel on Climate Change (IPCC). (2014) Climate Change 2014: Mitigation of Climate Change (AR5).
Cambridge Press, New York, USA. International Energy Agency (IEA). (2018) Global EV Outlook 2018 Towards Cross-Modal Electrification, Paris, France.

315
Kamal Dhawan, John E. Tookey, Ali GhaffarianHoseini, and Amirhosein GhaffarianHoseini
Janné, M. and Fredriksson, A. (2019) Construction Logistics Governing Guidelines in Urban Development Projects, Construction Innovation, 19(1), 89–109.
Jenkins, B., Russell, S., Sadler, B. and Ward, M. (2014) Application of Sustainability Appraisal to the Canterbury Water Management Strategy, Australasian Journal of Environmental Management, 21(1), 83–101.
Kibert, C. (2005) Sustainable Construction: Green Building Design and Delivery, John Wiley & Sons Inc, New Jersey, USA. Kohn, C. and Brodin, M. (2008) Centralised Distribution Systems and the Environment: How Increased Transport Work Can
Decrease the Environmental Impact of Logistics, International Journal of Logistics Research and Applications, 11(3), 229–245.
Koskela, L., Stratton, R. and Koskenvesa, A. (2010) Last Planner and Critical Chain in Construction Management: Comparative Analysis, Proceedings of the 18th Annual Conference of the International Group for Lean Construction (pp. 538-547), National Building Research Institute, Technion-Israel Institute of Technology.
Lambert, D., Croxton, K., Garcı ́a-Dastugue, S., Knemeyer, M. and Rogers, D. (2006) Supply Chain Management Processes, Partnerships, Performance, 2nd ed., Hartley Press Inc., Jacksonville, FL, USA.
Larson, P. and Halldorsson, A. (2004) Logistics versus Supply Chain Management: An International Survey, International Journal of Logistics: Research and Application, 7(1), 17–31.
McKinnon, A. and Ge, Y. (2006) The Potential for Reducing Empty Running by Trucks: A Retrospective Analysis, International Journal of Physical Distribution & Logistics Management, 36(5), 391–410.
Mentzer, J., DeWitt, W., Keebler, J., Min, S., Nix, N., Smith, C. and Zacharia, Z. (2002) Defining Supply Chain Management, Journal of Business Logistics, 22(2), 1–25.
Ministry for the Environment (MfE). (2005) Value Case for Sustainable Building in New Zealand, Wellington. Ministry of Business, Innovation and Employment (MBIE). (2017) National Construction Pipeline Report 201, Wellington. Ministry of Business, Innovation and Employment (MBIE). (2019) Construction Sector Accord, Wellington. Ministry of Business, Innovation and Employment (MBIE). (2020) Construction Sector Transformation Plan, Wellington. Ministry of Economic Development. (2007) New Zealand Energy Strategy to 2050: Powering our Future. Wellington. Miron, L., Kaushik, A. and Koskela, L. (2015) Target Value Design: The Challenge of Value Generation, Proceedings of the
23rd Annual Conference of the International Group for Lean Construction, July 29-31, Perth, Australia. Naismith, N., Monaghan, B., Zhang, T., Doan, D., GhaffarianHoseini, A. and Tookey, J. (2016) Examining the Productivity in the
NZ Construction Industry, The 2nd NZAAR International Event Series on Natural and Built Environment, Cities, Sustainability and Advanced Engineering, Kuala Lumpur.
Norman, W. and MacDonald, C. (2004) Getting to the Bottom of “Triple Bottom Line”, Business Ethics Quarterly, 14(2), 243– 262.
Obaidat, A. (2019) Is Economic Value Added Superior to Earnings and Cash Flows in Explaining Market Value Added? An Empirical Study, International Journal of Business, Accounting, and Finance, Spring 2019, 13(1), 57–69.
Organisation for Economic Cooperation and Development (OECD). (2002) OECD Guidelines towards Environmentally Sustainable Transport.
Owen, R., Koskela, L., Heinrich, G. and Codinhoto, R. (2006) Is Agile Project Management Applicable to Construction, Proceedings of the 14th Annual Conference of the International Group for Lean Construction, 14 Jul 2006, Santiago, Chile.
Pero, M., Moretto, A., Bottani, E. and Bigliardi, E. (2017) Environmental Collaboration for Sustainability in the Construction Industry: An Exploratory Study in Italy, Sustainability, 9(1), 125–149.
Saeed, M. and Kersten, W. (2017) Supply Chain Sustainability Performance Indicators - A Content Analysis Based on Published Standards and Guidelines, Logistics Research, 10(12), 1–19.
Shakantu, W., Tookey, J. and Bowen, P. (2003) The Hidden Cost of Transportation of Construction Materials: An Overview, Journal of Engineering, Design and Technology, 1(1), 103–118.
Statistics New Zealand. (2019) Business Operations Survey: 2018. The New Zealand Herald (2019) Watercare Inks $2.4b 10-year Contract with Fulton Hogan, Fletcher Construction, 27
September. Tiwari, R., Shepherd, H. and Pandey, R. (2014) Supply Chain Management in Construction: A Literature Survey, International
Journal of Management Research and Business Strategy, 3(1), 7–28. Tran, V. and Tookey, J. (2012). Directions for Future Construction Supply Chain Management Research in New Zealand: A
Real Options Perspective. International Journal of Construction Supply Chain Management, 2(1), 34–45. Tregidga, H. and Milne, M. (2006) From Sustainable Management to Sustainable Development: A Longitudinal Analysis of a
Leading New Zealand Environmental Reporter, Business Strategy and the Environment, 15, 219–241. Turner, C. (2019) Draft Proposal for Whangaparaoa Peninsula Watercare Projects. (Unpublished). Watercare, Auckland. United Nations Department for Economic and Social Affairs (UN DESA). (2019) World Urbanisation Prospects: The 2018
Revision (Report No. ST/ESA/SER.A/420) United Nations Economic Commission for Europe (UNECE) (n.d.). Share of Construction in GDP. Vrijhoef, R. (2015) Reducing the Environmental Impact and Improving Efficiency of Construction Transport, Proceedings of
the Joint CIB Symposium, Going North for Sustainability: Leveraging Knowledge and Innovation for Sustainable Construction and Development, 23-25 November 2015, London South Bank University, London, UK.
Vrijhoef, R. and Koskela, L. (1999) Roles of Supply Chain Management in Construction, 7th Conference of the International Group for Lean Construction, Berkeley, USA.
Vrijhoef, R. and Koskela, L. (2000) The Four Roles of Supply Chain Management in Construction, European Journal of Purchasing & Supply Management, 6(3–4), 169–178.
Warnock, C. (2005) Sustainable Construction in New Zealand, New Zealand Journal of Environmental Law, 337–376. Wilkinson, S., Tookey, J., Potangaroa, R., MacGregor, C., Milicich, M., Ghodrati, N., Adafin, J., Stocchero, A. and Bayan, K.
(2017) Transforming the Building Industry (Working Paper). National Science Challenge, Wellington, New Zealand. World Commission on Environment and Development (WCED). (1987) Our Common Future. Yilmaz, M. and Bakis, A. (2015) Sustainability in Construction Sector, Procedia - Social and Behavioral Sciences, 195. Ying, F. and Tookey, J. (2014) Managing Logistics Cost – A Missing Piece in Total Cost Management, International Cost
Engineering Council IX World Congress, Milano, Italy. Zimina, D., Ballard, G. and Pasquire, C. (2012) Target Value Design: Using Collaboration and a Lean Approach to Reduce
Construction Cost, Construction Management and Economics, 30, 383–398.

316
The 54th International Conference of the Architectural Science Association (ANZAScA) 2020
Contributions of urban traffics to increase in road surface temperature – A case study in New York City
Zhou Yu1 and Qi Li2 1,2 Cornell University, Ithaca, USA
{zy3281, ql562}@cornell.edu
Abstract: Vehicular waste heat discharge is one of the major sources that alter the urban thermal environment. Existing analytical studies or the observational temperature differences between urban roads and its rural counterpart have confirmed the influence of traffic-related energy use on road surface temperature (RST). However, a direct estimation of vehicle-induced RST increase from the perspective of surface energy balance (SEB) has received relatively little attention. This study proposes a new method to quantify the RST by applying a perturbation analysis of the SEB aided by satellite-derived urban surface properties. The method is subsequently applied to New York City (NYC) using satellite remote sensing image for a selected day during spring in 2017. The results indicate that the average increase in RST attributable to vehicular waste heat (Δ RST) in NYC is 1.39 °C. The high values of Δ RST correspond well to expressways connecting different parts of NYC. Overall, this study highlights that by combining satellite imagery and traffic data, this physically-based method can be a viable approach for a quick diagnostic of the spatially explicit Δ RST, thus a practical way to quantify the impact of vehicular waste heat to the urban thermal environment.
Keywords: vehicular waste heat; road surface temperature (RST); surface energy balance (SEB); satellite remote sensing.
1. IntroductionRapid urbanization has driven drastic land use and land cover (LULC) change (Roth et al. 1989). Such change has not only modified the urban land surface properties, but also led to clustered activities of energy consumption. These two factors interactively contribute to the formation of the UHI effect (Jusuf et al. 2007), which refers to higher air temperature in the urban areas compared to the surrounding rural areas. The formation of UHI is predominantly driven by the modified surface energy budget (SEB) in urban areas with complicated three-dimensional surface geometry compared to that in rural areas (Lemonsu et al. 2004; Masson. 2000; Parlow. 2003; Piringer et al. 2020; Rigo & Parlow. 2007). At the same time, human activities within the urban canopy layer – the layer of atmosphere from ground level to the height of urban built structures, profoundly impact the SEB. The bustling urban lifestyles consume a large amount of energy: from building energy use, manufacturing industry to commuting traffics (Sailor. 2011), which
Imaginable Futures: Design Thinking, and the Scientific Method. 54th International Conference of the Architectural Science Association 2020, Ali Ghaffarianhoseini, et al (eds), pp. 316–324. © 2020 and published by the Architectural Science Association (ANZAScA).

317
Zhou Yu and Qi Li
altogether account for additional energy input to the lower atmosphere that lead to distinct urban thermal environment compared to the surrounding rural areas.
As an essential part of urban life, fuel combustion from ground vehicular traffics causes waste heat being exhausted into the ambient air (Haddad & Aouachria. 2015; Okeil. 2010). It also changes the surface energy exchange between the air and the roads in the following ways. First, any car can be seen as a unit, which blocks incoming solar energy and outgoing longwave radiation. Second, more energy is added into turbulent sensible and latent heat fluxes. Third, natural ventilation is changed due to disturbance to surrounding air flows (Khalifa et al. 2016; Prusa et al. 2002). Many studies have shed light on the road surface temperature (RST) regarding the impact of passing vehicles. Scenarios with or without traffic flows are considered in the Town Energy Balance (TEB) model (Khalifa et al. 2016, 2018), which concluded a 2- 3 °𝐶𝐶 difference for RST. Gustavsson (1991) finds that intense traffics contributed to about 1 °𝐶𝐶 increase in RST Other methods have also been also applied to assess the RST increase. For example, massive data sets of air temperature from in-car sensors are collected to enable estimation of RST (Hu et al. 2019); computational microscopic traffic modelling is conducted to aid the quantification of traffic flows and a subsequent amount of waste heat discharge (Zhu et al. 2017). Moreover, temperature differences across lanes are observed on multi-lane roads, which could be attributed to varied circulating vehicles (Chapman & Thornes, 2005). All such studies agree that vehicular behaviours on urban roads play a key role in impacting the air-road heat transfer process.
Despite success in the above-mentioned studies for estimating RST, representing the vehicular heat transfer process in above-road energy balance models often requires a large amount of external data inputs, which may not be readily available. In addition, although a direct comparison of the RST difference between urban and rural roads provide a posteriori estimation of the temperature difference, no method exists yet to attribute the difference in RST increase to vehicular fuel consumption. Therefore, this study aims to develop a practical method assisted by satellite remote sensing for modelling the increase of RST based on perturbation analysis of the SEB, which require relatively fewer input data and can be easily extended to other geographic locations.
2. Data and methods
2.1. Research sites and datasets
New York City (NYC) is selected as the study site due to the presence of abundant circulating vehicles. The commuting demand for its local municipal residents and people from adjoining regions is large. Also, detailed documentation of passing vehicles such as the Annual Average Daily Traffic (AADT) is available in NYC
Generally, the necessary datasets involved here are twofold. First, for the traffic counting, digitalized AADT data (the latest is of the year 2015 when the experiment is done) is obtained from the New York State Department of Transportation (with a target area of NYC). Second, for the parameterization of thermal properties (e.g. emissivity, temperature) in a road environment, satellite and ground measurements are applied. Landsat 8 products over NYC of April 18, 2017 are obtained from the United States Geological Survey (USGS). Synchronous weather data are from the Automated Surface Observing System (ASOS), which can be found on the website of National Centers for Environmental Information (NCEI). Note that for some lower classified roads, the records of traffic streams from roadside detectors are marked as ‘simulated’ rather than the recorded counts, and we also include these `simulated’ data for subsequent analysis. Meanwhile, Landsat 8 images are selected to retrieve surface properties due to its

318
Contributions of urban traffics to increase in road surface temperature – A case study in New York City
accessibility and high solution. The spatial resolution at thirty meters facilitates later adjustment of the parameters to the census tract level. The irregular division of the total area into census tracts is shown below (Figure 1).
Figure 1: The New York City divided by census tracts
2.2. Basic assumptions
Our approach to estimate the traffic-related RST growth is based on the following assumptions. First, since the latest traffic counting data is of 2015, it is assumed here that there is no drastic shift in trends of vehicle streams between 2015 and 2017, subsequently, such data could be matched to road surfaces with physical properties in 2017. Second, the surface properties derived from the selected snapshot in 2017 from a perfectly cloudless remote sensing imagery is representative of the estimation of RST increase. Third, we also assume that waste heat from motor engines directly increases the ambient air, which subsequently changes the sensible heat flux in the surface energy budget, an assumption similar to that in other related studies (Pigeon et al. 2007).

319
Zhou Yu and Qi Li
𝑎𝑎 𝑎𝑎 𝑠𝑠
2.3. Methods
The concept of a control volume is briefly introduced here to help understand where this method will be applied to. The control volume contains all passing vehicles, and the heat exhaust is seen as an extra energy input. The human-induced addition of energy alters the SEB, causing an increase in the sensible heat flux on the dry road surface, which is often referred to as the vehicular heat flux (𝑄𝑄𝑣𝑣 ).
The values of 𝑄𝑄𝑣𝑣 has been estimated in previous studies (Chow et al. 2014; Pigeon et al. 2007; Sailor & Lu. 2004; Sailor et al. 2015) by computing the total heat discharged from all vehicles at given periods and areas. For instance, a proxy of population density is applied:
𝑄𝑄𝑣𝑣 = 𝑝𝑝𝑝𝑝𝑝𝑝𝑝𝑝𝑝𝑝 ⋅ 𝐹𝐹𝑡𝑡 ⋅ 𝜌𝜌𝑝𝑝𝑝𝑝𝑝𝑝 ⋅ 𝐸𝐸𝑝𝑝, (1) where 𝑝𝑝𝑝𝑝𝑝𝑝𝑝𝑝𝑝𝑝 refers to per capita Daily Vehicle Distance, reorganized from Daily Vehicle Miles Traveled (DVMT). 𝐹𝐹𝑡𝑡 is the fractional traffic profile diurnally. 𝜌𝜌𝑝𝑝𝑝𝑝𝑝𝑝 is population density. 𝐸𝐸𝑝𝑝 is the energy released per vehicle per meter travelled. The fractional traffic profile 𝐹𝐹𝑡𝑡 (4.5% here for 10-11 am local time) and the energy release coefficient 𝐸𝐸𝑝𝑝 (calculated as below) are applied in our computations:
𝑁𝑁𝐻𝐻𝐶𝐶 ⋅ 𝜌𝜌𝑓𝑓𝑢𝑢𝑓𝑓𝑓𝑓𝐸𝐸𝑝𝑝 = 𝐹𝐹𝐸𝐸 , (2)
where 𝑁𝑁𝐻𝐻𝐶𝐶 is the net heat of combustion of gasoline, 𝜌𝜌𝑓𝑓𝑢𝑢𝑓𝑓𝑓𝑓 is the fuel density, and 𝐹𝐹𝐸𝐸 is the mean fuel economy. Typical values for these items are gained from Sailor and Lu (2004): 𝑁𝑁𝐻𝐻𝐶𝐶 is 4.5 × 10⁷𝐽𝐽 ⋅ 𝑘𝑘𝑘𝑘−1, 𝐹𝐹𝐸𝐸 is 8.5 𝑘𝑘𝑘𝑘 ⋅ 𝑓𝑓−1 and 𝜌𝜌𝑓𝑓𝑢𝑢𝑓𝑓𝑓𝑓 is 0.75𝑘𝑘𝑘𝑘 ⋅ 𝑓𝑓−1. 𝐸𝐸𝑝𝑝 is finalized to be 3975𝐽𝐽 ⋅ 𝑘𝑘−1.
Suppose within a control volume, waste heat from traffic is directly heating the ambient air, according to the rule below:
𝐸𝐸𝑝𝑝 ⋅ Δ𝑁𝑁𝑝𝑝
· 𝑅𝑅𝑅𝑅 = ∫ 𝜌𝜌 𝐶𝐶𝑝𝑝 𝑣𝑣𝑝𝑝𝑓𝑓
Δ𝑇𝑇𝑎𝑎𝑑𝑑𝑝𝑝 Δ𝑡𝑡
Δ𝑇𝑇𝑎𝑎
= 𝑣𝑣𝑝𝑝𝑓𝑓 ⋅ 𝜌𝜌𝐶𝐶𝑝𝑝 ⋅ (3) Δ𝑡𝑡
where Δ𝑁𝑁𝑝𝑝 is net vehicle flux, represented by the number of cars passing through a given traffic zone, 𝑣𝑣𝑝𝑝𝑓𝑓. 𝑅𝑅𝑅𝑅 stands for the total road length within this volume. Street vector files are processed with the assistance of Geographical Information System (GIS) techniques to get road-related parameters. Δ𝑇𝑇𝑎𝑎 is the air temperature difference. Δ𝑡𝑡 is the time interval. 𝜌𝜌 is the air density, 1290𝑘𝑘 ⋅ 𝑘𝑘−3, and 𝐶𝐶𝑝𝑝 is the heat capacity at constant pressure, 1.004𝐽𝐽 ⋅ 𝑘𝑘−1 ⋅ 𝐾𝐾−1.
The relationship between the change of air and surface temperature has been found affected by surface properties under the framework of SEB (Bogren et al. 1991; Chapman et al. 2001; Gustavsson et al. 1990; Thornes & Shao. 1991). The SEB that corresponds to the roads impacted by the existing traffics is:
(1 − α) Rsw + Rlw = H + LE + G, (4) where α is the surface albedo. (1 − 𝛼𝛼) Rsw and Rlw are the net shortwave and longwave radiation, respectively. 𝑅𝑅𝑓𝑓𝑤𝑤 = 𝜀𝜀𝑠𝑠𝜎𝜎(𝜀𝜀 𝑇𝑇4 − 𝑇𝑇4), in which 𝜀𝜀𝑠𝑠 is the surface emissivity, 𝜀𝜀𝑎𝑎 is the atmosphere emissivity, 𝜎𝜎 is the Stefan-Boltzmann constant (5.67 × 10⁻⁸), 𝑇𝑇𝑎𝑎 and 𝑇𝑇𝑠𝑠 are the air and surface temperature. H is the sensible heat flux ( ground heat flux.
is the aerodynamic resistance), 𝑅𝑅𝐸𝐸 is the latent heat flux and 𝐺𝐺 is the
Similar to Zeng et al (2017), Equation 4 is differentiated with respect to 𝑇𝑇𝑠𝑠 after expanding terms dependent on 𝑇𝑇𝑠𝑠 (i.e. 𝜀𝜀𝑎𝑎, 𝑇𝑇𝑎𝑎, 𝑇𝑇𝑠𝑠 and 𝑟𝑟𝑎𝑎 in the calculation of 𝑅𝑅𝑓𝑓𝑤𝑤 and 𝐻𝐻) and omitting terms independent
Δ𝑡𝑡

320
Contributions of urban traffics to increase in road surface temperature – A case study in New York City
𝑓𝑓
on 𝑇𝑇𝑠𝑠 (i.e. α, Rsw , LE and G), leading to the change Δ𝑇𝑇𝑠𝑠 as expressed in Equation 5. The aerodynamic resistance 𝑟𝑟𝑎𝑎 can be modeled using the standard bulk aerodynamic approach (Kato & Yamaguchi, 2005).
(5)
where 𝑓𝑓𝑠𝑠 and 𝑓𝑓𝑎𝑎 are two energy redistribution coefficients regulating the heat transfer between air and land:
(6)
(7)
Furthermore, from Equation 5, a linear relation between Δ𝑇𝑇𝑠𝑠 and Δ𝑇𝑇𝑎𝑎 appears: 𝑓𝑓𝑎𝑎
Δ𝑇𝑇𝑠𝑠 = Δ𝑇𝑇𝑎𝑎 . (8) 𝑠𝑠
In general, Equation 8 can be understood physically as quantifying the increment in RST directly attributable to the increment of ambient air temperature on the roads by the vehicular heat exhausts. The estimation of Δ𝑇𝑇𝑎𝑎 and Δ𝑇𝑇𝑠𝑠 are illustrated here using one census tract in Manhattan (FID: 1925) as an example. It is analogous to a rectangular area with four major roads passing through. All roads are almost straight and each about 330 meters long within this census tract. The traffic count on the four road segments in one hour (10 am to 11 am) is 7773, which means a total of 7773 vehicles passby. The road width of 30 meters is imposed here as a first approximation due to the lack of detailed road information with corresponding traffic counting data. An average of vehicle height is assumed to be 2 meters, leading to a section area of 60 m2.
Suppose the average moving speed of vehicles in non-jammed hours is 10 meters per second (NYC has a speed limit of 25 miles per hour, approximately 11.18 meters per second), then the time of stay for a car on any one of the four road segments in this area will be 33 seconds. Alternatively, the total number of cars simultaneously on one road segment could be estimated to be the traffic flux going through a check-point for consecutive 33 seconds, assuming a uniform transport flow. Therefore, Δ𝑁𝑁𝑝𝑝 is equal to 7773 × 33
3600
≈ 71 . Finally, Δ𝑇𝑇𝑎𝑎 is about 3.63∘𝐶𝐶 and Δ𝑇𝑇𝑠𝑠 is about 3.54∘𝐶𝐶 with the 𝑓𝑓𝑎𝑎 approximates to 𝑓𝑓𝑠𝑠
0.975.
3. Results and discussionsThe representative results of traffic-induced RST increase on April 18, 2017 from 10 to 11 am at NYC are shown in Figure 2, along with the transition coefficient 𝑓𝑓𝑎𝑎 between air and surface temperature.
𝑓𝑓𝑠𝑠

321
Zhou Yu and Qi Li
Figure 2: (a) Road surface temperature growth, (b) the transition coefficient 𝒇𝒇𝒂𝒂 and (c) the AADT 𝒇𝒇𝒔𝒔
distribution

322
Contributions of urban traffics to increase in road surface temperature – A case study in New York City
Here, at the default road width of 30 meters, RST increase at census tract over 10∘𝐶𝐶 are treated as outliers and removed. Traffic flows within these census tracts are estimated to contribute to RST from 0 to 10 °𝐶𝐶, with a mean of 1.39∘𝐶𝐶. Our results indicate that at 10-11 am local time, the high values of RST increase tend to distribute near the boundaries of NYC. It is acknowledged that tons of expressways are surrounding the city, especially close to the city boundary. High through-traffic can be found on these major expressways (Figure 2c), regardless of being rush hour or not. In contrast, the RST increase in the core urban areas is smaller due to less commuting traffics, especially for less commercial areas (e.g. many of the census tracts in Brooklyn and Queens near the centre of Figure 2a). This might qualitatively explain the spatial pattern of RST growth. Generally, our results are comparable to other existing literature, e.g. a difference of 2 to 3 °𝐶𝐶 with or without traffics in TEB models (Khalifa et al. 2015, 2018). The transition coefficients 𝑓𝑓𝑎𝑎 are close to 1 and have very small variations in magnitude throughout the city (Figure 2b).
𝑓𝑓𝑠𝑠𝑓𝑓𝑎𝑎 is closer to 𝑓𝑓𝑠𝑠 at outskirts compared to centric urban areas.
Meanwhile, some uncertainties are considered in the modelled results. First, the current RST increase is assessed under a default road width of 30 meters, while in reality, the road width is distinctive across road types. Consequently, an uncertainty analysis of the influence of road width (in other words, control volume) is addressed, assuming a fixed average vehicle height of 2 meters. The road width is presumably perturbed from 20 meters to 40 meters. It is found that given fixed traffic volumes (total vehicular heat discharge), the increments of ambient air temperature and RST are inversely related to street widths (Table 1). Second, the air temperature 𝑇𝑇𝑎𝑎 is one of the influential factors in the energy redistribution factor 𝑓𝑓𝑎𝑎. However, only one measurement at LGA airport is used in our modelling. The impact of 𝑇𝑇𝑎𝑎 on the heat transfer from air to land surface is little known. To this end, 𝑇𝑇𝑎𝑎 is perturbed from 0∘𝐶𝐶 to 35∘𝐶𝐶 with a step of 5 to imitate different scenarios across seasons. As shown in Table 2, the change of 𝑓𝑓𝑎𝑎 and subsequently 𝑇𝑇𝑠𝑠 is insensitive to Ta.
Table 1: RST increase with flexible mean street widths (number of census tracts: 2050)
Road width (m) 20 25 30 35 40 Max Δ𝑇𝑇𝑎𝑎 (°𝐶𝐶) 15.29 12.23 10.19 8.74 7.65 Mean Δ𝑇𝑇𝑎𝑎 (°𝐶𝐶) 2.15 1.72 1.43 1.23 1.07 Max Δ𝑇𝑇𝑠𝑠 (°𝐶𝐶) 15.00 12.00 10.00 8.57 7.50 Mean Δ𝑇𝑇𝑠𝑠 (°𝐶𝐶) 2.09 1.67 1.39 1.20 1.05
Table 2: Response of 𝒇𝒇𝒂𝒂 to the perturbation of 𝑻𝑻𝒂𝒂
Air temperature 0 5 10 15 20 25 30 35 (°𝐶𝐶) Min 𝑓𝑓𝑎𝑎 17.57 17.75 17.95 18.15 18.35 18.57 18.79 19.02 Max 𝑓𝑓𝑎𝑎 56.07 56.26 56.45 56.65 56.86 57.07 57.29 57.52 Mean 𝑓𝑓𝑎𝑎 34.16 34.35 34.54 34.74 34.95 35.16 35.38 35.61

323
Zhou Yu and Qi Li
4. Conclusion
A new method is proposed for estimation of traffic-related increase in RST based on perturbation analysis of the SEB. The method is applied to NYC as a case study using satellite remote sensing data from Landsat 8 on April 18, 2017. Due to the restriction of data availability, the annual average daily traffic data of 2015 are utilized and processed according to the needs of spatial and temporal extents. Results show that RST is elevated by 1.39°𝐶𝐶 on average, under a pre-set street width of 30 meters. In fact, road with is a critical parameter to the final temperature change in this modelling as indicated by the sensitivity analysis, because it influences the size of control volume, where the waste heat accumulates. Meanwhile, air temperature has little impact on the increment of RST due to the traffic heat exhausts. Our method generates results comparable in magnitudes to other studies, where sophisticated urban surface energy balance model or detailed traffic model have been applied (Khalifa et al. 2015, 2018).
This study is limited by the following aspects. First, the accuracy of this method depends on the precision of traffic volume data. However, such fine data are hardly available in many cities. Even in NYC with an extensive monitoring system, on-site measurements are blended with tons of predictive data. Second, in addition to a rule-of-thumb diurnal traffic fraction profile, it must be assumed that traffic flow is perfectly even both temporally and spatially. Elaborate microscopic traffic modelling can provide smart predictions for vehicle motions within certain periods and between geographical nodes. In short, developing the most suitable way for simulating urban traffic travelling trajectories that matches the need is essential. Third, the spatial representativeness of a few intermediary parameters such as 𝑓𝑓𝑎𝑎 and 𝑓𝑓𝑠𝑠 remains uncertain, since they are rescaled to the irregular census tracts to be in line with traffic counting data. They are initially derived from satellite products with regular spatial resolutions (e.g. 30 meters), which may lead to error in the upscaling process.
Acknowledgements The authors would like to thank New York State Department of Transportation to provide and introduce the AADT data. This work is supported by the start-up fund of Dr. Qi Li from Cornell University.
References Bogren, J. and Gustavsson, T., 1991. Nocturnal air and road surface temperature variations in complex terrain.
International journal of climatology, 11(4), pp.443-455. Chapman, L., Thornes, J.E. and Bradley, A.V., 2001. Modelling of road surface temperature from a geographical
parameter database. Part 2: Numerical. Meteorological Applications, 8(4), pp.421-436. Chapman, L. and Thornes, J.E., 2005. The influence of traffic on road surface temperatures: implications for thermal
mapping studies. Meteorological Applications: A journal of forecasting, practical applications, training techniques and modelling, 12(4), pp.371-380.
Chow, W.T., Salamanca, F., Georgescu, M., Mahalov, A., Milne, J.M. and Ruddell, B.L., 2014. A multi-method and multi- scale approach for estimating city-wide anthropogenic heat fluxes. Atmospheric environment, 99, pp.64-76.
Gustavsson, T., 1990. Variation in road surface temperature due to topography and wind. Theoretical and Applied Climatology, 41(4), pp.227-236.
Gustavsson, T. and Bogren, J., 1991. Infrared thermography in applied road climatological studies. International Journal of Remote Sensing, 12(9), pp.1811-1828.

324
Contributions of urban traffics to increase in road surface temperature – A case study in New York City
Hu, Y., Almkvist, E., Gustavsson, T. and Bogren, J., 2019. Modeling Road Surface Temperature from Air Temperature and Geographical Parameters—Implication for the Application of Floating Car Data in a Road Weather Forecast Model. Journal of applied meteorology and climatology, 58(5), pp.1023-1038.
Haddad, L. and Aouachria, Z., 2015. Impact of the transport on the urban heat island. International Journal of Environmental and Ecological Engineering, 9(8), pp.968-973.
Jusuf, S.K., Wong, N.H., Hagen, E., Anggoro, R. and Hong, Y., 2007. The influence of land use on the urban heat island in Singapore. Habitat international, 31(2), pp.232-242.
Kato, S., & Yamaguchi, Y. (2005). Analysis of urban heat-island effect using ASTER and ETM+ Data: Separation of anthropogenic heat discharge and natural heat radiation from sensible heat flux. Remote Sensing of Environment, 99(1-2), 44-54.
Khalifa, A., Marchetti, M., Bouilloud, L., Martin, E., Bues, M. and Chancibault, K., 2016. Accounting for anthropic energy flux of traffic in winter urban road surface temperature simulations with the TEB model.
Khalifa, A., Bouzouidja, R., Marchetti, M., Buès, M., Bouilloud, L., Martin, E. and Chancibaut, K., 2018. Individual contributions of anthropogenic physical processes associated to urban traffic in improving the road surface temperature forecast using TEB model. Urban climate, 24, pp.778-795.
Lemonsu, A., Grimmond, C.S.B. and Masson, V., 2004. Modeling the surface energy balance of the core of an old Mediterranean city: Marseille. Journal of applied meteorology, 43(2), pp.312-327.
Masson, V., 2000. A physically-based scheme for the urban energy budget in atmospheric models. Boundary-layer meteorology, 94(3), pp.357-397.
Okeil, A., 2010. A holistic approach to energy efficient building forms. Energy and buildings, 42(9), pp.1437-1444. Prusa, J.M., Segal, M., Temeyer, B.R., Gallus Jr, W.A. and Takle, E.S., 2002. Conceptual and scaling evaluation of vehicle
traffic thermal effects on snow/ice-covered roads. Journal of Applied Meteorology, 41(12), pp.1225-1240. Parlow, E., 2003. The urban heat budget derived from satellite data. Geographica Helvetica, 58(2), pp.99-111. Piringer, M., Grimmond, C. S. B., Joffre, S. M., Mestayer, P., Middleton, D. R., Rotach, M. W., ... & Karppinen, A. (2002).
Investigating the surface energy balance in urban areas–recent advances and future needs. Water, Air and Soil Pollution: Focus, 2(5-6), 1-16.
Pigeon, G., Legain, D., Durand, P. and Masson, V., 2007. Anthropogenic heat release in an old European agglomeration (Toulouse, France). International Journal of Climatology: A Journal of the Royal Meteorological Society, 27(14), pp.1969-1981.
Rigo, G. and Parlow, E., 2007. Modelling the ground heat flux of an urban area using remote sensing data. Theoretical and Applied Climatology, 90(3-4), pp.185-199.
Roth, M., Oke, T.R. and Emery, W.J., 1989. Satellite-derived urban heat islands from three coastal cities and the utilization of such data in urban climatology. International Journal of Remote Sensing, 10(11), pp.1699-1720.
Sailor, D.J. and Lu, L., 2004. A top–down methodology for developing diurnal and seasonal anthropogenic heating profiles for urban areas. Atmospheric environment, 38(17), pp.2737-2748.
Sailor, D.J., 2011. A review of methods for estimating anthropogenic heat and moisture emissions in the urban environment. International journal of climatology, 31(2), pp.189-199.
Sailor, D.J., Georgescu, M., Milne, J.M. and Hart, M.A., 2015. Development of a national anthropogenic heating database with an extrapolation for international cities. Atmospheric Environment, 118, pp.7-18.
Thornes, J.E. and Shao, J., 1991. Spectral analysis and sensitivity tests for a numerical road surface temperature prediction model. Meteorological Magazine, 120(1428), pp.117-124.
Zeng, Z., Piao, S., Li, L. Z., Zhou, L., Ciais, P., Wang, T., ... & Mao, J. (2017). Climate mitigation from vegetation biophysical feedbacks during the past three decades. Nature Climate Change, 7(6), 432-436.
Zhu, R., Wong, M.S., Guilbert, É. and Chan, P.W., 2017. Understanding heat patterns produced by vehicular flows in urban areas. Scientific reports, 7(1), pp.1-14.

325
The 54th International Conference of the Architectural Science Association (ANZAScA) 2020
Decolonising Landscape Architecture Education in Aotearoa New Zealand
Jacqueline Paul1 and Sibyl Bloomfield2
Te Whare Wananga o Wairaka - Unitec, Tāmaki Makaurau Auckland, Aotearoa New Zealand jpaul1, [email protected]
Abstract: Aotearoa is growing rapidly with expansive development occurring across the country as the creative and design industry responds to support the diverse needs of the growing population. This enables opportunities for emerging practitioners in the built environment to engage with communities and develop their cultural literacy and contributes to the wider shift in architecture education. This paper discusses the cultural values-based approach developed for a design studio where Unitec’s Department of Landscape Architecture partnered with Panuku Development Auckland on the Kia Puāwai a Pukekohe town centre transformation project. Core to this partnership the students have explored current and new approaches to understanding how to engage with mana whenua and understand placemaking as key elements of community development and urban regeneration. This design studio acts as a platform which creates space to enable students to engage in real world challenges and projects and develop relationships with real clients. Creating real world learning opportunities on both sides of the partnership. This creates opportunities for students to design and address social and cultural issues. This process also allows students to immerse themselves in contributing to and shaping their own living environments. They cover problem definition and identification of latent opportunities; brief generation; site analysis; master-planning processes; ‘local’ scale design responses and relevant instrumental design theory. This case study provides a series of tools regarding diverse approaches to integrating inclusive studios which aims to inform better long- term outcomes to deliver and build capacity and capability in landscape architecture.
Keywords: Decolonising; design education; cultural literacy; mana whenua engagement.
1. IntroductionThe purpose of this paper is to demonstrate how we might decolonise landscape architecture education. This is referenced in particular to a studio-based course programme located in the School of Architecture, Landscape Architecture Department at Unitec Institute of Technology in Auckland, New Zealand. This course is led by lecturers Jacqueline Paul (Ngāti Kahungunu, Ngāpuhi, Ngāti Tūwharetoa) and Sibyl Bloomfield (Waikato Tainui, Ngāti Naho). The aim of this paper is to provide an overview of a case study which contributes to the wider decolonisation of education.
Imaginable Futures: Design Thinking, and the Scientific Method. 54th International Conference of the Architectural Science Association 2020, Ali Ghaffarianhoseini, et al (eds), pp. 325–334. © 2020 and published by the Architectural Science Association (ANZAScA).

326
Jacqueline Paul and Sibyl Bloomfield
The paper is informed by a studio developed for third year landscape architecture students for semester one of 2020. Unitec’s Department of Landscape Architecture partnered with Panuku Development Auckland on the Kia Puāwai a Pukekohe project. The students explore the understanding of mana whenua engagement and placemaking as key elements of community development and urban regeneration. The studio aims to engage students in real world challenges and projects by building relationships with real clients. This covered problem definition and identification of latent opportunities; brief generation; site analysis; master-planning processes; ‘local’ scale design responses and relevant instrumental design theory. The course aims to re-think current curriculum in landscape architecture and re-imagine how we can transform our environments by growing diversely skilled practitioners. This outcome will form the basis of this paper which will aim to address the following research question:
How can we enhance the cultural literacy of Landscape Architecture practitioners to grow the capacity of the profession to uphold and operationalise Te Tiriti o Waitangi?
2. MethodologyThis paper will engage in a three staged approach to undertake the various methods of integrating research and design education with an emphasis on decolonisation and placemaking. The discussion is framed within the three stages of: review, case study, and analysis using collaborative studio as a reference. This includes a critical review and scan of relevant literature in decolonising landscape architecture education to provide a contextual overview of the state of knowledge in the field and responsibilities of the profession. This will provide a framework for assessing and examining learnings from the third year Bachelor of Landscape Architecture (BLA) design studio. This will also include programme analysis and evaluation provided by students and collaborating partners. Corcoran et al (2004) notes that case-study methodology is a common and appropriate research tool used in studies of sustainability in higher education. We argue that the decision to publish case studies for a broad audience suggests that others have something to learn from the case study. Therefore, the study should provide a critical analysis of practice and be documented in such a way that it can have transformative value for others (Corcoran et al, 2004). We will utilise the Te Tauākī Ako: Our Ako Framework (see figure 1) to assess and analyse our teaching practices and processes within a kaupapa Māori context.
3. Review of LiteratureDecolonization, once viewed as the formal process of handing over the instruments of government, is now recognized as a long-term process involving the bureaucratic, cultural, linguistic and psychological divesting of colonial power (Smith, L. T, 2013). Decolonising Landscape Architecture Education in Aotearoa is not something we say lightly. Decolonisation involves efforts by Pakeha and Māori to reflectively work together to shape current and future cultural identities, politics and economics (Amundsen, 2018). Decolonization in the settler colonial context must involve the repatriation of land simultaneous to the recognition of how land and relations to land have always already been differently understood and enacted; that is, all of the land, and not just symbolically (Tuck and Yang, 2012). This is highly relevant as we discuss how landscape architects are instrumental in contributing to the decolonisation of not only education but also the profession.

327
Decolonising Landscape Architecture Education in Aotearoa New Zealand
Figure 1. Te Tauākī Ako: Our Ako Framework

328
Jacqueline Paul and Sibyl Bloomfield
3.1. Te Tiriti o Waitangi and Landscape Architecture
We recognise in the te reo text of Te Tiriti o Waitangi, article two ‘tino Rangatiratanga o o ratou wenua o ratou kainga me o ratou taonga katoa’ [sic] where Māori were guaranteed the ‘highest chieftainship’ of their kāinga (Independent Māori Statutory Board, 2018). It’s important to identify that the landscape architecture profession has a role and responsibility to uphold Te Tiriti o Waitangi. In the Aotearoa-New Zealand Landscape Charter produced by the New Zealand Institute of Landscape Architects the organisation identifies and recognises Māori values. The charter presents seven elements which encapsulate the key concepts underpinning the Te āo Māori perspective on landscape: Whakapapa and Whanaungatanga, Kaitiakitanga, Kotahitanga, Te Putahi and Puta Noa (NZILA, 2010). This values-based approach is instrumental in the way in which we practice and must be at the forefront of how landscape architects give effect to Te Tiriti o Waitangi.
Landscape Architecture as a discipline is at the interface between people and the land. This positions the profession as a powerful tool in navigating the process of decolonising our built and natural environments and re-positioning our cities to better honour our treaty partnership. The New Zealand profession has a strong interest in architects with Māori backgrounds and/or high levels of cultural competency (Allan and Smith, 2013). As an accredited degree programme, this gives Unitec BLA graduates the professional recognition internationally as it also subscribes the programme to the western educational expectations that reinforce colonial systems. Tuia Pito Ora, the New Zealand Institute of Landscape Architects (NZILA) specifically acknowledges the importance of embedding mātauranga and te āo Māori as well as honouring Treaty of Waitangi obligations, in the degree and profession in New Zealand in NZILA Education Policy and Standards 2016 document.
In the New Zealand context, this the NZILA encourages recognition of Mana whenua (the special relationship that tribal groups have with their traditional lands and places), the culturally shared character of New Zealand’s public landscapes, Māori landscape architectural design requirements, and the importance of the legislative and policy framework in addressing these aspects of landscape architectural practice, including treaty of Waitangi obligations (NZILA, 2016).
This a position of the profession and further reiterates the responsibility of the landscape architecture in upholding Te Tiriti o Waitangi. This overarching view provides context and a better understanding of the position that this course sits within as western institutions in New Zealand have obligations to uphold and operationalise Te Tiriti o Waitangi. Unitec Institute of Technology honours its commitment to Te Tiriti o Waitangi through the adoption of the partnership agreement Te Noho Kotahitanga. The partnership is based on five guiding principles which includes Rangatiratanga, Wakaritenga, Kaitiakitanga, Mahi Kotahitanga and Ngakau Mahaki (Unitec, 2020). This has helped staff and students to examine how they can engage with Māori knowledge, how Māori and non-Māori interact with each other, and how we all can behave in our local communities (Unitec, 2020).
We acknowledge and recognise that western-centric landscape architecture curriculum is still prevalent in education. This is very problematic as the low numbers and lack of representation of Māori students’ needs to be addressed at an institutional level, especially when there are certain policies identified to grow and support Māori in these diverse spaces however they have failed to deliver. This may provoke further conversations in regard to Māori staff employed in the architecture schools in Aotearoa.

329
Decolonising Landscape Architecture Education in Aotearoa New Zealand
4. Case Study – Studio 5: Communities and RegionsUnitec’s Department of Landscape Architecture partnered with Panuku Development on their Kia
Puāwai a Pukekohe (Unlock Pukekohe) project. Students explored mana whenua engagement and placemaking as key elements of community development and urban regeneration in response to population growth. Panuku Development are Auckland Council’s agents working alongside other parts of the council, government organisations, businesses and locals to regenerate the city in ways that benefit our communities as a whole. Working closely with Auckland Council, including councillors and local boards, mana whenua, the private sector, crown organisations and local communities to deliver urban regeneration for Tāmaki Makaurau (“Who we are”). This studio aimed to expose students to real world challenges and projects and to engage and develop relationships with real clients. The students were actively engaging with the studio clients throughout this process to reinforce the relevance of their studio outcomes. The course reinforces and builds on the range of conventions of landscape architectural production introduced in previous studios, through the generation of design strategies which address the complexity of context, site and programme. Design projects explore the way in which ideas about landscape, techniques and methods for dealing with landscapes and ways of communicating about design are all related to each other and can influence the process of design. At the core of this studio was the engagement with and embedding of Te āo Māori. This was done through the use of Te Reo, the practice and acknowledgment of tikanga, and actively embodying the Unitec Partnership agreement Te Noho Kotahitanga, in the way we approach the study of Landscape Architecture.
This studio also builds upon and expands the knowledge and engagement in te āo Māori previously explored in the BLA programme and does not operate in isolation. The intention of the course is to develop and expand the student’s cultural literacy, ensuring their ability to better understand and participate more fluently in te āo Māori in their practice of landscape architecture (Hirsch, 1983).
The course key objectives include:
• Embed tikanga and mātauranga Māori in landscape education so that students develop anunderstanding and fluency in Te āo Māori.
• Embed Māori values into course delivery.• Encourage tuakana teina relationships by connecting the educational environment with the wider
profession • Support and foster leaders and life-long learners in this space • Increasing capacity of students to conscientiously engage in landscape architecture practice in
partnership with mana whenua and within te āo Māori.
The course structure creates a framework for simulating a real-world project within the constraints of a 15-week semester. The design brief is set by the clients and students through the process of interview and research. Students worked in groups for the majority of the course, underpinned by individual workexploring instrumental theory to inform the student’s practice. Working in groups the students were able to support one another in their engagement in this challenging space. The final small design projects were done individually giving the students the opportunity to share their personal design voice. Theexpectations of the course are a significant step up from the previous studios in the programme and

330
Jacqueline Paul and Sibyl Bloomfield
the support and collaboration between students and lecturers is critical to the success. Student feedback was collected as part of the final evaluation process which highlights the value of the group work:
This was quite intimidating as it was in an in-class experience of what it would be like to meet the clients in the industry. However, doing this as a group made it significantly easier and was an insightful experience as most students don't get this opportunity while in study. – 3rd year BLA Student
...working in a group dynamic to produce an analysis [report] and masterplan was fun but also informative, it definitely helped with overcoming intimidation when we were interviewing the clients. Another bonus of group work was being able to expand on your knowledge by learning about the other group members as well as being able to build [relationships] with people. – 3rd year BLA Student
Encouraging, enabling and supporting growth in knowledge and understanding of Te Tiriti o Waitangi and how we as landscape architects and citizens are responsible as partners is critical to beginning the decolonising process. We must also note that none of the students enrolled in Studio 5 for the 2020 delivery identified as Māori, reinforcing the need to both engage in this learning, and to support our students in understanding their responsibilities and potential/value as tangata tiriti. This also highlights high attrition rates for Māori and Pasifika students were noted at all three New Zealand Landscape Architecture programmes (Allan and Smith, 2013) and the need to decolonise this space to encourage greater engagement and ensure this discipline better reflects our commitment to treaty partnership.
Guest speakers were also invited to share their knowledge, experience and encouragement with the students. Two landscape architects, from both spheres of Te Tiriti o Waitangi, were invited to share their kōrerō. Fiona Ting from Resilio and Xanthe White shared her experiences as tangata tiriti/tauiwi and finding agency to engage and design in a te āo Māori space. We also had William Hatton (Ngāti Kahungunu ki Wairarapa, Rangitāne and Muaūpoko) from Boffa Miskell speak about engaging with mana whenua in landscape architecture practice. It's important we allow students to understand tangata whenua and tangata tiriti. Through wānanga and sharing knowledge this provides a safe space and an engaging conversation to demonstrate how both landscape architects navigate these spaces. This was a valuable process and part of the course which is evident from student feedback as part of the course evaluation process:
This studio challenged me more than any other… The understanding of my responsibility as tangata o Tiriti has grown, growth resultant both of this course and of the global proliferation of resources for white people to become anti-racist. I now know that racism is a white issue that needs to be fixed by white people, not a black or brown issue that needs to be empathized with... The course does so much to suggest how that work might manifest in landscape architecture. – 3rd year BLA student
This was quite intimidating… However, doing this as a group made it significantly easier and was an insightful experience as most students don't get this opportunity while in study. It was great to create a bond with the clients, we introduced ourselves in Māori and shared respect... – 3rd year BLA student

331
Decolonising Landscape Architecture Education in Aotearoa New Zealand
Figure 2. BLA Students presenting at Panuku Development. Figure 3. Kimoro Taiepa - Kaihautu (Photos by Brent Condon, 2020)
5. Analysis and DiscussionThe Tauāki Framework (Ako Aotearoa, 2011) underpins this case study and the work of both educators operating within an institution practicing in a kaupapa Māori context. Decolonising Landscape architecture education is instrumental in ensuring emerging practitioners enter the profession with a great understanding of Te Tiriti o Waitangi and commitment to upholding this living document of Aotearoa. The delivery of this course is a part of the paradigmatic shift and transition required in education institutions. All kaupapa Māori values identified in the Tauāki Framework (Ako Aotearoa, 2011) are foundational to the ongoing development of landscape architecture in its entirety. The ongoing impacts of colonisation needs to be recognised and acknowledged to truly understand the whakapapa of Aotearoa. Inclusive approaches in education, design and planning, enable opportunities for the sharing of knowledge systems, building and strengthening relationships, valuing te reo Māori, empowering and mobilising Māori communities and ensuring safe and culturally appropriate practices. The course contributes to incremental change and will inform future models and applied learning partnerships. The course development was peer reviewed by the Kaihautū Architecture Kimoro Taiepa as part of the professional and cultural development. Feedback received reflected the value of both the course content and course delivery in meeting the partnership responsibilities to both Te Tiriti o Waitangi and Te Noho Kotahitanga:
Your strategies for demonstrating commitment to engaging Treaty Based relationships in real life contexts shows real coherence beginning firstly with the acknowledgement of the notion of mana whenua and as is premised in Te Tiriti; how these principles are aligned to our core values and practices; how they are articulated in the course content, expressed through course delivery through to assessment and application - Kimoro Taiepa.
The feedback also acknowledged the groundwork established by the same lecturers in other parts of the BLA programme to prepare and support the students in engaging with this course successfully.

332
Jacqueline Paul and Sibyl Bloomfield
...it is the by-product of 3 years’ work laying a solid foundation to develop cultural competency and build the capability of our students in engaging with mana whenua and Te Ao Māori and I think you weave all of these quite complex ideas very well and in a practical and accessible way for everyone involved. [There is] a real sense of the desire to honour and acknowledge Te Ao Māori in this practice and I see a dedication to achieving rangatiratanga and realising the true potential of treaty-based partnerships. Through Mahi Kotahitanga you provide the outlet for partnering and consultation to occur, offering real life contexts and settings for students to apply what they've learned. The evidence is compelling - the amount of quality consideration and planning that has occurred, been tried and tested is all a part of an evolution of your own understanding of the importance of Māori worldview and treaty-based partnership within landscape architecture - Kimoro Taiepa.
Additional to this, it is also essential to recognise the relationships and partnerships built as a result of this course which we will continue to foster. Partnering with Panuku enabled students’ access to a real-world project, and to understand and respond to the established engagement practice was an ideal ‘low-stakes’/high reward opportunity. In a recent article published by Panuku Development, they provide oversight of the final student presentations hosted by Panuku. Angela Fulljames from the Franklin Local Board says:
The Franklin Local Board has enjoyed a great relationship with Unitec School of Architecture for the past three years. The massive benefit is the objective and different perspective these students bring to commercial projects. Often, I think politicians and town planners need a stimulus of something new and fresh. This is what these students have supplied today in abundance. These young people are the designers and place- makers of our future cities. And after today I can safely say we are in good hands (Panuku Development Auckland, 2020).
This feedback is valuable and will contribute to the future development of this course. We must also recognise the value of the tikanga and kawa initiated in the early stages of this course that strengthened the course delivery. The delivery of this course was disrupted as Aotearoa went into a full lockdown in response to the COVID-19 pandemic which meant that students were no longer able to attend classes on campus. This challenged the entire concept of kanohi kitea. This majorly impacted the delivery of the course which traditionally would have centred face to face engagement with clients, however the move online enabled clients and partners to continue to support and engage with our students Constraints and limitations also allowed us to adapt to new ways of exercising kawa and tikanga virtually, continuing to engage in mihi whakatau, karakia and creating time and space to allow reflective sessions. Upon reflection, due to these robust processes and practices that are embedded in the course, the students were enabled to remain vigilant during these unprecedented times where mental health and well-being were paramount. The importance of relationships in te āo Māori and the practice of tikanga to support this further reinforced the pastoral care of students.
6. Conclusion
This case study is precedent which we will continue to build on in a long-term decolonising process. We hope that this will contribute to wider sector and industry changes in the profession which aims to

333
Decolonising Landscape Architecture Education in Aotearoa New Zealand
enhance the cultural literacy of emerging practitioners and landscape architects. We have an obligation under Te Tiriti o Waitangi to ensure that we are pivotal in practice by enabling opportunities for mana whenua and including them in the process from the beginning to the end of projects. Long term outcomes will mean that iwi and hapū have the opportunity to exercise their tino rangatiratanga on their lands and we must be engaged in supporting the operationalisation of this process. Professor Linda Tuhiwai Smith speaks in her book Decolonizing methodologies: Research and indigenous peoples about the four directions - decolonization, healing, transformation and mobilization (Smith,2013). This methodology is critical to the past, present and future of landscape architecture education, processes and practice in Aotearoa. Decolonising landscape architecture education in Aotearoa will be an ongoing process of deconstructing colonial structures and shifting knowledge systems which aims to encourage meaningful engagement in mātauranga and te āo Māori. Decolonising practice is not unique to Aotearoa and should be recognised in the international accreditation of landscape architecture education programmes ensuring greater accountability from institutions. The current low numbers of Māori students enrolled in landscape architecture programmes across Aotearoa is perhaps primarily to do with the low profile of the profession as a whole, although could also be attributed to the more western focused approach to landscape architecture and the lack of profile for Māori practitioners overall. Shifting the delivery of the programme to better reflect a decolonised profession will not just benefit those Māori students enrolling but also those non-Māori students graduating into practice and showing leadership in cultural literacy in this gradually decolonising world.
Glossary
Āhuatanga – Describing someone which may refer to their way of being, aspect, likeness, circumstance, and/or characteristics etc. Kanohi kitea – To have a physical presence Karakia – Incantation, prayer, chant Kaitiakitanga – Guardianship Kōrero – Speech, narrative, story, news, account, discussion, conversation, discourse Kotahitanga – Unity Mahi – To work Mana whenua – Those with authority over and responsibility to land Matauranga Māori – Māori knowledge Mihi whakatau – Speech of greeting or welcoming Puta Noa – To share or project Tikanga – Correct procedure, custom, habit, lore, method, manner, rule, way, code, meaning, plan, practice, convention Tāmaki Makaurau – Auckland Tangata tiriti – Generic term to describe people whose rights to live in Aotearoa/New Zealand) derive from Te Tiriti and the arrangements that the Crown has established under a common rule of law, and the equity provisions of Article 3 of Te Tiriti/Treaty. Tangata Whenua – Generic terms for Māori comprising those with mana whenua responsibilities (Māori who are tied culturally to an area by whakapapa), together with Mataawaka/Taurahere (Māori, resident in an area, but who belong to waka and tribes from other parts of Aotearoa/New Zealand. Tauiwi – Non-Māori Te Ao Māori – Māori Worldview

334
Jacqueline Paul and Sibyl Bloomfield
Teina – Younger brother(s) (of a male), younger sister(s) (of a female), junior relative(s) Te Tiriti o Waitangi – Agreement made between angatira and the British Crown in 1840 Te Reo – Māori language Tuākana – Elder brother (of a male), elder sister (of a female), senior relative Whakapapa – ancestral ties or connections Whakawhanaungatanga – The process of establishing relationships or Honour relationships Whanaungatanga – relationships Whenua – Land, country, earth, placenta, afterbirth
References Ako Aotearoa. (2011). Te Tauākī Ako: Our Ako Framework. Available from:
https://akoaotearoa.ac.nz/ako-hub/ourwork-m%C4%81ori-educators-and- learners/resources/pages/te-tau%C4%81k%C4%AB-ako-our-akoframework
Allan, P. and Smith, H. (2013) Research at the Interface: Bicultural Studio in New Zealand a case study. MAI Journal: A New Zealand Journal of Indigenous Scholarship, 2(2).
Amundsen, D. L. (2018). Decolonisation through reconciliation: The role of Pākehā identity. MAI Journal: A New Zealand Journal of Indigenous Scholarship, 7(2).
Corcoran, P. B., Walker*, K. E., and Walls, A. E. (2004). Case studies, make-your-case studies, and case stories: a critique of case-study methodology in sustainability in higher education. Environmental Education Research, 10(1), 7-21.
Tuck, E. and Yang, K. W. (2012) Decolonization is not a Metaphor. Decolonization: Indigeneity, Education & Society 1(1), 1-40.
Hirsch, E.D jr. (1983) Cultural Literacy. The American Scholar, 52(2), 159-169. Available from: <http://www.jstor.com/stable/41211231> (accessed July 2020)
Independent Maori Statutory Board. (2018). Housing: informing action through rights and obligations. https://www.imsb.maori.nz/assets/sm/upload/l2/xh/cr/bu/Housing%20- %20rights%20and%20obligations%20approach.pdf
NZILA (2010) The Aotearoa – New Zealand Landscapes Charter. Available from: <https://www.csla- aapc.ca/sites/csla-aapc.ca/files/IFLA/New%20Zealand.pdf>
NZILA (2016) NZILA Education Policy and Standards 2016. Available from: <https://umbrellar.nzila.co.nz/media/uploads/2017_01/nzilaeducationpolicyandstandardsfinaldocu mentfebruary2016.pdf>
Panuku Development Auckland (2020). Shaping urban spaces with Unitec’s young talent. Available from: <https://www.panuku.co.nz/news-and-blogs/shaping-urban-spaces-with-unitecs-young-talent>
Smith, L. T. (2013). Decolonizing methodologies: Research and indigenous peoples. Zed Books Ltd. “Te Noho Kotahitanga and Unitec” (2020) available from: <https://www.unitec.ac.nz/about-us/te-noho-
kotahitanga-and-unitec> (accessed July 2020) “Who we are” Panuku Development Auckland. Available from:
<https://www.panuku.co.nz/about/who-we-are>

335
The 54th International Conference of the Architectural Science Association (ANZAScA) 2020
Delivering Smart Heritage to Local Governments
David Batchelor1, Marc Aurel Schnabel2, Karl Lofgren3 1, 2, 3 Victoria University of Wellington, Wellington, New Zealand
{David.Batchelor1, MarcAurel.Schnabel2, Karl.Lofgren3}@vuw.ac.nz
Abstract: The governance of future built environments requires novel interdisciplinary discourses to address the complex needs within cities. Smart Heritage, the novel convergence of smart city and heritage disciplines, is one such interdisciplinary discourse that local governments can leverage for unique perspectives and capabilities. To deliver interdisciplinary discourses like Smart Heritage, it is the task for local governments to orchestrate the knowledge, processes, and initiatives between the two contributing disciplines and apply them to their local context and needs. However, as a novel discourse, no academic research is present on how smart city and heritage disciplines converge to deliver Smart Heritage within local government. This paper reports on the interdisciplinary knowledge, processes, and initiatives between the smart city and heritage disciplines in local government. The research conducted interviews with smart city and heritage advisors from three local governments in Australia and draws key findings on these themes. The findings from an academic understanding of how local governments engage with the Smart Heritage discourse.
Keywords: Smart heritage; smart city; heritage; government.
1. IntroductionLocal governments require novel interdisciplinary discourses to address the complex needs within cities. Smart Heritage, the novel convergence of smart city and heritage disciplines, is one such interdisciplinary discourse that local governments can leverage for unique perspectives and capabilities to address these needs. Early investigations into local government smart city and strategic heritage documents reveal a theoretical foundation for Smart Heritage that aids the success of future cities (Batchelor and Schnabel, 2019). This foundation reflects the broader expansion of the smart city discipline into non-technological fields where it intersects with cultural and social matters. These expansions witness the adaption of knowledge, processes, and initiatives between the disciplines and the resulting germination of independent discourses. It is the task for local governments to orchestrate the knowledge, processes, and initiatives between the contributing disciplines and apply them to their local context and needs. However, no academic research is present on how smart city and heritage disciplines currently converge to deliver Smart Heritage within local government.
Imaginable Futures: Design Thinking, and the Scientific Method. 54th International Conference of the Architectural Science Association 2020, Ali Ghaffarianhoseini, et al (eds), pp. 335–344. © 2020 and published by the Architectural Science Association (ANZAScA).

336
David Batchelor, Marc Aurel Schnabel, Karl Lofgren
The paper reports on the interdisciplinary knowledge, processes, and initiatives between the smart city and heritage disciplines in local government. The research conducted interviews with smart city and heritage advisors from three local governments in Australia and draws key findings on interdisciplinary knowledge, processes, and initiatives. The findings shape an academic understanding of how local governments form and engage with the Smart Heritage discourse.
2. Interdisciplinary Knowledge, Processes, and InitiativesThe academic literature reports it is beneficial for organisations, like local governments, to converge knowledge, processes, and initiatives of various disciplines to enable innovation and economic advantages. However, the literature also discusses difficulties occur when disciplines meet. This section provides a brief overview of the research on interdisciplinary knowledge, processes, and initiatives, including their benefits and drawbacks.
Within an organisation, knowledge is an asset comprising expertise with varying qualities and geographies (Izunwanne, 2017). Its presence justifies, and its absence condenses realities around what is known. It exists in many forms, from formalised policies, practices, and scientifically proven results, to informal observations, assumptions, and traditions. Leeuw et al. (1994) argue that interdisciplinary knowledge discourages information silos within organisations as teams do not become protective of specific expertise. Instead, knowledge becomes a domain for all workers to utilities commonly. Therefore, Leeuw et al. recommend that organisations should be critical of overreliance on specialists and continually seek new convergences.
Moreover, Nonaka and Tekuchi (1995) note that convergences can introduce knowledge to an organisation through constructive disruption, as the novelty challenges preconceptions and demand new considerations. However, Lattuca (2001) warns that these processes require additional time to integrate knowledge bases successfully and that it may not be efficient or suitable for all organisations. Researchers also note that technical terminology and philosophical perspectives between disciplines often create conflicts that can slow innovation and productivity (Gooch, 2005; Oberg, 2009; Repko, 2012).
Processes, also known as knowledge management, within an organisation are frameworks that manage knowledge (Gilson et al., 2009). They construct a mechanism which delivers a systematic method to enhance effectiveness and efficiencies. Chang and Lin (2015) state that interdisciplinary processes based on creative collaboration increase the capability for innovation as it enables a broader range of potential outcomes, resulting in an innovative competitive advantage. Kim (2015) claims that interdisciplinary processes are the fundamental building block to collective cohesion and functionality; therefore, they should be a priority for organisational management. However, Vince and Saleem (2004) warn that if the new interdisciplinary processes conflict with the existing operations, this can cause unintentional disruption within an organisation. Organisations should be aware of their social and political contexts before implementing new processes to avoid conflicting with existing processes.
Initiatives are the deliberate applications of knowledge and processes within an organisation. They result in physical or strategic outcomes and external outputs. Helga (2017) discuss how interdisciplinary initiatives produce novel, innovative and holistic outputs, tailor-made to solve complex issues. Lanterman and Blithe (2019) claim the inputs from various disciplines balance the sensitivities in these complex issues which a single discipline may not delicately manage. However, Helga and others warn that interdisciplinary initiatives can also be ineffective in resolving issues in contrast with single discipline initiatives, due to the collaborative processes misdirecting efforts and broader considerations

337
Delivering Smart Heritage to Local Governments
muddling the project focus (Heemskerk et al., 2003; Stokols et al., 2008; Thompson, 2009; Callard and Fitzgerald, 2015). Therefore, organisations should critically examine the suitability of interdisciplinary convergences within the time, scope, and budget demands of each initiative. Further researchers tell of collaborations diluting the effectiveness of initiatives as the disciplines demand concessions of the aspirations of each other rather than bold solutions (Goldman et al., 2015).
The above brief literature overview identifies interdisciplinary knowledge, processes, and initiatives can deliver innovative solutions within local government, but also introduce new demands and constraints. For the successful delivery of Smart Heritage, local governments must converge smart city and heritage disciplines in contexts that avoid or include mitigation to these unwanted outcomes.
3. MethodsThe research undertook interviews with three local governments in Australia. The local governments were Broken Hill City Council, the City of Newcastle, and the City of Melbourne. These organisations provide diversity in size and context; an outback township, a second-tier city, and a metropolitan state capital respectively. In each local government, the research separately interviewed an employee who worked in the smart city discipline and one who worked in the heritage discipline. The advisors were invited to participate in the research by email and later by online video calling. The interviews were approximately one hour in length and were audio-recorded then transcribed.
The interviews were semi-structured in format, containing open-ended questions that followed the themes of knowledge, processes, and initiatives. The first theme, knowledge, sought to understand the knowledge each participant had of the other discipline within their local council. The second theme, processes, explored the processes within the organisation if the advisors were to collaborate, including barriers to convergence. The third theme, initiatives, investigated the current initiatives converging the smart city and heritage disciplines within the local government, including their similarities and differences. The themes offer valuable insights into the realities of the operational environment where smart city and heritage disciplines converge.
Guided by the themes, the analysis involved reading the transcripts to identify valuable narratives across the organisations. Re-listening to audio-recordings confirmed the tonality and contextual interpretations within the responses. These narratives formed the findings in the following section.
4. Summary of findingsThe interviews emerged several findings on the themes of knowledge, processes, and initiatives. The below sections report the findings in more detail.
4.1. Key finding: lack of cross-disciplinary knowledge
The Heritage Advisors reported little knowledge about smart cities. They were broadly aware of its existence, however, admitted limited detailed knowledge as a result of few interactions within the organisation or little personal interest.
Concerning smart cities, the Heritage Advisors primarily spoke about technological devices. For example, sensors, tracking of data, pedestrian counters, 5G mobile network, smart lighting poles, virtual and augmented reality, and QR codes. When enquired about specific outcomes of the smart cities disciplines; such as sustainability, economic enhancement, governance, mobility; the Heritage Advisors

338
David Batchelor, Marc Aurel Schnabel, Karl Lofgren
assumed there would be broader benefits, but these were beyond their understanding. Some advisors had not considered in detail the other discipline before. Regardless, they were all supportive of any positive outcomes for their city from all disciplines. As an exception, the Heritage Advisor from the City of Newcastle had moderate knowledge of smart cities as a result of previously being within the same council team and mentioned how the smart city team is well-known within the organisation.
"Well, actually not an awful lot, which is quite interesting. I mean, I actually went and looked it up after you contacted me just to make sure I understood what it was about…There is [a lack of knowledge] for me because I am actually not interested in it per se. I like what it does. And I like seeing it happen, but I have no personal interest in it." (Broken Hill City Council, 2020a, Interview with Heritage Advisor, 22 May).
"It helps that [the Smart City] team was originally on the same floor as me in council, so I saw them on a daily basis." (City of Newcastle, 2020a, Interview with Heritage Advisor, 23 June).
The Smart City Advisors had some knowledge about heritage, but this knowledge was assumed or indirectly gained through haphazard interactions and informal learnings. The advisors were aware they did not comprehensively understand the nuances of the heritage discipline and what the heritage team did within their organisation. Their knowledge was primarily through topical issues regarding local or state government historic protection overlays restricting development or advertised heritage exhibitions. A notable exception was the Smart City Advisor in Broken Hill City Council who gave a thorough explanation of the heritage strategy in the council and the decision-making and regulatory processes, including the categories of heritage protection in the city. This in-depth explanation was because the advisor was also responsible for operational matters within the small local government. When asked to consider the outcomes of heritage, the Smart City Advisors described the preservation of historic buildings, as well as interpretation and governance of cultural narratives within the city. There was an understanding that these outcomes are valuable as they represent and engrain cultural identities within the city, and function as civic assets for economic, tourism, and symbolic governance purposes.
"Interestingly enough, if you talk to our planning department, it would be about conservation. If you talk to someone like me who works in economic development, it's also about how we showcase those heritage buildings… I think it's sort of a multi-layered question because depending on what aspect you're coming from, is about how you would view and use that strategy." (Broken Hill City Council, 2020b, Interview with Smart City Advisor, 22 May).
Smart City and Heritage Advisors in the local governments, all saw their role as strategically aligning with the other discipline. However, these alignments were unplanned as they primarily derived from opportunistic or serendipitous conversations or interactions. Therefore, the advisors did not consider the disciplines shared intentional alignment.
In the City of Melbourne, the Smart City Advisor described the utilisation of heritage protection overlays to manage 5g telecommunication infrastructure locations in the city. Historic protection overlays were one of the few controls the advisor had for this purpose due to federal legislation permitting installation. The Smart City Advisor expressed concern over the infrastructure cluttering footpaths while the heritage team sought to avoid adverse installations in historic areas. The Smart City Advisor found strategic alignment with the heritage team through a passing interaction. Similarly, in Broken Hill City Council, the Smart City Advisor and the Heritage Advisor opportunistically bolstered

339
Delivering Smart Heritage to Local Governments
local and state government grant applications by linking different smart city and heritage initiatives in the tenders. Both advisors in the City of Newcastle reported alignment where the disciplines delivered placemaking outcomes. However, the council did not direct this novel alignment. Instead, it occurred as a result of heritage directives geographically overlapping with smart technology upgrades in the city.
"In order to pull a project together in a council of this size, we need to have a multidisciplinary contribution, because otherwise it's not going to happen and we're not going to get all the information required." (Broken Hill City Council, 2020b, Interview with Smart City Advisor, 22 May).
"Aligns with and delivers, I would say...Smart city aligns in the sense that we are trying to create a future city that acknowledges and honours its past." (City of Newcastle, 2020b, Interview with Smart City Advisor, 30 June).
The serendipitous and opportunistic nature of the alignment often required additional and unforeseen effort to realise benefits. Some respondents expressed frustration with delays from further consultation or new technical requirements introduced by the other discipline. However, all respondents were thankful for the convergences as they created an innovative outcome eventually. Additionally, the unplanned nature of these alignments restricted the convergence to the issue at hand. Therefore, the advisors typically did not consider other opportunities for convergence outside the specific collaboration or instance. However, in the interviews, the advisors were willing to understand how the disciplines can work together better in the future and potentially converge outcomes.
"I'm interested in being strategic... So, I think I've created a job that's probably more aligned with Smart City than would normally be the case." (Broken Hill City Council, 2020a, Interview with Heritage Advisor, 22 May).
4.2 Key finding: reliance on personal connections for convergence
The participants relied on personal connections within the organisation to converge the disciplines. The Smart City Advisor for the City of Melbourne was not aware of a specific process for converging the disciplines in the organisation. The advisor instead relied on their personal network within the council. The Heritage Advisor was also not aware of formal processes and mused that the team leaders would discuss the opportunities before convergence occurred. The advisor said personal connections typically expedited convergences within the organisation and were critical to fill the gaps where formal processes did not exist. However, the Heritage Advisor noted a formal process of endorsement from management and councillors would be required to officially connect the disciplines, secure funding, and utilise other staff resources outside of personal connections. This formal process would take a significant period, and its success would be uncertain.
The advisors from Broken Hill City Council also regularly relied on personal networks. The Heritage Advisor reported that unplanned conversations regularly led to their involvement in initiatives that require heritage expertise. The Smart City Advisor highlighted the small size of the council encouraged an informal process for communication and collaboration between disciplines. The advisor stated there are no formal barriers to convergence between the disciplines other than time and financial restrictions.
The Smart City Advisor and Heritage Advisor in the City of Newcastle leveraged their close working relationship to converge the disciplines. Both advisors previously had contacted each other on the impulse that the other could benefit their initiatives and were not explicitly directed by management to

340
David Batchelor, Marc Aurel Schnabel, Karl Lofgren
do so. They both preferred a personal approach due to their familiarity with each other from previously working within the same team. The Smart City Advisor acknowledged that the smart city team had a process for interdisciplinary engagement due to their agile work-method. However, this method was an experiment within their team and not implemented across the organisation.
"The City of Melbourne is a really big local government, and there is a lot of coordination that is required, but there's still a lot of relationship-based activity. So, it's based on your relationships. So even if there was a process, people don't necessarily do that." (City of Melbourne, 2020b, Interview with Smart City Advisor, 4 June).
"Stuff filters through because someone will say, "did you know that we're doing that?" And you go, "no, I didn't", so you make a phone call, and you're in." (Broken Hill City Council, 2020a, Interview with Heritage Advisor, 22 May).
"For me to hatch a project with [the Heritage Advisor], I go downstairs, and I walk up to his desk, and I say 'Hey, can I have a chat?' and we go for a coffee and we hatch a project together. Then if we either like it enough, we crafted through the existing processes." (City of Newcastle, 2020b, Interview with Smart City Advisor, 30 June).
The reliance on personal networks limited the ability for some participants to form new convergences and innovations, such as those convergences that require broad networks or significant organisational resources. Also, there was a lack of procedural support for new convergences in the organisation and, therefore, steep learning curves where new interactions occurred. Some advisors indicated a preference for a more formal and structured approach as another procedural option to personal networks.
The Smart City Advisor at Broken Hill City Council experienced new learnings when installing smart lighting and CCTV monitoring systems into a heritage-listed park. According to the Heritage Advisor (2020), the design of the new technologies did not support the historic aesthetic or values of the park and the advisor "took the council to task" to redesign their installation (Broken Hill City Council, 2020a). The advisors then worked together to integrate the technologies sympathetically. This created time delays, however, formed greater procedural convergence between the disciplines. It led to a successful federal joint-grant application to develop the National Heritage Values Planning Framework for Broken Hill; guidelines and protocols to better manage and enhance historic sites. The Smart City Advisor of the City of Melbourne described how the smart city process is additive, and the outcomes are unclear even to those implementing them. The smart city team accepted this approach; however, it often was unsuitable for other disciplines, like the heritage team, who had deadlines and fixed deliverables. The Heritage Advisor for the City of Newcastle reported they relied heavily on the Smart City Advisor to assist with technology, and the Heritage Advisor appreciated discovering new opportunities to deliver heritage outcomes through technology.
"We're finding out what we don't know, and we don't know what we don't know. So, once we find out something, we'll be able to tell you what the benefits are. But until that point, we are unsure." (City of Melbourne, 2020b, Interview with Smart City Advisor, 4 June).
4.3 Key finding: current convergences
All the participants reported a handful of existing convergences with the other discipline. Most convergences were on placemaking, knowledge transmission, and community initiatives. However, the

341
Delivering Smart Heritage to Local Governments
convergences saw limited innovation as the scope of the interactions prescribed the inputs; whereas the convergence could not influence the strategic direction of the initiative. All advisors noted that more convergences are desirable.
The Heritage Advisor from Melbourne City Council collaborated with the smart city team on an ongoing three-year 'heritage data project'. The initiative collates the currently dispersed information about heritage places; location, historical photographs, heritage investigations and reports, and current historic protections; into a central digital system to support development application decisions, strategic decision making, and broader placemaking and community projects. As of June 2020, the initiative ended its first year. The second-year builds a digital system to accommodate and manage the heritage data. Also, the Heritage Advisor and Smart City Advisor from Melbourne City Council separately discussed a 'Melbourne City DNA' exhibition for Melbourne Knowledge Week, an annual innovation festival. The exhibition implemented virtual and augmented reality, a series of interactive screens showcasing data, and a 3D printed model of the city to engage audiences with strategic planning issues, including heritage and smart cities. Both advisors highlighted how it conveyed Aboriginal Heritage to new audiences and integrated non-tangible heritage into a planning context through technology. Both advisors could not identify another instance of convergence.
Regarding the limitations to convergences in the City of Melbourne, both advisors noted high workloads in their traditional duties and stated these limited the time for free-form collaborative efforts. Convergences on the Melbourne City DNA initiative was limited to only displaying existing and static smart city and heritage datasets and did not aim to produce new or unknown outcomes for either discipline. Both advisors supported more convergence but were not aware of future opportunities. The lack of known future convergences made it evident that additional resources would be required to pull the disciplines together.
"Yeah, because it's very conditions-based. If there's no permission to be accessed then I don't involve them, or like if there's no benefit for the heritage team then I wouldn't involve them." (City of Melbourne, 2020b, Interview with Smart City Advisor, 4 June).
The Smart City and Heritage Advisors for Broken Hill City Council discussed the ongoing delivery of an inner-city cultural precinct to create a more liveable city, with a measure of people spending more time in the inner-city. The advisors identified the new large-format shopping precincts on the outskirts of the city and the lack of attractive central public amenities detracting from inner-city use. The cultural precinct features an art gallery, a museum and civic archives, and a public library. The Heritage Advisor in Broken Hill City Council worked 'peripherally' on the initiative through assessing the effects on heritage in development applications. The Heritage Advisor was aware that smart technology is involved, but the advisor was not involved in these matters. In the precinct, the Smart City Advisor managed the installation of automatic watering systems, public Wi-Fi, and smart lighting systems. The smart technologies primarily sought operational efficiencies for the cultural precinct and were not explicitly intended to interact with heritage values.
The respondents in Broken Hill City Council had a pragmatic perspective of the limitations of convergence. The Heritage Advisor acknowledged the immediate need to address the population decline within the city and the restrictions of the small local government budget. Therefore, the advisor prioritised cost-efficient and immediately effective initiatives. The advisor was willing to prioritise these initiatives in place of those serving unknown outcomes from innovative approaches. The Smart City Advisor, who was also responsible for economic development in the council, similarly prioritised the

342
David Batchelor, Marc Aurel Schnabel, Karl Lofgren
immediate need to pull shoppers away from large format retail developments on the outskirts of the city. Once these improved central public spaces exist, both advisors supported delivering innovative solutions through the smart city and heritage convergence.
"It's about economic uplift, and about getting more people to spend more time in the central business district because, for the size of this town, we've got a couple of other little shopping precincts that have drawn people out of that CBD space…. it's also about liveability." (Broken Hill City Council, 2020b, Interview with Smart City Advisor, 22 May).
The Heritage and Smart City Advisors from the City of Newcastle reported multiple convergences. Their primary convergence regarded placemaking and knowledge transmission surrounding historical narratives. Both advisors discussed placemaking initiatives in public spaces, where they worked on alongside a Guraki facilitator (an Aboriginal advisor) and a placemaking advisor. In these initiatives, the Heritage Advisor identified heritage narratives alongside the Guraki facilitator that the Smart City Advisor integrated into digital interpretative experiences. The Heritage Advisor also previously worked with the smart city team on development assessment applications for digital signage in the historic town centre and supported historical research services to the Smart City team for a mobile application coastal walking tour. The Smart City Advisor described a 'dual naming project' that educated communities about English and Aboriginal names places and dual-cultural perspectives of place. The advisors worked alongside the Guraki facilitator to deliver digital and augmented heritages Aboriginal experiences at these sites. In these experiences, users press a button on signposts to listen to the Aboriginal names and then use their cell phones for an augmented cultural experience of the place and more historical information via a QR code. The Smart City Advisor proffered technical services for the augmented reality experience, while the Heritage Advisor supported research into the historical information. The Smart City Advisor also worked alongside the heritage team to deliver a digital twin of the city for the planning team in the council to engage the public on urban densification matters; the Heritage Advisor advised where heritage protection overlays are present in the city.
The City of Newcastle advisors did not consider the scope of initiatives limited innovative outcomes. The trusted working relationship between the advisors facilitated an environment for free-form convergences. Supporting this view, the Heritage Advisor discussed a quarterly meeting that featured heritage and smart city staff who discussed upcoming opportunities, strategic direction, and processes for collaboration.
"It just so happens that [the Heritage Advisor] is a good person and likes to think in a way that is in the spirit of how the smart city team and I want to operate; which is highly collaborative, future-focused, and get it done. We've got principles, and they seem to suit, but there's no ledger where we help them out, and they go, 'I own one'. It's project-by- project." (City of Newcastle, 2020b, Interview with Smart City Advisor, 30 June).
4. ConclusionThe research demonstrates that local governments tenuously orchestrate the Smart Heritage discourse through a patchwork of knowledge, personal networks, and a handful of convergences. Regarding knowledge, most of the Smart City and Heritage Advisors responded they have little or limited knowledge about the other discipline. Generally, they described the other disciplines based on tangible user-experiences, such as virtual reality and heritage development restrictions. Drawing on the above literature about knowledge, this indicates detrimental silos of the disciplines within the organisations

343
Delivering Smart Heritage to Local Governments
(Leeuw et al., 1994). Nevertheless, the advisors reported that the disciplines strategically align as they both support council-wide aspirations to enhance the city. However, this alignment was unplanned as it derived mainly from opportunistic or serendipitous interactions. Guided by the academic literature, the novelty of these interactions present opportunities for innovation, however, the organisations require additional time and resources to meaningfully integrate the knowledge at a significant scale (Nonaka and Tekuchi, 1995; Lattuca, 2001).
Additionally, the advisors relied on personal connections within the organisations to undertake the process of convergence. There were no formal processes in the local governments for discussing, managing, or implementing convergence between the disciplines; therefore, the advisors relied on their personal network and agency. The advisors generally accepted this approach as they tailored the response for their current initiative. However, some respondents felt limited by the reliance on personal networks to achieve new outcomes that require broad networks or more significant organisational resources. Interestingly, all advisors were not actively restricted by the organisational structure or other internal processes from converging with the other discipline; instead, it was a matter of an absence of processes. These findings are in line with the academic literature on processes, as the tailoring of processes avoids conflict within the organisation from the innovation but restricts the exposure to organisation-wide resources and opportunities (Vince and Saleem 2004).
All participants reported initiatives where the disciplines converged. In most cases, these convergences occurred solely in technical contexts, where their expertise was requested to resolve a specific issue on a programmed outcome; and not deliver innovation or meaningfully influence an initiative outside of this scope. This trend echoed the drawback within the academic literature, where interdisciplinary initiatives can be ineffective in their potential innovation if not comprehensively embraced (Goldman et al., 2015). Only in the City of Newcastle, did the scope for convergence produce novel Smart Heritage outcomes that balanced sensitivities of issues as described by Lanterman and Blithe (2019).
Overall, the convergences share the challenges that are common throughout academic literature on interdisciplinary discourses. Enhancements to interdisciplinary knowledge, processes, and initiatives would improve convergence resulting in more substantial Smart Heritage outcomes. Further research into these improvements, specifically how to construct notable Smart Heritage discourse within local government strategy and operations, would proffer valuable insights.
References Batchelor, D. and Schnabel, M.A. (2019) Smart Heritage in selected Australian local government smart city policies,
in A. Agrawal and R. Gupta (eds.), Revisiting the Role of Architecture for 'Surviving' Development, (53rd International Conference of the Architectural Science Association (ANZAScA)), pp. 245–254.
Broken Hill City Council (2020a) Interview with Heritage Advisor, 22 May. Broken Hill City Council (2020b) Interview with Smart City Advisor, 22 May. Callard, F. and Fitzgerald, D. (2015) Rethinking Interdisciplinarity across the Social Sciences and Neurosciences,
Palgrave Pivot, London. Chang, C. and Lin, T. (2015) The role of organisational culture in the knowledge management process, Journal of
Knowledge Management, 19(3), 433–455. City of Melbourne (2020a) Interview with Heritage Advisor, 21 May. City of Melbourne (2020b) Interview with Smart City Advisor, 4 June. City of Newcastle (2020a) Interview with Heritage Advisor, 23 June. City of Newcastle (2020b) Interview with Smart City Advisor, 30 June.

344
David Batchelor, Marc Aurel Schnabel, Karl Lofgren
Gilson, C., Dunleavy, P. and Tinkler, J. (2009) Organisational learning in government sector organisations: literature review, London School of Economics and Political Science, London.
Goldman, J., Reeves, S., Wu, R., Silver, I., MacMillan, K. and Kitto, S. (2015) Medical residents and interprofessional interactions in discharge: An ethnographic exploration of factors that affect negotiation, Journal of General Internal Medicine, 30(10), 1454–1460.
Gooch, J.C. (2005) The Dynamics and Challenges of Interdisciplinary Collaboration: A case study of "cortical depth of bench" in group proposal writing, IEEE Transactions on Professional Communication, 48(2) 177–190.
Heemskerk, M., Wilson, K. and Pavao-Zuckerman, M. (2003) Conceptual Models as Tools for Communication Across Disciplines', Conservation Ecology, 7(3), 8.
Helga, N. (2017) Introduction: Investigation Interdisciplinarities, in S. Frickel, A. Mathieu and B. Prainsack (eds), Investigating Interdisciplinary Collaboration: Theory and Practice across Disciplines, Rutgers University Press, London, 5–24.
Izunwanne, P. (2017) Developing an Understanding of Organisational Knowledge Creation: A Review Framework, Journal of Information and Knowledge Management, 16(2), 1–31.
Kim, S. (2015) Interdisciplinary Approaches to Methods for Sustainable Transformation and Innovation, Sustainability, 7(4), 3977–3983.
Lanterman J.L. and Blithe, S.J. (2019) The Benefits, Challenges, and Disincentives of Interdisciplinary Collaboration, Commoning Ethnography, 2(1), 149–165.
Lattuca, L.R. (2001) Creating Interdisciplinarity: Interdisciplinary research and teaching among college and university faculty, Vanderbilt University Press, Nashville.
Leeuw, F.L., Rist, R.C. and Sonnichsen, R.C. (1994) Can governments learn?: comparative perspectives on evaluation and organisational learning, Transaction Publishers, New Brunswick.
Nonaka, I. and Takeuchi, H. (1995) The Knowledge Creating Company: How Japanese Companies Create the Dynamics of Innovation, Oxford University Press, Oxford.
Oberg, G. (2009) Facilitating Interdisciplinary Work: Using quality assessment to create common ground, Higher Education, 57(4), 405–15.
Repko, A.F. (2012) Interdisciplinary Research: Process and theory, Sage Publications, Thousand Oaks. Stokols, D., Hall, K.L., Taylor, B., and Moser, P. (2008) The Science of Team Science: Overview of the Field and
Introduction to the Supplement, American Journal of Preventive Medicine, 35(2), 77–89. Thompson, J.L. (2009) Building Collective Communication Competence in Interdisciplinary Research Teams, Journal
of Applied Communication Research, 37(3), 278–297. Vince, R. and Saleem, T. (2004) The Impact of Caution and Blame on Organizational Learning, Management
Learning, 35(2), 133–154.

345
The 54th International Conference of the Architectural Science Association (ANZAScA) 2020
Design and develop smart asset management leveraging BIM for life cycle management of building assets in Vietnam
Quynh To Thi Huong1 1 National University of Civil Engineering, Hanoi, Vietnam
Abstract: Along with the life cycle of building assets, their owners have submitted to increasing challenges, from quality issues, degraded indoor environment, high running expenses; as well as increasing sustainability requirements to reduce both energy consumption and greenhouse gas emission. To meet these challenges, the owner of a pilot building project in Vietnam had to innovate both management and operation methods in order to optimise building effectiveness together with the improvement of its performances. The chosen strategy was based on smart asset management which leveraging Building Information Modelling (BIM) and other related technologies (Barcode, Sensor technology, Internet of Things). This paper presents the design of a smart asset management model applied to this pilot building in Vietnam. The model has concerned different issues not only leveraging innovative technology but also management method approaches of each building base on its characteristics, such as optimising management process, evaluating management performance by KPIs as well as managing asset information throughout the building life-cycle.
Keywords: Building Information Modelling (BIM), smart asset management, building life cycle, Vietnam.
1. IntroductionAs one part of Engineering Asset Management (EAM) in particular and Asset Management (AM) in general, Building Asset Management (BAM) takes all nature and characteristic of EAM and control of ISO 55000 family standards (Amadi-Echendu et al., 2010). BAM system enables buildings' stakeholders to extract the most value from their building assets. This system is broad in scope - a wide variety of areas, including all activities, from operation/maintenance to upgrade/renewal for the entire building life- cycle. BAM must control performance management, risk, and cost at both building asset level and organisation one for achieving organisational strategic goals. Managing building assets has significantly altered because of changing building components' and equipment's designs, information and communication technologies between building stakeholders, pressures of budget and users, risk and failures tolerance ability as well as increasing sustainability requirements (Parlikad, 2019).
Moreover, recently, management-working environments are more and more complex and require simultaneously multiple reactions. This integrated high-level management implicating various sub- systems requests the collaboration of diverse stakeholders involved numerous systems and divisions.
Imaginable Futures: Design Thinking, and the Scientific Method. 54th International Conference of the Architectural Science Association 2020, Ali Ghaffarianhoseini, et al (eds), pp. 345–354. © 2020 and published by the Architectural Science Association (ANZAScA).

346
Quynh To Thi Huong
These stakeholders work together to improve coordination and information sharing during the whole life cycle process of building assets (Jin et al., 2019). Aim to have an effective program, BAM also requires operation and management (O&M) staffs an enthusiastic commitment. A part of the process includes utilising technology to determine the state of assets. There is no silver bullet, but there are various technologies that could deliver the best investment return for different asset configurations (Willson, 2013).
Indeed, the available technologies and their capabilities in supporting management are increasing yearly. Smart technologies are rapidly developing viewed as business enablers, and they have the effect, use and penetration of the marketplace to provide asset management activities. The first reason is smart technologies can support collaborative information sharing and deliver numerous benefits to an organisation such as cooperative or separate working environment like Building information modelling (BIM) does (Guillen et al., 2016). Besides, base on the complexity of buildings' structure, the costs to determine the building assets' condition for maintenance purposes during their whole life can be very high by the traditional and manual strategy. With the application of appropriate smart technologies related to BIM as Barcode, Radio Frequency Identification (RFID) tags, sensor technology, Internet of Things (IoT), all real-time asset information can be collected easily and fast (Gao and Pishdad-Bozorgi, 2019). Therefore, this critical help is the second reason for adopting smart technologies in BAM.
BIM and these relevant technologies mentioned above have been studied intensely in both academic and commercial fields (Li et al., 2019). There are some available BIM-enabled asset management platforms, which are already available commercially and been used worldwide as BIM 360 OPS (Autodesk, 2020). However, these publications and products have several shortcomings. First, they had only focused on applying technologies individually, without a combination of various technologies into one smart system for managing building assets. Second, their BAM strategy had not concerned the ISO 55000 goals that focus not only on correct maintenance purposes but also optimising AM strategy and performance through Key performance indicator (KPI) systems (To et al., 2020). Even though there are also some on-going projects like Parlikad et al., (2017) one that focused on smart asset management strategy, but its objects are infrastructure assets. Those assets are quite different from building ones, which are already much more separate because of building types. To et al., (2020) proposed a Smart Asset Management (SAM) model for social housing assets base on Parlikad et al., (2017) one; however, this research limitation is a lack of a tool for assessing the performance of BAM and building assets (BA). Besides, the critical tasks of BAM leveraging BIM inappropriate to BAM context in the To et al., (2020) model also need to confront.
Therefore the first step of this research is a design of the Smart Building Asset Management (Smart BAM) system for the whole life cycle management of BA. The next process of the study: developing a Smart BAM's strategy in Vietnam context can begin. The final step is concerned with adopting this Smart BAM to a case study building. The results and findings of the study will provide a tool to support life cycle management of building assets, particularly in Vietnam.
2. Smart building asset management design and developmentThe Smart BAM system for the whole life cycle management leveraging BIM and related technologies (Barcode, Sensor technology, Internet of Things) includes five steps (Fig 1). Each step defines the list of stakeholders as well as their contribution to the building asset management process. Step 1 to step 3 are used for managing individual building assets level, while 4th and 5th step can apply for both building and organisation management level. Those five steps must be developed detailedly regarding (1)

347
Design and develop smart asset management leveraging BIM for life cycle management of building assets in Vietnam
building assets’ nature and property, (2) building management organisation strategy, policies and goals, (3) national and international context of regulation and standards. The detailed processes of eachfollowing smart BAM step will be developed under complex, equipped, high-rise building assets’specification and their multiple stakeholders’ goals; which are the most challenging type of building tomanage. Base on the BIM environment, all related technologies will be concerned to optimise manualBAM processes, from asset identification to decision making as well as performance evaluation. Fordecision making and performance evaluation, the related regulation (The Vietnamese Prime Minister,2015) and standards (The Vietnam Minister of Construction, 2019) of Vietnam will be regarded as theresearch aim is the development of Smart BAM model that suitable to the Vietnam context.
Figure 1: Smart asset management system in 5 steps with the stakeholders' participant (Modified pattern from Parlikad et al., 2017; To et al., 2020)
2.1 Step 1: Identification of building assets
Barcode, RFID tags are two automatic identification technologies that could be integrated with BIM successfully (Gao and Pishdad-Bozorgi, 2019; To et al., 2020). Cheap two-dimensional barcodes can be used for identifying building equipment like MEP equipment (Water heaters, air-conditional, switches, power receptacles, light fixtures, etc.) and interior stuff (Doors, windows, interior equipment). More expensive but more benefits, RFID tags could be used to identify important equipment of MEP system (Distribution equipment, power transformer equipment, security cameras, door access control, emergency generator, booster pumps, air make-up unit, elevator machines) or Fire safety assets (Emergency lighting, exit signs, fire detection equipment, heat and smoke detectors). Architectural elements (Wall cladding, roof's cover..), soft landscaping (plants, laws), structural parts (Foundation, columns, beams, floors, roofs, stairs) and MEP components (Power distribution, panel boards, wires) can be named by Identify codes (related to their place or types).
Both the statistical data of building assets such as information related to (1) technical (insulation class, energy consumption, etc.), (2) installation, (3) warranty, (4) maintenance, (5) asset ID, (6) cost, (7)
BIM environment

348
Quynh To Thi Huong
labour, machine, time expenses for asset installation or disposal; and the social information related to the legal field ((8) Technical standards, (9) Regulation, (10) Sustainable requirement) needs to store in the building asset information database. This information is essential when the building managers do the operation, maintenance, renewal/ upgrade/renovation and dispose of buildings. This information also has a strong relationship with KPIs of building performance and quantitative decision-making method - the core concerning 4th and 5th steps of the smart asset management process.
2.2 Step 2: Tracking the state or condition of building assets – update dynamic asset data
Sensing technology and IoT facilitate transferring and updating of information as well as tracking of building assets' status (Gao and Pishdad-Bozorgi, 2019; To et al., 2020). The two technologies track critical parameters that provide an indication of the rate of progression or the likelihood of development for different failure modes of an element, an asset or the system. Mechanical, electrical, fire safety assets with RFID tags (active ones) have favourable conditions to connect automatically with the monitoring system through IoT. Data captured by sensors will be sent to managers, or update to Raspberry PI server by connecting sensors by wired or wireless networks. New engineering datasets (not available in previous systems) provided by new sensors, are interpreted and translated into the same language with the old one. The core data could be updated manually or automatically to BA information database in the BIM environment.
In addition to dynamic auto-tracking, manual checking and reporting are applied for assets tagged by Barcode and ID name. Manual works could be done by owners' managers, contractors or even users. Indeed, users can report problems using BIM online version. Users could also change BA management setting using light BIM.
2.3 Step 3: Managing and dividing asset information automatically
The Smart BAM model aims at providing a single query mechanism to access to available data, without requiring searches across multiple databases and storage locations in different organisations. The ideal platform allows accessing all kinds of information mentioned in step 1. However, the amount of information needed for each asset types is not the same for each maintenance or operation action. Besides, managers from different departments of management organisations or sub-contractor for maintenance/ renovation demand the specific and particular asset information. For example, the technical managers, take the asset information of the numbers (1)-(2)-(3)-(4)-(5) and (8) in step 1 into consideration, while the financial or accountant officers concern only the one of the number (6), (9) and (10), and the human resource manager has the responsibility about labour or machine – so the one of the number (7) and (9) needed.
The amount of information captured day by day makes the asset management database come huge, which leads to increased expenses. There is the appearance of an important question concerned the minimum volume of data which provides effective management. Thus, dynamic BIM model and PI server were developed with the combination of several tools to support building managers accessing to priority information and classifying it.
2.4 Step 4: Smart decision making
Smart decision-making is a major concern for asset managers. New developments in the BIM technology field enable the effective usage of SAM in the building sector. For example, the creation of the BIM

349
Design and develop smart asset management leveraging BIM for life cycle management of building assets in Vietnam
dynamic model aims to help the managers and users to make effective decisions regarding comfort and energy consumption. Every asset is represented by a software program that continuously seeks data from various sources (including sensors) and takes decisions without a need for human intervention (Fig 2). This model is used to auto - modify the temperature, humidity and brightness parameters in the BIM interface (Alileche, (2018). Besides controlling the comfort functions, the BIM dynamic model enables users to track resource consumption and waste. Accessing to daily expenses could impact users' behaviour, push them into saving energy and water. Advances in the predictive maintenance manner using dynamic BIM model also enable asset managers to understand the state of their assets, to predict impending failure and create the opportunity to take optimised preventative actions (Fig 2).
Figure 2: Auto decision-making process with the method that regarding comfort zone (T/H) and energy consumption of the building and the predict maintenance plan- An example of Alileche, (2018)
Sensors and IoT make building asset management easier by auto-decision making tools. Nevertheless, along with the automatic decision-making process, semi-automatic tools are also necessary. They can be applied for activities in operation (Fig 3a), maintenance (Fig 3b), renewal, upgrade, renovation or even dispose of buildings (Fig 3c).
The proposed model provides the following value of BAs:
Benefits arising not only to BAs but also to the stakeholders through the effective performance ofthe BAM system (Step 2 in Fig 3a; Step 2 in Fig 3b, Simulation step in Fig 3c)
Reduce risks caused by BAs to the BAM system and BA stakeholders (Step 3 in Fig 3a; Evaluate asset condition Step 2 in Fig 3b, Make several plans in Fig 3c).
Lower expenditures incurred on the asset (Step 1 in Fig 3a; Simulation all plans in Fig 3c).
This section shows that BIM dynamic (with COBie extension) plays as a critical element of smart BAMmodel. It helps managers to get estimated results of simulated solutions or plans before making a decision. Therefore, smart decision-making approaches for BAM processes have not been only based on

350
Quynh To Thi Huong
cost but also risk and performance. So, the BIM model removes the difficulty of quantitative assessment in BAM strategy.
(a) (b) (c)
Figure 3: Semi-automatic decision-making model of operation activities (a), correct maintenance activities (b), selecting the most feasible plan of projects (c)
2.5 Step 5: Measuring performances of assets management
The performance assessment of the BAM system and asset value delivery includes three levels: asset, individual building and management operation. It is conducted using KPIs in Table 1. The KPIs cover four dimensions: (1) Finance, (2) function, (3) sustainable requirement and (4) user perspective. Including both short-term and long-term indicators, KPIs support building managers to detect asset management problem early. Thus, this step allows managers to avoid as much as possible profit or value loss for the entire building life cycle.
Table 1: KPIs for smart building asset management evaluation
1. Financial 2. Functional 3. Sustainable 4. User satisfaction
1.1. Operating costs (per sq.) (S); (B) – (O) 1.2. Building maintenance cost (per sq.) (S); (B) – (O) 1.3 Life cycle cost (L) – (B), (O) 1.4.Maintenance efficiency indicators (MEI) (Optional) – (S)-(L); (A), (B), (O)
2.1. Indoor environmental quality (IEQ) (S); (B) – (O) 2.2. Resource consumption – energy; water; materials L) – (S); (B) – (O) 2.3. Building performance index (BPI) L) – (S), (B)
3.1 CO2 emission (S); (B) – (O) 3.2. Property and real estate L) – (S); (B) – (O) 3.3 Waste (S); (B) – (O)
4.1. User satisfaction with the quality of building assets (S)-(L); (B) – (O) 4.2 User satisfaction with the services (S)-(L); (B) – (O)
Note: (S) Short-term indicators –(L) Long-term indicators (A) – (B) – (O) - Indicators to evaluate the performance of: A- Assets, B- Buildings, O - Operations
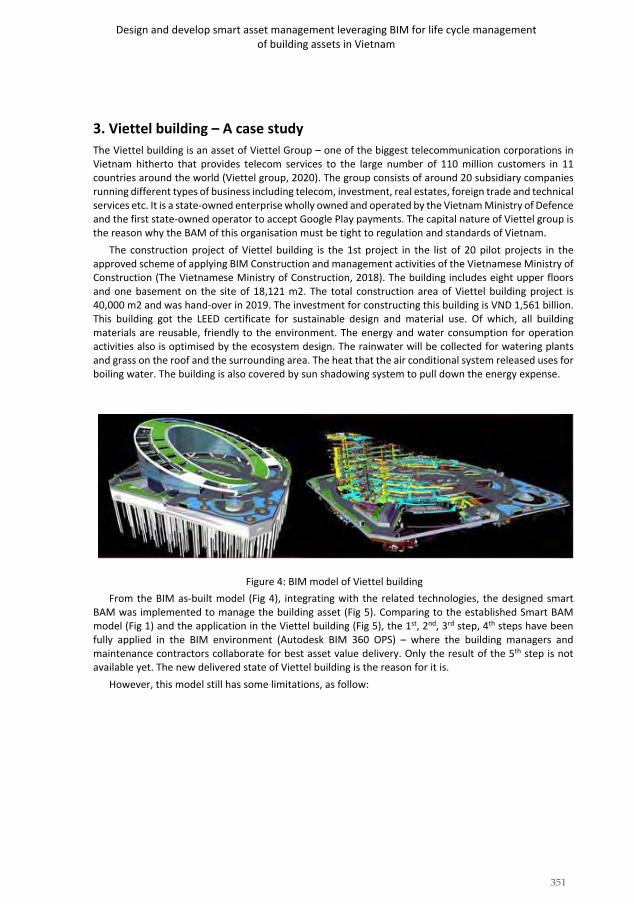
351
Design and develop smart asset management leveraging BIM for life cycle management of building assets in Vietnam
3. Viettel building – A case study The Viettel building is an asset of Viettel Group – one of the biggest telecommunication corporations in Vietnam hitherto that provides telecom services to the large number of 110 million customers in 11 countries around the world (Viettel group, 2020). The group consists of around 20 subsidiary companies running different types of business including telecom, investment, real estates, foreign trade and technical services etc. It is a state-owned enterprise wholly owned and operated by the Vietnam Ministry of Defence and the first state-owned operator to accept Google Play payments. The capital nature of Viettel group is the reason why the BAM of this organisation must be tight to regulation and standards of Vietnam.
The construction project of Viettel building is the 1st project in the list of 20 pilot projects in the approved scheme of applying BIM Construction and management activities of the Vietnamese Ministry of Construction (The Vietnamese Ministry of Construction, 2018). The building includes eight upper floors and one basement on the site of 18,121 m2. The total construction area of Viettel building project is 40,000 m2 and was hand-over in 2019. The investment for constructing this building is VND 1,561 billion. This building got the LEED certificate for sustainable design and material use. Of which, all building materials are reusable, friendly to the environment. The energy and water consumption for operation activities also is optimised by the ecosystem design. The rainwater will be collected for watering plants and grass on the roof and the surrounding area. The heat that the air conditional system released uses for boiling water. The building is also covered by sun shadowing system to pull down the energy expense.
Figure 4: BIM model of Viettel building
From the BIM as-built model (Fig 4), integrating with the related technologies, the designed smart BAM was implemented to manage the building asset (Fig 5). Comparing to the established Smart BAM model (Fig 1) and the application in the Viettel building (Fig 5), the 1st, 2nd, 3rd step, 4th steps have been fully applied in the BIM environment (Autodesk BIM 360 OPS) – where the building managers and maintenance contractors collaborate for best asset value delivery. Only the result of the 5th step is not available yet. The new delivered state of Viettel building is the reason for it is.
However, this model still has some limitations, as follow:

352
Quynh To Thi Huong
Step 1
The architectural and structural elements have not been concerned yet.
The RIFD tags have been used but not put into the BIM model. Step 2
The data captured from the sensor system still asks for updating manually due to the enormousprocessing requirement of reducing the amount of captured data. In future research, a helpingtool should be studied to provide automatical data mining supporting tools.
The user access has not been provided yet, so it should be developed in the future to leveraging users’ participant and support.
Step 3
Only the technical division understands how to access to BIM environment; therefore, other divisions have not participated yet in the Smart BAM of this building.
Step 4
Others processes of operation smart decision-making strategy should be facilitated by the BIMmodel instead of using a Building management system (BMS) model separately.
Step 5
Evaluating asset management performance tools have to be implemented and assessed following by each management activities.

353
Design and develop smart asset management leveraging BIM for life cycle management of building assets in Vietnam
Figure 5: Maintenance activities within Autodesk BIM 360 OPS environment of Viettel building assets
4. ConclusionThe design, development and adoption of the Smart asset management model for building assets to Vietel building assets have been presented. This model has both renovations in management activities and strategy comparing to available BIM-enabled BAM models. According to the results which analysis above, it is not difficult to show that smart technologies used for managing Viettel building assets are not completed like the model in Fig. 1 presented, especially for identifying assets and managing the value of BAM. The reasons for these consists are natures of building assets such as the complexity and diversity, which make the auto identifying process for each asset difficult, especially in case of a vast number of assets. However, it is undeniable that BIM and relevant technologies brought a new generation for BAM. They have already helped all stakeholders manage their assets more automatically and effectively. From all findings that showed above, a full model of smart BAM in the near future is entirely foreseeable.

354
Quynh To Thi Huong
Acknowledgements This research is funded by the National University of Civil Engineering (NUCE) under grant number 40- 2020/KHXD-TD.
References Alileche, L. (2018) Use of BIM for the Optimal Management of Existing Building, Lille University. Amadi-Echendu, J.E., Brown, K., Willett, R. and Mathew, J. (2010) Definitions, Concepts and Scope of Engineering
Asset Management, 1, Springer London Dordrecht Heidelberg New York, Australia. Available from: https://doi.org/10.1007/978-1-84996-178-3.
Autodesk. (2020) BIM 360 OPS - Facilities Management Software, Autodesk. Available from: https://www.autodesk.com/bim-360/facilities-management-software/ (accessed 20 October 2020).
Gao, X. and Pishdad-Bozorgi, P. (2019) BIM-enabled facilities operation and maintenance: A review, Advanced Engineering Informatics, 39, 227–247.
Guillen, A.J., Crespo, A., Gómez, J., Kobbacy, K. and Shariff, S. (2016) Building information modeling as asset management tool, IFAC-PapersOnLine, Elsevier B.V., 49 (28), 191–196.
Jin, R., Zhong, B., Ma, L., Hashemi, A. and Ding, L. (2019) Integrating BIM with building performance analysis in project life-cycle, Automation in Construction, 106.
Li, Y., Zhang, Y., Wei, J. and Han, Y. (2019) Status quo and future directions of facility management: A bibliometric- qualitative analysis, International Journal of Strategic Property Management, 23(5), 354–365.
Parlikad, A.K. (2019) Research challenges in Asset Management, in Lloyd, C. and Michael, C. (Eds.) Asset Management, Second Edition, ICE Publishing, 45–66.
Parlikad, A.K., Mcfarlane, D., Schooling, J., Pocock, D., Parsons, S. and Jensen, C. (2017) Intelligent Assets for Tomorrow ’ s Infrastructure : Guiding Principles. Available from :https://doi.org/10.13140/RG.2.2.16125.26085.
The Vietnam Minister of Construction. (2019) The circular No. 04/2019/TT-BXD on amendments to Circular No. 26/2016/TT-BXD dated October 26, 2016 of the Minister of Construction on elaboration of a number of aspects of construction work quality control and maintenance, Hanoi.
The Vietnamese Ministry of Construction. (2018) Decision No 362/QD-BXD on Establishing the list of the pilot projects that Building Information Modeling (BIM) is adopted in construction implementation and operation, Hanoi.
The Vietnamese Prime Minister. (2015) The Decree No. 46/2015/NĐ-CP on quality control and maintenance of construction works, Hanoi, Vietnam. Available from: https://thuvienphapluat.vn/van-ban/xay-dung-do- thi/Nghi-dinh-46-2015-ND-CP-quan-ly-chat-luong-bao-tri-cong-trinh-xay-dung-274018.aspx (accessed 20 October 2020).
To, Q.T.., Shahrour, I. and To, T.T.T. (2020) Smart Life Cycle Management of Social Housing Assets, in Liyanage, J.P., Amadi-Echendu, J. and Mathew, J. (Eds.) Engineering Assets and Public Infrastructures in the Age of Digitalization, Springer International Publishing, 55–66.
Viettel group. (2020) Introduction of Viettel group, Viettel Group. Available from: http://viettel.com.vn/en (accessed 20 October 2020).
Willson, G.H. (2013) The Right Technology for Asset Management Programs, Pipelines.

355
The 54th International Conference of the Architectural Science Association (ANZAScA) 2020
Design for Dematerialisation: an approach for reducing a building’s embodied environmental flows
Katie Skillington1 and Robert H. Crawford1
1The University of Melbourne, Melbourne, Australia [email protected], [email protected]
Abstract: The building sector must rapidly adopt measures to reduce its significant contribution to global environmental degradation. However, recent efforts in pursuing improved environmental outcomes in the building sector have disproportionately focused on building operation, overlooking the increasingly significant construction-related life cycle stages. The environmental effects associated with these life cycle stages are often locked-in during the design of a building. As such, design stakeholders must have an appreciation of design approaches that affect a buildings’ construction-related or embodied environmental flows. Design for Dematerialisation (DfD) is one such approach, however from the perspective of the building sector it is not well understood. Informed by research from allied disciplines, this study addresses this gap and ascertains that DfD is a design approach that targets reduced material and resource inputs whilst pursuing optimal functionality/performance. Implemented in early design decision making, DfD requires rethinking the whole building design from a life cycle perspective, questioning necessity, and testing alternatives to satisfy user need. Drivers and barriers affecting adoption are discussed, and the paper concludes with recommendations to further develop DfD research and practice – namely the need to empirically assess built examples of the approach to better support its implementation.
Keywords: Design for dematerialisation; embodied flows; design approaches; life cycle assessment.
1. IntroductionResponsible for approximately 36% of global final energy use, 39% of energy and process-related CO2 emissions, 12% of global freshwater consumption and 24% of raw material extractions (Bribián et al., 2011; Crawford, 2011; Global Alliance for Buildings and Construction et al., 2019), the building sector is under pressure to adopt more environmentally responsible methods of designing, constructing and operating the spaces in which we live, work and dwell. Of particular concern to this sector is the impact of accelerating material extraction, production and use, which is inextricably linked to these deteriorating environmental outcomes (Worrell et al., 2016). Yet, despite these concerns, recent efforts have primarily addressed the environmental burden of buildings arising from operation, overlooking the increasingly significant embodied environmental flows that may occur during other stages of a building’s life cycle. Often determined and locked-in during pre-construction stages, these embodied effects
Imaginable Futures: Design Thinking, and the Scientific Method. 54th International Conference of the Architectural Science Association 2020, Ali Ghaffarianhoseini, et al (eds), pp. 355–364. © 2020 and published by the Architectural Science Association (ANZAScA).

356
Katie Skillington and Robert H. Crawford
require stakeholders tasked with contemporary building design to be cognisant of sustainable design approaches that may contribute to their mitigation.
One approach that may assist in the reduction of a building’s embodied environmental flows is Design for Dematerialisation (DfD). More commonly applied and researched in the fields of industrial/product design and industrial ecology, the approach is concerned with the reduction of material and resource inputs in the development of an industrialised product. However, from the perspective of the building sector, the DfD approach is not widely discussed in literature. Discussion regarding DfD’s conceptual foundations and how it may be operationalised in the building sector may lead to an improved understanding and adoption of DfD in this context.
As such, the intent of this paper is to address this gap in research by presenting an understanding of the DfD approach as applicable to the building sector. Following an explanation of the importance of embodied environmental flows, this study elucidates DfD’s conceptual and operational aspects, drivers and barriers to its implementation, and future research opportunities to improve pathways to adoption and development of the approach. The outcome of this study forms a foundation for an ongoing doctoral research project, which involves the assessment of buildings demonstrating DfD in comparison to typical practice for a specific typology and context.
2. The importance of embodied environmental flowsThe life cycle of a building can be divided into embodied (i.e. covering the initial effects from the extraction of resources, material manufacture, their transportation, and building construction; and, recurrent embodied effects from the replacement and maintenance of its materials throughout its life), operational (i.e. encompassing the aspects of running the building such as heating, cooling, and lighting) and end-of-life (i.e. including the recycling or disposal of the building and its components). The effects of the building sector on the natural environment are wide reaching in terms of environmental flows, encompassing areas of energy, water, emissions, and raw materials.
To date, efforts to reduce the environmental effects of the building sector have disproportionately focused on a building’s operational stages – particularly operational energy, water and greenhouse gas (GHG) emissions – despite concerns regarding the increasing significance of embodied environmental flows (Stephan and Crawford, 2014; De Wolf et al., 2017; Stephan and Athanassiadis, 2017). As greater efficiencies in the operation of buildings are achieved via improved regulation and technology, the proportion of embodied environmental effects increases. Furthermore, demand for a significant determinant of embodied environmental flows – material and resources – has increased four-fold over the past half-century and will increase two-fold from current levels by 2050 (Allwood et al., 2011). Various studies have highlighted the significance of embodied environmental flows, including Stephan and Crawford (2014), who demonstrated that embodied water was the highest contributor to life cycle water requirements in their case study of an Australian suburban house. An extensive review of life cycle assessment case studies by Röck et al. (2020) also revealed that improvements to operational energy demand resulted in embodied GHG emissions taking a greater share of life cycle GHG emissions, with a ‘carbon spike’ occurring at building construction. As low- and net-zero (operational) energy buildings become more commonplace in contemporary building practice, this trend of embodied flows outweighing operational flows may be amplified.
It is therefore essential that embodied environmental flows receive immediate attention, and those best tasked with this challenge are stakeholders who determine a building’s construction assemblies, materiality and finishes, such as designers. Building design stakeholders hold significant influence over
357
Design for Dematerialisation: an approach for reducing a building’s embodied environmental flows
the embodied environmental flows of a building via specification, selection and detailing of material inputs (LendLease Building, 2020). When design stakeholders specify construction assemblies, materials and finishes, a wide variety of factors will typically be taken into consideration, including thermal performance, cost, physical properties, and context (Wastiels and Wouters, 2009; Crawford et al., 2010). However, embodied environmental flows – such as energy, water and GHG emissions – are often not considered. This may be due to environmental considerations commonly coming too late in the design process (Ding, 2008) or inconsistent awareness and perceptions of the effects of embodied environmental flows (LendLease Building, 2020). Guidance on design approaches that target a building’s materiality may assist in enabling the development of a built environment that pursues reductions in embodied environmental flows. A number of design approaches may fulfil this objective – such as Design for Disassembly or prefabricated/modular design – yet DfD in particular warrants further exploration due to its potential benefits and limited existing research.
3. Design for DematerialisationMuch of the research focusing on DfD is not directly related to the building sector and is more concentrated in the field of industrial ecology – which broadly seeks to understand the material and energy flows through an industrialised system – and industrial/product design. Outside of the building sector, common examples of dematerialisation may be seen in everyday consumer products, such as vehicles and refrigerators (Petrides et al., 2018) and in fully digitised product-service-systems that serve consumer needs through digital rather than physical forms (Park and Yoon, 2015).
When examining literature relating to dematerialisation it can be determined that the approach is one of many that may be applied as part of a broader sustainable design strategy. The most common theme to emerge from the literature is the reduction of resource and material inputs in the development of a product (Herman et al., 1990), in the production of a unit of economic output (Cleveland and Ruth, 1998), or in a service rendered (Smil, 2014). A secondary theme – the performance of the output – was also identified (Udo de Haes and Heijungs, 2007).
Dematerialisation’s simple focus on material reduction bares strong similarities to principles of other concepts, such as resource/material efficiency and eco-efficiency. These two concepts – which seek to provide economically-competitive or economically-valuable products by efficiently using material and resource inputs (Allwood et al., 2013; Caiado et al., 2017) – have been researched and applied within the building sector. Several commonalities are shared between the concepts – namely efficient resource and material use – and Allwood et al. (2011) supports their linkage by positioning dematerialisation as a possible approach for contributing to a broader material efficiency strategy in product development, albeit noting that applications of dematerialisation require a different product design from the outset. Importantly, this small qualification highlights that dematerialisation is not solely concerned with incremental efficiency improvements or material substitutions within existing product systems or designs. Whilst efficiencies and substitutions may contribute to progress, efficiencies alone will not ameliorate the effects of the forecast increase in demand for resources, nor will material substitutions that may not account for indirect impacts. This is supported by Persson (1999), who notes that dematerialisation requires a fundamental re-think or re-design of the product system from project inception, employing a life cycle perspective so that all indirect and direct environmental impacts are considered and addressed from early stage design. In this sense, it is posited that DfD implementation requires design stakeholders to question the status quo when it comes to designing for user need(s) and managing environmental flows.

358
Katie Skillington and Robert H. Crawford
Limited literature specific to the building sector that makes mention of dematerialisation or DfD exists,
although discussion of the concept is typically brief and in the context of broader sustainable design strategies. The themes discussed in this building-specific literature – reduction of resource or material use (Fernandez, 2006) and maintaining the quality of service or function (Sato et al., 2011) – align with those found in other disciplines. Therefore, in consideration of the literature that has been reviewed, it can be determined that conceptually, DfD is an early stage design approach that prioritises reduced material and resource inputs across all life cycle stages of a building, whilst not negatively affecting the building’s operational performance or intended function.
Whilst a conceptual understanding of the approach can aid in appreciating its intent, the practicalities of how DfD may be operationalised in the building sector still remain somewhat unclear. Contributing to this lack of clarity is an absence of empirical assessments of the DfD approach in practice. However, despite this gap, some broad guidelines and actions for operationalising the approach can still be deduced from existing literature. Beyond the adoption of a life cycle perspective, Brown and Lutz-Carrillo (2009) suggest a tripartite strategy to guide DfD implementation: starting with evaluating the necessity of components or functions, then determining which aspects are obsolete, and finally, reducing and optimising what remains. Implicit in these guidelines is the questioning of client needs during early stage or pre-design work, and experimentation with alternative modes of delivering on these needs. Further to these guidelines, there are some broad actions that may be implemented as part of the DfD approach.
Reduction via optimisation is the most apparent action that can be employed. Reductions via optimisation may be achieved by reducing overspecification, light-weighting or simplifying building systems to reduce material demand, specifying materials that are less energy/water/carbon-intense, or simply eliminating materials that may be superfluous to servicing basic user need. Opportunities to exercise simple savings have been documented by various authors investigating material efficiency or embodied environmental flows, including Moynihan and Allwood (2014), who found in a review of 23 steel buildings that over 10,000 beams were not using more than half of their load bearing capacity. The elimination of internal finishes that are repeatedly replaced or refurbished over the service life of a building – such as paint or carpet – will also likely result in the reduction of a building’s embodied energy and/or water (McCormack et al., 2007; Crawford, 2012). Optimisation of a building’s structural design may also yield significant embodied GHG emission reductions, as demonstrated by Helal et al. (2020).
Another action is more intensive functional use, which involves the reduction of a building’s physical footprint or floor area, incorporation of shared functions, and/or designing for multi-functionality and ongoing adaptability. With respect to floor area, researchers have demonstrated that life cycle environmental flows (energy, water, GHG emissions) rise with increasing house size (Stephan and Crawford, 2016), and Lausselet et al. (2020) found that a reduction of floor area per capita helped to mitigate embodied GHG emissions, thus presenting an environmental impetus for smaller dwelling sizes. Hertwich et al. (2019) also noted that this reduction in floor area or increased intensity of use may involve multi-purpose spaces and shared functions. However, despite these possible benefits, intensive use must be applied with caution: reductions should not impede the building’s ability to meet user need(s) or operational performance. Moreover, reduction of material quantity via physical footprint does not necessarily equate to a one-to-one reduction in embodied environmental flows – for example, a micro apartment may result in lower floor area per capita, however if that apartment is located in a tall building these savings may be offset by additional structural requirements. These qualifications suggest the need for DfD implementation to consider multiple areas of building performance concurrently and for the approach to be applied in the early stages of a building’s development, when

359
Design for Dematerialisation: an approach for reducing a building’s embodied environmental flows
design decisions are at their most flexible and alternative methods of servicing user need can be experimented with or entertained by stakeholders.
Similar to more intensive functional use is the next action: service life extension of the building and its material components. This is supported through the specification of more durable materials that require less frequent replacement or refurbishment and designing for a longer building service life. Extending the useful service life of a building can significantly reduce its life cycle embodied energy demand (initial and recurrent), as demonstrated by Rauf and Crawford (2015). To support the life extension of a building, the design should capitalise on the use of more durable materials and components and consider how future changes may be undertaken with minimal additional investment of material stocks. Such considerations may include flexible floor plates, floor-to-floor heights that can accommodate a variety of functions or designing to easily accommodate future additions or alterations.
The last DfD action to be discussed in brief is reuse, recycling and repair. Reuse and recycling can occur across multiple scales: adaptive reuse of an entire building structure, reuse of specific components, or the use of recycled construction waste in the creation of a new product (e.g. recycled concrete aggregate). Repair (or refurbishment) occurs when the product is still in service and repair will extend its useful service life. Again, similar to the reduction of absolute material quantity via the micro apartment example previously mentioned, the reuse of products won’t necessarily result in a one-to- one reduction of new material production (Cooper and Gutowski, 2017). Each instance of reuse or recycling introduces variables – e.g. the extent of a structure being reused, the amount of reprocessing required to bring a reusedcomponent to a serviceable quality, etc. For this reason, it is difficult to understand the magnitude ofeffect these actions may have on embodied environmental flows in the absence of empirical assessments of the approach in practice.
Although not an exhaustive list, Figure 1 summarises how these actions may manifest in built form.
Figure 1: Examples of DfD actions that may be applied to a building
4. Drivers of and barriers to Design for DematerialisationDespite limited literature relating to DfD from the perspective of the building sector, drivers of and barriers to the implementation of the approach may still be drawn from allied disciplines and the broader behaviours of the building sector itself.
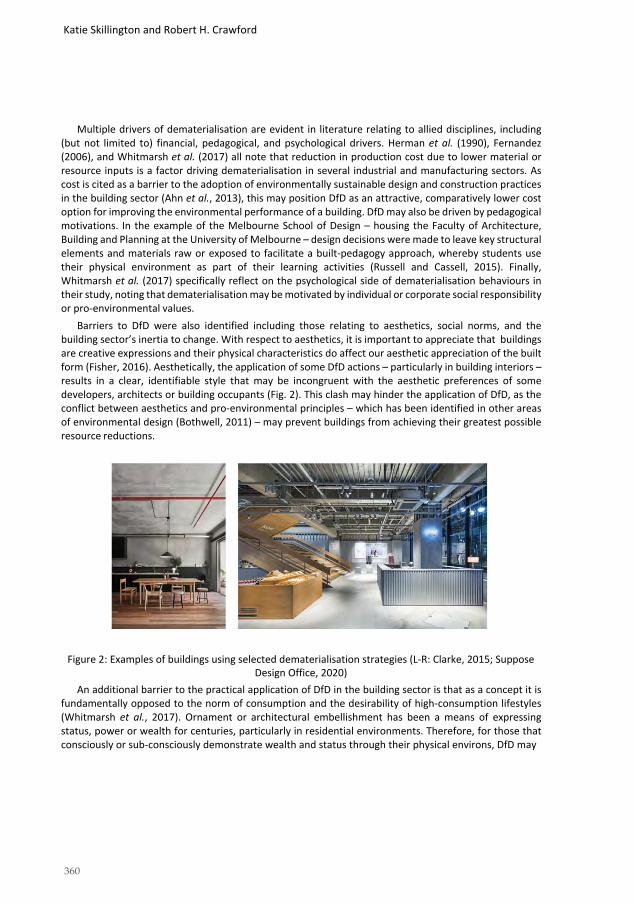
360
Katie Skillington and Robert H. Crawford
Multiple drivers of dematerialisation are evident in literature relating to allied disciplines, including (but not limited to) financial, pedagogical, and psychological drivers. Herman et al. (1990), Fernandez (2006), and Whitmarsh et al. (2017) all note that reduction in production cost due to lower material or resource inputs is a factor driving dematerialisation in several industrial and manufacturing sectors. As cost is cited as a barrier to the adoption of environmentally sustainable design and construction practices in the building sector (Ahn et al., 2013), this may position DfD as an attractive, comparatively lower cost option for improving the environmental performance of a building. DfD may also be driven by pedagogical motivations. In the example of the Melbourne School of Design – housing the Faculty of Architecture, Building and Planning at the University of Melbourne – design decisions were made to leave key structural elements and materials raw or exposed to facilitate a built-pedagogy approach, whereby students use their physical environment as part of their learning activities (Russell and Cassell, 2015). Finally, Whitmarsh et al. (2017) specifically reflect on the psychological side of dematerialisation behaviours in their study, noting that dematerialisation may be motivated by individual or corporate social responsibility or pro-environmental values.
Barriers to DfD were also identified including those relating to aesthetics, social norms, and the building sector’s inertia to change. With respect to aesthetics, it is important to appreciate that buildings are creative expressions and their physical characteristics do affect our aesthetic appreciation of the built form (Fisher, 2016). Aesthetically, the application of some DfD actions – particularly in building interiors – results in a clear, identifiable style that may be incongruent with the aesthetic preferences of some developers, architects or building occupants (Fig. 2). This clash may hinder the application of DfD, as the conflict between aesthetics and pro-environmental principles – which has been identified in other areas of environmental design (Bothwell, 2011) – may prevent buildings from achieving their greatest possible resource reductions.
Figure 2: Examples of buildings using selected dematerialisation strategies (L-R: Clarke, 2015; Suppose Design Office, 2020)
An additional barrier to the practical application of DfD in the building sector is that as a concept it is fundamentally opposed to the norm of consumption and the desirability of high-consumption lifestyles (Whitmarsh et al., 2017). Ornament or architectural embellishment has been a means of expressing status, power or wealth for centuries, particularly in residential environments. Therefore, for those that consciously or sub-consciously demonstrate wealth and status through their physical environs, DfD may

361
Design for Dematerialisation: an approach for reducing a building’s embodied environmental flows
not be an appealing design approach. Lastly, as articulated by Kibert (2016), professionals in the building sector are often slow to change, cautious in employing new approaches, and reactionary against new paradigms in practice. The limited built examples and minimal research exploring DfD in the building sector may result in the approach being viewed as experimental and novel, triggering apprehension from stakeholders considering its use. To overcome this, more information regarding the approach needs to be provided to industry, including demonstrations of DfD in practice and assessments of the approach that deliver data on DfD’s effect on environmental performance. Comprehensive assessments of DfD may aid stakeholders in developing trust in and understanding of the risks, trade-offs, and benefits that may emerge from its application. In the context of this study, it is important that such assessments demonstrate the effect DfD has on life cycle environmental flows, so that the significance of embodied effects on the building’s whole life cycle can be understood in context.
5. Recommendations for progressing Design for Dematerialisation Existing building-sector related DfD research and practice is limited. Although this study demonstrates at a high level what the approach entails conceptually and operationally, further efforts can be undertaken to progress the approach. Two recommendations that will be discussed include regulating embodied environmental flows, and the assessment of DfD’s effect on building performance.
As previously outlined, there has been a disproportionate amount of attention paid to the operational performance of buildings, and embodied environmental flows have been increasingly overlooked. Although this attitude is slowly changing, few jurisdictions in the world have measures in place for regulating embodied environmental flows or impacts, with European nations generally leading action and most policies focussing on embodied GHG emissions. If measures such as targets or caps to the embodied environmental flows of a building were implemented, a stronger impetus to pursue approaches such as DfD would exist and likely result in increased use. As DfD becomes more common in sustainable design practice, the principles and actions would inevitably evolve due to increased scrutiny and experimentation.
Adoption of DfD would be further improved if another gap was resolved, that being the lack of data pertaining to the effect of DfD on the embodied environmental flows and environmental performance of a building. DfD’s focus on material and resource inputs suggests that significant reductions may be gained, yet no empirical assessments of DfD in practice have been conducted. Although it is not unusual for novel sustainable building strategies to have not been scientifically quantified (Kibert, 2016), anecdotes do not provide a solid knowledge and evidence base to support broader adoption. Preliminary conclusions may be drawn from evidence examining specific actions that are associated with DfD – such as the effect of more durable finishes, reduction of steel via structural optimisation – however, as highlighted by Skillington et al. (2018), the isolation of performance criteria in building evaluation ignores the possible interactions between different areas of performance and the inherent complexity of buildings. Multi-dimensional, whole life cycle assessments of DfD in practice may help clarify the reductions in embodied environmental flows that can be reasonably achieved, balance performance outcomes across multiple life cycle stages and/or performance criteria, and uncover indications of possible negative second order effects occurring. Known as rebound effects, these second order effects occur when the savings attained from one action are negated by increases in demand of an alternative action (Petrides et al., 2018; Santarius and Soland, 2018). The presence of rebound effects is an important consideration in understanding the performance of a building employing DfD, as stakeholders must be privy to the possible trade-offs that may need to occur during design.

362
Katie Skillington and Robert H. Crawford
Furthermore, it is important to note that an evaluation conducted to further understand DfD should be done as part of a comprehensive, comparative assessment that can contextualise the effect of DfD against what is deemed typical or standard practice for the typology under examination. By conducting a comparative assessment, the relative performance of a building employing DfD may be better understood. A future research opportunity exists in the demonstration of a multi-dimensional framework for comparative assessment – and the assessment itself – and this will be explored in forthcoming work by the authors.
6. ConclusionAs the environmental effects from building operation are progressively improved, the share of commonly overlooked embodied environmental effects is increasing. This study presented an understanding of DfD as applicable to the building sector. It was shown that it is a potential yet under- researched approach for reducing the embodied environmental flows of a building. As discussed, DfD is a life cycle-based approach to building design that seeks reductions in material and resource inputs via the rethinking of the whole building in early stages of development. Its principles – question necessity, determine obsolescence, reduce and optimise the remaining – and actions – such as material reduction via optimisation, service life extension – have been discussed to demonstrate how the approach may be implemented. However, despite this further understanding, the question of by how much are embodied environmental flows affected by DfD in the context of a building’s whole life cycle remains unanswered. A comparative, multi-dimensional, life cycle assessment between typical and DfD case studies may help practitioners understand the relative performance of a building demonstrating DfD, and more broadly, to better understand the approach itself. Only at the completion of such an exercise can the benefits, pitfalls, and trade-offs of the approach be confidently declared, and its potential to reduce the embodied environmental flows of a building be comprehensively understood.
Acknowledgements This work forms part of a PhD research project supported by the Australian Government Research Training Program (RTP) and a Thrive Research Hub scholarship at the University of Melbourne, Australia.
References Ahn, Y. H., Pearce, A. R., Wang, Y. and Wang, G. (2013) Drivers and barriers of sustainable design and construction:
The perception of green building experience, International Journal of Sustainable Building Technology and Urban Development, 4(1), 35-45.
Allwood, J. M., Ashby, M. F., Gutowski, T. G. and Worrell, E. (2011) Material efficiency: A white paper, Resources, Conservation and Recycling, 55(3), 362-381.
Allwood, J. M., Ashby, M. F., Gutowski, T. G. and Worrell, E. (2013) Material efficiency: providing material services with less material production, Philosophical transactions. Series A, Mathematical, physical, and engineering sciences, 371(1986), 20120496.
Bothwell, K. (2011) The architecture of the passively tempered environment, in L. Sang (ed.), Aesthetics of sustainable architecture, 010 Publishers, Rotterdam.
Bribián, I. Z., Capilla, A. V. and Usón, A. A. (2011) Life cycle assessment of building materials: Comparative analysis of energy and environmental impacts and evaluation of the eco-efficiency improvement potential, Building and Environment, 46, 1133-1140.
Brown, M. and Lutz-Carrillo, S. (2009) Dematerialization - a changing paradigm in architecture, Austin, Texas, 1-8.

363
Design for Dematerialisation: an approach for reducing a building’s embodied environmental flows
Caiado, R. G. G., de Freitas Dias, R., Mattos, L. V., Quelhas, O. L. G. and Leal Filho, W. (2017) Towards sustainable development through the perspective of eco-efficiency - A systematic literature review, Journal of Cleaner Production, 165, 890-904.
Clarke, P. (2015) Nightingale 1 Interior, Peter Clarke Photography, Prahan, Melbourne. Cleveland, C. J. and Ruth, M. (1998) Indicators of Dematerialization and the Materials Intensity of Use, Journal of
Industrial Ecology, 2(3), 15-50. Cooper, D. R. and Gutowski, T. G. (2017) The Environmental Impacts of Reuse: A Review, Journal of Industrial Ecology,
21(1), 38-56. Crawford, R. H. (2011) Life Cycle Assessment in the Built Environment, 1st ed., Spon Press, Oxon. Crawford, R. H. (2012) An as-occupied life cycle energy assessment of a residential building, in H. Skates (ed.),
ASA2012: The 46th Annual Conference of the Architectural Science Association (formerly ANZAScA) - Building on Knowledge: Theory and Practice, Griffith University Department of Architecture, Southport, Australia.
Crawford, R. H., Czerniakowski, I. and Fuller, R. J. (2010) A comprehensive framework for assessing the life-cycle energy of building construction assemblies, Architectural Science Review, 53, 288-296.
De Wolf, C., Pomponi, F. and Moncaster, A. (2017) Measuring embodied carbon dioxide equivalent of buildings: A review and critique of current industry practice, Energy and Buildings, 140, 68-80.
Ding, G. (2008) Sustainable construction - The role of environmental assessment tools, Journal of Environmental Management, 86(3), 451-464.
Fernandez, J. (2006) Material Architecture: Emergent Materials for Innovative Buildings and Ecological Construction, 1st ed., Architectural Press, Oxford.
Fisher, S. (2016) Philosophy of Architecture, Metaphysics Research Lab, Stanford University, Online-Online. Global Alliance for Buildings and Construction, International Energy Agency (IEA) and United Nations Environment
Programme (UNEP) (2019) 2019 Global Status Report for Buildings and Construction: Towards a zero-emission, efficient and resilient building and construction sector, GABC/IEA/UNEP.
Helal, J., Stephan, A. and Crawford, R. H. (2020) The influence of structural design methods on the embodied greenhouse gas emissions of structural systems for tall buildings, Structures, 24, 650-665.
Herman, R., Ardekani, S. A. and Ausubel, J. H. (1990) Dematerialization, Technological Forecasting and Social Change, 38(4), 333-347.
Hertwich, E. G., Ali, S., Ciacci, L., Fishman, T., Heeren, N., Masanet, E., Asghari, F. N., Olivetti, E., Pauliuk, S., Tu, Q. and Wolfram, P. (2019) Material efficiency strategies to reducing greenhouse gas emissions associated with buildings, vehicles, and electronics—a review, Environmental Research Letters, 14(4), 043004.
Kibert, C. J. (2016) Sustainable construction: green building design and delivery, 4th ed., Wiley, Hoboken, New Jersey. Lausselet, C., Urrego, J., Resch, E. and Brattebø, H. (2020) Temporal analysis of the material flows and embodied
greenhouse gas emissions of a neighborhood building stock, Journal of Industrial Ecology, 1-16. LendLease Building (2020) Low embodied carbon in construction materials- what’s stopping us?, LendLease, Sydney,
Australia. McCormack, M., Treloar, G. J., Palmowski, L. and Crawford, R. (2007) Modelling direct and indirect water
requirements of construction, Building Research & Information, 35(2), 156-162. Moynihan, M. C. and Allwood, J. (2014) Utilization of structural steel in buildings, Proceedings of the Royal Society A,
470(20140170). Park, H. and Yoon, J. (2015) A chance discovery-based approach for new product–service system (PSS) concepts,
Service Business, 9(1), 115-135. Persson, J. G. (1999) Dematerialisation - Some implications on product design, ecodesign’99: First International
Symposium on Environmentally Conscious Design and Inverse Manufacturing, edited by H. Yoshikawa, R. Yamamoto, F. Kimura, T. Suga and Y. Umeda, Tokyo, Japan, 61-66.
Petrides, D., Papacharalampopoulos, A., Stavropoulos, P. and Chryssolouris, G. (2018) Dematerialization and Environmental Sustainability: Challenges and Rebound Effects, Procedia CIRP, 72, 845-849.
Rauf, A. and Crawford, R. H. (2015) Building service life and its effect on the life cycle embodied energy of buildings, Energy, 79, 140-148.

364
Katie Skillington and Robert H. Crawford
Röck, M., Saade, M. R. M., Balouktsi, M., Rasmussen, F. N., Birgisdottir, H., Frischknecht, R., Habert, G., Lützkendorf, T. and Passer, A. (2020) Embodied GHG emissions of buildings – The hidden challenge for effective climate change mitigation, Applied Energy, 258, 114107.
Russell, J. and Cassell, W. (2015) Architecture and pedagogy: The Melbourne School of Design. Available from: ArchitectureAU <https://architectureau.com/articles/architecture-pedagogy> (accessed June 10).
Santarius, T. and Soland, M. (2018) How Technological Efficiency Improvements Change Consumer Preferences: Towards a Psychological Theory of Rebound Effects, Ecological Economics, 146, 414-424.
Sato, S. P., Paulet, R., Silva, B. A., Carboni, M. H. S., Rocha, G. L., Baldessar, S. M. N. and Santos, A. (2011) Dematerialization Of The Built Environment, The World Sustainable Building Conference, Helsinki, Finland, 18-21 October, 864-878.
Skillington, K., Crawford, R. H. and Hes, D. (2018) Towards an assessment framework for the environmental performance of alternative, multi-residential housing models Engaging architectural science: meeting the challenges of higher density - 52nd International Conference of the Architectural Science Association (ANZAScA), edited by P. Rajagopalan and M. M. Andamon, Melbourne, Australia, 2018, 347-354.
Smil, V. (2014) Making the modern world: materials and dematerialization, ed., John Wiley & Sons, Chichester, United Kingdom.
Stephan, A. and Athanassiadis, A. (2017) Quantifying and mapping embodied environmental requirements of urban building stocks, Building and Environment, 114, 187-202.
Stephan, A. and Crawford, R. H. (2014) A comprehensive life cycle water analysis framework for residential buildings, Building Research and Information, 42, 685-695.
Stephan, A. and Crawford, R. H. (2016) The relationship between house size and life cycle energy demand: Implications for energy efficiency regulations for buildings, Energy, 116, 1158-1171.
Suppose Design Office (2020) Hotel Koe. Available from: Suppose Design Office <https://suppose.jp/en/works/hotel-koe-tokyo/> (accessed 26 June 2020).
Udo de Haes, H. A. and Heijungs, R. (2007) Life-cycle assessment for energy analysis and management, Applied Energy, 84(7), 817-827.
Wastiels, L. and Wouters, I. (2009) Material Considerations in Architectural Design: A Study of the Aspects Identified by Architects for Selecting Materials, Undisciplined! Design Research Society Conference 2008, Sheffield, United Kingdom, 16-19 July.
Whitmarsh, L., Capstick, S. and Nash, N. (2017) Who is reducing their material consumption and why? A cross- cultural analysis of dematerialization behaviours, Philosophical Transactions of the Royal Society A: Mathematical, Physical and Engineering Sciences, 375(2095).
Worrell, E., Allwood, J. and Gutowski, T. (2016) The Role of Material Efficiency in Environmental Stewardship, Annual Review of Environment and Resources, 41(1), 575-598.

365
The 54th International Conference of the Architectural Science Association (ANZAScA) 2020
Designing Biodiverse Façade Microbiomes
Christiane M. Herr1 and Yawen Duan2 1, 2 Xi’an Jiaotong-Liverpool University, Suzhou, China
[email protected] [email protected]
Abstract: With improved knowledge of the human microbiome and its interrelationship with biomes of the inhabited environment, architecture is able to address issues of healthy living with new types of design approaches. Previous research in the field has mostly addressed internal building environments, or sought to completely eradicate the growth of microbes such as moulds on building surfaces. Yet recent studies have shown that human health is closely interrelated with the health of various human microbiomes, such as the gut, skin, lungs etc, which in turn depend on exchanges with external microbial communities present in our environments. This study argues that architectural façade design implicitly creates potential reservoirs for microbial biodiversity and determines the likeliness of microbial growth through factors including material selection, sun and humidity exposure and response to local climate. As very little is known about the interplay of these factors in determining the microbiomes of our facades, we present first results of an empirical study on façade biomes, conducted in an urban environment in China. The paper outlines how results can inform façade design, working towards the integration of biology, building science, material science and architectural design to address the challenge of developing dense but healthy urban environments.
Keywords: Façade design; health; microbial community; China; materials.
1. Introduction: The microbiology of buildingsOver the past decade, a variety of factors have increasingly drawn attention to the interactions between microbial communities present in human living environments and human health. Recent related studies can be found across a broad range of fields, from biology to environmental science to materials studies, ecology, medicine and architecture. This paper presents a first step in a metagenomic study (examining genomics of several sites in an architectural environment) of microbial life on building facades in Suzhou, China. The study forms part of an interdisciplinary approach to architectural design motivated by broader ecological concerns for biodiversity and human health, aiming to develop new types of facades for increasingly dense urban environments in Asia, in particular in China.
With recent studies generating ever more understanding of the human microbiome and its interrelationship with the microbiomes of the inhabited environment, architecture is challenged to address issues of healthy living with new types of design approaches, extending the scope of architectural design to include non-human inhabitants (Roudavski, 2020; Mills et al., 2019; Morozov, 2016). For decades, cleanliness and avoidance of microbial growth of all kinds has been pursued
Imaginable Futures: Design Thinking, and the Scientific Method. 54th International Conference of the Architectural Science Association 2020, Ali Ghaffarianhoseini, et al (eds), pp. 365–374. © 2020 and published by the Architectural Science Association (ANZAScA).

366
Christiane M. Herr and Yawen Duan
throughout the built environment. This, however, is increasingly recognized as a short-sighted approach as it has been linked to immune deficiencies in the hygiene hypothesis (Roduit et. al., 2016). Human bodies are hosts to trillions of microbes – in the human body, human cells are outnumbered by microbial cells by a factor of 1.3 to one (Sender et al., 2016). While the impact of these microbes on human health and wellbeing is not well understood yet, it can hardly be understated: Increasing numbers of studies point to the links between the human microbiome and the human immune system, influencing the development of conditions such as asthma and Crohn’s disease and the development of organs such as our brain. Accordingly, Hanski et al., (2012) argue that human health and well-being in the future will depend on our ability to maintain and support biodiversity.
Where previous research on microbes in architectural contexts has mostly addressed internal building environments (Kembel et. al., 2014), or sought to completely eradicate and “combat” the growth of microbes such as moulds on building surfaces (Hofbauer and Gärtner, 2020), recent voices are calling for a more comprehensive ecological understanding of architecture within diverse, dynamic and interlinked environments. This parallels a wider public awareness of the role of microorganisms in human health, as for example underlying the increasing popularity of probiotic supplements. In the context of architecture and human health, Gilbert (2016) for example argues for embedding probiotics directly in building materials to create “probiotic buildings”. By exposing humans to desirable bacterial communities, he argues, human immune systems can be strengthened, the spread of pathogenic bacteria can be inhibited and indoor living environments can become healthier. Human microbiomes, as found in the gut, skin, or lungs, depend on close exchange with microbial communities in our environments. In this context, architectural design, layout and especially ventilation have been shown to be key factors in determining the microbiome of buildings next to human occupancy itself (Kembel et. al., 2014; Adams et. al., 2016; Rintala et. al., 2008; Adams et. al., 2013).
The study presented here extends previous research by focusing on external architectural façades rather than indoor environments. With indoor microbiome diversity closely linked to natural ventilation and airborne exchange with external microbial communities, we argue that building facades could play a central role as a source of microbial diversity in immediate proximity to inhabited spaces. This is especially relevant for dense urban environments, where less and less land is dedicated to microbially diverse green space (Flies et. al., 2017), and where microbial biodiversity is increasingly lost.
Architectural design choices in building facades implicitly determine the potential for microbial growth through several factors, including material selection, sun and rain exposure as well as consideration of local climate and site conditions. Very little is known about the interplay of these factors in determining the microbiomes of our facades, in part due to current research focusing on indoor environments and in part due to difficulties associated with environmental sampling. In this paper, we present first results of an empirical study on façade biomes conducted in a dense urban region of China. Results of the study aim to inform architectural façade design, conceived as a multidisciplinary effort integrating biology, ecology, building science, material science and architectural design to address a key challenge of the 21st century: the development of dense but healthy urban environments.
In the following, we will draw on some terminology and methodology typically used in biology. We employ these methods primarily to understand microbial growth on exterior facades for the purposes of architecture and seek to inform an architectural audience. Accordingly, we report results in simplified and more accessible terminology, to offer insights for a broader audience.
367
Designing Biodiverse Façade Microbiomes
2. Architectural facades as hosts Across different areas of architectural research and practice, façades have been singled out as key interfaces between human inhabitants and their external contexts, with a direct impact on human well- being. Building facades may be considered similar to the human skin, forming a barrier on the one hand but also hosting a vast number of nonhuman organisms. As such, buildings form habitats comparable with high altitude mountains or rocky river banks (Lundholm, 2006). Architects work with an increasing repertoire of greenery on buildings, from green roofs to more experimental types such as green walls and external vegetation cover at the scale of entire skyscrapers. While not as diverse in species as conventional green roofs, green walls are claimed to have positive effects on occupant health as well as on their surrounding urban environments but little empirical evidence has been published supporting these claims (Radic et. al., 2019). Among a broader push for healthier environments especially in cities, several proposals have been made to create alternative, less maintenance intensive, green walls. Cruz and Beckett (2016) have proposed the concept of bioreceptive design, leading to experimental wall systems of porous, low pH concrete seeded with transplanted mosses or lichen. For China, and most densely populated areas, however, such design approaches have very limited feasibility, as prevalent airborne pollutants as well as acid rain across urbanised areas strongly affects the growth of sensitive vegetation such as mosses and lichen.
Existing literature on the microbiology of buildings tends to fall into two camps: the microbe averse approach of material science and façade engineering on the one hand, and the indoor focus of building science on the other hand. This study takes a third approach, as called for by many authors of recent indoor microbiome studies such as Gilbert (2016) and Kembel et al. (2014), aimed at informing the design of buildings based on insights resulting from recent studies. Two main research questions emerge from the review of these studies in the field of microbiology:
• Which factors influence the growth of microbes on building facades?
• How can building facades foster a diverse microbiome that increases the well-being of building inhabitants?
3. Methodology For this initial exploratory study, we take the Xi’an Jiaotong-Liverpool University campus as a testing ground. The campus is located in Suzhou, China, which has a mild and humid climate: the annual average temperature is 15.6 degrees Celsius and the annual precipitation is 966 mm. The study examines exterior façade surfaces of educational buildings of ca. 10 years of age, including a variety of materials. The sampling locations are selected to include diverse orientations and weather exposures of façade surfaces within the same climatic context.
We focused on one building complex that features not only typical architectural materials such as glass and sheet metal panels (Figure 2, left) but also stone walls with water features as well as green walls (Figure 2, right). The green wall features did not develop as originally intended in the architectural design and may at first sight be regarded as architecturally less successful. By containing a variety of surfaces and by holding various types of soil and vegetation, they are however also rich in architecturally unintended microbial consequences. The samples taken for this study are taken from 15 locations, in two sets of samples covering the cold and the hot season, and are analysed for the microbial communities present in each location. We further documented ecological and environmental conditions

368
Christiane M. Herr and Yawen Duan
for each sampling site. In a third step, we establish tentative links between local microbial communities and characteristics of the surrounding built environment, in analogy to comparable indoor studies.
Figure 2: Typical façade materials including a combination of artificial and natural materials.
3.1 Experimental Setup
For this preliminary study, we obtained samples from 15 locations, at two points in time: the first was taken in December 2019 and the second was taken in August 2020. We distributed sampling locations such that two samples each were taken from a similar vicinity to examine how microbial communities across a larger site may be related, and to check for potential errors and contamination. In terms of architectural focus, we examine potential interactions between materials and microbial communities, in conjunction with environmental conditions. We further examine the environmental conditions of each sample, such as sun exposure. Samples were taken above human reach where possible. The following samples were analysed for bacterial and eukaryotic (fungal, protist, algae) diversity.
• 101GSN glass, shaded, out of human reach (North facing) • 102MSN metal façade panels, semi-shaded (North facing) • 103MES metal sunscreen, sun exposed, out of human reach (South facing)• 104MSN metal sunscreen, shaded, out of human reach (North facing)• 205EEE mossy earth on diagonal surface, sun exposed (East facing) • 206ESE mossy earth on diagonal surface, shaded, dry (East facing under staircase) • 207SEW artificial stone surface (between stones, on mortar), sun exposed (West facing)• 208SEE artificial stone surface (between stones, on mortar), sun exposed (East facing) • 209EEW mossy earth on diagonal surface with plants, sun exposed (West facing, edge)• 210EEW mossy earth on diagonal surface away from plants, sun exposed (West facing, edge)• 211LSW artificial/plastic lawn under bridge, shaded, dry (West facing) • 212EEE earth on diagonal surface under bridge, exposed, dry (East facing)• 213CSS control sample: soil from grassy surface on ground• 301TPE timber surface on flower enclosure, vertical, paint peeling off• 302TDE timber surface on bench, horizontal, paint peeling off

369
Designing Biodiverse Façade Microbiomes
At the outset of the study, we expected a significant similarity among the samples as microbial communities on facades are seeded primarily via aerial dispersion. The differences in communities are expected to result from different environmental conditions as well as different substrates for growth.
4. ResultsThe sampling of façade elements as outlined above produced only 10 usable environmental samples for 16SRNA (bacterial) and 18SRNA (eukaryotic) gene sequencing. Right at the outset, samples 101GSN (glass), 102MSN (metal panels), 103MES (metal sunscreen), 104MSN (metal sunscreen) and 211LSW (plastic lawn) were rejected as they did not contain sufficient microbial material to conduct a full analysis. We decided to not follow up further as even if we had taken samples from much larger surface areas to obtain sufficient genetic material for analysis, the intention of this study was to examine presence of microbial communities within a comparable façade surface area. The issue of irregularity and difficulty in environmental sampling across variable surfaces is well known and has unfortunately led to a scarcity of comparable studies (Digel et. al., 2018). For the purpose of this exploratory study, however, results were still informative: Façade materials such as glass, metal and plastic examined in this study can thus be described as hosting very little if any microbial life. This is no surprise, as most façade materials are engineered to repel microbes of all kinds for as long as possible, keeping maintenance requirements and surface changes over extended periods of time as minimal as possible, as shown by Hofbauer and Gärtner (2020). All remaining samples included some type of natural material, including timber, soil and a variety of small plants.
4.1. Diversity in microbial communities
The diversity measurement unit of microbial diversity studies in biology is the OTU (Operational Taxonomic Unit). To understand the community distribution information in sample sequencing, it is necessary to cluster the analyzed sequence. By clustering, it can be divided into similar sequences called OTU. Diversity is then shown quantitatively and qualitatively expressed as a Venn diagram for both bacterial and fungal OTU in Figure 3, showing the number of different species not the number of cells in the sample. Figure 3 shows only the sample taken in December 2019.
Across all samples taken in December, the variety of bacterial cells is greater than that of eukaryotic cells. The control sample 213CSS taken from ground soil next to the buildings examined in this study shows the greatest variety of both bacterial as well as eukaryotic cells. Sample 207SEW, taken from an artificial stone surface on a sun exposed West facing façade, has both the lowest number of bacterial and eukaryotic cells among the sample. Notably, sample 208SEEE, taken from a similar artificial stone surface but on a less sun exposed East facing façade, contains nearly double the number of both bacterial and eukaryotic OTU. The main difference between samples 209EEW and 2010EEW is the presence of larger plants in the latter. The analysis shows that the former features a larger number of fungi than 2010EEW. When comparing growth of microbial communities on mossy surfaces in the samples of 205EEE and 206ESE, the former contains more eukaryotic cells while the latter contains more bacterial cells. This is noteworthy as their main difference is that 206ESE is both shaded from direct sun exposure as well as direct precipitation.
The sample taken in August 2020 is not shown here due to the limited scope of the paper. While it shows a similar distribution of microbial life among the samples, it also indicates a surprising reduction of variety, with a larger number of taxa common to all samples and less variation between samples. We

370
Christiane M. Herr and Yawen Duan
do not know yet whether this difference to the winter sample is due to changes in seasonal sun exposure, or whether it is due to an exceptionally hot and rainy summer. In June, July and August 2020 Suzhou experienced 2.65 times more rainfall than usual, also causing less sun exposure than usual.
Figure 3: Microbial diversity (December) for bacterial (left) and eukaryotic cells (right).
4.2. Species catalogue
Figure 4 illustrates relationships between samples and their respective species catalogue in the form of a species abundance histogram accompanied by a list of the most abundant species. Due to the limited scope of this paper, only several observations can be pointed out from this rich dataset. First of all, variation in bacterial communities is not as pronounced as the variation of eukaryotic communities between samples. A broad variety of bacterial taxa are present in a relatively similar distribution across all samples, aside from smaller local variations. The 16SRNA (bacterial) analysis illustrates a strong presence of soil-based taxa of microorganisms. The 18S rRNA (eukaryotic) analysis shows more distinct location-specific variation, with a striking similarity between sample 212EEE (earth on diagonal surface under bridge, exposed, dry and facing East) and the control sample 213CSS, taken directly from soil on the ground. A significant difference is also shown between samples 207SEW and 208SEE, both taken from the mortar on artificial stone surfaces, however 207SEW being sun exposed and facing West, whereas 208SEE being sun exposed and facing East. With microbiology of the built environment still developing, and many taxa either unclassified or with little known interactions with human health, we refrain from speculating on the potential impact of specific microbial communities on human health in this paper. Instead, we take the approach that maintaining and increasing biodiversity is the most sensible approach for architectural façade design at this stage of our understanding of exterior façade biomes. This approach is supported by recent studies on the impact of microbial diversity in urban environments on human health, such as Mills et al. (2019) and Flies et al. (2017).

371
Designing Biodiverse Façade Microbiomes
Figure 4: Species catalogue for 16SRNA (left) and 18SRNA (right). Different taxa are indicated by different colours, with the most abundant ones named in the diagram.
4.3. Key factors influencing microbial diversity on facades
Results of the analysis shown in excerpts above point to a significant role of soil and plants in supporting diversity in microbial communities across building surfaces across the samples analyzed in this study (Figure 5). Furthermore, microbial diversity seems to be related to building features in that differences in sun exposure are linked to significant differences in microbial communities present among very similar façade types and materials. Based on the analysis, sunlight and UV exposure seem to be stronger determinants of microbial growth than exposure to rain: this may also be the reason for the reduced diversity of both bacterial and eukaryotic cells across all samples taken in August 2020. Façade orientation thus seems an important factor in promoting microbial growth, indicating that a building could host a variety of microbiomes depending on local variability of environmental conditions.
Aside from the key role of sun exposure, microbial diversity is closely related to façade materials across all analyzed samples. Materials such as glass, metal façade panels and sunscreen panels as well as plastic artificial lawn did not yield measurable evidence microbial communities. All samples containing soil, however, supported diverse bacterial as well as eukaryotic life. In addition, rough surfaces featuring artificial stone and crumbling mortar contained diverse microbial communities, especially if in proximity to visible plants and mosses. A surprising finding is that both timber surfaces tested in the August sample, even though not taken from building facades but flower pot enclosures and benches, featured the most diverse microbial communities among the sample. This may be due to the surface coatings of the timber already peeling off, leaving the rough natural timber surface open. In addition, it may be due to the presence of insects and small animals, such as ants.

372
Christiane M. Herr and Yawen Duan
Figure 5: Artificial stone façade in 207SEW (left) and mossy unsuccessful “green” wall in 205EEE (right).
5. Findings and ImplicationsFrom the brief analysis of the samples outlined above, several findings can be outlined with a view to informing both further research in the field as well as architectural design approaches aiming to design facades as hosts for diverse microbial communities.
• Artificial materials such as glass, steel and plastic did not yield sufficient numbers of microorganisms present on their surfaces, preventing analysis. Conventional architectural façade materials are thus unlikely to promote diverse façade microbiomes. Results from the analysis of timber elements are promising but are limited to non-façade elements.
• Exposure to rain seems to be less important than exposure to direct sunlight. Modulating sunlightand UV exposure on the façade – avoiding too much exposure while allowing sufficient sunlight - is a promising strategy for the design of diverse façade microbiomes.
• Diversity in microbial communities on the examined facades seems to be seasonal and morepronounced in the winter for the Suzhou climate zone.
• Bacterial diversity was found to increase with presence of soil and proximity to plants. Eukaryoticdiversity on the examined facades tends to be more localized and divergent across differentsamples compared to bacteria. Microbial growth can be regulated through sunlight exposure.
These findings are merely a first step in the study of façade microbiomes and results should be understood in context – in connection to the specific climatic context of the study presented here as well as in connection to broader ecological approaches to design. While the primary findings of this study are related to biology and have benefited from generous support offered by biological researchers, a key consultation with an ecologist early in the project offered a more comprehensive and systemic picture of the prospect of biodiverse architectural facades. From the perspective of ecology, the presence of specific microbial communities must be considered in relation to the presence of plants, of sunlight and of water. Aspects like heavy metal contamination induced by standard (and often deemed environmentally friendly) building materials as well as omnipresent airborne pollutants and acid rain across China are important factors in façade microbiomes – yet, these are usually not considered in the architectural design of buildings.

373
Designing Biodiverse Façade Microbiomes
Much still needs to be done in this regard. As Roudavski (2020) argues, a more inclusive approach to human habitation is required in future architectural design. At the same time, our awareness of what can be designed needs expansion to avoid remaining stuck in a limited view of the ecology of our environments by a focus on selected species, typically those that are at an easily observable scale. We can extend the conventional focus on human beings by becoming ecologically literate and adopting a systemic view on the relationships between species, from microbes to mammals (Mills et al., 2019). This calls for an architecture that is conceived as an open system, in active exchange with its environment and a host for diverse living organisms, supporting their dynamic balance. Gilbert (2016) echoes this vision from the perspective of microbiology with a call for a radical rethinking of how we conceptualise the built environment.
There is a strong tendency to approach the question of human health in relation to microbial biodiversity with a focus on particular species, assuming a linearly-causal relationship with human health. This, however, is short-sighted as systemic connections as well as microbial organisms are not well understood. The presence of bacteria in the genus Acinetobacter on human skin, for example, has been linked to a decrease in auto-immune diseases (Akst, 2020). Species within the same genus of bacteria, however, are also among the leading causes for infections in hospital-acquired pneumonia. Increasing the diversity of microbial communities across urban environments through restorative rewilding strategies, as suggested by Mills et al. (2019), thus forms a more prudent design strategy.
6. Summary and Future WorkThis exploratory study offers first insights into the microbial communities present on diverse external façade materials. Limited to one particular site in Suzhou, China, this study forms a first step in understanding how invisible communities of microorganisms shape a significant aspect of the built environment with a direct impact on human health. While results presented here are but first steps, they aim to help answering a fundamental question about our built environments: How can we define (and measure) a healthy living space? And following from this question, how can we design based on these insights? Analyzing a set of samples obtained from the campus of Xi’an Jiaotong-Liverpool University, this study has shown that material characteristics along with sunlight and, to a lesser extent, rain exposure, determine the diversity of facade microbiomes. Findings derived from this study will inform future work in this project, aiming to create a science-based but architecturally driven new approach to façade design. As a fundamental step in ecological thinking, awareness of microbial diversity leads to a more differentiated appreciation of building facades. This not only implies an inclusive approach integrating non-human life as part of human habitation, but also, as Roudavski (2020, p. 743) has argued, a reconceptualization of (architectural) aesthetics. Results of this study aim to support architects in conceiving ecological living environments beyond simplistic and romanticized visions of“nature” that focus on individual species, without considering larger networks of relationships withinbuildings and cities considered as biomes. Future work will not only continue the examination of themicrobial communities on building facades in greater detail. We will also use architectural design- driven research methods to employ insights gained from this study in experimental design for architecturalfacades able to host diverse communities of microbes, with a particular focus on creating favourableconditions to microorganisms that are in turn beneficial for human health and wellbeing. Results may also be linked to current studies on the microbiomes of indoor environments.

374
Christiane M. Herr and Yawen Duan
Acknowledgements This project is funded by Xi’an Jiaotong-Liverpool University, Research Fund EFP10120190067. We are grateful for the generous support of our project by advice from Dr. Boris Tefsen, Prof. Johannes Knops, Prof. David O’Connor, Chitraj Bissoonauth, Dr. Ferdinand Kappes and Prof. Sekar Raju.
References Adams, R.I., Miletto, M., Taylor, J.W. and Bruns, T.D. (2013) Dispersal in microbes: fungi in indoor air are dominated
by outdoor air and show dispersal limitation at short distances, The ISME Journal, 7(7), 1262-73. Adams, R.I., Bhangar, S., Dannemiller, K.C., Eisen, J.A., Fierer, N., Gilbert, J.Al, Green, J.L., Marr, L.C., Miller, S.L., Siegel,
J.A., Stephens, B., Waring, M.S and Bibby, K. (2016), Ten questions concerning the microbiomes of buildings, Building and Environment, 109, 224-234.
Akst, J. (2020) The Influence of Soil on Immune Health, The Scientist, published Jan 8, 2020. Available from: https://www.the-scientist.com/news-opinion/the-influence-of-soil-on-human-health-66885.
Cruz, M. and Beckett, R. (2016) Bioreceptive design: A novel approach to biodigital materiality, Architectural Research Quarterly, 20(01), 51-64.
Digel, I., Akimbekov, Sh., Kistaubayeva, A., Zhubanova, A.A. (2018), Microbial Sampling from Dry Surfaces: Current Challenges and Solutions, in Artmann G., Artmann A., Zhubanova A. and I. Digel (eds.), Biological, Physical and Technical Basics of Cell Engineering, Springer, Singapore, 421-456.
Flies, E.J., Skelly, C., Negi, S.S., Prabhakaran, P., Liu, Q., Liu, K., Goldizen, F.C., Lease, C. and Weinstein, P. (2017) Biodiverse green spaces: a prescription for global urban health, Frontiers in Ecology and the Environment, 15(9), 510-516.
Gilbert, J.A. (2016) How do we make indoor environments and healthcare settings healthier? Microbial Biotechnology, 10, 11-13.
Hanski, I., von Hertzen, L., Fyhrquist, N., Koskinen, K., Torppa, K., Laatikainen, T., Karisola, P., Auvinen, P., Paulin, L., Mäkelä, M.J., Vrtiainenn, E., Kosunen, T.U., Alenius, H. and Haahtela, T. (2012), Biodiversity, human microbiota, and allergy are interrelated, Proceedings of the National Academy of Sciences, 109(21), 8334-8339.
Hofbauer, W.K. and Gärtner, G. (2020) Microbial life on Façades, Wiesbaden, Springer Spektrum. Kembel, S.W., Meadow, J.F., O’Connor, T.K., Mhuireach, G., Northcutt, D. et al. (2014) Architectural Design Drives the
Biogeography of Indoor Bacterial Communities, PLOS ONE, 9(1): e87093. Long, S. (2019) The new frontiers of microbiome research Available from: WELL Building Institute <
https://resources.wellcertified.com/articles/the-new-frontiers-of-microbiome-research/> Lundholm, J.T. (2006) Green Roofs and Facades: A Habitat Template Approach, Urban Habitats, 4(1), 87-101. Mills J.G., Brookes J.D., Gellie Nicholas J.C., Liddicoat C., Lowe A.J., Sydnor Harrison R., Thomas T., Weinstein P.,
Weyrich L.S. and Breed M.F. (2019) Relating Urban Biodiversity to Human Health With the ‘Holobiont’ Concept. Frontiers in Microbiology, 10, 550. <https://www.frontiersin.org/article/10.3389/fmicb.2019.00550>
Morozov, A. (2016) Building with Microbes (in Mind) Available from: That’s Life [Science] <http://thatslifesci.com/2016-11-27-Building-with-microbes-in-mind-MOROZOV/> (accessed 18 Aug 2020).
Radic, M., Brkovic Dodig, M. and Auer, T. (2019), Green Facades and Living Walls—A Review, Sustainability, 11, 4579. Rintala, H., Pitkaranta, M., Toivola, M., Paulin, L. and Nevalainen, A. (2008) Diversity and seasonal dynamics of
bacterial community in indoor environment, BMC Microbiology, 8, 56. Roudavski, S. (2020) Multispecies Cohabitation and Future Design, in Stella Boess, Ming Cheung, and Rebecca Cain
(eds.), Proceedings of Design Research Society (DRS) 2020 International Conference: Synergy, Design Research Society, London, pp. 731–50.
Roduit, C., Frei, R., von Mutius, E., and Lauener, R. (2016) The Hygiene Hypothesis, in C. Esser (ed.), Environmental Influences on the Immune System, Springer, Vienna, pp. 77–96.
Sender R., Fuchs S. and Milo, R. (2016) Revised Estimates for the Number of Human and Bacteria Cells in the Body, PLOS Biology 14(8), e1002533.

375
The 54th International Conference of the Architectural Science Association (ANZAScA) 2020
Designing the Olkola Cultural Knowledge Centre: A Traditional Owner-Led Integrated Research and Education Process
Hannah Robertson1, Debbie Ross-Symonds2 and Pippa Connolly3
1 The University of Melbourne, Melbourne, Australia & Monash University, Melbourne, Australia [email protected];
2The Olkola Aboriginal Corporation, Cape York, Australia [email protected];
3 Monash University, Melbourne, Australia [email protected]
Abstract: The purpose of this paper is to identify, track and discuss the pedagogical processes involved in an integrated teaching and research project to design and build a Cultural Knowledge Centre on Olkola Country in remote Cape York, Australia. The paper provides an empirical enquiry into the foundational principles and key design, theoretical and practical processes of the collaborative partnership between the Olkola Aboriginal Corporation (OAC), Monash University (and now The University of Melbourne) that has been operating since 2018. This paper focuses on a pedagogical stage in 2019 that saw 320 final year structural, mechanical, transport, environmental and water engineering students team up with 15 masters of architecture student mentors with input from Indigenous Olkola Traditional Owners (TOs) to progress the engineering design concepts and assist with development application preparations. The research provides significant contributions to practical and theoretical understandings of interdisciplinary design education and research that combine traditional cultural and scientific knowledge to support TO needs and aspirations. These lessons have implications for: 1) improved interdisciplinary communication and understanding; 2) the sharing and transfer of technical expertise with TOs; and 3) effective community engagement through architectural science education.
Keywords: integrated education; sustainability; remote building; Indigenous; participatory practices.
1. Project Need and ContextThe most fundamental requirement of any Traditional Owner (TO) led research and teaching partnership is to respond to a community identified need in a contextually appropriate way. The Olkola Aboriginal Corporation (Olkola) are the TOs and custodians of Olkola Country in Cape York, which was handed back to the TOs in 2014 (Bush Heritage, 2016). At present there are 4 outstations on Olkola Country. These facilities support the TOs to maintain land management work. There is currently no built
Imaginable Futures: Design Thinking, and the Scientific Method. 54th International Conference of the Architectural Science Association 2020, Ali Ghaffarianhoseini, et al (eds), pp. 375–384. © 2020 and published by the Architectural Science Association (ANZAScA).

376
Hannah Robertson, Debbie Ross-Symonds and Pippa Connolly
facility on Country to keep and promote cultural artefacts and knowledge. Olkola share a vision to extend their land management work and continue cultural practices by building a Cultural Knowledge Centre (CKC) on Olkola Country. As Olkola elder Uncle Mike Ross (2018) states ‘[We want to] use the centre for all projects-recording knowledge and collecting information of the country and our culture. [We want to] use all the knowledge we can get of our landscape to manage country. Putting together scientific information and cultural knowledge. We can do a lot in a centre based on Country, [because] you’re not talking about your Country, you’re on Country’.
The CKC Project has run over three teaching semesters (at the time of writing), from master plan through to detailed design and has involved a total of 350 students to support the Olkola People in achieving their vision for a Cultural Knowledge Centre. This paper focuses on the most recent stage in Semester 2 2019, when 320 engineering students joined 15 Master of Architecture students to work with Olkola. This unit improved upon the conceptual designs from the previous semester, to improve their practical viability and ready them for development and building permit approvals. As such, the objective of this stage was for the engineering students to produce engineering design proposals and for the architecture students to produce development application reports and construction drawing sets. It was a natural fit then for Civil and Environmental Engineering Practice, a compulsory capstone unit for all final year structural, mechanical, transport, environmental and water engineering specialisations, to partner with a Master of Architecture elective to see the project through to the next stage.
The problem-solving and design approach taught in the subject aims to equip students with new modes of critical thinking and decision-making processes that can be directly applied to the complex, systemic and interconnected nature of the real world. Student design responses are used by the OAC in decision making processes and funding applications. This paper tracks the Olkola led interdisciplinary education processes involved and shows that the project makes significant contributions to 1) students, 2) architectural science education, 3) the CKC Project and most importantly 4) the Olkola.
2. Theoretical BackgroundTo situate this project in the field of architectural science education, we first need to identify how the field emerged, and how interdisciplinarity and TO Led engagement are approached within it. Architectural science emerged in the 1960s to distinguish scientific aspects of building from aesthetic or functional design considerations. At this time, Henry Cowan the University of Sydney’s Head of Architectural Science (1963), attributed the need for architectural science to increasing labour costs, building complexity and the rapid emergence of new materials and technology. Consequently, specialised courses in architectural science, architectural engineering and building science emerged, which contributed to a splintering of building projects into separate specialised technical consultancies.
Since then, the scientific component of architecture curricula has tended to focus on fundamental theoretical principles, typically within the architecture student cohort only. In contrast to this approach, Cowan argues architecture science is most effectively learnt in studio-based projects that have an integrated and applied approach with senior year engineering, construction and architecture students working together. The value of integrating multiple disciplines is supported by other architectural science educators including Nur and Oya Demirbilek (2007) who state that ‘the responsibility for achieving an optimum outcome for any project lies with each and every member of a design team’.
While integration is recognised as one element of effective architectural science education, active engagement is as another critical component. In their teaching, Nur and Oya Demirbilek (2007) aim to

377
Designing the Olkola Cultural Knowledge Centre: A Traditional Owner-Led Integrated Research and Education Process
achieve active engagement through student centred learning, arguing it ‘enhances student learning, helps them to apply the information gained to design, and gives them a better chance to remember’. In addition to student-centred learning, real project applications with active community engagement can also enhance learning by showing the value of applied technical skills. In Australia, architecture curricula have recently shown a specific interest in Indigenous community engagement to improve student awareness and understanding of Indigenous cultures. However, educators have a responsibility to ensure that this engagement is culturally appropriate and that it also benefits partner communities.
With this increased interest, several recent research publications and guidelines outline protocols for conducting culturally appropriate Indigenous research, design and most significantly built environment education, all of which tend to echo each other. Most recently in 2020, the Australian Institute of the Aboriginal and Torres Strait Islander Studies (AIATSIS) published a Code of Ethics for Aboriginal and Torres Strait Islander Research (2020), which outlines 4 principles for research with Indigenous peoples. The principles include Indigenous peoples’ right to ‘self-determination’ of research aims and approaches, ‘leadership’ in research activities that provide ‘sustainable and accountable’ ‘impact and value’ (AIATSIS, 2020). These principles are echoed in Kennedy et al’s (2018) International Indigenous Design Charter, which calls for ‘self-determination’, ‘deep listening’, ‘shared knowledge’ and ‘shared benefits’ that are ‘community specific’. In Indigenous Knowledge in the Built Environment: A Guide for Tertiary Educators Jones et al (2018) further reinforce these principles and suggest practical tools such as memorandum of understandings and action plans. The guide emerged from an earlier report by the same authors that identified ‘within the built environment, there is a clear lack of discourse about the nexus between built environment professionals and Indigenous protocols and knowledge’ (Jones et al, 2016). Although the authors cited some exceptions (Pieris et al, 2014; McGaw and Pieris, 2015; McGaw et al, 2015), all tend to adopt art or design-based architectural lens, rather than a scientific one.
Due to a lack of Indigenous engagement in architectural science publications, it is relevant to turn to built environment teaching initiatives that work with Indigenous partners to identify how interdisciplinary skillsets and scientific principles are applied. Several built environment educators across Australia, including Jock Gilbert, Michael Mossman, David O’Brien, Gini Lee, David Morris, Grant Revell, Paul Memmott, Shaneen Fantin and the Engineers Without Borders (EWB) Challenge deliver teaching programs with Indigenous community partners. The educators and their respective programs aim to deliver meaningful outcomes for Indigenous communities; however, the studios typically cater to architecture, landscape or planning disciplines, or in the instance of the EWB engineering disciplines only. Although many maintain ongoing partnerships throughout the design and build process, which necessarily encompass a project’s scientific aspects, few adopt an interdisciplinary teaching focus. There is thus a need for further Indigenous-led teaching and research offerings that bring together all disciplines involved in a building project to achieve an optimum outcome. This approach is a central aim of the CKC Project, which shows it complements emergent Indigenous led research and teaching approaches in Australian architectural science education.
3. MethodologyTo analyse and evaluate the subject a qualitative methodology linked to the Teaching and Learning Activities (TLAs) is adopted. In turn, TLAs are aligned with the intended learning objectives (ILOs) to

378
Hannah Robertson, Debbie Ross-Symonds and Pippa Connolly
ensure students gain a grounded understanding of remote building and participatory design practices. To ensure the ILOs were reflected effectively in teaching, three core TLAs were recursively tested: 1. Proposition: gained through analysis of pre-reading, lecture materials and guest speakers; 2. Collaboration: through the active participatory co-design with Olkola and engineering and
architecture students to connect abstract theories by generating practical design responses; and3. Reflection: through personal self-assessment via informal weekly feedback and two rounds of formal
feedback at the concept and detailed design stage. The combined analytical and generative nature of engineering design and construction strategies
supports a ‘by design’ or ‘design projection’ approach that combines multiple methods. According to Swaffield and Deming (2012) design projection/ design research shifts the focus away from buildings as physical artefacts to a process–driven approach. This is generally used in practice-based studies across art, architecture and design but also has value in engineering and scientific disciplines. Design projection aims to produce new theories through a process of ‘shift[ing the] focus back and forth between theoretical propositions and the empirical evidence’ (Swaffield and Deming). The aim is the pursuit of ‘whole’ knowledge that according to McDonagh (2015) combines the ‘true’ scientifically provable, with the ‘real’ or experiential. Real knowledge also aligns with bottom up community development approaches such as action research and participatory design (Jenkins and Forsyth, 2010). This approach supports the generation of ‘real’ outcomes and allows for integration of multiple disciplines.
Concurrent with this generative teaching methodology is the analysis of the research process. To this end, semi-structured interviews and questionnaires were used with students and Olkola in the form of written reflections in a Folio of Feedback (architecture students), survey results (engineering students) and the Student Experience Survey (SES) undertaken in all subjects at semester’s end. To ensure free, prior and informed consent of all participants the ethics approval outlines an agreement process with Olkola and students in terms of inclusion, ownership and authorship of work. This includes a voluntary student consent process to opt in or out of work being used by Olkola or in the research project. Survey results are deidentified to ensure student privacy. Names and images are only used with prior consent.
4. Subject StructureTo track key stages and activities, it is necessary to outline the subject’s structure. The key stages were: 1) team organisation, 2) pitch and ballot, 3) concept and detailed design and 4) presentation to Olkola. At the subject outset these stages and the CKC project brief were provided to each student.
4.1 Team Organisation
The engineering students were organised into Engineering Teams (ET) of 4 or 5 students each with a member from a geotechnical, structural, transport, water, environmental or mechanical engineering stream. Each ET was assigned an Architecture Student Mentor (ASM) in the role of practicing architect to uphold the architectural concept in negotiation with the ET. The goal was to mimic a real construction project with a multi-disciplinary professional team. 8 architecture students had also undertaken the previous semester where they had spent time co-designing with Olkola on Country, so they further supported the new students to understand the CKC Project. The students from the previous studio continued to work up their designs to the next stage, while those joining chose a previous student’s

379
Designing the Olkola Cultural Knowledge Centre: A Traditional Owner-Led Integrated Research and Education Process
design to become the custodian of and make changes to. For the new students this emulated professional practice where project team members may change, but there is a shared conceptual vision.
4.2 The Pitch and the Ballot
Given there were only 15 architecture students for 65 ET, each ASM was assigned three or four ET. To allocate the ASMs to ET, the ASMs were asked to prepare a three-minute pitch presentation in the second week. After the ASMs pitched their designs, a ballot of preferences was conducted, and each ET was allocated an ASM to assist with developing the design and contextual knowledge of the project.
4.3 Concept and Detailed Design and Feedback
From Weeks 2-6 the ET worked up the conceptual engineering design strategies for the structure, water flows and treatment, transport, mechanical and environmental services with their ASM. With over 300 students enrolled in the course, two co-supervisory academic staff and a dozen voluntary professional mentors, organisation and oversight of the students was managed each week with a group lecture followed by workshop sessions in which the ET met with professional and architecture student mentors. In Week 7 the ET presented and received verbal feedback on concept design schemes from a panel of professionals and their ASM. As part of the folio of feedback task the ASM also provided both written and drawn feedback to their ET. The feedback aimed to identify conceptual strengths, changes needed for architectural concept alignment and construction detail sketches to assist in resolving details.
From weeks 7-12, the ET continued to work up their design schemes into detailed reports. Concurrently, the ASM worked with the ET to finalise a construction drawing set and development application report. Critically, in Week 7 Olkola chose a conceptual design and provided further written feedback about what they liked about the chosen proposal as well as aspects of other schemes they wanted to see incorporated into the design. Weekly informal feedback sessions continued during this time. In week 10, the ET submitted draft engineering proposals and reports to their ASM who prepared another round of written and drawn feedback, similar to that of the conceptual stage.
4.4 Presentation to and Exhibition with Olkola Traditional Owners
In week 12, the Civil Engineering Department invited Olkola to attend the final presentations and an exhibition of work. 5 ET were chosen to present their design to Olkola, based on the quality of their design report. The ET presentations also covered several different architectural designs and approaches to geotechnics, structures, water, mechanical services, transport and environmental engineering. This highlighted the diversity of ways the CKC Project was tackled and in turn provided TOs with rich data and design options to assist in their decision-making processes. The opportunity to present to Olkola also aimed to enrich ET understandings of the project and how it supports Olkola to connect with and live on Country. Following the presentations, an exhibition was held to showcase the collaboration to date, and the latest addition, the ASM development application reports and construction drawing sets. The exhibition also provided a more informal setting for the students and Olkola to exchange project experiences, which reaffirmed the collaborative ethos of the project.

380
Hannah Robertson, Debbie Ross-Symonds and Pippa Connolly
5. ResultsIn this paper, the results are assessed through the lens of student feedback. For the ET this was provided individually in CATME and SES surveys at the end of the semester, whereas the ASM provided feedback throughout the semester in a Folio of Feedback. Although many common themes emerged in both student groups, it is worth discussing the engineering and architecture students separately to highlight their different experiences and how these relate to disciplinary background and/or the unit structure.
5.1 Engineering Student Feedback
Overall a consistent theme in engineering student feedback was that the unit was ‘tough’ and ‘challenging’, but despite the difficulty it was a ‘rewarding’, ‘fun experience’ that provided ‘real life experience’ and ‘lasting memories and impact’. Three common themes emerged, namely the students: 1) valued the ASM collaboration despite different approaches, 2) found student-centred learning new but useful for applying theoretical knowledge and 3) valued the project and Olkola collaboration.
Engineering student feedback showed emphatic support for the ASM collaboration, because they ‘loved the interaction’ and were a ‘most helpful’ resource. Many explained specific benefits, such as ‘[the ASM] meets us every single week with feedback and suggestions constantly in all disciplines’ and ‘talk[ing] to our architect mentor face-to-face and their enthusiasm and willingness to achieve the same goal was invaluable’. From this, it is evident that communication and a shared vision benefitted the ET however, the ASM collaboration was not always easy. A common complaint was ‘the architect made last minute changes…which required us to also make changes, creating delays’. While some suggested remedying the problem by finalising the architectural designs ‘well before the detailed design phase’, many acknowledged, ‘I also believe this accurately emulates the workplace’. Overall the experience was seen as valuable, such as ‘working on a real project with architects allowed me to gain an appreciation for projects in the real world…and where engineers fit in the project lifecycle’.
The feedback also showed that student-centred learning was new for the engineering students who remarked that significant ‘self-learning’ and ‘motivation’ was needed in the subject. To this effect, a key theme observed was exposure to a professional ‘way’ of working. One student suggested this was achieved by ‘this unit pushes to summarise the knowledge I have learnt for the last three years and connects it into a system…[as] a kick start or warm up for my career by creating a real project working system’. This systemic view is reinforced by another who states, ‘moving away from the theory and closed-ended solutions of previous courses into applying those in design solutions for open-ended problems’ showed ‘the multi-disciplinary nature of a project and how everything is linked’. While many viewed this as good preparation for their professional working life, some found the approach ‘stressful’, ‘a lot of work’ and ‘anxiety’ inducing. This is perhaps reflective that the unit, unlike other engineering subjects, was less focused on delivering technical knowledge, instead consolidating understandings through application, which suggests students lack exposure to this higher order thinking in earlier years.
Engineering student feedback showed support for the CKC Project, with many drawn to working with Olkola and the project’s real-world relevance. While many students explained the value of working with Olkola, such as ‘we got the opportunity to present to Olkola, which I think was really really important and nice to have their feedback, because at the end of the day they’ve been kept in our minds throughout this whole process and that is who this work is for so [it] was definitely a highlight’. It was more common for engineering students to value the project’s practical significance, such as ‘it was really

381
Designing the Olkola Cultural Knowledge Centre: A Traditional Owner-Led Integrated Research and Education Process
cool to be working on a real–world project with actual consequences.’ Others struggled to identify the relevance of a remote project focused on local renewable construction materials like timber and earth to corporate work, such as ‘applying the unit to a more realistic project would be ideal. Using real industry materials such as concrete or steel would have been really beneficial’. This difference could be attributed to the core requirement for all final year engineering students to take the subject.
5.2 Architecture Student Feedback
In contrast to the engineering students, ASM Folios of Feedback documented experiences throughout the semester. The ASM feedback provides a counterpoint to engineering student experiences and highlights differences in communication styles, learning approaches and design iteration. Key overall themes were: 1) varied experiences of working with ET depending on the collaborative approach, 2) frustration at ETlack of drawings, 3) the importance of negotiation, 4) the value of engineering in design resolution, 5)comfort with self-directed learning and 6) resonance with the project purpose.
The ASMs tended to establish rapport with the ET because their scheme was chosen in the ballot. The ASM who received the most ET first preferences tended to share: 1) structurally straight-forward designs, 2) friendly pitch presentations that invited collaboration and 3) clarity on work needed. For ASM whoreceived few or no first preferences there were two discernible albeit often separate trends, either: 1) the design seemed highly complex and difficult to resolve, or 2) the student made a ‘sales pitch’ as if to a clientrather than seeking to mutually engage. This difference in approach of director versus co-collaborator continued to influence ASM and ET dynamics throughout the semester, with those who took on board the latter approach generally reporting greater satisfaction than the former.
Although the management/collaboration style influenced ASM experiences differently, other experiences were universally shared. Most ASM relayed feeling ‘frustrated’, ‘annoyed’ and ‘disappointed’ at the lack of ET drawings. One student stated ‘it became apparent from early days that engineers work very differently to architecture students…they don’t produce drawings frequently which made it hard to review their work/design changes’. Some identified alternative ways to progress the collaboration. For instance, one student trialed using an ipad to collaboratively work up sketches, explaining ‘I realised the ipad would be good to use so we could draw over any work I’d done’. Another moved away from drawings to other ‘methods to help generate ideas such as asking teams to mind map how to achieve their project objective’. Many expressed a renewed appreciation for drawings, such as ‘it really highlighted to me the power and importance of drawings [as] an effective communication tool’.
The collaboration also highlighted the importance of regular communication and negotiation. One student stated, ‘an integral part of working well as a team is continual communication’, this was reinforced by another who stated ‘the communication methods were the more challenging and interesting aspect…I learnt that the way you have to explain projects to people outside of the architecture industry/education, is fundamentally different…there is a tendency to pitch a project as if addressing a client. I found this methodology does not work effectively when trying to collaborate’.
The ASM expressed appreciation for exposure to different engineering disciplines citing it also improved their designs. Structural engineering was commonly cited as the most valuable discipline, with one student explaining ‘due to me learning how lateral loads, wind loads and connections, work within a
382
Hannah Robertson, Debbie Ross-Symonds and Pippa Connolly
structural system’. Another elaborated ‘working with the engineers helped me resolve a lot of the connection details…The engineers were able to explain a lot to me about how these work…this has definitely had significant [design] implications.’ Many also cited being ‘surprised’ to learn about the potential of other engineering disciplines. One student remarked, ‘the most surprising and now my favourite is water engineering. These engineers think about structure too but also rainwater collection, storage, pumping, sterilization and irrigation.’ Another found mechanical engineering of greatest benefit, explaining ‘[they] have opened my eyes to services design and really how fundamental this is to allow a building to actually be built and functional.’
In comparison to the engineering students, ASM emphasised the CKC Project’s importance, citing their involvement as a ‘custodian[ship]’, ‘investment’ and/or a ‘responsibility’. One student explained ‘I responded to the unit as a student, a representative of an idea/ongoing project, and as a friend to those involved in the project Olkola’. Another echoed this interest stating, ‘learn[ing] about Aboriginal Land Rights and tenure structure helped me understand more about the Olkola people gaining back their Country’. The ASM who joined the unit also expressed strong connections with the conceptual vision of the designs they became custodians of and how they could contribute to refining them. One student stated, ‘I am thankful to become custodian of a project rich in values which will generate a sustainable future on Country, and grateful for [the former student]’s initial guidance on what she wanted to see retained.’ This feedback highlights the importance of student choice in establishing connections with a project. The incoming ASM chose the scheme they wanted to carry forth, and the ET chose an ASM in the ballot. As a group, the ASM perhaps resonated more with the project due to it being an elective, as opposed to the engineering students for whom it was a core requirement.
Finally, in contrast to engineering, the ASM seemed more comfortable with self-directed learning, perhaps due to the more open nature of the course. Overall, the feedback showed the relationships formed were the most valued outcome. A student who undertook the CKC Project across three consecutive semesters articulated the impact ‘[The CKC Project has] helped me consider how I think about those who are actually using the environments we are dealing with and gaining a better understanding of the people involved. It’s honestly as simple as that. Understanding that communication more so and developing the relationships with people involved’.
6. ContributionStudent feedback results help to identify how the unit’s interdisciplinary TO led approach contributes benefit to 1) students, 2) architectural science education, 3) Olkola TOs and 4) the CKC project. The collaboration exposed students to different ways of thinking, the need for compromise and it highlighted that the best results come from intractable problems, which no discipline can solve on their own. Student solutions were challenged by other disciplines and hence needed to be well justified, showing the importance of making mistakes in order to learn. While ASM were frustrated by ET wanting to finish the project early and ET were similarly frustrated by ASM changing their mind frequently until the last minute, both groups shared education outcomes in better understanding how elements come together to form a whole project with a client group, conceptual vision and design resolution. For ASM this clarified the reality of what is possible, and it pushed ET to think beyond risk adverse designs.
Further to the professional outcomes, the students were also exposed to Indigenous cultures and the challenges of living on Country in remote Australia. For many the unit was their first exposure to working with an Indigenous group. This got students thinking about how they could apply their

383
Designing the Olkola Cultural Knowledge Centre: A Traditional Owner-Led Integrated Research and Education Process
professional skills beyond economically commercial projects to also value social and cultural dimensions, and in doing so contribute to what civics educator Krinks (1999) calls ‘active citizenship’.
Building an active citizenry of technical practice in students translates directly into lessons for architectural science education. The collaboration highlighted the advantages of working on a real-life applied project over multiple semesters with assessments tailored to community needs and the project stage. In line with Cowan’s (1963) assertion, it also showed the advantages of bringing students nearing graduation together to draw on their existing and different technical disciplinary knowledges in preparation for practice. These findings also align with Demirbilek and Demirbilek (2015) student centred learning advantages of deep learning, high levels of engagement and independent enquiry.
The unit shows that a TO led approach contributes to a truly reciprocal exchange by creating opportunities for learning about Indigenous culture and engaging students through the application of their technical skills and expertise that also deliver practical project outcomes that benefit Olkola TOs. This showed that several factors need to be aligned to establish a TO led integrated subject, namely: • The will of the faculty Head of Departments involved;
• An established and ongoing relationship between the university and a community; • Flexibility to make contingencies (such as if delays occur in the feedback loops);
• Responsive assessments to TO identified needs, the project stage and with relevant disciplines; • Adaptive engagement processes in line with the changing demands of a project.
The unit has made practical contributions to the CKC project, which has been passed on to Olkola. ETwork presented multiple options of structural, water, services, environmental and transport proposals that combined with accompanying visualisations, aided design resolution discussions. ASM construction sets furthered CKC concepts and helped Olkola choose a scheme. These contributions informed the preparation for construction, by assisting with: 1) finalising and certifying the design and engineering drawings, 2) funding applications and 2) the staging and construction methodology. The development application has since been submitted (2020) with minor amendments to the ASM reports and construction sets. Although student work does needs further resolution, which highlights the limited contribution it can make to a real project, the breadth of research, visualisation and presentation options has significantly enriched the quality of the Olkola collaboration and project outcomes.
At the end of the semester, the OAC best summarised the benefits of the collaboration stating: ‘Olkola are proud to be undertaking the [CKC] Project in partnership with Hannah [, Pippa] and Monash University. Having only been back on our traditional lands for 5 years after being displaced, this building project means our research, cultural knowledge and people have a home On Country where we can share our story if we choose. We hope that by undertaking this project, we can show other Traditional Owner groups that building strong relationships with positive outcomes is a possibility for our people and hopefully others can follow in Olkola’s footsteps and undertake a [CKC] Project too’ (OAC, 2019).
7. ConclusionThe collaboration drew upon all architecture and engineering skills students had acquired during their university careers to undertake a complex integrated, open ended design project as part of a

384
Hannah Robertson, Debbie Ross-Symonds and Pippa Connolly
multidisciplinary team. This real-world project closely modelled the type of work expected of a professional architect and/or engineer working in a project team. The problem-solving and design approach taught in the subject equipped students with new modes of critical thinking and decision- making that can be directly applied to the complex, systemic and interconnected nature of the real world. While students perceived this approach and the follow through and inquiry that it required as tough and challenging, ultimately, this study shows that applying learnings to a real-world project with genuine TO leadership helped to engage students. The outcomes have helped Olkola to practically progress the CKC towards construction. The integration of the disciplines and active input of Olkola highlights the importance of communication in architectural science education, something Cowan (1963) asserts is ‘clearly desirable if a proper understanding of the contribution which each can make to the work of the other is going to be achieved’.
8. ReferencesAIATSIS (2020) Code of Ethics for Aboriginal and Torres Strait Islander Research. AIATSIS, Canberra. Bush Heritage (2016) Olkola. Available from: https://www.bushheritage.org.au/places-we-
protect/queensland/olkola (accessed 15 July 2020). Cowan, H. (1963) The Place of Science in Architectural Education, Journal of Architectural Education, 18(1), 6-10. Demirbilek, N., and Demirbilek, O. (2007) Architectural Science and Student-Centred Learning, in Coulson (ed.)
Towards solutions for a liveable future: progress, practice, performance, people. (41st International Conference of the Architectural Science Association (ANZAScA)), pp. 85-91.
Jenkins, P., and Forsyth, L. (2009) Architecture, Participation and Society, Routledge, Abingdon. Jones, D., Low Choy, D., Tucker, R., Heyes, S., Revell, G. and Bird, S. (2018) Indigenous Knowledge in the Built
Environment: A Guide for Tertiary Educators, Australian Government Department of Education and Training, Canberra.
Jones, D., Low Choy, D., Tucker, R., Heyes, S., Revell, G. and Bird, S. (2017) Re-casting Terra Nullius Blindness: Empowering Indigenous Protocols and Knowledges in Australian University Built Environment Education, Final Report, Australian Government Department of Education and Training, Canberra.
Kennedy, R., Kelly, M., Greenaway, J. and Martin, B. (2018) International Indigenous Design Charter: Protocols for sharing Indigenous knowledge in professional design practice, Deakin University, Geelong.
Krinks. K. (1998) Creating the Active Citizen? Recent Developments in Civics Education, Parliament of Australia, Canberra.
McDonagh, D. (2015) Design students foreseeing the unforeseeable: Practice-based empathic research methods, International Journal of Education through Art, 11 (3), 40.
McGaw, J., and Pieris, A., (2015) Assembling the centre: architecture for Indigenous cultures: Australia and beyond, Routledge research in architecture, Routledge, New York.
McGaw, J., Wallis, J. & Greenaway, J. (2014) Re-making Indigenous Place in Melbourne: Towards a Victorian Indigenouc Cultural Knowledge and Education Centre, University of Melbourne Press, Melbourne.
Pieris, A., Tootell, N., Johnson, F., McGaw, J. and Berg, R. (2014) Indigenous Place: Contemporary Buildings, Landmarks and Places of Significance in South East Australia and Beyond, University of Melbourne, Melbourne.
Ross, M. (2018) Project Brief for a Cultural Knowledge Centre, Olkola Aboriginal Corporation, Cairns (Unpublished). Swaffield, S. and Deming, E. (2012) Research strategies in landscape architecture: mapping the terrain, Journal of
Landscape Architecture, 6 (1), 34-45.

385
The 54th International Conference of the Architectural Science Association (ANZAScA) 2020
Developing virtual classroom environments for intelligent acoustic simulations
Megan Burfoot1, Ali GhaffarianHoseini1, Nicola Naismith1, Amirhosein GhaffarianHoseini1 1 Auckland University of Technology, Auckland, New Zealand
{megan.burfoot, ali.ghaffarianhoseini, nicola.naismith, amirhosein.ghaffarianhoseini}@aut.ac.nz
Abstract: Simulated architectural environments provide immense value in technology validation and optimisation in smart buildings. Automated variable acoustics (intelligent acoustic technology) as a novel, emerging technology would benefit largely from simulated environments. Notably, such technology exhibits opportune application for use in classrooms, suggesting the vast benefits of simulated classroom environments for optimisation of intelligent acoustic technology. For such simulations, typical profiles comprising of data on physical and aural NZ classroom attributes have not been holistically detailed or virtually developed. This paper thus aims to develop and detail such virtual environments. Documentation exposing the physicality of classroom types are collated to detail 5 typical classroom profiles. Studies attempting to define regular aural situations in classrooms reveal 4 typical aural situations. Statistical analysis of these quantitative physical and aural classroom attributes produced 2 useful datasets for the acoustic environments. Co-variate adaptive randomization and interpolation were used to create 20 profiled NZ classrooms. This paper offers the development, detailing and demonstration of these ‘typical’ NZ profiles which can be used for software simulation in both industry and academic fields; classroom architecture, classroom acoustics and acoustic optimisation. I-Simpa, a pre/post- processor for acoustic codes, and Autodesk software are used to detail and demonstrate the classroom profiles.
Keywords: Classroom Acoustics; Intelligent Acoustics; Building Performance Analysis; Acoustic Simulation.
1.0 Introduction Computer modelling simulations are commonly used when assessing building performance measures in support of the design process. Building performance analysis (BPA) can facilitate design optimization alongside providing feedback on building design (Chen, 2018). Building Information Modelling (BIM)-enabled BPA, e.g. computer modelling simulations provide this valuable insight into building performance in early design stages (Jin et al., 2019). It is often challenging to ensure the quality of simulation results, suggesting simulations should not generate solutions or answers but increase understanding of the implemented model (Hensen and Lamberts, 2019). Physical architectural environments comprise of many unique independent variables and unpredictable interactions between these multiple factors (de Wilde, 2019). Simulation of the physics of the interactions is vital in understanding and accounting for their effects on building performance (Hensen and Lamberts, 2019; Rodriguez-Mier et al., 2019). The interaction between the building performance and integrated technology can be predicted with simulations, which can also support the product development of novel technologies (Favoino et al., 2017).
Automated variable acoustics (intelligent acoustics), an emerging technology, is achieved through the integration of acoustic scene classification, a machine learning method, and variable acoustic technology. As a novel and developing technology, intelligent acoustics would benefit largely from simulated environments. Intelligence within our built environment is experienced as buildings optimally responding to occupants' needs, thus achieving significant improvements to user wellbeing, sustainability and adaptability of architecture (Clements-Croome, 2011). Artificial intelligence used in smart buildings can significantly improve occupant comfort within all main areas of Indoor Environmental Quality (IEQ) (Panchalingam and Chan, 2019). This is due to occupants having changing preferences and needs over time, which are essential factors affecting IEQ (Bluyssen, 2019). Simulating smart architectural spaces with realistic virtual environments is a prominent way to demonstrate the behavior and response of the space. Simulated architectural environments thus provide immense value in technological optimisation and validation in smart buildings.
Intelligent Acoustics exhibits opportune application for use in classrooms, suggesting the vast benefits of simulated classroom environments for manipulation and optimisation of intelligent acoustics. Classrooms are commonly thought of as single-use spaces, presenting the primary function of teaching and learning (Yang et al.,
Imaginable Futures: Design Thinking, and the Scientific Method. 54th International Conference of the Architectural Science Association 2020, Ali Ghaffarianhoseini, et al (eds), pp. 385–394. © 2020 and published by the Architectural Science Association (ANZAScA)

386
Megan Burfoot, Ali GhaffarianHoseini, Nicola Naismith, Amirhosein GhaffarianHoseini
2018). Nevertheless, there are numerous different acoustic events carried out in classrooms which require specific acoustic conditions to support the learning experience (Rands and Gansemer-Topf, 2017). Flexible spaces are increasing in popularity due to their ability to adapt to occupants changing needs (Søiland and Hansen, 2019). Environmental computer simulations provide timely, cost-effective solutions on the performance of such multi- use spaces for each use case (Hensen and Lamberts, 2019).
To simulate acoustics in an architectural space, there are certain inputs which are required; software instructions and a virtual environment (see Figure 1). The virtual environment is comprised of various physical and aural attributes. A gap in literature exists whereby virtual NZ classrooms comprising of such attributes have not been holistically detailed. Thus, papers aim is to develop a set of virtual classroom environments, by manipulating secondary data from existing studies.
Figure 1: Required Inputs for acoustic simulation
This paper details the development of 20 virtual NZ classroom environments (5 classroom types cross-multiplied with 4 aural situations). First, classroom types common to NZ are investigated and explored. Documentation exposing the physicality of various classroom types are collated to detail 5 typical classroom profiles. Secondly, 4 typical aural situations arising in classrooms are revealed and defined based on existing studies. Interpolation and mode analysis are used on the quantitative physical and aural data exposed in these investigations, to extract the characteristics used in the final profiles. Lastly, I-Simpa, a pre/post-processor for acoustic codes, and Autodesk Revit and 3DSMax are used to demonstrate the final classroom profiles. 3DSMax holds the capability to create and export 3D-scene environments, for import into I-Simpa where 3D aural situations can be created. These profiles are intended for the use of industry professionals and academics who require ‘typical’ or ‘normal’ virtual classroom profiles, to save simulation time.
2.0 Methods Accurately simulating Human-Building interaction is difficult due to behavioural diversity amongst building occupants. Building context (classroom), characteristics (physical attributes) and type of behaviour (speech) are clearly defined to alleviate as much uncertainty around the simulated interactions as possible. The tools (methods or materials) used to define each these variables, and at which phase of the research design are outlined in Figure 2.
Figure 2: Research method phases and tools used for Virtual Environment Demonstration

387
Developing virtual classroom environments for intelligent acoustic simulations
2.1 Physical Classroom attributes
Data Assembly and Extraction: The New Zealand catalogue of standard school building types published by the Ministry of Education was used to assemble the data for this research (McNulty and McClurg, 2013). Initially, the Ministry was contacted to assure the document was up to date. The most recent version of the catalogue contains 2 sections of interest, permanent classrooms (9 buildings scheduled in the catalogue) and relocatable classrooms (15 buildings scheduled in the catalogue). The catalogue defines classroom ‘types’ found in a selection of schools around NZ, by demonstrating qualitative and quantitative attributes of individual classrooms in each ‘type’. The catalogue details, diagrams and photographs were thus deciphered, and appropriate data was assembled. To represent the spaces accurately on Autodesk software, thorough details were required for the following classroom attributes. These included; space dimensions, roof shape, ceiling type, use of acoustic tiles, wall type and covering, insulation, floor type, glazing and furniture layout. Data not interpreted from the catalogue was floor and wall covering, as there is a regulation in NZ for classrooms to be carpeted, and standard wall covering unless otherwise specified is Gib-board. A structured criterion was put in place to ensure only applicable data was extracted to satisfy the research goals. Firstly, only data helpful to the physical acoustic profile analysis were extracted from the catalogue for interpretation. Secondly, data was only included if it was sufficiently detailed, to realistically represented the physical environments. Some level of drawing and photograph interpretation was used to extract the data, with utmost professional judgement. If any of the data was unclear, it was omitted from the profile analysis.
Building Attribute Analysis: In-depth building attribute analysis was conducted on the extracted classroom data. Firstly, the modes for each classroom attribute were found from the collected data above. The number of modes were limited by a maximum of 5, due to the creation of only 5 classroom types, and a minimum of 1, as each attribute required at least one property. After the most prominent modes were extracted (Table 1), the number of occurrences each mode experienced was recorded.
Table 1: Prominent Modes. Attribute (number of occurrences, percentage relative to other modes, equivalent integer)
Attribute Mode No. 1 2 3 4 Glazing Large glazing on North (4,
20%, 1) Large Glazing on North and South (8, 40%, 2)
Some Glazing on all sides (2, 10%, 1)
Some-Little Glazing on N/S (6, 30%, 1)
Layout of Furniture Multiple tables seating 4 (5, 21%, 1)
Front facing desks seating 2 or 3 (9, 47%, 2)
Continuously connected desks (1, 5%, 1)
Front facing single desks (4, 21%, 1)
Ceiling Shape Center Ridge (13, 56%, 3) Mono pitch (3, 13%, 1) Flat (7, 30%, 1) Ceiling Structure Long straight steel trusses
(5, 23%, 1) Large exposed Internal timber beams (7, 31%, 1)
None (10, 45%, 3)
Wall Structure Masonry block with reinforced concrete (2, 8%, 1)
Light timber framing (11, 42%, 2)
Fibre cement with timbre frame (13, 50%, 2)
Dimension Length 8.9-9.2m (11, 57%, 3) 10m (6, 31%, 1) 12m (2, 12%, 1) Dimension Width 7.5-8m (15, 93%, 4) 6.5m (1, 7%, 1) Wall Insulation Yes (5, 20%, 1) No (19, 80%, 4) Ceiling Cladding Acoustic Pinex Ceiling (10,
44%, 2) Gib Ceiling (13, 56%, 3)
Floor Structure Concrete slab on grade (7, 26%, 1)
Suspended timber floor (20, 74%, 4)
Floor Covering Thin Carpet (24, 100%, 5)
This number was then calculated as a percentage relative to the total number of occurrences of all modes for an attribute. Lastly, this percentage was translated into an equivalent single integer of minimum 1, to distribute each attribute amongst the 5 classroom profiles. For example, Table 2 shows the calculation of equivalent integers for the glazing type attribute.

388
Megan Burfoot, Ali GhaffarianHoseini, Nicola Naismith, Amirhosein GhaffarianHoseini
Table 2: Glazing type equivalent integer, building attribute example
Glazing Type No. of Occurrences
Mode Y/N
Percent Equivalent Integer
Representatio n in table 2
Large glazed walls to north 4 Y 20% 1 (4, 20%, 1) Large glazed walls to north and south. 8 Y 40% 2 (8, 40%, 2) Large glazed windows on side. Celestial windows 1 N - - - on opposite side. High level glazing to roof lantern. 1 N - - - Verandas alongside elevations. High clerestory 1 N - - - windows. Only low-level glazing. 1 N - - - Some glazing on all sides. 2 Y 10% 0.5 = 1 (2, 10%, 1) Some/Little glazing on north and south. 6 Y 30% 1.5 = 1 (6, 30%, 1) Total Occurrences 24 4 modes 5 instances
Physical Profile Creation: To create the 5 profiles, covariate-adaptive randomization was used to group various combinations of classroom attributes. This is a randomization technique which stratifies baseline covariates (classroom attributes) and assigns each attribute based on others in the stratum (classroom type no.) to achieve realistic profiles (Ma et al., 2019). This approach was advantageous as balance over many classroom attributes when the sample size is small (5 classroom types) was imperative to satisfy the research goal. Validation was achieved to ensure attributes were assigned consistently with what would be seen in a physical classroom. This was done by comparing the final classroom compositions with Valentine and Halstead (2002) building survey of NZ classrooms and the 4 ‘types’ of classroom categories they created (Table 3). The 5 classroom profiles did sit very close to these 4 types.
Table 3: Classrooms types created by Valentine and Halstead (2002), used to validate final classroom compositions
Type No. Description Type 1 Relocatable classrooms constructed from lightweight materials (timber framing, raised particle board floor)
with an acoustically hard, pitched ceiling following the line of the roof (central ridge and 15-degree pitch) Type 2 Relocatable classrooms (lightweight construction) with softboard acoustic ceiling tiles fixed to the
underside of the trusses, forming a horizontal ceiling plane Type 3 The older style permanent classrooms with concrete on grade floor construction and softboard acoustic
ceiling tiles (perforated softboard) forming a horizontal ceiling Type 4 The older style permanent classrooms with concrete on grade floor construction and an acoustically hard,
flat ceiling (plasterboard or fibre-cement).
Crucial missing data which was not in the main document had to be collected from past studies, including absorption and diffusion coefficient spectrum of surfaces. The data was extracted from three different studies to ensure no missing data (Hodgson and Scherebnyj, 2006) (Yang and Hodgson, 2007) (Coffeen, 2000). Secondly, typical occupancies in the spaces were discovered; in NZ, most students are in classes of size 26 to 30 (54%) or 21 to 25 (31%) (Caygill and Sok, 2008). Thus, 5 occupancies will be simulated from these ranges, including 22, 24, 26, 28 and 30. And lastly, typical temperature, pressure and relative humidity in classrooms were not collected for this research as their effect on classroom acoustics is negligible. Honor Columbus, Principal Technical Advisor for school design in NZ, was approached to inform on typical ceiling heights and roof pitches (personal communication, May 21st, 2020). For the classrooms in question, a height of 2.7m is standard for flat ceilings, and a height of 3m at the apex was typical for pitched ceilings. It was also recommended that internal ceiling apexes range from 3-4.5m so an average should be used of 3.75m.
2.2 Classroom Aural Attributes
Auralization, the under-established acoustic counter-part to visual 3D rendering, is used to anticipate or predict the acoustic behaviour of a space (Pelzer et al., 2014). The data required for the design of aural situations for realistic Auralization in this study were typical directivity, size (decibels), number of sources and ambient background noise of the unoccupied classroom.
Data Collection: Various aural situations in classrooms are categorized for this study using secondary data. Namely, Bradbeer, Mahat, Byers, Cleveland, Kvan & Imms (2017) conducted a study across 337 NZ schools, gathering data to categorize teaching approaches used in classrooms, for sound data collection. Although teaching methods are sophisticated and can vary over time, the data collected and categorized extensively covers

389
Developing virtual classroom environments for intelligent acoustic simulations
the scope of this research. Furthermore, these categories are supported by Cleveland, Newton, Fisher, Wilks, Bower, & Robinson (2016), who researched environmental learning settings. Informal use of the space was not included in the study, but this included any non-teaching hours such as before school, morning tea break and lunch break.
Aural Situation Refinement: Some of these teaching approaches possess similar sound profiles and desired acoustic conditions, so are further narrowed into 4 distinct aural situations. This is due to them possessing similar characteristics, based on a) the potential number of people speaking and thus b) a hypothesized acoustic requirement (RT required). For example, both ‘teacher speaking to all children’ and ‘teacher facilitating large group discussion’ involve 1-2 people speaking at a time, and both will require a high RT, so they will not need to be distinguished apart from each other. This will both simplify and improve the simulated environments, producing only narrowly targeted results.
Not interpreted from this data, thus, to be discovered from alternative studies were the characteristics of voice level (dB) and background noise level (dB). Firstly, a German study by Berger et al. (2019) established normative speaking voice data by measuring 1274 female and 1352 male participants aged 6 to 17 years. They measured 5 voice intensities as the quietest voicing speaking voice (Level I), conversational voice (Level II), classroom voice (Level III), shouting voice (Level IV), and again the quietest speaking voice (Level V). These intensity levels are used for each aural situation. Secondly, Mealings (2019) conducted a study comparing an acoustic application ‘SoundOut’ against a sound level meter, collecting 46 unoccupied ambient noise level recordings in classrooms. This data showed ambient classroom noise levels ranging from 32-45db, with multiple mode values 34, 36 and 39. For this Auralization, a single value of 36dB will be used for background noise level.
3.0 Results The resulting output of this paper is sufficient detail to create and simulate 5 classroom profiles and 4 aural situations. The virtual environments are demonstrated here, with explanations of each step taken to bring the virtual environments into fruition. Figures 3-5 show examples of each step in the virtual environment demonstration, from Revit to 3DS Max to I-Simpa.
3.1 Model Definition and Design
5 classroom profiles were created and assembled (Table 4) based on documented data undergone statistical analysis (Table 1).
Table 4: Physical classroom attributes
No. Dimension Ceiling shape, exposed structure, Ceiling material
Floor type and covering
Wall construction, insulation
Glazing Layout of Furniture, Occupancy
1 6.5x10 Mono pitch, Long Concrete slab on Masonry block Large glazing Continuously straight steel trusses, grade, thin carpet with reinforced on North connected Gib Ceiling concrete, no desks, 25
2 8x9.2 Flat, None, Acoustic Suspended timber Light timber Some-Little Front facing Pinex Ceiling floor, thin carpet framing, no Glazing on single desks, 22 N/S
3 7.5x12 Center Ridge, Large Suspended timber Fibre cement Large Glazing Multiple tables exposed Internal timber floor, thin carpet with timbre on North and seating 4, 24 beams, Gib Ceiling frame, no South
4 7.5x8.9 Center Ridge, None, Suspended timber Light timber Large Glazing Front facing Acoustic Pinex Ceiling floor, thin carpet framing, yes on North and desks seating 2 South or 3, 28
5 7.5x8.9 Center Ridge, None, Gib Suspended timber Fibre cement Some Glazing Front facing Ceiling floor, thin carpet with timbre on all sides desks seating 2 frame, no or 3, 30
Note: All buildings contained a lot of art/posters on walls, cupboard and bookshelves. Note: Typical NZ building floor to ceiling height in classrooms: 2.7m, internal apex height 3.75m.
Furniture families were imported to Revit to create the profiled classrooms’ floor plans. Unique wall, floor and roof types were created to accurately model each classroom envelop. Standard Revit window and door components were used in varying arrangements for each classroom. Figure 3 demonstrates 2 classroom types; classroom 1 and classroom 3 modelled on Autodesk Revit.

390
Megan Burfoot, Ali GhaffarianHoseini, Nicola Naismith, Amirhosein GhaffarianHoseini
Figure 3: Examples - Left: Classroom 1 modelled on Revit. Right: Classroom 3 modelled on Revit
3.2 Aural Profile Design
Absorption and diffusion (scattering) coefficient spectrum of building materials are detailed (Table 5). Expectedly, many building materials share a similar spectrum profile to other materials. Moreover, surfaces with similar coverings (though different structural properties) still share the same acoustic properties.
Table 5: Absorption and diffusion coefficient spectrum of building materials
Building Material Absorption Coefficient Spectrum (125, Diffusion Coefficient Spectrum (125, 250, 500, 1000, 2000, 4000, 8000Hz) 250, 500, 1000, 2000, 4000Hz)
Acoustic Pinex Ceiling (0.27, 0.28, 0.36, 0.43, 0.39, 0.39, 0.45) Use ‘carpet’ (0.06, 0.07, 0.1, 0.15, 0.15, 0.2)
Concrete slab on grade, thin carpet (0.05, 0.1, 0.25, 0.3, 0.35, 0.4, -) (0.06, 0.07, 0.1, 0.15, 0.15, 0.2) Suspended timber floor, thin carpet (0.14, 0.19, 0.21, 0.24, 0.29, 0.33, 0.49) (0.06, 0.07, 0.1, 0.15, 0.15, 0.2) Gib ceiling, Gib covering on masonry no (0.12, 0.09, 0.09, 0.09, 0.08, 0.09, 0.13) Use ‘painted plywood’ insulation, Gib covering on timber framing (0.03, 0.03, 0.02, 0.01, 0.01, 0.01) no insulation, Gib covering on ffiber cement with timbre frame no insulation, Gib covering on timber framing insulation Glazing (0.35, 0.25, 0.18, 0.12, 0.07, 0.04, - ) Use ‘blackboard’
(0.1, 0.05, 0.04, 0.04, 0.03, 0.03) Wooden door (0.15, 0.11, 0.09, 0.07, 0.06, 0.06, 0.13) (0.6, 0.45, 0.32, 0.38, 0.3, 0.3) Furniture (hard chairs and tables) (0.06, 0.07, 0.09, 0.09, 0.08, 0.07, 0.07) Use ‘wood’
(0.6, 0.45, 0.32, 0.38, 0.3, 0.3) Occupants (0.13, 0.16, 0.15, 0.13, 0.18, 0.25, - ) (0.62, 0.72, 0.8, 0.8, 0.85, 0.85)
The secondary aural situation data was refined into situations A-D based on analyzing and grouping similar speaker and listener characteristics. For example, ‘teacher speaking to all children’ and ‘teacher facilitating large group discussion’ both have 4-6 people speaking at once, and people listening in varying directions, so are grouped together. Thus, 4 aural situations used in classrooms are profiled (Table 6) by defining number of people speaking and at which intensity level. Lastly, background noise level is noted at 36dB.
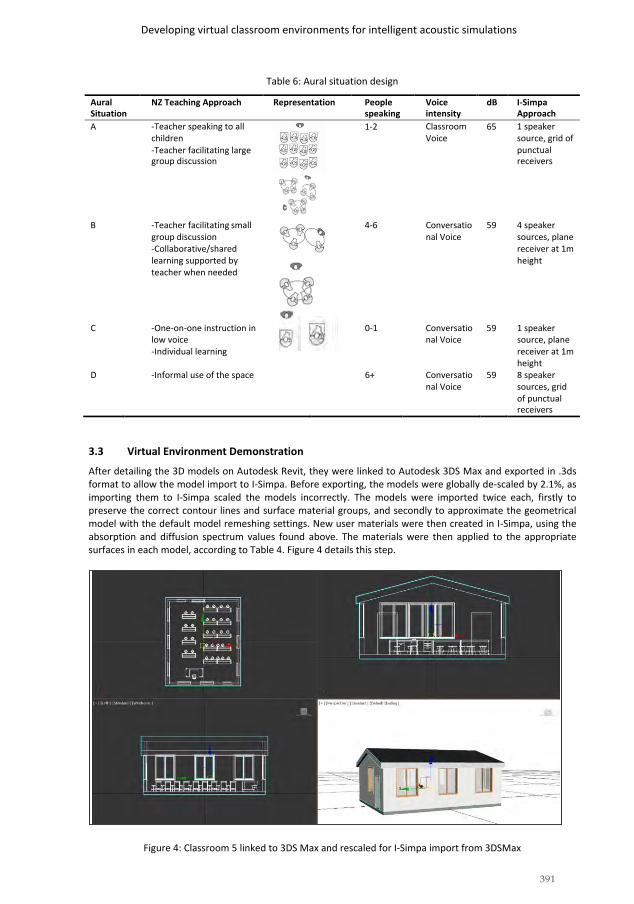
391
Developing virtual classroom environments for intelligent acoustic simulations
Table 6: Aural situation design
Aural Situation
NZ Teaching Approach Representation People speaking
Voice intensity
dB I-SimpaApproach
A -Teacher speaking to all children -Teacher facilitating largegroup discussion
1-2 Classroom Voice
65 1 speaker source, grid of punctual receivers
B -Teacher facilitating small group discussion -Collaborative/shared learning supported by teacher when needed
4-6 Conversatio nal Voice
59 4 speaker sources, plane receiver at 1m height
C -One-on-one instruction in 0-1 Conversatio 59 1 speaker low voice nal Voice source, plane -Individual learning receiver at 1m
height D -Informal use of the space 6+ Conversatio 59 8 speaker
nal Voice sources, grid of punctual receivers
3.3 Virtual Environment Demonstration
After detailing the 3D models on Autodesk Revit, they were linked to Autodesk 3DS Max and exported in .3ds format to allow the model import to I-Simpa. Before exporting, the models were globally de-scaled by 2.1%, as importing them to I-Simpa scaled the models incorrectly. The models were imported twice each, firstly to preserve the correct contour lines and surface material groups, and secondly to approximate the geometrical model with the default model remeshing settings. New user materials were then created in I-Simpa, using the absorption and diffusion spectrum values found above. The materials were then applied to the appropriate surfaces in each model, according to Table 4. Figure 4 details this step.
Figure 4: Classroom 5 linked to 3DS Max and rescaled for I-Simpa import from 3DSMax

392
Megan Burfoot, Ali GhaffarianHoseini, Nicola Naismith, Amirhosein GhaffarianHoseini
The aural situations were then created by defining various sound sources (people speaking) and sound receivers (people listening). In accordance with Table 5, the sources had defined global Lw dB levels and space positions, and the receivers were created singularly in grids or as a plane, with a defined background noise level. To simulate the aural situations, the correct frequency bands were selected which match the user-defined material coefficient spectrums used in the model; 125, 250, 500, 1000, 2000, and 4000Hz. Two examples are shown in figure 5. Classroom 5 has been imported into I-Simpa and aural situation A has been defined in the space. A grid of 5x6 receivers represent the students listening, and a point sound source with directivity in the YZ plane represents the teacher speaking. Classroom 2 is also displayed in figure 5, demonstrating aural situation B in the 3D space. The students listening are represented by a plane receiver at 1m height in the XY plane. The teacher and students are speaking and represented by sound sources with unique vector directivities.
Figure 5: Left: Classroom 5 with Aural Situation A, showing the sound power of the teacher. Right: Classroom 2 with aural situation B (plane receiver not shown)
4.0 Discussion In this paper, I-Simpa was used merely to demonstrate the final aural situation designs. In practise, the aural attributes of the virtual environments would prove to be an accurate software input software, however the 3D geometry input would not be. I-Simpa performs more efficiently and accurately with simplified geometries combined with precise absorption and diffusion coefficients for each geometry surface. Thus, in practise the 3D models should first be simplified to basic shapes before importing them to I-Simpa. Furthermore, interpolation should be used to obtain the coefficient spectrums for each simplified surface, to accurately represent the specific and unique distribution of objects and materials on that surface. Figure 6 illustrates this concept by transforming a wall made up of 3 materials with different coefficient spectrums, into a wall with one coefficient spectrum representing an equivalent proportion of the 3 combined materials. Nevertheless, the final physical classroom profiles are shown here in a detailed form for broad access and easier transferability into other architectural disciplines and simulation typologies.
Figure 6: Simplification of 3D Model using interpolation for I-Simpa accuracy and efficiency
Many new classrooms in NZ are constructed as prefabricated, relocatable buildings (Dodd et al., 2001). Unfortunately, they have received unwelcome attention due to numerous complaints from educators about the acoustic performance. The nature of discomforts for classrooms are all associated with an acoustic environment causing distress for speech or related cognitive tasks (Vilcekova et al., 2017). Students spend a significant portion of their time at school (Ministry of Education, 2019). These environments are critical to the development, growth and progression of our nation’s youth, presenting a vital space where appropriate best practice acoustics should be applied. Concerningly, AS/NZ2107:200 has set out singular recommended acoustic parameters for

393
Developing virtual classroom environments for intelligent acoustic simulations
classrooms, and this is just a compromise between the wide parameter ranges needed in classrooms (Standards New Zealand, 2016). Consequentially, there is little motivation for designers to optimise this within a range of values for different situations, leading to poor classroom acoustics. It is not appropriate to apply one acoustic condition to a dynamic space such as a classroom, as teaching approaches performed in classrooms are varied in nature. Advanced acoustic solutions are required in NZ classrooms, and one example - Intelligent acoustic technology - can now be tested using the environments designed in this paper.
Ghaffarianhoseini et al. (2018) recently acknowledged the importance of intelligent technology, and how meaningful benefits for occupants and societies can arise from their integration in our built environment. It was suggested that these benefits and challenges should be continually explored and redefined. Simulations can be used to alleviate some of the challenges with designing and optimizing intelligent technology (Ghaffarianhoseini et al., 2017). Acoustic simulations present their own set of challenges. For example, incongruities exist in the field of acoustic simulation around the optimum level of detail for the simulated geometrical models. The level of detail is quantitatively defined by the number of surfaces in the model divided by the 3D volume. It is widely believed that model approximations with lower levels of detail achieve more accurate results, due to user compensation of assigning less realistic scattering coefficients to reflect actual measurements in a space (Shtrepi, 2019). Nevertheless, it stands true that highly detailed models with more realistic scattering coefficients can also achieve accurate simulation results (Wang et al., 2004). This is because models with high detail levels experience lower sensitivity to scattering coefficient. Thus, the virtual environments in this paper were created using high levels of detail and realistic scattering coefficients, so when used for simulation the outputs are accurate.
5.0 Conclusion A gap in literature exists in the development and demonstration of virtual NZ classroom environments. This paper aims to close this gap by using manipulated secondary data of physical and aural attributes, to develop 20 virtual classroom environments typical to NZ. Computer modelling simulations are commonly used when assessing building performance measures in support of the design process. Simulations can facilitate design optimization, provide feedback on building design, and increase understanding of an implemented model. Physical architectural environments comprise of many unique independent variables and unpredictable interactions between these multiple factors. Classrooms have received unwelcome attention due to numerous complaints from educators about acoustic performance. Rather than physically experimenting with new classroom technology, acoustic simulations can be deployed to save time, cut costs and reduce learning disruption.
To simulate the acoustic environments in this paper, a combination of both physical and aural data was required. Typical profiles comprising of data on physical and aural NZ classroom attributes have not been holistically detailed in past literature. This paper collated existing data to create and demonstrate a set of 5 classroom profiles. Thus, existing ‘typical’ NZ classroom types were investigated. Documentation exposing the physicality of different classrooms was then used to detail the 5 typical classroom profiles. Secondly, typical aural situations arising in classrooms was revealed in existing studies. Aural trend analysis was used to define 4 resulting situations to be used in the profiles, based largely on the number of people speaking and at which sound level. I-Simpa, Autodesk Revit and 3DSMax were then used for the final classroom virtual environments.
Simulating the real-time performance and evaluation of smart buildings is a prominent way to demonstrate the approximate building response and behavior. As a novel and developing technology, intelligent acoustics would benefit largely from simulated environments, providing immense value in technological optimisation and validation. Intelligent Acoustics exhibits opportune application for use in classrooms, emphasizing the vast benefits of simulated classroom environments for manipulation and optimisation of intelligent acoustics.
This paper offers the development, detailing and demonstration of 20 NZ classrooms profiles which can be used for software simulation. Benefits are thus experienced by those who require typical classroom profiles for simulations in both industry and academic fields including but not limited to classroom architecture, classroom acoustics and acoustic optimization. Despite how this paper presents various physical and aural characteristics of New Zealand classrooms, this does not mean to say that classrooms in other countries would not see value in these demonstrations. Many classroom attributes could be very easily altered or transformed in some way to represent a variation of the classrooms seen here. Additionally, if the classroom profiles are used to simulate and test an architectural technology, by comparing the pre-test and post-test outputs, the statistical results would be accurate as they are presented in a relative context; the post-test data relative to the pre-test data. Thus, these profiles can be used universally, to quantify general technological effects in classrooms.

394
Megan Burfoot, Ali GhaffarianHoseini, Nicola Naismith, Amirhosein GhaffarianHoseini
6.0 References Berger, T., Peschel, T., Vogel, M., Pietzner, D., Poulain, T., Jurkutat, A., Meuret, S., Engel, C., Kiess, W. and Fuchs, M. (2019)
Speaking Voice in Children and Adolescents: Normative Data and Associations with BMI, Tanner Stage, and Singing Activity, Journal of Voice, 33(4), 580.e521-580.e530.
Bluyssen, P. M. (2019) Towards an integrated analysis of the indoor environmental factors and its effects on occupants, Intelligent Buildings International, 1-9.
Caygill, R. and Sok, S. (2008) School demographic characteristics and decile,Education Counts, Ministry of Education. Chen, S.-y. (2018) A green building information modelling approach: building energy performance analysis and design
optimization,MATEC Web of Conferences, EDP Sciences, 01004. Clements-Croome, D. (2011) Sustainable intelligent buildings for people: A review, Intelligent Buildings International, 3(2),
67-86.Coffeen, B. (2000) Classroom acoustics - a resource for creating learning environments with desirable listening conditions,
University of Kansas, Acoustical Society of America. de Wilde, P. (2019) Ten questions concerning building performance analysis, Building and Environment, 153, 110-117. Dodd, G., Wilson, O., Valentine, J., Halstead, M. and McGunnigle, K. (2001) Classroom Acoustics a New Zealand
Perspective,17th International Congress on Acoustics, Rome. Favoino, F., Giovannini, L. and Loonen, R. (2017) Smart glazing in Intelligent Buildings: what can we simulate?,All eyes on
glass: conference proceedings of Glass Performance Days 2017, 28-30 June 2017, Tampere, Finland, Glass Performance Days, Glaston Finland Oy, 212-219.
Ghaffarianhoseini, A., AlWaer, H., Ghaffarianhoseini, A., Clements-Croome, D., Berardi, U., Raahemifar, K. and Tookey, J. (2018) Intelligent or smart cities and buildings: a critical exposition and a way forward, Intelligent Buildings International, 10(2), 122-129.
Ghaffarianhoseini, A., Tookey, J., Ghaffarianhoseini, A., Naismith, N., Azhar, S., Efimova, O. and Raahemifar, K. (2017) Building Information Modelling (BIM) uptake: Clear benefits, understanding its implementation, risks and challenges, Renewable and Sustainable Energy Reviews, 75, 1046-1053.
Hensen, J. and Lamberts, R. (2019) Building performance simulation–challenges and opportunities, Building Performance Simulation for Design and Operation, 1-10.
Hodgson, M. and Scherebnyj, K. (2006) Estimation of the absorption coefficients of the surfaces of classrooms, Applied Acoustics, 67(9), 936-944.
Jin, R., Zhong, B., Ma, L., Hashemi, A. and Ding, L. (2019) Integrating BIM with building performance analysis in project life- cycle, Automation in Construction, 106, 102861.
Ma, W., Qin, Y., Li, Y. and Hu, F. (2019) Statistical Inference for Covariate-Adaptive Randomization Procedures, Journal of the American Statistical Association, 1-10.
McNulty, D. and McClurg, M. (2013) Catalogue of Standard School Building Types, in M. o. Education (ed.), Ministry of Education.
Mealings, K. (2019) Validation of the SoundOut Room Acoustics Analyzer App for Classrooms: A New Method for Self- Assessment of Noise Levels and Reverberation Time in Schools, 277-283.
Ministry of Education (2019) New Zealand School System Available from: New Zealand Immigration <https://www.newzealandnow.govt.nz/living-in-nz/education/school-system > (accessed April 13).
Panchalingam, R. and Chan, K. C. (2019) A state-of-the-art review on artificial intelligence for Smart Buildings, Intelligent Buildings International, 1-24.
Pelzer, S., Aspöck, L., Schröder, D. and Vorländer, M. (2014) Interactive Real-Time Simulation and Auralization for Modifiable Rooms, Building Acoustics, 21(1), 65.
Rands, M. L. and Gansemer-Topf, A. M. (2017) The room itself is active: How classroom design impacts student engagement, Journal of Learning Spaces, 6(1), 26.
Rodriguez-Mier, P., Mucientes, M. and Bugarín, A. (2019) Feature selection and evolutionary rule learning for Big Data in smart building energy management, Cognitive Computation, 11(3), 418-433.
Shtrepi, L. (2019) Investigation on the diffusive surface modeling detail in geometrical acoustics based simulations, The Journal of the Acoustical Society of America, 145(3), EL215-EL221.
Søiland, E. and Hansen, G. K. (2019) Ideas or reality? Flexible space – flexible people?, Intelligent Buildings International, 1- 13.
Standards New Zealand (2016) Australia/New Zealand Standard.,Acoustics - Recommended design sound levels and reverberation times for building interiors.
Valentine, J. and Halstead, M. (2002) Classroom Acoustics, A New Zealand Perspective, 14(2). Vilcekova, S., Meciarova, L., Burdova, E. K., Katunska, J., Kosicanova, D. and Doroudiani, S. (2017) Indoor environmental quality
of classrooms and occupants' comfort in a special education school in Slovak Republic, Building and Environment, 120, 29-40.
Wang, L. M., Rathsam, J. and Ryherd, S. (2004) Interactions of model detail level and scattering coefficients in room acoustic computer simulation, Architectural Engineering - Faculty Publications, 18.
Yang, J., Pan, H., Zhou, W. and Huang, R. (2018) Evaluation of smart classroom from the perspective of infusing technology into pedagogy, Smart Learning Environments, 5(1), 20.
Yang, W. and Hodgson, M. (2007) Optimum Reverberation for Speech Intelligibility for Normal and Hearing-Impaired Listeners in Realistic Classrooms Using Auralization, Building Acoustics, 14, 163-177.

395
The 54th International Conference of the Architectural Science Association (ANZAScA) 2020
Development of a BIM-based LCA Tool to Support Sustainable Building Design during the Early Design Stage
Bartlomiej Marek Kotula1, Aliakbar Kamari*2
1 Aarhus University, Aarhus, Denmark [email protected]
*2 Aarhus University, Aarhus, Denmark [email protected]
Abstract: The vast majority of scientists, building industry representatives, and non-governmental organizations agree that a robust method in environmental load assessment of buildings needs to be implemented to reduce the environmental burden of the construction industry significantly and to meet the required environmental standards. So far, the industry utilizes the life cycle assessment (LCA) method to assess the environmental impacts of the detailed design; yet, the implementation of changes at that stage of development is often expensive and unadvisable. On the other hand, during the early design stages, the LCA method is restrained by the information provided by the design and the uncertainty of material decisions. To support sustainable design decisions during early design, the aim of this research study is primarily to investigate how the use of available methods and tools, such as Building Information Modelling (BIM), can facilitate the process of conducting LCA analysis. A literature review is conducted that enable us to establish a framework for BIM and LCA integration, which creates the foundation for the development of a new BIM-based LCA tool. The first prototype of the tool is demonstrated in this paper and empirically evaluated on a large case study of a residential building in Denmark.
Keywords: Life Cycle Assessment (LCA); Building Information Modelling (BIM); BIM-based LCA; Early Design Stage.
1. IntroductionBuildings' production and operation stages are responsible for 35% of total energy use and 19% of energy-related to GHG (Edenhofer et al., 2014). To meet the sustainable development goals architects, engineers, contractors, together with other building stakeholders are not only obliged to work in the Building Information Modeling environment, but they also have to introduce the Life Cycle Assessment concept into their practices. Without ground methods for assessing environmental impacts of the building and exploitation of the benefits of reused materials, the process of achieving the sustainable goals will be significantly hampered.
Imaginable Futures: Design Thinking, and the Scientific Method. 54th International Conference of the Architectural Science Association 2020, Ali Ghaffarianhoseini, et al (eds), pp. 395–404. © 2020 and published by the Architectural Science Association (ANZAScA).

396
Bartlomiej Marek Kotula and Aliakbar Kamari
Although the LCA has been widely accepted as a method to evaluate the environmental impacts of the buildings, the methodology, underlying data, and tools are still under development. The main disadvantages of the LCA are its complexity, time consumption, data collection, and issues with weighting. Due to those limitations, the design's evaluation of environmental loads is often shifted after the design phase is completed – when all the necessary materials are available. Thus, both the possibility of influencing the design decisions made in the early design stage and the enormous potential for the reduction of the building's life cycle impacts are abandoned (Basbagill et al., 2013; Häkkinen et al., 2015, Marsh, 2017). Moreover, Häkkinen et al. (2015) argue that there is a lack of not only design- integrated tools but also the process descriptions for designing low-carbon buildings.
Despite those limitations and incoherence in LCA studies, many researchers proposed solutions to introduce the LCA in the early design stage to enhance design abilities and sustainable decision making (Antón & Díaz, 2014; Basbagill et al., 2013; Bueno et al., 2018; Häkkinen et al., 2015; Kamari et al., 2018a,b,c; Meex et al., 2018; Röck et al., 2018; Soust-Verdaguer et al., 2017). The proper collection of data is key to the reliable and efficient environmental impacts assessment of the design. Since BIM allows a multidisciplinary collection to be imposed in one model, it creates a new way of incorporating sustainable measures throughout the design process (Azhar et al., 2011). As various disciplines are moving towards BIM application, it is beneficial to develop a BIM-integrated LCA methodology in order to take the aspect of environmental loads of the building into design decision making (Antón & Díaz, 2014; Chong et al., 2017; Hollberg & Ruth, 2016; Meex et al., 2018; Röck et al., 2018). The goal of BIM and LCA integration is to give AEC (Architecture, Engineering, Construction) industry a possibility to focus on conceptual design while, in parallel, being informed about the implications and potential effects of the material and design selection during the early design stage (Hollberg et al., 2018).
1.1. Problem statement
Since most of the available software on the construction market does not allow for interoperability between BIM environment, the most obvious solution is to integrate BIM and LCA and implement it in the early design stage to allow engineers and architects to identify hot-spots of environmental impacts and minimalize their effects. Therefore, the main aim of this paper is to identify and investigate current LCA and BIM integration issues, and afterward, provide a holistic framework for BIM-LCA integration and to develop BIM-based LCA tool, which can be used in the early design stage. With decreasing the environmental loads from the operational stage, the building material selection starts to play a significant role in the total environmental impact of the design; thus, the LCA tool should facilitate the interpretation of the results to support design decisions regarding material choices. Moreover, the project aims to analyze the representativeness of the data, and the outcome of that research will be incorporated into the software's architecture.
In particular, the developing tool is supposed to bridge the existing gaps in current practices, which were stressed by the EXIGO consultancy (a construction company located in Aarhus, Denmark), according to the two rounds of interviews we conducted with their LCA practitioners. Therefore, the developing tool in this paper should enable professionals, small architectural companies, students, and researchers to execute the calculation of the environmental loads of the building in the early design stage in a transparent, easy, and time-saving manner. The tool will allow for effortless quantity material take-off from the Revit model and, in contrast to other LCA tools, will allow for automated mapping of the materials to reduce the time needed to perform LCA calculations. This will lead to improving

397
Development of a BIM-based LCA Tool to Support Sustainable Building Design during the Early Design Stage
sustainable design decision processes in the early design stage as well as to spread awareness of materials' selection and their production effect on the environment.
1.2. Research structure
The point of departure for this research is conducting qualitative research. Based on a literature review, the state-of-the-art within the current practices in the sustainable building design, the use of BIM and LCA methods, and the value of integrating these two approaches are outlined. In addition, the literature review is used to analyze current methods of the assessment of the environmental impacts within the construction industry and find the gaps in the existing LCA tools. Since the purpose of the tool is to being used within the BIM environment – the Autodesk Revit software is used as a BIM platform. The BIM- based LCA tool is developed using the Visual Basic Studio and C# programming language and utilization of the Revit API.
2. BIM and LCA – a framework for integration and designThe goal of sustainable design is to create a building with the lowest environmental impact while pushing economic and social development (Antón & Díaz, 2014). Many scholars reviewed several cases of BIM and LCA integration in the building industry and proved that through this approach, it is possible to gain quick and reliable results about the environmental impact of the building from the early design stages. However, there is still a long way to go in the process of eliminating current challenges in BIM and LCA integration. Both works by Häkkinen & Kiviniemi (2008) and Soust-Verdaguer et al. (2017) underline the variety of data requirements between BIM and LCA, which leads to the time-consuming nature and complexity of the whole process. According to the reviewed papers, the data contained in the BIM databases is not sufficient to perform LCA, which is the main reason behind the manual edition of the bill quantities and material properties by the end-users (Basbagill et al., 2013; Häkkinen et al., 2015; Najjar et al., 2017; Peng, 2016; Soust-Verdaguer et al., 2017).
Another critical issue is the lack of worldwide standards regarding functional units, system boundaries, and weighting methods. As Nwodo & Anumba (2019) stated, all inputs and outputs in the life cycle inventory and the life cycle impact assessment are related to the functional unit. The functional unit not only improves the comparison of the data but also plays a major role in assessing the environmental impact loads of the whole building system. Soust-Verdaguer et al. (2017) emphasize that many scholars assumed either complete building or 1 m2 of the heated area as a functional unit in LCA, which might not be completely reliable while comparing different buildings. Soust-Verdaguer et al. (2017) suggest that functional unit should include building type (residential, office), relevant technical requirements (regulatory requirements, energy performance), a pattern of use (occupancy, usable floor area), and required service life. Another relevant issue is the variation in building life span and service life. Nwodo & Anumba (2019) state many studies on building LCA make varied standard assumptions on building life span and service life for material replacement, repair, and maintenance. These standard assumptions may lead to incorrect and unreliable LCA results. The authors suggest that pragmatic assumptions should be considered based on the science of building rather than common practice.
Besides, Nwodo & Anumba (2019) highlight that the lack of procedure for system boundaries is another challenge of building's LCA, which needs to be tackled. As in the case of the functional units, the LCA standards do not provide any specific procedures to define system boundaries, which makes the comparison of the results difficult. According to EebGuide (2019), screening LCA should include A1-A3,

398
Bartlomiej Marek Kotula and Aliakbar Kamari
B6, B7, which corresponds to the production stage (raw materials supply, transport manufacturing) and use stage (only operational energy use and water use). The other stages are considered as optional because of minor relevance or due to potentially missing data, which is reasonable because in the early design stage, it is hard to define what will be emissions for the demolition or replacement phase. The simplified approach adds on top of that stage C3 and C4, which are waste process and disposal, and D stage, which is benefits beyond boundary. Complete, as the name suggests, includes all the life stages.
In terms of practical LCA assessment, it is a contentious issue whether the operational water use has to be included in the early design stage. Since the operational energy mainly depends on the building design, the water use depends only on user behavior. It is not related to the design at any degree, thus many researchers and screening or simplified LCA approaches omit that stage. Fufa et al. (2018) stated that the data from A4-A5, B, and C modules should be completely removed from the assessment of environmental impact, as they are based on scenarios given by the producers, but not by construction specialists. According to the interview with EXIGO A/S consultancy and the scientific resources, it is preferable to focus on the A1-A3 stages of the building design, which refer to the material production, since the uncertainty of the data in the use stage and demolition stage relatively high. Literature also echoes that selection of the final indicators is based on the scope of the LCA, the design location's environmental problems, the intended audience of the research, and the practitioner's preferences.
However, literature shows that there is a common understanding of the importance of correct results' presentation, which is a way to stimulate environmental awareness of society. In this case, proper selection of impact categories allows for flawless conduction of knowledge to the audience. To present different environmental impact categories results in a simplified unit first, they need to be normalized and weighted - which in accordance with the ISO standards, both steps are optional for LCA (ISO, 2006). However, since most of the building LCAs are used only in the building industry and their results are not publicly published, it is recommended to base the LCA on the environmental impact indicators included in BS EN 15978 standard (British Standards Institute, 2012).
The results should be presented in easy to evaluate way, preferably employing eye-catching graphs, charts, or by visualization of the impact categories BIM model (Kamari et al. 2020). It is recommended to avoid delivering broad environmental reports, which consists of many unnecessary data, especially during the early design stage, when the hot-spots have to be quickly identified and eliminated.
3. Demonstration of the BIM-based toolThe developed BIM-based LCA tool works linearly, which means that one activity needs to be finished before the other starts. The developed add-in automatically delivers the geometry extraction with the properties needed for further evaluation. After that step, the tool automatically links the elements from the material take-off with the material database created in the Microsoft Excel spreadsheet (developed by the authors). The whole process of assigning Revit materials to the material's database takes less than a few seconds. Subsequently, the LCA BIM-based tool calculates the total environmental impact of each material during the production phase and saves up the results, which later are displayed in the form of tables and charts. The workflow is illustrated in Figure 1. It is worth mentioning that the process requires only one activity from the user, which is an initialization of the LCA tool by clicking on its plug-in icon in the Autodesk Revit software. The add-in automatically generates material quantity take-off and saves it up as a text file. This method was obtained by using the MaterialQuantities application provided by Revit SDK samples. However, the source sample provided in the Revit SDK was limited only to walls, roof, and floors, so it did not allow for full material quantity take off. The sample was customized with
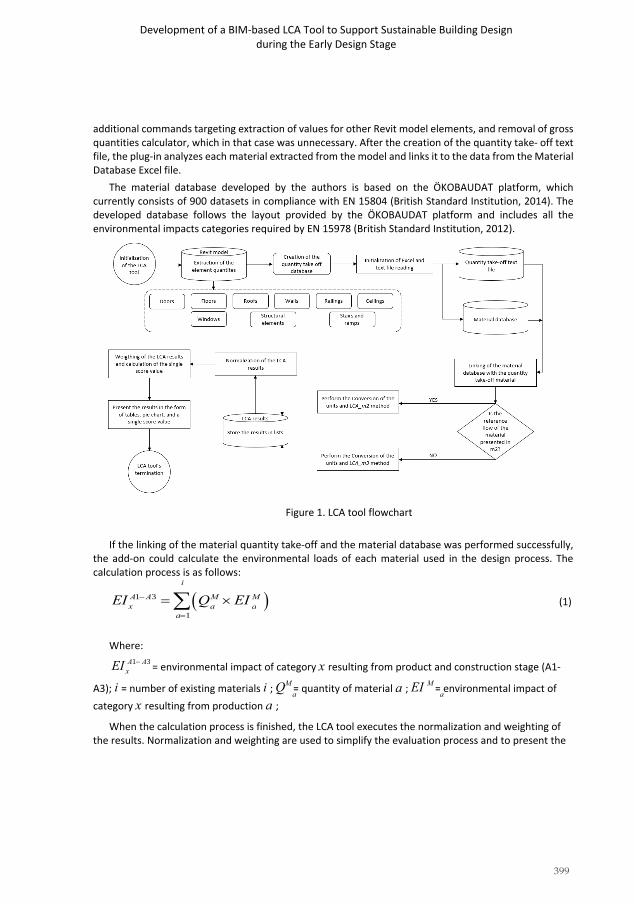
399
Development of a BIM-based LCA Tool to Support Sustainable Building Design during the Early Design Stage
x a a
x
additional commands targeting extraction of values for other Revit model elements, and removal of gross quantities calculator, which in that case was unnecessary. After the creation of the quantity take- off text file, the plug-in analyzes each material extracted from the model and links it to the data from the Material Database Excel file.
The material database developed by the authors is based on the ÖKOBAUDAT platform, which currently consists of 900 datasets in compliance with EN 15804 (British Standard Institution, 2014). The developed database follows the layout provided by the ÖKOBAUDAT platform and includes all the environmental impacts categories required by EN 15978 (British Standard Institution, 2012).
Figure 1. LCA tool flowchart
If the linking of the material quantity take-off and the material database was performed successfully,
the add-on could calculate the environmental loads of each material used in the design process. The calculation process is as follows:
i
EI A1− A3 = ∑(QM × EI M ) a=1
(1)
Where:
EI A1− A3 = environmental impact of category x resulting from product and construction stage (A1-
A3); i = number of existing materials i ; QM = quantity of material a ; EI M = environmental impact of a a
category x resulting from production a ; When the calculation process is finished, the LCA tool executes the normalization and weighting of
the results. Normalization and weighting are used to simplify the evaluation process and to present the
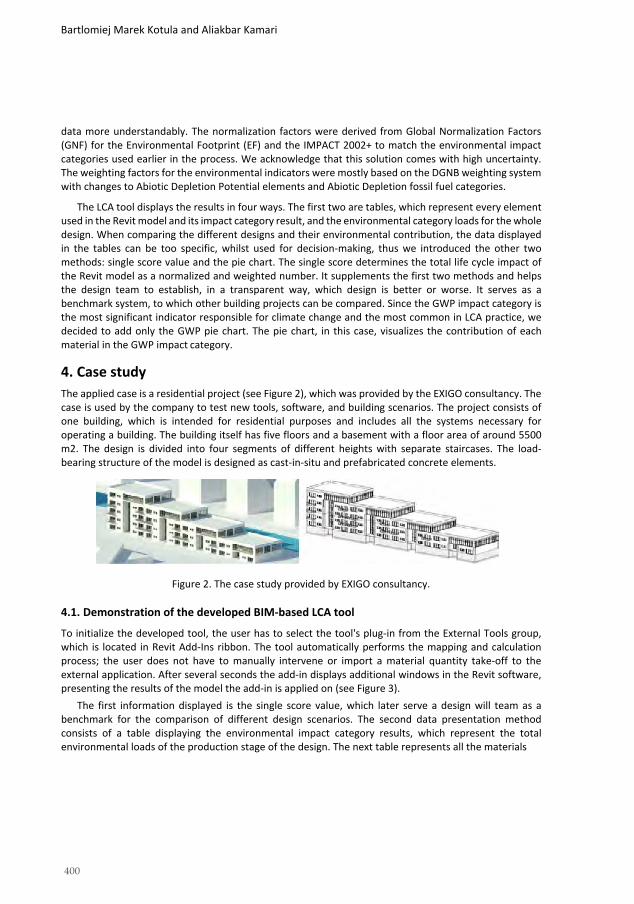
400
Bartlomiej Marek Kotula and Aliakbar Kamari
data more understandably. The normalization factors were derived from Global Normalization Factors (GNF) for the Environmental Footprint (EF) and the IMPACT 2002+ to match the environmental impact categories used earlier in the process. We acknowledge that this solution comes with high uncertainty. The weighting factors for the environmental indicators were mostly based on the DGNB weighting system with changes to Abiotic Depletion Potential elements and Abiotic Depletion fossil fuel categories.
The LCA tool displays the results in four ways. The first two are tables, which represent every element used in the Revit model and its impact category result, and the environmental category loads for the whole design. When comparing the different designs and their environmental contribution, the data displayed in the tables can be too specific, whilst used for decision-making, thus we introduced the other two methods: single score value and the pie chart. The single score determines the total life cycle impact of the Revit model as a normalized and weighted number. It supplements the first two methods and helps the design team to establish, in a transparent way, which design is better or worse. It serves as a benchmark system, to which other building projects can be compared. Since the GWP impact category is the most significant indicator responsible for climate change and the most common in LCA practice, we decided to add only the GWP pie chart. The pie chart, in this case, visualizes the contribution of each material in the GWP impact category.
4. Case studyThe applied case is a residential project (see Figure 2), which was provided by the EXIGO consultancy. The case is used by the company to test new tools, software, and building scenarios. The project consists of one building, which is intended for residential purposes and includes all the systems necessary for operating a building. The building itself has five floors and a basement with a floor area of around 5500 m2. The design is divided into four segments of different heights with separate staircases. The load- bearing structure of the model is designed as cast-in-situ and prefabricated concrete elements.
Figure 2. The case study provided by EXIGO consultancy.
4.1. Demonstration of the developed BIM-based LCA tool
To initialize the developed tool, the user has to select the tool's plug-in from the External Tools group, which is located in Revit Add-Ins ribbon. The tool automatically performs the mapping and calculation process; the user does not have to manually intervene or import a material quantity take-off to the external application. After several seconds the add-in displays additional windows in the Revit software, presenting the results of the model the add-in is applied on (see Figure 3).
The first information displayed is the single score value, which later serve a design will team as a benchmark for the comparison of different design scenarios. The second data presentation method consists of a table displaying the environmental impact category results, which represent the total environmental loads of the production stage of the design. The next table represents all the materials

401
Development of a BIM-based LCA Tool to Support Sustainable Building Design during the Early Design Stage
used in the project and their environmental loads. The last data presentation form that presents the results of the developed tool is the pie chart of the Global Warming Potential of the material's composition. Due to the high number of materials used in the case study, the pie chart shows only the labels of the materials with the highest contribution with respect to the whole design. This was achieved by inserting additional conditions regarding the presentation of the data, and thus the boundary of 5% was implemented.
Figure 3. Embodied environmental impact results generated by the plug-in.
It means that all the materials with a contribution lower than 5% do not have their own label in the chart. Moreover, it is observed that the wooden materials have a negative GWP result. The reason for this is that timber is the only material that has the lowest embodied energy level, absorbs CO2, and produces oxygen during its growth. Thus, even though the processing emits some amounts of CO2, the benefit of timber to store CO2 outperforms its production several times, creating the negative value of GWP. This, in conclusion, is beneficial for the overall GWP result of the design. Although the timber has

402
Bartlomiej Marek Kotula and Aliakbar Kamari
a positive influence on the design, it creates the trivial problem of representing its value in the pie chart. The negative values cannot be shown in the pie charts, which means that those values have to either be omitted in the data representation or have to be included in the pie chart as the absolute values. Hence, we have decided to exclude them from the pie chart.
4.2. Discussion
The results of the implementation of the BIM-based LCA tool on the case study are presented inside the Revit software as an additional window. The fully automatic process delivers a reliable solution to enhance early design stage design by delivering the most valuable data identifying design hot-spots of an existing Revit model. The automatic mapping of the model elements with the material database together with the estimation of the environmental impacts take significantly less time in comparison to other existing software and does not require any input from the end-user.
As it was expected, the concrete based materials are responsible for 1.37E+06 kg of CO2e, which is equal to 83% of the total embodied environmental load of the design. The concrete-based materials are followed by the metal and aluminum profiles used in the suspended gypsum ceiling, GWB walls, and railings, which together are responsible for the design contribution of 7% (1.10E+05 kg of CO2e). Furthermore, the production of the insulation and glass materials would emit 8.01E+04 kg of CO2e and subsequently 5.15E+04, which together accounts for 8% of the total global warming potential. What is worth to mention that the application of the wooden elements in floors, windows, and doors can reduce the global warming potential of the model by 7% (1.12E+05 kg of CO2e).
When it comes to the automatization and LCA assessment during the early design stage, the developed tool proves to be significantly faster than the similar LCA tools on the market and does not require any additional input from the user. Besides, the developed tool, despite its simplicity and its speed, delivers almost identical results to other available software as the process of the material take- off and the calculation process is the same. Furthermore, the developed LCA tool is free of charges, thus students, researchers as well as small and medium architectural, engineering companies do not have to stretch their budget to identify hot-spots in the conceptual BIM model.
5. Conclusion and future studyThe study demonstrated that there is a large opportunity to utilize BIM to perform LCA. By combining those two methods and introducing them as a robust tool during the early design stage, the design team has a safety margin for defining the shape of the design – at this stage, possibilities to influence the design outcome are the best, while their costs are the lowest. Furthermore, the study showed that even with the low detail level of BIM, there is a possibility to perform LCA accurately enough to identify the design hot-spots.
The difficulties regarding the building life cycle in the current LCA practices can be easily omitted by introducing the tool focusing only on the embodied environmental impacts of the building materials. Moreover, by emphasizing the material-level LCA and the fact that the major embodied environmental impact corresponds to the building's structure, it can be assumed that materials have the same life- service length as the building. It does not only eliminate inconsistencies throughout the design but also, as other studies indicated, it reduces the chance of delivering under-reported results.
Furthermore, by developing the LCA tool in the BIM environment, the problem regarding interoperability between the LCA and BIM is completely resolved. Because of that, there is no more

403
Development of a BIM-based LCA Tool to Support Sustainable Building Design during the Early Design Stage
need for manual calculation of material quantities; however, there is still room for improvement regarding the information which is obtained through the BIM model (material properties, e.g. U-value, density, weight, and environmental impacts).
The case study shows that the tool facilitates decision-making in an integrated design process. Moreover, it provides a reliable solution for a quick-assessment of the early-stage model, which excludes the manual input of the end-user. By that, the tool facilities the comparison process but also reduces the time-consumption of the whole LCA process. Furthermore, in comparison to other existing software, the automatic mapping within the Revit platform does not require any manual input from the user; it thus takes significantly less time to obtain the results and increases the chance that environmental impacts are being considered during the design stage, as there is no additional work. Last but not least, the idea behind the development of the BIM-based LCA tool is to be used by everyone free of charges, so it can serve as an educational tool applied in University projects, consultancy companies, or in the architectural offices to support the design for the environment and educate people about the importance of material selection in the design process.
The tool still needs additional verification and improvement regarding the linking of the materials and the visualization of the results. However, the developed tool, as proved in the case study, serves as a reliable substitute for expensive LCA tools on the market. Moreover, due to its simplicity, the end-user to perform the embodied environmental impact assessment does not have to possess any knowledge about the LCA methods. Furthermore, the whole procedure of calculation of the embodied environmental loads takes significantly less time in comparison to other LCA software. This feature confirms that the developed BIM-based LCA tool can play a major supportive role in decision making during the early design stage of the project.
As concluded in the present paper, the BIM-based LCA tool seems to have a significant impact on decision making within the early design stage. However, there are still limitations regarding the functionality of the tool and the interoperability between LCA and BIM as follows:
Firstly, the proposed tool requires additional work in defining the model elements included in the assessment. So far, the results are displayed for each material, thus it would be more beneficial to implement element-based LCA to help designers identify where the material with the highest contribution to the environment is located in the model. Moreover, as was noticed in the case study, every material is accounted for as a new position. Hence, the solution to this is to improve the tool to identify the repetitive material and sum up its results. Regarding the data presentation, it would be profitable to include more data presentation forms, e.g. bar charts, bubble charts, etc. It would enhance the comparability of the results and improve the visual aspect of the final report.
Secondly, there is a need to create a function that would automatically export results to a Word file or Excel spreadsheet. By now, there is no such possibility, thus the user needs to take a screenshot of the results using an external snipping tool.
Last, in order to improve the mapping of the Revit materials with the Excel database, the AI could be introduced. It would increase the reliability of the linked materials, and the software by itself would learn which materials, based on the composition of the structure, should be included in the assessment.
References Antón, L. Á. and Díaz, J. (2014) Integration of LCA in a BIM Environment, Procedia Engineering, 85, 26-32.

404
Bartlomiej Marek Kotula and Aliakbar Kamari
Azhar, S., Carlton, W. A., Olsen, D. and Ahmad, I. (2011) Building information modeling for sustainable design and LEED® rating analysis, Automation in Construction, 20(2), 217-224.
Basbagill, J., Flager, F., Lepech, M. and Fischer, M. (2013) Application of life-cycle assessment to early stage building design for reduced embodied environmental impacts, Building and Environment, 60, 81-92.
British Standards Institution and European Committee for Standardization (2012) Sustainability of Construction Works: Assessment of Environmental Performance of Buildings : Calculation method.
British Standards Institution and European Committee for Standardization (2014) Sustainability of Construction Works: Environmental Product Declarations : Core Rules for the Product Category of Construction Products., ed.
Bueno, C., Pereira, L. M. and Fabricio, M. M. (2018) Life cycle assessment and environmental-based choices at the early design stages: an application using building information modelling, Architectural Engineering and Design Management, 14(5), 332-346.
Chong, H.-Y., Lee, C.-Y. and Wang, X. (2017) A mixed review of the adoption of Building Information Modelling (BIM) for sustainability, Journal of Cleaner Production, 142, 4114-4126.
EebGuide (2019) Operational Guidance for Life Cycle Assessment Studies of the Energy Efficient Buildings Initiative. Edenhofer, O., Pichs-Madruga, …, von Stechov, C. and Zwickel, T. (2014) Climate change 2014: mitigation of climate
change: Intergovernmental Panel on Climate Change, ed., Cambridge University Press, New York, NY. Fufa, S. M., Skaar, C., Gradeci, K. and Labonnote, N. (2018) Assessment of greenhouse gas emissions of ventilated
timber wall constructions based on parametric LCA, Journal of Cleaner Production, 197, 34-46. Häkkinen, T. and Kiviniemi, A. (2008) Sustainable building and BIM. In SB08 Conference Melbourne, 21-25. Häkkinen, T., Kuittinen, M., Ruuska, A. and Jung, N. (2015) Reducing embodied carbon during the design process of
buildings, Journal of Building Engineering, 4, 1-13. Hollberg, A. and Ruth, J. (2016) LCA in architectural design—a parametric approach, The International Journal of Life
Cycle Assessment, 21(7), 943-960. Hollberg, A., Tschetwertak, J., Schneider, S. and Habert, G. (2018) Design-Integrated LCA Using Early BIM, in,
Designing Sustainable Technologies, Products and Policies, 269-279. International Organization for Standardization (2006) International standard ISO 14044:2006 environmental
management – life cycle assessment – requirements and guidelines, ed., ISO Geneva. Kamari, A., Jensen, S., Christensen, M.L., Petersen, S. and Kirkegaard, P.H. (2018a) A Hybrid Decision Support System
(DSS) for Generation of Holistic Renovation Scenarios—Case of Energy Consumption, Investment Cost, and Thermal Indoor Comfort. Sustainability, 10(4), 1255-78.
Kamari, A., Laustsen, C., Petersen, S., and Kirkegaard, P.H. (2018b) A BIM-based decision support system for the evaluation of holistic renovation scenarios. Journal of Information Technology in Construction, 23, 354-380.
Kamari, A., Schultz, C. and Kirkegaard, P.H. (2018c) NovaDM - Towards a formal, unified Renovation Domain Model for the generation of holistic renovation scenarios. In ECPPM 2018 (European Conference on Product & Process Modelling) conference, Copenhagen, DK.
Kamari, A., Kirkegaard, P.H. and Schultz, C. (2020) PARADIS - A process integrating tool for rapid generation and evaluation of holistic renovation scenarios. Journal of Building Engineering. DOI: 10.1016/j.jobe.2020.101944
Marsh, R. (2017) Building lifespan: effect on the environmental impact of building components in a Danish perspective, Architectural Engineering and Design Management, 13(2), 80-100.
Meex, E., Hollberg, A., Knapen, E., and Verbeeck, G. (2018) Requirements for applying LCA-based environmental impact assessment tools in the early stages of building design, Building and Environment, 133, 228-236.
Najjar, M., Figueiredo, K., Palumbo, M. and Haddad, A. (2017) Integration of BIM and LCA: Evaluating the environmental impacts of building materials at an early stage of designing a typical office building, Journal of Building Engineering, 14, 115-126.
Peng, C. (2016) Calculation of a building's life cycle carbon emissions based on Ecotect and building information modeling, Journal of Cleaner Production, 112, 453-465.
Röck, M., Hollberg, A., Habert, G. and Passer, A. (2018) LCA and BIM: Visualization of environmental potentials in building construction at early design stages, Building and Environment, 140, 153-161.
Soust-Verdaguer, B., Llatas, C. and García-Martínez, A. (2017) Critical review of bim-based LCA method to buildings, Energy and Buildings, 136, 110-120.

405
The 54th International Conference of the Architectural Science Association (ANZAScA) 2020
Development of a virtual construction approach for steel structures considering structural and non- structural elements, and installation equipment
Thai Phan1, Shahab Ramhormozian2, Charles Clifton3, Gregory MacRae4, Rajesh Dhakal5, Liang-Jiu Jia6, and Stefan Marks7
1,2,7Auckland University of Technology, Auckland, New Zealand [email protected], [email protected], [email protected]
3University of Auckland, Auckland, New Zealand [email protected]
4,5University of Canterbury, Christchurch, New Zealand {gregory.macrae4, rajesh.dhakal5}@canterbury.ac.nz
6Tongji University, Shanghai, China [email protected]
Abstract: The planning phase of a construction project has a crucial effect on different aspects of the project outcome. There are various software programs developed and widely used to help with construction planning, however many construction projects still grow over limits, as the reality is still much more complicated than any model. Hence, more sophisticated software and methods need to be developed in order to minimize the gap between modelling and the reality. Visualization of construction processes using building-information-models (BIM) is a new trend in construction planning. This research aims to investigate previous works on visualization of construction processes using information technology, analyse various techniques and tool sets, and choose a method to apply to the steel structures construction, considering structural and non-structural elements as well as installation equipment. The specific case study is a three-storey steel structure with a height of 4m per storey proposed via the ROBUST (Robust Building Systems) project, which is a joint NZ-China research with the intention of improving buildings’ seismic resiliency. The building will be built and tested on a shaking table at the International joint research Laboratory of Earthquake Engineering (ILEE) located in China.
Keywords: virtual construction; steel structures; construction element; game engine
1. IntroductionThe planning phase of a construction project has a crucial effect on different aspects of project outcome, such as quality, efficiency, environment, cost and safety, and guarantees the time frame of the project to be achieved (Olawale and Sun, 2010). In order to reach a specific result, the project’s planners are required to have a deep understanding of each phase of the construction project. Moreover, according to Olawale and Sun (2010), in order to support project planners, various software programs
Development of a virtual construction approach for steel structures considering structural and non- structural elements, and installation equipment. 54th International Conference of the Architectural Science Association 2020, Thai Phan, et al (eds), pp. 405–414. © 2020 and published by the Architectural Science Association (ANZAScA).

406
Thai Phan, Shahab Ramhormozian, Charles Clifton, Gregory MacRae, Rajesh Dhakal, Liang-Jiu Jia, and Stefan Marks
have been developed and used widely, but a great quantity of construction projects still grow over limits in terms of costs and time. Nevertheless, these software programs are still helping engineers and managers around the globe with their technical tasks.
However, reality is much more complicated than any models, regardless of how advanced they are. As a result, more sophisticated software and methods need to be developed in order to minimize the gap between modelling and the real world. One aspect of this software functionality is visualization, which is getting more and more credibility among construction specialists (Rohani et al., 2014).
Visualization using computer software has many applications in construction industry, especially for construction planning, progress monitoring, safety monitoring, etc. A statistical research conducted by Wang et al. (2020) has shown that construction planning is one of the most popular applications of visual computing in construction industry. This research also revealed that visualization in construction planning focuses on animating construction processes and operations in a 3D environment. Other applications of visualization in this category include simulation of crane erection processes, crane operation, and work area analysis.
Construction process visualization has many advantages in all stages of a construction life cycle. One type of such visualizations, 4D CAD, has been found to be helpful from planning stage to construction stage and process monitoring stage by different projects’ stakeholders (Rohani et al., 2014). For example, 4D CAD helps project personnel detecting any logical errors in their design and building sequence. Furthermore, construction process visualization also helps with the identification of construction site risks and safety training. Park and Kim (2013) developed a framework for safety management of construction sites by utilizing construction visualization at its core. Bosché et al. (2016) advanced further with their proposal of a virtual-reality system for construction training that combined an immersive 3D visualization of the construction site with a stereoscopic head-mounted display (HMD) that allowed full 6 degree-of-freedom movement.
This research aims to propose an approach including software and methodology for visualization of construction processes. Therefore, this research will investigate previous studies on construction visualization, current available software for that purpose, and suggest further research directions.
The case study for the proposed approach is the ROBUST steel structure. The ROBUST (Robust Building Systems) project is a joint NZ-China research with the intention of improving buildings’ seismic resilience by verifying several design ideas of structural and non-structural aspects (Dhakal et al., 2019). A three-storey steel structure with a height of 4m per storey is proposed and will be built and tested on a shaking table at the International joint research Laboratory of Earthquake Engineering (ILEE) located in China (Dhakal et al., 2019; Yan et al., 2019). Various structural and non-structural systems will be respectively constructed and tested. However, at the time of this report, these construction processes were not visualized. A visualization of these processes could help researchers analyse temporal and spatial constraints of the construction more effectively, as well as avoiding any logical errors in assembling sequence and identifying risks more efficiently.
In the following sections, a literature review is presented, several approaches are rationalized and framework and plan for developing a systematic approach to virtual construction is designed.
2. Literature reviewThe reviewed literature below was found by using keywords: “4D”, “construction”, “virtual”, “BIM”, “visualisation”, “planning”, and limiting the result to researches within the last 20 years. The results

407
Development of a virtual construction approach for steel structures considering structural and non- structural elements, and installation equipment
showed that several previous studies, using a multitude of different methodologies, have shown the potential and the feasibility of virtual construction. In general, each methodology involves a combination of components: a 3D CAD software program for construction modelling, a scheduler for project planning and a visualizer for animating the construction process. Furthermore, these components can be separate pieces of software or different functions within the same software program.
A number of researchers use readily available software components. For example, Bonsang Koo and Fischer (2000) used AutoCAD, PlantSpace Simulator and Primavera’s P3 scheduling software while Al- Hussein et al. (2006) and Han et al. (2012) used 3D Max Studio to create animation key-frames and MaxScripts to program the user interface and 3D animation. In addition to that, many software companies released new specialised applications for virtual construction and some researchers have utilized these applications in a case study. For instance, Huang et al. (2007) used Dassault System’s CATIA/DELMIA and Dong et al. (2019) used Autodesk Revit’s Fuzor. However, these software programs’ retail prices are considerably high, especially for small businesses and academic studies. Moreover, their approaches still have some disadvantages: no equipment was considered (Bonsang Koo and Fischer, 2000), tedious and error-prone data input process (Huang et al., 2007), no collision detections (Al- Hussein et al., 2006; Han et al., 2012), non-interacting animation (Dong et al., 2019).
A different approach in terms of the use of software for visualization and animation was proposed by Kamat and Martinez (2004). Contrary to aforementioned approaches, they have programmed from scratch a software program called VITASCOPE. This software reads a library of 3D models and a scripting file manually derived from a simulation model, and then creates a visualization of 3D construction objects and an animation of the construction process. The advantages of this approach are processing speed and extensibility because VITASCOPE was custom-built using C/C++ language. However, it is complicated because they have to program the rendering, lighting of the visualization component. Even so, it still lacks some features such as physics simulation, especially collision detection. Besides, the lack of VITASCOPE’s source code and documentation makes it harder to follow this approach.
An attempt to reconcile the requirements of flexibility and extensibility with the complexity of software programming could be achieved by using a game engine. A game engine is a software framework that provides developers with commonly used functionalities such as rendering and animation, physical simulation, as well as artificial-intelligence of in-game objects (Charrieras and Ivanova, 2016). Various studies chose this approach because it is simpler than programming from scratch and still inherits a certain degree of freedom and flexibility of programming. For example, Li et al. (2015) used the 3DVIA Virtool game engine, Bille et al. (2014) used the Unity3D game engine and Lin et al. (2018) used the Unreal Engine 4. This approach seems like a reasonable solution, especially when game engines have a considerable set of features and are either free to use for non-commercial projects like Unreal Engine (“Unreal EngineFrequently Asked Questions,” n.d.) or free and open-source like the Godot engine (“Godot Engine - License,” n.d.).
3. Research methodologyThe previously reviewed literature has shown the potential of visual computing, especially by using a game engine, for better construction planning. However, each of those studies still has some limitations. The expected features of the new proposed approach are:

408
Thai Phan, Shahab Ramhormozian, Charles Clifton, Gregory MacRae, Rajesh Dhakal, Liang-Jiu Jia, and Stefan Marks
• Modelling of structural elements (steel beams, columns, joints, etc.) and non-structural elements(ceilings, walls, fire sprinkler piping systems, etc.).
• Able to model construction equipment (stationary or non-stationary). • Using project planning to assign time duration for each construction operation. • Including collision detection between moving equipment and other objects. • Allowing users to interactively change the viewing angle or explore the virtual construction while
the animation is progressing. • Allowing users to control the animation speed, e.g., for inspecting a certain moment in the
construction process in more detail.
3.1. The basic workflow
The 3D CAD models of construction details (structural or non-structural) as well as 3D models of construction elements and the construction site are acquired either by directly modelling or converting from other formats. Similarly, the project plan is also created with details for specific parts of construction, required equipment and time duration. This plan is either created from a third-party software such as Microsoft Project and exported as XML format or created directly in a specialised software program for virtual construction, such as DELMIA (Huang et al., 2007). The next phase is to continuously create the visualization of construction activities according to the plan and check for any collisions either manually and visually, or automatically by a specialised software program (in the case of Fuzor (Dong et al., 2019); or 3DVIA Virtools (Li et al., 2015)). When logical errors and collisions are avoided, the final animation can be exported into a digital format and displayed for project stakeholders. In the case of using a game engine, instead of a digital video, the animation is a 3D interactive program with dynamic viewpoints. The approaches previously reviewed are only different in how the authors had either combined some steps into one (Fuzor (Dong et al., 2019); DELMIA (Huang et al., 2007)), or added some steps after planning and 3D models acquiring (Al-Hussein et al., 2006; Kamat and Martinez, 2004), or run a separated simulation tools to export result to an ASCII file, which will later provide information for the visualization phase.
For this specific project, the authors’ plans for each phase are as followed:
• Designing of the construction / 3D CAD models: in this case, consulting the ROBUST project forthe design and 3D CAD models of the steel structure, including both structural and non- structural elements. If the 3D CAD file format is not compatible for the visualization stage, a conversion willhave to be done, either automatically via a software program or manually. The latter is very time-consuming, hence is not the preferred practical and ideal option.
• Project planning / construction processes: how the steel-structure should be assembled / built, its building site specification, its construction equipment, etc. The construction planning will beobtained from the ROBUST project or at least consulted with them and carried out in MicrosoftProject or ProjectLibre (an open-source alternative to Microsoft Project).
• Visualization: using the construction 3D models and construction planning, a software programcan be used to import the 3D models and create a visualization / animation of the building process. Depending on the availability of software capabilities and / or time constraint of this project, anautomation module could also be developed to automate the process of reading constructionplanning and generating an animated visualization. The automation module can be written inPython. Python is an interpreted scripting language and is accepted in the growing scientific community (Rashed and Ahsan, 2018). Although Python has a disadvantage in code

409
Development of a virtual construction approach for steel structures considering structural and non- structural elements, and installation equipment
execution speed compared to a compiled programming language like C/C++, it is easier and faster to develop. In academic environment, development time is usually more important than code execution time (Rashed and Ahsan, 2018).
• Verification and modification: the visualization can then be analysed for further improvements.Similar to previous phases, the verification for collision detection and logical errors can beautomatic or manual.
3.2. The choice of software
3.2.1. Option 1: Commercial software
Autodesk Revit, Autodesk Inventor can be used to create 3D CAD models and Fuzor or Autodesk 3D Studio Max for visualization. Alternatively, other commercial software like DELMIA or Tekla Structure is capable of modelling 3D structures and visualizing construction processes. Additionally, these commercial software programs are usually well documented and supported, so learning to use one could be comparatively easier than other methods. However, they do not have functions for visualizing construction equipment. Furthermore, the disadvantages are the lack of freedom in features such as no interaction of viewer while animation is running. These commercial software bundles are also expensive, which would be a significant disadvantage for academic purposes or small companies.
3.2.2. Option 2: In-house programming software
One example of this option is the VITASCOPE software, created by Kamat and Martinez (2004). A specialised software program created for visualization of construction process obviously could fulfil all requirements. However, software at this level of complexity requires developing time and multi- discipline engineers/programmers. It is also a time-consuming and costly process to develop a complicated standalone software program that could satisfy the requirements. For the scope of this research, a different approach which can utilize existing software and libraries might be preferred.
3.2.3. Option 3: Using existing software components and create a working workflow
3D CAD models can be imported into a software program specialised for animation such as 3D Studio Max or open-source alternative like Blender. A game engine like Unity3D engine or other open-source engine can be used to simulate the virtual environment and how 3D models interact with each other physically. Blender version 2.79 and under even has its own game engine (“Blender Game Engine,” 2020). By using a game engine, we can utilize their visual engine and physics engine to simulate the 3D environment as well as how objects physically interact with gravity and each other. In a game engine, collision between objects are easily detected and simulated.
We propose to use option 3 with open source software because of its flexibility and its potential for future development without depending on any third party proprietary software.
3.3. Open source software
Since its inception in 1976, the idea of sharing source code and has become more and more popular, and for good reasons. A survey of 1300 IT professionals has shown that the use of open source software has increased significantly from 42% in 2010 to 78% in 2015 (Anthes, 2016). Many open source software

410
Thai Phan, Shahab Ramhormozian, Charles Clifton, Gregory MacRae, Rajesh Dhakal, Liang-Jiu Jia, and Stefan Marks
programs have replaced proprietary software to become a standard in an industry. Furthermore, open source software programs are usually more flexible than their proprietary counterpart (Ovadia, 2014). For example, Blender is an excellent open-source 3D modelling and animation software program with a sophisticated physics engine. Blender also has a dedicated game engine that could flexibly simulate construction equipment.
More specifically, this project uses software as described in t Engine documentation,” n.d.). Table 1. The main software component is Godot. Godot is a free and open source game engine that
can run on multiple platforms: Windows, Linux, macOS (“Godot Engine - Features,” n.d.). Compared with proprietary game engines such as Unity or Unreal Engine, Godot is smaller and does not require an installation. Although Godot may lack behind Unity or Unreal Engine in term of 3D environment development, Godot is easier to learn and does not consume as much hardware resources (“Unity vs Godot - 2019 Complete Game Engine Comparison,” 2020). Godot is also flexible in term of scripting language. It supports direct programming in compiled language like C++ as well as interpreted language like C#. It even has its own Gdscript, a powerful interpreting language similar to Python (“Godot Engine - Features,” n.d.). Furthermore, Godot has a great community and comprehensive documentation (“Godot Engine documentation,” n.d.).
Table 1: Software choices
Software Description Purpose
ProjectLibre Project management software Creating project plan for construction processes. FreeCAD v0.18 Parametric 3D CAD designer for
mechanical or architecture and civil design.
Blender 2.82 3D computer graphics software used for creating animation and 3D mesh models.
Converting 3D CAD models obtained from the ROBUST project if required.
Creating other model for environment. Creating animation frames.
Godot 3.2.2 2D/3D game engine Creating virtual environment with physics simulation.
3.4. Detailed workflow
3D models of construction elements and construction surrounding and equipment are converted by FreeCAD or directly modelled by using Blender into mesh models supported by Godot. Project plan is created by ProjectLibre and might need to be exported to XML format for automatic integration. The main phase of this workflow is the visualization process where Godot is used to simulate animation of equipment’s movement, verify and adjust accordingly.
3.4.1. Object files format
A workflow has been established to convert 3D CAD objects designed in Autodesk Inventor by the ROBUST project to a 3D mesh format that can be imported into Godot. Firstly, from the 3D assembly file of the construction, each component’s 3D CAD information can be selected and exported into DXF format. Consequently, FreeCAD is used to read the DXF file and export it into OBJ format for Blender. This process is to convert models from 3D parametric information into 3D mesh information requires by Godot.
A complete scene in Blender, including lighting, material and animation, can be imported into Godot by using the following 3D scene file formats: Collada, Wavefront OBJ, FBX and glTF 2.0 (both text and

411
Development of a virtual construction approach for steel structures considering structural and non- structural elements, and installation equipment
binary formats) (Importing 3D Scenes, n.d.). The authors found that for the same 3D scenes, the glTF 2.0 binary format achieved the smallest file sizes and the importing processes were much faster. Alternatively, physics bodies can be manually created in Godot then assigned their mesh instances with 3D mesh files imported from Blender in Wavefront OBJ format. However, an unresolved bug in Blender 2.8 caused OBJ file imported with wrong scaling factors (OBJ Export Has Wrong Scaling Factor, n.d.). After some experiments, the authors found a temporary fix by manually entering the scaling factor for all axes.
Figure 1: Detailed workflow
3.4.2. Godot game engine
This section will shortly explain some technical terms used by the Godot game engine: nodes, scenes, scripts as well as several components required for a basic 3D game – a virtual environment.
A node is a basic building block of a game and can be assigned a function (Scenes and Nodes, n.d.). Nodes can have other nodes as children and together, they create a Godot scene. A scene is a group of nodes organized hierarchically to perform a special purpose. A scene can also be a child of another scene.
The Godot game engine offers two ways of creating reusable gaming objects: by using scripts and scenes (Applying Object-Oriented Principles in Godot, n.d.). Scripts are codes attached to a node that could improve or specified its function. Godot supports Gdscript, a Python like scripting language, and C#. As such, the design of Godot game engine can be thought as object-oriented programming, a popular software principle that helps to create software faster and more maintainable (Applying Object- Oriented Principles in Godot, n.d.).
For building a 3D game, the Godot engine supports various types of node but only basic nodes such as Camera nodes, CollisionObject nodes, Joint nodes, MeshInstance and CollisionShape will be discussed. Camera nodes are self-explanatory as they only provide a viewpoint for users while the game is playing.
The most important CollisionObject nodes are PhysicsBody nodes because they represent physics objects. There are 3 types of PhysicsBody in Godot; each was treated differently in term of physics simulation: StaticBodies, RigidBodies and KinematicBodies. Firstly, StaticBodies cannot be moved and

412
Thai Phan, Shahab Ramhormozian, Charles Clifton, Gregory MacRae, Rajesh Dhakal, Liang-Jiu Jia, and Stefan Marks
will not be affected by normal physics like gravity but can interact with other bodies when collided. Secondly, RigidBodies’ movements are calculated by the physics engine and should only be controlled by applying forces or impulses on them. Thirdly, KinematicBodies are not affected by the physics engine and must be controlled by user’s code, e.g., through animations.
Each type of the PhysicsBody nodes can be set to detect collision with other bodies and allow user’s code to react to collision signals. Each PhysicsBody node needs to have a MeshInstance node for visual purpose and a CollisionShape node for physics simulation. MeshInstance nodes contain geometric information such as vertices, surfaces of the visual objects while CollisionShape nodes contain geometric information of the collision boundaries. Ideally, this information should be identical (as in real life), however, collision detection requires intensive resources' performance so game developers usually keep collision shape as simple as possible without affecting user’s experience.
4. Current result
4.1. Construction elements
For a specific construction model, the number of construction elements needed to be modelled by the game engine depends on the required level of details. However, some elements could have standard shapes and sizes, such as mechanical fasteners (nuts and bolts, screws, pins and rivets...). These elements can be created once and reuse multiple times, while more specific elements must be created every time. For an element such as a steel frame, its mesh model was imported into Godot as a MeshIntance for a RigidBody. Next, a simple CollisionShape was created and assigned mass then saved as a scene.
Figure 1: Construction element and equipment
4.2. Construction equipment
Construction equipment is relatively standardized in reality. As a consequence, a library of ready-to-use Godot scenes for construction equipment can be created. A crane could be a perfect example of construction equipment.
Firstly, a set of simplified mesh models of crane’s components (cabin, telescopic boom, hook block...) was created in Blender and a corresponding set of physics bodies was also created in Godot. Each physic body in Godot was then assigned a matching mesh model. Several Joint nodes were attached properly for the crane (SlideJoints for the telescopic boom, 6DOFJoints for the crane cabin, wheels, etc.).

413
Development of a virtual construction approach for steel structures considering structural and non- structural elements, and installation equipment
Subsequently, scripts are programmed for each PhysicsBody of the crane so user can control its movement as well as camera’s movement. The physics characteristics of each PhysicsBody such as mass, weight, gravity scale, friction scale, etc. can be adjusted at this stage to attain the best physics simulation of the model. The crane can move back and forth, turn left and right, extend and retract its boom, turn the boom left and right. All movements were assigned a control key on a keyboard and were programmed in Gdscript.
5. ConclusionIn this research, several approaches for the visualization and simulation of the construction process have been reviewed and an approach that use open-source software tool set to create visualization of construction process of a steel structure has been proposed, taking into account all requirements and constraints such as: availability of equipment, building site constraints, etc. By using the proposed approach, the authors was able to create a 3D virtual environment with a physics simulation, including the collision detection of physics bodies. Several construction elements and a construction crane were created and simulated in this virtual environment, showing the potential of this proposed approach. Users can interactively navigate within this virtual 3D space and control the construction equipment to move construction elements. Physical contacts and collisions between objects were simulated correctly as expected.
Due to the limited time and resource, the authors has not fully created all construction elements (especially non-structural elements) and has only modelled and programmed one construction equipment. However, the authors believes that by applying the proposed approach, future research can continue to create various models of construction equipment. authors The resulting software project is published on Github (Phan, n.d.) and future researchers are invited to utilize this repository as a library for Godot’s construction equipment.
Additionally, future research can focus on miscellaneous functions such as reading text-based project plans automatically and more intuitive ways for users to assign construction elements and equipment to each operation on a project plan.
References Al-Hussein, M., Athar Niaz, M., Yu, H. and Kim, H. (2006) Integrating 3D visualization and simulation for tower crane
operations on construction sites, Automation in Construction, 15(5), 554-562. Anthes, G. (2016) Open source software no longer optional, Communications of the ACM, 59(8), 15–17. Bille, R., Smith, S., Maund, K. and Brewer, G. (2014) Extending Building Information Models into Game Engines, 1-8. Blender Game Engine (2020),Wikipedia. Bonsang, K. and Fischer, M. (2000) Feasibility Study of 4d Cad in Commercial Construction, Journal of Construction
Engineering & Management, 126(4), 251. Bosche, F., Abdel-Wahab, M., & Carozza, L. (2016). Towards a Mixed Reality System for Construction Trade Training.
JOURNAL OF COMPUTING IN CIVIL ENGINEERING, 30(2). https://doi.org/10.1061/(ASCE)CP.1943-5487.0000479 Frédéric, B., Mohamed, A.-W. and Ludovico, C. (2016) Towards a Mixed Reality System for Construction Trade
Training, Journal of Computing in Civil Engineering, 30(2), 04015016. Charrieras, D. and Ivanova, N. (2016) Emergence in video game production: Video game engines as technical
individuals, Social Science Information, 55(3), 337-356. Dhakal, R., Rashid, M., Bhatta, J., Sullivan, T., Macrae, G., Clifton, G., Jia, L. J. and Xiang, P. (2019) Shake Table Tests
of Multiple Non-Structural Elements in a Low -Damage Structural Steel Building.

414
Thai Phan, Shahab Ramhormozian, Charles Clifton, Gregory MacRae, Rajesh Dhakal, Liang-Jiu Jia, and Stefan Marks
Dong, C., Shaopeng, D., Ming, C. and Chenyue, S. (2019) The Simulation and Research of Steel-Work Construction Based on Fuzor, E3S Web of Conferences, 136, 03023.
Godot Engine - Features. Available from: <https://godotengine.org/features>. Godot Engine - License. Available from: <https://godotengine.org/license >. Godot Engine documentation. Available from: <https://docs.godotengine.org/en/stable/index.html >. Han, S. H., Al-Hussein, M., Al-Jibouri, S. and Yu, H. (2012) Automated post-simulation visualization of modular
building production assembly line, Automation in Construction, 21, 229-236. Huang, T., Kong, C. W., Guo, H. L., Baldwin, A. and Li, H. (2007) A virtual prototyping system for simulating
construction processes, Automation in Construction, 16(5), 576-585. Importing 3D scenes. (n.d.). Retrieved October 22, 2020, from
https://docs.godotengine.org/en/stable/getting_started/workflow/assets/importing_scenes.html Joint. (n.d.). Retrieved October 20, 2020, from
https://docs.godotengine.org/en/stable/classes/class_joint.html?highlight=joint#joint
Kamat, V. R. and Martinez, J. C. (2004) General-purpose 3D animation with VITASCOPE, Winter Simulation Conference, 1691–1697.
Li, H., Chan, G., Skitmore, M. and Huang, T. (2015) A 4D automatic simulation tool for construction resource planning: a case study, Engineering, Construction and Architectural Management, 22(5), 536-550.
Lin, Y.-C., Chen, Y.-P., Yien, H.-W., Huang, C.-Y. and Su, Y.-C. (2018) Integrated BIM, game engine and VR technologies for healthcare design: A case study in cancer hospital, Advanced Engineering Informatics, 36, 130- 145.
OBJ export has wrong scaling factor. (n.d.). Retrieved October 20, 2020, from https://developer.blender.org/T24959
Olawale, Y. A. and Sun, M. (2010) Cost and time control of construction projects: inhibiting factors and mitigating measures in practice, Construction Management and Economics, 28(5), 509-526.
Ovadia, S. (2014) Linux for Academics, Part II: The Advantages of Free and Open-Source Software, Behavioral & Social Sciences Librarian, 33(1), 47-51.
Park, C.-S. and Kim, H.-J. (2013) A framework for construction safety management and visualization system, Automation in Construction, 33, 95-103.
Phan. (n.d.). Thai_Phan_godot_PEPM_repository. GitHub. Retrieved October 20, 2020, from https://github.com/wonbinbk/godot_PEPM
Rashed, M. G. and Ahsan, R. (2018) Python in Computational Science: Applications and Possibilities, International Journal of Computer Applications, 46(20), 26-30.
Rohani, M., Fan, M. and Yu, C. (2014) Advanced visualization and simulation techniques for modern construction management, Indoor and Built Environment, 23(5), 665-674.
Scenes and nodes. (n.d.). Retrieved October 20, 2020, from https://docs.godotengine.org/en/stable/getting_started/step_by_step/scenes_and_nodes.html
Unity vs Godot - 2019 Complete Game Engine Comparison (2020),The Ultimate Resource for Video Game Design. Wang, H.-W., Hu, Z.-Z. and Lin, J.-R. (2020) Bibliometric review of visual computing in the construction industry,
Visual Computing for Industry, Biomedicine, and Art, 3(1), 1-15. Yan, Z., Bagheri, H., Clifton, G., Quenneville, P., Ramhormozian, S., Macrae, G., Dhakal, R., Zhao, X., Jia, L. J. and
Xiang, P. (2019) Shaking Table Test of a Near Full Scale Low Damage Structural Steel Building: Structural Aspects.

415
The 54th International Conference of the Architectural Science Association (ANZAScA) 2020
Disparity between reality and theoretical models - predicting moisture and mould growth in houses.
Sarah Buet1, and Dr Nigel Isaacs2
1, 2 Victoria University of Wellington, Wellington, New Zealand [email protected] [email protected]
Abstract: A common goal amongst building practitioners is to create warmer, healthier, and drier homes. A key barrier to this is the presence of excessive moisture, the leading cause of mould growth within buildings. New Zealand Building Code Clause E3 ‘Internal Moisture’ has been set out to control internal moisture within a house, however, there is currently no prescribed method which practitioners can use to demonstrate compliance. Tools such as ASHRAE Standard 160 ‘Criteria for Moisture Control Design Analysis in Buildings’ can be used to predict internal conditions; however, studies have shown that such tools rely upon a range of possibly inappropriate assumptions and may not give accurate results. Using yearlong records of the internal conditions (temperature and relative humidity) of a New Zealand house, discrepancies between measured data and the theoretical models were identified and explored. The paper reports on the research findings, documents the reasons for these differences and whether they can be resolved.
Keywords: Mould; Moisture; Assessment; “Prediction Models”.
1. IntroductionThe need for accurate criteria for moisture design in residential houses is longstanding, with numerous research efforts aiming to improve the accuracy of hygrothermal models. Whilst internal moisture and mould occur in residential homes internationally, this issue is also one which pertains particularly to New Zealand. The 2015 House Conditions Survey (HCS) conducted by the Building Research Association of New Zealand (BRANZ) identified that, of the assessed properties, 46% of owner-occupied houses and 54% of rental houses experience mould growth. (White & Jones, 2017). Whilst the HCS did not survey all New Zealand homes, the results suggest that the issue of mould growth is one that greatly impacts a significant number of New Zealanders.
A common method used by practitioners to assess mould risk is through the use of moisture analysis and analytical models such as ASHRAE Standard 160 (2016), coupled with understanding the likely behaviours of moisture in various wall systems. These models are often used in conjunction with computer-based simulation tools such as WUFI. Whilst these simulation tools are relatively advanced,
Imaginable Futures: Design Thinking, and the Scientific Method. 54th International Conference of the Architectural Science Association 2020, Ali Ghaffarianhoseini, et al (eds), pp. 415–424. © 2020 and published by the Architectural Science Association (ANZAScA).

416
Sarah Buet, and Dr Nigel Isaacs
they are prone to requiring considerable information and data inputs, leading to models such as ASHRAE Standard 160 being implemented beforehand as a means of reducing the amount of processed information. Additionally, whilst analytical mould prediction tools are becoming more sophisticated due to the rapid improvements in computer-based moisture analysis tools, minimal attention is generally paid to the advancements of appropriate inputs. These inputs are required in order to effectively run these computer-based moisture simulations and have often been found to be where discrepancies commonly occur; particularly when moisture analysis is being run at a design stage (TenWolde 2008).
2. BackgroundThe New Zealand Building Code (NZBC) is a performance-based code, stating how a building must perform rather than providing a prescriptive compliance method and the performance may be achieved through implementing an Acceptable Solution, Alternative Solutions, or a Verification Method. NZBC Clause E3 “Internal Moisture” emphasises mitigating moisture issues within a building. However, there is no recognised method by which practitioners can demonstrate that moisture problems will not occur (Ministry of Business, Innovation, and Employment, 2017). Many New Zealand residential buildings utilise external walling systems such as the one shown in Figure 1 and as a result of there being little evidence to show any systematic moisture issues resulting from this walling system, E3 compliance is often demonstrated through historic use (Overton, 2019).
Figure 1: Section through a typical New Zealand wall construction. (Source: Overton, 2019)

417
Disparity between reality and theoretical models - predicting moisture and mould growth in houses
A BRANZ research project (Overton 2019) set out to consider how hygrothermal modelling could be used in conjunction with the VTT Mould Index to permit practitioners to demonstrate Clause E3 compliance. The research found that a third of failed residential inspections can be attributed to moisture issues, including indoor moisture and rainwater penetration(s) into the building envelope. It also identified a gap in the information available on the indoor conditions within New Zealand houses.
Numerous different models can be used to assess mould risk within building components. These models are generally categorised into one of two model types: basic prediction parameters; or in-depth deterministic models. Despite these model types varying in terms of the required input parameters, both consider surface temperature and RH to be the minimum requirements for determining the potential for mould growth. Johansson et al. (2013) found that RH and exposure time are the most critical conditions for mould to grow. Although fungal growth can occur over a wide range of temperatures, with most fungi growing in the temperatures between 5°C and 35°C providing the moisture conditions are favourable.
When looking to assess whether a wall system is prone to condensation, dew point calculations such as the Glaser method and ASHRAE Standard 160 can be used to ascertain whether condensation might occur. Whilst these two methods vary slightly, they both look at the vapour pressure profiles and steady-state temperatures through a structure and determine whether the vapour pressure is likely to exceed the saturation vapour pressure at a particular point. If this occurs, condensation will occur and thus the structure may be deemed as unacceptable in terms of moisture issues (ASHRAE, 2010). In addition to vapour pressure profiles and steady-state temperatures, they both use assumed indoor and outdoor conditions. These are often under contention, and also vary between the two models.
Overton (2019) suggested that there is a need for an assessment method that relies less upon assumptions and correlates more with field experience. Through a series of experiments analysing various wall systems, discrepancies between the ASHRAE Standard 160:2009 model and the ASHRAE Standard 160:2016 model were addressed. It was established that under the two different assessment criteria different mould predictions would be attained. Overton (2019) began to identify these discrepancies as well as begin to look at how these differences could be used to establish a Verification Method for the performance requirements of NZBC Clause E3.
The research reported in this paper develops from Overton’s (2019) initial conclusions to further explore the theoretical models. By utilising measured data, an additional layer of analysis can be examined to identify any discrepancies between the in-situ internal conditions and the predicted internal conditions from the theoretical models.
3. MethodologyThis research examines the assumptions used in the ASHRAE Standard 160 model, comparing the calculated indoor condition inputs (following Tables 1 and 2) with measured data gathered by the BRANZ Pilot Housing Survey (PHS) which gathered data on indoor temperatures and relative humidity (RH) from a variety of homes (Jones 2018). This data has been made available for this research to explore this information gap and was explored through the use of models.
The PHS is the largest national housing assessment survey undertaken within New Zealand since the 1930s, collecting detailed data on the occupants and their houses in approximately 80 houses in various locations throughout New Zealand over a 12-month period. As well as surveying the basic amenities,

418
Sarah Buet, and Dr Nigel Isaacs
moisture management techniques, and health safety measures within each house, sensors were placed in various rooms (Jones 2018).
Six sensors were placed in each of the houses: one external; one in the roof space; one in the living room; and the remaining three in bedrooms. Each of the sensors recorded the temperature and RH at approximately 15-minute intervals for approximately a year. The data from the internal bedroom sensors was averaged over a 24-hour period for comparison with the indoor design relative humidity and temperature calculated by the ASHRAE Standard 160 model based on the external temperature data (shown in Figure 2 and Figure 3).
3.1. ASHRAE Standard 160
ASHRAE Standard 160 (2016) ‘Criteria for Moisture Control Design Analysis in Buildings’ was created with the aim of specifying performance-based criteria in order to predict, mitigate and/or reduced internal moisture within a buildings envelope as well as its components, systems, and materials. The revised 2016 version works on the premise of providing selection criteria of analytic procedures as well as relevant inputs (such as boundary conditions, material composition, and indoor conditions) and provides criteria for evaluation and general use of outputs. The analytic procedures and inputs are able to be used in accordance with computer-based moisture analysis tools such as WUFI.
Having identified in the literature review that moisture is the primary catalyst for mould growth within a building (Johansson, et al., 2013) the critical aspect of this standard considered in this paper is the selection of indoor conditions. There are three sections to this selection of indoor conditions: indoor design temperature; indoor design humidity; and design air pressure differentials and flows. Whilst both indoor design temperature and humidity are vital in understanding the potential for mould growth, ASHRAE Standard 160 (2016) states that an analysis of the impact of air pressure differentials and airflows is optional, so these have been excluded from this analysis. It is important to state that whilst ASHRAE Standard 160 provides default values (shown in Table 1 and Table 2) for the indoor conditions, if the measured conditions are available then it requires that these are used. This paper is setting a scenario in which the only known variable is the outdoor conditions and thus is using ASHRAE Standard 160 to determine the likely indoor conditions as a comparison with the measure conditions.
The purpose of this paper is to explore the appropriateness of ASHRAE Standard 160 within a New Zealand context if the expected indoor conditions are unknown. Therefore, utilising the data gathered from the PHS, in-situ RH and temperatures are compared to the indoor design temperature and indoor design RH calculated following ASHRAE Standard 160. The indoor design humidity is able to be determined by one of three methods; simplified method, intermediate method, or full parameter calculation; for this analysis the simplified method shall be investigated. Throughout this paper the ASHRAE Standard 160 indoor design temperature shall be referred to as indoor design temperature and the ASHRAE Standard 160 indoor design humidity simplified method, shall be referred to as indoor design RH.
If actual conditions are known it is recommended that they are used, however, ASHRAE (Table 1 and Table 2) are there to be used if the indoor conditions are not known. I am essentially creating a scenario that says that I don’t have the indoor conditions so would need to use ASHRAE and then I want to see how closely they reflect what would actually be happening in this situation.

419
Disparity between reality and theoretical models - predicting moisture and mould growth in houses
4. Analysis of data
4.1. Indoor design temperature
ASHRAE Standard 160 (2016) assumes that the indoor design temperature is directly related to the outdoor temperature and is specified as one of three values, dependant on the 24-hour running average of the outdoor temperature (shown in Table 1). This is particularly important for New Zealand as the NZBC has no minimum indoor temperature requirement, except for in old people’s homes and early childhood centres where a minimum 20°C is required (Department of Building and Housing, 2011). If the design or operation of a building does not specify the indoor operating temperature, or they have not been specified by a building code, then Table 1 gives the appropriate formula according to ASHRAE Standard 160.
Table 1: Indoor design temperature, ASHRAE Standard 160 Table 4.2. (Source: ASHRAE, 2016)
The equations shown above in Table 1 demonstrate that the indoor design temperature assumes that there is a minimum heating setpoint within a space of 21.1°C (70°F). This is based on the idea that if the 24-hour average outdoor temperature falls below 18.3°C (65°F) then the indoor temperature would fallbelow a comfortable temperature, requiring a minimum heating setpoint of 21.1°C. This results in anassumption that all spaces assessed with the indoor design temperature have some form of space heating to ensure this minimum temperature would be achieved regardless of the outdoor temperature.
4.2. Indoor design humidity
ASHRAE Standard 160 (2016) allows for the indoor design humidity to be determined through one of three methods, of which one will be assessed in this paper - the simplified method. Just as the indoor design temperature is given as if the building has a specified operating temperature, the same is true for the specified RH. However, if the RH has not been specified then one of the three methods is implemented. Similar to the indoor design temperature, the indoor design RH assumes that the indoor humidity relates to the outdoor temperature. The table shown below in Table 2 shows the simplified method formulae for indoor design RH.

420
Sarah Buet, and Dr Nigel Isaacs
Table 2: Indoor design RH, ASHRAE Standard 160 Table 4.3.1. (Source: ASHRAE, 2016)
4.3. Comparison of in-situ measurements and ASHRAE Standard 160 specifications
Utilising the measured indoor temperatures and RH from each of the sensors in the bedrooms and the outdoor temperature from the external sensor, the formula shown in Table 1 and Table 2 were implemented to develop the graphs shown below in Figure 2 and Figure 3.
Figure 2: Graph plotting the measured temperature (°C) of the three spaces against the indoor design temperature as specified by ASHRAE Standard 160.

421
Disparity between reality and theoretical models - predicting moisture and mould growth in houses.
Figure 3: Graph plotting the measured RH (%) of the three spaces against the indoor design humidity (simplified method) as specified by ASHRAE Standard 160.
4.4. Assessment of indoor design temperature
Figure 2 shows the the indoor design temperature prediction and the actual indoor temperatures. The three indoor room temperatures all follow the same daily profiles. However, when cooler outdoor temperatures are experienced the indoor design temperature calculation (Table 1) stipulates that the minimum indoor temperature is 21.1°C while the outdoor temperature is under 18.3°C. Applying this calculation to the collected data, this indoor minimum of 21.1°C is applied 78% of the time yet Figure 2 shows this is higher than the measured temperature for approximately six months. From 2nd March 2019 to 10th September 2019 the average measured outdoor temperature was below 18.3°C for 98% of the time, resulting the the indoor design temperature being on average 2.7°C higher than the measured temperature. During the winter months of June – August, this deviation from the predicted indoor design temperature increased up to 6.2°C.
In contrast to this when the outdoor temperature was between 18.3°C and 21.1°C the indoor design temperature calculation is more directly related to the outdoor temperature. In these instances, the formula adds 2.8°C to the 24-hour average outdoor temperature. As Figure 2 shows, this relationship follows more closely the indoor temperature. From 20th February 2019 to 1st March 2019, the 24-hour average outdoor temperature is between 18.3°C and 21.1°C and therefore 2.8°C is added to this which and resulted in an average difference between the measured results and the indoor design temperature predictions of 0.4 °C with a maximum deviation of 2.9°C.
In regard to indoor design temperature, the top two formulae in Table 1 are applicable; the first being the assumption that when the outdoor temperature drops below 18.3°C the indoor temperature would be no less than 21.1°C, and the second being that outdoor temperature between 18.3°C and

422
Sarah Buet, and Dr Nigel Isaacs
21.1°C result in indoor temperatures which are 2.8°C higher than outside. From these two formulae and the comparison shown in Figure 2, the fixed indoor temperature for outdoor temperatures below 18.3°C does not appear to be applicable to the heating regime found in this New Zealand house.
As shown in Table 1, the indoor design temperature makes an assumption as to whether the space is heated only, or heated and air conditioned, but the instance (common in New Zealand (Isaacs, et al. 2010)) in which a space is not conditioned is not considered. The house where this data was gathered from was not conditioned, so a minimum winter indoor temperature of 21.1°C was rarely achieved. This in turn raises the question of the suitability of the ASHRAE Standard 160 Table 1 indoor design temperature in a non-airconditioned or non-centrally heated building.
The critical issue with these discrepancies between the measured indoor temperature and the indoor design temperature comes when using these internal conditions to predict potential mould growth. The indoor design temperature formulae in Table 1 for external temperatures below 18.3°C indicates that the room should be on average 2.7°C warmer than it actually is. Two of the critical factors for mould growth are temperature and humidity with warmer conditions creating more favourable conditions for mould growth. As a result, the indoor design temperature formulae may result in false positives, suggesting mould where in fact it would not grow.
4.5. Assessment of indoor design humidity (simplified method)
Analogous to the indoor design temperature assuming there is some form of space conditioning when specifying indoor design temperature, when considering the indoor design RH there is no consideration of the possibility of a dehumidifying system. Whilst there is generally a safe assumption that if there is a dehumidifying system the potential for excessive moisture to accumulate and for mould to grow is minimal, it again raises the issue of a false positive when using ASHRAE Standard 160 to predict mould growth, specifically considering that moisture is the primary catalyst for mould growth (Johansson, et al., 2013).
Figure 3 shows a number of potential discrepancies arise in the use of the indoor design RH. Just as the indoor design temperature specified an absolute minimum of 21.1 °C which resulted in variation from the actual measurement, the indoor design RH is specified to have an absolute maximum of 70%. This is achieved when the daily average outdoor temperature exceeds 20°C and assumes that warmer temperatures have higher saturation vapour pressures. However, RH is not solely determined by the saturation vapour pressure but also by the amount of vapour present air (partial vapour pressure). This means that just because a temperature of over 20°C is experienced, the partial vapour pressure will not necessarily result in a RH of 70%. This is demonstrated in the period between 12th March 2019 and 1st April 2019 where the indoor design RH specified 70% RH but on average over this time period the RH was 63%. The indoor design RH gave an indoor RH exceeding the actual which may result in false positive mould growth.
Discrepancies regarding this 70% RH maximum also arise when looking at situations within the measured data where a RH exceeding 70% has been recorded. A RH of 70% was exceed approximately 10% of the time for each of the bedrooms sensors but on only one day (23rd February 2019) did the daily average outdoor temperature also exceed 20°C and thus result in the indoor design RH specifying 70% RH. This demonstrates several things. Firstly, a RH exceeding 70% is common within this house and the indoor design RH does not consider the implications of this. Secondly, a RH exceeding 70% is able to be achieved within temperature below 20°C. In situations where the RH exceeded 70%, the temperature averaged at 18.5°C and even went as low as 14.9°C. In these circumstances the indoor design RH is

423
Disparity between reality and theoretical models - predicting moisture and mould growth in houses
specifying a RH that is lower than that which is being experienced within the space and therefore may produce inaccurate result. As the growth of mould is heavily reliant on moisture content in the air, it is critical to understand that the formula giving a lower RH is potentially specifying a situation where unfavourable mould growth conditions are being achieved when actually these conditions are favourable to mould giving a false negative result. Ultimately this raises the question of how suitable the use of outdoor temperature is in specifying design indoor humidity levels when the space is not centrally heated or air-conditioned.
Existing mould prediction models place an emphasis on the impact of unfavourable mould growth conditions when predicting mould growth potential and how these conditions can lead to a reduction in mould growth. An unfavourable condition would be one in which either the moisture content or the air temperature are such that mould is unable to grow or could even reduce. When there is a larger RH range there are points at which the humidity could be potentially unfavourable and therefore where mould retardation could occur. This is potentially the case when looking at the measured data where the recorded RH range of the bedrooms could be as much as 28%. A fluctuation this large in the RH suggests that there could be time periods when mould growth conditions would be unfavourable. In contrast to this, the indoor design modelled RH only fluctuates by 11% throughout this time period, suggesting the model may be flattening out extreme fluctuations which may negatively impact on the assumption that unfavourable growth conditions may be being experienced.
5. ConclusionsThe presence of mould in homes is a pressing issue that impacts a significant number of New Zealanders. NZBC Clause E3 is intended to minimise this risk and is often used in conjunction with computer-based moisture simulation tools. These simulation tools require the inputs of mould prediction models, which whilst these are becoming more sophisticated, are also facing setbacks due to insufficient research being given to developing a sound understanding of the level and accuracy of the required inputs. The research reported in this paper builds on Overton (2019). It compared in-situ temperature and RH yearlong records of one house against the indoor design temperature and humidity as calculated following ASHRAE Standard 160 (2016) should the measured data be unavailable.
From this analysis, the most significant finding was the potential of ASHRAE Standard 160 to generate either false positive or false negative results due to specifying indoor conditions which do not match the reality of New Zealand houses. In regard to indoor temperature, the absolute minimum of 21.1°C which the indoor design temperature suggested to be in place 78% of the assessed time period, indicates that under ASHRAE Standard 160 the space should be on average 2.7°C warmer than it actually is. The indoor design temperature also does not consider the instance in which no space conditioning (central heating or air conditioning) is present and therefore the indoor temperature is likely to be lower. This in turn raised the question as to the suitability of the use of an ASHRAE Standard developed for North America indoor conditions in New Zealand when measured data is not available, and considering social differences, homes construction and use.
The indoor design RH (simplified method) also did not consider the impact of space conditioning systems within a house. Through the indoor design RH specified a RH higher than experienced, there may be the potential for a false positive mould prediction to be produced. This also highlights the potential issue of having one design humidity value for an entire home when different systems and moisture generation levels are being experienced. This comparison of measured data and the indoor design RH specification highlighted a discrepancy in the assumption of an absolute maximum of 70% RH

424
Sarah Buet, and Dr Nigel Isaacs
in a space. The measured data for this one house showed that this occurred approximately 10% of the time but by having a design humidity which is less than that which is being experienced allows for the possibility of an incorrect mould prediction result.
Whilst these two values are only two of numerous inputs that are required when using mould prediction tools, moisture content (RH) and temperature have been found to be two of the most significant drivers of mould and thus it is critical that these are correct in order to produce realistic mould predictions. This research is continuing to explore the applicability of the ASHRAE Standard 160 model to investigate the potential for mould growth in a wide range of monitored New Zealand houses.
6. ReferencesASHRAE. 2016. ANSI/ASHRAE Standard 160-2016: Criteria for Moisture-Control Design Analysis in Buildings. Atlanta:
ASHRAE. ASHRAE. 2010. ANSI/ASHRAE Standard 55-2010: Thermal Environmental Conditions for Human Occupancy. Atlanta:
ASHRAE. Department of Building and Housing. 2011. Compliance Document for New Zealand Building Code Clause G5 Interior
Environment. Ministry of Business, Innovation, and Employment. Isaacs, N, M Camilleri, L Burrough, A Pollard, K Saville-Smith, R Fraser, P Rossouw, and J Jowett. 2010. Energy Use in
New Zealand Households - Final Report on the Household Energy End-Use Project (HEEP). Study Report (SR) 221, Porirua, New Zealand: BRANZ Ltd.
Johansson, Pernilla, Gunilla Bok, and Annika Ekstrand-Tobin. 2013. The effect of cyclic moisture and temperature on mould growth on wood compared to steady state conditions. Building and Environment (Elsevier) 65: 178-184.
Jones, Mark. 2018. “Warmer, drier, healthier buildings.” BUILD Magazine, 1 December: 65-66. Ministry of Business, Innovation, and Employment. 2017. Acceptable Solutions and Verification Methods for New
Zealand Building Code Clause E3 Internal Moisture (2nd Edition, Amendment 6). Wellington: Ministry of Business, Innovation, and Employment.
Overton, Greg. 2019. Hygrothermal performance of New Zealand wall constructions - meeting the durability requirements of the New Zealand Building Code Canadian Journal of Civil Engineering (NRC Research Press) 46 (10): 1063-1073.
TenWolde, Anton. 2008. ASHRAE Standard 160P - Criteria for Moisture Control Design Analysis in Buildings. ASHRAE Transactions (ASHRAE) 114: 167-171.
White, Vicki, and Mark Jones. 2017. Warm, dry, healthy? Insights from the 2015 House Condition Survey. BRANZ.

425
The 54th International Conference of the Architectural Science Association (ANZAScA) 2020
Double Envelope Unitized Curtain Wall for solar preheating of ventilation air
Roberto Garay-Martinez1, Diego Gonzalez2, Izaskun Alvarez3, Beñat Arregi4 and Gorka Sagarduy2 1,3,4 TECNALIA, Basque Research and Technology Alliance (BRTA), Derio, Spain
roberto.garay, izaskun.alvarez, [email protected] 3 Uxama Fachadas Singulares, Amorebieta, Spain
Abstract: Despite recent efforts on energy performance improvement, curtain walls remain a significant contributor to the energy consumption of commercial buildings. A novel double envelope unitized curtain wall system is presented, aimed at the substantial improvement of the energy performance of glazed systems. Outdoor air is ventilated through an integrated cavity in its paths to the ventilation air intake of the air handling unit. In its path through the glazed envelope, the air is heated from both incident solar radiation and transmission losses recovered from the indoor environment. A substantial energy performance improvement is achieved by means of the preheating of fresh air. Energy consumption is reduced in the heating season, and even net gains above the heating demand are delivered under favorable conditions. By-pass elements are integrated to allow free cooling and natural ventilation when required in cooling mode. In this way, the double envelope also provides advantages in summer mode, where solar heat gain coefficients are substantially lower than for other systems due to the double envelope and the ventilation of the cavity to the ambient. The overall architectural concept, engineering design and outcomes of an experimental campaign over a 2-story full scale test in Spain are presented.
Keywords: Curtain Wall, Ventilation; Solar heat; Experimentation.
1. IntroductionIn the 21st century, there is an increasing awareness of scarcity of resources and the risks associated with climate change in an overpopulated planet. This has led to increasingly stringent public policies towards the use of energy, with the promotion of energy conservation and efficiency such as EC(2010). As per EC(2010.b), as much as 40% of the total final energy use is performed in buildings. Considering increasing requirements for ventilation to compensate for more air-tight envelopes and the known issues about indoor air quality effects on human health, there is a need to match increasing energy loads in buildings due to ventilation with the aforementioned energy conservation and efficiency measures. In this context, ventilation energy loss accounts for up to 50% of space heating or cooling needs in some cases.
Imaginable Futures: Design Thinking, and the Scientific Method. 54th International Conference of the Architectural Science Association 2020, Ali Ghaffarianhoseini, et al (eds), pp. 425–431. © 2020 and published by the Architectural Science Association (ANZAScA).

426
Roberto Garay-Martinez, Diego Gonzalez, Izaskun Alvarez, Beñat Arregi and Gorka Sagarduy
Already common in the last decades, the popularity of glazed envelopes is increasing in commercial buildings, and even in some high-end residential projects. However, this popularity is met with energy performance levels not meeting energy conservation standards in some cases. Modern components such as additional glass panes, gas-filled cavities, low emissivity coatings and thermally broken framing elements have been developed to partially mitigate these problems. Recent developments in Building codes such as the Spanish CTE (2019) has led to U-value requirements for highly glazed buildings in the range of 0.8 W/m²K (Garay, 2020), thus Passivhaus-certified product performance levels (Passivhaus Institute, 2015). But although these products can meet energy conservation standards, there is still a need to contribute to the energy efficiency target, by means of the incorporation of renewable energy sources, and to mitigate the environmental footprint of buildings.
Also, comfort-related issues are reported by building occupants in the vicinity of glazed envelopes. Low surface temperatures in winter periods and direct solar radiation or high surface temperatures during irradiated periods and hot periods are known issues of these systems.
Considered the exposed trifold issue with energy conservation, energy efficiency and comfort, a technical solution is proposed, where a double envelope unitized curtain wall (DEUCW) is proposed to pre-heat ventilation air. This system reduces radiant asymmetries and occupant discomfort due to greater heat absorption in the glass and delivery to a ventilated cavity. The cavity is connected to the intake of and Air Handling Unit (AHU).
This paper presents the DEUCW configuration, adaptation schemes for highly glazed buildings, outcomes of a full-scale energy performance assessment, and projections of the energy savings over the full year.
2. Typical configurations of Highly Glazed BuildingsModern multi-rise buildings generally share some common features:
• Highly glazed envelopes, yielding up to 100% in many cases • At least partially mechanically-driven ventilation system • Centralized HVAC systems, where ventilation systems are located. These systems are commonly
located in the roof. For buildings with more than 5-7 storeys, HVAC plants are distributed acrossthe building, with a dedicated technical floor every 5 to 7 storeys.
The DEUCW system shall be defined to adapt to this context, both in terms of architectural definition, and capacity to address the energy loads and fresh-air ventilation airflows required in such integration schemes.

427
Double Envelope Unitized Curtain Wall for solar preheating of ventilation air
Figure 1: Glazed Multi-rise building (left) and rooftop HVAC systems (right)
3. Definition of SystemThe DEUCW is a double envelope system, which comprises two glazing units (two envelopes). These two panes are separated by an air cavity, where air is circulated by means by forced convection. This air is then fed into the air handling unit. Considering its glazed aesthetic and modular concept, the system achieves both aesthetic and functional integration with the building.
In terms of integration with the air handling unit, this system is similar to a Transpired Solar Collector System (NREL, 2000). The cavity is used to capture solar heat and recover transmission losses from the indoor space and operates over the full façade height. The cavity is open to the exterior in its lower end (e.g. ground level) and connected to an air handling unit in its upper end (roof, or technical room). Air is vented from the lower end to the upper connection to the technical room, and heated as it rises due to solar incidence from the sun.
Both for technical rooms and roof connections, parapet-like integrations allow for a virtually non- impacting integration with the HVAC system.
A schematic of the system is depicted in Figure 2.
Figure 2: Schematics of system operation in solar harvesting mode

428
Roberto Garay-Martinez, Diego Gonzalez, Izaskun Alvarez, Beñat Arregi and Gorka Sagarduy
Considering the particular composition and operational scheme of the system, typical glass selection criteria has been revisited in order to maximize solar gains into the cavity, while avoiding direct solar gain into the building. A particular implementation of the system for the city of Bilbao (~40°N, ~1000 HDD/y):
• Single glazing to the external side, in order to maximize solar gains,• Double glazing with a low-emissivity coating to the cavity side, to prevent heat loss from indoor
air and deliver the solar gains within the cavity air. • Hygienic issues are considered twofold:
o Filters are installed at the bottom edge of the DEUCW, in a location with ease of access for cleaning, maintenance & substitution.
o Specific panes (ca. 1/3 of the total surface) can be opened from the internal side for maintenance & cleaning activities.
The design of the system is presented with greater detail in a previous publication (Gonzalez et al., 2018).
4. Experimental AssessmentA full-scale prototype was constructed and installed in a purpose-specific building in the vicinity of the KUBIK by Tecnalia test facility (Garay et al., 2015), nearby Bilbao, Spain. A 3x2 layout was installed, where 2 modules were connected in vertical/serial arrangement, and a total of 3 cavities were generated. A total prototype area of 14.8 m² was installed. The DEUCW was connected to an AHU, equipped with a variable speed fan and an electric heating coil with several heating levels. The ventilation air was introduced into a 30.5 m³ room on the ground floor, in direct contact with the DEUCW. Considering the physical setup presents a large DEUCW to volume ratio, ventilation rates were set to be representative of a much larger building. The effective ventilation rate was set at 683 m³/h, considered to be equivalent to that of a building with a 25 m depth.
Figure 3: Test setup
An experimental campaign was initiated in June 2019, and is still ongoing. The experimental campaign has been designed to identify the performance of the system for various outdoor and indoor temperatures, and solar radiation levels. From the experimental campaign, several relevant data have been extracted and analysed (Garay-Martinez et al., 2020). In terms of heat gain when the DEUCW is active, radiation-dependent temperature gains were observed in the range of 5 to 15 °C.

429
Double Envelope Unitized Curtain Wall for solar preheating of ventilation air
Figure 4: Inlet-outlet temperature gain in the cavity. (Roberto Garay-Martinez et Al. (2020))
Based on the data from the test campaign, linear correlations were calibrated for the output power and system performance with regards to bounding temperatures and solar irradiation.
P = 0.304 * I + 14.54 * (Ti-Te) (1)
η = 0.304 + 14.54 * (Ti-Te)/I (2)
Where: P = output power per glazed area in W/m²; I = solar irradiation in W/m²; Ti = internal air
temperature; Te = external air temperature; η = system efficiency (P/I). Greater detail of the experimental setup and assessment is provided at Garay-Martinez et al. (2020).
5. Climate ProjectionsSeveral projections have been perfomed to assess the performance of the DEUCW system over various climates. In all cases, Cfb climates according to the Köppen-Geiger classification (Kottek, 2006) have been taken. The following climates have been chosen: Bilbao (location of the test referenced in section 4), Auckland and Sydney (for their regional relevance). In all cases, the temperature difference (ΔT) between outdoor air and the balance point of a commercial building has been considered. A balance point of 18 °C has been considered. The ventilation air temperature rise across the DEUCW system has been calculated, and its impact in the ventilation ΔT assessed.

430
Roberto Garay-Martinez, Diego Gonzalez, Izaskun Alvarez, Beñat Arregi and Gorka Sagarduy
Figure 5: Climate conditions (above) and Ventilation ΔT (below) for Bilbao (left), Sydney (centre) and Auckland (right)
Depending on the location, an average ventilation load reduction in the range of 15 to 20% is achieved with the DEUCW system.
6. Discussion & ConclusionsIn this paper, a novel DEUCW system is presented, together with an experimental assessment of its performance.
The DEUCW system allows for the solar energy capture and its use for the reduction of ventilation heating load in buildings. Other benefits are the reduction of transmission heat loss through the envelope, and the reduction of local discomfort in the vicinity of the glazed envelope.
The overall system concept is presented, and a full scale test prototype constructed. As an outcome of this, it can be concluded that the system is validated towards its architectural and mechanical engineering aspects.
With regard to the energy performance, the outcome of the experimental assessment provides a calibrated model, which is used to extrapolate the performance of the system to a wider scale. Actually, the experimental mock-up is already scaled-up, as its ventilation rate corresponds to that of a building with a much deeper façade-to-floor-area ratio.
Climate projections state that the system can meet in the range of 15 to 20% of the ventilation heating loads of commercial buildings.
The aforementioned assessment is by itself promising, but it should be considered as a conservative value due to a couple of facts. On one side, the capacity of the DEUCW system to virtually avoid transmission heat loss is not considered in this study. On the other side, the climate projection did not consider additional energy performance due to overheating possibilities for periods where the DEUCW system not only met, but surpassed ventilation ΔT.

431
Double Envelope Unitized Curtain Wall for solar preheating of ventilation air
Also, this paper has been focused in the performance of the DEUCW system during the heating season. This system is expected to produce also savings in cooling loads in summer mode due to the highly absorptive glass layers in a ventilated arrangements have not been considered in the calculation.
With all these considerations in mind, the authors believe that such a system should be further considered within architectural projects for commercial buildings.
References CTE (2019), Available from: Instituto de Ciencias de la Construcción Eduardo Torroja, CSIC:
<https://www.codigotecnico.org/images/stories/pdf/ahorroEnergia/DBHE.pdf> (accessed 12 November 2020). European Commission (2010). COM(2010) 639 European Commuission (2010b). Directive 2010/31/EU. Garay, R. (2020), CTE 2019. Compacidad y valores límite K para los elementos de envolvente, Avaliable from:
<https://robertogaray.com/cte-2019-compacidad-y-valores-limite-k-para-los-elementos-de-envolvente/> (accessed 12 November 2020).
Garay, R. et al. (2015), Energy efficiency achievements in 5 years through experimental research in KUBIK, Energy Procedia, 78, (3222-3227)
Garay-Martinez, R. and Arregi, B. (2020), Curtain Wall with Solar Preheating of Ventilation Air. Full Scale Experimental Assessment, 12th Nordic Symposium on Building Physics, 2020, Tallinn.
Gonzalez, D. et al. (2018), Innovative curtain wall with solar preheating of ventilation air and integrated control system, ICAE2018, 2018, Donostia-San Sebastian.
Kottek, M., et al. (2006), World Map of the Köppen-Geiger climate classification updated. Meteorol. Z., 15 (3), 259- 263.
NREL (2000), Transpired Solar Collectors. This simple, low-cost solar technology preheats ventilation air for commercial buildings. Available from: NREL <https://www.nrel.gov/docs/fy00osti/23667.pdf> (accessed 12 November 2020)
Passivhaus Institute (2015), Certification criteria for Passive House Transparent Building Components. Available from: <https://passiv.de/en/03_certification/01_certification_components/02_certification_criteria/01_transparentco mponents/01_transparentcomponents.html> (accessed 12 November 2020)

432
The 54th International Conference of the Architectural Science Association (ANZAScA) 2020
Ecosystem services assessment tools for regenerative urban design in Oceania
Fabian Delpy1 and Maibritt Pedersen Zari2 1 Utrecht University, Utrecht, Netherlands
2 Victoria University of Wellington, Wellington, Aotearoa New Zealand [email protected], [email protected]
Abstract: Tools that spatially model ecosystem services offer the opportunity to include ecological values into regenerative urban design practices. However, few of these tools are suitable for assessing ecosystem services in cities, meaning their application by urban designers and architects is potentially limited. This research reviews and compares a diverse range of ecosystem services assessment tools to find those that are most suited for the urban context of Aotearoa New Zealand and Pacific Oceania islands. The tool classification includes essential aspects of project management such as type of input and output data, time commitment, and necessary skills required. The strengths and limitations of the most relevant tools are further discussed alongside illustrative case studies, some collected from literature and one conducted as part of the research in Wellington, Aotearoa. A major finding of the research is that from the 95 tools reviewed, 4 are judged to be relevant for urban design projects. These are modelling tools that allow spatially explicit visualisation of biophysical quantification of ecosystem services. The ecosystem services assessed vary among tools and the outputs’ reliability often depends on the user’s technical expertise. The provided recommendations support urban designers and architects to choose the tool that best suits their regenerative design project requirements.
Keywords: Ecosystem-based adaptation; multidisciplinary design; urban ecology; Pacific Oceania islands.
1. IntroductionThe unsustainable development of human civilisation has degraded the natural environment and caused climate and ecological changes. To face environmental challenges while keeping up with rapid urbanisation, cities must now develop climate adaptation and mitigation strategies that create societal health while regenerating the functions of degraded ecosystems and preserving biodiversity. This implies shifting away from conventional urban and architectural design paradigms, and towards nature inclusive practices.
Ecosystem-based Adaptation (EbA) and other types of nature-based solutions are gaining recognition and momentum among designers of the built environment because they are in line with this new paradigm. EbA draws upon knowledge of ecosystem services to increase ecosystems’ and communities’ resilience to the impact of climate change through development strategies that strengthen biodiversity
Imaginable Futures: Design Thinking, and the Scientific Method. 54th International Conference of the Architectural Science Association 2020, Ali Ghaffarianhoseini, et al (eds), pp. 432–441. © 2020 and published by the Architectural Science Association (ANZAScA).
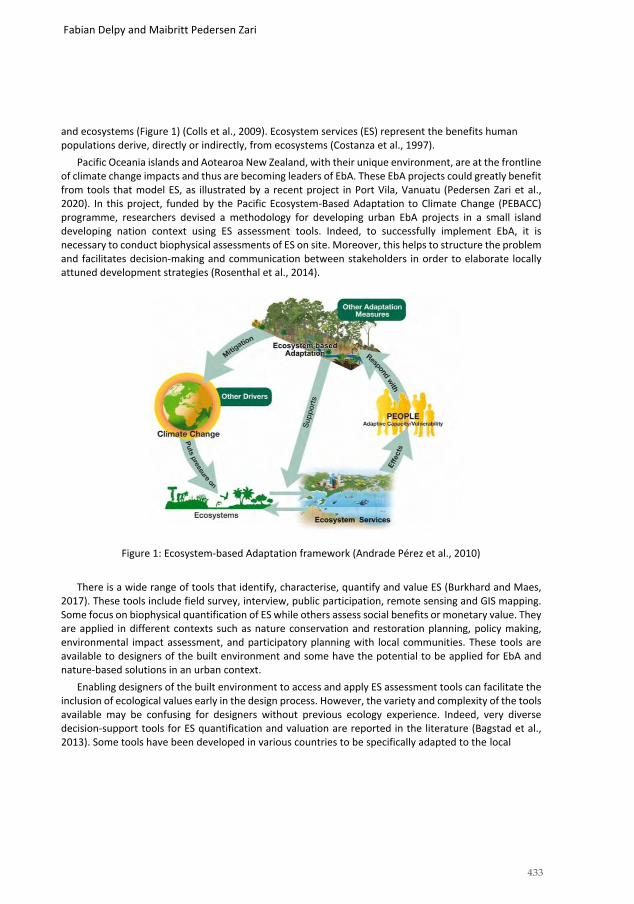
433
Fabian Delpy and Maibritt Pedersen Zari
and ecosystems (Figure 1) (Colls et al., 2009). Ecosystem services (ES) represent the benefits human populations derive, directly or indirectly, from ecosystems (Costanza et al., 1997).
Pacific Oceania islands and Aotearoa New Zealand, with their unique environment, are at the frontline of climate change impacts and thus are becoming leaders of EbA. These EbA projects could greatly benefit from tools that model ES, as illustrated by a recent project in Port Vila, Vanuatu (Pedersen Zari et al., 2020). In this project, funded by the Pacific Ecosystem-Based Adaptation to Climate Change (PEBACC) programme, researchers devised a methodology for developing urban EbA projects in a small island developing nation context using ES assessment tools. Indeed, to successfully implement EbA, it is necessary to conduct biophysical assessments of ES on site. Moreover, this helps to structure the problem and facilitates decision-making and communication between stakeholders in order to elaborate locally attuned development strategies (Rosenthal et al., 2014).
Figure 1: Ecosystem-based Adaptation framework (Andrade Pérez et al., 2010)
There is a wide range of tools that identify, characterise, quantify and value ES (Burkhard and Maes, 2017). These tools include field survey, interview, public participation, remote sensing and GIS mapping. Some focus on biophysical quantification of ES while others assess social benefits or monetary value. They are applied in different contexts such as nature conservation and restoration planning, policy making, environmental impact assessment, and participatory planning with local communities. These tools are available to designers of the built environment and some have the potential to be applied for EbA and nature-based solutions in an urban context.
Enabling designers of the built environment to access and apply ES assessment tools can facilitate the inclusion of ecological values early in the design process. However, the variety and complexity of the tools available may be confusing for designers without previous ecology experience. Indeed, very diverse decision-support tools for ES quantification and valuation are reported in the literature (Bagstad et al., 2013). Some tools have been developed in various countries to be specifically adapted to the local

434
Ecosystem services assessment tools for regenerative urban design in Oceania
context and as such, are not always transferable to a new geographical decision-making context. Moreover, the number and type of ES that each tool considers, the expertise required, the affordability, and the scalability vary greatly.
This research reviews the landscape of ES assessment tools and evaluates them for their applicability to sites in Aotearoa New Zealand and Pacific Islands towns and cities. It does not aim to detail every tool as extensive publications are already available that do this (Bagstad et al., 2013; Grêt-Regamey et al., 2017, Neugarten et al., 2018). Instead, the results the results are presented in a form that guides future users to choose the tools that best suits their project requirements and level of expertise. The tools’ evaluation is illustrated with case studies and complemented by a pilot study of one tool (Land Utilisation Capability Indicator (LUCI)) in the urban context of Wellington, New Zealand.
2. MethodsThe systematic identification and evaluation of tools that are suitable for urban designers and architects in Oceania consisted of four main steps. Firstly, an extensive list of ES assessment tools, frameworks, guidelines and methods (referred to as “tools”) was drawn up through an investigation of ES-related databases, tools’ official websites, and the scientific search engine Google Scholar. Secondly, the list was shortened by selecting only the tools that are generalisable, ready to use, publicly available, reviewed by the scientific literature, and consider multiple ES concurrently. Thirdly, the list was further narrowed based on designers’ needs and requirements to carry out ES assessment in an urban context in Oceania. Urban designers’ and architects’ specific needs and requirements were elaborated upon based on the expertise from a specialist in the field of ES urban design, Dr. Maibritt Pedersen Zari, and have been further completed with urban designers’ feedbacks collected during a collaborative pilot study (the LUCI application in Wellington part of this research). The requirement criteria for further analysis of the tools included: preference for small scale and adequate spatial resolution, biophysical assessment of ES, spatially explicit outputs that are easy to interpret, the ability of the tool to be used independently of the developers, and finally accessibility and affordability of the tool. Lastly, the selected tools were classified and evaluated based on case studies in the Oceania context. To cope with the lack of case studies in Oceania for some tools, the geographical boundaries were adapted to consider small islands or coastal environments in Asia and the Caribbean, as well as in and some continental locations when judged relevant. In addition to the case studies collected in the literature, one of the reviewed tools, LUCI, was applied in the urban context of Wellington, Aotearoa New Zealand.
3. ResultsFrom the initial list of 95 tools found in the literature review, 4 tools meet the two sets of selection criteria of this research. The tools judged to be suitable for urban designers and architects in Oceania are ARIES (Artificial Intelligence for Ecosystem Services), Co$ting Nature, InVEST (Integrated Valuation of Ecosystem Services and Trade-offs), and LUCI (Land Utilisation Capability Indicator). The strengths and limitations of these tools are elaborated on in the following sections where the tools are presented by ascending complexity of application. The four tools allow spatially explicit biophysical quantification of ES in most regions of the world. The type and number of ES assessed vary among tools and the outputs’ reliability tends to depend on the user’s technical expertise and commitment. Even though they all assess ES relevant to the urban environment, none of the four tools were initially designed for application in cities. Examples of their application in the urban Oceania context is thus very limited. LUCI

435
Fabian Delpy and Maibritt Pedersen Zari
is the most applied tool in Oceania and the Asia-Pacific region, which is not surprising because it was developed in New Zealand (LUCI, 2018). InVEST has been used in the Caribbean and Asia-Pacific possibly because the developers, who are based at Stanford University, USA, are collaborating with the Chinese Academy of Sciences among other international partners (Natural Capital Project, 2020a). Few case studies of coastal application are available for ARIES and Co$ting Nature. Table 1 presents some of the tools characteristics and table 2 refers to the ES assessed by the tools.
3.1. Simple analysis: Co$ting Nature
Co$ting Nature is a web-accessible tool that values “natural capital” and analyses ES provided by natural environments. It identifies the beneficiaries of these services, and evaluates the impact of human interventions in ecosystems (Mulligan, 2018). The tool focuses on mapping conservation priority areas and assessing implications of policy scenarios. There is no application in urban contexts reported in the literature but the tool’s applications on the coasts of Ecuador and Madagascar suggest that some of the generated outputs are likely to be relevant to the Oceania context (Burgess et al., 2015; Mulligan et al., 2020). The tool has been designed for users lacking GIS expertise, with limited time and budget. Indeed, by using the global dataset included in the tool and the default tool parameters, users can assess ES anywhere in the global terrestrial realm without any extra data input requirements (Policy Support, 2020). Therefore, Co$ting Nature is the tool with the fewest barriers to use. However, limited outputs reliability and coarse resolution (100m X 100m) impede its application at the smaller urban site scale (Neugarten et al., 2018). As a consequence, the tool has mostly been used at regional or national scales. Moreover, users are restricted by the inability to adapt or customise the tool and have to rely on the default global datasets. The outputs are not absolute values but relative, generating maps where ES are bundled, and each pixel indicates the service with the highest conservation priority.
3.2. Intermediate complexity options: InVEST and LUCI
InVEST is a freely accessible suite of models used to quantify, map, and value “the goods and services from nature” (Tallis and Polasky, 2009). The tool’s principal applications include ES mapping, scenario comparison, economic valuation, land and resource management, impact assessment, and policy making (Natural Capital Project, 2020a). It is the world’s most used tool for spatially modelling ES with application in over 60 countries (Ochoa and Urbina-Cardona, 2017; Sharp et al., 2018). Therefore, along with very complete training programs, new users can benefit from a large community of users in different contexts. InVEST is reported to be faster to use than LUCI and ARIES but is comparable to LUCI when it comes to new site application where users must put considerable effort in to guarantee the quality of the input data (Sharps et al., 2017). This is supported by some case studies reporting that analysis can suffer from outdated data, sometimes requiring data review or generation with a predictive model (Arkema et al., 2017; Sharma et al., 2018). InVEST contains 18 models that assess a broad diversity of ES with possible focus on coastal and urban environments. Indeed, in response to the increasing demand of users for urban ES assessment, developers released the Urban Cooling and Urban Flood Risk Mitigation models in early 2020 (Natural Capital Project, 2020b). Two case studies in the Zhoushan archipelago, China, report that the tool resolution (10m X 10m) was appropriate for ES assessment on small islands and that the results could be used by decision-makers in city management (Cao et al., 2017; Deng et al., 2019).
LUCI is a GIS-based framework that explores land management scenarios to identify locations where changes in land use and management result in improvements in ES, or where trade-offs between

436
Ecosystem services assessment tools for regenerative urban design in Oceania
services are present (Jackson et al., 2013). It is applicable in diverse contexts such as sustainable development, policy making, conservation, and ecological restoration. LUCI has been widely used in the rural context of New Zealand and tested in Australia, the Philippines, Vietnam, Vanuatu, and other Pacific Islands (LUCI, 2018). The tool emphasises producing transparent and easy to interpret outputs, and generating traffic light coded maps where green shows good opportunities for changes and red designates areas that should be preserved or restored. It is accessible for public use and can be requested through the developer’s website. LUCI is the only tool that can simultaneously model different spatial scales, and that can compare multiple ES at once to identify both trade-offs and synergies (win-win scenarios where multiple services might benefit from single spatial interventions) (Sharps et al., 2017). The tool’s fine resolution (usually 5m X 5m) at local scales generates useful information, even when input data are missing as illustrated by its use in Port Vila, Vanuatu (Pedersen Zari et al., 2020). Indeed, in that case study, users correlated the input data with New Zealand data based on subjective considered assumptions. LUCI’s application in locations where the tool has never been used is more time consuming (up to several months) but the developer team has presented different options for parameterisation in a case study in the Philippines (Benavidez et al., 2016). The tool does not report uncertainty, and does not assess supporting and cultural ES, but it is constantly evolving with ongoing research, notably for urban application in Christchurch, New Zealand (LUCI, 2018). The pilot study in Wellington, New Zealand, conducted during this research supports the conclusion that LUCI is relevant to urban design contexts. In less than a month, the analysis generated 1m X 1m resolution outputs with the use of readily available national datasets as input. The study assessed seven ES (agricultural productivity; carbon stocks and fluxes; erosion and sediment; flood mitigation; nitrogen; phosphorus; and soil loss) and evaluated the trade-off and synergy interaction between them. Figure 2 illustrates the outputs generated for flood mitigation ES (left) in parallel with the city aerial map (right).
Figure 2: Flood mitigation ES output sample of the LUCI pilot study in Wellington City, New Zealand.

437
Fabian Delpy and Maibritt Pedersen Zari
3.3. Complex analysis: ARIES
ARIES is the most elaborate tool of the four, with modelling techniques such as agent-based modelling, dynamic modelling, and machine learning that reflect the complex dynamic of ES flows (Neugarten et al., 2018; Villa et al., 2014). Indeed, unlike most tools that focus on the processes that bring ES into existence, the basis for ES valuation in ARIES is the quantification of the actual flow of benefit, including the source, sink and use of ES. Therefore, it is not surprising that this tool is more time consuming to use, especially for new site applications. Its approach is to develop global, yet customisable ES models, and promote a community-based model development strategy in which data and models are networked, used, and further developed by users (Martínez-López et al., 2019). The model can be customised and adapted to local contexts, which requires expertise, but training programs are available to help users through this challenging process (ARIES, 2020). Moreover, developers have announced the release of the ARIES Explorer web interface, due in 2020, which will enable users with less expertise work with the tool (ARIES, 2020). Based on the results of the literature review, it is difficult to evaluate the potential difficulties that may arise from ARIES’ application on a local scales on small islands of the Pacific including Aotearoa New Zealand. Indeed, the most relevant application is a regional scale analysis in the coastal urban environment of the Puget Sounds, USA (Zank et al., 2016). However, a case study in the UK reports that the probabilistic approach of the tool can cope with data gaps in data scarce regions, which is often the case in Oceania (Sharps et al., 2017).
Table 1: Tool characteristics (T = terrestrial; F = freshwater; M = marine; A = Absolute; R = Relative; S = static single time period; D = dynamic temporal variation; * refers to ARIES Explorer due 2020)
Characteristic ARIES Co$ting Nature InVEST LUCI
Appl
icat
ion
cont
ext
Generalisability Medium (*High) High High High Application context T, F, M T, F T, F, M T, F
Scalability Local-Global Local-National Local-Global Site-National Resolution 50m X 50m 100m X 100m 10m X 10m 1m X 1m
Out
puts
Monetary valuation ✓ ✓ ✓Type of outputs A, R R A, R A, R
Trade-offs ✓ ✓ ✓Scenario/Forecast ✓ ✓ ✓ ✓
Mod
el
N° models within tool 11 13 18 9
Platform GIS (*Web-based) Web-based GIS GIS
Model temporality S, D S S S
Approach to uncertainty ✓ ✓ ✓
Table 2: ES assessed by the four tools (S = supporting; R = regulating; P = provisioning; C = cultural)
Ecosystem services assessed by tool ARIES Co$ting Nature InVEST LUCI
S Habitat (quality and provision) ✓ ✓ R Biological control (pest or disease regulation) ✓
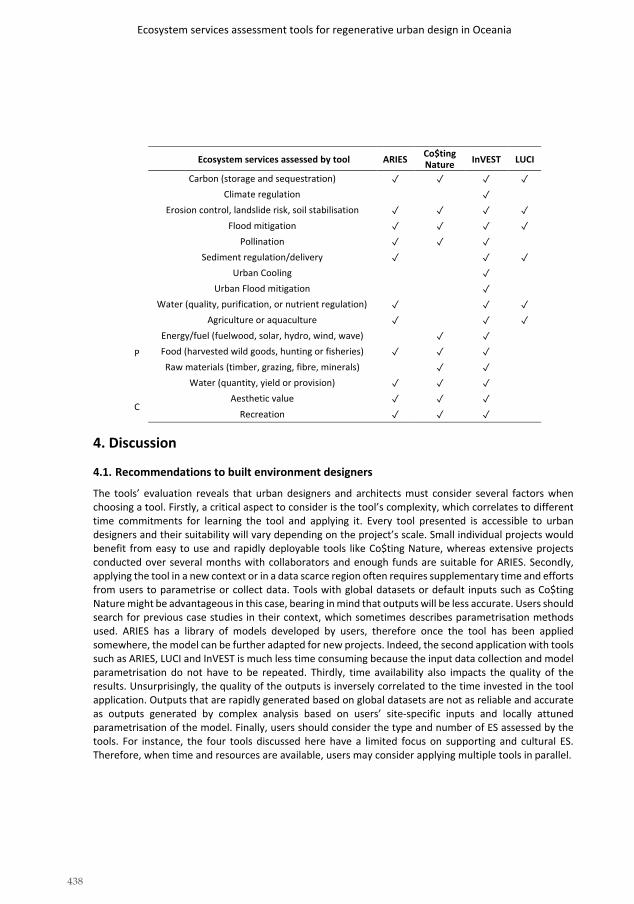
438
Ecosystem services assessment tools for regenerative urban design in Oceania
Ecosystem services assessed by tool ARIES Co$ting Nature InVEST LUCI
Carbon (storage and sequestration) ✓ ✓ ✓ ✓ Climate regulation ✓
Erosion control, landslide risk, soil stabilisation ✓ ✓ ✓ ✓ Flood mitigation ✓ ✓ ✓ ✓
Pollination ✓ ✓ ✓Sediment regulation/delivery ✓ ✓ ✓
Urban Cooling ✓Urban Flood mitigation ✓
Water (quality, purification, or nutrient regulation) ✓ ✓ ✓
P
Agriculture or aquaculture ✓ ✓ ✓Energy/fuel (fuelwood, solar, hydro, wind, wave) ✓ ✓Food (harvested wild goods, hunting or fisheries) ✓ ✓ ✓Raw materials (timber, grazing, fibre, minerals) ✓ ✓
Water (quantity, yield or provision) ✓ ✓ ✓
C Aesthetic value ✓ ✓ ✓
Recreation ✓ ✓ ✓
4. Discussion
4.1. Recommendations to built environment designers
The tools’ evaluation reveals that urban designers and architects must consider several factors when choosing a tool. Firstly, a critical aspect to consider is the tool’s complexity, which correlates to different time commitments for learning the tool and applying it. Every tool presented is accessible to urban designers and their suitability will vary depending on the project’s scale. Small individual projects would benefit from easy to use and rapidly deployable tools like Co$ting Nature, whereas extensive projects conducted over several months with collaborators and enough funds are suitable for ARIES. Secondly, applying the tool in a new context or in a data scarce region often requires supplementary time and efforts from users to parametrise or collect data. Tools with global datasets or default inputs such as Co$ting Nature might be advantageous in this case, bearing in mind that outputs will be less accurate. Users should search for previous case studies in their context, which sometimes describes parametrisation methods used. ARIES has a library of models developed by users, therefore once the tool has been applied somewhere, the model can be further adapted for new projects. Indeed, the second application with tools such as ARIES, LUCI and InVEST is much less time consuming because the input data collection and model parametrisation do not have to be repeated. Thirdly, time availability also impacts the quality of the results. Unsurprisingly, the quality of the outputs is inversely correlated to the time invested in the tool application. Outputs that are rapidly generated based on global datasets are not as reliable and accurate as outputs generated by complex analysis based on users’ site-specific inputs and locally attuned parametrisation of the model. Finally, users should consider the type and number of ES assessed by the tools. For instance, the four tools discussed here have a limited focus on supporting and cultural ES. Therefore, when time and resources are available, users may consider applying multiple tools in parallel.

439
Fabian Delpy and Maibritt Pedersen Zari
4.2. Insights from the LUCI pilot study in Wellington city
The pilot study conducted with LUCI in Wellington city has been integrated into an academic project by an urban designer. The discussion supported the notion that regenerative urban design projects can benefit from ES assessment tools. Indeed, the information provided by the tools is not commonly available to urban designers and its integration in the early stages of a project can lead to a new design thinking and can help to shape the design. Moreover, the consideration of ecological values by designers can facilitate collaboration with environmental experts in a later stage.
4.3. Future considerations
This review is a snapshot of the constantly evolving ES assessment tool landscape. Indeed, the tools are under continuous development to provide better results, add new functionalities and facilitate application. ARIES has announced the release of a Web-based platform (ARIES Explorer due 2020) that will allow users with less expertise to use the tool (ARIES, 2020). InVEST has expressed their intention of focusing on urban application and has recently released two new models: “Urban Cooling” and “Urban Flood Risk Mitigation”, as part of the Urban InVEST platform (Natural Capital Project, 2020b). LUCI developers are currently testing the tool in Christchurch, New Zealand, to further develop the model (LUCI, 2018). Nothing has been expressed by Co$ting Nature concerning any development related to the urban context.
5. ConclusionThis research identified four ES assessment tools that designers of the built environment can apply in cities of Aotearoa New Zealand and Pacific Oceania islands, namely ARIES, Co$ting Nature, InVEST, and LUCI. These four modelling tools allow spatially explicit visualisation of ES biophysical quantification, and facilitate the inclusion of ecological values into design processes. The ES assessed vary among tools and the outputs’ reliability depends on the user’s technical expertise and the history of previous application on or near the site. Results inform future users about crucial characteristics such as time, outputs quality, user commitment, and resource availability in order to choose the tool that best suits their design project requirements. The tools’ ongoing development and the interest in the urban context by LUCI and InVEST in particular illustrate that tools functionality, generalisability, and ease of application are likely to improve in the future. This is promising as the need to integrate ecological values into urban design practices is essential to develop EbA and other adaptation and mitigation strategies to address environmental and societal challenges. This comparative research is limited to a literature review because the four tools have never been applied at the same location. Future research should thus be conducted to evaluate the strengths and weaknesses of the four tools in practice. It is suggested that the LUCI pilot study could be complemented by the application of the other tools in Wellington.
6. AcknowledgementsWe would like to express our gratitude to Bethanna Jackson and Rubianca Benavidez who allowed us to use LUCI, and supported us through the technical steps of the project. We would also like to thank Thomas Westend for his views on user needs in the application of the tools in an urban design context.

440
Ecosystem services assessment tools for regenerative urban design in Oceania
7. ReferencesColls, A., Ash, N. and Ikkala, N. (2009) Ecosystem-based adaptation: a natural response to climate change. Gland,
Switzerland: IUCN. Andrade Pérez, A., Herrera Fernandez, B. Cazzolla Gatti, R. (eds.) (2010). Building resilience to climate change:
ecosystem-based adaptation and lessons from the field. Gland, Switzerland: IUCN. ARIES (2020) ARIES - ARtificial Intelligence for Ecosystem Services, Retrieved July 8, 2020, from:
http://aries.integratedmodelling.org/ Arkema, K., Fisher, D., Wyatt, K. (2017) Economic valuation of ecosystem services in Bahamian marine protected
areas. Prepared for BREEF by The Natural Capital Project, Stanford University. Bagstad, K.J., Semmens, D.J., Ancona, Z.H., Sherrouse, B.C. (2017) Evaluating alternative methods for biophysical and cultural ecosystem services hotspot mapping in natural resource planning. Landscape Ecology, 32(1), 77–97.
Bagstad, K.J., Semmens, D.J., Waage, S., Winthrop, R. (2013) A comparative assessment of decision-support tools for ecosystem services quantification and valuation. Ecosystem Services, 5, 27–39.
Bagstad, K.J., Villa, F., Johnson, G.W., and Voigt, B. (2011) ARIES – Artificial Intelligence for Ecosystem Services: A guide to models and data, version 1.0. ARIES report series n.1.
Beck, M.W., Lange, G.M. (eds.) (2016) Managing coasts with natural solutions: guidelines for measuring and valuing the coastal protection services of mangroves and coral reefs, Wealth Accounting and the Valuation of Ecosystem Services Partnership (WAVES), World Bank, Washington, DC.
Benavidez, R., Jackson, B., Maxwell, D., Paringit, E. (2016) Improving predictions of the effects of extreme events, land use, and climate change on the hydrology of watersheds in the Philippines. Proceedings of the International Association of Hydrological Sciences, 373, 147–151.
Burgess, P., Qin, S., Li, X. (2015) Mangroves in Ecuador: An application and comparison of ecosystem service models. Duke University, Durham, NC, 12-20.
Burkhard, B., Maes, J. (eds.) (2017) Mapping ecosystem services, Pensoft Publishers, Sofia. Cao, W., Li, R., Chi, X., Chen, N., Chen, J., Zhang, H., Zhang, F. (2017) Island urbanization and its ecological
consequences: A case study in the Zhoushan Island, East China, Ecological Indicators, 76, 1–14. Costanza, R., d’Arge, R., de Groot, R., Farber, S., Grasso, M., Hannon, B., Limburg, K., Naeem, S., O’Neill, R.V., Paruelo,
J., Raskin, R.G., Sutton, P., van den Belt, M. (1997) The value of the world’s ecosystem services and natural capital, Nature, 387(6630), 253–260.
Daily, G.C., Polasky, S., Goldstein, J., Kareiva, P.M., Mooney, H.A., Pejchar, L., Ricketts, T.H., Salzman, J., Shallenberger, R. (2009) Ecosystem services in decision making: time to deliver, Frontiers in Ecology and the Environment, 7(1),21–28.
Deng, J., Lin, Y., Zhou, M., Wu, C., Chen, B., Xiao, G., Cai, J. (2019) Ecosystem services dynamics response to tremendous reclamation in a coastal island city, Ecosystem Health and Sustainability, 5(1), 155–168.
Grêt-Regamey, A., Sirén, E., Brunner, S.H., Weibel, B. (2017) Review of decision support tools to operationalize the ecosystem services concept, Ecosystem Services, 26, 306–315. Jackson, B., Pagella, T., Sinclair, F., Orellana, B., Henshaw, A., Reynolds, B., Mcintyre, N., Wheater, H., Eycott, A. (2013)
Polyscape: A GIS mapping framework providing efficient and spatially explicit landscape-scale valuation of multiple ecosystem services. Landscape and Urban Planning, 112, 74–88.
LUCI (2018) LUCI, Retrieved July 8, 2020, from: https://www.lucitools.org/ Martínez-López, J., Bagstad, K.J., Balbi, S., Magrach, A., Voigt, B., Athanasiadis, I., Pascual, M., Willcock, S., Villa, F.
(2019) Towards globally customizable ecosystem service models. Science of The Total Environment, 650, 2325– 2336.
Mulligan, M. (2018) Documentation for the Co$tingNature Model V3. Mulligan, M., van Soesbergen, A., Hole, D.G., Brooks, T.M., Burke, S., Hutton, J. (2020) Mapping nature’s contribution
to SDG 6 and implications for other SDGs at policy relevant scales. Remote Sensing of Environment, 239, 111671. Natural Capital Project (2020a) Who We Are, Retrieved July 7, 2020, from:
https://naturalcapitalproject.stanford.edu/who-we-are/natural-capital-project

441
Fabian Delpy and Maibritt Pedersen Zari
Natural Capital Project, (2020b) Urban InVEST, Retrieved July 8, 2020, from: https://naturalcapitalproject.stanford.edu/software/invest-models/development-urban-invest
Nayak, D.R., Smith, P. (2019) Review and comparison of models used for land allocation and nature valuation. Neugarten, R.A., Langhammer, P.F., Osipova, E., Bagstad, K.J., Bhagabati, N., Butchart, S.H.M., Dudley, N., Elliott, V.,
Gerber, L.R., Gutierrez Arrellano, C., Ivanić, K.-Z., Kettunen, M., Mandle, L., Merriman, J.C., Mulligan, M., Peh, K.S.-H., Raudsepp-Hearne, C., Semmens, D.J., Stolton, S., Willcock, S., Groves, C. (2018) Tools for measuring,modelling, and valuing ecosystem services, Gland, Switzerland: IUCN.
Ochoa, V. and Urbina-Cardona, N. (2017) Tools for spatially modeling ecosystem services: Publication trends, conceptual reflections and future challenges, Ecosystem Services, 26, 155–169.
Pedersen Zari, M., Blaschke, P.M., Jackson, B., Komugabe-Dixson, A., Livesey, C., Loubser, D.I., Martinez-Almoyna Gual, C., Maxwell, D., Rastandeh, A., Renwick, J., Weaver, S., Archie, K.M. (2020) Devising urban ecosystem- based adaptation (EbA) projects with developing nations: A case study of Port Vila, Vanuatu. Ocean & Coastal Management, 184, 105037.
Policy Support (2020) Co$ting Nature, Retrieved July 7, 2020, from: http://www.policysupport.org/costingnature Rosenthal, A., Verutes, G., McKenzie, E., Arkema, K.K., Bhagabati, N., Bremer, L.L., Olwero, N., Vogl, A.L. (2014)
Process matters: a framework for conducting decision-relevant assessments of ecosystem services. International Journal of Biodiversity Science, Ecosystem Services & Management, 11(3), 190–204.
Ruckelshaus, M., McKenzie, E., Tallis, H., Guerry, A., Daily, G., Kareiva, P., Polasky, S., Ricketts, T., Bhagabati, N., Wood, S.A., Bernhardt, J. (2015) Notes from the field: Lessons learned from using ecosystem service approaches to informreal-world decisions. Ecological Economics, 115, 11–21.
Sharma, S.K., Baral, H., Laumonier, Y., Okarda, B., Komarudin, H., Purnomo, H., Pacheco, P. (2018) An analysis of multiple ecosystem services under future oil palm expansion scenarios in Central and West Kalimantan, Indonesia, Occasional Paper 187, Bogor, Indonesia: CIFOR.
Sharp, R., Tallis, H.T., Ricketts, T., Guerry, A.D., Wood, S.A., Chaplin-Kramer, R., Nelson, E., Ennaanay, D., Wolny, S., Olwero, N., Vigerstol, K., Pennington, D., Mendoza, G., Aukema, J., Foster, J., Forrest, J., Cameron, D., Arkema, K., Lonsdorf, E., Kennedy, C., Verutes, G., Kim, C.K., Guannel, G., Papenfus, M., Toft, J., Marsik, M., Bernhardt, J., Griffin, R., Glowinski, K., Chaumont, N., Perelman, A., Lacayo, M., Mandle, L., Hamel, P., Vogl, A.L., Rogers, L., Bierbower, W., Denu, D., Douglass, J. (2018) InVEST 3.6.0 User’s Guide, The Natural Capital Project, Stanford University, University of Minnesota, The Nature Conservancy, and World Wildlife Fund.
Sharps, K., Masante, D., Thomas, A., Jackson, B., Redhead, J., May, L., Prosser, H., Cosby, B., Emmett, B., Jones, L. (2017) Comparing strengths and weaknesses of three ecosystem services modelling tools in a diverse UK river catchment, Science of The Total Environment, 584, 118–130.
Tallis, H. and Polasky, S. (2009) Mapping and valuing ecosystem services as an approach for conservation and natural resource management. Annals of the New York Academy of Sciences, 1162(1), 265–283.
Vigerstol, K.L., and Aukema, J.E. (2011) A comparison of tools for modeling freshwater ecosystem services, Journal of Environmental Management, 92(10), 2403–2409.
Villa, F., Bagstad, K.J., Voigt, B., Johnson, G.W., Portela, R., Honzák, M., Batker, D. (2014) A methodology for adaptable and robust ecosystem services assessment, PLOS ONE, 9(3), e91001.
Villa, F., Ceroni, M., Bagstad, K., Johnson, G., Krivov, S. (2009) ARIES (ARtificial Intelligence for Ecosystem Services ): a new tool for ecosystem services assessment, planning, and valuation, In Proceedings of the 11th Annual BIOECON Conference on Economic Instruments to Enhance the Conservation and Sustainable Use of Biodiversity, Venice, Italy, 21-22.
Zank, B., Bagstad, K.J., Voigt, B., Villa, F. (2016) Modeling the effects of urban expansion on natural capital stocks and ecosystem service flows: A case study in the Puget Sound, Washington, USA. Landscape and Urban Planning, 149, 31–42.

442
The 54th International Conference of the Architectural Science Association (ANZAScA) 2020
Embedding Digital Technology into Contemporary Māori and Pasifika Architectural Practise.
Rick Kaufusi1, Yusef Patel2, Semisi Potauaine3 and Rameka Alexander-Tuinukuafe4
1, 2, 3 Unitec Institute of Technology, Auckland, New Zealand [email protected], {ypatel2, spotauaine3}@unitec.ac.nz
4 Wingate Architects, Tauranga, New Zealand [email protected]
Abstract: The research paper will review how designers and architects can utilise digital technology to produce culturally respectful Māori and Pasifika architectural outputs within a contemporary landscape. The purpose of the research is to determine how digital fabrication technology can embody the same mana found within traditional design thinking and making process. The research will firstly aim to understand what social customs must be retained to ensure the design outcome are culturally appropriate. The second aim of the research is to determine what traditional building and artisan crafts must be employed in the fabrication process. The method will predominantly a review of various forms of literature, recorded interviews and case studies where possible. Three generations of Māori and Pasifika architectural practise having been selected for this review to ensure a large and diverse cultural representation are analysed. The research findings have indicated there are a large number of approaches to producing contemporary digital architecture. While some approaches ensure traditional craftsman are involved throughout the design and fabrication process, other designers opt to engage with modern craftsman with the blessing of the community. The value of this research is important, as it will serve as a mechanism to understand the conflicts between tradition and technological progress. Although it is essential to preserve cultural skill, expertise and craft, it is equally crucial to innovate technologically. The research goal is to enable digital architecture that can spiritually resonate mana and respect to ancestors of Māori and Pasifika culture.
Keywords: indigenous architecture; digital technologies; culture.
Imaginable Futures: Design Thinking, and the Scientific Method. 54th International Conference of the Architectural Science Association 2020, Ali Ghaffarianhoseini, et al (eds), pp. 442–450. © 2020 and published by the Architectural Science Association (ANZAScA).

443
Rick Kaufusi, Yusef Patel, Semisi Potauaine, and Rameka Alexander-Tuinukuafe
1. Introduction
The research presented within this paper will review how architects utilise digital technology to produce culturally respectful Māori and Pasifika architectural outputs within a contemporary landscape. Today, the architectural profession acknowledge the indigenous people of New Zealand by seeking to work with local Māori when formulating designs for community infrastructure (cultural, civic and landscape architecture) and public art. Embedding digital technology into contemporary Māori and Pasifika architectural practices requires practitioners to incorporate modern methods of fabrication (whether sculptural, ornamental or structural) into a culturally driven environment that needs to respect Māori and Pasifika traditions and heritage. The technology that will be investigated are;
• Building Information Model (BIM) software,• Automated Fabrication systems such as CNC cutters, Robotics, and 3D printers to simulate
traditional hand carving, • Other traditional artesian crafts that may be achieved by digital methods
The purpose of this paper sets to determine how digital fabrication technology can embody the same mana found within traditional design thinking and making process. According to Māori Dictionary the word ‘Mana’ can be described as “prestige, authority, control, power, influence, status, spiritual power, charisma”, it is a supernatural force within a person, community, place or object (Moorfield, 2020). The paper will be focussing on aspects that relate to spiritual power, prestige and influence within the production of architecture. The cultural practices of the Pasifika and Māori artesian and craftspoeple often draw upon generations of cultivated customs. To quote Karen Stevenson (2002), “Contemporary Pacific Island artists in New Zealand are utilising the cultural knowledge of their homelands in their artistic expression as a means of navigating their urban environment.” This ensures they acknowledge the ancestral routes from where they draw their inspiration from.
2. Research Question and Methodology
The research question of this paper seeks to determine if digital fabrication technology can embody the same Mana and cultural meaning that is found in the traditional making process. To understand how New Zealand architects can integrate new fabrication technologies into Māori and Pasifika architecture, this paper documents a variety design and fabrication approach that architects have undertaken. The two main aims that this paper will seek to address are:
• By researching social customs that pertain to the traditional fabrication involved, there needs tobe an understanding what these customs embody in order to keep any foreign fabrication process culturally appropriate and acceptable.

444
Embedding Digital Technology into Contemporary Māori and Pasifika Architectural Practise
• Through further research of the customs, there must be an understanding of what traditionalbuilding techniques and methodologies must be used in the fabrication process in order to keepthe same Mana and cultural integrity intact.
The method of the paper will review two types of relevant literature and case studies. The first medium will review relevant theories and design principles that related to Maori and Pasifika architectural practise. The second medium will investigate practice-based case studies that embed Māori and Pasifika values into their digital design and fabrication practice.
3. Literature and Case Studies
3.1. Theories and Design Principles
Architectural commentator with both Māori and Tongan descent, Rameka Alexander-Tuinukuafe (2017), explains the progression of Māori architecture in the past 20 years was largely dependent on practitioners such as Rau Hoskins, Mike Barns, and Peter Maher, late Rewi Thompson. Their contribution has laid the foundation for many architects to expresses the need for Māori architects to be skilled in both Te Ao Māori (Te Ao Māori meaning Māori worldview), and Te Ao Pākehā (of European descent) (Moorfield, 2020)). He expresses that in order for progression and change, as a starting point the change needs to be led by Māori architects inside established architectural practices. In the near future significant architectural projects will be led by Māori architects and clients, resulting in a place based or iwi specific architectural outcomes that enhance the Whakapapa and Mana of the indigenous people of Aotearoa. Alexander-Tu’inukuafe’s reflections, highlight the importance and need for today’s New Zealand architects to expresses an understanding of both the western design principles and the Māori design principles. Digital fabrication represents an argument that there needs to be some sort of conversation between the two principles in ensure traditional crafts and ideas do not become superseded, overshadowed, and overwhelmed by modern technology. It is therefore important to encourage architects, academics and other designers to be exposed to the digitisation of the production of Māori and Pasifika architecture to enable discourse around this topic do take place. Without it, this unique opportunity for local Iwi and other cultural stakeholders to participate on the conversation will be forfeited (Alexander-Tuinukuafe, 2015).
There are concerns that not enough is being done to reclaim the Māori cultural identity of urban landscapes within the city centres. When reflecting upon the Auckland Central Business District, we see very little traces of the of Māori identity and heritage. This problem is being combated with the employment of Phil Wihongi as Māori design leader within the Auckland Design Office (Alexander- Tuinukuafe, 2017). Digital fabrication technology can provide an outlet to allow urban spaces to be reclaimed to provide greater Māori cultural identity to existing western infrastructure.
To influence the urban context, we can review the work of contemporary Māori artist and carver Bernard Makoare on the Māori identity to the cultural landscape of New Zealand. Makoare’s influence

445
Rick Kaufusi, Yusef Patel, Semisi Potauaine, and Rameka Alexander-Tuinukuafe
and thinking on tikanga Māori and how this can be brought to life in an urban context. The Māori voice is the original voice, the indigenous voice of New Zealand, yet there is not enough representation across Auckland for their voice and presence to be heard and felt. The introduction of Bernard Makoare brings an interesting view of the current Māori artisan perspective as in further research into his works and crafts he brings a new term of “Miharo” when approaching a project with the Mana it deserves (Makoare, 2020). Bernard Makoare personal website describes Miharo as extraordinary or exceptional. In his diagram he breaks it down into creativity and innovation. Makoare first experienced the concept during the Auckland City Art Gallery project where they “began to grapple with an unfamiliar Māori dimension” (Makoare, 2020). This is a significant development, as it promotes the innovation and creativity that is needed to address the ever-evolving environment that modern contemporary Pasifika and Māori artisan are navigating.
Pasifika researcher and academic, Karen Stevenson (2002) draws upon the mnemonic traits that are carried through the use of patterns and motifs of the Pacific. The intertwining of one’s craft with culture is ultimately a natural evolution of the encapsulating generational experiences within Pasifika society. The language that imbues from the art speaks through metaphors and the stories of the land. The transition of artistry from the old to the new with the contemporary artists using this knowledge of their homeland as a navigational tool to set their own path in their urban environment. Stevenson continues to address this change from traditional methods as a ‘migration’ tracing it back to the navigational history of the Oceanic people. This important detail illustrates that there is an understanding of foreignness and the need to adapt. The contemporary response to this migration can be attributed to two main elements: environment and generation. The environmental aspect of the adaption can be traced to the migration from the homelands, to this new setting where cultures collide and offer varied views on similar standpoints. For instance, Stevenson brings to light that, “the utilisation of these patterns provides sustenance to the culture. As times change, materials may change, metaphors may change, but the cultural essence remains” (Stevenson, 2002, p17).
Professor Deidre Brown, from University of Auckland explains, the Māori perspective of these changing times. Brown (2020) states, “the Mana of movements shifted through the passing-on of symbols and architectural forms” and “the appropriation of Western-European design elements was not a sign of assimilation but a strengthening of culture against colonisation.” It is suggested that the development of the traditional artform does not move away from customs but rather fights the colonisation of the culture using their own tools. For the practice of digital fabrication, it can mean that its introduction to the artform does not take away from the culture but rather enhances it. Digital fabrication than becomes a tool for innovation that is symbolic of culturally strengthening the bonds between an adaptive world and the steadfastness of culture.
3.2. Architectural Practise
As the largest and arguably the most prolific architectural practise in New Zealand, Jasmax is setting the stage for the further development and cultivation of mixing and bringing the old and new age. Jasmax is careful with their approach to making the Koauau (a musical instrument) into a symbolic gift that both

446
Embedding Digital Technology into Contemporary Māori and Pasifika Architectural Practise
embraces its Māori concepts of Whanau (belonging to a family) and the use of digital technology (Jasmax, 2019). It is seemingly culturally aware in its symbolism and purpose which has been developed in the form of a brand that is unique to Jasmax whilst acknowledging Aotearoa’s indigenous heritage and connection to place. As Oceanic people we emphasise the connections we have and the principles that are developed along with them. Being able to know these connections is what also gives the mana its presence. In contemporary Pasifika art the outputs may not be traditional in medium or in material, but the acknowledgement of the connections and essence must be present for the mana to truly be felt (Harvey, 2015).
According to architectural journalist and author Justine Harvey (2019), in order to walk the talk they need to incorporate the Māori values into built environments that recognises Aotearoa as a collective. The Te Aranga Māori design principles are a means of helping both Māori and non-Māori architects engage the cultural landscape and create environments for Māori to grow and thrive. Non- Māori can still engage meaningfully with culturally sensitive environments. Their involvement can help the sharing of knowledge and support which creates culturally equipped teams, that then expand and grow the collective knowledge. It is interesting that there is now a number of Pākehā architects who are learning Te Reo Māori with genuine interest, through working with Māori clients and wanting to understand the culture. This can help the non- Māori perspective understand and appreciate the cultural landscape that they inhabit from day-to-day.
Lyonel Grant has been a driving force in the Māori architecture scene with his work on the Unitec Marae being a culmination of both traditional carving techniques with western sculptural materials and techniques. In the article by Carly Tawhiao, Hare Paniora elaborates on the thinking of Grant, "He didn’t just want to decorate a box. The carvings of the house are also its structure,"(Tawhiao, 2009). As the Wharenui was traditionally designed and built time and money came into consideration. An interesting factor in this build however is the centre pillar or “Pou’ as it is constructed of bronze and represents everything up to 1840. This is not a traditional material and therefore requires a non-traditional approach to crafting it. This shows how the cultural norms are adapting and recognising how the world is changing. They do this by using an important feature in their cultural archetype, the Pou or central heart Pou, as a way of giving recognition to the treaty (Austin, 2014).
Multi-media artist, lecturer, Tavakefai’ana Semisi Potauanie (2019) has been a very vocal and relevant artist in the field of architecture and Pasifika art and design. In his recent commission in Christchurch, he was asked by SCAPE public art to design a public piece to be installed in the city centre. Named Vaka a Hina translated to Vessel of Hina, this sculpture is the reimagining of the Tongan or Pacific folktale of the Tongan goddess Hina’s vessel (vaka), in which she uses to travels between vava (outer space) and maama (earth). In partnership with John Jones Steel, Potauaine’s design was brought to life with steel structure and fabrication. The involvement of Potauaine in the process has ensured that that this folk tale is still communicated accordingly. The sculpture representants a beacon, a meeting point and way finder to connect the community and celebrate cultural differences (Scape Public Art, 2019).

447
Rick Kaufusi, Yusef Patel, Semisi Potauaine, and Rameka Alexander-Tuinukuafe
Semisi’s prior work, Manuesina the white angel displayed in Waihekle island displayed the same vigour. His rich cultural environmental influence has allowed him to make socially appropriate decisions. Working in multi-media disciplines, allows him to undertake a variety of meaningful projects, with different fabrication technologies and innovative materials (Potauanie, 2019). For Semisi’s Waiheke sculpture, ‘Manuesina’ the incorporated the bird as a symbol for global spirit. The design inspiration came from intricate Tongan highly symmetrical patterns called ‘Kupesi’ which is inherently strong in mana. The sculpture was constructed using an environmentally friendly engineered polymer (Ali 2016). Both the Christchurch and Waiheke projects are geometrical form and required the use of digital fabrication technology to be built. The use of 3D printed model where employed to test design iterations. The use of CNC laser cutters creates components and Robotic arms assembler the structure. The end product did not take away from Semisi’s cultural visions and beliefs as his involvement acted as a compass that kept the narrative true to its course. For Semisi, digital technology is another tool available for us to use. It allows us to continue our dealing with reality, aiding us in the transforming time-space (ta-va) to line-space (kohi-va). These folklores of antiquity now take on new medium. Just like metaphor, their meaning remains intact.
Tennant Brown Architects and Makers of Architecture teamed up with Māori artist, Derek Lardelli, to create spaces of cultural dialogue that are pushing boundaries while staying grounded in their Whakapapa. Tennent Brown brings together the traditional carving patterns and the contemporary techniques to form the CNC cut ‘Tāhuhu’ Ridgebeam at Gisborne Airport. The Tāhuhu being the ridge beam and an essential part of the structure of the Wharenui, this use of western techniques seems to become a statement to the growth of the culture’s artform. This culmination of western and Māori techniques brings the development of the whare into the spotlight and informs a possible outcome of the technological advancements of today (Ashton, 2019).
The Kākano’s pod within Ngā Purapura Sports Facility is parametrically designed geodesic dome that was also CNC cut out of plywood also designed by Tennant Brown Architects. This project can be seen as a big development in the melding of the Māori narrative into the building style of prefabrication. The Kākano is seen as a reflective teaching space that is a mnemonic device of Whakapapa (Tennent & Brown, 2019). The process of building and designing was incredibly efficient and timely due to the ease of the digital fabrication process (Timoteo, 2019). This blend of technologically designed space, and their culturally intertwined meanings, brings to light a conversation between techniques that speak to the potentials of fabrication. Archaeologist Peter Wood of Victoria University brings a perspective that sheds light on the Pakeha’s engagement with contemporary Māori architecture. In particular, the Kākano pod within the Ngā Purapura Sports Facility brings an inspirational encounter where he understands the meaning and the purpose of Kākano (Wood, 2012). This is an example of the meaning and purpose of the design is felt regardless of the level of understanding of Mana.
The National Library of Wellington houses a permanent exhibition named ‘He Tohu’. This exhibition houses the most iconic constitutional documents of New Zealand, one of which is the 1840 Te Tiriti o Waitangi (Treaty of Waitangi). The room is an adaptation of a ‘Waka Huia’ or a timber treasure box, this sense of a treasure box speaks to the level of sacredness or Mana that it holds. With the importance of

448
Embedding Digital Technology into Contemporary Māori and Pasifika Architectural Practise
the documents that the exhibition houses, there are technical requirements that need to be met in order for preservation of said treasures. Due to the limitations of the project the designers looked to the use of parametric modelling to generate physical exploratory models and CNC routering. Although Studio Pacific Architecture took a digital approach, they still acquired the cultural expertise of Bernard Makoare to contribute to the design and fabrication of the exhibit. Makoare’s involvement and the use of New Zealand’s native timber Rimu, for the interior and exterior cladding shows the consideration for connection to Whakapapa and Whenua within the project. This makes the exhibition a prime example of the melding of digital fabrication with traditional taonga (Timoteo, 2019).
Matthew McIntyre Wilson’s architectural CNC milled architectural ‘He Raukura’ fins adorn’s Waitohi Johnsonville Library and Community Hub design by architectural firm Athfield Architects. The work manufactured also manufactured by Makers of Architecture investigates the possibilities of what CNC fabrication has the offer the Māori artform and style. In this piece Wilson’s artistry is translated into a series of elegant long fins that were made to reflect the Māori heritage of the area (Southcombe, 2020).
5. Findings
When looking at the social customs of Māori and Pasifika artesian works must be retained theacknowledgement of Whakapapa or heritage seems to be an underlying theme throughout. Knowing and expressing the original ideas and or art style that has been developed and cultivated ensures that Mana can be upheld.
This brings into question what fabrication methods can be used. The traditional methods have not changed and are the same as they have been for hundreds of years. To ensure that strategies and meanings are retained when traditional methods are not viable, consultations with local Māori experts and or tufunga can ensure that the meanings and connections are still being maintained and representative of whakapapa and heritage. By ensuring involvement of the traditional craftsman throughout the process, the design path is steered in the right direction and can manage any misinterpretation of any or all culturally sensitive craft and art (Love, 2016)
By gaining blessings from the community and or indigenous people of the area while using modern craftsman, there is an acknowledgement of the heritage and the community that the project stems from. The connections that are attached to the craft and the cultivation of the artform is the grounding factor. Crafts people are experienced in their field of arts and craft they have the knowledge and understanding of their specific cultural connection. Crafts people are willing and able to adapt while knowing their artform enough to keep their Mana and cultural integrity alive and felt. Community Blessings bring an approach that is respectful to the cultural landscape that is being drawn from. It is an acknowledgement of the environment that is culturally present and respective.
6. Conclusions and Future Research

449
Rick Kaufusi, Yusef Patel, Semisi Potauaine, and Rameka Alexander-Tuinukuafe
The value of this research is important as it can help New Zealand’s architectural firms, big or small investigate how technology and culturally sensitive design to Māori and Pasifika can be embedded within their practice. This Research can also serve as a mechanism to understand the conflicts between tradition and technological progress. Although it is essential to preserve cultural skill, expertise and craft, it is equally crucial to innovate technologically. The research goal ultimately is to enable digitally produced architecture that can spirituality resonate mana and respect to both the ancestors and the living.
The main point of conflict that is found throughout the research is in the change of mediums. There is a culturally embedded notion that the method of fabrication is just as important as the meaning and can be an essential process for the meaning to be delivered in the end product. We see through contemporary artists the challenging of these cultural norms with their prioritising of the Mana or cultural essence of their product. When it comes to the meanings and the narratives that are represented there is no doubt that they are made to stay true to those origins and to the Whakapapa of those indigenous groups who are involved.
Tangata is of Mana. When Tangata arrived in the new land, Mana must find new medium as a way of integration. In this, we must not rule out that “traditional” started off as “contemporary.” We will rest more assured if we think at Mana this way. (Tavakefai`ana Semisi 2020)
The Taonga of Innovations seen through the use of digital fabrication technology have made cultural intent the underlying factor that the making process stems from. Through the research, the use of digital fabrication technology in the manufacturing process has been a turning point for some designs. By giving the artists the freedom that they normally have with the efficiency of the programming, the artists intent and meaning can still be translated into the process and to the product. The Mana is then a product of the artists involved and their input sees the respect is maintained. To quote Rameka Alexander-Tuinukuafe, “Mana does not have to be understood to be felt but can be felt when understood” (Alexander-Tuinukuafe, 2017).
The next steps of the research is to produce an architectural outcome within academia. The authors intend to work with QUE Haven Community and Management Trust – a Non for profit organisation restoring farmland to native forest to design and develop culturally appropriate lookout pavilion. To ensure that the product of this research is not a culturally appropriate, the involvement of artists and or local iwi or communities ensures the product is representative of their whakapapa. Their participation also ensures the connections of the project stay true to their meanings.
References
Ali, M (2016, 20 July). The Titirangi artist’s concept selected for Waiheke Headland Sculpture of on the Island. Available from: Stuff <https://www.stuff.co.nz/auckland/local-news/western-leader/82202156/titirangi-artists- concept-selected-for-waiheke-headlands-sculpture-on-the-island> (accessed 19 August, 2020).
Alexander-Tuinukuafe, R. (2015). Opinons: Rameka Alexander-Tu’inukuafe on…”A Ngā Tamatoa perspective on Māori architecture”. Architecture NZ, 6(Nov/Dec Issue), 27-28

450
Embedding Digital Technology into Contemporary Māori and Pasifika Architectural Practise
Alexander-Tuinukuafe, R. (2017, November 08). Building culture: why good urban design requires a better understanding of Tikanga Maori. Available from: Idealog <https://idealog.co.nz/urban/2017/11/building- culture-why-good-urban-design-requires-better-understanding-tikanga-maori> (accessed 02 August 2020)
Ashton, A. (2019, November 20). New look for Gisborne Airport. Available from: Gisborne Herald <http://www.gisborneherald.co.nz/local-news/20191120/new-look-for-gisborne-airport/> (accessed 02 August 2020)
Austin, M (2014). Turning (Back) to Linguistics” C. Schnoor (eds), Translation; The Society of Architectural Historians, Australia and New Zealand, (SAHANZ), pp 205-211
Brown Professor Deidre Brown, D. (2020, January 03). Open your eyes to the future of Māori architecture. Available from: Newsroom <https://www.newsroom.co.nz/@ideasroom/2020/01/03/965328/open-your-eyes-to-the- future-of-maori-architecture> (accessed 02 August 2020)
Harvey, J (2015). Jasmax Maori Cultural Advisory. Architecture NZ, (Nov/Dec Issue), 27-28 Harvey, J (2019). New Architecture of the South Pacific: How the Maori Worldview is Changing New Zealand’s Built
Enviroment. Archireture Design, 89, 94-97; Wiley Jasmax (2019, November 14). Jasmax announces a new design direction. Available from Architecture Now:
<https://architecturenow.co.nz/articles/jasmax-announces-a-new-design-direction/> (accessed 18 August 2020) Love, J. (2016, November 07). Kōrero Mai, Kōrero Atu: On making an exhibition from colonial spoils. Pantograph
Punch. Available from: <https://www.pantograph-punch.com/posts/korero-mai-korero-atu> (accessed 18 August 2020)
Makoare, B. (2020). Bernard Makoare: Carver, artist & designer. Available Bernard Makoare from <https://bernardmakoare.com/> (accessed 18 August 2020)
Stevenson, K. (2002). Lalava-ology: A Pacific Aesthetic. In F. Tohi & S. Rees (eds.), Filipe Tohi: Genealogy of lines Hohoko ē Tohitohi, New Plymouth, Bovett-Brewster Art Gallery, 17-19
Southcombe, M. (2020). Going beyond the brief. Architecture NZ, (May/June Issue), 32-39 Scape Public Art. (2010, March 28). Icon for East Frame. Available from: Scoop Media
<https://www.scoop.co.nz/stories/CU1903/S00357/icon-for-east-frame.htm> (accessed 18 August 2020) Tawhiao, C (2009, April 02). Unitec Wharenui Opens. Auckland City Harbour News. Available from: Stuff
<http://www.stuff.co.nz/auckland/local-news/auckland-city-harbour-news/2255652/Unitec-wharenui-opens> (accessed 18 August 2020)
Tennent, H., & Brown, E. (n.d.). Ngā Purapura. Available from: The Designers Institute of New Zealand <https://designersinstitute.nz/case-study/nga-purapura/> (accessed 03 August 2020)
Timoteo, E. (2019). He Tohum, Document Room. In E. Timoteo, P. Bell & G. Marriage (eds.), How to Prefab: A series of New Zealand offsite construction case studies. Wellington, Prefab NZ, 09-10.
Timoteo, E. (2019). Ngā Purapura, Sports Facility. Available from: Prefab NZ Database <http://www.prefabnz.com/Downloads/Assets/Download/13509/1/Nga%20Purapura,%20Sports%20Facility%2 0.pdf> (accessed 03 August 2020)
Wood, P. (2012). Nga Purapura, Te Wananga o Raukawa. Architecture NZ, (July/August Issue), 58-64 Moorfield, J.C (2020.). Available from: Māori Dictionary <https://maoridictionary.co.nz/word/3424> (accessed 01
August 2020).

451
The 54th International Conference of the Architectural Science Association (ANZAScA) 2020
Embedding Flexible design to endure long-term preservation of Industrial building in Australia
Marisa Claudia Martínez1, Sarah Shuchi2 and Susan Ang3 1, 2, 3 Deakin University, Geelong, Australia
{mcmartin1, sarah.shuchi2, susan.ang3}@deakin.edu.au
Abstract: Obsolete industrial buildings often highlight the remains of an industrial culture, being the prominent part of the industrial heritage. Although they offer unsurpassed opportunities for reuse, abandoned industrial buildings are too often considered as obsolete brownfields by local authorities. The preservation of these buildings necessitates their conversion into new uses, a task requiring careful design and implementation. Standard criteria have been defined in the literature for ensuring the adaptive reuse of a built environment, which has minimal impact on heritage values. Nevertheless, little has been discussed about the impact modern social dynamics will have on the actual preservation of reused-adapted heritage buildings, as early obsolescence could jeopardize, and even negate, preservation efforts. This research is based upon detailed analysis of two successful case studies in the Australian context, and is aimed at revealing the need for a preservative approach which adopts multiple cycles of adaptive reuse, and gives priority to adaptive reuse as a proven strategy for salvaging significant buildings and ultimately contributing to community revitalization. The guiding philosophy is that the prominent, extensive, open-plan morphology of Australian industrial buildings could be profiteered to use flexible designs, capable of withstanding multiple cycles of adaptive reuse. The current research identifies the decision-making strategies to embed flexibility into the process of adaptive reuse, assisting in a long-term preservation paradigm for industrial structures.
Keywords: Industrial heritage, Flexible design, Long-term sustainable preservation, adaptive reuse.
1. IntroductionThe characteristics of obsolete buildings within a city significantly impacts upon the conservation of
cultural aspects of its history; in particular, the remnants of obsolete industrial heritage often present dramatic buildings, landscapes, sites and precincts that contribute to the distinct character of that city. The preservation of these buildings allows maintaining their intrinsic heritage and cultural values (Langston, 2008). A building could become obsolete for various reasons; changing economic and industrial practices, instigating demographic shifts or increasing the cost of upkeep or maintenance, but mostly because it is no longer suited for the original function (Günçe & Mısırlısoy, 2015). Adaptive reuse refers to the process of salvaging an existing building for a purpose other than which it was originally built. Therefore, successful adaptive reuse of obsolete buildings has been seen as project innovative
Imaginable Futures: Design Thinking, and the Scientific Method. 54th International Conference of the Architectural Science Association 2020, Ali Ghaffarianhoseini, et al (eds), pp. 451–460. © 2020 and published by the Architectural Science Association (ANZAScA).

452
Marisa Claudia Martínez, Sarah Shuchi and Susan Ang
opportunity for reusing the heritage asset (RAIA, 2004; Günçe & Mısırlısoy, 2015; Petković- Grozdanovića, et al., 2016; Mehr, et al., 2017). The loss of significant architectural structures will continue if adaptive reuse opportunities are not adopted successfully. This dynamic is well represented by the fate of Geelong’s waterfront, in Victoria, Australia: Throughout the 1980's, most of Geelong’s waterfront wool stores, which symbolized the significance of the nineteenth century wool industry of Australia, fell into a condition of disrepair (De Jong, 2007) and, regrettably, many iconic industrial buildings that shaped the landscape were lost. The last decades have seen one of the last remaining building, the Bow Truss Building, which formed part of the historic Dennys Lascelles Wool Stores (now National Wool Museum), pitilessly demolished and replaced as a wasteland for temporary car parking. Another local example is the iconic Geelong Power Station A Building, partially demolished to make way for Westfield Plaza Shopping Centre, whose remains now stand disfigured.
To date, adaptive reuse projects have been assessed in accordance with the triple bottom line theory: adaptive reuse of structures are considered a success if they are socially, economically and environmentally sustainable (Langston, 2008; RAIA, 2004; Petković-Grozdanovića, et al., 2016) . These ideas have been integrated into ‘design criteria models’ for helping in evaluating design performances for adaptive reuse management (Conejos, et al., 2011; Conejos, et al., 2014). Additionally, standard criteria have been defined to ensure that an adaptive reuse project has minimal impact on buildings’ heritage values (RAIA, 2004). Nevertheless, little is said about the impact modern social dynamic will have on the actual preservation of reuse-adapted heritage buildings, as early obsolescence of adaptive reuse interventions could jeopardize preservation efforts. Researchers are stressing the need of considering flexible design strategies in the early design stage to maximize the adaptive reuse potential of new buildings (Andrade, et al., 2019), hence, it becomes apparent that the long-term preservation of a structure requires design for multiple cycles of reuse. Despite extensive research efforts being devoted to the reuse-salvage of obsolete buildings and the need for embedding flexibility to prevent, or delay obsolescence of new built, few authors have linked the two research fields: How to prevent early obsolescence of adaptive reuse projects?
This paper sought to reveal the need for multiple cycles of adaptive reuse, emphasizing the fact that the same societal dynamics producing large amounts of obsolete buildings can jeopardize preservation efforts by producing early obsolescence to adaptive-reused heritage buildings. Its main objective is to demonstrate the need to embed flexibility into adaptive-reuse design projects to maximize opportunities for long-term preservation. Of particular focus, was the aspect of long-term preservation of architecturally significant obsolete industrial build stock in Australia, this research proposed exploring design solutions suitable to reach the goal of successful, long-lasting preservation of significant architectural buildings. In this particular scenario, the prominent, extensive open-plan morphology of industrial buildings can be profited to produce flexible design strategies to be able to withstand several cycles of adaptive reuse (Martinez, 2020). Assimilating the synergies central to a successful integration of adaptive reuse and highlighting the integration of flexible design strategies, the authors propose a new term, ‘Multiple re-use’, for signalling the aim of designing for multiple cycles of adaptive reuse.
2. Exploration of Flexibility in Adaptive reuseIn order to realize the paradigm of long-term preservation of significant industrial buildings, it becomes
apparent it is imperative to integrate the ideas of flexibility and future adaptability into the design of adaptive reuse projects of such buildings; thus, aiming for a flexible architecture that is designed to easily respond to change throughout the lifetime of a structure. The benefits of this form of

453
Embedding Flexible design to endure long-term preservation of Industrial building in Australia
design are significant: it extends the life span of a structure, accommodates users’ experiences and intervention, takes advantage of technical innovation more readily, and is economically and ecological more viable. It is worth mentioning that despite the terms ‘flexible’ and ‘adaptable’ are used interchangeably, ‘adaptability’, as defined by Steven Groák (1992), refers to being capable of different social uses, which means designing a particular space that can be used in a variety of different ways, whilst ‘flexibility’ refers to the provision of the capability of different physical arrangements; this can be achieved by altering the physical fabric, by joining, extending or through sliding or folding walls and furniture (Shuchi, et al., 2017). When pondering the question of flexibility in architecture, the issue of building’s longevity arises. The main characteristics of flexible architecture, as defined by (Kronenburg, 2007), include a combination of adaptation, transformation, mobility and interaction in the structure.
Adaptability and transformability are showcased in Cedric Price’s Fun Palace (Centre Canadien d’Architecture, n.d.); a proposition for an alternative educational leisure centre that designed to facilitate various programmatic and spatial reconfigurations initiated by its users. The concept was to make the design constantly under construction: users can rearrange wall panels to create new spaces as the program change and evolve, creating endless variation forms and flexibility (Özkoç, 2009). Another successful adaptive-reuse project integrating transformability (and adaptability) is the award-winning Ru Paré Community project (BETA, 2018).
3. Research MethodologyThis research is based on a systematic analysis of two case-studies of adaptive reuse of industrial
buildings in Australia: Tonsley’s MAB (Adelaide) and Federal Mills (Geelong). The cases were analysed to recognize the design strategies and approaches adopted for the projects, aiming to understand how flexible design criteria can assist on long-lasting preservation. Both case-studies are architecturally significant and display a great value of adaptive reuse, however, the way the repurpose project was managed presents significant differences: Federals Woollen Mills was developed by a private company, without any involvement from the community, while Tonsley site was developed as a unique project, sponsored by the city of Adelaide, that promoted the participation of the community into project outlining and definition. Flexible design solutions were investigated, based upon available written and photographic documents and architectural drawings, to determine the strategies of flexible design that help in promoting long lasting preservation of these adaptive-reuse projects. Brand’s model (1994) for building decomposition into ‘Shearing Layers of Change’ was adopted in this research to help identifying how flexible design solution could be adopted for industrial heritage structures.
3.1 Case-Study 1: Tonsley, Former Mitsubishi Car factory, Adelaide, SA
3.1.1. Background
The site comprises most of the former Chrysler and Mitsubishi Motors Australia site, located in the suburb of Clovelly Park in the City of Marion, Adelaide, Australia. The Tonsley site represents the early settlement history of the Marion districts with mixed farming, market gardening and vineyards. Chrysler purchases the property in 1955 and builds a large complex of single-level sawtooth roofed assembly factory building (Tonsley, 2020).

454
Marisa Claudia Martínez, Sarah Shuchi and Susan Ang
3.1.2. Tonsley, Adaptive Reuse Innovation District, Adelaide.
When operations ceased at Tonsley vehicle assembly plant in 2008, planning began to transform the 64-hectare site into the Tonsley Innovation Precinct. During the transformation, the large steel framestructure remained, and corrugated asbestos cement sheets and the metallic roof has been replaced.Today, Tonsley is a vibrant knowledge precinct supporting clean technologies, sustainable industries,advanced manufacturing, education, and research. Whilst respecting the structure of the main buildingknown as Tonsley’s Main Assembly Building (MAB) in its current form, architects worked closely withcommunity representatives and consultants to create a comprehensive design for the adaptive reuse,which celebrates the industrial heritage of the building and creates a unique destination andcontemporary public space (Woods Bagot, 2018). Tonsley’s MAB and associated Pods operate as aninterconnected and intelligent mixed-use precinct. The masterplan recognised the importance of regional urban fabric and respected the manufacturing heritage of the site. The umbrella-like existing structure(Figure 1, left and right panels) celebrates the industrial heritage of the building, creates a unique publicdestination, and delivers a clear layout with a highly flexible work environment.
The tenancies use a ‘pod’ approach that is adaptable, flexible and highly functional. The Tonsley Pod can accommodate up to 40 people seated theatre-style and can easily transform from a training room to a networking space in minutes (Woods Bagot, n.d.). The Main Assembly Building has abundant natural sunlight and ventilation, thanks to skylights and open ‘walls’ and offers public areas such as the Town Square, two ‘urban forests’, plus cafés and meeting places that all create collision spaces to foster serendipitous networking for collaboration and innovation (RenewalSA, 2018). The re-use of the motor vehicle assembly building to create a framework within which individual ‘pods’ area developed and inserted and are able to be expanded, modified or re-placed is a clear example of how to be flexible.
Computer modelling was carried out to align appropriate daylight levels, thermal and acoustic performance, by allocating a specific ratio of solid panels, transparent panels and openings to each space typology. The project team also utilized computational fluid dynamics modelling to derive façade and roof permeability for optimal cross ventilation for user comfort throughout the year (Woods Bagot, n.d.). The aesthetic is industrial, with skeletal frames and raw, legible services. There is an awareness of the sun’s path, of changing temperatures and wind patterns. Pockets of vegetation open to the sky provide a welcome respite from the surrounding urban landscape (Atkin, 2016). The grid layout and structures related to the existing build forms are maintained. All new structures do not interfere or connect to the existing building; organic lines are the soft element inside the rigid structure.
To adapt diverse needs, architectural space was designed to be flexible yet suitable to the functional requirements. Tonsley’s proposed use of existing space morphology establishes basic systems configurations that allow expansion and contraction of different social uses providing different physical arrangements. Figure 1, central panel, shows examples of MAB’s different spatial and functional arrangements, highlighting the flexibility of the design. Tonsley’s project demonstrates the successful repurposing of the existing structural elements (hard system) combined with soft elements (organic and open plan) into flexible design arrangements.
The Tonsley model has produced innovative infrastructure features designed explicitly to nurture a collaborative community and to build a culture of innovation. This has meant combining the ‘hard’ infrastructure, the architecturally planned physical layout, with the ‘soft’ infrastructure that is supplied by the design of Tonsley’s open spaces. The interaction of hard and soft infrastructure has helped to develop cosmopolitanism and a sense of place in the aesthetic transformation of a former

455
Embedding Flexible design to endure long-term preservation of Industrial building in Australia
manufacturing plant. One of the chief architects involved in developing Tonsley’s master plan described the challenge of weaving together hard and soft elements of infrastructure (Mark Dean, 2018)
Figure 1: Left panel: MAB’s original structure and today’s interior (Source: Atkin (2016)), central panel: Examples of MAB’s layout configurations (Source: Tonsley (2020)), right panel: MAB’s Exterior and
interior spaces (Source: Tonsley (2013))
3.2 Case-Study 2: The former Federal Woollen Mill, Geelong, VIC
3.2.1. Background
The Federal Woollen Mill played an important role in the production of army uniforms and blankets for Australian soldiers during the First World War, enabling Australia to produce its own essential military equipment without relying on assistance from overseas. The mill was vital to the economy of Geelong region, created stable employment for many local residents and was considered as a significant innovation of the times. The impressive brick structures of the former mill (Figure 2, left panel), completed in 1915 by Australia’s first Labour Government, signal a time in Victoria’s history where there was a move away from traditional factories (dark, poorly ventilated & multi-storeyed), towards a new approach focused on improving the working conditions of employees. Welfare programs for workers were also introduced, which was of great social significance (PIVOT CITY, n.d.).
The factory was regarded as revolutionary for its time in employing a logical and linear work-flow through all stages of the processes, which were housed in single storey "sheds" grouped around a central thoroughfare rather than in the usual multi-storeyed building. The buildings were particularly well designed to receive better day-light and ventilation. Another innovation of that time was that all processes were electrically powered from the mill’s own power plant. This former Woollen Mill is the most intact in terms of its building stock and original design layout. The original fabric remains largely intact, despite the loss of plant and the addition of some modern envelope. The place is architecturally and scientifically important for its excellence in technology and layout, notably, the influential introduction of the shed principle of factory planning and the use of steam turbines and electric motors for machine driving (Victorian Heritage, 2020).
3.2.2. Federal Mills, Pivot City Innovation District
In 2013, David Hamilton Property Group purchased the Federal Woollen Mills in a derelict state and repurposed these historically significant buildings. Today, these Mills retain their imposing presence while hosting a vast diversity of activities (PIVOT CITY, n.d.). The site is defined by its free classical style in red brick, a material characteristic of much of Geelong, as well as the large windows that dominate its

456
Marisa Claudia Martínez, Sarah Shuchi and Susan Ang
façade. This reinvention of the mill into a technologically creative start-up hub has helped Geelong to overcome its industrial decline, rising into a creative city.
The site located in North Geelong, within an Industrial 2 Zone has an area of approximately 54,000 m2 with an existing floor space of 28,000 m2. Original sketch plan, and structures related to original build form, are maintained (Figure 2, central panel). New internal structures, fixed to the existing fabric shed, propose new sub-spaces. The partition responded to the new uses: sub-areas- spaces for lease. This internal subdivision emphasis privacy and specific use spaces. The new proposal breaks-out the original conceptual design which followed a logical and linear workflow through the entire site (through all stages of the processes). This interconnection is lost, reducing flexibility and disfiguring the site.
The design features exposed historic steel beam structure, original polished concrete a unique red brick structure that combine to create a modern industrial interior (Figure 2, right panel). The "saw- tooth" system and large windows allow natural light to reflect throughout the space, this was essential in the manufacturing process that required large areas of enclosed space to house the machinery. The news workspaces were inserted into each industrial shed in a manner that kept the special qualities, structure and experiences of the original building.
Figure 2: Left panel: Federal Woollen Mills by 1975 (Source: Anon. (n.d.)), central panel: Present subdivision of spaces for lease (Source: Martinez (2020)), right panel: Today’s Federal Mills’ interior
spaces (Source: Hamilton Group (2020))
The new tenancies spaces provide services that run under the roof structure. Federal Mill’s infrastructural design enables sub-systems to be installed or changed with a minimum of interface problems. This is usually achieved by the separation of a ‘base-building’ and its interior ‘fit-out’. All spaces are completely empty, and each tenancy needs to design his internal fit-out. Hamilton Group provides the service for fitting-out the space or offers some advice on how to use the space more efficiently.
Federal Mill’s management plan focuses on how to use the space more efficiently; through detailed utilization studies prior to fit-out, in addition to real-time tracking during the occupation. If areas are underutilized, then they can be modified into more efficient space use. “There is a desire to fit-out highly flexible spaces that can be used for multiple purposes and/or business units or, alternatively, flex- form an office one week, with minor changes, to become a meeting room over the weekend” (Hamilton Group, 2020). The interior is subdivided into studios in a manner that respects the areas and volumes of the original spaces. The aim was to create flexible, adaptable interiors that would help extend the life of the building, while allowing the original plan to be easily read within the adapted building.

457
Embedding Flexible design to endure long-term preservation of Industrial building in Australia
4. Identified Flexible Design Strategies for Adaptive ReuseAdaptive reuse was unanimously signalled as one of the most valuable strategies to preserve these
industrial buildings by largely retaining their structural integrity, therefore, the changes needed to alter the functionality appeared to be relatively minimal. The design analysis of the case-studies also revealed that the specific flexible strategies incorporated in the buildings increased the capacity to accommodate changes while preserving the industrial heritage. Case-study analysis portrayed how preservation of the structural clarity of industrial buildings principally influenced to retain their structural integrity, hence, the changes required to alter/enhance its functionality appear to be relatively minimal. Both projects demonstrated that fitting a newly constructed shell inside existing layouts is a bespoken way of offering industrial spaces a new purpose whilst maintaining the legacy.
Flexible designs appear as key factors for conveying sustainability of the projects. Tonsley’s project took advantage of using the open space where flexible design is placed in a way that responds to the plan and spatial logic configuration. Federal Mill preserved the existing shed structure; unfortunately, the original plan, following the manufacture process, was lost to create privacy for the new tenants. The result degrades the flexibility of the site; however, this new subdivision could be an important factor for the economical sustainability of the project. Current research findings identified that, by adopting the shearing layers concept by Brand (1994), flexibility of industrial buildings can be categorized under the following design approaches.
Structure: A process of retrofitting old industrial buildings for new uses should allow structures to retain their historic integrity while meeting the needs of the new occupants. Introduce flexible building concepts using existing industrial structure and combine whit de-mountable systems to extend the useful lives of existing.
Skin: A flexible skin must allow to be modified by means of easy and fast operations as occurs with enclosures formed by replaceable elements. The important additional aspect of transformable architecture is the ability of the building to interact with external environment and respond to climatic situations.
Services: Exposed services are treated as integrated expressive elements. Building management systems and solar panels are provided and adapting industrial buildings to balance modern heating, ventilation, and air conditioning (HVAC), point services must be located outside the building to have free access to repair, change or upgrade systems.
Spaces Plan: Flexibility of the possible layouts gives freedom for the users to create the desired space according to the client needs. Industrial building offer possibility to flexible design plan to increase multi-purpose space. Table 1 summarizes flexible design characteristics found to be common across the two case-studies, based upon Brand’s model of decomposition of buildings.

458
Marisa Claudia Martínez, Sarah Shuchi and Susan Ang
Table 1: Summary of flexible design characteristics uncovered from the two case-studies.
Structure
Compact - Open
• Traces of the past are not erased, but integrated into the design.
Fragmented - Closed
• Old industrial structural elementsemphasized: brick walls, columns andbeams exposed, concrete surfaces are left untouched.
Skin • Double glazed front façade + metalliccladding: strategic design adapted to amodular existent grid.
• Roofs, wall and other parts of the facadeare opened for light or closed foratmospheric reasons.
• Modular skin: flexible and better insulated.• Ability of the building to interact with
external environment
• Industrial building fabric conserved; artefacts, including signage, retained.Building’s historic character preserved.
• Conserved original building’s brick façadeand parts of the interior.
• Replaced all damage metallic cladding +double glazing to improve building’sperformance.
Services • Appropriate daylight levels, thermal and acoustic performance by allocating a specific ratio of solid panels, transparent panels and openings to each space typology.
• Façade and roof permeability for optimalcross ventilation for user comfort.
• All services running overhead, maintainoriginal services point outside of envelope.
• All services running overhead, maintainoriginal services point outside of envelope.
• Free access to repair or changecommunications wiring, electrical wiring,plumbing, sprinkler system, HVAC.
• Exposed services are treated as expressive integrated.
• Addition of new 100KW solar system.
Spaces Plan
Stuff (Fit-out)
• Adaptable and flexible open plan.• Design provides future adaption and
expansion capabilities through flexiblearrangements, allows future adaptivereuse opportunities.
• Internal circulation design strategy andexisting building volume offersopportunities for the development oftenancies of different forms and scales.
• Spatial flow-mobility, open plan, fluid andcontinuous.
• Convertibility, divisibility, elasticity, multi- functionality.
• Prefabricated components. • Uses a ‘pod’ approach that is adaptable,
flexible and highly functional. • Able to be inserted, expanded, modified or
replaced.
• New use as offices has retained thebuilding’s spatial qualities and remnantartefacts.
• The relationship between the originalbuilding groupings is cancelled to provideprivacy in each sub-space.
• All original access relating whit exteriorhave been carefully maintained.
• The plan layout shows free circulation around external building, connecting areas through open pergolas: this connection isprovided only for external circulation.
• Independent structural grid: freedom todevelop each space.
• Fit-out internal design is provided bytenants: the space to rent is empty and all services are provided under the roof.
• Guidelines to fit out the space. • Separating the structural and infill
elements.• Modular coordination system. • Separation of structural and infill elements. • Flexible layout: Open plan and partitioned
office space, complemented with meeting rooms and utility spaces.
• Using accessible component.• Employing proper detailed design of
fittings, fixtures, and joints that can beeasily disassembled.
Shearing Layers
Research Case Study 1 Tonsley’s MAB, Geelong
Research Case Study 2 Federal Mills, Geelong

459
Embedding Flexible design to endure long-term preservation of Industrial building in Australia
5. Discussion and ConclusionResearch has emphasised the importance of developing a flexible spatial configuration to meet the
precipitously changing demands of the built environment. Despite extensive efforts devoted to the reuse-salvage of obsolete buildings, only a few authors successfully linked these two research fields to date. The current research primarily proposed the need for designing multiple cycles of adaptive reuse, emphasizing the fact that large amount of obsolete buildings would jeopardize the preservation efforts by creating early obsolescence of heritage structures. The importance of embedding flexibility into adaptive reuse projects expected to ease possible future cycles of adaptive reuse interventions, increasing the probabilities of attaining long-term preservation. The analysis of both case-studies revealed that architects and planners with a deliberate effort of producing design could accommodate changing uses of the spaces in order to realize the paradigm of long-term preservation. Therefore, the current paper posits that it is imperative to integrate the ideas of flexibility, and future adaptability, into the design of adaptive reuse projects. Despite the many threats obsolete industrial sites encounter, they have the advantage of presenting a morphology that results ideal for repurposing designs with embedded flexibility.
This research was proposed as an explorative study of existing adaptive reuse projects of obsolete industrial buildings and was part of a more extensive research study undertaken as a post graduate research thesis and presents findings two case study buildings located in Geelong as representative of a study undertaken to understand the Australian context. It does not offer any new tools or strategies for incorporating architectural flexibility into adaptive reuse projects. Designers are increasingly connecting the ideas of reuse-salvage of obsolete buildings and the paradigm of embedding flexibility to prevent future obsolescence. More inter-connected research into these fields, exploring design solutions suitable to reach the goal of successful; long lasting preservation of significant architectural buildings would be welcome.
References Andrade, J., Castro, M. d. F. & Bragança, L., 2019. Flexible and adaptive buildings since early design stage BAMB-
Building Materials Banks View project Special Issue "Building Sustainability Assessment" on Buildings Journal View project. s.l., s.n., pp. 1298-1307.
Anon., n.d. Federal Woollen Mills. [Online] Available at: https://www.pinterest.com.au/pin/65161525833002108/ (accessed 17 April 2020).
Atkin, L., 2016. Canopy of industry: Tonsley Main Assembly Building Redevelopment. [Online] Available at: https://architectureau.com/articles/tonsley-main-assembly-building-redevelopment/# (accessed 28 April 2020).
BETA, 2018. BETA recognition and press - 12.04.18. [Online] Available at: https://beta-office.com/recognition-press/gouden-a-a-p-2018/ (accessed 5 May 2020).

460
Marisa Claudia Martínez, Sarah Shuchi and Susan Ang
Brand, S., 1994. How buildings learn : what happens after they're built. New York: Viking. Centre Canadien d’Architecture, n.d. Fun Palace: interior perspective. [Online]
Available at: https://www.cca.qc.ca/fr/recherche/details/collection/object/378817 (accessed 8 May 2020). Conejos, S., Langston, C. & Smith, J., 2011. Improving the implementation of adaptive reuse strategies for historic
buildings. Naples, Institute of Sustainable Development and Architecture. Conejos, S., Langston, C. & Smith, J., 2014. Designing for better building adaptability: A comparison of adaptSTAR
and ARP models. Habitat International, Volume 41, pp. 85-91. De Jong, U. M., 2007. Positing a holistic approach to sustainability, s.l.: s.n. Groák, S., 1992. The idea of building : thought and action in the design and production of buildings. First edition ed.
London ; New York: E & FN Spon. Günçe, K. & Mısırlısoy, D., 2015. Questioning the Adaptive Reuse of Industrial Heritage and Its Interventions in the
Context of Sustainability. Sociology Study, 28 9.5(9). Hamilton Group, 2020. Federal Mills (Properties & Precincts). [Online]
Available at: http://www.hamilton.net.au/federalmills (accessed 18 May 2020). Kronenburg, R., 2007. Flexible Architecture that responds to the change. London: Lawrence King Publishing. Langston, C. A., 2008. The Sustainability Implications of Building Adaptive Reuse Professor of Construction and
Facilities Management. Beijing, s.n. Mark Dean, J. S., 2018. Evaluating the efficacy of policymaking for Tonsley: a hub driving regional innovation?. s.l.,
s.n.Martinez, M., 2020. Long-term preservation of significant industrial building in Australia: Flexible design strategies
enabling repeated cycles of adaptive reuse, s.l.: s.n. Mehr, S. Y., Skates, H. & Holden, G., 2017. Adding More by Using Less: Adaptive Reuse of Woolstores. Procedia
Engineering, Volume 180, pp. 697-703. Özkoç, O., 2009. Social Potentials of Pattern: Cedric Price’s Fun Palace Thesis O Ozkoc Cedric price fun place, s.l.: s.n.
Petković-Grozdanovića, N., Stoiljković, B., Keković, A. & Murgul, V., 2016. The Possibilities for Conversion and Adaptive Reuse of Industrial Facilities into Residential Dwellings. Procedia Engineering, Volume 165, pp. 1836-
1844. PIVOT CITY, n.d. 100 Years of Innovation at the Federal Mills. [Online]
Available at: https://www.federalmills.com.au/history (accessed 28 April 2020). RAIA, 2004. Adaptive reuse : preserving our past, building our future, Canberra: Heritage Division, Dept. of the
Environment and Heritage. RenewalSA, 2018. TONSLEY TO REPRESENT AUSTRALIA AT VENICE BIENNALE. [Online]
Available at: https://renewalsa.sa.gov.au/tonsley-to-represent-australia-at-venice-biennale/ (accessed 28 April 2020).
Shuchi, S., Drogemuller, R. & Buys, L., 2017. A conceptual design framework to incorporate flexibility in airport terminals. Journal of Airport Management, .
Tonsley, 2013. MAB Development Manual, Adelaide: s.n. Tonsley, 2020. Tonsley- Heritage History. [Online]
Available at: https://tonsley.com.au/about/heritage-history/ (accessed 2 May 2020). Victorian Heritage, 2020. FORMER FEDERAL WOOLLEN MILLS, s.l.: s.n. Woods Bagot, 2018. Tonsley Main Assembly Building and Pods / Woods Bagot. [Online]
Available at: https://www.archdaily.com/896363/tonsley-main-assembly-building-and-pods-woods-bagot (accessed 2 May 2020).
Woods Bagot, T. A., n.d. Adelaide adaptive reuse: a sign of a city in transition. [Online] Available at: https://www.architectureanddesign.com.au/projects/mixed-use/adelaide-adaptive-reuse-a-sign- of-a-city-in-transi# (accessed 1 May 2020).

461
The 54th International Conference of the Architectural Science Association (ANZAScA) 2020
Energy and Cost Optimization for Residential Improvement Options
Arezoo Shirazi1 and Amirpooya Shirazi2 1 University of Technology Sydney, Sydney, Australia
[email protected] 2 University of Tehran, Tehran, Iran
Abstract: US started to implement building energy codes and energy efficiency regulations from 1980s. However, the existing pre-code buildings are still a significant fraction of the nation’s housing stock. Although various retrofit options and technologies are proposed throughout the years, homeowners are still reluctant to renovate due to the high upfront costs. This research focused on pre-code buildings in Atlanta and implemented a retrofit cost optimization analysis on a potential mix of improvements and technologies to investigate the opportunities for cost-effective energy efficiency and renewable energy retrofit options in pre-1980s residential buildings of the region. To this end, a baseline building is selected from previous case studies. The building was originally built in the 1920s, as a one story, single- family detached home with 3,380 square feet of living area located in Atlanta metropolitan. The baseline building was modeled using the Energy Performance Calculator (EPC) energy modeling software. Additionally, multiple improvement options and associated costs were proposed and simulated to investigate the energy efficiency impacts on the baseline model. Finally, an optimization model was solved using the EPC-TechOpt to find the most efficient energy improvement options while keeping the cost at the lowest possible level. The results showed that the best solutions are achievable with approximately 20-40 thousand dollars of investment with the focus on smart lighting management, wall and windowinsulation and heat pump improvements.
Keywords: Single-Family Detached; Pre-1980s; Energy Modeling; Retrofit Options
1. IntroductionBuildings’ share of the total worldwide energy consumption is approximately one third (UNEP, 2009). According to a study in India, in a worldwide scale, 30–40% of all primary energy is used for buildings and they are held responsible for 40–50% of GHG emissions. (Ramesh, Prakash and Shukla, 2010). Additionally, the United Nations Environment Program (UNEP) predicted that 87% of the US population will be living in urban areas by 2030 (United Nations World Water Development Report, 2015). The growing energy use has raised various concerns including heavy environmental impacts.
Imaginable Futures: Design Thinking, and the Scientific Method. 54th International Conference of the Architectural Science Association 2020, Ali Ghaffarianhoseini, et al (eds), pp. 461–470. © 2020 and published by the Architectural Science Association (ANZAScA).

462
Arezoo Shiraziand Amirpooya Shirazi
Studies estimating operational energy consumption primarily use either top-down or bottom-up models. The top-down models typically estimate local residential energy consumption from regional level estimates using factors, such as gross domestic product (Hirst, 1978; Saha and Stephenson, 1980), technology attributes (Haas and Schipper, 1998), price, total population, and evolution of housing stocks (Nesbakken, 1999; Zhang, 2004). The bottom-up approach consists two genres of models, including the statistical models and the engineering models. The results from statistical models are generally analyzed to interpret the correlations of energy consumption with various individual-level characteristics, such as the size of housing units, socio-economic and demographic features, local heating and cooling degree days (Hirst, Goeltz and White, 1986; Raffio et al., 2007) and behaviors, including financial and cultural motivations in energy use (Douthitt, 1989; Fung, Aydinalp and Ugursal, 1999). The aim of statistical models is to understand the variation in energy use given changes in various occupant characteristics, so that policies can be derived to monitor energy price and provide ethical or financial motivations to regulate or curb energy consumptions (Chen, Wang and Steemers, 2013; Jain et al., 2014). Some recent model efforts use more advanced machine learning models such as neural networks and support vector machine to estimate residential energy consumptions (Aydinalp, Ismet Ugursal and Fung, 2002, 2004; Dong, Cao and Lee, 2005). However, these models are also data intensive and are difficult to be applied to large study areas.
The engineering models compute energy consumptions based on the energy ratings of various appliances, building materials, applied energy saving technology on-site and thermodynamic theorems (Zhao and Magoulès, 2012). Specifically, this approach first estimates energy consumption for a series of typical prototypes or archetypes of housing stocks in the region, using a small sample of buildings. The occupant behaviors are not captured but simplified to various assumptions. Different from the statistical models, the objective of engineering models is to extrapolate the results to the entire region so that the total residential energy consumption or the changes in consumption under various technology penetration scenarios can be obtained. The extrapolation is usually made by assigning weights, estimated based on regional housing inventory, to the sampled buildings. several software and calculation standards are developed to estimate building energy consumption using this modeling approach (Crawley et al., 2008).
In this paper, the authors used an engineering method to model a residential building, located in the Atlanta metropolitan area. Additionally, multiple improvement options and associated costs were proposed and simulated accordingly to investigate the energy efficiency impacts on the baseline model. The paper finally conducted an optimization methodology to find the most efficient energy improvement options while keeping the cost at the lowest possible level.
2. Baseline case studyThe Case study of this project is a one story, single-family detached house located in Atlanta Metropolitan area. The house was originally built in 1920s, with 3380 square feet living area (314 square meters) and 11 feet (3.35 meter) height. The initial information and characteristics of the building were extracted from the Oak Ridge National Lab (ORNL) report (Jackson, E. Kim, et al., 2012). Based on the extracted information, a family of two adults and one child has rented this home for more than three years. Figure 1 represents the house.

463
Energy and Cost Optimization for Residential Improvement Options
The house has a traditional vented attic and a vented crawlspace. Regarding the energy conservation measure, the residents set the thermostat to 58°F (around 15°C) at night and a typical range of 62-68°F (around 17-20°C) in the day. The envelope is bounded by an insulated framed floor above the vented crawlspace and an insulated ceiling plane above the first floor (Attic ceiling = R-11). The R-13 batts (rock wool) is the most common material of the attic knee walls. In addition to the knee walls, there were also attic bypasses into interior wall cavities. No exterior wall insulation was observed for the house. In the ceiling of the crawlspace (i.e. subfloor), there were R-13 fiberglass batts that were recently installed. The windows in this home are all single pane windows with wood frames. The total air leakage rate was 9,840 CFM50. With a conditioned volume of 39,853 cubic feet, the air exchange rate for the house was approximately 14.8 ACH50.
Figure 1. The one story, single-family detached house of the case study
2.1. Case study energy simulation
After extracting the initial characteristics of the case study from the ORNL report, required information were gathered for modeling the building into a building energy simulation tool. Based on the residents’ feedback on the usual thermostat sets, the setpoints were identified as shown in Table 1 and used to model the building. Additionally, several assumptions were made as listed as listed in Table 2 for the unknown variables based on the characteristics of a generic building in the region.
Table 1. Temperature setpoints on weekends and weekdays
Day/Time 12-8 am 8 am – 6 pm 6 pm - midnightWeekday (Heating) 15 °C 20 °C 16 °C Weekend (Heating) 15 °C 18 °C 16 °C Weekday (Cooling) 27 °C 25.6 °C 27 °C
Weekend (Cooling) 27 °C 27 °C 27 °C

464
Arezoo Shiraziand Amirpooya Shirazi
Table 2. Additional assumptions made to cover the unknown variables for modeling
Assumption Number Assumption Description 1 The house is facing South 2 It is a 37.5 * 90 sqft (27.432 * 11.43 m^2) rectangular house 3 0.4 window/wall ratio in south side 4 0.2 window/wall ratio in other 3 sides 5 All windows with white curtain inside with 0.8 Shading Reduction Factor (SRF)
The case study was then modeled using a building energy simulator called Energy Performance Calculator (EPC) developed by the High Performance Building Lab at Georgia Tech (Quan et al., 2015). The monthly heating and cooling results are shown in Figure 2 and the total delivered heating and cooling energy is presented in Figure 3.
Figure 2. Heating and cooling per month through the year for the baseline building
Figure 3. Total delivered energy (heating & cooling) of baseline building per month through the year

465
Energy and Cost Optimization for Residential Improvement Options
Based on the EPC models, the building used 13 kWh/m^2/year more heating in comparison to cooling which is acceptable based on the location of the building in south east of the US. Moreover, the total heating and cooling load of the building is calculated as 102 kWh/m^2/year which is close enough to reference number of the energy consumption of a house in that area.
3. Improvement optionsImprovement technology options of the region and the associated costs were extracted from both the ORNL case study and the actual options which were used to retrofit the residential buildings in the study (Jackson, E.-J. Kim, et al., 2012) as well as the US National Renewable Energy Laboratory (NREL) repository of retrofit audits and cost estimations (Eisenberg, Shapiro and Fleischer, 2012). These numbers then were adjusted for the baseline case study of section 2.
Based on the identified improvement options, the options were then categorized into static or continuous variables. Hence, the input variables were added to the model to be accounted for the optimization problem. The advanced version of EPC-TechOpt were used for adding the retrofit options and the cost constraints into the originally developed simulation model of the building. The final selected static retrofit options, their characteristic and the associated costs were discussed clearly in Tables 3, 4, 5 and 6.
Table 3. Identified improvement options for roof and opaque insulation of the building.
Improvement U-value Emissivity Absorption Cost Cost Reference options Coefficient (USD)
Roof Insulation 2 0.276 (W/(m^2 K)) 0.6 0.7 3,400 ORNL Report 3 0.162 (W/(m^2 K)) 0.5 0.6 7,330 ORNL Report
Opaque Insulation 2 0.34 (W/(m^2 K)) 0.7 0.6 3,500 ORNL Report 3 0.29 (W/(m^2 K)) 0.8 0.6 6,800 ORNL Report
Table 4. Identified improvement options for the Heating and Cooling Plants Efficiencies (COP).
Improvement Options
Heating COP Cooling COP
Cost (USD)
Cost Reference
Heating and Cooling Plants 2 0.91 3.9 7,000 ORNL Report
Efficiencies (COP) 3 0.95 4.32 9,000 ORNL Report
4 0.95 4.86 12,000 ORNL Report
Table 5. Identified improvement options for window insulation of the building.
Improvement Options
U-value SHGC
Emissivity
Cost (USD)
Cost Reference
2 2.46 W/(m^2) 0.35 0.7 6,145 NREL Window 3 1.25 W/(m^2) 0.475 0.24 14,410 NREL
4 1.16 W/(m^2) 0.53 0.25 25,786 NREL

466
Arezoo Shiraziand Amirpooya Shirazi
Table 6. Other identified improvement options for the building.
Improvement Options Cost Cost Reference Appliances Energy star 1.68 watt/m^2 3,337 ORNL Report Lighting 2 4.1 watt/m^2 825 ORNL Report Lighting Occupancy Factor Fully automated - 250 NREL DHW Generation System Heat pump (1.4) - 2,760 ORNL+NREL
On the other hand, the only technology option identified as the continuous variable was the building leakage level. To correctly implement this variable into the model, the following regression analysis conducted as shown in Figure 4 and the extracted continuous equation was used instead for this variable in the model.
Figure 4. Regression analysis conducted to find the continuous equation for this variable.
4. Optimization results analysisThe objectives of the optimization in this research was to minimize total delivered energy while restricting improvement cost to a certain amount. As mentioned previously, EPC-TechOpt tool was used to conduct the optimization process throughout the building energy modeling. Tech-Opt is an added feature to the original EPC calculator which is also developed by the High-Performance Building Lab at Georgia Tech. It actually brings a template in the EPC ‘input’ spreadsheet to be populated with data related to the optimization problem (Simmons et al., 2015).

467
Energy and Cost Optimization for Residential Improvement Options
Table 7. The result of economic estimation with NPC method
Improvement Technology Cost Minimized Delivered Energy Energy NPC Total Saving Options Restriction (kwh/m^2/year) Improveme
Percentage nt(USD) (USD)
Baseline - 305 - 142,525.85 - Solution 1 70k 99.09 67.5 116,095.10 26,431 Solution 2 60k 99.85 67.26 105,076.55 37,449 Solution 3 50k 105.32 65.47 99,010.63 43,515 Solution 4 40k 119.76 60.7 95,939.15 46,587 Solution 5 30k 136.86 55.1 93,919.91 48,606 Solution 6 20k 164.30 46.1 96,736.87 45,789 Solution 7 10k 228.16 25.2 116,578.88 25,947
The results of the optimization analysis are shown in Table 7, considering various cost restrictions. As we can see from the results, by decreasing the retrofit cost restrictions, the minimized delivered energy increased. From the authors’ point of view, the solutions number 4, 5 and 6 are the best options which save the highest amount over years and also still decrease the energy consumption by 55-65%. Details about some of the aforementioned solutions are provided in the following paragraphs.
4.1. Nominated Solution #4
The objective of the optimization in this scenario was to minimize total delivered energy while keeping the retrofit cost lower than 40k. The final solution for this optimization problem is listed in Table 8.
Table 8. Cost details in case of solution #4
Variable Technology Result Cost (USD) Roof Insulation 2 3400 Heating and Cooling Plants Efficiencies (COP) 2 7000 Window 3 14,409 Appliances Baseline 0 Lighting Baseline 0 Lighting Occupancy Factor Fully automated 250 Opaque Insulation 2 3500 DHW Generation System Heat pump (1.4) 2760 Building Air Leakage Level 1.43 8680.21
In this solution, the delivered energy will reduce to 119.75 (kwh/m^2/year) from the original number of 305 (kwh/m^2/year) for the base case scenario. On the other hand, by saving around 60% on the operational energy consumption over the next 20 years of the operation of the building, this solution will save the total amount of $46,586.3 (considering 3% interest rate) for the building.
4.2. Nominated Solution #5
The objective of the optimization in this scenario was to minimize total delivered energy while keeping the retrofit cost lower than 30k. The final solution for this optimization problem is listed in Table 9.

468
Arezoo Shiraziand Amirpooya Shirazi
Table 9. Cost details in case of solution #5
Variable Technology Result Cost (USD) Roof Insulation Baseline 0 Heating and Cooling Plants Efficiencies (COP) 3 9000 Window 2 6145 Appliances Baseline 0 Lighting Baseline 0 Lighting Occupancy Factor Fully automated 250 Opaque Insulation 2 3500 DHW Generation System Heat pump (1.4) 2760 Building Air Leakage Level 1.51 8344.93
In this solution, the delivered energy will reduce to 136.83 (kwh/m^2/year) from the original number of 305 (kwh/m^2/year) for the base case scenario. On the other hand, by saving around 55% on the operational energy consumption over the next 20 years of the operation of the building, this solution will save the total amount of $48,605.46 (considering 3% interest rate) for the building.
4.3. Nominated Solution #6
The objective of the optimization in this scenario was to minimize total delivered energy while keeping the retrofit cost lower than 20k. The final solution for this optimization problem is listed in Table 10.
Table 10. Cost details in case of solution #6
Variable Technology Result Cost (USD) Roof Insulation Baseline 0 Heating and Cooling Plants Efficiencies (COP) Baseline 0 Window 2 6145 Appliances Baseline 0 Lighting Baseline 0 Lighting Occupancy Factor Fully automated 250 Opaque Insulation 2 3500 DHW Generation System Heat pump (1.4) 2760 Building Air Leakage Level 1.78 7328.11
In this solution, the delivered energy will reduce to 164.30 (kwh/m^2/year) from the original number of 305 (kwh/m^2/year) for the base case scenario. On the other hand, by saving around 46% on the operational energy consumption over the next 20 years of the operation of the building, this solution will save the total amount of $45,788.98 (considering 3% interest rate) for the building.
5. ConclusionIn this paper, a 1920s one story, single-family detached home located in Atlanta Metropolitan area was modeled and analyzed using a reduced order building energy simulation model created in the EPC which originated from the ISO 2008 energy performance of buildings and was later adapted for specific research use (Lee, Zhao and Augenbroe, 2013). The optimal improvement option is tested with different existing technologies. The ultimate optimization goal is to minimize the energy consumption rate over an investment time horizon of 20 years.

469
Energy and Cost Optimization for Residential Improvement Options
The results of the optimization analysis showed that the best solutions are achievable with approximately 20-40 thousand dollars of investment with the focus on smart lighting management, wall and windowinsulation and heat pump improvements. The results were also compared with the real retrofit solutionsused in the ORNL report to retrofit the same building (Jackson, E. Kim, et al., 2012). In this case, the report showed the attic and knee wall insulation as well as heating and cooling system improvements among the retrofit solutions used for the building. The actual retrofit solutions resulted in an approximation of 27% energy saving over a year of building operation.
References Aydinalp, M., Ismet Ugursal, V. and Fung, A. S. (2002) ‘Modeling of the appliance, lighting, and space-cooling energy
consumptions in the residential sector using neural networks’, Applied Energy. Elsevier, 71(2), pp. 87–110. doi: 10.1016/S0306-2619(01)00049-6.
Aydinalp, M., Ismet Ugursal, V. and Fung, A. S. (2004) ‘Modeling of the space and domestic hot-water heating energy-consumption in the residential sector using neural networks’, Applied Energy. Elsevier, 79(2), pp. 159– 178. doi: 10.1016/J.APENERGY.2003.12.006.
Chen, J., Wang, X. and Steemers, K. (2013) ‘A statistical analysis of a residential energy consumption survey study in Hangzhou, China’, Energy and Buildings. Elsevier, 66, pp. 193–202. doi: 10.1016/J.ENBUILD.2013.07.045.
Crawley, D. B. et al. (2008) ‘Contrasting the capabilities of building energy performance simulation programs’, Building and Environment. Pergamon, 43(4), pp. 661–673. doi: 10.1016/J.BUILDENV.2006.10.027.
Dong, B., Cao, C. and Lee, S. E. (2005) ‘Applying support vector machines to predict building energy consumption in tropical region’, Energy and Buildings. Elsevier, 37(5), pp. 545–553. doi: 10.1016/J.ENBUILD.2004.09.009.
Douthitt, R. A. (1989) ‘An economic analysis of the demand for residential space heating fuel in Canada’, Energy. Pergamon, 14(4), pp. 187–197. doi: 10.1016/0360-5442(89)90062-5.
Eisenberg, L., Shapiro, C. and Fleischer, W. (2012) Retrofit Audits and Cost Estimates: A Look at Quality and Consistency. Golden, CO (United States). doi: 10.2172/1055375.
Fung, A., Aydinalp, M. and Ugursal, V. (1999) ‘Econometric models for major residential energy end-uses’. Available at: https://scholar.google.com/scholar?hl=en&as_sdt=0%2C11&q=Econometric+models+for+major+residential+en ergy+end-uses&btnG= (Accessed: 21 April 2018).
Haas, R. and Schipper, L. (1998) ‘Residential energy demand in OECD-countries and the role of irreversible efficiency improvements’, Energy Economics. North-Holland, 20(4), pp. 421–442. doi: 10.1016/S0140-9883(98)00003-6.
Hirst, E. (1978) ‘A model of residential energy use’, SIMULATION. Sage PublicationsSage CA: Thousand Oaks, CA, 30(3), pp. 69–74. doi: 10.1177/003754977803000301.
Hirst, E., Goeltz, R. and White, D. (1986) ‘Determination of household energy using “fingerprints” from energy billing data’, International Journal of Energy Research. Wiley-Blackwell, 10(4), pp. 393–405. doi: 10.1002/er.4440100410.
Jackson, R. K., Kim, E., et al. (2012) Advancing Residential Retrofits in Atlanta. Oak Ridge National Laboratory. Jackson, R. K., Kim, E.-J., et al. (2012) Advancing Residential Retrofits in Atlanta. Available at:
http://www.ntis.gov/support/ordernowabout.htm (Accessed: 27 August 2017). Jain, R. K. et al. (2014) ‘Forecasting energy consumption of multi-family residential buildings using support vector
regression: Investigating the impact of temporal and spatial monitoring granularity on performance accuracy’, Applied Energy. Elsevier, 123, pp. 168–178. doi: 10.1016/J.APENERGY.2014.02.057.
Lee, S. H., Zhao, F. and Augenbroe, G. (2013) ‘The use of normative energy calculation beyond building performance rating’, Journal of Building Performance Simulation, 6(4), pp. 282–292. doi: 10.1080/19401493.2012.720712.
Nesbakken, R. (1999) ‘Price sensitivity of residential energy consumption in Norway’, Energy Economics. North- Holland, 21(6), pp. 493–515. doi: 10.1016/S0140-9883(99)00022-5.

470
Arezoo Shiraziand Amirpooya Shirazi
Quan, S. J. et al. (2015) ‘Urban data and building energy modeling: A GIS-based urban building energy modeling system using the urban-EPC engine’, in Lecture Notes in Geoinformation and Cartography. Kluwer Academic Publishers, pp. 447–469. doi: 10.1007/978-3-319-18368-8_24.
Raffio, G. et al. (2007) ‘Targeting Residential Energy Assistance’, in ASME 2007 Energy Sustainability Conference. ASME, pp. 489–495. doi: 10.1115/ES2007-36080.
Ramesh, T., Prakash, R. and Shukla, K. K. (2010) ‘Life cycle energy analysis of buildings: An overview’, Energy and Buildings, 42(10), pp. 1592–1600. doi: 10.1016/j.enbuild.2010.05.007.
Saha, G. P. and Stephenson, J. (1980) ‘A model of residential energy use in New Zealand’, Energy. Pergamon, 5(2), pp. 167–175. doi: 10.1016/0360-5442(80)90005-5.
Simmons, B. et al. (2015) ‘Determining the cost optimum among a discrete set of building technologies to satisfy stringent energy targets’, in Artificial Intelligence for Engineering Design, Analysis and Manufacturing: AIEDAM. Cambridge University Press, pp. 417–427. doi: 10.1017/S0890060415000414.
UNEP (2009) ‘Buildings and Climate Change’. United Nations World Water Development Report (2015). Available at:
http://www.unwater.org/publications/publications-detail/en/c/281166/. Zhang, Q. (2004) ‘Residential energy consumption in China and its comparison with Japan, Canada, and USA’, Energy
and Buildings. Elsevier, 36(12), pp. 1217–1225. doi: 10.1016/J.ENBUILD.2003.08.002. Zhao, H. and Magoulès, F. (2012) ‘A review on the prediction of building energy consumption’, Renewable and
Sustainable Energy Reviews. Pergamon, 16(6), pp. 3586–3592. doi: 10.1016/J.RSER.2012.02.049.

471
The 54th International Conference of the Architectural Science Association (ANZAScA) 2020
Energy retrofit of historic buildings in Aotearoa New Zealand: current practice, challenges and opportunities
Priscila Besen1, Paola Boarin2
1, 2 University of Auckland, Auckland, New Zealand [email protected], [email protected]
Abstract: Energy retrofitting historic buildings can be an effective way to enhance their indoor environmental quality, to save energy and to ensure they have a longer lifespan. As the literature on Aotearoa/New Zealand’s approaches to such topics is very limited, this study aims to understand current practices, challenges and opportunities in retrofitting historic buildings in the country. Therefore, the research included a literature review, an online questionnaire and follow-up interviews with practitioners involved with retrofit works in the country, including professionals from the public and private sector. The results reveal a general interest in the uptake of energy retrofit, but a lack of practical applications in New Zealand projects. The main barriers to implementing energy retrofit in historic buildings were the perceived cost of these interventions, the lack of interest from building owners and uncertainties about the necessary approvals from heritage authorities. Participants pointed out to solutions to encourage this practice, which included clearer guidance documents from heritage authorities, further education for the building industry and building owners about the benefits of energy retrofit, and financial incentives for maintaining and upgrading listed heritage buildings.
Keywords: Building retrofit; Historic buildings; Energy retrofit; Industry practice.
1. IntroductionImproving the energy performance of historic buildings is a crucial measure to protect them from obsolescence and to reduce greenhouse gas (GHG) emissions, as the building industry has been urged to decarbonise by 2050 and to achieve the 2030 Agenda for Sustainable Development, especially Goal 11 – Sustainable Cities and Communities (United Nations, 2015). Adapting and reusing historic buildings is an effective way to avoid embodied emissions related to new construction, while their energy retrofit provides an opportunity to reduce operational energy use (Martínez-Molina et al., 2016; Webb, 2017). ICOMOS (the International Council on Monuments and Sites) has pointed out that cultural heritage offers significant potential to drive climate action and has recommended energy retrofitting historic buildings in ways that conserve heritage values (ICOMOS Climate Change and Cultural Heritage Working Group, 2019). Internationally, the adaptation of historic buildings through energy retrofit has had intense development in research and practice in the last decade, now being recognised as a measure to help with the protection of heritage buildings by providing healthy indoor environments that can have a longer lifespan (Martínez-Molina et al., 2016; Webb, 2017). These retrofit projects are often described as a balancing act between optimisation and conservation of original features (Webb, 2017), aiming to find equilibrium between energy efficiency, mandatory heritage conservation requirements and users’ thermal comfort, a combination that can be oftentimes challenging (Martínez-Molina et al., 2016). This balance can be successfully achieved when conservation is planned by an interdisciplinary team of experts (Troi and Bastian, 2015). Several studies have analysed current energy retrofit practice, barriers, challenges,
Imaginable Futures: Design Thinking, and the Scientific Method. 54th International Conference of the Architectural Science Association 2020, Ali Ghaffarianhoseini, et al (eds), pp. 471–480. © 2020 and published by the Architectural Science Association (ANZAScA).
472
Priscila Besen, Paola Boarin
perceptions and subjective components involved in decision-making related to retrofitting historic buildings in other countries, finding several inconsistencies between policies and practice, and many challenges due to financial constraints (Davies and Osmani, 2011; Friedman and Cooke, 2012).
However, in Aotearoa New Zealand, development in this field is still limited. The country passed the Zero Carbon Act in 2019 to reduce emissions; however, this has not been translated into significant policy changes for the built environment yet. The New Zealand Building Code mandates minimum energy efficiency in new construction (Ministry of Business Innovation & Employment, 2017), but there are no extensive policies to encourage, regulate or mandate the energy retrofit of existing buildings, apart from limited regulations to upgrade the building envelope and heating in residential rental properties (New Zealand Government, 2017). The focus of historic building retrofit in the country has been on another issue: seismic strengthening. After many tragic earthquakes, policies have been put in place to enforce seismic strengthening of earthquake-prone buildings (Ministry of Business Innovation & Employment, 2016). Apart from seismic performance, refurbishment work only needs to comply 'as nearly as is reasonably practicable' with the New Zealand Building Code for fire and accessibility clauses (if applicable), including evidence of weighing up the sacrifices and benefits of achieving full compliance (Ministry of Business Innovation & Employment, 2020). Regarding energy retrofit of listed heritage buildings, guidance from the national heritage authority, Heritage New Zealand Pouhere Taonga (HNZPT), is limited. The institution published a guideline for the sustainable management of historic heritage in 2007 (McClean, 2007), including brief mentions to energy efficiency. However, these guidelines are just general recommendations and they are not mandatory; in addition, some of the guidance is now outdated. Another brief source of guidance from HNZPT states that windows and doors should be repaired rather than replaced, double glazing should be discouraged and secondary glazing should be adopted in a way that does not obscure the original window or the design pattern of sash joinery or create a reflective effect (New Zealand Historic Places Trust Pouhere Taonga, 2007).
Since there are no mandatory requirements, incentives or extensive guidance available for the energy upgrade of historic buildings in Aotearoa, current practice is carried out on a voluntary basis, resulting in diverse approaches and levels of intervention. There is a lack of knowledge about the state- of-the art of deep energy retrofit practices in New Zealand historic building stock (Besen, Boarin and Haarhoff, 2020) and the barriers to its uptake. Gronert (2011) carried out one of the few studies on this topic, by interviewing architects involved in renovation of State Housing built in the 1930s-1950s. It revealed that no significant thermal upgrades were carried out as part of these projects because of budget constraints or lack of consideration about indoor environmental quality; thermal insulation was improved only in areas affected by new building works, and timber windows remained single glazed. Moreover, until present, no extensive studies focused on understanding the challenges, barriers and opportunities to undertake energy retrofit in historic buildings in Aotearoa by understanding the views of professionals involved in these projects. This study aims to investigate in the New Zealand context: (1) the state-of-the-art of historic building energy retrofit practice and the most common interventions being implemented; (2) the balance between different disciplines in retrofit projects; (3) the main barriers to the uptake ofenergy retrofit, including technical and subjective issues; (4) the impact of heritage policies and approvals processes on the uptake of energy retrofit; (5) opportunities for encouraging energy retrofit and thepossible integration of energy upgrades with mandatory seismic retrofitting. To address these points, this publication presents the findings from an online questionnaire and interviews with professionals aboutthe application of energy retrofit in historic buildings.
2. MethodologyThe study consisted of mixed methods, including quantitative and qualitative data collection through a literature review published by the authors (Besen, Boarin and Haarhoff, 2020), followed by a questionnaire and interviews that are presented in this article. An anonymous online questionnaire was designed and offered to professionals working in heritage conservation, architectural design and

473
Energy retrofit of historic buildings in Aotearoa New Zealand: current practice, challenges and opportunities
engineering in private and public organisations, with the aim of gathering quantitative and qualitative data about common practices in retrofit projects in New Zealand. The questionnaire consisted of 18 multiple-choice and matrix-rating questions, as well as 5 open-ended questions. It was distributed through the Qualtrics online platform and was open for participation from November 2018 to January 2019. Invitations were sent to 1,906 email addresses obtained from publicly available sources on professional organisations’ websites, as well as from an online search of keywords. These institutions included the New Zealand Registered Architects Board, the New Zealand Green Building Council, the Passive House Institute New Zealand, ICOMOS New Zealand, Engineering New Zealand, HNZPT and local city councils. For simplification purposes, the terms ‘retrofit’, ‘renovation’ and ‘alteration’ were used as synonyms, meaning any adaptations to historic buildings. The questions also clarified that the term ‘historic building’ included any building with historic value and not only listed/scheduled heritage.
After the conclusion of the questionnaire, follow-up in-depth semi-structured interviews were designed to build upon the quantitative and qualitative data collected. The interview procedures enabled participants to comment on questions that arose from questionnaire results and allowed an interviewer-interviewee interactive discussion, providing more detail on these topics. Six professionals were interviewed, who were selected according to the following criteria: (1) level of professional experience on the subject; (2) representation of different disciplines; (3) representation of public and private sector; (4) participation in the questionnaire; and (5) expression of interest in taking part in a follow-up face-to-face interview. Therefore, the interviews provide a range of different views on this subject, covering different disciplines and backgrounds.
3. Results and DiscussionThe questionnaire obtained 234 responses, out of 1,906 email invitations sent, resulting in a response rate of 12.3%. This is a relatively high percentage considering that participation was on a volunteer basis and also that not all invited professionals were necessarily involved with retrofit or were interested in this topic. Respondents were from diverse professions in the building industry: architects or architectural designers (66%), engineers (8%), building science or environmental design consultants (6%), builders (4%), heritage conservation consultants (5%) and others (11%). The majority of respondents were architects – this high proportion is in line with the number of invitations, as well as a higher interest from these professionals since they are more closely involved in these projects. The occupations of selected interviewees were the following: one heritage advisor from a local city Council, one project manager, one conservation architect from the national heritage authority, one architect, one building science and services engineer and one structural engineer. The results and discussion of the questionnaire and interviews are presented in the following sections, ordered according to the main topics addressed.
3.1. General views about retrofit and balance between different disciplines Questionnaire participants were asked about their general views on the adaptation of historic buildings for the future, and 89% of respondents answered that “historic buildings should be upgraded to new requirements and technologies in a sensible way that maintains their character”. These views reflect the current thinking that adapting historic buildings to current demands is a fundamental action for their protection. This was reinforced by one of the interviewees, a Senior Conservation Architect from HNZPT: “[energy retrofits] can be achieved if they are done in a sensitive and thoughtful way (…). We need historic buildings to be functional, useful, and good environments for people to be in, people have to be comfortable and they have to value the place. Otherwise, we end up with buildings that are abandoned and unused, because they have just been foreseen as being too difficult to deal with.” Questionnaire respondents generally agreed that the energy performance of historic buildings can be improved with energy retrofit - 92% of them Generally Agreed (GA is the sum of ‘Agree’ and ‘Strongly Agree’). The idea

474
Priscila Besen, Paola Boarin
that historic buildings are more likely to be retained if they serve a useful purpose was widely agreed with (93% GA). Furthermore, a question asked whether historic significance and energy efficiency could coexist, to which 97% replied “yes” and 3% replied “no”, revealing general support to the idea that energy upgrades can be conciliated with heritage conservation agendas. However, when asked about the level of importance attributed to different disciplines, energy efficiency and thermal comfort were not considered high priorities when upgrading historic buildings in New Zealand. The answers in the questionnaire generally aligned with the focus of current policies - the main topics considered “very important” in the questionnaire were fire safety, structural stability and weathertightness. Energy efficiency and airtightness received a lower level of importance, and were ranked as 9th against other aspects, while thermal comfort was ranked as 5th. There were also remarks about the difference in priorities according to each region and climate in New Zealand. In one of the interviews, a heritage assets advisor from a city council acknowledged about energy retrofit that “particularly in the North Island, it just doesn’t seem to be on the radar at the moment. In the South Island, it is though, […] as they have a real winter down there […].” In fact, when isolating questionnaire responses from the South Island only, a higher priority was given to thermal comfort and energy efficiency when ranked against other aspects. Additionally, aesthetic or cosmetic upgrades, such as renovating internal finishes, were ranked as the least important issue when retrofitting historic buildings.
3.2. Current retrofit practice Participants were asked about common practices in the pre-intervention stage of retrofit design, by rating several practices against a five-point Likert-style scale indicating how often these are implemented. Site visits and manual measurements (ranked 1st), structural assessment (2nd) and analysis of original plans (3rd) were the most common pre-intervention practices. On the other hand, energy audits (10th), full 3D laser scanning (11th), building performance modelling (12th), and thermography (13th) were identified as the least common. The lack of these important diagnostics can lead to low quality solutions, as international guidance recommends careful reading of existing fabric before making any interventions to historic buildings (Troi and Bastian, 2015). One participant highlighted that “modelling the behaviour of buildings before and after retrofit would be of great benefit. Poorly applied retrofit can result in more damage over time”. Reinforcing this idea, a building services engineer added in an interview that “all too often you would see building retrofits that are limited to ‘what's the quickest and cheapest way that we can do this and move on to the next project’”. The limited use of pre-intervention diagnostics might also be related to the economic challenges (section 3.3).
Moreover, professionals were asked about common interventions undertaken in retrofit projects that they have worked on, considering the multiple disciplines usually involved in these projects (Table 1). The results confirm that the focus of most retrofit projects in New Zealand is on structural upgrades, considering the challenge of earthquakes and current regulations for mandatory seismic strengthening. The table also shows the prevalence of interior upgrades that are highly valued by the property market – updating kitchens and bathrooms was the second-highest ranked intervention. This contrasts with the responses discussed in section 3.1, where aesthetic/cosmetic upgrades were ranked second to last. Although most professionals had agreed with the statements about the integration between energy efficiency and heritage in the beginning of the questionnaire, the implementation of this in practice is limited - Table 1 reveals that energy retrofit is not widely applied. Roof insulation was the most common energy retrofit practice, ranked third amongst all other practices. This result aligns with the literature review on retrofit practice in New Zealand (Besen, Boarin and Haarhoff, 2020), and also with the fact that the visual impact of this intervention is usually less significant. It also aligns with the current policy for retrofitting residential rental properties (New Zealand Government, 2017), which only requires roof and underfloor insulation, if reasonably practicable - in practice, more roofs than floors are being insulated due to ease of access. Upgrading indoor lighting to LED was ranked as the 7th most common practice, which is also an intervention with low impact on heritage fabric. An interview with a project

475
Energy retrofit of historic buildings in Aotearoa New Zealand: current practice, challenges and opportunities
manager from a local council also revealed that LED lighting is usually considered one of the main “green” practices applied when renovating historic buildings. Participants reported that the addition of wall insulation (3.78), floor insulation (3.62), window upgrades (3.36) and upgrades to airtightness (3.27) were less common. 57% replied that they had never or rarely integrated renewable energy, such as photovoltaic panels, in retrofit projects. This aligns with the literature review, which did not find extensive examples of the implementation of these technologies in historic buildings in the country. Overall, improving energy efficiency and thermal comfort was considered important in principle, but its implementation is limited to simple upgrades such as roof insulation and LED lighting, which are a step in the right direction but do not guarantee a comfortable and efficient building.
Table 1 - Frequency of interventions undertaken in renovation projects
Interventions in retrofit projects Likert Scale Values (%)* Mean Ranking 1 2 3 4 5
Structural strengthening/upgrading 0% 1% 16% 46% 37% 4.19 1 Updating kitchens and bathrooms 0% 0% 14% 58% 28% 4.14 2 Upgrading/introducing insulation to ceilings/ roofs 1% 1% 19% 48% 31% 4.07 3 Upgrading services, e.g. electrical, plumbing, telecom 1% 0% 21% 55% 23% 3.99 4 Basic conservation of existing features 1% 1% 19% 60% 19% 3.95 5 Improving weathertightness 1% 5% 20% 56% 18% 3.85 6 Upgrading lighting to LED 1% 3% 30% 44% 22% 3.83 7 Upgrading/introducing thermal insulation to walls 1% 2% 35% 42% 20% 3.78 8 Relining walls / ceilings 1% 2% 32% 54% 11% 3.72 9 Upgrading/introducing thermal insulation to floors 1% 11% 30% 41% 17% 3.62 10 Installing/upgrading HVAC systems 1% 3% 41% 45% 10% 3.60 11 Remodelling the internal layout 2% 7% 35% 43% 13% 3.58 12 Renovating interior flooring 2% 3% 43% 43% 9% 3.54 13 Restoration of elements to their original state 2% 5% 47% 41% 5% 3.42 14 Alterations for adaptive reuse 3% 8% 40% 43% 6% 3.41 15 Upgrading windows (glazing and/or frames) 3% 10% 40% 42% 5% 3.36 16 Additions/extensions to increase the floor area 2% 10% 43% 40% 5% 3.36 17 Improving airtightness 3% 14% 41% 37% 5% 3.27 18 Integrating renewable energy sources such as PV panels 19% 38% 35% 8% 0% 2.32 19 * 1 – never, 2 – rarely, 3 – sometimes, 4 – very often, 5 – always
One question focused specifically on different types of window upgrades in historic buildings (Figure 1), since some strategies commonly utilised in other countries are not being applied in New Zealand’s historic buildings. Secondary glazing (A) was the least common type of window upgrade, with only 12% of responses, even though it is encouraged by HNZPT’s guidance documents (New Zealand Historic Places Trust Pouhere Taonga, 2007). Complete replacement of windows (C), a very invasive intervention, was the most common window upgrade (37%), followed by double glazing existing windows while keeping existing frames (B), also known as retrofit double glazing (36% of responses). Most responses in the “other” category mentioned that they avoid any window upgrades, preferring to - one of them stated that window upgrades are “generally not done because of heritage controls”. Participants also mentioned utilising secondary glazing on the outside face of the building. Many examples cited by a

476
Priscila Besen, Paola Boarin
senior conservation architect in an interview revealed that secondary glazing is mostly being applied for acoustic purposes, rather than thermal considerations. An associate from one of the main heritage architecture practices in New Zealand commented about the lack of knowledge in the industry about the thermal benefits that these solutions can offer: “There is not a lot of data that I can access about the benefits of secondary glazing, for example the percentage of heat loss reduction. (…) Most things have been done unscientifically by just saying “let’s put this secondary glazing in” – obviously, you are protecting the heritage window, but, calculation-wise, there is not a lot of work done, so we need some kind of model for this.” Overall, lack of knowledge in the industry about the various options of window upgrades, lack of information about their thermal benefits and a lack of comprehensive guidance from heritage authorities on these interventions were identified. This is in contrast with the context of other countries, where more in-depth guidance is provided, such as in the case of Historic England (2016).
Figure 1. Window upgrades that respondents have applied in their projects.
3.3. Perceived barriers to the implementation of energy retrofit A question asked about the main barriers to implement energy retrofit in historic buildings, referring specifically to the addition of insulation and window upgrades, since these were identified as being rarely applied in New Zealand’s historic buildings. The results are shown in Figure 2. Although cost of materials obtained a higher percentage than labour costs, this was later refuted in the interviews, where an engineer commented that “[…] material costs would be quite marginal in comparison with the amount of effort it takes to install them”, and other interviewees also confirmed that labour costs tend to be higher than the cost of materials in building retrofit. In addition, it is important to highlight that this view of cost is often only limited to upfront costs and there is a lack of consideration about potential energy savings over time which can payback initial investments in building retrofit. Another barrier identified was a lack of interest from clients in this type of upgrade, with one of the participants commenting that “often these measures do not make a ‘visible’ difference” and another one saying that “the process requires responsible and engaged owners [who] are more often than not the roadblock to seismic upgrades and energy retrofits.” One participant commented that “[p]eople feel intimidated by the possible for cost escalations associated with deep retrofits. The more examples of this kind of retrofit we have the more clients will feel confident to ask for it.” These views confirm that the role of building owners is critical to the uptake of energy retrofit. In addition, energy retrofit interventions were not considered as a way of substantially increasing the value of properties in New Zealand. Participants who answered “other” questioned the need for energy retrofit in New Zealand: “Are these upgrades needed? What other measures can be usefully applied – e.g. really good curtains rather than fitting new windows if the old ones are in good repair”. Another participant wrote: “I do not see that this is important. Wear the right clothing if you are in a cold building”. These answers illustrate a common

477
Energy retrofit of historic buildings in Aotearoa New Zealand: current practice, challenges and opportunities
perception within the industry that high thermal performance is not needed in the mild climate of New Zealand, ignoring the fact that inappropriate indoor conditions with low temperatures are linked to severe health issues to building occupants, as demonstrated by a plethora of studies (Howden-Chapman et al., 2012). Other respondents highlighted the need for knowledge in building science and more holistic approaches to ensure retrofit measures do not create additional issues: “There isn't enough incentive to do a comprehensive job. One can't just add insulation and seal gaps. One then has to deal with internal moisture and most local professionals are ignorant of best practice in this regard.” A practitioner from a well-known heritage architecture firm mentioned in an interview that “if people are trying to design remedial solutions for heritage buildings, there is quite a preoccupation on getting the repairs right, that the time for making improvements is less”. Another barrier was identified by a project manager from a local council who mentioned that skill shortages have a significant impact on the delivery of heritage projects as “you have only very selective type of people, especially in New Zealand, who can do the job, and sometimes it is really expensive to use their services”.
Figure 2. Main barriers to undertaking energy retrofit measures such as window upgrades and thermal insulation.
3.4. Views on current policies and their implementation There were diverging views about the consistency of approval of projects by local and national authorities. Although each building is unique and has its own heritage values, there were arguments for more clarity on general guidance for the approval of interventions. Some respondents stated that authorities were too strict when it comes to upgrades to listed heritage buildings and this relationship could be improved with an “attitude that a repurposed historic building that is made more versatile and used has greater benefits for community than perfectly preserved 'museum' buildings.” A respondent pointed out that: “resistance to upgrades that allow owners occupiers to meet lifestyle and living standard expectations can lead to lack of maintenance and deterioration where demolition becomes the only reasonable option”. Another practitioner mentioned that it is a challenge to “persuade council to allow innovative changes that will make building upgrades financially viable.” On the other hand, a similar number of respondents found authorities to be flexible and open to proposed upgrades, and in some cases even too permissive to harmful interventions. Many respondents pointed to a need for better education about heritage conservation, as several professionals are not prepared to deal with this type of project. Others mentioned that more focus should be given to the benefits of retaining historic buildings from an environmental perspective: “Energy efficiency policy and carbon policy both very weak. Recognition needed that retaining buildings is far more sustainable than knocking them down. Life cycle costing focus needed rather than short-term.” There were also arguments for more consistency between national and local policies for heritage conservation and further clarity in their

478
Priscila Besen, Paola Boarin
implementation: “Consensus about best practice needs to be facilitated via a National Policy Statement for historic heritage. Opposing approaches at national, local govt and Heritage NZ levels makes it difficult to achieve good outcomes that don't alienate sympathy building owners.” The lack of integration between building control policies and heritage conservation policies through the Resource Management Act (RMA, 1991) was also highlighted: “Clearer relationship between Building Act Regulations and RMA requirements, particularly with regard to acknowledgement of buildings which are identified as having statutory protection in District plans, not just those listed with Heritage NZ.”
Several participants highlighted the need to improve the New Zealand Building Code clauses for energy efficiency, since most projects only target minimum requirements. A building science/services engineer commented in an interview: “If you are doing the minimum you necessarily can and our standards are already low, then we're not actually creating good living and working environments for people. (…) we need to lift our minimum performance standards, because we cannot rely on industry to make those decisions for themselves. Some people will do it voluntarily, but by large, people won't.” Participants also commented about this in the survey: “Better Building Code standards, particularly thermal & energy use, moisture management, ventilation, air-tightness. Grants from Government to do better than Building Code minimum. Set an air-tightness standard and verify with blower door testing.” Overall, the lack of specific policies and official guidance on energy retrofit means the assessment by authorities has to rely on individual interpretations about the benefits versus the impacts on heritage. This is likely to be the reason why there are so many diverging views on the efficacy of current policies, since practitioners experience the approval process differently in each council and with each assessor.
3.5. Opportunities for improvement and possible integration between energy and seismic retrofit When asked about possible improvements to industry practice, participants highlighted the need for professionals to better understand both heritage conservation and energy performance, and learn from techniques applied in other countries, such as the case of secondary glazing options: “better knowledge of alternative methods i.e. installing secondary glazing on the inside face of the wall”. Sharing examples of completed projects and case studies would be another important initiative, according to respondents. When asked about possible improvements to policies and government initiatives, participants mentioned that more public funding for heritage buildings would be beneficial; this is not only a matter for energy retrofit, but also a question for the basic protection of these buildings in New Zealand. There is limited funding provided by HNZPT, Lottery grants and territorial authorities, and HNZPT recognises that Heritage incentives are a powerful complement to heritage regulation and the synergy between them is a valuable heritage tool (McClean, 2013). The Heritage Equip programme provides funding for the seismic retrofit of historic buildings (Ministry for Culture and Heritage, 2016), thus a similar approach could be developed for energy upgrades in listed buildings. Public-private partnerships are well-known solutions for energy efficiency upgrades internationally, and should be further explored for the case of building energy retrofit in Aotearoa.
The study identified that the current focus on seismic strengthening historic buildings might limiting the scope of energy upgrades as structural upgrades can already be too costly and challenging for building owners. On the other hand, these projects also present an opportunity to implement energy retrofitting concurrently with seismic strengthening, with the addition of thermal insulation, upgrades of windows, and several other elements. Furthermore, an open-ended question asked about the feasibility of including energy upgrades in this type of project. This idea has been received very positively by two thirds of respondents, who stated that current seismic upgrades are a great opportunity to integrate additional improvements to historic buildings, as it is much easier to combine the two interventions for resource efficiency. A few practitioners also mentioned that they have already made the two upgrades coexist in many occasions, including earthquake repair works in Christchurch. Respondents also said that the access provided by seismic upgrades is not usually available and should be taken advantage of:

479
Energy retrofit of historic buildings in Aotearoa New Zealand: current practice, challenges and opportunities
“when a major upgrade is planned to a building, upgrading of all services should be considered.” Other respondents said it is a good opportunity, but made comments about financial viability: “With the amount of work to strengthen the buildings efforts should definitely be made to upgrade the energy efficiency; but it'll be unfortunately based on affordability as costs escalate quickly on these sorts of projects.” Another participant argued that: “It is practically feasible - for it to be economically feasible there needs to be more value placed on energy performance across all sectors and aspects of building procurement and management.” Respondents also highlighted the need for interventions to be sensible: “this is not always easy but need to be done but with great care and sympathy for the buildings’ heritage value”. Less than 10% of respondents opposed this idea, pointing out that seismic strengthening is already financially challenging, therefore suggesting additional upgrades may be overwhelming and “cause owners to find ways to demolish the building”. However, having a holistic approach to building retrofit when a major renovation is planned can be a way of avoiding future issues and costs, as addressing both aspects concurrently could be more cost-effective than having two separate interventions.
4. ConclusionsThe results from the questionnaire and interviews were aligned with the literature review, confirming a general interest in energy retrofitting historic buildings, but limited practical implementation in the context of New Zealand. The most common energy retrofit measures implemented were roof insulation and upgrade to LED lights, due to their low cost and relatively low impact on historic fabric. The main perceived barriers to the uptake of energy retrofit were related to costs, however, often this perception is only limited to upfront costs – without considering potential energy savings over time which can help payback initial investments. Regional differences were also identified, as respondents based in colder regions of New Zealand attributed a higher level of importance to upgrading buildings for better energy performance and thermal comfort. Other barriers identified were: (1) uncertainty about obtaining approval from local and/or national heritage authorities; (2) clients’ lack of interest in these measures; (3) lack of examples of completed energy retrofit projects in the country; (4) the practicalities ofimplementing such measures while keeping the heritage fabric; (5) lack of knowledge about the benefitsof energy retrofit; (6) current focus on seismic strengthening might prevent energy upgrades to buildings due to costs; and (7) skills shortages. Without substantial regulations and official guidance on energyretrofitting historic buildings, approval of interventions is based on subjective interpretations of currentpolicies. The questionnaire’s responses pointed to a wide range of different approaches to theimplementation of policies, with views ranging from authorities being either too strict or too permissive,and a general uncertainty about obtaining consents. These results align with studies in other countries,where inconsistency has been found amongst heritage authorities in their assessment of energy retrofitapplications (Friedman and Cooke, 2012). Although every historic building is unique, efforts for moreconsistent general guidance would be beneficial in encouraging and regulating appropriate retrofitmeasures. Because of this uncertainty, many practitioners resist on proposing changes to the buildingenvelope, and occupants end up having to rely heavily on active systems with high energy consumption,since they cannot achieve comfortable conditions passively. The main opportunities identified to improve industry practice were: (1) better education of professionals about building science, thermal performance, moisture management and heritage conservation principles; (2) more knowledge about options available and case studies of completed retrofit; (3) more long-term thinking from clients; (4) better understanding of costs-savings and pay-back mechanisms; (5) better integration between different disciplines; (6)integration of energy retrofit to seismic strengthening projects; (7) availability of more public funding and public-private partnerships for the retrofit of listed buildings. The study also identified that many factorsin the decision-making process in retrofit rely on input from other stakeholders not included in thisquestionnaire and interviews, therefore further research is recommended to investigate the views of building owners, property developers and building occupants.

480
Priscila Besen, Paola Boarin
Acknowledgements The researchers would like to thank all the professionals who participated in questionnaires and interviews for this study. Research procedures have been carried out as per approval obtained from the University of Auckland Human Participants Ethics Committee, reference numbers 021307 and 021924.
References Besen, P., Boarin, P. and Haarhoff, E. (2020) ‘Energy and Seismic Retrofit of Historic Buildings in New Zealand:
Reflections on Current Policies and Practice’, Historic Environment: Policy and Practice. Routledge, 11(1), pp. 91–117. doi: 10.1080/17567505.2020.1715597.
Davies, P. and Osmani, M. (2011) ‘Low carbon housing refurbishment challenges and incentives: Architects’ perspectives’, Building and Environment, 46(8), pp. 1691–1698. doi: 10.1016/j.buildenv.2011.02.011.
Friedman, K. and Cooke, A. (2012) Is UK Planning a barrier to energy efficient heritage retrofit: a comparative analysis of a selection of London Boroughs, Retrofit 2012 Conference. Salford, UK.
Gronert, R. (2011) Sustainable Thermal Retrofit of the New Zealand 1930’s – 1950’s Labour Party State House. The University of Auckland.
Historic England (2016) Energy Efficiency and Historic Buildings: Secondary Glazing for Windows. doi: 10.1108/ss.2011.11029caa.019.
Howden-Chapman, P. et al. (2012) ‘Tackling cold housing and fuel poverty in New Zealand: A review of policies, research, and health impacts’, Energy Policy, 49, pp. 134–142. doi: 10.1016/j.enpol.2011.09.044.
ICOMOS Climate Change and Cultural Heritage Working Group (2019) The Future of Our Pasts: Engaging Cultural Heritage in Climate Action. Paris. Available at: https://indd.adobe.com/view/a9a551e3-3b23-4127-99fd- a7a80d91a29e.
Martínez-Molina, A. et al. (2016) ‘Energy efficiency and thermal comfort in historic buildings: A review’, Renewable and Sustainable Energy Reviews, 61, pp. 70–85. doi: 10.1016/j.rser.2016.03.018.
McClean, R. (2007) Sustainable Management of historic heritage. Guide No. 6 Building Act 2004. McClean, R. (2013) Incentives for Historic Heritage Toolkit. Wellington, New Zealand. Ministry for Culture and Heritage (2016) Heritage EQUIP: Earthquake upgrade incentive programme. Available at:
http://heritageequip.govt.nz/ (Accessed: 1 May 2018). Ministry of Business Innovation & Employment (2016) Building (Earthquake-prone Buildings) Amendment Act.
Wellington, New Zealand. Ministry of Business Innovation & Employment (2017) H1 Energy efficiency | Building Performance, Building Code
Compliance. Available at: https://www.building.govt.nz/building-code-compliance/h-energy-efficiency/h1- energy-efficiency/ (Accessed: 15 May 2019).
Ministry of Business Innovation & Employment (2020) Meeting the requirements for altering existing buildings, Building Performance. Available at: https://www.building.govt.nz/building-code-compliance/b-stability/b1- structure/altering-existing-building/meeting-the-requirements-for-altering-existing-buildings/ (Accessed: 12 March 2020).
New Zealand Government (2017) Healthy Homes Guarantee Act 2017. New Zealand. New Zealand Historic Places Trust Pouhere Taonga (2007) ‘Sustainable Management of Historic Heritage Guidance,
Information Sheet 12: Alterations and additions to historic buildings’, (August). Available at: http://www.heritage.org.nz/resources/sustainable-management-guides.
Troi, A. and Bastian, Z. (2015) Energy Efficiency Solutions for Historic Buildings. A Handbook. Basel: Birkhäuser Verlag GmbH.
United Nations (2015) Transforming Our World: the 2030 Agenda for Sustainable Development. Paris. Webb, A. L. (2017) ‘Energy retrofits in historic and traditional buildings: A review of problems and methods’,
Renewable and Sustainable Energy Reviews, 77, pp. 748–759. doi: 10.1016/j.rser.2017.01.145

481
The 54th International Conference of the Architectural Science Association (ANZAScA) 2020
Enhancement of cooling performance of metal ceiling radiant cooling system by a novel panel with a concave and segmented
surface
Ahmed A. Serageldin1, Minzhi Ye2 and Katsunori Nagano3 1, 2,3 Hokkaido University, Sapporo, Japan
{ahmed.serageldin1, nagano3}@eng.hokudai.ac.jp [email protected]
Abstract: This paper proposed a novel ceiling radiant cooling panel (CRCP) with a concave and segmented surface. Full-scale laboratory experiments are conducted to study the heat transfer characteristics extensively and thermal comfort conditions inside an environmental chamber coupled with four CRCP-s with a concave and segmented surface under various operating conditions. Moreover, a three-dimensional finite volume simulation was developed to study the conjugated heat transfer and fluid flow, as well as the thermal comfort conditions. The results show that the simulation achieves a good agreement with experimental results with an accuracy of 98.9 %. The proposed panel enhances the convection heat transfer by 61% and 23 % compared with the flat and inclined surface panels. The fluid inlet temperature of 18 ºC and the fluid flow rate of 1.5 L/min achieve the lowest temperature difference between the head and ankle level of 0.18 ºC; also, it shows the neutral PMV of 0. So, changing only the panel surface shape from ordinary flat to a concave and segmented surface gives a chance to use a lower fluid flow rate and higher inlet water temperature and maintains an acceptable comfortable level, which reveals the potential of energy saving by using this new panel.
Keywords: Radiant Ceiling Panel; CFD; Numerical analysis; Curved shape; Radiant cooling.
1. IntroductionOver decades, radiant cooling and heating systems (RCH) becomes an energy-efficient alternative to
the customary air-conditioning (AC) system. As RCH system relies basically on the radiation heat exchanges between the radiant surface and the surrounding indoor thermal environment by more than 50 % of the total heat transfer (Rhee, Olesen and Kim, 2017). Many practical and theoretical studies confirmed the distinct advantages of RCH systems. RCH shows a high capability of energy savings not only in residential dwellings but also in commercial(Stetiu, 1999), education buildings, and even small- or large-scale industrial facilities(M.Schmidt(University of Stuttgart), 2011). Moreover, the RCH grants the occupants with a more thermally comfortable and healthy environment, which promotes their working efficiency and better living quality(Miriel, Serres and Trombe, 2002; International Organization
Imaginable Futures: Design Thinking, and the Scientific Method. 54th International Conference of the Architectural Science Association 2020, Ali Ghaffarianhoseini, et al (eds), pp. 481–490. © 2020 and published by the Architectural Science Association (ANZAScA).

482
Ahmed A. Serageldin, Minzhi Ye and Katsunori Nagano
for Standardization, 2005). Additionally, RCH systems resulted in lower draught risk, and less vertical temperature gradients, hence less local discomfort complaints (Lin et al., 2016). But also, the RCH systems are still suffering from limitations of surface condensation(Feustel and Stetiu, 1995; Roulet, Rossy and Roulet, 1999), complicated control(Andrés-Chicote et al., 2012), cold draught risk(Imanari, Omori and Bogaki, 1999b; Stetiu, 1999; Ge and Fazio, 2004), and high capital cost(By, Olesen and Ashrae, 2002; Miriel, Serres and Trombe, 2002) as well as limited cooling capacity(Imanari, Omori and Bogaki, 1999a; Jeong and Mumma, 2007). Accordingly, this literature presents the recently developed studies to remove the barriers toward the wide spreading of the RCH systems installation and commission
Some RHC systems are integrated with building structures. While the conventional RHC systems include metal ceiling panel (Imanari, Omori and Bogaki, 1999b). In the integrated building design, the RHC floor system and RHC ceiling system consist of a tube embedded in the structure of the ceiling, mounted on wall or floor embedded panels(Feng, Schiavon and Bauman, 2013)..
From this literature, most of the studies focused on the capillary radiant ceiling cooling and heating panels with a flat surface (FRCCHP), and no one tries to use another surface configuration type. Hence the novelty of this paper is to investigate the thermal performance of RCH panel experimentally and numerically with a new concave curved, segmented surface.
2. Experimental set-upThe experiment set-up consists of identical twin walk-in environmental chambers (ESPEC E series, ESPEC Corporation, Japan) with autonomous control. Each chamber has an internal dimension of length, width, and height of 2.7 m × 2.7 m × 2 m. Also, the two chambers are sharing a wall with an opening, this opening has a width of 0.8 m and adjustable height. The temperature of the left chamber is adjusted at 40℃ to mimic the outdoor environment temperature in the summer season. While the right chamber is the test cell, which is equipped with four radiant ceiling panels. The fluid temperature and flow rate are adjusted according to predefined conditions. In these experiments, the room is heated internally by four cylindrical heat-generating dummies. The energy generated from each cylinder is 58.2 W/m2, which is approximately equal to the energy generation from human being body seated in rest, dimensions, and the electrical circuit connection is shown in Fig. 1. The photos and dimensions of the novel panel with a segmented and concave surface is shown in Fig. 2.
3. CFD model set-upThe three-dimensional finite volume model is developed by ANSYS FLUENT software to solve the coupling between fluid flow and heat transfer inside a full-scale room under steady-state conditions without ventilation. The other one is a curved panel that has the same surface area, but with segmented curves, each segmented curve has a length of 0.1 m. The curvature cord length (l) and radius (r) are adopted to achieve the highest convective heat transfer, so the l/r ratio is studied in the span between 1.99 and 0.33, as shown as listed in Table 1. The cord length (l) is calculated through Eqs. (1-2).

483
Enhancement of cooling performance of metal ceiling radiant cooling system by a novel panel with a concave and segmented surface
Fig. 1 Schematic diagram indicates the experimental set-up carried out in this study
Fig. 2 radiant panel with segmented and concave surfaces used in this study

484
Ahmed A. Serageldin, Minzhi Ye and Katsunori Nagano
θ = (0.1×360)/2πr (1)
l = 2r sin(θ/2) (2) Where r is the arc radius, θ is the arc angle, and l is the cord length.
Concave and convex curvatures with the same dimensions are studied, as shown in Fig. 3. The figure shows that the projected area (Ap) is the product of WL, where W is the total segmented width plus the void space between each segment (nl+(n+1)void), where n is the number segments. The void space is opened to the room space to give the chance of the heat to convected from the bare upper panel surface. The distance between the panel and the right and left walls (S1) is calculated by Eq.(3)
S1 = [3.6-(nl+(n-1)void)]/2 (3)
Fig. 3 The geometry of the full-scale room used in numerical simulation
Table 1 Dimensions and cases been studied in this study
r l l/r θ void S1 w Ap/A
0.03 0.0597 2 95.49 - 0.7715 2.457 0.55
0.03 0.0597 2 95.49 0.029 0.2000 3.600 0.81
0.06 0.0890 1.5 47.75 - 0.3980 3.204 0.72
0.06 0.0890 1.5 47.75 0.011 0.2000 3.600 0.81
0.3 0.1000 0.3 9.55 - 0.2000 3.600 0.81

485
Enhancement of cooling performance of metal ceiling radiant cooling system by a novel panel with a concave and segmented surface
4. Experimental results
4.1. Radiation and convection heat fluxes
Figure 4 presents the convection (qc in W/m2) and radiation heat (qr in W/m2) fluxes transferred to the panel upper and lower surfaces under different operating conditions. In all cases, radiation heat flux accounts for more than 50 % of the total heat flux (q in W/m2). But, the ratio between the convection and total heat fluxes (qc/q) increased significantly by 20 % from 28 % at a fluid inlet temperature of 15 ºC to 47 % for inlet temperature of 18 ºC under the same flow rate 1.7 m/s.
Fig. 4 Radiation and convection heat fluxes under different operating and cooling loads
4.2. Comparison of data in reference
After calculating the radiant/convective heat fluxes, the ratio of convection to total heat fluxes (qc/qt) and ratio of radiation to total heat fluxes (qr/qt) are compared with the data of a free-suspended panel with a flat surface and a suspended metal ceiling radiant panel with inclined fins presented by Zhange et al.(Zhang, Liu and Jiang, 2013) as shown in Fig.5 Figure 5 presents the comparison of these ratios with the data from references. When using the novel radiant ceiling panel with a segmented and concave surface, the ratio of convective heat flux is 61.5% higher than the suspended flat panel and 23.9% higher than the suspended panel with inclined fins. It can be proved that the novel panel with the segmented and concave surface is able to promote convection effectively.
Fig.5 Comparison of the ratio of convection in the experiment with data of suspended flat panel(Jeong and Mumma, 2007) and suspended panel with inclined fins(Zhang, Liu and Jiang, 2013)

486
Ahmed A. Serageldin, Minzhi Ye and Katsunori Nagano
4.3. Indoor air temperature vertical profile Figure 6 illustrates the indoor air temperature profiles in each line. The blue dot horizontal line represents the position of the radiant ceiling panels, and the black dot line shows the upper and lower limits of the window. As shown in the figure, the vertical temperature difference in the test room is very small compared, and the temperature of each line is almost the same as well.
Fig.6 Indoor air temperature variation with Y-direction at three lines under different operating conditions and cooling loads
15 oC 18 oC
1.5
L/m
in
1.7
L/m
in
2 L/
min

487
Enhancement of cooling performance of metal ceiling radiant cooling system by a novel panel with a concave and segmented surface
5. Numerical results
5.1. Air temperature profile
Figure 7 demonstrates the comparison between the air temperature for different L/R ratio starts from 0.3 to 2 for concave curvature. The general overview proves the temperature decrement in the vertical direction. The differences are related to the coverage area and the curvature radius, so as the coverage area increases from 55 % to 81 % for L/R of 2, the average air temperature decreases by 2 oC from 26.41 oC to 24.41 oC. Also, the floor temperature decreases from 1.62 oC from 27.18 oC to 25.56 oC, which achieve more comfort satisfaction. Adding avoid distance between curvature segments, promoting the heat transferred from the upper panel surface, and increases the total heat transferred from the panel top and bottom surface. For L/R of 1.5 with/without the void, the average air temperature decreases by 0.87 oC from 25.10 oC to 24.24 oC.
Fig.7 Vertical air temperature profile at the middle line for different L/R ratios
5.2. Air temperature and PMV contours
The indoor air temperature contours are drawn on a vertical plane at Z=1.7 m, and two plans crossing the dummy cylinders for each L/R value are shown in Fig. 8. As the L/R ratio increases, the cold air draft is become more muscular and occupied more indoor volume. The middle area is remaining with less effect as the cold air is flowing at the side areas. Also, the air volume with specific temperature values lower than 25.5 oC. It shows that the cold air is flowing adjacent to the side walls to the floor, the ratio L/R of 2 without void shows the less air volume, and the ratio L/R of 1.5 with a void shows the most massive air volume with a temperature lower than 25.5 oC. Also, a counter-flow is induced between hot air flowing upward against a cold air flowing downward. For the PMV index contours, the middle area has a warmer PMV value compared with the far sides where the PMV becomes colder as apparent in the ratio of L/R of 1.5 and 2. For L/R value of 1.5, the maximum value at the middle area is 0.9, while the minimum value at the side spaces is -0.6. Also, for the ratio L/R of 2, the maximum value is more than 1, and the minimum value is lower than -0.5. But the

488
Ahmed A. Serageldin, Minzhi Ye and Katsunori Nagano
PMV values improve more with adding void spaces, as shown in contours of L/R of 1.5 and 2 cases, respectively.
Fig. 8 Temperature contours and Isovolume in each case
2Voi
d 2
1.5V
oid
1.5
0.3

489
Enhancement of cooling performance of metal ceiling radiant cooling system by a novel panel with a concave and segmented surface
6. ConclusionsThis paper investigates the cooling performance of a novel radiant ceiling panel and the thermal comfort in the laboratory test room under different inlet water temperature, flow rate, and two different internal cooling loads. Different curvature cord length to curvature radius ratios (L/R) from 0 to 2 are numerically examined. Three dimensional CFD model is developed and validated against the experimental result. The experimental results show that the adjustment of inlet water temperature seems to be more effective than changing the flow rate. When operating with the same inlet water temperature and flow rate (1.5L/min and Tin of 15 oC), the radiant heat transfer increased by 20.5%, and the convective increased by 127%. Besides, the radiant heat transfer coefficient and convective heat transfer also increased by 15.5% and 104%. Also, compared with other suspended panels, this novel curve shape panel can effectively promote the convection and increase the ratio of convective heat flux by 61 % and 23 % compared with other flat and inclined surfaces. Also, the temperature difference between ankle (Y=0.1 m) and head (Y=1.5 m) was less than 0.35 oC. Nevertheless, The PMV values are close to 0 under conditions of 1.5L/min and 2L/min, when the fluid inlet temperature is 18 oC and 15 oC. The preferable inlet water temperature is between 16-19 oC. The numerical results show that, as the coverage area increases from 55 % 81 % when L/R is 2, the average air temperature decreases by 2 oC from 26.41 oC to 24.41 oC. Also, the floor temperature decreases from by 1.62 oC from 27.18 oC to 25.56 oC, which achieve more comfort satisfaction. When the L/R increases from 0 to 1.5 at the same coverage ratio of 81 %, the average air temperature declined by 1 oC from 25.22 oC to 24.22 oC, and the foot temperature decreases by 0.63 oC, also, adding the void ratio decreases the air temperature by 0.87 oC. Addition, increasing the ratio L/R from 0 to 2 with void space, decreases the hr by 31 % from 6.8 W/m2.K to 4.7 W/m2.K, and the hc increases at the upper surface by 174 % from 1.02 W/m2.K to 2.8 W/m2.K
References Andrés-Chicote, M. et al. (2012) ‘Experimental study on the cooling capacity of a radiant cooled ceiling
system’, Energy and Buildings, 54, pp. 207–214. doi: 10.1016/j.enbuild.2012.07.043. By, D. D., Olesen, B. W. and Ashrae, F. (2002) ‘Radiant Floor Heating In Theory and Practice About the Author’,
5(July), pp. 19–24. Cho, J., Park, B. and Lim, T. (2019) ‘Experimental and numerical study on the application of low-temperature
radiant floor heating system with capillary tube: Thermal performance analysis’, Applied Thermal Engineering. Elsevier, 163(September), p. 114360. doi: 10.1016/j.applthermaleng.2019.114360.
Feng, J. (Dove), Schiavon, S. and Bauman, F. (2013) ‘Cooling load differences between radiant and air systems’, Energy and Buildings, 65, pp. 310–321. doi: https://doi.org/10.1016/j.enbuild.2013.06.009.
Feustel, H. E. and Stetiu, C. (1995) ‘Hydronic radiant cooling - preliminary assessment’, Energy and Buildings, 22(3), pp. 193–205. doi: 10.1016/0378-7788(95)00922-K.
Ge, H. and Fazio, P. (2004) ‘Experimental investigation of cold draft induced by two different types of glazing panels in metal curtain walls’, Building and Environment, 39(2), pp. 115–125. doi: 10.1016/j.buildenv.2003.08.006.
Imanari, T., Omori, T. and Bogaki, K. (1999a) ‘Thermal comfort and energy consumption of the radiant ceiling panel system.’, Energy and Buildings, 30(2), pp. 167–175. doi: 10.1016/s0378-7788(98)00084-x.
Imanari, T., Omori, T. and Bogaki, K. (1999b) ‘Thermal comfort and energy consumption of the radiant ceiling panel system. Comparison with the conventional all-air system’, Energy and Buildings, 30(2), pp. 167–175. doi: 10.1016/S0378-7788(98)00084-X.
International Organization for Standardization, 2005. EN ISO 7730:2005. (2005) Ergonomics of the thermal environment — Analytical determination and interpretation of thermal comfort using calculation of the PMV and

490
Ahmed A. Serageldin, Minzhi Ye and Katsunori Nagano
PPD indices and local thermal comfort criteria. Jeong, J. W. and Mumma, S. A. (2007) ‘Practical cooling capacity estimation model for a suspended metal
ceiling radiant cooling panel’, Building and Environment, 42(9), pp. 3176–3185. doi: 10.1016/j.buildenv.2006.08.006. Lin, B. et al. (2016) ‘Evaluation and comparison of thermal comfort of convective and radiant heating
terminals in office buildings’, Building and Environment. Elsevier Ltd, 106, pp. 91–102. doi: 10.1016/j.buildenv.2016.06.015.
M.Schmidt(University of Stuttgart) (2011) Comparison between ceiling radiant panels and floor heating inindustrial buildings. Stuttgart, Germany.
Miriel, J., Serres, L. and Trombe, A. (2002) ‘Radiant ceiling panel heating-cooling systems: Experimental and simulated study of the performances, thermal comfort and energy consumptions’, Applied Thermal Engineering, 22(16), pp. 1861–1873. doi: 10.1016/S1359-4311(02)00087-X.
Rhee, K. N., Olesen, B. W. and Kim, K. W. (2017) ‘Ten questions about radiant heating and cooling systems’, Building and Environment. Elsevier Ltd, 112, pp. 367–381. doi: 10.1016/j.buildenv.2016.11.030.
Roulet, C. A., Rossy, J. P. and Roulet, Y. (1999) ‘Using large radiant panels for indoor climate conditioning’, Energy and Buildings, 30(2), pp. 121–126. doi: 10.1016/S0378-7788(98)00079-6.
Stetiu, C. (1999) ‘Energy and peak power savings potential of radiant cooling systems in US commercial buildings’, Energy and Buildings, 30(2), pp. 127–138. doi: 10.1016/S0378-7788(98)00080-2.
Werner-Juszczuk, A. J. (2018) ‘Experimental and numerical investigation of lightweight floor heating with metallised polyethylene radiant sheet’, Energy and Buildings. Elsevier B.V., 177, pp. 23–32. doi: 10.1016/j.enbuild.2018.08.011.
Zhang, L., Liu, X. H. and Jiang, Y. (2013) ‘Experimental evaluation of a suspended metal ceiling radiant panel with inclined fins’, Energy and Buildings. Elsevier B.V., 62, pp. 522–529. doi: 10.1016/j.enbuild.2013.03.044.

491
The 54th International Conference of the Architectural Science Association (ANZAScA) 2020
Environment, resource and surroundings based dynamic project schedule model for road construction industry in New Zealand
Mahesh Babu Purushothaman1 and Sumit Kumar2 1, 2 Auckland University of Technology, Auckland, New Zealand
{Mahesh.babu1, qgy94032}@aut.ac.nz
Abstract: Though significant works of literature are available for project scheduling, project delay in the road construction industry is a common phenomenon. The main objective of this paper is to identify the real-time critical characteristics that influence the project delay in the New Zealand road construction industry and how to manage these delays during project scheduling. The real-time critical characteristics considered are based on environment, resource & surroundings (ERS) to develop a dynamic project schedule. This study adopted semi-structured interviews/ expert opinion and systematic literature review data to determine the critical characteristics of a roading project such as daily weather, Instrument and equipment breakdown, geological and landscaping, material shortage, design errors, pandemic and events. The data were analysed by using descriptive analysis, Likert scale, and thematic analysis techniques to understand the relationship of these factors. Based on the analysis a dynamic model for managing these factors proposed, which in turn can reduce the uncertainty and scheduling errors during the planning phase. This would aid in lesser scheduling modification during the execution phase. In practice, this study will be helpful for road contractors to overcome road construction delays, reduce cost, aid in stakeholder management and sustainable development.
Keywords: Road sealing; Delay cause; Dynamic schedule.
1. IntroductionFahmy et al. (2019) stated that most of the construction projects executed under dynamic environments and subjected to various real-time events. These real-time events can be described as daily weather change, availability of competent operators, raw materials availability, machinery breakdowns, community events, traffic management, and geological data but are not limited to these events. It becomes difficult for project managers to effectively schedule and control road construction projects by employing traditional predictive scheduling techniques such as CPM and PERT which does not consider real-time events as a factor influencing schedule. Hence, there exists a need to develop a dynamic model that is different from traditional models and help to deal with these real-time events during execution and planning stage of the project.
Imaginable Futures: Design Thinking, and the Scientific Method. 54th International Conference of the Architectural Science Association 2020, Ali Ghaffarianhoseini, et al (eds), pp. 491–500. © 2020 and published by the Architectural Science Association (ANZAScA).

492
Mahesh Babu Purushothaman and Sumit Kumar
According to Strang (2019), the last year project failures and road project delays resulted in half of the project delivery rate than what was expected by the NZTA. Few of these project failures and damaged caused by the delays are discussed below.
Project Failure 1 - Wellington’s Transmission Gully Project: Recent example of road construction project failure is wellington’s transmission gully highway project. Initial project cost for the transmission gully project was 850 million NZD but due to unforeseen events, this project is running behind schedule and over budget by 191 million NZD (Maxwell, 2020). Main reasons behind these delays were underestimated earthwork required and the weather forecast Strang (2019). (Maxwell, 2020), New Zealand Transport Authority (NZTA) has decided to wipe off the previous penalty fees for the delays. NZTA decided to enforce NZD16000/ day late penalty fees for the delays based on a new specified date. The 16000 daily rates are equating to 496000/month.
Project Failure 2 - Kapiti Expressway Repair Project: Another example of road construction project failure was the Kapiti expressway repair project. This project is currently running 9 months behind schedule and the main reason for this delay is the bad weather and equipment’s availability (Fallon, 2020). Cost and penalty of these delays are yet to be established by NZTA.
The above examples of roading project failures relate to real-time events. Due to the dynamic nature of these projects predictive optimal scheduling technique becoming neither feasible nor optimal (Fahmy et al., 2019).
Recently New Zealand (NZ) government has announced 5.3 billion NZD worth road construction budget (Coughlan, 2020), which means in future there is going to be a huge demand for road construction work. If these construction projects are well managed from start to finish, the road construction industry can provide a positive result for the NZ economy. To control and manage the projects effectively there is a need to develop a scheduling model based on the real-time critical characteristics that affect the project success.
The underlining reason and aim for this research are to identify and analyse these dynamic real-time events (referred as characteristics) and then develop a scheduling model. The following were the research questions:
• What are the internal and external critical characteristics that influence the project delay in NZ road construction industry?
• How the internal and external critical characteristics that influence the project delay inNZ road construction industry interlink to each other?
2. Literature reviewThe road construction industry in NZ is considered as one of the strategic industry sectors which employ over 170,000 peoples which equates to 7.6% of the workforce (Ministry of Business Innovation and Employment (MBIE), 2013). Road construction and the sealing industry is the fifth largest sector in NZ. “NZ roading network made of approximately 63,000kms sealed road and 32000 km of unsealed roads, owned by both local and central government” value of this roading network is estimated to be approximately 79.2 billion NZD (MBIE, 2016). Yet, only a few kinds of research are undertaken done to improve the project delivery rate. For New Zealand, Transport Authority roading industry project delays are one of the biggest problems. Project delay occurs on almost every single project. Some projects delayed by a single event, others caused by several factors with no involvement or cause for any parties. A successful project is one which is kept within budget and delivered at the prescribed schedule. This

493
Environment, resource and surroundings based dynamic project schedule model for road construction industry in New Zealand
requires successful project planning and good decision-making skill (Ahmed et al., 2003). To achieve this project manager often use different project scheduling techniques. Some of these project scheduling techniques are discussed below.
2.1 Project scheduling
Project scheduling is a tool used by the Project Managers (PM) and Project Engineers (PE) to track project progress, create a list of critical activities, the time required to achieve the desired objective and the resource requirement to accomplish the objective. To manage the project efficiently PM, need to distribute and communicate project information effectively (Kumar, 2005). That is where the project schedule becomes handy for the project team. To prepare an effective project schedule there are several scheduling techniques available. Some of them are listed and discussed below.
2.1.1 Critical path method (CPM):
CPM techniques were developed in 1950 by DuPont and were first used in a missile construction project. As the name suggests CPM technique is based on identifying the critical and non-critical path of activities in the project to avoid any time delays in the project. In CPM technique project activities are represented in a block and the link between activities is presented by arrows and most of these activities are organised in technical order which means that B activity cannot be started until A activity is finished (East, 2015).
In CPM techniques activity duration is based on a single point assumption. For using this network diagram project manager list all the activities of the project and then assigns a unique ID number for each activity. Next step in this diagram is to estimate the activity duration and also the resource allocation. The last step is to identify the dependency between each activity to prepare a critical path for the project. Which enable project managers to decide on the start and end dates of the project, project budget, and resources requirement.
2.1.2 Program evaluation and review technique (PERT):
PERT techniques are similar to the CPM technique as both of these are based on mathematical analysis and helps in visualising the project’s critical path. But there is one major difference between PERT and CPM, which is the activity duration (Ballesteros-Pérez, 2017). Where in CPM technique activity duration is well defined by a single point estimate on other hand PERT techniques time estimation is calculated from an average of three-time estimates such as optimistic activity duration, pessimistic activity duration and most likely activity duration. Pert technique is more suitable for the research-oriented project rather than CPM.
2.1.3 Critical chain method:
In 1997 Goldratt’s book on critical chain introduced the CCM, which is similar to the Critical path method. Valikoniene (2015) states that CCM technique addresses the human issues neglected by the other traditional scheduling methods (CPM & PERT), promises shorter delivery time, a more robust schedule and simplifies the project monitoring. According to Herroelen et al. (2002), There are few fundamentals around CCM scheduling techniques such as there is no activity dates or milestone, identify the critical project chain and avoid multitasking, determine the precedence and resource-based baseline

494
Mahesh Babu Purushothaman and Sumit Kumar
schedule, accommodate uncertainties during the time buffer and prepare a predictive schedule based on an early start and early finish dates.
In these techniques, the project manager can identify the critical path of the network and usually schedule the critical activities at the earlier stage of the project (Valikoniene, 2015). The main goal of CCM is to avoid any time delays due to uncertainty on critical activity. Network analysis diagram in CCM is similar to CPM technique but in CCM start of the project is often determined by a non-critical activity. In CCM techniques slack time is used to absorb the sudden change in project activities to keep the project end date on the schedule.
2.1.4 Gantt chart Scheduling:
Gantt chart was invented in 1917 by Henry Laurence Gantt for controlling the production schedule in a manufacturing company (Rouse, 2007). For effective control, the Gantt chart uses the graphical representation of the project schedule which helps the project manager in coordinating and tracking the specific task. Gantt chart represents the project activities, the time required to achieve those activities, resource allocation and also the percentage completion of the project (Kumar, 2005). Gantt chart a vertical line on the horizontal bar can be used to represent the current date. The left-hand side of the line represents the completed tasks and the right-hand side represent the upcoming tasks. To represent the project delay, the horizontal bar can be left unshaded. When the project is in progress Gantt chart can be used to represent the estimate start and estimate finish date against the actual start date and actual end date on an activity basis.
2.1.5 Kanban Scheduling:
Kanban schedule is a lean project management tool. Kanban scheduling was initially developed by Toyota in 1940 to achieve just in time production. Henderson (1986) Kanban “is an information system that controls the production of the necessary products in the quantity that is required at the right time in every process of a manufacturing company”. Kanban is the Japanese word which means billboard or signboards. Toyota used this system to improve the efficiency of resources and supplies based on immediate product demand. Kanban system consists of the Kanban board, task cards and columns to organise the cards. As stated by Kimura & Terada (1981) “Kanban system employs the pull system as in pull system there is a certain amount of inventory at each process. The succeeding process orders and withdraws the parts from the preceding process only at the rate and at the moment it has consumed all the parts. The preceding process than only produced on the parts withdrawn by the succeeding process”.
Based on literature review most of the scheduling techniques either in context to the construction industry, manufacturing industry or any other sector is all about preparing the project schedule based on 2 main assumptions, static environment and full resources availability. Also, in most of the scheduling techniques, it is assumed that the actual physical work duration will stay the same and activities will run on a predefined track during the execution. But in reality, traditional scheduling techniques lack the involvement of real-time events. These techniques are not practical to apply in a road construction project. In real-world project managers and project, planners need better tools to counter these real- time events (e.g. daily weather, machinery breakdown, community events and geological data) on the project schedule. None of the present and past project scheduling technique accommodates these real- time events.

495
Environment, resource and surroundings based dynamic project schedule model for road construction industry in New Zealand
3. Research methodologyThe process steps are shown in Figure 1. The first step is the research problem which includes identifying the problem, importance of the research, identifying objectives and organisation of the research plan. Once the research problem identified, the next step of this research is the systematic
literature review, which includes international studies and literature related to the cause of delays in the construction industry. The aim of this review includes many relevant materials from textbooks, professional journals, research papers, and reports developing the framework for the aim of the study. The literature review of articles was limited to the English language. This review led to prepare the vital information to develop the semi-structured interview with local field experts. The identified factors based on the literature review then verified by the semi-structured interview.
Next step is to categorise the identified factors into the critical groups based on their characteristics. Data need to group around critical characteristics of the project revolves around critical factors, critical time and critical resources.
The fourth step in the research includes conducting semi-structured interviews with representatives of three major contractors in the region. This step will help to analyse the relevance of systematic literature review in context with the NZ road industry.
The contractor interviewed during this study
Figure 1: Research methodology framework had a minimum of 10-15 years of work experience in the NZ road construction industry. The
contractor’s main work scope based around the Taranaki region. During Semi-structured interviews, open conversations held with respondents. The data collected from the interview was used: the relevance of the factors identified to the NZ roading industry and to understand the impact of each identified factors.
Once the data collection was completed next step of the research was the analysis of the data and discussions on the findings by using the tables and chart. During data analysis, different statistical tools used such as descriptive statistics–method of means and percentage to be used to understand the correlation of the data with the research objective, Likert scale: three-point Likert scale, which will be labelled as high, medium and low. 1-4 scale classed as low, 4-7 considered as a medium, and 7-10 scale considered being high, another useful tool used is the correlation analysis, which will help to study the relationship between the different variables and Thematic analysis–thematic analysis used for analysing the data collected during a semi-structured interview with local field experts. According to Braun and

496
Mahesh Babu Purushothaman and Sumit Kumar
Clarke (2006), this analysis work on following six steps such as data familiarization, initial data, theme search, reviewing the research theme, defining and naming themes and producing the final report. After data analysis next is to develop a scheduling model based on the critical characteristics, which in result will help in predicting the real-time project duration. To develop this model correlation analysis will understand each factor variable in interval data and test the agreement of factors with respondents’ answers. The last step in the research methodology is the results and conclusion of the study.
According to Dingwall et al. (1998), the result and findings of research rely on the quality of the method used. Quality of the research design based on qualitative and quantitative method has to assess with the concept of reliability and validity, but these concepts will be operationally different from each other (Bakker, 2018). This research followed Dingwall et al. (1998)’s, approach. For this research, the design quality was based on triangulation approach. According to Duffy (1987), triangulation is the method to compare the results of two or more data collection methods, e.g. comparing the result of an interview with observation or comparing the result of an interview with different respondents. This way, the researcher can develop a theme based on the overall interpretation.
4. Result and analysisFor every business completion of the project on time with quality is the primary objective, delay in projects hurts the business performance and can cause conflicts between contractors and clients. This research had helped to identify the categories of these delays. The Systematic literature review was conducted on articles spanned over 18yrears. A total of 502 articles were shortlisted based on the keyword search and 65 articles were relevant to identify the Delay factors. The span of articles and % publication that referred to the delay factors are given in Figure 2.
Based on the systematic literature review, 8 common themes were identified. Where 49 articles confirmed the weather factor out of 65 articles, 55 articles confirmed the material shortage and material quality factor out of 65 articles, 26 confirmed the geotechnical factor out of 65 articles, 57 confirmed the shortage of labour and skilled labour factor out of 65 articles, 23 confirmed the event factor out of 65 articles, 53 confirmed the equipment shortage factor out of 65 articles. 25 confirmed the breakdown factor out of 65 articles and 58 out of 65 articles identified the design error factor. Based on these factors semi-structured interview questioner was framed and the same questions and protocol were used to obtain expert confirmation in New Zealand.
Figure 2: Span of articles and % of publication

497
Environment, resource and surroundings based dynamic project schedule model for road construction industry in New Zealand
According to contractor A, material shortage, skilled labour shortage, incorrect Geotechnical data, machinery breakdown, weather, disaster, pandemic and events considered being high-impact factors on the other side equipment shortage and design errors considered as low-impact factors. There is no factor in medium impact range as per contractor A. According to contractor B, material shortage incorrect geotechnical data, machinery breakdown, weather, disaster, pandemic are high-impact factors whereas labour shortage, equipment shortage, design errors and events considered being low impact factors. According to contractor C, material shortage, equipment shortage, geotechnical data, weather, disaster, pandemic, they consider events to be high-impact factors while labour, design errors, and machinery breakdown considered being low-impact factors. The results are tabulated in Table 1.
Table 1: Factors identified by NZ road contractors
Factors Literature response
Industry Response Contractor A Contractor B Contractor C
Critical Material 55 H H H resources Labour 57 H L L
Equipment shortage 53 L L H Critical Geotechnical data 26 H H H factors Design error 58 L L L
Machinery breakdown 25 H H L Critical Weather 49 H H H
time Disaster - H H H Pandemic - H H H Events 23 H L H
Based on Table 1, the scheduling model was developed to understand the influence of each factor and relevance of each factor with other as shown in Figure 3. In Figure 3 the “negative” sign against each factor shows that factors have a negative impact on the project schedule, whereas “positive” sign shows that factors are contributing to achieving the project aim. The model comprises 10 factors identified during the semi-structured interview with field experts. In Figure 3 critical characteristics divided into 3 major factors such as critical factors, critical resources and critical time. All these factors have a direct and indirect link with identified factors. It directly links some factors to these others have an affected on other relevant factors. For example, material shortage, labour shortage and equipment shortage classified under critical factors.
Under critical time, mainly three factors have a negative contribution to the uncertainty in project duration. First is the pandemic, which has a negative impact on the critical sealing window and also contributes positively to the factors of the event. The second factor under critical time is the disaster, same as the pandemic disaster has a negative impact on the project schedule but also positively contribute to the labour shortage.
Second major factor under critical time is the weather, which contributes negatively to the project schedule directly but also contributes positively to events and equipment breakdowns. Second major contributing factors in project delays under critical factors. Critical factors are a combination of four major factors such as equipment breakdown, events, design errors and incorrect geotechnical investigation.

498
Mahesh Babu Purushothaman and Sumit Kumar
Whereas geotechnical and events have a direct negative impact on the project schedule. But equipment breakdown and design errors can lead to a positive contribution to other factors. Equipment breakdown contributes to the equipment shortage and design error can lead to a shortage of labour and material availability.
Figure 3: Project delay model
Third identified factor as critical resources. Critical resources are a combination of factors like equipment shortage, labour shortage, and material availability. Whereas material shortage affects the project schedule directly, but labour shortage can affect schedule directly or indirectly by influencing the material. All these factors have a negative influence on the project schedule. But the labour factor can also contribute to material availability.
In brief, the internal and external critical characteristics that influence the project delay in NZ road construction industry are Critical resources (material, Labour, and equipment shortage), Critical factors (design error, breakdown, and events) and critical time (weather, disaster and pandemic). The internal and external critical characteristics that influence the project delay in NZ road construction industry interlink to each other. Figure 3 shows the connectivity between delay factors and the Critical resources, critical factors, and critical time along with their positive (+) and negative (-) impacts, which reveal that

499
Environment, resource and surroundings based dynamic project schedule model for road construction industry in New Zealand
all these factors affect the project and during initial schedule planning a planner has to consider these factors and provide an appropriate buffer to deal with these uncertainties during the execution time.
5. Discussions and conclusionAs discussed in section one, the road construction sector in NZ plays an important role in New Zealand economic growth. This main focus of the study was to identify the factors and characteristics that influence project delays and develop the schedule model to mitigate these critical factors during the scheduling phase of the project. During study 65 international articles were review to identify the factors related to the construction project delays. These factors are then analysed to develop a semi- structured interview questionnaire for the local field experts. The field experts interviewed during this study had a minimum of 10 to 15 years of experience in the NZ road construction industry.
Comparing the systematic literature review and semi-structured interview result, the weather factor was confirmed by 49 out of 65 pieces of literature and all the field experts confirmed this factor as high impact. 55 confirmed the material shortage and material quality factor out of 65 articles, which all three experts in the road construction industry rated as high impact. 26 confirmed the geotechnical factor out of 65 articles and all three experts rated this as a high-impact factor. 57 confirmed the shortage of labour and skilled labour factor out of 65 articles, while one expert confirmed this factor as high and the other two confirmed low impact. 23 confirmed the event factor out of 65 articles and two experts rated as high impact while one rated as low impact. 53 confirmed the equipment shortage factor out of 65 articles and two experts rated as low impact while one rated as high impact. 25 confirmed the breakdown factor out of 65 articles, while 2 experts confirmed as high and one confirmed as low. The design error factor i in 58 out of 65 articles, while all three field experts confirmed as low impact. The disaster and pandemic were rated high impact by the three experts and none of the literature stated it as factors. The records and data shown by experts confirmed the disaster and pandemic weather material and geotechnical were the most influential in NZ road construction projects. While labour event, equipment shortage, breakdown, and design error had mixed impacts in NZ road construction projects Based on the semi-structured interview conducted with field experts the road construction projects experience time overrun which can vary any way between 20-40%, based on the project size. This study can help in identifying the delay causes in road construction projects and minimise their effects.
This study concludes that weather, pandemic, material, geotechnical, and disaster factors highly influence the project delay, while other factors such as equipment shortage, breakdown, design error, labour and event had mixed impact on project delays. These factors are recommended for future research to identify the percentage impact on each project delay and subfactors.
References Ahmed, S.M., Azhar, S., Kappagantula, P. and Gollapudi, D. (2003). Delays in Construction: A Brief Study of the
Florida Construction Industry. [online] Ascweb.org. Available at: http://ascpro0.ascweb.org/archives/cd/2003/2003pro/2003/Ahmed03.htm.
Bakker, A. (2018). Research quality in design research. Design Research in Education, pp.87–95. Ballesteros-Pérez, P. (2017). M-PERT: Manual Project-Duration Estimation Technique for Teaching Scheduling
Basics. Journal of Construction Engineering and Management, 143(9), p.04017063. Braun, V. and Clarke, V. (2006). Using thematic analysis in psychology. Qualitative Research in Psychology, 3(2), pp.77–
101.

500
Mahesh Babu Purushothaman and Sumit Kumar
Coughlan, T. (2020). Government announces billions of infrastructure spending, with roads the big winner. [online] Stuff. Available at: https://www.stuff.co.nz/national/119105125/government-announces-billions-of-spending- with-roads-the-big-winner [Accessed 18 Mar. 2020].
Dingwall, R., Murphy, E., Watson, P., Greatbatch, D. and Parker, S. (1998). Catching Goldfish: Quality in Qualitative Research. Journal of Health Services Research & Policy, 3(3), pp.167–172.
Driscoll, D.L., Appiah-Yeboah, A., Salib, P. and Rupert, D.J. (2007). Merging Qualitative and Quantitative Data in Mixed Methods Research: How to and Why Not. Ecological and Environmental Anthropology (University of Georgia), 3(1).
Duffy, M.E. (1987). Methodological Triangulation: A Vehicle for Merging Quantitative and Qualitative Research Methods. Image: The Journal of Nursing Scholarship, 19(3), pp.130–133.
E William East (2015). Critical path method tutor for construction planning and scheduling. New York: McGraw-Hill Education.
Fahmy, A., Hassan, T., Bassioni, H. and McCaffer, R. (2019). Dynamic scheduling model for the construction industry. Built Environment Project and Asset Management, ahead-of-print(ahead-of-print).
Fallon, V. (2020). Kāpiti expressway repairs delayed, 10km still to go in multi-million dollar fix up. [online] Stuff. Available at: https://www.stuff.co.nz/motoring/119126079/kpiti-expressway-repairs-delayed-10km-still-to-go- in-multimillion-dollar-fix-up [Accessed 10 Apr. 2020].
Henderson, B.D. (1986). THE LOGIC OF KANBAN. Journal of Business Strategy, 6(3), pp.6–12. Herroelen, W. and Leus, R. (2001). On the merits and pitfalls of critical chain scheduling. Journal of Operations
Management, 19(5), pp.559–577. Herroelen, W., Leus, R. and Demeulemeester, E. (2002). Critical Chain Project Scheduling: Do Not Oversimplify.
Project Management Journal, 33(4), pp.48–60. KIMURA, O. and TERADA, H. (1981). Desiǵn and analysis of Pull System, a method of multi-staǵe production control.
International Journal of Production Research, 19(3), pp.241–253. Kumar, P.P. (2005). Effective use of Gantt chart for managing large scale projects. 47, pp.14–21. Maxwell, J. (2020). NZTA wipes $16,000-a-day late fines for late Transmission Gully project. [online] Stuff. Available
at: https://www.stuff.co.nz/dominion-post/news/119696051/nzta-wipes-16000aday-late-fines-for-late- transmission-gully-project [Accessed 11 Apr. 2020].
Ministry of Business, Innovation & Employment (2013). Construction the New Zealand Sectors Report 2013. [online] Available at: https://www.mbie.govt.nz/assets/77439ddc45/Construction-report-2013.pdf.
Ministry of Business, Innovation & Employment (2016). Road infrastructure. [online] MBIE. Available at: https://www.mbie.govt.nz/assets/5f96bf780c/road-infrastructure.pdf.
Rouse, M. (2007). What is Gantt chart? - Definition from WhatIs.com. [online] SearchSoftwareQuality. Available at: https://searchsoftwarequality.techtarget.com/definition/Gantt-chart.
Stewart, J. (2015). Concurrency and the cost of delay. [online] www.minterellison.co.nz. Available at: https://www.minterellison.co.nz/our-view/construction-article-concurrency-and-the-cost-of-delay [Accessed 18 Oct. 2020].
Strang, B. (2019). $850m Transmission Gully completion delays likely. [online] RNZ. Available at: https://www.rnz.co.nz/news/national/398107/850m-transmission-gully-completion-delays-likely [Accessed 25 May 2020].
Valikoniene, L. (2015). Resource Buffers in Critical Chain Project Management | Research Explorer | The University of Manchester. [online] www.research.manchester.ac.uk. Available at: https://www.research.manchester.ac.uk/portal/en/theses/resource-buffers-in-critical-chain-project- management(eb4dda85-edb3-4775-b0ef-91ee5c76ec24).html [Accessed 13 May 2020]

501
The 54th International Conference of the Architectural Science Association (ANZAScA) 2020
Framework for building defects and their identification technologies: case studies of domestic buildings in Melbourne,
Australia
Shruthy Pamera1, and Argaw Gurmu2 1, 2 Deakin University, Geelong, Australia
[email protected], [email protected]
Abstract: The construction industry is one of the largest contributors to the economic development of a country, but dealing with major challenges such as building defects. Defects can affect project cost, duration and stakeholders’ relationships. Thus, to reduce the adverse effects, identification of defects in the early stages of the construction is essential. To identify the most prevalent defects, this paper used the Victorian Civil and Administrative Tribunal (VCAT) database as the main source of data. Five cases from VCAT database were chosen and the most frequently observed defects were considered for further analysis. Accordingly, installation errors in pipes, water damages, plumbing defects, internal water leakages and wall cracking were some of the common defects observed in the selected case studies. A Defects Identification and Analysis Framework (DIAF) was then proposed by mapping the defects with their potential causes and the identification technologies such as the ASDMCon (Advanced Sensory Based Defect Management at Construction Sites), BIM-based Defect Management (BIMDM), Electric- Type Geophysical and Infrared Thermography. The proposed framework can help construction managers or quality managers to mitigate building defects. This study contributes to the body of knowledge by developing a framework which can be used to identify and analyse defects in buildings.
Keywords: Building defects; construction industry; defect detecting technologies.
1. IntroductionThe residential construction sector plays an important role in the Australian economy. According to the Australian Bureau of Statistics (ABS) 2018, the total residential building sector contributes over $150 billion per annum (ABS, 2018). Utilizing 9.6 per cent of the national workforce, this sector employs over one million workers every year (ABS trend data, 2019). Despite the importance of this sector, low- quality works have been frequently reported in the residential building sector (Mills, 2009). Additionally, Mills et al. (2009) and Sadri et al. (2011) found that one in five houses were reported defective and the cost of rectification was 4 to 5 per cent of the construction contract value. Numerous studies have been conducted on the identification of the types of building defects. Which includes cracks, water seepage,
Imaginable Futures: Design Thinking, and the Scientific Method. 54th International Conference of the Architectural Science Association 2020, Ali Ghaffarianhoseini, et al (eds), pp. 501–510. © 2020 and published by the Architectural Science Association (ANZAScA).

502
Shruthy Pamera, and Argaw Gurmu
misalignment, blemishes (scaling, honeycomb), corrosion of reinforcement steel, cracking (floor, beam), and foundation failures were some of the frequent building defects. Nonetheless, some studies focused on analysing the causes of defects such as design errors, incorrect measurements, incompetent labours, inadequate equipment, lack of testing and inspection, faulty construction, climatic condition, lack of maintenance and change in the use of the building.
On the other hand, previous studies proposed various methods of defect detection. Yue et al. (2006) developed ASDMCon (Advanced Sensor-Based Defect Management at Construction Sites) to help site managers in detecting and managing construction defects using 3D imaging and other advanced sensor technologies. Meola et al. (2005) used 3 different techniques such as infrared thermography, ultrasonic and electric-type geophysical methods to detect defects. Lin et al. (2016) proposed a BIM-based Defect Management (BIMDM) system for early detection of defects by on-site quality managers during the construction phase. The above reviews indicated that erstwhile studies on building defects focus on either (1) identification of the anomalies or (2) assessing the causes of defects or (3) developing technologies for their detection. Hence, there is a dearth of research which combines the three issues together. Further,none of the previous studies proposed a comprehensive tool which integrates defects, their causes andidentification techniques. To improve the quality of buildings during the construction stage, it is important not only to identify the cause of defects but also to map with defect detecting methods so that corrective measures can be performed. Thus, to address the aforementioned knowledge gap, the objective of this research is to develop a framework which helps to map the defects with the identification techniques and their causes.
2. Literature review
2.1. Defect types
Ayininuola and Olalusi (2004) found that wall cracking, foundation settlement and column buckling were the most common building defects in Nigeria. Mills et al. (2009) opined that leakage through windows and external water penetration was the costliest claims due to water damage. Rodrigues (2011) mentioned that the main anomalies in building facades include water problems, cracking, detachment and problems in the surface appearance. Bortolini et al. (2018) found that the most common defects were cracking in interior partitions and structural elements. Alencastro et al. (2018) investigated the quality defects affecting the thermal performance of buildings and found that the most frequent defects were related to building structural gaps and poor isolation element installation. Further, the authors identified several defects, including lack of cavity closers and isolation gaps at jambs and sills. Summary of defect types is presented in Figure 1.
2.2. Defect causes
According to Akinpelu (2002), environmental changes, natural and manmade hazards, improper presentation and interpretation in the design were the major causes of structural failures. Richard (2002) opined that deterioration of reinforced concrete could occur due to corrosion of the reinforcement caused by carbonation and chloride ingress. Ayininuola et al. (2004) found that improper presentation and interpretation in the design, non-existence of local codes and lack of maintenance are the common causes of the design errors. Moreover, he concluded that clients, architects, design engineers, local authority (town planners) and contractors are contributing immensely to building failures in various dimensions. Carretero- Ayuso et al. (2015) identified that the lack of detailed plans in construction is a direct cause of many defects and humidity is the most frequent cause of the anomalies. Further, the authors discussed that flaws in waterproofing, differential settlements, lack of tight joints, and deficiencies or absence of drain elements were some of the causes of defects. The causes of defects are summarised in Figure 2

503
Framework for building defects and their identification technologies: case studies of domestic buildings in Melbourne, Australia
.
Defect types Authors Wall cracking, spalling, foundation settlement, column buckling. Ayininuola et al. (2004) Deformation of the roof, internal walls and floors. Ilozor et al. (2004) Cracking of grout, external leakage, the inadequacy of structures, windowsill gap
Georgiou (2010)
Water problems, cracking, detachment and problems in the surface appearance.
Rodrigues et al. (2011)
Corrosion and spalling of concrete, leakage at pipe penetration and joints. Das et al. (2011) Leaking pipes, total failure of the water supply system, cracking of concrete walls, faulty doorknobs and concrete walls dampness.
Abdul-Rahman (2012)
Inaccurate tile grouting, incorrect fixtures and toilet fittings, floor or wall irregularities, tinctures, mess and cracks.
Forcada et al. (2016)
Errors in ceramic pieces layout, faulty cut of ceramic pieces, excessive visibility of joints and uneven surfacing.
Del Solar et al. (2015)
Cracking in interior partitions and structural elements, water problems in interior partitions, corrosion of the plumbing system.
Bortolini et al. (2018)
Poor isolation element installation, lack of cavity closers and isolation gaps at jambs & sills.
Alencastro et al. (2018)
Figure 1: Summary of the common defect types
Causes of Defects Sub-categories Author/s Environmental factors
Environmental changes, natural and manmade hazards, carbonation and chloride, ingress, natural motion, ageing
Akinpelu (2002), Richard (2002),
Errors in design elements, insufficient review of drawings Ayininuola et al. (2004), Abdul- Rahman (2012)
Construction faults
Improper presentation and interpretation in the design, overloading, substandard construction materials, damage or vandalism
Akinpelu (2002), Ayininuola et al. (2004), Auchterlounie
Incompetence of builders and other stakeholders Poor workmanship and materials
Lack of attention to quality by house builders, clients tend to save cost by using low-quality materials.
Ayininuola et al. (2004)
Faulty workmanship; bad building materials; flaws in waterproofing; ignorance, negligence and fraud of workers; unqualified employees or inadequate supervision; inadequate tools or equipment, incompliance with equipment manual; lack of training for labours.
Auchterlounie (2009), Carretero- Ayuso et al. (2015), Atkinson (1998), Ayininuola et al. (2004), Abdul- Rahman (2012), Lee et al. (2018), Love et al. (2019)
Figure 2: Summary of causes of defect
Defect identification technologies
The ability to understand defects and their causes is a vital prerequisite for preventing and/or minimizing defects. Yue et al. (2006) developed an ASDMCon (Advanced Sensory Based Defect Management at Construction Sites) framework to aid site managers in detecting and managing construction defects using 3D imaging and other advanced sensor technologies. The author mentioned that ASDMCon helps to detect defects as they occur by performing frequent, complete, and accurate assessments of the actual (as-built) condition of a facility throughout the construction process. According to Yue et al. (2006), advanced sensor technologies such as 3D imagers (i.e., laser scanners) and embedded sensors can be used to monitor defects. Laser scanners provide the capability to accurately model the geometric aspects of the facility, whereas embedded sensors monitor non- geometric aspects such as concrete strength. The collected information is then combined with the design model, an ontology of specifications, and the project schedule to create an integrated project model, which is dynamically updated throughout the construction period. Similarly, Akinci et al. (2006) have successfully developed a formalism for using advanced sensor systems and integrated project models for activity quality control on construction sites.

504
Shruthy Pamera, and Argaw Gurmu
Meola et al. (2005) used infrared thermography (IRT), ultrasonic technique and electric-type geophysical methods for defect detection. Accordingly, infrared thermography (IRT) was found to be the easiest and quickest technique which can be used for detecting defects in cement-based material. According to the authors, IRT is capable of supplying detailed information about the size, position and nature of defects. It can also be used for the study of precious artworks such as mosaics, frescoes and paintings. On the other hand, the ultrasonic technique can provide information useful for the evaluation of structural inhomogeneity in the presence of very thick materials. Further, the ultrasonic method can be used to analyse the in-depth conditions, such as the thickness of the walls and the characteristics of the support under the plaster (Meola et al., 2005). According to the authors, the electric-type geophysical technique is useful for a thorough assessment of porosity levels, the distribution of voids and micro-cracks in the entire structure of masonry including the plaster and support. Milovanovic et al. (2016) provided an overview of the active infrared thermography (IRT) method for detection and characterization of defects such as cracks and other anomalies in reinforced and prestressed concrete structures.
Lin (2016) developed the building information modelling defect management (BIMDM) system by integrating the BIM models of defects and defect management (DM) information using Navisworks and application programming interface (API). As per the authors, by using the BIMDM system, users can quickly and automatically link the corresponding defect information to BIM models and effectively access the defect information, solve problems, and manage defect information during the construction phase. Moreover, Kim et al. (2008) proposed a computerized Quality Inspection and Defect Management System (QIDMS). This system can be used to collect defect data at a site in real-time using Personal Digital Assistant (PDA) and wireless internet, and effectively manage the statuses and results of the corrective works performed.
3. Research methodologyA research conducted by Gurmu and Paton-Cole (2018) showed that the majority of court cases regarding residential building defects were registered in East and South-Eastern suburbs of Melbourne, Australia, which include Pakenham, St. Kilda, Doncaster Easter and Brighton. Based on the findings of the previous study, this research randomly selected five different properties built in the East and South- East suburbs of Melbourne. The data used in this paper was drawn from VCAT database since the tribunal collects and registers all the possible pieces of evidence related to the alleged building defects before deciding on a case (VCAT, 2019). Evidence also includes independent experts witness to decide whether the complaint lodged by the house owner is a genuine allegation or not. Hence, valid conclusions can be drawn based on the data obtained from VCAT.
The qualitative research method is adopted to explore the most frequent building defects and the potential causes of the defects. Dey (1993) mentioned that qualitative data analysis involves description of phenomena, classification and observation of how the concepts might interconnect. Additionally, Rose et al. (2015) described that qualitative data analysis can be carried out in three stages which include data reduction, data display, and drawing conclusions. After analysing the contents of court cases of the selected buildings, the most frequent defects were then identified, and the results were presented in tables and figures. Thereafter, the potential causes of the identified defects and their detection technologies were proposed based on the review of relevant literature. Finally, the framework which relates the most frequent defects identified in five case studies with the defect causes along with the defect identification methodologies was developed.

505
Framework for building defects and their identification technologies: case studies of domestic buildings in Melbourne, Australia
4. Case studiesThe first case study is the Prahran home. This house was constructed together with an adjoining house, by the builder for the owner pursuant to a major domestic building contract dated 30 March 2011 for a contract price of $1,050,000 (“the Contract”). Construction has been completed on 23 May 2012; however, the owner did not move in until a few months later. On 21 May 2018, the owner brought legal proceedings to rectify alleged defects such as plumbing defects, errors in the installation of the air- conditioning unit, leakages in the bathroom and render damage (Figure 3).
No Type of defects
1 First-floor ceiling height was out of code 2 The opening of windows non-compliant with contract 3 Gaps in many areas of first-floor cladding of the building 4 Roof plumbing defects 5 Render damage 6 Leakages in bathroom
Figure 3: Defects in Prahran house
The second case study is the Kensington home. The domestic building contract between the owner and the builder was signed on 25th February 2017. The total contract price of the project inclusive of GST was $200,140.00. A building permit was issued on 10th April 2017 and construction began on 10th August 2017. The Occupancy Certificate was issued on 16th July 2018. The owners of the house have moved into their new three-bedroom home on 10th August 2018. However, in early January 2019, the owners noticed various severe defects in a house they have occupied in only 5 months. Some of the defects include diagonal cracking, rear trusses out of level, door opening on ground-level too low and party wall cavity insufficient (Figure 4).
No Type of defects
1 Stair opening void short by 90 mm 2 Diagonal cracking 3 Ply bracing not installed properly 4 Load-bearing triple studs placed incorrectly 5 Rear trusses out of level 6 Incorrect shaft liner clips used to the party wall 7 Party wall cavity insufficient-the party wall studs were built with an insufficient
gap to allow the installation of Fire check sheeting 8 Incorrectly sized window openings on the ground and first floors in both units were built to the wrong size 9 Door opening on ground-level too low
Figure 4: Defects in Kensington house
No Type of defects
1 The finished floor level across the front of the robe sliding doors to be up to 13 mm out of level within 2- meter sections resulting in the robe head and the ceiling also being out of level
2 The restrictor bracket at the bottom of the window sash has separated from the frame which is allowing the window to open greater than 125mm.
3 The Sarking membrane - inadequate installation 4 Ceilings are out of level 5 Windows and door frames are distorting 6 Cracking of walls 7 The return air intake grille has been installed in the study area at the top of
the stair rather than at floor level on the ground floor area 8 Basement water leaks 9 Weather tightness being impaired 10 There is a gap of 12mm across the top of the door and the latch does not engage into the striker plate 11 External rear garage wall and ceiling - flashing missing 12 Exhaust fan in bathroom not vented 13 Service pipes fracturing
Figure 5: Defects in Glen Iris home

506
Shruthy Pamera, and Argaw Gurmu
The third case study is the Glen Iris house. The building permit of this property was issued on 4 April 2011. The certificate of occupancy was issued on 28 July 2016. The property has 3 bedrooms, 2 bathrooms with 2 car spaces. The sale price of the property was $1,644,500. The owners of the property inspected the property on 2 December 2016 and found defects and found defects listed in Figure 5.
The fourth case study is Bentleigh house. On about 4 June 2010, the builder and the owner entered into a major domestic building contract to construct three two-storey townhouses on land owned by the owner at Tucker Road in Bentleigh for a price of $1,100,000.00 inclusive of GST. The work was to be carried out in accordance with plans provided to the builder by the owner. Construction took place between 23 August 2010 and 25 August 2011 when the owner took possession of all three buildings. A certificate of occupancy was issued for the buildings on 8 September 2011. Based on VCAT data, the defects shown in Figure 6 were identified.
No Type of defects
1 Substandard installation of flashings 2 Water damage in guest Ensuite 3 Inadequate fixing to cappings 4 Spreaders not installed correctly 5 Incorrect drainage from box gutters 6 Inadequate fall on parapet capping 7 Failed caulking in articulation joint 8 No damp proof course installed 9 Control joints missing polystyrene foam cladding 10 Faults in roof space and kitchen cabinetry 11 Defective paintwork 12 Faults in external door seals 13 Failed waterproofing to guest Ensuite 14 Inadequate fasteners to pressure flashing
Figure 6: Defects in Bentleigh house
No Types of defects 1 The air-conditioning pipes had not been adequately sealed where they
penetrated the wall sheeting. 2 Metal cappings had not been properly installed and some did not fall into the
gutter 3 The upper roof box gutter did not have a sump installed 4 Water entering the building at the internal corner above the glazed entry door
because it had not been sealed and the appropriate corner flashing had not been installed. 5 The sill of the external toilet door is below the pavers that form the floor of the
toilet 6 Waterproofing to the bathrooms was inadequate and it is installed before bath
hobs 7 Head and sill flashings are missing on many windows 8 The rain heads were installed with non-compliant overflow cut-outs 9 Flashings and roofing material were not turned up or turned down as
appropriate 10 The deterioration in the timber as it was not treated with a material called
“Cutek” as per the contract 11 Lack of linear drainage to take surface water from the area 12 External decking boards do not have sufficient penetrating oil or sealer to
protect them from weather 13 The ceiling had been plastered without any insulation 14 Pavers next to the pool have cracked where they were laid over a void in the
concrete
Figure 7: Defects in Toorak house
The fifth case study is Toorak house. The house was partially constructed by the builder pursuant to a major domestic building contract between 2013 and 2016. The contract was then terminated, and the construction of the house was completed by another builder. Analysis of the court case revealed defects comprising of waterproofing to the bathrooms was inadequate, head and sill flashings are missing, water leakage from kitchen north wall and ceiling had been plastered without any insulation (Figure 7). Analysis of the court case of the owner and the builder revealed the list of defects presented in Figure 7.

507
Framework for building defects and their identification technologies: case studies of domestic buildings in Melbourne, Australia
5. Findings and discussionsAfter reviewing the five case studies from East and South-East suburbs of Melbourne, all the qualitative data is combined, the most frequent defects were identified, and the results are presented in Figure 8.The bar graph was plotted using the type of defects and their frequency (Figure 8). For example, the defect ‘leakage of water’ is observed in the five houses listed under case studies; thus, number 5 was assigned to it. Similarly, the frequencies of other defects were determined. Accordingly, roofing errors, cracks in walls, leakage of pipes, water damage to the ceiling plasterboard, floor and wall irregularities, voids in mortar and uneven surfacing were found to be some of the most frequent defects in this research. Paton-cole and Gurmu (2018) also concluded that cracking of cornice, diagonal cracking and horizontal movement of brickwork, cracks on floor tiles, large cracks in the plasterwork, jamming of doors and windows, service pipes fracturing and leaning of walls are some of the common defects observed in the two case studies from western suburbs of Melbourne.
Figure 8: Frequency of occurrences of defects in the selected case studies
5.1. Defects Identification and Analysis Framework (DIAF)
By combining the findings obtained from case studies and literature review, a framework which shows the most frequent defects, potential causes and technologies which help to identify the defects is developed (Figure 9). In the middle of the framework, the most frequent defects such as inadequate ceiling, internal water leakages, ceiling leakages, installation errors in windows and doors and cracks in walls and roof of buildings are provided. The possible causes of defects such as errors in design (Love, 2002, Alencastro et al., 2018, Forcada et al., 2012, Silvestre and De Brito, 2011); construction faults (Hwang et al., 2009, Sun and Meng, 2009); and poor workmanship (Jha and Iyer, 2006, Abdul-Rahman et al., 2012) are then mapped with defects. The possible defects identification technologies during the design and construction phases are also indicated in the proposed framework.
As indicated in Figure 9, roofing errors and inadequacy of structural members are found to be the most frequent defects. The potential causes of these defects could be related to design errors because the analysis of court cases (VCAT database) showed that the pitch of the roof was designed out of building code of Australia. On the other hand, the technologies which can be used to identify these defects include Laser Scanners and BIM-based defect management. Cracks in a structure may be due to construction faults such as foundation failure, decay of building fabric, change in moisture, thermal and ground moment. Understanding the site condition and soil classification is important in assessing cracks and preparing mitigation strategies. Nonetheless, technologies such as ASDMCon helps find out the defects related to cracks, leakages, window and door irregularities with the use of laser scanners and embedded sensors in concrete. Further, infrared thermography can help to identify defects such as small cracks in walls and ceiling.
Similarly, internal water leakages and ceiling leakages are some of the main defects observed in many of the case studies. These defects could be due to inadequate application of waterproofing, poor roof drainage and use of low-quality materials. Hence, the causes can be broadly categorized under

508
Shruthy Pamera, and Argaw Gurmu
construction faults. Contrariwise, sensor-based technologies can serve as an early identification tool of the defects related to leakages. Also, infrared thermography can be adopted to detect the leakages in ceilings and sanitary fixtures and the water damage to the plasterboards. Errors in the installation of doors and windows, roof and timber cladding are identified after hand-overring the property to the owners. Thus, Building Information Modelling Defect Management (BIMDM) can be used for the early identification of these anomalies by comparing the original plan with the actual or as-built plan. Goedert et al. (2005) also described an innovative approach to building modelling by integrating three- dimensional (3D) digital laser scanning and rapid prototyping (RP) technology. The process involves capturing a 3D scan of a building exterior and using the RP process to create a 3D physical model. According to the authors, the technique has advantages in terms of cost, speed, and reduction of human error.
Figure 9: Framework for defects types, causes and identification technologies
Defects like uneven surfacing could be due to applying plaster without preparing the background surface, thick coat applying to surface of the wall for speedy construction. Moreover, construction professionals not complying the minimum requirement provided in the construction codes and standards for the sake of saving cost also the reason for such defects. However, the ultrasonic method can be used to detect the in-depth condition of a structure like the uneven thickness of walls and plaster which were identified in some of the case studies. Finally, voids in plaster works may be due to poor mortar proportions and poor workmanship. The electric-type geophysical technique for assessment of porosity levels, the distribution of voids and micro-cracks in the entire structure can serve as a best defect detecting tools.
6. ConclusionThere are various technologies for the identification of defects in the early stages of construction or after property hand-over. However, there is a lack of framework which links defects, their potential causes and suitable defects identification technology. Hence, the objective of this research is to propose

509
Framework for building defects and their identification technologies: case studies of domestic buildings in Melbourne, Australia
a Defects Identification and Analysis Framework (DIAF). In the framework, building defects in the residential properties from East and South-East suburbs of Melbourne, Australia were analysed with the use of the Victorian Civil and Administrative Tribunal (VCAT) database. Accordingly, cracks in external walls, interior partitions and plaster works; installation errors in doors and windows; and leakages of the ceiling and sanitary fixtures are concluded as most common defects observed from selected case studies.
The framework was developed by mapping the type of defects and the potential causes with defect identification technologies based on the review of literature and expertise of the researchers. For instance, cracks and leakages could be due to construction faults and poor workmanship. Thus, with the help of the theoretical framework, defects can be identified at any phase of the construction or after handover phase. This study has both practical and theoretical implications. First, the proposed framework can be used by construction managers or quality managers to identify building defects and take corrective actions such as changing the design, maintaining quality of the materials and deploying the skilled workmanship. Second, researchers in the areas of building defects can use the framework to collect and analyze defects data.
Some of the limitations of this research include; first, the data was collected from the selected cases in VCAT database and field observation was not conducted to validate the findings. Second, the study considered houses in the East and South-Eastern suburbs of Melbourne and the findings may not be generalized. Therefore, further research needs to be undertaken by analyzing all the residential buildings defects data which are available in the VCAT database. The analysis can be carried out by categorizing the data based on the year of construction of houses and analyzing the defects’ trends. Additionally, future researchers can conduct defects analyses by collecting data with the help of defect identification technologies and compare the accuracy of the technologies in detecting defects.
References Abdul-Rahman, H., Wang, C., Wood, L and Khoo, Y. (2012) Defects in Affordable Housing Projects in Klang Valley,
Malaysia, Journal of Performance of Constructed Facilities, 28(2), 272-285. ABS (2018) Building Activity, Australia, Mar 2018, Cat. no. 8752.0, Canberra, Australia. Akinci, B., Boukamp, F., Gordon, C., Huber, D., Lyons, C. and Park, K. (2006) A formalism for utilization of sensor systems
and integrated project models for active construction quality control, Automation in construction, 15(2), 124-138. Akinpelu, J.A. (2002) The need for code of conduct, building regulations and by-laws for the building industry in
Nigeria, The Professional Builder, Nigeria Institute of Building, 2(1), 11-14. Alencastro, J., Fuertes, A. and De Wilde, P. 2018. “The relationship between quality defects and the thermal
performance of buildings.” Renewable and Sustainable Energy Reviews, 81, 883-894. Atkinson, A. 1998. “Human error in the management of building projects.” Construction Management &
Economics, 16(3), 339-349. Ayininuola, G and Olalusi, O. 2004, "Assessment of building failures in Nigeria: Lagos and Ibadan case study." African
Journal of Science and Technology, 5 (1). Bortolini, R and Forcada, N (2018), "Building Inspection System for Evaluating the Technical Performance of Existing
Buildings", Journal of Performance of Constructed Facilities, 32(5), 04-73. Das, S. and Chew, M.Y. (2011) Generic method of grading building defects using FMECA to improve maintainability
decisions, Journal of Performance of Constructed Facilities, 25(6), 5-533. Dey, I. (1993) Qualitative data analysis: a user-friendly guide for social scientists, Routledge, New York, US. Forcada, N., Macarulla, M., Gangolells, M. and Casals, M. (2016) Handover defects: comparison of construction and
post-handover housing defects, Building Research & Information, 44(3), 279-288.

510
Shruthy Pamera, and Argaw Gurmu
Georgiou, J. (2010) Verification of a building defect classification system for housing, Structural Survey, 28(5), 370- 383.
Hwang, B.-G., Thomas, S. R., Haas, C. T. and Caldas, C. H. (2009) Measuring the impact of rework on construction cost performance, Journal of construction engineering and management, 135(3), 187-198.
Ilozor, B.D., Okoroh, M.I. and Egbu, C.E., (2004) Understanding residential house defects in Australia from the State of Victoria, Building and Environment, 39(3), 327-337.
Jha, K. and Iyer, K. (2006) Critical factors affecting quality performance in construction projects, Total Quality Management and Business Excellence, 17(9), 1155-1170.
Kim, Y.S., Oh, S.W., Cho, Y.K. and Seo, J.W., (2008) A PDA and wireless web-integrated system for quality inspection and defect management of apartment housing project, Automation in Construction, 17(2), 163-179.
Lin, Y.-C., Chang, J.-X. & Su, Y.-C. (2016) Developing construction defect management system using BIM technology in quality inspection, Journal of Civil Engineering and Management, 22(7), 903-914.
Love, P.E., Smith, J., Ackermann, F. and Irani, Z. (2019) Making sense of rework and its unintended consequence in projects: The emergence of uncomfortable knowledge, International Journal of Project Management, 37(3), pp.501-516.
Meola, C., Di Maio, R., Roberti, N. and Carlomagno, G. M. (2005) Application of infrared thermography and geophysical methods for defect detection in architectural structures, Engineering Failure Analysis, 12(6), 875- 892.
Mills, A., Love, P. E., and Williams, P. (2009) Defect costs in residential construction Journal of Construction Engineering and Management, 135(1), 12-16.
Opfer, N. (1999) Construction defect education in construction management, in ASC proceedings of the 35th Annual Conference, California Polytechnic University, ASC.
Paton-Cole, V. and Gurmu, A. (2018) A review of defects in low-rise residential buildings in the Australian State of Victoria, In ICEC-PAQS 2018: Grassroots to Concrete Jungle: Dynamics in Built Environment (pp. 1-9). Australian Institute of Quantity Surveyors, Sydney, Australia.
Richard, R.L. (2002) Leading the way in concrete repair and protection technology. Concrete Repair Association, Costa Rica, 1, 1.
Rodrigues, M. F. S., Teixeira, J. M. and Cardoso, J. C. (2011) Buildings envelope anomalies: A visual survey methodology, Construction and Building Materials, 25(5), 2741-2750.
Rose, S., Spinks, N. and Canhoto, A.I. (2015) Management research: Applying the principles, Routledge, London. Sadri, R & Ghavam, H. (2011) Improving productivity through mistake-proofing of construction processes,
Proceedings of International Conference on Intelligent Building and Management, Singapore. Silvestre, J. and De Brito, J. (2011). Ceramic tiling in building façades: Inspection and pathological characterization
using an expert system. Construction and Building Materials, 25(4), 1560-1571. Solar, P., Del Río, M., Villoria, P. and Nadal, A. (2015) Analysis of Recurrent Defects in the Execution of Ceramic-
Coatings Cladding in Building Construction, Journal of Construction Engineering and Management, 142(4), 04015093.
Sun, M. and Meng, X. (2009) Taxonomy for change causes and effects in construction projects, International journal of project management, 27(6), 560-572.
VCAT (2019) Expert witnesses. Available from: https://www.vcat.vic.gov.au/steps-to-resolve-your-case/how-to- prepare-for-your-hearing/witnesses-and-witness-statements (accessed 8 October 2019).
Yue, K., Huber, D., Akinci, B. and Krishnamurti, R. (2006) The ASDMCon project: The challenge of detecting defects on construction sites, In Third International Symposium on 3D Data Processing, Visualization, and Transmission. IEEE, Chapel Hill, NC, US.

511
The 54th International Conference of the Architectural Science Association (ANZAScA) 2020
Framework for the refurbishment of modernist social housing
Sarah Pells1 and Hans-Christian Wilhelm2 1, 2 Victoria University, Wellington, New Zealand
[email protected], [email protected]
Abstract: New Zealand (NZ) has a stock of social housing developments built between 1940-80, requiring substantial refurbishment to meet current thermal comfort requirements. Additionally, these developments often lack social spaces, adequate to changed societal circumstances. Consequently, there is a desire to demolish rather than refurbish. The situation is exacerbated as by 1st July 2023 the new healthy homes standards require social housing providers to ensure dwellings can be heated to a minimum of 18°C indoor temperature. While some exemplar social housing refurbishments have been undertaken in NZ, there is a lack of systematic assessment to inform and increase uptake of refurbishment as a development option. This research develops a systematic framework of assessment for the refurbishment of social housing developments in NZ, whereby enhancement of social spaces and thermal comfort are combined. Based on a literature review, a range of refurbished and non- refurbished social housing developments are analysed and captured in a comparative matrix, ranging from urban and dwelling typology, social spaces, to construction and building envelope details. Subsequently, a design tool informing a range of refurbishment strategies combining social space and thermal comfort is proposed. The research can inform decisions around refurbishing or demolishing existing social housing. Increasing the uptake and quality of refurbishments will contribute to preserving built heritage and reduce resource and energy footprints of housing in NZ.
Keywords: Social housing; thermal comfort.
1. Background, hypothesis, aims and objectivesBackground. A large proportion of NZ’s existing social housing stock is often cold, damp and lacks heating and insulation (Habitat for Humanity, 2019). In addition, these dwellings can be expensive to heat due to their low energy performance, making heating unaffordable for many tenants. Moreover, the poor conditions are linked to increased illness and infections (Habitat for Humanity, 2019). In addition, many of NZ’s modernist social housing estates are also confronting problems on the level of social interaction. For instance, the lack of variation and the vulnerability of hidden spaces turned modernist utopian ideas into waves of criticism (Mahdavinejad et al., 2012). Issues pertaining thermal comfort and health in conjunction with social issues have often led to a desire to demolish rather than refurbish. Demolition was once and quite often still is the default strategy to the problems associated with modernist social housing (Karakusevic, 2017). According to researcher Karakusevic (2017), demolition is often brutal, not viable, unnecessary, and hugely wasteful. By contrast, refurbishments can
Imaginable Futures: Design Thinking, and the Scientific Method. 54th International Conference of the Architectural Science Association 2020, Ali Ghaffarianhoseini, et al (eds), pp. 511–520. © 2020 and published by the Architectural Science Association (ANZAScA).

512
Sarah Pells and Hans-Christian Wilhelm
be ambitious, sustainable, affordable, better quality, and far more economical. Furthermore, these buildings are a part of our history. Therefore, transformative approaches should be much more desirable in the long term. (Karakusevic, 2017).
This paper aims to establish a design tool that addresses the fundamental issues of NZ’s modernist social housing stock and to promote refurbishment over demolition. Literature is analysed to determine the qualities and importance of social spaces and thermal comfort in social housing, as well as best practice design strategies to enhance both. A comparative matrix of six non-refurbished NZ case studies is analysed to inform the areas of focus, where social spaces and thermal comfort can be improved. Refurbished case studies are evaluated based on what design strategies led to their success. A design tool is then created based on literature review, comparative matrix, and case study analysis, to best achieve design interventions where social space and thermal comfort can be enhanced and efficiently work together. Hypothesis. This research proposes to effectively refurbish modernist social housing in NZ using simple and effective design strategies that combine and enhance social space and thermal comfort to improve building performance and liveability. Aims and Objectives. The fundamental aim of this paper is to demonstrate that combining and enhancing social spaces and thermal comfort is an efficient way to refurbish NZ’s modernist social housing. A crucial objective is to create a systematic framework for assessment of NZ’s non-refurbished modernist social housing. A further objective is to create a design tool that combines and enhances social space and thermal comfort in the identified areas of focus.
2. MethodologyThis research comprises four stages: a literature review, a case study analysis (refurbished and non- refurbished social housing projects) leading to a comparative matrix, and a design tool that combines social spaces and thermal comfort efficiently. Based on literature, themes about social interactions and thermal comfort are established and analysed to inform an argument of why these topics are important in social housing. Six non-refurbished case study projects are analysed to form a comparative matrix, which synthesises common features and problems. Aspects analysed range from urban and dwelling typology, social spaces, to construction and building envelope details. The matrix captures areas of similarities and weaknesses and informs areas of focus where enhancing social spaces and thermal comfort could be achieved most effectively. In addition, two refurbished social housing case studies (international and NZ) are analysed. Based on the findings, a design tool is then established. The tool is a set of best practice design principles, represented in a table for designers and stakeholders to use. The table demonstrates how to best achieve enhancement of social space and thermal comfort within each identified area of focus. To achieve the desired holistic view and in accordance with the focus on architectural design, the research reviews and synthesises specialist research literature and projects reviews rather than conducting resident interviews or other forms of data collection.
3. Literature study and reviewThe literature review examines authors’ perspectives of community and social sustainability, the impacts of social interactions, how to best design for social interactions, thermal comfort parameters, effects of thermal comfort, and how-to best design for thermal comfort. Finally, it explores combining social spaces and thermal comfort.

513
Framework for the refurbishment of modernist social housing
3.1. Social spaces and social interactions
The criteria for literature selection include articles that analyse community, social sustainability, and the psychology of social interactions in residential environments. Bramley and Power (2009), and Callies et al. (2003) discuss ideas that contribute to community and social sustainability. These include social interaction, social integration, cohesion, growth, sense of purpose, attachment, and safety. The literature reveals that social interactions play an essential role in achieving social sustainability and community.
Literature reviewed states that social interactions contribute to enhancing communities and personal health. For instance, Umberson and Montez (2010) proclaim that adults who are more socially connected are healthier and live longer than their more isolated peers. In addition, the literature analysed discusses green spaces as a common area for social interactions to occur. Green spaces and nature are argued to have health benefits. For example, according to Mitchell and Popham (2008), parks, playing fields and forests provide both a stress-reducing restorative effect and allow more physical activity, both of which improve health. Therefore, there is an argument that the positive health impacts of social interactions can be linked to the health benefits of green spaces. Overall, the literature analysed implies that social interactions and nature contribute positively to health. This is especially important in social housing because common demographics include elderly people (often isolated) and vulnerable people (health problems).
Forster (2010), Karuppannan and Sivam (2011), and Talen and Ellis (2002) debate which design strategies best achieve spaces of social interactions and community. The literature analysed suggests that common strategies for building design include mixed housing, mixed density, accessibility, human scale, variety of spaces, attractiveness of public space, safety, units placed around a common space, common entries and meeting points, and local amenities. Common strategies for green spaces design include well-located open spaces, pedestrian oriented spaces, vegetable gardens and planting; for example, a reduction in crime has been observed in areas with more natural features such as trees and grassy areas (Forster, 2010). Based on the literature, these strategies are the paramount ways to achieve social interactions and community. In conclusion, social interactions can positively contribute to social sustainability, community, and health. In addition, literature reveals built and natural strategies that can foster social interactions.
3.2. Thermal comfort and energy performance
Literature has been searched for articles that analyse thermal comfort in social housing conditions. Haddad et al. (2019) and Diaz Lozano Patino and Siegel (2018) discuss factors that impact thermal comfort, including temperature, humidity, air velocity, mean radiant temperature, occupant metabolic level and clothing level. Many of these factors vary from person to person. For example, WHO (2007) recommends comfortable temperatures of 18-22°C (WHO Europe, 2007), whereas a study by Földváry et al. (2017) defined the range of acceptable temperature as 20-24°C.
The literature analysed underlines causal links between exposure to low or high indoor temperatures (i.e. exceeding certain ranges) and negative effects on health. For example, Diaz Lozano Patino et al. (2018) and Haddad et al. (2019) discuss that low temperatures can lead to poorer resistance to respiratory infections and increased blood pressure. High temperatures can lead to heat fatigue, heat exhaustion, and heat strokes. This is especially important for social housing occupants because they are

514
Sarah Pells and Hans-Christian Wilhelm
more at risk of health issues and spend considerable amounts of time in their homes. Therefore, it is imperative that healthy indoor conditions are maintained for social housing occupants.
In addition, Diaz Lozano Patino and Siegel, (2018), Haddad et al. (2019), and Tiberiu et al. 2019) discuss that thermal comfort is directly linked to energy performance. Haddad et al. (2019) argues that energy performance is a major issue for social housing, because many social housing tenants have difficulties paying their electricity bills. This has become commonly addressed as energy poverty. In some cases, energy poverty has negative effects on health, because tenants choose not to turn on heating since they cannot afford it. This is exacerbated due to the substandard energy performance issues (minimal insulation, cold and damp environments) in social housing.
Haddad et al. (2019) and Tiberiu et al. (2019) discuss crucial strategies utilised to improve thermal comfort and energy performance. These strategies include improving the building envelope, adding thermal insulation, improving airtightness, upgrading, or replacing windows and doors, controlled ventilation, solar radiation, and utilising passive design strategies to reduce the use of active cooling and heating systems. In addition, Tiberiu et al. (2019) highlights how glazed balconies can be used as thermal buffer zones in cold climates and in warm climates open balconies can be used as sub-spaces to shade spaces. In conclusion, achieving thermal comfort in social housing is particularly important to improve health outcomes, occupant perception of comfort and reduce energy poverty. Literature verifies that thermal comfort can be achieved through modernisation and retrofits.
3.3. Social interactions and thermal comfort
There is a literature gap with regards to social interactions and thermal comfort working in conjunction with each other. Therefore, both topics have been analysed individually. The literature reveals design strategies that can enhance social interactions and thermal comfort within developments. There is an opportunity to analyse how these strategies can work in conjunction with each other when refurbishing modernist social housing. This obviously has its limitations, where implementing strategies that maximise social spaces can compromise thermal comfort and vice versa. Therefore, strategies that can achieve desirable outcomes for social interactions in conjunction with thermal comfort are able to keep interventions small, while attaining maximum building performance, liveability, and health of tenants. In conclusion, literature verifies that design strategies that enhance social interactions and thermal comfort in social housing can promote communities and improve health.
4. Case study analysis
4.1. Case studies non-refurbished – comparative matrix
Six non-refurbished modernist social housing case studies in NZ are analysed systematically, firstly looking at building typology, separating projects into apartment block and low-rise high-density types. The apartment block typology consists of three case studies, Dixon Street Flats, Gordon Wilson Flats and Arlington George Porter Tower, all located in Wellington (NZ). The common features within the apartment block typology include 6+ storeys, common horizontal accessways, vertical stair cores and dual aspect units. The low-rise high-density case studies consist of Star Flats, Arlington Flats and Housing Corporation Flats, located in Wellington (NZ). The common features within the low-rise high-density developments include 1-3 storeys, individual entrances, and dual and triple aspect units. Each case study is analysed in a comparative matrix demonstrating existing design features and issues.

515
Framework for the refurbishment of modernist social housing
4.2. Results/ findings
Floor Plans. The floor plans demonstrate the areas of focus that relate to social space and thermal comfort. They are then analysed based on where the areas of focus overlap. These areas of focus indicate where social spaces and thermal comfort can be combined and mutually enhanced. For instance, in these case studies, common areas of focus include entrances, circulation zones, stairways, balconies and community rooms. These areas of focus are spaces where social space and thermal comfort (building envelope) can work in conjunction with each other (Figure 1).
Figure 1: Comparative matrix – case study floor plans
Volumetric arrangements. The diagrams display the differences between the apartment block and low- rise high-density typologies. For example, the apartment blocks have large, shared entrances, circulation zones and stairways. Therefore, apartment blocks have a greater opportunity for social interactions to occur. In contrast, the low-rise high-density developments have smaller shared entrances, circulation zones and stairways and less people in these areas, (Figure 3). This means social interactions will occur less frequently and easily. The low-rise high-density typology has greater opportunity for winter balconies to have a strong relationship with communal outdoor spaces, where social interactions occur.
Figure 2: Comparative matrix – volumetric arrangements
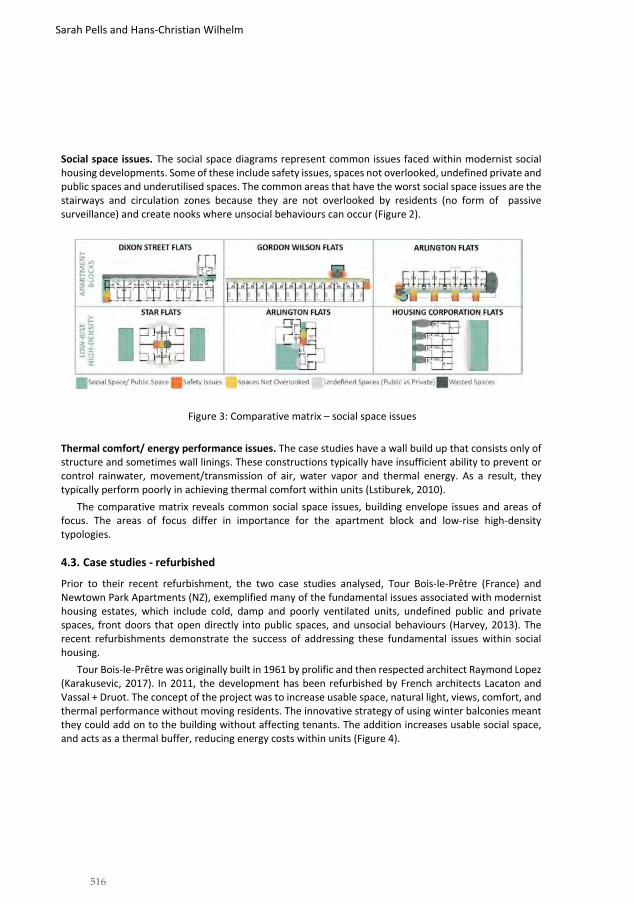
516
Sarah Pells and Hans-Christian Wilhelm
Social space issues. The social space diagrams represent common issues faced within modernist social housing developments. Some of these include safety issues, spaces not overlooked, undefined private and public spaces and underutilised spaces. The common areas that have the worst social space issues are the stairways and circulation zones because they are not overlooked by residents (no form of passive surveillance) and create nooks where unsocial behaviours can occur (Figure 2).
Figure 3: Comparative matrix – social space issues
Thermal comfort/ energy performance issues. The case studies have a wall build up that consists only of structure and sometimes wall linings. These constructions typically have insufficient ability to prevent or control rainwater, movement/transmission of air, water vapor and thermal energy. As a result, they typically perform poorly in achieving thermal comfort within units (Lstiburek, 2010).
The comparative matrix reveals common social space issues, building envelope issues and areas of focus. The areas of focus differ in importance for the apartment block and low-rise high-density typologies.
4.3. Case studies - refurbished
Prior to their recent refurbishment, the two case studies analysed, Tour Bois-le-Prêtre (France) and Newtown Park Apartments (NZ), exemplified many of the fundamental issues associated with modernist housing estates, which include cold, damp and poorly ventilated units, undefined public and private spaces, front doors that open directly into public spaces, and unsocial behaviours (Harvey, 2013). The recent refurbishments demonstrate the success of addressing these fundamental issues within social housing.
Tour Bois-le-Prêtre was originally built in 1961 by prolific and then respected architect Raymond Lopez (Karakusevic, 2017). In 2011, the development has been refurbished by French architects Lacaton and Vassal + Druot. The concept of the project was to increase usable space, natural light, views, comfort, and thermal performance without moving residents. The innovative strategy of using winter balconies meant they could add on to the building without affecting tenants. The addition increases usable social space, and acts as a thermal buffer, reducing energy costs within units (Figure 4).

517
Framework for the refurbishment of modernist social housing
Figure 4: Tour Bois-le-Prêtre – diagrams based on Lacaton and Vassal’s plans (Karakusevic, 2017).
Newtown Park Apartments was originally built in 1967 by D E Barry-Martin & Blake Architects (Harvey, 2014). In 2013, the development was refurbished by architects Studio Pacific. The concept of the project was to increase safety, identity, improve facilities for the residents, including playgrounds, allotment gardens, drying facilities, seating, and green space. The project’s defining features include the successful open corridors on each floor that facilitate spaces of social interaction (Figure 5). In addition, each unit was upgraded with double glazing, insulation, and better ventilation.
Figure 5: Newtown Park Apartments – diagrams based on Studio Pacific’s plans (Harvey, 2014).
In conclusion, the case studies demonstrate a focus on designing spaces with multiple purposes. For example, in the Tour Bois-le-Prêtre the winter balcony acts as private and social space as well as a thermal buffer. In Newtown Park Apartments the corridor also acts as communal space. This concept of designing spaces with multiple purposes significantly contributes to the concept behind the design tool.
5. Design toolThe design tool consists of a table that is broken into the areas of focus where social spaces and thermal comfort can work together and amplify each other. These areas include entrances, circulation zones, stairways, communal spaces, and winter balconies. These areas act as thermal buffer zones to the units. The units need to achieve the minimum 18°C objective. The tool consists of design strategies derived from the analysed literature and case studies. The strategies are categorized in terms of importance. For

518
Sarah Pells and Hans-Christian Wilhelm
instance, the most valuable strategies are listed first. The initial strategies can create fair outcomes within each area of focus. If all strategies are utilised, ideal outcomes are achieved (Table 1).
Table 1: Social space and thermal comfort design tool ENTRANCES Fair Good Ideal SOCIAL SPACE Safety & accessibility: A: disabled accessible, B: visible, C: well lit, D: overlooked, E:
limited entry access, F: privacy for nearby units. A&B AB
C&D ABC DE&F
Size & scale: A: proportional to façade and streetscape, B: minimum width of 3m, C: double height space.
A A&B AB &C
Social & aesthetics: A: visible, B: defined public & private entrances, C: interactive space (seating, letter boxes etc.), D: individuality, E: contributes to building façade and streetscape F: natural materials, G: planting.
AB &C
ABC D&E
ABC DEF &G
THERMAL COMFORT Temperature: A: 22°C +/- 4°C, B: 22°C +/- 3°C, C: 22°C +/- 2°C. A B C Passive strategies: A: natural light, B: natural ventilation, C: sheltered from
weather, D: cross ventilation, E: double skin entry. A&B AB
C&D ABC D&E
CIRCULATION ZONES Fair Good Ideal SOCIAL SPACE Safety & accessibility: A: disabled accessible, B: overlooked, C: public & private
separate, D: privacy for units, E: limited entry access. A&B ABC
&D ABC D&E
Size & scale: A: minimum width of 3m (if applicable), B: appropriate size and scale to building façade, C: double height space.
A A&B AB &C
Social & aesthetics: A: usable social space/ spaces of interaction (seating, planting), B: visually interesting, C: respectful to existing building, D: contributes to streetscape & building façade.
A&B AB &C
ABC &D
THERMAL COMFORT Temperature: A: 22°C +/- 4°C, B: 22°C +/- 3°C, C: 22°C +/- 2°C. A B C Passive strategies: A: natural light, natural ventilation, B: flexibility between
open and sheltered, C: passive cooling. A A&B AB
&C STAIRWAYS Fair Good Ideal SOCIAL SPACE Safety & accessibility: A: overlooked, B: well lit (natural light), C: visible. A A&B AB&C Size & scale: A: size related to number of residents, B: appropriate size &
scale for a stairway, C: visually clear that it is a stairway. A A&B AB
&C Social & aesthetics: A: respectful to existing building, B: contributes to
streetscape & building façade, C: seats & planting. A A&B AB
&C THERMAL COMFORT Temperature: A: 20°C +/- 4°C, B: 20°C +/- 3°C, C: 20°C +/- 2°C. A B C Passive strategies: A: natural light & ventilation, B: sheltered, C: passive cooling. A A&B AB&C COMMUNAL SPACES Fair Good Ideal SOCIAL SPACE Safety & accessibility: A: disabled accessible, B: visible, C: functional & safe
common areas, D: overlooked/ open (safe), E: well lit. A&B ABC
&D ABC D&E
Size & scale: A: appropriate size & scale (relative to development), B: visually clear it is communal space, C: double height space.
A A&B AB &C
Social & aesthetics: A: social space (seating, gardens, games, kitchen, bathroom), B: visually interesting, C: respectful to existing building.
A A&B AB &C

519
Framework for the refurbishment of modernist social housing
THERMAL COMFORT Temperature: A: 22°C +/- 2°C, B: 22 +/- 1°C, C: 22°C +/- 0.5°C. A B C Passive strategies: A: natural light, B: cross ventilation, C: passive cooling. A A&B AB&C WINTER BALCONIES Fair Good Ideal SOCIAL SPACE Safety & accessibility: A: disabled accessible, B: form of passive surveillance, C:
privacy for units, D: avoid climbing aids (safety) A&B AB
&C ABC &D
Size & scale: A: minimum area 6m2, B: space for clothesline, C: correct size and scale relative to apartment, D: double height space.
A&B AB &C
ABC &D
Social & aesthetics: A: respectful to existing building, B: contributes to building façade & streetscape, C: individuality, D: visually interesting, E: planting, F: utilisation of views.
A&B ABC &D
ABC DE&F
THERMAL COMFORT Temperature: A: 22°C +/- 4°C, B: 22°C +/- 3°C, C: 22°C +/- 2°C. A B C Passive strategies: A: natural light & ventilation, B: flexibility between open and
sheltered, C: passive heating & cooling strategies. A A&B AB
&C In Addition, UNITS Fair Good Ideal SOCIAL SPACE Floor plan: A: open plan living, B: balcony, C: double height space. A AB AB&C THERMAL COMFORT Temperature: A: 22°C +/- 2°C, B: 22 +/- 1°C, C: 22°C +/- 0.5°C. A B C Passive strategies: A: large windows facing north (sun), B: openable windows, C:
thermal mass flooring, D: minimise unwanted solar gain, E: cross ventilation, F: insulating glass.
A&B ABC &D
ABC DE&F
BUILDING ENVELOPE Detailing: A: rainwater control layer, B: air control layer, C: vapour
control layer, D: thermal control layer, E: exterior envelope - - ABC
D&ER values: A: roof: R 3.3, walls: R 2.0, floor: R 1.3, glazing R 0.4, B: roof:
R 5.5, walls: R 3.7, floor: R 2.7, glazing R 0.53, C: roof: R 8.3, walls: R 5.5, floor: R 3.7, glazing R 0.6. (MBIE, 2020)
A B C
6. ImplicationsThis paper set out to establish a design tool to efficiently refurbish NZ’s modernist social housing. The design tool aims to be simple and effective by narrowing all the information gathered into a manageable checklist. There are noticeable limitations. For instance, not all strategies will be able to be implemented into every site. Attaining maximum social spaces can compromise thermal comfort and vice versa. The tool is an addition to any structural upgrades needed.
Overall, through the analysis of literature, the research demonstrates that social interactions and thermal comfort play a significant role in establishing functional communities and positive health outcomes for social housing tenants. Literature also has revealed design strategies to achieve optimal social spaces and thermal comfort. The comparative matrix analysis determines problems, where social and thermal aspects overlap within existing modernist social housing. In addition, areas of focus have been established. The refurbished case studies demonstrate effective design strategies and the success of spaces having multiple purposes. The results can inform decisions around refurbishing or demolishing existing social housing, in order to increase the uptake and quality of refurbishments, to preserve built heritage, and to reduce resource and energy footprints of housing in NZ.

520
Sarah Pells and Hans-Christian Wilhelm
References Bramley, G., & Power, S. (2009). Urban Form and Social Sustainability: The Role of Density and Housing Type:
Environment and Planning B: Planning and Design. https://doi.org/10.1068/b33129 Callies, D. L., Franzese, P. A., & Guth, H. K. (2003). Ramapo Looking Forward: Gated Communities, Covenants, and
Concerns. The Urban Lawyer, 35(1), 177–202. JSTOR. Diaz Lozano Patino, E., & Siegel, J. A. (2018). Indoor environmental quality in social housing: A literature review.
Building and Environment, 131, 231–241. https://doi.org/10.1016/j.buildenv.2018.01.013 Diaz Lozano Patino, E., Vakalis, D., Touchie, M., Tzekova, E., & Siegel, J. A. (2018). Thermal comfort in multi-unit
social housing buildings. Building and Environment, 144, 230–237. https://doi.org/10.1016/j.buildenv.2018.08.024
Földváry, V., Bekö, G., Langer, S., Arrhenius, K., & Petráš, D. (2017). Effect of energy renovation on indoor air quality in multifamily residential buildings in Slovakia. Building and Environment, 122, 363–372. https://doi.org/10.1016/j.buildenv.2017.06.009
Forster, P. (2010). An introduction to environmental psychology. 22(01), 1–6. Habitat for Humanity New Zealand. (2019). The Need in New Zealand—Housing issues in New Zealand affect New
Zealand’s wealth, health and quality of life. Habitat for Humanity New Zealand. https://habitat.org.nz/who-we- are/the-need-in-new-zealand/
Haddad, S., Pignatta, G., Paolini, R., Synnefa, A., & Santamouris, M. (2019). An extensive study on the relationship between energy use, indoor thermal comfort, and health in social housing: The case of the New South Wales, Australia. IOP Conference Series: Materials Science and Engineering, 609(4), 042067. https://doi.org/10.1088/1757-899X/609/4/042067
Harvey, J. (2013). Central Park Apartments and Te Ara Hou Apartments. Architecture New Zealand, 4, 44–55. Harvey, J. (2014, July 15). Newtown Park Apartments. Architecture Now. /articles/newtown-park-apartments-1/ Karakusevic, P. (2017). Social housing: Definitions & design exemplars. Riba Publishing. Karuppannan, S., & Sivam, A. (2011). Social sustainability and neighbourhood design: An investigation of residents’
satisfaction in Delhi. Local Environment, 16(9), 849–870. https://doi.org/10.1080/13549839.2011.607159 Lstiburek, J. (2010, July 15). BSI-001: The Perfect Wall. Building Science Corporation.
https://www.buildingscience.com/documents/insights/bsi-001-the-perfect-wall Mahdavinejad, M., Mashayekhi, M., & Ghaedi, A. (2012). Designing Communal Spaces in Residential Complexes.
Procedia - Social and Behavioral Sciences, 51, 333–339. https://doi.org/10.1016/j.sbspro.2012.08.169 MBIE, M. of B., Innovation and Employment. (2020). House insulation requirements. Building Performance.
https://www.building.govt.nz/building-code-compliance/h-energy-efficiency/h1-energy-efficiency/building- code-requirements-for-house-insulation/house-insulation-requirements/
Mitchell, R., & Popham, F. (2008). Effect of exposure to natural environment on health inequalities: An observational population study. The Lancet, 372(9650), 1655–1660. https://doi.org/10.1016/S0140- 6736(08)61689-X
Talen, E., & Ellis, C. (2002). Beyond Relativism: Reclaiming the Search for Good City Form. Journal of Planning Education and Research, 22(1), 36–49. https://doi.org/10.1177/0739456X0202200104
Tiberiu, C., Daniel, B., Andreea, V., & Cătălin, L. (2019). Glazed balconies impact on energy consumption of multi- story buildings. E3S Web of Conferences, 111, 06079. https://doi.org/10.1051/e3sconf/201911106079
Umberson, D., & Montez, J. K. (2010). Social Relationships and Health: A Flashpoint for Health Policy. Journal of Health and Social Behavior, 51(Suppl), S54–S66. https://doi.org/10.1177/0022146510383501
WHO Europe. (2007). Housing, energy and thermal comfort: A review of 10 countries within the WHO European Region. https://apps.who.int/iris/handle/10665/107815

521
The 54th International Conference of the Architectural Science Association (ANZAScA) 2020
Green infrastructure design and performance evaluation: A practice-based interdisciplinary design and research
David Dziubanski1, Bo Yang2, Thomas Meixner3 1,2,3The University of Arizona, Tucson, Arizona, USA
[email protected] ; [email protected] ; [email protected]
Abstract: We report a practice-based interdisciplinary design and research project on Green Infrastructure (GI). GI strategies have been widely used in the urban environment to mitigate floods, with various modeling tools employed to forecast design performance. However, current knowledge is based primarily on modeling hypothetical scenarios, with relatively few empirical studies using technical design drawings as the input data for modeling. To address this gap, an interdisciplinary team consisting of experts from landscape architecture and hydrology integrated site design with modeling analysis. The project is focused on the Auto Mall area (28.9 ha) in Tucson, Arizona (USA). The area has the highest impervious cover percentage (86.5%) in the city, making it vulnerable to flash floods during Arizona’s monsoon season. Various GI retrofit designs are proposed, including increasing rainwater harvesting volumes (curb cut, bioswale, cistern), and reducing impervious cover areas (porous pavement, daylighting arroyo). The team completed three different designs and associated technical drawings. Preliminary modeling results show that the designs would provide around 3610 m3 runoff storage volume and reduce the discharge volume by 75% (1-yr 1-hr storms). Detailed analysis is being performed using the KINEROS hydrologic model to further compare the performance of design scenarios and their climate resilience.
Keywords: KINEROS, ecosystem services, urban design, hydrologic modelling
1. IntroductionIncreasing urbanization is converting previously natural landscapes into impervious surfaces, which is altering the natural hydrologic functions of that landscape (Shuster et al., 2005). Impervious surfaces in urban areas reduce infiltration, while engineered streets and drainage ways increase the velocity and connectivity of flows within and to the edge of the urban area. Consequently, these changes lead to increases in runoff volumes, larger peak flows, and flashy hydrographs (Sathish Kumar et al., 2013; Miller et al., 2014; McGrane 2016; Walsh et al., 2005; Liu and Li 2017).
Green infrastructure (GI) design has been advocated by the U.S. Environmental Protection Agency (USEPA) as an ecological way to better manage stormwater for better water quantity and quality. This new drainage design paradigm focuses on maintaining the natural hydrologic cycle in urban areas and advocates treating runoff on-site instead of the old paradigm that manages and treats stormwater off-
Imaginable Futures: Design Thinking, and the Scientific Method. 54th International Conference of the Architectural Science Association 2020, Ali Ghaffarianhoseini, et al (eds), pp. 521–530. © 2020 and published by the Architectural Science Association (ANZAScA).

522
David Dziubanski, Bo Yang, Thomas Meixner
site (Dietz, 2007; Jarden et al., 2016). In stormwater management, typical GI design encompasses open space, parks, green roofs, stormwater systems that include bioretention and constructed wetlands, and decentralized water management such as rainwater harvesting and protection facilities of riparian areas (US Environmental Protection Agency, 2009). Many cities have successfully implemented flood control designs according to their individual municipal requirements (US Environmental Protection Agency, 2010). These strategies combine a number of techniques, including storing, infiltrating, evaporating, and releasing runoff slowly, at a rate not exceeding that of the condition before development.
However, current knowledge of GI design is mostly based on isolated design strategies employed at small-scale sites (Avellaneda et al., 2017; Lewellyn et al., 2016; Liu et al., 2014b). Numerous studies have focused on GI effects at small parcels to neighborhood scales in residential areas (<0.1 km2). There is a need to identify GI effects beyond this scale in highly engineered watersheds (Golden and Hoghooghi, 2018). Few studies adequately measure the effectiveness of GI, and few of them are conducted in semiarid climates, such as in the semiarid western states of the United States.
This study tackles the question: what is the effect of GI on hydrologic responses at a larger scale (0.28 km2), highly engineered, commercial land use watershed located in Tucson, Arizona? An expected contribution of this project is linking the model to actual designs that could be implemented in the real world.
2. Materials and Methods
2.1. Site context and design problems
The design and research team was tasked to provide a master plan and retrofit designs of specific areas of the Tucson Automall area using GI strategies. The project site area is 71.4 acres (28.9 hectares), dominated by commercial stores with large parking lots. Site impervious cover is approximately 86.5%, which causes stormwater runoff quantity (e.g., flash flood) and water quality concerns (e.g. to adjacent Rillito River). There are 40 large commercial buildings onsite, with a total area of 1496.5 m2. The bimodal precipitation pattern (summer and winter monsoons) makes it challenging to designate large scale detention basins to manage stormwater runoff in this area-constrained commercial site (Dziubanski et al. 2020).
2.2. Interdisciplinary collaboration
Students and faculty in the School of Landscape Architecture and Planning collaborated with researchers in the Department of Hydrology and Atmospheric Sciences at the University of Arizona (Tucson, USA). Graduate students produced green infrastructure masterplans and designs for specific zones and focus areas. These design products in the format of AutoCAD technical drawings were incorporated into the Kinematic Runoff and Erosion Model (KINEROS) hydrologic model to exam the hydrological performance and climate resilience of different design scenarios. The design teams produced three distinctive design packets; one of them was chosen and refined for the modeling exercise.
2.3. Model description
The Automated Watershed Assessment (AGWA) urban tool has a GIS interface for creating inputs into the KINEROS2 model. KINEROS2 is an event-oriented, spatially-distributed, physically-based hydrologic model that represents the flow in a watershed through a series of cascading planes and channels (Goodrich et al., 2012). Each plane represents an urban parcel (i.e., home lot or a commercial lot) (Korgaonkar et al.,

523
Green infrastructure design and performance evaluation: A practice-based interdisciplinary design and research
2018). There are 13 potential overland flow areas to describe flow across an urban parcel. This study focused on indirectly connected pervious (ICP), connecting impervious (CI), and directly connected impervious (DCI) components (Figure 1). These components allow a representation of different parking lot configurations. Parking lots can be represented by completely impervious areas (DCI), or pervious islands (ICP) surround by impervious parking (CI), as well as other land-use configurations.
Figure 1: Various land use types and configurations possible in the AGWA urban tool (figure by authors, used with permission).
2.5. Design proposals as model input data
Figure 2 shows the boundaries of sub-watersheds and drainage features implemented for the study site. Figures 3 through 5 show a series of GI design illustrations and technical drawings that were used as the input data for the KINEROS model. For students in the design class, the project requirements include (1) using GI strategies for stormwater runoff management and use passive rainwater harvesting strategies when applicable, (2) maintaining building footprints and major vehicle circulations, (3) provide basins and curb cuts, when appropriate, for rainwater harvesting, (4) retain the current numbers of parking stall for the project site as a whole as well as that foreach building, and (5) reduce the amount of impervious cover area, and maintain/enhancecirculation functions. The design teams conducted a comprehensive site inventory and divided the site into five zones with various proposed GI strategies to be implemented in phases. In additionto stormwater management, the schematic design also considered other GI benefits such as urban heat island mitigation and energy saving.

524
David Dziubanski, Bo Yang, Thomas Meixner
Figure 2: Location of lot drains (green), storm drains (magenta), and walls (red) in the Tucson Automall area, Tucson, Arizona, USA. Urban parcels implemented in the KINEROS model are represented by
yellow boundaries (Dziubanski et al., 2020, used with permission).

525
Green infrastructure design and performance evaluation: A practice-based interdisciplinary design and research
Figure 3: Site inventory and analysis, and phasing strategies for the masterplan (image courtesy: LAR 511 students ).
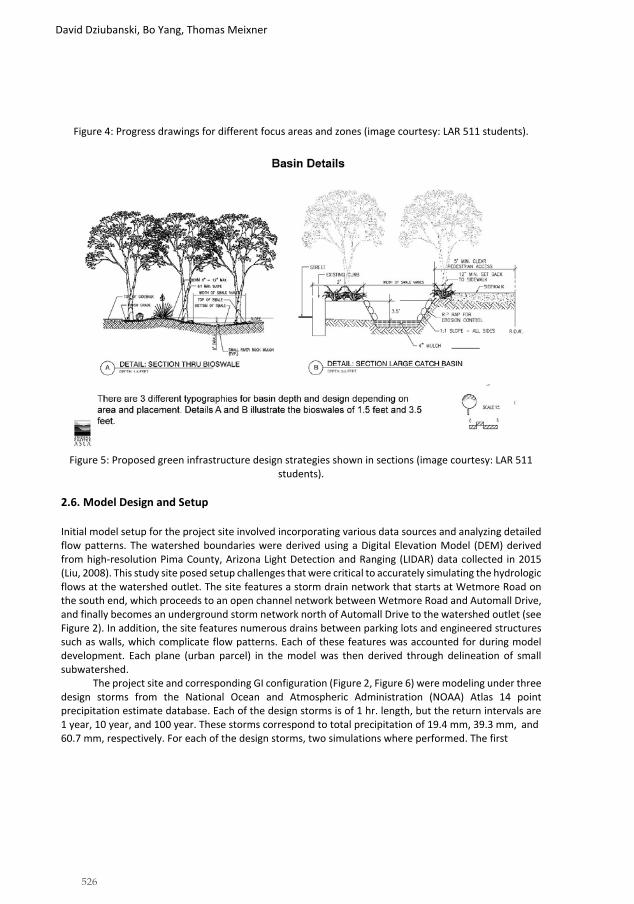
526
David Dziubanski, Bo Yang, Thomas Meixner
Figure 4: Progress drawings for different focus areas and zones (image courtesy: LAR 511 students).
Figure 5: Proposed green infrastructure design strategies shown in sections (image courtesy: LAR 511 students).
2.6. Model Design and Setup
Initial model setup for the project site involved incorporating various data sources and analyzing detailed flow patterns. The watershed boundaries were derived using a Digital Elevation Model (DEM) derived from high-resolution Pima County, Arizona Light Detection and Ranging (LIDAR) data collected in 2015 (Liu, 2008). This study site posed setup challenges that were critical to accurately simulating the hydrologic flows at the watershed outlet. The site features a storm drain network that starts at Wetmore Road on the south end, which proceeds to an open channel network between Wetmore Road and Automall Drive, and finally becomes an underground storm network north of Automall Drive to the watershed outlet (see Figure 2). In addition, the site features numerous drains between parking lots and engineered structures such as walls, which complicate flow patterns. Each of these features was accounted for during model development. Each plane (urban parcel) in the model was then derived through delineation of small subwatershed.
The project site and corresponding GI configuration (Figure 2, Figure 6) were modeling under three design storms from the National Ocean and Atmospheric Administration (NOAA) Atlas 14 point precipitation estimate database. Each of the design storms is of 1 hr. length, but the return intervals are 1 year, 10 year, and 100 year. These storms correspond to total precipitation of 19.4 mm, 39.3 mm, and 60.7 mm, respectively. For each of the design storms, two simulations where performed. The first

527
Green infrastructure design and performance evaluation: A practice-based interdisciplinary design and research
simulation is a control run without any GI implemented, which allows analysis for the entire watershed under the current conditions. The second simulation contains all GI features implemented. In total, 122 GI features were implemented in this simulation, with each feature having a depth of 0.4 m. Runoff volumes and peak flows are compared between both scenarios.
Figure 6: GI design implemented in the KINEROS model. Red zones indicate the GI basins.
3. ResultsOverall model results indicate that implementing GI in the project site can potentially mitigate flooding significantly. Under all design storms, reductions in discharge volumes are generally higher than 40% (Figure 7, dashed). Peak flows are reduced by approximately 50% or more. One feature that is evident is that reductions do decrease as storm size increases. For a 1 yr 1 hr storm, the GI features capture almost

528
David Dziubanski, Bo Yang, Thomas Meixner
all runoff generated from the impervious surfaces. Under this storm, peak flow is approximately 1.5 m3/s with GI in comparison to the 5 m3/s without GI, leading to a reduction of 70% in the peak flow. Runoff volumes are reduced by 75% under this scenario. Under the 10 yr 1 hr storm, reductions in peak flow become smaller. Peak flow is reduced by 55% from 11.5 m3/s to 5 m3/s, and volumes are also reduced by 55%. For the 100 yr 1 hr storm, the GI has the least benefit. Peak flow is reduced by 8.5 m3/s, corresponding to a 45% reduction, and volume is reduced by 110 m3, corresponding to a reduction of 42%. Thus, these results show that GI is most effective for small events, and as event size increases, the GI system becomes filled closer to capacity.
Figure 7: Model simulation results for the GI scenario under three design storms. Blue lines indicate the hydrologic flows under no GI; orange lines indicate hydrologic flows under the GI scenario.
4. Discussion and SummaryPrevious studies have shown a similar range of decreases in runoff volumes and have shown GI to be most effective for small storms (Liu et al., 2014a,b; Zellner et al., 2016; Liu et al., 2017; Xie et al., 2017; Woznicki et al., 2018). A review of 14 studies on bioretention cell performance conducted by (Liu et al., 2014a) for small drainages of < 1 ha found runoff volume reductions of 0-100%, with many studies

529
Green infrastructure design and performance evaluation: A practice-based interdisciplinary design and research
showing reductions of approximately 60-90%. These reductions align with results in this current study, showing a 42-75% decrease in volumes, dependent on storm magnitude. However, further studies of GI effectiveness need to be conducted at larger watershed scales > 0.1 km2 to more definitively understand how the effects of small features scale up (Golden and Hoghooghi, 2018). The effect of GI on runoff reduction for large monsoonal events with > 2.5 cm of rain that are common in the Tucson region is an additional uncertainty as these practices are typically designed for storms of lower magnitude (Eckart et al., 2017; NRC, 2009). A study by Zellner et al. (2016) indicated that GI needs to increase from 5-15% coverage at 5 year storms to 15-30% coverage at 100 year storms to have similar effects on runoff reduction. A study by Liu et al. (2017) using GIS modeling techniques also concluded that GI is most effective for smaller, more common storms. Nonetheless, the results for the project site, along with a study by Lewellyn et al. (2016), do indicate that GI can have some impact on reducing volumes during large storms, particularly with more comprehensive GI coverage. Finally, this study demonstrates the process of practice-based interdisciplinary design and research collaboration and highlights the benefits of green infrastructure for stormwater management in semiarid climates.
Acknowledgements Design drawings were produced by students in LAR 511 Design Studio II class in the Master of Landscape Architecture Program at the University of Arizona. Funding for this work was provided by the National Science Foundation Coupled Human-Natural Systems (CNH) Grant #1518376. We would also like to thank Yoga Korgaonkar, Neha Gupta, and Phil Guertin.
References Avellaneda, P. M., A. J. Jefferson, J. M. Grieser, and S. A. Bush, 2017: Simulation of the cumulative hydrological
response to green infrastructure. Water Resouces Res., 53, 3087–3101, https://doi.org/doi:10.1002/ 2016WR019836.
Dietz, M. E., 2007: Low Impact Development Practices:A Review of Current Research and Rcommendations for Future Directions. Water Air Soil Pollut., 186, 351–363, https://doi.org/10.1007/s11270-007-9484-z.
Eckart, K., Z. McPhee, and T. Bolisetti, 2017: Performance and implementation of low impact development – A review. Sci. Total Environ., 607–608, 413–432, https://doi.org/10.1016/j.scitotenv.2017.06.254.
Golden, H. E., and N. Hoghooghi, 2018: Green infrastructure and its catchment-scale effects: an emerging science. Wiley Interdiscip. Rev. Water, 5, https://doi.org/10.1002/wat2.1254.
Goodrich, D. C., and Coauthors, 2012: KINEROS2/AGWA: Model use, calibration, and validation. Trans. ASABE, 55, 1561–1574, https://doi.org/10.13031/2013.42264.
Jarden, K. M., A. J. Jefferson, and J. M. Grieser, 2016: Assessing the effects of catchment-scale urban green infrastructure retrofits on hydrograph characteristics. Hydrol. Process., 30, 1536–1550, https://doi.org/10.1002/hyp.10736.
Korgaonkar, Y., D. P. Guertin, D. C. Goodrich, C. Unkrich, W. G. Kepner, and I. S. Burns, 2018: Modeling urban hydrology and green infrastructure using the AGWA urban tool and the KINEROS2 model. Front. Built Environ., 4, https://doi.org/10.3389/fbuil.2018.00058.
Lewellyn, C., C. E. Lyons, R. G. Traver, and B. M. Wadzuk, 2016: Evaluation of seasonal and large storm runoffvolume capture of an infiltration green infrastructure system. J. Hydrol. Eng., 21, 1–8, https://doi.org/10.1061/(ASCE)HE.1943-5584.0001257.
Liu, C., and Y. Li, 2017: GIS-based dynamic modelling and analysis of flash floods considering land-use planning. Int. J. Geogr. Inf. Sci., 31, 481–498, https://doi.org/10.1080/13658816.2016.1207774.
——, ——, and J. Li, 2017: Geographic information system-based assessment of mitigating flash-flood disaster from

520
David Dziubanski, Bo Yang, Thomas Meixner
green roof systems. Comput. Environ. Urban Syst., 64, 321–331, https://doi.org/10.1016/j.compenvurbsys.2017.04.008.
Liu, J., D. J. Sample, C. Bell, and Y. Guan, 2014a: Review and research needs of bioretention used for the treatment of urban stormwater. Water (Switzerland), 6, 1069–1099, https://doi.org/10.3390/w6041069.
Liu, W., W. Chen, and C. Peng, 2014b: Assessing the effectiveness of green infrastructures on urban flooding reduction: A community scale study. Ecol. Modell., 291, 6–14, https://doi.org/10.1016/j.ecolmodel.2014.07.012.
Liu, X., 2008: Airborne LiDAR for DEM generation: Some critical issues. Prog. Phys. Geogr., 32, 31–49, https://doi.org/10.1177/0309133308089496.
McGrane, S. J., 2016: Impacts of urbanisation on hydrological and water quality dynamics, and urban water management: a review. Hydrol. Sci. J., 61, 2295–2311, https://doi.org/10.1080/02626667.2015.1128084.
Miller, J. D., H. Kim, T. R. Kjeldsen, J. Packman, S. Grebby, and R. Dearden, 2014: Assessing the impact of urbanization on storm runoff in a peri-urban catchment using historical change in impervious cover. J. Hydrol., 515, 59–70, https://doi.org/10.1016/j.jhydrol.2014.04.011.
NRC (National Research Council), 2009: Urban Stormwater Management of the United States. National Academies Press,.
Sathish Kumar, D., D. S. Arya, and Z. Vojinovic, 2013: Modeling of urban growth dynamics and its impact on surface runoff characteristics. Comput. Environ. Urban Syst., 41, 124–135, https://doi.org/10.1016/j.compenvurbsys.2013.05.004.
Shuster, W. D., J. Bonta, H. Thurston, E. Warnemuende, and D. R. Smith, 2005: Impacts of impervious surface on watershed hydrology: A review. Urban Water J., 2, 263–275, https://doi.org/10.1080/15730620500386529.
US Environmental Protection Agency, 2009: Green Infrastructure in Arid and Semi-Arid Climates - Adapting innovative stormwater management techniques to the water-limited West. 1–8 pp.
——, 2010: Green Infrastructure Case Studies: Municipal Policies for Managing Stormwater with Green Infrastructure. 1–14 pp.
Walsh, C. J., A. H. Roy, J. W. Feminella, P. D. Cottingham, P. M. Groffman, and R. P. Morgan, 2005: The urban stream syndrome: current knowledge and the search for a cure. J. North Am. Benthol. Soc., 24, 706–723, https://doi.org/10.1899/04-028.1.
Woznicki, S. A., K. L. Hondula, and S. T. Jarnagin, 2018: Effectiveness of landscape-based green infrastructure for stormwater management in suburban catchments. Hydrol. Process., 32, 2346–2361, https://doi.org/10.1002/hyp.13144.
Xie, J., H. Chen, Z. Liao, X. Gu, D. Zhu, and J. Zhang, 2017: An integrated assessment of urban flooding mitigation strategies for robust decision making. Environ. Model. Softw., 95, 143–155, https://doi.org/10.1016/j.envsoft.2017.06.027.
Zellner, M., D. Massey, E. Minor, and M. Gonzalez-Meler, 2016: Exploring the effects of green infrastructure placement on neighborhood-level flooding via spatially explicit simulations. Comput. Environ. Urban Syst., 59, 116–128, https://doi.org/10.1016/j.compenvurbsys.2016.04.008.
531
The 54th International Conference of the Architectural Science Association (ANZAScA) 2020
Greenhouse gas emissions performance of cross laminated timber construction using hybrid life cycle assessment
Xavier Cadorel1, and Robert H. Crawford2
1, 2 The University of Melbourne, Melbourne, Australia {xavier.cadorel1, rhcr2}@unimelb.edu.au
Abstract: Numerous studies have investigated the environmental benefits of cross laminated timber (CLT) construction in comparison to conventional construction, typically using a life cycle assessment (LCA). Yet, there is a need for further in-depth analysis of the environmental performance of CLT construction using a more comprehensive approach, in order to provide a more realistic estimation of the potential for CLT construction to reduce greenhouse gas (GHG) emissions associated with buildings. This research aims to fill this knowledge gap by conducting a streamlined life cycle assessment to quantify embodied GHG emissions, using hybrid coefficients from the EPiC Database, for a real case study; a five storey multi- residential CLT building about to be constructed in Melbourne, Australia. The new knowledge will provide some of the critical knowledge that is currently lacking in relation to the life cycle GHG emissions performance of CLT construction and the potential for this form of construction to reduce GHG emissions associated with the construction industry.
Keywords: CLT; lifecycle; assessment; hybrid.
1. IntroductionAustralia has committed to a target of reducing GHG emissions to 5 per cent below 2000 levels by 2020 and is expected to overachieve this target by 264 MtCO2-e (Department of the Environment and Energy, 2019). This achievement is driven by two main factors, first the reduction of emissions by the electricity sector led by a high uptake of renewable energy and the decommission of old emission intensive coal fired power plants. Second, the Land Use, the Land Use Change and Forestry (LULUCF) sector has become a net sink sector with GHG emissions projected to reach -16 Mt in 2020 and is driven mostly by the decline in the rate of native forest harvesting.
While this achievement is a positive changed, one can observe that the GHG emissions associated with the construction sector, together with services and transport, remains high with 71 MtCO2-e in 2020 (Department of the Environment and Energy, 2019), and the projection for this sector for the next ten
Imaginable Futures: Design Thinking, and the Scientific Method. 54th International Conference of the Architectural Science Association 2O220, Ali Ghaffarianhoseini, et al (eds), pp. 531–540. © 2020 and published by the Architectural Science Association (ANZAScA).
532
Xavier Cadorel, and Robert H. Crawford
years shows a steady increase reaching 75 MtCO2-e in 2030. However, as a partial result of increased energy efficiency stringency in the Australian National Construction Codes, direct combustion emissions from buildings is projected to decrease by 4% within the next 10 years to reach 18 MtCO2-e in 2030. Both trends demonstrate that buildings in Australia are being more energy efficient, but their construction is still GHG emissions intensive.
To better understand and to potentially achieve greater GHG emissions reduction associated with buildings, there is a need to go beyond energy efficiency, and to adopt a more holistic approach that considers GHG emissions reductions across all life cycle stages of a building, as highlighted by (Hafner & Rueter, 2018; Takano et al., 2014; Crawford et al., 2016).
In the last decade, the use of an innovative product named Cross Laminated Timber (CLT) has increased internationally. CLT is composed of layers of solid timber glued together, with each layer oriented at 90 degrees to adjacent layers. CLT, as a structural solution, is commonly used for load bearing walls, floors, stairways, lift shafts and roofs, in projects that range from large residential to medium density multi-residential buildings. CLT is bio-sourced and thus made of renewable materials that could play a role in avoiding potential risk of depleting the resources used in conventional steel and concrete building structures.
Numerous studies have investigated the environmental benefits of CLT construction in comparison to conventional construction, typically using a life cycle assessment (LCA). Yet, Cadorel and Crawford (2018) have highlighted the need for further in-depth analysis of the environmental performance of CLT construction using a more comprehensive approach for quantifying the production-related (or embodied) loadings of CLT, namely the Path Exchange (PXC) hybrid approach. The PXC approach is a hybrid approach for quantifying embodied loadings that integrates the precision of a process analysis and the comprehensiveness of environmentally-extended input-output (EEIO) analysis (Crawford et al., 2017). The PXC approach has been used to develop a list of embodied energy, water and GHG emissions coefficients for a range of construction materials, including CLT (R. Crawford et al., 2019). The use of these coefficients provides a more comprehensive estimation of the embodied loadings associated with construction materials.
1.1 Aim
This study aims to assess and to compare the embodied GHG emissions of a multi-residential building constructed of both CLT and conventional materials.
2. MethodsThis section includes the selection and description of the case study, the scope of research with exclusions and assumptions, and the process involved in quantifying embodied GHG emissions.
2.1 Case study and reference buildings
In order to better understand the embodied GHG emissions performance of CLT construction, this study uses a case study building and a reference building. The case study building (CSB) integrates a structure mainly constructed out of CLT, while the reference building (RB) is identical to the CSB, but integrating a structure mainly constructed out of reinforced concrete (RC). In opposition with most previous similar studies that use hypothetical buildings as case studies, this study is based on a real-life project that was in design and documentation phase at the time of this research and is due for completion by the end of

533
Greenhouse gas emissions performance of cross laminated timber construction using hybrid life cycle assessment
2020. Access to all documentation, architectural, engineering and manufacturing sets, has enabled both a high level of detail in the generation of the bill of quantities (BOQ), and the realism of an existing project as a case study, that meets current planning and construction regulations, as well as budget constraints.
Consecutively, the RB becomes a hypothetical building with its design driven by conventional construction methods and economical rationales as it occurs in current practice. For example, since the RB has suitable access to the site via two roads, the use of precast concrete panels will be preferred, as it would offer both time and cost savings. In comparison, the reduced quantity of RC walls for the CSB will favour construction of the ground floor using concrete blocks enabling a quick start before CLT installation.
Situated in Thornbury, a medium density suburb north of Melbourne, Australia, the CSB is a five- storey building, just under 22 metres high, in a rectangle shape with the long sides oriented north and south, with a total of 13 apartments (Figure 1). The ground floor includes a retail space, diverse storage and a foyer that is naturally lit by a southern glass block façade for the full height of the building. Thirteen car spaces are spread between the ground floor and basement levels using two car stackers. The first two levels (F1 and F2) follow the ground floor footprint of about 468 m2 and include nine apartments with decks (Figure 2). The facades of the following two levels (F3 and F4) are recessed on all sides of the building reducing the floorplate to about 283 m2 and include four apartments. The last level (F5) is shared between a common roof deck area, an outdoor plant room and an array of solar panels.
Figure 1: Artist impression of the case study building (CSB). Source: Gardiner Architects.

534
Xavier Cadorel, and Robert H. Crawford
Figure 2: Second floor (F2) plan of the case study building (CSB). Source: Gardiner Architects.
2.1.1 Design considerations for the case study building (CSB).
According to the Australian National Construction Code (NCC), there are two methods to comply with the design of a building, the first method is deemed-to-satisfy (DTS), where the design of the building follows provided guidelines. The second method is performance-based, where no guidelines are provided and designers must assess the building in term of structure, fire, thermal performance, etc. to prove that the performance of the designed building is in accordance with the minimum standards required by the NCC. Since 2016, amendments to the NCC allow multi-residential timber construction under effective height of 25 metres to be designed according to DTS, which represents valuable support to designers in using CLT, and this is the case with this CSB. Similarly to the Forté building (Durlinger et al., 2013), the CSB integrates a RC podium, meaning that the ground floor slab and bearing walls, and the first level slab use RC. Then, most of structural elements from above the first-floor slab use CLT, sometimes reinforced with LVL lintels and steel transfer beams.
2.1.2 Design considerations for the reference building (RB).
Based on the architectural drawings of the CSB, the RB was designed in order to obtain the most accurate BOQ. The complete RC structure was fully engineered down to steel bar and mesh reinforcement level, including the footing systems, using information on the soil type from the CSB. The building envelope preserves the same exterior aesthetically with identical cladding and insulation. The layout and room areas are similar. At design stage, it was noted that the RB structure needed fewer load bearing elements than the CSB, thus increasing the number of non-load bearing light timber walls. The only noticeable design difference between the CSB and the RB is the presence of two central columns in the retail space at ground level for the CSB, where the RB contains only one central column.

535
Greenhouse gas emissions performance of cross laminated timber construction using hybrid life cycle assessment
2.2 Quantification of embodied GHG emissions
The EPiC Database (Crawford et al., 2019) provides a list of hybrid embodied GHG emissions coefficients for construction materials that are generated using the PXC approach. The PXC approach involves the integration of bottom-up industry specific process data with top-down economic and environmental data (known as environmentally-extended input-output (EEIO) data). The EPiC Database coefficients include the embodied GHG emissions for all processes associated with the production of the individual materials and products (i.e. stage A1-A3 as per EN 15978:2011). Further EEIO data is used to estimate the embodied GHG emissions associated with the assembly/construction process and minor materials used in the CSB and RB (stage A4-A5 as per EN 15978:2011). The full process to quantify the embodied GHG emissions associated with each building (stage A1-A5) is shown in Equation 1 and outlined in the EPiC database (Crawford et al., 2019).
Where: EGHG represents the total embodied GHG emissions during stage A1-A5 for a building (kg CO2-e); QM represents the quantity of each material contained with a building (t, m3 etc.); EGHGM represents the embodied GHG emissions coefficient of each material (kg CO2-e/unit); CB represents the total cost of the building ($); TGHGRB represents the total GHG emissions associated with one dollar of output from the Residential Building sector (kg CO2-e/$); TGHGM represents the total GHG emissions for input-output pathways related to materials that have been quantified in the BOQ (kg CO2-e/$).
2.2.1 Exclusions and margin of error
This study uses a streamlined life cycle assessment that focusses only on embodied GHG emissions for stages A1-A5. The functional unit is the entire building for both the CSB and the RB. The bill of quantities for both buildings has been generated manually according to architectural and engineering documentation and separated into two lists, namely structure and non-structure. These two lists share common physical values, such as floor and façade areas (m2), wall lengths (m) and window schedules limiting margin of errors regarding to the bill of quantities. Appendix 1, Table A.1 shows of all main material quantities for the CSB and RB. In the absence of reliable BIM documentation, or an automated process, some exclusions were required to make this task manageable:
• all services and active systems; this includes water (pumps, pipes, taps and rainwater system), electricity (electrical cables, switches, LED lighting), sewage (drainage and drain grills, greasetraps), gas (hot water systems), data and communications network, cooling, ventilation, liftand PV systems;
• safety services such as sprinkler system, fire hydrant, hose reel, FIP and EWIS;• all internal fittings, this includes car stacker, bench, lockers, cupboard storage, cages,
mailboxes, benches, TGSI, balustrades, kitchens, wardrobes, cupboards, bathrooms andinternal doors, etc.;

536
Xavier Cadorel, and Robert H. Crawford
• all external fine details such as awnings, sunshade structure, privacy screens, gutters, flashing and downpipes, metal gates and entrance door, garden box and roof top furniture.
3. Results
3.1 Total embodied GHG emissions for CSB and RB
The embodied GHG emissions associated with each material contained within the CSB and RB are shown in Appendix 1, Table A.1. Figure 3 shows the total GHG emissions for both buildings.
0 200 400 600 800 1,000 1,200 1,400 1,600 1,800 2,000 2,200
CSB
RB
Figure 3: Total embodied GHG emissions for the CSB and RB (tCO2-e)
Total embodied GHG emissions, including those associated with the production of materials and the construction process equates to 1,9298 tCO2-e and 2,024 tCO2-e for the CSB and the RB, respectively, resulting in an embodied GHG emissions reduction of 4.7% for the CSB compared to the RB. Although this percentage seems minor, it represents a saving of 95.22 tCO2-e, which is equivalent to a 4-wheel drive vehicle traveling more than thirty-seven times around Australia (560,129 km based on 220 gCO2 per km). When applied to the total gross floor area of each building, which are similar, these results are about 1,408 kgCO2-e/m2 and 1,477 kgCO2-e/m2 for the CSB and the RB, respectively.
3.1.1 Embodied GHGE related to construction and minor materials
The embodied GHG emissions associated with the construction process and minor materials represents 688.5 tCO2-e and 510.9 tCO2-e for the CSB and RB, respectively. The embodied GHG emissions associated with construction and minor materials is different for both buildings for a number of reasons - the difference in project cost (as this component is based on the use of EEIO data and the project cost) and due to the absence of CLT for the RB.
3.1.2 Embodied GHGE related to main materials
Figure 4 shows the embodied GHG emissions associated with each of the main materials for both buildings. Four main observations can be drawn from this. Firstly, while there is no CLT in the RB and thus no associated GHG emissions, there is a fair amount of embodied GHGE emissions related to the use of concrete for the CSB. This is not only due to foundations but also the presence of a basement and podium in the CSB. Secondly, it is noted that the embodied GHG emissions related to hardwood, which includes interior battens in the foyer and decking and flooring for all apartments is relatively high, ranking fourth place of the biggest embodied GHG emissions per materials. Thirdly, since the CSB is designed according to deemed-to-satisfy, all CLT elements are encapsulated with 16mm plasterboard, resulting in an increase of embodied GHG emissions related to plasterboard of 165% for the CSB compared to the RB. Lastly, while
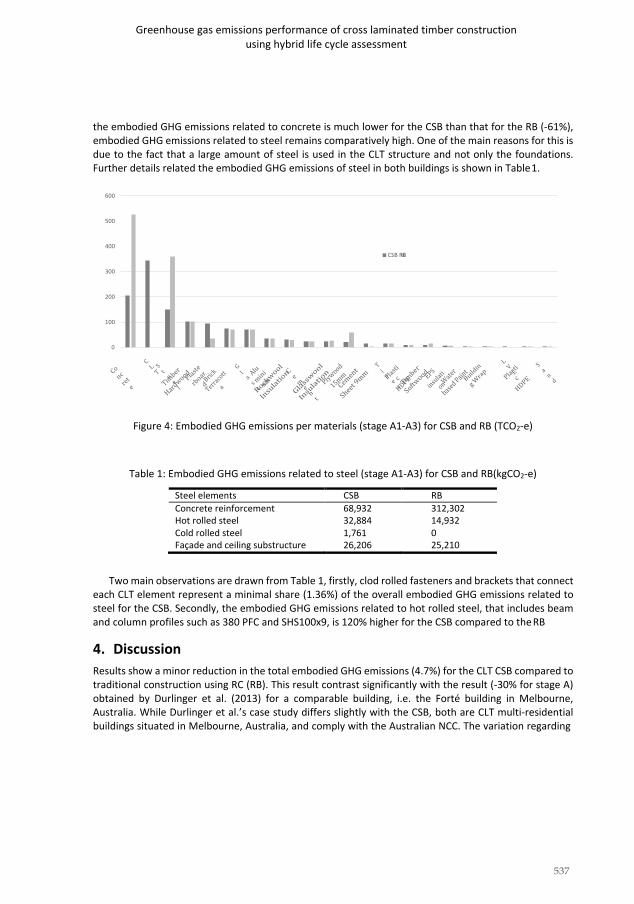
537
Greenhouse gas emissions performance of cross laminated timber construction using hybrid life cycle assessment
the embodied GHG emissions related to concrete is much lower for the CSB than that for the RB (-61%), embodied GHG emissions related to steel remains comparatively high. One of the main reasons for this is due to the fact that a large amount of steel is used in the CLT structure and not only the foundations. Further details related the embodied GHG emissions of steel in both buildings is shown in Table 1.
600
500
400
300
200
100
0
Figure 4: Embodied GHG emissions per materials (stage A1-A3) for CSB and RB (TCO2-e)
Table 1: Embodied GHG emissions related to steel (stage A1-A3) for CSB and RB(kgCO2-e)
Steel elements CSB RB Concrete reinforcement 68,932 312,302 Hot rolled steel 32,884 14,932 Cold rolled steel 1,761 0 Façade and ceiling substructure 26,206 25,210
Two main observations are drawn from Table 1, firstly, clod rolled fasteners and brackets that connect each CLT element represent a minimal share (1.36%) of the overall embodied GHG emissions related to steel for the CSB. Secondly, the embodied GHG emissions related to hot rolled steel, that includes beam and column profiles such as 380 PFC and SHS100x9, is 120% higher for the CSB compared to the RB
4. DiscussionResults show a minor reduction in the total embodied GHG emissions (4.7%) for the CLT CSB compared to traditional construction using RC (RB). This result contrast significantly with the result (-30% for stage A) obtained by Durlinger et al. (2013) for a comparable building, i.e. the Forté building in Melbourne, Australia. While Durlinger et al.’s case study differs slightly with the CSB, both are CLT multi-residential buildings situated in Melbourne, Australia, and comply with the Australian NCC. The variation regarding
CSB RB

538
Xavier Cadorel, and Robert H. Crawford
results can potentially be explained by the difference in methods used to quantify the embodied GHG emissions.
The study by Durlinger et al. uses a more traditional, yet incomplete process analysis, while this study has used a much more comprehensive hybrid analysis, based on more recent data and a more complete system boundary. While usually this is less of an issue for comparative studies, a recent study by Crawford et al. (2019) has shown that differences in supply chain coverage between process-based material coefficients can alter a comparative study depending on the mix of materials being used.
Another explanation of this result lays in the sensitivity of the construction cost. It appears that while the reduction of embodied GHG emissions related to main materials is 18% lower for the CSB compared to the RB, the addition of the GHG emissions associated with the construction process and minor materials, based solely on construction cost, brings the final results closer in line. While the PXC approach ensures a greater completeness, the reduction in the difference in embodied GHG emissions results between the two buildings from 18% to 4.7% highlights its sensitivity to material price and cost estimation. This sensitivity is greater when there is a price variation associated with materials used in large quantities, such as the case with the CSB. A sensitive analysis on the influence of cost of CLT, which is estimated to vary by +/- 30%, on the findings was conducted. Such cost variation results in a variation to the total embodied GHG emissions of about +/- 2.78% for the CSB. Further uncertainties in embodied GHG emissions data can also lead to variations in results.
The embodied GHG emissions related to hot rolled steel is more than double for the CSB than the RB. The façade recess of the building on level 3 and 4 results in extra punctual loads to be supported by the third floor. While the RC construction design solution rests on transfer beams or extra in-slab reinforcement under punctual loads, the CLT solution was more complex and relies on a series of steel beams, which accounts for more than three tons of steel for the third level floor only. This extra steel structure results for 8.77 tCO2-e in itself, highlighting the need to better consider layout and partition design that reduce path load disruption.
5. ConclusionThis study conducted an analysis of the embodied GHG emissions of a case study building constructed using CLT and a reference building constructed using RC. A PXC hybrid approach was used to quantify the embodied GHG emissions, using materials coefficients from the EPiC Database. Results show a minor reduction in total embodied GHG emissions of 4.7% for the CLT building. While many factors must be considered when selecting materials and construction systems, this study has identified several opportunities to further refine our understanding of the embodied GHG emissions of CLT construction and to reduce these emissions, including:
further clarification around total construction cost, in particular the price of CLT; consideration of the load path at the design phase to ensure greater structural efficiencies; further research regarding CLT behaviour under fire enabling reduction of reliance on
plasterboard.
Due to the limited scope of this study, the conclusions regarding the embodied GHG emissions benefits from CLT construction compared to more conventional construction is restricted to stage A1-A5 as per EN 15978:2011. Further research is required to consider the full life cycle GHG emissions, including those associated with the operational stage, carbon sequestration and various end of life scenarios. A CLT

539
Greenhouse gas emissions performance of cross laminated timber construction using hybrid life cycle assessment
building will perform differently to a RC building across each of these stages and these factors must be considered in order to estimate the total net GHG emissions implications of CLT construction.
While this study has solely focused on the GHG emissions associated with the construction of a multi- residential building using two different materials, there are many other factors to consider when selecting one construction method over another one, such as thermal performance, offsite potential, cost, safety and quality control, as well as health and well-being outcomes. Nevertheless, GHG emissions are an important factor among many to consider when assessing the potential for CLT to innovate and transform the construction sector and to contribute to the development of sustainable cities.
6. ReferencesCadorel, X. and Crawford, R. H. (2018) Life cycle analysis of cross laminated timber in buildings: a review, Engaging
Architectural Science: Meeting the Challenges of Higher Density, (52nd International Conference of the Architectural Science Association (ANZAScA)), pp. 107-114.
Crawford, R. H., Bartak, E. L., Stephan, A. and Jensen, C. A. (2016) Evaluating the life cycle energy benefits of energy efficiency regulations for buildings, Renewable and Sustainable Energy Reviews, 63, 435–451.
Crawford, R. H., Stephan, A., Bontinck, P. A. and Wiedmann T. (2018) Hybrid life cycle inventory methods – A review, Journal of Cleaner Production, 172, 1273-1288.
Crawford R. H., Stephan, A. and Prideaux, F. (2019) Environmental Performance in Construction (EPiC) Database, The University of Melbourne.
Crawford, R. H., Stephan, A. and Prideaux, F. (2019) A comprehensive database of environmental flow coefficients for construction materials: closing the loop in environmental design, Revisiting the Role of Architecture for 'Surviving’ Development, (53rd International Conference of the Architectural Science Association (ANZAScA)), pp. 353-362.
Department of the Environment and Energy (2019, December). Australia’s emissions projections 2019. Australias- Emissions-Projections-2019-Report.
Durlinger, B., Crossin, E. and Wong, J. (2013) Life cycle assessment of a cross laminated timber building, Forest and Wood Products.
Hafner, A. and Rueter, S. (2018) Method For Assessing The National Implications Of Environmental Impacts From Timber Buildings—An Exemplary Study For Residential Buildings In Germany, Wood and Fiber Science, 139–154.
Takano, A., Pittau, F., Hafner, A., Ott, S., Hughes, M. and Angelis, E. D. (2014) Greenhouse gas emission from construction stage of wooden buildings, International Wood Products Journal, 5(4), 217–223.

540
Xavier Cadorel, and Robert H. Crawford
7. Appendix
Table A.2: Main material quantities and embodied GHG emissions (Stage A1-A3) for CSB and RB.
Case Study Building (CSB) Reference Building (RB) Materials Bill of
Quantities Units Embodied
GHG emissions
Bill of Quantities
Units Embodied GHG emissions
(kgCO2-e) (kgCO2-e) Concrete 467.7 m3 205,177 1122.1 m3 526,178 Concrete block 549.5 m2 1,736 0.0 m2 0 Cement 11.7 m3 22807.9 12.3 m3 23996.6 Lime 0.6 m3 300 0.6 m3 291 Sand 95.3 t 2,288 98.0 t 2,351 Gravel 7.3 t 262 11.1 t 399 Pebbles 10.2 m3 367 10.2 m3 367 Brick Terracotta 99.7 m3 76,664 96.1 m3 73,922 Steel bars 32.6 t 68,483 131.7 t 276,581 Hot rolled steel 11.3 t 32,884 5.1 t 14,932 Cold rolled steel 13.4 t 49,578 18.5 t 68,448 Aluminum 1.2 t 36,277 1.2 t 36,277 CLT 532.3 m3 343,321 0.0 m3 0 LVL 1.8 m3 1,937 0.0 m3 0 Timber Softwood 16.7 m3 9,735 27.2 m3 15,846 Timber Hardwood 1076.3 m3 104,784 1076.3 m3 104,784 Plywood 15mm 380.4 m2 20,998 1048.7 m2 57,889 Glass 24.1 t 71,211 24.1 t 71,211 Cement Sheet 9mm 743.6 m2 15,096 202.2 m2 4,105 Plasterboard 14085.4 m2 95,549 5937.7 m2 36,034 Tiles 746.5 m2 14,556 768.8 m2 14,992 Water based Paint 10010.1 m2 5,305 10358.5 m2 5,490 Acoustic Insulation 2.3 m3 745 2.3 m3 744 Glasswool Insulation 240.6 m3 24,296 253.5 m3 25,606 Rockwool Insulation 122.6 m3 32,364 111.5 m3 29,438 EPS insulation 33.1 m3 5,965 35.5 m3 6,390 Building Wrap 2645.0 m2 5,025 2074.4 m2 3,941 Plastic HDPE 2.0 t 12,484 1.7 t 11,013

541
The 54th International Conference of the Architectural Science Association (ANZAScA) 2020
Hindrances to the adoption of green walls: a hybrid fuzzy-based approach
Saeed Reza Mohandes1, Amir Mahdiyar2, Haleh Sadeghi3, Sanaz Tabatabaee4, M. Reza Hosseini5 1, 3 Department of Civil and Environmental Engineering, The Hong Kong University of Science and
Technology, Clear Water Bay, Kowloon, Hong Kong {[email protected], [email protected]}
2 School of Housing, Building, and Planning, Universiti Sains Malaysia, 11800, Penang, Malaysia [email protected]
4 Green Cities and Construction Research Group, Razak Faculty of Technology and Informatics, Universiti Teknologi Malaysia, 54100, Kuala Lumpur, Malaysia
[email protected] 5 School of Architecture and Built Environment, Faculty of Science, Engineering and Built Environment,
Deakin University, Geelong, Australia [email protected]
Abstract: Green walls – comprising living walls and green facades – are being widely touted as environmentally friendly products in architectural design. Green walls can be viable in every aspect of sustainability; they benefit building occupants in various ways – economic, social and environmental advantages. Despite this, the adoption rate is still in its infancy. And research on barriers that inhibit their wider adoption is scarce. To address this gap, this paper aims to identify and assess the relative importance of hindrances to green wall adoption in Hong Kong. To this end, fuzzy Delphi method (FDM), and Fuzzy Parsimonious Analytic Hierarchy Process (FPAHP) are used in ranking the identified hindrances. Findings provide a list of ranking for the identified barriers; financial barriers and difficulties in installation and maintenance turn out to be the most critical hindrances to green wall adoption. This paper offers illuminating insight into the challenges of green wall adoption for researchers. In practical terms, findings provide lessons for clients, designers and all key stakeholders of building projects. Discussions raise awareness of policy makers too, especially to reconsider the financial incentives for green wall installers. These all would facilitate wider adoption of green walls in the building industry.
Keywords: Sustainability; green building; design; MCDM methods
1. IntroductionGreen Walls (GWs), colloquially known as vegetated walls, are considered a passive design solution and an element of green infrastructure (Liberalesso et al., 2020). They positively contribute to all aspects of sustainability: water management, reducing urban heat island effect, improving air quality, aesthetic
Imaginable Futures: Design Thinking, and the Scientific Method. 54th International Conference of the Architectural Science Association 2020, Ali Ghaffarianhoseini, et al (eds), pp. 541–550. © 2020 and published by the Architectural Science Association (ANZAScA).
542
Saeed Reza Mohandes, Amir Mahdiyar, Haleh Sadeghi, Sanaz Tabatabaee, M. Reza Hosseini
value, energy saving, and providing biodiversity among other things (Radić, Dodig and Auer, 2019; Prodanovic et al., 2020). The benefits of GWs in each aspect varies and depends on some factors like climate, type of vegetation used, and maintenance style. That said, there is no deterministic value for the benefits of GWs (Mahdiyar et al., 2016). For instance, it has been reported that GWs are capable of energy saving between 33% and 60% (Shen, Zhang and Long, 2017), while the additional required costs for installation and maintenance varies. In terms of sustainability aspects, GWs have high potential to be installed in a large scale building – new or retrofitted (Castiglia Feitosa and Wilkinson, 2020).
Despite the above facts, GWs’ potential in all aspects of sustainability have been overlooked by designers, due to some hindrances to their adoption. A review of the literature shows that very few studies, if any, are conducted on analysing the hindrances to GW adoption. Systematic attempts to identify hinderances and assess their relative importance are non-existent. To address the gap, this paper is aimed at investigating these barriers and analysing their relative importance in Hong Kong. Hong Kong is selected as the context of the study in view of its proven record in adopting GWs; its favourable climate, and its concentrated high-rise environment (Mohandes, Zhang and Mahdiyar, 2019).
2. BackgroundGreen Walls (GWs) are defined as vertical greening systems that cover walls of buildings for sustainable purposes. These are classified into two major systems, green facades and living walls (Manso and Castro- Gomes, 2015; Medl, Stangl and Florineth, 2017). Traditional green facades are categorised as direct green facades, while indirect green facades consist of continuous guides and modular trellis. Continuous guides are based on a single support structure that leads plants’ direction along the entire surface, while green facades with modular trellises comprise several modular elements (vessels for plants rooting) and an individual support structure along the surface (Laurenz et al., 2005).
Living walls are the modern type of GWs for integrating green surfaces in high-rise buildings. Rapid growth, uniform coverage of large vertical surfaces and the possibility of using various plant species are the main advantages of living walls (Manso and Castro-Gomes, 2015). Based on application methods, living walls are categorised into continuous and modular. In continuous living walls, which are also known as vertical gardens, plants are inserted in permeable and lightweight screens (Bribach, 2011). However, modular living walls consist of elements with specific dimensions and an intermediate layer for plant growth. Each element of modular living wall – trays, vessels, planter tiles or flexible bags – is either directly or indirectly fixed to the vertical surface (Dunnett and Kingsbury, 2008).
Like green buildings and other green-based elements used in buildings (such as green roof), the adoption of GWs is affected by some hindrances. Of these, one of the most crucial hindrances to the adoption of GWs are unanimously believed to be their high installation costs (Perini et al., 2011). Installed GWs need to be irrigated and pruned regularly, hence cost of maintenance is another major hindrance to their wider adoption, as argued by Riley (2017). Overconsumption of drinkable water represents another barrier to the adoption of green facades; however this problem is eased off, thanks to the use of new technology (Terblanche, 2019). A review run on previous studies on the hindrances to the adoption of GWs. A list of major barriers identified and culled from previous studies in the field is illustrated in Table 1.

543
Hindrances to the adoption of green walls: a hybrid fuzzy-based approach
Table 1. Summary of identified hindrances in previous studies
ID Hindrance Reference(s) H1 Climate adaptability (Hopkins and Goodwin, 2011) H2 High environmental burden of some materials (Ottelé et al., 2011) H3 High maintenance cost (Riley, 2017) H4 High installation cost (Perini et al., 2011) H5 Sophisticated implementation (Perez et al., 2011) H6 High water and nutrients consumption (Terblanche, 2019) H7 Uncertainty in accepting a new technology (Duda, 2009) H8 Lack of policy and standards (such as design-related
standards) (Duda, 2009)
H9 Lack of published costs stipulated in guidelines (Terblanche, 2019) H10 Insufficient lighting for the plants (Smith et al., 2010) H11 Possible damages to the back wall (Manso and Castro-Gomes, 2015) H12 Paucity of technical tools (for conducting required
simulation) (Ascione et al., 2020)
H13 Necessity of involving qualified designers (Ascione et al., 2020) H14 Inducement to fire (Manso and Castro-Gomes, 2015) H15 Vulnerability to fungus, insects, etc. (Fleck et al., 2020) H16 No/limited incentives provided by governments (Liberalesso et al., 2020) H17 Difficulty of maintenance (Kontoleon and Eumorfopoulou,
2010), (Perez et al., 2011)
As inferred from the list of hindrances in Table 1, research on the topic comprises a collection of very few studies allocated to the topic. Besides, existing studies are scattered and comprise a collection of piecemeal papers and publications. There is an obvious dearth of research; studies that comprehensively identify and accordingly analyse existing hindrances are non-existent. As such, conducting further research on this fecund, yet overlooked area is justified. In practical terms, such research will facilitate and pave the way for further adoption of such green-based features in the building industry and can raise awareness among key stakeholders and policy makers alike.
3. Research methodsFuzzy Delphi method (FDM) is used to identify and refine the hindrances to the adoption of GW, and fuzzy parsimonious analytic hierarchy process (FPAHP) is developed to calculate relative importance weights, as well as prioritise the identified hindrances. Judgement sampling is used for both methods, where twenty-one and seven experts are involved in FDM and FPAHP respectively, as suggested by Mahdiyar et al.,(2020). Purpose sampling is used for data collection following the lessons by Mohandes et al. (2020), who recommended the criteria for the pool of experts: five years of related experience in construction engineering and management, and at least a related undergraduate degree.
3.1 Fuzzy Delphi Method
Fuzzy Delphi method is an effective method for the aims and objectives of this paper, namely, identifying and prioritising the barriers to GW adoption (Mohandes and Zhang, 2019; Mahdiyar et al., 2020; Zhang and Mohandes, 2020). This method entails three steps: 1) determination of barriers through synthesising the findings of previous studies; 2) designing the questionnaire survey and administering it among experts; and 3) analysing the relative importance of barriers.

544
Saeed Reza Mohandes, Amir Mahdiyar, Haleh Sadeghi, Sanaz Tabatabaee, M. Reza Hosseini
The outcome of step 1 is shown in Table 1 – a pool of barriers culled from the literature. In step 2, a questionnaire survey is developed based on the identified barriers, using a five-point Likert scale (see Table 2).
Table 2. FDM scale and linguistic
Level of Significance Description TFN 1 very low significant (1, 1, 3
2 2 Low significant 3 5
( , 2, ) 2 2
3 moderately significant
4 significant 5 very significant
5 7 ( , 3, ) 2 2 7 9
( , 4, ) 2 2 9
( , 5, 5) 2
This survey was then distributed among twenty-one qualified experts in Hong Kong, who met the specified requirements. Triangular fuzzy numbers (TFNs) are used to fuzzify the experts’ point of view, which are in the form of crisp values, as indicated in Table 3. Table 3 illustrates a summary of experts’ profile involved in the study.
Table 3. Experts’ profile information
NO Role Degree NO of projects Experience 1 Designer Master’s in architecture 2 Within 5 and 10 years 2 Facility manager Master’s in construction management 4 Within 5 and 10 years 3 Designer Master’s in architecture 4 Within 10 and 15 years 4 Facility manager Bachelor’s in civil engineering 4 Within 10 and 15 years 5 Project manager Master’s in construction management 2 Within 5 and 10 years 6 Contractor Bachelor’s in architecture 6 Within 10 and 15 years 7 Designer Master’s in architecture 4 Within 10 and 15 years 8 Designer Master’s in architecture 2 Within 5 and 10 years 9 Contractor Bachelor’s in civil engineering 3 Within 5 and 10 years 10 Project manager Master’s in construction management 2 Within 5 and 10 years 11 Contractor Bachelor’s in architecture 3 Within 5 and 10 years 12 Contractor Bachelor’s in civil engineering 3 Within 5 and 10 years 13 Designer Master’s in architecture 3 Within 5 and 10 years 14 Project manager Master’s in construction management 2 Within 5 and 10 years 15 Facility manager Bachelor’s in civil engineering 4 Within 10 and 15 years 16 Designer Bachelor’s in architecture 4 Within 10 and 15 years 17 Contractor Master’s in construction management 4 Within 10 and 15 years 18 Project manager Bachelor’s in civil engineering 5 Within 10 and 15 years 19 Designer Bachelor’s in architecture 2 Within 5 and 10 years 20 Contractor Bachelor’s in civil engineering 3 Within 5 and 10 years 21 Designer Master’s in architecture 2 Within 5 and 10 years
After fuzzifying the responses, n experts’ points of view concerning z barriers of GW in Hong Kong are aggregated, using Eqs. 1 and 2. As all responses from experts are fuzzified, the aggregation of n experts’ responses for z barriers are TFN.
𝐹𝐹𝑗𝑗 (𝑏𝑏) = (𝑝𝑝𝑗𝑗, 𝑞𝑞𝑗𝑗, 𝑟𝑟𝑗𝑗), 𝑗𝑗 = 1, 2, … , 𝑛𝑛 (1)
)

545
Hindrances to the adoption of green walls: a hybrid fuzzy-based approach
𝐴𝐴𝐺𝐺 (𝑏𝑏) = (𝑝𝑝𝐴𝐴, 𝑞𝑞𝐴𝐴, 𝑟𝑟𝐴𝐴) = (𝑘𝑘𝑖𝑖𝑛𝑛 𝑝𝑝𝑗𝑗 , 𝐺𝐺𝐺𝐺 𝑞𝑞𝑗𝑗, 𝑘𝑘𝑎𝑎𝑥𝑥 𝑟𝑟𝑗𝑗), 𝑗𝑗 = 1, 2, … , 𝑛𝑛 (2)
in which 𝐹𝐹𝑗𝑗 (𝑏𝑏) stands for the expert j point of view regarding barrier b in the form of TFN. Additionally, the aggregated experts’ points of view regarding barrier b or AG (b) is shown in Eq. 2, where GM is the abbreviation of Geometric Mean in Eq. 2. To attain crisp value as each barrier significance, aggregated responses of experts are defuzzified based on Eq. 3. According to Eq. 4, a threshold is determined for identifying important barriers (Bouzon et al., 2016).
𝑝𝑝𝐹𝐹𝐴𝐴𝐺𝐺 (𝑏𝑏) = (𝑝𝑝𝐴𝐴 + 4 × 𝑞𝑞𝐴𝐴𝐺𝐺 , 𝑟𝑟𝐴𝐴𝐺𝐺 )/6 (3)
(4)
where, 𝑝𝑝𝐹𝐹𝐴𝐴𝐺𝐺 (𝑏𝑏) stands for the defuzzification of aggregated responses for barrier b. TH denotes the defined threshold, hence barrier b is considered as an important one when 𝑝𝑝𝐴𝐴 (𝑎𝑎) ≥ 𝑇𝑇, otherwise it should be eliminated.
3.2 Fuzzy Parsimonious Analytic Hierarchy Process
Analytic Hierarchy Process, has been used as one of the most common techniques of decision making in construction research (Jato-espino et al., 2014). This method is capable of converting intangible variables/factors into quantitative values for further analysis. It however suffers from several weaknesses like vague judgements, and difficulties in pairwise comparison, especially when several criteria/factors are involved (Mahdiyar et al., 2019). Considering the aims and objectives of the present study, fuzzy parsimonious analytic hierarchy process (FPAHP), as a new hybrid method is used to calculate the importance of barriers to GW installation with fewer required number of pairwise comparison and achieving accurate results using fuzzy numbers.
In the first step of FPAHP, experts are asked to rate the importance of barriers to GW installation in Hong Kong, which is called initial rates (𝐼𝐼𝑅𝑅). The scale of ranking is similar to conventional AHP scale (from one to nine representing the lowest and highest importance), to make it consistent with the following steps and easier to follow by the experts. As shown in Table 4, TNFs are used to fuzzify the AHP crisp values to improve the accuracy of results (Mohandes and Zhang, 2019; Mahdiyar et al., 2020). In the second step, the required numbers reference evaluation barriers (𝑟𝑟) are selected based on the guideline provided by Abastante et al. (2019). In the third step, a conventional fuzzy AHP process is conducted to obtain the weights of reference evaluation barriers. Following the studies conducted by Mahdiyar et al. (2019), once the pairwise matrix is generated using AHP scale, the consistency of responses must be checked before proceeding to fuzzify the numbers.
Table 4: FAHP scale used to evaluate the importance of barriers (Keprate and Ratnayake, 2016)

546
Saeed Reza Mohandes, Amir Mahdiyar, Haleh Sadeghi, Sanaz Tabatabaee, M. Reza Hosseini
Once the consistency of the responses is confirmed, the weights of reference barriers are calculated and following the parsimonious AHP concept (as presented by Abastante et al. (2019)), the weights of barriers are calculated.
4. Result and discussionBased on the results of FDM, H1, H6, H9, and H12 (see Table 1 and Figure 1) were perceived as non- significant hindrances to the implementation of GWs. As for H6, due to a great deal of raining in Hong Kong, the need for irrigation of the GWs installed on buildings facades is negligible, where Hong Kong climate is not a barrier for GW adoption. When it comes to the lack of published data on costs associated with GW, it is believed that firms involved in the field have all the detailed expenses of installation, they also can provide information to clients on the expenses during maintenance and operation phase. As a result, a majority of experts are of the opinion that H9 is not a significant barrier in Hong Kong, as illustrated in Figure 1. Likewise, there are many simulation tools for analysing GW installation like energy and building, TRANSYS, among others. These tools are freely available for interested researchers, institutions, companies, and government bodies in Hong Kong; hence, H12 was unanimously perceived to be a less significant hindrance in Hong Kong.
Fig. 1. FDM results
According to the results of FDM, thirteen barriers are perceived as important, as illustrated in Table 5. As discussed, parsimonious concept is used for pairwise comparison, hence, instead of thirteen comparing hindrances pair wisely, only four hindrances must be compared. As a result, the required number of pairwise comparison has been reduced significantly at approximately 87% (from ( 13×12
2 = 78) to ( 5×4 =
2
10)). During the first step of FPAHP, experts were asked to rate the barriers based on their experience. Four hindrances (i.e. H3, H8, H17, H7) were selected as the reference points. In reference selection, a wide range of priority is considered to increase the consistency of results. Then, the experts were asked to conduct pairwise comparison between these four hindrances and the weights and ranks of all hindrances were calculated (see Table 5).
Threshold value
Defuzzified value

547
Hindrances to the adoption of green walls: a hybrid fuzzy-based approach
Table 5. Weights of hindrances to GW installation
Hindrances Weights Ranks H3 0.17 1 H4 0.14 2 H17 0.13 3 H5 0.11 4 H14 0.10 5 H10 0.09 6 H7 0.06 7 H16 0.06 7 H2 0.05 8 H11 0.04 9 H8 0.02 10 H15 0.02 10 H13 0.01 11
As illustrated in Table 5, the most important barriers to GW installation are financial aspects (H3 and H4) followed by difficulties in installation and maintenance (H5 and H17). These results are consistent with previous studies conducted on GW and green roof installation, though any additional cost can be potentially offset by the financial benefits of their adoption (Rosasco and Perini, 2018). Besides, the net present value and payback period are fraught with uncertainties, which result in the lack of adoption of GWs by clients and developers. In terms of difficulties in installation and maintenance, various types of GWs have different characteristics and requirements; special expertise is required for the installation. Moreover, due to the long lifespan of GWs, regular maintenance is required, which has been considered as an additional task during the whole lifespan. The performance of GWs depends on the health and quality of plants and its structure. These further highlight the significance of regular maintenance.
The next important barrier is H14 as plants are vulnerable to cause fire. As a result, installing GWs for buildings exposes buildings to extra safety and financial risks. In terms of required lighting for GWs, and given that Hong Kong is home to many skyscrapers and high-rise buildings, many locations might lack the required adequate level of natural lighting, especially in central business districts. That said, various types of plants need different levels of lighting, therefore, H10 can be overcome if the GW is designed with suitable plants.
When it comes to the adoption of sustainable methodologies, governments tend to provide financial incentives through tax abatements or by partially covering any additional costs of installation. Though GW installation facilitates achieving green building certificates with financial gains for clients/developers, GW installers are not eligible for financial incentives where green building certificate is not achieved (Liberalesso et al., 2020). As a result, it can be considered as a hindrance to GW adoption. In is notable to mention GWs might have some adverse impact to the environment when plastic is used in the vessels to accommodate the plants. These plastics have adverse impact on the environment if landfilled after the GWs lifespan, similar to the case of green roofs as investigated by Peri eta al. (2012)). Given that all types of GWs plastics do not require plastics, H2 is considered as an important hindrance.
According to Table 5, there are some other barriers, ranked as the least important ones: H11, H15, H8, H13. The damage might happen to the back wall due to waterproofing flaws and the moisture retention. Moreover, roots and branches might be the source of damage while the wall is vulnerable to fungus and insects. These damages are however almost entirely preventable if the GW is regularly maintained,

548
Saeed Reza Mohandes, Amir Mahdiyar, Haleh Sadeghi, Sanaz Tabatabaee, M. Reza Hosseini
therefore, their lower importance compared to other barriers is justified. The expertise needed for the designers to consider GW in their designs has been perceived as the least significant hindrance, mostly due to the availability of sources and guidelines in the market.
5. ConclusionAlthough a few studies have touched on the topic of barriers to the adoption of GWs, the study presented here is the first systematic effort in identifying the barriers to widespread adoption of GWs in Hong Kong, based on empirical data. Original views, new insights and trends emerged as the outcome of this study, encapsulated in the form of a list of barriers that thwart efforts towards wider uptake of GWs, as the first empirically validated list in its kind. Examination of the list reveals that while most of the major barriers are presented in previous studies, some act as the root causes for a lack of intention to adopt GWs. They must be given top priority, that is, they nurture a wide range of barriers and addressing them can enable project stakeholders to eliminate the underlying reasoning behind the lack of interest in GWs. The clear message is about proposing a way forward that will address the issues of installation, maintenance and costs uncertainties, relying on technological innovations to revolutionise the current practices of installing and maintaining GWs, as a result of which people will be more willing to use them in their buildings. The practical implication is that building researchers and professionals are called to allocate resources to improve GWs installation and maintenance practices and methods to eliminate the underlying causes of key stakeholders’ unwillingness to use them. This involves giving priority to addressing these with better technology.
Despite the contributions, findings of the study must be viewed considering several limitations that affect the findings. Chief among all is that direct application of findings in countries other than Hong Kong must be treated with caution. Besides, findings are based on the perception of experts in the field, rather than analysis of performance measures or quantitative assessment of using GWs outcomes and various factors. This however provides the field with fertile grounds for future research. Future studies can assess the applicability of findings in other countries and contexts, propose solutions for addressing the identified barriers and their root causes and define methods to assess the performance of GWs based on hard data and quantitative methods.
References Abastante, F. et al. (2019) ‘A new parsimonious AHP methodology : Assigning priorities to many objects by
comparing pairwise few reference objects’, Expert Systems With Applications. Elsevier Ltd, 127, pp. 109–120. doi: 10.1016/j.eswa.2019.02.036.
Akadiri, P. O., Olomolaiye, P. O. and Chinyio, E. a. (2013) ‘Multi-criteria evaluation model for the selection of sustainable materials for building projects’, Automation in Construction. Elsevier B.V., 30, pp. 113–125. doi: 10.1016/j.autcon.2012.10.004.
Ascione, F. et al. (2020) ‘Green walls, a critical review: Knowledge gaps, design parameters, thermal performances and multi-criteria design approaches’, Energies, 13(9). doi: 10.3390/en13092296.
Bavafa, A., Mahdiyar, A. and Marsono, A. K. (2018) ‘Identifying and assessing the critical factors for effective implementation of safety programs in construction projects’, Safety Science. doi: 10.1016/j.ssci.2018.02.025.
Bouzon, M. et al. (2016) ‘Identification and analysis of reverse logistics barriers using fuzzy Delphi method and AHP’, Resources, Conservation and Recycling. Elsevier B.V., 108, pp. 182–197. doi: 10.1016/j.resconrec.2015.05.021.
Bribach, C. (2011) ‘Vertical garden panel’, US, 59518, p. A1. Castiglia Feitosa, R. and Wilkinson, S. J. (2020) ‘Small-scale experiments of seasonal heat stress attenuation
through a combination of green roof and green walls’, Journal of Cleaner Production. Elsevier Ltd, 250, p. 119443. doi: 10.1016/j.jclepro.2019.119443.

549
Hindrances to the adoption of green walls: a hybrid fuzzy-based approach
Chen, Z. (2010) ‘A cybernetic model for analytic network process’, in Machine Learning and Cybernetics (ICMLC), 2010 …. IEEE, pp. 1914–1919. Available at: http://ieeexplore.ieee.org/xpls/abs_all.jsp?arnumber=5580528 (Accessed: 28 April 2016).
Duda, J. (2009) ‘Incentives and Barriers impacting the Implementation of Green Building Exteriors’, October, (October).
Dunnett, N. and Kingsbury, N. (2008) Planting green roofs and living walls. Timber press Portland, OR. Fleck, R. et al. (2020) ‘Characterisation of fungal and bacterial dynamics in an active green wall used for indoor
air pollutant removal’, Building and Environment. Elsevier Ltd, 179(May), p. 106987. doi: 10.1016/j.buildenv.2020.106987.
Hopkins, G. and Goodwin, C. (2011) Living architecture: green roofs and walls. Csiro Publishing. Jato-espino, D. et al. (2014) ‘A review of application of multi-criteria decision making methods in construction’,
Automation in Construction. Elsevier B.V., 45, pp. 151–162. doi: 10.1016/j.autcon.2014.05.013. Keprate, A. and Ratnayake, R. M. C. (2016) ‘Enhancing offshore process safety by selecting fatigue critical
piping locations for inspection using Fuzzy-AHP based approach’, Process Safety and Environmental Protection. Institution of Chemical Engineers, 102, pp. 71–84. doi: 10.1016/j.psep.2016.02.013.
Kontoleon, K. J. and Eumorfopoulou, E. A. (2010) ‘The effect of the orientation and proportion of a plant- covered wall layer on the thermal performance of a building zone’, Building and environment. Elsevier, 45(5), pp. 1287–1303.
Laurenz, J. et al. (2005) ‘Natural envelope. The green element as a boundary limit’, in Proceedings of the 2005 World Sustainable Building Conference, Tokyo, Japan, pp. 27–29.
Leal, J. E. (2020) ‘MethodsX AHP-express : A simpli fi ed version of the analytical hierarchy process method’, 7. doi: 10.1016/j.mex.2019.11.021.
Liberalesso, T. et al. (2020) ‘Green infrastructure and public policies: An international review of green roofs and green walls incentives’, Land Use Policy. Elsevier, 96(June 2019), p. 104693. doi: 10.1016/j.landusepol.2020.104693.
Mahdiyar, A. et al. (2016) ‘Probabilistic private cost-benefit analysis for green roof installation: A Monte Carlo simulation approach’, Urban Forestry and Urban Greening. Elsevier GmbH., 20, pp. 317–327. doi: 10.1016/j.ufug.2016.10.001.
Mahdiyar, A. et al. (2019) ‘A Prototype Decision Support System for Green Roof Type Selection: A Cybernetic Fuzzy ANP Method’, Sustainable Cities and Society, p. 101532. doi: https://doi.org/10.1016/j.scs.2019.101532.
Mahdiyar, A. et al. (2020) ‘Barriers to green roof installation: An integrated fuzzy-based MCDM approach’, Journal of Cleaner Production. Elsevier Ltd, p. 122365. doi: 10.1016/j.jclepro.2020.122365.
Manso, M. and Castro-Gomes, J. (2015) ‘Green wall systems: a review of their characteristics’, Renewable and Sustainable Energy Reviews. Elsevier, 41, pp. 863–871. doi: 10.1016/j.rser.2014.07.203.
Medl, A., Stangl, R. and Florineth, F. (2017) ‘Vertical greening systems – A review on recent technologies and research advancement’, Building and Environment. Elsevier Ltd, 125, pp. 227–239. doi: 10.1016/j.buildenv.2017.08.054.
Mohandes, S. R. et al. (2020) ‘Assessing construction labours’ safety level: a fuzzy MCDM approach’, Journal of Civil Engineering and Management, 26(2), pp. 175–188.
Mohandes, S. R. ., Zhang, X. and Mahdiyar, A. (2019) ‘Neurocomputing A comprehensive review on the application of artificial neural networks in building energy analysis’, Neurocomputing. Elsevier B.V., 340, pp. 55–75. doi: 10.1016/j.neucom.2019.02.040.
Mohandes, S. R. and Zhang, X. (2019) ‘Towards the development of a comprehensive hybrid fuzzy-based occupational risk assessment model for construction workers’, Safety Science. Elsevier, 115(October 2018), pp. 294– 309. doi: 10.1016/j.ssci.2019.02.018.
Ottelé, M. et al. (2011) ‘Comparative life cycle analysis for green façades and living wall systems’, Energy and Buildings. Elsevier, 43(12), pp. 3419–3429.
Perez, G. et al. (2011) ‘Green vertical systems for buildings as passive systems for energy savings’, Applied energy. Elsevier, 88(12), pp. 4854–4859.
Peri, G. et al. (2012) ‘The cost of green roofs disposal in a life cycle perspective: Covering the gap’, Energy.

550
Saeed Reza Mohandes, Amir Mahdiyar, Haleh Sadeghi, Sanaz Tabatabaee, M. Reza Hosseini
Elsevier Ltd, 48(1), pp. 406–414. doi: 10.1016/j.energy.2012.02.045. Perini, K. et al. (2011) ‘Greening the building envelope, façade greening and living wall systems’, Open Journal
of Ecology. Scientific Research Publishing, 1(01), p. 1. Prodanovic, V. et al. (2020) ‘Green wall height and design optimisation for effective greywater pollution
treatment and reuse’, Journal of Environmental Management. Elsevier Ltd, 261(September 2019), p. 110173. doi: 10.1016/j.jenvman.2020.110173.
Radić, M., Dodig, M. B. and Auer, T. (2019) ‘Green facades and living walls-A review establishing the classification of construction types and mapping the benefits’, Sustainability (Switzerland), 11(17), pp. 1–23. doi: 10.3390/su11174579.
Riley, B. (2017) ‘The state of the art of living walls: Lessons learned’, Building and Environment. Elsevier, 114, pp. 219–232.
Rosasco, P. and Perini, K. (2018) ‘Evaluating the economic sustainability of a vertical greening system: A Cost- Benefit Analysis of a pilot project in mediterranean area’, Building and Environment. Elsevier, 142(April), pp. 524–533. doi: 10.1016/j.buildenv.2018.06.017.
Saaty, T. (1996) Decision making with dependence and feedback: The analytic network process. RWS Publication. Available at: http://www.cs.put.poznan.pl/ewgmcda/pdf/SaatyBook.pdf (Accessed: 3 October 2015).
Shen, L., Zhang, Z. and Long, Z. (2017) ‘Significant barriers to green procurement in real estate development’, Resources, Conservation and Recycling. Elsevier B.V., 116, pp. 160–168. doi: 10.1016/j.resconrec.2016.10.004.
Smith, A. M. et al. (2010) ‘Plant biology (New York: Garland Science)’. Taylor & Francis, 664p. Tabatabaee, S. et al. (2019) ‘An assessment model of bene fi ts , opportunities , costs , and risks of green roof
installation : A multi criteria decision making approach’, Journal of Cleaner Production. Elsevier Ltd, 238, p. 117956. doi: 10.1016/j.jclepro.2019.117956.
Tang, Y. et al. (2014) ‘The selection of key technologies by the silicon photovoltaic industry based on the Delphi method and AHP ( analytic hierarchy process ): Case study of China’, Energy. Elsevier Ltd, 75, pp. 474–482. doi: 10.1016/j.energy.2014.08.003.
Terblanche, R. (2019) ‘Barriers of implementing green walls in the urban environment in developing countries’, (August), pp. 229–241. doi: 10.33796/waberconference2019.16.
Zhang, X. and Mohandes, S. R. (2020) ‘Occupational Health and Safety in green building construction projects : A holistic Z-numbers-based risk management framework’, Journal of Cleaner Production. Elsevier Ltd, 275, p. 122788. doi: 10.1016/j.jclepro.2020.122788.

551
The 54th International Conference of the Architectural Science Association (ANZAScA) 2020
How Young and Old Men and Women Perceive the Streets
A case study of Kuala Lumpur city center
Sherina Rezvaniour1, Norhaslina Hassan2, Amirhosein GhaffarianHoseini3 and Mahmoud Danaee3
1, 2, 4 University of Malaya, Kuala Lumpure, Malaysia [email protected]
{nhaslina2, mdanaee4}@um.edu.my 3 Auckland University of Technology, Auckland, New Zealand
Abstract: Kuala Lumpur is the fast-growing capital of Malaysia. It plans to become a fully pedestrian friendly city by the year 2025. Previous studies have implied that the street’s social and physical attributes may influence conscious perception and behaviour. However, some evidence show factors such as age, gender and ethnicity may alter the perception. Kuala Lumpur is a multi-cultural environment with many nationalities and ethnicities that use the streets next to each other. Despite this fact, less attention is devoted to explore these differences in the Malaysian context. In this study, we report the second phase of a study, which aims to identify diversity of users’ preferences towards the street attributes. A total of 384 men and women aged 15 to 55 and older have participated in this study. The Kruskal-Wallis test was used to examine whether there is any significant difference between the groups.
Keywords: Pedestrian perception; Street attributes; Walking experience; Urban space users
1. IntroductionStreets are vital components of the urban life. They transform the social and physical dynamics of a city (Ozbil, Gurleyen, Yesiltepe, & Zunbuloglu, 2019). The influence of a street’s social and physical attributes alters the users’ behaviour and decision making. It contributes to the sustainability and liveability of a healthy public space (Van Hecke et al., 2016). Nevertheless, to create a satisfactory perception and a friendly environment, it is essential to understand pedestrians’ needs. The issue is pedestrians’ preferences, needs and desires vary according to the sociodemographic of the place and subjective individual motivations (King, 2015; Murry & Isaacowitz, 2017). This has motivated a growing number of studies to explore the unique aspects of the human-environment interactions (Dougherty & Arbib, 2013). However, fewer studies have focused on the differences between users’ perception in the multicultural Malaysian context. Hence, this study has aimed to investigate whether there are any
Imaginable Futures: Design Thinking, and the Scientific Method. 54th International Conference of the Architectural Science Association 2020, Ali Ghaffarianhoseini, et al (eds), pp. 551–560. © 2020 and published by the Architectural Science Association (ANZAScA).

552
Sherina Rezvaniour, Norhaslina Hassan, Amirhosein Ghaffarianhoseini and Mahmoud Danaee
differences in pedestrians’ preferences in Malaysian urban streets. In different sections, the existing findings on the characteristics that are linked to either human biology or social construct are discussed. Eventually, the results shall be discussed and the possibilities of future implementations in urban design policies are explored.
2. Background of the studyThe environment we live in, influences many aspects of our perception and behaviour (de Paiva & Jedon, 2019). The complex nature of the environmental perception, makes its evaluation debatable and somewhat neglected (Gärling & Golledge, 1989; Kühne, 2019; Nasir, Lim, Nahavandi, & Creighton, 2014; Rodaway, 1994). In recent years, neuroimaging tools have granted enhanced methods to objectively evaluate the effect of the environmental sensory stimuli on the brain’s physiological changes. Passive and active detection of the stimuli causes subconscious brain sensorimotor activation which leads to muscle movements and planned actions (Ward, Silverman, & Villalobos, 2017) and since we are living in the era of urbanization, most of our activities take place within the built environment that is filled with sensory stimuli (Dzebic, Perdue, & Ellard, 2013). Thus, the subconscious influence of the physical environment cannot be undermined. However, to fully grasp an individuals’ mental image, we should consider the memory of past experiences, cultural background and personal motivations (de Paiva & Jedon, 2019; Jacobsen, Hvitved, & Andersen, 2014; Markus et al., 1991). Review of the existing environmental findings show how frequently users’ preferences vary within each individual and each sociodemographic context (King, 2015; Murry & Isaacowitz, 2017). To further discuss this matter we need to review the fundamental differences between individuals as pedestrians which may contribute to their perception of streets.
2.1. Nature or Nurture? Based on the human biology, there are certain physical features of the environment that primarily attract our attention (Christopher Alexander, Sara Ishikawa, 1977). It is believed that our innate biological construct and the essential need for survival are both presenting such reaction (Hollander & Foster, 2016; Mehaffy, Kryazheva, Rudd, & Salingaros, 2020; Nanda, Pati, Ghamari, & Bajema, 2013; Tokhmehchian & Gharehbaglou, 2019). However, when it comes to the environmental experience, our emotional reaction plays a crucial role. From the time the fetus is created in the mother’s womb, the senses start to develop and at birth the subconscious component of the emotional response is matured (Rouby, Fournel, & Bensafi, 2016). Through the constant development of the senses and the effect of the environment we are nurtured in, our emotional regulation increases (Viding, Sebastian, & McCrory, 2013). But as we reach the middle-age threshold, our sensory and cognitive processing starts to decline (Humes, 2015). Unlike younger users, older adults rely on multiple sources of information and struggle to weigh the sensory data (de Dieuleveult, Siemonsma, van Erp, & Brouwer, 2017). They easily experience mental fatigue in a demand focused environment (Tilley, Neale, Patuano, & Cinderby, 2017). In comparison, senior adults have higher tendencies to visit the green spaces and seek higher aesthetic value in nature (Kaczynski, Potwarka, Smale, & Havitz, 2009; King, 2015; Ode Sang, Knez, Gunnarsson, & Hedblom, 2016).
This type of variations can be seen between genders as well. Generally, males and females have slight differences in their early information processing (Halpern, 2013). Moreover, some studies found men and women have different sensory hypersensitivity (Dixon et al., 2016; Ohla & Lundström, 2013;

553
How Young and Old Men and Women Perceive the Streets
Oliveira-Pinto et al., 2014; Yang, Moon, & Kim, 2018). When it comes to the environmental perception, gender preferences vary circumstantially. Evidently, men and women preferences of the aesthetics, recreational walking or mobility walking, shifts in various geographical locations. (Humpel, Owen, Iverson, Leslie, & Bauman, 2004; Pelclová, Frömel, & Cuberek, 2013; Shibata, Oka, Harada, Nakamura, & Muraoka, 2009). Moreover, females express more fear than males, albeit sociodemographic of the place and its crime rate may play a significant role here (Adlakha & Parra, 2020; Bahrainy & Khosravi, 2013; Maruthaveeran & Van den Bosh, 2015; Pedersen & Johansson, 2018). In general, humans are biological organisms that are developed in a social and physical environment (Halpern, 2013), but the environment’s influence is sometimes too deep that can change both brain physiology and conscious perception (de Paiva & Jedon, 2019; Lederbogen et al., 2011). Hence, it is hard to define a distinct border between the effects of the nature and nurture. Evidently, there is a link between information processing and culture, which the latter one might be the main predictor of holistic or analytical data processing (Kastanakis & Voyer, 2014). This may be the reason for preference variation within different contexts. For instance, while urban parks generally associate with higher restorative and relaxation effects (Zhang, Liu, & Li, 2019), in Malaysian context, users have demonstrated avoidance behaviour towards it. The participants elaborated the long vegetation, its enclosure and risk of the crime as the main reasons for their fear and avoidance (Hashim, Thani, Jamaludin, & Yatim, 2016; Maruthaveeran & Van den Bosh, 2015). More specifically, users who belong to smaller racial groups show higher concerns about the environment (King, 2015; Murry & Isaacowitz, 2017). Currently, the cause of the ethnicity effect on the divergent preferences is not yet clear. Theories suggest the unique social context of the ethnic groups, combined with the generalized social norms; may be the contributor to perception variation (Medina, DeRonda, Ross, Curtin, & Jia, 2019).
3. MethodsIn order to explore the users’ preferences towards the sensory exposure of the street attributes, a mixed methodology was executed in two main phases (Figure 1).
The first phase of the study was a prerequisite step to the current research, which its steps and results are briefly reported here. The main question that the second and current phase of the study aimed to determine, was to find out whether the pedestrians’ preferences of the street’s sensory stimuli, differs based upon their age, gender and ethnicity.
Figure 1 Research phases and steps
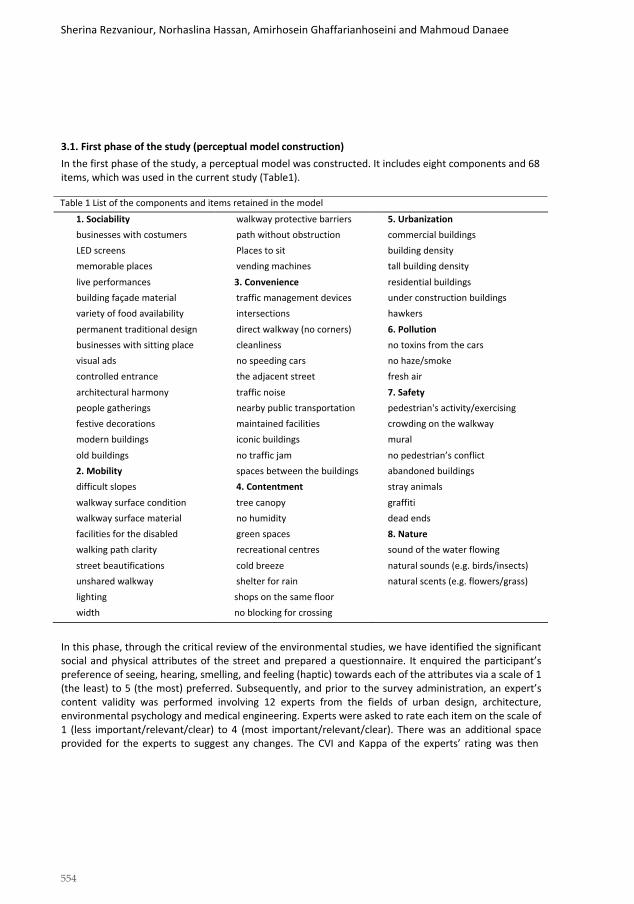
554
Sherina Rezvaniour, Norhaslina Hassan, Amirhosein Ghaffarianhoseini and Mahmoud Danaee
3.1. First phase of the study (perceptual model construction) In the first phase of the study, a perceptual model was constructed. It includes eight components and 68 items, which was used in the current study (Table1).
Table 1 List of the components and items retained in the model
1. Sociability walkway protective barriers 5. Urbanizationbusinesses with costumers path without obstruction commercial buildings LED screens Places to sit building density memorable places vending machines tall building density live performances 3. Convenience residential buildings building façade material traffic management devices under construction buildingsvariety of food availability intersections hawkers permanent traditional design direct walkway (no corners) 6. Pollution businesses with sitting place cleanliness no toxins from the carsvisual ads no speeding cars no haze/smoke controlled entrance the adjacent street fresh air architectural harmony traffic noise 7. Safety people gatherings nearby public transportation pedestrian's activity/exercisingfestive decorations maintained facilities crowding on the walkway modern buildings iconic buildings mural old buildings no traffic jam no pedestrian’s conflict 2. Mobility spaces between the buildings abandoned buildings difficult slopes 4. Contentment stray animals walkway surface condition tree canopy graffiti walkway surface material no humidity dead ends facilities for the disabled green spaces 8. Nature walking path clarity recreational centres sound of the water flowing street beautifications cold breeze natural sounds (e.g. birds/insects)unshared walkway shelter for rain natural scents (e.g. flowers/grass) lighting shops on the same floorwidth no blocking for crossing
In this phase, through the critical review of the environmental studies, we have identified the significant social and physical attributes of the street and prepared a questionnaire. It enquired the participant’s preference of seeing, hearing, smelling, and feeling (haptic) towards each of the attributes via a scale of 1 (the least) to 5 (the most) preferred. Subsequently, and prior to the survey administration, an expert’s content validity was performed involving 12 experts from the fields of urban design, architecture, environmental psychology and medical engineering. Experts were asked to rate each item on the scale of 1 (less important/relevant/clear) to 4 (most important/relevant/clear). There was an additional space provided for the experts to suggest any changes. The CVI and Kappa of the experts’ rating was then

555
How Young and Old Men and Women Perceive the Streets
calculated. Based on both qualitative and quantitative analysis, necessary changes were administered on the questionnaire. The form was then distributed to (n=200) pedestrians without serious sensory difficulty. Ultimately, an exploratory factor analysis (EFA) was performed on the results to identify the components of the model and remove the unrelated items from the model.
3.2. Current study (Second phase of the study) In this phase the model was tested to identify whether the preferences would remain the same across all categories of age, gender, and ethnicity.
3.2.1. Data collection The questionnaire form was distributed into three busy streets of Kuala Lumpur, Malaysia (n=384). The participants were pedestrians using the street without any major sensory difficulty. They were approached randomly Each participant spent about 15 minutes to complete the form while the researcher monitored the participants to answer all questions without any missing values.
3.2.2. Sociodemographic of the Studied Area We selected three prominent economical and social streets inside the metropolitan area of Kuala Lumpur. These streets were selected for two main reasons: Firstly, for the diverse sociodemographic of the users and secondly, for the presence of social and physical attributes, which were addressed in the questionnaire. This helped the participants to directly relate to the questions in a real-life environment. The middle aged and elderly were less keen to participate and brought up excuses such as lack of time, prior engagements, or lack of interest for their refusal. Hence, most of the respondents were younger Malay men and women. However, the distribution of the age and the racial population were more or less in line with the estimated statistics provided by the Malaysian department of statistics (DOSM 2019). The international participants were those who lived as students or expats in Malaysia. Therefore, all of them acknowledged prior familiarization with the streets (Table 2).
Table 2 the sociodemographic of the participants based on gender, age, race and nationality
Age (%) Gender (%) Racial groups (%) Nationality (%)
15 -24 43.5 male 58.3 Malay 76 Malaysian 91.1 25 - 34 36.5 female 41.7 Chinese 11.5 International 8.9 35 - 44 12.5 Indian 3.6 45 - 54 4.2 Other 3.38 55 and older 3.4
3.3. Data Analysis A non-parametric Kruskal-Wallis test was performed to analyse the differences between the mean values of the components within each category. The statistical analysis was performed by SPSS and only the p value < 0.05 was considered significant. Pairwise comparison was only available for the categories, which included more than two groups including ‘age’ and ‘Ethnicity’.

556
Sherina Rezvaniour, Norhaslina Hassan, Amirhosein Ghaffarianhoseini and Mahmoud Danaee
4. ResultsThe results confirmed that significant preference differences exist in some categories including age and ethnicity. No differences were identified between genders and nationalities.
4.1. Differences between Age groups The result shows the preferences towards the ‘mobility’ significantly differs between age groups with (Test statistic = 18.45, d.f. = 4, P < 0.001) (Figure 2).
Figure 2 The independent sample test view of mobility in 'age'
The pairwise comparison shows there is a significant difference between the youngest group (15 - 24) and young adults (25 - 34) (test statistic = - 37.99, p = 0.003). A comparison of the mean values shows that pedestrians belonging to the (15 - 24) age group have the least preference towards the street mobility (Table 3).
Table 3 comparison of mean value for ‘mobility’ component Age Mean Std. Deviation 15-24 3.89* 0.67 25-34 4.11* 0.75 35-44 4.14 0.77 45-54 4.37 0.51 55 and older 4.39 0.63
4.2. Differences between various Ethnicities Although no significant differences were identified between internationals and Malaysians, the results show there are significant differences between Malaysian ethnicities in terms of ‘sociability’ (Test statistic = 13.02, d.f. = 3, P < 0.005) and ‘urbanization’ (Test statistic = 16.27, d.f. = 3, P < 0.001) (Figure 3).

557
How Young and Old Men and Women Perceive the Streets
The pairwise comparison shows that there are significant differences towards the ‘sociability’ between the Chinese and Malays (test statistic = 60.19, p = 0.001) as well as Chinese and others (test statistic = - 83.87, p = 0.004). Comparison of the mean value also shows that Chinese pedestrians have the least preference towards street sociability. There is also a significant difference towards the ‘urbanization’ between Chinese and Malays (test statistic = 70.18, p = 0.000). The mean value comparison shows Chinese pedestrians have the least preference towards the urbanization features in the street (Table 4).
Table 4 comparison of mean value for ‘sociability’ and ‘urbanization’ Sociability Ethnicity Mean Std. Deviation Malay 4.12* 0.65 Chinese 3.81* 0.59 Indian 3.93 0.81 Other 4.17* 0.67 Urbanization Ethnicity Mean Std. Deviation Malay 3.70* 0.74 Chinese 3.21* 0.79 Indian 3.69 0.62
5. Conclusion
Other 3.52 0.91
Previous studies provided evidence that environmental preferences vary based upon user’s gender, age and ethnicity. In this study, we aimed to identify whether similar variations exist in Malaysian urban context. Our results confirmed that in Kuala Lumpur, pedestrians’ preference differ in some cases. Nonetheless, there were some unexpected findings, which are discussed accordingly. Other studies found divergent gender preferences of environmental satisfaction, aesthetics and safety features (Adlakha & Parra, 2020). Surprisingly and in contrast, we did not find any significant differences between the genders. However, we found preference differences among ‘age’ and ‘ethnicity’ groups. Youngest participants show less preference towards the sensory presence of the ‘mobility’ features. At this point, the reason for this is unclear, albeit some possibilities could be speculated. Compared to the teens and young adults, other age groups are more occupied with their daily errands. It is possible that the absence of the features that consume more time and energy, is what elder users seek in the streets. Furthermore, the comparison between the mean values shows that the participant’s preference for the
Figure 3 The independent sample test view of Sociability and Urbanization in the

558
Sherina Rezvaniour, Norhaslina Hassan, Amirhosein Ghaffarianhoseini and Mahmoud Danaee
‘mobility’ features gradually increases as they become older. Hence, it is fair to conclude as older the users become, they are keener to consciously seek for the features that facilitate the ease of walking and bodily safety. Unlike some other studies that have found age difference towards nature preferences, we did not find any significant divergence between the age groups. Subsequently, our results suggest preference differences towards the ‘sociability’ and ‘urbanization’ users with different ethnicity. The differences observed for both features and ‘sociability’ in particular, suggest the influence of the psychological dimension on perception. Generally, humans find pride, and connect with place via their unique cultural characteristics that might even dominate the social norms and the way they perceive the environment (Kirk, Lösch, Berlin, Lösch, & Berlin, 1963). People desire an environment that corresponds to their internal aesthetic preferences, which is affected by themselves or the cultural habits of their peers (Kastanakis & Voyer, 2014) Hence, as it was expected similar ethnic differences exist in Malaysian context.
Finally, it is important to note that these findings need to be tested with a higher number of participants and in other settings (street types, etc.). It is also recommended for further studies to examine both subjective and objective interactions between participants’ preferences, emotional reactions, and decision making. This would grant feasible and extensive data on pedestrians’ psychological traits, which can lead them to use or avoid a place. After all, street is an excellent arena, which enhances the social dynamics of the public environment. But it requires not only one, but multiple perspectives to be in place to consider the needs of all types of pedestrians and prevent the neglection of those who are the most vulnerable users.
6. AcknowledgementThis paper is based on the study that is done in partial fulfilment of an extensive empirical study, which is funded by FRGS FP059-2018A program.
References Adlakha, D., & Parra, D. C. (2020). Mind the gap: Gender differences in walkability, transportation and physical activity in urban India. Journal of Transport and Health, 18(August 2019), 100875. https://doi.org/10.1016/j.jth.2020.100875 Bahrainy, H., & Khosravi, H. (2013). The impact of urban design features and qualities on walkability and health in under-construction environments: The case of Hashtgerd New Town in Iran. Cities, 31, 17–28. https://doi.org/10.1016/j.cities.2013.01.001 Christopher Alexander, Sara Ishikawa, M. S. (1977). A Pattern Language: Towns, Buildings, Construction (Cess Center for Environmental). Oxford University Press. New York, New York, USA. Retrieved from https://epdf.pub/a-pattern- language-towns-buildings-construction-cess-center-for-environmental de Dieuleveult, A. L., Siemonsma, P. C., van Erp, J. B. F., & Brouwer, A. M. (2017). Effects of aging in multisensory integration: A systematic review. Frontiers in Aging Neuroscience, 9(MAR), 1–14. https://doi.org/10.3389/fnagi.2017.00080 de Paiva, A., & Jedon, R. (2019). Short- and long-term effects of architecture on the brain: Toward theoretical formalization. Frontiers of Architectural Research, 8(4), 564–571. https://doi.org/10.1016/j.foar.2019.07.004 Dixon, E. A., Benham, G., Sturgeon, J. A., Mackey, S., Johnson, K. A., & Younger, J. (2016). Development of the Sensory Hypersensitivity Scale (SHS): a self-report tool for assessing sensitivity to sensory stimuli. Journal of Behavioral Medicine, 39(3), 537–550. https://doi.org/10.1007/s10865-016-9720-3 Dougherty, B. O., & Arbib, M. A. (2013). The evolution of neuroscience for architecture: introducing the special issue. Intelligent Buildings International, 5(sup1), 4–9. https://doi.org/10.1080/17508975.2013.818763

559
How Young and Old Men and Women Perceive the Streets
Dzebic, V., Perdue, J. S., & Ellard, C. G. (2013). The influence of visual perception on responses towards real-world environments and application towards design. Intelligent Buildings International, 5(SUPPL1), 29–47. https://doi.org/10.1080/17508975.2013.807766 Gärling, T., & Golledge, R. G. (1989). Environmental Perception and Cognition. In E. H. Zube & G. T. Moore (Eds.), Advance in Environment, Behavior, and Design (pp. 203–236). Boston, MA: Springer US. https://doi.org/10.1007/978-1-4613-0717-4_7 Halpern, D. F. (2013). Sex Differences in Cognitive Abilities. Psychology Press.https://doi.org/10.4324/9780203816530 Hashim, N. H. M., Thani, S. K. S. O., Jamaludin, M. A., & Yatim, N. M. (2016). A Perceptual Study on the Influence of Vegetation Design Towards Women’s Safety in Public Park. Procedia - Social and Behavioral Sciences, 234, 280–288. https://doi.org/10.1016/j.sbspro.2016.10.244 Hollander, J., & Foster, V. (2016). Brain responses to architecture and planning: a preliminary neuro-assessment ofthe pedestrian experience in Boston, Massachusetts. Architectural Science Review, 59(6), 474–481. https://doi.org/10.1080/00038628.2016.1221499 Humes, L. E. (2015). Age-Related Changes in Cognitive and Sensory Processing: Focus on Middle-Aged Adults. American Journal of Audiology, 24(2), 94–97. https://doi.org/10.1044/2015_AJA-14-0063 Humpel, N., Owen, N., Iverson, D., Leslie, E., & Bauman, A. (2004). Perceived environment attributes, residentiallocation, and walking for particular purposes. American Journal of Preventive Medicine, 26(2), 119–125. https://doi.org/10.1016/j.amepre.2003.10.005 Jacobsen, C. B., Hvitved, J., & Andersen, L. B. (2014). Command and motivation: How the perception of externalinterventions relates to intrinsic motivation and public service motivation. Public Administration, 92(4), 790–806. https://doi.org/10.1111/padm.12024 Kaczynski, A. T., Potwarka, L. R., Smale, B. J. A., & Havitz, M. F. (2009). Association of Parkland proximity withneighborhood and park-based physical activity: Variations by gender and age. Leisure Sciences, 31(2), 174–191. https://doi.org/10.1080/01490400802686045 Kastanakis, M. N., & Voyer, B. G. (2014). The effect of culture on perception and cognition: A conceptual framework. Journal of Business Research, 67(4), 425–433. https://doi.org/10.1016/j.jbusres.2013.03.028 King, K. E. (2015). Chicago residents’ perceptions of air quality: objective pollution, the built environment, andneighborhood stigma theory. Population and Environment, 37(1). https://doi.org/10.1007/s11111-014-0228-x Kirk, W., Lösch, A., Berlin, I., Lösch, A., & Berlin, I. (1963). Problems of Geography cultural, 48(4), 357–371. Kühne, O. (2019). Landscape Theories. RaumFragen: Stadt – Region – Landschaft. Wiesbaden: Springer Fachmedien Wiesbaden. https://doi.org/10.1007/978-3-658-25491-9 Lederbogen, F., Kirsch, P., Haddad, L., Streit, F., Tost, H., Schuch, P., … Meyer-Lindenberg, A. (2011). City living andurban upbringing affect neural social stress processing in humans. Nature, 474(7352), 498–501. https://doi.org/10.1038/nature10190 Markus, H. R., Cross, S., Fiske, A., Gilligan, C., Givon, T., Kanagawa, C., … Trian-, H. (1991). Culture and the Self:Implications for Cogniti. Psychological Review, 98(2), 224–253. Retrieved fromhttp://psycnet.apa.orgjournals/rev/98/2/224 Maruthaveeran, S., & Van den Bosh, C. K. (2015). Fear of crime in urban parks - What the residents of Kuala Lumpur have to say? Urban Forestry and Urban Greening, 14(3), 702–713. https://doi.org/10.1016/j.ufug.2015.05.012 Medina, V., DeRonda, A., Ross, N., Curtin, D., & Jia, F. (2019). Revisiting Environmental Belief and Behavior Among Ethnic Groups in the U.S. Frontiers in Psychology, 10(MAR), 1–6. https://doi.org/10.3389/fpsyg.2019.00629 Mehaffy, M. W., Kryazheva, Y., Rudd, A., & Salingaros, N. A. (2020). A New Pattern Language for Growing Regions: Places, Networks, Processes A. Entre nous (Copenhagen, Denmark). Murry, M. W. E., & Isaacowitz, D. M. (2017). Age differences in emotion perception. International Journal ofBehavioral Development, 41(5), 597–604. https://doi.org/10.1177/0165025416667493 Nanda, U., Pati, D., Ghamari, H., & Bajema, R. (2013). Lessons from neuroscience: form follows function, emotions follow form. Intelligent Buildings International, 5(sup1), 61–78. https://doi.org/10.1080/17508975.2013.807767 Nasir, M., Lim, C. P., Nahavandi, S., & Creighton, D. (2014). A genetic fuzzy system to model pedestrian walking path in a built environment. Simulation Modelling Practice and Theory, 45, 18–34.

560
Sherina Rezvaniour, Norhaslina Hassan, Amirhosein Ghaffarianhoseini and Mahmoud Danaee
https://doi.org/10.1016/j.simpat.2014.03.002 Ode Sang, Å., Knez, I., Gunnarsson, B., & Hedblom, M. (2016). The effects of naturalness, gender, and age on how urban green space is perceived and used. Urban Forestry and Urban Greening, 18, 268–276. https://doi.org/10.1016/j.ufug.2016.06.008 Ohla, K., & Lundström, J. N. (2013). Sex differences in chemosensation: Sensory or emotional? Frontiers in Human Neuroscience, 7(SEP), 1–11. https://doi.org/10.3389/fnhum.2013.00607 Oliveira-Pinto, A. V., Santos, R. M., Coutinho, R. A., Oliveira, L. M., Santos, G. B., Alho, A. T. L., … Lent, R. (2014). Sexual dimorphism in the human olfactory bulb: Females have more neurons and glial cells than males. PLoS ONE, 9(11). https://doi.org/10.1371/journal.pone.0111733 Ozbil, A., Gurleyen, T., Yesiltepe, D., & Zunbuloglu, E. (2019). Comparative associations of street network design, streetscape attributes and land-use characteristics on pedestrian flows in peripheral neighbourhoods. International Journal of Environmental Research and Public Health, 16(10). https://doi.org/10.3390/ijerph16101846 Pedersen, E., & Johansson, M. (2018). Dynamic pedestrian lighting: Effects on walking speed, legibility and environmental perception. Lighting Research and Technology, 50(4), 522–536. https://doi.org/10.1177/1477153516684544 Pelclová, J., Frömel, K., & Cuberek, R. (2013). Gender-Specific Associations between Perceived Neighbourhood Walkability and Meeting Walking Recommendations When Walking for Transport and Recreation for Czech Inhabitants over 50 Years of Age. International Journal of Environmental Research and Public Health, 11(1), 527– 536. https://doi.org/10.3390/ijerph110100527 Rodaway, P. (1994). SENSUOUS GEOGRAPHIES. (Intergovernmental Panel on Climate Change, Ed.) (Vol. 53). Abingdon, UK: Taylor & Francis. https://doi.org/10.4324/9780203306864 Rouby, C., Fournel, A., & Bensafi, M. (2016). The Role of the Senses in Emotion. In H. L. Meiselman (Ed.), Emotion Measurement (pp. 65–81). Elsevier. https://doi.org/10.1016/B978-0-08-100508-8.00003-5 Shibata, A., Oka, K., Harada, K., Nakamura, Y., & Muraoka, I. (2009). Psychological, social, and environmental factors to meeting physical activity recommendations among Japanese adults. International Journal of Behavioral Nutrition and Physical Activity, 6, 60. https://doi.org/10.1186/1479-5868-6-60 Tilley, S., Neale, C., Patuano, A., & Cinderby, S. (2017). Older People’s Experiences of Mobility and Mood in an Urban Environment: A Mixed Methods Approach Using Electroencephalography (EEG) and Interviews. International Journal of Environmental Research and Public Health, 14(2), 151. https://doi.org/10.3390/ijerph14020151 Tokhmehchian, A., & Gharehbaglou, M. (2019). Biophilic perception in urban green spaces (Case study: El Gölü Park, Tabriz). International Journal of Urban Sciences, 23(4), 568–585. https://doi.org/10.1080/12265934.2019.1568284 Van Hecke, L., Deforche, B., Van Dyck, D., De Bourdeaudhuij, I., Veitch, J., & Van Cauwenberg, J. (2016). Social and physical environmental factors influencing adolescents’ physical activity in urban public open spaces: A qualitative study using walk-along interviews. PLoS ONE, 11(5), 1–25. https://doi.org/10.1371/journal.pone.0155686 Viding, E., Sebastian, C. L., & McCrory, E. J. (2013). Development of Affective Circuitry. In J. Armony & P. Vuilleumier (Eds.), The Cambridge Handbook of Human Affective Neuroscience (pp. 611–634). Cambridge: Cambridge University Press. https://doi.org/10.1017/CBO9780511843716.034 Ward, D., Silverman, D., & Villalobos, M. (2017). Introduction: The Varieties of Enactivism. Topoi, 36(3), 365–375. https://doi.org/10.1007/s11245-017-9484-6 Yang, W., Moon, H. J., & Kim, M. J. (2018). Combined effects of short-term noise exposure and hygrothermal conditions on indoor environmental perceptions. Indoor and Built Environment, 27(8), 1119–1133. https://doi.org/10.1177/1420326X17703774 Zhang, T., Liu, J., & Li, H. (2019). Restorative Effects of Multi-Sensory Perception in Urban Green Space: A Case Study of Urban Park in Guangzhou, China. International Journal of Environmental Research and Public Health, 16(24), 4943. https://doi.org/10.3390/ijerph16244943

561
The 54th International Conference of the Architectural Science Association (ANZAScA) 2020
Human response to greeneries in public spaces
Victor Momoh1, Dorcas, A. Ayeni2 Ali GhaffarianHoseini3, and Funmilayo Ebun Rotimi3 Frankfurt University of Applied Sciences, Frankfurt am Main, Germany1
Federal University of Technology, Akure, Nigeria2 Auckland University of Technology, Auckland, New Zealand3
[email protected], [email protected], [email protected], [email protected]
Abstract: Cities globally continue to lose contact with nature due to urbanization and consequently are experiencing a great level of thermal discomfort and a rise in global warming. The study area, Lokoja, is a developing city, experiencing massive removal of the green covers to allow for further developments. This study intends to improve the comfort level of public spaces in Lokoja through greeneries and inform stakeholders of its benefits. The study was carried out using the qualitative method of research that involved an in-depth study of literature. Also, two case studies of public spaces in Abuja and Obudu Plateau was conducted to elicit information on the impact of greeneries on their environment. It was discovered that Landscape features such as green facades, roof gardens, indoor plants, extensive lawn areas, and other green covers were identified to be beneficial to public spaces and can improve the comfort level in an urban setting. The study, therefore, emphasized the need for green public space development in Lokoja, and encouraged the habit of nature conservation in public spaces and nurturing of the existing vegetation as a concept to improve the environmental quality of the city.
Keywords: Green architecture; Greenery; Landscape; Thermal comfort.
Introduction Rapid urbanization and population growth on the global scene has led to an increase in building construction to meet up with the rising demand (Momoh and Folorunso, 2018). The effect of this has caused a shortage of green spaces in urban areas bringing about an alarming rate of environmental issues such as the Urban Heat Island (UHI) effect (Taib and Abdullah, 2012). It has also brought about overcrowding and pollution, which according to Basorun and Ayeni (2013) defines the city as dysfunctional urban Centers, making the environment vulnerable to climatic attacks. Nigeria is located in the tropical region of Africa, experiencing rapid climatic changes as development in the urban sectors proceed Lokoja, the capital of Kogi state is an example of such cities whose vegetation, wetland resources, water bodies, and mountainous terrain are threatened due to their continuous reduction in the areal extent over time while the built environment expanded tremendously (Adeoye 2012). In the long run, it leads to the depletion of the ozone layer as the city covers are been removed, thereby exposing it to the harsh weather, leading to significant human health problems such as heatstroke and prevalence of infectious diseases, which makes living unbearable and threatens the existing character
Imaginable Futures: Design Thinking, and the Scientific Method. 54th International Conference of the Architectural Science Association 2020, Ali Ghaffarianhoseini, et al (eds), pp. 561–569. © 2020 and published by the Architectural Science Association (ANZAScA).

562
Victor Momoh, Dorcas, A. Ayeni2 Ali GhaffarianHoseini, and Funmilayo Ebun Rotimi
and the Outstanding Universal Value of World Heritage Site List (Omale et al, 2017; Sato et. al., 2016; Shamsuddina et al, 2012).
This effect can be mitigated through the practice of green architecture and the habit of conservation and development of nature reserve rather than destroying them (Steiner, 2014; Olorunfemi et al. 2016). This paper aims to improve the comfort level of public spaces in a city through greeneries and inform stakeholders of its benefits. It is achieved by literature study of the benefit of greeneries in the concerning space, and two case studies, evaluating the response of users of the public spaces, identifying the prospective benefits of greeneries in these locations, and determining how the concepts could be implemented in Lokoja and other related regions.
2.0 Literature review
2.1 Sustainability in Green Conservation
Sustainability presents a new attitude of looking at the world. Bromberek (2009) maintained that Sustainability, also known as "Green Architecture” is a concept increasingly used as a measure to evaluate the contemporary built environment which is an important concept in today’s urban planning. It is an approach to revitalize the continued depletion and degradation of the natural environment through green conservation (Ayeni 2012). It is therefore essential to ensure that sustainability is imbibed as a culture in all endeavors especially in the organization of spaces and in the reform of our environment by our choice of building technique and its environmental consequences (Momoh and Folorunso, 2018) to achieve significant value. According to Burcu (2015), green architecture defines an understanding of environment-friendly architecture and addressed some universal issues such as energy efficiency, water-saving strategies, ventilation system, landscape planning, alternative power supply, materials, and recycling or reuse of environmentally friendly materials.
Alteration of climatic conditions and the urban heat island effect (UHI) are consequences of increased human population and activities in urban zones. (Colunga et al, 2015). Urban heat island is a phenomenon describing the difference in urban and rural heat due to high temperature, whose intensity is lower in small cities than the bigger cities (AboElata, 2017; Alves and Lopes, 2017). Colunga et al, (2015) further stated that vegetation has a significant effect on the mitigation of urban heat island (UHI), which is evident in the claim of AboElata (2017) that rural communities’ experiences low effect of UHI as a result of the existence of natural features such as vegetation than the urban area.
Man depends on the environment for survival and sustenance, as such, the environment must be protected from all forms of degradation (Ayeni, 2018). In today’s challenge of energy-economic crisis in developing cities, the introduction of green spaces in public areas and residences will help to reduce UHI effect and building’s cooling load, and allow the passive approach of green design by the means of natural ventilation often designed in the form of sky court, rooftop garden, and green terrace, as mentioned by Taib and Abdullah (2012).
2.2 Greeneries and the environment
According to Christoph et al (2014), urban green space is vital in fulfilling people’s nature needs. Lokoja presently experiences progressive urbanization, which brings about a gradual loss of contact with nature as development proceeds which causes a potential loss of daily contact with nature, diminishing access to the wide range of its associated health benefits such as surface cooling, regional cooling, and reduced

563
Human response to greeneries in public spaces
heat in hot weather, shade provision, lower building energy consumption, and an improved outdoor boundary condition (Cox et al, 2017; Armson et al, 2012). Qviström (2016) identified the importance of nature to a community and stated that it is a priceless asset for play, exercise, relaxation, outdoor and leisure but that nature is not accessible to everyone, and gradually relinquished as development persist (such as Lokoja) and therefore suggested that natural parks should be created and strategically located for use by communities. Ignatieva et al (2017) in their study on the lawn as a social and cultural phenomenon, also emphasized the use of open space design to create recreation and sports opportunities. It can, therefore, be assumed that vegetation in the built environment is a means of improving the quality of life of individuals or groups of people both physically or psychologically.
The benefit of greenery in the environment is well explored by Song et al, (2017) in the use of the Forest environment as a place for recreation and health promotion. In this case, the green environment helped to promote relaxation and improved the health of observers with hypertension by a decrease in heart rate, which according to Christoph et al, (2014) defines it as vital in fulfilling people’s nature needs. This assertion concurs with the claim of Mohd Hussain, et al (2014) that landscape can bring mental and physical benefits to people. As such, should be giving more attention in the built environment and developing cities.
2.3 The indoor and outdoor space
In areas of high-density development, the design of the landscape of a place offers a psychological- retreat space for users to feel comfortable (Taib and Abdullah, 2012). The most dominant landscape elements in George Town are the water bodies where the city is located by the sea (Shamsuddina et al 2012) which could be argued to have improved the city’s performance and appearance. Lohr (2010) identified the essence of plants in human surroundings and noted that indoor and outdoor plants improving users’ health and well-being. Also, results of a study of elderly residents in an assisted living facility who participated in a project to grow indoor plants in their rooms observed a significantly improved feeling of health after working with the indoor plants (Collins and O’Callaghan, 2008).
Indoor Plants naturally, contribute to a cleaner, healthier air for breathing, thus improving our well- being and comfort (Chowdhury, 2019). Indoor plants also make our surroundings more pleasant, offers a relaxing feel, help to maintain humidity, increase productivity, scrub the air off dangerous chemicals and improve productivity and mental fatigue as people recover from stress more quickly when exposed to nature than urban scenes (Lohr, 2010; Satterfield, 2009). This becomes a point of relief for busy urban cities where people could take a break from the daily hustle and bustle to enjoy their contact with nature and on the larger scope redefining the cityscape and its environmental impact.
2.4 Recreation and landscape
Landscape design has proven beneficial to the built environment and the quality of life thereof. It ensures the continuous human-nature interaction through topographical planning, vegetation and associated plants and soil, water bodies, and their spatial configuration (Mohd Hussain, et al 2014). In the last few decades, the ability of landscaping features to improve the energy efficiency of residential, business, and public buildings has created increased attention both in the scientific and professional communities. According to Ignatieva et al, (2017) modern urban landscape and the concept of recreation are related mutually since an urban green space with a distinct landscape planning attracts recreational activities for public use. It is an attempt to bring people closer to nature and its diverse

564
Victor Momoh, Dorcas, A. Ayeni2 Ali GhaffarianHoseini, and Funmilayo Ebun Rotimi
benefits while they recreate. It has been described by Mohd Hussain, et al (2014) as a means to create a “sense of place” to the housing area, as such, adding great value to housing development and positive human coexistence. This concept is adopted in public spaces in Shanghai, the urban park in Kremlin- Bicêtre, Obudu Resort center in Nigeria, and other public spaces around the world. Public spaces could be enhanced by the landscape in function, appearance, and adverse environmental effect. It is described by Ayeni (2012) as an essential part of tourism policy and should, therefore, be given the desired attention. Landscape in the form of greeneries could be a major attraction in Lokoja and a means to mitigate the environmental effect of the harsh weather, by annexing the potential of the large water body, existing vegetation, or the undulated terrain of the city to develop a nature park with well- planned landscape for recreation and other environmental gains.
This however attracts an uplift in house and infrastructure prices, which varies according to the type of landscape adopted. For example, Mohd Hussain, et al (2014) explained that house price and value are influenced by factors such as open spaces, water bodies, street trees, and parks, which according to Richard and Ryan (2018) and AboElata (2017) requires a strategy to know homebuyer’s preferences, and the manner of tree planting in terms of scale and layout, to provide shades and allow a chance of heat escape at night, therefore ensuring effective urban planning.
3.0 Research methodology
3.1 Study area
Lokoja is located between latitude 7o 45΄27.56΄΄ and 7o 51΄04.34΄΄N and longitude 6o 41΄55.64΄΄ and 6o 45΄36.58΄΄E, in the present North Central of the Federal Republic of Nigeria with an estimated landmass of 63.82 sq. km (Adeoye, 2012). It is the capital of Kogi state and also called the confluence city, a name derived from the natural occurrence of the two major waterways in West Africa (River Niger and Benue) which was an essential means of communication and transportation especially for the riverside dwellers during the colonial period. According to Adegbie and Ayeni (2013), the tropics receive high solar radiation throughout the year which confirms Ifatimehin et al (2014) argument that Lokoja experiences hot weather prevalently throughout the year.
Lokoja is endowed with natural phenomena such as large waterbody, surrounding mountains, and sparsely dense vegetation which has inherent features for natural public space development. Examples of such spaces are the confluence of the Niger and Benue; Mount Patti (the most popular mountain in Kogi state), or the surrounding region with large green vegetation and other natural landscape features. These strategic locations offer the city an opportunity for a befitting nature park development where the above-mentioned benefits of greeneries could be achieved.
3.2 Methodology
In addition to the literature review on specific topics related to this research, case studies of two public spaces were conducted to evaluate their approach to greeneries and the general planning of the public centres. These locations are Magic Land in Abuja, the Federal Capital Territory of Nigeria, and the Obudu Mountain Resort in Cross River State, Nigeria. The locations provided a park that offered indigenes and tourists the opportunities to connect with nature and its recreational resources. Both situations were therefore analysed to determine the manner in which the landscape of the locations was implemented

565
Human response to greeneries in public spaces
and their significance to the environment. Details on the two case studies are presented in the following paragraphs;
3.2.1 Case 1: Magic land, Abuja, Federal capital territory of Nigeria
Magic Land, formerly called Wonderland is located off constitution Avenue, opposite Abuja National Stadium, Abuja city Gate in Nigeria. It is an ultramodern facility that offers opportunities for activities such as relaxation, sightseeing, recreation, restaurant, and bar. The park comprises of an outdoor public area, wildlife section, and indoor play area with substantial open spaces for social interaction. This location was visited two times during the research period and kiln observation was taken about the attention given to the strategic planning of green spaces, trees, and shrubs, and water bodies to ensure a comfortable environment for the public. Also, an interview was conducted with a tour manager and questions concerning the maintenance culture of the park, available facilities, plans for possible expansion, nature conservation and environmental planning, and users’ satisfaction from the usage of the facilities were addressed. He confirmed that remarkable feedback was gotten from a survey conducted to evaluate the satisfaction of the users of the park in 2016 with positive comments on the recreational facilities, environmental quality, and landscaping of the park and further stated the plan for a possible addition of accommodation, which had earlier been included on the master plan, adequately planned to ensure user comfort and a deserving value for their money.
3.2.2 Case 2: Obudu mountain resort, Cross-River state, Nigeria
The Obudu Mountain Resort is located in the north-eastern part of Cross River State, Nigeria, close to the border of Cameroon. It is a prominent destination for local and international tourists and adequately equipped to offers visitors maximum recreation (hotels.ng). It is also recognized for its blend of warm and cold temperature and attractive landscape with calming ambiance. It features a water park with a water slide and a swimming pool. Horse-riding, golfing, hiking and fitness activities are usual activities carried out by the public. It also offers accommodation for tourists in the form of chalets which are built with environmentally-friendly materials and adequately planned with interesting landscape features.
4.0 Findings and discussion The relationship between the case studies as regards the approaches adopted in the implementation of greeneries into the surrounding are hereby presented and discussed below;

566
Victor Momoh, Dorcas, A. Ayeni2 Ali GhaffarianHoseini, and Funmilayo Ebun Rotimi
6
Figure 1: Case 1; Approach of environmental planning, Magic land, Abuja
Magic land in Abuja was noted with the use of trees and shrubs to create shades for the car park and the public sitting areas, providing a thermally conducive environment for relaxation. Trees and shrubs were identified to be used as buffers between the noisy area and the main activity area. The landscape also featured the use of lawns to define the entrance of the park and the walk paths in the yard, which added beauty to it. The wildlife section was also planned with vegetation to give a feel of natural habitat for the animals (see figure 1 above). In addition, the landscape also introduced activities with water which could benefit the environment in terms of the evaporative cooling process.
Figure 2: Case 2; Approach of environmental planning, Obudu mountain resort, Cross-River State, Nigeria

567
Human response to greeneries in public spaces
Obudu Mountain resort however adopted the approach of extensive use of lawn area to provide a rather natural expanse of space for recreational activities and around the chalets. They also annexed the advantage of the varied terrain in terms of height to achieve a dynamic view of the surroundings. They also utilized trees and shrubs to create shades for public sitting areas, to define movement and beautify the surrounding. In addition, the resort has water features such as fountains, swimming pools, and water slides to enhance the activities and create a natural beauty in the resort center (see figure 2 above).
The two locations regarded the essentials of greeneries and had applied them however to a different degree as shown in the above figures. The neutral point is the acknowledgment of the relevance of plants in public spaces and the impact they make in such an environment.
People find nature to be serene and visually pleasing as it creates an environment that appeals to the senses while adding aesthetic value to spaces, which could reduce stress, cleans interior air, increases productivity, and generate excitement in users of such space. Consequently, the exterior plants also create a great impression on man and the well-being of the environment. Aside from the decorative benefit of the exterior landscape, it also controls temperature and offers other benefits such as hydrological benefits, architectural enhancement, habitats for wildlife, and recreational opportunities. Roof garden design should be encouraged in Lokoja to replace the massive use of aluminum or corrugated metal roofing sheet which causes more solar radiation and contributes to global warming. Gutter gardens are a great way to take advantage of the vertical spaces around a facade to grow flowers, edibles, and create a stylish finish. This technic of vertical greenery can be adapted for shading corridors, balconies, or exterior wall cover to increase the thermal comfort of the interior space. Also, the introduction of a water body in the form of an artificial lake or fountain to public space can reduce the intensity of heat radiation and add beauty to the environment to provide a refreshing atmosphere for users.
6.0 Conclusion The implementation of greeneries in public spaces was argued by various authors to be beneficial to the air quality, thermal comfort, and beauty of the space, to mention but a few. These features include horizontal and vertical green elements such as; roof garden, green facade, indoor plants, trees and shrubs, and large lawn areas. If public spaces are developed in Lokoja adopting green concepts such as green façade design, roof garden, shrubs and trees planting, and proper landscaping, this will go a long way to protect the city from the adverse effect of urban heat island, and improve its comfort level. The study hereby concludes that the city should explore the potential of the tourist location at the confluence of river Niger and Benue or the surrounding mountains to develop a nature park and garden where people can experience more nature. Also, the city should develop the habit of conserving existing trees to maintain the green cover of the city.
Acknowledgements: I thank my co-authors for their constant support and critical review of this research. It is with this assistance that we can contribute to the well of knowledge as regards the built environment and sustainable development, thereby adding value to lives and properties.

568
Victor Momoh, Dorcas, A. Ayeni2 Ali GhaffarianHoseini, and Funmilayo Ebun Rotimi
References: AboElata, A. A. A. (2017). Study the Vegetation as Urban Strategy to Mitigate Urban Heat Island in Mega City Cairo.
Procedia Environmental Sciences 37(2017) 386-395. International Conference-Green Urbanism, GU 2016 Adeoye, N. O. (2012). Spatio-Temporal Analysis of Land Use/Cover Change of Lokoja - A Confluence Town. 4, (4) 40-
51 Adegbie, M. O. and Ayeni, D. A. (2013). Soft Landscape Elements: Importance and Implications on Thermal Control
in Tropical Buildings. International Journal of Development Research 3 (5)55-60 Alves, E., and Lopes, A. (2017). The Urban Heat Island Effect and the Role of Vegetation to Address the Negative
Impacts of Local Climate Changes in a Small Brazilian City. Atmosphere. 8. 1-14. Armson, D., Stringer, P. and Ennos, A.R. (2012). The Effect of Tree Shade and Grass on Surface and Globe
Temperatures in an Urban Area. Urban Forestry & Urban Greening 11 (3), 245-255 Ayeni, d. A. (2018). The Perceptible Effects of Climate Change on Buildings and the Surrounding Landscape in
Nigeria. Proceedings of ISER 151st International Conference, London, UK, 18th-19th August 2018 Ayeni, D. A (2012). Emphasizing Landscape Elements as Important Components of a Sustainable Built Environment
in Nigeria. Developing Country Studies. 2(8)33-42 Basorun, J. O. and Ayeni, D.A. (2013). Planning and Restoration of Environmental Values in Nigeria Dysfunctional
Societies. European Journal of Sustainable Development, 2(4)185-198 Belcher, R., and Chisholm, R. (2018). Tropical Vegetation and Residential Property Value: A Hedonic Pricing Analysis
in Singapore. Ecological Economics. 149. 10.1016/j.ecolecon.2018.03.012. Bromberek, Z. (2009). Eco-Resorts: Planning and Design for the Tropics 11-13 Burcu, G., (2015). “Sustainability Education by Sustainable School Design” Social and Behavioral Sciences 186 (2015)
868 – 873. Chowdhury, M. R., (2019). ThePositive Effects of Nature on your Mental Well-Being. PositivePsychology.com Christoph, D.D., Rupprecht, J and Byrne, A. (2014). Informal urban greenspace: A typology and trilingual systematic
review of its role for urban residents and trends in the literature Urban Forestry & Urban Greening 13 (2014) 597–611
Collins, C.C., and O’Callaghan, A.M. (2008). The impact of horticultural responsibility on health indicators and quality of life in assisted living. HortTechnol. 18:611-618
Colunga, M., Cambron-Sandoval, V., Suzán-Azpiri, H., Guevara-Escobar, A., and Luna, H. (2015). The role of urban vegetation in temperature and heat island effects in Querétaro city, Mexico. Atmosfera. 28. 205-218.
Cox, D. T. C., Hudson, H. L., Shanahan, D. F., Fuller, R. A. and Gaston, K. J (2017). The Rarity of Direct Experiences of Nature in an Urban Population. Landscape and Urban Planning 160 (2017) 79–84.
https://hotels.ng/guides/destinations/everything-need-know-obudu-mountain-resort/ Accessed on 16/04/2020 Ifatimehin, O. O., Essoka, P. A. and Olu, T. I (2014) Ecosystem Regulatory Services and Human Comfort in an
Outdoor Environment of Lokoja, Nigeria. British Journal of Applied Science & Technology 4(18)2576-2589 Ignatieva, M., Eriksson, F., Eriksson, T., Berg, P. and Hedblom, M. (2017). The lawn as a social and cultural
phenomenon in Sweden. 21 (2017) 213–223 Lohr, V.I. and Pearson-Mims, C.H. (2000). Physical discomfort may be reduced in the presence of interior plants.
10(53-58) Mohd Hussain, M. R., Tukiman, I., Zen, I. H., and Shahli, F. M. (2014). The Impact of Landscape Design on House Prices
and Values in Residential Development in Urban Areas. APCBEE Procedia 10 ( 2014 ) 316 – 320. ICESD 2014: February 19-21, Singapore
Momoh, V. and Folorunso, C. O. (2018). Identifying Factors Hindering the Adoption of Expanded Polystyrene for Building Construction in Akure, Nigeria. Journal of Material Science and Chemical Engineering, 6, 1-11
Olorunfemi, S. O., Oladele, T. V., and Koffi, A. E. (2016). An Overview of Urban Road Landscape in Lokoja, Nigeria. FUTA Journal of Management and Technology.1 (2)85-95.
Omale, R. P., Momoh, V. and Aluko, O. S. (2017). Effects of Roof Colors on the Environment. International Journal of Scientific Research and Innovative Technology. 4(6)85-95

569
Human response to greeneries in public spaces
Qviström, M. (2016). The nature of running: On embedded landscape ideals in leisure planning. Urban Forestry & Urban Greening 17 (2016) 202–210
Sato, Y., Higuchi, A., Takami, A., Murakami, A., Masutomi, Y., Tsuchiya, K., Goto, D. and Nakajima, T. (2016). Regional variability in the impacts of future land use on summertime temperatures in Kanto region, the Japanese megacity. Urban Forestry & Urban Greening 20 (2016) 43–55
Satterfield, Z. P. E. (2009). Green Building, NESC Engineering Scientist (2009)8-4 Shamsuddina, S., Sulaimana, A. B. and Amat, R. C. (2012). Urban Landscape Factors That Influenced the Character of
George Town, Penang Unesco World Heritage Site. 50, (2012) 238 – 253 Steiner, F. (2014). Urban Landscape Perspectives. Land 3(1) 342-350 Taib, N. and Abdullah, A. (2012). Study of Landscape Gardens: Expectations and Users’ Perceptions of a High-Rise
Office Building. 50 (2012) 633 – 642

570
The 54th International Conference of the Architectural Science Association (ANZAScA) 2020
Identification of Parameters to Develop an Evidence-based Framework to Improve Building Code Amendment in New Zealand
Amarachukwu Nnadozie Nwadike1, Suzanne Wilkinson2 and Itohan Esther Aigwi3 1, 2 Massey University, Auckland, New Zealand
{a.nwadike1, s.wilkinson2}@massey.ac.nz 3Auckland University of Technology, Auckland, New Zealand
Abstract: This paper presents an evidence-based framework by identifying parameters that promote New Zealandbuilding code improvement. The study explores how each identified parameter contributes to achieving the primary functions of the building code practice. In justifying the rationale behind the need to develop a framework, the study conducted a narrative review of the current knowledge within the building code context to enhance its functions for better building performance and quality. The study identified five action priority features such as regulation and administration, design and implementation, enforcement, compliance and amendment process. Each action priority features has established criteria that describes what needs to be improved. The identified parameters offer a unique opportunity in balancing stakeholders diversity interest while ensuring a transparent improvement process. The implementation of the proposed framework would facilitate a robust building code improvement.
Keywords: Building code improvement; regulatory system; amendment process; implementation.
1. IntroductionMany countries around the globe have either developed or adopted their building code, with many transiting from prescriptive-based to performance-based regulatory system. The performance-based code facilitated innovative techniques, flexibility and reduced regulatory cost (Mumford, 2010). However, the building has progressed gradually over time to meet the societal needs regarding safety, the resilient built environment and public health (Kumar, 2017). Accordingly, building code has played a significant role in reducing disaster impacts (Jones & Vasvani, 2017).
Despite the benefits of building code practice, some limitations exist that demonstrates the need for improvement. Considerably, lack of training with the introduction of amended requirements, inadequate awareness, poor legislative environment, code complexities, non-compliance and lack of qualified staff have been recognised as factors that could limit building code benefits (Duncan, 2005; Nwadike, Wilkinson, & Clifton, 2019b). In some cases, poorly skilled code users with poorly written building code lead to wrong interpretations and application of building code requirements in design and construction, which could be as a result of regulatory oversight on the part of the regulators (Michael Mills, 2010). According to Jain (2002), non-mandatory use of the building code in design and construction contributed to the code limitations. Similarly, the quest to reduce disaster risks, enhance the potentials of building code and simplify its application have also made the code improvement a necessity. The building code improvement requires the input and participation of relevant stakeholders irrespective of their diverse interest, supervised by the building code regulators at all levels. Furthermore, building code amendment process creates an avenue to improve the building code and other related documents (Nwadike & Wilkinson, 2020).
This paper explores relevant factors that could improve building code amendment in New Zealand. A narrative literature review of existing documents (Green, Johnson, & Adams, 2006; Juntunen & Lehenkari, 2019; Rumrill Jr &
Imaginable Futures: Design Thinking, and the Scientific Method. 54th International Conference of the Architectural Science Association 2020, Ali Ghaffarianhoseini, et al (eds), pp. 570–579. © 2020 and published by the Architectural Science Association (ANZAScA).

571
Amarachukwu Nnadozie Nwadike, Suzanne Wilkinson and Itohan Esther Aigwi
Fitzgerald, 2001) was conducted to identify the knowledge gaps which enables the establishment of relevant factors to develop a proposed framework that improves the application and use of building code in New Zealand. The findings from this paper offer an insightful basis for improving the New Zealand building code and the amendment process.
2. Building code improvementThe concept of improving building code implies changing existing building regulations, requirements, and methods of application that are no longer tenable to ensure that the primary purpose of developing building code is achieved. Improving building code involves the participation and contribution of all stakeholders. The increasing deficiencies in building code practice as a result of environmental changes and noticeable dissatisfaction of building code outputs in building performance suggests the need to improve the building code regulations (Nwadike, Wilkinson, & Clifton, 2019a; Wayne Thompson, 2005). The building code in some situations failed to address quality in design and construction (Wayne Thompson, 2005), which has resulted in societal fear as the built environment changes over time. Building quality ensures a safe, durable, and healthy built environment. It offers an excellent opportunity to improve building features that align with the Ministry of Business, Innovation, and Employment (MBIE) aim of improving building code to keep pace with the modern design and construction methods (MBIE, 2020a). This will reflect in the building performance before, during, and after any extreme loading conditions in the built environment. Improving building code creates the pathway to consistently address the bare minimum standards stipulated in the building code requirement (Carla Williams, 2016), as the human environment changes with time.
The introduction of a performance-based building code requires periodic improvement of building regulations and requirements since it presents innovative techniques and flexibility in building design and construction systems. The improvement becomes necessary as innovation and flexibility are consistently outpacing the readiness of all stakeholders involved in the building regulatory system (Duncan, 2005; B. J. Meacham, 2010). The innovative techniques have given rise to different interpretations of building code requirements by code users and building officials (Lundin, 2006; B. J. Meacham, 2010; Meacham Brian, 2008). The diverse code interpretation has led to the question of the clarity of building code requirements and the choice of terminologies used in describing building code. Consequently, the leaky building situation in New Zealand demonstrates how innovative techniques can outpace readiness (Duncan, 2005; Hunn, Bond, & Kernohan, 2002; May Peter, 2003). Additionally, a similar incident was reported in Vancouver, Canada, and some parts of the South East in the United States of America (Meeks & Brannigan, 1996). However, other factors may contribute to rate at which innovation overtakes the building industry readiness such as cost-cutting practice, poor work quality, failure in the construction process, knowledge deficiency and lack of coordination among the stakeholders (Duncan, 2005; Hunn et al., 2002; May Peter, 2003; Nigel Isaacs, 2018).
3. Situations confronting building code improvementMany situations are encountered when considering measures for improving the building code. Building code regulators, policymakers, and other stakeholders are faced with the question of what to improve, how to improve it, and when to improve the identified areas in the building code. Before amending any section of the building code, standard, or compliance documents, it is crucial to consider the socio-economic implications of the intended changes and how the new changes can be adequately presented to the code users. Before making changes in the building code and other associated documents, the building regulators and the policymakers seek ways to meet the expected changes in the building code, with regards to implementation and compliance (Ametepey, Ansah, & Edu-Buandoh, 2015; Auckland Council, 2020). The critical success of any proposed changes largely depends on how the expected positive outcomes can be accepted in the industry, building consent authorities, and building practitioners (Michael Mills, 2010). Also, the manner of presenting building code changes to the end-users for implementation should be considered, as it is expected to come with resourceful training for all, supports and how compliance with the new changes could be achieved (Duncan, 2005).
The MBIE is responsible for monitoring, detecting any deficiency in the regulation or poor building performance, and the need to improve the building code as the institution is saddled with the responsibility to review and maintain the building code (MBIE, 2019a). However, other regulatory agencies such as the Building Consent Authorities and Territorial Authorities are obligated under the Building Act to support the MBIE to achieve and maintain the building regulatory system in New Zealand (MBIE, 2019a). According to section 172, under the Building Act established a Building Advisory Panel (BAP) with special duties such as ensuring a constructive dialogue between the construction sector and the MBIE (MBIE, 2019a). The regulatory agencies and the BAP help to create an enabling environment that ensures the building code continues to deliver the best building performance with innovative approaches that can be globally acceptable.

572
Identification of Parameters to Develop an Evidence-based Framework to Improve Building Code Amendment in New Zealand
The consultation process that proceeds before the building code amendment helps to make the process transparent, consistent and relevant stakeholders to make contributions that enhances the decision-making process as largely overseed by the MBIE. The relevant stakeholders include the building code regulators, construction industry professionals, building owners, the government, insurance institutions and the research institutions. The stakeholders come to the table of contribution with diverse interests that potentially serve their respective benefits. The building code regulators are mostly concerned with safety precautionary measures which they achieve by applying strict building requirements, regular building code amendment and the stringent enforcement process through the Territorial Authorities and Building Consent Authorities. Also, the regulators maintain and ensure strict compliance with the building requirements (Aigwi, Ingham, Phipps, & Filippova, 2020). The construction industry professionals believe in the application of innovative techniques in construction that serves the taste of the time.
4. Research methodologyThis study explores the identification of parameters to develop an evidence-based framework to improve the performance-based building code in New Zealand. In achieving the purpose of this study, a qualitative method was adopted by conducting an intensive narrative literature review of existing documents within the New Zealand building code and the associated regulatory system. A narrative literature review is a method of data collection that critically evaluate existing research related to the topic of interest to provide a comprehensive overview and establish a hypothetical context on a research topic under consideration (Baker, 2016; Byrne, 2016; Green et al., 2006; Juntunen & Lehenkari, 2019). This data collection technique draws its advantage in summarising previous literature to give a broad conclusion on a topic of interest under investigation (Baker, 2016; Baumeister & Leary, 1997).
5. Framework description based on action priority and criteriaThe framework described in this section presents five critical features, such as regulation and administration, enforcement, compliance, and amendment process. The framework criteria are used to measure and assess the action priorities. The action priorities features are discussed in detail in the following sub-sections.
5.1. Building regulation and administration Building regulation is a significant aspect of the building control framework, made in accordance with the New Zealand Building Act. The building regulation provides building control details such as change of use, specified system, earthquake moderation and related levy rates (MBIE, 2018a) while ensuring compliance, enforcement with the building code(Ashburton District Council, 2019). In New Zealand, the building regulation has undergone several changes since enacted into law, to improve the building performance and create an enabling environment that drives innovative techniques. Accordingly, the building regulation provides user-friendly requirements, efficient services and timely delivery through legislative policy measures (Ashburton District Council, 2019). Any building design and construction method that does not follow all the stipulated building regulation requirements are not deemed fit to be constructed, as such design and construction pose a high risk in the built environment. Given the nature of building regulations, some stakeholders consider building regulations and administrations as obstructive to innovative technologies, unnecessary building cost restricts new building materials and social discrimination of low-income earners as they may not be able to afford building cost (Arlani & Rakhra, 1988). Seeking the opinion of the relevant stakeholders to improve the building regulations and the administration of the code requirements becomes necessary.
The framework development based on the regulation and administration is measured under six criteria as a source to improve the building and its application. The criteria are well discussed below: (i) Making legislations that can reduce the bureaucratic process in building code administration to the code users to
achieve regulatory goals (Imrie, 2004; Offei-Nketiah, Kwofie, & Duah, 2019). Reducing the procedure of obtainingbuilding permits, streamlining the implementation process and regular inspection minimises bureaucracy withinbuilding control system (Ametepey et al., 2015; Moullier & Krimgold, 2015). Meanwhile, Brian Easton (2012) pointed out that even though the legislations provide ways to reduce the bureaucratic process, some administrators could fail to implement it effectively.
(ii) Improving clarity and simplifying building code requirements increases the level of understanding (MBIE, 2014, 2015, 2018b; B. Meacham, 2010), especially as the practice of innovative techniques in performance-based building code is on the increase. The understanding of the building code requirements critically drives the success of the regulatorysystem (Moullier & Krimgold, 2015), when backed with adequate training regulations.

573
Amarachukwu Nnadozie Nwadike, Suzanne Wilkinson and Itohan Esther Aigwi
(iii) The flow of information and excellent communication between the code users and the regulators are essential toenhance building code improvement (GBPN, 2014; May, 2005; MBIE, 2018b; Moullier & Krimgold, 2015; Raman, 1997). The MBIE recognised that the regulatory system regarding monitoring and information flow is poorly managed (MBIE, 2015). The interaction among the stakeholders allows the regulators to hear the viewpoints of the regulated. Thisincludes conducting technical meetings and workshops where the interest of both the regulators and the regulated are aligned to improve building code practice.
(iv) There is a need to conduct a practical impact assessment of the intended changes in the building code in line with theexpected changes before the amendment, during the amendment process, and after the changes are in practice.Impact assessment promotes building quality, regulations, ensures efficient building performance (Michael Mills,2010), and correct the implementation of building code requirements (Chmutina & Bosher, 2015).
(v) The introduction of performance-based building code encourages the use of innovative technologies in design,construction, manufacturing, and other related service delivery. The use of these innovative technologies todemonstrate compliance has become problematic(Duncan, 2005; Gann, Wang, & Hawkins, 1998), as the buildingofficials find it difficult to balance the new ideas with the building code requirements (Duncan, 2005). Hence, providing legislative policies that could monitor and govern the use of these innovative approaches becomes vital as a measure to improve the use of building code. The effectiveness of these regulations would span across the people that use the technologies; the process followed to achieve the purpose of innovative technologies, the performance of theovertime, the planning phase, and the products that are used to acquire the results. The products designed withinnovative techniques should undergo checks to ensure conformity with the construction system (Gann et al., 1998).
5.2. Design and implementation Building code to some extent, centres on the design and implementation of code requirements, which provides an insightful, practical application of building requirements. The implementation of building code requirements is often neglected as a result of the complexity surrounding code requirements (Coburn & Spence, 2003). It involves the participation of all relevant stakeholders to achieve a purposeful building code implementation through continuous training to ensure competency, technical assistance by experienced technical experts and regular active monitoring (Ricciarini Sylvana, 2009). Hence, effective implementation and design of building regulations depend on how the following measured criteria are improved, as discussed below: (i) Overcoming the complexities within building requirements needs the involvement of competent technical staff who
can review plans, inspect, monitor, and supervise the activities of the building code users (Chandel, Sharma, &Marwaha, 2016; Jones & Vasvani, 2017; Moullier & Krimgold, 2015). Engaging the service of professional technicalstaff promotes the building regulatory system and guides the code users in the right direction. Besides, qualifiedtechnical staff detects violation within the building code and provide ways of correcting it. Effective design andimplementation take place in an environment with sufficient skilled and competent staff with adequate legal, financial and moral support to function independently (Burby, May, & Paterson, 1998; Offei-Nketiah et al., 2019; Yates, 2002).
(ii) Encouraging low-risk innovative technologies in complying with the building code reduces the stress imposed on the building officials who review and inspect technical drawings and work constructions. Accordingly, using low-risk innovative techniques tends to balance the safety measures and possibly prevents difficulty in building codecompliance and eases the code interpretation process on the side of the building officials (Duncan, 2005).
(iii) There is a need to enhance building quality and the incentives given to the code users, as these encourageimplementation of building code requirements and building performance (David Kelly, 2012; MBIE, 2015). Offeringincentives to good code practitioners ensure that buildings are constructed with adequate quality and performanceto induce compliance (Burby et al., 1998; Michael Mills, 2010). The incentives could occur in diverse ways such astechnical assistance (Burby et al., 1998), relaxed inspection with leniency on violators (Burby et al., 1998), waving of some fees, reduced administrative, bureaucratic process, training, and commendation awards.
(iv) Providing building code users with attractive technical assistance encourages compliance with less policing and a waste of resources on enforcement. Technical support increases the understanding of building code requirements andprovides informative guidelines that help to attain building code objectives (Burby et al., 1998; Haberecht & Bennett, 1999; Nwadike & Wilkinson, 2020). Acknowledging the significance of providing technical assistance (Moullier &Krimgold, 2015) advised on institutionalising sustainable technical support to code users.

574
Identification of Parameters to Develop an Evidence-based Framework to Improve Building Code Amendment in New Zealand
(v) Another way of improving the building code efficiency is by reducing the complexities within the building regulatory system, especially the building code requirements (David Kelly, 2012; Dixit Amod & Esteban Leon, 2009; MBIE, 2015; Nwadike & Wilkinson, 2020). Building code complexities within the regulatory system could lead to poor design andimplementation of code requirements, deficiency in building performance, and waste of resource in ensuringcompliance (David Kelly, 2012; Gülkan, 2001; Listokin & Hattis, 2005; Michael Mills, 2010; Nwadike & Wilkinson, 2020).
5.3. Enforcement Building code to some extent, centres on the design and implementation of code requirements, which provides an insightful, practical application of building requirements. The implementation of building code requirements is often neglected as a result of the complexity surrounding code requirements (Coburn & Spence, 2003). It involves the participation of all relevant stakeholders to achieve a purposeful building code implementation through continuous training to ensure competency, technical assistance by experienced technical experts and regular active monitoring (Ricciarini Sylvana, 2009). Hence, effective implementation and design of building regulations depend on how the following measured criteria are improved, as discussed below: (i) Building code enforcement is best achieved when there is increased monitoring and inspection of building work
regularly with shortened processing time (Michael Mills, 2010; Moullier & Krimgold, 2015; Offei-Nketiah et al., 2019). The inspection and monitoring should revolve around assessing building plans before granting a permit, during different construction stages and final construction commissioning of the project (Awuah, Hammond, Lamond, &Booth, 2014).
(ii) Although promoting voluntary enforcement increases the building performance, encourages code users to comply,and provides the best regulatory practice. There is a need to have a mixed method of enforcement, as some building code users could misunderstand the basis for voluntary enforcement (Nwadike et al., 2019b). The mixed-method of compliance should be monitored, inspected, with adequate punishment for regular violators (Burby & May, 2000;Burby et al., 1998), as it helps to deter non-compliance (Balch, 1980).
(iii) Enforcing building code requires a mechanism that ensures sufficient resources available for both the code regulators and the enforcement entities (Yates, 2002). These resources could be in terms of sufficient skilled personnel, financial resources, logistics, smart regulations, and appropriate detection strategy (Offei-Nketiah et al., 2019; Olshansky, 1998; Spence, 2004; Yates, 2002).
(iv) Accordingly, the efficacy of building code enforcement depends on the ability of the enforcement team to have a well-defined enforcement strategy to detect and correct violation practices (Burby, May, Malizia, & Levine, 2000; Spence, 2004). It is essential to engage the services of qualified professionals in the enforcement team, as successful building code enforcement entails the use of mixed-method of enforcement, comprising of the systematic method (i.e.deterrence) and facilitative approach (i.e. voluntary). Furthermore, mixed-method enforcement becomes necessary as the application of one method comes with some unintended disadvantages (Burby et al., 1998; Downs, 1991; Elliott, 1981; Nwadike et al., 2019b).
(v) Institutionalising legal action plan with varied degree of punishments for building code violators could be anothermeasure to deter people from violating the code provisions. The action plan will provide the enforcement team with an opportunity to assess the level of non-compliance based on the violator's efforts to comply, and the associatedimpacts to determine the type of actions to be followed.
5.4. Compliance It is crucial for relevant stakeholders to consider building code compliance in an attempt to improve building code. Effective building code compliance unlocks productivity opportunities through the code users within the building regulatory system (MBIE, 2018b). Furthermore, compliance with the building code requires an enabling environment supported with a legislative policy that is inclusive and allows for the participation of all stakeholders with encouraging incentives while empowering the building regulators to publish violators and reward compliance culture. Compliance with building code within the context of this study is measured under the criteria discussed below: (i) Developing a mechanism to enhance understanding of building code provision is essential, and this can be achieved
through improving code readability, simplifying code language, providing a detailed description of the minimum standard and providing education on the regulatory system through a well-communicated platform (AbimbolaOlukemi Windapo & Keith Cattell, 2010; MBIE, 2018b; Shoichi Ando, 2008).

575
Amarachukwu Nnadozie Nwadike, Suzanne Wilkinson and Itohan Esther Aigwi
(ii) One of the key elements that have demonstrated an increase in building code compliance is technical assistance. This is evident as Abimbola Olukemi Windapo and Keith Cattell (2010) cited a lack of knowledge on code provisions as amajor source of non-compliance. Enhancing technical assistance promotes compliance by educating the users whileeliminating obstacles that could cause non-compliance with the building code among the code users.
(iii) Creating awareness on the need for compliance, consequences of non-compliance, advantages of complying withbuilding code requirements, and how to comply are necessary as it equips the code users with a better understanding of why building code compliance is non-negotiable. Raising awareness allows the building code users to appreciatethe benefits of compliance while increasing their interest to comply willingly (Huisman, Elffers, & Verboon, 2006;Johnson, 2011). Delivering building code awareness requires systematic training of the code users on various pathways to achieve compliance and efficient building performance (Abimbola Olukemi Windapo & Keith Cattell, 2010; Ahmed et al., 2018; APN, 2017; Duncan, 2005; Meres, Sigmon, DeWein, Garrett, & Brown, 2012).
(iv) The desired fundamental principle of building code compliance is to inspire the code users to comply with the code provisions willingly without applying the deterrence enforcement approach (Burby et al., 1998; Murphy, 2017).Considerably, this could be achieved through the medium of incentive rewards to those that willingly follow thestipulated rules. Incentive rewards encourage compliance with building code, especially as innovative techniques inperformance-based building code poses a challenge to complying with building code. However, incomplete incentive rewards potentially lead to poor compliance (MBIE, 2015).
(v) Cost-benefit assessment on building code requirements is essential as it shows the cost implication of each coderequirement (Arlani & Rakhra, 1988; David Norman, Matthew Curtis, & Ian Page, 2014). Glaeser and Gyourko (2003) reported that some building code requirements are expensive to comply with while insisting that some of theregulations are introduced into the building code without adequate quantification of the associated cost. Hence,theses mean extra unnecessary financial cost on the code users.
(vi) Regular building code amendment provides a means to make changes in the code through the introduction of newguidelines, requirements, setting new performance criteria, alterations, and safety measures. Amending building code helps the regulatory system to keep pace with innovative industrial ideas, emerging construction methods, and tomeet the modern-day societal needs (MBIE, 2020b). Adopting amended building regulation encourages compliancewith the building code requirements, saves cost, minimises liability, and creates the need to train code users (NCBCS, 2018).
5.5. Amendment process The building code amendment process is also considered towards improving building code requirements. The amendment process is unique in providing an opportunity for all relevant stakeholders to participate and make adequate contributions to improve the building code. The amendment process ensures that new innovative practices and products are introduced into the building regulatory system at the right time (Thompson, 1947; Vaughan & Turner, 2013). A successful amendment process helps the code regulatory system to continuously deliver better, smarter, and cost-effective buildings that serve society needs (Vaughan & Turner, 2013). New Zealand building code (NZBC) has passed through several amendment processes (Nwadike & Wilkinson, 2020); however, improving the amendment process becomes necessary as the regulatory system sees several innovative techniques, new construction methods and technologies emerge over time. In this context, some measured criteria are discussed below: (i) The improvement of building code requires increased transparency, fairness, inclusiveness, openness, and balancing
the interest of all relevant stakeholders (Nwadike & Wilkinson, 2020; Vaughan & Turner, 2013). Transparency in theamendment process allows all the stakeholders to view all the activities taking place and fully participate in theprocess. Increased transparency strengthens the amendment process while given attention to all the suggestions from the stakeholders (Vaughan & Turner, 2013). Therefore, a transparent process in amending building code should begreatly encouraged as it protects the building code integrity regarding accuracy, competence, and completeness(Brown, Stern, Tenenbaum, & Gencer, 2006; Vaughan & Turner, 2013).
(ii) A well-managed and transparent building code amendment process is recognised (Nwadike & Wilkinson, 2020);however, implementing the contributions from the stakeholders is significant in improving the building code. Thestakeholder's contributions reveal the needs of the building sector and various ways to make building code compliancemuch easier to achieve (MBIE, 2019b). Hence, to achieve efficient building code improvement, the contribution of the stakeholders must be justified and balanced with the outcomes of the building code amendment process.

576
Identification of Parameters to Develop an Evidence-based Framework to Improve Building Code Amendment in New Zealand
6. Proposed evidence-based framework design and validation
Figure 1: Evidence-based framework design logic
The proposed evidence-based design logic framework is characterized with action priority features such as regulation, design and implementation, enforcement, compliance and amendment process, as shown in Figure 1. The primary aim of the proposed framework design is to aid in improving the New Zealand building code and secure a safe built environment. However, the proposed framework will be validated through the triangulation research method comprising of subject matter experts, questionnaire survey, and structural equation modelling. The triangulation research method allows the proposed framework design to be validated through cross verification from the three different sources to test the consistency of the proposed framework design (Heale & Forbes, 2013). The proposed evidence-based framework offers an opportunity to involve and consult with key building code users and made adequate evaluations based on the evidence- based approach.
7. DiscussionThis paper presents a proposed an evidence-based framework design developed to improve the New Zealand building code based on the identified parameters within the areas of concerns in the building regulatory system. These parameters consist of five

577
Amarachukwu Nnadozie Nwadike, Suzanne Wilkinson and Itohan Esther Aigwi
action priority features such as regulation and administration, design and implementation, enforcement, compliance, and amendment process. Each action priority features are associated with criteria in the framework that works together to improve the building code. The concept of building code improvement is significant in providing a safer built environment, as the entire system is experiencing rapid innovative technologies, new construction methods, noticeable code deficiency, new construction materials while hazard occurrence is consistently increasing in the built environment. These necessitate the need to develop a framework to improve the existing building code.
The efficacy of the proposed framework depends on how the action priority features and the criteria are effectively implemented. The regulation and administration of the priority feature aim to create a legislative environment that promotes code clarity, bureaucracy, information flow, innovative technologies, and improved functions of the subordinate regulatory authorities. Also, the priority feature of design and implementation aims to improve the application of building code requirements through skilled staff, calculated innovative techniques with attractive technical supports that minimises code complexities. Furthermore, the enforcement aspect of the action priority ensures that all regulatory rules and code requirements are strictly followed to enhance building code through monitoring, regular inspection, encouraged voluntary enforcement with a technically skilled enforced team and adequate resource. Besides, building code compliance within this context aims to improve compliance pathways with appropriate training to ease understanding, technical assistance, and incentives. Building code amendment seeks to provide a platform where the observed deficiencies and new ideas are incorporated into the building code based on the contributions of all the relevant stakeholders. The amendment process balances all aspect of the action priority features in the proposed framework design.
8. ConclusionThis study identified potential parameters that aided in the design formulation of a framework to improve building code system in New Zealand. The main purpose of developing the framework is to guide the pathway of improving building code and other associated documents in meeting the primary purpose of the building code, the societal needs, reducing complexities and providing clarity on building regulation requirements. The proposed framework is necessary as it encourages the use of innovative technologies, construction method and materials in meeting code requirements and demonstrating compliance with careful examination of the associated risks. Also, the framework enhances code users training, proactive technical support system, reduced bureaucratic process, enforcement and compliance. The application of the developed framework is unique as it allows resourceful contributions from all the stakeholders on the way forward towards improving the building code. However, limitations exist in the developed framework as the identified action priority features, and the criteria were based on the current challenges facing New Zealand building regulatory system, even though it is flexible. Also, the implementation of the framework may be subject to validation to ensure accuracy. The application of the proposed evidence-based framework would facilitate a robust building code improvement while providing a better understanding of the code requirement and technical assistance to the code users. Also, it will encourage voluntary compliance with the building code to promote a safer built environment that will be resilient to any form of hazard. The evidence-based framework may be unique to New Zealand. However, the evidence-based framework could be transferred to other countries that use regularly updated performance-based building code.
References Abimbola Olukemi Windapo, & Keith Cattell. (2010). A study of building contractors' compliance with national building regulations in Cape Town.
Paper presented at the RICS_COBRA, South Africa. file:///C:/Users/user/Downloads/CIB20060_RICS_COBRA_CONFERENCE_2010.pdf Ahmed, I., Gajendran, T., Brewer, G., Maund, K., von Meding, J., & MacKee, J. (2018). Compliance to building codes for disaster resilience: Bangladesh
and Nepal. Procedia engineering, 212, 986-993. Aigwi, I. E., Ingham, J., Phipps, R., & Filippova, O. (2020). Identifying parameters for a performance-based framework: Towards prioritising
underutilised historical buildings for adaptive reuse in New Zealand. Cities, 102, 102756. doi:10.1016/j.cities.2020.102756 Ametepey, S. O., Ansah, S. K., & Edu-Buandoh, K. (2015). Assessing factors affecting implementation of the national building regulations (LI 1630) in
Ghana. Public Policy and Administration Research, 5(2), 66-73. APN. (2017). Understanding the opportunities and challenges of compliance to safe building codes for disaster resilience in South Asia. Retrieved from
Asia: https://www.preventionweb.net/files/62325_crrp201709syahmedfinalreport3.pdf Arlani, A., & Rakhra, A. (1988). Building code assessment framework. Construction Management and Economics, 6(2), 117-131. Ashburton District Council. (2019). Building Regulation: ACTIVITY MANAGEMENT PLAN 2018-28. Retrieved from
https://www.ashburtondc.govt.nz/SiteCollectionDocuments/Plans%20and%20Strategies/Activity%20Management%20Plans/Building%20Regula tion.pdf
Auckland Council. (2020). Building legislation. Retrieved from https://www.aucklandcouncil.govt.nz/building-and-consents/Pages/building- legislation.aspx
Awuah, K. G. B., Hammond, F. N., Lamond, J. E., & Booth, C. (2014). Benefits of urban land use planning in Ghana. Geoforum, 51, 37-46. Baker, J. D. (2016). The purpose, process, and methods of writing a literature review. AORN journal, 103(3), 265-269. Balch, G. I. (1980). The stick, the carrot, and other strategies: A theoretical analysis of governmental intervention. Law & Policy, 2(1), 35-60. Baumeister, R. F., & Leary, M. R. (1997). Writing narrative literature reviews. Review of general psychology, 1(3), 311-320. Brian Easton. (2012). Regulation and Leaky Buildings. Retrieved from https://www.eastonbh.ac.nz/2012/01/regulation-and-leaky-buildings/

578
Identification of Parameters to Develop an Evidence-based Framework to Improve Building Code Amendment in New Zealand
Brown, A. C., Stern, J., Tenenbaum, B., & Gencer, D. (2006). Handbook for evaluating infrastructure regulatory systems: The World Bank. Burby, R., & May, P. (2000). Issues for regulatory enforcement and compliance with building codes: American perspectives. Paper presented at the
12th World Conference on Earthquake Engineering, Auckland, New Zealand. http://www.iitk.ac.in/nicee/wcee/article/2558.pdf Burby, R. J., May, P. J., Malizia, E. E., & Levine, J. (2000). Building code enforcement burdens and central city decline. Journal of the American
Planning Association, 66(2), 143-161. Burby, R. J., May, P. J., & Paterson, R. C. (1998). Improving compliance with regulations: Choices and outcomes for local government. Journal of the
American Planning Association, 64(3), 324-334. Byrne, J. A. (2016). Improving the peer review of narrative literature reviews. Research integrity and peer review, 1(1), 12. Carla Williams. (2016). Building code pros and cons: Is the system in need of an overhaul? Retrieved from
https://www.constructiondive.com/news/building-code-pros-and-cons-is-the-system-in-need-of-an-overhaul/419457/ Chandel, S., Sharma, A., & Marwaha, B. M. (2016). Review of energy efficiency initiatives and regulations for residential buildings in India. Renewable
and Sustainable Energy Reviews, 54, 1443-1458. Chmutina, K., & Bosher, L. (2015). Disaster risk reduction or disaster risk production: The role of building regulations in mainstreaming DRR.
International journal of disaster risk reduction, 13, 10-19. Coburn, A., & Spence, R. (2003). Earthquake protection: John Wiley & Sons. David Kelly. (2012). Streamlining building regulation: Proposed changes to the New Zealand Building Code. Retrieved from
https://treasury.govt.nz/sites/default/files/2012-03/ris-dbh-sbr-mar12.pdf David Norman, Matthew Curtis, & Ian Page. (2014). A cost-benefit analysis of improved working at heights regulation. Retrieved from
https://www.sitesafe.org.nz/globalassets/about-us/safety-liaison-group/waikato/3-cost-benefit-analysis-of-the-working-at-heights- programme.pdf
Dixit Amod, & Esteban Leon. (2009). Safer Building Codes and Construction: A Strategy for Enforcement, Implementation and Dissemination. The Second Session of Global Platform for Disaster Risk Reduction. Retrieved from https://nanopdf.com/download/safer-building-codes-and- construction-a-strategy_pdf
Downs, A. (1991). The advisory commission on regulatory barriers to affordable housing: Its behavior and accomplishments. Duncan, J. (2005). Performance-based building: lessons from implementation in New Zealand. Building Research & Information, 33(2), 120-127. Elliott, M. (1981). The impact of growth control regulations on housing prices in California. Real Estate Economics, 9(2), 115-133. Gann, D. M., Wang, Y., & Hawkins, R. (1998). Do regulations encourage innovation?-the case of energy efficiency in housing. Building Research &
Information, 26(5), 280-296. GBPN. (2014). Designing and implementing best practice building codes: Insights from policy makers. Retrieved from
https://www.gbpn.org/sites/default/files/05_Design%20and%20implementation%20of%20best%20practice%20building%20codes.pdf Glaeser, E. L., & Gyourko, J. (2003). The impact of building restrictions on housing affordability. Economic Policy Review, 9(2). Green, B. N., Johnson, C. D., & Adams, A. (2006). Writing narrative literature reviews for peer-reviewed journals: secrets of the trade. Journal of
chiropractic medicine, 5(3), 101-117. Gülkan, P. (2001). The search for enhanced disaster resistance of the building stock in Turkey: recent legislative measures for effective building code
enforcement and mitigation policies. Consultancy Report for the World Bank and Turkish Treasury, TEFER, Government of Turkey, Ankara. Haberecht, P. W., & Bennett, A. F. (1999). Experience with durability assessment and performance-based building codes: BRANZ. Heale, R., & Forbes, D. (2013). Understanding triangulation in research. Evidence-Based Nursing, 16(4), 98-98. Huisman, W., Elffers, H., & Verboon, P. (2006). Managing and maintaining compliance. Closing the gap between science and practice. Hunn, D., Bond, I., & Kernohan, D. (2002). Report of the overview group on the weathertightness of buildings to the building industry authority:
Building Industry Authority. Imrie, R. (2004). The role of the building regulations in achieving housing quality. Environment and Planning B: Planning and Design, 31(3), 419-437. Jain, S. K. (2002). Codes, licensing, and education. Earthquake Spectra, 18(1_suppl), 319-339. Johnson, C. (2011). Creating an enabling environment for reducing disaster risk: Recent experience of regulatory frameworks for land, planning and
building in low and middle-income countries. Background Paper for the Global Assessment Report on Disaster Risk Reduction, 2011. Jones, S., & Vasvani, V. (2017). Compliance with the building byelaws and earthquake safety in urban areas of Bihar: progress, constraints and
challenges. Environmental Hazards, 16(4), 345-362. Juntunen, M., & Lehenkari, M. (2019). A narrative literature review process for an academic business research thesis. Studies in Higher Education, 1-
13. doi:https://doi.org/10.1080/03075079.2019.1630813Kumar, A. (2017). Problems and prospects of building regulations in Shimla, India–A step towards achieving sustainable development. International
Journal of Sustainable Built Environment, 6(1), 207-215. Listokin, D., & Hattis, D. B. (2005). Building codes and housing. Cityscape, 21-67. Retrieved from
https://www.jstor.org/stable/20868571?seq=1#metadata_info_tab_contents Lundin, J. (2006). Fire risk control in a performance-based regulatory system–challenges and shortcomings. Paper presented at the Proceedings of the
6th International Conference on Performance-Based Codes and Fire Safety Design Methods, Society of Fire Protection Engineers (SFPE), Bethesda, MD, US.
May Peter. (2003). Performance-based regulation and regulatory regimes: the saga of leaky buildings. Law & Policy, 25(4), 381-401. May, P. J. (2005). Regulatory implementation: Examining barriers from regulatory processes. Cityscape, 209-232. MBIE. (2014). New Zealand Building Code Handbook. Retrieved from https://www.building.govt.nz/assets/Uploads/building-code-
compliance/handbooks/building-code-handbook/building-code-handbook-3rd-edition-amendment-13.pdf MBIE. (2015). Summary of the building performance regulatory system assessment. Retrieved from
https://www.mbie.govt.nz/assets/f5b5aeec12/summary-of-building-regulatory-system-assessment.pdf MBIE. (2018a). Building and maintaining New Zealand’s homes and buildings. Retrieved from https://www.mbie.govt.nz/building-and-
energy/building/building-and-maintaining-new-zealands-homes-and-buildings/

579
Amarachukwu Nnadozie Nwadike, Suzanne Wilkinson and Itohan Esther Aigwi
MBIE. (2018b). Smarter Compliance Pathways. Summary of Findings. Retrieved from https://webcache.googleusercontent.com/search?q=cache:M5HKjS3QaCcJ:https://www.mbie.govt.nz/dmsdocument/4330-smarter- compliance-pathways-summary-of-findings+&cd=1&hl=en&ct=clnk&gl=nz
MBIE. (2019a). Building regulatory system. Retrieved from https://www.mbie.govt.nz/cross-government-functions/regulatory- stewardship/regulatory-systems/building-regulatory-system/
MBIE. (2019b). Updates to the Building Code will make it easier to comply. Retrieved from https://www.building.govt.nz/about-building- performance/news-and-updates/all-news-and-updates/updates-to-the-building-code-will-make-it-easier-to-comply/
MBIE. (2020a). Building Code update consultation June 2020. Retrieved from https://www.mbie.govt.nz/have-your-say/building-code-update- consultation-june-2020/
MBIE. (2020b). Building Code update June 2020. Retrieved from https://www.building.govt.nz/about-building-performance/news-and- updates/codewords/codewords-issue-94/building-code-update-june-2020/
Meacham, B. (2010). Performance-based building regulatory systems principles and experiences. A report of the inter-jurisdictional Regulatory Collaboration Committee,(IRCC). Australian Building Codes Board (ABCB), Australia, February. Retrieved from https://ircc.info/Doc/A1163909.pdf
Meacham, B. J. (2010). Accommodating innovation in building regulation: lessons and challenges. Building Research & Information, 38(6), 686-698. Meacham Brian. (2008). Performance Requirements and Acceptance Criteria for Safety in Case of Fire. IRCC Workshop on Fire Performance and
Criteria Retrieved from http://ircc.azurewebsites.net/new%20page/Workshops/Documents/Austria2007_reportIRCC_workshop.pdf Meeks, C., & Brannigan, V. (1996). Performance based codes: economic efficiency and distributional equity. Paper presented at the International Inter
am Conference, 7th Proceedings March. Meres, R., Sigmon, J., DeWein, M., Garrett, K., & Brown, J. (2012). Successful strategies for improving compliance with building energy codes.
Proceedings of the ACEEE 2012 Summer Study on Energy Efficiency in Buildings, 4, 275-288. Michael Mills. (2010). Regulatory Impact Assessment. Building Act review: Proposals and options for reform Agency Disclosure Statement. Retrieved
from https://treasury.govt.nz/sites/default/files/2017-01/ris-dbh-bar2-jul10.pdf Moullier, T., & Krimgold, F. (2015). Building regulation for resilience: managing risks for safer cities. The World Bank, Washington DC https://www.
gfdrr. org/sites/default/files/publication/BRR% 20report. pdf. Mumford, P. J. (2010). Enhancing Performance-Based Regulation: Lessons from New Zealand's Building Control System. Murphy, K. (2017). Procedural justice and its role in promoting voluntary compliance. Regulatory theory: Foundations and applications, 43-58. NCBCS. (2018). Benefits and Challenges of aTimely Code Adoption Cycle. Retrieved from
https://cdn.ymaws.com/www.nibs.org/resource/resmgr/ncgbcs/NCBCS_TimelyCodeAdoption.pdf Nigel Isaacs. (2018). Why our building regulation just doesn’t cut it. Retrieved from
https://www.newsroom.co.nz/ideasroom/2018/06/06/112722/why-our-building-regulation-just-doesnt-cut-it Nwadike, A., & Wilkinson, S. (2020). Building Code Amendment Process: A Case Study of New Zealand. Retrieved from
https://www.researchgate.net/profile/Amarachukwu_Nwadike/publication/340828395_Building_Code_Amendment_Process_A_Case_Study_o f_New_Zealand/links/5e9ff48092851c2f52ba684c/Building-Code-Amendment-Process-A-Case-Study-of-New-Zealand.pdf
Nwadike, A., Wilkinson, S., & Clifton, C. (2019a, June, 2019). Comparative Insight on Building Code Paradigm Shift Practice and Updates: International Perspectives. Paper presented at the The 4th International Conference on Civil, Structural and Transportation Engineering (ICCSTE'19), Ottawa, Canada
Nwadike, A., Wilkinson, S., & Clifton, C. (2019b). Improving disaster resilience through effective building code compliance. Paper presented at the 9th International i-Rec Conference 2019, University of Florida, Gainesville, United States. https://www.preventionweb.net/events/view/61094?id=61094
Offei-Nketiah, J. K., Kwofie, T. E., & Duah, D. Y. A. (2019). Regulatory Distress: Architects’ Perspective on Enforcement of Building Regulations in Ghana. Paper presented at the Construction Industry Development Board Postgraduate Research Conference.
Olshansky, R. B. (1998). Promoting the adoption and enforcement of seismic building codes: A guidebook for state earthquake and mitiga tion managers: FEMA.
Raman, S. (1997). Sizing up the policy information system for energy efficient construction. Paper presented at the Proceedings of the 1997 ECEEE Summer Study.
Ricciarini Sylvana. (2009). Building codes development, implementation and enforcement. Retrieved from https://www.preventionweb.net/files/globalplatform/entry_presentation~7SylvanaRicciarini.pdf
Rumrill Jr, P. D., & Fitzgerald, S. M. (2001). Using narrative literature reviews to build a scientific knowledge base. Work, 16(2), 165-170. Shoichi Ando. (2008, 28-29 November 2008). Experience of Damages in Recent Earthquakes. Paper presented at the Records and outcomes of
International Symposium 2008 on Earthquake Safe Housing Japan. Spence, R. (2004). Risk and regulation: can improved government action reduce the impacts of natural disasters? Building Research & Information,
32(5), 391-402. Thompson, G. N. (1947). The problem of building code improvement. Law and Contemporary Problems, 12(1), 95-110. Vaughan, E., & Turner, J. (2013). The value and impact of building codes. Environmental and Energy Study Institute White Paper. Wayne Thompson. (2005). Building code change sought to avoid ghetto risk. Retrieved from
https://www.nzherald.co.nz/nz/news/article.cfm?c_id=1&objectid=10354668 Yates, A. (2002). The nexus between regulation enforcement and catastrophic engineering failures. Current Issues in Regulation: Enforcement and
Compliance.

580
The 54th International Conference of the Architectural Science Association (ANZAScA) 2020
Illumination Condition Effect on the Performance of CNN- based Equipment Load Detection for Energy Demand Estimation
Shuangyu Wei1, Paige Tien2, John Calautit3, Yupeng Wu4 1, 2, 3 ,4 University of Nottingham, Nottingham, United Kingdom
{shuangyu.wei1, paige.tien2, john,calautit13, yupeng.wu4}@nottingham.ac.uk
Abstract: The main aim of this paper is to investigate the influence of lighting conditions on the detection accuracy of the vision-based equipment load detection approach. The work will be using artificial intelligence cameras to detect equipment information in different lighting levels, employing deep learning method to analyse and generate real-time equipment usage profiles for offices which can be inputted to the demand-based building controls to increase the efficiency of heating, ventilation, and air-conditioning systems. The performance of the developed approach in various illumination conditions was compared by using a building energy simulation tool. The results showed that as compared with the conventionally-scheduled heating, ventilation, and air-conditioning systems, the system with the use of equipment usage profiles conducted by the proposed approach can achieve up to 15% reduction in energy consumption depending on the setup of the artificial intelligence-enabled camera in terms of indoor lighting levels. The finding indicates that adequate illumination level contributes to the decrease of building energy demand by achieving an effective deep learning approach.
Keywords: Built Environment; Deep Learning; Equipment Detection; Energy Savings.
1. Introduction and literature reviewAs the major energy consumers in the buildings, heating, ventilation and air-conditioning (HVAC) systems consume approximately 40% of the total energy use (Kim et al., 2020). As the growth of global temperature, HVAC systems consumes more energy to maintain a comfortable indoor environment. Thus, an optimal design for HVAC controls is necessary to achieve higher energy efficiency. When designing HVAC system control strategies, equipment heat emission is a significant factor as it is one of the main sources of internal heat gains that affects the cooling loads and requires to be accurately measured or estimated. For office buildings, more electronic devices are installed within the conditioned spaces, and not all devices are in use during the conditioned period. Hence, accurate equipment usage detection is valuable for energy consumption reduction and carbon emission reduction in the built environment. Generally, there are three techniques of detecting and predicting equipment information including presence, mode, location, identity and count – collecting consumption data from power meters (Gandhi and Brager, 2016), clustering from surveys (Wang and Ding, 2015), and forecasting based on occupancy information (Gunay et al., 2016).
Imaginable Futures: Design Thinking, and the Scientific Method. 54th International Conference of the Architectural Science Association 2020, Ali Ghaffarianhoseini, et al (eds), pp. 580–589. © 2020 and published by the Architectural Science Association (ANZAScA).

581
Shuangyu Wei, Paige Tien, John Calautit, Yupeng Wu
Using the collected equipment usage information, the actual thermal demands in different conditioned space can be achieved by adjusting the operation of HVAC systems. Previous studies (Causone et al., 2019) highlighted that the use of conventional control strategies in office buildings such as the use of “static” operation schedules could cause large energy waste in particular during unoccupied hours. There is a potential for increasing energy efficiency by allowing HVAC systems to dynamically react to the indoor-outdoor environment changes instead of using the fixed or “static” control strategies based on the real-time detection and recognition of equipment information and usage. However, common equipment loads detection techniques discussed as above are unable to provide comprehensive and real-time equipment information necessary for demand-driven strategies. This highlights the necessity of the development of strategies such as computer vision and deep learning that can be implemented into building HVAC systems.
Many studies have developed the models to detect different types of objects with high detection accuracy by employing computer vision and deep learning techniques. For instance, the study (Eddine Mneymneh et al., 2019) created a CNN-based framework that can automatically and efficiently detect a failure to wear a hardhat using computer vision techniques applied on videos capture from construction sites. It achieved high precision and recall rates by 90% and 98.5%. However, no work has explored the potential of predicting internal heat gains from equipment usage in office buildings using computer vision and deep learning methods. Building up from our previous research, a computer vision and deep learning-based equipment load detection approach which uses artificial intelligence (AI) enabled cameras is proposed in office building. Due to the use of cameras, the change of environmental and spatial conditions, such as the illumination variations, viewpoints, shadows, and dynamic background scene, could impose great challenges for achieving high detection performance (Mohajan et al., 2019). This paper focuses on exploring the effects of illumination changes on detection performance.
When designing vision-related technology, lighting is a crucial factor to be considered as improper lighting conditions may lead to poor detection performance of the proposed approach and further cause inaccurate building energy demand estimation. Because of the changing sun direction, weather conditions, reflection, and partial or complete obstacle of light source, the illumination conditions of the scene and the target might change greatly (Yazdi and Bouwmans, 2018; Arad et al., 2019). The change of the position of targets is another factor as it changes the orientation of targets relative to the light sources which illuminate them (Kasundra and Warhade, 2014). Many studies have investigated the effects of lighting conditions on detection performance in the virtual world. To simulate the driving scenarios under different lighting conditions, the study (Yang et al., 2017) tested the detection model by controlling the intensity from low to high. In the study (Makihara et al., 2003), authors assessed the performance of the object recognition model for a robot which can bring the specified object to the user under various lighting levels. Though great progress in object detection has been achieved, there is still an issue on the performance of these algorithms under different illumination levels.
The above studies provide valuable insights onto the existing technologies and techniques for detecting the magnitude and patterns of equipment usage and the impact of illumination conditions on the performance of object detection algorithms. Currently, studies on the detection and recognition of equipment usage information and estimation of the associated heat gains from the equipment are limited. The existing techniques have limitations in terms of performing real-time detection and recognition of equipment usage, which can allow the HVAC system to dynamically respond to the changes within the thermal or indoor environment. Although the computer vision and deep learning method could be a feasible way to achieve real-time and automatic response for the proposed system, there are still many challenging problems to solve, such as varying illumination levels in spaces.

582
Illumination Condition Effect on the Performance of CNN- based Equipment Load Detection for Energy Demand Estimation
Furthermore, the detection of multiple equipment usage in a given time frame should be explored. Therefore, to fill these gaps, the proposed approach in this work was developed using computer vision and deep learning techniques to perform real-time equipment usage detection and prediction to create the heat gain or load patterns for HVAC control strategy operation and building energy performance simulations. Moreover, the current study gives an insight into the impact of illumination conditions on the detection performance of vision-based detection and recognition technologies. Therefore, based on our previous work (Wei et al., 2019; Tien et al., 2020), this study further develops the vision-based equipment load detection approach to detect and predict internal heat emission from equipment in office buildings using the Faster RCNN model with InceptionV2 and investigate the influences of varying lighting conditions on the detection performance.
2. Methods
2.1. The proposed framework
In our previous work, a simplified demand-driven framework of this study with the utilization of deep learning and computer vision techniques is proposed and presented in Fig 1. It can be separated into two parts – detection model preparation, and deployment of proposed model and energy assessment. In the first part, a suitable type of deep learning model is selected and modified to meet the requirements of equipment detection. Then a large number of images including different types of office equipment within an office space is collected and randomly divided into training and testing dataset. After labelling both training and testing dataset, the model is trained and tested with the processed dataset and further optimized based on the evaluation of detection and recognition performance. In the second part, the detection model is implemented in an actual office space to generate and cluster the data of equipment detection and recognition with the utilization of an AI-enable camera. The obtained data could then be inputted into the control system to automatically adjust the HVAC operation. To assess its feasibility and analyse its potential impact on building energy use, the data was inputted into a BES software to perform energy modelling. Based on the results of energy performance, the ability of the proposed deep learning-based framework for both optimizing HVAC operations and effectively managing building energy loads could be evaluated. In addition, the influence of illumination levels on the live detection and recognition is considered and different lighting conditions were simulated to investigate it. These obtained results could also contribute to the optimization of computer vision equipment detection model and the design of future buildings and operation strategies. In addition, compared to motion sensors, more applications of this method could be developed such as occupancy recognition and fire detection.

583
Shuangyu Wei, Paige Tien, John Calautit, Yupeng Wu
Figure 1 The outline of the proposed framework
2.2. Equipment detection and recognition
As a deep learning model with CNN architecture produce an accurate performance in computer vision tasks, CNN is selected as the algorithm to perform live equipment detection and recognition in this study. Python and TensorFlow object detection API were employed to implement the equipment detection using the CNN algorithm. According to the comparison of test-time speed of different CNN- based object detection algorithms, Faster region-based CNN (RCNN) is much faster than other algorithms which can even be implemented for live object detection (John, 2019). In addition, as the Inception module could improve the utilization of the computing resources inside the network, it was used together with Faster RCNN to achieve a higher accuracy of the detection task (Galvez et al., 2018). Therefore, in this study, Faster RCNN with InceptionV2 is selected as the equipment detection model to achieve real-time detection and recognition. To carry out the training process, a Graphics Processing Unit (GPU) with 2560 CUDA cores, 1607 MHz graphics clock, 10 Gbps memory clock, and 8 GB GDDR5X memory was used as GPU to perform the implementation of this computationally expensive task.
In order to develop an object detector, a large dataset and proper labelling are essential and significant for achieving a high accuracy and efficiency on detecting objects. Due to the lack of the relevant dataset in previous and current studies, a dataset of 500 images of the PC monitor is created. These images were collected from the google search engine and or taken within real office spaces (different from the space used in the test) by using cameras. According to the rule of thumb, 20% of the images were used for testing and the rest were used for training. Then both training and testing dataset were labelled manually by using LabelImg which is a graphical image annotation tool written in Python. To summarize the detection results of the proposed algorithm, precision, recall and F1 score are used to evaluate the accuracy of the object detection algorithm.

584
Illumination Condition Effect on the Performance of CNN- based Equipment Load Detection for Energy Demand Estimation
2.3. Equipment heat gains calculation
The total heat gains from equipment is the sum of heat emission of different types of office equipment, which is the product of the number of the specific type of equipment in use and the value of heat gain of this equipment. The number of equipment in use is the output of the proposed deep learning-based detection model. As the developed model is not able to detect the practical equipment heat gains so far, the typical values of the heat released from different types of office equipment which can be obtained from CIBSE Guide A will be utilized to calculate the total equipment heat gains in this study.
3. Case study
3.1. Case study building and experiment setup
The open plan office on the first floor of the Sustainable Research Building at the University of Nottingham was selected as the test space to conduct the experiment in the present study. To enable this office as a space to test the developed model, the experimental setup was carried out and presented in Fig 2. A camera with 1080p resolution and a wide 90-degree field of view was installed close to the ceiling in the office space and connected to a computer to perform equipment detection using the trained detection model. Within the detectable range, there are eight monitors (heat rate of 50 W(Duška et al., 2007)) and each monitor is connected with a desktop computer (heat rate of 200 W (Duška et al., 2007)). The equipment usage information was gathered for a whole typical workday by a 1-minute time-lapse interval through the detection model. According to the clustered information, the actual daily equipment load profile could be created. In order to evaluate the effect of employing the proposed model on the energy performance of the case study building, the created equipment load profile will be inputted into a BES software to simulate the energy demand for this office space.
Figure 2 Floor plan and experimental setup of test room

585
Shuangyu Wei, Paige Tien, John Calautit, Yupeng Wu
To evaluate the impact of various illumination levels which is a significant factor affecting the performance of vision-based detection task, twelve scenarios were designed in terms of the different time of a day, various daylighting and artificial lighting conditions. The test under these scenarios was conducted in the morning, afternoon and evening on the same day. Within this office, as the most common way to control the amount of natural light entering the space, opening and closing curtain represent the high and low natural lighting levels respectively. Similarly, artificial lights on and off represents the high and low indoor illumination levels. The details of scenarios are listed in Table 1.
Table 1 Details of different detection scenarios (O = on/opened, X = off/closed)
Morning Afternoon Evening
Scenario 1 2 3 4 5 6 7 8 9 10 11 12 Artificial lighting X X O O X X O O X X O O
Curtain X O O X X O O X X O O X
3.2. Energy simulation
To assess the energy performance of the case study building, IESVE were employed to carry out the energy modelling. The case study building was modelled with several features of the buildings simplified and surrounding buildings and vegetation not taken into account. The Nottingham weather data file was used for the simulations. To evaluate the impact of using the proposed model on the energy performance, the created equipment usage profiles called “deep learning-based profiles” was inputted into IESVE software to simulate the internal heat gains from equipment in the office space. In this study, the equipment is set to be eight PC monitors within the detection scene. The “deep learning-based profiles” illustrated the usage of each equipment and further adjusted the settings of the HVAC operation accordingly. In order to assess the potential of energy savings by using the proposed model, a “typical profile”, which is commonly used in the field or industry when modelling equipment loads or setting the operation of HVAC, was employed for comparison. The equipment usage pattern of the “typical profile” is plotted as Fig 3. The office thermal zone was maintained at 22 °C during these periods.
Figure 3 Typical daily equipment usage profile
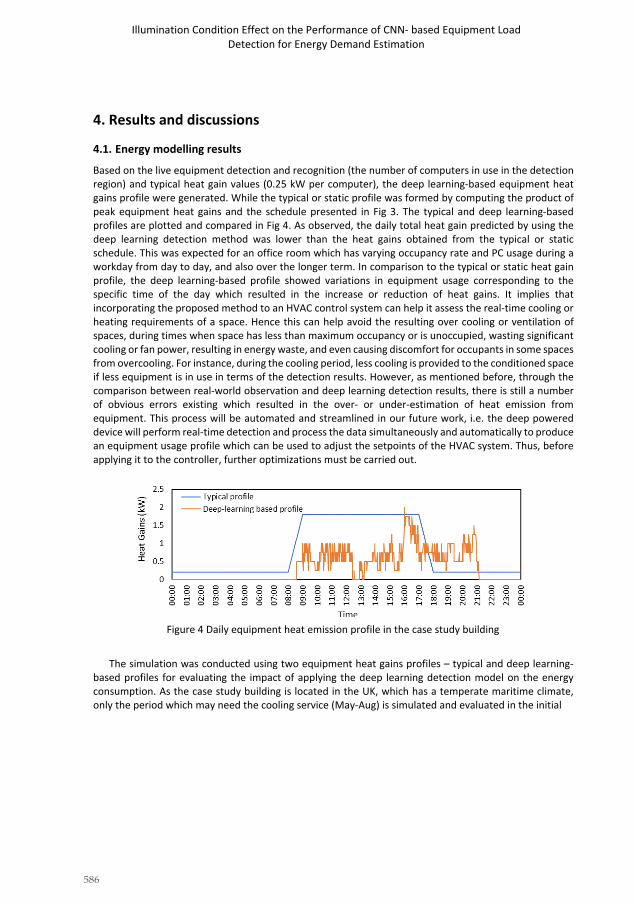
586
Illumination Condition Effect on the Performance of CNN- based Equipment Load Detection for Energy Demand Estimation
4. Results and discussions
4.1. Energy modelling results
Based on the live equipment detection and recognition (the number of computers in use in the detection region) and typical heat gain values (0.25 kW per computer), the deep learning-based equipment heat gains profile were generated. While the typical or static profile was formed by computing the product of peak equipment heat gains and the schedule presented in Fig 3. The typical and deep learning-based profiles are plotted and compared in Fig 4. As observed, the daily total heat gain predicted by using the deep learning detection method was lower than the heat gains obtained from the typical or static schedule. This was expected for an office room which has varying occupancy rate and PC usage during a workday from day to day, and also over the longer term. In comparison to the typical or static heat gain profile, the deep learning-based profile showed variations in equipment usage corresponding to the specific time of the day which resulted in the increase or reduction of heat gains. It implies that incorporating the proposed method to an HVAC control system can help it assess the real-time cooling or heating requirements of a space. Hence this can help avoid the resulting over cooling or ventilation of spaces, during times when space has less than maximum occupancy or is unoccupied, wasting significant cooling or fan power, resulting in energy waste, and even causing discomfort for occupants in some spaces from overcooling. For instance, during the cooling period, less cooling is provided to the conditioned space if less equipment is in use in terms of the detection results. However, as mentioned before, through the comparison between real-world observation and deep learning detection results, there is still a number of obvious errors existing which resulted in the over- or under-estimation of heat emission from equipment. This process will be automated and streamlined in our future work, i.e. the deep powered device will perform real-time detection and process the data simultaneously and automatically to produce an equipment usage profile which can be used to adjust the setpoints of the HVAC system. Thus, before applying it to the controller, further optimizations must be carried out.
Figure 4 Daily equipment heat emission profile in the case study building
The simulation was conducted using two equipment heat gains profiles – typical and deep learning- based profiles for evaluating the impact of applying the deep learning detection model on the energy consumption. As the case study building is located in the UK, which has a temperate maritime climate, only the period which may need the cooling service (May-Aug) is simulated and evaluated in the initial

587
Shuangyu Wei, Paige Tien, John Calautit, Yupeng Wu
tests. It should be noted that the proposed method could also be useful during heating periods i.e. less heating required when there are high heat gains from equipment. Fig 5 presented the simulation results of sensible cooling loads based on the typical and deep learning-based profiles. For the selected period, the model predicted a total cooling load of 4.07 MWh when using the proposed approach in comparison to a typical or static profile which had a total cooling load of 4.78 MWh. It indicated up to 14.92% potential cooling energy saving to be achieved by using the proposed approach. The initial result highlighted that the deep learning technique for equipment detection could influence energy consumption by making the HVAC system adapt to the actual energy demands in real-time. However, it should be noted that the proposed detection model has not been improved to decrease the error, which may lead to inaccurate estimation of the energy demand and further causes an uncomfortable indoor environment for occupants. Moreover, the energy modelling results will vary due to the different buildings and locations and the proposed detection model may perform more effectively in the regions especially with tropical and hot weather where a large amount of cooling is required all over the year. Furthermore, it could also be more effective in spaces where there are many and several types of equipment in use, such as in computer rooms and large open-plan offices. These will be investigated in our future works.
Figure 5 Cooling demand during cooling period in the case study building
4.3. Illumination
In order to investigate the impact of illumination levels, twelve scenarios were designed in terms of the different time of the day and various daylighting and artificial lighting conditions. Table 2 listed the detection performance under different scenarios. It includes the individual values and average values of Precision, Recall and F1 score for all detection scenarios. Based on their definitions, Precision and Recall values can indicate the error rate of the wrong prediction and missed detection, respectively. The results showed that the trained detection model has the ability to identify the desired object under different lighting conditions within the detection region. The selected model achieved lower average Precision of 0.663 and higher average Recall of 0.917, which means that when implementing the detection task, wrong detections were the main errors occurred. F1 score balances these two measures which can sufficiently represent the detection performance with one value. The average value of F1 score of 0.746 indicated that the selected detection model can handle the equipment detection and recognition task excellently with a relatively low error rate. According to the result of F1 score under each scenario as listed in Table 2, it can be observed that at daytime, the value of F1 score is higher

588
Illumination Condition Effect on the Performance of CNN- based Equipment Load Detection for Energy Demand Estimation
when applying sufficient artificial lighting. On the contrary, when applying the indoor lighting on the detected side at nighttime, it resulted in the lower values of F1 score. This may be caused by the over bright illumination conditions around the desired object because in the evening, without the natural light, the illumination level in the whole space decreases which increases the brightness of the light projecting to all the surface. This may result in the surface adjacent to the monitors to be much brighter than usual and further cause the difficulty of detection and recognition. Based on the above analysis, it indicates that different illumination conditions significantly affect the performance of detection task. In other words, lighting conditions may result in either great or poor detection performance which may further affect the building energy demand estimation. To enhance the detection model to adapt to different lighting condition, one important way is to collect sufficient training data of various lighting scenarios for the desired objects.
Table 2 Detection performance under different scenarios Scenario 1 2 3 4 5 6 7 8 9 10 11 12 Average
Precision 0.629 0.578 0.825 0.747 0.543 0.527 0.721 0.758 0.758 0.596 0.608 0.671 0.663
Recall 0.925 0.969 0.975 0.808 1.000 0.986 1.000 0.779 1.000 0.994 0.894 0.694 0.917 F1 score 0.706 0.696 0.874 0.764 0.699 0.669 0.823 0.761 0.853 0.732 0.705 0.672 0.746
5. Conclusion and future worksIn this work, a vision-based equipment load detection approach to detect and predict heat emission from equipment in offices using the Faster RCNN model with InceptionV2 was further developed based on the previous research and implemented under various lighting conditions. Based on the detection results, the trained detection model can identify the desired object under various lighting conditions with a relatively high accuracy which can be represented by the average F1 score of 0.746. The results of energy modelling show that a up to 15% cooling energy reduction was predicted to achieve by employing the proposed approach to obtain the actual equipment heat gains in comparison to using fixed schedule (typical) profile. These findings indicate that this approach presents a desirable detection performance under different illumination levels and a large potential to reduce energy use in buildings by adjusting the HVAC operation in terms of the actual energy demand. However, further improvements of the current approach are required to carry out in future work. To train a robust detection classifier, more images, which have random objects in the image along with the desired objects and a variety of backgrounds and lighting conditions, are required. It can improve the detection model to adapt not only the different lighting conditions but also other variation of environmental and spatial conditions, and further reduce the error rate. Furthermore, the impact of the proposed method on occupants’ thermal comfort will be investigated and the results will be validated with the metered data. Moreover, a further development is necessary to obtain a more advanced equipment profile detection model based on the present approach, which can streamline the real-time data from the output of the proposed model to the HVAC control system.
Acknowledgements The support by the University of Nottingham (Department of Architecture and Built Environment) and the scholarship from Faculty of Engineering is gratefully acknowledged.

589
Shuangyu Wei, Paige Tien, John Calautit, Yupeng Wu
References Arad, B., Kurtser, P., Barnea, E., Harel, B., Edan, Y. and Ben-Shahar, O. (2019) Controlled Lighting and Illumination-
Independent Target Detection for Real-Time Cost-Efficient Applications. The Case Study of Sweet Pepper Robotic Harvesting, Sensors, 19, 1390.
Causone, F., Carlucci, S., Ferrando, M., Marchenko, A. and Erba, S. (2019) A data-driven procedure to model occupancy and occupant-related electric load profiles in residential buildings for energy simulation, Energy and Buildings, 202, 109342.
Duška, M., Lukeš, J., Barták, M., Drkal, F. and Hensen, J. (2007) Trend in Heat Gains from Office Equipment,6th International Conference on Indoor Climate of Building, Strbske Pleso, Bratislava.
Eddine Mneymneh, B., Abbas, M. and Khoury, H. (2019) Vision-Based Framework for Intelligent Monitoring of Hardhat Wearing on Construction Sites, ed.
Galvez, R. L., Bandala, A. A., Dadios, E. P., Vicerra, R. R. P. and Maningo, J. M. Z. (2018) Object Detection Using Convolutional Neural Networks,TENCON 2018 - 2018 IEEE Region 10 Conference, 2023-2027.
Gandhi, P. and Brager, G. S. (2016) Commercial office plug load energy consumption trends and the role of occupant behavior, Energy and Buildings, 125, 1-8.
Gunay, H. B., O’Brien, W., Beausoleil-Morrison, I. and Gilani, S. (2016) Modeling plug-in equipment load patterns in private office spaces, Energy and Buildings, 121, 234-249.
John, P. (2019) Review Paper on Object Detection using Deep Learning- Understanding different Algorithms and Models to Design Effective Object Detection Network, International Journal for Research in Applied Science and Engineering Technology, 7, 1684-1689.
Kasundra, N. and Warhade, K. K. (2014) Performance evaluation of object detection and tracking method under illumination variation,2014 Annual IEEE India Conference (INDICON), 1-6.
Kim, B., Yamaguchi, Y., Kimura, S., Ko, Y., Ikeda, K. and Shimoda, Y. (2020) Urban building energy modeling considering the heterogeneity of HVAC system stock: A case study on Japanese office building stock, Energy and Buildings, 207, 109590.
Makihara, J., Takizawa, M., Shirai, Y. and Shimade, N. (2003) Object recognition under various lighting conditions, Springer-Verlag Berlin Heidelberg, SCIA 2003, LNCS 2749, 899−906.
Mohajan, G., Dhar, P., Ahmed, T. and Shimamura, T. (2019) Moving Object Detection against Sudden Illumination Change Using Improved Background Modeling, ed.
Tien, P. W., Wei, S., Calautit, J. K., Darkwa, J. and Wood, C. (2020) A vision-based deep learning approach for the detection and prediction of occupancy heat emissions for demand-driven control solutions, Energy and Buildings, 226, 110386.
Wang, Z. and Ding, Y. (2015) An occupant-based energy consumption prediction model for office equipment, Energy and Buildings, 109, 12-22.
Wei, S., Tien, P. W., Calautit, J. K. and Wu, Y. (2019) A Novel Deep Learning Approach for Equipment Load Detection for Reducing Building Energy Demand,11th International Conference on Applied Energy, Sweden.
Yang, S., Deng, W. and Liu, Z. (2017) Analysis of Illumination Condition Effect on Vehicle Detection in Photo-Realistic Virtual World, Intelligent and Connected Vehicles Symposium.
Yazdi, M. and Bouwmans, T. (2018) New trends on moving object detection in video images captured by a moving camera: A survey, Computer Science Review, 28, 157-177.

590
The 54th International Conference of the Architectural Science Association (ANZAScA) 2020
Impact of curtainwall facades on apartment overheating
Christopher A. Jensen1, Erika Bartak1, Roberto Petruzzi1, Sisi He1 1University of Melbourne, Melbourne, Australia
{cjensen, ebartak, [email protected], [email protected]}
Abstract: Overheating in Melbourne’s tall apartment buildings presents a unique challenge to occupant comfort with limited opportunity for shading, ventilation and refuge from exposed spaces. As residential apartment buildings increase in height the traditionally commercial ‘curtain wall’ facade system has become a popular option for tall residential apartment building facades. Unlike the balcony and punch window systems typical of lower rise apartment buildings, the curtain wall construction system favours fixed glass, limited ventilation and no shading. Apartments with curtain wall facades, especially when facing west, are the most susceptible residential dwelling group to overheating in Melbourne.
Seven typical curtain wall apartment variants were tested for the Melbourne climate to determine the level of compliance with the recently introduced heating and cooling caps in the National Construction Code (NCC). Of those tested, only 18% complied with the NCC 6 Star cooling cap, and only 10% demonstrated compliance with the stricter Victorian Better Apartment Design Standards (BADS) cooling load targets. These results demonstrate how the curtain wall systems are thermally one-dimensional and ineffective at meeting maximum cooling load limits. Glass performance, improved ventilation, external shading, reduced glass to floor area ratios and west façade specific designs are all potential solutions.
Keywords: Overheating, Apartment, Curtain wall, Cooling load
1. IntroductionModern apartments developments are characterised by a desire for expansive glazed areas that are often limited to a single orientation. As residential apartment buildings have increased in height, designers and builders now favour the curtain wall façade system, which has numerous constructability, time and cost benefits, primarily related to the prefabrication and the ability for installation concurrently with the construction of the super-structure. The curtain wall system consists of panels that are fabricated off-site and then suspended from the superstructure providing efficiencies that cannot be achieved using façade systems typical of older apartment buildings. Such curtain wall façade systems offer very limited opportunities for shading and ventilation, both of which contribute significantly to summer comfort.
Despite being a continent of extreme heat waves, there is currently no comprehensive requirement for summer comfort in Australian buildings. Although changes are progressively improving the National Construction Code (NCC), thermal comfort is not explicitly included as a metric in the assessment of proposed designs. This limitation is partially acknowledged by NCC 2019, which introduced a ‘cap’ on heating and cooling load per dwelling. The Victorian Better Apartment Design Standards (BADS)
Imaginable Futures: Design Thinking, and the Scientific Method. 54th International Conference of the Architectural Science Association 2020, Ali Ghaffarianhoseini, et al (eds), pp. 590–599. © 2020 and published by the Architectural Science Association (ANZAScA).

591
Christopher A. Jensen, Erika Bartak, Roberto Petruzzi, Sisi He
introduced even more stringent cooling load limits, reflecting concern for overheating risks in Victorian apartments. However, both of these measures utilise an annual total cooling load cap and do not adequately account for ‘peak’ cooling requirements as would be experience during heat waves. This paper represents the first stage of a larger study, investigating the risks of, and potential solutions to, overheating in Melbourne curtain wall apartments. This stage of the research intends to quantify the gap between curtain wall apartment buildings recently completed or under construction in Melbourne, with the newly introduced NCC and Victorian BADS cooling load caps.
2. Literature Review
2.1. Curtain Walls
The curtain wall, for many practical reasons including heat, energy, light and aesthetics, has been used extensively in commercial building facade design to create a modern ‘glassy’ appearance (Bedon et al., 2018) . Although the curtain wall system can include up to 100% insulated opaque panels that perform the same as typical walls form a thermal perspective, it is more common to take advantage of the opportunity for large areas of glazing for the benefit of the occupants internally and consistency in the façade externally. In contrast to commercial applications with typically open plan office configurations, the problem of building overheating is emphasised in residential curtain wall buildings due to the small floor area per apartment, which results in a localised concentration of external heat gain. The problem of heatwaves and building overheating in Melbourne and Australia has been well defined, including research on existing apartment buildings ranging from very poor to best practice (Jensen, Cadorel, & Chu, 2017) including low-energy buildings which are characterised by highly insulated airtight envelopes that exacerbate overheating (Mavrogianni, Wilkinson, Davies, Biddulph, & Oikonomou, 2012). Porritt, Cropper, Shao, and Goodier (2012) found that building orientation has a significant impact on overheating exposure, varying by almost 100% among different directions. That is, the buildings with same architectural features may accept totally different amount of solar heat if the building were oriented differently. Other factors like wall insulation, glazing performance and shading devices should be determined associating with building orientation when considering the elements of building envelope to alleviate overheating problems. Ren, Wang, and Chen (2014) demonstrated the importance of shading devices to reduce overheating and note that these are problematic in curtainwall construction. When considering impacts beyond operational and embodied energy, a study by Stephan, Jensen, and Crawford (2017) highlights the problematic high glass to floor area ratio that is characteristic of curtain wall buildings, and its notable contribution to both operational and embodied energy.
2.2. Overheating
Despite the absence of an exact definition of overheating, the international thermal comfort standards such as ISO 7730, ASHRAE Standard 55, and the EN 15251 European Standard have commonly defined overheating as when “the level of indoor temperature exceeds a maximum comfort temperature, and this, over a defined length of time” (Cohen, Munro, & Ruysssvelt, 1993). However, it is difficult to define an accepted definition for overheating because thermal comfort is complicated and subjective. The Building Research and Information (BRI) Journal compiled a special overheating issue (Lomas & Porritt, 2017) in which the findings generally supported the view that:

592
Impact of curtainwall facades on apartment overheating
• Overheating was a significant problem in both existing stock and new buildings, including low energy buildings and generally exceed the performance requirements in the relevant standards;
• Occupant awareness and operation of ventilation was poor and contributed to the overheatingexperienced, and in some cases were more important than climatic and location factors; and
• Research found that dwellings designed to have high levels of winter heat retention in order tomeet thermal design requirements in temperate climates were more exposed to heat stress,resulting in reduced health and wellbeing of occupants.
The findings highlight that overheating is a universal problem to dwellings of all types and ages, is exacerbated by poor occupant knowledge and that the recent focus on improved thermal performance including air tightness are more exposed to heat stress. Currently, most countries, including Australia, do not have regulations or standards regarding overheating of residential buildings, but international thermal comfort standards are developed in some European countries (Lomas & Porritt, 2017). It is important to note that a ‘free-run’ assessment that measures indoor temperature is a separate calculation to the common heating and cooling load assessment which measures the energy requirement of the HVA system to maintain comfort temperatures. However, international thermal comfort standards such as BS EN 15251, ISO 7730 and ASHRAE standard 55-2013 are providing references for the development of Australian thermal comfort standards. Consequently, Australian research institutes are developing overheating standards for free-run residential buildings based on the British CIBSE standard (Chen, 2019), which recommends that the maximum temperature in the living room is 28 degrees, and the maximum thresholds at 28 degrees for living rooms and 26 degrees in bedrooms will not exceed over 1% of annual operation time. According to a research conducted by (Chen D, 2019), there are a large number of residential buildings failing the CIBSE overheating criteria in Australia when assessed in free run mode, while figure 1 indicates that there are 92% of dwellings cannot achieve the CIBSE overheating criteria in Victoria.
Figure 1: Percentage of residential buildings that fail the CIBSE overheating criteria in Australia (retrieved from Chen, Ren & Lane (2019)

593
Christopher A. Jensen, Erika Bartak, Roberto Petruzzi, Sisi He
2.3 Australian Context
Research and investigation into Australia’s lagging Building Energy performance standards now exceeds 15 years (Horne et al., 2005). In 2003, the NCC issued the first National Housing Energy Rating Program (NatHERS) to specify energy targets, for which no overheating assessment is required. NatHERS assesses the parameters of the facade along with climate and occupant default behaviours with the goal of reducing total heating and cooling energy, provide flexibility for innovation and increase industry efficiency. As a performance-based regulation, the regulation provides compliance flexibility through trade-offs and sets minimum requirements for the safety, health, convenience accessibility and sustainability of certain buildings from the perspective of the design and construction of new buildings (Australian Building Codes Board, 2020). There is an assumption in NatHERS star rating regulation that heating and cooling systems can always be used in the house to keep the occupants thermally comfortable, however it has been shown that 5 and 6 Star houses overheat in free-run mode (Chen D, 2019). The future of the NCC requires thermal comfort to be considered alongside total energy performance.
3. Methods
3.1 Determination of compliance specification
Seven ‘typical’ curtain wall apartment types were generated for the purposes of energy modelling using industry standard construction specifications and assemblies, with default occupancy and ventilation settings appropriate to the construction system (Table 1 & 2). A range of curtain wall apartment buildings in Melbourne were reviewed, and a series of typical floor plans were developed for this study to reflect the size and design of common apartment models. The final plans (refer Figure 2) are representative of typical curtain wall apartments available in the current Melbourne market, and include student accommodation (studio), one, two and three-bedroom floor plans (refer Figure 2). Corner variations had additional glazing to elevation B which was modelled for all apartments except the studio (hence 7 total apartment types). All non-external surfaces including floors and ceilings are considered to be adiabatic for the purposes of modelling, and each apartment was rotated through 8 orientations. Each type was considered industry compliant when the worst-case orientation achieved a 5 Star minimum NatHERS rating; this required improving the glazing specification for poor performing apartments. This is a common strategy to achieve compliance with NatHERS ratings, as apartment developments typically obtain planning approval prior to undertaking energy efficiency assessments, therefore limiting façade changes that would require amendment to planning permissions (specifically glazing and external shading devices).

594
Impact of curtainwall facades on apartment overheating
Figure 2: typical apartment layouts tested
The National Construction Code (NCC) 2016 was used as the initial compliance benchmark as many recently constructed and approved apartment towers in Melbourne have been or will be built to this standard. The energy efficiency provisions of NCC 2016 require Class 2 apartments in a Melbourne climate to achieve a 6 Star average NatHERS rating across the development, with no single apartment achieving below 5 Stars. Building compliance was determined using industry standard software FirstRate5 to determine the Star rating and cooling loads.
Table 1: Construction specification
Climate Zone Melbourne NatHERS 21 Site Exposure Exposed, 20m high floor level Element Construction Thermal specs Ceiling Suspended slab 200mm with plasterboard ceiling 50mm R1.5 Rockwool Floor Suspended slab 200mm with carpet / tiles / timber floor finishes Ext. wall: Curtain Insulated spandrel panel (to exposed façade) 75mm R2.27 Rockwool batt
Ext. wall: Party Double stud party walls between apartments (to shared walls) 2 x 70mm R1.6 glasswool batts
Ext. wall: Corridor Insulated stud walls to corridors (to "south" walls) 70mm R1.6 glasswool batt Internal walls Uninsulated studs with plasterboard lining (within apartment) Internal doors 2.1m x 820mm doors Exhaust fans Sealed exhaust fans to Kitchen, Bath, Ensuite, Laundry Downlights Assumed sealed recessed downlights to all rooms Glazing Floor to ceiling curtain wall: aluminium framed double glazing refer below External Shading none

595
Christopher A. Jensen, Erika Bartak, Roberto Petruzzi, Sisi He
Table 2: Glazing improvements required Glazing performance specifications Applies to apartment:
Base case: U: 4.07 SHGC: 0.39 All except below
Improved 1: U: 3.80 SHGC: 0.37 2 Bed, Corner
Improved 2: U: 3.70 SHGC: 0.36 Studio, Mid-row Improved 3: U: 3.12 SHGC: 0.35 1 Bed, Corner
Curtain wall specific settings include the limiting of window openability to 5% in accordance with part 3.4 of the NCC Volume 2 for ventilation, Aluminium window framing – which is captured in the window U-value and SHGC settings, and no shading to windows
3.2 Determination of compliance with Cooling Caps
Following the establishment of a compliant specification, the house energy rating results were compared against the cooling caps introduced in NCC 2019, as well as the cooling load limits outlined in the Victorian Better Apartment Design Standards (BADS). These limits are described in Table 3.
Table 3: Cooling Load limits
Cooling load limits for Class 2 apartments in Melbourne climate zone 21 NCC 2019, 5 Stars 62 MJ/m2.annum NCC 2019, 6 Stars 36 MJ/m2.annum BADS 30MJ/m2.annum
4. ResultsThe Apartment star ratings in table 4 show that mid-row apartments outperform their corner variations for overall thermal performance, due to greater adiabatic wall area and lower glass-to-floor-area ratio. The corner apartments have greater glass-to-floor-area ratios and face multiple orientations, thus having greater exposure to heat loss and gain. While mid-row apartments typically achieved ratings in the 6 and 7 Star range, corner apartments predominantly rated less than 6 Stars.
Apartments with North or Northeast-facing glazing achieved the highest Star ratings, and those with West or Southwest-facing primary glazing achieved the lowest. The Studio was the exception to this, with the South-facing model outperforming its North-facing counterpart, indicating that heat gain to a small apartment has a negative overall effect.
As apartments get smaller, the proportion of glass to net floor area increases, thus reducing thermal performance of the building envelope. The 3-bedroom mid-row apartment performed best overall, with the highest rating of 7.8 Stars for the ideal North-facing orientation, and an average of 6.9 Stars. The 1- bedroom corner apartment performed worst overall, requiring significant glass specification improvement to comply with the 5 Star minimum.
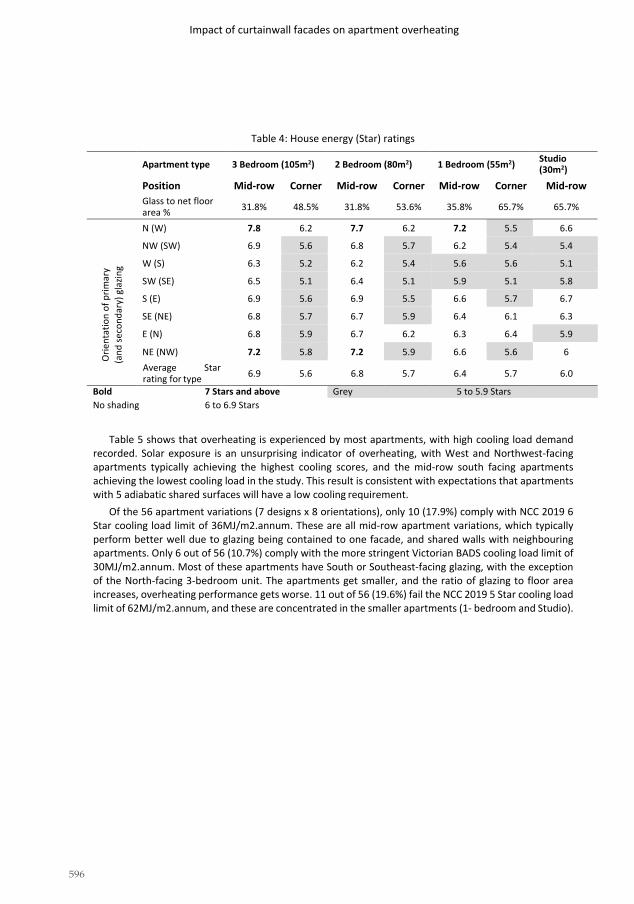
596
Impact of curtainwall facades on apartment overheating
Table 4: House energy (Star) ratings
Apartment type 3 Bedroom (105m2) 2 Bedroom (80m2) 1 Bedroom (55m2) Studio (30m2)
Position Mid-row Corner Mid-row Corner Mid-row Corner Mid-row Glass to net floor area % 31.8% 48.5% 31.8% 53.6% 35.8% 65.7% 65.7%
Orie
ntat
ion
of p
rimar
y (a
nd se
cond
ary)
gla
zing
N (W) 7.8 6.2 7.7 6.2 7.2 5.5 6.6
NW (SW) 6.9 5.6 6.8 5.7 6.2 5.4 5.4
W (S) 6.3 5.2 6.2 5.4 5.6 5.6 5.1
SW (SE) 6.5 5.1 6.4 5.1 5.9 5.1 5.8
S (E) 6.9 5.6 6.9 5.5 6.6 5.7 6.7
SE (NE) 6.8 5.7 6.7 5.9 6.4 6.1 6.3
E (N) 6.8 5.9 6.7 6.2 6.3 6.4 5.9
NE (NW) 7.2 5.8 7.2 5.9 6.6 5.6 6 Average rating for type
Star 6.9 5.6 6.8 5.7 6.4 5.7 6.0
Bold 7 Stars and above Grey 5 to 5.9 Stars No shading 6 to 6.9 Stars
Table 5 shows that overheating is experienced by most apartments, with high cooling load demand recorded. Solar exposure is an unsurprising indicator of overheating, with West and Northwest-facing apartments typically achieving the highest cooling scores, and the mid-row south facing apartments achieving the lowest cooling load in the study. This result is consistent with expectations that apartments with 5 adiabatic shared surfaces will have a low cooling requirement.
Of the 56 apartment variations (7 designs x 8 orientations), only 10 (17.9%) comply with NCC 2019 6 Star cooling load limit of 36MJ/m2.annum. These are all mid-row apartment variations, which typically perform better well due to glazing being contained to one facade, and shared walls with neighbouring apartments. Only 6 out of 56 (10.7%) comply with the more stringent Victorian BADS cooling load limit of 30MJ/m2.annum. Most of these apartments have South or Southeast-facing glazing, with the exception of the North-facing 3-bedroom unit. The apartments get smaller, and the ratio of glazing to floor area increases, overheating performance gets worse. 11 out of 56 (19.6%) fail the NCC 2019 5 Star cooling load limit of 62MJ/m2.annum, and these are concentrated in the smaller apartments (1- bedroom and Studio).

597
Christopher A. Jensen, Erika Bartak, Roberto Petruzzi, Sisi He
Table 5: Compliance as assessed against Cooling Cap requirements
Apartment type 3 Bedroom (105m2) 2 Bedroom (80m2) 1 Bedroom (55m2) Studio (30m2)
Position Mid-row Corner Mid-row Corner Mid-row Corner Mid-row Glass to net area %
floor 31.8% 48.5% 31.8% 53.6% 35.8% 65.7% 65.7%
Orie
ntat
ion
of p
rimar
y (a
nd se
cond
ary)
gla
zing
N (W) 28.5 40.3 33.9 43.2 50.4 76.5 81.8
NW (SW) 45.7 42.9 51.4 41.6 73.3 62.7 112
W (S) 52.7 47 57.1 38.7 78.3 44.6 110
SW (SE) 33.1 39.3 35.9 38 49.4 51.5 70.4
S (E) 17.2 32.3 18.8 37.4 27.4 47.6 42.2
SE (NE) 26 38.1 28.3 38.1 39.4 45.1 57.5
E (N) 41.8 44.7 45.7 41.5 62 48.7 89
NE (NW) 39 53.5 44.1 56.7 61.9 76.2 93
Av cooling (MJ/m2.pa)
load 35.5 42.3 39.4 41.9 55.3 56.6 82.0
Bold < 30 (BADS compliant) Grey > 36 (Fails 6 Star NCC cooling cap)No shading NCC compliant Dark Grey > 62 (Fails 5 Star NCC cooling cap)
5. DiscussionOverheating of the apartments analysed is shown to be largely due to the lack of external shading of glazing, and limited ventilation opportunity for passive cooling, inherent in curtain wall construction. The resulting high cooling load demand means these apartments will be heavily reliant on artificial cooling. This has significant running cost implications for occupants and poses a risk to occupant health if these cooling systems fail or are unable to operate during a blackout event. Although these results are specific to Melbourne, it is likely that warmer climates would experience similar issues.
Although previous studies have demonstrated the relationship between glass area and operational energy performance, the link has not been made to the additional challenges faced by curtain wall apartments in Australian buildings during design and operation, characterised by the easily obtained large glass areas, the lack of options for shading devices and limitations on ventilation due to the curtain wall system itself. This study reveals that only 17.9% of the tested curtain wall apartment models demonstrate compliance with the recently introduced NCC cooling cap. Even worse, only 10.7% of those tested would comply with the more stringent cooling load limits of the Victorian BADS. It is also important to note that a high house energy rating does not guarantee good summer performance – 22 out of 56 apartments (39.3%) achieve a rating of 6 Star or higher but fail the 6 Star cooling load limit. Two of the studio apartments with ratings 6 Star or higher failed the comparatively easier 5 Star cooling load limit. Although specific to apartments, these findings support previous findings by Chen, Ren & Lane (2019) of significant overheating issues in residential buildings in Melbourne.

598
Impact of curtainwall facades on apartment overheating
In order to achieve an acceptable level of comfort in the absence of air-conditioning new buildings must more accurately calculate the free-running performance of the apartments which is likely to lead to development of shading and ventilation solutions for curtain wall systems. Potential solutions include the development and promotion of more widespread use of spandrel panels in curtain wall system in order to address the over glazing problem, and the options for improved natural ventilation opportunities through double facades, louvres or other glazing that maximises open area without compromising safety – as was typical of the traditional balcony sliding door solution of smaller and older buildings. Althoughglass area is constrained by the current energy focussed 6-star standard, this can also be further improved by performing free-running assessments. And at some point, architects need to accept that thermalperformance is best served by façade orientation-specific solutions. The relatively recent introduction ofboth NCC 2019 cooling caps and Victorian BADS cooling caps will go some way towards achieving thisoutcome, and with the benefit of working within the existing rating system. The cooling cap requirements is likely to impact tall curtain wall apartment buildings that previously were able to meet minimum energy standard (i.e. Star ratings) but cannot meet the new cooling caps. But it is through the introduction of afree-running ‘overheating’ indoor temperature based assessment as is used overseas in locations with less extreme heatwaves than are experienced in Melbourne that will result in acceptable indoor temperatures in curtain wall apartments (amongst other dwellings) in the absence of air-conditioning.
6. ConclusionThe purpose of this study was to establish a baseline comparison of typical Melbourne curtain wall apartment designs and construction with regards to NCC compliance (NatHERS Star ratings, and cooling load limits) as well as Victorian BADS cooling load limits. The results show that the inherent limitations of curtain wall facades systems including the opportunity for large glazed areas, the limitations in external shading devices and the difficulty in achieving effective ventilation make meeting the new cooling load maximums a real challenge. In the face of increasing heatwaves, buildings built to current standards will remain reliant on HVAC systems in order to achieve acceptable indoor temperatures. Future stages of this work will be two-fold: to review these typical apartment models and performance outcomes against international standards for overheating and thermal comfort; and to explore design changes to improve overheating performance, such as balconies, external shading devices, improved opportunity for cross ventilation, and likely critically, design solutions that are unique to each of the main facades of the building. Replication of the study for other Australian cities would also broaden the understanding of overheating for apartment buildings in different climate zones.

599
Christopher A. Jensen, Erika Bartak, Roberto Petruzzi, Sisi He
References Australian Building Codes Board. (2020). National Construction Code. Retrieved from https://ncc.abcb.gov.au/ncc-
online/About. Bedon C., Zhang X., Santos F., Honfi D., Kozłowski M., Arrigoni M., . . . Lange D. (2018). Performance of structural glass
facades under extreme loads–Design methods, existing research, current issues and trends. Construction and Building Materials, 163, 921-937.
Chen D. (2019). Overheating in residential buildings: Challenges and opportunities. In: SAGE Publications Sage UK: London, England.
Chen D R. Z., Lane B,;. (2019). The hot issue in houses we have to deal with. Retrieved from https://ahd.csiro.au/the-hot-issue-in-houses-we-have-to-deal-with/
Cohen R., Munro D. & Ruysssvelt P. (1993). Overheating criteria for non-air conditioned buildings. Paper presented at the Proceedings of CIBSE National Conference, UK.
Horne R., Hayles C., Hes D., Jensen C., Opray L., Wakefield R. & Wasiluk K. (2005). International comparison of building energy performance standards. Report to Australian Greenhouse Office, Department of Environment and Heritage.
Jensen C. A., Cadorel X. & Chu A. (2017). Ventilation for Reduced Heat Stress in Apartments. Back to the Future: The Next, 50, 615-624.
Lomas K. J. & Porritt S. M. (2017). Overheating in buildings: lessons from research. Building Research & Information, 45(1-2), 1-18. doi:10.1080/09613218.2017.1256136
Mavrogianni A., Wilkinson P., Davies M., Biddulph P. & Oikonomou E. (2012). Building characteristics as determinants of propensity to high indoor summer temperatures in London dwellings. Building and environment, 55, 117-130.
Porritt S. M., Cropper P. C., Shao L. & Goodier C. I. (2012). Ranking of interventions to reduce dwelling overheating during heat waves. Energy and Buildings, 55, 16-27.
Ren Z., Wang X. & Chen D. (2014). Heat stress within energy efficient dwellings in Australia. Architectural Science Review, 57(3), 227-236.
Stephan A., Jensen C. A. & Crawford R. H. (2017). Improving the Life Cycle Energy Performance of Apartment Units through Façade Design. Procedia Engineering, 196, 1003-1010. doi:https://doi.org/10.1016/j.proeng.2017.08.042

600
The 54th International Conference of the Architectural Science Association (ANZAScA) 2020
Improving empathic evaluations in virtual reality for marketing of housing projects
Athira Azmi1, Rahinah Ibrahim2, Maszura Abd Ghafar3 and Ali Rashidi4 1, 2,3 University Putra Malaysia, Selangor, Malaysia
[email protected], rahinah 2, [email protected] 4 Monash University, Melbourne, Australia
Abstract: Virtual reality technology has been proven in various research as an effective visualisation tool. This research examines the potentials of virtual reality as a pre-purchase evaluation tool for potential homebuyers to facilitate home purchase decisions. An experiment was conducted to determine whether virtual reality could replace the real environment evaluation of housing design based on emotion and behavioural responses. Results of the experiment suggest that there are no significant differences in the emotions evoked in real and virtual environment. The structural model assessments using PLS-SEM also revealed that atmospherics significantly and positively affect pleasure and arousal emotions. Pleasure was also found to positively influence home purchase intention. This paper highlights practical implications of virtual reality to be strategically applied as a tool for design evaluation especially in the housing industry for better housing design that is more empathic, user- centred and satisfies the emotional and social needs of potential homebuyer.
Keywords: Built environment informatics; virtual reality; empathic design; user-centred design.
1. IntroductionThe home buying process is a complex social process that entangles emotions, economy, perceptions of family life and living lifestyle (Levy, Murphy, & Lee, 2008). It is already well established and proven in many researches that price and affordability of the dwelling are the main attributes that influence home purchase (Hasanudin & Chandra Sakaran, 2016; Kam, Lim, Al-Obaidi, & Lim, 2018; Mariadas, Abdullah, & Abdullah, 2019; Olanrewaju & Wong, 2019; Olanrewaju & Woon, 2017; Tan, 2013; Thanaraju, Mentaza Khan, Juhari, Sivanathan, & Md Khair, 2019; Zainon, Mohd Rahim, Sulaiman, Abd Karim, & Hamzah, 2017).
However, this paper found that there are limited studies in the housing industry, where digital visualisation technique such as virtual reality (VR) could be utilized to revolutionize how homebuyers could evaluate the house to purchase for a more satisfactory house purchase decision. The aim of this paper is to investigate whether VR could facilitate understanding regarding how spaces influence emotion and home purchase intention. Henceforth, this study had focused on integrating the concept of understanding emotion or empathy in pre-purchase house evaluation with the application of VR. In this
Imaginable Futures: Design Thinking, and the Scientific Method. 54th International Conference of the Architectural Science Association 2020, Ali Ghaffarianhoseini, et al (eds), pp. 600–609. © 2020 and published by the Architectural Science Association (ANZAScA).

601
Athira Azmi, Rahinah Ibrahim, Maszura Abd Ghafar and Ali Rashidi
paper, the authors present the potentials of VR for emphatic evaluations of housing project under development in view of adding a valuable advantage for residential real estate marketing initiatives.
2. Literature Review
2.1. Stimulus – Organisms – Response (S-O-R Framework)
The theoretical backdrop for this paper is based on the widely applied and extended Stimulus-Organism- Response (S-O-R) framework by Mehrabian and Russell (1974) to explain consumer behaviour in an environment that consists of three key components – stimulus, organism and response. Although the original S-O-R framework was developed more than 45 years ago, this study believes that the S-O-R framework is superior to other theories on consumer behaviours to be used in this study. The S-O-R framework is proven to be the most extensively applied and commonly used theoretical foundation in consumer behaviour studies, especially to explain consumers’ purchase intentions (Chan, Cheung and Lee, 2017).
This framework is highly adaptable and has been widely applied to explain behaviours in various fields of studies such as sport service environments (Kim, Byon, Baek, & Williams, 2018), online social network environment (Cao & Sun, 2018) and workplace and organizational behaviours (Attiq, Rasool, & Iqbal, 2017). Since this framework has not been widely examined in the virtual environment and the housing context, this research will contribute to this theory by adapting and extending its applicability to explain potential homebuyers’ behaviour in a VR environment. The S-O-R framework also provides a parsimonious and structured theoretical lens (Floh & Madlberger, 2013; Luqman, Cao, Ali, Masood, & Yu, 2017; Tang, Warkentin, & Wu, 2018) to examine and explore the effects of VR features on potential homebuyers’ emotional reactions and subsequently, influences their intention to purchase the house. Due to these reasons, this study believes that the S-O-R framework is appropriate to be applied in this study.
2.1.1. Atmosphere as the Stimuli (S) component
Stimulus is the external cues that triggers individual’s emotional responses. The atmosphere is the quality of the surrounding space that could be apprehended through human main sensory channels – sight, sound, scent and touch; and are proven to influence consumer behaviours (Choi & Kandampully, 2018; Tantanatewin & Inkarojrit, 2017). This study proposed that the atmospheric properties in the virtual environment is the stimulus component that could stimulate potential homebuyers’ emotions. The following hypotheses are proposed for this study:
H1: There is no significant difference in the atmospheric appraisal of the house between the real environment and virtual environment. H1a: Atmospheric appraisal have a positive effect on potential homebuyers’ pleasure emotion. H1b: Atmospheric appraisal have a positive effect on potential homebuyers’ pleasure emotion.
2.1.2. Pleasure and Arousal Emotions as the Organism (O) component
Mehrabian and Russell (1974) defined organisms as the internal evaluations or primary emotional responses to the stimulus exerted. Pleasure is defined as the degree to which a person feels happy or satisfied within an environment, while arousal refers to an individual’s degree of excitement, alert and stimulation triggered by the stimulus. This study hypothesized that:

602
Improving empathic evaluations in virtual reality for marketing of housing projects
H2: There is no significant difference in pleasure emotion between the real environment and virtual environment. H3: There is no significant difference in arousal emotion between the real environment and virtual environment. H2a: Pleasure has a positive effect on purchase intention. H3a: Arousal has a positive effect on purchase intention.
2.1.3. Purchase Intention as the Response (R) component
In the original S-O-R framework, the response (R) component represents the behavioural outcomes- approach or avoidance behaviour, which is the result of the emotional reactions. This study proposed that pleasure and arousal emotions when viewing the house could influence potential homebuyers’ purchase intention. The following hypothesis to be tested is posed:
H4: There is no significant difference in purchase intention between the real environment and virtual environment. Overall, Figure 1 summarises the relationships between the stimuli factor – atmospheric appraisal;
emotional factors – pleasure and arousal; and their influence on potential homebuyers’ purchase intentions.
Figure 1: Proposed theoretical framework and hypotheses
3. Research Methodology
3.1. Experimental Design
A randomized crossover study design was used in this study. Each participant visited two different environments – real environment and virtual environment. The order of presentation of two different environments were randomized, and each visit occurred on the same day to minimize the order effect. The study design is illustrated in Figure 2.

603
Athira Azmi, Rahinah Ibrahim, Maszura Abd Ghafar and Ali Rashidi
Figure 2: Experiment Procedure
3.2. Model and Apparatus
A real mock-up show unit that was already constructed by a local property developer at a one-to-one scale was used as the model. For the virtual environment, Sketchup Pro 2019 Version 19.3 was used to create an identical model of the apartment unit in 3D with similar dimensions, furniture, interior decorations and lighting conditions. Enscape Version 2.6.1 was employed for real-time VR rendering.
The tools used for the VR system was HTC Vive. HTC Vive system has one head-mounted devide (HMD), two wireless controllers and two base stations which tract both the controller and the HMD positions. The computer used for 3D modelling in Sketchup and rendering of the model in Enscape was a Dell G7 15 7588 laptop with Intel Core i7 processor and NVIDIA GeForce GTX 1050 graphics card. The specifications on this computer satisfies the system requirements for HTC Vive. Figure 3 shows the real show unit and the virtual show unit that was developed using Sketchup and Enscape software.
a) Real environment b) Virtual environment
Figure 3: Example of real and virtual environment of the apartment unit

604
Improving empathic evaluations in virtual reality for marketing of housing projects
3.3. Questionnaire Development
A set of self-reported questionnaires were used as the instrument to measure participants’ response from both experimental conditions. In this study, atmospheric appraisals were collected in six items with a bipolar 7-point semantic differential scale (e.g., pleasant-unpleasant, inviting-univiting, cozy-not cozy, boring-interesting, monotone-varied, and meaningless-impressive), based on combined evaluative concepts from De Kort et al. (2003), Westerdahl et al. (2006), Franz and Wiener (2008) and Kuliga et al. (2015). Pleasure was measured with a bipolar 7-point semantic differential scale with the following three items: happy-unhappy, bored-entertained and annoyed-pleased (Bigneá, Andreu, & Gnoth, 2005). Similarly, arousal was measured with a bipolar seven-point semantic differential scale with the following three items: calm-enthusiastic, relaxed-stimulated, and indifferent-surprised. Purchase intention is measured by means of even-point Likert scales with three items adapted from past studies (Van Kerrebroeck, Brengman, & Willems, 2017).
3.4. Participants
The target population for this study is potential first-time homebuyers. Respondents were recruited using purposive sampling technique, which allowed the researchers to select participants who were valid, informative and that was deemed appropriate for analysing the effect under study (Sarstedt, Bengart, Shaltoni, & Lehmann, 2018). To ensure statistical power of the experimental results of this study, an a priori power analysis using G*Power 3.1 was conducted to determine the minimum sample size required for paired sample t-test analysis.
The results form G*Power 3.1 indicated that the minimum sample size of 27 was required to achieve a power of 80% with a medium effect size. Furthermore, this study adopts the minimum sample size based on the PLS-SEM rule of thumb which is the “ten times rule” (Hair, Ringle, & Sarstedt, 2011). Therefore, based on the G*Power calculations, the sample size from similar previous experimental studies and consideration of additional provision of respondents anticipated for dropout, a total of 65 participants recruited in this experiment were adequate.
3.5. Experiment Procedure
As illustrated in Figure 2, participants were randomly assigned to experience one of the experimental conditions first, followed by the other experimental conditions (e.g. RE then VE, or VE then RE). This counterbalancing procedure was done to eliminate any order effects, following the procedure conducted by similar experimental studies by Heydarian et al. (2015), Kuliga et al. (2015) and Hong et al. (2019). The five-minute washout or break period in between the environments follows previous similar experiment conducted by Heydarian et al. (2015) and Hong et al. (2019) to reduce the carry-over effect.
Once all participants have experienced the apartment unit in the two experimental conditions and completed the questionnaires, they were given cash as compensation and dismissed. Out of the 65 participants recruited for the experiment, two participants felt dizziness after wearing the HTC Vive HMD and unable to complete the experiment, while three participants did not complete the questionnaire accordingly. Therefore, the analysis for this study is based on the response from 60 participants.

605
Athira Azmi, Rahinah Ibrahim, Maszura Abd Ghafar and Ali Rashidi
4. Results and Analyses
4.1. Paired samples t-test results
For the evaluation of the atmospherics, the p-value (p = 0.000 < 0.05) indicates that there is a significant difference between the mean values of atmospheric appraisal ratings in the real environment (M = 6.06, SD = 0.75) and virtual environment (M = 5.51, SD = 1.24); t (59) = 3.80, p < 0.05, d = 0.49. Therefore, hypothesis H1 was not supported. For pleasure emotion, the results indicate that there was no significant difference (p = 0.087 > 0.05) in the ratings of pleasure emotion in real environment (M = 5.97, SD = 0.89) and ratings of pleasure emotion in virtual environment (M = 5.70, SD = 1.20); t (59) = 1.74, p > 0.05, d = 0.22. For arousal emotion, the result also indicates that there was no significant difference (p = 0.503 > 0.05) in the ratings of arousal emotion in real environment (M = 5.52, SD = 1.20) and arousal in virtual environment (M = 5.66, SD = 1.20); t (59) = -0.67, p > 0.05, d = 0.09. Thus, these results support H2 and H3. However, the results for purchase intention did not support hypothesis H4. The paired samples t-test results indicate that there was a significant difference (p = 0.006 < 0.05) in the ratings for the purchase intention in the real environment (M = 5.961, SD = 0.961) and the purchase intention in the virtual environment (M = 5.556, SD = 1.247); t (59) = 2.875, p < 0.05, d = 0.37. Table 1 summarizes the results for the paired samples t-test.
Table 1: Summary of the paired samples t-test results
Constructs Mean Std. Deviation Mean t-statistics p-value EffectRE VE RE VE difference size, d
Atmospherics 6.06 5.51 0.746 1.24 0.55 3.80 0.000 0.49
Pleasure 5.97 5.70 0.891 1.20 0.26 1.74 0.087 0.22
Arousal 5.52 5.66 1.203 1.19 0.13 -0.67 0.503 0.09
Purchase Intention 5.96 5.56 0.961 1.25 0.41 2.88 0.006 0.37
4.2. Structural model assessments using PLS-SEM
4.2.1. Measurement model
The result indicates that all the indicator loadings on their corresponding latent variables in both environments and the CR coefficients of all reflective latent variables in the path model were higher than 0.70. These results indicate that the measurement model possessed acceptable reliability. To establish convergent validity, the AVE should be higher than 0.50 (Hair et al., 2017). Results indicates that the AVE values were higher than 0.50 for all constructs. Table 2 indicates that all constructs established discriminant validity where the square root of AVE is greater than the correlations for all reflective constructs.

606
Improving empathic evaluations in virtual reality for marketing of housing projects
Table 2: Discriminant validity using Fornell and Larcker Criterion
ATM PLE ARO PUR ATM PLE
0.897* 0.874 0.916*
ARO 0.840 0.888 0.891* PUR 0.633 0.576 0.444 0.948* Note: The diagonal elements (in bold) represent the square root of the AVE, while the off diagonals represent the correlations among constructs. * indicates that discriminant validity has been established
4.2.2. Structural model assessments
Based on the assessment of the path coefficient as shown in Table 5, three relationships are found to have t-value > 1.645, thus significant at 0.05 level of significance, except for the relationship between arousaland purchase intention. Atmospherics has a significant positive effect on Pleasure (β= 0.875, t = 20.25, p< 0.05), which explains 76.6% of variance in Pleasure. Thus, H1a is supported. Atmospherics also has asignificant positive effect on Arousal (β= 0.841, t = 13.08, p < 0.05) which explains 70.7% of variance inArousal; hence supporting H1b. Pleasure has a significant positive effect on Purchase Intentions (β= 0.857, t = 4.07, p < 0.05); supporting H2a. However, the result indicates that Arousal has a small insignificantnegative effect on Purchase Intention (β= -0.318, t = 1.250, p > 0.05); therefore, H3a is not supported. BothPleasure and Arousal explains 35.2% of variance in Purchase Intention. All coefficient determinationvalues (R2) are above the 0.26 value as suggested by Cohen (1988), which indicates substantial model.
In addition, the effect sizes (f 2) are also assessed in SmartPLS 3.2.8 as both the substantive significance (effect size) and statistical significance (p-values) are essential results to be reported (Sullivan & Feinn, 2012). To measure the effect size, this study follows the guideline by Cohen (1988), whereby the values of 0.02 represent a small effect size, 0.15 represent a medium effect size, and 0.35 represent large effect size.
Table 3: Hypothesis testing results
Relationships Std beta (β) Std dev t - value p - value Supported R2 Effect size (f2) H1a Atmospherics → 0.875 0.043 20.247 0.000 Yes 0.766 3.270
Pleasure H1b Atmospherics → 0.841 0.064 13.084 0.000 Yes 0.707 2.415
Arousal H2a Pleasure → 0.857 0.211 4.072 0.000 Yes 0.240
H3a
Purchase Intention Arousal → Purchase
-0.318 0.254 1.250 0.106 No
0.352 0.033
Intention
From Table 3, it can be observed that Atmospherics has a substantial effect in producing the R2 for Pleasure (f 2 = 3.270) and Arousal (f 2 = 2.415). Moreover, the result indicates that Pleasure has a medium effect size in producing the R2 for Purchase Intention (f 2 = 0.240). Furthermore, Arousal has a

607
Athira Azmi, Rahinah Ibrahim, Maszura Abd Ghafar and Ali Rashidi
near to small effect in producing the R2 for Purchase Intention (f 2 = 0.033). Figure 5 illustrates the results of the structural model assessment using PLS-SEM.
Figure 4: Results of the structural model assessment
4.3. Analyses
The purpose of this study was to examine whether VR could be an effective approach as a pre-purchase evaluation tool for potential homebuyers to emotionally experience a house before making purchase decisions. An experiment was conducted to evaluate the potential homebuyers’ response in terms of atmospheric appraisal, pleasure and arousal emotions, as well as their purchase intention through a set of questionnaires and compared participants’ response on a set of identical questionnaires in a real and virtual environment with the same design.
The analysis using paired samples t-test and PLS SEM resulted in several important findings. Firstly, this study found that there was a statistically significant difference (p = 0.000 < 0.05) in how potential homebuyers rate the atmospheric qualities of a house between a real and virtual environment (MRE = 6.06, SDRE = 0.75; MVE = 5.51, SDVE = 1.24); t (59) = 3.80, p < 0.05, d = 0.49. Secondly, the study found that there was a statistically significant difference (p = 0.006 < 0.05) in the purchase intention between real environment and virtual environment (MRE = 5.961, SDRE = 0.961; MVE = 5.556, SDVE = 1.247); t (59) = 2.875, p < 0.05, d = 0.37. However, there is no significant difference in the pleasure (p = 0.087 > 0.05) and arousal emotions (p = 0.503 > 0.05) evoked in these two different environments. The structural model assessment in PLS-SEM reveal that atmospherics has a significant positive effect on pleasure emotion (β= 0.875, t = 20.25, p < 0.05), and arousal emotion (β= 0.841, t = 13.08, p < 0.05. Pleasure also has a significant positive effect on purchase intention (β= 0.857, t = 4.07, p < 0.05).
This finding corresponds to the findings of study by Kuliga et al. (2015). The difference in evaluation of the atmospherics between the two environments could be explained by the lower level of experiential realism in the virtual environment which is lower than that of real environment (de Kort et al., 2003). Due to the significant difference in atmospherics evaluations between real and virtual environment, this study proposed that for VR to be used for pre-purchase evaluations, the quality and vividness of the virtual environment should be enhanced. Furthermore, it is suggested for housing

608
Improving empathic evaluations in virtual reality for marketing of housing projects
developers to invest in sound and haptics systems, position tracking sensors and wireless HMD for users to walk naturally and have more intuitive interaction within the virtual environment that would notably improve the comparability of experience in VR. Secondly, another important finding from this study is regarding the capacity of the virtual environment to evoke similar emotions of pleasure and arousal as in the real environment. The results found in testing the path coefficients using PLS-SEM revealed that pleasure emotion has a significantly positive effect on purchase intention, which coincide the results found in previous research.
5. ConclusionThe findings in this study has successfully extended the current knowledge in residential real estate literature. The findings in this study revealed that potential homebuyers could induce the same emotion when viewing a house in the virtual environment as they would when visiting a real show unit or mock- up model of the house. Therefore, for VR to successfully be used as the pre-purchase emphatic evaluation tool to influence purchase intention, it is important for the designers present the living environment with an aim to provide potential homebuyers with the utmost pleasure while experiencing the house in VR.
This study contributes in extending the applicability of the S-O-R framework to a new and important research field focusing on VR and its applications in the housing industry. The theoretical framework proposed is expected to provide a new paradigm for researchers, residential real estate developers as well as building designers to tackle new strategy for influencing home purchase using VR. Furthermore, it is important to note that the experimental realism of this study is maximized by conducting the experiment in a naturalistic setting where actual consumption or homebuying experience takes place, to observe and measure responses (Morales, Amir, & Lee, 2017). This study had also recruited real potential homebuyers instead of recruiting students as the participants in the experiment thereby, extending the generalizability of the findings with larger realistic impact.
6. ReferencesBigneá, J. E., Andreu, L., & Gnoth, J. (2005). The theme park experience: An analysis of pleasure, arousal and
satisfaction. Tourism Management, 26, 833–844. Chan, T. K., Cheung, C. M., & Lee, Z. W. (2017). The state of online impulse-buying research: A literature analysis.
Information and Management, 54(2), 204–217. Chin, W. W. (2010). How to Write Up and Report PLS Analyses BT - Handbook of Partial Least Squares: Concepts,
Methods and Applications (V. Esposito Vinzi, W. W. Chin, J. Henseler, & H. Wang, eds.). Cohen, J. (1988). Statistical Power Analysis for the Behavioral Sciences Second Edition (2nd ed.). de Kort, Y. A. W., Ijsselsteijn, W. A., Kooijman, J., & Schuurmans, Y. (2003). Virtual Laboratories: Comparability of
Real and Virtual Environments for Environmental Psychology. Presence, 12(4), 360–373. Franz, G., & Wiener, J. M. (2008). From Space Syntax to Space Semantics: A Behaviorally and Perceptually Oriented
Methodology for the Efficient Description of the Geometry and Topology of Environments. Environment and Planning B: Planning and Design, 35(4), 574–592.
Hair, J. F., Hult, G. T. M., Ringle, C. M., & Sarstedt, M. (2017). A Primer on Partial Least Squares Structural Equation Modeling (PLS-SEM). In SAGE (2nd ed.). USA: SAGE Publications, Inc.
Hair, J. F., Ringle, C. M., & Sarstedt, M. (2011). PLS-SEM: Indeed a silver bullet. Journal of Marketing Theory and Practice, 19(2), 139–151.

609
Athira Azmi, Rahinah Ibrahim, Maszura Abd Ghafar and Ali Rashidi
Hasanudin, M. T. T., & Chandra Sakaran, K. (2016). Prioritisation of key attributes influencing the decision to purchase a residential property in Malaysia: An analytic hierarchy process (AHP) approach. International Journal of Housing Markets and Analysis, 9(4), 446–467.
Hong, T., Lee, M., Yeom, S., & Jeong, K. (2019). Occupant responses on satisfaction with window size in physical and virtual built environments. Building and Environment, 166.
Kam, K. J., Lim, A. S. H., Al-Obaidi, K. M., & Lim, T. S. (2018). Evaluating Housing Needs and Preferences of Generation Y in Malaysia. Planning Practice and Research, 33(2), 172–185.
Kuliga, S. F., Thrash, T., Dalton, R. C., & Hölscher, C. (2015). Virtual reality as an empirical research tool-Exploring user experience in a real building and a corresponding virtual model.
Levy, D., Murphy, L., & Lee, C. K. C. (2008). Influences and emotions: Exploring family decision-making processes when buying a house. Housing Studies, 23(2), 271–289.
Mariadas, P. A., Abdullah, H., & Abdullah, N. (2019). Factors Influencing the First Home Purchase Decision of Middle- Income Earners (M40) in Selangor, Malaysia. Journal of Social Sciences and Humanities, 16(1), 1–11.
Mehrabian, A., & Russell, J. A. (1974). An approach to environmental psychology. The MIT Press. Morales, A. C., Amir, O., & Lee, L. (2017). Keeping it real in experimental research-understanding when, where, and
how to enhance realism and measure consumer behavior. Journal of Consumer Research, 44(2) Olanrewaju, A. L., & Wong, Hw. C. (2019). Evaluation of the requirements of first time buyers in the purchase of
affordable housing in Malaysia. Journal of Housing and the Built Environment, Olanrewaju, A. L., & Woon, T. C. (2017). An exploration of determinants of affordable housing choice. International
Journal of Housing Markets and Analysis, 10(5), 703–723. Rasoolimanesh, S. M., Ringle, C. M., Jaafar, M., & Ramayah, T. (2017). Urban vs. rural destinations: Residents’
perceptions, community participation and support for tourism development. Tourism Management, 60, 147– 158.
Sarstedt, M., Bengart, P., Shaltoni, A. M., & Lehmann, S. (2018). The use of sampling methods in advertising research: a gap between theory and practice. International Journal of Advertising, 37(4), 650–663.
Sullivan, G. M., & Feinn, R. (2012). Using Effect Size—or Why the P Value Is Not Enough . Journal of Graduate Medical Education, 4(3), 279–282.
Tan, T. H. (2013). Affordable Housing for First-Time Homebuyers: Issues and Implications from the Malaysian Experience. Pacific Rim Property Research Journal, 19(2), 199–209.
Thanaraju, P., Mentaza Khan, P. A., Juhari, N. H., Sivanathan, S., & Md Khair, N. (2019). Factors Affecting the Housing Preferences of Homebuyers in Kuala Lumpur. Journal of the Malaysian Institute of Planners, 17(1), 138–148.
Van Kerrebroeck, H., Brengman, M., & Willems, K. (2017). When brands come to life: experimental research on the vividness effect of Virtual Reality in transformational marketing communications. Virtual Reality, 21(4), 177– 191.
Westerdahl, B., Suneson, K., Wernemyr, C., Roupé, M., Johansson, M., & Allwood, C. M. (2006). Users’ evaluation of a virtual reality architectural model compared with the experience of the completed building. Automation in Construction, 15(2), 150–165.
Zainon, N., Mohd Rahim, F. A., Sulaiman, S., Abd Karim, S. B., & Hamzah, A. (2017). Factors Affecting the Demand of Affordable Housing among the Middle-Income Groups in Klang Valley Malaysia. Journal of Design and Built Environment, 1–10.
Acknowledgements This paper is part of the PhD requirement by the first author in the field of Integrated Design Studies in the Built Environment Informatics Research Group at Universiti Putra Malaysia under Tenaga Akademik Muda (TAM) scheme. The research team would like to acknowledge the support of Sime Darby Property Sdn. Bhd. for their contribution to this project.

610
The 54th International Conference of the Architectural Science Association (ANZAScA) 2020
Indoor air quality in South East Queensland dwellings during 2019-2020 bushfires
Fan Zhang1, and Rodney Stewart2
1, 2 Griffith University, Gold Coast, Australia {fan.zhang1, r.stewart2}@griffith.edu.au
Abstract: Australia has experienced the longest bushfire season in 2019–2020 summertime. This study investigates the indoor air quality, represented by indoor air temperature, relative humidity, PM2.5 concentration and CO2 concentration, in 16 Brisbane and 5 Gold Coast residential buildings from Dec 2019 to Feb 2020. Results demonstrated that in general, IAQ conditions were not seriously affected by the bushfire, except a few days in December 2019. The indoor and outdoor PM2.5 concentrations were very close during normal building ventilation conditions; however, the indoor to outdoor ratio can range widely between 0.21 and 7.50 during bushfire days under minimal ventilation conditions. Staying indoors with windows and doors closed might not always bring benefits during bushfire events, as internally generated fine particulates might exacerbate the level of pollution indoors.
Keywords: Indoor air quality; South East Queensland; residential buildings; bushfire season.
1. IntroductionAustralia has experienced the longest bushfire season from September 2019 to March 2020. As of 9th March 2020, the fires burnt an estimated 18.6 million hectares of land (Burton, 2020). Over 5,900 buildings (including 2,779 homes) were destroyed across the country (O'Mallon and Tiernan, 2020). Bushfires also have indirect costs, mainly resulting from the population exposure to atmospheric particulate matter (PM) with a diameter less than 2.5 μm (PM2.5), which can penetrate deep into the respiratory system (Vardoulakis et al., 2020). Taking Brisbane and Gold Coast as an example, Table 1 lists the monthly maximum 24-hour average PM2.5 concentrations in South Brisbane and Southport monitoring stations from March 2019 to February 2020. The annual average PM2.5 concentration during the same period was 9.9 μg/m3 for South Brisbane, and 8.5 μg/m3 for Southport (The State of Queensland, 2020). Because of the bushfire, the 24-hour average PM2.5 concentrations in both locations have exceeded the National Environment Protection Measure for Ambient Air Quality (Air NEPM) advisory standards (25 μg/m3 for 24-hour average) (Keywood et al., 2016) in September, November, and December 2019. Previous research demonstrates that bushfire smoke is associated with increased risks of hospitalization and emergency department visits due to respiratory diseases and infections (Dennekamp and Abramson, 2011), increased cardiovascular morbidity, and psychological disorders (Finlay et al., 2012).
Imaginable Futures: Design Thinking, and the Scientific Method. 54th International Conference of the Architectural Science Association 2020, Ali Ghaffarianhoseini, et al (eds), pp. 610–619. © 2020 and published by the Architectural Science Association (ANZAScA).

611
Fan Zhang, and Rodney Stewart
Table 1: Monthly maximum 24-hour average PM2.5 concentrations (μg/m3) in Brisbane and Gold Coast, March 2019 to February 2020 (The State of Queensland, 2020).
South Brisbane, Mar Apr May Jun Jul Aug Sep Oct Nov Dec Jan Feb
17.1 10.2 12.5 14.3 24.8 12.9 36.1 18.0 124.8 75.3 18.5 12.5
Brisbane Southport, Gold
Coast 9.7 6.2 - 9.3 27.1 18.9 39.0 10.1 95.8 64.1 16.7 10.4
(Numbers in bold denote values that have exceeded the 24-hour average PM2.5 concentrations of 25 μg/m3
regulated in Air NEPM advisory standards)
To reduce the adverse health impacts, Queensland government and public health research studies (Queensland government, 2020; Jalaludin et al., 2020; Vardoulakis et al., 2020) advise residents to stay indoors and minimise the transfer of outdoor air to the inside by closing windows and doors where possible. However, the effectiveness and feasibility of staying indoors is questioned by recent studies (Reisen et al., 2019; Jalaludin et al., 2020; Vardoulakis et al., 2020; Yu et al., 2020). For one reason, most residential houses are not equipped with air purifiers or air conditioning systems with high-efficiency filters. Hence, outdoor pollutants can still penetrate houses, and indoor and outdoor concentrations of fine particles are often very close (Yu et al., 2020; Liu et al., 2018). For another reason, staying indoors may be impractical or ineffective during longer periods of bushfire events (Vardoulakis et al., 2020).
Although there is a large amount of IAQ studies in residential buildings all around the world (e.g. Morawska et al., 2001; Molloy et al., 2012; Yassin et al., 2012; Liu et al., 2018), few study has focused on IAQ in residential buildings during bushfire events, probably due to the unpredictable nature of these events. With the recent development of low-cost environmental sensors, it is now feasible to deploy large-scale IAQ monitoring in an extended period in which extreme weather events are likely to occur, e.g. during the summer bushfire season, and so on.
This study aims to explore the indoor air quality, represented by indoor air temperature, relativehumidity, CO2 concentration, and PM2.5 concentration in South East Queensland (SEQ) dwellings from Dec 2019 to Feb 2020, which coincided with the 2019–2020 Australian bushfire season. The objectives are to report residential IAQ conditions during the bushfire season and compare indoor and outdoor PM2.5 concentrations during a bushfire day and a normal day.
2. Methods
2.1. Locations of the study
This study was carried out in Brisbane and Gold Coast. Brisbane has a humid subtropical climate (Köppen climate classification: Cfa) (Brisbane Climate, 2020) with hot, wet summers and moderately dry, moderately warm winters. Being 66 kilometres south-southeast of Brisbane and immediately north of the border with New South Wales, Gold Coast also features a humid subtropical climate with the Köppen classification of Cfa. However, Gold Coast has slightly cooler summers and slightly warmer winters than Brisbane.
2.2. Participating dwellings
Twenty-one dwellings—16 in Brisbane and 5 in Gold Coast—were recruited from multiple avenues, including email broadcast to all Griffith University students and staff, paid advertisements in local

612
Indoor air quality in South East Queensland dwellings during 2019-2020 bushfires
newspapers, and word of mouth within social and family networks. To be eligible, participants needed to reside in Brisbane or Gold Coast areas, and planned to stay in the same dwelling during the monitoring period. Participants received a small compensation at the end of the project if they finish all required research activities. All research protocols have been approved by the Griffith University Human Research Ethics Committee.
Characteristics of the dwellings and the participating households can be seen in Table 2. Most dwellings (76.2%) are detached houses with one or two storeys. The ages of the buildings range between 7 and 100 years old, with an average of 28.5 years. The total floor areas range between 59 m2 and 385 m2, with an average of 227 m2. All dwellings are occupied by families, with an average number of 3 occupants per dwelling. About 88.9% of dwellings are insulated. All dwellings have air-conditioning systems installed, among which 28.6% adopts ducted air-conditioning systems, and 71.4% adopts split systems. No dwelling has air purifier installed.
Table 2: Characteristics of the participants’ dwellings.
Dwelling type Value Detached house 16 (76.2%) Semi-detached townhouse 3 (14.3%) Apartment 2 (9.5%)
Dwelling characteristics Average age of the dwelling (yrs) 28.5 Average floor area (m2) 227 Average number of occupants per dwelling 3 Percentage of dwellings with insulation (%) 88.9
Percentage of dwellings with air-conditioning (%) 100 Percentage of dwellings with air purifiers (%) 0
2.3. IAQ measurements
The field monitoring campaign started from 4th Dec 2019 and ended on 29th Feb 2020. The indoor air temperature, relative humidity, PM2.5 concentration, and CO2 concentration in 21 households have been continuously monitored via the Qingping IAQ sensors during the monitoring period. Qingping IAQ monitor is a commercial-grade low-cost IAQ monitor. Its performance specification is listed in Table 3. All 21 devices have been calibrated against Testo 480 for air temperature, relative humidity, and CO2 readings.
Table 3: The performance specification of IAQ monitor.
Category Range Resolution Accuracy Air Temperature, °C -10–50 0.1 ±0.5 °C Relative Humidity, % 0–100 0.1 ±5% PM2.5, μg/m3 0–999 0.1 ±10% CO2, ppm 400–9999 1 ±15%
Qingping IAQ monitors were placed in participants’ living rooms, where occupants spend most of their time during the day. The devices were positioned in well-ventilated locations, away from heat emitting sources, direct sunlight, or excessive moisture exposure. Monitors connected to residents’ Wi-

613
Fan Zhang, and Rodney Stewart
Fi and a mobile APP which allowed the long-distance real-time visualization of the data. Data were recorded in 15 min intervals and stored in the cloud. During researchers’ first visit to participants’ dwellings, participants were required to complete a background questionnaire regarding dwelling and demographic features, general comfort perceptions, daily activities, and behaviors, etc.
2.4. Data preparation and analysis
All data were first screened for significant outliers. To ensure the quality of data, Liu et al. (2018) have removed PM2.5 concentrations higher than 800 μg/m3 from the database. This study adopted the same method to remove the extreme PM2.5 readings. Depending on the Wi-Fi connection quality in each dwelling, IAQ monitors sometimes went offline, thus the IAQ data might not be continuously monitored. When calculating the daily average values for all measured IAQ parameters, those days with less than 12 hours of recorded data were removed from the dataset.
To facilitate comparisons between indoor and outdoor parameters, the outdoor air temperature, relative humidity, and PM2.5 concentration data from the closest monitoring stations were acquired from the Queensland government website (https://apps.des.qld.gov.au/air-quality/download/) and matched post hoc with the corresponding indoor climate observations. Brisbane’s outdoor data were retrieved from South Brisbane monitoring station, and outdoor weather data of Gold Coast were retrieved from the Southport monitoring station. To calculate the acceptable indoor temperature range using the adaptive thermal comfort model (de Dear et al., 2018), the required daily maximum and minimum air temperature data were obtained from the closest Bureau of Meteorology stations. The prevailing mean outdoor air temperature was calculated as the weighted running mean of last seven day’s outdoor daily air temperatures.
The differences between the daily average indoor and outdoor PM2.5 concentrations were examined by the independent t-test. The significance level was set at p < 0.05. All data analyses were carried out in SPSS (Version 26).
3. Results and discussions
3.1. IAQ conditions during the monitoring period
3.1.1. Indoor air temperature and relative humidity
Figure 1 plotted the indoor and outdoor daily average air temperature in 16 Brisbane and 5 Gold Coast dwellings during the monitoring period. The outdoor air temperature in Gold Coast was generally 1–2 °C lower than that in Brisbane. However, the indoor air temperatures were similar in both locations, which typically ranged between 26 °C and 30 °C. de Dear et al. (2018) has developed an adaptive thermal comfort model for residential buildings based on field monitoring in 43 dwellings in Sydney. Figure 1 also plotted the upper and lower 80% acceptability limits based on this residential adaptive model. The average indoor temperatures in Brisbane and Gold Coast dwellings frequently exceeded the upper 80% acceptability limits during the monitoring period. The percentage of exceedance was 44.3% in Brisbane and 57.5% in Gold Coast. This finding aligned with the participants’ respondence in the background questionnaires, where 66.7% of participants have chosen “too hot during summer” as their main concerns of thermal comfort in their dwellings. Although 90.5% of dwellings have air-conditioning installed in the living rooms, the AC units were not frequently used for cooling. As reported in the background surveys, 61.9% of dwellings utilized cross ventilation in living rooms all the time.

614
Indoor air quality in South East Queensland dwellings during 2019-2020 bushfires
Figure 1 The indoor and outdoor daily average air temperature in 16 Brisbane and 5 Gold Coast dwellings during the monitoring period, compared with de Dear et al. (2018) residential adaptive
comfort 80% acceptability limits Figure 2 plots the indoor and outdoor daily average relative humidity in 16 Brisbane and 5 Gold Coast
dwellings during the monitoring period. The outdoor relative humidity in Gold Coast was slightly higher than that in Brisbane. Indoor relative humidity levels were similar in both locations, typically ranging between 50% and 80% in summertime. High humidity is known to facilitate mould growth. In the background surveys, 23.8% of participants have reported mould in their dwellings.
3.1.2. Indoor CO2 concentration
Figure 3 plots the 24h average indoor CO2 concentration in 16 Brisbane and 5 Gold Coast dwellings during the monitoring period, where the boxes represent the 25th and 75th percentiles, and the whiskers represent the 5th and 95th percentiles. The mean CO2 concentration for all dwellings were below 500 ppm, and the 95th percentile for most dwellings were below 800 ppm, indicating good ventilation in the living rooms. In the background surveys, 61.9% of participants reported that their living rooms were cross ventilated all the time; only 4.8% of participants never utilized cross ventilation in the living rooms. When being asked “how many windows do you usually open to ventilate the living area”, 52.4% of participants have selected three or more windows.
3.1.3. Indoor PM2.5 concentration
Figure 4 illustrates the 24h average indoor and outdoor PM2.5 concentration in Brisbane and Gold Coast dwellings during the monitoring period. The 24h average outdoor PM2.5 concentration in both locations were normally below 10 μg/m3. Due to the bushfire, the 24h average outdoor PM2.5 concentration in Brisbane between 5th Dec and 9th Dec exceeded the Air NEPM threshold (25 μg/m3), with the highest daily concentration occurring on 7th Dec at 74.1 μg/m3, almost three times the guideline value.

615
Fan Zhang, and Rodney Stewart
Similarly, the 24h average outdoor PM2.5 concentration in Gold Coast between 4th Dec and 9th Dec exceeded the Air NEPM threshold, with the highest daily concentration occurring on 8th Dec at 58.5 μg/m3. Figure 4 shows that the indoor PM2.5 concentration in two locations generally followed the outdoor trend but displayed slightly different patterns in Brisbane and Gold Coast. In Brisbane, the indoor PM2.5 concentration was consistently lower than its outdoor counterpart, whereas in Gold Coast, there seemed to be no discernible difference between indoor and outdoor values.
Figure 2 The indoor and outdoor daily relative humidity in 16 Brisbane and 5 Gold Coast dwellings during the monitoring period
Figure 3 Boxplot of 24h average indoor CO2 concentration in 16 Brisbane and 5 Gold Coast dwellings during the monitoring period
Independent t-tests were adopted to examine the differences between the 24h average PM2.5 concentrations indoors and outdoors in Brisbane and Gold Coast. The results were reported in Table 4. In both locations, the 24h average indoor PM2.5 concentration was lower than the corresponding outdoor value. This difference was statistically significant in Brisbane (M=-3.28, p=0.01), but not significant in Gold Coast (M=-1.72, p=0.22).

616
Indoor air quality in South East Queensland dwellings during 2019-2020 bushfires
To understand the impact of bushfire on the outdoor and indoor PM2.5 concentrations and the indoor-to-outdoor (I/O) ratio, a typical bushfire day (7th Dec, 2019) and a typical normal day (29th Feb, 2020) were selected during the monitoring period in Brisbane for comparison. Figure 5 plots the hourly average indoor and outdoor PM2.5 concentration and the I/O ratio in two scenarios. During a typical bushfire day (Figure 5a), the hourly outdoor PM2.5 concentration displayed a drastic range between 6.4 and 157.6 μg/m3 with an average concentration of 74.1 μg/m3, while the hourly indoor concentration were much more stable, with a range of 31.4 to 62.0 μg/m3. The I/O ratio fluctuated between 0.21 to 7.50, with a mean level of 1.55. During a typical normal day (Figure 5b), outdoor PM2.5 concentration fluctuated between 4 and 8.4 μg/m3 with an average level of 6.1 μg/m3, which was 1/40 of the maximum outdoor PM2.5 concentration during the bushfire. The indoor concentration ranged between 1.4 and 5.0 μg/m3, and the I/O ratio ranged between 0.18 and 1.03, with a mean level of 0.54.
Figure 4 The indoor and outdoor 24h average PM2.5 concentration in 16 Brisbane and 5 Gold Coast dwellings during the monitoring period
Table 4: Comparison of indoor and outdoor 24h average PM2.5 concentration in Brisbane and Gold Coast during the monitoring period.
Location Mean Difference Std. Error Sig. (2-tailed) BCa 95% Confidence Interval Lower Upper
Brisbane -3.28 1.35 0.01* -6.12 -0.60Gold Coast -1.72 1.38 0.22 -4.35 1.00 (*p < 0.05)

617
Fan Zhang, and Rodney Stewart
a) A typical bushfire day in Brisbane b) A normal day in Brisbane
Figure 5 Average indoor PM2.5 concentration in relation to outdoor concentration in Brisbane during 1) a typical bushfire day when average outdoor concentration was 74.1 μg/m3; 2) a normal day when
average outdoor concentration was 6.1 μg/m3
4. DiscussionsPM2.5 pollution is generally not an issue in Australia (Paton-Walsh et al., 2019). The modelled annual average PM2.5 concentration in Australian urban areas is approximately 8 μg/m3, which is lower than values in nations with higher population densities, such as UK (12 μg/m3), Germany (14 μg/m3), and China (59 μg/m3) (World Health Organization, 2016). However, there are occasions when the 24h average PM2.5 concentration exceeds the 25 μg/m3 threshold in Australian cities, mostly during bushfires or hazard reduction burns (Paton-Walsh et al., 2019). During bushfire events, the temporary values of I/O ratio could range widely (0.21–7.50), however, the average ratios were close to 1 (1.55). Table 4 revealed that during the 3-month bushfire season, the average differences between the indoor and outdoor PM2.5 concentration in both Brisbane and Gold Coast were less than 5 μg/m3. Although the differences were statistically significant in Brisbane, the actual indoor concentration might be closer to the outdoor level given the accuracy of the low-cost IAQ sensors (Liu et al., 2018). The similarity of indoor and outdoor PM2.5 concentration has been reported by many previous residential IAQ studies (e.g. Morawska et al., 2001; Massey et al., 2012; Liu et al., 2018).
Finding in this study also challenges the idea of staying indoors during bushfires as a measure to prevent the adverse health impact, even with doors and windows closed. Figure 6 plots the hourly average CO2 concentration in Brisbane dwellings during the same days as in Figure 5. The average CO2 level was much higher between 12AM and 3PM during the bushfire day compared with the normal day, indicating reduced ventilation during bushfire events. This could well explain the distinct trend of PM2.5 concentration indoors and outdoors during this period in Figure 5a. Nevertheless, the average CO2 level was similar between 3PM and 11PM during the bushfire and the normal day, indicating similar ventilation conditions. This was also evidenced by the I/O ratio being close to 1 after 3PM in Figure 5a. However, the daily average indoor PM2.5 concentration during the bushfire day was 55% higher than its outdoor counterparts, indicating that closing doors and windows during bushfire events may not always bring benefits. It effectively prevented outdoor pollutions from coming indoors, meanwhile prevented

618
Indoor air quality in South East Queensland dwellings during 2019-2020 bushfires
the internally generated fine particulates from dissipating. Therefore, the average indoor pollution level might even exceed the outdoor level.
Figure 6 Average indoor CO2 concentration in Brisbane households during a typical bushfire day and a normal day
5. ConclusionsThis study investigates the indoor air quality in South East Queensland dwellings during the Dec 2019– Feb 2020 Australian bushfire season. The following conclusions can be drawn.
• During the monitoring period, 44.3% of days in Brisbane and 57.5% of days in Gold Coast exhibited indoor air temperatures that exceeded the residential adaptive comfort model’s upper 80%acceptability limit. The indoor relative humidity typically ranges between 50% and 80% in both locations. The indoor 24h average CO2 concentration in all dwellings was below 500 ppm.
• Throughout the monitoring period, the indoor 24h average PM2.5 concentration in Brisbane wassignificantly lower than its outdoor counterpart (p < 0.05); this difference was not statisticallysignificant in Gold Coast. However, the indoor and outdoor PM2.5 concentrations were very closeduring normal building ventilation conditions.
• During a typical bushfire day, the hourly I/O ratio of PM2.5 concentration can range between 0.21and 7.50 due to reduced ventilation, with a daily average of 1.55. Staying indoors with windowsand doors closed might not effectively protect occupants from fine particulates during bushfires.
Acknowledgements This research project has been funded by the 2019 Cities Research Institute's Strategic Grant Development Initiative from Griffith University.
References Brisbane Climate (2020). Available from: Climate-Data.org <https://en.climate-
data.org/oceania/australia/queensland/brisbane-6171/> (accessed 01 Aug 2020). Burton, J. (2020) 'It was a line of fire coming at us': Firefighters return home. Available from: Busselton- Dunsborough
Mail <https://www.busseltonmail.com.au/story/6620313/it-was-a-line-of-fire-coming-at-us- firefighters-return-home/> (accessed 31 Jul 2020).

619
Fan Zhang, and Rodney Stewart
Dennekamp, M. and Abramson, M. J. (2011) The effects of bushfire smoke on respiratory health, Respirology, 16(2), 198-209.
de Dear, R., Kim, J. and Parkinson, T. (2018) Residential adaptive comfort in a humid subtropical climate─Sydney Australia, Energy and Buildings, 158, 1296-1305.
Finlay, S. E., Moffat, A., Gazzard, R., Baker, D. and Murray, V. (2012) Health impacts of wildfires, PLoS currents, 4, e4f959951cce959952c-e959954f959951cce959952c.
Jalaludin, B., Johnston, F., Vardoulakis, S. and Morgan, G. (2020) Reflections on the Catastrophic 2019─2020 Australian Bushfires, The Innovation, 1(1), 100010.
Keywood, M., Emmerson, K. and Hibberd, M. (2016) Ambient air quality: National air quality standards, Australia state of the environment 2016, Canberra.
Liu, J., Dai, X., Li, X., Jia, S., Pei, J., Sun, Y., Lai, D., Shen, X., Sun, H., Yin, H., Huang, K., Tan, H., Gao, Y. and Jian, Y. (2018) Indoor air quality and occupants' ventilation habits in China: Seasonal measurement and long-term monitoring, Building and Environment, 142, 119-129.
Massey, D., Kulshrestha, A., Masih, J. and Taneja, A. (2012) Seasonal trends of PM10, PM5.0, PM2.5 & PM1.0 in indoor and outdoor environments of residential homes located in North-Central India, Building and Environment, 47, 223-231.
Molloy, S. B., Cheng, M., Galbally, I. E., Keywood, M. D., Lawson, S. J., Powell, J. C., Gillett, R., Dunne, E. and Selleck, P. W. (2012) Indoor air quality in typical temperate zone Australian dwellings, Atmospheric Environment, 54, 400-407.
Morawska, L., He, C., Hitchins, J., Gilbert, D. and Parappukkaran, S. (2001) The relationship between indoor and outdoor airborne particles in the residential environment, Atmospheric Environment, 35(20), 3463-3473.
O'Mallon, F. and Tiernan, E. (2020) Australia's 2019-20 bushfire season. Available from: The Canberra Times <https://www.canberratimes.com.au/story/6574563/australias-2019-20-bushfire-season/> (accessed 31 Jul 2020).
Paton-Walsh, C., Rayner, P., Simmons, J., Fiddes, S. L., Schofield, R., Bridgman, H., Beaupark, S., Broome, R., Chambers, S. D., Chang, L. T., Cope, M., Cowie, C. T., Desservettaz, M., Dominick, D., Emmerson, K., Forehead, H., Galbally, I. E., Griffiths, A., Guerette, E-A., Haynes, A., Heyworth, J., Jalaludin, B., Kan, R., Keywood, M., Monk, K., Morgan, G. G., Nguyen Duc, H., Phillips, F., Popek, R., Scorgie, Y., Silver, J. D., Utembe, S., Wadlow, I., Wilson, S. R. and Zhang, Y. (2019) A Clean Air Plan for Sydney: An Overview of the Special Issue on Air Quality in New South Wales, Atmosphere, 10(12).
Reisen, F., Powell, J. C., Dennekamp, M., Johnston, F. H. and Wheeler, A. J. (2019) Is remaining indoors an effective way of reducing exposure to fine particulate matter during biomass burning events?, Journal of the Air & Waste Management Association, 69(5), 611-622.
The State of Queensland. Air Quality Bulletin: South East Queensland. Available from: https://www.qld.gov.au/ data/assets/pdf_file/0035/68768/air-quality-bulletin-seq.pdf (accessed 11 Oct 2020).
Queensland government (2020). Bushfires and dust storms. https://www.qld.gov.au/environment/pollution/monitoring/air/air-pollution/bushfires (accessed 11 Oct 2020).
Vardoulakis, S., Jalaludin, B. B., Morgan, G. G., Hanigan, I. C. and Johnston, F. H. (2020) Bushfire smoke: urgent need for a national health protection strategy, Medical Journal of Australia, 212(8), 349-353.e341.
World Health Organization (2016). Ambient Air Pollution: A global assessment of exposure and burden of disease, World Health Organization. Geneva, Switzerland.
Yassin, M. F., AlThaqeb, B. E. Y. and Al-Mutiri, E. A. E. (2012) Assessment of indoor PM2.5 in different residential environments, Atmospheric Environment, 56, 65-68.
Yu, P., Xu, R., Abramson, M. J., Li, S. and Guo, Y. (2020) Bushfires in Australia: a serious health emergency under climate change, The Lancet Planetary Health, 4(1), e7-e8.

620
The 54th International Conference of the Architectural Science Association (ANZAScA) 2020
Influence of sustainable streetscape to augment social interaction in the low-density suburbs of regional Victoria
Nishat Rashida1 and Sarah Shuchi2 1, 2 Deakin University, Geelong, Australia
{rashidan1, sarah.shuchi2}@deakin.edu.au
Abstract: Streetscape design plays a dynamic role in connecting communities and assists in significant development in the social aspect of a community. The available literature on the topic only comprises several fragmented attempts of combining streetscape features and their influence on social interaction. However, the best approaches for improving social communication and factors of sustainable streetscape design have always remained under-researched. This paper aims to underline the importance of social interaction in streetscape design, explicitly highlighting the sustainable aspects of streetscape design that have maximum influence on enhancing social interaction in low-density suburbs. A systematic literature review was conducted as part of the current study to identify the underlying relationship between social interaction and sustainable streetscape designs. It was observed that only 35% of the relevant articles discussed social interaction in the streetscape. Our study reveals that the design principles for sustainable social interaction in the streetscape focus on the following three broad aspects –liveability, sustainability, and inclusiveness. The study proposes a checklist support in developing sustainable design solutions to enhance social interaction in low-density suburbs. Finally, the proposed list of design principles was applied to Norlane, a low-density suburb in the City of Greater Geelong, as a case study.
Keywords: Low-density suburbs; social interaction; streetscape features; sustainable streetscape.
1. IntroductionSocial sustainability is increasingly recognised as a significant driving force of sustainable development. To establish a sustainable community, social interaction is considered to be one of the key dimensions (Fischer et al., 1977) and plays a crucial role in motivating social wellbeing (Miller and Tolle, 2016). Social connection on streets have a substantial influence on the overall success and quality of life among the neighbours (Rehan, 2013), creates setting for social meetings (Fyfe, 1998) and develops attachment towards the physical dimension of space (Hidalgo and Hernandez, 2001). Consequently, streets are considered as a place for socialising and meeting people, and valuable to its residents (Rehan, 2013). Hence, the planning and design of a street have a considerable effect on how the inhabitants value a specific space and interact (Frank, 2010). However, research has rarely demonstrated a clear relationship between realistic levels of social interaction and physical design characteristics of a street layout (Thompson and Kent, 2014; Raman, 2010).
Imaginable Futures: Design Thinking, and the Scientific Method. 54th International Conference of the Architectural Science Association 2020, Ali Ghaffarianhoseini, et al (eds), pp. 620–629. © 2020 and published by the Architectural Science Association (ANZAScA).

621
Nishat Rashida and Sarah Shuchi
Social interaction is an aspect of neighbourhood sustainability that involves forming social associations within the community and interactions with the inhabitants (Dempsey et al., 2011; Burton, 2000). The influencing factors of social interaction are extensively studied in many fields like health and wellbeing, psychological and public fields (Skjaeveland and Garling, 1997; Fried 1982), yet not many studies had considered the importance of the impact of physical aspects like community space or streetscapes on social interaction (Arundel and Ronald, 2017). As the possibility of the built environment effectively influence on human behaviour and social interactions is discussed in a wide range of studies (Gehl, 1987; Lawrence, 1987; Burton et al., 2005), only a few empirical studies reflected the relationship between physical characteristics of the streetscape and social interaction in community spaces (Abu- Ghazzeh, 1999; Williams, 2005; Al-Homoud and Tassinary, 2004; Owens, 1993). According to Abass and Tucker (2020), a better streetscape design can easily connect residents to their environment and neighbours and consequently improves the sense of community feeling by enhancing their social networks. Indeed, the currently available literature on the topic only highlighted several fragmented attempts of combining streetscape features and their influence on social interaction. An overall analysis of these attempts to illustrate the influencing factors of sustainable streetscape design has always remained under-researched.
The available concepts of the sustainable streetscape, design elements, and principles of sustainable streetscape and its relationship with social interaction were identified, reviewed, and analysed in the current paper. Based on the analysis, the factors of the sustainable streetscape that have a maximum impact in the low-density suburb were determined. The current research identified the key factors of streetscape and developed a set of design principles of sustainable streetscape that have the maximum impact on social interaction in low-density suburbs. The factors were presented under 3 broad categories, (1) Principles on Liveability, (2) Principles on Sustainability and (3) Principles on Inclusiveness. These 3 broad areas have been explored as the potential avenues to enhance neighbourhood social interaction.Later, best-suited design factors of sustainable streetscape are exploited to design a few streetscapes ofNorlane, a low-density suburb in the City of Greater Geelong, to improve its social sustainability in a wider aspect.
2. BackgroundStreetscape is the visual presentation and spatial arrangement of built and landscape elements once viewed from the street (Tucker et al., 2005), consists of three layers, notably the private and the public frontage and the vehicular lanes (Aurbach, 2005). The inhabitants experience streetscapes with the perception of scale, height, surface, and colour (Cullen, 1961). Moreover, some critical elements which influence visual complexity within a streetscape include the differentiation between private space and public realm, its security, vehicular and pedestrian facilities, and last but not the least- the type and amount of street trees (Rapoport, 1982).
Sustainable streetscape confirms a space to have longevity and operate as an integral part of the bigger ecosystem and use of technologies to reduce carbon footprint, creating better places for all residents (Ramadan et al., 2018). The major rationale behind the success of a city can undoubtedly refer to the best possible use of sustainable streetscapes (Rehan, 2013). According to Greenberg (2009), sustainable streets embrace and support various agendas of sustainability like environment, economy, and equity and thus overall helps the community to sustain. The principles for sustainable streetscape was categorised by Rehan (2013) into four main groups- Urban, Social, Economic, and Environmental.

622
Influence of sustainable streetscape to augment social interaction in the low-density suburbs of regional Victoria
Urban principles acknowledged that the streets need to be accessible and designed for comfort and safety for all its users like- pedestrians, drivers, shoppers, sightseers, etc.
Certain qualities of a neighbourhood such as attachment, walkability, safety, neighbourhood satisfaction, and neighbouring were highlighted by many researchers (Bonaiuto et al., 1999; Lewicka, 2010; Lee et al., 2017). On the other hand, economic principles explicitly highlighted the use of sustainable materials and reduced consumption of resources. The material used in the streetscape should be sustainable and durable to minimise excessive maintenance (Kim, 2008). Design solutions require to reduce the consumption of material resources, use recycled and durable materials (Bevan et al., 2007) and reduces impacts on ecological resources, and minimise impacts on the natural environment (Bevan et al., 2007).
3. Research methodologyA systemic literature review was undertaken to identify the sustainable aspects of streetscape design that have maximum influence on enhancing social interaction. The systematic review was developed in 3 stages (Figure 1). The data obtained by running keywords search on the Scopus database and Google Scholar, given its broader coverage and quick indexing. The search process starts by identifying relevant keywords ("streetscape design" OR "neighbourhood" OR "built environment" OR "pedestrian" OR "street layout" AND "sustainable streetscape" OR "elements of sustainable streetscape" OR "features of sustainable streetscape" OR "principles of sustainable streetscape" AND "streetscape design" OR "neighbourhood" OR "built environment" OR "pedestrian" OR "street layout" AND "residential satisfaction" OR "sense of community" OR "social interaction" OR social* OR "attachment" "neighbourhood satisfaction"). An initial pool of 179 studies was identified; finally, only 18 studies (35% of total identified studies) were recognised to have relevant research about the influences of sustainable streetscape on enhancing social interaction.
4. Findings
Figure 1: Research procedure (Source: Author)
The key concept of the 18 publications is presented in Table 1. A thorough analysis of the studies revealed that the significant factors streetscape design could be presented under 3 broad categories,

623
Nishat Rashida and Sarah Shuchi
which are divided into 11 subcategories presented in Table 2. The subdivision of the categories adopted based on a report, 'Urban design protocol for Australian cities', published in 2011.
Table 1: Selected publications for analysis
ID Paper About the paper 1 (El Messeidy, 2019) Significance of a sustainability approach to design good streetscape 2 (Frank, 2010) Role of placemaking principles in design process that influences social interaction 3 (Harsritanto, 2018) Suggestion of sustainable streetscape development based on design principles 4 (Abass et al., 2020) The relation between social interaction and neighbourhood design in suburbs 5 (Rehan, 2013) Role of sustainable streetscape to provide a safe, sustainable urban environment
6 (CNU, 2012) Investigated the primary role of the street network is to serve people and society and provided the setting for commerce and social interaction
7 (Abass and Tucker, 2020) Impact of streetscape design on correlates of social interaction in suburbs 8 (French et al., 2014) Sense of community in individuals are stronger in pedestrian-friendly suburbs
9 (Brown and Lombard, 2014)
Investigates the effects of the built environment on social interaction with impacts on individual and community health.
10 (Mahmoud and El Khateeb, 2016)
Developed a criterion set for the design of streetscape that has a positive impact on social behaviour
11 (Lund, 2002) Influence of pedestrian environment on residents' sense of community 12 (Du Toit et al., 2007) Walkable neighbourhoods boost local social interaction and sense of community 13 (Wood et al., 2010) Correlation among neighbourhood design, walking, and sense of community 14 (Glanz, 2011) Analysis of walking and social interaction based on New Urbanism principles 15 (Patricios, 2002) Residential design focusing on users at the micro-neighbourhood scale 16 (Ewing et al., 2016) Guidance for designing walkable and pedestrian-friendly streetscapes 17 (Abass and Tucker, 2018) Influence of built environment on residents' satisfaction in low-density suburbs 18 (Kim and Kaplan, 2014) Compared urbanist community with traditional, based on the sense of community
Table 2: Categories of the design approach
Category Sub- category Design principles Elements of sustainable streetscape Paper ID
Principles on liveability
Convenient Urban principle-Accessible & Safety
trees, medians, benches, street furnishings, landscape strips 5, 7, 14
Active Social principle-Liveliness, Appealing café, street corners 2, 6, 12, 16
Reliable Urban principle-Safety sidewalks, crossings, street corners 2, 5, 6,
Walkable Urban principle-Accessible sidewalks, crossings, street corners, tree coverage/tree canopies
4, 8, 13, 17
Attachment Urban Principle-Legibility public art 7, 9, 11, 18
Principles on sustainability
Connected Economic principle bicycle facilities, bus shelters 2, 4, 6, 8
Environmental Environmental principles garden, tree canopies, landscape strip, lightings, pavement materials 2, 6
Enriching Economic principle café, public art 9, 16
Principles on inclusiveness
Versatile Urban principle-Accessible sidewalks, crossings, street corners 3, 10 Context Urban principle-legibility public art 1
Involvement Social principle-Liveliness, Appealing café, public art 3, 15

624
Influence of sustainable streetscape to augment social interaction in the low-density suburbs of regional Victoria
4.1 Principles on liveability
Liveability emphasises on the convenience of the residents, welcoming characteristics of streetscapes, a reliable and most importantly, an enjoyable walk on the streets (Rehan, 2013). A street should be pedestrian-friendly; additionally, adequate footpath provision enhances a sense of attachment and satisfaction (Abass and Tucker, 2020). Glanz (2011) also highlighted the importance of calm, welcoming and pedestrian-friendly streetscape to improve interactions.
According to Congress for the New Urbanism [CNU] (2012), street networks help to achieve active neighbourhoods (CNU, 2012), creates places to meet, explore, and interact. An eclectic mixer of buildings, building colours, setback, the material, and business types create a visually appealing and socially vibrant street (Frank, 2010). The potential benefits from an active and liveable community depend on the frequency of people walking on the street (Du Toit et al., 2007). Ewing et al. (2016) indicated that shops, restaurants, public parks could generate significant pedestrian traffic and make the streets active. According to Frank (2010), a socially dynamic street with seating is also an essential component.
A reliable street network is considered to be an integral part of helping to travel within their community in a safe, dignified, and efficient manner (CNU, 2012). A user will be likely to engage in social interaction if only the user feels it is safe (Frank, 2010). Lighting is vital in assuring the safety of an area for night-time (Rehan, 2013). A well- connected street designs with adequate provision of sidewalks and trees are accountable for improving interaction (Abass et al., 2020).
A walkable street encourages physical activities and promotes wellbeing. Walking can enhance a sense of community by increasing opportunities for interaction with neighbours (French et al., 2014), a channel for social interaction and equally crucial for the physical and mental health perspective (Wood et al., 2010). According to Abass and Tucker (2018), the most significant predictors of friendly and walkable neighbourhoods are tree coverage, provision of sidewalks, street types, shared, and community spaces were similarly found to be contentment. Hence, appropriate coverage of trees and tree canopies can protect pedestrians from harsh weather and make the streets more walkable.
According to Brown and Lombard (2014), neighbourhood attachment is an indicator of a higher level of engagement and social interaction. There is a strong relationship between social interaction, the feeling of attachment, and contentment with the neighbourhood. A well-connected and pedestrian- friendly environment enhances attachment and satisfaction (Abass and Tucker, 2020), increases the likelihood of community-oriented behaviour and hence, increases neighbourhood attachment (Lund, 2002; Kim and Kaplan, 2014).
4.2 Principles on sustainability
The streets require to be well connected both physically and socially to its surrounding areas that include public transport, walking, and bicycling (Abass et al., 2020). A sustainable street network ensures options for transportation modes and routes for passengers (CNU, 2012). Enhanced street connectivity has been associated with both higher levels of walking and more significant social support and social cohesion (French et al., 2014). The walkable, gridded street neighbourhoods are well connected to public transport and have sufficient greenery and open space. Researchers have also emphasised the importance of a well-connected street within the neighbourhood schools, shops, amenities, and other services (Frank, 2010; Ewing et al., 2016).
625
Nishat Rashida and Sarah Shuchi
Streets should be additionally designed to save resources like water, electricity, etc and use of particular material that minimises environmental impact. Its urban context's natural features and ecological systems are respected and enhanced in a sustainable street network. It integrates stormwater treatment into the street, and the durable paving materials are selected and assure permeability (CNU, 2012). Moreover, the concept of a socially and environmentally sustainable community is an aesthetically pleasing environment appealed to the broad masses (Frank, 2010).
Sustainable streets respect the aspiration and needs of the residents; it creates opportunities for local businesses to thrive. Retails promote street activities, and increased pedestrian activity can successfully provide places that enable, support, and enhance the social interaction of neighbourhoods (Brown et al., 2014). It improves the local economy and community and enriches the overall environment of the neighbourhood (Ewing et al., 2016).
4.3 Principles on inclusiveness
Cities that effectively promote inclusion not only offer greater opportunities for their residents but often also increase widespread economic benefits. Each locality has its own character and qualities, but there should be an overall harmonious blend to meet the different needs of people and offer a variety of options so that they can move with ease, even when they are walking or with bikes, wheelchair, or wheeling luggage. The design of the streets should be able to accommodate differing needs and expectations for people with other mobility needs (Harsritanto, 2018) and equipped with the most modern services and facilities to make them practical and safer (Mahmoud and El Khateeb, 2016).
Sustainable streets incorporate with the physical environment and integrate the topography, overall landscape and views, existing buildings, and infrastructure. The built environment is enhanced in both visual and functional context. El Messeidy (2019) emphasised that co-ordination of design, material, and elements of the streets required to be fitted in the context and comply with the site's history.
Neighbourhood sustainable streets acknowledge that one of their primary objectives is about creating places for people and its users. It involves people from all fields of works, age, culture, and religion. Streetscape should be such which can be used by all user regardless of sexes, ability, and ages (Harsritanto, 2018). Neighbourly connections may also be formed by frequent travel along mutual pathways or in shared activities and events at common meeting places (Patricios, 2002).
5. Proposing sustainable streetscapes checklist for NorlaneIn Australia, almost two-thirds of its population lives in the suburbs, which are being endlessly criticised for having poor social sustainability (Davison, 1993) and the absence of liveability (Johnson, 2007). It is highly required to include these factors in the streetscape design to improve social interaction in low- density suburbs. The current research chose 'Norlane', a low-density suburb in the City of Greater Geelong, Australia, to implement the identified design factors to improve its social sustainability. The population of this suburb was declining in contrast to the strong growth in the remainder of the City; therefore, a significant improvement of liveability is a necessity. Hence, by designing sustainable streetscape to increase social interaction, Norlane is expected to become a potential feature of the vibrant gateway to Geelong. The current streetscape of Forster St, Lona St, Tennyson St and Stradbroke St were observed, analysed and documented to find out the crucial aspects which hinder social interaction, specifically in terms of achieving sustainable streetscape.

626
Influence of sustainable streetscape to augment social interaction in the low-density suburbs of regional Victoria
5.1. Proposed Checklist
From the overlaid discussion, the current research proposed the following checklist (Table 3) to adopt sustainable design solutions to enhance social interaction in low-density suburbs.
Table 3: Proposed streetscape features augmenting social interaction
Features How the proposed streetscape features encourage social interaction
Trees & tree canopies Protect against noise pollution, reduce urban heat island, provide shading & increase aesthetics. This influences residents to relax & enjoy while walking, creating neighbourhood satisfaction and encouraging them to interact more.
Landscape strips & planters Provide buffers between the pedestrians & vehicles, reduce noise pollution, integrate rain gardens, and improve overall aesthetic, thus augmenting social interaction.
Stormwater management & rain garden
Make the streets more usable & safer during worse weather conditions. More residents feel safer to use the roads, hence creating scopes for interaction.
Lighting Make the streets secure, specially at nights. People feel more reliable to use them, so more residents use them, resulting in social connection.
Street bench and trash receptacle
Benches provided at open spaces and street corners for seating with adequate trash receptacles, increase interaction and neighbouring.
Sidewalks, bike lanes & crossings
Safe & walkable sidewalks, curbs, bike lanes and crossings promote alternative transportation, thus improving pedestrian safety & establishing inclusiveness.
Bicycle facilities & bus shelters
Bicycle facilities create alternative options to travel, resulting in pedestrians' increase, hence creating more social communication & interaction.
Café & Public Art Public art and outdoor spaces in the cafes create active and lively spaces in the neighbourhood, creating floors for more involvement, attracting more residents. Thus, enhance social interaction.
5.2. Design recommendation
To enhance the social interaction of the Streetscapes of Norlane, the design principles and elements of sustainable streetscape drawn from the findings and analysis, are applied to the following streets.
Figure 2: Proposed vibrant café and sidewalk (Source: Author)
The café is located at Labuan Sq in Norlane. Here, the café spaces are close to the street, yet the large solid wall is hindering street activities. A transparent glass facade has been proposed to offer transparency and visual communication, including few seating arrangements on sidewalks, tree canopies for shading, and noise buffer. Here, Social and Urban Design Principles were implied to make the spaces socially interactive.

627
Nishat Rashida and Sarah Shuchi
Figure 2: Proposed vibrant sidewalk, bicycle facilities and bus shelters (Source: Author)
Figure 3: Proposed public art- representing culture and heritage (Source: Author)
The bus shelters at Forster St in Norlane are poorly maintained and even lack in proper seating arrangements. Bicycle facilities with parking space, seatings, tree canopies and trash receptacles have been proposed. Here, Economic, Urban and Environmental Design Principles were suggested to make the community more accessible, connected, inclusive and safe for the pedestrians, creating scopes for interaction.
The selected area is also located at Labuan Sq in Norlane, a social gathering space for the local people with cafes and retail shops. However, the place is in lack of liveliness. Public art like sculptures, paintings have been proposed here on facades and courtyards. Heritage and culture of the area can be easily represented through it. Social and Urban Design Principles were implied here, which made the place more appealing, lively, legible and
inspired place attachment. This will certainly enrich the cultural values, unity and attract more residents to use that area.

628
Influence of sustainable streetscape to augment social interaction in the low-density suburbs of regional Victoria
Conclusion The study identified the design parameters of streetscape that have the most significant impacts on establishing and influencing social interaction. It is essential to identify the specific streetscape design features and principles to bridge the gap between streetscape design and socially interactive sustainable community. Undoubtedly, those factors facilitate to establish a sense of community attachment, reliability, walkability, and inclusiveness among the users, thus influencing social interaction. It was discovered that a coordinated effort of application of the identified factors and maintenance has the highest potential for creating a successful, socially interactive, and vibrant streetscape. As a model application, the identified design factors of sustainable streetscapes from the research were applied to propose a conceptual design of the selected streets of Norlane, Geelong. The prospective benefits from designing streets and spaces that promote social interaction and a sense of community are much higher than simply planning an aesthetically demanding environment. Hence, it would be of immense assistance to municipalities, towns, and cities if further work can be carried out on streetscape design and the role it plays to augment social interaction and form a socially sustainable suburb.
References Abass, Z.I. and Tucker, R. (2020) Talk on the Street: The Impact of Good Streetscape Design on Neighbourhood
Experience in Low-density Suburbs, Theory & Society, 1-24. Abass, Z.I. and Tucker, R. (2018) Residential satisfaction in low-density Australian suburbs: The impact of social and
physical context on neighbourhood contentment, Journal of Environmental Psychology, 56, 36-45. Abass, Z.I., Andrews, F. and Tucker, R. (2020) Socialising in the suburbs: relationships between neighbourhood
design and social interaction in low-density housing contexts', Journal of Urban Design, 25(1), 108-33. Arundel, R. and Ronald, R. (2017) The role of urban form in sustainability of community: The case of Amsterdam,
Environment and Planning, 44 (1), 33-53. Aurbach, L. (2005) Traditional Neighbourhood Development Design Rating Standard, TND Design Rating System,
United States Environmental Protection Agency, USA Australian Bureau of Statistics 2016, Census QuickStats, Available from: Open Source Repository
<https://quickstats.censusdata.abs.gov.au/ census_services/ getproduct/census/2016/quickstat/SSC21948> (accessed 30 May 2020).
Bevan, T.A., Sklenar, O., McKenzie, J.A. and Derry, W.E. (2007), Sustainable urban street design and assessment, 3rd
Urban Street Symposium, Seattle, Washington. Brown, S.C. and Lombard, J. (2014) Neighbourhoods and social interaction, Well-being and Environment, 2(1), 1-28. Brown, B.B. and Cropper, V. (2001) New urban and standard suburban subdivisions: Evaluating psychological and
social goals, Journal of the American Planning Association, 67(4), 402-19. Burton, E. (2000) The potential of the compact city for promoting social equity, In Achieving Sustainable Urban
Form, 19-29. City of Greater Geelong and Department of Planning and Community Development 2011, Corio Norlane structure
plan background report, Available from: Open Source Repository <https://www.geelongaustralia.com.au/ common/ public/documents/amendments/8d2e6c2c7028c41> (accessed 30 May 2020).
Congress for the New Urbanism (2012) Sustainable Street Network Principles, Premier Press, USA. Cullen, G. (1961) The Concise Townscape, First Edition, Architectural Press, USA. Dempsey, N., Bramley, G., Power, S. and Brown, C. (2011) The social dimension of sustainable development,
Sustainable Development, 19(2), 289-300. Du Toit, L., Cerin, E., Leslie, E. and Owen, N. (2007) Does walking in the neighbourhood enhance local sociability?,
Journal of Urban Studies, 44(9), 1677-95. El Messeidy, R. (2019) Towards Great Streets: Sustainable Design Solutions, Journal of Urban Research, 34 (1), 134-
55.

629
Nishat Rashida and Sarah Shuchi
Ewing, R., Hajrasouliha, A., Neckerman, K.M., Purciel-Hill, M. and Greene, W. (2016) Streetscape features related to pedestrian activity, Journal of Planning, Education and Research, 36(1), 5-15.
Fischer, C., Baldassare, M., Gerson, K., Jackson, R., Jones, L. and Stueve, C. (1977) Networks and Places: Social Relations in the Urban Setting, Free Press, USA.
Frank, L. (2010) Streetscape Design: Perceptions of Good Design and Determinants of Social Interaction, Master of Arts in Planning Thesis, University of Waterloo, retrieved 2 April 2020, Waterloo's Institutional Repository.
Fried, M. (1982) Residential attachment: Sources of residential and community satisfaction, Journal of Social Issues, 38(3), 107-19.
Fyfe, N. (2006) Images of the Street: Planning, identity and control in public space, Routledge, USA. Glanz, T.A. (2011) 'Walkability, social interaction, and neighborhood design', Master of Community and Regional
Planning Thesis, University of Nebraska- Lincoln, retrieved 20 July 2020, UNL's Waterloo's Institutional Repository.
Greenberg, E.J. (2009) Sustainable streets: Foundations for an emerging practice. Harsritanto, B. (2018) Sustainable Streetscape Design Guideline based on Universal Design Principles, MATEC Web
of Conferences, 159, 01003. Hidalgo, M.C. and Hernandez, B. (2001) Place attachment: Conceptual and empirical questions, Journal of
Environmental Psychology, 21(3), 273-81. Kim, C., Nakanishi, H., Blackman, D., Freyens, B. and Benson, A. (2017) The effect of social capital on community co-
production: Towards community-oriented development in post-disaster recovery, Procedia Engineering, 180, 901-11.
Kim, J. and Kaplan, R. (2004) Physical and psychological factors in the sense of community: New urbanist Kentlands and nearby Orchard Village, Journal of Environment and Behaviour, 36(3), 313-40.
Kim, M. (2008) Design Manual: Sustainable Initiatives Chapel Hill Streetscape and Lighting Master Plan, Technical Report, USA.
Lund, H. (2002) Pedestrian environments and sense of community', Journal of Planning, Education and Research,21(3), 301-12.
Mahmoud, M.F. and El Khateeb, S. (2016) An Analytical Study of the Impact of Streetscape in Jeddah on Social Behavior of the Users', Civil and Environmental Engineering, 16(2), 26-31.
Miller, H.J. and Tolle, K. (2016) Big data for healthy cities: Using location-aware technologies, open data and 3D urban models to design healthier built environments, Built Environment, 42(3), 441-56.
Nasar, J. (1990) The evaluative image of the city, Journal of the American Planning Association, 56(1), 41-53. Patricios, N. (2002) The neighborhood concept: a retrospective of physical design and social interaction, Journal of
Architecture and Planning Research, 70-90. Raman, S. (2010) Designing a liveable compact city: physical forms of city and social life in urban neighbourhoods,
Built Environment, 36(1), 63-80. Rapoport, A. (1990) The meaning of the built environment: A nonverbal communication approach, University of
Arizona Press, USA. Rehan, R. (2013) Sustainable streetscape as an effective tool in sustainable urban design, HBRC Journal, 9(2), 173-
86. Sengul, G. and Enon, Z. (1990) Changing socio-spatial aspects of neighbouring: design implications, Ekistics,
57(342/323), 138-145. Thompson, S. and Kent, J. (2014) Connecting and strengthening communities in places for health and wellbeing,
Australian Planner, 51(3), 260-71. Tibbalds, F. (1992) Making People-Friendly Towns: Improving the Public Environment, Spon Press, UK. Tucker, C., Ostwald, M., Chalup, S. and Marshall, J. (2005), A method for the visual analysis of the streetscape, 519-
29.

630
The 54th International Conference of the Architectural Science Association (ANZAScA) 2020
Insights into the New Zealand Prefabrication Industry
Guy Brown1, Rashika Sharma2 and Lydia Kiroff3 1Veros, Tauranga, New Zealand
[email protected] 2, 3 Unitec Institute of Technology, Auckland, New Zealand,
[email protected]@unitec.ac.nz 3
Abstract: Prefabricated building methods have recently undergone profound development and have been effectively used in easing housing shortages globally. However, prefabrication is a relatively new concept for New Zealand and is surrounded with significant uncertainty around its potential in the construction industry. The purpose of this research is to gain a deeper insight into the realities of using prefabricated construction methods, analyse the government initiatives and regulatory framework to facilitate prefabrication, and discuss the benefits and client preferences. The study employed a survey research approach focusing on prominent prefabrication residential building companies across New Zealand. Questionnaires, followed by face-to-face interviews with industry professionals were the major methods of empirical data collection. The findings revealed that prefabricated construction is a viable option to supply mass affordable homes to the New Zealand residential housing market. The research also highlighted many benefits of using prefabrication over conventional building methods including better quality homes through controlled building methods and use of superior materials, and most importantly the associated time savings during construction. The study concludes that the growth of the prefabrication industry is impacted by negative stigmas still prevalent amongst New Zealand consumers.
Keywords: prefabrication, residential housing, modular, off site manufacture
1. IntroductionNew Zealand is currently experiencing an unprecedented housing shortage with its biggest metropolitan area, Auckland, needing approximately 30,000 more homes to cater for its growing population (Kiernan, 2019). The construction industry is struggling to meet the demand for housing through traditional building methods which is why alternative construction methods need to be explored. Prefabrication is one such effective and efficient construction method that has been successfully used in countries such as Sweden, the United Kingdom and Japan. This study is an investigation into prefabrication and the factors that impact the New Zealand construction market. It contributes to the international body of knowledge on prefabrication by offering a unique New Zealand perspective.
Imaginable Futures: Design Thinking, and the Scientific Method. 54th International Conference of the Architectural Science Association 2020, Ali Ghaffarianhoseini, et al (eds), pp. 630–639. © 2020 and published by the Architectural Science Association (ANZAScA).

631
Guy Brown, Rashika Sharma and Lydia Kiroff
2. Background2.1. Overview Historically, the prefabrication industry started in New Zealand in 1833 (Chiu, 2012) with the dispatching of pre- cut frames for the early settlers’ houses from the United Kingdom, the United States and Australia (Bergdoll and Christensen, 2008; Toomath, 1996). The most notable contemporary prefabrication factory in New Zealand was started in 1955 by De Geest Construction, which supplied complete houses to the Waitaki Hydro- power Scheme (Scofield, Potangaroa, and Bell, 2009); 549 complete houses were supplied to Twizel and 350 componentised houses transported to Cromwell (Kinsella, 2008, cited in Scofield, Potangaroa, and Bell, 2009). However, the uptake of prefabrication in New Zealand has been significantly slow with an uneven distribution across the country, around 70% of prefabrication manufacturers are located in the North Island (Moradibistouni, Vale, and Isaaks, 2018).
Over the past few years, legislation and government policies are being developed to make prefabrication more mainstream and act as a precursor for creating greater acceptance towards prefabrication. With government intervention through the implementation of various policies, the uptake of prefabrication has been faster (Ahamad, Azman, and Hussin, 2012). The biggest hindrance has been the lengthy delays in getting design approvals for prefabricated buildings. Different territorial authorities’ requirements for prefabricated housing can vary significantly (BRANZ, 2012). Additionally, local community consents can also prevent high density housing development as they are often perceived as unacceptable for local area image (Manley, Miller, and Steinhardt, 2013). However, the MultiProof initiative launched by the New Zealand government in 2010 introduced a streamlined consenting process for multiple-use building designs (Kennerly, 2019) which resulted in faster building consents for standard prefabrication designs.
2.2. Perceptions around prefabrication The concept of prefabricated design and construction which is stereotypically perceived as bland and inflexible has a long-standing adverse history. The general opinion is that prefabrication lacks individualisation to client needs due to mass production. Prefabrication has varying degrees of acceptance in the construction industry although is an important way to address issues of housing affordability and accessibility of architectural design to a wider audience (Bell, 2009). Flexibility of design can ensure a greater enthusiasm towards prefabrication (Blismas and Wakefield, 2009). However, last stage design changes should be discouraged as this may create challenges for construction companies who are using prefabrication (Goulding and Nadim, 2011). This potential problem can be overcome by ‘an early design freeze [which] is necessary to allow an early start of production for the required parts and modules’ (Rahman, 2013, p.71).
However, with recent developments around sustainable designs and emphasis on affordable methods of construction globally, prefabrication is now considered a viable construction option (Bell, 2009) and is slowly being considered as a modern-day alternative building solution with changing perceptions around the technique. There is growing interest in prefabrication as there is growing recognition of its potential in increasing construction efficiency and performance, cost reduction and subsequent reduction in environmental impacts (Burgess, Buckett, and Page, 2013; Chen and Samarasinghe, 2020). Furthermore, prefabrication can be considered effective as a method to combat inflated housing demands by creating prefabricated apartments, town houses and high rises. Since 2008, contemporary prefabricated housing has become popular in New Zealand as a

632
Insights into the New Zealand Prefabrication Industry
design option mostly for holiday houses or second homes. Designs include unfolding elements to create greater floor areas such as port-a-bach fold down deck and HABODE 's butterfly roof (Scofield, Potangaroa, and Bell, 2009).
2.3. Future developments Currently, New Zealand has limited viable designs and products; a wider range of options for offsite solutions are needed for the growing housing demand (Scofield, Potangaroa, and Bell, 2009). The local market has a limited number of companies that offer state of the art, desirable prefabricated homes, which could be the leading factor for the slow uptake of prefabrication in New Zealand. For new and emerging companies, the challenge is to provide a successful prefabricated model for New Zealand. However, New Zealand is challenged by a smaller consumer market and volatility to international macroeconomic conditions. Additionally, shortfalls within the supply chain lead to high material costs and marginal savings (Mirus, Patel, and McPherson, 2018). For prefabrication to be economically viable, several approaches could be taken such as advancing innovative systems through research and development, collaborations between industry and tertiary institutions, architect-designed housing models to target a specialised niche market, utilising marketing tools such as show-homes, plan- books and housing events, and large production runs matched by market demand (Bell, 2009; Scofield, Potangaroa, and Bell, 2009). The progress towards prefabrication in New Zealand is slow and greater research and development is needed to propel this industry. There is currently a high demand for residential housing throughout New Zealand. The residential housing market is heavily underdeveloped and conventional building methods are proving too expensive and slow to meet the growing demand.
2. Research approach and methodsThe study employed a face-to-face survey research approach focusing on New Zealand based prefabrication industry professionals with the aim to seek their views and opinions. Surveys are best suited when the researcher wants factual information relating to groups of people: what they do, what they think and who they are in an attempt to establish patterns of activity within those groups or categories of people (Denscombe, 2014). Questionnaires, followed by semi-structured, face-to-face, in- depth interviews were the major methods of empirical data collection. A purposive sampling was used to select the study’s participants.
Seven prominent New Zealand based prefabrication companies participated in this project. Fourteen industry professionals from across New Zealand were surveyed to gain an insight into beliefs, common misconceptions and the reality of using prefabricated construction methods. All fourteen of the participants completed demographic and ordinal scale questionnaires. Furthermore, ten of the fourteen respondents later participated in semi-structured interviews.
3. Results
3.1. Questionnaire Outcomes
The participants in the research represented various occupations within the prefabrication construction industry – architects/designers, project managers, quantity surveyors and sales/marketing professionals. The years of experience in the prefabrication industry varied (this is not the length of general

633
Guy Brown, Rashika Sharma and Lydia Kiroff
construction industry experience). All participants worked on residential projects but four worked on both residential and commercial prefabricated buildings. The projects ranged from $100k – $1m, which is the price range of residential buildings in New Zealand, to $2M - $10M values for commercial projects. Auckland had the most prefabrication projects underway. There is clearly a stronger prefabricated presence in the North Island compared to the South Island, which is likely due to population spread. (Table 1).
Participants’ demographic data
Current position within the prefab industry
Years of experience within the prefab industry
Type of projects Average project value Area covered
1 Architect/Designer 5 - 10 years Residential 500k – 1m Auckland, Christchurch
2 Architect/Designer 1 – 3 years Residential 500k – 1m Nation wide
3 Architect/Designer 1 – 3 years Residential 500k – 1m Auckland, Queenstown
4 Project Manager 5 - 10 years Residential, Commercial
500k – 1m, 1 – 2m Auckland
5 Project Manager 3 - 5 years Residential, Commercial
100 – 500k, 500k – 1m Auckland
6 Project Manager 1 – 3 years Residential, Commercial 100 – 500k North Island
7 Quantity Surveyor 1 – 3 years Residential 500k – 1m Northland
8 Quantity Surveyor 1 – 3 years Residential 100 – 500k Wellington
9 Quantity Surveyor 3 - 5 years Residential, Commercial
100 – 500k, 500k – 1m Waikato
10 Sales/Marketing 1 – 3 years Residential 100 – 500k, 2 – 10m Nation wide
11 Sales/Marketing 1 – 3 years Residential 100 – 500k Auckland
12 Sales/Marketing 3 – 5 years Residential 500k – 1m Queenstown
13 Sales/Marketing 1 – 3 years Residential 500k – 1m Waikato
14 Sales/Marketing 1 – 3 years Residential 100 – 500k Auckland
Table 1: Participants’ demographic data.
The participants were given a range of statements to rate on a scale of 1 (Strongly disagree) to 5 (Strongly agree). Figure 1 clearly shows that there was strong agreement within the industry that

634
Insights into the New Zealand Prefabrication Industry
prefabricated methods reduced construction waste, improved construction time and reduced cost compared to conventional buildings methods.
Figure 1: Attributes of prefabrication. The participants also believed that quality and design have a strong influence on purchasers when
choosing prefabricated homes. When it came to addressing accessibility to architectural design through prefabrication, a strong proportion of replies came back neutral.
3.2. Interview Outcomes
3.2.1. Drivers of prefabrication
Most participants identified the current legislation as being the biggest hindrance to the slow uptake of prefabrication in New Zealand and felt strongly that the government could be doing more to support the prefab industry. Lack of customer knowledge and confidence in prefabrication were the other common reasons for the slow uptake. More investment, training and research and development were voiced as key factors that need enhancing. The need for overseas skilled labour to help drive the industry was also

635
Guy Brown, Rashika Sharma and Lydia Kiroff
highlighted as a way to reduce a potential labour shortage in New Zealand. “More positive marketing is needed as well as education around the technology used and sustainability of the product” (Sales/Marketing2, Interview, 9 September 2019). One participant mentioned that more could be done to advertise prefab homes and information to the public via media platforms like TV and publications.
3.2.2. Current state of development of the New Zealand prefab industry Half of the study’s participants were of the opinion that targeting offshore markets could improve the market size: “targeting offshore markets would provide more brand exposure and access to more international suppliers who offer more competitive pricing” (Sales/Marketing1, Interview, 2 September 2019). However, some participants mentioned that because offshore markets were already markedly more advanced than New Zealand they could see New Zealand as their potential market. One participant preferred to deal with onshore clients in order to minimize risks.
Most participants shared the view that there were limited pre-finished products available in the market. Currently, panelised systems seem to be undergoing development within the industry. “Our design revolves around the most efficient way to use the panels” (Sales/Marketing2, Interview, 9 September 2019). The participants also believed that up-scale manufacturing with larger factories was needed to improve the industry. The two most experienced participants felt that improving speed and delivery of prefabricated projects was essential. “Upscale of manufacturing needs to be on par with car manufacturing to have an effect” (Architect1, Interview, 4 September 2019). In addition, more design freedom and flare were needed which strengthens the view that prefabrication has design restrictions.
3.2.3. Benefits of prefabrication All participants agreed that the most beneficial aspects of prefabrication were around reduced cost, saved time and less generated waste. Being able to design around available material sizes creates less waste “reduction in waste gets better with every build, modules are designed around materials available i.e. sheet sizes” (General Manager1, Interview, 10 September 2019). The benefits around building out ofthe weather in controlled environments was also a key benefit compared to conventional buildingpractice. “Building in a controlled environment, with no influences from the weather and minimal onsitedisruptions is a key benefit of prefabrication” (General Manager1, Interview, 10 September 2019).
3.2.4. Factors influencing clients’ decisions The majority of participants made it clear that design plays an important role for clients choosing a home. The design and size of homes were seen as determining factors when clients were considering between conventional or prefabrication methods. “Design restrictions with prefab are timber floors vs concrete” (Architect1, Interview, 4 September 2019). Generally, minor dwellings did not receive much design input unlike larger homes. Some participants mentioned that clients are willing to make the sacrifices around design if there were time and cost saving benefits.
All participants stated that time and cost were the most influential factors which lead to people choosing prefabricated homes. “Money saved due to time saved with borrowing/loans, quality and time efficiencies, customers are surprised at the level of quality” (Architect1, Interview, 4 September 2019). Interestingly, multiple participants mentioned that prefabricated homes were not as economical as perceived. “A prefabricated home isn't necessarily cheaper than a conventionally built home, the cost is currently very similar” (Architect1, Interview, 4 September 2019). One participant also made the point

636
Insights into the New Zealand Prefabrication Industry
that it is a “misconception that prefab is quicker than conventional building” (General Manager2, Interview, 12 September 2019).
4. Discussion
4.1. Review of the Building Consent process in the light of prefabrication
The research highlighted that prefabrication has great scope in the New Zealand market. The participants expressed the view that prefabrication had potential to help the housing shortage in New Zealand. They made it clear that it could be extremely beneficial if large volumes of affordable houses could be supplied to the market quickly. However, one of the major hindrances for prefabrication was government legislation and council regulations. The uptake of prefabrication can be fast forwarded by government intervention (Steinhardt and Manley, 2016). In a prefabrication report from 2012, BRANZ suggested that there was a general consensus within the prefabrication industry that the consent and compliance processes are easier for offsite construction after relationships are established with Territorial Authorities (TA). However, this does not seem to be the case as the consent process seems to be a significant issue for most companies. The participants highlighted that the building consent process is multi-layered and creates duplication of paperwork for prefabricated buildings. The current processes were deemed unfit for prefabricated methods of building. In addition, the building inspection process is set up for conventional building methods, and does not work for prefabricated buildings as they are built in stages and transported to different locations around the country. Inspections are carried out by multiple local authorities with different rules because of the building process. “Where multiple TAs are used due to the building being constructed in another jurisdiction, communication and coordination between parties concerned becomes vital, as interpretations of the Building Code vary between jurisdictions” (BRANZ, 2012, p. 28). It is evident with responses in the interviews that not a lot has changed in the TA processes in the past few years and the building consent process for prefabrication buildings needs refining.
4.2. Scope for mass production
Mass production of panelised systems is the key to a successful prefabrication market. The study’s participants strongly believed that panelised systems and well-developed factories are the future for prefabrication. The majority of NZ manufacturers of prefabrication, or 64%, produce components or panels with the lowest degree of prefabrication while only 8% offer the highest degree of prefabrication, completed buildings (Moradibistouni, Vale, and Isaaks, 2018). Improving pioneering systems through research and development is key to the success of the industry (Bell, 2009). High levels of efficiency are achieved through automated systems, forest to finish, vertically integrated production, interventionist housing policy and the scale to warrant it, resulting in mass production with a daily output between 1 to 3 homes (Trainer, 2017). If New Zealand aspires for a prefabrication niche market, it should focus more on the mass production of pre-fabricated elements. Only then will the country reach a scale capable of reducing the housing shortage.
4.3. Reduction in waste, time and cost
The major benefits of prefabrication are an overall reduction in waste, time and cost and the added advantage of building in a controlled environment. Prefabrication offers time efficiency compared with

637
Guy Brown, Rashika Sharma and Lydia Kiroff
traditional on-site construction techniques (Chen and Samarasinghe, 2020; Moradibistouni and Gjerde, 2017). Savings of up to $1,600 per week could be made by switching to prefabricated methods (BRANZ, 2012). “Reduced project cost, shorter project duration and on time delivery of projects is achieved through prefabrication” (Shahzad, Mbachu, and Domingo, 2015, p.198). It is anticipated that approximately 30,000 new homes will be needed in Auckland in the future (Kiernan, 2019) and prefabrication may prove advantageous due to reduced timeframes required to build homes (Prefab New Zealand, 2014).
Furthermore, the findings of this research support claims in the literature that prefabrication results in reduced onsite wastage and reduced whole life cycle costs (Shahzad, Mbachu, and Domingo, 2015). When building occurs in a controlled environment, techniques used could lead to decreased consumption of energy and reduced emissions of Green House Gases (GHG) (Gorgolewski, 2005). It is evident that greater construction quality can be achieved through controlled prefabricated methods which in turn can lead to subsequent building waste reduction. Building in controlled environments has added advantages of completing projects faster than conventional builds.
4.4. Design flexibility
Design is one of the crucial factors that clients consider during the building process. Prefabrication is an important way to address accessibility of architectural design to a wider audience (Blismas and Wakefield, 2009). New Zealand needs a wider range of options for offsite solutions to cater for the growing demand for housing. Currently the industry has limited viable designs and products to choose from at the design stage and have little faith that the products available will meet the needs of the projects (Scofield, Potangaroa, and Bell, 2009). The findings of this study also highlighted that design plays an influential role when clients weighted options around prefabrication or conventional builds. The participants noted that clients weighed between either design or functionality and cost. One participant strongly believed that design was the overarching factor for the success of any company. Although there were limited designs for prefabricated buildings, it is evident through this research that there is also a strong enthusiasm around implementing architectural design in prefabricated housing.
4.5. Positive advertising and marketing
Prefabrication relies heavily on client preferences; the research participants believed that there needs to be more investment in educating the consumer market around the benefits of prefabrication through marketing and brand awareness. Negative or inferior marketing of prefabrication is one the major reasons for the slow uptake in the market (Bell, 2009). The industry needs to apply more contemporary approaches like marketing instruments, housing shows, magazines, and show homes to enhance the industry and ensure information is accurate and readily available (Scofield, Potangaroa, and Bell, 2009). With greater advertising, the market for prefabrication will broaden. By investing in the positive marketing of prefabricated homes, a different perceptive can be given to the public making them aware of the new sleek, contemporary architectural designs available. Raising consumers’ awareness of the benefits of prefabrication such as the improved quality of materials used, reduction in time and potential cost savings, is essential for its success. Secondly, by partnering with companies to offer incentives to buyers to choose prefabricated over conventional homes is needed. This will boost sales which will in turn stimulate growth, production and technologies within the industry to help speed up processes. As the research shows this can have many benefits to the industry such as reduced construction waste and cheaper homes through mass production, creating simultaneously more jobs for

638
Insights into the New Zealand Prefabrication Industry
skilled workers.
5. ConclusionIn conclusion, prefabrication has great potential in the New Zealand construction market. The participants made it clear that the benefits of prefabrication far outweigh the negatives. Prefabrication has a number of advantages over conventional methods of construction such as reduction in time, costs and wastes, better quality materials, and faster build time due to controlled environments. With appropriate government legislation and robust council processes, extensive marketing and education around the quality of available products, prefabricated homes could become a market leader in providing affordable housing in New Zealand.
The study has a number of limitations that need to be taken into consideration: first, the relatively small sample of participants due to the study’s time constraints; second, the short length of experience in the prefabrication industry, although this is not the total years of construction industry experience; and third, a possible bias in the responses due to the participants’ prefabrication background painting a more positive picture overall. To counteract this issue participants from conventional building companies could also be surveyed to give a more diverse account of industry perspective on prefabrication.
It is recommended that Central and Local government as well as the residential construction industry invest in the research and development of prefabricated methods of construction. This will help existing prefabrication companies to grow and reach levels of production needed to supply the volume of housing to stimulate the market adequately. Without this investment the industry cannot grow at a sufficient rate to supply an adequate number of homes to the market.
6. ReferencesAhamad, M. S. S., Azman, M. N. A., & Hussin, W. M. A. W. (2012). Comparative study on prefabrication construction
process. International Surveying Research Journal, 2(1), 45-58. Available from: Open Source Repository <https://www.researchgate.net/publication/260202475_Comparative_Study_on_Prefabrication_Construction_ Process>
Bell, P. (2009). Kiwi prefab: Prefabricated housing in New Zealand: An historical and contemporary overview with recommendations for the future. Available from: Open Source Repository <http://researcharchive.vuw.ac.nz/handle/10063/1111>
Bergdoll, B. and Christensen, P. (2008). Home delivery: Fabricating the modern dwelling. New York, USA: The Museum of Modern Art.
Blismas, N., & Wakefield, R. (2009). Drivers, constraints and the future of offsite manufacture in Australia. Construction Innovation: Information, Process, Management, 9(1), 72-83. Available from: Open Source Repository <http://dx.doi.org/10.1108/14714170910931552>
Burgess, J.C., Buckett, N.R. and Page, I.C. (2013). Prefabrication impacts in the New Zealand construction industry. (BRANZ Report SR 279). Wellington, New Zealand: BRANZ. Available from: Open Source Repository <https://d39d3mj7qio96p.cloudfront.net/media/documents/SR279_Prefabrication_impacts_in_the_New_Ze aland_construction_industry.pdf>
Chen, H. and Samarasinghe, D. A. S. (2020). The factors constraining the adoption of prefabrication in the New Zealand residential construction sector: Contractors’ perspective. Available from: Open Source Repository <https://www.researchgate.net/profile/Don_Amila_Sajeevan_Samarasinghe/publication/339897919_The_Fact ors_Constraining_the_Adoption_of_Prefabrication_in_the_New_Zealand_Residential_Construction_Sector_Con

639
Guy Brown, Rashika Sharma and Lydia Kiroff
tractors'_Perspective/links/5e6ad99f458515e5557646b0/The-Factors-Constraining-the-Adoption-of- Prefabrication-in-the-New-Zealand-Residential-Construction-Sector-Contractors-Perspective.pdf>
Chiu, S. T. L. (2012) An analysis on the potential of prefabricated construction industry. Available from: Open Source Repository <https://open.library.ubc.ca/cIRcle/collections/undergraduateresearch/52966/items/1.0103132>
Denscombe, M. (2014) The good research guide: For small-scale social research projects. Berkshire, England: Open University Press.
Gorgolewski, M.T. (2005) The potential for prefabrication in United Kingdom housing to improve sustainability. Available from: Open Source Repository <https://www.irbnet.de/daten/iconda/CIB4250.pdf>
Goulding, J. S., & Nadim, W. (2011). Offsite production: A model for building down barriers: A European construction industry perspective. Engineering, Construction and Architectural Management, 18(1), 82-101. Available from: Open Source Repository <http://dx.doi.org/10.1108/09699981111098702>
Kennerly, T. (2019). Planning barriers to prefab. Build 171, April/May 2019. Available from: Open Source Repository <https://www.buildmagazine.org.nz/assets/PDF/Build-171-82-Research-Planning-Barriers-To-Prefab.pdf?>
Kiernan, G. (2019) New Zealand short by nearly 40,000 houses. Available from: Open Source Repository <https://www.infometrics.co.nz/nz-short-by-nearly-40000-houses/>
Manley, K., Miller, W., & Steinhardt, D. A. (2013). Reshaping housing: The role of prefabricated systems. Queensland, Australia: Queensland University of Technology. Available from: Open Source Repository <https://eprints.qut.edu.au/81175/1/resh aping-housing-prefabricatedsystems.pdf>
Mirus, A.C., Patel, Y. and McPherson, P. (2018). Prefabrication: New Zealand’s golden ticket? Available from: Open Source Repository <https://unitec.researchbank.ac.nz/bitstream/handle/10652/4550/Mirus%2c%20A.C.%20%282018%29.pdf?seq uence=4&isAllowed=y>
Moradibistouni, M., and Gjerde, M. (2017). Potential for prefabrication to enhance the New Zealand construction industry. Available from: Open Source Repository
<http://anzasca.net/wp-content/uploads/2017/11/ASA_2017_Moradibistouni_Gjerde.pdf> Moradibistouni, M., Vale, B. and Isaaks, N. (2018). Prefabrication: New Zealand manufacturers of prefabricated
buildings and components 2017. Available from: Open Source Repository <https://www.researchgate.net/profile/Eziaku_Rasheed/publication/329544715_The_influence_of_demograph ic_and_locational_factors_on_occupants'_perception_scores_for_their_buildings/links/5c4a43a1458515a4c73e 8e96/The-influence-of-demographic-and-locational-factors-on-occupants-perception-scores-for-their- buildings.pdf#page=147>
Prefab NZ. (2014). Value case for prefab: How off-site construction can deliver better cost-effective housing to more New Zealanders. Available from: Open Source Repository <http://www.prefabnz.com/Downloads/Assets/7639/1/>
Rahman, M. M. (2013). Barriers of implementing modern methods of construction. Journal of Management in Engineering, 30(1), 69-77. https://doi.org/10.1061/(ASCE) ME.1943-5479.00001
Scofield, R., Potangaroa, R., and Bell, P. (2009) Offsite unplugged: The potential for offsite production in New Zealand.Available from: Open Source Repository <http://12219-
portal.memberconnex.com/PDFs/CSA/Offsite%20Unplugged.pdf> Shahzad, W., Mbachu, J., and Domingo, N. (2015). Marginal productivity gained through prefabrication: case studies
of building projects in Auckland. Buildings, 5(1), 196-208. Available from: Open Source Repository <https://www.mdpi.com/2075-5309/5/1/196>
Steinhardt, D. A., and Manley, K. (2016). Adoption of prefabricated housing–the role of country context. Sustainable Cities and Society, 22, 126-135. Available from: Open Source Repository <https://eprints.qut.edu.au/100065/3/100065.pdf>
Toomath, W. (1996). Built in New Zealand: The houses we live in. Auckland, New Zealand: Harper Collins. Trainer, M. (2017). Housing in Sweden: An overview. Terner Centre for Housing Innovation, UC Berkeley. Available
from: Open Source Repository <http://ternercenter.berkeley.edu/uploads/Swedish_Housing_System_Memo.pdf>
640
The 54th International Conference of the Architectural Science Association (ANZAScA) 2020
Interlocking Blocks in Social Construction of Housing: Collaboration of Local Government, NGO and the Urban Poor
Isidoro Malaque III University of the Philippines Mindanao, Davao City, Philippines
Abstract: With the failure of both public and private sectors in ideal provision of low-income housing, the agencies of NGO and the urban poor are seen contributing important role in shelter provision. In the co-production of housing, this paper sought to explore on the participation of various agencies in the social construction of low-income housing in Los Amigos relocation site, Davao City, Philippines. A survey was conducted covering 33 housing units of the members of a homeowners’ association who are beneficiaries of relocation site by the city government and assistance on housing construction by NGO. In this relocation site with lots provided by the local government, units assisted by NGO were initially provided with core housing models installed with locally produced interlocking compressed earth blocks. Upon occupancy of the urban poor beneficiaries, incremental improvements were made through self-help manner. Inspired from the interlocking compressed earth blocks as the basic building material for core housing units, this paper demonstrates the social construction of an architecture as result of collaboration between various actors in the socio-spatial processes. Most importantly, the empowerment and participation of the people, represented by the urban poor and NGO, as the centre in achieving Sustainable Development Goals.
Keywords: Urban poor housing; NGO; interlocking blocks; Davao City.
1. IntroductionMassive rural to urban migration resulted to shortage of affordable housing in the formal market sector. In the context of developing countries, rapid growth of urban population coupled with poverty resulted to proliferation of informal housing in impoverished settlement conditions as affordable shelter for the urban poor. With the failure of both public and private sectors in the ideal provision of low-income housing, referring to the promises of social welfare and neo-liberal market oriented policies, respectively, the agencies of non-governmental organisation (NGO) and the urban poor are seen contributing important role in shelter provision.
In the Philippines, in Davao City for example, a sheer number of urban migrants who need adequate shelter is beyond the capability of the private sector to provide through the formal housing market, and the government through its socialized housing programme. However, from the point of view of citizen
Imaginable Futures: Design Thinking, and the Scientific Method. 54th International Conference of the Architectural Science Association 2020, Ali Ghaffarianhoseini, et al (eds), pp. 640–649. © 2020 and published by the Architectural Science Association (ANZAScA).

641
Ibrahim Alhindawi and Carlos Jimenez-Bescos
participation, NGO initiatives are seen successful in assisting in the provision of housing and settlements for organised urban poor communities. Despite ended up settling in impoverished conditions in the slums and informal settlements, the ingenuity of the urban poor in providing their own shelter is also observed in their self-help housing initiatives. Thus, in the context of citizen participation, there is a need to explore on the contribution of the people, assisted by NGO, in the formation of built environment evident in the construction of low-income housing and settlements.
2. Background to the study
2.1. Housing typologies and the transition from living in informal housing towards owning formal housing types
The preliminary findings in a comprehensive case study of low-income housing and settlements conducted in Davao City, Philippines, revealed that low-income housing can be classified into different types in a range of contiguous categories from informal to formal housing units (Malaque III, et al., 2014). For the urban poor living in informal settlement, there may be three ways to own formal housing unit. Firstly, the urban poor had to undergo multi-step transitions from living in informal housing and settlement, and became owner of formal housing unit in due course. This also means in situ progressive development of former informal urban settlement that went through a process of regularisation. Secondly, ownership of formal housing is achieved through one-step regularisation where an urban poor living in informal settlement became beneficiary of a low-cost housing unit with assistance from both the government on provision of land and NGO for house construction. Thirdly, with the same one-step regularisation model, ownership of formal housing unit is achieved by being a qualified beneficiary of formal housing loan, or in other case, the urban poor improved his/her capacity to afford completed housing unit sold in the formal housing market.
The traditional ‘one-step regularisation model’, originated and successful in high-income countries, was criticised by Lim (1987) when this model was adopted in developing countries, thus, the ‘multi-step transition model’ was posited as alternative. However, in the case study conducted in Davao City, Philippines, the ‘one-step regularization model’ was observed successful in the provision of formal housing for the low-income sector because of the collaboration of the government for assistance on land development and security of tenure, and the NGO for participation in the construction of housing units (Malaque III, et al., 2014). With improved security of tenure, incremental construction towards finishing the housing units by the inhabitants themselves was also observed (Malaque III, et al., 2015). While the previous comprehensive study (Malaque III, et al., 2014; 2015) also covered cases of in situ progressive development of urban settlements and multi-step transition of housing, this study focused on cases of housing in a relocation site provided by the local government unit where cases of successful one-step regularisation with assistance from the NGO for house construction were found.
2.2. Social construction of housing
In terms of epistemological and ontological approaches to housing research, McNelis (2014, p. 11) identified ‘positivism’ as the most common approach being employed. Positivist paradigm that underpinned traditional housing policy, popular at the height of modernity in the twentieth century, viewed housing problems in an objective way. Following the social welfare approach then popular in the 1970s, housing solutions were implemented based on the ideological tendencies of concerned governments. For example, Mayo, Malpezzi and Gross (1986, p. 184) reported that if there is a

642
Interlocking Blocks in Social Construction of Housing: Collaboration of Local Government, NGO and the Urban Poor
perceived shortage of shelter, the government will build houses. In the context of developing countries, this traditional approach failed to cope with the dynamism and complexity evident in slums and informal settlements. From the point of view of urban design, Madanipour (2006) originally defined the actors of socio-spatial dynamic processes in the formation of built environment. For example, according to Madanipour (2006, p. 174), the socio-economic process reflects the act of the producers identified as ‘those who build the city, predominantly developers and their financiers and team professionals, including designers and construction companies’. However, in the context of a developing country, Malaque III, et al. (2016, p. 96) observe that the urban poor themselves are identified as the main producers with technical and other forms of assistance from NGO. This implies that the urban poor are both the users (socio-cultural actors) and the producers (socio-economic actors) of housing and the built environment. This same framework was applied in the previous paper of Malaque III and Golimlim (2019) on the construction of low-income housing towards climate change adaptation and disaster risk reduction, utilizing case study of low-income housing provision for the victims of typhoon. For housing research that offers an account of the processes by which a housing phenomenon is treated as socially constructed, this papers adopts the postmodernist paradigm of ‘social constructionism’, identified by Lund (2011) as one the five approaches used in understanding housing policy in the UK.
2.3. Collaboration in housing provision
Social construction of housing demonstrated by reciprocal relationship between actors in the socio- spatial processes, in this paper, is concretised with the concept of collaboration. Collaboration as a dynamic process was examined in the study of Rattelade and Sylvestre (2012) with Ottawa Supportive Housing Network as the case. The study sought to understand the dynamic inter-relationship of categories of effective collaboration originally identified by Mattessich and Monsey (1992, as cited by Rattelade and Sylvestre, 2012) to include environment, membership, communication, process/structure, purpose and resources. In the context of developing countries, in the case of Nepal for example, collaboration was a result of the movement of civil society represented by squatters’ organisations (Tanaka, 2009). The movement started in 1990 with workshop on squatters organized in Kathmandu by the Concerned Citizen Group in Nepal. Initiated by the late Dr Ramesh Manandhar who was a well- respected architect and housing rights activist, this eventually led to the formation of the Lumanti Support Group for Shelter, an NGO that facilitated the formation of different grassroots people’s groups and built their capacity. From one of confrontation with government authorities, Tanaka (2009) highlighted the change of squatters’ strategy to one of collaboration with multiple stakeholders, including non-squatters. With the change in relationship between squatters and non-squatters, and with the moves for public-private-community partnership, thus, this resulted to collaboration.
Collaboration is also associated with co-production of the built environment. In the context of developing countries, in the case of Zimbabwe for example, collaboration between states and organised communities managing their unequal power relationships is linked to make co-production work as strategy for settlement upgrading (Shand, 2018). In the European context, the concepts of collaboration and co-production are used as social constructs to understand the phenomena of housing provisions in Vienna and Lyon, Austria and France, respectively (Czischke, 2018). Exploring on the cases, the notion of co-production illustrates the relationship between housing providers (public, not-for-profit, cooperative, professionals) and the user groups (residents) in collaborative housing projects. Thus, focusing co- production of space defined by housing and the built environment, collaboration is seen as a shifting paradigm in citizen participation managing reciprocal relationships between actors in the socio-spatial

643
Ibrahim Alhindawi and Carlos Jimenez-Bescos
processes instead of having tug-and-war between the power holders and the marginalised sector such as the urban poor. Moreover, collaboration is also applied in transdisciplinary exercise involving the academic actors, community and development practitioners (Nix, et al., 2019). However, this paper focuses on the collaboration between the government, NGO and the urban poor, predefined as agencies in the social construction of low-income housing.
3. Aims and objectivesFollowing the preliminary result presented in the paper of Malaque III, et al. (2014) on the typology of housing units and the multi-step transition from living in informal housing to owning formal housing types, succeeding studies focused on the cases of multi-step transition of housing found in in situ progressive development of urban settlements. Examples of succeeding papers include the incremental construction of housing in direct relation to the improvement of security of tenure (Malaque III, et al., 2015); and, the evolution of housing and socio-spatial processes in low-income settlements (Malaque III, et al., 2016). The focus on cases of in situ multi-step transition of housing followed the criticism on the failure of one-step regularisation model adopted in developing countries. However, following example of successful one-step regularisation, unique in the case of Davao City, Philippines (Malaque III, et al., 2014), this study revisited housing cases in a relocation site where a community of urban poor beneficiaries received assistance from NGO for the construction of housing units.
Despite being the subject of scholarship presented in the previous papers (Malaque III, et al., 2015; 2016; Malaque III and Golimlim, 2019), the social construction of housing and settlements participated by various agencies requires further detailed understanding. Thus, the aim of this research is to explore on the participation of various agencies in the social construction of low-income housing in Los Amigos relocation site, Davao City, Philippines. From the point of view of socio-spatial processes, to illustrate housing as a material expression, this research emphasizes the importance of political, economic and cultural factors in the formation of built environment. Hence, it is hoped to provide insights into housing interventions, especially in terms of architectural design and practice, appropriate in developing countries.
4. Case study area, housing cases and data collectionThe case study presented in this paper was conducted in Davao City, Philippines, the same city that situates the comprehensive study of low-income housing and settlement reported in the previous papers (Malaque III, et al., 2014; 2015; 2016). While the previous papers were based from extensive fieldwork conducted from February to April 2014, approved by The University of Adelaide Human Research Ethics Committee (January 2014), covering a total of 74 households in 11 settlements, this current study revisited the Los Amigos relocation site that is one of the mentioned 11 settlements. Moreover, while the fieldwork data in 2014 included only three housing cases located in this relocation site, this current study, funded by the University of the Philippines Mindanao through its In-House Research and Creative Work Grants (2020), covers 33 housing units of the members of Samahang Matute at Soliman (SAMASOL) homeowners’ association who are beneficiaries of relocation site by the city government and assistance on housing construction by NGO.
SAMASOL homeowners’ association was organised and officially registered in 2012. The association has 46 registered members qualified for city government relocation site, being affected by demolition of their informal houses, among other bases for qualification. Out of 46 members, 33 were qualified for assistance on the construction of houses from NGO, which became the subject of this case study. These

644
Interlocking Blocks in Social Construction of Housing: Collaboration of Local Government, NGO and the Urban Poor
33 housing cases are coded with Housing Unit (HU) numbers from 001 to 033 indicated with their respective household family names given by the respondents during fieldwork. These family names have no legal implications, except that they are only used as reference for academic discussion. The current fieldwork was conducted in time of COVID-19 pandemic, thus, strict protocol for preventive measure was observed. This includes the hiring of NGO staff and homeowners’ association officers as enumerators and on other fieldwork assistance; wearing of face mask; and, maintaining the required social distancing during household surveys. Furthermore, COVID-19 screening questionnaires were completed by those involved in the actual fieldwork including enumerators and household participants. For the safety of research proponent, supervision of fieldwork was conducted remotely by monitoring through mobile phone.
5. Presentation of results
5.1. Provision of relocation site by the local government unit
The 1987 Philippine Constitution, reported in the PhD thesis of Malaque III (2017), was a major landmark in the country’s governance following the People Power revolution in 1986. The Constitution, as a general framework, sets guiding principles on the conditions of evictions and the roles of the government, private and non-profit organisations in housing delivery and infrastructure development. Furthermore, this became the basis for enactment of the Local Government Code of 1991 and the Urban Development and Housing Act of 1992. These major legislations marked the departure from eviction and relocation to the adoption of a more decentralised approach which integrated the participation of the urban poor; and, redefined the roles of local government, urban poor communities, and mediating groups such as NGO.
In this case study, the Los Amigos relocation site is one of the latest relocation project of the city government of Davao. It is located approximately 21 kilometres northwest of the city centre through the Davao-Bukidnon road. The site has a total land area of 135,033 square metres that can accommodate at least 747 lots compliant to the minimum standards for socialised housing. Each lot has an area of 80 square metres each provided to qualified housing beneficiaries by the city government. In the time being, while site and infrastructure development is not complete, the urban poor beneficiaries are only allowed to occupy with no final agreement yet between them and the city government.
5.2. Assistance in the construction of housing units by the NGO
The Homeless Peoples’ Federation Philippines Inc (HPFPI), active in many years, has operated in the dumpsites of Payatas, Quezon City since the 1990s. The federation was formed, with the Vincentian Missionaries Social Development Foundation Inc (VMSDFI) Manila (2001) as NGO partner, to bring together low-income community organisations that had developed housing savings groups. At the time of Papeleras, et al. (2012) publication, HPFPI was reported being active in 17 cities (including Davao) throughout the country with a total savings of USD 987,844. Aside to finance housing needs for the urban poor, the savings demonstrates a social mechanism to build networks of communities, to bring people to work together towards a common goal. In the case of this study, HPFPI, with its office based in Davao City, played important role in community organising to support SAMASOL homeowners’ association to avail housing assistance.

645
Ibrahim Alhindawi and Carlos Jimenez-Bescos
In terms of micro-financing, the Community Resources for the Advancement of the Capable Society (COREACS) served as the partner NGO to provide loans to qualified beneficiaries for the construction of core houses mainly installed with locally produced interlocking compressed earth blocks (Figure 1). The loan package for a 20-square meter core house costs a total of PHP 150,000. To qualify, beneficiaries must be able to pay one-time equity amounting to PHP 30,000; and, with household income to afford monthly payments of PHP 3,145 in five years for the remaining PHP 120,000 loan amount. The monthly payments were computed with 18 per cent annual interest rate on diminishing balance. Further NGO assistance includes the construction of core houses by the Link Build Inc (LINKBUILD), supported by the Technical Assistance Movement for People and the Environment Inc (TAMPEI) for the design and technical matters (Table 1).
(a) (b) Figure 1: Floor plan (a), and 3D model of core housing unit initially provided by NGO (b)
Table 1: Network of NGO collaborated to assist in the construction of houses
Name of NGO Assistance / participation HPFPI Homeless Peoples’ Federation Philippines Inc Community organizing COREACS TAMPEI LINKBUILD
Community Resources for the Advancement of the Capable Society Technical Assistance Movement for People and the Environment Inc Link Build Inc
Micro-financing Design and technical Construction of core units
5.3. Incremental construction of housing units by the inhabitant beneficiaries
Two out of three housing cases covered by this study previously settled in informal housing and settlements. Aside from being affected by demolition, some of them were renting in informal housing and settling in danger zones such as in flood prone area near Davao river. An isolated case, the Sapid household (HU010) previously owned and lived in a formal housing located in the city centre. For the reason that their house was demolished being affected by road widening project, thus, the household qualified for a relocation site. Housing cases covered have an average household size of four members. For two cases of extended or multi-family households, the Sapid (HU010) and the Macabodbod (HU016) households, their sizes are eight and eleven total members, respectively. In the following paragraphs, selected representative cases of incremental housing construction are presented.
Figure 2 presents two sample housing cases which remain almost the same in comparison with the core house preliminary provided by NGO shown in Figure 1. In Figure 2(b), construction detail of the installation of interlocking compressed earth blocks shows the flexibility of the core house for further expansion of areas and incremental construction of structures. This type of blocks (sometimes referred as bricks) was first used as alternative housing materials in African countries and later introduced to

646
Interlocking Blocks in Social Construction of Housing: Collaboration of Local Government, NGO and the Urban Poor
Asian countries through international network of NGOs for use in low-cost housing projects. In terms of production, compressed earth blocks were made of 10 per cent cement and 90 per cent lime soil. Moreover, water is added in proper proportion considering moisture content of lime soil, local climatic condition of the site during production, among other considerations to achieve desired structural strength. In some other cases, chemical additives were added to shorten curing period or to enhance structural qualities. In its application as major building material for the core house shown in Figures 1 and 2, the use of temporary building materials for the frontage wall, such as wood planks (Figure 2[a]) or plywood sheets (Figure 2[c]), allows easier expansion towards the front yard without damaging major structures nor wasting more permanent building materials already installed.
(a) (b) (c) Figure 2: Samoranos (HU002) house (a), construction detail of interlocking compressed earth blocks (b),
and Panchito (HU011) house (c)
(a) (b) (c) Figure 3: Incremental improvements of Sapid (HU010) (a), Mulit (HU018) (b),
and Habagat (HU032) (c) houses
From the initial core house, further incremental constructions by the inhabitant beneficiaries themselves were observed in various forms. Despite improvements were done at the same time period, in response to the needs of the inhabitants and in accordance to the financial capacity of the households, these current housing cases in various forms represent different phases of incremental constructions. For example, in the case of Sapid house (HU010) shown in Figure 3(a), any available or affordable light building materials were used for makeshift expansion of the core house to shelter a multi-family family household of 11 members. By its nature, this current incremental construction is considered temporary. In the case of the Mulit house (HU018) shown in Figure 3(b), the incremental improvement is observed in the appearance of an expansion in the front using concrete and masonry construction. Despite unfinished in the time being, the structural form implies to carry an upper floor. In the case of Habagat house (HU018) shown in Figure 3(c), to simply enhance safety and security, and privacy, improvements were done focusing on the construction of permanent property walls and front entrance gate.

647
Ibrahim Alhindawi and Carlos Jimenez-Bescos
Five out of the 33 housing cases covered in this study were observed completed with permanent building materials for the housing structure and finished with tiles and paints. Samples of fully completed and finished houses shown in Figure 4 demonstrate the end goal of those cases of incremental construction in-process presented above. As finished architectural product, the final form reflects the contribution of interlocking compressed earth blocks (as basic building material used) and the flexibility of the core house model to accommodate effective incremental construction by the inhabitants themselves during occupancy. Architecture, in this paper referring to a house that provides man/woman’s basic need for shelter, as material expression of participation of various agencies of socio-spatial processes is the subject of discussion in the succeeding section.
(a) (b) (c) Figure 4: Maalat (HU001) (a), Magno (HU012) (b), and Maalat (HU022) (c) houses
6. The interlocking blocks in social construction of housingThe seminal work of Turner (1968) emphasised the agency of the settler in squatter settlement. Referring to the architecture in squatter settlement as ‘an architecture that works’, Turner (1968) then demonstrated that the incremental construction of a house started from a simple shack where a squatter inhabitant invested his/her life savings in a dwelling that he/she created by him/herself in the process. However, after decades of learning from interventions of governments and private financial sectors (with varying degrees of success and failure), this case study illustrates how a core house model situated in a local government provided relocation site an effective initial housing provision for the inhabitants to further its incremental construction in self-help manner. An example of successful model of one-step regularisation resulted from collaboration between the government (on provision of land and security of tenure) and NGO (on assistance in house construction) was observed in a previous study (Malaque III, et al., 2014). Moreover, in this study, the referred successful one-step regularisation is further enhanced by the contribution of inhabitant beneficiaries in the incremental improvements, completion and finishing of housing units in self-help manner. Improved security of tenure as important factor to encourage investments from inhabitants for incremental construction of houses, also observed in another previous study (Malaque III, et al., 2015), is further demonstrated in the 33 housing cases covered by this study that are located in a local government relocation site with assistance from NGO on provision of core housing units. The provision of land and secured tenure (by the government) and the acknowledgement of inhabitants to qualify for assistance in provision of core houses (by the NGO) encouraged secured investments from inhabitant beneficiaries on the incremental construction, completion and finishing of their houses using permanent building materials.
Inspired from the interlocking compressed earth blocks as the basic building material for the construction of initial core housing units, the ‘interlocking blocks’, in social term, refers to the participation and collaboration of the government, NGO and the urban poor as agencies in the social

648
Interlocking Blocks in Social Construction of Housing: Collaboration of Local Government, NGO and the Urban Poor
construction of low-income housing illustrated in this study. From the point of view of socio-spatial processes, with actors originally defined by Madanipour (2006), followed by a redefinition of the socio- economic actors in the context of a developing country, in the case of the Philippines by Malaque III, et al. (2016), the agencies of social construction of housing and their acts are presented in the following points.
• The government as actor in the socio-political process, its successful participation is demonstrated in the direct intervention by the local government unit, in this case the city government of Davao,on the provision of land and secured tenure for the urban poor housing beneficiaries.
• The NGO, in its participation in assisting the urban poor as producer in the socio-economic process (per redefinition of Malaque III, et al., 2016), played important role in community organising,provision of micro-financing, technical assistance in the design and construction of core housing units.
• The urban poor, as actor in both socio-economic and socio-cultural processes (referring to the same redefinition of Malaque III, et al., 2016), demonstrated ingenuity in creating their own dwellings inthe process fit to their realistic needs and economic status in time.
7. ConclusionThe social welfare policy approach in provision of complete housing product for the low-income sector was criticised not successful in developing countries due to limitations of government funds. However, in this study, it is observed that the government is successful in facilitating the provision of land with secured tenure in a relocation site by the local government unit. In the same way, the neo liberal market oriented policy approach mainly played by the private financial sector was criticised for bringing the urban poor, supposedly as low-income housing beneficiaries, to long-term debts resulted to vicious cycle of squatting and relocating. However, with the participation of NGO in community organising, provision of micro-financing, and assistance in the design and construction of core housing units, the ingenuity of the urban poor to create their own dwellings, which Turner (1968) once had faith, is better realised. Eventually, the co-production of housing and the built environment by collaboration of the government, NGO and the urban poor is demonstrated in this study. Hence, for an architecture that really works, it must be an architecture that is socially constructed as result of collaboration between various actors in the socio-spatial processes, most importantly empowering the participation of the people who is the centre in achieving Sustainable Development Goals.
Acknowledgements This research project was funded by the University of the Philippines Mindanao through its In-House Research and Creative Work Grants (2020). Acknowledgment is hereby extended to the following organisations and persons for their assistance and cooperation in the conduct of fieldwork/data collection: Homeless Peoples’ Federation Philippines Inc (HPFPI); Samahang Matute at Soliman (SAMASOL) Homeowners’ Association; Rexan Rainier Cabangal; Janeth Mandin; and, Aprille Dawn Golimlim.

649
Ibrahim Alhindawi and Carlos Jimenez-Bescos
References Czischke, D. (2018) Collaborative housing and housing providers: towards an analytical framework of multi-
stakeholder collaboration in housing co-production, International Journal of Housing Policy, 18(1), 55-81. Lim, G.C. (1987) Housing policies for the urban poor in developing countries, Journal of the American Planning
Association, 53, 176–185. Lund, B. (2011) Understanding housing policy, Second edn., Policy Press, Bristol. Madanipour, A. (2006) Roles and challenges of urban design, Journal of Urban Design, 11(2), 173-193. Malaque III, I., Bartsch, K. and Scriver, P. (2014) Typology of urban households and their transition from informal to
formal status, in A. Tadeu, O. Ural, D. Ural and V. Abrantes (eds.), Sustainable Housing, Construction: Proceedings of the 40th IAHS World Congress on Housing, International Association of Housing Sciences, Funchal.
Malaque III, I., Bartsch, K. and Scriver, P. (2015) Learning from informal settlements: provision and incremental construction of housing for the urban poor in Davao City, Philippines, in R.H. Crawford and A. Stephan (eds.), Living and Learning: Research for a Better Built Environment: Proceedings of the 49th International Conference of the Architectural Science Association, Melbourne, 163-172.
Malaque III, I., Bartsch, K. and Scriver, P. (2016) Modelling the evolution of housing and socio-spatial processes in low-income settlements: case of Davao City, Philippines, in J. Zuo, L. Daniel and V. Soebarto (eds.), Fifty Years Later: Revisiting the Role of Architectural Science in Design and Practice: Proceedings of the 50th International Conference of the Architectural Science Association, Adelaide, 89-98.
Malaque III, I. (2017) Multi-Step Transition in Housing Provision and Progressive Development of Urban Settlements: Case of Davao City, Philippines (Published PhD Thesis), The University of Adelaide, Adelaide, Australia. Available from: <https://digital.library.adelaide.edu.au/dspace/handle/2440/119353>
Malaque III, I. and Golimlim, A.D. (2019) Socio-spatial processes in the construction of low-income housing towards climate change adaptation and disaster risk reduction, in A. Agrawal and R. Gupta (eds.), Revisiting the Role of Architecture for 'Surviving’ Development: Proceedings of the 53rd International Conference of the Architectural Science Association, Roorkee, 441–450.
Mayo, S.K., Malpezzi, S. and Gross, D.J. (1986) Shelter strategies for the urban poor in developing countries, Research Observer, 1(2), 183-203.
McNelis, S. (2014) Making progress in housing: a framework for collaborative research, Routledge, London. Nix, E., Paulose, J., Shrubsole, C., Altamirano-Medina, H., Belesova, K., Davies, M., Khosla, R. and Wilkinson, P. (2019)
Participatory action research as a framework for transdisciplinary collaboration: a pilot study on healthy, sustainable, low-income housing in Delhi, India, Global Challenges, 3(4).
Papeleras, R., Bagotlo, O. and Boonyabancha, S. (2012) A conversation about change-making by communities: some experiences from ACCA, Environment and Urbanization, 24(2), 463-480.
Rattelade, S. and Sylvestre, J. (2012) Understanding collaboration as a dynamic process: a case study of collaboration in a supportive housing network, Currents: Scholarship in the Human Services, 11(1).
Shand, W. (2018) Making spaces for co-production: collaborative action for settlement upgrading in Harare, Zimbabwe, Environment and Urbanization, 30(2), 519-536.
Tanaka, M. (2009) From confrontation to collaboration: a decade in the work of the squatters' movement in Nepal, Environment and Urbanization, 21(1), 143-159.
Turner, J.C. (1968) The squatter settlement: an architecture that works, Architectural Design, 38(8), 355-360. Vincentian Missionaries Social Development Foundation Inc (VMSDFI) Manila (2001) Meet the Philippines Homeless
People's Federation, Environment and Urbanization, 13(2), 73-84.

650
The 54th International Conference of the Architectural Science Association (ANZAScA) 2020
Investigating Natural Ventilation Behaviour of Passivhaus PHPP Using CFD Building Simulations
Ibrahim Alhindawi1 and Carlos Jimenez-Bescos2 1 National University of Ireland, Galway, Ireland
[email protected] University of Nottingham, Nottingham, United Kingdom
Abstract: While the Passivhaus design approach and certification depend on the Passivhaus Planning Package (PHPP) steady-state building simulations, including the natural ventilation assessment, design, and planning, this paper aims to assess the effectiveness and behaviour of the Passivhaus ventilation plan taken from the Passivhaus Planning Package (PHPP) natural ventilation tab through the implementation of Computational Fluid Dynamics (CFD), building modelling and simulation. The study approach provides useful and informative assessment for building designers to manipulate natural ventilation plans in a more efficient way, leading to a more accurate decision making and increased flexibility in the design process. The results, through a case study, have unveiled the fact that airflow patterns are of an uncomfortable airspeeds at certain locations, surpassing 2 and 3 m/s at specific inlet air velocities, causing turbulence at some points of coverage, where these outputs could be implemented in adjusting the architectural design decisions regarding airflow direction.
Keywords: Passivhaus; PHPP; Natural Ventilation; CFD; Building Simulations.
1. IntroductionDescribing energy efficiency as “the first fuel”, the International Energy Agency (IEA) has stated that there is potential for significant benefits associated with energy efficiency. However, energy efficiency measures such as the implementation of natural ventilation might have negative impacts on the indoor environment status if not implemented correctly, as it is a directly related factor to thermal comfort, indoor air quality and overheating risk. Therefore, studies that implement pre-design and early design stages tools that enhance the mechanism and operation of such measures are of great importance in terms of realising better performing buildings.
In terms of ventilation, whether forced or natural, Computational Fluid Dynamics (CFD) software implementations have dispensed a range of outcomes that have had crucial implications in this field.
While assisting designers and modellers with decision making, CFD have taken the simulations towards better design approaches of active and passive cooling behaviour of airflow.
Imaginable Futures: Design Thinking, and the Scientific Method. 54th International Conference of the Architectural Science Association 2020, Ali Ghaffarianhoseini, et al (eds), pp. 650–659. © 2020 and published by the Architectural Science Association (ANZAScA).

651
Ibrahim Alhindawi and Carlos Jimenez-Bescos
Studies that implemented CFD in buildings’ design and investigations have varied in aims and objectives. In an article by Sultanguzin et al. (2019), the research team have implemented the use of CFD with BIM and BEM to present a concept of an integrated building design process, to create a house with minimal energy costs. The study showed the effectiveness of application to create a building close to the Passivhaus standards.
For Passivhaus building certification, the Passive House Planning Package (PHPP) is the one tool that gives verdict on whether the design and its various aspects are successful in being verified and eventually pass as a certified building. Moreover, it includes the natural ventilation plan tab, which is an important part of the spreadsheets’ steady-state calculations.
However, the implementation of CFD or other BEM software simulations is not a part of this process, despite its efficient dynamic outcomes. Rimár et al. (2019) have investigated the system of a Passivhaus building Mechanical Ventilation with Heat Recovery (MVHR) using CFD simulations. The ANSYS FLUENT software allowed to calculate heat balance of rooms’ thermal gains like computers, monitors and occupants. The results proved that these simulations are important for occupants and equipment heat gains calculations, beside the solar gains. Another finding was that the CFD airflow simulations were important to figure out indoor airflow barriers behaviour.
Sigalingging et al. (2019) have implemented IES VE software to investigate a Passivhaus building energy use, beside the PHPP for the building criteria. Also, the field measurements of air temperature and relative humidity to validate the software models. Having validated the IES model, it was found that the dwelling insulation and air-tightness levels were incrementally changed until they met the Passivhaus standard. In another Passivhaus study, Costanzo et al. (2018) have found that overheating occurrences during the cooling season have been recorded for almost 50% of the time according to EN 15251 Standard in PHPP calculations. Further analyses conducted with the help of dynamic simulations in EnergyPlus allowed identifying the insulation levels and ventilation mode as the key design factors to change in order to reduce overheating to less than 20% of time while keeping a comfortable indoor environment in winter.
Suhendri and Koerniawan (2017) have taken three traditional houses in Indonesia for investigating wind-driven ventilation strategy, representing all country areas. CFD simulations were conducted for that purpose. Results have shown that the tool has enabled more optimisation for the strategy design, buildings shapes adjustments and more uniform air distribution. A comprehensive numerical CFD study by Bajc et al. (2015) on a Passivhaus, focused on the analysis of temperature fields of a Trombe wall for several days of a typical meteorological year (TMY) for a moderate continental climate. Results have shown that the analysis has potential for the energy saving performance.
Investigating a dual method of CFD simulation models, Xie M. et al. (2012) have shown the results of natural ventilation analysis of rural houses in Hunan, China, stating that CFD simulations helped with more land-saving strategy with model 2, where the extruded space model was the best model and worth to be applied more than model 1.
Eventually, a range of studies have implemented CFD simulations and BEM software, in attempts to lower and optimise energy use and natural ventilation strategies, whether in Passivhaus buildings, next to PHPP, or in other building concepts.
This study aims to assess the behaviour of the natural ventilation airflow patterns in Passivhaus through the implementation of CFD simulations, by applying the Passivhaus PHPP natural ventilation strategy, and acquiring a comprehensive description of the operability of the strategy, with multiple

652
Investigating Natural Ventilation Behaviour of Passivhaus PHPP Using CFD Building Simulations
outcomes to provide an assessment of the approach, as well as multiple parameters for further investigations.
2. MethodologyThe process of this study comprises two main phases. The first phase involves data extraction of the natural ventilation plan from the PHPP, as it is needed in the second phase, which consists of the application of the extracted data in the ANSYS CFD software in three steps.
Starting from ANSYS GEOMETRY where the Passivhaus modelling and form settings take place, going through the ANSYS MESH where the model volume settings, inlets and outlets are identified, ending with the ANSYS FLUENT solution of all the previous model settings and natural ventilation plan aspects integration.
The PHPP natural ventilation data are extracted from the hygienic air exchange window ventilation strategy and the additional night ventilation strategy. The window groups quantity, openings, clear width, and clear height values are modelled in the ANSYS GEOMETRY phase and translated to air velocity receivers (air velocity inlets) and exhausters (air pressure outlets) in the MESH phase.
Additionally, the FLUENT phase has relatively different data sets to apply within. As the outdoor air velocities coming into the Passivhaus through the PHPP plan specified openings dimensions are set into four velocity magnitudes. Airspeeds of test, 0.5, 1.0, 1.5 and 2.0 m/s, represent the usual airspeeds that enter through windows in buildings, from the annually average wind direction (south/south-west).
Furthermore, the previous inputs where implemented to evaluate the effect of different airspeeds on the indoor airflow condition, with respect to the comfort status of users. Figure 1 shows the modelling phase/process.
Figure 1: Points of Coverage - Passivhaus CFD Modelling.

653
Ibrahim Alhindawi and Carlos Jimenez-Bescos
As for the outcomes of the simulations, apart from the main outcome, which is the airflow patterns and gradients of rooms area plans, the airspeeds results were taken out for points distributed on the Passivhaus indoor areas on the mid-chest plane height. That happens to be 90 cm, simulating a sitting user mid-chest level, as a detailed area coverage. On the other hand, another set of results is extracted, represented by two parameters from the FLUENT surface integral reports. The first parameter is the Uniformity Index (UI), that describes how uniform the airflow is distributed around the covered area, which is calculated within the values range of 0.0 (0%) to 1.0 (100%), having the optimum values as 0.75 and above. As CFD simulation procedures suggests.
The second parameter is the Area-Weighted Average (AWA) airspeed, which is an average airspeed value for the whole area points covered by the airflow. Relatively, the process takes the ASHRAE 55 rule of thumb as a reference of comfortable airspeeds, which takes a maximum of 2 m/s of airflow speed to be appropriate for occupants, as higher values are usually where papers starts blowing off for instance, which is not comfortable for building users. The previously mentioned values are calculated for both storeys of the Passivhaus, as well as for the vertical plane that goes through the double height (staircase volume). Figure 2 explains the workflow process.
Figure 2: Workflow Diagram.
3. ResultsResults of the simulations are presented in four parts; each part stands for an inlet airspeed of test that is illustrated on all planes tested in the Passivhaus areas.

654
Investigating Natural Ventilation Behaviour of Passivhaus PHPP Using CFD Building Simulations
3.1. Inlet Airspeed of 0.5 m/s
A range of 0.05 m/s to maximum 0.36 m/s has been recorded among the points of test on the ground floor, with a UI of 0.75 and an AWA of 0.19 m/s.
The first floor test points recorded airspeeds have ranged from 0.04 to 0.74 m/s at the test points, with a maximum airspeed of 1.3 m/s at spaces junctions of the N/E and the N/W outlets spaces. As shown in Figure 3. The UI and AWA of the first floor have recorded 0.68 and 0.3 m/s respectively, with the double height recording a 0.68 of UI as well.
Figure 3: FLUENT Results-0.5 m/s Inlet Airspeed Simulation.
3.2. Inlet Airspeed of 1.0 m/s
This simulation has recorded airspeeds within the range of 0.09 to 0.76 m/s for the ground floor points of coverage, with a UI of 0.7 and an AWA of 0.39 m/s. For the first floor, the range of airspeeds at the test points has been within 0.06 and 0.83 m/s, with a UI of 0.67 and an AWA of 0.58 m/s. The spaces junctions of the N/E and the N/W outlets spaces has recorded above 2.00 m/s as Figure 4 illustrates.
Figure 4: FLUENT Results-1.0 m/s Inlet Airspeed Simulation.
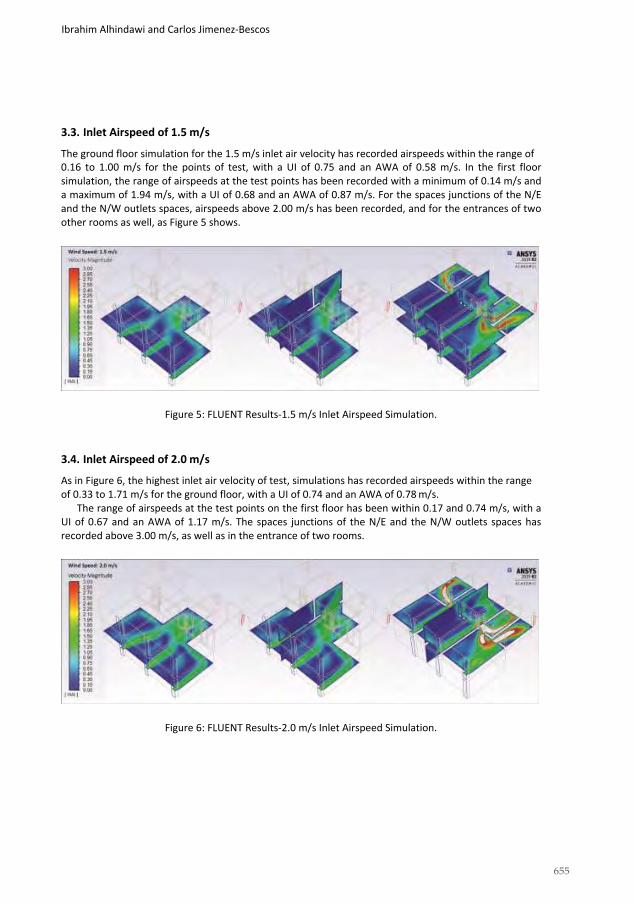
655
Ibrahim Alhindawi and Carlos Jimenez-Bescos
3.3. Inlet Airspeed of 1.5 m/s
The ground floor simulation for the 1.5 m/s inlet air velocity has recorded airspeeds within the range of 0.16 to 1.00 m/s for the points of test, with a UI of 0.75 and an AWA of 0.58 m/s. In the first floor simulation, the range of airspeeds at the test points has been recorded with a minimum of 0.14 m/s and a maximum of 1.94 m/s, with a UI of 0.68 and an AWA of 0.87 m/s. For the spaces junctions of the N/E and the N/W outlets spaces, airspeeds above 2.00 m/s has been recorded, and for the entrances of two other rooms as well, as Figure 5 shows.
Figure 5: FLUENT Results-1.5 m/s Inlet Airspeed Simulation.
3.4. Inlet Airspeed of 2.0 m/s
As in Figure 6, the highest inlet air velocity of test, simulations has recorded airspeeds within the range of 0.33 to 1.71 m/s for the ground floor, with a UI of 0.74 and an AWA of 0.78 m/s.
The range of airspeeds at the test points on the first floor has been within 0.17 and 0.74 m/s, with a UI of 0.67 and an AWA of 1.17 m/s. The spaces junctions of the N/E and the N/W outlets spaces has recorded above 3.00 m/s, as well as in the entrance of two rooms.
Figure 6: FLUENT Results-2.0 m/s Inlet Airspeed Simulation.

656
Investigating Natural Ventilation Behaviour of Passivhaus PHPP Using CFD Building Simulations
4. DiscussionAs the study aims to provide a detailed description of the airflow pattern and air speeds at different points covering the Passivhaus areas, the simulations have produced varied ranges of data. The ascending inputs of outdoor air velocity magnitudes entering through the model inlets have widen the reported predictions of how the airflow behaves in the building.
With both storeys having air velocity ranges of almost 0 m/s to above 3 m/s, the lower-higher air speeds have not necessarily participated in producing a larger UI in many locations. Withal, through the 0.5 m/s test; the ground floor airflow has shown a higher uniformity index than the first floor, with lower airspeed average related to the area of the airflow distribution.
The results concluded the relation between airflow behaviour of velocity and UI. As higher speeds at certain points caused both higher and lower UI values, the approach has provided a flexible opportunity for designers to manipulate spaces partitioning and inlets/outlets positioning.
Compared to the 0.5 m/s inlet airspeed test, the 1.0 m/s, the rooms with inlet spots recorded a range of 0.6-1.2 m/s, which has clearly no turbulence, staying in the comfort range. However, the simulations of the rooms with outlets windows have recorded uncomfortable airspeeds in certain locations, acting as the peak flow area of the air stream.
Yet, these results occurred when all the doors between the rooms are opened. As Figures 7 and 8 show, airspeeds were doubled at most of the points, pushing the numbers closer towards the green range, as optimum indoor air velocity sets.
Figure 7: Points of Test Airspeeds-Ground Floor

657
Ibrahim Alhindawi and Carlos Jimenez-Bescos
On the other hand, the uniformity index of the ground floor has recorded a lower value, and a triple increase in AWA air velocity. By the same token, the same effect has taken place on the first floor, but with a slightly lower value, with the status of UI and AWA. In the same way of behaviour, the FLUENT simulations for both inlet airspeeds of 1.5 and 2.0 m/s have produced the results, in terms of ascending values of inlet airspeeds of test.
The UI, related to the distribution of the green gradient in Figure 5 shown previously, is noticeably growing wider, covering more areas as the air speed rises, although the airspeed is only one of the factors affecting the UI, as the windows openings and air stream controlling are other important factors.
Howbeit, the 1.5 m/s inlet airspeed simulation results have shown that the UI values of the ground floor and first floor are the same as the 0.5 m/s inlet airspeed simulation results, while noticing that the AWA value is tripled in both storeys, giving more explanations for the designer to note and manipulate the space air supply positions and areas, in a way that serves the design best.
Furthermore, the overall average UI value of the three planes of test (GF, 1st ,and staircase double height) has recorded a value of 0.702, and an AWA of 0.708 m/s.
Figure 8: Points of Test Airspeeds-1st Floor
As Figure 9 illustrates, the red areas of the vector-presented airflow pattern represent the high airflow velocities with values above 2.0 and 3.0 m/s, and these locations were found to have turbulence and uncomfortable airflow sensation for the occupants at inlet airspeeds of 1.0, 1.5 and 2.0 m/s, where this breaks the ASHRAE 55 (2017) rule of comfortable airflow speed.
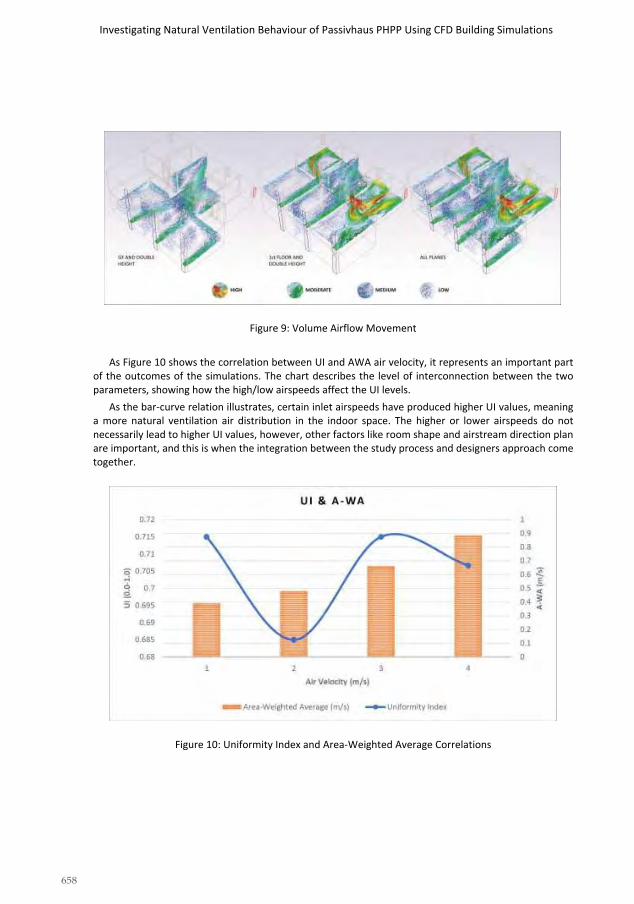
658
Investigating Natural Ventilation Behaviour of Passivhaus PHPP Using CFD Building Simulations
Figure 9: Volume Airflow Movement
As Figure 10 shows the correlation between UI and AWA air velocity, it represents an important part of the outcomes of the simulations. The chart describes the level of interconnection between the two parameters, showing how the high/low airspeeds affect the UI levels.
As the bar-curve relation illustrates, certain inlet airspeeds have produced higher UI values, meaning a more natural ventilation air distribution in the indoor space. The higher or lower airspeeds do not necessarily lead to higher UI values, however, other factors like room shape and airstream direction plan are important, and this is when the integration between the study process and designers approach come together.
Figure 10: Uniformity Index and Area-Weighted Average Correlations

659
659
Ibrahim Alhindawi and Carlos Jimenez-Bescos
5. ConclusionAs the investigation came out with multiple outcomes, the variety of the results has provided the aimed at description of the PHPP natural ventilation strategy. The FLUENT solution has explained how the airflow behaved through the indoor spaces of the Passivhaus in a comprehensive way.
The process has the potential to aid designers through their early design stages and help them manipulate the passive cooling strategies at the most important indoor locations for the occupant’s comfort realisation. On top of that, the parameter of airspeed have come out in two types, as specific points and as a whole space/room area-weighted average, allowing natural ventilation strategy investigators and researchers to go through further studies such as thermal comfort with its varied models, especially the PMV/PPD model, in a detailed way of investigation. In addition, with the different parameters produced have explained how they work together, providing an image of the behaviour of their relations and how they affect each other while increasing and decreasing, helping to reach a balance with a trade-off perspective, in a parametric method.
The applicability of this study has a wide implementation range in the buildings sector. Further applications in the varied concepts of buildings are realisable, where the approach could provide the possible outcomes of passive cooling in terms of flexibility, alternative mechanisms, and courses of action. Nonetheless, limitations of application could exist, in regard to specific building concepts that may rely on specific pieces of software for verification. At that, limitations could extend further where the indoor physical environment could change, in a way, that affects the pre-design simulation outcomes, changing the airflow patterns, where the occupants’ behaviour comes in action. Practical limitations can have effects as well, whilst the control of this method could have multi-disciplinary perspectives to manipulate the design.
References ANSI/ASHRAE Standards 55 (2017), Thermal Environmental Conditions for Human Occupancy, ASHRAE, Atlanta. Bajc T., Todorović M.N., Svorcan J. (2015) CFD analyses for passive house with Trombe wall and impact to energy
demand, Energy and Buildings. pp. 39-44. Costanzo V., Fabbri K., Piraccini S. (2018) Stressing the passive behavior of a Passivhaus: An evidence-based scenario
analysis for a Mediterranean case study, Building and Environment. pp. 265-277. Rimár M., Kulikov A., Fedak M., Abraham M. (2019), CFD analysis of the ventilation heating system, Mechanics and
Industry, 708. Sigalingging R.C., Chow D., Sharples S. (2019) Modelling the impact of ground temperature and ground insulation on
cooling energy use in a tropical house constructed to the Passivhaus Standard, IOP Conference Series: Earth and Environmental Science, 12010.
Suhendri, Koerniawan M.D. (2017), Investigation of Indonesian traditional houses through CFD simulation, IOP Conference Series: Materials Science and Engineering, 12109.
Sultanguzin I.A., Kruglikov D.A., Yatsyuk T.V., Kalyakin I.D., Yavorovsky Yu.V., Govorin A.V. (2019) Using of BIM, BEM and CFD technologies for design and construction of energy-efficient houses, E3S Web of Conferences, 3014.
Web, International Energy Agency (IEA). (2014) Capturing the Multiple Benefits of Energy Efficiency. Available from: <https://webstore.iea.org/capturing-the-multiple-benefits-of-energy-efficiency> (accessed 28 July 2020).
Xie M., Shi L., Liu R., Zhang Y. (2012) The optimization space design on natural ventilation in Hunan rural houses based on CFD simulation, Advances in Intelligent and Soft Computing. pp. 189-195.

660
The 54th International Conference of the Architectural Science Association (ANZAScA) 2020
Land Stewardship in the Climate Wrung Epoch
Yue Yu1 and Sibyl Bloomfield 2 1University of Auckland, Auckland, New Zealand
[email protected] 2Te Whare Wananga o Wairaka - Unitec, Auckland, New Zealand
Abstract: This paper discusses a student research by design project, undertaken as the culmination of a Bachelor of Landscape Architecture degree. The project used theories and principles from resilience thinking as a lens of inquiry, and guidelines for redefining vulnerable coastal land in Onehunga industrial zones undergoing urban development. Asking the question How can vulnerable land be turned into adaptive land that is ‘safe’ for communities? The project explores ways to prototype and test resilience ideas that re-examine and redefine everyday lives, challenge the status quo, and integrate living, working, playing and land stewarding. Key design moves were based on the understanding of complex adaptive social-ecological systems, from individual community members to society as a whole, are embedded in the biosphere and dependent on its life-supporting capacity. By hypothetically testing an alternative way of living, and through a shared process of learning, a new land-use agenda that incubates everyday forms of resilience would emerge, and a downshift mindset promoted by acquired skills would transcend the economic growth driven paradigm that is no longer adaptive and appropriate for the climate change wrung epoch: the Anthropocene.
Keywords: Resilience thinking; climate change; land stewardship; community building.
1. Introduction Human inhabitation has been focused around bodies of water throughout history. In New Zealand
particularly, access to our coast is considered a birthright (Peart, 2009). The coast is at the very core of New Zealand identity. Rapidly growing populations, particularly in urban environments, is putting increasing pressure on coastal settlements and has seen economic incentives take precedence over the ecological and environmental values, and increasingly coastlines are being overtaken by large-scale developments. The hardening of the coastal edge through intensive development has drastically limited the adaptive capacity of the coast, and coastal communities. Climate change and its related impacts continue to increase the tension between the built edge and the sea. The line that separates land from sea does not really exist beyond the conventions of map drawing (Mathur and Da Cunha, 2010). Continuing climate related change in the coastal environment only further blurs the edges. The natural environment does not work with finite lines and boundaries and we must begin to accept and integrate this into our coastal settlements.
Imaginable Futures: Design Thinking, and the Scientific Method. 54th International Conference of the Architectural Science Association 2020, Ali Ghaffarianhoseini, et al (eds), pp. 660–669. © 2020 and
published by the Architectural Science Association (ANZAScA).

661
Yue Yu and Sibyl Bloomfield
The need to develop a resilient and mutually beneficial relationship between these climate change vulnerable coastal zones and the human inhabitation is becoming increasingly apparent. Managed retreat, leaving the edge to its own devices, or intensive protection and development, neither addresses the history of human inhabitation of the coastal edge nor deals with the vulnerable nature of the coastal system appropriately (Bloomfield, 2018). With landscape architecture as the interface between the conflicting needs of ecological and socio-economic systems, a more adaptive and viably interdependent relationship can be created.
Auckland is known for its harbours and tributaries that form large areas prone to flooding hazards (Fernandez et al, 2019). Climate change will increase the severity and frequency of flooding across Auckland: 23% of Auckland buildings are prone to flooding, and 16,000 buildings are estimated to be at risk of floor flooding in 100year flood events (Fernandez et al, 2019).
The research by design case study project, sited in Onehunga, Auckland, New Zealand, proposes designed solutions for integrated coastal development that favours both inhabitation and the revitalisation of ecological coastal systems equally. The intention is to create a model that retrofits existing coastal developments, enhancing both the socio-cultural values of the community, and the ecological and environmental systems that characterize the coast.
Figure 1: Siting the project.
2. Methodology
This paper focuses on a landscape architecture student project as a case study. The case study project addressed climate change and community resilience using the methodology of research by design. This allowed for a reflexive process of multiple feedback that encourages complex system thinking as opposed to mechanistic and linear thinking (Roggenma, 2016). Design testing was conducted in three overlapping phases: pre-design, design and post-design. Design theories were developed into strategies and measures. They were then converted into site-specific design interventions and tested through the process, interwoven with continuous research and active exchange of critique and feedback. This was an iterative process. It is also understood that the purpose of research by design is not solution oriented, but rather a learning curve and a cognitive development. For this paper a desktop review of literature, and further case study analysis was undertaken to support and expand on the primary case. This allowed for discussion of alternative land ‘ownership’ strategies and approaches. This paper is intended as a starting point for further research.
3. Literature Review
Prehistorically the use of temporary settlements in changing environments allowed for resource exploitation without a great extent of investment and risk (Nicholson and Cane, 1994). Migration has been a human adaptive strategy in the face of changes in the environment, due to climate or catastrophic events, that changed the availability of resources or the ability to access them (McLeman and Smit, 2006). As the climate settled and the knowledge and technological ability to protect against the advance of the sea developed, investment in the coastal environment has become more prevalent. With this increased confidence in protective structures, human responses to changes and instability in the coastal environment began to stabilise, often using hard engineering structures. By limiting the natural responses, the hard engineering protective structures are increasing the tensions between natural processes and the man-made environment (Charlier and Chaineux, 2005; Hansom, 2001; Helvarg, 2003; Klein et al, 2001; Nicholls and Klein, 2005; Tol and Klein, 2008).

662
Land Stewardship in the Climate Wrung Epoch
3.1 Climate Change
Sea-level rise (SLR), increased storm intensity and a warming climate, due to increased C02 levels in the atmosphere, are among some of the accepted indicators of climate change. There are immediate impacts such as coastal inundation and flooding that cause disruption of low-lying bloodline infrastructure and transportation. Properties are exposed to damage and the community’s safety and well-being is endangered (Fernandez et al, 2019). It is also necessary to consider less direct impacts such as social dislocation and displacement and related psychological stress (Lindley et al, 2011). Positioning those tensions and challenges in a reality of wicked problems: unstable global economy, volatile international politics and the current global pandemic exposed the complexity of climate change. Policy and decisions are defined by what society wants and expects from its environment, acknowledging human needs in the short term (Crance and Draper, 1996; Tol and Klein, 2008). This highlights the importance of education and knowledge sharing (Scott et al, 2006). Adjusting to living with the natural processes in the coastal environs will require a change of attitude, priorities, and of community understanding and awareness if there is to be integrated coastal management, sensitive development and coastal inhabitation in our future (Barnett, 2001; Helvarg, 2003; MacDonald and Thom, 2009; Nicholls and Klein, 2005; Scott et al, 2006).
Resilience thinking is based on system science that understands our planet and all its organic and inorganic elements as a changing whole. It positions the human dimension (individuals, households, communities, societies, economies and cultures) as part of the interlinked, complex and adaptive social ecological system. It was identified that a main driver of unsustainable development is the application of inappropriate approaches to natural resource management which are often based on static and linear understanding of the social-ecological system while ignoring abrupt changes such as climate change events (Folke, 2016; Walker and Salt, 2006). Exacerbating these circumstances is the illusion of command and control of natural processes and the belief in perpetual growth based on maximising efficiency and optimizing performance of the parts of the social-ecological system (Walker and Salt, 2006).
Thresholds and adaptive cycles are two key models in resilience thinking that provide practical analysing tools that allows insightful understanding of the structure and dynamics of socio-ecological systems at and across a range of temporal-spatial scales (Folke, 2016; Walker and Salt, 2006). Examining vulnerable coastal land through this lens exposed the risk of late conservation (K) and quick release (Ω), often meaning degraded and unhealthy ecological conditions with a backdrop of intensifying urban development. The danger is that the system might be pushed over an unclear threshold and enter an unfavourable yet resilient regime, for example an eutrophicated pond, devastated coral reefs or collapsing ice shelves. Those two models also highlighted the importance of taking radical actions that increase biosphere capacity or the volume of the ‘basin’, and instigate fundamental paradigm shifts in system operations and individual behaviours, so that the overall system operates within the carrying capacity and keeping a safer distance from the late conservation and release phases (Folke, 2016; Walker and Salt, 2006).
Adaptive capacity is about latency and flexibility creating space for responsive adaptation within the socio-ecological system. Building adaptive capacity within coastal settlements increases their resilience and creates space within the community for the absorption of gradual changes, while also providing a platform for faster recovery in the event of any larger scale disturbances. The scientific prerogatives of reports dealing with the natural environment often tend to sideline issues of socio-environmental relationships, particularly on the coast. While the ecological research is critically important, the relationships between the natural environment and human settlement need to be better articulated and the high value of ecological resilience needs to be incorporated in the socio-economic values of the community. Our relationship with our environment needs to be symbiotic, and future development needs to value and highlight these interrelationships and interdependencies.

663
Yue Yu and Sibyl Bloomfield
3.2 Land Ownership
Early colonial settlers to New Zealand had experienced the enclosure of the commons, eviction of tenant farmers and as a result were very aware of the independence and power that came with land ownership. The desire to freehold land was a powerful driver of land policy and settlement (McAloon, 2008). In economic terms land is considered a scarce resource and essential element of production to produce outputs (Bahmanteymouri, 2017). This has inevitably led to a people and land relationship that focuses on the capital value of land while overlooking its environmental values and its social-cultural significance.
The concept of land stewardship comes from the medieval word ‘steward’ meaning ‘keeper of the hall’, more recently it has come to mean someone who cares for something on someone else’s behalf. Land stewardship is then the responsibility for, and care for, the natural environment. In a New Zealand contextthis is related to the Māori environmental management concept of kaitiakitanga, which translates as similar to guardianship or stewardship.
Stewardship has become associated with the environmental movement as a land management approach that allows concerned groups to invest in landscapes and environments for positive environmental outcomes. To date land stewardship is predominantly associated with voluntary engagement in privately owned land for the benefit of natural ecosystem health. Stewardship of public spaces on smaller scales in urban environments is becoming more common. Public space is considered the responsibility of territorial authorities in regard to management and maintenance, and conflicting views of how it might be managed within a community can lead to it being not managed or maintained at all. Like the enclosure of the commons this has led to a less inclusive approach to land management in urban environments in particular.
...public ownership too often means non-ownership, leading to the "Tragedy of the Commons”. Land ownership patterns are critical to stewardship, but no one type of ownership guarantees good stewardship. It implies knowledge, and caring for, the entire system of which that land is a part, a knowledge of a land's context as well as its content… This means that stewardship depends on interconnected systems of ecology and economics, of politics and science, of sociology and planning (Young, 2020).
The definition of the city as a common as described by Foster and Iaione (2016) could be transferred into the context of coastal Onehunga’s vulnerable land. Reimagined as a ‘common’ in this context the Onehunga site could be disentangled from the complexities of traditional western ownership paradigms in the face of climate related threats, and re-positioned as a community asset:
... to recognize the community's right to access and to use a resource which might otherwise be under exclusive private or public control - on account of the social value or utility that such access would generate or produce for the community (Foster and Iaione, 2016).

664
Land Stewardship in the Climate Wrung Epoch
The inherent issues with, and the potential of the commons is often debated and is summarised well by Foster and Iaione (2016):
Hardin famously postulated that threats of degradation and destruction of the commons give rise to either a system of centralized public regulation or the imposition of private property rights in order to avoid the "tragedy”. Ostrom's ground-breaking work, on the other hand, demonstrated that there are options for commons management that are neither exclusively public nor exclusively private. Ostrom identified groups of users who were able to cooperate to create and enforce rules for using and managing natural resources.
In Te āo Māori (the Māori world view) we are the kaitiaki (guardians/stewards) of the land for future generations, as our ancestors were before us. Land ownership, and the conflict of ideals between Māori and European definitions of the concept, is at the heart of the ongoing negotiation of New Zealand’s bi cultural identity. Māori did not have a concept of absolute ownership of land, multiple hapū (tribe or sub- tribe) and whanau (family) might have different rights to the same piece of land, rights were constantly renegotiated and exclusive boundaries were rare (McAloon, 2008). Māori world views regard all humans and living and non-living elements of the environment as interconnected in an interwoven relationship known as ‘whakapapa’ (lineage) (Thompson-Fawcett et al, 2017). This illustrated an understanding of the symbiotic relationship that people have with land and laid the foundation of Māori customary resource management practices. Traditional western land management is led by decisions typically driven by the site owner whereas land stewardship entails dialogue, collaboration and proactive stakeholder engagement, to be defined and facilitated by specific planning considering site complexity, and expected ommunity end goals (Common Forum and NICOLE). Foster and Iaione (2016) also suggest a commons framework with a set of ‘democratic’ design principles that flatten the governance structures:
These principles - horizontal subsidiarity, collaboration, and polycentrism - reorient public authorities away from a monopoly position over the use and management of common assets and toward a shared, collaborative governance approach. (Foster and Iaione, 2016).
There is clear potential, even need, for the development of a stewardship-focused land governance structure that derives from both Te āo Māori principles of kaitiakitanga and whanaungatanga and these ‘democratic’ design principles for our current and future climate-vulnerable urban environments.

665
Yue Yu and Sibyl Bloomfield
4. Onehunga Foreshore Case Study
Onehunga is located on the northern shoreline of Auckland’s Mangere Inlet, which is the north eastern arm of the Manukau Harbour. Onehunga’s convenient access to the east coast made it a strategic hub for transport and infrastructure throughout consecutive settlement and development periods (Murdoch,2013; Panuku, 2017). Major land use decisions including industry activities, port operations, coastal reclamations and roading have left blunt imprints on the coastal morphology that have effectively formed a hardened line as we see today (Murdoch, 2013; Panuku, 2017). This arbitrary edge not only interrupted community access to the waterfront but also fragmented local hydrological filtrations and ecological functions. The otherwise fertile and nurturing inlet has been facing increasingly deteriorating water and sediment contamination issues as indicated by very low biodiversity counting and an ecological healthy rating of ‘unhealthy’ (Kelly, 2008; Kelly 2009).
Compounding those predicaments are another two influxes of challenges: climate change induced flooding and population growth. Based on 50year Annual Recurrence Intervals with 1m sea level rise, sea level is encroaching Onehunga coastal land up to 4m above Mean Sea Level (MSL), meaning a significant proportion of land being inundated including state highway 20 and most of Neilson Street. Being one of Auckland’s most popular areas for urban development, Onehunga has attracted millions of dollars of council upgrade budget and concomitant interests of private investments. By the year 2043, Onehunga is predicted to accommodate 4,773 more dwellings, 10,000 more residents and a significant increase in the aging population who are among the most climate change vulnerable groups (Panuku, 2017). Urban development brings about opportunities for change. However, if land use decisions are based on the status quo paradigm, there is a tendency toward trade-offs that neglect environmental warnings and drop down more plot lines and hard surfaces on vulnerable land. This gave rise to risks of moving further down along a late conservation curve and tapping on the dangerous brink of release phase.
Figure 2: Project master plan.

666
Land Stewardship in the Climate Wrung Epoch
Framed through resilience thinking, three core values emerged as the visions for this design project: restoring biosphere capacity, re-establishing biosphere connectivity and transforming towards stewardship. Complementing those values are seven fundamental principles: diversity; connectivity; feedback loops and slow variables; system thinking; experimentation; broad participation; and polycentric governance. The design project focused on the coastal industrial land between Onehunga Mall and Captain Spring Road. Key design moves started with reclassifying vulnerable land into three flexible zones based on their respective phases in adaptive cycles:
Zone one is 32 ha of ‘quick release’ land under immediate threat of 1m sea level rise (SLR) based on 50-year Annual Return Intervals (ARI). Those lands sit below the threshold delineated at 4m MSL while accommodating bloodline infrastructures including sections of state highway 20, Onehunga Harbour Road off ramp and Neilson Street. This design project seeks this conflicting tension as an opportunity to elevate or relocate threatened infrastructure to allow de-paving and ecological regeneration to filter and treat stormwater runoff within the south Maungakiekie catchment. Streams are to be restored, improved and connected where possible to enhance biochemical processes and provide habitats of functional sub-tidal channels. This design intervention is part of the overall effort to reposition the coastal suburb’s social- ecological system so that it operates within a healthy and safe biophysical ‘regime’.
Zone two is the “slow release” land and also a transitional belt sitting above zone one and under the identified threshold delineated at and above 6m MSL. Repurposed for ecological regeneration, this 34 ha of land is also envisaged to bring communities into the vulnerable land and test a ‘lite’ settlement plan that incubates behavioural transformation towards resilience and stewardship. The rationale is derived from the realisation that increasing biosphere capacity needs to engage people, so that it has the chance to become a place that incubates behavioural change as opposed to misanthropic re-naturalisation. The informal settlements are based on a premise of acknowledging uncertainties and impermanence while adapting to inundation, flooding and any climate change induced challenges. Settlement typologies such as off grid tiny houses on stilts, mobile houses on wheels or modular apartments with transferable units using cranes and rails, are allowed to pop-up, forming neighbourhoods, communities, and whanau. Those emergent and affordable households will be developing essential living skills with decentralised services of power, water and waste. They will accommodate residents who are willing to take an experimental tenure-ship that deviate from property values and re-align lifestyles with environmental responsibility and climate change equity. It aims to cultivate an ethos that cherishes a downshifted, frugalist lifestyle detached from current market norms. The proposed spatial arrangement allows and encourages observation of ecological impacts, instigates response and recalibration of everyday activities, so that an agile social-ecological feedback loop can be formed. Last but not least, it tests a new inhabiting paradigm that allows a wider community to own a home, not on land titled as property, but rather Tūrangawaewae - a place to stand, to be connected and empowered.
Zone three, or the ‘high ground’ is the area where the social-cultural sphere intersects with the biosphere. It is the richest ecotone where social-ecological interactions and ecosystem services interface. It is where economic and social infrastructures are to be invested, and community resources and supplies to be cached. Higher ground in this zone is used as a nexus that connects nodes of catalyst projects such as a resilience centre (the engine room), a youth centre (the router), and a new library/ community centre (the gateway). The long-discussed light rail project was incorporated in this zone. An elevated and vegetated hybrid bridge is envisioned to accommodate light rail transit, cycle ways and walkways. It provides resilient and storm-proof services and also gives way to non-obstructed hydrological and ecological right of way. It is intended to be used as a leverage project that allows this multi-generational investment to better connect and serve local communities.

667
Yue Yu and Sibyl Bloomfield
Most existing buildings sitting at the threshold between 5m and 6m contour levels are proposed to be removed, to create redundancy and space for flexible land use. It will provide vital space for relocations of zone two housing in emergent events such as severe flooding or inundation, effectively function as the new zone two. It also allows for large areas of public open space available for community needs and experimentation such as food production and energy generation. Buildings of heritage value, including some industrial buildings, are to be repurposed as culture and identity anchors. With the above design moves, zone three is envisioned to be a functional biocultural refugia, providing pockets of social-ecological memory in time of change. It is a manifestation of a cultural landscape where community members, existing and new, develop a sense of place and a rooted Onehunga identity.
Projects like RISE (Revitalising Informal Settlements and their Environments) show us that the provision of critical infrastructure to informal settlement doesn’t have to ‘lock down’ the settlement itself but provides for the residents and allows quality of life, and environmental health to be prioritised. This project identified climate change and rapid population growth as exacerbating health risks local communities have been facing (RISE, 2020; Wright, 2009). Flexible and integrated infrastructure including ‘smart’ sewage tanks, bio-filtration gardens, constructed wetlands and recycled wastewater are tested and adopted to ensure agile and site-specific solutions responding to local context (RISE, 2020; Wright, 2009). This is relevant to Onehunga coastal areas that are exposed to climate change risk of displacement and associated challenges. While this project was initiated in response to an informal settlement’s obvious need for some kind of sanitation infrastructure there is no reason why such infrastructure couldn’t be provided to a ‘planned lite-settlement’.
4. Discussion
The Onehunga case study project explored the three core values around biosphere capacity, biosphere re-connectivity and transformation towards stewardship to propose a model for engaging with vulnerable landand developing adaptive capacity. This project has created a resilient Onehunga in the face of Climate change by enhancing:
Biosphere capacity: through retiring vulnerable land for ecological regeneration, allowing re- establishment ofimportant ecosystems and habitats and promoting functional and response diversity.
Biosphere connectivity: reconnecting social-ecological processes and patterns via tangible and intangibleinfrastructure, identifying and preserving palimpsest of ecological and social heritage, spatial and temporalconsiderations. Biosphere connectivity is also achieved by allowing off-grid nomadic inhabitations on land forecological regeneration. It holds two seemingly conflicting spheres together and attempts to build a structure of a modular nature, that is self-sufficient, ecologically diligent, and flexible and responsive.
Social transformation towards stewardship: providing space that allows for adaptive living to happen andevolve; providing opportunities for on-the-ground experimentation, co-learning, co-production ofknowledge, and shared experience. It is about initiating an “adaptive wave” that cultivates adaptivebehavioural and social patterns to emerge and feedback to the system, which then disperse the changesfrom the top and down to wider social spheres and individuals. Key design moves and elements employed key resilience principles of enhancing polycentric governance; broadening participation; encouraginglearning and experimentation; fostering complex systems understanding; maintaining functional andresponsive diversity; managing connectivity; and managing slow variables and feedback loops.

668
Land Stewardship in the Climate Wrung Epoch
Resilience thinking has many intellectual overlaps with Mātauranga Māori or Māori knowledge. Due to the scope of this project, although several design concepts echoed and reflected Māori values, it must be acknowledged that they were not comprehensively integrated or sufficiently synthesised. However, it is noteworthy to mention their value and relevance. Core Māori values of kaitiakitanga (stewardship), whanaungatanga (relationships and connections through kinship as well as shared experiences), kotahitanga (solidarity, collaboration and collective action), and manaakitanga (wellbeing, kindness, respect and care for others) shared insights about the important factors in resilience in the human dimension in relation to the biosphere (Auckland Design Manual, 2019; Ministry of Civil Defence, 2019).
5. Conclusion
Perhaps the opportunity that our changing climate is offering us can help to shift the rigid, socio-economic and power orientated definition of ownership toward a more inclusive, and viably interdependent one.
References
Bahmanteymouri, E (2017) Planning, Urban Land Economics and Urban Economics, in Millar, C. and Beattie,L (eds) Planning Practice in New Zealand. NZ: LexisNexis NZ Ltd. Pp229-242)
Barnett, J. (2001) Adapting to Climate Change in Pacific Island Countries: The Problem of Uncertainty. World Development. 29(6). 977-993.
Bloomfield, S. E. M., (2018) Stepping back: a look at managed retreat in NZ, in P. Rajagopalan (eds.), Engaging Architectural Science: Meeting the Challenges of Higher Density: 52nd International Conference of Architectural Science Association 2018, pp. 553-559.
Bradley, Q. (2017). Neighbourhoods, communities and the local scale. In Bradley Q. & Brownill S. (Eds.), Localism and neighbourhood planning: Power to the people? (pp. 39-56). Bristol: Bristol University Press. doi: 10.2307/j.ctt1t89h5j.9 www.jstor.org/stable/j.ctt1t89h5j.9
Charlier, R. H. & M. C. P. and Chaineux, S. M. (2005) Panorama of the History of Coastal Protection. Journal of Coastal Research 21(1) 79-111.
Common Forum and NICOLE (nd) Land Stewardship: Investing in The Natural, Social and Economic Capital of Industrial Land. Available from:
<https://nicole.org/uploadedfiles/NICOLE_CF_Landstewardship_A5_Booklet_digital.pdf>
Crance, C., and Draper, D. (1996). Socially cooperative choices: An approach to achieving resource sustainability in the coastal zone. Environmental Management 20, 175–184. Available from:
<https://doi.org/10.1007/BF01204002>
Fernandez, M.A., and Golubiewski, N.E. (2019). An assessment of vulnerability to climate change in Auckland. (Auckland Council Technical Report TR2019/011). Auckland, New Zealand: Auckland Council. Available from:
<http://www.knowledgeauckland.org.nz/publication/?mid=2801&>
Folke, C. (2016). Resilience (Republished). Ecology and Society 21(4), 44. Available from: <https://doi.org/10.5751/ES- 09088-210444>
Foster, S. R. and Iaione, C. (2016). The City as a Commons. Yale Law & Policy Review. 34(2), 281-349. Available from: <http://www.jstor.com/stable/43920369> (accessed July 2020)
Hansom, J.D. (2001) “Coastal Sensitivity to Environment Change: A View from the Beach.” Catena 42. 291-305. Helvarg, D. (2003). “Oceans of Trouble: Coasts at Risk Coastal Sprawl and the Shore.” The Multinational Monitor. Available from:<http://www.multinationalmonitor.org/mm2003/03september/sept03corp3.html>. (accessed March 2010)

669
Yue Yu and Sibyl Bloomfield
Klein, R.J.T, et al. (2001) Technological Options for Adaptation to Climate Change in Coastal Zones. Journal of Coastal Research 17(3). 531-543.
Lindley, S., O’Neill, J., Kandeh, J., Lawson, N., Christian, R., and O’Neill, M. (2011). Climate change, justice and vulnerability. Available from: https://www.jrf.org.uk/report/climate-change-justice-and-vulnerability
Mathur, A. and Da Cunha, D. (2010). “The Sea and Monsoon Within: A Mumbai Manifesto.” Mostafavi, Mohsen and Gareth (eds) Doherty. Ecological Urbanism. Baden: Lars Mueller Publishing. 194-207.
MacDonald, T and Thom, B. (2009) Reflections on Managing Australia’s Coastal Environments: Interview with Bruce Thom. Ecological Management and Restoration: Linking Science and Practice 10(1), 4-9.
McAloon, J. (2008). ‘Land ownership’, Te Ara - the Encyclopedia of New Zealand. Available from:
<http://www.TeAra.govt.nz/en/land-ownership/print> (accessed July 2020)
McLeman, R and Smit, B. (2006) Migration as an Adaptation to Climate Change. Climatic Change 76. 31-53. Murdoch, G. (2013). Onehunga Heritage Survey: A preliminary summary of Māori ancestralrelationships. Auckland,New Zealand.
Nicholls, R.J. and Klein, R. J. T. (2005) Climate Change and Coastal Management on Europe’s Coast, in J. E. Vermaat et al. (Eds) Managing European Coasts: Past, Present and Future. Heidelberg: Springer-Verlag Berlin. Nicholson, A. and Cane, S. (1994) Pre-European Coastal Settlement and Use of the Sea. Australian Archaeology 39. 108-117.
Peart, Raewyn (2009). Castles in the Sand. Nelson: Craig Potton Publishing. RISE. (2020). Revitalising informal settlement. Available from:
<https://www.riseprogram.org/#:~:text=RISE%20is%20an%20action%2Dresearch,%2C%20Indonesia%20and%2 0Suva%2C%20Fiji.> (accessed July 2020)
Roggenma, R. (2016). Research by Design: proposition for a methodological approach. Urban Science, 1(1), 2-19.
Available from: <https://doi.org/10.3390/urbansci1010002>
Scott, G. I. A., Holland, F. and Sandifer, P. A. (2006) Managing Coastal Urbanization and Development in the Twenty First Century: The need for a new Paradigm, in Kleppel, G.S, M. Richard DeVoe and Mac V. EDS Rawson. Changing Land Use Patterns in the Coastal Zone: Managing Environmental Quality in Rapidly Developing Regions. USA: Springer. 285-299.
Thompson-Fawcett, M., Rona, L., and Rae, H. ( 2017). Taiao Toitū: Māori and planning, in C. Miller & L. Beattie (Eds.), Planning Practice in New Zealand (pp. 175-188). New Zealand LexisNexis NZ Limited.
Tol, R.S.J., Nicholls, R. J. T. and Klein, R. J. (2008) Towards Successful Adaptation to Sea-Level Rise Along Europe’s Coasts. Journal of Coastal Research 24(2). 432-442.
Walker, B., & Salt, D. (2006). Resilience thinking sustaining ecosystems and people in a changing world. Washington, US: Island Press.
Young, G. L. (2020) “Land Stewardship”. Available from:
<https://www.encyclopedia.com/environment/encyclopedias-almanacs-transcripts-and-maps/land stewardship> (accessed July 2020)

670
The 54th International Conference of the Architectural Science Association (ANZAScA) 2020
Landscape phenology and soil moisture dynamics influenced by irrigation in a desert urban environment
Chenghao Wang Stanford University, Stanford, USA
Abstract: Natural vegetation in arid and semi-arid environments is usually water-limited, while the urbanization process alters its phenology through anthropogenic activities such as irrigation and fertilization. In particular, urban irrigation has also been used as one of the strategies to alleviate heat stress during hot seasons. In this study, we aim to examine the impacts of irrigation and its scheduling on vegetation phenology and soil moisture dynamics in the Phoenix Metropolitan Area, a desert urban environment located in Arizona. We first investigate the plant phenology over different land cover types based on long-term remotely sensed data. Results show that precipitation is the primary determinant of natural vegetation growth, while irrigation controls urban greening and agricultural phenology. We then evaluate different irrigation schedules use a soil water balance model. Simulations suggest that irrigation substantially reduces plant water stress, but its effect varies with the scheduling. Seasonally varied daily irrigation is identified as the optimal irrigation practice to reduce plant water stress and improve evapotranspiration for both urban vegetation and crops. This study highlights the critical role irrigation plays in vegetation phenology in arid and semi-arid environments, and sheds new light on effectively using irrigation to mitigate heat stress in a desert city.
Keywords: Vegetation phenology; urban irrigation scheduling; soil water dynamics; plant water stress.
1. IntroductionAvailable water and energy input are essential to the functioning of vegetation, especially in extreme environments (Schwinning et al., 2004). For arid and semi-arid ecosystems, precipitation is the major available water resource, which significantly influences the dynamics of vegetation (Snyder and Tartowski, 2006). The timing, frequency, and magnitude of precipitation are crucial to the vegetation growth via the interactions of climate–soil–vegetation system (Laio et al., 2001; Ogle and Reynolds, 2004). Heisler-White et al., (2008) evaluated the response of aboveground net primary productivity (ANPP) of semi-arid grasslands to the increasing precipitation event size, and suggested that the ANPP would increase with fewer but larger rainfall events. Another study on three North American deserts showed the sensitivity of net ecosystem CO2 exchange to rainfall event size (Huxman et al., 2004).
In contrast, anthropogenic activities bring in exotic vegetation during the urbanization process, and the phenology of these species can be distinct from those living in the natural environment (Verdugo-
Imaginable Futures: Design Thinking, and the Scientific Method. 54th International Conference of the Architectural Science Association 2020, Ali Ghaffarianhoseini, et al (eds), pp. 670–679. © 2020 and published by the Architectural Science Association (ANZAScA).

671
Chenghao Wang
Vásquez et al., 2016). For example, irrigation as the additional water input increases the water availability, while fertilization in agricultural development improves the primary productivity of crops. A study of deciduous broadleaf forest over the Eastern United States showed that urban vegetation has a growing season 8 days longer than the surrounding forest (White et al., 2002). In the arid Phoenix Metropolitan Area, studies have found distinct vegetation growth multimodality within agricultural and urban areas when compared to that in the surrounding desert (Buyantuyev and Wu, 2012; Zhang et al., 2020).
To evaluate the vegetation phenology and its response to climate and land cover changes, experiments and numerical simulations have been conducted (e.g., Laio et al., 2001). However, in situ measurements have limited spatial and temporal coverages, while numerical simulations are not capable of fully capturing the land–atmosphere interactions. Remote sensing techniques provide an alternative and attractive means to assess the long-term changes of vegetation via proxies such as the Normalized Difference Vegetation Index (NDVI) and the Enhanced Vegetation Index (EVI). For instance, NDVI has been used to study surface moisture, water deficit, and crop water use (Schnur et al., 2010).
In this study, we evaluate the vegetation phenology under different land cover conditions, i.e., urban, agricultural, and natural desert land covers (shrubland and grassland), using a 15-year record of remotely sensed NDVI and EVI over the Phoenix Metropolitan Area. A soil water balance model is modified to incorporate irrigation and EVI-driven plant seasonal variability. Four irrigation schedules are selected to numerically examine the responses of soil moisture dynamics and plant water stress to additional water input. This study aims to answer the following questions: (i) how vegetation seasonality differs under various land cover conditions, (ii) whether rainfall is the driver the vegetation growth for different land covers, and (iii) how irrigation schedules regulate soil moisture dynamics and plant water stress.
2. Data collection and methodology
2.1. Data sources
We retrieved the 30-m National Land Cover Database (NLCD) products for 2001, 2006, and 2011 (https://www.mrlc.gov/data) over the Phoenix Metropolitan Area. NLCD datasets have 16 land cover types over the contiguous United States, with four different urban land cover types ranging from open space to high intensity. Here we consider Shrub/Scrub, Grassland/Herbaceous, and Cultivated Crops in NLCD’s classification system as (natural) shrubland, grassland, and agricultural area, respectively. Figure 1 shows the NLCD 2011 product over Phoenix (as an example) and the satellite images of typical landscapes. We also retrieved the 500-m Moderate Resolution Imaging Spectroradiometer (MODIS) MCD12Q1 Version 5 product (2001–2013) with the IGBP global vegetation classification scheme (Friedl et al., 2010). However, large discrepancies exist between NLCD and MCD23Q1 datasets. For example, the urban area in MCD12Q1 remains intact for 13 years, while the Phoenix Metropolitan Area has undergone extensive urban growth during the past two decades (Wang and Wang, 2017). NLCD products are therefore considered more reliable and are used in the following analyses. We further resampled 30-m NLCD products to a coarser resolution of 250 m.
Two vegetation indices, i.e., NDVI and EVI, during 2001–2015 were retrieved from 16-day MODIS vegetation indices Version 6 product (MOD13Q1) (https://lpdaac.usgs.gov/products/mod13q1v006/). The spatial resolution of this product is 250 m. Note that NDVI is more sensitive to chlorophyll, while EVI is more sensitive to canopy structural variations such as leaf area index and canopy architecture (Huete

672
Landscape phenology and soil moisture dynamics influenced by irrigation in a desert urban environment
et al., 2002). We removed pixels with invalid vegetation indices data and derived the time series of spatial averages over the same land cover type. The NDVI and EVI values over 7 different land cover types during 2001–2005, 2006–2010, and 2011–2015 are based on NLCD 2001, 2006, and 2011 products, respectively.
We use meteorological data (1) to derive precipitation parameters for the point-scale soil water balance model, and (2) to determine the irrigation amount and scheduling. Daily precipitation data in 2001–2015 at the Phoenix Sky Harbor International Airport were downloaded from the National Climatic Data Center’s Climate Data Online website (https://www.ncdc.noaa.gov/cdo-web/). Two Arizona Meteorological (AZMET) Network stations, i.e. Buckeye and Phoenix Encanto, were selected as examples of agricultural land and urban areas, respectively. Figure 1 shows the locations of these three stations and their surrounding environment (satellite images). Note that the Phoenix Encanto station is located on the Encanto Golf Course. The reference evapotranspiration (ETos) data during 2003–2015 were used to calculate the maximum vegetation evapotranspiration by including crop coefficients (Kc) (Brown, 2005).
Figure 1: NLCD 2011 map, satellite images of typical landscapes (source: Google Earth Pro in 2017), and the geographical locations of NOAA Phoenix Airport station and two AZMET stations.
2.2. Point-scale soil water balance model
A modified point-scale soil water balance model originally developed by Laio et al., (2001) is used to simulate the change of relative soil moisture s over time t for one representative natural land cover type (shrubland) as well as agricultural and urban lands by including irrigation effect,

673
Chenghao Wang
w
nZ ds = P(t) + Irr(t) − I(t) − Q(s,t) −ET(s,t) − L(s,t) , (1)
r dt
where n is the soil porosity, Zr the rooting depth (the depth of active soil), P the precipitation, Irr the irrigation, I the interception, Q the runoff, ET the evapotranspiration, and L the leakage (all in LT–1). The first three terms on the right-hand side of Eq. 1 represent the available rainfall and irrigation that reach the soil, while the last three terms constitute water losses.
Precipitation input can be regarded as independent from the soil moisture state at the point scale (Laio et al., 2001). The rainfall series is treated as a series of point events over time and can be simulated as a stochastic Poisson process with a mean arrival rate λ (day–1) and a mean storm/event depth α (mm). Note that λ is the reciprocal of the mean arrival time of the rainfall pulses (1/λ, unit: day). These two parameters are derived based on measurements at the Phoenix Airport station (2001–2015), and can be used to generate rainfall series that follows the distribution of observations.
Interception I is simplified as a parameter that depends on vegetation. Without irrigation, infiltration happens only if the precipitation amount is higher than interception. Runoff Q is considered as saturation excess runoff, and it occurs when s > 1. ET is treated as a piecewise function with four stages
0, s − s
s ≤ sh
E h , s < s ≤ s
w s − s h w
ET(s,t) = E w
w h
+ (ETmax − E ) s − sw
s* − s , sw < s ≤ s*
, (2)
ET , s* < s ≤ 1 max
where sh, sw, and s* are hygroscopic point, wilting point, and plant water stress threshold, respectively, and Ew and ETmax are the bare soil evaporation rate at sw and the maximum ET rate when s is greater than the stress threshold, respectively.
Leakage L is described as the decrease of the hydraulic conductivity K over time as soil dries out,
eβ (s−sfc ) − 1 L(s,t) = K(s,t) = Ks eβ (1−sfc ) − 1
, (3)
where Ks is the saturated hydraulic conductivity at s = 1, and β = 2b + 4. Here b is the pore size distribution index. The hydraulic conductivity decreases to zero at the field capacity sfc.
The static plant water stress ζ is evaluated as (Porporato et al., 2001)
s* − s q
ζ (s,t) = *
s , (4) w
for sw ≤ s ≤ s*, where q measures the nonlinearity of the soil moisture deficit impacts on plant conditions. Here q = 3 is assumed (Porporato et al., 2001). Note that ζ = 0 when s > s*, while the plant water stress reaches its maximum when s drops below wilting point (s < sw).
Urban vegetation in this study is assumed to be turfgrass. Here two types of grass species are considered. During the summer (May–September) bermudagrass is the only grass species, while the
w
− s

674
Landscape phenology and soil moisture dynamics influenced by irrigation in a desert urban environment
practice of overseeding with ryegrass is conducted in October (Brown, 2003; Kopec and Umeda, 2015). The presence of ryegrass lasts from October to April next year. The ETmax of both species over time can be estimated using the measured ETos at the Phoenix Encanto station, the appropriate crop coefficients (Kc) (Brown, 2003), and an EVI reduction coefficient, f, as
ETmax(t) = ETos(t) × Kc(t) × f(EVI, t). (5)
The EVI reduction coefficient incorporates plant seasonality based on remotely sensed vegetation index,
f(EVI, t) = EVI(t) / EVImax, (6)
where EVI(t) is the mean monthly EVI over low intensity urban areas, while EVImax is the maximum of 12 monthly EVI values. Such approach is informed by the strong relationship between vegetation indices and ET (Glenn et al., 2008). For urban vegetation, monthly series of ETos(t)Kc(t) are used based on high quality turf data in Brown's (2003) study. For months with EVImax, the interception Imax by grass is assumed to be 1.0 mm day–1 (Zhou et al., 2013). For other months, the interception is determined as
I(t) = Imax × f(EVI, t). (7)
The maximum rooting depth Zrmax,ber for bermudagrass during its active period (May–September) is 150 mm (Cardenas-Lailhacar et al., 2010), while Zrmax,rye for ryegrass during its active period (October– April) is 70 mm (Wedderburn et al., 2010). The varying Zr,ber and Zr,rye for other months are calculated as
Zr,ber = Zrmax,ber × fber(EVI, t), (8)
Zr,rye = Zrmax,rye × frye(EVI, t), (9)
and the reduction coefficients are
fber(EVI, t) = EVI(t) / EVImax,May–Sep, (10)
frye(EVI, t) = EVI(t) / EVImax,Oct–Apr, (11)
where EVImax,May–Sep and EVImax,Oct–Apr are maximum values of monthly mean EVI during the growing periods of bermudagrass and ryegrass, respectively.
Crops over agricultural land experience rotation every year. Here we assume crops to be cotton in April–October and durum wheat in November–April (most widely harvested in Arizona) (USDA, 1997). Crop coefficients for two species are based on the guidelines of Food and Agriculture Organization (Allen et al., 1998). Calculations of monthly ETmax and I follow Eqs. 5–7 using EVI over agricultural lands, while ETos is based on the Buckeye station. The maximum interception is assumed to be 1 mm day–1. The maximum rooting depths of cotton and durum wheat during their active periods are 1220 mm and 2000 mm, respectively, based on previous studies (Grimes et al., 1975; Gregory et al., 1978). Varying rooting depths in other months can then be determined using reduction coefficients as in Eqs. 10–11.
Creosotebush is selected as the example species for shrubland (Hartman, 1977). The crop coefficients for creosotebush are from Neale et al. (2011). ETos data when using Eq. 5 are from the Buckeye station as AZMET has no rural stations. Monthly ETmax values are further scaled following Schreiner-McGraw et al. (2016). Here EVI data over shrubland are used, and the maximum interception is assumed to be 1.5 mm day–1 (Zhou et al., 2013). The maximum rooting depth is 2000 mm (Gibbens and Lenz, 2001). Similar EVI reduction coefficients are also used.

675
Chenghao Wang
Uniform soil texture of sandy loam (Hartman, 1977) is used here, and the soil parameters follow Laio et al. (2001): n = 0.43, sh = 0.14, sw = 0.18, s* = 0.46, sfc = 0.56, b = 4.90, and Ks = 800 mm day–1. We aim to evaluate on average the responses of soil moisture dynamics and plant water stress to precipitation and irrigation. Therefore, for each land cover with or without irrigation, numerical simulations of continuous 1000 years were performed, and results are evaluated based on monthly or annual averages.
2.3. Irrigation scheduling
The irrigation amount needed for urban areas and agricultural land is estimated to be equal to the ETmax throughout the year. As a result, the annual irrigation amount needed for urban vegetation (1397.2 mm) is slightly lower than that for agriculture (1671.4 mm). Similar to Volo et al. (2014), four irrigation scenarios are designed, i.e., daily constant (DC), daily seasonal (DS), monthly constant (MC), and monthly seasonal (MS), with identical annual irrigation amount but different frequency and size of delivery (Figure 2). The responses of soil moisture dynamics and plant water stress can reveal the optimal irrigation scheduling using the soil water balance model.
Figure 2: Different irrigation scheduling for (a–d) urban areas and (e–h) agricultural land.
3. Results and discussion
3.1. Vegetation phenology based on remotely sensed vegetation indices
Figure 3b and c shows the average 16-day NDVI and EVI over time under seven land cover conditions during 2001–2015. Winter and monsoon seasons with precipitation higher than 100 mm are shaded in blue and red, respectively. The spatial and temporal patterns of NDVI and EVI are in general consistent, although NDVI is relatively higher than EVI. Grassland has the highest coefficient of variation (CV = 0.29 for NDVI) among all land cover types, although its mean NDVI (or EVI) is relatively low, suggesting its high sensitivity to precipitation. Similarly, shrubland has the second largest CV with mean NDVI (or EVI) relatively higher than that of grassland. Agricultural land has the highest vegetation index level. The mean NDVI or EVI over open space, low intensity, and high intensity urban areas is close to that over shrubland, while high intensity urban areas have the lowest NDVI or EVI level. In addition, the CVs of NDVI and EVI over agricultural land and urban areas are much smaller than those of natural landscape, suggesting that the phenology of agricultural and urban vegetation is not determined by precipitation. Instead, irrigation is the predominant water input over these areas. The highest NDVI or EVI peaks over natural landscapes are observed mainly during winters and springs with high seasonal rainfalls (Figure 3).

676
Landscape phenology and soil moisture dynamics influenced by irrigation in a desert urban environment
In contrast, large monsoonal rainfalls have limited impact on natural vegetation, possibly because the water input is insufficient to support growth when ET rate is very high during hot summers (see Section 3.2).
Figure 3e shows monthly EVI in the study area. The annual multimodality of EVI is clear for most land cover types. The two peaks of EVI result from crop rotation and repeated urban grass overseeding practice. Natural desert vegetation usually has only one growing season which often ends during the pre-summer drought. EVI over natural landscapes is also controlled by the precipitation peak in March, although the EVI peak is one month later than the winter rainfall peak as limited by temperature. Summer rainfalls have relatively marginal impacts on vegetation growth over natural landscapes, but can further improve the growth of irrigation-fed vegetation in urban and agricultural areas.
Figure 3: Long-term (a) monthly precipitation and 16-day (b) NDVI and (c) EVI, as well as monthly mean (d) precipitation, (e) temperature, and EVI in the Phoenix Metropolitan Area. Note that precipitation and
temperature are observations from the Phoenix Airport station.
3.2. Responses of soil moisture dynamics and plant water stress to precipitation and irrigation
Figure 4 shows the simulated soil moisture dynamics and plant water stress under natural condition (without irrigation). For all three land cover types, the lowest soil moisture and the highest static water stress occur in the pre-monsoon season owing to high temperature and low precipitation. The mean soil moisture content is below the wilting point in most months, suggesting extremely high water stress. With a shallower rooting depth, urban grass has the highest mean soil moisture during monsoon (summer) and winter seasons. The bimodality of ET is in line with NDVI or EVI observations and growing seasons. Surface runoff and leakage occur in some months for urban grass, while for shrubland and agricultural land, precipitation is completely converted to ET. The leakage amount of urban grass is much greater than runoff, especially in winter. In contrast, limited leakage and runoff are observed in summer due to the high demand of ET. The probability distribution function (pdf) of static water stress shows that plants over all three land cover types, if without irrigation, are under high water stress (mean

677
Chenghao Wang
ζ > 0.9). With a shallow rooting depth, the ζ of urban grass can drop to zero during large rainfall events. The highest ETmax during most months over agricultural areas results in the highest mean static water stress.
Figure 5 shows the responses of soil moisture to different irrigation schedules. Compared to natural conditions, irrigation substantially alleviates plant water stress and elevates mean soil moisture. For urban areas, irrigating only once per month (monthly pulses) results in higher plant water stress and lower mean soil moisture than daily irrigation. Note that the two monthly irrigation practices have nearly identical patterns of soil moisture. The constant urban daily irrigation throughout the year yields the lowest mean static water stress and highest mean soil moisture (0.36), although its s during summer is lower than that with seasonally varied daily irrigation (Volo et al., 2014). The impact of irrigation on reducing crop water stress is even more significant than over urban areas, as suggested by the lower mean ζ values. The seasonally varied daily irrigation leads to the lowest mean static water stress. The soil moisture in two constant scenarios is higher than sfc during winter.
We further examine the partitioning of available water. Among the four urban irrigation practices, daily seasonal scenario yields the maximum ET amount (74.8% of annual water input) with only marginal leakage loss (2.2% of annual water input). In contrast, a large portion of available water (63.6%) in two urban monthly scenarios is converted to runoff. The daily seasonal scenario for agricultural irrigation also has the maximum ET amount (81.7% of the annual water input). As the net primary productivity is closely related to ET amount (Churkina et al., 1999), the daily seasonal scenario is considered as the optimal practice for both urban areas and agricultural land.
Figure 4: (a) Monthly relative soil moisture content, (b) monthly ET, leakage, and runoff, and (c) probability distribution functions fz(ζ) of static water stress (probability for ζ = 0 and 1 not shown) under
natural condition (no irrigation). Error bars in (a) show standard deviation of 1000-year simulations, while ζ values in (c) show the mean values.
Figure 5: Monthly relative soil moisture content and pdfs of s for four irrigation schedules over (a) and (c) urban area, and (b) and (d) agricultural land. Note that ζ values in (c) and (d) are the mean values (DC
= daily constant, DS = daily seasonal, MC = monthly constant, and MS = monthly seasonal).

678
Landscape phenology and soil moisture dynamics influenced by irrigation in a desert urban environment
4. Concluding remarks In this study, we examine the vegetation phenology under different land cover conditions in the Phoenix Metropolitan Area using long-term remotely sensed data. Results suggest that agricultural land has the highest mean NDVI or EVI, followed by urban areas with low intensity and open space, both due to irrigation practices. In contrast, natural shrubland and grassland have relatively low mean NDVI or EVI levels as limited by available water, with high sensitivity to precipitation. Winter rainfall is the major driver of the peak vegetation growth over shrubland, while the strong bimodality in agriculture and urban areas results from crop rotation, repeated grass overseeding practice, and irrigation. Simulations using a modified soil water balance model show that with the same annual irrigation amount, seasonally varying daily irrigation is the optimal practice to reduce plant water stress and promote plant growth in both urban areas and agricultural land. This study also has strong implications for urban planning of effectively using irrigation to mitigate heat stress during hot seasons. Arid cities like Phoenix should also pay attention to the trade-off between water use and heat mitigation (Wang et al., 2019).
Acknowledgements The author thanks Dr. Enrique R. Vivoni and two anonymous reviewers for their constructive comments.
References Allen, R.G., Pereira, L.S., Raes, D. and Smith, M. (1998) Crop evapotranspiration - Guidelines for computing crop water
requirements-FAO Irrigation and drainage paper 56, FAO, Rome, 300(9), p. D05109. Brown, P.W. (2003) Turfgrass consumptive use values for the Phoenix area. AZ1314. Tucson, Arizona: The University
of Arizona. Brown, P.W. (2005) Standardized reference evapotranspiration: A new procedure for estimating reference
evapotranspiration in Arizona. AZ1234. Tucson, Arizona: The University of Arizona. Buyantuyev, A. and Wu, J. (2012) Urbanization diversifies land surface phenology in arid environments: Interactions
among vegetation, climatic variation, and land use pattern in the Phoenix metropolitan region, USA, Landscape and Urban Planning, 105(1–2), 149–159.
Cardenas-Lailhacar, B., Dukes, M.D. and Miller, G.L. (2010) Sensor-based automation of irrigation on bermudagrass during dry weather conditions, Journal of Irrigation and Drainage Engineering, 136(3), 184–193.
Churkina G., Running, S.W. and Schloss, A.L. (1999) Comparing global models of terrestrial net primary productivity (NPP): the importance of water availability, Global Change Biology, 5, 46–55.
Friedl, M.A., Sulla-Menashe, D., Tan, B., Schneider, A., Ramankutty, N., Sibley, A. and Huang, X. (2010) MODIS Collection 5 global land cover: Algorithm refinements and characterization of new datasets, Remote Sensing of Environment, 114(1), 168–182.
Gibbens, R.P. and Lenz, J.M. (2001) Root systems of some Chihuahuan Desert plants, Journal of Arid Environments, 49(2), 221–263.
Glenn, E.P., Huete, A.R., Nagler, P.L. and Nelson, S.G. (2008) Relationship between remotely-sensed vegetation indices, canopy attributes and plant physiological processes: What vegetation indices can and cannot tell us about the landscape, Sensors, 8(4), 2136–2160.
Gregory, P., McGowan, M., Biscoe, P. and Hunter, B. (1978) Water relations of winter wheat: 1. Growth of the root system, The Journal of Agricultural Science, 91(1), 91–102.
Grimes, D.W., Miller, R.J. and Wiley, P.L. (1975) Cotton and corn root development in two field soils of different strength characteristics, Agronomy Journal, 67(4), 519–523.
Hartman, G.W. (1977) Soil survey of Maricopa County, Arizona, central part. Department of Agriculture, Soil Conservation Service.

679
Chenghao Wang
Heisler-White, J. L., Knapp, A. K. and Kelly, E. F. (2008) Increasing precipitation event size increases aboveground net primary productivity in a semi-arid grassland, Oecologia, 158(1), 129–140.
Huete, A., Didan, K., Miura, T., Rodriguez, E.P., Gao, X. and Ferreira, L.G. (2002) Overview of the radiometric and biophysical performance of the MODIS vegetation indices, Remote Sensing of Environment, 83(1), 195–213.
Huxman, T.E., Snyder, K.A., Tissue, D., Leffler, A.J., Ogle, K., Pockman, W.T., Sandquist, D.R., Potts, D.L. and Schwinning, S. (2004) Precipitation pulses and carbon fluxes in semiarid and arid ecosystems, Oecologia, 141(2), 254–268.
Kopec, D. and Umeda, K. (2015) Overseeding winter grasses into bermudagrass turf. AZ1683. Tucson, Arizona: The University of Arizona.
Laio, F., Porporato, A., Ridolfi, L. and Rodriguez-Iturbe, I. (2001) Plants in water-controlled ecosystems: active role in hydrologic processes and response to water stress: II. Probabilistic soil moisture dynamics, Advances in Water Resources, 24(7), 707–723.
Neale, C.M.U., Geli, H., Taghvaeian, S., Masih, A., Pack, R.T., Simms, R.D., Baker, M., Milliken, J.A., O'Meara, S. and Witherall, A.J. (2011) Estimating evapotranspiration of riparian vegetation using high resolution multispectral, thermal infrared and lidar data, in Remote Sensing for Agriculture, Ecosystems, and Hydrology XIII, 81740P.
Ogle, K. and Reynolds, J.F. (2004) Plant responses to precipitation in desert ecosystems: integrating functional types, pulses, thresholds, and delays, Oecologia, 141(2), 282–294.
Porporato, A., Laio, F., Ridolfi, L. and Rodriguez-Iturbe, I. (2001) Plants in water-controlled ecosystems: active role in hydrologic processes and response to water stress: III. Vegetation water stress, Advances in Water Resources, 24(7), 725–744.
Schnur, M.T., Xie, H. and Wang, X. (2010) Estimating root zone soil moisture at distant sites using MODIS NDVI and EVI in a semi-arid region of southwestern USA, Ecological Informatics, 5(5), 400–409.
Schreiner-McGraw, A.P., Vivoni, E.R., Mascaro, G. and Franz, T.E. (2016) Closing the water balance with cosmic-ray soil moisture measurements and assessing their relation to evapotranspiration in two semiarid watersheds, Hydrology and Earth System Sciences, 20(1), 329–345.
Schwinning, S., Osvaldo, E.S., Loik, M.E. and Ehleringer, J.R. (2004) Thresholds, memory, and seasonality: understanding pulse dynamics in arid/semi-arid ecosystems, Oecologia, 141(2), 191–193.
Snyder, K.A. and Tartowski, S.L. (2006) Multi-scale temporal variation in water availability: Implications for vegetation dynamics in arid and semi-arid ecosystems, Journal of Arid Environments, 65(2), 219–234.
USDA (1997) Usual planting and harvesting dates for US field crops. Agricultural Handbook Number 628. National Agricultural Statistics Service.
Verdugo-Vásquez, N., Acevedo-Opazo, C., Valdés-Gómez, H., Araya-Alman, M., Ingram, B., de Cortázar-Atauri, I.G. and Tisseyre, B. (2016) Spatial variability of phenology in two irrigated grapevine cultivar growing under semi- arid conditions, Precision Agriculture, 17(2), 218–245.
Volo, T. J., Vivoni, E.R., Martin, C.A., Earl, S. and Ruddell, B.L. (2014) Modelling soil moisture, water partitioning, and plant water stress under irrigated conditions in desert urban areas, Ecohydrology, 7(5), 1297–1313.
Wang, C. and Wang, Z.-H. (2017) Projecting population growth as a dynamic measure of regional urban warming, Sustainable Cities and Society, 32, 357–365.
Wang, C., Wang, Z.-H. and Yang, J. (2019) Urban water capacity: Irrigation for heat mitigation, Computers, Environment and Urban Systems, 78, 101397.
Wedderburn, M.E., Crush, J.R., Pengelly, W.J. and Walcroft, J.L. (2010) Root growth patterns of perennial ryegrasses under well-watered and drought conditions, New Zealand Journal of Agricultural Research, 53(4), 377–388.
White, M.A., Nemani, R.R., Thornton, P.E. and Running, S.W. (2002) Satellite evidence of phenological differences between urbanized and rural areas of the eastern United States deciduous broadleaf forest, Ecosystems, 5(3), 260–273.
Zhang, F., Wang, C. and Wang, Z.-H. (2020) Response of natural vegetation to climate in dryland ecosystems: A comparative study between Xinjiang and Arizona, Remote Sensing, under review.
Zhou, X., Istanbulluoglu, E. and Vivoni, E.R. (2013) Modeling the ecohydrological role of aspect-controlled radiation on tree-grass-shrub coexistence in a semiarid climate, Water Resources Research, 49(5), 2872–2895.

680
The 54th International Conference of the Architectural Science Association (ANZAScA) 2020
Learning from the biology of evolution: Exaptation as a design strategy for future cities
Alessandro Melis1, J. Antonio Lara-Hernandez2 and Barbora Foerster3 1,2,3 University of Portsmouth, Portsmouth, United Kingdom
[email protected], [email protected], [email protected]
Abstract: This paper highlights the importance of transdisciplinary studies in times of crisis. In the first part, the study shows the benefits of the introduction of literature on biology to better understand the evolutionary dynamics of architecture. The focus of the research concerns architectural exaptation. In biology, exaptation is a functional shift of a structure that already had a prior but different function. We will also learn that, in biology, all creative systems are redundant and involve variability and diversity. The second part of the paper demonstrates how architectural exaptation, intended as an indeterministic and radical mode of design, can contribute to overcome the current global crisis, because structural redundancy is frequently functional, mostly in ever-changing and unstable environments. For instance, the failure of a planned function of a city can be an opportunity to re-use a structure designed for an obsolete function, to respond to unexpected constraints. As a conclusion, through the comparison between biology and architecture, we will, therefore, try to build an architectural taxonomy that demonstrates how indeterminism is not a subcategory of design. Instead, design paradigms in which redundancy and variable diversity of structures reflect functionalism, constitute an equivalent and essential complement with respect to design determinism.
Keywords: Architecture, Design, Biology, Exaptation
1. IntroductionIn times of global environmental crises, transdisciplinary knowledge becomes valuable for understanding phenomena in a holistic way. Transdisciplinary research involving the biology of evolution is proving particularly significant, having a great impact in applied research (Andriani & Carignani, 2014; Dew, Sarasvathy, & Venkataraman, 2004). The interest in biology has its roots in the idea of architecture as an imitation of nature, such as the origins of classicism (Buchli, 2020; Kaufmann, 1964; Kruft, 1994). The interest of architects today is more oriented towards understanding the genotypes of biology. Scholars such as Rachel Armstrong, Neri Oxman, Liss C. Werner, Tom Kovac, Marjan Colletti, Claudia Pasquero, Marco Poletto, Pablo Eiroa, Antonino Di Raimo are more and more engaging with researches in quantum biology, biocomputation, AI, cybernetics and autopoiesis, as expressed by Francisco Verel and the Chilean biologist Humberto Maturana. Despite the implications of the adaptation processes in natural selection in the search of understanding autopoiesis (Pievani, 2008), there is, however, a lack scientific studies focused on the relationship between adaptation and autopoiesis, and there are even fewer within the field of architecture. The understanding of the aforementioned relationship is the focus of the present study.
One criticism of much of the literature on the history of architecture is that it concerns short periods of time. Conventionally, the history of architecture refers to a short period of evolution of the city, and everything that happens before concerns archaeology. What precedes archaeology usually belongs to palaeoanthropology. Now, if we extend our understanding of architecture beyond the confines of the history of architecture and even that of archaeology, we would have to deal with the study of the biology of evolution to avoid confusing periodic development trends with the understanding of more extensive and permanent phenomena. Thus, an objective of this writing is to start a discussion on the need for this extension in the time frame normally assigned to architecture in order to tackle the relationship between ecosystem and human settlements in a holistic and temporally coherent way. In this perspective, the studies of Heather Pringle on the birth of creativity and those of Stephen Jay Gould and Elisabeth Vrba on the exaptation are pivotal (Gould & Vrba, 1982; Pringle, 2013). The following section will explain this in more detail.
Imaginable Futures: Design Thinking, and the Scientific Method. 54th International Conference of the Architectural Science Association 2020, Ali Ghaffarianhoseini, et al (eds), pp. 680–688. © 2020 and published by the Architectural Science Association (ANZAScA).

681
Alessandro Melis, J. Antonio Lara-Hernandez and Barbora Foerster
2. Exaptation in architectural designAccording to Gould and Vrba (1982), exaptation is the possibility that, in nature, the relationship between organs and functions was potentially redundant, so as to allow that a trait developed for a certain adaptive reason could be ‘co-opted’ or converted to a function also completely independent from the previous one. The concept of exaptation is, therefore, a particularly interesting case study of evolution, because it evokes the relationship between structures and functions, between optimisation and imperfection in nature, calling into question the long-prevailing ‘adaptationist’ vision of the 20th century (Pievani, 2008). Although traces of exaptation were already found in the first formulations on Darwin's pre-adaptation, the idea that the relationships between environment and structures and forms of organisms based exclusively on the principle of adaptation prevailed until the 1960s (Bock, 1967; Bock & WJ, 1979; Bock, 1980; Bock & Von Wahlert, 1965; Williams, 1966). Nevertheless, starting from the research by Gould and Vrba onwards, claims stating that adaptation and exaptation are subsets of the aptation have been corroborated by several studies (Pievani, 2008; Pievani & Serrelli, 2011; Furnari, 2009). Hence, aptation includes both the principles that the functions determine a form, and that the redundancy of the forms allows functional co-optation when unexpected environmental constraints occur.
As mentioned earlier, similarities can be identified between architecture design and biology adaptation mechanisms. Surprisingly, very little attention has been paid on possible parallels between the adaptive models of the evolution and design, which is its architectural version (Faulders, n.d.; Furnari, 2009, 2011). Nevertheless, following the analogy between human design and nature design through the adaptation mechanisms determined by natural selection, we could state that natural selection designs the forms based on the functional objectives of these, so also the architect does the same. This analogy has often fuelled discussions about man's Promethean will to place himself as or above nature (and before God) as a creator. However, if we read this condition in terms of natural selection, the human being is nothing but one of the actors present in the ecosystem. It is through her actions and acts on the environment based on the constraints that the environment exerts; giving life, in turn, a chain of events that determines further constraints on which the human being must subsequently intervene.
In this sense, human action is analogous to that of the other actors present in the ecosystem. The only difference is the tools that the human being uses to carry them. Among these, a specificity of a human is the use of creativity as a form of manifestation of associative thinking (Pringle, 2013). Other actors use other instruments, which are also unique (Gould & Duve, 1996). However, the idea of humankind at the top of an evolutionary ladder or not (Fletcher, 2007; Gould & Duve, 1996; Gould, 1991; Huxley, 1926), does not concern the discourse on design and it will not been taken into account in the present paper. Whilst architectural design, as an environmental adaptation mechanism that depends indirectly on natural selection as many others, is the initial focus of the present writing, we agree with Pievani and Serrelli (2011) by arguing that, in the field of biology, the term aptation includes both adaptation and exaptation. Following this analogy, we hypothesise that the architectural design, which attributes a function to the designed structures, is equivalent to adaptation. So, what is that architectural design mode equivalent to exaptation called? Gould (1982) claims that exaptation presupposes a form of adaptation-non-adaptation because it occurs by functional coptation. Thus, if a mode of design-non-design equivalent to the adaptation exists, how can architectural exaptation contribute to the evolution of cities and buildings?
A precise definition of architectural exaptation has proved to be elusive; therefore, there is no answer to this question in the history of architecture literature (Benevolo, 1977; Collins, 1998; Zevi, 1978; Scully, 2003; Tafuri & Verrecchia, 1980). This could suggest that the phenomenon does not exist at all or that it is not relevant. However, growing attention has been paid to architecture which is not the result of a conventional design process. For instance, indeterministic approaches also imply a functional coptation of existing structures, or the re-use of materials and structures thought to have been for different uses, and even the unexpected change of use in originally designed architectural spaces. These descriptions can be well=-applied to the architectural exaptation definition, even if, in the field of architecture, we usually refer to them as informality, and, sometimes, also to certain expressions of vernacular architecture (Rudofsky, 1987; Frampton, 1993). At this point, we could wonder if, given that the phenomenon exists, it is of little importance. This question can be easily answered by considering that about half of the terrestrial population lives in settlements or structures not designed or not designed for the use that is in place (Melis & Medas, 2020). Therefore, despite the enormous quantitative impact of architecture not designed according to conventional criteria, the literature studying the forms of non-architectural design, or of what we call as exaptation in architecture, is limited. Furthermore, usually it conceives the interpretation of informal architecture as a side aspect of architecture, or as a problem to be treated. Research on vernacular architecture also tends to read positively the adaptive (deterministic) aspects of buildings, for example by enhancing their cultural identity, in antagonism with respect to colonialism, or the climatic response, expertly built on acquaintance transmitted from generation to generation. Even the birth of restoration, conservation and preservation, in the 18th century, have more to do with the cultural value

682
Learning from the biology of evolution: Exaptation as a design strategy for future cities
that ancient buildings and monuments finally acquired, rather than with the attempt to understand the possibilities of refunctionalisation of structures whose function was now obsolete (Carbonara, 1997).
In the field of biology so as in architecture “classifications are not passive ordering devices in a world objectively divided into obvious categories. Taxonomies are human decisions imposed upon nature—theories about the causes of nature's order. The chronicle of historical changes in classification provides our finest insight into conceptual revolutions in human thought. Objective nature does exist, but we can converse with her only through the structure of our taxonomic systems” (Gould & Duve, 1996).
Regarding architecture, it is a matter of naming the possibility of a design to allow functions and uses that were not expected, or expectable, before its construction. The lack of a precise definition as architectural exaptation is, therefore, evidently a gap in the literature. Transdisciplinary studies involving the biology of evolution could contribute to fill this gap, conceptualising architecture as an imitation of nature, biomimicry, bioarchitecture, biocomputation and so on, as previously has already happened. The heuristic value of the interdisciplinary study on exaptation was confirmed forty years ago, yet very little known in architecture. Gould and Lewontin (1979) described, for the first time, the type of structure through which exaptation occurs; they used an architectural metaphor that has become very influential in the field of biology. This structure is called spandrel and its decryption is borrowed from the spandrels of the cathedral of the Basilica of San Marco in Venice.
3. Architectural exaptation: an initial taxonomyThis manuscript section attempts to formulate a first hypothesis of taxonomy on the architectural exptation. We have already indicated that this feature is present in architecture and is highly relevant. We also explained the need for a taxonomy to make the existence of an effective concept that can have a significant impact in overcoming current environmental crisis. The following taxonomy does not intend to be conclusive; rather it is a starting point aimed to enhance an aspect of architecture that has always been considered secondary or insignificant. The architectural and archaeological literature illustrating the following case studies already exists and, in some cases, is even quite extensive (Ingold, 2013; Steadman, 2016). We do not intend to retrace the history of architecture (and its relationship with archaeology), in an orthodox way. Instead, we aim to analyse only a neglected aspect in literature, which is the presence of functional coptation in the following selected case studies.
The discriminant of the inclusion of the case studies in the present taxonomy concerns the presence of spandrel or other forms of functional co-optation. Gould uses the term spandrel to describe the characteristic that is a by-product of the evolution of some other characteristic, rather than a direct product of adaptive selection. Following spandrel’s definition, we could build a taxonomy based on at least five categories. Each category can include both architectural and urban scales and both deterministic and indeterministic approaches. The considered categories are: 1) Functionalisation of existing geomorphologies; 2) Integration of function in existing structures; 3) Re-funtionalisation of function in existing structures; 4) Integration of uses, and lastly 5) Temporary appropriation of space. Let us now turn to explain them in detail.
3.1 Functionalisation of existing geomorphologies
It could be said that, from the beginning, the first form of architecture was the result of a mixture of adaptation and architectural exaptation; from the first settlements in the caves, to the use of its protrusions as seats, to its walls for decorations, to its cavities for sepulchres, and for the accumulation of waste and so on (Steadman, 2016; Rapoport, 1998). The forms of tectonic symbiosis between geomorphology and design and, therefore, the functional coptation of redundant forms, born for other function or for no function, successfully cross every historical epoch and every geographical place on Earth. Such forms can count on milestones such as le Domus de Janas of Sardinia, the hermits' hermitages scattered in almost every place in the Mediterranean, the architectures carved in the stone of Cappadocia, Petra in Jordan, Montezuma Castle in Arizone, Mada'in Saleh rock tombs in Saudi Arabia (Figure 1), and numerous works of contemporary and modern architects. We could distinguish examples in which design determinism seems to prevail (e.g. Petra), with respect to the functionalisation of forms, from cases in which the informal (not designed) approach emerges in a more evident way (i.e. caves).
Chronologically, we could deduce from previous examples that there is a formal prevalence over the informal. Additionally, considering more recent examples in the other forms of functional co-optation, we could see that this trend can only be the result of a study of a limited time span or originated by a prejudice on the greater dignity of the determinist, with respect to indeterminism (Gould & Duve, 1996).

683
Alessandro Melis, J. Antonio Lara-Hernandez and Barbora Foerster
There are almost infinite examples of architectures in which it is difficult, if not impossible, to distinguish the realisation of a shape for a given use, or the attribution of a use to a pre-existing, un-designed shape. Returning briefly to the logic of the biology of evolution, the answer lies in the overcoming of linear logic, cause-effect, and more in associative thinking, through which the brain builds relationships in which environmental constraints push towards creativity and simultaneously the creativity product generates new environmental constraints.
Figure 1: Petra in Jordan (top-left) (Source: Jon Arnold); Montezuma Castle in USA (bottom-left) (Source: Kimberly Dumke); Mada'in Saleh in Saudi Arabia (right) (Source: National Geographic).
3.2 Integration of function in existing structures
Although we have a tendency to describe architecture as the result of a single intended use, resulting from a deterministic design (from which the typology also derives), which we then break down into a series of separate and complementary uses (equally determined), almost in each tectonic component there are different functions, some designed deterministically, others co-opted. So much so that the presence of several functions, decorative, structural or otherwise, in the same tectonic component is probably an intrinsic feature of architecture. In most cases, especially if we observe the architecture of the past, from Classicism, to Romanesque and Gothic, to distinguish the primary function from the secondary one, it is virtually impossible (Melis & Pievani, 2020).
We also tried to attribute adjectives when an aesthetic function seemed, doubtfully in our opinion, to prevail over the others, as in the case of the extension of the Renaissance, towards Mannerism, and of the Baroque towards the Rococo. Alternatively, when a social, cultural and symbolic value prevailed over the aesthetic and structural one, as in the case of Enlightenment neoclassicism or romantic historicism. Surprisingly, this syncretic specificity of architecture has a central role in biology studies on exaptation. A great example is provided in one of the cornerstones of literature by Gould and Lewontin (1979):
The great central dome of St. Mark's Cathedral in Venice presents in its mosaic design a detailed iconography expressing the mainstays of Christian faith. Three circles of figures radiate out from a central image of Christ: angels, disciples, and virtues. Each circle is divided into quadrants, even though the dome itself is radially symmetrical in structure. Each quadrant meets one of the four spandrels in the arches below the dome. Spandrels-the tapering triangular spaces formed by the intersection of two rounded arches at right angles are necessary architectural byproducts of mounting a dome on rounded arches. Each spandrel contains a design admirably fitted into its tapering space. An evangelist sits in the upper part flanked by the heavenly cities. Below, a man

684
Learning from the biology of evolution: Exaptation as a design strategy for future cities
representing one of the four biblical rivers (Tigris, Euphrates, Indus, and Nile) pours water from a pitcher in the narrowing space below his feet.
The design is so elaborate, harmonious, and purposeful that we are tempted to view it as the starting point of any analysis, as the cause in some sense of the surrounding architecture. But this would invert the proper path of analysis. The system begins with an architectural constraint: the necessary four spandrels and their tapering triangular form. They provide a space in which the mosaicists worked; they set the quadripartite symmetry of the dome above.
Such architectural constraints abound, and we find them easy to understand because we do not impose our biological biases upon them. Every fan-vaulted ceiling must have a series of open spaces along the midline of the vault, where the sides of the fans intersect between the pillars. Since the spaces must exist, they are often used for ingenious ornamental effect. In King's College Chapel in Cambridge, for example, the spaces contain bosses alternately embellished with the Tudor rose and portcullis. In a sense, this design represents an "adaptation," but the architectural constraint is clearly primary. The spaces arise as a necessary by-product of fan vaulting; their appropriate use is a secondary effect. Anyone who tried to argue that the structure exists because the alternation of rose and portcullis makes so much sense […]. Yet evolutionary biologists, in their tendency to focus exclusively on immediate adaptation to local conditions, do tend to ignore architectural constraints and perform just such an inversion of explanation.
3.3 Re-funtionalisation of function in existing structures
What is described in the first category does not exclude that there are cases that are also very frequent in the history of architecture, in which literally distinct functions follow one another in the same tectonic component. A striking case is the use of pre-existing masonry structures, as foundations of successive buildings. In no case had this secondary use been foreseen, even if, paradoxically, it constitutes a topos of architecture, for example Romanesque, on Roman infrastructures.
This phenomenon is highly present in historic and multi-layered context such as the Italian cities. The medieval acropolis of Perugia, for example, is elevated and built on a platform actually supported by the pre- existing Etruscan city. This can be found even in other regions of the world, such as in Mexico City, which is another great example, because the Spanish grid was built on top of Tenochtitlan, the capital of the Aztec Empire. The case of the Piazza Anfiteatro, in Lucca, could well-represent non-deterministic design as an extension of the adaptative possibilities of cities.
Just as a thumb of a panda, where the panda is the city, the middle age square grows on the abandoned and obsolete remains of the ancient Roman amphitheatre (2nd century AD), which determined its elliptical closed shape, which perfectly fits for the use of workshops, commercial activities and compact residential quarters, facing a central public space. From the evolution of the Piazza Anfiteatro clearly a non-deterministic design approach emerges, one that implies that the current function of a structure does not always coincide with its historical origin, whilst explaining the complexity of city evolution. Because of the further generative role of constraints, the elliptical space, cleaned of medieval superfetations, became the ideal location for the 19th
century market designed by the architect Lorenzo Nottolini, required by the economic and social needs of the rise of the bourgeois city. A constraint became an opportunity (Melis & Pievani, 2020).
3.4 Integration or change of use
In this category, we intend to include all subsequent and unforeseen uses of a given architecture, when the required transformations have occurred through a deterministic project. Essentially, it is the change of use not foreseen when the architecture was built and, for this reason, falls within the modality of architectural exaptation. However, this type of activity has already been included in the taxonomy of architecture, albeit independently of the analogy with the adaptation. This particular category proves once again that design determinism is what has so far been given a dignity that deserves inclusion in what is architectural design, even in those cases where this second determinism architectural, is a necessity due to the failure of the objectives of the initial project.
All these transformations modalities, when performed consciously and, therefore, with determinism, even if the initial architectural design did not imply them, are alternatively indicated as regeneration, restoration, conservation, preservation, refurbishment, renovation, and functional adaptation, depending on the geographic

685
Alessandro Melis, J. Antonio Lara-Hernandez and Barbora Foerster
context, the historical period, the cultural value attributed to the architecture, or the specific architectural discipline .
Naturally, within this category of architectural exaptation, it is necessary to exclude those cases in which, for example, conservation and the other forms of design described do not imply the change of use, or its monumentalisation as an added use.
3.5 Temporary appropriation of space
Several modalities of functional co-optation in architecture remain excluded from the presumed interpretation of secondary determinism described in the previous category. For example, the phenomenon of temporary appropriation of public space, which contributes to the resilience of the neighbourhoods, concerns the uses of space not planned in any conventional design (Lara-Hernandez & Melis, 2018; Melis, Lara-Hernandez & Thompson, 2020).
The temporary appropriation is an urban phenomenon in which people use public spaces to carry out activities for which, initially, public spaces were not designed (Lara-Hernandez, Melis & Caputo, 2017). Lara- Hernandez (2019) states that the informal behavioural patterns increase the resilience of public spaces because they strengthen the bond between people and places. Such informal behavioural patterns are categorised in three main groups: i) commerce/work; ii) leisure, arts or sports; and lastly iii) worship or sacralisation. He has shown in his research, for example, how an obsolete telephone booth can become a cooking space to prepare street food or how an occluded window becomes an altar (Lara-Hernandez & Melis, 2018). Similarly, Khemri, Melis, and Caputo (2020) describe how a wall of Algiers’ El Houma can become either an exhibition space or a place where it is possible to organise a community event within the context of a funeral or even a wedding.
The studies of Lara-Hernandez and Melis (2018; 2018, 2020; 2020) have been developed through their extensive research on temporary appropriation, especially on Mexico City which can be considered an emblematical case of architectural exaptation at the urban scale. Mexico City was designed following planning parameters established by the Spanish crown, taking advantage of the surrounding context in terms of weather and geographical conditions (Stanislawski, 1947). Mexico City is considered as one of the top five megalopolises in the world, having a population over than 21 million, it is the oldest capital city in America (University College London, 2020). It was built on the top of Tenochtitlan, which was the capital of the Aztec Empire earlier on in the 14th century, allowing to emerge a peculiar syncretism in terms urban design and behaviour. It is not the purpose of this paragraph to discuss such syncretism in Mexico City, which has been already widely discussed elsewhere (see (Garcia Canclini, 1999; Bonfil Batalla, 2004). Rather, it is to highlight how people temporarily appropriate public spaces in unexpected and sometimes very creative manner, illustrating the phenomenon of exaptation in architecture.
The perimeter block and the Spanish grid were an effective way to organise the city, having the private life in the inner courtyard while the public realm outside on the streets and squares. Because of the magnificent and beautiful architecture, the well-known English traveller Charles Latrobe (1836) gave it the title ’City of Palaces’. Additionally, in times of war this combination of architectural design and planning provided very useful and strategical military advantages (Stanislawski, 1947; Cejudo Collera, 2015). However, although the aforementioned deterministic purposes were certainly envisioned and tested over time, there are temporary activities (the informal) that were never foreseen. For instance, Figure 2 (left) illustrates a group of men playing fronton in the Museo Nacional de Arte (National Museum of Art) which was the old Palace of Communications, while Figure 2 (right) shows street artists resting and taco sellers. Figure 3 (left) shows a group of men playing hand-squash in a section of Moneda St. which used to be a water channel before the Spanish colonisation; at the centre, Figure 3 shows a woman performing a haircut utilising bollards in the street as a hair studio; and on the right we can observe a San Judas altar being placed early morning. Each of these activities could superficially be judged as informal or out of context, while through the lens of biology they are seen as sprandel.

686
Learning from the biology of evolution: Exaptation as a design strategy for future cities
Figure 2: Men playing fronton in Mexico City Centre (left), women selling tacos while artists resting after performance (right). Source: Authors.
Figure 3: Man playing squash (left), woman performing a haircut (centre), altar placed in early morning (right). Source: Authors.
4. Discussion and conclusionAs mentioned in the literature review, concepts borrowed from biology have been used in the narrative of history of architecture for some time. An initial objective of this manuscript was to highlight the relevance of architectural exaptation to the research agenda. This text has highlighted that much of the architecture in which we live is not the result of a deterministic design process. This vast type of non-deterministic architecture was categorised in five main groups: 1) Functionalisation of existing geomorphologies; 2) Integration of function in existing structures; 3) Re-funtionalisation of function in existing structures; 4) Integration of uses, and lastly 5) Temporary appropriation of space. Reviewed examples contribute to the increase of resilience and sustainability of the urban landscape. Furthermore, research on sustainability has shown that the formal city, understood as the set of conventionally designed architectures, is the main cause of CO2 emissions and, therefore, the idea that the problem of informal urbanisation, from the point of view of environmental view, is a prejudice (Melis & Medas, 2020; Yentel, 2020; Snyder, Marlow & Riley, 2014; Warah, 2003; World Health Organization, 2018). The studies on the temporary appropriation also show that indeterministic uses favour diversity, inclusiveness and justice, which, in turn, increase the resilience, understood as adaptive capacity, of the urban space (Lara- Hernandez & Melis, 2018). It can also be added that, in accordance with the Life Cycle Assessment studies (Curran, 2016), the possibility of functional co-optation of an architectural component or of an obsolete use of a building can only be a benefit, even when the deterministic planning has failed. This approach is also corroborated by the analogy with biology, which leads to the understanding that natural selection operates in economics, so that co-opting a form is more efficient than building a new form. Equally, in terms of land use and embodied energy, architectural exaptation can offer a positive contribution to sustainability.

687
Alessandro Melis, J. Antonio Lara-Hernandez and Barbora Foerster
The underestimation of the indeterministic processes of transformation of architecture and of co-opting its parts (spandrel) is a result of a prejudice. Once again, prejudices can be explained and demonstrated thanks to transdisciplinary studies. The greater dignity attributed to design determinism corresponds to the idea that this is the result of creativity as an advanced expression of human intelligence. However, the studies cited by Pringle (2013) demonstrate the opposite, as creativity derives from the indeterminism of associative thinking, as opposed to linear thinking as default survival mode, just as the five categories we described above.
Consistively, Pievani (2011; 2008) and the geneticist Ewan Birney also remind us that, in nature, all creative systems are indeterministic in the sense that they provide a redundancy of forms and relationships without a specific use. This indeterminacy is precisely the basis of the adaptive resilience of creative structures such as DNA, the human brain, and even spandrels like the six fingers of the Panda, the birds’ feathers, and their manifestations like the primitive drawings (Melis & Pievani, 2020). In Full House (1996), Gould also explains that the reading of a trend of progress, in this case concerning deterministic planning, can be the result of a reification, that is, the transformation into reality of an abstraction, linked to the perception that man has of himself at the top of an evolutionary scale. This bias is reflected in the taxonomies and in the definitions that humanity uses to describe its surroundings. As we previously described, the shift of our attention from the history of civilisation (about ten thousand years) towards palaeoanthropology (over two hundred thousand years), and beyond (biology of evolution) would make it easier to identify the bias in the form of reification of false trends.
Conservation, informality like the work of contemporary practices such as Urban Think Tank, Teddy Cruz, Giancarlo Mazzanti, and Alejandro Aravena / Elemental, and previously architecture as a process, as expressed by Radical movements such as the Japanese Metabilist and Austrian Radicals, have been overlooked as a possible representation of architectural exaptation. This bias might also be caused by concern of architects who think that interdeterminism, as a non-project, may question the existence of the architect itself. In reality, architectural exaptation is, instead, a design which prioritises redundancy of shape and genotypes on pre- assigned functions and phenotypes.
References Andriani, P. & Carignani, G. (2014) Modular exaptation: A missing link in the synthesis of artificial form. Research Policy.
[Online] 43 (9), 1608–1620. Available from: doi:10.1016/j.respol.2014.04.009. Benevolo, L. (1977) History of modern architecture. Mit Press. Bock, W.J. (1980) The definition and recognition of biological adaptation. American Zoologist. 20 (1), 217–227.
Bock, W.J. (1967) The use of adaptive characters in avian classification. In: Proceedings of the XIV international ornithological congress. 1967 Blackwell. pp. 61–74. Bock, W.J. & Von Wahlert, G. (1965) Adaptation and the form-function complex. Evolution. 269–299. Bock, W.J. & WJ, B. (1979) The synthetic explanation of macroevolutionary change: a reductionistic approach. Bonfil Batalla, G. (2004) Pensar nuestra cultura. Dialogos de acción. 1, 117–134. Buchli, V. (2020) An anthropology of architecture. Routledge. Carbonara, G. (1997) Trattato di restauro architettonico. Utet.
Cejudo Collera, M. (2015) La inclusión profesional de los ingenieros militares en la arquitectura civil durante. Academia XXII. [Online] (10), 87–103. Available from: doi:dx.doi.org/10.22201/fa.2007252Xp.2015.10.48976. Collins, P. (1998) Changing ideals in modern architecture, 1750-1950. McGill-Queen’s Press-MQUP. Curran, M.A. (2016) Goal and scope definition in life cycle assessment. Springer.
Dew, N., Sarasvathy, S.D. & Venkataraman, S. (2004) The economic implications of exaptation. Journal of Evolutionary Economics. [Online] 14 (1), 69–84. Available from: doi:10.1007/s00191-003-0180-x.
Fletcher, J. (2007) The scenography of trauma: a ‘Copernican’reading of Sophocles’’ Oedipus the King’. Textual Practice. 21 (1), 17–41. Frampton, K. (1993) Toward a Critical Regionalism: Six points for an architecture of resistance. In: Thomas Docherty (ed.). Postmodernism: a reader. London, UK, Routledge. Taylor & Francis Group. p.
Furnari, S. (2009) Mechanisms of Aesthetic Exaptation in Artefact Design: How a Beaux-arts Garden evolved into an Avant- garde Art Park. In: XXV EGOS Colloquium. [Online]. 2009 Barcelona, Spain. p. Available from: http://www2.druid.dk/conferences/viewpaper.php?id=5983&cf=32.
Garcia Canclini, N. (1999) Los usos sociales del patrimonio cultural. Patrimonio Etnológico. Nuevas perspectivas de estudio. [Online]16–33.Available from: http://ecaths1.s3.amazonaws.com/seminariomulticulturalismo/1173606279.canclini.pdf. Gould, S.J. (1991) Exaptation: A crucial tool for an evolutionary psychology. Journal of social issues. 47 (3), 43–65. Gould, S.J. & Duve, C. de (1996) Full House: The Spread of Excellence from Plato to Darwin. Nature. 383 (6603), 771.
Gould, S.J. & Lewontin, R.C. (1979) The spandrels of San Marco and the Panglossian paradigm: a critique of the adaptationist programme. Proceedings of the Royal Society of London - Biological Sciences. [Online] 205 (1161), 581–598. Available from: doi:10.1098/rspb.1979.0086.

688
Learning from the biology of evolution: Exaptation as a design strategy for future cities
Gould, S.J. & Vrba, E.S. (1982) Exaptation-A Missing Term in the Science of. Paleobiology. [Online] 8 (1), 4–15. Available from: http://www.jstor.org/stable/2400563. Huxley, A. (1926) Jesting pilate: an intellectual holiday. George H. Doran Company. Ingold, T. (2013) Making: Anthropology, archaeology, art and architecture. Routledge.
Kaufmann, E. (1964) Memmo’s Lodoli. The Art Bulletin. [Online] 46 (2), 159–175. Available from: doi:10.1080/00043079.1964.10790157.
Khemri, M.Y., Melis, A. & Caputo, S. (2020) Sustaining the Liveliness of Public Spaces in El Houma through Placemaking. The Journal of Public Space. 5 (1), 129–152. Kruft, H.-W. (1994) History of architectural theory. Princeton Architectural Press.
Lara-Hernandez, J.A. (2019) Temporary appropriation: Theory and Practice of the Street. [Online]. United Kingdom, University of Portsmouth. Available from: https://researchportal.port.ac.uk/portal/en/theses/temporary-appropriation(62a30252- cbb1-457a-b751-52b66176d8d7).html. Lara-Hernandez, J.A. & Melis, A. (2018) Understanding the temporary appropriation in relationship to social sustainability. Sustainable Cities and Society. [Online] 39C, 1–14. Available from: doi:10.1016/j.scs.2018.03.004.
Lara-Hernandez, J.A., Melis, A. & Caputo, S. (2017) Understanding Spatial Configuration and Temporary Appropriation of the Street in Latin American cities: the case of Mexico City Centre. In: Hocine Boudagh, Antonella Versaci, Ferdinando Trapani, Marco Migliore, et al. (eds.). Urban Planning and Architectural Design for Sustainable Development. 2017 Palermo, Italy, IEREK, Springer. pp. 153–173.
Lara-Hernandez, J.A., Melis, A. & Coulter, C.M. (2020) Temporary appropriation and informality: a nuanced relationship. In: Jose Antonio Lara-hernandez, Alessandro Melis, & James Thompson (eds.). Temporary Appropriation in Cities: Human Spatialisation in Public Spaces and Community Resilience. London, UK, Springer Nature Limited. p.
Lara-Hernandez, J.A., Melis, A. & Coulter, C.M. (2018) Using the street in Mexico City Centre: temporary appropriation of public space vs legislation governing street use. Journal of Public Space. [Online] 3 (3), 25–48. Available from: doi:10.32891/jps.v3i3.1135. Latrobe, C.J. (1836) The rambler in Mexico.
Melis, A., Lara-Hernandez, J.A. & Thompson, J. (2020) Temporary Appropriation in Cities: Human Spatialisation in Public Spaces and Community Resilience. 1st edition. [Online]. London, UK, Springer Nature Limited. Available from: doi:10.1007/978-3-030-32120-8.
Melis, A. & Medas, B. (2020) Tecnologie avanzate per la resilienza dell’architettura e della comunità. In: Bioarchitettura: Appunti per una città sostenibile. Nardini Editore. p.
Melis, A. & Pievani, T. (2020) Exaptation as a design strategy for resilient communities. In: Integrated Science: Transdisciplinarity Across the Different Disciplines. Springer Nature. p. Pievani, T. (2008) Exaptation. Il bricolage dell’evoluzione. Bollati Boringhieri. Pievani, T. & Serrelli, E. (2011) Exaptation in human evolution: How to test adaptive vs exaptive evolutionary hypotheses. Journal of Anthropological Sciences. [Online] 89, 9–23. Available from: doi:10.4436/jass.89015.
Pringle, H. (2013) The origins of creativity. Scientific American. [Online] 308 (3), 36–43. Available from: doi:10.1038/scientificamerican0313-36. Rapoport, A. (1998) Using ‘Culture’ in Housing Design. In: Housing and Society. 1998 Seul, Korea. pp. 1–20. Rudofsky, B. (1987) Architecture without architects: a short introduction to non-pedigreed architecture. UNM Press. Scully, V.J. (2003) Modern architecture and other essays. Princeton University Press.
Snyder, R.E., Marlow, M.A. & Riley, L.W. (2014) Ebola in urban slums: the elephant in the room. The Lancet Global Health. 2 (12), e685. Stanislawski, D. (1947) Early Spanish Town Planning in the New World. American Geographical Society. 37 (1), 94–105. Steadman, S.R. (2016) Archaeology of domestic architecture and the human use of space. Routledge. Tafuri, M. & Verrecchia, G. (1980) Theories and history of architecture. Granada London.
University College London (2020) Mexico City Population 2020 (Demographics, Maps, Graphs). [Online]. 2020. World Population Review. Available from: https://worldpopulationreview.com/world-cities/mexico-city-population [Accessed: 21 July 2020]. Warah, R. (2003) The challenge of slums: Global report on human settlements 2003. [Online]. 2003. Global Policy Forum. Available from: https://www.globalpolicy.org/component/content/article/211/44579.html [Accessed: 19 July 2020]. Williams, G.C. (1966) Adaptation and natural selection Princeton University Press: Princeton. New Jersey.
World Health Organization (2018) Climate change and health. [Online]. 1 February 2018. Key facts. Available from: https://www.who.int/news-room/fact-sheets/detail/climate-change-and-health [Accessed: 19 July 2020].
Yentel, D. (2020) The End of the Beginning – by Diane Yentel , NLIHC President and CEO. [Online]. 30 March 2020. National Low Income Housing Coalition. Available from: https://nlihc.org/resource/end-beginning-diane-yentel-nlihc-president- and-ceo [Accessed: 30 March 2020]. Zevi, B. (1978) The modern language of architecture. Australian National University Press.

689
The 54th International Conference of the Architectural Science Association (ANZAScA) 2020
Less Structure, More Impact? An evaluation of structured design thinking methods in higher education in architecture.
Christos Chantzaras1
1 Technical University of Munich, Munich, Germany [email protected]
Abstract: Design thinking is widely known as a creativity and innovation method among management disciplines and practitioners. While creative design disciplines have benefited from the rising awareness and application, the discipline of architecture has not embedded this development with an approach of its own, despite being at the forefront of designerly ways of working and design thinking as a mind-set. To assist architects in contributing and applying their particular form of design thinking, to foster entrepreneurial initiatives and to reduce the gap between architectural practice and other practices of design thinking, four different creativity formats based on existing methods have been evaluated at the Department of Architecture at the Technical University of Munich (TUM). The results provide a critical view of practiced phase-structured creativity formats for innovation. The key findings provide directions to develop an architectural design thinking approach, which is applicable to industries and challenges beyond building design and can re-integrate design expertise and meaning in the quest for innovation.
Keywords: design thinking; architecture; methods; innovation
1. IntroductionTo cope with rising environmental and detailed complexities in industries and markets, management disciplines have learned from design-led professions and their abductive way of thinking (Boland & Collopy, 2004; Buchanan, 2008; Dorst, 2015; Martin, 2013). While industrial design, software and mechanical engineering have successfully developed and implemented a method of design thinking in fields beyond their specific domain, architecture has not rigorously applied its designerly ways of working to open and complex problems of strategy, organization, product and service development (Chantzaras, 2019c; Fisher, 2015; Lewrick, Link, & Leifer, 2017; Luebkeman, 2015). Despite being at the forefront of design thinking as a discipline and a mind-set for the past century, architecture has still to leverage its potential as an integrative and interdisciplinary discipline for transformation (Chantzaras, 2019a; Dorst, 2011; Rowe, 1987; Shamiyeh, 2016). Research into the practice of design professions and design thinking as conducted by Schön (1983), Rowe (1987) Cross (2007, 2013), Lawson (2005) and Lawson and Dorst (2009) reference architects as a study group, with a specific approach to design thinking (Chantzaras, 2019d). The continuing relevance of design thinking for the development of new structures and systems
Imaginable Futures: Design Thinking, and the Scientific Method. 54th International Conference of the Architectural Science Association 2020, Ali Ghaffarianhoseini, et al (eds), pp. 689–698. © 2020 and published by the Architectural Science Association (ANZAScA).

690
Christos Chantzaras
in industries, institutions and societies offers a window of opportunity for architecture to contribute and apply an architectural design thinking based on a critique of currently applied methods as overly linear, stage-phased, business-oriented, and decoupled from intuition, aesthetics, design expertise and creative engineering (Buchanan, 2015; Clancey, 2016; Verganti, 2017).
2. Theoretical Framework: Architectural Thinking & Design ProcessArchitectural thinking and the specific pre-design phase in the architectural design process serve as a theoretical framework whose specific characteristics are relevant to applied design thinking methods in other industries. Within this framework, a method for innovation and creativity initiatives has not been developed. Though the architectural programming approach has sought to apply architectural thinking and tools in a structured way to complex challenges beyond building design, it has not received broader attention, adoption and application (Chantzaras, 2019a; Cherry, 1999). Architectural programming has remained largely a method for effective communication with clients, for requirement planning and brief design. By evaluating creativity formats from other fields, implication and directions can be derived to develop an architectural design thinking methodology within the framework of architectural thinking.
Architectural thinking and the design process can be described by principle forms of reasoning and making. First, the thinking is directed to a betterment, what ought to be, and is less driven by possible solutions, market applicable and business feasible implementations (Boschung & Jachmann, 2013; Lawson, 2005; Mäscher, 2018; Nelson & Stolterman, 2012). It is inherently optimistic with a quest for synthesis in the real world to achieve a successful application of a new whole (ibid.; Dator, 2016; Gänshirt, 2012). In their thinking architects embrace complexity, challenge existing circumstances, integrate contradictory goals, sustain uncertainties until the very end of a design process, and work prospectively and constructively towards an alternative situation (Bachman, 2012; Gänshirt, 2012; Lawson, 2005). Architectural thinking considers relations and interdependencies in space and time. The implications and consequences of a design that is going to be built need to be imagined in advance in a “holistic approach with a long-term perspective beyond current client, user, or market demands.” (Chantzaras, 2019d, p. 544; Cross, 2007). Second, the architectural design process is a reflection-in-action process, with aprototype-mindset and an intense use of non-verbal means, such as sketching, diagramming andmodelling to create boundary objects (ibid.; Star, 2010; Wagner, 2000). The process foregroundsprinciples of acting rather than pre-defined process-steps to be followed and pre-selected tools to be used (Rowe, 1987). Activities to constantly move, represent, interpret, evaluate, manage, and formulate evolve from the skills and design expertise an architect has accumulated, and are agily combined throughout the process (Lawson & Dorst, 2009). Embracing complexity, re-interpreting the task, applying a large set of non-verbal tools to `think, play, do’ (Dodgson, Gann, & Salter, 2011), especially with diagrams and 3- dimensional models, are skills which make architects bring to design thinking processes and which haveapplications beyond building design (Lewrick & Link, 2015; Oswalt & Vassal, 2016). Their thinking anddesign process can add a socially-oriented, holistic approach to the design of innovations, since architects must “design a thing by considering it in its next larger context” as Finnish architect Eliel Saarinen describes it (Keeley, Pikkel, Quinn, & Walters, 2013, 116). This resonates with a system design approach favored bydesign scholars and practitioners (Buchanan, 2001, 2015; Luebkeman, 2015; Senge, 2006).
Through testing different creativity formats for innovation at higher education, an empirical basis can be provided to discuss applicability and relevance of an architectural thinking approach in the current business-oriented practice of design thinking methods. The study provides first insights into the advantages and shortcomings of structured innovation methods and their application (Keeley et al., 2013,

691
Less Structure, More Impact? An evaluation of structured design thinking methods in higher education in architecture
.
p. 2; Verganti, 2017). It also allows to investigate the behavior and performance of students fromarchitecture and other disciplines before experience as professionals might constrain and narrow their problem solving strategies. The four interdisciplinary formats were conducted, evaluated, and documented from October 2017 to September 2019, in cooperation with an alliance of five leadingEuropean architectural departments, funded by an Erasmus+ Grant on Strengthening Architecture andBuilt Environment Research (SABRE)1. The workshops (referred to as activities in the grant) also provided an opportunity to engage with different industries and relate new challenges in the context of the built environment to academia. The workshops were intended to foster architectural entrepreneurship, i.e. an entrepreneurial approach based on values and characteristics in architectural thinking, design processesand tools. During the workshops, the following hypotheses were tested:
• H1: Architectural students through their skills and knowledge innovation methods can positively impact and operate effectively in modes of collaboration and co-creation.
• H2: Structured, rapid & collaborative innovation methods taken from other fields are applicable in the context of Architecture and the Built Environment.
• H3: Creativity formats are applicable and useful in linking emerging challenges from practice of different industries with academia.
This paper describes the set-up, content and structure of each workshop. It summarizes the evaluation of each activity (i.e. workshops) and critically reflects key findings, learnings and limitations. It concludes by suggesting directions to develop a method of architectural design thinking within the framework of architectural thinking, and contributes to the discourse of applied methods of design thinking in future.
3. Methodology: Preparation and Methodological Set-UpDesign Sprints, Business Games, Makethons, Hackathons and Enterprise Design Thinking formats are used across industries to foster collaboration, generate new ideas and develop new processes, products and services or business models (Chantzaras, 2019c; Knapp, Zeratsky, & Kowitz, 2016). Despite their popularity, the extent to which these methods improve collaboration, creativity and innovation, and what the drivers or inhibitors are for a successful process are requires further research (Keeley et al., 2013; Lewrick et al., 2017). The formats for the study were selected depending on the kind of problem in industry and society. The challenges formulated from this addressed social relevance, impact on specific industries and novelty in academic discourse and education. The subject of circularity was scheduled in 2017 (A), transformations in the architecture, engineering and construction industry (AEC) were investigated in 2018 (B), followed by the topic of future of work in the same year (C). In 2019, new concepts of living for urban nomads were set as a topic (D). Two workshops followed a rigidly defined process (A,C), two workshops were conducted with a more open agenda regarding tasks and tools (B,D). In each workshop, industry partners set the challenge or problem and participated to various extents as lecturers and facilitators. The application process, in which students needed to provide a motivation letter, a short curriculum vitae, and – for two workshops (C,D) – a portfolio of projects – ensured an interested and engaged group of participants. Credit points were granted for successful participation in
1 The workshops were part of the 3-year Erasmus+ Strategic Partnership “Strengthening Architecture and the Built Environment Research” (SABRE). The BauHow5 alliance is a partnership of five leading European research intense universities in architecture & the built environment (UCL The Bartlett, TU Delft, Chalmers, ETHZ d.arch, TU Munich). SABRE is co-funded by the Erasmus+ programme of the European Union.

692
Christos Chantzaras
the workshop and the submission of an report of process and outcomes. For each activity, a physical space was set-up as a co-creative lab with toolboxes, plenum and breakout area. The workshops were organized by the internal academic staff of the Department of Architecture at TUM, and partially supported by researchers from the partnering universities and representatives of the industry partners.
4. Four Tested Formats, Four Themes
4.1 Design Sprint on ‘The Circular University’ (A)
The first creativity method in October 2017 was conceptualized as a design workshop on defining new concepts for circularity in higher education and universities. The design sprint was conducted with a German-based architectural practice and a Swiss furniture manufacturing company (Chantzaras, 2019c). The method developed by google ventures (GV) is characterized as “a “greatest hits“ of business strategy, innovation, behavioral science, design, and more-packaged into a step-by-step process, that any team can use.” (Knapp et al., 2016, p. 6). To foster interdisciplinary work, the call for applications was open to Bachelor’s and Master’s degree students from architecture, industrial design, management, civil and environmental engineering, science and technology studies, politics and informatics. The 35 participants assembled themselves into six teams with 5-7 members (72% female/28% male; 40% Bachelor’s degree/60% Master’s degree). 33 participants completed the five-day workshop, 28 submitted an extended post-workshop report. The days were scheduled from 10 am to 5 pm following the steps described in “Sprint: How to Solve Big Problems and Test New Ideas in Just Five Days” (Knapp et al., 2016): Day 1 - Context; Day 2 - Target; Day 3 - Decision; Day 4 - Prototype; Day 5 - Interview, Present. Afterwards, the teams were given additional time to iterate their work, integrate comments on their presentations and submit a report on concept and process. Five out of six teams finalized their work.
4.2 Creative Business Game on ‘Start-Up Architecture’ (B)
As second workshop, the Creative Business Game focused on new entrepreneurial directions for architectural practices and new business models in the AEC industry. The built environment and construction industry , which is among the largest industries in the world has not embraced innovation potentials offered by digital technologies (World Economic Forum, 2016). In a 2-day interdisciplinary business game with 24 Master’s degree students from architecture, design, management and informatics, future entrepreneurial opportunities were questioned. Three business tasks were set by industry partners from an architectural practice. The workshop was conducted as a loosely structured format with few design tools and limited facilitation. The 24 participants from architecture and management studies assembled themselves into 6 teams of 4 members (39% female / 61% male; 96%). The teams worked independently on two days from 9am to 7pm: Day 1 - Context & Challenge; Day 2 - Model & Pitch. 5 of the 6 teams completed the workshop; only one group submitted a report as team; of the other four groups, only one team member in each completed and handed in their own documentation.
4.3 Enterprise Design Thinking Lab ‘Workspaces for DigitalYou’ (C)
In the third activity, future workplaces in knowledge-intense industries were focused on. Together with an international consulting firm and an information technology company, a 3-day enterprise design thinking lab was conducted with Master’s degree students from architecture, management and information technology. Workspaces for the future were thought from a people-, technology- and building-driven perspective. The lab followed the IBM Enterprise Design Thinking Field Guide. Each team

693
Less Structure, More Impact? An evaluation of structured design thinking methods in higher education in architecture.
was facilitated by researchers or one design thinker from IBM Watson IoT, who explained and supported the steps in the field guide throughout the three days (IBM, 2020). The 24 participants were assigned prior to the workshop to six specific teams of four to ensure an interdisciplinary and diverse mix of students (43% female/57% male). The workshop ran from 8am to 6pm daily: Day 1 - Context & Challenge; Day 2 - Ideation & Concept; Day 3 - Prototype & Pitch. Additionally, the final day of the workshop was documented in a short video: https://www.youtube.com/watch?v=5omeUayPyJc&feature=youtu.be
4.4 Community Design Lab - ‘Designing Social Hubs for Urban Nomads’
In the fourth activity, the topic of future living in urban communities was emphasized. Together with a start-up incubator, a concept branch of a mobility company and an architectural magazine, the participants developed spatial, technological and social concepts for temporary communities in the city. The process followed a simply structured agenda. The 24 participants were grouped in advance into six teams of four (47% female/53% male) and were facilitated throughout the 2.5 days by one researcher or industry partner. The workshop days, except Day 1, were scheduled from 8:30 am to 6pm: Day 1 - Context; Day 2 - Problem & Ideation; Day 3 - Concept & Pitch. Five of six teams completed the workshop, but only six of the 24 participants handed in documentation. Additionally, the industry partners documented the workshop on video: https://www.youtube.com/watch?v=xkKGaHU21Uc
4. Discussion: Evaluating the FormatsAll workshops were evaluated with a questionnaire to the participating students, and documented with pictures, video recordings and interviews. In the first part of the questionnaire, concept, workload, collaboration, results and benefits were assessed. The questions could be answered on a scale of 1, representing “strong agreement”, to 5, representing “strong refusal.” The plus signs in Table 1 represent the number of positive replies, in which “agreement” and “strong agreement” are aggregated (1+2).2 The second part of the questionnaire comprised open questions to elicit personal statements, recommendations and advice for future development and implementation.
Table 1: Evaluation of the workshop based on questionnaires after completion.
Evaluation acc. Questionnaire Design Sprint
Creative Biz Game
Enterprise DT Lab
Community Design Lab
(N: Number of participants) 33 replies N= 33
23 replies N=24
24 replies N=24
15 replies N=24
Concept, consciousness, target of circularity increased ++++ ++ +++ ++++
Workload, process, implementation were feasible +++ ++ +++ ++++
Collaboration, interdisciplinarity, integration increased +++ ++ ++++ +++++
Results, willingness to pursue idea further were satisfying +++ ++ +++ +++
Benefits to apply skills and use new insights occurred ++++ ++ +++ ++++
2 Regarding the limited number of questionnaires, percentages are replaced by “+”. Two plusses represent half of the participants with agreement and strong agreement, three plusses represent above 60%, four plusses above 80%, five plusses above 90%. Detailed figures in percentages are available in the workshop documentations: http://www.bauhow5.eu/output-2-2/

694
Christos Chantzaras
Overall, the format of a design sprint was well accepted by the participants. The majority regarded the method as an important extension of their architectural education and would favor an integrated module in future education to strengthen a structured discourse on complex problems. The time limitations for each task and day were appreciated by the students, and considered as a useful tool in working more focused and effectively on the architectural design process, as well as experiencing an “after-work-mode.” On the other hand, the structured process was reported to impede in-depth discussions and hindered the working process, especially when a task needed to be conducted in a specific way, where architectural students would have preferred to apply other tools and invest more time. Due to the over-representation of architectural students, interdisciplinarity could not be achieved. The satisfaction rate was above average in the 33 replies, cumulating “agreement” & “strong agreement” (number of participants N=35). Regarding the Creative Business Game, nearly 60% of the participants were students from management studies, 40% came from the disciplines of architecture and landscape architecture. Only two teams assembled themselves equally with management and architecture students. Two teams proceeded with one architectural student, and two teams were entirely uni-disciplinary. Surprisingly, the students of architecture did not approach the challenge of redesigning the future practice of architectural offices. Satisfaction was decent in the 23 cumulated replies, and lowest across the other workshops (N=24). The Design Thinking Lab showed a high rate of acceptance among the participants. The strong user focus and work with the concept of personas offered a new approach for architects, but limited, on the other hand, more visionary and alternative approaches. The graphical tools applied (e.g. post-its) constrained the opportunities for the architects to use a broader range of non-verbal and visual tools. The satisfaction rate was high in 24 replies (N=24). In the Community Design Lab, participants came partially from outside academia. The response rate of the evaluation was 15 out of 24 participants. The highest satisfaction rate was evident in the 15 replies of (N=24) all conducted workshops, but at the same time, showed the lowest rate of development of ideas and the lowest rate of submitted documentation. This discrepancy needed to be further analyzed in order to derive key findings from the study.
5. Key Findings: Outcome follows Structure.In addition to the findings from the questionnaires, the workshops were analyzed and compared according to their structure and working process, the intensity of facilitation and support provided, the disciplines represented and the achieved level of outcomes, i.e. the teams’ projects and reports (Table 2).
Table 2: Review of the workshop based on set-up, idea development and rate of submitted reports.
Structure of Workshops Design Sprint
Creative Biz Game
Enterprise DT Lab
Community Design Lab
Detailed agenda with tasks provided yes no yes no
Facilitation provided continuously yes no yes yes
Catering provided no partially partially yes
Disciplines present (if more than 2 representatives) 1 2 3 4
Share of architectural students ∼ 85% ∼ 40% ∼ 60% ∼ 30 %
Submitted reports by students (teams, individually) 28 of 35 8 of 24 20 of 24 6 of 24
Three key findings could be retrieved, regarding the impact of methodological structure, facilitation and the formulation of the challenge. First, structure had a positive impact on work process and development of concepts, but influenced the kind of outcomes. The structured format of a design sprint

695
Less Structure, More Impact? An evaluation of structured design thinking methods in higher education in architecture
and enterprise design thinking lab worked best in a setting of higher education. Both provided the students with comprehensible schedules and tools. However, the proposed tools and time constraints impeded the creative work of architectural students. For example, they had difficulties sketching on and thinking with sticky notes instead of the familiar mediums of large sheets of paper, sketch rolls and tangible models. The students were not used to interrupting a design process or design flow and proceeding with a subsequent task if a satisfying preliminary resolution had not been discovered. The structure influenced the direction and kind of outcomes but lead to a thorough development of the ideas and the highest submission rate of reports.
Second, facilitation had a positive impact if conducted by experienced and dedicated facilitators, as in the enterprise design thinking lab. The personal commitment of the supporters and lecturers contributed to a positive atmosphere. During the workshops, the consistency of the brief and its alignment to the problem context led to higher engagement among the students. Where facilitation was provided to a limited extent and in an unskilled way, teams struggled to proceed and perform.
Third, the formulation of the challenge and the kind of problem addressed influenced the number of applications and their diversity. When a societal impact in the challenge was stated, the number of applications, specifically by architectural students was higher. The interest and engagement of the participating students may be more intrinsically driven than can be fostered by extrinsic drivers such as prizes, awards and publicity. The creative business game with its direct focus on entrepreneurship and economic prosperity had the lowest application rate, and the second lowest rate of submitted reports after the activity. In the case of the community design lab, the societal impact was not perceived by the students as open as in the case of circularity in the design sprint or the theme of the future of work. Though the community design lab showed the highest satisfaction among students, the decent level of participation by the discipline of architecture and the lowest rate of submitted report leaves questions open for further research. In total, the outcomes reached the highest level of idea development in the structured methods, as evidenced in the enterprise design thinking lab and design sprint. The engagement of management students in the first-mentioned raised the level of completeness in the submissions.
Further observations could be made regarding the infrastructure, duration of each workshop and diversity in the teams. In terms of organization, the effort invested in the set-up, infrastructure, prize donations and catering across the workshops did not correlate with depth and quality of the elaborated outcomes. Regarding duration, at least 3-days were observed to be necessary for thorough development of ideas and were also confirmed as the preferable time frame by the students. The stakeholder engagement and interest correlated with the size of the company and the experience with structured methods for creativity and innovation. The larger the industry partner was, the more time it invested in the workshops. Regarding diversity, different gender, origin and study level positively influenced collaboration in teams in all workshops. A mix of Bachelor’s and Master’s level students increased the vitality of the workshops, especially among architectural students. The hypotheses set out at the beginning of the study were partially confirmed. The involvement of architectural students raised the breadth and novelty of the ideas developed (H1). Distinct elements of structure were recognized and shown as valuable for architectural design processes (H2). Current and emerging challenges from industry and society were shown to be transferable to higher education in a rapid way (H3).
6. LimitationsThe conducted workshops, their evaluation and key findings have several limitations in terms of size, provision, teams and timing. The small size of the study allows only a preliminary statement of results,

696
Christos Chantzaras
which would need to be confirmed in further studies. As these kinds of workshops were conducted for the first time at a department of architecture, the quality of organization and conduct of the different activities varied according to the external support through industry partners and experienced facilitators. Appropriate facilitation could not be provided equally during all workshops. The disciplinary bias evoked by involving mostly architects in the workshops’ set-up and implementation needs to be considered. The enterprise design thinking lab was led and facilitated by trained professionals. Its positive evaluation outlines the value and impact experienced design facilitation and a thoroughly developed methodology has on the level of overall success. Further, an equal level of team skills, capabilities and interdisciplinarity were difficult to achieve. The number and quality of applications and participation from architectural students varied across the workshops. In the case of the design sprint, the novelty of the format for architectural students may have led to the positive response and evaluation. Reference teams for comparison consisting of entirely architectural students and of interdisciplinary teams without architectural students were not set-up to compare process performances and outcomes. In terms of timing, the awareness of the workshops differed with the time they were held. When the workshops were announced and conducted before, during or after lecture times during a semester made a difference in this respect. Close to the start of lecture times appeared most feasible for students, if no competing formats from other institutions or industries were announced in parallel.
7. Implications & Future ResearchThe project provides a viable basis to firstly develop an architecture design thinking method, and secondly, to create a new way of conducting research. As a first implication, structured formats as experienced in the design sprint or enterprise design thinking lab can leverage the existing skill-set among architectural students for complex problem solving in interdisciplinary fields. With their structure, the existing formats offer opportunities for architects to immerse themselves in current and future topics to do with the built environment, which are increasingly addressed by other disciplines such as information technology, electrical and mechanical engineering. Regarding the relevance of the built environment for sustainable development goals, architectural students are enabled to engage in different design thinking processes with other industries and apply their own approaches and methods to addressing these issues. Existing formats such as the design sprint and an architectural design thinking methodology should be integrated into architecture study programs in higher education. Thus, modifications are necessary to tap the potentials of architectural thinking and design process in the most beneficial way. An architectural design thinking method should incorporate the design expertise, meaning and form-giving approaches of architects, their broad and open use of non-verbal tools and boundary objects, and their capacity to adapt and change time frames of tasks when needed. A revised method specifically for architects, as was initiated with architectural programming in the 1960s, could attract more architectural students, could foster interdisciplinary collaboration with other disciplines and contribute to the discourse on design thinking methods, in which architects are underrepresented (Chantzaras, 2019a; Cherry, 1999). In an internal review of this study by heads of research in architecture from the involved universities, Murray Fraser from The Bartlett School of Architecture, University College London commented: “It is interesting to see how much less overt ‘design’ there is in a design sprint compared to how we usually understand the term.”
The specific characteristics of architectural thinking and design process may have a positive impact on the evolution of design thinking methods. Its adaptive and agile nature, its use of existing and new design tools, which are developed according to need, escapes the production of isomorphic outcomes which result from practicing existing design thinking methods (Hargadon, 2015; Verganti, 2017). In other words,
697
Less Structure, More Impact? An evaluation of structured design thinking methods in higher education in architecture
if identically structured methods of design thinking with similar tools are applied across organizations and industries, the outcomes will resemble each other, and therefore lose in innovativeness and competitive advantage. To create a distinct, meaningful and socially-oriented innovation, architectural design thinking may become more relevant. A current research direction, developed after the project, focuses on urban planning and urban innovation. The urban prototyping method is conceptualized and tested as a spatial design thinking method, which merges the speed and agility of existing design thinking methods with architectural thinking and processes for urban design. The urban prototyping lab as series of workshops investigates whether a rapid innovation method can be applied to spatial environments by designing, prototyping and testing novel ideas for urbanism.
A second implication is that design thinking methods – architectural and others – can create a new way of conducting research. The formats are suitable for channeling real-world problems from practice back to higher education. They can introduce academics, students and industry partners to new modes of thinking and working to better examine and uncover socially-relevant questions, create a shared understanding and develop research questions with a design-driven approach. As technological advancements continue apace, a value-based design for research and technology may be needed. For further research, and as intended in the funding, the dissemination of the project learnings is of major importance to enable other institutions European wide and globally to approach, test and integrate structured creativity and innovation formats. After a decade of applying design and design thinking for better businesses, the design of better worlds with an architectural approach is certain to gain in importance (Chantzaras, 2019b).
Acknowledgements The author would like to thank SABRE Erasmus+, Yolande Schneider and Martin Luce from the Department of Architecture of TUM for the overall project initiation, coordination and support. On behalf of the Department of Architecture of TUM, the author would also like to thank the academic and industry partners for supporting and contributing to the workshops and the study. The complete documentation on each of the workshops is available as a PDF-download: http://www.bauhow5.eu/output-2-2/
References Bachman, L. R. (2012). Two spheres: Physical and strategic design in architecture. London: Routledge. Boland, R. J., & Collopy, F. (Eds.) (2004). Managing as designing. Stanford, Calif.: Stanford Business Books. Boschung, D., & Jachmann, J. (Eds.) (2013). Morphomata: Vol. 6. Diagrammatik der Architektur. Paderborn: Fink. Buchanan, R. (2001). Design Research and the New Learning. Design Issues, 17(4), 3–23. Buchanan, R. (2008). Introduction: Design and Organizational Change. Design Issues, 24(1). Buchanan, R. (2015). Worlds in the Making: Design, Management, and the Reform of Organizational Culture. She Ji:
The Journal of Design, Economics, and Innovation, 1(1), 5–21. Chantzaras, C. (2019a). Architecture as a system and innovation design discipline. FORMakademisk, 12(2). Chantzaras, C. (2019b). The City demands our Attention: Designing for better worlds - not for better business. In TUM
Department of Architecture (Ed.), Review #2 | 2019, (pp. 82–83). Munich: Technische Universität München. Chantzaras, C. (2019c). The perfect blend for disruption: Fostering architectural entrepreneurship and architectural
design thinking by interdisciplinary workshops. In TUM Department of Architecture (Ed.), Review 2018-19, (pp. 66–67). Munich: Technische Universität München.
Chantzaras, C. (2019d). The 3rd Dimension of Innovation Processes. In E. Bohemia, G. Gemser, N. Fain, C. de Bont, & R. Assoreira Alemandra (Eds.), Conference proceedings of the Academy for Design Innovation Management 2019: Research Perspectives In the era of Transformations (Vol. 2, pp. 537–553). London: ADIM

698
Christos Chantzaras
Cherry, E. (1999). Programming for design: From theory to practice. New York, NY: John Wiley & Sons. Clancey, W. J. (2016). Creative Engineering: Promoting Innovation by Thinking Differently John E. Arnold. Cross, N. (2007). Designerly ways of knowing. Basel: Birkhäuser. Cross, N. (2013). Design thinking: Understanding how designers think and work (Reprinted.). London, Oxford, New
York, New Delhi, Sydney: Bloomsbury Academic. Dator, J. (2016). Alternative Futures in Architecture. In M. Kanaani & D. A. Kopec (Eds.), Routledge Companions. The
Routledge companion for architecture design and practice: Established and emerging trends (pp. 549–564). New York, London: Routledge Taylor & Francis Group.
Dodgson, M., Gann, D., & Salter, A. (2011). Think, play, do: Technology, innovation, and organization. Oxford: Oxford Univ. Press.
Dorst, K. (2011). The core of ‘design thinking’ and its application. Design Studies, 32(6), 521–532. Dorst, K. (2015). Frame innovation: Create new thinking by design. Design thinking, design theory. Cambridge,
Massachusetts, London, England: The MIT Press. Fisher, T. (2015). Welcome to the Third Industrial Revolution: Mass-Customisation of Architecture, Practice and
Education. In C. Luebkeman (Ed.), Architectural design: 85 / 4. 2050 - Designing Our Tomorrow. London: Wiley. Gänshirt, C. (2012). Tools for Ideas: Introduction to Architectural Design. Basel: de Gruyter. Hargadon, A. (2015). Borkerage and Innovation. In M. Dodgson, D. Gann, & N. Phillips (Eds.), The Oxford handbook of
innovation management. Oxford: Oxford University Press. IBM (2020). Enterprise Design Thinking Field Guide. Retrieved from
https://www.ibm.com/cloud/garage/content/field-guide/design-thinking-field-guide. Last accessed 04.10.2020. Keeley, L., Pikkel, R., Quinn, B., & Walters, H. (2013). Ten types of innovation: The discipline of building breakthroughs.
Hoboken, NJ: Wiley. Knapp, J., Zeratsky, J., & Kowitz, B. (2016). Sprint: How to solve big problems and test new ideas in just five days (First
Simon & Schuster hardcover edition). New York, London, Toronto, Sydney, New Delhi: Simon & Schuster. Lawson, B. (2005). How designers think: The design process demystified (4. ed.). Amsterdam: Elsevier/Arch. Press. Lawson, B., & Dorst, K. (2009). Design expertise. Oxford: Elsevier Architectural Press. Lewrick, M., & Link, P. (Eds.) (2015). Design Thinking Tools: Early Insights Accelerate Marketers’ Success (Vol. 32). Lewrick, M., Link, P., & Leifer, L. (2017). Design Thinking Playbook. Luebkeman, C. (2015). Design is Our Answer: An Interview with Leading Design Thinker Tim Brown. In C. Luebkeman
(Ed.), Architectural design: 85 / 4. 2050 - Designing Our Tomorrow. London: Wiley. Martin, R. L. (2013). The Design of Business. Rotman Magazine, 15–19. Mäscher, T. (2018). How Architectural Thinking and Research Collaboration Brings Value to Creative Industries.
Christos Chantzaras. Archipreneur Magazine. (01), 96–104. Nelson, H. G., & Stolterman, E. (2012). The design way: Intentional change in an unpredictable world (Second edition).
Cambridge, MA: MIT Press. Oswalt, P., & Vassal, J.-P. (2016). Die Aufgabenstellung gestalten. Arch+. (222). Rowe, P. G. (1987). Design thinking. Cambridge, Mass.: MIT Pr. Schön, D. A. (1983). The reflective practitioner: How professionals think in action. New York: Basic Books. Senge, P. M. (2006). The fifth discipline: The art and practice of the learning organization. NY, London: Crown Business. Shamiyeh, M. (2016). Designing from the Future. In W. Brenner & F. Uebernickel (Eds.), Design Thinking for Innovation
(pp. 193–219). Cham: Springer International Publishing. Star, S. L. (2010). This is Not a Boundary Object: Reflections on the Origin of a Concept. Science, Technology, & Human
Values, 35(5), 601–617. Verganti, R. (2017). Design Thinkers Think Like Managers: Two strategies linked to uncertainty resolution. She Ji: The
Journal of Design, Economics, and Innovation, 3(2), 100–102. Wagner, I. (2000). Persuasive Artefacts in Architectural Design and Planning. In S. A. R. Scrivener, L. J. Ball, & A.
Woodcock (Eds.), Collaborative Design (pp. 379–389). London: Springer London. World Economic Forum (2016). Shaping the Future of Construction: A Breakthrough in Mindset and Technology.
Retrieved from http://www3.weforum.org/docs/WEF_Shaping_the_Future_of_Construction_full_report .pdf. Last accessed 04.10.2020.

699
The 54th International Conference of the Architectural Science Association (ANZAScA) 2020
Life cycle energy assessment of retrofitting alternatives for mass social housing
Victor Bunster1, Waldo Bustamante2, Cristian Schmitt2, Mathew Aitchison1 1 Monash University, 900 Dandenong Road, Caulfield East, VIC 3145, Australia
[email protected], [email protected] 2 Pontifical Catholic University of Chile, El Comendador 1961, Providencia, Chile
[email protected], [email protected]
Abstract: Energy retrofitting yields great potential as a means to reduce the environmental loadings of buildings; however, the scope of these measures is often limited to the operational stage of buildings. This study contributes to the development of more comprehensive approaches to energy retrofitting by quantifying the life cycle energy loadings of different envelope solutions for Chilean mass social housing. Overall, the results suggest that increasing the thermal requirements of retrofitting solutions beyond current regulation can significantly increase the environmental performance of the existing building stock due to their capacity to reduce operational loadings without a major increase in embodied energy requirements.
Keywords: Life cycle assessment; embodied energy; energy retrofitting; mass housing.
1. IntroductionOver the past 20 years, Chile has quadrupled its electricity requirements and more than doubled its gross demand for primary energy, putting the country in high vulnerability due to its dependence on imported fossil fuels. In this context, the residential sector has become a key target for environmental policy. According to official statistics, Chilean residential buildings are currently responsible for 15% of the country’s demand for energy while, in 2010, only close to 2% of the housing stock was meeting minimum thermal performance standards (Escorcia Oyola et al., 2013; National Energy Comision, 2018). Several initiatives have been introduced aiming to reduce this demand for energy, including thermal regulation and retrofitting programs for social housing. Although a substantial body of research has explored the potential impacts and limitations of such programs, there remains a lack of reliable information regarding Chilean construction materials and their embodied energy which has limited the scope of research to the operational stage of buildings (Bunster et al., 2018a). This is a significant limitation as the environmental loadings of production activities can offset operational savings (Crawford, 2011). In line with SDGs 7 and 11, this study aims at extending the scope of the analyses
Imaginable Futures: Design Thinking, and the Scientific Method. 54th International Conference of the Architectural Science Association 2020, Ali Ghaffarianhoseini, et al (eds), pp. 699–704. © 2020 and published by the Architectural Science Association (ANZAScA).

700
Victor Bunster, Waldo Bustamante, Cristian Schmitt, Mathew Aitchison
towards a more comprehensive assessment of the life cycle impacts of energy retrofitting measures in Chile.
2. MethodsThis section presents the cases, scenarios, data sources and methods used to quantify the life cycle loadings of different energy retrofitting alternatives in Chile.
2.1. Case study
A CORVI 1020 housing complex was used as case study (Figure 1). These buildings were built on a massive scale across Chile until the 1970s with no significant variations to their design or construction. The original design of these 4-story reinforced concrete buildings did not include wall insulation and used single-glazed windows. Recent surveys estimate that close to 2,000 units are still in use throughout the country and a number of programs are currently in place aiming to improve the residential conditions of their occupants including extensions and energy retrofitting (Bunster et al., 2018b).
Figure 1: The current state of a CORVI 1020 mass social housing building.
2.2. Scenarios
The analysis focused on three envelope solutions in three contrasting climatic zones, for a total of nine different scenarios. Table 1 summarizes the main climatic conditions of Calama, Santiago and Punta Arenas, the three cities used for the scenario testing after their location in the extreme north, center and extreme south of Chile. Table 2 summarizes the characteristics of the different envelope retrofitting solutions where: the Baseline Building has no insulation: the Current Code alternative responds to

701
Life cycle energy assessment of retrofitting alternatives for mass social housing
current thermal regulation (Government of Chile, 1992): and the Improved alternative includes changes proposed by (Bustamante, 2013) and (Ministry of Housing and Urban Planning, 2018).
Table 1: Climatic conditions of the different scenarios under analysis.
Latitude Climate
Annual temperature [C°] Mean
Table 2: Materials of wall and window assemblies tested under the different scenarios.
Walls Windows Roofs City Concrete EPS Plaster. U-value Glazing U-value Concrete EPS U-value
[m] [m] [m] [W/m2·K] [type] [W/m2·K] [m] [m] [W/m2·K]
Baseline Building
Calama Santiago 0.17 . . 3.60 Single 5.80 0.14 0.04 0.70
P. Arenas
Current Code
Calama Santiago 0.17
. 0.02 0.01
3.60 Single 5.80 1.25
Double 3.00 0.14 0.05 0.60 0.07 0.47
P. Arenas 0.05 0.62 0.14 0.25
Improved Calama Santiago 0.17
0.07 0.05 0.01
0.48 0.69 Double
3.000.14
0.47 0.07
0.47
P. Arenas 0.09 0.38 1.94 0.14 0.25
2.3. Data sources
This study draws on a recently developed dataset of embodied energy coefficients of common Chilean construction materials (Bunster and Crawford, 2019). The dataset was developed with the Path Exchange method for hybrid life cycle inventory development using macroeconomic statistical data and local environmental product declarations (EPDs) (Bunster et al., 2018a). Table 3 summaries the main physical properties of the materials used to estimate the requirements of different retrofitting alternatives.
Table 3: Properties of the materials used to calculate embodied and operational energy requirements.
Embodied energy Service life Wastage Conductivity Density Specific heat [MJ/kg] [years] coefficient [W/m·K] [kg/m3] [J/kg·K]
EPS 172.2 50 1.10 0.039 16 340 Plasterboard 14.7 30 1.05 0.170 880 1,050 Glass panels 34.9 40 1.03 1.000 2,531 0.84 Aluminum frames 282.8 48 1.10 210 2,680 880
[Köppen] Mean Minimum Maximum humidity [%] Calama 22°27’S Bwk (Cold Desert) 12.1 2.0 23.0 37 Santiago 33°27′ S Csb (Mediterranean) 13.6 6.7 22.4 72 Punta Arenas 53°08′ S ET (Tundra) 5.9 2.8 9.7 76

702
Victor Bunster, Waldo Bustamante, Cristian Schmitt, Mathew Aitchison
2.4. Life cycle assessment
This section presents the methods used to estimate the life cycle energy of the different retrofitting alternatives under analysis, including their operational, initial and recurrent embodied requirements.
2.4.1. Operational energy
The thermal energy demand of the buildings was calculated using the simulation software Tas Engineering 9.4.3. This demand was used to estimate primary energy use considering a heating device with coefficient of performance 100% and 2.55 as primary energy conversion factor (Larraín and Escobar, 2012). Four apartments of a standard second floor layout were modelled and simulated, and the results multiplied by the total number of stories (four) to account for a complete building. These results were multiplied by the design life of the retrofits (i.e., 50 years). The thermal comfort zone was defined between 20 C° for heating and 26 C° for cooling setpoints. While the airtightness of the buildings was assumed to be 3.0 ACH for the Baseline Building and Current Code alternatives, and 0.7 ACH for the Improved alternative, the internal thermal gains were limited to the ones associated to a standard 4-occupant household (100W/p metabolic rate).
2.4.2. Embodied energy
Following the principles of streamlined life cycle assessment (Crawford, 2011), the embodied energy of the different retrofitting alternatives was estimated by calculating the initial and recurrent energy requirements associated to different construction materials over the design life of the retrofits. The initial embodied energy reflects the energy loadings associated with the production stage of the building materials (A1-3 in (European Standards Organisation, 2011)). It was calculated in four main steps. Firstly, the total surface of envelope assembly needed to retrofit one complete building was estimated using original building design documentation. Then, the quantities of material needed to build that assembly were estimated in kg/m2 using the densities and thicknesses specified in Tables 2 and 3. Later, the energy requirements of the assemblies were estimated by multiplying the results per material by the embodied energy and wastage coefficients described in Table 3. Lastly, the embodied energy of the different layers was summed and multiplied by the total quantity of assembly to reflect total initial embodied energy requirements. The recurrent embodied energy reflects loadings associated to the replacement of materials during the building’s life (B5 in (European Standards Organisation, 2011)). In this study, these replacements were estimated using the expected service life of each material (Table 3) over the retrofit’s design life. Once the number of replacements per material was calculated, these replacements were multiplied by the initial embodied energy of each material to account for the total recurrent embodied energy requirements of the different alternatives.
3. ResultsFigure 2 summarizes the net life cycle energy savings of the case study building under the different climates and retrofitting scenarios. While the average decrease in the demand for energy was 18.41% after the introduction of energy retrofitting solutions that respond to current codes (SC2), the average reduction after further improvements was 79.84% (SC3). This is a performance improvement of 333.68% after an average increase of 58.52% in the thermal resistance of envelope components. Calama showed both the minimum and maximum percentual improvements with a 7.20% of decrease in the Current Code case, and 87.49% in the Improved case; however, the largest improvement of net life cycle energy

703
Life cycle energy assessment of retrofitting alternatives for mass social housing
use was in Punta Arenas, with an average annual reduction of 233.82 GJ per apartment in the Improved case. Significantly, the increase in embodied energy was almost negligible with an average contribution of 1.85% in the Current Code and 0.82% to in the Improved alternatives.
Figure 2: Life cycle operational energy (LCOE, right axis) and embodied energy (LCEE, left axis) of the Baseline Building (SC1), Current Code (SC2) and Improved (SC3) retrofitting alternatives.

704
Victor Bunster, Waldo Bustamante, Cristian Schmitt, Mathew Aitchison
4. ConclusionsThis study presents a life cycle energy assessment of retrofitting alternatives for Chilean social housing. The assessment is conducted using the CORVI 1020 housing block as case study to test three envelope alternatives under three different climates. Overall, the results demonstrate that implementing retrofitting solutions that moderately exceed current thermal performance regulation can significantly reduce the life cycle energy loadings of the buildings. In parallel, they provide evidence that the embodied energy contribution of the retrofitting solutions is close to negligible, arguably due to the poor thermal performance of current envelope components and insufficient improvements ensured by current codes. Future work will focus on life cycle costing optimized solutions based on payback periods.
Acknowledgements This work was partially supported by the Future Building Initiative Lab, Faculty of Art Design and Architecture and Faculty of Engineering, Monash University, and by the Chilean National Commission for Science and Technological Research (CONICYT) under the FONDECYT Postdoctoral Research Fellowship (Project N°3170502). The authors acknowledge the support provided by CEDEUS under the research grant CONICYT/FONDAP 15110020.
References Bunster, V. and Crawford, R. H. (2019) Hybrid LCI coefficients for Chilean building materials. Bunster, V., Crawford, R. H., Bontinck, P.-A., Stephan, A. and Bustamante, W. (2018a) Towards a comprehensive
hybrid life cycle inventory for Chilean building materials, in R. Wakefield, P. Rajagopalan and M. A. Schnabel (eds.), ASA 2018, Melbourne, Australia, 399-406.
Bunster, V., Crawford, R. H., Bontinck, P.-A., Stephan, A. and Bustamante, W. (2018b) Towards a comprehensive hybrid life cycle inventory for Chilean building materials, in R. Wakefield, P. Rajagopalan and M. A. Schnabel (eds.),Engaging Architectural Science: Meeting the Challenges of Higher Density, 52th International Conference of the Architectural Science Association, The Architectural Science Association and RMIT University, Melbourne, Australia, 399-406.
Bustamante, W. (2013) Propuesta de actualización de la reglamentación térmica, Art. 4.1.10 de la OGUC, Ministry of Housing and Urban Planning, Chile.
Crawford, R. H. (2011) Life cycle assessment in the built environment, ed., Routledge. Escorcia Oyola, O., García Alvarado, R., Trebilcock Kelly, M., Celis, F., Echeverría, E. and Sánchez, R. (2013) Validation
of thermal improvements in housing for the reconstruction process post-2010's earthquake. Dichato, Chile, Revista de la Construcción, 12(2), 54-71.
European Standards Organisation (2011) EN 15978:2011 Sustainability of construction works - Assessment of environmental performance of buildings - Calculation method, Czech Republic.
Government of Chile (1992) Ordenanza general de urbanismo y construcciones, Chile. Larraín, T. and Escobar, R. (2012) Net energy analysis for concentrated solar power plants in northern Chile,
Renewable Energy, 41, 123-133. Ministry of Housing and Urban Planning (2018) Estándares de construcción sustentable para viviendas, Tomo II:
Energía, in DITEC - MINVU (ed.), Santiago, Chile. National Energy Comision (2018) Balance nacional de energia 2017, in Ministry of Energy (ed.), Santiago, Chile.

705
The 54th International Conference of the Architectural Science Association (ANZAScA) 2020
Low carbon rules: an interdisciplinary approach to writing standards for earth and straw construction in Aotearoa New
Zealand.
Min Hall1, Hugh Morris2 and Graeme North3 1, Unitec Institute of Technology, Auckland, New Zealand
[email protected] 2 University of Auckland, Auckland New Zealand
[email protected] 3 Graeme North: Earth and Natural Building Consultant, Auckland, New Zealand
Abstract: In order to realise a future where a variety of low carbon building options is readily available, their consenting needs to be supported by relevant standards to assist their path through the regulatory process. The recently published suite of revised and expanded Earth Building Standards, NZS 4297-99: 2020, does just that. The product of a collaboration between a team of architects, engineers, builders, consenting officers, and academics, the standards provide normative and informative guidance for using a wide range of earth and straw building techniques. A key aspect of the interdisciplinary collaboration involved testing of both materials and testing methods included in the revised standards. These standards enable a 'low-tech' approach, making self-help methods available to owner builders, including simplified material testing with low cost equipment. This paper reviews the standards development including testing of materials, verification of low-tech material testing. Given the challenges associated with the changing roles of government and other stakeholders, the problems that arise when the maintenance and development of building standards relies heavily on industry funding, an international collaboration is proposed with lobbying for national government support for on-going development.
Keywords: Earth construction; straw bale construction; building standards; low carbon.
1. IntroductionThe widely used term ‘low carbon’ in relation to building materials is somewhat misleading; it does not refer to the carbon content of the materials being used, but to the CO₂ emissions generated during the extraction, manufacturing and transportation of both the raw materials and the final product to the construction site. Unfired adobe bricks, for instance, have embodied CO₂ emissions of -20Kg/m³, while fired ceramic bricks have +375Kg/m³ (Alcorn, 2010). Low carbon materials have an important part to play in the construction industry if greenhouse gas (GHG) emissions are to be reduced to the levels
Imaginable Futures: Design Thinking, and the Scientific Method. 54th International Conference of the Architectural Science Association 2020, Ali Ghaffarianhoseini, et al (eds), pp. 705–714. © 2020 and published by the Architectural Science Association (ANZAScA).

706
Min Hall, Hugh Morris and Graeme North
recommended by the Intergovernmental Panel on Climate Change (IPCC) and, in the case of Aotearoa, the targets set by the New Zealand Government in 2019 (New Zealand Government, 2019).
As well as adobe bricks, other unfired and unstabilised earthen materials such as rammed earth, cob, and pressed earth bricks are also low carbon, and since 1998 their use has been guided by a suite of New Zealand Earth Building Standards (NZS, 1998). These standards have been cited by the Ministry of Business Innovation and Employment (MBIE) as a means of compliance with the New Zealand Building Code (NZBC), but, after 22 years of existence, they required revision and amendment to bring them into line with changes to other parts of the NZBC, and to reflect recent practical and research findings. The reviewed, revised and expanded Earth Building Standards were published in February 2020 (NZS 2020).
Since 1998, a modest number of earth buildings have been constructed annually, their design, consenting and construction were guided by the standards. During that time skills and expertise have developed, and major earthquakes have provided real-life testing of the structural performance of earthen buildings constructed before and after the 1998 standards came into being (Morris et al 2010, 2011). The government agencies responsible for the administration and development of the regulatory framework have also changed markedly, which has had a significant effect on the process of reviewing and updating the standards. At one point, there was a very real danger that the review would be stopped in its tracks, with the result that building with earth could become extremely difficult to achieve in Aotearoa. At the time of writing, although the revised standards have been published, they have yet to be cited by MBIE as a means of compliance for clauses B, E and H of the NZBC (see detail later). Once this has been done, the necessary rules for the use of a wider range of low carbon building materials will be in place, and they can be further explored to encourage wider uptake.
This paper discusses the standards development including testing of materials, verification of low- tech material testing, challenges associated with the changing roles of government and other stakeholders, and discusses the problems to be overcome when the maintenance and development of building standards relies heavily on industry funding.
2. Background
2.1 Brief history of earth building in Aotearoa New Zealand
The history of earth as a building material in Aotearoa is as long as its human occupation. When Māori arrived from the warmer northern Pacific 700 years ago (King, 2003), they did not use earth as a structural building component, but they did use it for floors, for insulation by mounding against timber framed walls, and as a binder for fibrous wall materials (Phillips, 1952, p.15). In the nineteenth century, settlers arriving from Europe, Australia and China brought earthen wall building techniques with them, including cob, sod, rammed earth, and adobe brick. These were easily translated to the new environment, and earth buildings became an integral part of New Zealand’s vernacular architecture. However, as sawn timber became readily available in most regions towards the end of the nineteenth century, the use of earth declined; during the first half of the twentieth century it became non-existent in most parts of the country (Hall, 2019).
After the Second World War building materials, including timber, were in short supply, and a new interest in earth emerged. Both the government and private individuals looked to rammed earth, soil cement and sun-dried brick for constructing houses (Hall, 2019). Clusters of earth houses appeared in Otago, Canterbury, Nelson, and Wellington. However, Government withdrew support in 1959, choosing to focus solely on timber construction, and building with earth slowed down (Hall, 2019).

707
Low carbon rules: an interdisciplinary approach to writing standards for earth and straw construction in Aotearoa New Zealand
It was when the global counterculture movement reached New Zealand in the 1970s that interest in earth building grew. During the 1970s and 1980s a number of adobe brick, rammed earth and pressed brick houses were built. Hands-on skills and design expertise grew and in 1988 the Earth Building Association of New Zealand (EBANZ) was established. The 1990s represented a golden era of building with earth, particularly amongst owner-builders (Hall, 2012). Earth bricks were being manufactured commercially, and in 1998 the New Zealand Earth Building Standards were published.
While buildings in earth are only one and three percent of total annual residential building consents, growth has continued at a steady rate into the 21st century (Hall, 2012). As well as adobe, rammed earth and pressed earth brick, other methods such as cob, in-situ adobe, light earth, straw clay, and lower density adobe have been implemented. In February 2020 the revised and updated Earth Building Standards were published, this time including informative appendices on earth floors, straw bale construction, light earth construction, and internal adobe brick veneer.
2.2 Brief history of earth building regulations in Aotearoa New Zealand to 1840-2010
Prior to 1992, when the Building Act 1991 and associated NZBC came into being, building regulations were set and controlled by multiple agencies, as outlined by Nigel Isaacs in Early Building Legislation (Isaacs, 2011). Early regulations were concerned particularly with fire, structure and sanitation; earth construction was neither specifically covered nor excluded. When the performance based NZBC came into force in 1992 it had a much broader scope dictated by the Building Act, which required it “to address the wellbeing, sustainable development and safety and health of building users” (Buckett, 2014). There are two ways to comply with the NZBC: using Acceptable Solutions or Alternative Solutions. The former is by far the easiest path to gaining a building consent, and complying with NZ standards that are cited as a means of compliance with particular clauses of the NZBC provides a way of doing this.
When EBANZ was formed in 1988, its founding members were well aware of the proposed overhaul of the New Zealand building regulatory system. Their aim was to generate design guidelines for earth building systems that specifically addressed the New Zealand environment; systems that could withstand earthquakes, wind-driven rain storms, and a climate ranging from sub-tropical to dry temperate. They also ensured that building guidelines produced in 1989 and 1991 would assist owner- builders as well as qualified builders (Drupsteen, 1989 Hodder, 1991).
In 1993 Standards New Zealand (SNZ) were approached by the Standards Association of Australia (SAA) about writing a joint standard for earth building. A steering group met to work out parameters for the standards and initiate writing of the first drafts. The full Joint Technical Committee (JTC) comprised academics, engineers, architects, builders, building officials, and regulators from both countries. At that time there were no substantive international Earth Building Standards; consequently, work had to start from scratch. In order to fit both the accepted building standards framework and the innovative approaches demanded by the new performance based NZBC and proposed Building Code of Australia (BCA), it was decided that three complementary standards were required: an engineering design standard, a deemed-to-comply design standard, and a materials and construction standard to support the other two. The JTC members worked productively together to draft, review, revise and edit the standards but difficulties arose; most significantly the fact that the proposed BCA covering the whole of Australia had still not come into being. The committee was de-jointed in February 1997 and the New Zealand-only committee went on to complete the suite of New Zealand Earth Building Standards, which were eventually published in October 1998 (SNZ, 1998).

708
Min Hall, Hugh Morris and Graeme North
In 1999 NZS 4297 and 4299 were cited as Acceptable Solutions and Verification Methods in the New Zealand Building Code (NZBC) for clauses B1 (Structure), B2 (Durability), E2 (External Moisture) and H1 (Energy Efficiency). The standards have therefore provided building officials, architects, engineers, builders, and owner-builders with a clear and confident path to assess, design, and build earthen walled houses using adobe, rammed earth, and pressed earth brick, with some additional advice for poured earth, cob, earth floors, and earth plasters. As changes to the NZBC occurred, corresponding amendments were made to accommodate the Earth Building Standards. These included changes to H1 in 2007 and E2 in 2008.
2.3 Brief history of testing to support standards development 1990-2000
Experimental work and testing of earthen materials and building techniques is an important aspect of any standards development. The important post-war work carried out by engineering lecturer P.J. Alley in Aotearoa and George Middleton at the New South Wales Research Station in Australia continued in both countries before and after the 1998 standards were published. In Australia, informal experimental work on rammed earth had been undertaken by the Commonwealth Scientific and Industrial Research Organisation (CSIRO) in support of Middleton’s Bulletin 5 (Middleton, 1987) and research on soil cement materials was also undertaken at the University of Technology Sydney. In New Zealand, a number of informal material trials were undertaken during the 1990s in preparation for proposed guidelines or standards and a modest test programme was undertaken at the University of Auckland, initially investigating in-plane performance of small and large panels of reinforced adobe and rammed earth walls for seismic resistance. Other tests were also undertaken, including stabilised rammed earth compression and tension, validation of durability tests, bond strength of adobe and pressed earth, and an evaluation of various reinforcement materials (Gurumo, 1992, Morris, 1993, Walker and Morris, 1998).
3. Review of Earth Building Standards
3.1 Setting up the review 2009-2015
By 2009, members of EBANZ had started planning a revision to the standards. Standards are generally reviewed every five to ten years, and although no earth building built in compliance with the 1998 standards had failed, new research and work with a wider range of earthen materials, including better insulating low density earth, had taken place. Other standards and NZBC clauses referenced in the Earth Building Standards had also changed. In 2010 EBANZ began to lobby SNZ about the need to keep the three standards up to date, as well as incorporating amendments made to clauses E2 and H1 of the NZBC pertaining to earth construction back into the standards. In 2011, EBANZ initiated an unofficial revision of the standards with many of the original 1998 standards committee taking part on a voluntary basis. The scope of the standards was widened to include research findings, as well as accommodating a wider range of earthen-based materials.
The Canterbury and Kaikoura earthquakes occurred just before and during the review process, providing real-life testing of the performance of earth buildings built before and after the 1998 standards. EBANZ funded reconnaissance trips by four committee members after the quakes. Their findings, which informed changes and improvements to the revised standards, showed that earth buildings built according to the 1998 standards performed very well, even those very close to the epicentres (Morris et al, 2010, 2011).
709
Low carbon rules: an interdisciplinary approach to writing standards for earth and straw construction in Aotearoa New Zealand
In 2013, when the revision drafts were nearing completion, EBANZ approached SNZ to set up an official committee to complete a formal review. At that time SNZ was undergoing a restructuring process, and the outgoing SNZ leaders declined to re-appoint a Technical Committee to adopt and finalise the EBANZ drafts into standards. Under the direction of EBANZ, the voluntary group continued to revise the drafts, which were largely completed by 2015.
3.2 Standards New Zealand (SNZ) and the review 2015-2020
The restructuring process resulted in SNZ becoming a stand-alone business unit within MBIE, with oversight from MBIE's Building Systems Performance unit (BSP), whose role is to oversee building regulations. The BSP has the ultimate say in which building standards receive support and funding for revision. After lobbying by SNZ and EBANZ the three Earth Building Standards were included as part of the upcoming work programme for 2016.
In late 2016, under the auspices of SNZ, the Earth Building Standards Development Committee was formed to take the EBANZ draft revisions through the formal standards process. Under the auspices of SNZ, new committee members were appointed to widen representation beyond SNZ, MBIE, and EBANZ. Representatives were appointed from the New Zealand Institute of Architects (NZIA), Engineering New Zealand (ENZ), Structural Engineering Society (SESOC), Building Officials Institute of New Zealand (BOINZ), Building Consent Authorities (BCA), Universities of New Zealand, Unitec Institute of Technology (UNITEC), New Zealand Certified Builders (NZCB), and the National Association of Women in Construction (NAWIC).
Before the committee was finalised, SNZ took the proposal to the Standards Approval Board for approval. They suggested that the scope of the standards be broadened to include, not only the new low density earthen materials proposed, but also other techniques such as straw bale, and a LEM (Light earth material) section. Draft appendices were quickly assembled and included within the overall drafts EBANZ handed over to SNZ for processing.
Shortly before the inaugural committee meeting in 2017, BSP suspended funding for twelve months. After intense lobbying, the meeting went ahead and the drafts, including new sections on veneer construction, low density earthen materials, straw bale and LEM, were refined with specific tasks assigned to committee members. Drafting and editorial work continued on a voluntary basis for the ensuing twelve months by which time it was made clear that funding through BSP would not be reinstated. In order to keep the project alive, a pilot partnership agreement was negotiated between EBANZ and SNZ, whereby EBANZ would not only provide the administration, but also funding for the necessary SNZ formal functions. EBANZ member Ian Brewer agreed to adopt the role of Development Lead for the standards review process, a role formerly taken by SNZ, and BSP withdrew from the Committee.
Development work continued on the three standards and in July 2019 drafts were released for public comment. The committee deliberated over the more than 400 public comments received, and finalised the content. In December 2019, the Standards Approval Board approved the standards for publication, and in February 2020 the standards were published:
▪ NZS 4297:2020 Engineering design of earth buildings,▪ NZS 4298:2020 Materials and construction for earth buildings, and▪ NZS 4299:2020 Earth buildings not requiring specific engineering design.

710
Min Hall, Hugh Morris and Graeme North
The revised standards include sections on dense earthen materials such as mud brick, cob, rammed earth and pressed earth brick in the 1400-2200 kg/m³ range, sections on lower density earthen materials such as mud brick and cob 800-1400 kg m³, internal mud brick veneers, earth floors, and earth plasters. Informative appendices are also included on LEM 200-1200 kg/m³ and straw bale over 90kg/m³ in density. For the first time, a range of low carbon materials with density between 90 and 2200 kg/m³ are combined into one set of comprehensive design documents.
3.3 Testing 2000-2019
Testing continued following the publication of the 1998 standards, and leading up to the 2020 standards. Some tests were undertaken to build confidence in the structural capabilities of materials and other tests were undertaken to investigate the performance of new materials and methods, which have subsequently been included in the 2020 standards. Some, but by no means all, of these tests are discussed below.
3.3.1. Internal high density adobe veneer walls
Increased use of high density internal adobe veneers, to provide thermal mass, led to a testing program to validate their use. Typically, 140mm veneer bricks are secured with brick ties fixed to a timber frame and positively screw-fixed to the brick. The tests were to confirm seismic resilience and ensure minimal risk of out-of-plane wall collapse into rooms inside the house.
Figure 2: Adobe veneer wall panel 4m x 3m with lintel, a) tilt test at about 45 degrees, b) highlighted crack pattern following all tests. Photos: Hugh Morris
A novel test approach was taken. In lieu of constructing and then transporting a test wall to a shake table in a distant laboratory, the testing was carried out in a Nelson-based adobe manufacturer’s yard. A hinged foundation was constructed on top of a piled foundation and the wall panel was built on top. An initial 1.2m wide x 1.8m high panel performed very well when the wall was tilted at increasing angles backwards and forwards multiple times. The final quasi-static test was near horizontal with the veneer towards the ground, giving approximating 1g equivalent seismic acceleration. A 1.2m x 2.4m wall panel test was also very satisfactory, and was followed by the most critical case, which was a 4.0m x 3.0m wall panel with 1.2m of wall height above a doorway lintel, as shown in Figures 2a and 2b. The side wall panels were of reduced height to maximise the height of wall above the lintel, similar to a higher wall overall (Morris et al, 2017). The quasi-static test of tilting the lintel wall of adobe backwards and

711
Low carbon rules: an interdisciplinary approach to writing standards for earth and straw construction in Aotearoa New Zealand
forwards was expected to cause moderate damage or collapse, but again performed very well, with cracks of minor structural significance in the mortar joints. The excavator then lifted the wall and dropped the boom, in order to increase the loading and simulate dynamic effects, reaching 2.6g. The wall damage after these tests is marked to highlight the damage pattern, this is satisfactory and would be repairable post-earthquake.
3.3.2. Low density adobe walls
Figure 3: a) Lightweight adobe 230mm thick out-of-plane tilt test, b) Bond wrench test measuring mortar adhesion. Photos: Hugh Morris
In order to improve the thermal performance of earthen walls, lower density adobe bricks for full thickness house walls have been developed. The proposed seismic design system was also tested at the Nelson brickyard and in the University of Auckland engineering laboratories. Out-of-plane tilt tests and in-plane wall tests were undertaken. The out-of-plane tests are shown below.
The same rig was used to undertake low density wall tests on a 1.2m x 2.4m and a 1.2m x 3m high panel. These full thickness walls were reinforced to the proposed requirements of the 2020 standards: deformed threaded “reidbar” vertical mild steel with hand-tightened post-tensioning and horizontal polypropylene geogrid. As shown in figure 3a, the wall was tilted backwards and forwards in a similar manner, but again had only minor cracks, with no bricks falling out. The wall was then tilted down to near horizontal and loaded with sandbags, equivalent in additional mass to the original wall, making an equivalent seismic load of 2g. The cracks visible in the figure show the damage after this additional loading, and give confidence for life safety (Shi, 2017).
3.3.3. Density, flexural and compressive strength validation tests
The mix and shape of low density adobe bricks was consistently achieved by one manufacturer but required validation to determine realistic mix proportions. Appropriate size measurement approaches to take account of the variation of typical shape for accurate density definition was also validated by an architect, engineer and builder on the standards committee as shown in figure 4a. The lever arm test rig for simplified testing was checked for the additional tensile strength of the more fibrous lightweight adobe as shown in figure 4b.

712
Min Hall, Hugh Morris and Graeme North
Figure 4. a) Low density adobe bricks b) Simple lever arm test setup using measured water for mass) c) detail of the load point after a flexural tension failure, Auckland 2019 Photos: Min Hall
4. Discussion and conclusionThis paper set out to discuss issues surrounding the regulation of low carbon building materials in Aotearoa New Zealand, using the recently completed review of the NZ Earth Building Standards as a case study. Aotearoa has a long history of building with unfired earth, and a current earth building fraternity with significant skills developed over the last fifty years. It also has a suite of Earth Building Standards, first published in 1998. Experts from backgrounds including architecture, engineering, building and consenting, supported by EBANZ, have collaborated in developing the recently updated and expanded 2020 NZS Earth Building Standards.
Any standards development work requires the input of a range of stakeholders as was the case in the Earth Building Standards committee. The viewpoints of each were essential in drafting the revised standards and ensuring that, as with the 1998 standards, the end result was a usable and useful document for all end-users, including owner-builders. For instance, the testing method described in NZS 4298 and shown in Figure 4 for tensile strength does not require a specialist laboratory; it can be carried out by anyone with the skills and equipment to set it up. Enabling owner-builders and minimizing material evaluation costs were key motivating factors for the committee members, who recognized that as well as offering a mitigating potential in terms of GHG emissions, low carbon materials are often also relatively low-tech, making them innately suitable for use by beginners. Empowering those who wish to be involved in the construction of their own houses has obvious value when addressing the current nationwide housing shortage.
Another key requirement for standards development is financial support. Over the past twenty years successive New Zealand governments have stepped away from active participation in rule-making affecting the construction industry, focusing instead on process and oversight. SNZ, once a stand-alone government agency has been trimmed down to a small team within MBIE, “the over-arching regulator of New Zealand’s building system” (MBIE, 2020). This has meant that the ability to keep the regulatory system up to date relies heavily on industry funding. Such a situation was not ideal even for large scale construction materials such as steel, concrete and timber, which have recently had some government relief and now seriously disadvantages most other low carbon materials. The struggle to complete the revision of the 1998 Earth Building Standards is a case in point. Timber, whose production and processing is big business in Aotearoa, is the only truly low carbon material that has serious industry

713
Low carbon rules: an interdisciplinary approach to writing standards for earth and straw construction in Aotearoa New Zealand
backing. Timber research is funded by both government and industry at institutions such as Scion, BRANZ and universities, and designers, engineers, builders, and building consent officers are trained in timber construction as a matter of course. For the low carbon materials covered in the Earth Building Standards, however, it has been left up to individuals and organisations, like EBANZ, who have been at the forefront of developing sustainable building practices for decades, to take responsibility for ensuring that the standards are updated.
By the time SNZ became involved in the Earth Building Standards review in 2016, EBANZ had spent $42,000 on developing the review, and the expert volunteers had devoted thousands of unpaid hours. This required a major additional time commitment and perseverance especially from those taking the lead in what is already a complex process. Thousands more hours were spent over four years and, in the end, a crowdfunding campaign was necessary to raise the funds to complete the process.
It is clear that, at a time when there is an urgent need to reduce the impact of the built environment on climate change, but also an equally urgent need to meet housing demand, a change of attitude to regulating the construction industry is necessary. In the words of US building code writer David Eisenberg, “It is possible and reasonable to look for ways to discourage practices with the greatest large- scale impacts and encourage better practices that reduce them” (Eisenberg, 2016). Such a change requires government to take responsibility for the support and development of a range of building practices that employ low carbon materials and techniques. Twenty-five years ago, the 1998 Earth Building Standards were developed, with support that existed in the form of SNZ, who took the lead development role and covered the administrative, editorial and publication costs. This enabled the multi-disciplinary committee members to focus on the content. The incidence of building with unfired earth, straw bale and other low carbon materials, excluding timber, is not high in Aotearoa. However, if used at scale they have the potential to significantly reduce the carbon footprint of a ballooning built environment. But in order for these materials to be developed and used at the scale necessary to make a difference, there needs to be an internationally supported effort to lobby governments to provide support for research and experimentation, coupled with a commitment to a forward-looking regulatory environment that is not dependent on a very small (but growing) industry. Regulations need to be regularly updated and expanded to respond to innovations based on practical experience in low carbon materials and techniques are essential to harnessing their potential as low-cost, low-impact housing solutions.
The New Zealand example of continuing changes to the government agencies responsible for regulating construction has resulted in a reliance on industry to fund regulation development, leaving most low carbon materials out in the cold. Natural materials require minimal processing, cost either very little or nothing, are difficult to monetize, and thus of little commercial interest but regulations are needed to allow use of an even wider range of low carbon materials, at a time when the construction industry needs to significantly reduce GHG emissions. Perseverance has just got the NZ Standards over the line. We need to raise the profile, gain international support, and in parallel with others around the world, undertake coordinated local lobbying to achieve vital on-going government support.
6. AcknowledgementsThe authors extend their thanks to members of the Earth Building Standards committee, their supporting organisations, students of University of Auckland involved in the testing, and all those who provided feedback during the public consultation process.

714
Min Hall, Hugh Morris and Graeme North
References Alcorn, A. (2010) Global sustainability and the New Zealand house, PhD thesis, Architecture, Victoria University of
Wellington, Wellington. Buckett, N. (2014) A code to build by, BUILD, Issue142, June/July 2014, New Zealand. Drupsteen, T. and North, G. (1989). Guidelines to aspects of earth building in New Zealand. Northland Craft Trust Eisenberg, D.A. (2016) Transforming building regulatory systems to address climate change, Building Research &
Information, 44:5-6, 468-473, DOI: 10.1080/09613218.2016.1126943 Gurumo, Shabani R, (1992). Diagonal Compression Strength of Adobe Wall Panels, Master of Engineering Project D
Report, The University of Auckland, Auckland. Hall, M. (2012) Earth and straw bale: an investigation of their performance and potential as building materials in New
Zealand, M.Arch thesis, Architecture, Victoria University of Wellington, Wellington. Hall, M. (2019) Back to earth: earth building in Aotearoa New Zealand 1945-65. In Andrew Leach and Lee Stickells
(Ed.), SAHANZ - Distance Looks Back, Vol. 36. 205-216Hodder, G. (1991) Non-specific design guidelines for earth buildings. EBANZ, New Zealand
Isaacs, N. (2011) Early building legislation, BUILD Issue 122 February/March 2011, New Zealand. King, M. (2003) The Penguin History of New Zealand, Auckland, Penguin Middleton, G. (1987) Bulletin no 5 Earth-wall Construction. National Building Technology Centre, Commonwealth of
Australia, Fourth edition MBIE. (2020) https://www.building.govt.nz/about-building-performance/ (accessed 19 July,2020) Morris H.W. (1993) The Strength of Engineered Earth Buildings, Proceedings, IPENZ Annual Conference, Sustainable
Development, Hamilton, Pages 660-671 Morris, H.W. and Walker, R. (2000) ‘Aseismic Design and Design and Construction of Earth Buildings in New Zealand’,
12th World Conference on Earthquake Engineering, Auckland, 30 Jan-4 Feb 2000, Proceedings Paper number 2193.
Morris, H.W, Walker, R., & Drupsteen, T. (2010). Observations of the performance of earth buildings following the September 2010 Darfield earthquake. Bulletin of the New Zealand Society for Earthquake Engineering, 43 (4), 393-403.
Morris, H. and Walker, R. (2011) Observations of the performance of earth buildings following the February 2011 Christchurch earthquake, Bulletin New Zealand Society for Earthquake Engineering, 44, p.358-367.
Morris, H. W., Brooking, J., & Walker, R. (2017). Out-of-plane adobe wall veneer performance from a novel quasi- static and dynamic tilt test. In Next Generation of Low Damage and Resilient Structures (pp. 8 pages). Wellington. Retrieved from http://db.nzsee.org.nz/2017/O6A.4_Morris.pdf
New Zealand Government. (2019) Climate Change Response (Zero Carbon) Amendment Act 2019, Wellington. Phillipps, W.J. (1952) Maori Houses and Food Stores, Wellington, Government Printer. Shi, Y., Xiao, M (2017) Part 4 Student Project Reports, University of Auckland: Department of Civil and Environmental
Engineering, Auckland, unpublished. Standards New Zealand. (1998) NZS 4297: Engineering Design of Earth Buildings, NZS 4298: Materials and
Workmanship for Earth Buildings, NZS 4299: Earth Buildings Not Requiring Specific Design, Wellington, NZ, Standards New Zealand.
Standards New Zealand. (2020) NZS 4297:2020 Engineering design of earth buildings, NZS 4298:2020 Materials and construction for earth buildings, NZS 4299:2020 Earth buildings not requiring specific engineering design. Wellington, NZ, Standards New Zealand.
Walker, R. and Morris H.W. 1998 “Development of New Performance Based Standards for Earth Building”. Australasian Structural Engineering Conference, Proceedings Vol 1 pp477 – 484.

715
The 54th International Conference of the Architectural Science Association (ANZAScA) 2020
Low-tech Geometry-based Node Design for Spatial Structures
Esmaeil Motaghi1, Arman Khalil Beigi2, Ali Ghazvinian3, Sina Salimzadeh4, Katayoun Taghizadeh Azari5 1, 2, 4, 5, University of Tehran, Tehran, Iran
{motaghi.esmaeil1, a.khalilbeigi2, sina.slm4, ktaghizad5}@ut.ac.ir 3 Penn State University, State College, PA, United States
Abstract: Reducing the cost and time of construction is aimed at many recent pieces of research. Many construction costs are allocated to nodes in conventional spatial trusses and frames comprised of nodes and bars. Also, these parts have time-consuming manufacturing processes. Even simple mero-type spherical joints require complicated 5- or 6-axis CNC milling machines for fabrication. Thus, this is of great significance to inquire about computational geometry and digital fabrication solutions to address these challenges. The proposed solution discussed in this paper uses geometrical computations to design a node with three significant advantages; First, manufacturing with ordinary 3-axis CNC machinery; thus, decreasing the costs and time of fabrication. The node system is then fully compatible with gradient forms of lattices, from simple to complex, such as multi-layer structures with arbitrary node vacancies. Lastly, since the whole system is based on 2D flat members and components, it is adaptable with panels or claddings that mount on the members. Fabricated prototype to show the proof of concept has been designed and built, and its fabrication challenges are discussed.
Keywords: Computational Design, Fabrication, Node, Low-tech.
1. IntroductionAs one of the Industrial Revolution consequences, a transformation in manufacturing occurred in the nineteenth century. The manual production has been replaced by mass production, done by the machines. The idea of production lines has been introduced by Henry Ford and revolutionized making products. Architects and designers benefit from this paradigm shift correspondingly, since the making stage of the work was getting accessible at reasonable costs and time. Throughout the following developments in the next decades, mass production shaped most of the buildings and the cities of the era; From mass-produced building components such as doors and windows to structural elements like precast beams and columns. Although this seemed to be a decent solution for the housing problems, mainly caused by the world war II, the disadvantages and drawbacks of this approach began to appear in the architecture field, especially in its humanistic aspects. As the French-swiss architect, Le Corbusier emphasized the architect's role in giving the users freedom of choice (Blake, 1996). Thus, there was a missing parameter in the mass-production system, which is the users' identity.
Imaginable Futures: Design Thinking, and the Scientific Method. 54th International Conference of the Architectural Science Association 2020, Ali Ghaffarianhoseini, et al (eds), pp. 715–723. © 2020 and published by the Architectural Science Association (ANZAScA).

716
Esmaeil Motaghi, Arman Khalil Beigi, Ali Ghazvinian, Sina Salimzadeh, Katayoun Taghizadeh Azari
Mass production could not reflect the individuality of the clients on the proposed housing solutions. Then, in light of the developments in personal computers and digital fabrication tools, another paradigm shift has happened; A transition from mass-production towards mass-customization (Wang and Duarte, 2002). With the emergence of advanced computational tools and powerful personal computers, the architecture, engineering, and construction (AEC) industry underwent a drastic change like the other industries. Thus, naturally, serialization and repetition in the Fordist assembly line confront the idea of variation or differentiation (Lynn, 1999). These tools allowed the designers and the end-users to adjust the product of their design regarding their will.
The computer-aided design and manufacturing (CAD/CAM) tools and processes empower designers and customers to produce the desired products according to their specific needs and configuration with much lower expenses. Nevertheless, these new tools' immense possibilities inevitably demand a corresponding shift in fabrication and construction methods. Nowadays, generating fabrication information directly from the design software and designing the fabrication method seems an inseparable stage of contemporary architecture, as crucial as preliminary architectural drawings.
The digital fabrication methods seem to have a significant role in shaping our future cities for various reasons. It is highly customizable and affordable and, therefore, compatible with a large variety of queries. The CAD/CAM has been a mainstay of industrial design and engineering and manufacturing industries—particularly the automotive and aerospace industries—for more than a half-century. Parts ranging from engine blocks to cell phones are designed and built using 3D-computer-modeling software. Scaled models are made quickly, using rapid-prototyping machines that turn out accurate physical models from the computational techniques' data. Once the digital model is refined and completed, the data can be transferred to computer-controlled machines that make full-scale parts and moulds from various materials such as aluminium, steel, wood, and plastics (Iwamoto, 2009).
The spatial structures such as space trusses and space frames are examples of the structural systems taken advantage of this transformation to the computational design. Since the adjustment of these structures with manual methods was quite time-consuming, even a small change in their parts' spatial relation can result in several changes in the entire structure. However, there are still gaps in the design and fabrication of these structures related to the fabrication methods and make them expensive and unsustainable. The central part of these structures which problematizes the fabrication is the design and manufacturing of the nodes. In this paper, an experiment's preliminary results on introducing a novel method to design and fabricate nodes for such structures are discussed.
2. Nodes in the Spatial StructuresT In common 3D structures such as space trusses and space frames, a large portion of the cost, energy, and time is allocated to 3D Node fabrication. Given that manufacturing processes are responsible for 19% of the world’s greenhouse gas emissions and 31% of the United States' total energy usage (Herzog, 2005). It is of great importance to study alternative fabrication methods for 3d structures joinery.
Nodes in space truss systems are fabricated by CNC milling machines, commonly using subtractive fabrication methods, which means the node's intended geometry is carved from a solid block of material. Although subtractive manufacturing is still the dominating method in the industry, removing excess material from a processed block is a highly time consuming, wasteful, and inefficient method of energy consumption and sustainability. Through the material removing process, up to the same energy order is consumed to produce the machining material. Concerning the cutting fluid preparation and cleaning, the focus shifts from the energy to the coolant liquid and hazardous gaseous emissions (Dahmus et al., 2004). From another point of view, it is arguable that similar techniques are not in tune with computational methods of design. For instance, carving out a piece out of a block of material is, by nature, an analogue process and somehow computerized by milling machines or articulated robotic arms (Retsin, 2016). Thus by nature, the immense potentials of computational design are disregarded in this approach.

717
Low-tech Geometry-based Node Design for Spatial Structures
Besides, moving toward additive manufacturing causes another set of problems; for example, fused deposition modelling (FDM) methods like Stereolithography (SLA) have restrictions in material, mechanical, and structural properties of the printed part. Different types of plastics or resins in FDM and SLA printers can be fabricated as negative formwork for further casting. However, first, a secondary formwork must be produced earlier to cast the steel. Also, quality control over casting iron is a complicated procedure, and, finally, the process is not easily scalable. It means for irrational structures with numerous types of joints process is somewhat unreasonable. Methods like selective laser sintering (SLS) or laser metal deposition (LMD) can fabricate steel parts directly, but gradual stacking layers in SLS methods are time consuming and expensive. In the LMD process, which is more suitable for large-scale metal objects, the challenge is preventing the oxidation of the printed metal, as no oxygen-free chamber is being used. Lastly, the contour crafting type of printing has relatively lower accuracy and is compatible with limited materials such as cement-based materials, pastes, plastics, and ceramics. As mentioned, the methods being used for the fabrication of nodes are not sustainable. The subtractive manufacturing with milling and machining is time-consuming, costly, and not energy-efficient. Additive manufacturing is more sustainable but almost slow, costly, and limited in choosing the materials. Therefore, a method not as complex as five or six-axis milling but as customizable as 3d printing can be beneficial. The proposed method in this paper has a limited dependency on cutting-edge machinery. It can be fabricated with all kinds of plasma/laser/CO2 cutters, waterjets, and other types of 2/2.5 dimensional machines.
3. Computational Geometry as Solution
Shifting the complexity of designing the nodes in the spatial structures from high-tech machinery towards intricate computational design can solve unsustainable node problems. With a geometrical study, the 3D nodes can be replaced with some 2D interlocking elements.
In the design process, the intention was to minimize the parts. Thus, the possible scenarios considered how various bars connect to each node. Handling the position and rotation of each bar, corresponding elements were generated.
The proposed algorithm to create the joint is compatible with various conditions of the bars. It means different positioning and orientations can still form a good joint. In the conventional spherical node systems like MERO, NODUS, or TUBALL, the node's size is closely associated with the conditions of its connecting elements (Elfawal, 2014). In other words, the lower the angle between arriving elements, the larger the node. This is because of providing a larger surface area to be able to receive the elements correctly. Nevertheless, this problem is mitigated in the proposed approach as the receiving parts are separated and flat. It is contrary to, for example, the MERO system in which the size of the node is not necessarily corresponding to the magnitude of stresses. Nodes in the MERO system tend to get heavier and structurally less suitable as the excessive material results from geometrical conditions. Thus, it seems reasonable to tackle this problem by the discretization implied in the proposed method. It enables the expansion of the node in two dimensions instead of three, which consumes less material. In the following paragraph, the node's design and fabrication process, shown in figure 1, is elaborated.

718
Esmaeil Motaghi, Arman Khalil Beigi, Ali Ghazvinian, Sina Salimzadeh, Katayoun Taghizadeh Azari
Figure 1. The proposed node for the spatial structures
In order to start designing the node, a given surface, and its generated network for bars are required. The proposed node includes three main elements shown in figure 2-A. First, the Main elements (shown as δ and red) connect each pair of adjacent linear bars. Besides, Connectors (shown as ε and in blue) link the bars to each node's main elements by an interlocking joint, and finally, Integrators (shown by θ and in yellow). These elements are intended to integrate the entire elements of the spatial joint.
Figure 2. The elements and the design process of the proposed node

719
Low-tech Geometry-based Node Design for Spatial Structures
For each node's design, two parallel aligned planes are located by a specific distance of (l) from each other. The distance between the two planes is depended on the minimum angle of the two adjacent elements. The lower the minimum angle is, the larger the distance (l) gets. The orientation of planes is based on the given surface. They are perpendicular to the given surface and parallel to one of the principal curvatures of the base surface (Figure 2-B). The intersection of the bars and these planes, combined with a relative offset value, forms the convex geometry for the layout of the parts (Figure 2- C). Then, the bars are thickened parallel to the normal vector of the base surface (Figure 2-D). As the proposed method is designed for 2D manufacturing, a secondary element is placed perpendicular to both the bar and the main element, which receives the bars and determines the relative positioning and orientation (Figure 2-E). The shape of these connectors follows the imposed structural conditions. They are thickened where the bending moment and shear forces are maximized.
At this stage, it is required to consolidate the entire system by some integrator elements that retain the main parts at the proper distance. The number of these elements and their positioning is associated with the forces acting upon the main elements. Some of the different scenarios for this challenge are shown in figure 3.
Figure 3. Four different angle and distance scenarios for the proposed node

720
Esmaeil Motaghi, Arman Khalil Beigi, Ali Ghazvinian, Sina Salimzadeh, Katayoun Taghizadeh Azari
4. Proof of the ConceptAs a proof of concept, a real scale pavilion was fabricated via the proposed method (Figure 4). The pavilion's overall geometry was designed as a double-curved surface to show the method's compatibility with different complex shapes. Nodes behave desirably regarding the torsion of the base network.
Figure 4. The 'Twisted Arc' pavilion, designed and fabricated by the proposed node system
The entire structure behaves as a self-supporting structure under the dead loads. Nodes undergo different axial stresses, and therefore the integration of the nodes is examined under tensile and compressive forces and shear forces. The structure's structural analyses have been done via Karamba3D (Preisinger and Heimrath, 2014), and the results are shown in figure 5. Figures 5-A and 5-B show the structure's utilization, which means the amount of stress the entire structure and each bar bear compared to their capacity. The longitudinal shear forces are shown in figure 5-C, and the axial stresses are depicted in figure 5-D.

721
Low-tech Geometry-based Node Design for Spatial Structures
Figure 5. The structural analyses of the 'Twisted Arc' pavilion
Regarding the fabrication, to control the assembling process, elements indicating the structure's footprint have been considered in the design process (Figure 6). By laying these base structures, the rest are woven gradually towards the top of the structure. The assembly of the bars and nodes is done manually (Figure 7), and the construction process took less than a day.
Figure 6. The fabrication stages of the 'Twisted Arc' pavilion

722
Esmaeil Motaghi, Arman Khalil Beigi, Ali Ghazvinian, Sina Salimzadeh, Katayoun Taghizadeh Azari
Figure 7. The assembling process of the proposed node system for the 'Twisted Arc' pavilion
5. ConclusionThis paper proposes a method to discuss two-dimensional fabrication machinery's potentials for manufacturing universal joints to construct 3D spatial structures. The main goal is to decrease the amount of material, time, and cost required to design and fabricate the spatial structures' nodes. The solution stems from geometrical computational procedures and therefore is more efficient in the customization aspect. The proposed system's main features are wider availability of machining tools, lower relative machining costs, and lower total weight. This method is compatible and adaptable regarding various connecting elements and provides the constructors with faster construction time. A real scale pavilion designed and fabricated with the proposed method has also been discussed.
Regarding the work outcome, the following issues can be considered in the method's future developments. First, a topological optimization under the more complex loading scenarios can improve the parts' geometry and result in a more efficient design. Second, the connection of the parts can be improved both technically and geometrically. In the former case, welding or nut-screw joints may result in better outcomes, and for the latter dry push-fit, or click joint detail may enhance the system. Finally, a profound study of the joints can indicate different mechanical and structural properties.

723
Low-tech Geometry-based Node Design for Spatial Structures
Acknowledgements The authors would like to thank Dr. K. Taghizadeh, head of the architecture faculty, and Dr. H. Mazaherain, head of the center of excellence in architecture technology (CEAT) at the University of Tehran, for their support during this research.
References Blake, P. (1996). The master builders: Le Corbusier, Mies van der rohe, frank Lloyd wright. WW Norton &
Company. Dahmus, J. B., & Gutowski, T. G. (2004, January). An environmental analysis of machining. In ASME
international mechanical engineering congress and exposition (Vol. 47136, pp. 643-652). Elfawal, M. F. A. (2014). The technical and feasibility selection of space truss construction systems.
Mobile and Rapidly Assembled Structures IV, 136, 293. Herzog, T. (2009). World greenhouse gas emissions in 2005. World Resources Institute. Iwamoto, L. (2013). Digital fabrications: architectural and material techniques. Princeton Architectural Press. Lynn, G. (1999). Animate Form Princeton Architectural Press. New York. Preisinger, C., & Heimrath, M. (2014). Karamba—A toolkit for parametric structural design. Structural
Engineering International, 24(2), 217-221. Retsin, G. P. F. (2016, November). Discrete and Digital. Texas Society of Architects. Wang, Y., & Duarte, J. P. (2002). Automatic generation and fabrication of designs. Automation in
construction, 11(3), 291-302.

724
The 54th International Conference of the Architectural Science Association (ANZAScA) 2020
Measuring intensity and frequency of human activities.
YeeKee Ku1
The University of Melbourne1, Melbourne, Australia [email protected], [email protected] 1
Abstract: The measurement of dwellings per hectare as static density is imprecise to calculate urban, population, and building densities. The missing factor is the dynamics of human behaviour, either by moving or occupying a temporal area that changes to different and unpredictable activities. In order to improve the precision of real-time density, this paper introduces two novel equations to measure activities in an urban environment: intensity and frequency. Intensity is the measurement of the number of people occupying an area for more extended time activities. Frequency measures the shorter activities that do not occupy an area. These equations are tested in a human settlement, Tmor-Da in Phnom Penh, Cambodia, to measure the activities along the laneways. The study conducts a systematic observation documented as time-lapse photos, to map and measure human activities for further statistical analyses. The findings suggest that the equations allow for customisation variables in specific activities, time-intervals and types of people of the context. The measurements could serve as a quantitative factor to test Jacob’s assumptions of public/private interfaces and offers insights into the study of human behaviour. In conclusion, these novel equations are generalizable to measure human activities in any place and serve as a quantitative indicator of real-time density.
Keywords: Urban Density; human intensity; human activities; temporal-occupied spaces [TOS].
1. IntroductionAs recorded by Vitruvius, Archimedes discovered the measurement of density by calculating mass per unit volume (p=m/V) )(Rowland et al., 2014). A similar principle can be related to density measurement in urban environment, but the translation between these measurements was undocumented. These measurements are the density of an urban area, population, building, etc. Urban density calculates the number of people to the urban land area. Population density measures the population per unit area. Both measurements are objective, quantitative and a neutral spatial indicator of the number of people per area. However, at different contexts and scales, the measurements become imprecise. As an example, population density measures the number of building residents per hectare based on census data. Building density measures floor area ratio, or plot ratio. These measurements are non-volumetric, do not reflect the actual fluctuation of population and exclude non-residential buildings into the calculation of an urban area at macro-scale. At micro-scale, occupancy changes of building residents and the real uncertainty of people concentration at different times and places are not included. Therefore,
Imaginable Futures: Design Thinking, and the Scientific Method. 54th International Conference of the Architectural Science Association 2020, Ali Ghaffarianhoseini, et al (eds), pp. 724–734. © 2020 and published by the Architectural Science Association (ANZAScA).

725
YeeKee Ku
the measurements are general and can only be a perceptual and conceptual indicators (Cheng, 2009; Dovey & Pafka, 2016; Pont, 2010) of static density.
Within a broader measurement of density lies the intricacies of ever-changing concentration of people to certain activities at different places, or described as intensity (Dovey et al., 2017; Dovey & Symons, 2012; Stonor, 2019). Intensity accurately describes Jacob’s observation on the relationship between human concentrations in their neighbourhoods with the overall density. She prescribed this as one of the principles that contribute to increasing the social capital of the area (Jacobs, 1961). Her observations and assumptions form the study of public/private interfaces in urban design (Dovey et al., 2017; Dovey & Wood, 2015). A wealth of qualitative studies follows with very few developments in quantitative studies. The measurements proposed for intensity remains at macro-levels that measure the surrounding environments, either building forms, typology, connections, links, etc. (Porqueddu, 2015; Rowe & Kan, 2014; Sevtsuk et al., 2013) but not the `concentration of people’ or human activities. Upon close inspection, the descriptions of intensity are on observable human activities, particularly in public spaces. A `space' is defined as a physical area without meaning. The described activities are a manifestation of human behaviour, single or collective, in an open setting or public area. Specifically, activities are dynamics of human behaviour that can be categorised either moving or occupying a temporal area. Their behaviours change the state of a public area to be private by occupying the area for their activities at a length of time, and these became cues to measure intensity. The key is to measure at the human-scaled micro level.
Therefore, the objective of this paper is to introduce two novel equations to measure human activities. The aim is to explore the plausibility of providing another form of quantitative indicator to the existing broad density calculations. The purpose is to improve upon the precision of density measurements for urban environments. This study employs both qualitative and quantitative methods to conduct an empirical study with a post-positivist ethos. Followed by an explication of procedures to implement the measuring process, and test the results using visual pattern and statistical analyses before reporting on the final result. These equations are tested in a human settlement to measure the activities along the laneways and advance the study of Jacob's `public/private interfaces'.
2. Measurement of human activities: Intensity and frequency equationsThe principles behind the proposed measurement of human activities are based on the population
density and the spatial-temporal point process (Weisstein; Eric (Wolfram research), 2020) mathematics. Through the author’s observation, the nature of the human activity is a temporal occurrence on an area over time. Some activities occur repetitively daily on the same location, some are random without a fixed location, and some are unpredictable. Mapping the spatial dimension of each person conducting an activity could trace the pattern and or location of occurrence at different times. The common denominator is that human activities are a manifestation of people occupying a space for some time, or temporal-occupied spaces [TOS]. Therefore, the measurement of human activities calculates the number of people that conduct the activities on the TOS area at different times.
The observable human activities in space-time are visible as spatial-temporal models. Spatial refers to the visible space of people occupying an area, or volume. Temporal refers to time which is measurable in real-time human activities. Time is not a factor in density calculation but is an important variable to record the dynamics of human activities over time. This follows by mapping a series of changing spatial-temporal models with a constant variable of time intervals. Thus determines the space and time type of data to collect, which identify the location and time of occurrences.

726
Measuring intensity and frequency of human activities
As people gather to participate in an occurrence/s, mapping collective human activities increased in complexity. The area of TOS may increase beyond the area occupied by one person by locating personal objects. As an example, a vendor locates a cart in an area to demarcate the temporal space for his business. The TOS area would include the void space in between two or more individuals that gather and occupy an area collectively. Also, in streets or any main circulation area, there will be passers that do not occupy the area but has a certain relationship with the people that may occupy an area nearby. As an example, the café culture in Paris where people would sit at the sidewalks to watch other people walking by. There is a synergy between the people moving and occupying an area, which resulted in the occurrence of TOS. The characteristics of TOS may vary based on the different behaviour of people in different places. Therefore, this paper introduces two novel equations to measure human activities in an urban environment: intensity and frequency. Intensity measures the number of people occupying an area for more extended time activities. Frequency measures the shorter activities that do not occupy an area. It is important to measure and document data about these shorter activities because there might be relationships between the longer (intensity) and shorter (frequency) activities that we have yet to understand. The data collected may allow future research to analyse further. The equations are:
i = P(TOS) per tTOS
f = P(NON − TOS) × tTOS
Figure 1: Figure of a hypothetical occurrence of human activities in a place.
2.1. Equation 1: Intensity of human activities ( i )
The intensity of human activities measures the longer activities that occupy an area, as illustrated in Figure 1 as TOS people. It is measured by calculating numbers of people that occupy space and divided by the area of TOS for a prescribed time interval (t).
2.2. Equation 2: frequency of human activities ( f )
Frequency of human activities measures the shorter activities that do not occupy an area, as illustrated in Figure 1 as non-TOS people. It is measured by calculating numbers of people that do not occupy the TOS area and divide by the TOS area and time interval.

727
YeeKee Ku
3. Experiment: Testing of equations on a case study
3.1. Select a case study
The primary criterion to select a case study is the observable human activities in a place. Aligned with the discussion about Jacob’s observation of public/private interfaces that may increase the social capital of the area (Jacobs, 1961), Tmor-Da, a self-form settlement in Phnom Penh, Cambodia was selected. The first reason was observable human activities that changes the state of public laneways to private, temporarily, which is of a similar characteristic as public/private interfaces. The second reason was observable changing built forms that indicate the increase of social capital in the area. Extension of built forms from an existing ruin and abandoned old buildings suggest that the settlement is evolving. Deep inside Tmor-Da, dwellers are observed to conduct businesses and domestic activities from their homes extending out to the laneway. These built forms could only evolve when the financial standing of each dweller has improved to fund the construction of these new extensions. This indicates that the domestic economy of a place is thriving. That leads to the question aligned to Jacob’s assumption that a place that allows for public/private interfaces may increase the social capital of a place. This experiment will not evaluate Jacob’s assumptions but will test if the equations proposed to measure human activities on TOS could provide quantitative methods to evaluate Jacob’s assumption.
Fieldwork in Tmor-Da identified 15 focal zones ( https://doi.org/10.26188/5dcb6ce1362ec ) to select two zones with opposing characteristics for this paper. Zone 1 is a typical dwelling area in the settlement and located at the entryway into the settlement from the main road, Preah Sisowatch Quay. Zone 5 is deep inside the settlement where boil egg-embryos vendor is in the middle of the laneway. In this case study, TOS refers to people changing the state of a public space temporary for private activities. A `state' is defined as a particular condition, denoted by humans on space, at a specific period in time. `Private' is defined as belonging to, or for the use of only one particular person, or more. In Tmor-Da, people carry out their daily domestic activities and conduct businesses along the laneways in the settlement. Technically, that describes Jacob's observations, and public/private interfaces refer to the occurrence of TOS and can be measured using the proposed equations. Therefore, TOS refers to people changing the public state of an area to private along the laneways of Tmor-Da.
3.2. Methods
This empirical research records qualitative observations on time-lapse photos and documents on maps. Quantitative abstraction follows to calculate the number of people and the TOS area at specified time intervals. These datasets are for visual patterns and statistical analyses before reporting on the result. A systematic procedure of five steps is essential to collect comprehensive dataset at the level of details required for measurements and further analyses. Details of figure and tables are in this link https://doi.org/10.26188/12782321.v9
• Step 1- Record time-lapse photos of an area: Record observations in time-lapse photos with aconsistent angle and interval of time in a day. This step can be taken by manual single shot photos or by clipping out photos from a video recording. The output from Tmor-Da’s fieldwork is a series of organised photos in sequence to the time interval of every 30 minutes from 07:00 until 22:00,set during fieldwork.
• Step 2- Mapping of documented observations from time-lapse photos: Documentation of space-time data follows the sequence of the time-lapse photos. Firstly, set a consistent 2-D

728
Measuring intensity and frequency of human activities
plan-viewed map on the area of activities in the focal zone. Standardised variables’ codes, which are the number of people and area of TOS. Set a standard colour codes on categories of different activities. In Tmor-Da, there are two dominant activities: domestic in pink and commercial in cyan. Next, set the icon for people to be in dots, with colour codes to different types of people as dweller-female in red, dweller-male in maroon, dweller-kid in purple and vendor in dark purple, also object in grey. The expected output is a series of maps similar to the time-lapse photos. Another spatial intensity map is to analyse the location of activities by collapsing all maps into one with a transparency rate of 30% each. The expected output is a single map with different tones that illustrates the amplitude of intensity for visual pattern analyses in step 4.
• Step 3- Measuring human activities: First, locate the people and objects from each time-lapse photo to a space-time map. Identify the different types of people and objects placed to markterritories. The expected output is a two-way table of different types of people and objects, TOSalong with vertical columns against the range of time intervals along horizontal rows.
• Step 4- Visual pattern and statistical analyses: Five charts visualise the measured data. The firsttwo doughnut charts identify the predominant type of people on the TOS area. (1) The differenttypes of TOS area. (2) Different types of people on TOS area. (3) A circular histogram chart ofintensity value per 30 minutes from 07:00 until 22:00 identifies the pattern of intensitythroughout a day. (4) A time-series plot of frequency on TOS area in a day is to identify thecorrelational pattern between frequencies to the TOS area occupied in a day. (5) A combinationchart of stacked vertical columns to the time intervals of different types of people and objects,with a hatched line chart of the TOS area behind. This visualises the dynamics of the number ofpeople and objects to the TOS area throughout a day.
• Step 5- Results: Interpret human intensity and frequency calculations in the zones.
3.3. Zone 5: A typical dwelling area
• Step 1- Recorded time-lapse photos of an area in Figure 2(b): The dwellers carry out daily domestic activities and chat to each other across the laneways without care for passers-by.
• Step 2- Mapping of documented observations from time-lapse photos in Figure 2(c): TOSdomestic in pink colour occupied the entire laneway briefly from 07:30 to 08:30. A smaller patch of area was occupied again at 09:30. It moves to a single-sided area from 11:30 to 12:00, and again at 15:00. Then, it expanded to the entire laneway at 16:00 until 18:30 but retracted to the smaller and single-sided area from 19:00 until 21:30. Data abstracted from Figure 2(c) are recorded inTable 1.
• Step 3- Measurement of human activities in Table 1.
• Step 4- Spatial intensity analysis in Figure 1(d) and statistical analyses in Figure 3.
• Step 5- Results: In figure 3(b), 72.31% of dweller-females predominantly occupy the TOS area for100% domestic activities (figure 3(a)). The active period of intensity is from 15:00 until 21:30 asshown in figure 3(c). The frequency pattern in figure 3(d) and intensity pattern in figure 3(e) arealmost the same as the active TOS domestic area. Table 2 tabulates the total mean and median of intensity values per 30 minutes are 0.54 and 0.56 with a standard deviation of 0.25 and

741
YeeKee Ku
variance of 0.06. The total mean and median of frequency values per minute are 0.02 with a standard deviation of 0.01 and variance of 0. This means the amplitude of activities on that day is moderate.
Figure 2: Zone 1 (a) A photo of a typical day. (b) Time-lapse photos from 07:00 until 22:00. (c) 2d time- lapse maps from 7:00 until 22:00. (d) Spatial intensity mapping.
Table 1: Measurements to calculate intensity and frequency in Zone 1.

730
Measuring intensity and frequency of human activities
Figure 3: Visualisation of statistical analyses of Zone 1.
3.4. Zone 5: The boiled egg-embryos seller
• Step 1- Recorded time-lapse photos of an area in Figure 4(b): There are two huge stackable trays of eggs on top of water pots with burning charcoal at the bottom. They are cooking a local delicacy of boiled egg-embryos, and the laneway is their kitchen. Throughout the day, various mobile-vendors on motorcycles and bicycles came to take the eggs and sell elsewhere. Some locals passed by, but none of the neighbours conduct daily chores nearby. It is as though there is anunderstanding to allow them to conduct business without obstructions.
• Step 2- Mapping of documented observations from time-lapse photos in Figure 4(c): TOScommercial in cyan colour occupied over the laneway from 07:30 until 11:30 and peaks at 08:30to 09:00 with many passers. The TOS area retracted closer to the vendor's home from 12:00 until 19:30 without any major cooking. A vendor continued selling to locals who passed by until 20:00. Data abstracted from Figure 4(c) are recorded in Table 2.
• Step 3- Measurement of human activities in Table 2.
• Step 4- Spatial intensity analysis in Figure 4(d) and statistical analyses in Figure 5.
• Step 5- Results: In figure 5(b), 30.86% of vendors predominantly occupy the TOS area for 100%commercial activities (figure 5(a)). The active intensity period is distributed throughout the daybut peaks at 13:30, followed by 9:00, 15:00 to 15:30 and 18:30, as shown in figure 5(c). Thefrequency pattern in figure 5(d) and intensity pattern in figure 5(e) opposes to the period of active TOS area. Table two tabulates the total mean and median of intensity values per 30 minutes are0.40 and 0.38 with a standard deviation of 0.31 and variance of 0.10. The total mean and median of frequency values per minute are 0.1 and 0.1 with a standard deviation of 0.31 and variance of 0. This means zone 5 is busy with a high volume of passers or visitors engaging with a vendor. His business is attracting people to that zone.

731
YeeKee Ku
Figure 4: Zone 5 (a) A photo of a typical day. (b) Time-lapse photos from 07:00 until 22:00. (c) 2d time- lapse maps from 07:00 until 22:00. (d) Spatial intensity mapping.
Table 2: Measurements to calculate intensity and frequency in zone 5.

732
Measuring intensity and frequency of human activities
Figure 5: Zone 1 (a) Visualisation of statistical analyses of Zone 5.
3.5. Compare results between Zone 1 and 5.
The intensity value of domestic activities in zone 1 is higher than commercial activities in zone 5 but with lower standard deviation and variance values. This means dwellers regularly use the area in zone 1 with little changes throughout a day. Opposite to that, the frequency of commercial activities in zone 5 is higher than zone 1, which means the vendors actively use the area and alter their commercial activities throughout the day with many people coming in and out but none stays for long. The location of the highest spatial intensity in both zones abuts a built form, either for domestic or commercial activities. As a whole, the results from testing these novel equations in the experiment are consistent to expectations.
4. Findings, discussions and conclusionThe equations tested in Tmor-Da were able to measure and produce consistent intensity and
frequency values on the different activities of the two zones. The precision of the measurement is to an individual level of engaging activity because of the data collected is human-scaled. That particular person is categorised into a variable for the type of people. Then, another set of the variable for his types of activities on TOS. In Tmor-Da, the broader category is between domestic and commercial, but these two can be further broken down to different types of domestic and commercial activities. As an example, they are cooking and chatting for domestic activities and different types of goods sold by the vendors, either food or daily goods. Customisation to different time variables can be done as long as the time-intervals are kept consistent. Therefore, the flexibility of the customisation to different variables in the proposed equations produced results to the precision of one individual’s specific activity at a specific time interval. A future improvement to the research methods could account in volumetric space of TOS through the use of people tracking or occupancy sensors with machine learning for higher precision in shorter time intervals.
733
YeeKee Ku
The measurement of intensity and frequency values provide human activities with a quantitative factor to test Jacob’s assumption that public/private interfaces may inculcate social capital of an area. The results can extend more theoretical discussions with statistical evidence. However, measuring activities are post-mortem of an occurrence. The collected data of these human activities are a manifestation of a certain pattern of human behaviour which can now be studied to understand the underlying reasons. In Tmor-Da, the reasons for dwellers self-forming the settlement could be hidden in their daily adaptation of public spaces for private uses. While understanding human behaviour is important, designing specifically to human behaviour may cause stagnancies to an evolving system like a self-form settlement. Human behaviour is ever-changing and evolving, and activities manifested will inevitably be unpredictable and unknown. It is more important to understand the mechanism behind how human behaviour reciprocally adapts in an environment by engaging interdisciplinary approach from human geography, psychology, biology, computer science, etc.
Table 3: (left) Population density with intensity and frequency measurements.
Figure 6: (right) Bar chart of distribution of population density, human intensity and frequency in a day. Each zone studied is a population sample for the settlement. This paper present two samples with
differing intensity and frequency values of human activities in a day. The measured precision is to every time interval, which differs throughout a day, and reflects real-time density. The standard deviation and variance values reflect how much human activities differ in a day, also, to specific real-time types of people that were in the sample. The changes of values reflect the dynamic nature of human activities. These values can be multiplied with the static density value of urban, population and even building to gauge the real-time dynamic patterns of human activities distribution in a day (Figure 6). Higher precision can be attained with more samples and data from multiple days.
In conclusion, the equations of intensity and frequency can be generalised to measure human activities in any places, either in the interior of buildings or outdoor places. These measurements offer insights into human behaviours that can be studied by interdisciplinary approaches. Finally, further development of these equations into quantitative indicators of real-time densities will improve the precision of current static density measurements for urban environments.

734
Measuring intensity and frequency of human activities
Acknowledgements The data measurements and mathematical equations are devised solely by the author in her PhD thesis, following the suggestion to map temporal-occupied space area by Professor Justyna Karakiewicz.
References Cheng, V. (2009). [PDF] Understanding Density and High Density. Semantic Scholar.
https://doi.org/10.4324/9781849774444-11 Dovey, K., & Pafka, E. (2016). Urban density matters – but what does it mean ? https://theconversation.com/urban-
density-matters-but-what-does-it-mean-58977 Dovey, K., Pafka, E., & Ristic, M. (2017). Mapping Urbanities. In Mapping Urbanities. Routledge.
https://doi.org/10.4324/9781315309163 Dovey, K., & Symons, F. (2012). Density without intensity and what to do about it: reassembling public/private
interfaces in Melbourne’s Southbank hinterland. Australian Planner, 51(1), 34–46. https://doi.org/10.1080/07293682.2013.776975
Dovey, K., & Wood, S. (2015). Public/private urban interfaces: type, adaptation, assemblage. Journal of Urbanism, 8(1), 1–16. https://doi.org/10.1080/17549175.2014.891151
Jacobs, J. (1961). The Death and Life of Great American Cities. The Failure of Town Planning. New York, 71, 474. https://doi.org/10.2307/794509
Pont, M. B. (2010). Spacematrix : space, density, and urban form. NAI. Porqueddu, E. (2015). Intensity without Density. Journal of Urban Design, 20(2), 169–192.
https://doi.org/10.1080/13574809.2015.1009008 Rowe, P., & Kan, H. Y. (2014). Urban Intensities: Contemporary Housing Types and Territories - Harvard Graduate
School of Design. Walter de Gruyter GmbH. https://www.gsd.harvard.edu/publication/urban-intensities- contemporary-housing-types-and-territories/
Rowland, I. D., Howe, T. N., & Dewar, M. J. (2014). Vitruvius: ‘Ten books on architecture.’ In Vitruvius: “Ten Books on Architecture.” Cambridge University Press. https://doi.org/10.1017/CBO9780511840951
Sevtsuk, A., Ekmekci, O., Nixon, F., & Amindarbari, R. (2013). Capturing urban intensity. Open Systems - Proceedings of the 18th International Conference on Computer-Aided Architectural Design Research in Asia, CAADRIA 2013, 551–560. http://cumincad.scix.net/data/works/att/caadria2013_027.content.pdf
Stonor, T. (2019). Measuring Intensity - Describing and Analysing the “Urban Buzz.” Iconarp International J. of Architecture and Planning, 7(Special Issue “Urban Morphology”), 240–248. https://doi.org/10.15320/iconarp.2019.87
Weisstein; Eric (Wolfram research). (2020). Spatial-Temporal Point Process -- from Wolfram MathWorld. Wolfram Mathworld. https://mathworld.wolfram.com/Spatial-TemporalPointProcess.html

735
The 54th International Conference of the Architectural Science Association (ANZAScA) 2020
Methods to assess the risk of condensation from thermal bridges in timber-framed houses: a systematic literature review.
Griffin Cherrill1, Dr Michael Donn2 1, 2Victoria University, Wellington, New Zealand
[email protected] [email protected]
Abstract: A systematic literature review has analysed methods available to assess the risk of condensation from thermal bridges in timber-framed houses. The standard approach comes from Clause E3 in the New Zealand Building Code, which prescribes the minimum overall R-value for timber-framed walls as R-1.5. The standard approach avoids condensation because the amount of timber framing, with an R-value of less than 1.5, makes up a tiny fraction of the overall insulated wall. It does not consider the possibility that sections within the wall may be built up with solid timber creating a much larger thermal bridge than a single timber stud. For example, New Zealand Standard 3604 states trimming studs can be built up to a width of 270mm. EnergyPlus is commonly used to calculate the energy demand. It can calculate surface temperatures and thus the risk of condensation for overall average R-values. Complex moisture programs such as WUFI Plus can be used to estimate condensation potential around local thermal bridges, but this is time-consuming and requires additional expertise. The systematic review identifies the existing state- of-the-art programs like EnergyPlus as potentially less complex tools, that are already in use for energy performance analysis, to predict the risk of local condensation.
Keywords: Thermal bridge; condensation; simulation.
1. IntroductionA thermal bridge can be identified as a change in the thermal resistance of the building fabric, where it would otherwise be uniform. A timber stud has a higher thermal conductivity than the insulation layer that it sits in, which increases the heat flow through the building fabric surrounding the thermal bridge. This decreases the internal surface temperature and increases the relative humidity, leading to an increased risk of condensation and mould growth (Mao & Johannesson, 1997).
The current method used to avoid surface condensation is found in Clause E3 of the New Zealand Building Code (NZBC). It prescribes the minimum overall R-value for timber-framed walls as R-1.5, calculated using the equivalent U-value method. This calculation method assumes that the sections of the wall with a lower thermal resistance from thermal bridges can be averaged across the building element, and the risk of condensation will be insignificant if the minimum R-value is achieved. When used, this method does not allow for detailed estimation of the effect of built up sections in the wall, such as the
Imaginable Futures: Design Thinking, and the Scientific Method. 54th International Conference of the Architectural Science Association 2020, Ali Ghaffarianhoseini, et al (eds), pp. 735–744. © 2020 and published by the Architectural Science Association (ANZAScA).

736
Griffin Cherrill, Dr Michael Donn
270mm timber framed trimming studs prescribed by New Zealand Standard 3604. Nor does it allow for the local risk of surface condensation at specific details within the building to be assessed, which is necessary for building practitioners who want to design higher performance buildings. Instead, this method encourages the problem of excess timber to be solved by increasing the thermal resistance of insulation.
A systematic literature review was conducted to identify existing methods and programs that are available to assess the risk of condensation in timber-framed houses. The literature review analysed the method used in Clause E3 of the NZBC, referred to as the equivalent U-value method and identified whether this simple method provides sufficient detail to assess accurately the risk of condensation. The goal of the review was to explore the important factors that need to be considered to accurately replicate the behaviour of thermal bridges in a simulation program. This was to help identify existing methods of varying complexities that could be used to simulate accurately the heat flow through the building fabric and allow the risk of condensation to be assessed. The aim was not to identify the most precise or detailed tool, but to identify which tool can most accurately simulate the behaviour of heat flow through thermal bridges without unreasonably increasing the computing time or the level of experience required.
Although there is a range of existing literature which relates to the assessment of condensation from thermal bridges with various methods and tools, no literature review has been found which collectively investigates the important factors that need to be modelled in a simulation program. Nor is there any existing literature which aims to identify a method or tool that can accurately assess the risk of condensation without requiring large amounts of time or experience.
The aim of the systematic process was to collect literature that evaluates a method to calculate local surface temperatures and/or assess the risk of condensation from thermal bridges within the building fabric. The literature review was not looking to identify work that has been done on how to validate tools, but the evaluation did need to be compared against a comprehensive model or empirical data, for the same thermal bridge.
2. Systematic literature review processA systematic literature review follows a clear and replicable methodology which reduces the risk of bias. The process for the systematic literature review was taken from Boland et al. (2014).
2.1. Literature search results
A number of databases were chosen (Table 1) as representing a broad range of research sources. Two combinations of keywords were searched (Table 1), and the titles of each set of results were read to collect literature which aligned with the aim of the review. Table 1 shows the number of results for each set of keywords in each database, along with the number of relevant references which were collected in brackets. Google Scholar produces a significantly larger number of results for each search compared to other databases, so instead of reading through all the titles, the results were ordered in terms of relevant matches to keywords. This database was then searched until only one piece of relevant literature was collected over two pages of titles.

737
Methods to assess the risk of condensation from thermal bridges in timber-framed houses: a systematic literature review
Table 1: Number of results from databases searched.
Number of Results (Number of Results Collected) “Thermal Bridge” AND Condensation AND “Surface Temperature” AND …
Databases … (EnergyPlus OR “Energy Model”) … (Model OR Simulation)Google Scholar 1,960 results (23 collected) 10,200 results (38 collected) ProQuest 84 (9) 286 (27) Research Gate 0 0 SAGE Journals 3 (0) 30 (5) SciELO 0 0 ScienceDirect 94 (3) 382 (18) Scopus 0 15 (4) Taylor and Francis 3 (2) 27 (4) Web of Science 0 8 (3) Total 37 99
2.2. Screening results
The search produced 136 references. This was reduced to 99 after duplicates were removed and full-text papers were obtained. The following exclusion criteria was applied, leaving 32 results. The exclusion criteria removed literature if:
• It was a repeat of literature that had already been collected. • It compared results from at least two methods but for a different thermal bridge. The literature
needed to test the methods on the same thermal bridge to show suitability. • It used methods to assess a thermal bridge in a building, considering the effect on energy demand
alone, rather than considering the effect on local surface temperatures and condensation risk.
3. Findings from the reviewThe findings from the 32 papers confirm that, in addition to thermal bridges changing the overall heat flow due to reduced thermal resistance, there is an increased risk of internal surface condensation surrounding the thermal bridge (Mao & Johannesson, 1997). In addition to these issues, the authors demonstrate that the calculation of the risk of condensation is not easy. Ascione et al. (2012) confirm that accurately assessing the risk of condensation is not as straightforward as using a simple R-value calculation, such as the equivalent U-value method, and more complex modelling tools may be required.
Martin et al. (2011) discuss the two difficulties faced when modelling the effect of thermal bridges within the building fabric which can increase the complexity of a tool. The first issue relates to replicating the thermal inertia and the dynamic behaviour. The equivalent U-value method of NZBC Clause E3 does not consider the thermal properties, such as density and specific heat, of the thermal bridges, disregarding their effect on phase lag and amplitude. The dynamic properties of the thermal bridges and opaque wall are ignored as the heat flow through the wall is assumed to be instantaneous. This results in the temperature of the internal surface being affected by heat flow earlier than it would do in reality, leading to misleading results.
The second issue arises when trying to replicate multidimensional heat flow from thermal bridges in a 1-dimensional (1D) modelling program. The equivalent U-value method is faulted by various authors forthis reason. The method assumes that heat travels in 1D and is constant across the whole building

738
Griffin Cherrill, Dr Michael Donn
element, which means local surface temperatures cannot be assessed. Rather than modelling sections of the wall made from thermal bridges where heat flow is greater than opaque sections of the wall, the reduced thermal resistance of the thermal bridges is averaged to slightly lower the overall R-value. This leads to the correct overall heat flow but does not allow for local surface temperatures surrounding thermal bridges to be analysed, potentially leading to the risk of condensation being overlooked.
3.1. Dynamic vs static
The equivalent U-value method is discussed by Baba (2015) and Prata (2017) who note that it does not correctly simulate the dynamic effects of heat flow through thermal bridges because it does not consider the thermal inertia.
Martin et al. (2012) discusses the issues with using linear thermal transmittance (LTT), or the ψ (psi) value, to calculate the effects of thermal bridges on energy demand. The LTT is a measurement of how much heat is lost per meter of thermal bridge. The authors note that LTT is calculated under static conditions and therefore does not consider the effect of the thermal inertia of the thermal bridges, a similar problem faced by the equivalent U-value method. The authors state that using LTT to calculate additional heat flow is comparable to calculating the energy demand in a building considering only the thermal resistance and disregarding the density and specific heat of materials. In a previous article written by Martin et al. (2011), the authors compared results from different methods used to model thermal bridges, one of which was calculating LTT under static conditions then adding it to the thermal transmittance of the homogenous wall so it can be used in a dynamic simulation. The results show that when a concrete thermal bridge with a significant thermal inertia was represented with LTT, the heat flow through the wall was instantaneous resulting in a phase lag of 0 hours, when the other models reported a phase lag around 8 hours. For this reason, the authors concluded a dynamic simulation is considered a necessity when more precise information is required for more efficient design. Furthermore, Troppová et al. (2016) found when calculating the LTT under static conditions, the heat flow through linear thermal bridges was underestimated by up to 54% compared to the real value.
Prata (2017) supports this claim stating the heat loss through linear thermal bridges was higher when simulated in a dynamic simulation compared to results from a static simulation. Prata (2017) concluded greater heat flow through the thermal bridges in dynamic simulations led to cooler surface temperatures and therefore a higher risk of condensation occurring. Interestingly, Baba (2015) discusses the importance of simulating behaviour under dynamic conditions rather than static conditions but concluded the opposite to Prata (2017). By calculating the minimum surface temperature and dew point under both static and dynamic conditions, Baba (2015) found that static simulations recorded lower surface temperatures and an increased risk of condensation compared to results from a dynamic simulation. This result is likely due to the static simulation assuming instantaneous heat flow through the building fabric, while this is untrue in reality. The results of the dynamic simulation from Prata (2017) show that as the external air temperature increases from the coldest temperature, the lowest internal surface temperature is not reached until around 6 hours later. By this time, the external temperature has already started increasing, therefore decreasing the effect of colder external air temperatures. Additionally, the static simulation cannot consider the possibility that the internal area of the wall is colder than both the external and internal surfaces, and therefore heat is travelling inwards from both surfaces (Prata, 2017).
Rather than calculating the internal surface temperature to assess the risk of condensation, Mumovic et al. (2006) compared the number of hours masonry, timber and steel framed junctions have a relative humidity (RH) greater than 80% with a dynamic and static simulation. The results show the dynamic
739
Methods to assess the risk of condensation from thermal bridges in timber-framed houses: a systematic literature review
simulations predict a few hours above the threshold, suggesting a risk of condensation, while the static simulation predicts all values of RH are significantly lower than 80% for all junctions.
Baba (2015) suggests the material of the thermal bridge has an impact on the thermal inertia and dynamic behaviour of a building element, with materials of a greater thermal mass increasing the dynamic effect. For example, the thermal inertia of lightweight thermal bridges, such as timber frame or cross laminated timber, was found to be less significant than that of thermal bridges made from higher mass materials and could therefore be considered negligible. From this, the author suggests the dynamic behaviour of light weight thermal bridges does not need to be assessed and a static analysis of heat flow would be suitable. However, the author does not clearly define the point at which the effects of thermal inertia become negligible. This argument is supported by the findings of Mao and Johannesson (1997), where the dynamic behaviour of the wall was similar with and without the metal stud. On the other hand, Martin et al. (2011) found the thermal inertia of a timber thermal bridge had a significant effect on the phase lag and amplitude of a lightweight clay ceramic block wall.
3.2. Multi-dimensional modelling
Although the significance of their effect is under debate, the literature agrees that thermal bridges within the building fabric affect the heat flow which affects the energy demand. Gao et al. (2008) found that simulating the effects of thermal bridges with a 1D model can underestimate the total heat flow through a building’s envelope by more than 10%, while Alhawari and Mukhopadhyaya (2018) found it can underestimate heat flow by up to 70%. Martin et al. (2011) reported, depending on the type of house and level of insulation, the energy demand can be underestimated by 5-39% when thermal bridges are modelled incorrectly. When simplifying the wall to 1D, using the equivalent U-value method, and computational fluid dynamic modelling of a metal deck roof, Ascione et al. (2012) show the two methods produce a different thermal resistance for the roof, leading to a different energy demand. Contrasting to the findings from other investigations, the thermal resistance for the 1D wall was lower than the results from CFD, which resulted in an overestimation of heat flow and energy use. The authors also assessed a method similar to the equivalent wall method, where the predicted energy demand was similar to the results from CFD, but regardless, the effect on local surface temperatures cannot be predicted as the heterogenous layers are not modelled.
Prata (2017) and Quinten and Feldheim (2019) demonstrate that 1D modelling of thermal bridges is inadequate and their effect on reduced surface temperatures should be assessed in 2 or 3-dimensions. The method used in Clause E3 of the NZBC simplifies heat flow to 1-dimension and focuses on representing the overall heat flow through a thermally bridged wall. This may be an inadequate method to calculate overall heat flow as it does not consider material properties, but it also does not allow the effect on surface temperatures surrounding the thermal bridge to be considered.
Martin et al. (2012) discusses the two approaches used to implement thermal bridges correctly into a whole building energy model. The first approach, which is the most complex, implements 2D or 3D heat conduction techniques into the program, while the second calculates a 1D homogenous equivalent wall that has the same 2D and 3D heat flow as the thermally bridged building element. Contrary to Martin et al. (2012), who groups 2D and 3D modelling techniques into the same method, Kalousek and Novák (2019) states that even though the word “multidimensional” covers both 2D and 3D, the results from using these methods can vary significantly. And while Martin et al. (2012) suggest the use of 1D techniques to model thermal bridges, Pont and Mahdavi (2017) argue that simplified 1D models should not be used to model thermal bridges as their behaviour cannot be captured.

740
Griffin Cherrill, Dr Michael Donn
Pont and Mahdavi (2017) carried out an investigation to compare the results from static 2D and 3D heat flow simulations to calculate minimum surface temperatures. Among the thermal bridges compared in 2D and 3D, the results found a difference in calculated surface temperatures of up to 6K, which would have significant effects on the risk of internal surface condensation and possible mould growth. The authors argue that in some cases, the use of a 3D model should be recognised as a necessity because the difference between the results from the 2D and 3D model are significant. These results are supported by Kalousek and Novák (2019), who found significant differences in the surface temperatures from 2D and 3D models, with the greatest being 15.82°C in 2D and 9.75°C in 3D. Prata (2017), who investigated the heat flow through 2D and 3D corners both static and dynamic conditions, found the total heat flow through a 3D point thermal bridge was significantly lower than that of the 2D linear thermal bridge. But when assessing condensation risk, Prata argues that internal surface temperature in the 3D corner cannot be overlooked. The comparison between the 2D and 3D models shows a difference in internal surface temperature of 2.2°C, from 11.7°C in 2D to 9.5°C in 3D.
Posey and Dalgliesh (2005) carried out a similar investigation, comparing static heat flow and minimum surface temperatures from thermal bridges using finite difference and finite element 2D and 3D programs. Their conclusions disagree with the conclusions of Kalousek and Novák (2019), Pont and Mahdavi (2017) and Prata (2017), as they state that there is an agreement with the results from the 2D and 3D programs, as well as “hand calculations” that were used. Where the authors compared the results from both 2D and 3D models, the selected thermal bridge details were “No stud or tie” and “Stud, no tie” in a wall. The use of a 3D heat flow model to analyse these specific thermal bridges is unnecessary as only 2D heat flow would occur in these areas. The details of thermal bridges, such as the junction between two walls and a floor or roof, that would cause 3D heat flow, were only analysed with the two 3D models, therefore the agreement between the results from these models is expected.
From an investigation comparing 2D static and 3D dynamic simulations, Standaert (1985) found that condensation is most likely to occur in the corners of 3D junctions, where three linear thermal bridges join to create a point thermal bridge, emphasising the importance of modelling in 3D. Standaert acknowledges that condensation or mould growth is not expected to show up in a 2D static simulation, but still concluded this type of program is sufficient.
Rather than investigating the effect of simulating in 1D on surface temperatures or heat flow, Mao and Johannesson (1997) looked into how simplifying a thermal bridge to 1D can change the amplitude and phase lag for admittance and transmittance through the building fabric. The authors compared the current structure and simplified 1D structure for a metal stud wall and a heavy concrete floor junction. Baba (2015) and Prata (2017) both discuss the investigation carried out by Mao and Johannesson (1997) and state that their conclusions suggest the presence of a thermal bridge affects the dynamic behaviour. There is no evidence of these conclusions in the paper, rather Mao and Johannesson (1997) state, for both types of thermal bridges, the amplitude and phase lag were similar. The description of the process does not detail the specific simulation program used, or how the thermal inertia of the thermal bridges was considered in any of the simulations.
A similar study by Martin et al. (2011) investigated how different methods of simplifying thermal bridges affect the phase lag and amplitude of a lightweight clay ceramic block wall. The authors compare results from two thermal bridges: a concrete pillar, which has a similar thermal inertia as the wall, and a lintel and timber blind box, which has a lower thermal inertia than the wall. The authors tested 7 methods of modelling the wall, starting from modelling the real geometry including the thermal bridge, the

741
Methods to assess the risk of condensation from thermal bridges in timber-framed houses: a systematic literature review
homogenous wall without the thermal bridge and with the LTT, a number of walls with ranging thermal conductivities and different considerations of thermal inertia, and one with redefined cut-off planes.
When modelling the wall with the concrete pillar, with the similar thermal inertia as the wall, the results were all similar apart from the method which uses LTT as it does not consider the thermal inertia of the wall or thermal bridge. The results of the wall with the timber thermal bridge, with a lower thermal inertia than the wall, were all drastically different. Contrasting to Mao and Johannesson (1997), the authors conclude simplification of thermal bridges into 1D does affect the estimation of phase lag and amplitude of heat flow. The authors also state there currently is no single hybrid method that can replicate the dynamic behaviour of all types of thermal bridges.
4. Benchmarking the risk of condensationRegardless of whether a static or dynamic tool, or a 1D or multi-dimensional tool is used to model the risk of condensation from thermal bridges, the most common benchmarking measure used is the temperature factor (fRsi). Referred to as the temperature index by Posey and Dalgliesh (2005) and the dimensionless surface temperature by Standaert (1985), the temperature factor calculates a value between 0 and 1 using Equation (1). The value of this index points to the risk of surface condensation, mould growth and corrosion of metallic surfaces. With a greater internal surface temperature, the temperature factor calculated is closer to 1 and therefore the risk is lower, and vice versa.
f = θsi −θe
Where:
Rsi θ −θ i e (1)
fRsi = temperature factor value; θsi = lowest internal surface temperature; θe = external air temperature; θi = internal air temperature.
Kalousek and Novák (2019) cite the Czech Technical Standard (ČSN) 730540 (2011) which states the following condition must be met for the risk of condensation to be considered low.
Where:
fRsi ≥ fRsi,crit + ∆fRsi (2)
fRsi = temperature factor calculated with the lowest internal surface temperature; fRsi,crit = critical temperature factor at which condensation formation will become significant; ∆fRsi = safety temperature surcharge which ranges from -0.030 to 0.045, depending on location and construction of the thermal bridge, and the type of heating system used and accounts for fluctuating outdoor temperatures.
For the condensation risk to be considered low, the calculated temperature factor needs to be greater than the critical temperature factor, but the value at which condensation becomes significant is under debate, along with the conditions under which the temperature factor should be calculated.
Mumovic et al. (2006) states the risk of condensation is low if the temperature factor is greater than 0.75, according to British Standard 5250 (2002). Standaert (1985) argues the critical temperature factor should be 0.70, determined by an article previously written by the author. Pont and Mahdavi (2017) agree with Standaert (1985) while also stating there are two other critical temperature factors to consider, retrieved from Deutsches Institut für Normung 4108-3 (2014). The German standard states corrosion of metallic surfaces occurs where the temperature factor is less than 0.88, mould growth occurs when it is

742
Griffin Cherrill, Dr Michael Donn
less than 0.70 and surface condensation occurs when it is less than 0.57. The values show that surface condensation does not need to occur for mould to grow and for metal to corrode, suggesting that surface condensation is the worst-case scenario and the limit should be set at 0.70 to stop mould growing. This is supported by ISO 13788 (2012) which states the critical RH should be set at 80%, where mould growth starts, instead of 100% where condensation forms.
Rather than prescribing a critical temperature factor for all conditions, the ČSN 730540 (2011), used by Kalousek and Novák (2019), calculates the critical temperature factor based on the following equation.
237.3 + (3.1×θi ) 1 fRsi,crit = 1− θi −θe
× 1.1−
17.269 ϕ
(3)
Where:
ln ϕ
i
si,crit
θi = internal air temperature; θe = external air temperature; φi = internal relative humidity; φsi,crit = critical internal relative humidity.
The authors then add ∆fRsi to calculate fRsi, according to Equation (2), and rearrange Equation (1) to determine the critical internal surface temperature.
Where:
θsi,crit = θi − (1− fRsi )(θi −θe ) (4)
θsi,crit = critical internal surface temperature; fRsi = temperature factor; θi = internal air temperature; θe
= external air temperature. Baran et al. (2017) discusses the factors needed to assess the risk of condensation. The authors state
the following conditions need to be met to avoid internal surface condensation forming. The first condition considers internal temperature and dew point, whereas the second condition considers the internal RH.
Where:
θsi > θr
ϕi > ϕsi,crit
(5)
(6)
θsi = lowest internal surface temperature; θr = dew point; φi = internal relative humidity; φsi,crit = critical internal relative humidity.
The first condition assumes that the dew point is the critical internal surface temperature which is the minimum temperature that the surface should not drop below if condensation formation is to be avoided. For the conditions discussed by Kalousek and Novák (2019) with an internal temperature of 20°C and a RH of 50%, the dew point is calculated as 9.27°C. The equation the authors used to calculate the critical temperature factor requires the critical surface RH to be defined. Instead of using a φsi,crit of 100%, which would assess the risk of surface condensation forming, ČSN 730540 (2011) recommends using 80% to assess when mould starts to grow on the surface. For this reason, the authors calculate the critical internal surface temperature as 11.04°C, rather than using the dew point of 9.27°C.
Of the 5 thermal bridges analysed in the paper written by Kalousek and Novák, 2 details were identified as condensation risks because the internal surface temperature falls below the 11.04°C minimum. The

743
Methods to assess the risk of condensation from thermal bridges in timber-framed houses: a systematic literature review
temperature does not drop below the dew point, suggesting the dew point may not be a suitable value to assess condensation risk and that internal moisture could still be an issue with temperatures above the dew point. This supports the temperature factor values given by Pont and Mahdavi (2017), where surface condensation is not the real risk, rather they suggest mould growth and corrosion of metallic surfaces should be considered as the limit first.
Mumovic et al. (2006) use Equation (6) from Baran et al. (2017) as the criteria to assess the risk of internal moisture. The authors calculate the amount of time a surface has a RH greater than 80%, as several hours under these conditions can lead to mould growth. Baran et al. (2017) use an equation to calculate the critical RH for surface condensation and mould growth rather than specifically using 80% as the threshold. The equations show that the critical RH for mould growth is 0.80 of the critical RH for surface condensation. This aligns with the threshold used by Mumovic et al. (2006), as according to Equation (5), Baran et al. (2017) assume surface condensation occurs when the internal surface temperature drops below the dew point where RH would be 100%.
5. ConclusionsTo produce the most precise results, the general consensus from the literature is to use a tool that can dynamically simulate in all three dimensions as this is the most detailed and will likely reflect reality best. The simplistic equivalent U-value method built into Clause E3 of the New Zealand Building Code does not deal explicitly with the dynamic issue or the multi-dimensional issue which are discussed as the important factors in the literature.
Dynamic simulations are able to account for the effect on amplitude and phase lag from thermal inertia, although the magnitude of this effect is under debate. The effect is dependent on the material of the thermal bridge and opaque wall, with one author suggesting the effect of lightweight timber thermal bridges is negligible. Regardless, when static simulations are used, heat flow is assumed to be instantaneous which results in an apparent risk of condensation.
The use of 1D simulations does not allow for local surface temperatures surrounding thermal bridges to be assessed and has been shown to underestimate the heat flow and energy demand significantly. When comparing calculated internal surface temperatures from 2D and 3D simulations, the difference could result in the risk of condensation being overlooked in 2D.
The equivalent U-value method, as in Clause E3 of the NZBC, does not consider the material properties or thermal inertia of thermal bridges which can result in an overestimation of heat flow, but it also simulates in 1D which can result in an underestimation of heat flow. This results in two competing factors which are possibly compensating for each other in an uncontrolled manner. This carries its own risks as the relative magnitude of the two competing factors are unknown and likely to vary when used in different situations, for example, higher performance walls and complex 3D junctions. Although LTT is calculated in 2D, it is still simulated under static conditions and was only found to be applicable to a limited number of situations due to its inability to consider material properties and thermal inertia. When the thermal resistance of the insulation is increased, the proportion of heat lost through the thermal bridges increases. This makes the importance of accurately assessing heat flow through thermal bridges with these simplistic methods more critical.
The findings from the literature suggest there is a trend where the reliability of results increases as the complexity of the model increases. The problem that this indicates is that to design with this level of complexity, the modeller requires a level of expertise unlikely to be found in construction design offices.

744
Griffin Cherrill, Dr Michael Donn
These offices need a tool that is ‘good enough’ to produce sufficiently accurate results when predicting condensation risk. The literature review identified the important factors which can improve the accuracy of simulations but there is no confirmed recommendation about which tool is the best for designers to use. Further research needs to be conducted to investigate the impact of not taking these factors into account and therefore determine how complex a tool needs to be to maintain accuracy of results, ease of use and reduce computing time.
6. ReferencesAlhawari, A. & Mukhopadhyaya, P., 2018. Thermal bridges in building envelopes – An overview of impacts and
solutions. International Review of Applied Sciences and Engineering, 9(1), pp. 31-40. Ascione, F., Bianco, N., de’ Rossi, F., Turni, G. & Vanoli, G. P., 2012. Different methods for the modelling of thermal
bridges into energy simulation programs: Comparisons of accuracy for flat heterogeneous roofs in Italian climates. Applied Energy, Volume 97, pp. 405-418.
Baba, F., 2015. Dynamic Effect of Thermal Bridges on the Energy Performance of Residential Buildings, Concordia University, Montréal.
Baran, I., Georgescu, M. S., Dumitrescu, L., Bliuc, I. & Pescaru, R. A., 2017. The Surface Temperature Factor - An Assessment Criterion of Superficial Condensation Risk. Advanced Engineering Forum, 1 March, Volume 21, pp. 497-505.
Boland, A., Cherry, M. G. & Dickson, R., 2013. Doing a Systematic Review: A Student’s Guide. 1st ed. Thousand Oaks: SAGE Publications Ltd.
Gao, Y., Roux, J. J., Zhao, L. & Jiang, Y., 2008. Dynamical Building Simulation: A Low Order Model for Thermal Bridges Losses. Energy and Buildings, 40(12), pp. 2236-2243.
Kalamees, T., 2006. Critical values for the temperature factor to assess thermal bridges. Tallinn, Estonian Academy Publishers, pp. 218-229.
Kalousek, M. & Novák, M., 2019. The Assessment of Construction Details in Terms of 3D Thermal Fields and the Impact on Building Design. Bristol, Institute of Physics Publishing.
Mao, G. & Johannesson, G., 1997. Dynamic calculation of thermal bridges. Energy and Buildings, Volume 26, pp. 233- 240.
Martin, K., Erkoreka, A., Flores, I., Odriozola, M. & Sala, J. M., 2011. Problems in the calculation of thermal bridges in dynamic conditions. Energy and Buildings, 43(2), pp. 529-535.
Martin, K., Escudero, C., Erkoreka, A., Flores, I. & Sala, J. M., 2012. Equivalent wall method for dynamic characterisation of thermal bridges. Energy and Buildings, Volume 55, pp. 704-714.
Mumovic, D., Ridley, I., Oreszczyn, T. & Davies, M., 2006. Condensation risk: comparison of steady-state and transient methods. Building Services Engineering Research & Technology, 27(3), pp. 219-233.
Pont, U. & Mahdavi, A., 2017. A Comparison of the Performance of Two-and Three-Dimensional Thermal Bridge Assessment for Typical Construction Joints. Bozen-Bolzano, Italy, Bozen-Bolzano University Press, pp. 367-374.
Posey, J. B. & Dalgliesh, W. A., 2005. Thermal bridges - heat flow models with Heat2, Heat3, and a general purpose 3- D solver. Ottawa, National Building Envelope Council of Canada.
Prata, J., 2017. Dynamic Behaviour of Linear and Point Thermal Bridges of Buildings - Numerical and Experimental Simulations, University of Coimbra, Coimbra.
Quinten, J. & Feldheim, V., 2019. Mixed equivalent wall method for dynamic modelling of thermal bridges: Application to 2-D details of building envelope. Energy and Buildings, Volume 183, pp. 697-712.
Standaert, P., 1985. Thermal bridges: a two-dimensional and three-dimensional transient thermal analysis. Clearwater Beach, U.S. Department of Energy, pp. 315-328.
Troppová, E., Klepárník, J. & Tippner, J., 2016. Thermal bridges in a prefabricated wooden house: comparison between evaluation methods. Wood Material Science & Engineering, 11(5), pp. 305-311.

745
The 54th International Conference of the Architectural Science Association (ANZAScA) 2020
Mid-Rise Mass Timber in the Contemporary Workplace
Shannon Bridget Griffiths1, Michael Donn2, Joanna Merwood-Salisbury3 and Marc Woodbury4 1, 2,3 Victoria University of Wellington, Wellington, New Zealand
{griffishan1, michael.donn2, joanna.merwood-salisbury3}@vuw.ac.nz 4 Studio Pacific Architecture, Wellington, New Zealand
Abstract: Mass timber construction, although an alternative construction method currently, is in the beginnings of a resurgence. Quick to erect, prefabrication friendly, light weight and sustainable – timber is an attractive material for urban construction. Presently, the body of knowledge on timber design is highly focused on technology, leaving absent from the discussion the spatial, functional or architectural implications of timber structures. While timber products are used extensively for low rise housing in New Zealand, little success has been found in the mid-rise market and even less so in the commercial sector. This research seeks to develop the interaction between timber structure and workplace planning at a mid- rise scale, suggesting ways mass timber, as a unique architectural language, can change future workplace design. Drawing on existing literature and the graphic analysis of a series of conceptual and new build precedent studies, it critiques and extracts key concepts of both workplace and mass timber design. Reflecting on current workplace models, we suggest that future mass timber construction offers potential, utilising its inherent properties, rather than as a simple substitute for steel and concrete.
Keywords: Mid-rise mass timber; commercial architecture; workplace design.
1. IntroductionMass timber structures for medium to large scale non-residential buildings are becoming increasingly popular. Most such structures imitate their steel and concrete predecessors, using post and beam frame techniques to resist loads and form the architectural resolution of the building. These timber frames do not exploit the inherent structural and material properties of timber and to the detriment of the interior, adhere to historical notions of open floor plate spatial planning. This paper explores the proposition that buildings which utilise the inherent material properties of timber will have a radically different architectural expression, and this will likely affect the planning and construction at all scales of building; from the detailing, to the interior layout and beyond to the urban connection. This paper explores this in the context of office buildings, questioning the feasibility and potential of timber for the kinds of flexible or open planning required for commercial viability.
Imaginable Futures: Design Thinking, and the Scientific Method. 54th International Conference of the Architectural Science Association 2020, Ali Ghaffarianhoseini, et al (eds), pp. 745–754. © 2020 and published by the Architectural Science Association (ANZAScA).

746
Shannon Bridget Griffiths, Michael Donn, Joanna Merwood-Salisbury and Marc Woodbury
1.1. Scope
A preliminary literature review explains the historic relationship between innovative building structures and new forms of office planning in the modern period. The main focus of the paper is a series of precedent reviews of both international and significant Pacific mid-rise mass timber office buildings. Utilising the authors’ graphical analysis of the plan and overall structural/architectural resolution, conclusions drawn from this analysis are used to reflect on current design trends, with the expectation that inferences drawn may be directly applied to future mid-rise mass timber office buildings in the urban context of New Zealand.
2. Office Planning – Historical to ContemporaryThe modern office has seen a variety of interior planning solutions since the early twentieth century, from the International Style to the more recent uptake of Activity Based Working environments. These shifts in interior solutions correlate to shifts in architectural technologies, where technological advancements have enabled fundamental change in workplace planning. We suggest that the workplace is on the brink of another significant change, one that timber as a unique architectural language can enable.
2.1 The International Style and the Open Plan Office
Skyscrapers, corporate monoliths of the past, make up our cities. The urban fabric is defined by tall glass boxes rising up from the flat landscape in which they were imposed. These structures are an example of the International Style. Developed during the early decades of the 20th century and canonised in the 1950’s, the International Style represented both architectural modernism and the globalisation of corporate culture (Flowers, 2009, p. 90-104).
It was through the advent of technology that these buildings became the international benchmark. Once steel frames eliminated the need for load bearing external walls, curtain glass skins became viable facades. The development of air-conditioning and later the fluorescent tube and suspended ceiling marked a significant turning point in the office, where the office became “fully autonomous from the exterior environment” (Mozas, 2017, p. 18). There was no longer a need to place employees close to the perimeter where they might get a glimpse of natural light and open a window for fresh air: the suspended ceiling housed all these functions and fluorescent lighting illuminated all.
Lever House (1952) by SOM and The Seagram Building (1958) by Mies van der Rohe, both in New York, proved popular not only for their sleek modernist exteriors, but also for their thoroughly designed, open- plan interiors. Both buildings were technical and architectural successes, but there was danger hidden in this success. As Lewis Mumford wrote in discussion of Lever House, “if its planning innovations prove sound, it may become one unit in a repeating pattern…” (Mumford, 1952, p. 35). This is where we find ourselves today: surrounded by an endless repetition of the pure functionalist structures of the past. The office building has become a “simple, neutral technology, endlessly reproducible” (Saval, 2014, p. 138).
2.2 Questioning the Open Plan: Activity Based Working
Whilst the International Style office building was being canonised across the world as the typology of the future, the interior of these office buildings were also being reconsidered. Modernist technologies allowed for large, open-plan floor plates but space planning was not necessarily well considered and office

747
Mid-Rise Mass Timber in the Contemporary Workplace
interiors still tended toward historical notions of organisational hierarchies. From the 1960s, the tenets of modernism and the unquestionable International Style came under attack – modernism was critiqued as “antihuman”, ignoring human psychology to impose a single method and aesthetic of design (Saval, 2014, p. 230).
Since the 1960s, a number of design responses have been produced, born out of dissatisfaction with the open plan office, from the Office Landscape (Bürolandschaft) by the Schnelle brothers to the Action Office by Robert Propst, and more recently, ‘Activity Based Working’ (ABW). This term describes a method of working which is agile and flexible. It describes a working culture which values choice, mobility, communication, collaboration and the elimination of hierarchy (Skogland, 2016, p. 63). Generally defined as a transformative business and workplace design strategy, the ABW environment encourages employees to recognise that “different work activities can be better supported by spaces and features designed specifically for that task” (Leesman, 2017, p.6). It facilitates diverse activities ranging from confidential, enclosed individual work to highly collaborative, open group work. This concept is a reaction to the rigidity and repetition of the modernist International Style office.
Figure 1. Plan diagrams with overlayed visual analysis of the proportion of individual to group work, circulation and fully enclosed space in Kirshenbaum & Partners West, Sedgwick Rd, PricewaterHouse
Coopers and EMI London Headquarters. (Source: Author, 2020.)

748
Shannon Bridget Griffiths, Michael Donn, Joanna Merwood-Salisbury and Marc Woodbury
However, like the Office Landscape and the Action Office, ABW still operates within the same basic framework. Figure 1 analyses the floor plans of four mid-rise office buildings presented in Myerson & Ross (2006). Visual analysis of the overall planning solutions is overlayed to uncover the strategies used within the architecture to create a contemporary work environment. These case study international buildings are of a representative size and scale to be applicable to a mid-rise typology in a New Zealand urban environment. The BRANZ BEES study (2014) established that 20% of the total floor space in New Zealand comprises buildings between 3,500m2 and 9000m2 total floor area. A further 20% of the total floor area is made up of buildings over 9000m2. These analysed buildings range from 2,000 to 12,000m2 in area. The interior resolution of these buildings is resolutely tied to the large, regular, open grid of steel and concrete. Stripped of architectural quality and meaning, the interior relies exclusively on partition walls and unique furniture systems to supply the differing spaces required for a successful ABW environment. A high degree of undefined circulation space and little variation in planning arrangements creates a homogenous working environment, where the structure contributes little to the architectural image of the building. This inevitably leads to resistance in the uptake of this new mode of working, with the more commonly cited issues in open plan environments such as a “lack of privacy” and “too much visual and auditory distraction” leading to a lack of engagement with mobility and flexible work processes (van Meel, 2019; Leesman, 2017; Rolfö et al., 2018). Fully enclosed spaces are still clearly desired in the workplace to create this privacy. For the buildings in Figure 1 50% (on average) of the total workspace is enclosed. The prevalence of these walls begs the question, could they be more permanent fixtures and contribute directly to the architectural language of the office?
This disconnect between the structure and planning suggests that the architecture of commercial buildings might better facilitate a meaningful variation in spaces that is distinct from simple furniture systems and superficial aesthetics. The use of mass timber, a unique material with its own tectonic language, is one way we suggest to challenge the future of commercial architecture, in particular workplace design.
3. Mid-Rise Massive Timber TechnologyMassive timber technology, in the context of mid to high rise structures, is a rapidly evolving field. “As trees are harvested from forests, humankind seeks to reformulate or re-engineer wood to fulfil a new purpose” (Mayo, 2015, p. 9), new methods of engineering, jointing and manufacturing are all developed to realise the architectural intent of a building. Popular mass timber products currently utilised in the New Zealand context include; Cross Laminated Timber (CLT), where layers of timber are glued perpendicular to one another to create panels; Laminated Veneer Lumber (LVL), where thin veneers of timber are glued in parallel to create billets; and Glue-Laminated Timber (Glulam), where layers of timber are glued again in parallel to typically create long span beams.
Timber is fundamentally a natural material, one that is grown, cut and glued. Not formed or welded like steel and concrete. As such it is a material with defects, properties that are not inherently advantageous to engineers and designers alike. And while engineered timber products have been proven to be a comparatively light weight and sustainable choice, it is difficult to view the tensile and compressive strength as exact replacements for more traditional mid to high rise materials like steel and concrete. Nevertheless, timber is an incredibly strong material when forces are applied perpendicular to the grain (Buchanan, 2007, p. 28) and “its high strength to weight ratio renders it an excellent choice for load-

749
Mid-Rise Mass Timber in the Contemporary Workplace
bearing columns and walls” (FPInnovations, 2013, p. 121). As such, CLT shear walls and massive LVL or Glulam columns and beams are sensible and useable features of timber design. However, these members will be significantly larger than their steel and concrete counterparts; for example, timber beams of the same depth can span only 65% of the distance of steel or concrete beams (Marriage, 2020, p. 82). In terms of lateral design, an especially critical aspect of the overall design solution for seismically active New Zealand, timber products are typically utilised in a hybridised manner with steel plates and/or screws to provide ductility and shear capacity. While timber cannot typically be the sole lateral resistance system in mid to high rise buildings, the main advantage timber has over traditional materials in this capacity is its low weight, and therefore lower seismic load (FPInnovations, 2013, p. 123). This reduces the load imposed on the foundations and can make timber buildings more suitable for poorer soil conditions and generally makes foundations less laborious and expensive to construct.
So, what are the major difficulties in timber design? Or, what is preventing wider scale adoption? In one word, connections. “The whole structural system is no stronger than its weakest link” (Buchanan, 2007, p. 141), and for timber, designing and detailing the connections is inherently the most difficult part ingetting any project into the real world. Mass timber elements perform well, they are strong and stiff buthave little to no capacity to provide deformation, drift and ductility at their joints without complicatedsteel substitutes. And with this, material incompatibility becomes a significant engineering andarchitectural issue. Steel elements have a much lower fire capacity, while massive timber will char andretain its internal structural integrity, poorly designed and unprotected steel quickly turns plastic, deforms and fails (Mayo, 2015, p. 37). Architecturally, the intersection of elements can become an expensive andlaborious detail, or conversely simple methods of fixing (such as nailed steel plates) leave much to bedesired in terms of aesthetic and tectonic qualities.
4. Timber PrecedentsFour mid-rise precedents were analysed as representative examples of typical solutions or approaches to mass timber design in the Pacific, from mixed structural solutions to pure timber wall design. The method of analysis was to strip the buildings back to structure and façade, the resulting axonometric diagrams analyse (Figure 2) the spatial qualities and logic of the architecture. Where, structure is “the regulating logic of the internal organisation… a material system complicit in the expression of the architectural concept” (Kuo, 2013, p. 90). Whether hidden or celebrated, structure is integral to the office typology and interrupts the interior planning. The skin is analysed in terms of the interior’s relationship to the external environment or urban context, how the building is contained on its sides and the placement of glass or solid materials in relation to this.
4.1 Post and Beam Structure
Post and beam construction solutions tend to be the accepted tectonic strategy for office buildings; they allow for open, large floor plates with free planning. Importantly, they are commercially exploitable as a ‘non architecture’ that can be endlessly adapted internally to accommodate any tenant or even change of use. The conservative, risk averse nature of the construction industry does not often encourage innovation (Fleming et al., 2014, p. 23). Buildings utilising a new material mimic their predecessors; “it is easier to promote a new and perhaps untrusted structural material or technique in reference to the status quo, showing that it can simply replace the old material” (Fleming et al., 2014, p. 23). But, this trend of

750
Shannon Bridget Griffiths, Michael Donn, Joanna Merwood-Salisbury and Marc Woodbury
design thinking brings mass timber to the conversation about material selection rather than as a fundamental rethink of architectural design. Mass timber is utilised as a simple, but less efficient, substitute for concrete or steel.
Figure 2: Axonometric diagrams analysing the structural solution of 149 Featherston Street and International House. (Source: Author, 2020.)
Figure 2 analyses the structural resolution of two Pacific based precedents, 149 Featherston Street and International House respectively. 149 Featherston Street conceptually was intended to be one of New Zealand’s first timber high-rise structures, demonstrating the cutting edge of engineering and architectural design. It features timber post and beam gravity only structure, with a reinforced concrete core providing the lateral strength of the building. International House is a representative precedent of the popular trends in Australia in terms of commercial mass timber design. Designed for Lendlease, this building was the “first modern commercial engineered timber building of its size and type in Australia at the time of completion” (TZANNES, 2020). The structural design of the building lends itself towards a particular architectural form, an asymmetric core with a 2-way CLT floor diaphragm braced on the exterior with timber frames and sitting on a concrete ground floor podium. A similarly executed design solution can be seen in 25 King Street, Brisbane (2018).
Both of these precedents attempt to utilise timber as a material and structural solution whilst also achieving an open floor plate. The size of the timber members needed to achieve this desirable openness is very large. In International House 1200mm deep beams run in one direction from the core to the braced perimeter of the building, all connections are fully concealed and there is no implicit material or tectonic language that could be defined as unique or typological of timber design. 149 Featherston Street conversely achieves relatively slim (600mm deep) timber members, by virtue of its comparatively small allotment, but relies heavily on its concrete core to compensate for what timber alone cannot provide, notably lateral stability. The issues surrounding lateral loading design, whether this is primarily for earthquakes in New Zealand or wind loading in Australia, leads to mixed structural systems in post and beam construction and a reliance on concrete cores, podiums and inefficient timber bracing. This leads to

751
Mid-Rise Mass Timber in the Contemporary Workplace
not only a high degree of structural complexity, but also material incompatibility. The interaction of these different materials is critical for the overall stability of the building and the reliance on highly engineered joints is a notable weakness of mixed system design. Is this an efficient, or even architecturally appropriate use of mass timber? Post and beam construction forces timber to impersonate the tectonic language of traditional material systems. This structural rationalism that dominates mass timber construction is detrimental not only to its wider adoption but also to its growth as a unique material with unique tectonic properties. After all, why build the imitation if the original is easier and better understood?
4.2 Wall Structure
Mid-rise mass timber residential buildings have seen a large uptake in the construction market. The comparatively simple, typically modular, architectural strategies lend themselves to current panelised timber technologies. Wall orientated structural solutions, we suggest, demonstrate the primary tectonic language of mass timber. “New technologies manifest themselves as typologies of use” (Kuzmanovska et al., 2018, p. 9). As such this wall technology has almost exclusively supported residential development. But, can the same methodology also be applied to commercial developments? Can mass timber can be effectively and efficiently used as both a structural system and architectural language?
Figure 3: Axonometric diagrams analysing the structural solution of the Forte Apartments and the Scion Innovation Centre. (Source: Author, 2020.)
Figure 3 analyses the structural resolution of the Forte Apartments and Studio Pacific Architecture’s competition proposal for the Scion Innovation Centre respectively. The Forte Apartments located in Melbourne is one of the most commonly cited mass timber buildings in the Pacific region. It was, at the time of conception, the tallest (32.2m) CLT building in the world and is a showpiece of modern mass timber construction. The structural design is tied inherently to the architecture of the building, where all walls are structural, leading to a ‘honey-comb’ or ‘house of cards’ resolution. Like International House, it features a concrete podium to support a retail ground level. The Scion Innovation Centre, although a low- rise concept design, is one of the few examples of a mass timber walled structure proposed in a commercial development. It features three-dimensionally folded walls that are the gravity, lateral and architectural resolution of the building. This precedent utilises a novel engineering solution to create the image of the building and a unique interior planning solution. This wall solution stemmed from a desire

752
Shannon Bridget Griffiths, Michael Donn, Joanna Merwood-Salisbury and Marc Woodbury
to move away from using timber as a substitute for steel or concrete; “the design has not adopted a material technology but rather looked to adopt the inherent properties of wood” (Studio Pacific Architecture, 2018).
Commonly, walled mass timber buildings utilise a ‘house of cards’ structural solution, wherein most exterior and interior walls are the gravity and lateral structure of the building. This is a simple and effective solution as it minimises jointing difficulty. The most common jointing method is simple steel angle brackets connecting vertical walls to the horizontal floor slabs as seen in the Forte Apartments. It also simplifies the overall engineering of the building, because there is little room for incompatibility between different structural elements and materials. This method of construction also allows for a higher degree of prefabrication and modulation, structural elements or even whole rooms are manufactured off site and simply craned in place.
Does this widespread use of panelised mass timber structure suggest an inherent tectonic language? Or, a structural method that produces the architectural quality of mass timber buildings. It suggests a significantly smaller grid size and more cellular approach to the architectural planning than is typically seen in steel and concrete office buildings. Instead of the standard approach to office design, where the floor plate is largely structure-less, the use of mass timber suggests a higher degree of structural interdependence. This is not inherently a disadvantage; the structure could instead define a new interior. Instead of an overreliance on partition walls, mass timber office architecture could instead seek to utilise the likely cellular nature of the structure to suggest occupation and use, to break up the monotony and homogeneity of the generic open plan office. The deliberate and considered placing of wall elements in the plan could provide a series of unique and differing environments, with their own inherent character, to facilitate the diverse activities that take place in the office. Moving away from the superficial to the architectural, mass timber walls suggest a new interior that may alleviate issues currently facing the uptake of ABW in the office.
While walls can be utilised in a diverse manner to create interesting spaces in the plan, an interior solution that works well in the context of the office does not necessarily lend itself to good ground floor conditions. Many commercial buildings must also provide an open ground floor for retail tenancy, the use of many continuous shear wall elements is therefore typically terminated at ground floor and instead a concrete podium provides the necessary open plan for commercial viability. This is demonstrated in both International House and the Forte Apartments. This is a noticeable flaw in the wall structural solution, not only in terms of engineering complexity but also architectural resolution. Mass timber architecture needs to engage critically with both the office and the ground floor connection, perhaps seeking a middle ground between creating a varied spatial plan and still providing relative ‘openness’ required for commercial viability. What is clear is that there must be implicit architectural intent behind any wall placement, creating a meaningful relationship between the occupant and the structure.
4.3 Skin, External Expression and the Urban Context
As contemporary mass timber buildings are currently in their infancy, they must fulfil other functions not typically required of the office typology. Incorporating urban contributions, monumentality and presenting the image of sustainability through exposed elements, as seen in all aforementioned

753
Mid-Rise Mass Timber in the Contemporary Workplace
precedents, are all methods by which mass timber buildings are seeking to prove themselves in the commercial marketplace. The skin in particular is one of the principal mediators between the architecture and its urban context.
Figure 4: Axonometric diagrams analysing the skin solutions of 149 Featherston Street, International House, the Forte Apartments the the Scion Innovation Centre. (Source: Author, 2020.)
Figure 4 analyses the selected precedents’ skins. All three commercial precedents utilise a non-structural curtain glass wall around all street facing facades, as is typical of an office building typology. Notably, the intentional expression of the timber is represented on the skin through the placement and division of the mullion and transom elements. The transparency of the skin allowing the pedestrian to glimpse the timber structure inside. The Forte Apartments conversely utilises punched windows with a metal cladding system protecting the external walls from moisture. Again, this is typical of the typology, the concealed nature of the wall not notably differing from typical approaches to concrete shear walls. There is an uneasy tension between the essential duplication of walls.
These buildings all utilise the façade language typical of steel and concrete buildings, posing the question; is there a façade language that is more expressive of timber as a material? What this means has not been fully explored as of yet. There is certainly an opportunity for more expressive facades that speak clearly to the structural solution, to create a clear link between the interior and urban context. Whether this is explored through utilising fully exposed timber elements, timber curtain wall systems or simply more expressive modulation, mass timber buildings could seek more meaningful and playful responses to the necessities of natural light and weather protection to create a connection to the urban context.
5. ConclusionCurrently in mass timber mid-rise commercial buildings, the inherent properties of timber as a material are not being fully explored. Structural timber is being used as a simple replacement, to impersonate the tectonic language of more traditional material systems to the disadvantage of its wider adoption and growth as a unique material with unique tectonic properties. This mimicking of more traditional modes of construction is apparently motivated by a desire to follow the presumption that commercial architecture must be an ‘empty’ architecture, an endless open floor plate with no inherent character or

754
Shannon Bridget Griffiths, Michael Donn, Joanna Merwood-Salisbury and Marc Woodbury
quality, to be commercially viable. With the recent uptake of Activity Based Working concepts, concepts that require a diverse range of spaces to facilitate work activities, mass timber architecture has an opportunity not only to provide these spaces, but also to challenge how we conceive the planning, urban connection and façade expression of commercial architecture. Moving beyond the aesthetic use of timber in the workplace, structural mass timber suggests an architecture with a smaller grid spacing, a higher degree of structural interference and a more modular approach, and thus an entirely different internal planning and external expression to the typical office building. This interaction between the office as a typology and the properties of mass timber has not yet been developed. Mass timber commercial architecture needs to define itself in the marketplace as a viable solution, one that is not only structurally rational but also architecturally meaningful.
Acknowledgments This research is funded by the BRANZ Building Research Levy.
References BRANZ. (2014). SR297/1 Building Energy End-use Study Part 1: Final Report. Available at:
https://www.branz.co.nz/pubs/research-reports/sr29711/ Buchanan, A. (2007) Timber Design Guide, New Zealand Timber Industry Federation Inc, Wellington. Fleming, P., Smith, S., & Ramage, M. (2014) Measuring-Up in Timber: A Critical Perspective on Mid and High Rise
Timber Building Design. Architectural Research Quarterly, 18(1), 20-30. Flowers, B. (2009) Skyscraper: The Politics and Power of Building in New York City in the Twentieth Century,
University of Pennsylvania Press, Philadelphia. FPInnovations. (2013) Technical Guide for the Design and Construction of Tall Wood Buildings in Canada,
FPInnovations, Quebec. Kuo, J. (2013) A-Typical Plan - Projects and Essays on Identity, Flexibility and Atmosphere in the Office Building, Park
Books, Zurich. Kuzmanovska, I., Gasparri, E., Tapias Monne, D., & Aitchison, M. (2018) Tall Timber Buildings – Emerging Trends and
Typologies, 2018 World Conference on Timber Engineering, August 20-23. Leesman. (2017) The Rise and Rise of Activity Based Working, Leesman, London. Marriage, G. (2020) Tall - The Design and Construction of High-Rise Architecture, Routledge, London. Mayo, J. (2015) Solid Wood - Case Studies in Mass Timber Architecture, Routledge, London. van Meel, J. (2019) Activity Based Working – The Purenet Practice Guide, Purenet. Mozas, J. (2017) The Office on the Grass - Evolution of the Workplace, A+T Architecture. Mumford, L. (1952) House of Glass, New Yorker, August 8. Myerson, J., & Ross, P. (2006) Radical Office Design, Laurence King Publishing Ltd, New York. Rolfö, L., Eklund, J., & Jahncke, H. (2018) Perceptions of Performance and Satisfaction after Relocation to an Activity
Based Office. Ergonomics, 61(5), 644-657. Saval, N. (2014) Cubed - A Secret History of the Workplace, Doubleday, New York. Skogland, M. (2016) The Mind Set of Activity-Based Working. Department of Architectural Design and Management,
62-75.Studio Pacific Architecture. (2018). Scion Innovation Centre, Wellington. TZANNES. (2020) International House Sydney. Available at: https://tzannes.com.au/projects/international-house/
[Accessed April 2020].

755
The 54th International Conference of the Architectural Science Association (ANZAScA) 2020
Modelling biogenic and anthropogenic carbon dioxide exchange in urban area - a data fusion approach
Peiyuan Li1 and Zhi-Hua Wang2
1, 2 Arizona State University, Tempe, U.S.A peiyuanl1, [email protected]
Abstract: Much effort of carbon dioxide (CO2) mitigation as the countermeasure to global changes has focused on the urban areas – the hotspots of fossil fuel and concentrated emission and pollutants. Despite their critical role in CO2 exchange in urban ecosystem, emission sources from vegetation and soil surfaces are largely overlooked in existing urban land surface models. In this study, we parameterized the biogenic CO2 exchange in cities using an advanced single-layer urban canopy model, by incorporating a plant physiological model in the built environment. In addition, the proposed model also includes the anthropogenic CO2 fluxes especially that from traffic emissions, based on gridded dataset. We evaluate the proposed model using CO2 measurements from an eddy covariance flux tower located at west Phoenix, Arizona, USA. The model results are in good agreement with the observed carbon flux over the built terrain, with a RMSE of 0.21 mg m-2s-1. Furthermore, our simulations show that the abiotic traffic-emitted CO2 amounts the largest source in cities, as expected. Nevertheless, the biogenic carbon exchange can be significantly enhanced in the built environment, which makes an equally important contributor to the total carbon emission especially in sub-urban areas.
Keywords: Anthropogenic sources; Plant physiology; Urban canopy model; CO2 exchange.
1. IntroductionUrban land surface models (LSMs) have undergone continuous development from a simple urban energetic models (Masson, 2000; Kusaka et al., 2001), to incorporate momentum transport (Martilli et al., 2002), urban hydrological processes (Wang et al., 2013), and anthropogenic heat (Sailor and Lu, 2004; Sailor, 2011). In particular, urban LSMs have gradually included parameterization schemes of urban vegetation with increasing complexity, like green roofs (Yang and Wang, 2014), urban trees (Upreti et al., 2017), and urban irrigation (Wang et al., 2019). These new schemes significantly enhanced the model predictive skills over realistic built terrains, furnishing further improvement of urban LSMs for capturing biogenic and anthropogenic carbon emission in urban areas (Song et al., 2017).
In addition to the pronounced urban heat island (UHI) effect, cities are also hotspots of greenhouse gas (GHG) emission, especially CO2, with concentrated sources and human activities (Hutyra et al., 2014). In particular, anthropogenic CO2 (AnCO2), primarily emitted from the fossil fuel combustion, constitutes the largest flux of CO2 to the atmosphere and represents the dominant source of GHG
Imaginable Futures: Design Thinking, and the Scientific Method. 54th International Conference of the Architectural Science Association 2020, Ali Ghaffarianhoseini, et al (eds), pp. 755–764. © 2020 and published by the Architectural Science Association (ANZAScA).

756
Peiyuan Li and Zhi-Hua Wang
forcing to emergent climate patterns (Gurney, 2014). AnCO2 emissions are often used as a near-certain boundary conditions when solving for total carbon budget, which is essential to improve our fundamental understanding of the feedback mechanisms between the carbon cycle and climate changes (Vetter et al., 2008). Accurate quantification of the urban CO2 emission, either biogenic or anthropo- genic in source, requires the integration of observational, mechanistic, and modelling methods at fine resolutions (Gurney, 2014).
By combining the advantages of “bottom-up” inventory data by sectors and the “top-down” spatial distributed dataset from remote sensing imagery (Sailor and Lu, 2004), the CO2 mapping technology today can represent the efflux estimation over space and time with wide coverage (global or continental scale), high spatial resolution (1~10km) and reliable with cross validations. However, the mapping of biogenic CO2 release or uptake is usually missing in the built environment, mainly due to the complex flow field and dynamics of transport in the built environment (Fernando, 2010). Up to date, the biogenic sources of CO2 emission is largely under explored as compared to the AnCO2 counterpart, especially in residential areas with substantial fraction of vegetation cover. This inadequacy of capturing CO2 emission by plant physiological functions in urban areas, in turn, surfaces in the net ecosystem exchange (NEE) gridded data, leading to large uncertainties and degraded data quality (Macknick, 2011).
Recently, a pioneering work has been conducted for numerical CO2 flux modelling at the street scale (Goret et al., 2019). The model was tested over a heavily urbanized city centre (90% impervious surface), and showed urban vegetation played a minimum role in CO2 exchange (less than 3%) due to the small vegetation fraction in city core. While the model performance is good, the limited representation of biogenic CO2 emission constrains its applications to highly impervious areas. In contrast, nearly half of the urban land in the U.S. attributes to residential use, where the vegetation fraction is significantly higher than it in urban cores (USDA, 2017), with the presence of urban vegetation in the forms of urban parks, golf courses, and most importantly, maintained urban gardens. It is therefore critical for urban LSMs to capture plant responses to elevated temperature, CO2 level, irrigation, and active lawn management.
The continuous development of urban LSMs, gridded anthropogenic emission data products, and plant physiological modelling techniques, hitherto in parallel lines, provides the possibility for the modelling of CO2 exchange in urban areas. With the tools and datasets readily available, the development of holistic urban CO2 modelling framework becomes increasingly imperative. This study aims to bridge the research gap, in which we first disentangle the relative contribution to urban carbon fluxes from each component (anthropogenic, biogenic, soil), and then integrate various contributors. The proposed model is evaluated against year-long eddy covariance (EC) measurements of urban carbon flux, located in a residential built environment in west Phoenix, Arizona, USA with hourly data sampling.
2. Model description
2.1. Urban canopy modelling
Among existing urban LSMs, the single-layer urban canopy models (UCMs) are probably the most widely used. They are particularly attractive to researchers for maintaining a fine balance between the numerical simplicity (i.e. urban canyon representation) and the comprehensiveness of land surface dynamics. Despite its comparative simplicity to more sophisticated LSMs, single-layer UCMs have tractable parameter sensitivity (Wang et a., 2011) and often give satisfactory performance with the same level of model calibration (Grimmond et al., 2010, 2011). These UCMs have been incorporated into
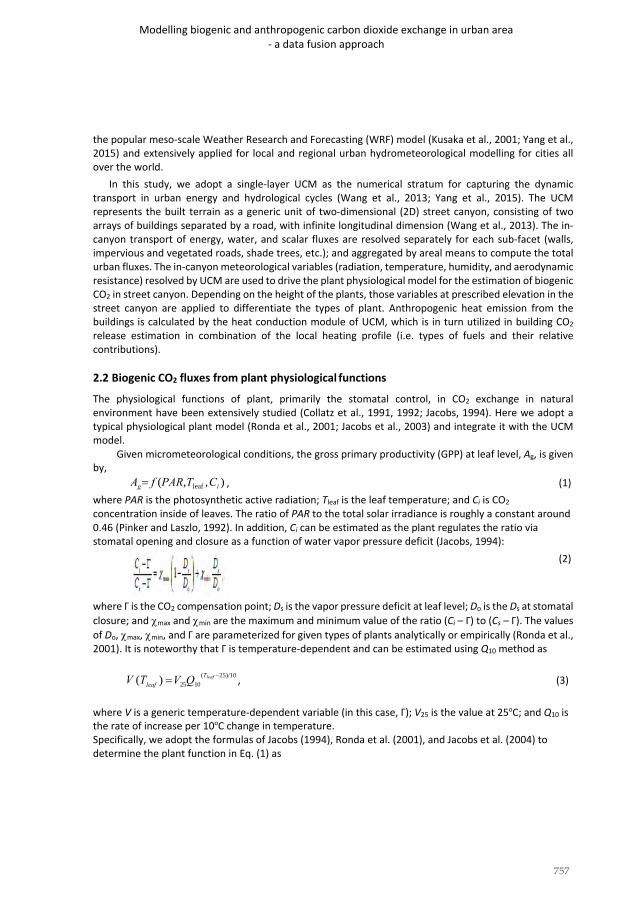
757
Modelling biogenic and anthropogenic carbon dioxide exchange in urban area - a data fusion approach
the popular meso-scale Weather Research and Forecasting (WRF) model (Kusaka et al., 2001; Yang et al., 2015) and extensively applied for local and regional urban hydrometeorological modelling for cities all over the world.
In this study, we adopt a single-layer UCM as the numerical stratum for capturing the dynamic transport in urban energy and hydrological cycles (Wang et al., 2013; Yang et al., 2015). The UCM represents the built terrain as a generic unit of two-dimensional (2D) street canyon, consisting of two arrays of buildings separated by a road, with infinite longitudinal dimension (Wang et al., 2013). The in- canyon transport of energy, water, and scalar fluxes are resolved separately for each sub-facet (walls, impervious and vegetated roads, shade trees, etc.); and aggregated by areal means to compute the total urban fluxes. The in-canyon meteorological variables (radiation, temperature, humidity, and aerodynamic resistance) resolved by UCM are used to drive the plant physiological model for the estimation of biogenic CO2 in street canyon. Depending on the height of the plants, those variables at prescribed elevation in the street canyon are applied to differentiate the types of plant. Anthropogenic heat emission from the buildings is calculated by the heat conduction module of UCM, which is in turn utilized in building CO2 release estimation in combination of the local heating profile (i.e. types of fuels and their relative contributions).
2.2 Biogenic CO2 fluxes from plant physiological functions
The physiological functions of plant, primarily the stomatal control, in CO2 exchange in natural environment have been extensively studied (Collatz et al., 1991, 1992; Jacobs, 1994). Here we adopt a typical physiological plant model (Ronda et al., 2001; Jacobs et al., 2003) and integrate it with the UCM model.
Given micrometeorological conditions, the gross primary productivity (GPP) at leaf level, Ag, is given by,
Ag = f (PAR,Tleaf , Ci ) , (1) where PAR is the photosynthetic active radiation; Tleaf is the leaf temperature; and Ci is CO2 concentration inside of leaves. The ratio of PAR to the total solar irradiance is roughly a constant around 0.46 (Pinker and Laszlo, 1992). In addition, Ci can be estimated as the plant regulates the ratio via stomatal opening and closure as a function of water vapor pressure deficit (Jacobs, 1994):
(2)
where Γ is the CO2 compensation point; Ds is the vapor pressure deficit at leaf level; Do is the Ds at stomatal closure; and χmax and χmin are the maximum and minimum value of the ratio (Ci – Γ) to (Cs – Γ). The values of Do, χmax, χmin, and Γ are parameterized for given types of plants analytically or empirically (Ronda et al., 2001). It is noteworthy that Γ is temperature-dependent and can be estimated using Q10 method as
V (Tleaf ) = V25Q10 (Tleaf −25)/10 , (3)
where V is a generic temperature-dependent variable (in this case, Γ); V25 is the value at 25oC; and Q10 is the rate of increase per 10oC change in temperature. Specifically, we adopt the formulas of Jacobs (1994), Ronda et al. (2001), and Jacobs et al. (2004) to determine the plant function in Eq. (1) as

758
Peiyuan Li and Zhi-Hua Wang
(4)
where Rd is the plant dark respiration and usually calculated as a fraction of Am; Am is the primary productivity, given by
(5)
with Am,max the maximum primary productivity under high CO2 concentration and sufficient light condition, and gm the stomatal conductance. Here Am,max and gm are temperature-dependent, and can be estimated using the Q10 or Q10-type method (Ronda et al., 2001). To find the gross primary production at canopy level, CO2 uptake at leaf level needs to be integrated over entire leaf surface area, as
(6)
where Ag,c is the assimilation rate at canopy level; Am’ = Am + Rd ; LAI is the leaf area index; Kx is the extinction coefficient; and Eint represents the overall leaf density from top to bottom of the canopy, calculated as
(7)
with Ei [•] the exponential integral.
2.3 Soil and plant respiration
Carbon release from bare soil in urban area is often neglected due to the usual perception that soil is a minor source of CO2 comparing to anthropogenic release. In fact, soil respiration is a major contribution to atmospheric CO2 in manmade landscapes with irrigation and fertilization. Designated urban garden soil with enriched organic matter and nitrogen is often used in cities for a better plant growth. Decina et al. (2016) reported that the soil respiration in residential areas with active landscaping management is 2.2 times higher than that of urban forests. The total CO2 flux from soil is comparable with fossil fuel emission in summer months.
Bare soil respiration is primarily regulated by soil temperature (Ts) and soil water content (θ). Though other factors such as the presence of organic matters, nitrogen, the change of air pressure, etc. will also influence the respiration rate, their contribution is considered minor or embedded into the change of Ts and θ (Luo and Zhou, 2006). Like plant physiology, Q10-type methods are often used for temperature- dependent relation in soil respiration. Kirschbaum (1995) proposed temperature dependency model to estimate soil respiration due to biotic and abiotic processes. The method permits an optimum temperature as an input and a variable Q10, as
(8)
where β and Topt are empirically fitted parameters. Combined with Eq. (3) and the dependency on soil moisture, the soil respiration rate can be obtained as
(9)

759
Modelling biogenic and anthropogenic carbon dioxide exchange in urban area - a data fusion approach
where Rs and R25 are the soil respiration rate under Ts and 25oC; and f(θ) is the respiration reduction function due to water stress. The typical forms of f(θ) can be found in literature for urban evapo- transpiration (Wang et al., 2013; Li and Wang, 2019) and photosynthesis (Ronda et al., 2001).
Plant respiration is usually evaluated empirically using statistical regressions for field experiments. Here we adopt the formula derived over a grassland to represent the ecosystem respiration Re, for low vegetation surfaces (Norman et al., 1992)
Re = (a + bLAI )θ10 ec(Ts −Ts ,ref ) , (10)
where a = 0.159, b = 0.064, c = 0.054, and Ts,ref = 27.7 oC are empirical coefficients fitted from 900 on- site observations over grassland (Norman et al., 1992) and θ10 is the soil moisture at 10 cm below the surface.
3. Result and discussion
3.1. Model test and evaluation
The proposed model was first tested against field measurements by an EC located in west Phoenix, Arizona, USA (33.483847 oN, 112.142609 oW). The EC tower recorded four-component net radiation, 3D wind field, air temperature, humidity, CO2 concentration, and pressure at 10 Hz continuously. The original 10 Hz atmospheric measurements were processed, quality-controlled, and integrated at 30 min intervals with no gap filling. In this study, we used the measurements recorded from January 1, 2012 to May 28, 2013 (513 days) for subsequent analysis.
Figure 1. The comparison of model simulation to EC observation of (a) net radiation Rn, (b) sensible heat H, and (c) latent heat LE, from January 01, 2012 to May 28, 2013.
The source area of the flux tower covered a typical residential area of single-family houses (Song et al., 2017a). Most lots have small front and backyard spaces with automated irrigation system. The overall land cover within 1 km2 of the EC tower were 48.4% impervious surfaces (26.4% building and 22.0% road), 36.8% bare soil, 14.6% vegetation, and 0.1% water pool (Chow et al., 2014). We first calibrated the UCM by comparing the model predictions and meteorological measurements of net radiation Rn, sensible heat H, and latent heat LE, during the period of May 13, 2012 00:00 to May 27, 2012 23:30 (15 days). Then the calibrated parameter space is fixed and applied to the consequent study period. We then compared the model results against field measurements for the entire study period (513 days). Figure 1 shows the results of comparison for all available 30-min data points in scattered plots. The mean bias error (MBE) for Rn, H, and LE are 0.3 Wm-2, 5.1 Wm-2, and 5.2 Wm-2, respectively, and RMSE values of 24.7 Wm-2, 20.8 Wm-2, and 24.6 Wm-2, respectively.

760
Peiyuan Li and Zhi-Hua Wang
3.2. Biogenic CO2 exchange of urban plants
Plants in Phoenix area have distinct photosynthesis patterns, mainly consisting of C3 trees and C4 bushes or grasses. The fraction of C4 plants in Phoenix area is generally estimated to be 0.4 to 0.5 of total vegetation area (Still et al., 2003), making C4 plants a non-negligible contributor of carbon uptake. Specifically, many residential lots in the study area use a C4 plant, Bermuda grass (Cynodon dactylon) as the yard lawn (Chow et al., 2014). The function of C3 trees are simulated under the meteorological conditions at the roof level, while the ground level condition is used for C4 grass. In particular, the solar irradiance is the primary source of PAR, and the ratio of 0.46 (PAR to total irradiance) is used in this study. Temperatures and humidity in street canyons are obtained from the UCM predictions and used to drive the plant physiological model and estimate the soil respiration.
To aggregate the leaf level CO2 uptake to the canopy level, we obtain the vegetation fraction and its seasonal dynamics from remote sensing datasets. At the study site, the urban vegetation fraction (14.6 %) was estimated from a single frame of QuickBird satellite image based on local land cover class- ification at 2.4 m resolution (Chow et al., 2014). Despite of its high spatial resolution, the temporal dynamics is underrepresented. In this case, we use the Copernicus Global Land Services (CGLS, https://land.copernicus.eu) 10-day 1 km2 resolution data to find the seasonal variation of vegetation coverage and LAI. The fractions of C3 and C4 plants used in plant physiological model are first set based on the derived total fraction and characteristics in phenology, and then fine-tuned for the best model performance in the prediction of total CO2 exchange. Other model parameters used in plants physiological model are listed in Table 1. The extinction coefficient, Kx in Eq. (6) is set to 0.5 for both C3 and C4 plants, according to Zhang et al. (2014).
Figure 2. Diurnal variation of observed (black) and simulated (blue) CO2 flux at the study site. The shaded area shows one standard deviation (±1.0) from the observed or modelled monthly means.
The CO2 uptake only occurs during daytime when photosynthesis is active to assimilate carbon. During hot months, the peak of canyon temperature lags several hours behind the peak of the irradiance, depending on the ET rate (Wang, 2014b). While the out-phased irradiance-temperature evolution tends to reduce the optimum rate of CO2 uptake, the active synthesis, driven by both PAR and heat, will be prolonged due to the hysteresis so to achieve overall greater daily carbon assimilation. Within the total CO2 uptake, 74% comes from C3 plant primarily due to its consistent photosynthesis rate throughout a year and the higher carbon assimilation rate at its optimum condition for growth. In contrast, C4 plants account for 26% of annual uptake with the maximum contribution at July and August for its adaptation to high temperature. The CO2 release from vegetated area is quantified by Eq. (6). The annual net CO2 exchange from plants is -668.8 gCO2 m-2, negative sign indicating the net uptake. Along with the CO2 releases and uptake from soil and anthropogenic sources, the diurnal variation of CO2 fluxes is shown in Figure 2, while the seasonal change is shown in Figure 3.

761
Modelling biogenic and anthropogenic carbon dioxide exchange in urban area - a data fusion approach
Figure 3. Seasonal variation of the net CO2 flux from the observation (Fcobs, solid line) and model simulations (Fcsim, dash line) over the study area. Rb, Rh, Rt, Rs, and Re denote the CO2 release from
building, human, traffic, soil, and plants, respectively. C3 and C4 denote the CO2 uptake by C3 and C4 plant, respectively. The filled bars represent the composition of release and uptake in each month. The
values on the bars show the percentage of release or uptake from each source.
3.3. Soil respiration
Using variable Q10 method in Eqs. (8) & (9), soil respiration is calculated using soil temperature and water content. The annual total soil respiration is 1147.0 gCO2 m-2. This value is very close to the observational value 1112.5 gCO2 m-2 reported in Koerner and Klopatek (2002) as the annual mean soil respiration in Phoenix residential area. However, the value is significantly lower than soil respiration obtained from low density residential area near Boston (7395.8 gCO2 m-2, Decina et al., (2016)). The difference can be possibly contributed from the dry environment in Phoenix. Most homes in arid environment used xeric landscape design to save water from irrigation. Gravels, sometimes bare soil take a large portion of xeriscaping, leading to the reduction of root activities in subsurface. Less irrigation and fast evaporation also caused water deficit in soil, lowering the biotic activeness. From the modelling perspective, R25 needs to be adjusted for the change in land cover and climate region.
The seasonal variation in soil respiration is primarily determined by temperature. Though the soil respiration is suppressed by reduced Q10 during the hottest month, the greatest rate of soil respiration happens during June to August. Soil respiration accounts for over 30% of total CO2 release during May to October, which is comparable with the traffic emissions in the residential area. During winter months, only ~12% of CO2 release is from soil, making it the smallest source of CO2. Despite of the dramatic seasonal variation, soil respiration comprises 27% of total annual release at the study site, which is greater than the total CO2 released from the vegetated surface (20%). Evaporative cooling and shading provided by plants reduce the temperature in the soil, leading to an unfavoured condition for respiration. On the other hand, vegetated surface has additional CO2 uptake capabilities, thus

762
Peiyuan Li and Zhi-Hua Wang
converting bare soil to vegetated land in housing lots might be considered as an effective way to reduce the CO2 release in the residential area.
3.4. Anthropogenic CO2 release
The anthropogenic CO2 release is primarily determined by human activities and their working schedules. The variation is more related to the time of a day (diurnal cycle) rather than to the day of the year (seasonal variation). The diurnal variation of traffic release at the study site during workdays displayed a bimodal shape, corresponding to the two rush hours in the morning and evening. The bimodal trend becomes less apparent in weekends and holidays. Throughout a year, only a small seasonal change is observed at study site. The monthly mean release from traffic is 142.5 ± 11.0 gCO2 m-2 with the maxi- mum in August at 160.9 gCO2 m-2 and the minimum in July at 119.2 gCO2 m-2. The traffic emissions constitute the largest contributor to the annual total release in the study area.
According to GPWv4 statistics, the population density is 1578 person per km2 in 2010 and 1758 person per km2 in 2015 in the study area. We used linear interpolation to estimate the population density in 2012 and 2013. The average annual release from human respiration is 552.7 gCO2 m-2 without seasonal variation, accounting only 12.3% of total CO2 release.
4. Concluding RemarksIn this study, we developed a modelling approach for holistic evaluation of CO2 exchange in cities and evaluated its performance in a typical residential area in Phoenix, Arizona. The proposed model integrates the available urban land surface schemes, plant physiological model, and the spatial gridded emission datasets. The model shows a good agreement in comparison with the in-situ measurements of CO2 flux by an EC tower. In particular, we quantified the enhanced CO2 absorption and release in the study area, owing to the modified in-canyon temperature, elevated CO2 level, and irrigation schedules in the built environment. Due to the lawn management, respiration from soil releases a significant amount of CO2 into the surface layer. The modelling framework demonstrated here will contribute to the knowledge gap from two major perspectives. First, the coupling of UCM and plant physiological model unravels the mutual influence between UHI-induced environmental stress and the presence of urban vegetation in terms of heat, moisture, and CO2 exchanges simultaneously. Second, the comprehen- siveness of the framework make it a proper tool with a high potential in carbon reduction estimation, urban planning and decision making. For example, using the model to explore the environmental co- benefits from urban greening.
Given the paucity of the available observational dataset for urban vegetation, much of the parameter space of the plant physiological functions in the current model was determined empirically from field experiment in agricultural lands. Nevertheless, the proposed model is scalable and versatile in simulating urban carbon exchange at wide spatio-temporal scales, ranging from the sub-urban scale emission driven by local meteorology, to city and regional scale CO2 simulations when combined with mesoscale models. In the offline simulations, the gridded dataset is able to match the footprint of the EC system mounted on high towers with the high spatial and temporal resolution. When coupling with global climate models, the wide coverage of the spatial gridded dataset on urban geometry, vegetation- related metrics, and anthropogenic CO2 emission provides a high versatility in data acquisition. It is caveated; however, modelling of urban carbon exchange is hitherto generally subjected to large uncertainties, with their sources inherited from measurement datasets or numerical parameterization schemes, or both. Therefore, further development of urban CO2 modeming and the improvement of

763
Modelling biogenic and anthropogenic carbon dioxide exchange in urban area - a data fusion approach
their predictive skills for, e.g. projections of urban climate changes, calls for fine-resolution and high- quality urban CO2 observations by large-scale networks of ground-based measurements and remotely sensed data products. The endeavour on observational measurements, albeit at their infancy, is progressing rapidly and shedding more and more lights to guide the model development and appli- cations in quantifying the urban carbon exchange in the built environment.
Acknowledgements This study is based upon work supported by the US National Science Foundation (NSF) under grant # AGS-1930629. We acknowledge the Central Arizona-Phoenix Long-Term Ecological Research (CAP LTER) project under NSF grant # DEB-1637590 for providing the field measurement dataset.
References Collatz, G.J., Ball, J.T., Grivet, C., and Berry, J.A. (1991) Physiological and environmental regulation of stomatal
conductance, photosynthesis, and transpiration: a model that includes a laminar boundary layer. Agricultural Forest Meteorology, 54(2), 107-136
Collatz, G.J., Ribas-Carbo, M., Berry, J.A. (1992) Coupled photosynthesis-stomatal conductance model for leaves of C4 plants. Functional Plant Biology, 19, 519-538.
Chow, W.T.L., Volo, T.J., Vivoni, E.R., Jenerette, G.D. and Ruddell, B.L. (2014) Seasonal dynamics of a suburban energy balance in Phoenix, Arizona. International Journal of Climatology, 34: 3863-3880.
Decina, S.M., Hutyra, L.R., Gately, C.K., Getson, J.M., Reinmann, A.B., Short Gianotti, A.G., and Templer, P.H. (2016) Soil respiration contributes substantially to urban carbon fluxes in the greater Boston area. Environmental Pollution, 212, 433-439.
Fernando, H.J.S. (2010) Fluid dynamics of urban atmospheres in complex terrain. Annual Review of Fluid Mechanics, 42, 365-389.
Goret, M., Masson, V., Schoetter, R., and Moine, M.-P. (2019) Inclusion of CO2 flux modelling in an urban canopy layer model and an evaluation over an old European city centre. Atmospheric Environment X, 3, 100042.
Grimmond, C.S.B., Blackett, M., Best, M.J., Barlow, J., Baik, J.-J., Belcher, S.E., Bohnenstengel, S.I., Calmet, I., Chen, F., Dandou, A., Fortuniak, K., Gouvea, M.L., Hamdi, R., Hendry, M., Kawai, T., Kawamoto, Y., Kondo, H., Krayenhoff, E.S., Lee, S.-H., Loridan, T., Martilli, A., Masson, V., Miao, S., Oleson, K., Pigeon, G., Porson, A., Ryu, Y.-H., Salamanca, F., Shashua-Bar, L., Steeneveld, G.-J., Tombrou, M., Voogt, J., Young, D. and Zhang, N. (2010) The international urban energy balance models comparison project: First results from Phase 1, Journal of Applied Meteorology and Climatology. 49(6), 1268-1292.
Grimmond, C.S.B., Blackett, M., Best, M.J., Baik, J.-J., Belcher, S.E., Beringer, J., Bohnenstengel, S.I., Calmet, I., Chen, F., Coutts, A., Dandou, A., Fortuniak, K., Gouvea, M.L., Hamdi, R., Hendry, M., Kanda, M., Kawai, T., Kawamoto, Y., Kondo, H., Krayenhoff, E.S., Lee, S.-H., Loridan, T., Martilli, A., Masson, V., Miao, S., Oleson, K., Ooka, R., Pigeon, G., Porson, A., Ryu, Y.-H., Salamanca, F., Steeneveld, G.J., Tombrou, M., Voogt, J.A., Young, D.T. and Zhang, N. (2011) Initial results from Phase 2 of the international urban energy balance model comparison, International Journal of Climatology, 31(2), 244-272.
Gurney, K.R. (2014) Recent research quantifying anthropogenic CO2 emissions at the street scale within the urban domain. Carbon Management, 5(3), 309-320.
Hutyra, L.R., Duren, R., Gurney, K.R., Grimm, N., Kort, E.A., Larson, E. and Shrestha, G. (2014) Urbanization and the carbon cycle: current capabilities and research outlook from the natural sciences perspective. Earth’s Future, 2 (10) 473–495
Jacobs, C.M.J. (1994) Direct impact of atmospheric CO2 enrichment on regional transpiration. Ph.D. thesis, Wageningen Agricultural University, Wageningen, Netherlands, 179 pp.
Kirschbaum, M.U.F. (1995) The temperature dependence of soil organic matter decomposition, and the effect of global warming on soil organic C storage. Soil Biology and Biochemistry, 27(6), 753-760.

764
Peiyuan Li and Zhi-Hua Wang
Koerner, B. and Klopatek, J. (2002) Anthropogenic and natural CO2 emission sources in an arid urban environment. Environmental Pollution, 116, S45-S51.
Kusaka, H., Kondo, H., Kikegawa, Y., and Kimura, F. (2001) A simple single-layer urban canopy model for atmospheric models: comparison with multi-layer and slab models. Boundary-Layer Meteorology, 101(3), 329- 358.
Li, P., and Wang, Z.-H. (2019) Estimating evapotranspiration over vegetated surfaces based on wet patch patterns. Hydrology Research, 50(4), 1037-1046.
Luo, Y., and Zhou, X. (2006) Soil respiration and the environment. Academic Press. 328 pp. Macknick, J. (2011) Energy and CO2 emission data uncertainties, Carbon Management, 2(2), 189-205. Martilli, A., Clappier, A., and Rotach, M.W. (2002) An urban surface exchange parameterisation for mesoscale models.
Boundary-Layer Meteorology, 104(2), 261-304. Masson, V. (2000) A physically-based scheme for the urban energy budget in atmospheric models. Boundary-Layer
Meteorology, 94(3), 357-397. Norman, J.M., Garcia, R., and Verma, S.B. (1992) Soil surface CO2 fluxes and the carbon budget of a grassland.
Journal of Geophysical Research: Atmospheres, 97(D17), 18845– 18853. Ronda, R.J., de Bruin, H.A.R., and Holtslag, A.A.M. (2001) Representation of the canopy conductance in modeling the
surface energy budget for low vegetation. Journal of Applied Meteorology and Climatology. 40(8), 1431- 1444. Sailor, D.J., and Lu, L. (2004) A top–down methodology for developing diurnal and seasonal anthropogenic heating
profiles for urban areas. Atmospheric Environment, 38(17), 2737-2748. Sailor, D.J. (2011) A review of methods for estimating anthropogenic heat and moisture emissions in the urban
environment. International Journal of Climatology, 31(2), 189-199. Song, J., Wang, Z.-H., and Wang, C. (2017) Biospheric and anthropogenic contributors to atmospheric CO2 variability
in a residential neighbourhood of Phoenix, Arizona. Journal of Geophysical Research: Atmospheres, 122, 3317– 3329.
Still, C.J., Berry, J.A., Collatz, G.J., and DeFries, R.S. (2003) Global distribution of C3 and C4 vegetation: Carbon cycle implications. Global Biogeochemical Cycles, 17(1), 1006.
Upreti, R., Wang, Z.-H. and Yang, J. (2017) Radiative shading effect of urban trees on cooling the regional built environment. Urban Forestry & Urban Greening, 26, 18-24.
Vetter, M., Churkina, G., Jung, M., Reichstein, M., Zaehle, S., Bondeau, A., Chen, Y., Ciais, P., Feser, F. Freibauer, A., Geyer, R., Jones, C., Papale, D., Tenhunen, J., Tomelleri, E., Trusilova, K., Viovy, N. and Heimann, M. (2008) Analyzing the causes and spatial pattern of the European 2003 carbon flux anomaly using seven models. Biogeosciences, 5(2), 561-583.
Wang, C., Wang, Z.-H., and Yang, J. (2019) Urban water capacity: Irrigation for heat mitigation. Computers, Environment and Urban Systems, 78, 101397.
Wang, Z.-H., Bou-Zeid, E. and Smith, J.A. (2013) A coupled energy transport and hydrological model for urban canopies evaluated using a wireless sensor network. Quarterly Journal of the Royal Meteorological Society, 139: 1643-1657.
Yang, J., and Wang, Z.-H. (2014) Physical parameterization and sensitivity of urban hydrological models: Application to green roof systems. Building and Environment. 75, 250-263.
Yang, J., Wang, Z.-H., Chen, F., Miao, S., Tewari, M., Voogt, J. and Myint, S.W. (2015) Enhancing hydrologic modelling in the coupled Weather Research and Forecasting - urban modeling system. Boundary-Layer Meteorology. 155(1), 87-109.
Zhang, L., Hu, Z., Fan, J., Zhou, D., and Tang, F. (2014) A meta-analysis of the canopy light extinction coefficient in terrestrial ecosystems. Frontiers in Earth Science, 8(4), 599-609.

765
The 54th International Conference of the Architectural Science Association (ANZAScA) 2020
More is More: The No Free Lunch Theorem in Architecture
Inês Pereira1 and António Leitão2 1, 2 INESC-ID, Instituto Superior Técnico, Universidade de Lisboa, Lisboa, Portugal
{ines.pereira1, antonio.menezes.leitao2}@tecnico.ulisboa.pt
Abstract: The growing interest in sustainability and environmental design promoted the development of tools that respond to the architects’ demand for efficient ways to evaluate building performance and optimize their designs. To optimize a design, a parametric model of that design is iteratively instantiated and evaluated by an optimization algorithm that searches for the solutions that best fulfil a set of performance objectives. However, according to Wolpert´s No-Free-Lunch Theorem, different optimization problems are best served by different optimization algorithms and, thus, architects should test multiple ones. Unfortunately, this is not a straightforward task for the currently available algorithmic design tools because different optimization algorithms have different requirements, forcing architects to spend considerable time and effort to adapt their parametric models and simulation tools, to configure the optimization algorithms, and to visualize the optimization results. This paper addresses the beforementioned problems by presenting the integration of a wide range of optimization within the same algorithmic design tool. We discuss the use of this tool in a case study that demonstrates the usefulness of multiple optimization algorithms to avoid the potential non-optimality that emerges from using just one of them.
Keywords: Architectural optimization, No free lunch theorem, Parallelization
1. IntroductionThe adoption of building optimization strategies has been growing as a result of the increasing interest in sustainability and environmental design, promoting the development of tools that respond to the architects’ demand for efficient ways to evaluate performance and optimize designs (Touloupaki and Theodosiou, 2017). To this end, architects resort to Algorithmic Design (AD) tools to create the necessary parametric models and then evaluate their performance using analysis tools. This can then be coupled with an optimizer to iteratively create and evaluate design variations in the search for a better- performing alternative. However, there are many optimizations algorithms available and it is difficult to know a priori which algorithm is the most adequate for solving a particular design problem. In this context, a wide range of algorithms should be tested, especially at initial design stages, to allow architects to understand which one is more suitable for their problem, and confidently resort to that one during the remaining stages of the project development.
Imaginable Futures: Design Thinking, and the Scientific Method. 54th International Conference of the Architectural Science Association 2020, Ali Ghaffarianhoseini, et al (eds), pp. 765–774. © 2020 and published by the Architectural Science Association (ANZAScA).

766
Inês Pereira and António Leitão
Architectural optimization is usually simulation-based, meaning the objective functions are computed through time-intensive analysis, resulting in highly time-consuming and often time-unfeasible processes. For this reason, many architects refrain from using algorithmic optimization in their daily practice. Moreover, this becomes much more problematic when they not only need to test multiple optimization algorithms but also these are scattered across different optimization tools. This implies that changes to the optimization setup, even if small, must be made to adapt to the requirements of the new tool.
In this paper, we proposed an approach that addresses these problems by integrating a wide range of optimization algorithms in the same AD environment and allowing for the simultaneous testing of multiple optimization processes. The proposed approach reduces the time needed to test different optimization algorithms, increasing the confidence in the results, and motivating architects to continually employ such methodologies in their daily practices.
2. Architectural optimizationArchitectural optimization problems tend to have multiple objectives that often conflict with each other, meaning the best solution for one objective might have poor performance in the others. Additionally, architectural optimization is frequently criticized for not considering all aspects of the design, focusing on a few selected objectives, and not giving sufficient control to the architect that, ultimately, is responsible for the design decisions. In this view, one of the main goals of architectural optimization is to find a way to efficiently reconcile performance and design freedom.
Pareto optimization provides an attractive approach to achieve that goal. This is a Multi-Objective Optimization (MOO) approach that finds a set of solutions where none of the objectives can be improved without degrading some of the others (Khazaii, 2016). This set of optimal solutions represent the trade-offs found by the optimization algorithm and embody the so-called Pareto front. By producing not just one but a possibly large set of optimal solutions, Pareto optimization allows the architect to select from this set what he considers the best solution, satisfying not only the measurable objectives used during the optimization but also personal ones.
3. No Free Lunch TheoremArchitectural optimization problems are often simulation-based, meaning the objective functions do not have a known mathematical expression and, instead, are calculated through analysis tools. Since it is not possible to extract information from the objective functions to guide the optimization process, black-box optimization algorithms are more suitable to address architectural optimization problems (Wortmann and Nannicini, 2016). These can be sub-divided into three main classes: metaheuristic algorithms, which are inspired by natural phenomena and biological analogies, for example, evolution by natural selection or swarm behaviours; direct-search algorithms, which sequentially evaluate design solution through deterministic methods; and model-based algorithms, which create an approximation of the black-box objective functions and then iteratively refine it as the optimization progresses.
Interestingly, according to Wolpert’s No Free Lunch Theorem, no optimization algorithm constantly outperforms all others in all problems (Wolpert and Macready, 1997). Therefore, knowing which optimization algorithms are most suitable for a specific problem requires testing a heterogeneous set of algorithms. Moreover, each algorithm makes different assumptions regarding the problem they aim to solve, thus testing multiple ones increases the chances of finding the best match for a specific problem.
767
More is More: The No Free Lunch Theorem in Architecture
This, in turn, can result in large optimization gains. Yet, testing different optimization algorithms is time- consuming, especially in building performance optimization, where complex simulations are necessary.
In general, optimization requires a large number of evaluations of the objective functions. However, in simulation-based optimization, the evaluations are computationally expensive and, thus, it is necessary to use optimization algorithms capable of produce satisfactory results with a small sample of the design space (Wortmann, 2019).
Model-based algorithms are faster at calculating objective functions, since the time-consuming simulations are replaced by an approximation, and have been showing promising results, particularly in Single-Objective Optimization (SOO) (Wortmann et al., 2017). However, to produce better predictions these algorithms need to sample, using simulation-based evaluations, a sufficiently large fraction of the design space, which may hinder the speedup gained by using the approximation. Additionally, the architectural field seems to prefer a sub-class of the metaheuristics – the evolutionary algorithms. However, these may not be the best option as they usually need a high number of evaluations to achieve the same results as other classes of algorithms.
4. Architectural optimization toolsThe interest in architectural design optimization has been increasing over the last two decades, as is visible in the growing number of optimization tools available. These tools are usually developed as plugins for AD tools, such as Grasshopper or Dynamo, allowing architects to easily couple parametric modelling and building performance simulations with optimization strategies. The following sections present an overview of the most well-known optimization tools for architecture, along with the challenges architects may face when they want to test multiple optimization algorithms.
Despite the variety of optimization tools currently available, they significantly differ in the type of problems they can solve (e.g., single or multiple objective) and in the number and class of optimization algorithms they offer.
4.1. Grasshopper
Grasshopper for Rhino is a popular AD tool where architects can develop their designs by dragging and connecting graphical components. The following paragraphs present some of the optimization plugins that were developed specifically for Grasshopper.
Galapagos (Rutten, 2013) is a SOO plugin that uses two generic solvers: a genetic algorithm and a simulated annealing algorithm. It offers a simple, well-organized, and user-friendly interface where all the necessary options for the optimization have pre-defined defaults. On the one hand, its simplicity encourages designers with little experience in optimization to start integrating optimization strategies in their workflow. On the other hand, more experienced designers may feel limited when using it.
Wallacei (Makki et al., 2020) supports MOO, allowing users to run the well-known evolutionary optimization algorithm NSGA-II (Deb et al., 2002). It also provides detailed analytic tools coupled with a wide range of visualization options to assist users in understanding the results produced and, therefore, making more informed decisions.
Opossum (Wortmann, 2017) supports SOO and MOO, and includes metaheuristic algorithms and model-based ones for both optimization problems. For SOO it provides the model-based RBFOpt (Costa and Nannicini, 2018) and the evolutionary-based CMA-ES (Hansen et al., 2006), and for MOO, the

768
Inês Pereira and António Leitão
model-based RBFMOpt, the evolutionary-based MOEA/D (Rubio-Largo et al., 2014) and NSGA-II, the ant- colony-based MACO (Sun et al., 2010), and, finally, the particle swarm-based NSPSO (Liu, 2008). Additionally, Opossum addresses different levels of expertise, has a user-friendly and ready-to-use interface, with pre-defined default values for each algorithm, which can be re-configured by more experienced users.
Octopus (Vierlinger, 2020) is based on the MOO evolutionary algorithms SPEA2 (Zitzler et al., 2001) and HypE (Bader and Zitzler, 2011), and already includes some model-based algorithms. It works in a similar way to Galapagos but includes the concept of Pareto optimization. Octopus’ interface is as user- friendly as the one of Galapagos, generating multiple visualizations that help the user to better understand the optimization results.
Goat (Rechenraum, 2016) uses the NLopt library (Johnson, 2008) to provide SOO algorithms from the black-box-optimization classes mentioned in Section 3. It has the metaheuristic algorithms CRS2, the direct-search algorithms DIRECT and SUBPLEX, and the model-based algorithms COBYLA and BOBYQA. Moreover, Goat is deterministic, i.e., running the same algorithm with the same parameters will always yield the same result. This feature allows for the reproducibility of results, a valuable quality for scientific work. On the other hand, it only returns a single optimal solution, which is not appreciated by most architects.
Silvereye (Cichocka et al., 2017) is a SOO plugin based on the PSO algorithms. The main goal of Silvereye is to help inexperienced users solve complex real-world optimization problems. It has a simple and user-friendly interface, with default values for the algorithms’ configuration. These can be updated by the user, and the tool will automatically save the new values to be used as the default configuration the next time the plugin is loaded.
4.2. Dynamo
Dynamo is another well-known AD tool. It is also based on a visual programming language, but differently from Grasshopper, it is integrated with the BIM tool Revit. Although in smaller numbers, there are also optimization plugins developed specifically for Dynamo. Here, we present the one that is most used by practitioners of this AD tool.
Optimo (Asl et al., 2015) uses NSGA-II to solve both SOO and MOO problems. It does not provide users with a user-friendly graphical interface, meaning even post-processing and visualizations must be done through components and are showed as background of the Dynamo environment. This may keep the less experienced users away from using the tool.
4.3. Comparison
Table 1 summarizes the features we consider more relevant for this research from each one of the plugins presented previously. From all the tools we analysed, Opossum is the tool with a more diverse offer of optimization algorithms and the only Grasshopper plugin that includes options for both SOO and MOO. Octopus and Goat also have a fair number of algorithms and, similarly to Opossum, provide model-based algorithms. Moreover, Goat is the only one that provides direct-search algorithms. Finally, current optimization plugins already provide all classes of black-box optimization for both SOO and MOO, except direct-search for the later, a combination that is still being researched.

769
More is More: The No Free Lunch Theorem in Architecture
er o
f hm
s
Table 1: Design optimization plugins and their corresponding optimization algorithms.
Optimization Algorithms
Optimization Tool
Obj
ect
Num
b Al
gorit
Metaheuristics
Evolutionary Others Direct-Search Model-Based
\
Galapagos SOO 2 x - - -
Wallacei MOO 1 x - - -
Opossum SOO
MOO
2
5
x -
x x
-
-
x
x
Octopus MOO 5 x - - x
Goat SOO 5 x - x x
Silvereye SOO 1 - x - -
5. DiscussionTo address the challenges mentioned previously, we coupled a textual-based AD tool with a set of simulation-based evaluation tools and with a parallelized optimization framework that relies on a unified description of the optimization problem. This combination (1) provides a large variety of optimization algorithms, (2) parallelizes the optimization processes, and, finally, (3) supports post- processing and visualizations techniques to compare optimization results more easily.
5.1. Optimization problem
To test the proposed approach, we developed a case study that consists of a skylight truss. The skylight is divided into multiple truss pyramids where the height of each one changes randomly within a pre- defined range. Additionally, the number of pyramids can also vary. Figure 1 shows some variations regarding the number of pyramids (a to c, and b to d), and the maximum height (a to b, and c to d).
Optimo SOO/MOO
Dyn
amo
Gra
ssho
pper
AD
Too
l
ives

770
Inês Pereira and António Leitão
Figure 1: Variations of the truss skylight.
The number of pyramids (n) and the maximum height of the pyramids (h), as well as the material of the structural bars (mat) and its radius(r), were considered as the variables of our optimization problem. As objectives, we were interested in improving the structural behaviour of the skylight, measured in terms of the structure maximum displacement, while reducing its cost, measured in terms of the structure’s volume and the materials cost per m3, as described in Equations 1 and 2. These are conflicting objectives because a material with better structural performance is also more expensive. Thus, the goal for the optimization is to reconcile these objectives by finding the set of design solutions for the truss skylight that represent the best trade-off between structural performance and cost.
(1) (2)
To test the parallelization approach and to find out which optimization algorithm yields the best results for this case study, we tested nine different ones: six metaheuristics and three model-based algorithms. To allow a fair comparison with the previously presented optimization plugins, we excluded the direct-search class. As for the metaheuristic class, we tested the particle swarm-based SMPSO and OMPSO, and the evolutionary-based SPEA2, NSGA-II, MOEA/D, and PESA2 (Corne et al., 2001). Concerning the model-based class, to create the approximation of the objective functions we tested the Random Forest Regressor (RFR), the Extra Tree Regressor (ETR), and the Gaussian Process Regressor (GPR) (with a radial basis function as kernel), and we combined them with a metaheuristic solver (SPEA2).
Additionally, to allow a fair comparison between the different algorithms, they were limited to the same maximum number of evaluations: 600. This value corresponds to a very small percentage of this problem’s design space, more precisely to 4.3%. Moreover, all of the metaheuristic algorithms, which in our case are population-based, were given the same initial population, computed through the Latin hypercube algorithm, and the same number of iterations (20), resulting in a population size of 30

771
More is More: The No Free Lunch Theorem in Architecture
elements. The model-based algorithms work in a different way than the beforementioned class, thus, were defined in a more suitable way. To construct the approximations, we initially produced 420 random evaluations, corresponding to 70% of the maximum possible evaluations, and then, leave the remaining 30% to be evaluated during the optimization. We performed three runs to minimize the randomization factor inherent to each algorithm and to have more informed conclusions about the performance of each one, resulting in 27 optimization processes.
5.2. Optimization results
Once we had the results of all three runs of the optimization algorithms tested, we produced the corresponding Pareto front to compare the algorithm’s performance. The results are illustrated in Figure 2, where one Pareto front contains all of the optimal solutions found during the multiple runs.
From this figure, we can clearly observe that the particle swarm algorithms were the ones that showed the worst performance in this problem, particularly, OMOPSO was the algorithm with the poorest performance. The evolutionary algorithms and model-based ones exhibited similar performance, with the former being slightly worse than the latter. This shows one of the main drawbacks of using Pareto fronts to compare the performance of algorithms and reinforces the need to use other metrics to evaluate the performance of the optimization algorithms.
Figure 2: Pareto fronts for the optimization algorithms tested.
To have more in-depth performance evaluation and to determine which of the tested algorithms is the more adequate for our optimization problem, we decided to use the hypervolume and the Overall Non-dominated Vector Generation (ONVG) indicators. The former measures the volume of the dominated space and the latter measures the number of optimal solutions. Moreover, to understand how the optimizations evolve over time, we measure these indicators per iteration, as illustrated in Figure 3. It is noteworthy that for the model-based algorithms, only the solutions found through the

772
Inês Pereira and António Leitão
approximations are represented. From the information in this figure, we can take more concrete conclusions about the performance of the algorithms. Particularly, the model-based RFR_SPEA2 and ETR_SPEA2 were not only the algorithms that more quickly achieved a higher value of hypervolume, but also the ones that found more optimal solutions.
Figure 3: Hypervolume and ONVG indicators per evaluation.
5.3. Parallelization results
When a set of tasks can be executed in parallel, the time needed to complete all of them depends only on the longest one. This means that the maximization of the parallelization speedup requires that all tasks take approximately the same time to complete. However, in our case study, we observed that the SMPSO algorithm took, on average, twice as much time to complete as the second slowest one, which caused a decline in the speedup factor. Given that our approach supports selective cancelling of the optimization processes that are running in parallel, it is up to the architect to decide if the solutions produced by other optimizations are good enough to allow for early termination. As a result, to better evaluate the parallelization effort, we divided it into two parts: one where the outlier algorithm is not considered, and another where it is. In the first case, assuming that we have as many processing cores as needed and taking into account the actual time need for each optimization the theoretical speedup was 13.3. However, as the number of tasks (21) exceeded the capabilities of the available hardware (only eight cores with hyper-threading), the observed speedup was 6.7. In the second case, as we increased the number of tasks (27) to include SMPSO’s runs, the theoretical speedup decreases to 8.6 but the actual one was 2.9.
Despite being considerably below the theoretical speedups, the results represent a significant improvement in the time needed to test multiple optimization algorithms, and more so for the first case. This means that the parallelization has the potential to motivate architects already interested in optimization to test a wider range of algorithms, while simultaneously appealing to those interested in environmental design, but afraid of the time-consuming aspect of optimization. Finally, results show that even in machines with limited resources, parallelization approaches can considerably reduce the computational time needed for experimenting with the different optimization algorithms. In fact, in

773
More is More: The No Free Lunch Theorem in Architecture
other case studies, tested in more powerful hardware, we have experienced larger speedups that reach one order of magnitude.
6. Conclusions and Future work Architectural optimization can help architects achieve more performative and sustainable designs. To this end, architects must use optimization algorithms that are adequate for their design problem. However, in general, this adequacy is not known beforehand. Therefore, for each optimization problem, it is important to test a wide range of optimization algorithms. Unfortunately, the currently typical optimization workflow is not practical, forcing architects to (1) switch between tools and (2) test algorithms sequentially, considerably increasing the time spent in what is already a highly time- consuming process.
To address these problems, we proposed a framework that combines an algorithm design tool with simulation and optimization tools, allowing architects to use a unified description of the optimization problem to test multiple optimization algorithms. Moreover, we parallelized it to run multiple optimization processes simultaneously, thus, speeding up the identification of the best-performing optimization algorithm. This allows architects to worry less about the details of the optimization and, instead, direct their attention towards the creative process of design development, while still ensuring a high-performing final design.
One of the limitations of this research is that, differently from what the architectural field prefers, it uses a textual-programming language. Textual-programming languages have a higher learning curve when compared with visual ones. However, they scale better, meaning algorithmic descriptions of complex designs become easier to understand and, therefore, to optimize. Another limitation to consider is the hardware resources needed for an effective parallelization. Although the evaluation was performed on an off-the-shelf laptop, the results show that even in this case the speedup obtained justifies the adoption of parallelization approaches in optimization problems. Moreover, given that the current hardware evolution points in the direction of an increasingly larger number of processing units, it is expected that the parallelization speedups will improve in the future.
As future work, we will explore additional parallelization approaches to further increase the speedup. In particular, we plan to also parallelize the evaluation of individuals in population-based optimization algorithms, as well as the evaluation of a single individual for embarrassingly parallel objective functions, such as those based on lighting analysis or acoustic analysis.
Acknowledgements This work was supported by national funds through Fundação para a Ciência e a Tecnologia (FCT) with references UIDB/50021/2020 and PTDC/ART-DAQ/31061/ 2017.
References Asl, M., Stoupine, A., Zarrinmehr, S., et al. (2015) “Optimo: A BIM-based Multi-objective Optimization Tool Utilizing
Visual Programming for High Performance Building Design.” In Proceedings of the 34th Education and Research in Computer Aided Architectural Design in Europe (eCAADe) Conference. 2015. pp. 673–682.
Bader, J. and Zitzler, E. (2011) HypE: An Algorithm for Fast Hypervolume-Based Many-Objective Optimization. Evolutionary Computatio, 19 (1): 45–76.
Cichocka, J., Migalsk, A., Browne, W., et al. (2017) “SILVEREYE – The Implementation of Particle Swarm Optimization

774
Inês Pereira and António Leitão
Algorithm in a Design Optimization Tool.” In Future Trajectories: Proceedings of the 17th International Conference on Computer-Aided Architectural Design Futures (CAAD Futures). 2017. pp. 151–169.
Corne, D., Jerram, N., Knowles, J., et al. (2001) “PESA-II: Region-based Selection in Evolutionary Multiobjective Optimization.” In Proceedings of the Genetic and Evolutionary Computation Conference. 2001. pp. 283–290.
Costa, A. and Nannicini, G. (2018) RBFOpt: an open-source library for black-box optimization with costly function evaluations. Mathematical Programming Computation, 10 (4): 597–629.
Deb, K., Pratap, A., Agarwal, S., et al. (2002) A Fast and Elitist Multi-objective Genetic Algorithm: NSGA-II. IEEE Transactions on Evolutionary Computation, 6 (2): 182–197.
Hansen, N., Müller, S.D. and Koumoutsakos, P. (2006) Reducing the Time Complexity of the Derandomized Evolution Strategy with Covariance Matrix Adaptation (CMA-ES). Evolutionary Computation, 11 (1): 1–18.
Johnson, S.G. (2008) The NLopt nonlinear-optimization package. Available at: http://github.com/stevengj/nlopt (Accessed: 16 August 2020).
Khazaii, J. (2016) “chapter 11: Pareto-Based Optimization.” In Advanced Decision Making for HVAC Engineers: Creating Energy Efficient Smart Buildings. Springer. pp. 99–115.
Liu, Y. (2008) “A fast and elitist multi-objective particle swarm algorithm: NSPSO.” In Proceeding of the 2008 IEEE International Conference on Granular Computing. 2008. pp. 470–475.
Makki, M., Showkatbakhsh, M. and Song, Y. (2020) An Evolutionary Multi-Objective Optimization and Analytic Engine for Grasshopper 3D. Available at: https://www.wallacei.com/ (Accessed: 11 August 2020).
Rechenraum (2016) goat. Available at: https://www.rechenraum.com/en/goat.html (Accessed: 15 August 2020). Rubio-Largo, Á., Zhang, Q. and Vega-Rodríguez, M.A. (2014) MOEA/D: A Multiobjective Evolutionary Algorithm
Based on Decomposition. Information Sciences, 289 (1): 91–116. Rutten, D. (2013) Galapagos: On the logic and limitations of generic solvers. Architectural Design, 83 (2): 132–135. Sun, X., You, X. and Liu, S. (2010) “Multi-objective Ant Colony Optimization Algorithm for Shortest Route Problem.”
In Proceeding of the 2010 International Conference on Machine Vision and Human-machine Interface. 2010. pp. 796–798.
Touloupaki, E. and Theodosiou, T. (2017) Performance simulation integrated in parametric 3D modeling as a method for early stage design optimization - A review. Energies, 10 (5): 637–655.
Vierlinger, R. (2020) Octopus. Available at: https://www.food4rhino.com/app/octopus (Accessed: 14 August 2020). Wolpert, D.H. and Macready, W.G. (1997) No Free Lunch Theorems for Optimization. IEEE Transactions on
Evolutionary Computation, 1 (1): 67–82. Wortmann, T. (2017) “Opossum: Introducing and Evaluating a Model-based Optimization Tool for Grasshopper.” In
Janssen, P., Loh, P., Raonic, A., et al. (eds.). Protocols, Flows and Glitches: Proceedings of the 22nd d International Conference of the Association for Computer-Aided Architectural Design Research in Asia (CAADRIA) 2017. Suzhou, China, 2017. pp. 283–292.
Wortmann, T. (2019) Genetic evolution vs. function approximation: Benchmarking algorithms for architectural design optimization. Journal of Computational Design and Engineering, 6 (3): 414–428.
Wortmann, T. and Nannicini, G. (2016) “Black-box optimisation methods for architectural design.” In Living Systems and Micro-Utopias: Towards Continuous Designing, Proceedings of the 21st International Conference of the Association for Computer-Aided Architectural Design Research in Asia (CAADRIA). 2016. pp. 177–186.
Wortmann, T., Waibel, C., Nannicini, G., et al. (2017) “Are genetic algorithms really the best choice for building energy optimization?” In SIMAUD ’17: Proceedings of the Symposium on Simulation for Architecture and Urban Design. 2017. pp. 41–48.
Zitzler, E., Laumanns, M. and Thiele, L. (2001) SPEA2: Improving the strength pareto evolutionary algorithm.

775
The 54th International Conference of the Architectural Science Association (ANZAScA) 2020
Multi-objective optimization objectives for building envelopes: a review study
Muhammad Hegazy1, Kensuke Yasufuku2, and Hirokazu Abe3 1 Graduate School of Engineering, Osaka University, Japan
[email protected] 2,3 Cybermedia Center, Osaka University, Japan
{Yasufuku2, Abe3}@cmc.osakau.ac.jp
Abstract: This study organizes a systematic review of sixty studies on multi objective optimization related to buildings envelopes. The main objective of this paper is to investigate the most adopted building types, locations, and objectives presented in the literature. The study found that office buildings were the most represented in building optimization studies, while a majority of building locations were in Europe. The optimization objectives could be categorized into five types; visual comfort, energy consumption, thermal comfort, cost, and emissions. Energy related objectives were found to be predominant in building optimization studies, specifically cooling energy, followed by visual comfort objectives represented in a number of daylight metrics. This study can aid the designers and building scientists in pinpointing reliable objectives for optimizing their respective envelope designs.
Keywords: Genetic algorithm; façade; building envelope; multi-objective optimization.
1. IntroductionBuilding envelope is a core element in the life cycle of any building, starting from early design stages up to construction and operation stages. In addition to the definitive effect of the building envelope on the aesthetics and user perception (Magliocco et al., 2015), it is also considered the membrane separating the indoor and outdoor environments of a building. In general, building envelope comprises two main systems; the opaque and the transparent system. The opaque elements include walls, floors, roof, and insulation, while transparent elements include windows, skylights, and glass doors (Mirrahimi et al., 2016). Thus, the specification of such elements have a major role in determining the energy efficiency and indoor environmental quality within the building. In addition, building envelope design can considerably effect the project’s structural design and cost. Numerous studies have addressed the impact of the envelope design on various aspects (Elghamry and Hassan, 2020; Mirrahimi et al., 2016) . As most of the decisions related to building envelope are taken at an early stage of design, architects and engineers used to rely on rules of thumb and past experience to identify best candidate envelope solutions based on various predefined information, such as building function and location (Granadeiro et al., 2013). However, as the morphology of building envelope is tending towards more sophisticated
Imaginable Futures: Design Thinking, and the Scientific Method. 54th International Conference of the Architectural Science Association 2020, Ali Ghaffarianhoseini, et al (eds), pp. 775–784. © 2020 and published by the Architectural Science Association (ANZAScA).

776
Muhammad Hegazy, Kensuke Yasufuku, and Hirokazu Abe
forms, materials, and flexibility, finding the best solution became a very complicated task that include a large pool of parameters. This includes the shape of the building, wall construction, insulation, glazing type, area, thermal mass of the used materials, and shading strategies. On the other hand, the competing nature of the end objectives of the envelope design (e.g. daylight availability versus solar heat gains) make it even harder to alter these variables towards a win-win solution. Building simulation tools are used to achieve balance between the proposed solutions and efficiency thresholds in different aspects. For instance, tools such as DOE-2 (Winkelmann et al., 1993) and EnergyPlus (Crawley et al., 2001) enable designers to verify the energy performance of their designs through spatiotemporal simulations, while DIVA for Rhino (Solemma, 2014) can run climate based daylight simulations, and calculate various daylight performance indicators such as spatial Daylight Autonomy (sDA) and Annual Sunlight Exposure (ASE) (Heschong et al., 2012). While simulations offer definitive validation to the performance of the building at an early stage of design, having to test the outcome of every set of parameters individually then altering them to achieve better results can lead to an unintuitive design process, particularly when simulation time is long (Jones et al., 2012). In this context, coupling the simulation tools with optimization algorithms can help the designers to explore large number of computationally generated solutions based on the performance metrics required. Mathematically defined, optimization is the process of finding the maximum or minimum value of a given function by selecting the best values for a set of variables (Fang and Cho, 2019). Thus, an optimization process would requires variable parameters and objective functions as two main inputs , where the parameters represent values of different building design elements, and the objective functions are the building performance indicators calculated in simulation tools (Machairas et al., 2014). If two or more conflicting optimization goals are involved, Multi-Objective Optimization Algorithms are used. In this case, the optimization process does not output one best solution, but a set of best win-win solutions known as “non-dominated” or “Pareto Optimal”. While there are many types of optimization algorithms, building performance optimization frequently adopts stochastic population-based algorithms, including genetic algorithm and particle swarm (Fang and Cho, 2019). In this paper, sixty peer-reviewed studies on building envelope optimization published in the last twenty years were reviewed and analyzed, with a specific focus on the representation of daylighting-related objectives compared to other optimization aspects. In addition, optimized building type, location, design parameters, simulation and optimization tools used were thoroughly investigated for each reviewed paper. The contribution of this study lies in pinpointing the most addressed optimization objectives in building performance research, as well as effective parameters within the building envelope. The study can also guide building scientists and designers towards different simulation tools and optimization algorithms and their respective applications in daylight performance optimization.
2. MethodologyA methodology comprised of four phases was followed in the selection and analysis of the relevant works in this review study. First, a set of keywords related to the building simulation, optimization and envelope was used as search terms. The selected keywords were evolutionary design, multi-objective, optimization, façade, window, building envelope, building simulation, parametric design, and generative design. As this study investigates the representation of different parameters and objectives in the literature, terms directly related to optimization objectives (e.g. daylighting, energy, comfort) were avoided to prevent potential bias towards one objective over the other. Second, using a combination of the selected keywords, an extensive survey on relevant work was conducted within various related databases, including Google Scholar, Web of Knowledge, Jstor, and CuminCAD index. In addition,

777
Multi-objective optimization objectives for building envelopes: a review study
databases of major publishers (Elsevier, Taylor & Francis, Sage, Springer, Wiley) were also scanned for relevant work. As a large volume of candidate papers came out of the initial survey, a third phase was applied to screen the selected works based on fulfillment of a number of criteria; the work should be either a peer- reviewed journal or conference paper, the proposed optimization approach should showcase a case study rather than a theoretical framework, the variable parameters should be directly related to building envelope, the optimization process should be applied through Stochastic algorithms in principal, and published between 2000-2020. Subsequently, sixty papers were found to fulfill the discussed criteria and were selected for further analysis. Finally, for each of the selected works the following information was extracted; publication date, building type, building location, optimization objectives, building parameters, simulation tools, and optimization tools.
3. Results and discussion
Figure 1: Reviewed studies by publication date.
Based on the previously discussed methodology, sixty journal and conference papers were selected as relevant works related to optimization of building envelope. A historical tracking of the publication dates of the selected works was conducted. While the selection criteria set 2000-2020 as the historical range of a paper, the oldest relevant work was found to be published in 2003. In this early study, Holst (2003) used a genetic optimization program coupled with an energy simulation tool to minimize building’s energy consumption by 22%. The optimized solution also offered better daylight availability and thermal comfort levels. On the other hand, in one of the most recent reviewed studies, Sun et al. (2020) proposed an Artificial Neural Network (ANN) to optimize daylight availability, energy use, and envelope cost for a public building in China. The optimized solutions showed 11% increase in sDA, as well as noticeable reduction in energy use and envelope costs. The proposed method also greatly shortened optimization time. In general, the majority of the selected papers were published between 2016 and 2020, with a noticeably the highest volume of publications in 2017 (Figure 1). This finding closely aligns with the findings of an earlier review study by Shi et al. (2016) focusing on energy optimization, where an upward trend in the number of related papers from 2011 to 2015. Furthermore, this noticeable

778
Muhammad Hegazy, Kensuke Yasufuku, and Hirokazu Abe
increase in publications related to building optimization were explained by two causes; first, the paradigm shift in building industry where all the stakeholders are realizing the importance of high- energy efficiency within building design. Second, the wide variety of simulation tools rapidly developed in the recent years, namely focusing on energy simulations.
3.1. Building types and locations
The reviewed researches primarily focused on the optimization of office buildings, where 55% of the case studies addressed were office spaces (Figure 2). However, the specifications and areas of such spaces varied widely between studies. For instance, Méndez Echenagucia et al. (2015) performed a multi-objective optimization on an open space office of an area of 280 m2, to minimize the energy need for heating, cooling and lighting. On the other hand, Zhai et al. (2019) optimized window configuration for a small office room of an area of 9 m2 to minimize energy consumption, overheating hours, and hours with daylighting below 500 lux. Residential buildings represented approximately 26% of the optimization case studies, ranging between public housing units (Yigit and Ozorhon, 2018), family houses (Ascione et al., 2016), and dorm rooms (Lartigue et al., 2014). Educational spaces were addressed in six studies, including classrooms (Futrell et al., 2015; Zhang et al., 2017) and libraries (Hong et al., 2019; Sun et al., 2020). Each of healthcare (Mangkuto et al., 2016; Sherif et al., 2015) and commercial spaces were represented in two studies. One study by Menconi et al. (2013) addressed an industrial facility, where a livestock housing model was optimized in terms of energy performance using genetic algorithm.
Figure 2: Building types considered in the reviewed studies.
As building optimization often includes climate-based simulation, the location of the building-and subsequently its climate zone- can have a major role in identifying the objectives and needed outcomes of the optimization process. In this survey study, about 15% of the locations featured within the reviewed literature were in the United States (Figure 3), citing the highest occurrence by country. It worth noticing that several climate zones were studied within the United States. For instance, Tuhus-

779
Multi-objective optimization objectives for building envelopes: a review study
Dubrow and Krarti (2010) compared best parameters for minimal energy performance in five climate zones, comprising cities of Boulder, Phoenix, Chicago, Miami, and San Francisco. However, ranked by continent, cities in Europe accounted for 40% of the locations studied in the reviewed literature, led by locations in Italy. Rapone and Saro (2012) performed optimization analysis louvers and glazing in a typical office in five European cities; Stockholm, Vienna, London, Rome, and Athens, to minimize the annual carbon emissions. A considerable number of studies (34%) were conducted in Asia, led by locations in China. However, Japan, the only developed within the studied locations in Asia (United Nations, 2014), was included in only one early study. Torres and Sakamoto (2007) applied a genetic algorithm for the optimization of daylighting systems in an office room in Tokyo, to maximize energy savings and minimizing discomfort glare. Africa was the least continent represented in the optimization studies, with only four cases in Egypt and one case in Morocco (Sghiouri et al., 2018).
Figure 3: Building locations considered in the reviewed studies.
3.2 Optimization objectives
The sixty surveyed papers included a total of 131 objectives to be optimized. The objectives could be organized into five distinct categories; Visual comfort, Energy consumption, Thermal comfort, Cost, and Emissions (Figure 4). Energy-related objectives were found by far the most dominant (48%) among the reviewed studies. Moreover, minimizing the cooling energy consumption (Ecooling) (13%) and total energy consumption (ETotal) (13%) were also the most included objectives across all categories. To a lesser extent, minimizing lighting energy consumption (Elighting) and heating energy (Eheating) were also considered. A total of 6 studies have used Energy Use Intensity (EUI) as a representative of building energy consumption. EUI can be defined as the total annual energy consumption of a given building

780
Muhammad Hegazy, Kensuke Yasufuku, and Hirokazu Abe
divided by its total gross floor area, and has many important applications, such as energy bench marking and urban energy infrastructure planning (Ma and Cheng, 2016). In a recent study by Pilechiha et al. (2020), a multi-objective method was used to explore optimized window system designs to minimize EUI of an office room in Tehran while maximizing daylight performance metrics. Visual comfort metrics came as the second highest number of objectives in the reviewed studies (27%) and where directly related to daylighting performance. The highest used daylight metric was the Useful Daylight Illuminance (UDI), which is defined as the annual occurrence of illuminances across the work plane where all the illuminances are within the range 100-2000 lux (Nabil and Mardaljevic, 2005). A number of studies have utilized different definitions of daylight availability as an indicator of visual comfort. For instance, Lartigue et al. (2014) developed a criterion of daylight availability proposed as Annual Deficient Daylight Time (ADDT), which is defined as the integrated time when the illuminance is below a threshold of 300 lux and artificial lighting is required. Mahmoud and Elghazi (2016) explored the performance of kinetic façade panels in terms of the percentages of daylit area for the Rotational motion different angles performed at four days of the year through three thresholds (partially daylit, daylit, and overlit). Chen et al. (2018) defined daylight availability as the ratio of the floor area receiving a mean annual illuminance more than 300 lx and lesser than 2000 lx over the gross floor area. Other studies used Daylight Factor (DF) (Lee et al., 2016; Mangkuto et al., 2016), (spatial) Daylight Autonomy (sDA) (Mangkuto et al., 2018; Sun et al., 2020), vertical and horizontal illuminance levels (Gagne and Andersen, 2012; Katsifaraki et al., 2017), and Light Uniformity (Mangkuto et al., 2016). A number of studies focused on minimizing glare through the use of Daylight Glare Probability (DGP) (Lavin and Fiorito, 2017; Wortmann, 2017) and Annual Glare Index (AGI)(Maltais and Gosselin, 2017). When it comes to daylighting, one of the challenges of optimization process is the subjectivity of the daylight related qualities. This challenge is evident in one study by Pilechiha et al. (2020), where a novel metric was developed as a quantitative indicator for the Quality of View (QV), defined by viewer position, view angle, view factor (Heschong et al., 2012), and view depth. To a lesser extent, thermal comfort metrics were used as optimization objectives in the reviewed studies (13%). Predicted Percentage of Dissatisfied (PPD), followed by Predicted Mean Vote (PMV), were the most adopted thermal comfort metrics. The two metrics are directly related to human sensation of the surrounding thermal environment, and thus aims to predict occurrence of thermal discomfort in a given environment. Other studies have utilized physically based metrics such as Annual Solar Exposure (ASE) and Overall Thermal Transfer Value (OTTV). In one study, Gou et al. (2018) introduced Comfort Time Ratio (CTR) as an annual indoor thermal comfort indicator for naturally ventilated environments. The objective of the study was to maximize CTR and minimize energy demands through altering a number of facade parameters. While minimizing energy consumption can positively minimize the cost of building operation as well as greenhouse gas emissions, a number of studies explicitly focused on the optimization of quantitative metrics for building cost and emissions. For instance, Ferdyn-Grygierek and Grygierek (2017) conducted a multi-variable optimization to minimize Life Cycle Costs (LCC) for a residential building in Poland. On the other hand Camporeale et al. (2017) and Hong et al. (2019) aimed to maximizing Net Present Value (NPV) by optimizing windows and glazing types of a social housing block and a library building, respectively. Sun et al. (2020) included Building Envelope Cost (BEC) as an objective to minimize in their optimization process of a library building in Changchun, China. Only four studies included objectives directly related to environmental pollution and emissions, represented in annual Green House Gas Emissions (GHG) (González and Fiorito, 2015; Rapone and Saro, 2012; Wu et al., 2017)and Global Warming Potential (GWP) (Hong et al., 2019).

781
Multi-objective optimization objectives for building envelopes: a review study
4. Conclusions
Figure 4: Optimization objectives in the reviewed studies.
Building envelope is the layer connecting the indoor environment with its natural and urban surroundings. Thus, the design of building envelope can definitely affect its performance on many levels, including aspects of occupant comfort, energy consumption, and operational costs. Due to the interweaving set of parameters that can control such performance outcomes, multi-objective optimization has seen an increase in the recent years among building scientists and designers to explore large number of envelope solutions based on fitness of their performance. In this study, sixty peer- reviewed papers addressing multi-objective optimization of building envelope were reviewed, analysed, and compared. The study concluded that the majority of literature focused on office and residential buildings, respectively. Among the reviewed studies, a majority of climate-based simulation were conducted for locations in the United States, followed by Italy, while locations in Africa were the least represented. An analysis of the optimization objectives could categorize them into five distinctive groups. Minimizing energy related objectives represented the major focus within the reviewed studies. The second most dominant group was visual comfort metrics, represented in daylight metrics such as Useful Daylight Illuminance (UDI) and Daylight Glare Probability (DGP). The three groups of thermal comfort, building costs, and emissions were also considered in a number of studies, specifically Predicted Percentage of Dissatisfied (PPD) and Life Cycle Cost (LCC). The contribution of this research lies in pinpointing the research gaps within the literature in terms of investigated building types,

782
Muhammad Hegazy, Kensuke Yasufuku, and Hirokazu Abe
climates, and objective. It can also help designers and researchers to define a reliable set of objective within the optimization process.
References Ascione, F., De Masi, R.F., de Rossi, F., Ruggiero, S., Vanoli, G.P., 2016. Optimization of building envelope design for
nZEBs in Mediterranean climate: Performance analysis of residential case study. Applied Energy 183, 938– 957. https://doi.org/10.1016/j.apenergy.2016.09.027
Camporeale, P.E., Mercader Moyano, M. del P., Czajkowski, J.D., 2017. Multi-objective optimisation model: A housing block retrofit in Seville. Energy and Buildings 153, 476–484. https://doi.org/10.1016/j.enbuild.2017.08.023
Chen, K.W., Janssen, P., Schlueter, A., 2018. Multi-objective optimisation of building form, envelope and cooling system for improved building energy performance. Automation in Construction 94, 449–457. https://doi.org/10.1016/j.autcon.2018.07.002
Crawley, D.B., Lawrie, L.K., Winkelmann, F.C., Buhl, W.F., Huang, Y.J., Pedersen, C.O., Strand, R.K., Liesen, R.J., Fisher, D.E., Witte, M.J., 2001. EnergyPlus: creating a new-generation building energy simulation program. Energyand buildings 33, 319–331.
Elghamry, R., Hassan, H., 2020. Impact of window parameters on the building envelope on the thermal comfort, energy consumption and cost and environment. International Journal of Ventilation 19, 233–259. https://doi.org/10.1080/14733315.2019.1665784
Fang, Y., Cho, S., 2019. Design optimization of building geometry and fenestration for daylighting and energy performance. Solar Energy 191, 7–18. https://doi.org/10.1016/j.solener.2019.08.039
Ferdyn-Grygierek, J., Grygierek, K., 2017. Multi-Variable Optimization of Building Thermal Design Using Genetic Algorithms. Energies 10, 1570. https://doi.org/10.3390/en10101570
Futrell, B.J., Ozelkan, E.C., Brentrup, D., 2015. Bi-objective optimization of building enclosure design for thermal and lighting performance. Building and Environment 92, 591–602. https://doi.org/10.1016/j.buildenv.2015.03.039
Gagne, J., Andersen, M., 2012. A generative facade design method based on daylighting performance goals. Journal of Building Performance Simulation 5, 141–154. https://doi.org/10.1080/19401493.2010.549572
González, J., Fiorito, F., 2015. Daylight Design of Office Buildings: Optimisation of External Solar Shadings by Using Combined Simulation Methods. Buildings 5, 560–580. https://doi.org/10.3390/buildings5020560
Gou, S., Nik, V.M., Scartezzini, J.-L., Zhao, Q., Li, Z., 2018. Passive design optimization of newly-built residential buildings in Shanghai for improving indoor thermal comfort while reducing building energy demand. Energy and Buildings 169, 484–506. https://doi.org/10.1016/j.enbuild.2017.09.095
Granadeiro, V., Duarte, J.P., Correia, J.R., Leal, V.M.S., 2013. Building envelope shape design in early stages of the design process: Integrating architectural design systems and energy simulation. Automation in Construction 32, 196–209. https://doi.org/10.1016/j.autcon.2012.12.003
Heschong, L. (Chair), Wymelenberg, V.D., (Vice-Chair), K., Andersen, M., Digert, N., Fernandes, L., Keller, A., Loveland, J., McKay, H., Mistrick, R., Mosher, B., Reinhart, C., Rogers, Z., Tanteri, M., 2012. Approved Method: IES Spatial Daylight Autonomy (sDA) and Annual Sunlight Exposure (ASE) (No. 978- 0-87995-272– 3). IES - Illuminating Engineering Society.
Holst, J.N., 2003. USING WHOLE BUILDING SIMULATION MODELS AND OPTIMIZING PROCEDURES TO OPTIMIZE BUILDING ENVELOPE DESIGN WITH RESPECT TO ENERGY CONSUMPTION AND INDOOR ENVIRONMENT, in: Proceedings of the Eighth International IBPSA Conference. p. 8.
Hong, T., Kim, J., Lee, M., 2019. A multi-objective optimization model for determining the building design and occupant behaviors based on energy, economic, and environmental performance. Energy 174, 823–834. https://doi.org/10.1016/j.energy.2019.02.035
Jones, N.L., Greenberg, D.P., Pratt, K.B., 2012. Fast computer graphics techniques for calculating direct solar radiation on complex building surfaces. Journal of Building Performance Simulation 5, 300–312. https://doi.org/10.1080/19401493.2011.582154

783
Multi-objective optimization objectives for building envelopes: a review study
Katsifaraki, A., Bueno, B., Kuhn, T.E., 2017. A daylight optimized simulation-based shading controller for venetian blinds. Building and Environment 126, 207–220. https://doi.org/10.1016/j.buildenv.2017.10.003
Lartigue, B., Lasternas, B., Loftness, V., 2014. Multi-objective optimization of building envelope for energy consumption and daylight. Indoor and Built Environment 23, 70–80. https://doi.org/10.1177/1420326X13480224
Lavin, C., Fiorito, F., 2017. Optimization of an External Perforated Screen for Improved Daylighting and Thermal Performance of an Office Space. Procedia Engineering 180, 571–581. https://doi.org/10.1016/j.proeng.2017.04.216
Lee, K., Han, K., Lee, J., 2016. Feasibility Study on Parametric Optimization of Daylighting in Building Shading Design. Sustainability 8, 1220. https://doi.org/10.3390/su8121220
Ma, J., Cheng, J.C.P., 2016. Estimation of the building energy use intensity in the urban scale by integrating GIS and big data technology. Applied Energy 183, 182–192. https://doi.org/10.1016/j.apenergy.2016.08.079
Machairas, V., Tsangrassoulis, A., Axarli, K., 2014. Algorithms for optimization of building design: A review. Renewable and sustainable energy reviews 31, 101–112.
Magliocco, A., Perini, K., Department of Architectural Sciences, University of Genoa, Genoa, Italy, 2015. The perception of green integrated into architecture: installation of a green facade in Genoa, Italy. AIMS Environmental Science 2, 899–909. https://doi.org/10.3934/environsci.2015.4.899
Mahmoud, A.H.A., Elghazi, Y., 2016. Parametric-based designs for kinetic facades to optimize daylight performance: Comparing rotation and translation kinetic motion for hexagonal facade patterns. Solar Energy 126, 111– 127. https://doi.org/10.1016/j.solener.2015.12.039
Maltais, L.-G., Gosselin, L., 2017. Daylighting ‘energy and comfort’ performance in office buildings: Sensitivity analysis, metamodel and pareto front. Journal of Building Engineering 14, 61–72. https://doi.org/10.1016/j.jobe.2017.09.012
Mangkuto, R.A., Feradi, F., Putra, R.E., Atmodipoero, R.T., Favero, F., 2018. Optimisation of daylight admission based on modifications of light shelf design parameters. Journal of Building Engineering 18, 195–209. https://doi.org/10.1016/j.jobe.2018.03.007
Mangkuto, R.A., Rohmah, M., Asri, A.D., 2016. Design optimisation for window size, orientation, and wall reflectance with regard to various daylight metrics and lighting energy demand: A case study of buildings in the tropics. Applied Energy 164, 211–219. https://doi.org/10.1016/j.apenergy.2015.11.046
Menconi, M.E., Chiappini, M., Grohmann, D., 2013. Implementation of a genetic algorithm for energy design optimization of livestock housing using a dynamic thermal simulator. J Agricult Engineer 44. https://doi.org/10.4081/jae.2013.280
Méndez Echenagucia, T., Capozzoli, A., Cascone, Y., Sassone, M., 2015. The early design stage of a building envelope: Multi-objective search through heating, cooling and lighting energy performance analysis. Applied Energy 154, 577–591. https://doi.org/10.1016/j.apenergy.2015.04.090
Mirrahimi, S., Mohamed, M.F., Haw, L.C., Ibrahim, N.L.N., Yusoff, W.F.M., Aflaki, A., 2016. The effect of building envelope on the thermal comfort and energy saving for high-rise buildings in hot–humid climate. Renewable and Sustainable Energy Reviews 53, 1508–1519. https://doi.org/10.1016/j.rser.2015.09.055
Nabil, A., Mardaljevic, J., 2005. Useful daylight illuminance: a new paradigm for assessing daylight in buildings. Lighting Research & Technology 37, 41–57. https://doi.org/10.1191/1365782805li128oa
Pilechiha, P., Mahdavinejad, M., Pour Rahimian, F., Carnemolla, P., Seyedzadeh, S., 2020. Multi-objective optimisation framework for designing office windows: quality of view, daylight and energy efficiency. Applied Energy 261, 114356. https://doi.org/10.1016/j.apenergy.2019.114356
Rapone, G., Saro, O., 2012. Optimisation of curtain wall façades for office buildings by means of PSO algorithm. Energy and Buildings 45, 189–196. https://doi.org/10.1016/j.enbuild.2011.11.003
Sghiouri, H., Mezrhab, A., Karkri, M., Naji, H., 2018. Shading devices optimization to enhance thermal comfort and energy performance of a residential building in Morocco. Journal of Building Engineering 18, 292–302. https://doi.org/10.1016/j.jobe.2018.03.018
Sherif, A., Sabry, H., Wagdy, A., Arafa, R., 2015. DAYLIGHTING IN HOSPITAL PATIENT ROOMS: PARAMETRIC WORKFLOW AND GENETIC ALGORITHMS FOR AN OPTIMUM FAÇADE DESIGN, in: Proceedings of BS2015:

784
Muhammad Hegazy, Kensuke Yasufuku, and Hirokazu Abe
14th Conference of International Building Performance Simulation Association, Hyderabad, India, Dec. 7- 9, 2015. p. 6.
Shi, X., Tian, Z., Chen, W., Si, B., Jin, X., 2016. A review on building energy efficient design optimization rom the perspective of architects. Renewable and Sustainable Energy Reviews 65, 872–884. https://doi.org/10.1016/j.rser.2016.07.050
Solemma, L.L.C., 2014. DIVA for Rhino. Available.[accessed 02.05. 17]. Sun, C., Liu, Q., Han, Y., 2020. Many-Objective Optimization Design of a Public Building for Energy, Daylighting and
Cost Performance Improvement. Applied Sciences 10, 2435. https://doi.org/10.3390/app10072435 Torres, S.L., Sakamoto, Y., 2007. FACADE DESIGN OPTIMIZATION FOR DAYLIGHT WITH A SIMPLE GENETIC
ALGORITHM. Building Simulation 6. Tuhus-Dubrow, D., Krarti, M., 2010. Genetic-algorithm based approach to optimize building envelope design for
residential buildings. Building and Environment 45, 1574–1581. https://doi.org/10.1016/j.buildenv.2010.01.005
United Nations, 2014. World Economic Situation and Prospects. Winkelmann, F.C., Birdsall, B.E., Buhl, W.F., Ellington, K.L., Erdem, A.E., Hirsch, J.J., Gates, S., 1993. DOE-2
supplement: version 2.1 E. Lawrence Berkeley Lab., CA (United States); Hirsch (James J.) and Associates …. Wortmann, T., 2017. Model-based Optimization for Architectural Design: Optimizing Daylight and Glare in
Grasshopper. Technology|Architecture + Design 1, 176–185. https://doi.org/10.1080/24751448.2017.1354615
Wu, R., Mavromatidis, G., Orehounig, K., Carmeliet, J., 2017. Multiobjective optimisation of energy systems and building envelope retrofit in a residential community. Applied Energy 190, 634–649. https://doi.org/10.1016/j.apenergy.2016.12.161
Yigit, S., Ozorhon, B., 2018. A simulation-based optimization method for designing energy efficient buildings. Energy and Buildings 178, 216–227. https://doi.org/10.1016/j.enbuild.2018.08.045
Zhai, Y., Wang, Y., Huang, Y., Meng, X., 2019. A multi-objective optimization methodology for window design considering energy consumption, thermal environment and visual performance. Renewable Energy 134, 1190–1199. https://doi.org/10.1016/j.renene.2018.09.024
Zhang, A., Bokel, R., van den Dobbelsteen, A., Sun, Y., Huang, Q., Zhang, Q., 2017. Optimization of thermal and daylight performance of school buildings based on a multi-objective genetic algorithm in the cold climate of China. Energy and Buildings 139, 371–384. https://doi.org/10.1016/j.enbuild.2017.01.048

785
The 54th International Conference of the Architectural Science Association (ANZAScA) 2020
Nature City. How our cities can adapt to climate change.
Matthew Bradbury1
1,Unitec, Auckland, New Zealand [email protected]
Abstract: The effects of climate change on the New Zealand city will be the biggest disruptive event in the history of New Zealand urbanism. This paper discusses whether our existing urban development planning model can adapt to the coming environmental depredation occasioned by climate change or will this urban model have to change. The paper will explore how by re framing the typical urban development site within the wider urban catchment, an understanding of larger environmental problems can be apprehended. Through the use of catchment analysis and GIS modelling, the implications of climate changes for an urban development site can be understood. The consequences of applying appropriate environmental remediation remedies to combat the disruptive effects of climate change on the conventional urban development plan are explored. The investigation finds that an urban development can become a resilient to the effects of climate change by developing an adaptive landscape strategy. Building an indigenous and ecologically viable landscape will help to increase biodiversity, ameliorate the consequences of contaminated stormwater and reduce flooding. This process calls for an interdisciplinary approach of architecture-related disciplines to help improve the performance of buildings and urbanism in the face of the effects of climate change.
Keywords: Climate Change, Urbanism, Catchments, Resilience.
1.1. Climate Change
Climate change is expected to cause extreme weather events such as flooding, severe storms, droughts and heat waves (Pachauri, 2014). The average global rainfall is predicted to grow (however this will not be average across the planet). The atmosphere is warming, increasing the capacity to hold more water, thus causing more rain. Major widespread flooding will be the result. This will have catastrophic results for low-lying countries especially around deltas like Bangladesh and the islands of the Pacific, but a number of world cities are also built in low-lying coastal areas. The increase in air temperature is leading to the melting of the ice caps. This will have the effect of raising sea levels. According to the Intergovernmental Panel on Climate Change (IPCC) sea levels are expected to rise by 1.00m by 2100, however their figures have recently been reconfigured and now sea level is expected to rise by 2.000mm (Pachauri, 2014) . The result will be increased coastal flooding and an increase in littoral damage from storm surges. The increase in storm events will also lead to pluvial flooding.
Imaginable Futures: Design Thinking, and the Scientific Method. 54th International Conference of the Architectural Science Association 2020, Ali Ghaffarianhoseini, et al (eds), pp. 785–794. © 2020 and published by the Architectural Science Association (ANZAScA).

786
Matthew Bradbury
The National Institute of Water and Atmospheric Research (NIWA) (Dean, 2017) has predicted more extreme weather events will occur in NZ. Increased flooding and increased droughts are very likely for different parts of the country. The effect of climate change on the urban development in NZ will be profound.
2.1. Effects of climate change on urban development
Cities will be especially vulnerable as large amounts of impervious surfaces present in many cities mean that flooding will be difficult to absorb (Boyd et al., 1993). The built environment and the physical infrastructure of the city are often obstructive to flooding pathways, causing increased damage. Because of the highly impervious nature of the typical urban development, the existing stormwater infrastructure can often be overwhelmed by sudden storm events. This causes surface flooding to varying levels of intensity (Houston et al., 2011). Waterfront development, at the downstream end of the catchment, will be the recipient of the flood water from the catchment (Houston et al., 2011). The water’s edge of the typical urban development is often the most critical part of the project. This is the location of the main public space and the location of the most valuable real estate. This is also the most vulnerable place because it is directly affected by coastal flooding. This condition will be exacerbated by the effect of sea-level rise and storm surges (Vitousek et al., 2017). There will also be an increase in run-off from impervious urban surfaces. The run-off will pick up contaminants from dirty urban surfaces: roofs, roads and footpaths. The discharge of this untreated water into urban streams and waterfronts will lead to the pollution of the receiving environment (Cromwell, 2009). Many urban developments are at the end point for the production of contaminated run-off from roads and buildings that is collected in a piped infrastructure and discharged into an adjacent receiving environment. The discharge of toxins into this environments has a deleterious effect on the biota in the receiving environment (Schiffa et al., 2002) (Kelly, 2010).
3.1 A new urban development methodology.
The evolution of a new urban development methodology that can help build resilience to the environmental effects of climate change is desirable. The following description is a sketch of a design methodology developed by the author to address these issues. This is followed by a case study which demonstrates how the design methodology could be actuated. The methodology is broken into three parts; an inventory of an existing site, a consideration of the potential of the site for development, and lastly, the design process for developing an urban development for a site to ensure resilient from the effects of climate change.
The first part in the construction of the development methodology is to build an inventory and analysis of the development site within the hydrological catchment. A catchment is a geographical unit in which the hydrological cycle and its components can be analysed (Cretu et al., 2010). To understand how water will behave in the city or the countryside, the catchment (known as a watershed in America) is defined as a specific geographical unit. The inventory would consist of; the location and boundaries of development site and the location and boundaries of the catchment. The placement of the development site within the catchment would be defined through aerial photos, mapping the topography and vegetation of the catchment, and the

787
Nature City. How our cities can adapt to climate change
mapping the hydrology, in particular the overland flow paths. The inventory would also encompass a study of any existing environmental problems with the site, in particular the ratio of pervious to impervious surfaces. The percentage of pervious and impervious surfaces within a catchment is a critical measure in understanding the hydrological behaviour within a catchment. If this information is not available as a shape file, then there are a number of ways of deriving this information. The simplest way to understand this ratio is through an aerial photo survey to measure the percentage of buildings and roads versus unbuilt surfaces such as parks and reserves. This method doesn't allow for any complex analysis to include factors such as the soil condition and the types of absorbent vegetation. To give more certainty, ground truthing (a site inspection) of the selected landscape can yield a more accurate analysis of the specificity of the ground conditions. Finally, a specialist investigation of soil and subsoil conditions will yield hard data on the ability of soils to absorb run-off. and the possibility of flooding.
The second part of the proposed development methodology is concerned with the urban development potential of the site within the catchment. This can be measured in a number of ways. The financial return of the site can be understood with simple development ratios, the gross floor area (GFA) and the floor area ratio (FAR). Property developers use these ratios to understand the financial costs and returns on a development site. Gross Floor Area (GFA) is a term that refers to the total floor area within the building walls. This term includes all the structure and spaces but excludes the roof. The term Net Floor Area (NFA) refers to the GFA minus the structural area, while the Usable Floor Area or leasable floor area (LFA) is the NFA minus the functional areas and circulation areas, (corridors, atrium and lobby) (BOMA, 2017). The amount of allowable GFA on the site is usually regulated by local governments. They often use a ratio known as the Floor Area Ratio (FAR). This is the relationship of the building GFA to the area of the building plot. This ratio can be refigured in different ways: the typical example is FAR of 1. This can be a one-storey building occupying 100 percent of the site, or a four-storey building occupying 25 percent of the site. If planning authorities wish the building footprint to be totally occupied but want to indicate a building height, then the ratio could be 1.5 or 2.0 (Bertaud and Brueckner, 2005). The development potential of a site can also be understood through the development of structure plans and master plans, these show how the site might be developed to different degrees of detail, from simple zoning layouts to detailed infrastructure layouts with building distribution.
The implications for building environmental resilience to the environmental effects if climate change can be analysed in a number of ways. The environmental implications of a development ratio, the potential GFA and FAR of a site, can be translated into a simple ratio of permeable and impervious surface for a development site, this can demonstrate how the hydrological balance of a site will be affected by a development. The impact of a more sophisticated masterplan on the environmental character of a site can be tested by superimposing the plan over the existing site analysis. Some of the environmental implication of the master plan that can be understood in the way the urban development might for instance, block an overland flow path thus preventing the conveyance of future flooding or the way a development might be flooded by sea level rise. The implication of an increase of impervious surfaces can also be understood through the use of the rational method. The rational method is a commonly used mathematical equation to calculate the maximum value of flood run-off from a small catchment. This is a formula that relates the intensity of rainfall, the area of the catchment and the consequent run-off (Thompson, 2007). , in New Zealand, the National Institute of Water and Atmospheric Research (NIWA)

788
Matthew Bradbury
has developed an online calculator for any New Zealand location. There are also a number of online tools to help with this calculation (LMNO Engineering Research and Software, 2015).
The third part of the development methodology can be divided into two parts, landscape and architectural. Into these categories fall the actual techniques used to make the development site resilient to the effects of climate change. Some of the techniques that can be used are derived from LIUDD techniques and GIS operations. Low Impact Urban Design (LIUDD) is a theory and practice that looks at how the planning of cities can be achieved with the least impact on the natural environment, in particular, the original hydrological cycle. The NZ originators of LIUDD (van Roon et al., 2006) are influenced by two theoretical poles, the ecological, in particular the environmental mapping techniques of McHarg (McHarg, 1969) , and Arendt (Arendt et al., 1994) and urban sustainability, especially the ideas of Newman and Kenworth (Newman, 1999). Geographic Information System (GIS) is software that helps in the analysis and design of data, especially environmental data (Schuurman, 2004). Specific techniques include; protecting the hydrological pattern of the site by buffering the overland flow paths that run through the development site from the greater catchment and protecting the littoral through buffering the harbour/ river edge. Protection of riparian margins is critical to the protection of stream networks. This goal can be accomplished with the indigenous planting of high biomass species in a buffer zone around the stream. This method helps to increase aquatic and terrestrial biodiversity within the riparian corridors. In addition to riparian corridors, wetland and flood detention areas should also be protected by planning a buffer area around these zones. By protecting the areas around urban streams through the replanting of indigenous species, erosion can be reduced, sediment trapped, and phosphorus, nitrogen, and other contaminants present in urban run-off can be filtered before reaching the stream, protecting and enhancing both aquatic and terrestrial wildlife habitats (Wenger and Fowler, 2000). To ensure buffer zones function, the planting should be a 15 to 30m margin. While grass will help absorb pollution in overland flows, the planting of indigenous vegetation, preferably from the appropriate ecotones, is the best-practice solution. The buffered hydrological network can also act as a flood corridor during extreme rainfalls, as well as being used as a connector of urban patches. Social activities such as parks, reserves and sport facilities can be located along stream margins, as they help to increase the amount of pervious surface within the urban development. A specific GIS function, buffering, can be used to delineate a buffer around existing stream and overland flow paths. (ArcGIS, 2015)
The design consequences of these operations are varied, for example, the buffered overland flow path (OLFP) could be used for pluvial flooding conveyance and detention. The OLFP could also be planting with indigenous vegetation to help encourage evapotranspiration and lower the urban heat island effect. The buffered OLFP network could also be used to locate stormwater treatments devices such as wetlands to treat stormwater from the larger catchment. The buffered harbour water edges could help to form and locate soft barriers to coastal flooding. The net effect of these remediation techniques on the catchment can be measured through a recalculation of the permeable /impermeable surface ratio. The percentage of pervious and impervious surfaces within a catchment is a critical measure in understanding the hydrological behaviour within a catchment. If this information is not available as a shape file, then there are a number of ways of deriving this information. The simplest way to understand this ratio is through an aerial photo survey to measure the percentage of buildings and roads versus unbuilt surfaces such as parks and reserves. This method doesn't allow for any complex analysis to include factors such as the soil condition and the

789
Nature City. How our cities can adapt to climate change
types of absorbent vegetation. To give more certainty, ground truthing (a site inspection) of the selected landscape can yield a more accurate analysis of the specificity of the ground conditions. Finally, a specialist investigation of soil and subsoil conditions will yield hard data on the ability of soils to absorb run-off. This has two consequences, the first is the development of a new urban masterplan that is more open and greener with a number of remediatory regimes to help build urban resilience to the effects of climate change. The implication of this new masterplan on the conventional real estate programme requires a change in thinking about how the required amount of GFA to make the project financially viable might be allocated. This can be accomplished through the LIUDD strategies of clustering the building programme. Clustering is an idea that uses the amalgamation of buildings in a subdivision to free up land for other purpose such as amenity, recreation, utility or, in the LIUDD world, protecting environmentally sensitive zones. The traditional way in which building clustering occurs is the village, an urban form where houses are grouped together. This basic housing morphology can be amended in different way to produce a number of different housing types that can still meet the definition of clustering, such as row housing. An early definition of cluster housing is by William Whyte (Whyte, 1964). By recalculating the GFA into a new FAR, a reconfigured building footprint driven by the dictates of the
environmental remediation programme, the financial returns of the original real estate investment can be accomplished. The urban and architectural consequences of the reconfigured urban programs can be modeled in ArcGIS, graphically represented through the extrusion of the proposed building footprint.
4.1 Case Study; The Rarawara catchment, Whenuapai, Auckland
Auckland is undergoing rapid urban growth. More than one million new citizens are expected to arrive in Auckland over the next 20 years. As a consequence of this growth there is an acute housing shortage. Whenuapai is located adjacent to SH16, an important motorway in the western growth corridor and near the new NorthWest Shopping Centre. Whenuapai also neighbours the successful Hobsonville housing development, making Whenuapai the next site for future urban development. To address the urban pressure Auckland is facing, the Auckland Council, in 2016, developed an urban structure plan for Whenuapai to help conceptualise the shape of future urban development. The structure plan efficiently zones the available land according to proximity to infrastructure; industrial land and an apartment zone are located adjacent to the main transport routes, SH16 and 18. Lower density housing zones are located nearer to the edge of the Waitematā Harbour. Single-storey housing with large sites are zoned for the coastal margin, while more intensive housing (medium density) is zoned between the coastal edge and the industrial zone. To explore how the structure plan might be made more responsive to the environmental issues that will be occasioned by the environmental effects of Climate Change, a sub-catchment of the larger Whenuapai catchment was chosen as a case study site. The selected site was the Rarawara sub- catchment to both understand the consequences of the proposed urban development. The effect of the Auckland Council’s Whenuapai structure plan on the Rarawara catchment is to configure the catchment into four housing zones and an industrial zone (Auckland Council, 2016). The area closest to the coast is zoned for low-density, single-storey housing, along an approximately 100ha coastal margin. Allowing for one dwelling unit (DU) per 500m2 gives 2008 DUs, and 50ha of impervious surfaces. A medium-density housing zone of 82ha is planned behind the coastal zone. Allowing for one

790
Matthew Bradbury
DU per 300m2 equals 2743 DU, giving 61ha of impervious surface. The remaining area is zoned industrial/commercial with two apartment zones to the east of the airfield zone. Three parks are proposed of approximately 35ha in total. Roads proposed and existing housing make up 212ha of impervious surface.
5.2. Rarawara Catchment Site Analysis. The 324ha Rarawara catchment is a moderately flat site bounded to the north by the Waitematā Harbour. To the west the site is defined by the Brigham Creek/Pitoitoi Stream catchment, to the east by Whenuapai village and airfield and, to the south, by the intersection of SHW16 and 18.
Vegetation The predominant vegetation in the catchment is grass, the result of the rural economy of the catchment. The other vegetation type are decorative gardens around the housing areas, and shelterbelt species from the small horticulture and orchard blocks.
Hydrology The catchment drains into the dominant stream, the Rarawara Creek (fig. 9). The creek runs roughly north south and bisects the catchment. There are three sub-catchments. The stream exits into an estuarine mouth before connecting to the Waitematā Harbour. There are smaller streams from the hinterland to the coast on either side of the Rarawara catchment.
Aspect and Slope The aspect of the Rarawara catchment is mostly northerly with an east-west division along the sides of the stream corridors. The slope of the majority of the site is flat, 0-5 degrees, especially the aerodrome site. However, alongside the steam corridors the slope increases from 5 to 16 degrees.
Land Use The land of the catchment is separated into two broad uses. The first is suburban housing, large lifestyle houses and sections on the northern coastal edge, and a smaller subdivision to the west of the airfield. The rest of the catchment is made up of rural lifestyle blocks, and small horticulture and orchard blocks.
Pervious/Impervious Ratio Due to its mostly rural nature, the catchment is largely made of pervious surfaces . The impervious areas are the roading infrastructure and the airfield .
• The existing Rarawara catchment area is 324.1753 hectares.• The impervious surface area is made up of roads (81.8428 hectares) and buildings (20.1004
hectares). • The total impervious surface area is 104.1488 hectares • The total pervious surface area is 220.0265 hectares • Giving a ratio of pervious to impervious of 2:11.
5.3. Rarawara Catchment: Environmental Problems With the construction of the new housing and the associated infrastructure, the hydrological pattern of the existing territory will be irrevocably changed; increased run-off with increased sedimentation will

791
Nature City. How our cities can adapt to climate change
add to already high levels of sedimentation in the upper Waitematā Harbour. Run-off will also be polluted from roading contaminants and roof debris.
Pervious/Impervious Ratio In the Auckland Council structure plan the impervious surface in the Rarawara catchment will increase markedly.
• The existing Rarawara catchment area is 324.1753 hectares• The impervious surface area is made up of road, (81.8428 hectares), and buildings (206.9095
hectares), • The total impervious surface area is 288.7523 hectares. • The total pervious surface area is 35.423 hectares • Giving a ratio of pervious to impervious of 8:1 (fig. 21).
If this plan was built, then the result of this high degree of imperviousness would be a large amount of contaminated stormwater run-off discharging into the harbour. To calculate the volume of stormwater that would be discharged from the catchment under the new structure plan, the Rational Method can be used.(Thompson, 2007) To calculate the required volume for the construction of a storage and treatment wetland TP10 (Auckland Council, 2003) is used.
• The run-off discharge flow rate over two years (m3/sec) would be 5.95 m3/sec. • The required storage and treatment wetland for this run-off is sized at 32140.04m3. • For a 10-year run-off discharge flow rate of 8.71 m3/sec,• The required storage volume is 47019.68m3. •• For a 100-year run-off discharge flow rate of 13.95 m3/sec, • The required storage volume is 75350.53m3.
Rarawara Catchment: Environmental Remediation: Design Process To ameliorate the effects of urbanisation on the coastal receiving environment, an understanding of the hydrological behaviour of the catchment is necessary. The first step is to determine the structure and shape and size of the catchment on the site, through mapping with ARCGIS. This data can be manifested as a series of maps showing catchment boundaries and a network of overland flow paths. From this mapping we can determine both the size of the catchment and the ratio of impervious to pervious surface. Using the Rational Method, we can gain an understanding of what the rainfall run-off will be with the expanded site. By measuring the increase in impervious surface due to the number and type of housing zones, the increase in stormwater run-off can be calculated. Once the connection of housing density to the impervious/pervious surface ratio is established, the different zoning densities and associated impervious/pervious ratios can be manipulated to allow for greater permeability, while at the same time ensuring that the planned number of dwelling units remains the same.
Hydrology How can the environmental damage from an increase in stormwater discharge into the upper Waitematā catchment be ameliorated? Decreasing the amount of impervious surface through the

792
Matthew Bradbury
removal of infrastructure such as roads and housing will lead to an increase in the amount of pervious surface, leading to an increase in the absorption of stormwater run-off. One way to increase the pervious surface of the catchment is by protecting and enhancing the existing stream network by establishing a protective buffer zone of at least 25m around the stream and overland flow paths Protection of the coastal edge is another important environmental measure; a buffer of 30m would give a zone of 43ha. These two measures increase the area of pervious surfaces within the catchment by 128ha. This intervention also has the effect of developing a new park system along the stream corridors and the waterfront coastal edge
Accommodating these two measures necessitates a change in the housing footprint. This is accomplished by decreasing the low-density zone from 100ha to 23ha, and decreasing the medium- density zone slightly, from 82ha to 74ha.
5.4. Rarawara Catchment: Urban Design. To accomplish the increase in pervious surfaces and the consequent decrease in stormwater discharge means a loss of housing units. Under the Auckland Council structure plan the number of low-density DUs in the catchment is 2008 and medium density is 2743, equalling 4752 DUs (with no provision for high-density units). By enlarging the pervious surface area, the number of DUs in the low-density zone will drop to 473 DUs and in the medium density zone to 2471 DUs. The shortfall in DUs will be 1827.
One solution to this real estate shortfall is to substitute apartments for the missing lower density DUs. This solution will increase the number of DUs to 1468, making a total of 4420. By increasing the number of apartments by making the building denser or higher, the shortfall of 1827 DUs could be matched or even surpassed to give a better real estate return The new apartments could be located in the coastal zone around the existing stream mouth, an area of 8.8ha would provide two high-density apartment zones within the low-density area.
Pervious/Impervious Ratio • The Rarawara catchment area (324.1753 hectares) • Impervious surface of 196.1642 hectares, roads, (65.9289 hectares), and buildings, (130.2353
hectares) • Pervious surface, 128.001 hectares • Giving a ratio of pervious to impervious of 2:3.
Using the Rational Method, the effect of the new pervious surfaces will lead to a two-year run-off discharge flow rate of 29304.15042m3, compared to the discharge of 26468.26489m3 from the original site and 32140.03594m3 discharge with the proposed Auckland Council structure plan. In the 10-year run-off discharge, the flow rate of the new plan is 42870.88672m3, compared to the discharge of 38722.09123m3 from the original site and 47019.68221m3 from the proposed Auckland Council plan. In the 100-year run-off discharge, the flow rate of the new plan is 68701.95265m3 compared to 62053.37659m3 in the original site and 75350.52871m3 in the Auckland Council proposed plan.
5.5. Rarawara Catchment: Environmental Implications of the Design Process Stream Network

793
Nature City. How our cities can adapt to climate change
A buffer zone around the revealed hydrological network will enable the stream corridors to be revegetated with native species. The zone also gives the opportunity to allow for the location of structural stormwater cleaning instruments – in particular, wetlands and a rain garden – these can all be installed within the new zone. This stream zone can form a deep connection from the coastal edge to the hinterland, creating an ecological corridor Having housing adjacent to the new river zone will also help to increase real estate values. By locating medium-density housing along the edges of the new stream parks, owners can enjoy views of the water and native vegetation. The nature of the new river zones and the link from the coast to the hinterland provide the opportunity for owners in the centre of the development to have access to the coast.
Coastal Zone Establishing a coastal buffer zone means that the critical environmental conditions in this zone will be protected. Critical riparian ecologies can be restored and protected, damage from building in this zone can be ameliorated. Establishing a protective buffer zone around the coastal and stream hydrological networks will increase the ability of the Rarawara catchment to absorb rainfall, rather than add to run-off into the upper Waitematā Harbour. To ensure the same economic return is met – that the same number of DUs are constructed as specified in the Auckland Council structure plan – the loss of low- and medium-density housing is met by a greater number of apartments with a smaller, denser footprint. The result will be a low-rise domestic landscape of gardens and houses broken by tall, prismatic apartment towers that emphasise the unique stream system.
One criticism of this urban design proposal might be that building apartments in the coastal zone is an urban typology that is hostile to the Auckland suburban ethos. However, there are many existing examples of residential apartments in Auckland coastal suburbs such as Kohimarama, Herne Bay and Takapuna. These examples demonstrate the possibility of coexistence between low-density, two-storey, single housing on the coastal edge with apartment dwelling. A new 14-storey apartment building has also been recently proposed for the neighbouring suburb, Hobsonville Point (Gibson 2018)
5.6. Whenuapai Catchment: Environmental Implications of the Rarawara Case Study Investigation The new structure plan shows how the coastline and stream corridors are protected through buffering. There are three consequences of this action; the first is that the vegetative buffers have the effect of protecting the hydrological network by protecting the streams from the influx of contaminated stormwater. The second effect is that the ratio of impervious to pervious surface is relaxed, ensuring that more rainfall is able to be absorbed by uncovered ground. A social consequence of this new green network is the establishment of a new path/park system that links the hinterland of the subdivision with the coast. The third consequence of this action is the clustering of the GFA that has been displaced by the new stream/buffer stream network into a series of apartment towers located at the intersection of the stream networks and the coast
References ArcGIS. (2015). "Riparian Buffer Land Cover by Watershed." Retrieved January, 2017, from
http://www.arcgis.com/home/item.html?id=ad099d6faaf94984a51c70d054e94e37.

794
Matthew Bradbury
Arendt, R., E. A. Brabec, H. L. Dodson, C. Reid and R. D. Yaro (1994). Rural by design: maintaining small town character. Chicago, American Planning Association.
Auckland Council (2003). Stormwater management devices design guideline manual. Auckland, New Zealand, Auckland Council.
Auckland Council. (2016). "Whenuapai Structure Plan." Retrieved 7th of September, 2018, from https://www.aucklandcouncil.govt.nz/plans-projects-policies-reports-bylaws/our-plans-strategies/place-based- plans/Documents/whenuapai-structure-plan-september-2016.pdf
Bertaud, A. and J. Brueckner (2005). "Analyzing building-height restriction: Predicted impacts and welfare costs. ." Regional Science and Urban Economics 35: 109–125.
BOMA (2017). BOMA 2017 for Office Buildings: Standard Methods of Measurement, ANSI/BOMA Boyd, D., M. C. Bufill and R. M. Knee (1993). "Pervious and impervious runoff in urban catchments." Hydrological
Sciences Journal 38(6): 463-478. Cretu, G., C. Nagy and F. Boncia. (2010). "Watersheds." VICAIRE (VIrtual Campus In Hydrology and water Resource
management) Retrieved 10 June, 2016, from http://echo2.epfl.ch/VICAIRE/mod_1a/chapt_2/main.htm. Cromwell, J. (2009). Implications of climate change for adaptation by wastewater and stormwater agencies.
Alexandria, VA, Water Environment Research Foundation. Dean, S. (2017). "Climate Change." Retrieved 4 October, 2017, from https://www.niwa.co.nz/natural-
hazards/hazards/climate-change. Gibson, A. (2018). Hobsonville Point proposed 15-level apartment block exceeds maximum height by 40.8m. NZ
Herald. Auckland, NZME. Houston, D., A. Werritty, D. Bassett, A. Geddes, A. Hoolachan and M. Millan (2011). Pluvial (rain-related) flooding in
urban areas: the invisible hazard. York, Joseph Rowntree Foundation. Intergovernmental Panel on Climate Change (2018). IPCC Special Report. Kelly, S. (2010). Effects of stormwater on aquatic ecology in the Auckland region. C. a. Catchment. LMNO Engineering Research and Software. (2015). "Rational Equation Calculator Compute peak discharge from a
drainage basin using the Rational Equation Method." from http://www.lmnoeng.com/Hydrology/rational.php. McHarg, I. L. (1969). Design with Nature. Garden City, N.Y., American Museum of Natural History. Newman, P. K., J. (1999). Sustainability and Cities. Washington, D.C, Island Press. Pachauri, R. K. (2014). IPCC, 2014: Climate Change 2014: Synthesis Report. Contribution of Working Groups I, II and III to the Fifth Assessment Report of the Intergovernmental Panel on
Climate Change, Intergovernmental Panel on Climate Change: 155. Schiffa, K., S. Baya and C. Stransky (2002). "Characterization of stormwater toxicants from an urban watershed to
freshwater and marine organisms." Urban Water Journal 4(3): 215-227. Schuurman, N. (2004). GIS : A Short Introduction. Malden, MA., Blackwell. Thompson, D. B. (2007). The Rational Method, RO Anderson Engineering. van Roon, M., A. Greenaway, J. E. Dixon and C. T. Eason (2006). Low Impact Urban Design and Development: scope,
founding principles and collaborative learning. Urban Drainage Modelling and Water Sensitive Urban Design Conference Melbourne, Australia.
Vitousek, S., P. L. Barnard, C. H. Fletcher, N. Frazer, L. Erikson and C. D. Storlazzi (2017). "Doubling of coastal flooding frequency within decades due to sea-level rise." Scientific Reports 7.
Wenger, S. J. and L. Fowler (2000). Protecting Stream and River Corridors. Public Policy Research Series. R. W. Campbell. The University of Georgia, Carl Vinson Institute of Government
Whyte, W. H. (1964). Cluster Development. New York, American Conservation Association.

795
The 54th International Conference of the Architectural Science Association (ANZAScA) 2020
New Zealand House Indoor Microclimate and Allergens
Bin Su, Lian Wu, Peter McPherson and Renata Jadresin-Milic Unitec Institute of Technology, Auckland, New Zealand
[email protected], [email protected], [email protected], [email protected]
Abstract: The most common indoor allergens and triggers for people with asthma and allergic rhinitis are dust-mites, moulds, pets and pollen. Allergens from dust mites and moulds are strongly associated with indoor microclimate. Indoor microclimate conditions are closely related to house thermal performance and R-value of its envelope. Based on the field studies of indoor microclimatic conditions, tests of allergen levels of dust mites and mould growth of a number of sample houses, this study provides physical evidence to identifies thresholds or ranges of indoor microclimatic conditions related to different levels of dust-mite allergen and mould growth, a correlation between dust-mite allergen levels and mould growth levels, the most common type of indoor mould and the minimum requirement of indoor microclimatic conditions to control indoor dust-mite allergens at an acceptable level and prevent indoor mould problem. The study evaluates indoor microclimatic conditions related to indoor allergens of the sample houses with different R-values in their envelopes in accordant to the requirement of the current building code for New Zealand Climate Zone 1 and 2 (New Zealand Standard 4218: 2009) and the previous building code (New Zealand Standard 4218:1996).
Keywords: Dust-mite, indoor allergen, indoor microclimate, mould.
1. IntroductionAccording to New Zealand Health Survey 2017/18, the New respiratory disease affects 700,000 people, causes one in 10 hospital stays, costs New Zealand NZ$7 billion in healthcare every year, and is the third-highest cause of death. One in eight adults (12.5%) and one in seven children (14.3%) have asthma (MH, 2018). Most of the factors that adversely affect health, such as bacteria, viruses, fungi, mites, etc., have increases associated with high indoor relative humidity. Maintaining the indoor relative humidity between 40% and 60% can minimise the indirect health effects (Arundel, Sterling, Biggin, & Sterling, 1986). New Zealand has some of the highest levels of house dust mite allergens in the world (Siebers, Wickens, & Crane, 2006). Visible mould growth on indoor surfaces is a common problem in over 30% of New Zealand houses (Howden-Chapman et al., 2005). The abundance of two major causes of allergy, mites and mould in New Zealand housing, increase proportionately with average indoor relative humidity. The World Health Organisation recommends a minimum indoor temperature of 18 °C for houses; and 20–21 °C for more vulnerable occupants, such as older people and young children (WHO, 1987; WHO, 2009). Previous studies show that the minimum threshold of indoor temperature required
Imaginable Futures: Design Thinking, and the Scientific Method. 54th International Conference of the Architectural Science Association 2020, Ali Ghaffarianhoseini, et al (eds), pp. 795–804. © 2020 and published by the Architectural Science Association (ANZAScA).

796
Bin Su, Lian Wu, Peter McPherson and Renata Jadresin-Milic
for limiting respiratory infections is 16 °C: there is increased risk of respiratory infections when indoor temperatures are below 16 °C (Collins, 1986; Braubach, Jacobs, & Ormandy 2011).
Both indoor relative humidity and temperature can impact indoor dust mite populations and allergen levels. Maintaining indoor relative humidity below 50% can reduce dust mites and their allergens in the home, mite populations are almost eliminated in winter when indoor relative humidity is maintained within 40 to 50% (Arlian, Bernstein, & Gallagher, 1982; Korsgaard, 1982; Murray & Zuk, 1979). A range of 60–80% relative humidity provides ideal conditions for the reproduction of mites. Mites are hardy, surviving and multiplying best when relative humidity is 75-80% and the temperature is around 21 °C (Arundel, Sterling, Biggin, & Sterling, 1986). The indoor relative humidity required by dust mites to thrive is 75–80% or higher, and dust mites prefer temperatures of around 18–25 ᵒC. A decrease in indoor temperature (between 10 °C and 25 °C) can result in reducing dust mite populations (Arlian, Bernstein, & Gallagher, 1982; Arlian, Rapp, & Ahmed, 1990; Arlian, Neal, & Vyszenski-Moher, 1999; Arlian, Yella, & Morgan, 2010; Hart, 1998).
According to international and national standards, indoor relative humidity should be lower than 60% for optimum indoor air quality (ASHRAE, 1993; SNZ, 1990; DBH, 2001). The threshold of indoor relative humidity for mould survival and growth conditions is 60%. Mould growth is likely on almost any building material if equilibrium relative humidity of the material exceeds 75–80% (Coppock, 1951; Block, 1993; Pasanen et al., 1992). Mould spore germination requires not only higher relative humidity but also time (Hens, 2000), Table 1 shows the thresholds of mould spores germination. For example, for 80% of relative humidity, the time needed for mould spore germination is 30 days. One option to prevent mould growth on indoor surfaces is to control the indoor relative humidity to a level below the threshold of mould germination (Su, 2006).
Table 1: The thresholds of relative humidity and time for mould germination.
Substrate Thresholds of Relative humidity
Time needed for mould spore germination
Porous and dust- and fat-covered non-porous
100% 1 day 89% 7 days 80% 30 days
Since 1978, minimum R-values for building elements (Roof: 1.9, Wall: 1.5, Floor: 0.9 for New Zealand Climate Zone 1) were required in accordance with NZS 4218P:1977 (SNZ, 1977, BIA, 1992). In 1996, the standard was updated and the new regulations came into force at the end of 2000 (SNZ,1996; DBH, 2000). Minimum R-values for building elements (Roof: 1.9, Wall: 1.5, Floor: 1.3 for New Zealand Climate Zone 1) were required in accordance with NZS 4218P:1996. There are no R-value requirements for glazing and no limitation on the ratio of the window to the wall. The standard was further updated in 2004, principally with regard to limiting the percentage of the window to wall area and mandating that windows should be double glazed (SNZ, 2004). Minimum R-values for building elements (Roof: 1.9, Wall: 1.5, Floor: 1.3, Glazing: 0.15 for New Zealand Climate Zone 1) were required in accordance with NZS 4218:2004. In 2009, the standard was again updated (SNZ, 2009). Those requirements are mainly related to building energy efficiency.
Based on the field-study data of indoor micro-climate data associated with unacceptable and acceptable levels of indoor dust-mite allergens and different indoor mould growth levels of the sample houses in the Central North Island of New Zealand (Su & Wu, 2019), this study identified threshold of

797
New Zealand House Indoor Microclimate and Allergens
indoor air temperature and relative humidity for the acceptable level of indoor dust-mite allergen. This can be used as the minimum requirement for indoor thermal conditions to control indoor allergens at an acceptable level, and to evaluate winter indoor microclimatic conditions of the sample houses in Auckland, built in different periods of time, with different R-values in their envelopes according to under the local climate with mild and wet winter.
2. Research methodUnacceptable indoor dust-mite allergen data and indoor microclimatic data derived from the field study of 13 sample houses of the isolated Māori communities in Minginui, Te Whaiti and Murupara areas of New Zealand. The 13 sample houses were built in the 1920s to the 1970s. Floor areas of the 13 sample houses are 44m2 to 342m2. Roof materials are tin (6 houses), iron (4 houses), aluminum (1 house), tile (1 house) and asbestos (1 house). Wall materials are old weatherboard (12 houses), brick (1 house). The 8 sample houses do not have any insulation in their envelopes; The 5 sample houses have only limited, old insulation in either their roof space only or both roof space and floor. For space heating, the 10 sample houses used firewood as fuel for fireplaces, the 2 sample houses used coal or firewood as fuel for stoves (cooking and space heating), one sample house did not use any space heating. All the 13 sample houses did not use any electricity as fuel for space heating. Acceptable indoor dust-mite allergen data and indoor microclimatic data derived from the field study of 2 sample houses built in the 1980s with minimum insulation (Roof: 1.9, Wall: 1.5, Floor: 0.9) in their building envelope and single glazing windows and used electronic heaters for space heating during the winter in Rotorua (Su, & Wu, 2019).
According to the instructions for the Ventia™ Rapid Allergen Test, dust samples on the carpets of living rooms and bedrooms of the 13 sample houses were collected by a vacuum cleaner fitted with a DUSTREAM® collector, and dust samples were then tested using the Rapid Test cassette. Test results can identify four different levels of dust-mite allergens (see Table 2).
Table 2. Four levels of indoor dust-mite allergens
Dust-mite allergen levels Allergen in dust Action
Undetectable level - No action is needed
Low level (acceptable) <0.2 micrograms per gram of dust No action is needed Medium level (unacceptable) 0.2–1.0 micrograms per gram of dust Action needed to reduce allergen High level (unacceptable) ≥ 1 microgram per gram of dust Action needed to reduce allergen
Air temperatures and relative humidity adjacent to floors and ceilings of different indoor spaces in the 13 sample houses and the 2 sample houses in Rotorua, and shaded outdoor spaces were continuously measured and recorded at 15-minute intervals, 24 hours a day, by HOBO temperature and relative humidity (RH) loggers, from March 2018 to January 2019. According to the instructions of Biodet Services Ltd (consulting industrial microbiologists), the researchers used clear, standard Sellotape to collect mould samples from the indoor surface areas of the 13 sample houses in the Minginui, Te Whaiti and Murupara areas. The Sellotape with the mould samples was then folded in non-stick baking paper and placed into a plastic bag; the samples were then sent to the local testing lab, where they were examined both macroscopically and microscopically.
The study investigated differences and improvements in indoor microclimatic conditions related to indoor allergens from dust-mite and mould of local houses associated with increasing the R-values of

798
Bin Su, Lian Wu, Peter McPherson and Renata Jadresin-Milic
the building envelope from 1.9 for the roof, 1.5 for the wall, 1.3 for floor and 0.13 glazing, as required by the New Zealand building standards in 1996, to the 2009 requirements of 2.9 for the roof, 1.9 for the wall, 1.3 for floor and 0.26 for glazing (Climate Zone 1 and Zone 2). Indoor microclimatic data of the local houses derived from the field studies of two Auckland houses with lightweight timber frame construction. House 1 was built in 2000 (R-values for Roof: 1.9, Wall: 1.5, Floor: 1.3, Single Glazing: 0.13). House 1 had 2 occupants and used an electronic heater in the master bedroom only for the evening time during the field study. House 2 was built in 2012 (R-values for Roof: 2.9, Wall: 1.9, Floor: 1.3, Double Glazing: 0.26) in accordant to the current building code. House 2 had 2 occupants and did not use any space heating during the field study, although there is a heat pump. Air temperatures and relative humidity adjacent to floors and ceilings of indoor spaces in two Auckland houses (upstairs northern master bedroom, downstairs northern open living space including living, kitchen and dining room, downstairs southern bedroom and corridor) and under shaded outdoor space were continuously measured at 5-minute intervals 24 hours a day for about 56 days during the winter months by Lascar EL- USB-2 USB Humidity Data Logger (Su, 2017).
3. Data analysis
3.1. Correlations between indoor microclimatic data and indoor allergens
Field-study tests of dust mites and mould in 18 indoor spaces (rooms) of 13 sample houses in Minginui, Te Whaiti and Murupara showed seven sample houses with high levels of dust-mite allergens and six sample house with medium levels of dust-mite allergens. Field-study tests of dust mites and mould in 2 sample houses in Rotorua showed the two sample houses with low levels (acceptable level) of dust-mite allergens and without mould growth on indoor surface. Table 3 shows winter mean indoor microclimatic conditions of the 13 sample houses with medium and high levels of dust-mite allergens in Minginui, Te Whaiti and Murupara and the two Rotorua houses with low levels of dust-mite allergens. To compare indoor microclimatic conditions between the houses with low levels (acceptable level) of dust-mite allergens and the houses with high and medium levels (unacceptable levels) of dust-mite allergens, indoor mean relative humidity adjacent to the floor (69.8%) of the houses with low levels of dust-mite allergens (acceptable level) were clearly lower than 75% (the threshold for dust mites to thrive), indoor mean relative humidity adjacent to the floor of the houses with high allergen levels (78%) and medium allergen levels (87.4%) were clearly higher than 75%, the threshold for dust mites to thrive; test results of dust samples from the carpets of the 13 sample houses showed high or medium dust-mite allergen levels. To compare the indoor microclimatic conditions of the houses with high dust-mite allergen levels and the houses with medium dust-mite allergen levels (although in the houses with both high and medium levels of allergens, the indoor relative humidity met the threshold for dust mites to thrive), indoor mean air temperature and the mean air temperature adjacent to the floor (13.1 °C and 11.2 °C respectively) of the houses with high allergens was 3.5 °C and 3.2 °C higher than in the houses with medium allergens (9.6 °C and 8.0 °C respectively).
According to field-study data of the two Rotorua houses (see Table 4), to control indoor dust-mite allergens at an acceptable level, indoor mean relative humidity adjacent to the floor must be maintained below 70%, indoor relative humidity adjacent to floor must be maintained below 75% (the threshold for dust mites to thrive) for 20 hours (19.7 hours in Table 4) a day during winter and below 80% all the time (99% of winter time or 23.8 hours per day in Table 4) in winter. To achieve these conditions, the indoor mean temperature must be maintained at 17 °C (16.7 °C in Table 4) or higher. If indoor relative humidity

799
New Zealand House Indoor Microclimate and Allergens
adjacent to the floor can be controlled below the threshold for dust mites to thrive (75%) for 20 hours a day during the winter, it will not reach the threshold for mould germination. (The percentage of winter time in the two Rotorua houses, when indoor mean relative humidity was equal to or more than 80%, was only 1%, or 9.2 winter days, which was much lower than the threshold (30 days) for mould germination). If the mould spores never germinate in a house, mould will never grow on indoor surfaces. If indoor dust-mite allergen levels can be controlled at low (acceptable) levels, the house is unlikely to have a mould problem in the local climate with mild and wet winters.
Table 3. Winter mean indoor microclimatic conditions of the 13 sample houses and the 2 Rotorua houses with different levels of dust-mite allergens.
Mite allergen level High dust-mite allergens
Medium dust-mite allergens
Low dust-mite allergens
Tested houses 7 houses (9 rooms) 6 houses (9 rooms) 2 Rotorua houses (4 rooms) Test points Indoor
mean Floor mean
Indoor mean
Floor mean
Indoor mean
Floor mean
Mean T 13.1 11.2°C 9.6°C 8.0°C 16.7°C 15.2°C Time T≥16°C 21% 4% 3% 0% 60% 35% Time T≥18°C 12% 0% 1% 0% 34% 5% Time T≥20°C 7% 0% 1% 0% 9% 0% Time T≥22°C 4% 0% 0% 0% 1% 0% Mean RH 71.2% 78.0% 80.8% 87.4% 63.9% 69.8% Time RH≥50% 91% 99% 99% 100% 99% 100% Time RH≥60% 81% 98% 97% 99% 72% 96% Time RH≥70% 63% 80% 86% 96% 19% 51% Time RH≥75% 49% 65% 76% 93% 4% 18% Time RH≥80% 30% 45% 61% 88% 0% 1% Time RH≥85% 13% 22% 37% 73% 0% 0% Time RH≥90% 3% 5% 14% 36% 0% 0% Time RH≥100% 0% 0% 0% 0% 0% 0%
Table 4: Winter mean indoor microclimatic conditions of the two Rotorua houses with low levels of dust-mite allergens.
Mite-allergen level Low dust-mite allergens (acceptable level) Tested houses 2 Rotorua houses (4 rooms)
Test points Ceiling
Indoor Floor Ceiling Indoor Floor mean mean mean mean mean mean
Mean T 18.3°C 16.7°C 15.2°C 18.3°C 16.7°C 15.2°C Mean RH 58% 63.9% 69.8% 58% 63.9% 69.8% Time in winter Percentages of time in winter Time per day Time T≥16°C 71% 60% 35% 17.0h 14.4h 8.4h Time T≥17°C 62% 47% 18% 14.9h 11.3h 4.3h Time T≥18°C 53% 34% 5% 12.7h 8.2h 1.2h Time T≥20°C 32% 9% 0% 7.7h 2.2h 0.0h Time T≥22°C 14% 1% 0% 3.4h 0.2h 0.0h Time RH≤70% 87% 81% 49% 20.9h 19.4h 11.8h

800
Bin Su, Lian Wu, Peter McPherson and Renata Jadresin-Milic
Time RH≤75% 97% 96% 82% 23.3h 23h 19.7h Time RH≤80% 100% 100% 99% 24h 24h 23.8h
3.2. Correlation between dust-mite and mould
Most of the sample houses with a high level of dust-mite allergens also had an abundant or moderate level of Cladosporium, most of the sample houses with a medium level of dust-mite allergens also had low to moderate levels of Cladosporium (see Table 5). Cladosporium was the only identified type of mould, and had the highest frequency of detected mould in the 13 sample houses. Cladosporium is the most important indoor allergen, and a well-known trigger for asthma (Peternel, Culig, & Hrga, 2004; Flannigan, Samson, & Miller, 2001; Piecková & Jesenská, 1999). During most of the time in winter, indoor mean relative humidity of the sample houses was higher than 50% and 60% (thresholds of dust- mite survival and mould growth conditions, respectively). The threshold (75–80% or higher) of relative humidity for dust mites to thrive and the threshold (80% or higher) of relative humidity for mould spore germination are quite close. If a house has high or medium levels of dust-mite allergens, it is likely to have a mould growth problem, and vice versa. The occupants can find visible mould growth on indoor surfaces but cannot see dust mites in the carpet. There was no Cladosporium detected on the indoor surfaces of five sample houses. This does not necessarily mean there could not have been higher levels of Cladosporium in these houses, but that it was present at low levels at the time of testing. This could be explained by cleaning, by the location of sampling, or other factors. Mould test results can be influenced by occupants’ daily life and depend on how often the occupants clean the indoor surfaces, especially for the areas with visual mould.
Table 5: Sample houses with high or medium level of dust-mite allergens and mould in test results.
Houses 1 2 3 4 5 6 7 Dust-mite High High High High High High High allergens Cladosporium Moderate Abundant - Abundant - - Abundant Unidentified fungus
- - Low - - Low to Moderate
-
Houses 8 9 10 11 12 13 Dust-mite allergens
Medium Medium Medium Medium Medium Medium
Cladosporium Moderate No Low No Moderate Low to moderate
Unidentified fungus
Low Moderate Low to moderate
Moderate to abundant
Moderate to abundant
Low
3.3 Evaluating indoor microclimatic conditions of houses with different R-values
To control indoor dust-mite allergens at an acceptable level and prevent indoor mould problem in an indoor space, indoor mean relative humidity adjacent to the floor must be maintained below 70%, indoor relative humidity adjacent to the floor must be maintained below 75% (the threshold for dust mites to thrive) for 20 hours a day during winter and below 80% all the time in winter. To achieve these conditions, the indoor mean temperature must be maintained at 17 °C or higher.

801
New Zealand House Indoor Microclimate and Allergens
For house 1 (see Table 6), except the upstairs north master bedroom using temporary space heating, indoor mean relative humidity adjacent to the floor in the live room (70%), the downstairs south bedroom (75%) and the corridor (70%) were equated to or higher than 70%; time per winter day in the live room (19.0h), the downstairs south bedroom (11.5h) and the corridor (18.0h), when indoor mean relative humidity adjacent to the floor were below 75%, were less than 20h, and time per winter day in the live room (22.8h), the downstairs south bedroom (19.2h) and the corridor (21.8h) when indoor mean relative humidity adjacent to the floor were below 80% were less than 24h a day. The indoor mean temperature of the live room (15.5°C), the downstairs south bedroom (14.2°C) and the corridor (15.3°C) were lower than 17°C.
Table 6. Winter time related to different ranges of indoor temperature and RH of the Houses 1
Indoor spaces Live room Downstairs south bedroom
Upstairs north master bedroom
Corridor
Test points Indoor mean
Floor mean
Indoor mean
Floor mean
Indoor mean
Floor mean
Indoor mean
Floor mean
Outdoor
Mean T 15.5°C 14.9°C 14.2°C 13.7°C 16.9°C 16.2°C 15.3°C 14.8°C 10.4°C Time T≥16°C 34.7% 14% 11.2% 0% 69.2% 63% 34.0% 10% 1.70% Time T≥18°C 4.6% 0% 0% 0% 32.7% 20% 2.9% 0% 0% Time T≥20°C 0.1% 0% 0% 0% 6.7% 1% 0% 0% 0% Time T≥22°C 0% 0% 0% 0% 0.1% 0% 0% 0% 0% Mean RH 67.7% 70% 73.4% 75% 64.3% 60% 67.9% 70% 85% Time RH≥50% 100% 100% 100% 100% 100% 100% 100% 100% 99.9% Time RH≥60% 90.8% 99% 100% 100% 69.7% 86% 90.4% 96% 97.4% Time RH≥70% 34.7% 52% 71.4% 82% 24.6% 31% 35.8% 53% 86.8% Time RH≥75% 12.3% 21% 38.2% 52% 8.8% 10% 15.6% 25% 77.8% Time RH≥80% 0% 5% 13.4% 20% 0% 0% 1.5% 9% 68.4% Time/day RH≤70% 15.7h 11.5h 6.9h 4.3h 18.1h 16.6h 15.4h 11.3h 3.2h Time/day RH≤75% 21.0h 19.0h 14.8h 11.5h 21.9h 21.6h 20.3h 18.0h 5.3h Time/day RH≤80% 24.0h 22.8h 20.8h 19.2h 24.0h 24.0h 23.6h 21.8h 7.6h
For house 2 without space heating (see Table 7), except the downstairs south bedroom, indoor mean relative humidity adjacent to the floor in the live room (65%), the master bedroom (62%) and the corridor (61%) were clearly lower than 70%; time per winter day in the live room (23.3h), the master bedroom (23.8h) and the corridor (23.8h) when indoor mean relative humidity adjacent to the floor were below 75% were more than 20 h, and indoor mean relative humidity adjacent to the floor of those rooms were lower than 80% for 24h a day. The indoor mean temperature of the live room (16.8°C), the master bedroom (17.9°C) and the corridor (17.0°C) were also equated to or higher than 17°C. Although the indoor microclimatic condition of the downstairs south bedroom did not meet the requirement to control indoor dust-mite allergens at an acceptable level, winter time (21.2 days for 23% of winter time) in the downstairs south bedroom, when indoor relative humidity adjacent to the floor, was lower than 30 days, the threshold of mould spore germination.
Southern indoor spaces do not have any direct sunlight during the winter and are on the cold side of the house. Floor areas of southern bedrooms are commonly smaller than the northern bedrooms and the other spaces. A smaller floor area could potentially result in big ratios of external wall area to the indoor space volume or window area to the floor area of that room. Increasing the ratio of external

802
Bin Su, Lian Wu, Peter McPherson and Renata Jadresin-Milic
surface area to indoor space volume of a southern bedroom will increase heat exchange between indoor and outdoor and heat loss through wall and window areas during the winter. Windows are commonly a weak part of the building envelope for thermal resistance, even double glazed windows, compared with wall and roof with sufficient insulation. Big ratio of window area to indoor space volume of the southern downstairs bedroom can negatively impact indoor thermal comfort conditions. The negative impact of a big ratio of window to indoor space volume of the southern downstairs bedroom could overrule or degrade the positive impact of higher insulation levels and double glazed windows on its indoor thermal comfort conditions.
Table 7. Winter time related to different ranges of indoor temperature and RH of the Houses 2
Indoor spaces
Test points
North live room
Indoor Floor mean mean
Downstairs south bedroom
Indoor Floor mean mean
Upstairs north master bedroom Indoor Floor mean mean
Corridor
Indoor Floor mean mean
Outdoor
Mean T 16.8°C 16.5°C 14.8°C 14.3°C 17.9°C 17.2°C 17.0°C 16.9°C 10.4°C Time T≥16°C 78.7% 78% 28.3% 20% 71.1% 69% 76.2% 69% 1.70% Time T≥18°C 21.8% 13% 4.9% 1% 44.9% 41% 30.7% 34% 0% Time T≥20°C 1.0% 0% 0% 0% 18.7% 15% 4.0% 9% 0% Time T≥22°C 0% 0% 0% 0% 6.4% 3% 0.2% 0% 0% Mean RH 62.8% 65% 68.6% 76% 61.1% 62% 63% 61% 85% Time RH≥50% 99.4% 100% 100% 100% 97.5% 99% 100% 100% 99.9% Time RH≥60% 69.2% 81% 95.7% 100% 58.6% 68% 69.7% 60% 97.4% Time RH≥70% 11.8% 20% 41.4% 83% 8.0% 11% 10.8% 6% 86.8% Time RH≥75% 1.3% 3% 12.6% 57% 0.3% 1% 1.2% 1% 77.8% Time RH≥80% 0% 0% 2.5% 23% 0% 0% 0.04% 0% 68.4% Time/day RH≤70% 21.2h 19.2h 14.1h 4.1h 22.1h 21.4h 21.4h 22.6h 3.2h Time/day RH≤75% 23.7h 23.3h 21.0h 10.3h 23.9h 23.8h 23.7h 23.8h 5.3h Time/day RH≤80% 24.0h 24.0h 23.4h 18.5h 24.0h 24.0h 24.0h 24.0h 7.6h
4. ConclusionsThe study identified that there were correlations between dust-mite and mould problems in indoor spaces of the sample houses with insufficient insulation. If a house had a dust-mite allergen problem (medium or high levels of dust-mite allergens), it was likely to have a mould problem, and vice versa, in a temperate climate with mild and wet winters. According to field-study data, to control indoor dust-mite allergens at a low (acceptable) level, indoor mean relative humidity adjacent to the floor must be maintained below 70%, indoor relative humidity adjacent to the floor must be maintained below 75% (the threshold for dust mites to thrive) for 20 hours a day during winter and below 80% all the time in winter. To achieve these conditions, the indoor mean temperature must be maintained at 17 °C or higher. If indoor relative humidity adjacent to the floor can be controlled below the threshold for dust mites to thrive (75%) for 20 hours a day during the winter, it will not reach the threshold for mould germination. If the mould spores never germinate in a house, mould will never grow on indoor surfaces. If indoor dust-mite allergen levels can be controlled at low (acceptable) levels, the house is unlikely to have a mould problem in a temperate climate with mild and wet winters.

803
New Zealand House Indoor Microclimate and Allergens
For an Auckland house with sufficient insulation and double glazing windows (R-values for Roof: 2.9, Wall: 1.9, Floor: 1.3, Double Glazing: 0.26) in accordant to the current building code, except the south indoor space, the baselines of indoor temperature and relative humidity of indoor spaces without using space heating can meet the minimum requirement to control indoor dust-mite allergens at an acceptable level and prevent mould problem under a temperate climate with mild and wet winters. A further study can focus on adding more insulation in the southern wall and limiting the ratio of window area to indoor space volume of the southern indoor space for improving indoor thermal and health conditions of southern indoor spaces.
For an Auckland house with based insulation and single glazing windows (R-values for Roof: 1.9, Wall: 1.5, Floor: 1.3, Single Glazing: 0.13 required for Climate Zone 1 and 2 in New Zealand) in accordant to NZS 4218P:1996 Energy efficiency: Housing and small building envelope, the baselines of indoor temperature and relative humidity of indoor spaces without using space heating cannot meet the minimum requirement to control indoor dust-mite allergens at an acceptable level and prevent mould problem. With temporary space heating, indoor temperature and relative humidity of indoor can meet the minimum requirement to control indoor dust-mite allergens at an acceptable level and prevent mould problem.
Acknowledgements This work was partially supported by the National Science Challenge funding under Grant: SRA5-KTKR- Toi Ohoma. The authors would like to thank Dr Tepora Emery, Sylvia Tapuke, Ian McLean, Tony Goodman and Daniel Martin, who gave us help and support to visit the sample houses in Minginui, Te Whaiti, Murupara and Rotorua for the field studies.
References Arlian, L. G., Yella, L. & Morgan, M. S. (2010). House dust mite population growth and allergen production in
cultures maintained at different temperatures. The Journal of Allergy and Clinical Immunology, 125(2), AB17. Arlian, L. G., Neal, J. S., & Vyszenski-Moher, D. L. (1999). Reducing relative humidity to control the house dust mite
Dermatophagoides farinae. The Journal of Allergy and Clinical Immunology, 104(4), 852–856. Arlian, L. G., Rapp, C. M., & Ahmed S. G. (1990). Development of Dermatophagoides pteronyssinus (Acari:
Pyroglyphidae). The Journal of Medical Entomology, 27(6), 1035–1040. Arlian, L. G., Bernstein, I. L., & Gallagher, J. S. (1982). The prevalence of house dust mites, Dermatophagoides spp,
and associated environmental conditions in homes in Ohio. The Journal of Allergy and Clinical Immunology, 69(6), 527–532.
Arundel, A. V., Sterling, E. M., Biggin, J. H. & Sterling, T. D. (1986). Indirect health effects of relative humidity in indoor environment. Environmental Health Perspectives, 65, 351–361.
ASHRAE. (1993). ASHRAE Standard 62-2000 – Ventilation for Acceptable Indoor Air Quality. Atlanta, GA: American Society of Heating, Refrigeration and Air-conditioning.
BIA (Building Industry Authority). (1992). New Zealand Building Code, approved document H1, energy efficiency. Wellington, New Zealand: Building Industry Authority.
Block, S. S. (1993). Humidity requirements for mould growth. Applied Microbiology, 1, 287–293. Braubach, M., Jacobs D. E., & Ormandy, D. (Eds.). Environmental burden of disease associated with inadequate
housing: A method guide to the quantification of health effects of selected housing risks in the WHO European Region. Copenhagen, Denmark: WHO Regional Office for Europe.
Collins, K. J. (1986). Low indoor temperatures and morbidity in the elderly. Age and Ageing, 15(4), 211–20. Coppock, J. B. M., & Cookson, E. D. (1951). The effect of humidity on mould growth on construction material,
Journal of the Science of Food and Agriculture, December 1951, 534–537.

804
Bin Su, Lian Wu, Peter McPherson and Renata Jadresin-Milic
DBH (Department of Building and Housing). (2000). Compliance document for New Zealand Building Code, clause H1, energy efficiency. 2nd edition Wellington, New Zealand: Author.
DBH (Department of Building and Housing). (2001). Compliance document for New Zealand Building Code – Clause G5 Interior Environment. Wellington, New Zealand: Author.
Flannigan, B., Samson, R. A., & Miller, J. D. (Eds.). (2001). Microorganisms in home and indoor work environments: Diversity, health impacts, investigation and control. Abingdon-on-Thames, UK: Taylor and Francis.
Hart, B. J. (1998). Life cycle and reproduction of house-dust mites: Environmental factors influencing mite populations. Allergy, 53, 13–17.
Hens, H. L. S. C. (2000). Minimising fungal defacement. ASHRAE Journal, October 2000, 30–44. Howden-Chapman, P., Viggers, H., Chapman, R., O’Sullivan, K., Barnard, L. T. and Lloyd, B. (2012). Tackling cold
housing and fuel poverty in New Zealand: A review of policies, research, and health impacts. Energy Policy, 49, 134-142.
Korsgaard, J. (1982). Preventive measures in house-dust allergy. The American Review of Respiratory Disease, 125, 80–84.
MH. New Zealand Health Survey 2017/18; Ministry of Health: Wellington, New Zealand, 2018. Murray, A. B., & Zuk, P. (1979). The seasonal variation in a population of house dust mites in a North American city.
Journal of Allergy and Clinical Immunology, 64, 266–269. Pasanen, A. L., Juutinem, T., Jantunem, M., et al. (1992). Occurrence and moisture requirements of microbial growth
in building materials. International Biodeterioration and Biodegraadation, 30, 273–283. Peternel, R., Culig, J., & Hrga, I. (2004). Atmospheric concentrations of Cladosporium spp. and Alternaria spp. spores
in Zagreb (Croatia) and effects of some meteorological factors. Annals of Agricultural and Environmental Medicine, 11(2), 303–307.
Piecková, E., & Jesenská, Z. (1999). Microscopic fungi in dwellings and their health implications in humans. Annals of Agricultural and Environmental Medicine, 6(1), 1–11.
Siebers, R., Wickens K. and Crane. J. (2006). House dust mite allergens and allergic diseases – the Wellington Asthma Research Group studies. New Zealand Journal of Medical Laboratory Science, 60 (2), 49-58.
SNZ (1977). Provisional New Zealand Standard 4218:1977 Minimum insulation requirements for residential buildings. Wellington, New Zealand: Standards New Zealand.
SNZ (1990). New Zealand Standard 4303:1990 Ventilation for Acceptable Indoor Air Quality. Wellington, New Zealand: Standards New Zealand.
SNZ (1996). New Zealand Standard 4218:1996 Energy efficiency: Housing and small building envelope. Wellington, New Zealand: Standards New Zealand.
SNZ (2004). New Zealand Standard 4218: 2004 Energy Efficiency: Small building envelope. Wellington, New Zealand: Standards New Zealand.
SNZ (2009). New Zealand Standard 4218: 2009 Thermal Insulation: Housing and small buildings. Wellington, New Zealand: Standards New Zealand.
Su, B. (2006). Prevention of winter mould growth in housing. Architectural Science Review, 49(4), 385–390. Su, B. (2017). Field study of Auckland housing winter indoor health conditions associated with insulation, heating and
energy. In M. A. Schnabel (Ed.), Proceedings of 51st International Conference of the Architectural Science Association (ANZAScA). (pp. 713–722).
Su, B., & Wu, L. (2019). Chapter Two: House Occupants' Health Conditions and Their Living Conditions (pp. 28-46), Healthy homes, healthy people (Eds. Emery, T. & McLean, I.). Porirua, New Zealand: Toi Ohomai Institute of Technology (https://www.buildingbetter.nz/publications/ktkr/Emery_McLean_Eds_2019_Toitu_te_kainga.pdf).
WHO (1987). Health impact of low indoor temperatures. Copenhagen, Denmark: World Health Organisation, Regional Office for Europe.
WHO (2009). WHO guidelines for indoor air quality: dampness and mould. Copenhagen, Denmark: World Health Organisation, Regional Office for Europe.

805
The 54th International Conference of the Architectural Science Association (ANZAScA) 2020
Occupant Energy Behaviours – A Review of Indoor Environmental Quality (IEQ) and Influential factors
Achini Shanika Weerasinghe1, Eziaku Rasheed2 and James Olabode Bamidele Rotimi3 Massey University, Auckland, New Zealand
[email protected], [email protected], [email protected]
Abstract: Occupants try to adjust or adapt to the indoor environment to improve the indoor environment quality (IEQ). However, the impact of these occupant behaviours is overlooked in building energy modelling. Furthermore, there is no general agreement on the factors that drive occupants’ decisions and reflect their energy behaviour. A comprehensive literature review and a subsequent desk study of journal articles and fifty (50) theses highlight the impact of occupant behaviours on the energy consumption of buildings based on the relationship to IEQ and influential factors. Accordingly, the most prominent behaviours that drive the energy consumption of buildings are the operation of plug-ins and equipment, opening/closing windows, turning lighting on/off, adjusting thermostats, lowering blinds, and occupant presence. Amongst, interaction with opening/closing of windows to improve IEQ operation of plug-ins and adjusting thermostat as a response to thermal discomfort, and turning lighting on/off and lowering blinds to improve visual conditions directly affect the building's energy use. Also, indoor environmental conditions, climate, building characteristics, building systems and devices, user- centred design, and building elements are recognized as important influencers. Overall, this study highlights the importance of incorporating occupant comfort related parameters and significant influential factors to recognise the dynamic nature of occupant energy behaviours.
Keywords: Occupant energy behaviours; IEQ; influential factors; review.
1. IntroductionOver the past three decades, researchers proved that occupant behaviours highly influence the increase of building energy demand (Hoes et al., 2009; Langevin et al., 2015). For example, it is identified that occupant behaviour is the main reason behind the discrepancy between simulated and actual energy (Langevin et al., 2015). Further, Hoes et al. (2009) showed that occupant behaviour is an important input parameter influencing the whole building energy simulations, therefore uncertainty in occupant behaviours may significantly affect such predictions. Similarly, Lin and Hong (2013) demonstrated via computer simulations that the inefficient work style of occupants leads to double the energy. However, occupant behaviours are often simplified in building simulations of design and operation stages (D'Oca et al. 2018).
Imaginable Futures: Design Thinking, and the Scientific Method. 54th International Conference of the Architectural Science Association 2020, Ali Ghaffarianhoseini, et al (eds), pp. 805–814. © 2020 and published by the Architectural Science Association (ANZAScA).

806
Achini Shanika Weerasinghe, Eziaku Rasheed and James Olabode Bamidele Rotimi
As Schweiker (2010) defined “occupant energy behaviour refers to the unconscious and conscious actions of a human being to control the physical parameters of the surrounding built environment based on the comparison of the perceived environment with the sum of past experiences”. Usually, these reactions of occupants are possible when they are in discomfort and trying to create a comfortable indoor environment (Nicol and Humphreys, 2002). According to Bluyssen (2019), building occupants influence the internal environment through their presence and by modifying the building's systems and components. These activities aim to improve thermal comfort, acoustic comfort, visual comfort and indoor air quality (IAQ) which together ensure the indoor environmental quality (IEQ) of buildings.
Occupants who are driven by these adaptive IEQ triggers aim to achieve the desired personal comfort level using various strategies. They include building systems and elements such as building openings, shading, lighting, HVAC systems, hot water, and electrical appliances (Delzendeh et al., 2017). Other strategies are the occupants' actions and inactions. As Hong et al. (2015) identified, occupants' actions include opening and closing windows, adjusting blinds, adjusting thermostat temperature, and turning the air conditioning on or off) and the inactions include moving to a different location and dealing with some inconvenience.
Also, the behaviours are different from one building occupant to another, due to physical, physiological, psychological differences of occupants, and other external factors such as economic and regulatory (energy regulation and compliance) related (Bluyssen, 2019). Occupant behaviours such as occupant presence, window opening, light switching, adjusting blinds and clothing level adjustments, but not limited to, are a function of environmental factors such as indoor air temperature and daylight illuminance (Haldi and Robinson, 2011). Furthermore, another set of empirical studies added that the energy consumption of buildings having similar physical features differs due to the comfort preferences of occupants, their interaction with building systems, occupancy patterns, and lifestyle of occupants (Andersen et al., 2009; Maier et al., 2009).
Accordingly, the occupant energy behaviour that is driven from IEQ parameters: thermal, visual, aural, and IAQ and influential factors: physical, physiological, psychological, contextual, and social contribute to the discrepancy between expected and actual energy use. Therefore, this paper reviews the previous studies related to occupant energy behaviours, IEQ parameters, and factors influencing occupant energy behaviours to highlight the impact of occupant behaviours on the energy consumption of buildings. To achieve the aim of this study, related literature was identified referring to published journals, conference articles, and theses. Fifty (50) published articles were examined to highlight the significant energy-driven occupant behaviour and influential factors. The findings are discussed in the following sections.
2. Occupant Energy BehavioursIn a recent study, Hong et al. (2017) categorised occupant energy behaviours into two main clusters as adaptive behaviours and non-adaptive behaviours. According to the authors, adaptive behaviours include actions such as opening/closing windows, lowering blinds, adjusting thermostats, turning lighting on/off, and operation of plug-ins (e.g. personal heaters, fans, and electrical systems for space heating/cooling). Other actions include adjusting clothing levels, drinking hot/cold beverage, and moving through spaces to adapt themselves to their environment. On the other hand, non-adaptive behaviours include actions such as occupant presence, operation of plug-ins and electrical equipment (e.g. office and home appliances) and reporting complaints regarding discomfort. They can also be inactions like accepting the existing indoor environmental conditions when there is no access,

807
Occupant Energy Behaviours – A Review of Indoor Environmental Quality (IEQ) and Influential factors
awareness, and choice to control comfort (O'Brien and Gunay, 2014). Thus, these occupant actions directly depend on the occupants' comfort requirements and have an influence on overall building performance in terms of building energy consumption and comfort (Wang et al., 2016). For the 50 theses reviewed, seven (07) most frequently researched occupant energy behaviours that are significant in building energy consumption were identified and summarised in Table 1.
Table 1: Significant Occupant Energy Behaviours in Buildings
Occupant Behaviour Number of theses Operation of plug-ins and electrical equipment (personal heaters, fans, and electrical systems for space heating/cooling, office, and home appliances)
25
Opening/closing windows 13 Turning lighting on/off 13 Occupant presence 12 Adjusting thermostats 9 Lowering blinds 5 Reporting discomfort 3
As seen in Table 1, the majority of the studies (50%) focused on the operation of plug-ins and electrical equipment, while a considerable amount of studies (25%) focused on opening/closing windows, turning lighting on/off, and occupant presence. Additionally, only a very few researchers have focused on adjusting thermostats, lowering blinds, and reporting discomfort. However, these include studies that focused on either single energy behaviour or multiple energy behaviours. Different occupant behaviours can have a substantial impact on building energy consumption. For example, window opening behaviour might lead to a significant variation in the building’s Energy Use Intensity (EUI). According to Fabi et al. (2012), this variation equals a factor of four in commercial buildings in the United States and by a factor of three in identical apartments in Denmark. However, with careful consideration, energy savings from occupant behaviour could constitute 10% to 20% for residential buildings and 5% to 30% for commercial buildings (Lin and Hong, 2013). A study by Staats et al. (2004) that modified two energy behaviours: thermostat use and diffuser covering providing energy usage feedback, estimated a modest 6% savings in energy use. Furthermore, Dietz et al. (2009) stated that occupant energy savings have the potential to reduce 7.4% of U.S. emissions.
3. IEQ and Occupant Energy BehavioursThis section discusses the relationship between IEQ and occupant energy behaviours. From literature, IEQ is broadly categorized categorised into four main parameters; thermal comfort, IAQ, visual comfort, and acoustic comfort (Bluyssen, 2019; Hong et al., 2015).
3.1. Thermal comfort
Thermal comfort is defined by ISO (2005) as "that condition of mind which expresses satisfaction with thermal conditions". Environmental parameters determine an occupant thermal sensation, namely: air temperature, air velocity, mean radiant temperature, and relative humidity and personal parameters: metabolic rate and clothing factor (Asadi et al., 2017). Occupants often can operate windows and doors to improve room temperature and air exchange in a naturally ventilated building. In contrast, in mechanically ventilated buildings, occupants must accept the system operation or personally adjust

808
Achini Shanika Weerasinghe, Eziaku Rasheed and James Olabode Bamidele Rotimi
their metabolic rate and clothing level and adjust themselves to the indoor environment (Daum et al., 2011). Furthermore, occupants tend to adjust thermostats, fans, and heaters to adapt the indoor environment to their preference when they feel thermally uncomfortable (Langevin et al., 2015).
The thermal comfort sensation varies from person to person. Therefore, buildings should enable occupant interactions to choose their preferred conditions to decrease thermal discomfort (Nicol and Humphreys, 2002). Accordingly, the presence of adaptive interactions such as clothing, desk fan helps to achieve both perceived work-performance and thermal satisfaction (Tanabe et al., 2015). Previous studies that provided personalised ventilation systems such as individual air flow rate control and ceiling fans founded that a majority of occupants prefer those systems over HVAC systems and accept irrespective of the ambient air temperature (Chen et al., 2012).
However, the occupants should not compromise the energy savings of the building when they modulate their thermal preferences. Mostly, the adjustment of a thermostat to set the cooling set-point below 24 °C is an occupant energy waste behaviour (Sun and Hong, 2017). Another study, Nisiforou et al. (2012) showed that the occupant misbehaviour in energy use leads to energy waste. In contrast, occupants' willingness to switching off plug loads and HVAC systems in unoccupied spaces act as major contributing behaviours to avoid energy waste (Sun and Hong, 2017). Therefore, the empirical studies were focused on developing adaptive control procedures to intervene on windows, plug load and other building devices and systems to save energy without disturbing users' comfort while respecting occupants' thermal preferences (Stazi et al., 2017).
3.2. Indoor air quality (IAQ)
IAQ refers to the air quality inside buildings and structures (Amasyali and El-Gohary, 2016) that is related to the health and comfort of occupants where poor IAQ leads to Sick Building Syndrome (SBS) (Asadi et al., 2017). Further, respiratory health issues are expected among residential and office building occupants due to indoor air pollutants (Amasyali and El-Gohary, 2016). Further, residential building occupants with respiratory disease are more concerned about IAQ, while occupants with regular health symptoms such as sore throat are less satisfied with IAQ in their houses. Several factors influence IAQ like humidity, odour, crowding, and CO2 concentration.
Mostly, indoor CO2 concentration is used to control IAQ because it correlates directly with occupant presence (Nienaber et al., 2019; Wolf et al., 2019). Human exhalation has a much higher CO2 concentration than the outdoor air. Therefore, adequate ventilation is needed to dilute and remove the CO2 being accumulate in the indoor air (Wolf et al., 2019). Pavlovas (2004) recommended that more ventilation air is required to maintain proper IAQ when more people occupied a space. For example, ASHRAE Standard 62.1 (2019) specifies a CO2 concentration level of no greater than 700 ppm above outdoor air levels, along with specified ventilation rates that would satisfy a substantial majority (about 80%) of occupants. Further, the minimum ventilation rate required in office spaces is 5 cfm per persona of outdoor air to ensure adequate indoor air.
Previous studies suggest that the operation of windows is important in a building to make IAQ pleasant, to supply more ventilation air, and to reduce CO2 concentration. As Andersen et al. (2013) found in their study, any correlations between behaviour and CO2 concentration indicate relationships between air quality and occupant behaviour. Further, Calì et al. (2016) elaborated that there is a significant statistical correlation between window openings and the CO2 concentration where an increase of CO2 concentration level inside the building leads to an increase of window opening likelihood

809
Occupant Energy Behaviours – A Review of Indoor Environmental Quality (IEQ) and Influential factors
for more than 45% of the windows. Also, IAQ also influences the use/adjust of humidifiers and opening/closing of internal/external doors (Amasyali and El-Gohary, 2016).
Though these actions by occupants improve the IAQ, they also cause increased energy consumption. For example, Barlow and Fiala (2007) showed that the opening of windows increases energy consumption due to changes in indoor temperature because of allowing outside air into the building. A clear tendency can be observed that heating costs are positively correlated with a lower air quality, where better air quality is traded for an improved thermal sensation (von Grabe, 2019). Moreover, energy savings can be achieved by reducing the average ventilation rate via occupancy-controlled ventilation, while keeping an acceptable indoor climate and better control of indoor pollutant concentrations (Pavlovas, 2004).
Meanwhile, Dong et al. (2010) explained a connection between behavioural patterns and building energy management systems. They developed and implemented sensor-based modelling to predict user behaviours by connecting the behavioural patterns to building energy, and comfort management systems, where results indicated a 30% potential for energy savings without scarifying the IAQ. Development of an occupant behaviour model capable of simulating individual actions with a significant effect upon IAQ help to evaluate occupant exposure to the indoor environment (Dziedzic et al., 2019).
3.3 Visual Comfort
Visual comfort is often identified as a subjective impression associated with lighting quality, quantity, and distribution (Amasyali and El-Gohary, 2016). Moreover, occupant visual comfort in buildings assures that they are not being subjected to excessive contrast, glare, and unacceptable levels of brightness (Hong et al., 2015). The ISO standard ISO 8995-1:2002 states that the maintained work plane illuminance should not be less than 200 lx in the general working areas.
Especially, light intensity stimulates responses physiological, psychological, and physical human responses. Physical responses include lighting switch on/off, dimming lighting, and adjusting blinds (Naspi et al., 2018). In particular, the lights are turned on at the decrease of the indoor illuminance, while switching off when the occupants leave the room. However, the switch on/off behaviour usually takes place upon arrival or just before departure due to the placement of controls next to the door instead of close to the desks (Lindelöf and Morel, 2006). Contrary, in some cases occupants were observed not to use overhead lighting at all during the day (Jennings et al., 2000). Therefore, occupants' artificial lighting preferences vary from one participant to another based on the accessibility for lighting controls (Sadeghi et al., 2016). Likewise, occupants interact with their blinds to avoid glare and gain daylighting (Chan and Tzempelikos, 2013). Psychological factors and view causes opening the blinds, while they close blinds due to physiological reasons (Day et al., 2012). Other factors influencing the operation of the blinds are the orientation of the building, season, and sky conditions (Mahdavi, 2009). Lower energy consumption was expected with higher utilisation of daylight, easy access to lighting controls, and user-centered control while assuring occupants' visual comfort (Moore et al., 2002).
3.4. Acoustic comfort
The basic acoustic comfort is keeping the level of background noise within an acceptable range (Hong et al., 2015). A noise exposure level of below 85 dBA for eight hours is recommended to reduce the occupational noise-induced hearing loss of workers (NIOSH, 2014).

810
Achini Shanika Weerasinghe, Eziaku Rasheed and James Olabode Bamidele Rotimi
However, occupant relationship with aural stimuli goes beyond basic acoustic comfort and involves with series of complex factors. Such factors are personal, contextual, social, and symbolic transactions that are often unattended, yet of vital importance in acoustical design (Hong et al., 2015). Furthermore, Newsham et al. (2013) added that, even though acoustic comfort performs poorly of IEQ and contribute to occupant behaviour, yet acoustics is not included in most building performance simulation (BPS). The noise transmission can be regulated through the use of the windows (von Grabe, 2019). Often, the occupants do not open the windows because of the outdoor sources of noise like traffic jams and indoor sources like as HVAC systems, noise from talking, walking, and drinking water systems (Asadi et al., 2017).
4. Factors influencing occupant energy behavioursResearchers in this field classified factors influencing energy-driven occupant behaviour into various categories. For example, Schweiker (2010) identified that occupant behaviour is influenced by external factors such as temperature, humidity, airspeed, illuminance, etc. and internal factors such as cultural background, attitudes, preferences, etc. The authors also indicated that compared to external factors, the influence of internal factors on occupant behaviour is very complex. Similarly, Polinder et al. (2013) elaborated internal factors as biological, psychological, and social factors and external factors as building and building equipment properties, physical environment, and time. Additionally, Andersen et al. (2013) indicated that building properties: building ownership, available systems, and equipment also influence occupant energy behaviour.
Fabi et al. (2012), introduced a framework for classifying factors influencing energy-driven adaptive and non-adaptive behaviours by dividing those factors into five groups: physical environmental, contextual, psychological, physiological, and social, that include both internal and external factors. On the contrary, O'Brien and Gunay (2014) grouped the contextual factors into physical environmental factors that remain unchanged over a while; psychological factors that are related to individual and social factors; and physiological factors that are not immediate triggers.
Apart from the above categorisations, Peng et al. (2012) classified behaviours into environmentally- related: actions driven by environmental parameters; time-related: actions repeated in certain time- lapses; and random: actions depending on uncertain not quantifiable factors base on an analysis of human behaviours in residential buildings. Based on Peng et al.'s study, Stazi et al. (2017) reviewed the occupants' behaviours inside buildings assessing the main driving factors for their actions, divided into environmental and time-related stimuli. The results of their study suggest that not only environmental factors play a key role in the use of building systems but also contextual factors, as well as routine and habits, largely affect occupants' behaviours.
More recently, Schweiker et al. (2018) provided a framework to categorise factors influencing occupant behaviours into adaptive triggers, non-adaptive triggers, and contextual factors. Accordingly, adaptive triggers are physiological triggers that originate from a signal in the body that prompts the occupant to take action or physical environmental triggers that describe the indoor and outdoor environments and have been proven to stimulate occupant action in response to a thermal, olfactory, visual, and aural stimulus to modify the surrounding built environment to restore or improve the comfort conditions. In contrast, non-adaptive triggers are factors that are independent of physical environmental triggers.
Accordingly, the factors identified in the previous research thesis can be categorised into six (06) main types of factors; physical environmental, physiological, psychological, contextual, social, and time-

811
Occupant Energy Behaviours – A Review of Indoor Environmental Quality (IEQ) and Influential factors
related categories. Table 2 identifies and classifies the significant influential factors under those major categories of factors.
Table 2: Significant Factors influencing Occupant Behaviours in Buildings
Type of Factor Influential Factors Number of Sources Physical Environmental Factors
Indoor environmental conditions - Temperature, Humidity, 17 Air speed, Radiant temperature, Noise, Air pressure, Indoor air quality
Climate 11 Contextual Factors Building characteristics 9
Building systems and appliances 6 User-centred design - Usability and controllability of 6 heating/cooling/ventilation Building elements 4
Time related Day and time 5 Social Factors Number of occupants in an organisation 4
The education level 4 Job-status and income 4
Physiological factors
Psychological factors
Gender 4 Metabolic rate 4 Clothing insulation 4 Attitudes, motivations, and values 4 Subjective norms/normative beliefs 3 Perceived behavioural control 3 Personality traits 3
As seen in Table 2, seventeen (17) significant factors were identified under major influential categories. In terms of the physical environmental category, two (2) sub-factors that significantly influence occupant behaviours were identified. Amongst, most of the studies (34%) have highlighted indoor environmental conditions as a significant factor that determine occupant behaviours, while the majority of other studies (20%) showed climate conditions (ex. Warm and winter seasons, region, weather conditions) as another significant factor affecting occupant behaviour in buildings. In the contextual category, four (4) sub-factors were identified, where most studies (18%) have highlighted building characteristics (e.g. area, shape, size, texture, colour, elevation, etc.). Additionally, building systems and appliances, user-centered design, and building elements were also highlighted in most of the studies as significant factors influencing occupant energy-driven behaviour. In terms of time-related factors, only one factor has been identified as significant. The majority of the studies considered day and time such as day of the week, time of the day, and duration; as a significant factor that determines occupant behaviour. In terms of social factors, three (3) sub-factors; the number of occupants in an organisation, the education level, and job status andincome were determined by most of the studies. Considering physiological factors, three (3) factorsappeared in most of the empirical studies. Those factors are gender, metabolic rate, and clothinginsulation. For psychological factors, the majority of studies highlighted attitudes/motivations/values,subjective norms/normative beliefs, perceived behavioural control, and personality traits that influencing occupant behaviour in buildings. Physical environmental and contextual factors were highlighted by many previous studies compared to other factors. Therefore, the focus on other factors such as physiological,psychological, social, and time-

812
Achini Shanika Weerasinghe, Eziaku Rasheed and James Olabode Bamidele Rotimi
related factors was rarely considered as significantly influencing factors for energy-driven occupant behaviours in the previous research studies.
Conclusion As most people spend more than 90% of their time indoors, the IEQ plays an important role in occupant behaviours and a building’s energy efficiency. Improving building energy efficiency is one of the best strategies for reducing the energy consumption of buildings while maintaining the comfort and well- being of occupants. This paper reviewed previous studies related to occupant energy behaviours, IEQ parameters, and factors influencing occupant energy behaviours to understand human-related causes of energy increase in buildings.
The findings of this study show that majority of existing studies focus on actions such as the operation of plug-ins, opening/closing windows, turning lighting on/off, adjusting thermostats, and lowering blinds as measures employed by occupants to adapt the indoor environment to their preferences. Non-adaptive behaviours such as the occupant presence and reporting discomfort were also highlighted. Accordingly, these behaviours are identified as significant to the energy consumption in buildings. Of critical consideration, many studies focus on a single energy behaviour; however, in reality, likely, these energy behaviours are often inter-linked. In terms of IEQ parameters that related to occupant energy behaviour, opening/closing of windows mainly related to almost all the IEQ parameters considered: thermal comfort, IAQ, visual comfort, and acoustic comfort. Whereas, operation of plug-ins and adjusting thermostats related to thermal comfort, turning lighting on/off, and lowering blinds related to visual comfort. Therefore, IEQ caused to drive much of the significant energy-driven occupant behaviours. Physical environmental and contextual factors were highlighted by many previous studies compared to other factors. Amongst, indoor environmental conditions, climate, building characteristics, building systems and appliances, user-centered design, and building elements are the most significant factors influencing occupant behaviours. However, the focus on other factors such as physiological, psychological, social, and time-related factors was rarely considered as significantly influencing factors for energy-driven occupant behaviours in the previous research studies.
Therefore, it is recommended to consider occupant comfort-related parameters and all the significant, influential factors to recognise the dynamic nature of occupant energy. Thereby incorporating those into energy efficiency strategies in behaviour in diverse types of buildings is required. A scientific study that describes the dominant IEQ parameters and factors that are involved in energy behaviours needs to be conducted with the occupants in actual buildings.
References Andersen, R. V., Toftum, J., Andersen, K. K. and Olesen, B. W. (2009) Survey of occupant behaviour and control of
indoor environment in Danish dwellings, Energy and Buildings, 41(1), 11-16. Andersen, R., Fabi, V., Toftum, J., Corgnati, S. P. and Olesen, B. W. (2013) Window opening behaviour modelled
from measurements in Danish dwellings, Building and Environment, 69(2013), 101-113. Asadi, I., Mahyuddin, N. and Shafigh, P. (2017) A review on indoor environmental quality (IEQ) and energy
consumption in building based on occupant behavior, Facilities, 35(11/12), 684-695. ASHRAE (2019) ANSI/ASHRAE Standard 62.1 – 2019 Ventilation for acceptable indoor air quality, American Society
of Heating, Refrigerating, and Air-Conditioning Engineers, Inc. Atlanta, GA. Barlow, S. and Fiala, D. (2007) Occupant comfort in UK offices-How adaptive comfort theories might influence
future low energy office refurbishment strategies, Energy and Buildings, 39(2007), 837-846.

813
Occupant Energy Behaviours – A Review of Indoor Environmental Quality (IEQ) and Influential factors
Bluyssen, P. M. (2019) Towards an integrated analysis of the indoor environmental factors and its effects on occupants, Intelligent Buildings International, Doi: 10.1080/17508975.2019.1599318.
Calì, D., Andersen, R. K., Müller, D. and Olesen, B. (2016) Analysis of occupants' behavior related to the use of windows in German households, Building and Environment, 103(2016), 54-69.
Chan, Y. and Tzempelikos, A. (2013) Efficient Venetian blind control strategies considering daylight utilization and glare protection, Solar Energy, 98(2013), 241–254.
Chen, Y., Raphael, B. and Sekhar, S. (2012) Individual control of a personalized ventilation system integrated with an ambient mixing ventilation system, HVAC&R Research, 18(2012), 1136–1152.
Daum, D., Haldi, F. and Morel, N. (2011) A personalized measure of thermal comfort for building controls, Building and Environment, 46(2011), 3–11.
Day, J., Theodorson, J. and Van Den Wymelenberg, K. (2012) Understanding controls, behaviors and satisfaction in the daylit perimeter office: a daylight design case study, Journal of Interior Design, 37(1), 17–34.
Delzendeh, E., Wu, S., Lee, A. and Zhou, Y. (2017) The impact of occupants’ behaviours on building energy analysis: A research review, Renewable and Sustainable Energy Reviews, 80(2017), 1061-1071.
Dietz, T., Gardner, G. T., Gilligan, J., Stern, P. C. and Vandenbergh, M. P. (2009) Household actions can provide a behavioral wedge to rapidly reduce US carbon emissions. Proceedings of the National Academy of Sciences, 106(44), 18452-18456.
D'Oca, S., Hong, T. and Langevin, J. (2018) The human dimensions of energy use in buildings: A review, Renewable and Sustainable Energy Reviews, 81(2018), 731-742.
Dong, B., Andrews, B., Lam, K. P., Höynck, M., Zhang, R., Chiou, Y. S. and Benitez, D. (2010) An information technology enabled sustainability test-bed (ITEST) for occupancy detection through an environmental sensing network, Energy and Buildings, 42(2010), 1038–1046.
Fabi, V., Andersen, R. V., Corgnati, S. and Olesen, B. W. (2012) Occupants' window opening behaviour: A literature review of factors influencing occupant behaviour and models, Building and Environment, 58(2012), 188-198.
Haldi, F. and Robinson, D. (2011) The impact of occupants' behaviour on building energy demand, Journal of Building Performance Simulation, 4(4), 323-338.
Hoes, P., Hensen, J. L. M., Loomans, M. G. L. C., de Vries, B. and Bourgeois, D. (2009) User behavior in whole building simulation, Energy and Buildings, 41(3), 295-302.
Hong, T., D'Oca, S., Turner, W. J. N. and Taylor-Lange, S. C. (2015) An ontology to represent energy-related occupant behavior in buildings. Part I: Introduction to the DNAs framework, Building and Environment, 92(2015), 764-777.
Hong, T., Yan, D., D'Oca, S. and Chen, C. F. (2017) Ten questions concerning occupant behavior in buildings: The big picture, Building and Environment, 114(2017), 518-530.
ISO (2002) ISO 8995-1:2002 Lighting of workplaces — Part 1: Indoor, International Organization for Standardization. Switzerland, Geneva.
Langevin, J., Wen, J. and Gurian, P.L. (2015) Simulating the human-building interaction: Development and validation of an agent-based model of office occupant behaviors, Building and Environment, 88(2015), 27–45.
Lin, H. and Hong, T (2013) On variations of space-heating energy use in office buildings, Applied Energy, 111(2013), 515–528.
Lindelöf, D. and Morel, N. (2006) A field investigation of the intermediate light switching by users, Energy and Buildings, 38(2006), 790–801.
Mahdavi, A. (2009) Patterns and Implications of User Control Actions in Buildings, Indoor and Built Environment, 18(5), 440-446.
Maier, T., Krzaczek M. and Tejchman J. (2009) Comparison of physical performances of the ventilation systems in low-energy residential houses, Energy and Buildings, 41, 337-353.
Moore, T., Carter, D. and Slater, A. (2002) User attitudes toward occupant-controlled office lighting, Lighting Research & Technology, 34(3), 207–216.
Naspi, F., Arnesano, M., Zampetti, L., Stazi, F., Revel, G. M. and D'Orazio, M. (2018) Experimental study on occupants’ interaction with windows and lights in Mediterranean offices during the non-heating season, Building and Environment, 127(2018), 221-238.

814
Achini Shanika Weerasinghe, Eziaku Rasheed and James Olabode Bamidele Rotimi
Newsham, G. R., Birt, B. J., Arsenault, C., Thompson, A. J. L., Veitch, J. A., Mancini, S., . . . Burns, G. J. (2013) Do ‘green’ buildings have better indoor environments? New evidence, Building Research & Information, 41(4), 415- 434.
Nicol, J.F. and Humphreys, M.A. (2002) Adaptive thermal comfort and sustainable thermal standards for buildings, Energy and Buildings, 34(2002), 563–572.
Nienaber, F., Wolf, S., Wesseling, M., Calì, D., Müller, D. and Madsen, H. (2019) Validation, optimisation and comparison of carbon dioxide-based occupancy estimation algorithms, Indoor and Built Environment, 0(0) 1–15.
NIOSH (2014) Occupational Noise Exposure, National Institute for Occupational Safety and Health, Available at https://www.cdc.gov/niosh/docs/96-110/ (accessed 13 October 2020).
Nisiforou, O. A., Poullis, S. and Charalambides, A.G. (2012) Behaviour, attitudes and opinion of large enterprise employees with regard to their energy usage habits and adoption of energy saving measures, Energy and Buildings, 55(2012), 299–311.
O'Brien, W. and Gunay, H. B. (2014) The contextual factors contributing to occupants' adaptive comfort behaviors in offices - A review and proposed modeling framework, Building and Environment, 77(2014), 77-87.
Pavlovas, V. (2004) Demand controlled ventilation: a case study for existing Swedish multifamily buildings, Energy and Buildings, 36(10), 1029–1034.
Peng, C., Yan, D., Wu, R., Wang, C., Zhou, X. and Jiang Y. (2012) Quantitative description and simulation of human behavior in residential buildings, Building Simulation, 50(2012), 85-94.
Polinder, H., Schweiker, M., Schakib-Ekbatan, K., Fabi, V., Andersen, R., Morishita, N., . . . Wagner, A. (2013) Total energy use in buildings: analysis and evaluation methods, final report Annex 53: Volume II Occupant behavior and modelling, Institute for Building Environment and Energy Conservation, Tokyo.
Sadeghi, S. A., Karava, P., Konstantzos, I. and Tzempelikos, A. (2016) Occupant interactions with shading and lighting systems using different control interfaces: a pilot field study, Building and Environment, 97(2016), 177–195.
Scanu L. (2017) Towards archetypes of self-tuned models for connected buildings, Université Grenoble Alpes. Schweiker, M. (2010) Occupant behaviour and the related reference levels for heating and cooling, Tokyo City
University, Japan. Schweiker, M., Carlucci, S., Andersen, R. K., Dong, B. and O’Brien, W. (2018) Occupancy and Occupants’ Actions, In
A. Wagner, W. O’Brien, & B. Dong (Eds.), Exploring Occupant Behavior in Buildings: Methods and Challenges,Cham: Springer International Publishing, (pp. 7-38).
Staats, H., Harland, P. and Wilke, H. A. (2004) Effecting durable change a team approach to improve environmental behavior in the household, Environment and Behavior, 36(3), 41-67.
Stazi, F., Naspi, F. and D'Orazio, M. (2017) A literature review on driving factors and contextual events influencing occupants' behaviours in buildings, Building and Environment, 118, 40-66.
Sun, K. and Hong, T. (2017) A simulation approach to estimate energy savings potential of occupant behavior measures, Energy and Buildings, 136, 43-62.
Tanabe, S., Haneda, M. and Nishihara, N. (2015) Workplace productivity and individual thermal satisfaction, Building and Environment, 91(2015), 42–50.
von Grabe, J. (2019) Using the Instance-Based Learning Paradigm to Model Energy-Relevant Occupant Behaviors in Buildings, Cognitive Computation, https://doi.org/10.1007/s12559-019-09672-w
Wang, C., Yan, D., Sun, H. and Jiang, Y. (2016) A generalized probabilistic formula relating occupant behavior to environmental conditions, Building and Environment, 95(2016), 53-62.
Wolf, S., Calı,̀ D., Krogstie, J. and Madsen, H. (2019) Carbon dioxide-based occupancy estimation using stochastic differential equations, Applied Energy, 236, 32-41.

815
The 54th International Conference of the Architectural Science Association (ANZAScA) 2020
Occupants’ satisfaction in BREEAM Excellent Certified Buildings
Azadeh Montazami1, Sepideh Korsavi2 and Gideon Howell3 Coventry University, Coventry, UK
[email protected], [email protected] [email protected]
Abstract: This paper examines occupants’ satisfaction of three BREEAM excellent certified buildings at Coventry University in the UK. Occupants’ satisfaction is evaluated against passive and active sustainable approaches used in these buildings to improve Indoor Environmental Quality (IEQ). This paper adopts a quantitative approach by running a seven-point rating scale questionnaire to obtain occupants’ overall satisfaction score in each building. A total of 180 occupants were surveyed to investigate occupants’ satisfaction of the thermal environment, indoor air quality, visual and acoustic environment during summer and winter. The results show that average satisfaction scores are towards the more acceptable part of the scale in BREEAM Excellent certified buildings. The sustainable approaches towards these buildings and applied passive and active techniques improve occupants’ satisfaction of Indoor Environmental Quality. It should be highlighted that Coventry University has improved its sustainability approaches towards its buildings over time, with newer buildings showing a higher level of satisfaction.
Keywords: BREEAM, Indoor Environmental Quality, Occupants’ Satisfaction
1. IntroductionIn the 1990s, it was acknowledged that occupant’s discomfort and complaints about the indoor environment were not caused by one single parameter (Fransson et al. 2007). The concept of Indoor Environment Quality (IEQ) can be grouped into four main categories: thermal comfort, indoor air quality (IAQ), visual comfort and acoustic comfort (Marino et al. 2012, Wong et al. 2008, Sarbu and Sebarchievici 2013, Lai et al. 2009, Mendell and Heath 2005, Frontczak and Wargocki 2011, Dorizas et al. 2015, Astolfi and Pellerey 2008). The most important aspects of IEQ are satisfaction with the thermal environment (Frontczak and Wargocki 2011, Wong et al. 2008, Huang et al. 2012, Humphreys 2005, Zuhaib et al. 2018, Sakhare, V. V. and Ralegaonkar, R. V. 2014, Astolfi and Pellerey 2008, Lai et al. 2009, Ralegaonkar, R. V. and Sakhare, V. V. 2014, Yee 2014) and Indoor Air Quality (Zuhaib et al. 2018, Astolfi and Pellerey 2008, Humphreys 2005, Ghita and Catalina 2015), acoustic environment (Zhang, D. and Bluyssen 2019, Heinzerling et al. 2013, Astolfi and Pellerey 2008, Lai et al. 2009) and visual environment (Heinzerling et al. 2013). Due to the significance of Indoor Environment Quality and energy consumption, the Building Research Establishment Environmental Assessment Method (BREEAM) was launched in 1990. BREEAM is the world’s leading and most widely used environmental schemes (Dutch Green Building Council 2010) that assesses the ‘absolute’ performance to minimize the overall CO2 emission and energy consumption (Lee and Burnett 2008). BREEAM is a voluntary rating system used in the UK and internationally to promote sustainable built environment practices (Curran et al. 2018). It can be applied to new and existing built environment developments to evaluate their impact on energy and indoor environmental quality
Imaginable Futures: Design Thinking, and the Scientific Method. 54th International Conference of the Architectural Science Association 2020, Ali Ghaffarianhoseini, et al (eds), pp. 815–824. © 2020 and published by the Architectural Science Association (ANZAScA).

816
Azadeh Montazami, Sepideh Korsavi, and Gideon Howell
(Curran et al. 2018). Overall the scheme promotes standards reflecting local sustainability issues and environmental conditions (Reed et al. 2011). BREEAM covers issues in different categories of sustainability including Management, Health & Well Being, Energy, Innovation, Transportation, Water, Materials, Waste, Land Use and Ecology and Pollution (Dutch Green Building Council 2010, Altomonte et al. 2016). Different aims of BREEAM include (Dutch Green Building Council 2010) to mitigate the impacts of buildings on the environment, enable buildings to be recognised according to their environmental benefits, provide a credible, environmental label for buildings, stimulate demand for sustainable buildings (Dutch Green Building Council 2010). BREEAM has set benchmarks for different types of buildings, therefore, there is a growing interest to acquire BREEAM ratings in architectural, engineering, and construction industries. The total score is calculated based on the credits available, the number of credits achieved for each category and a weighting factor (Roderick et al. 2009). The overall performance of the building can be categorised as Unclassified (<30), Pass (≥30), good (≥45), very good (≥55), Excellent (≥70) and outstanding (≥85) (Roderick et al. 2009). This paper aims to investigate occupants’ satisfaction of Indoor Environment Quality (thermal environment, Indoor air quality, visual environment and acoustic environment) in three BREEAM Excellent buildings. This paper studies how ‘BREEAM’ scheme and sustainable approaches affect occupants’ satisfaction.
2. MethodologyThis paper focuses on assessing students’ satisfaction in three BREEAM excellent university buildings in Coventry, the UK with relation to sustainable approaches used in these building. All of these buildings were awarded the BREEAM “Excellent” which means that overall performance of the building is more than 70 and that the building represents performance equivalent to the top 10% of UK new non-domestic buildings. Post Occupancy Evaluation (POE) Surveys were conducted in three Coventry University Buildings known as HUB, ECB and AGB. The POE survey employs Building USE Studies Methodology (known as BUS methodology). This survey was carried out in two episodes of summer and winter to have more comprehensive data. In each episode, 30 occupants were surveyed in each building, resulting in participation of a total of 180 occupants. The surveys were handed out to the students who are regular users of the buildings. The participants were mainly selected from the communal spaces of these three buildings, such as the lobby.
2.1. Buildings’ Sustainable Features
Coventry University currently uses BREEAM to ensure sustainable design, construction and operation of new buildings. The passive and active systems, which are implemented in these building, are studied in the following.

817
Occupants’ satisfaction in BREEAM Excellent Certified Buildings
2.1.1. The HUB
In 2011, the Hub was built to be a new innovative idea of “home-to-home” building where students can have access to the student union, retail, social learning, and support facilities. The Hub was built on 2600 m2 of flexible floor space to facilitate most of the university events. Different architectural techniques and technologies that are applied in this naturally ventilated building include
• Boreholes water • Heat rejection method for the central cooling plant, • Ground source heat pump for sustainable cooling throughout the structure, • Rooftop photovoltaics for on-site power supply,• Solar thermal plants have been installed to heat the water, • Low energy light fittings which are regulated with a PIR controlling lighting system,• Water harvest tank to limit water usage. • Atrium design to improve thermal comfort, indoor air quality and visual comfort
Figures 1 and 2 show the exterior and interior of the HUB building.
Figure 1: Exterior façade of HUB. Figure 2. Communal space and atrium in the HUB
2.1.2. Energy and Computing Building (ECB)
Engineering and Computing Building (ECB) is built on 15000 m2 and houses over 4000 students, Figures 3 and 4. The ECB aims to promote the further use of technology and computer-aided software in higher education.
Figure 3: Exterior façade of HUB. Figure 4. Communal space and atrium in the HUB

818
Azadeh Montazami, Sepideh Korsavi, and Gideon Howell
Sustainable feature applied in this building include • Applying Exposed concrete with a high thermal mass as an integral feature to facilitate nigh time
ventilation during summer and reduce heating demand during winter • Atrium design to improve thermal comfort, indoor air quality and visual comfort• Designing air handling within the building so that nothing is wasted. • Recycling the heat in the stale air to pre-heat the air drawn in into the building • Using plate heat exchangers to pre-heat the air intake • The solar thermal array of evacuated tubes on the roof to preheats the water going into the boilers
and reduce the primary energy demand, Figure 5. • Green roof on the lower wing of the building that retains rainwater like a sponge and decreases the
occurrence of flash flooding, Figure 6. • Capturing, harvesting and filtering the rain falling on the building to flush all the toilets within the
new building.
Figure 5: Exterior façade of HUB. Figure 6. Communal space and atrium in the HUB
Given a super-insulated structure, solar optimized space design and heat recycling features, the primary heat load is very small for this size of this building.
2.1.3. Alison Gingell Building (AGB)
The Alison Gingell building is the newest completed facility at Coventry University. The facility boasts 1170 m2 of interactive and flexible spaces which function as simulated hospital wards. Figures 7 and 8 show the exterior and interior view of AGB. Questionnaire surveys were filled out in the lobby of the AGB.
Figure 7: Exterior of AGB showing courtyard. Figure 8. Interior of AGB showing atrium space

819
Occupants’ satisfaction in BREEAM Excellent Certified Buildings
The Reception Atrium in this building forms a narrow enfilade of space that connects the street with the Landscape Courtyard, Figure 9. The Large Atrium space with its “inhabited stair” has become part of the external landscape of the courtyard, delineated by the colonnade, Figure 10.
Figure 9: Reception Atrium that connects the street with the Landscape Courtyard (left). Figure 10. Atrium space with its “inhabited stair” (right) (Source: Aidan Ridyard: Architect of AGB)
3. Results3.1. Satisfaction level at HUB by Sustainable approaches Occupants’ average satisfaction of the indoor environment quality is assessed in different buildings. Table 1 shows that occupants’ average votes on IEQ are towards the more satisfying part of the scale, i.e. 4-6 at HUB. As can be seen in Table 1, the satisfaction level with the visual environment (average of 6) is the highest, followed by the thermal and acoustic environment.
Table 1. Occupants’ satisfaction level of IEQ at HUB Satisfaction Factors Scale 1 2 3 4 5 6 7 Scale Temperature in Summer Uncomfortable 5.1 (7) Comfortable Temperature in Winter Uncomfortable 4.3 (7) Comfortable Air in Summer Stuffy (1) 4.3 (7) Fresh Air in Winter Stuffy (1) 4.3 (7) Fresh Condition in Summer: Overall Unsatisfactory 4.2 (7) Satisfactory Condition in Winter: Overall Unsatisfactory 4.8 (7) Satisfactory Lighting: Overall Unsatisfactory 5.6 (7) Satisfactory Noise: Overall Unsatisfactory 4.8 (7) Satisfactory
Various passive and active strategies that are implemented in this building impact on occupant’s satisfaction level. This building has a deep compact plan with an atrium in the middle that maintains visual comfort and benefits thermal comfort in communal spaces passively. As an active strategy for thermal comfort, this building has a ground source heat pump for sustainable cooling. Furthermore, the curtain wall cladding system provides intelligent control of the internal environment via an easy to use building management system.
3.2. Satisfaction level at ECB by Sustainable approaches

820
Azadeh Montazami, Sepideh Korsavi, and Gideon Howell
Table 2 shows that occupants’ average satisfaction votes on IEQ are towards the more satisfying part of the scale, i.e. 4 and 5 at ECB. Results show occupant’s positive perception of the thermal environment, indoor air quality and visual comfort. This can be related to the internal atrium that promotes stack ventilation, improves the thermal environment and invites light into the building. As can be seen in Figure 3, the innovative honeycomb facade is very well insulated and designed to maximise the control of solar gain. These restrict solar glare into the building during the summer months when the sun is high in the sky and channel light into the building during winter when the sun is low. This reduces the base demand for lighting and heating and gives a light and airy feel to the internal space. The acoustic panels also are installed inside the space to reduce the reverberation time and maintain acoustic comfort.
Table 2. Occupants’ satisfaction level of IEQ at ECB Satisfaction Factors Scale 1 2 3 4 5 6 7 Scale
Temperature in Summer Uncomfortable (1) 5.3 (7) Comfortable Temperature in Winter Uncomfortable (1) 4.4 (7) Comfortable Air in Summer Stuffy (1) 4.4 (7) Fresh Air in Winter Stuffy (1) 5.2 (7) Fresh Condition in Summer: Overall Unsatisfactory (1) 5.1 (7) Satisfactory Condition in Winter: Overall Unsatisfactory (1) 5.1 (7) Satisfactory Lighting: Overall Unsatisfactory (1) 5.2 (7) Satisfactory Noise: Overall Unsatisfactory (1) 4.0 (7) Satisfactory
Regarding the thermal environment, the extra heat is absorbed on the internal surface of the building (concrete column) during the day. Absorbed extra heat can be released to the outside during summer months through stack ventilation or internal spaces during winter. During the winter months, the absorbed heating will go off from the concrete, maintaining a good temperature overnight. Therefore, boilers don’t have to work so hard to obtain a comfortable temperature for the next day. In the summer months, the benefits are even greater as the concrete keeps the building cool by removing the need for inefficient air conditioning units. Heat is absorbed into the concrete throughout the day and is driven out of the building at night by opening large glass vents at the top of the central atrium. In the morning, the concrete is nice and cool and ready to soak up the heat of the forthcoming day.
Figure 11. Communal spaces in ECB (left) Figure 12. A summary of sustainable approaches applied in ECB (right)

821
Occupants’ satisfaction in BREEAM Excellent Certified Buildings
3.3. Satisfaction level at AGB by Sustainable approaches
Table 3 shows that occupants’ average satisfaction votes on IEQ are towards the more satisfying part of the scale, i.e. 4 and 5 in AGB. In this building, designers have considered the complex relationship between indoor air quality, thermal, visual and acoustic environment. Several strategies are considered in this building to maintain Acoustic comfort. The south side windows are carefully designed to bounce back and attenuate external noise from the adjacent road. Acoustic panels are also installed in the internal atrium to attenuate reverberation time. Furthermore, the north side atrium promotes stack ventilation, improves the thermal environment and invites light into the building.
Table 3. Occupants’ satisfaction level of IEQ at AGB
Several other studies have shown the importance of atriums on improving indoor environment quality. The study by Wang et al. (2017) shows through overflow into the atrium, air with higher temperature returns to the heat recovery unit for the heat exchange with the new fresh and cold air outside. The study by Du et al. (2020) highlights that large-volume atriums equipped with a large number of indoor architectural structures can absorb the sound to a certain extent. The design of the atrium should focus on a balance between the light and the thermal physical environments (Du et al. 2020). Several other studies have highlighted the role of outdoor atriums (courtyards) on improving the visual environment and indoor air quality (Korsavi et al. 2017, Gou et al. 2012).
3.4. University’s Approach to Improving IEQ over time
Figure 13 (left) shows the distribution of occupants’ vote on the overall noise level in HUB, ECB and AGB. The level of noise satisfaction in AGB (newly built) is higher compared to ECB and HUB. The designer team of AGB worked closely with both specialist technicians and stakeholders to maintain acoustic comfort by carefully attenuate background noise level and reverberation time. Therefore, noise satisfaction (Vote 4 to 7) in AGB is around 75%. Furthermore, overall noise satisfaction has increased in ECB during the last years. In 2015, a comprehensive Post Occupancy Evaluation (POE) Survey was conducted on regular occupants of the ECB which showed noise dissatisfaction of occupants. The results suggested that high noise dissatisfaction could be related to lack of soft surfaces, the large space and bare concrete columns. Therefore, the noise bounced off hard surfaces, which increased the reverberation time and reduced the occupants’ overall noise satisfaction. Following the 2015 survey, it was decided to hang acoustic panels
1 2 3 6 7
(7) Satisfactory 5.3 Unsatisfactory (1) Noise: Overall (7) Satisfactory 5.3 Unsatisfactory (1) Lighting: Overall (7) Satisfactory 5.4 Unsatisfactory (1) Condition in Winter: Overall (7) Satisfactory 5.4 Unsatisfactory (1) Condition in Summer: Overall (7) Fresh 5.4 Stuffy (1) Air in Winter (7) Fresh 4.4 Stuffy (1) Air in Summer (7) Comfortable 4.4 Uncomfortable (1) Temperature in Winter (7) Comfortable 5.3 Uncomfortable (1) Temperature in Summer Scale Scale Satisfaction Factors

822
Azadeh Montazami, Sepideh Korsavi, and Gideon Howell
100% 100%
from the ceiling to absorb the extra noise. This resulted in an improvement on Noise Overall satisfaction with the average satisfaction of 5, Table 3, while it was below 4 before the refurbishment.
Figure 13. Proportion (%) in noise satisfaction scale (left), Proportion (%) in light satisfaction scale (right) Scale [1= Unsatisfactory ……7= Satisfactory]
[1= Lowest level of dissatisfaction: 7= Highest level of satisfaction]
In addition, Figure 13 (right) shows the level of light dissatisfaction at AGB is lower than ECB with the lowest unsatisfactory level of 1.6% at AGB which is half of the lowest unsatisfactory level at ECB (3.3%). The lower level of dissatisfaction is partly related to different design at AGB. According to the AGB’ Architect (Aidan Ridyard), AGB atrium core is design differently from ECB and connect positively to the external space on its north side.
Figure 14. Comparative study of reception spaces in ECB and AGB (Source: Aidan Ridyard: Architect of AGB)
Prop
ortio
n (%
) in
nois
e sa
tisfa
ctio
n sc
ale
Prop
ortio
n (%
) in
light
sat
isfa
ctio
n sc
ale

823
Occupants’ satisfaction in BREEAM Excellent Certified Buildings
4. Conclusion
The results show how integrating different passive and active strategies in three BREEAM Excellent buildings impact occupants’ satisfaction level towards the thermal environment, IAQ, visual and acoustic comfort. The main sustainable architectural feature used in these three buildings is the atrium that improves lighting comfort, thermal comfort and indoor air quality. Occupants in the atrium may suffer from acoustic discomfort, however, these spaces are equipped with acoustic panels to absorb extra noise, reduce the reverberation time and improve acoustic comfort. Furthermore, Coventry University protocol aims to deliver the best internal environment quality for the occupants by running post-occupancy surveys. In the AGB, only two Satisfaction Factors have an average of 4. In the ECB, three Satisfaction Factors have an average of 4 which is lower than that in HUB with 4. This differences may be related to its construction time and learning a lesson from the past and types pf the atrium which are different in these buildings. AGB is newer than ECB and ECB is newer than the HUB. This result highlights the Coventry University’s approach to delivering better conditions for occupants.
Acknowledgements Authors would like to acknowledge the help of Pakeeza Waheed and Joe Stallard for collecting data. We would like to thank Aidan Ridyard, AGB’s Architect from Burrell Foley Fischer, for providing information on AGB. We would like to thank Adrian Leman who provide us BUS Questionnaire to carry out this study.
References Altomonte, S., Saadouni, S., and Schiavon, S. (2016) ‘Occupant Satisfaction in LEED and BREEAM-Certified Office
Buildings’. PLEA 2016 - 36th International Conference on Passive and Low Energy Architecture 1–7 Astolfi, A. and Pellerey, F. (2008) ‘Subjective and Objective Assessment of Acoustical and Overall Environmental
Quality in Secondary School Classrooms’. The Journal of the Acoustical Society of America 123 (1), 163–173 Curran, M., Spillane, J., and Clarke-Hagen, D. (2018) ‘Rics Cobra 2018 Rics Cobra 2018’. Urban Construction
Management: The Role of ICT An Emerging Technologies In External Stakeholder Management (April) Dorizas, P.V., Assimakopoulos, M., and Santamouris, M. (2015) ‘A Holistic Approach for the Assessment of the Indoor
Environmental Quality, Student Productivity, and Energy Consumption in Primary Schools.’ Environmental monitoring and assessment 187 (5), 259–277
Du, X., Zhang, Y., and Lv, Z. (2020) ‘Investigations and Analysis of Indoor Environment Quality of Green and Conventional Shopping Mall Buildings Based on Customers’ Perception’. Building and Environment [online] 177 (December 2019), 106851. available from <https://doi.org/10.1016/j.buildenv.2020.106851>
Dutch Green Building Council (2010) BREEAM-NL, LABEL FOR SUSTAINABLE REAL ESTATE Assessor Manual New Buildings.
Fransson, N., Västfjäll, D., and Skoog, J. (2007) ‘In Search of the Comfortable Indoor Environment: A Comparison of the Utility of Objective and Subjective Indicators of Indoor Comfort’. Building and Environment 42(5), 1886– 1890
Frontczak, M. and Wargocki, P. (2011) ‘Literature Survey on How Different Factors Influence Human Comfort in Indoor Environments’. Building and Environment 46 (4), 922–937
Ghita, S.A. and Catalina, T. (2015) ‘Energy Efficiency versus Indoor Environmental Quality in Different Romanian Countryside Schools’. Energy and Buildings 92, 140–154
Gou, Z., Lau, S.S.Y., and Zhang, Z. (2012) ‘A Comparison of Indoor Environmental Satisfaction between Two Green Buildings and a Conventional Building in China’. Journal of Green Building 7 (2), 89–104
Heinzerling, D., Schiavon, S., Webster, T., and Arens, E. (2013) ‘Indoor Environmental Quality Assessment Models: A Literature Review and a Proposed Weighting and Classification Scheme’. Building and Environment 70, 210–

824
Azadeh Montazami, Sepideh Korsavi, and Gideon Howell
222 Huang, L., Zhu, Y., Ouyang, Q., and Cao, B. (2012) ‘A Study on the Effects of Thermal, Luminous, and Acoustic
Environments on Indoor Environmental Comfort in Offices’. Building and Environment 49, 304–309 Humphreys, M.A. (2005) ‘Quantifying Occupant Comfort: Are Combined Indices of the Indoor Environment
Practicable?’ Building Research & Information 33 (4), 317–325 Korsavi, S.S., Montazami, A., and Zomorodian, Z.S. (2017) ‘Evaluating Thermal Environment and Thermal Comfort in
Schools Located in Kashan-Iran in Mid-Seasons’. in Passive Low Energy Architecture: Design to Thrive. held 2017. 1163–1170
Lai, A.C.K., Mui, K.W., Wong, L.T., and Law, L.Y. (2009) ‘An Evaluation Model for Indoor Environmental Quality (IEQ) Acceptance in Residential Buildings’. Energy and Buildings 41 (9), 930–936
Lee, W.L. and Burnett, J. (2008) ‘Benchmarking Energy Use Assessment of HK-BEAM, BREEAM and LEED’. Building and Environment 43 (11), 1882–1891
Marino, C., Nucara, A., and Pietrafesa, M. (2012) ‘Proposal of Comfort Classification Indexes Suitable for Both Single Environments and Whole Buildings’. Building and Environment 57, 58–67
Mendell, M.J. and Heath, G.A. (2005) ‘Do Indoor Pollutants and Thermal Conditions in Schools Influence Student Performance? A Critical Review of the Literature’. Indoor Air 15 (1), 27–52
Ralegaonkar, R.V. and Sakhare, V.V. (2014) ‘Development of Multi-Parametric Functional Index Model for Evaluating the Indoor Comfort in Built Environment’. Indoor and Built Environment 23 (4), 615–621
Reed, R., Wilkinson, S., Bilos, A., and Schulte, K.-W. (2011) ‘A Comparison of International Sustainable Building Tools – An Update The 17 Th Annual Pacific Rim Real Estate Society Conference , Gold Coast’. The 17th Annual PacificRim Real Estate Society Conference (January), 16
Roderick, Y., Mcewan, D., Wheatley, C., and Alonso, C. (2009) COMPARISON OF ENERGY PERFORMANCE ASSESSMENT BETWEEN LEED , BREEAM AND GREEN STAR Ya Roderick , David McEwan , Craig Wheatley and Carlos Alonso Integrated Environmental Solutions Limited , Helix Building , Kelvin Campus , West of Scotland Science Park , Gl. 1167–1176
Sakhare, V. V. and Ralegaonkar, R. V. (2014) ‘Indoor Environmental Quality: Review of Parameters and Assessment Models’. Architectural Science Review 57 (2), 147–154
Sarbu, I. and Sebarchievici, C. (2013) ‘Aspects of Indoor Environmental Quality Assessment in Buildings’. Energy and Buildings 60, 410–419
Wang, Y., Kuckelkorn, J., Zhao, F.Y., Spliethoff, H., and Lang, W. (2017) ‘A State of Art of Review on Interactions between Energy Performance and Indoor Environment Quality in Passive House Buildings’. Renewable and Sustainable Energy Reviews 72, 1303–1319
Wong, L.T., Mui, K.W., and Hui, P.S. (2008) ‘A Multivariate-Logistic Model for Acceptance of Indoor Environmental Quality (IEQ) in Offices’. Building and Environment 43 (1), 1–6
Yee, T.C. (2014) ‘Indoor Environmental Quality (IEQ): A Case Study in Taylor’s Universiti, Malaysia’. International journal of Engineering and Applied Sciences 5 (07), 1–11
Zhang, D. and Bluyssen, P.M. (2019) ‘Actions of Primary School Teachers to Improve the Indoor Environmental Quality of Classrooms in the Netherlands’. Intelligent Buildings International 1–13
Zuhaib, S., Manton, R., Griffin, C., Hajdukiewicz, M., Keane, M.M.M., and Goggins, J. (2018) ‘An Indoor Environmental Quality (IEQ) Assessment of a Partially-Retrofitted University Building’. Building and Environment 139, 69–85

825
The 54th International Conference of the Architectural Science Association (ANZAScA) 2020
Opportunities to reduce brick waste disposal
Salman Shooshtarian1, Tayyab Maqsood2, Carl Barrett3, Peter SP Wong4, Rebecca J. Yang5, Malik Khalfan6
1, 2, 4, 5, 6RMIT University, Melbourne Australia {salman.shooshtarian, tayyab.maqsood, peter.wong, rebecca.yang, malik.khalfan}@rmit.edu.au
3BGC (Australia) Pty Ltd, Perth, Australia [email protected]
Abstract: Brick is a widely used construction material in the Australian construction industry. It has different applications in construction elements, notably walls and pavements. Between 85–90% of new dwellings in Australia in 2011 were built with external brick walls and concrete flooring. Furthermore, brickwork generates an abundance of waste in construction projects each year. This paper investigates the opportunities for minimising the volume of brick waste across its supply chain based on circular economy principles. It develops a model called Brick- LoWMoR (Low of Waste, More of Resource) which can identify these opportunities across the brick supply chain from manufacturing through to design, construction and various end of life stages. This paper provides practical recommendations to improve brick waste management for construction and demolition activities. The recommendations can also inform the development of building codes and standards which impact on the construction and demolition (C&D) waste stream in Australia.
Keywords: Circular economy; construction material; waste management; resource recovery.
1. Introduction
Brick has different applications in construction elements, notably walls and pavements. They last for more than 100 years compared to contemporary lightweight alternatives which are effectively a short-term application of combustion of hydrocarbons. Bricks vary in terms of type, size and material used. Variation is primarily associated with the origin of materials used and time of the brick production. Between 2018 and 2019, the three main clay brick products in Australia were face bricks (65.5%), common bricks (22.1%), and clay pavers (12.4%) (Youl, 2018). In Australia, in 2011, between 85 and 90% of new dwellings were built with external brick walls and concrete flooring (Youl, 2018). However, this pattern has changed over the last few years, and the clay brick manufacturing industry (CBMI) is most affected. According to the latest IBISWorld data, the industry’s annual revenue growth between 2016 and 2021 is -7.5% generating -16.3% annual profit growth (IBISWorld, 2020). The key demand for brick comes from house construction, multi-unit apartment and townhouse construction, bricklaying services, landscaping services, commercial and industrial building construction, institutional building construction and hardware wholesaling. Residential construction activity largely drives demand for the CBMI industry's products. This includes both new construction and repairs and alterations. Low-interest rates and population growth have caused dwelling commencements to rise over the
Imaginable Futures: Design Thinking, and the Scientific Method. 54th International Conference of the Architectural Science Association 2020, Ali Ghaffarianhoseini, et al (eds), pp. 825–834. © 2020 and published by the Architectural Science Association (ANZAScA).

826
Salman Shooshtarian, Tayyab Maqsood, Carl Barrett, Peter SP Wong4, Rebecca J. Yang, and Malik Khalfan
past five years, supporting demand for bricks (Youl, 2018). Increasing demand from non-residential construction, such as commercial and industrial buildings, has also positively influenced the industry growth.
The increased usage of bricks due to the substantial rise in construction activities will result in a significant increase in the generation of brick waste during various stages of the supply chain including manufacturing, procurement, storage and construction. Furthermore, it is noted that brickwork can generate a large amount of waste in different construction projects each year. Globally, brick waste accounts for 50-70% of the construction waste generated in urban redevelopment and 30-50% in building operations (Al-Fakih et al., 2019). There are limited and scattered data available, showing how much brick waste is recycled or upcycled in Australia. According to the latest statistics extracted from the National Waste Report, 1,872,467 tonnes of brick waste was recycled in Australia in 2016-2017; the share of the C&D sector in this waste recovery is estimated to be 60.3%, the largest source of feedstock for brick waste recovery activities (Pickin et al., 2018). Due to its various impacts on society, economy and environment, the effective management of construction material wastes has become a high priority in Australia (Shooshtarian et al., 2020). Analysis of the clay brick lifecycle shows that there are many opportunities for minimising or redirecting brick waste from landfill. This study aims to explore these opportunities across the brick waste supply chain.
2. Development of a modelIn order to identify opportunities for reduction of brick waste disposal across its supply chain, several
pieces of relevant literature were collected and reviewed. These include academic outputs, industry reports and interviews, government guidelines and policies obtained from multiple research engines such as Google Scholar, Scopus and Web of Science. The basis of the review was to explore the circularity of this construction material and maximum utilisation of resources across the various supply chains. The findings resulted in the development of a model which outlines eleven opportunities to reduce waste disposal and demand for raw material excavation. The model (Figure 1), called Brick- Low of Waste and More of Resources (LoWMoR) shows how informed decisions and actions across the supply chain could determine the waste fate more sustainably. The model provides a pathway to stakeholders in the construction and resource recovery industries to reduce brick waste quantity across the supply chain.
Figure 1. The integrated supply chain lifecycle model for brick waste
827
Opportunities to reduce brick waste disposal
3. Results and discussionThe following sections explore strategies that contribute to lower brick waste disposal across the supply chain depicted in the Brick- LoWMoR model.
3.1. Manufacturing
The brick manufacturing industry is one of the efficient users of virgin resources in the production of construction materials. In Australia, there are numerous initiatives among manufacturers to reduce waste during production. For instance, Western Australia’s newest clay brick manufacturer, BGC’s Brikmakers® has returned all clay brick production waste back into the product mix since it was established in 2007. It also utilises wastes from its concrete and fibre cement manufacturing operations back into its concrete paver and backing block products (Scarvaci and Barrett, 2019). According to Brickworks Building Products, 2012, the Austral Bricks® plant in Victoria has markedly reduced the instance of malformed or off-specification green (unfired) bricks; it is reported that any such units are automatically recycled into the clay mix rather than going to landfill (Brickworks Building Products, 2012). Production of half bricks that are sometimes necessary for certain constructions is another strategy that can contribute to waste minimisation. It is reported that up to 75% of brick waste occurs when labourers attempt to cut bricks into half (Forsythe and Máté, 2007). Studies show that the application of lean and parallel-line manufacturing model aids in waste reduction during manufacturing (Shah and Ward, 2003). Lastly, the brick manufacturing processes can integrate other waste materials which in turn reduces the need for using brick raw materials. These include charcoal, wheat dust, oak husks and other biosolids (Scarvaci and Barrett, 2019), sewage (Tay, 1987), marble powder (Bilgin et al., 2012), fly ash (Lingling et al., 2005), waste glass and limestone powder waste (Turgut, 2008; Phonphuak et al., 2016), spent shea waste and steel slag (Shih et al., 2004) and textile sludge (Rahman et al., 2015). The successful application of about 20 waste materials has previously been reported and reviewed (Murmu and Patel, 2018; Al-Fakih et al., 2019).
3.2. Design, contract, and planning
Waste reduction opportunities, at this stage, are attributed to designing structures and goods that last longer, are easily repaired, upgraded or used differently in future cycles, and actively managing negative externalities such as the release of toxic substances. Ekanayake and Ofori (2000) reported that a substantial amount of C&D waste is attributed to design errors. The authors graded design changes as the most significant contributor to waste generation when construction works are in progress. It is widely known that design variations and changes can create large quantities of waste. These variations often change the type or quantity of the building materials. On the contrary, the standardisation of design is found to improve buildability and reduce the number of offcuts and waste (Dainty and Brooke, 2004).
Other design-related issues are the complexity of detailing, selection of low-quality materials and lack of familiarity with alternative products. Design for deconstruction is another strategy that can also reduce waste in future, i.e. construction and demolition. Innovative and modern designs promote the idea of reusing old bricks. Further encouragement of this opportunity is conducive to the increased uptake of old bricks in new construction projects. Dalecki (2017), who uses old bricks in designs, enumerated the benefits of using old bricks, including for aesthetic features, either in a blend with other materials or alternatively, for contrast to create a beautiful, modern building. Additionally, old bricks do not require finish (paint or render) to maintain colour or appearance, which is used as a key decorative design feature as opposed to a modern design for paving, internal floors, ceilings, built-in furniture, steps or even seating. The flow of

828
Salman Shooshtarian, Tayyab Maqsood, Carl Barrett, Peter SP Wong4, Rebecca J. Yang, and Malik Khalfan
information and dissemination of best practice to reduce design waste will require investment and publicity in technology and education to reshape societal attitudes to waste disposal. This warrants partnerships between government, industry, the media, and community organisations. In this regard, the social responsibility of architects has a pivotal role in waste minimisation practices; architects can enlighten clients about the associated financial, social and environmental benefits of such practices (Osmani et al., 2008).
Errors in contract clauses or incomplete contract documents at the design stage can increase construction waste (Craven et al., 1994; Bossink and Brouwers, 1996). The stage at which contractual agreement is made presents an opportunity to minimise C&D waste (CRiBE, 1999). Stakeholders can reduce waste by incorporating waste minimisation activities stipulated by specifically oriented contract tender clauses. To make this happen, some studies suggest using contractual clauses to discipline poor waste management (Dainty and Brooke, 2004). Others, such as Greenwood (2003), believe that a fully integrated waste minimisation system at the contractual stage is necessary to identify and communicate the responsibilities for waste minimisation between all project stakeholders. There is evidence that even the type of contract could influence how a waste is generated. For instance, it is reported that “Fix only” subcontracts rarely create motivation for bricklayers to reuse offcuts. Subcontract payment to bricklayers for labour only and based on the completed in-situ brick count does not provide a payment system that encourages low wastage (Forsythe and Máté, 2007).
Designing against overconsumption through a components’ life extension is another waste-reducing design strategy (Oguchi et al., 2010). The major barrier to design against overconsumption is the cost; if the cost of a used and adapted product is similar to the new one, the latter is preferred (Hirschl et al., 2003). Bricklayers are important actors in the battle of reducing the waste if they are not disincentivised to do so. In Australia, bricklayers are contracted based on the number of bricks that arrive onsite and are thus incentivised to create waste. If they use half bricks, they get paid for a whole, and their pay is not deducted by the number of bricks left over. A contracting model similar to plastering subcontractors is perhaps the best way to control this issue and reduce waste. If the model was centred on a supply and lay approach, there would not be bricks leftover onsite, and any spare would be carried to the next job (Scarvaci and Barrett, 2019).
3.3. Procurement
Correct estimation of the bricks needed for a construction activity can save a significant quantity of unwanted materials that might have otherwise been landfilled. Inaccurate quantity take-off and/or over- ordering ultimately create extra waste. The false economy created by the structure of the brick ordering and later laying processes is a major contributor to brick wastes in the construction industry. In Australia, builders typically order 2-3% more than is required to allow for offcuts and waste etc. (Scarvaci and Barrett, 2019). However, on large jobs, the risk of over-ordering tends to be reduced because deliveries are made progressively throughout the job, and only the last order needs accurate take-off and ordering. Conversely, it can be a significant contributor in small jobs if bricks are only supplied in large order increments and only a small amount of the last order increment is required. Incremental ordering problems could potentially worsen if the brickwork is made up of small amounts of different brick types—as may be required in blended brickwork (Forsythe and Máté, 2007). An example of over-ordering is when, for a job requiring 1,100 bricks, 1,500 bricks must be ordered, which typically results in 27% waste. Just-in-time delivery of materials to a construction site should be planned to avoid damage taking place due to insufficient space for proper storage and adverse weather conditions (BRE Group, 2019). Moreover, suppliers can be encouraged to provide more flexible “last pack” sizes—i.e. a “fractional” pallet instead of a full pallet—in order to minimise the waste because of over-ordering.

829
Opportunities to reduce brick waste disposal
3.4. Transportation and delivery
Waste incurred through transportation can be reduced if the transportation companies typically contracted by brick manufacturers exercise good work practices. A lack of hard strap protectors at corners and edges of brick stacks and hand unloading can increase waste. Forsythe and Máté (2007) reported that an uneven landing pad for stacks could cause damage to bricks. In another study in Hong Kong, interviews with senior project managers, and experienced architects and engineers revealed that damage during transportation due to the unpacked supply is one of the two main reasons for brick wastage (Tam et al., 2006). Tam and Hao (2014) suggested that waste arising out of transportation and delivery could be reduced or eliminated by replacing site bricklaying with drywall panel systems.
3.5. Construction
The second major brick waste generation occurs at the construction site and mostly during construction activities (Poon et al., 2004). Researchers observed that brick waste could be reduced at all stages of the construction process (Poon et al., 2004). Damaged bricks due to over-stacking in the storage area and poor products of layering are all possible causes of wastes. A field study in Australia reported that the main source of waste brick comes from inaccurate brick cutting, which is primarily done by chopping at bricks with a trowel (Forsythe & Máté, 2007). The study estimated that poor workmanship could generate up to 75% of brick waste at a construction waste.
Brick waste construction inefficiencies include handling and stacking breakages, use of bricks for scaffolding and other unintended uses, and bricks contaminated by dirt. Training of those who are directly and indirectly dealing with the brick at the construction site should be an integral part of any waste management plan. Such training courses can target labourers who are working at different stages of construction and maintenance and have a pivotal role in the reduction of brick waste generated. In Australia, there are various education providers that offer a specific course on the brick material in the construction industry. For instance, PointsBuild offers two online courses ‘TBA Foundations: Brick Standards’ and ‘TBA Foundations: Defining a Brick’ to educate bricklayers and others involved in construction activities about the various technicalities of bricks in construction with the view to reduce damages to the material during and after construction. In recent years, the emergence of brick-laying robotic systems has presented an opportunity to increase the industry productivity by reducing construction completion time, providing financial benefits, minimising work safety incidents, and reducing waste during construction (Giftthaler et al., 2017). In 2018, Fastbrick Robotics, a construction company based in Perth (Australia), reported its achievement in completing a three-bedroom, two bathroom house in less than three days thanks to a robotic arm from a 3D model (Hall, 2018).
Another important strategy to assist with reducing waste during construction is to estimate the quantity of waste to be generated at a construction site (Llatas, 2011). Accurate estimation can aid in efficient prevention and management from the very beginning of a construction project. Nonetheless, prior research studies indicated that one of the main hindrances to a valid estimation of C&D waste is the lack of data, including poor documentation of waste generation rates and composition. In the past, some efforts made to model the quantity of waste generated at a construction site (Wu et al., 2014) and particularly building information modelling (BIM)-based modelling in recent years (Cheng and Ma, 2013).
Proper storage of bricks at the site can also contribute to reducing waste generated during construction activities. If the construction site has enough space, bricks arriving at the site can be adequately stored away from the main traffic flow onsite (BRE Group, 2019). Application of effective construction methodologies also contributes to less waste generation. Among various methodologies,

830
Salman Shooshtarian, Tayyab Maqsood, Carl Barrett, Peter SP Wong4, Rebecca J. Yang, and Malik Khalfan
prefabrication seems to be a viable option. By definition, prefabrication is a manufacturing process that takes place in a specialised factory where different materials are brought together to form a construction component of the final installation procedure (Minunno et al., 2018). Brickwork can be prefabricated off, or onsite in panels or box units lifted into position and bolted to a building frame in a similar manner to precast concrete (Minunno et al., 2018). Panels that are moved into place onsite using cranes create a reduction in overall site waste. Furthermore, brick orders are placed and cancelled as required directly through the manufacturers allowing resources to be monitored and waste to be recognised and controlled.
3.6. Demolition
Brick waste during demolition is generally sourced from residential or pavement demolition. In one study in China, it was found that demolition of residential buildings generates more brick waste than it does in commercial buildings (Zhao and Rotter, 2008). However, this waste almost always comes in a mix with other C&D waste. The resource recovery market strongly prefers separation at the source for masonry materials. Such a practice leads to more straightforward, cheaper and more effective recovery. This is also favourably considered in pricing mechanisms such as gate fees, which are lower for source-separated loads (Sustainability Victoria, 2014). In most cases that waste loads are mixed, the conventional practice is to separate waste materials by labours and some mechanical equipment such as excavators and front-end loaders. There are also instances of the utilisation of fixed equipment and automated sorting systems being employed to segregate materials (Hyder, 2011). De-construction, as opposed to demolition, is a building removal technique that aims to dismantle buildings with the goal of maximising the reuse potential of its components. The benefits of deconstruction include generation of revenue from the sale of salvaged materials, reduced disposal and transports costs, lower cost of building materials for the community, lower excavation for new materials and conserving landfill space. However, the time required to deonstruct is found to hinder the adaptation of this method (Crowther, 2000).
Selective deconstruction is the advance extension of deconstruction wherein some materials are targeted for reusing and recycling. Selective deconstruction project planning involves the scheduling for dismantling targeted building components, the definition and duration of work tasks, the choice of technology, the estimation of the required resources and the identification of any interactions among the different work tasks (Sanchez et al., 2019). Full demolition requires less time than deconstruction. Time taken includes the manpower (total man-hour) and active plant costs. The NSW Office of Environment and Heritage (2010) has published an information booklet wherein deconstruction and demolition were compared time-wise. The cost analysis associated with three building-removal techniques in NSW revealed that deconstruction is cheaper than demolition, by anywhere between 55% (Asbestos fibro) and 294% (full brick).
3.7. Reuse
The demolished brick or the brick that is damaged during transport, construction or renovation can be reused in construction projects without recycling. From an environmental perspective, reusing old bricks creates environmental benefits such as saving 0.5 kgCO2-e that is eliminated by not manufacturing one block of a clary brick (Gamlemursten, 2019). There are initiatives to encourage the application of old bricks in new builds. Think Brick Australia is running a Brick Cleaning Course (Thinkbrick, 2019), a nationwide training course on brick cleaning, in partnership with TABMA Training. Brick cleaners can achieve accreditation by completing this course. The course covers basics of brickwork, working with contemporary bricks, planning and preparing a worksite, identifying brick stains, prevention of brickwork stains, techniques not to damage brickwork, effective cleaning of brick stains, clean up and safe storage of equipment and

831
Opportunities to reduce brick waste disposal
chemicals, and using environmentally-friendly cleaning solutions. A new European Union-funded project called REBRICK (Gamlemursten, 2019) has exemplified that an old brick is not “just a brick”. The project pursues resourceful demolition of waste through automated cleaning of clay bricks so that they can be reused. This project, which is coordinated by a Danish SME, Gamle Mursten, has developed a technology to exploit the reusing potential of old bricks. The technology involves the automated sorting of demolition wastes that separates and cleans old bricks using vibrational rasping. Reuse of the brick may take place in the form of brick waste recycling for further use in a brick production line. In Turkey, Demir et al. (2013) studied the use of brick waste as an additive to raw materials for brick production. They reported that up to 30% mixture of fine brick waste additives could be successfully used in new brick production. Usage of waste material in the raw mixture minimises the physical damage that may occur during brick production. The reuse of waste-brick material in brick production provides an economic contribution and helps protect the environment by less virgin resource use, and saving in water and greenhouse gas emissions associated with clay excavation, transport, and landfilling.
3.8. Recycling
Brick waste can be processed and further used in the construction industry (recycling) or in other industries (upcycling). Brick waste is highly recyclable due to the inert nature and physical reprocessing requirements, with less need for chemical processes in comparison with other materials, (Sustainability Victoria, 2014). Brick recycling practices have a long history; with the earliest evidence relates to the use of crushed brick with Portland cement in Germany in 1860 for the manufacturing of concrete products (Devenny and Khalaf, 1999). Typically, large commercial projects lend themselves to recycling moreso than small residential projects as economies of scale play a key role in the collection, separation and marketing of recovered materials (SA EPA, 2001).
A study conducted in Australia found that a common solution to brick waste management is to crush the waste and to use the final product as a landscaping aggregate or low-grade road base (Forsythe and Máté, 2007). Brick recycling techniques are not complicated (Edge Environment, 2012): the bricks are crushed, either as mixed loads or in source-separated streams. In 2011, one study conducted a comparative analysis of the economic performance of two brick waste management scenarios in Melbourne (Damptey, 2011) to reveal the suitability of recycling versus landfilling. The study found that the costs associated with recycling bricks were comparatively cheaper than those in landfill disposal. In terms of operational costs, this study reported that, for 1,000 tonnes of brick waste, the total costs for landfilling and recycling are $92,356 AUD and $29,419 AUD, respectively. Increasing landfill levy rates has further widened this cost gap (Shooshtarian et al., 2020). In 2010, a study in Sydney showed that demolition was more expensive than selective and full deconstruction due to reduced costs associated with transport and landfill levy (NSW Office of Environment and Heritage, 2010). To encourage the community to contribute to C&D waste recycling, some local councils provide vouchers through rates notices to transfer a certain quantity of C&D waste to a nearby recycling facility free of charge. The utilisation of bricks waste in other applications is well documented. Brick waste can also replace raw materials used in a mixture for production of other construction materials. For instance, pozzolans that are derived from brick (powder) waste, when used as a partial cement substitute, typically improve the resistance of mortar. In Japan, demolished bricks are burned into slime burnt ash and commonly crushed to form filling materials in Hong Kong (Tam and Tam, 2006).

832
Salman Shooshtarian, Tayyab Maqsood, Carl Barrett, Peter SP Wong4, Rebecca J. Yang, and Malik Khalfan
3.9. Illegal dumping and stockpiling
Illegal dumping and stockpiling are prevalent with all construction materials, including clay brick. It is mainly incentivised by landfill charges inclusive of government-issued landfill levy schemes. The fact that the revenue from levy charges are rarely returned back to the C&D waste sector to improve recovery rates makes it difficult to reduce these activities. There are service providers in the waste recovery industry that are labelled as cowboy operators because they offer services for skip-bins, disposal, sorting or recycling at below-market rates, undercutting the cost of legitimate and licensed businesses (Mannix et al., 2019). The waste is stockpiled or dumped on rented properties or public land in the outer suburbs or regional areas. It is the public sector’s duty to address illegal dumping of materials and to strengthen controls over licensed sites. State Governments and territories have created task forces to exercise restrictions on waste stockpiling which have not been effective to date (Shooshtarian et al., 2019).
3.10. Landfilling
On a world-scale, the world annual production of clay bricks, which is approximately 6.25 × 10⁸ tonnes, about 7 × 10⁶ tonnes of brick goes to landfills each year (Adamson et al., 2015). In some countries, due to different factors, including unavailability of land, the cost of landfilling has increased so substantially that recycling is considered to be more cost-effective. One study in the US showed that recycling one ton of brick costs about $21 per tonne while landfilling one tonne of the same amount would cost approximately $136/tonne (Lennon, 2005). In Australia, the lack of updated and accurate data about current activities in the field of brick waste management has made it difficult to plan for the maximum usage of the value of brick material. The only data for landfilling extracted for the study period of 2016-17 showed that, in South Australia, of 40,320 tonnes brick waste generated 11,498 tonnes was landfilled.
3. Conclusion
This study developed the Brick- LoWMoR to conceptualise the opportunities across the brick supply chain to reduce waste disposal. Drawing on this model, various waste minimising strategies were identified. The following recommendations may facilitate implementation: Design appropriate landfill levy schemes to discourage brick waste landfilling; consider building standardisation to improve buildability and reduce the number of offcuts; suppliers to provide more flexible “last pack” sizes i.e. a “fractional” pallet instead of a full pallet; use of the “Supply and Lay” model to eliminate brick leftovers on site; develop an agreement where a contractor “sells back” the recycled waste from the original material supplier; ensure the bottom layers of bricks remain useable by preventing soil contamination; store bricks in a stable flat area to avoid breakages from fall overs; determine a means for cutting bricks into half more accurately so that both halves can be used and breakages are avoided; take unwanted bricks back to the brickyard or nearest material recovery facility for crushing and reuse—this can be also complemented by offering the customer leftover (full) bricks; Include a clean-up payment in the scope of the bricklayer’s subcontract to assist recycling and to discourage wasteful site practices; take brick left-overs away to use as aggregate or landscaping cover; and strengthen controls over licensed landfill sites. These recommendations can also inform building codes and standards which impact on the regulation of C&D waste streams in Australia.
References Adamson, M., Razmjoo, A. and Poursaee, A. (2015) Durability of concrete incorporating crushed brick as coarse
aggregate, Construction and Building Materials, 94, 426-432.

833
Opportunities to reduce brick waste disposal
Al-Fakih, A., Mohammed, B. S., Liew, M. S. and Nikbakht, E. (2019) Incorporation of waste materials in the manufacture of masonry bricks: An update review, Journal of Building Engineering, 21, 37-54.
Bilgin, N., Yeprem, H., Arslan, S., Bilgin, A., Günay, E. and Marşoglu, M. (2012) Use of waste marble powder in brick industry, Construction and Building Materials, 29, 449-457.
Bossink, B. and Brouwers, H. (1996) Construction waste: quantification and source evaluation, Journal of construction engineering and management, 122(1), 55-60.
BRE Group (2019) The true cost of waste. Brickworks Building Products (2012) Build for Living: Building a platform of commitment and responsibility, BrickWorks,
Melbourne, Australia Cheng, J. C. and Ma, L. Y. (2013) A BIM-based system for demolition and renovation waste estimation and planning,
Waste management, 33(6), 1539-1551. Craven, D., Okraglik, H. and Eilenberg, I. (1994) Construction waste and a new design methodology, Sustainable
Construction: Proceedings of the 1st Conference of CIB TG, Gainesville, Fla. : Center for Construction and Environment, M.E. Rinker Sr. School of Building Construction, College of Architecture, University of Florida, 89-98.
CRiBE (1999) Waste Minimisation through Counselling Building Project Teams & Collecting of Building Project Teams and Collecting Waste Arising, Welsh School of Architecture, Cardiff University, United Kingdom.
Crowther, P. (2000) Building deconstruction in Australia, Overview of deconstruction in selected countries, 14-44. Dainty, A. R. and Brooke, R. J. (2004) Towards improved construction waste minimisation: a need for improved supply
chain integration?, Structural Survey, 22, 20-29. Dalecki, J. (2017) Reuse & Recycle Materials - Brickworks Building Products. Damptey, E. F. (2011) Optimising the Use of Recycled C&D Waste Material in Civil Construction Projects, Faculty of
Engineering and Industrial Sciences, Centre for Sustainable Infrastructure, Swinburne University of Technology, Melbourne, Australia.
Devenny, A. and Khalaf, F. (1999) Use of crushed brick as coarse aggregate in concrete, Masonry International, 12(3), 81- 84.
Edge Environment (2012) Construction and Demolition Waste Guide - Recycling and Re-Use Across the Supply Chain, The Department of Energy and Environment Canberra, Australia.
Ekanayake, L. and Ofori, G. (2000) Construction material waste source evaluation. Forsythe, P. and Máté, K. (2007) Assessing brick waste on domestic construction sites for future avoidance, 41st Annual
Conference of the Architectural Science Association: Towards solutions for a liveable future: progress, practice, performance, people, Geelong, Australia, 1-8.
Gamlemursten (2019) The REBERICK project. Available from: <http://www.gamlemursten.eu> (accessed 5/06/2020). Giftthaler, M., Sandy, T., Dörfler, K., Brooks, I., Buckingham, M., Rey, G., Kohler, M., Gramazio, F. and Buchli, J. (2017)
Mobile robotic fabrication at 1: 1 scale: the in situ fabricator, Construction Robotics, 1(1-4), 3-14. Greenwood, R. (2003) Construction Waste Minimisation – Good Practice Guide, CRiBE (Centre for Research in the Build
Environment), Cardiff, United Kingdom. Hall, J. (2018) World-first’: WA’s Fastbrick robot builds 3x2 home in three days. Available from: The West Australian
(accessed. Hirschl, B., Konrad, W. and Scholl, G. (2003) New concepts in product use for sustainable consumption, Journal of Cleaner
Production, 11(8), 873-881. Hyder (2011) Construction and Demolition Waste Status Report: Management of Construction and Demolition Waste in
Australia Department of Energy and Environment (Department of Sustainability, Environment, Water, Population and Communities), Australia
IBISWorld (2020) Clay Brick Manufacturing in Australia: AUSTRALIA INDUSTRY (ANZSIC) REPORT C2021, in R. Dean (ed.), IBISWorld, Australia.
Lennon, M. (2005) Recycling construction and demolition wastes: a guide for architects and contractors, ed., Commonwealth of Massachusetts, Department of Environmental Protection.
Lingling, X., Wei, G., Tao, W. and Nanru, Y. (2005) Study on fired bricks with replacing clay by fly ash in high volume ratio, Construction and Building Materials, 19(3), 243-247.
Llatas, C. (2011) A model for quantifying construction waste in projects according to the European waste list, Waste management, 31(6), 1261-1276.

834
Salman Shooshtarian, Tayyab Maqsood, Carl Barrett, Peter SP Wong4, Rebecca J. Yang, and Malik Khalfan
Mannix, L., C., V. and C., H. (2019) The tipping point: Illegal dumping swamps the waste industry,The Age. Minunno, R., O’Grady, T., Morrison, G. M., Gruner, R. L. and Colling, M. (2018) Strategies for applying the circular
economy to prefabricated buildings, Buildings, 8(9), 125. Murmu, A. L. and Patel, A. (2018) Towards sustainable bricks production: An overview, Construction and Building
Materials, 165, 112-125. NSW Office of Environment and Heritage (2010) House deconstruction fact sheet: Bricks and concrete removal. Oguchi, M., Tasaki, T. and Moriguchi, Y. (2010) Decomposition analysis of waste generation from stocks in a dynamic
system: Factors in the generation of waste consumer durables, Journal of Industrial Ecology, 14(4), 627-640. Osmani, M., Glass, J. and Price, A. D. (2008) Architects’ perspectives on construction waste reduction by design, Waste
management, 28(7), 1147-1158. Phonphuak, N., Kanyakam, S. and Chindaprasirt, P. (2016) Utilisation of waste glass to enhance physical–mechanical
properties of fired clay brick, Journal of Cleaner Production, 112, 3057-3062. Pickin, J., Randell, P., Trinh, J. and Grant, B. (2018) National Waste Report 2018, Australian Department of the
Environment and Energy, Canberra, Australia. Poon, C.-S., Yu, A. T. and Jaillon, L. (2004) Reducing building waste at construction sites in Hong Kong, Construction
Management and Economics, 22(5), 461-470. Rahman, A., Urabe, T., Kishimoto, N. and Mizuhara, S. (2015) Effects of waste glass additions on quality of textile sludge-
based bricks, Environmental technology, 36(19), 2443-2450. SA EPA (2001) Barriers and Opportunities for Re-use and Recycling of Clean Fill and Building and Demolition Waste Sanchez, B., Rausch, C. and Haas, C. (2019) Selective Deconstruction Programming for Adaptive Reuse of Buildings, in,
Computing in Civil Engineering 2019: Data, Sensing, and Analytics, American Society of Civil Engineers Reston, VA, 225-232.
Scarvaci, V. and Barrett, C. (2019) Brick supply and lay model, BGC (Australia) Pty Ltd: Group Manager Energy and Environment, Brickmakers (Australia) Pty Ltd: General Manager, Perth, Australia.
Shah, R. and Ward, P. T. (2003) Lean manufacturing: context, practice bundles, and performance, Journal of operations management, 21(2), 129-149.
Shih, P.-H., Wu, Z.-Z. and Chiang, H.-L. (2004) Characteristics of bricks made from waste steel slag, Waste management, 24(10), 1043-1047.
Shooshtarian, S., Maqsood, T., Khalfan, M., Wong, S. P. and Yang, J. R. (2019) Managing construction and demolition (C&D) waste in Australia, CIB World Building Congress 2019 'Constructing Smart Cities', Hong Kong, China, 17-21 June
Shooshtarian, S., Maqsood, T., Khalfan, M., Yang, J. R. and Wong, S. P. P. (2020) Landfill levy imposition on construction and demolition waste: Australian stakeholders’ perceptions Sustainability, 12(11), 1-15.
Sustainability Victoria (2014) Factsheet: Market summary – recycled brick, stone and concrete, Melbourne, Australia. Tam, V. W. and Hao, J. J. (2014) Prefabrication as a mean of minimising construction waste on site, International Journal
of Construction Management, 14(2), 113-121. Tam, V. W., Tam, C., Chan, J. K. and Ng, W. C. (2006) Cutting construction wastes by prefabrication, International Journal
of Construction Management, 6(1), 15-25. Tam, V. W. and Tam, C. M. (2006) A review on the viable technology for construction waste recycling, Resources,
Conservation and Recycling, 47(3), 209-221. Tay, J.-H. (1987) Bricks manufactured from sludge, Journal of Environmental Engineering, 113(2), 278-284. Thinkbrick (2019) Accreditation Courses. Turgut, P. (2008) Limestone dust and glass powder wastes as new brick material, Materials and Structures, 41(5), 805-
813. Wu, Z., Ann, T., Shen, L. and Liu, G. (2014) Quantifying construction and demolition waste: An analytical review, Waste
management, 34(9), 1683-1692. Youl, T. (2018) IBISWorld Industry Report C2021. Clay Brick Manufacturing in Australia, IBISWorld Zhao, W. and Rotter, S. (2008) The current situation of construction & demolition waste management in China,2nd
International Conference on Bioinformatics and Biomedical Engineering, IEEE, Tianjin, China 4747-4750.

835
The 54th International Conference of the Architectural Science Association (ANZAScA) 2020
Optimising New Zealand construction consolidation centres: Defining a research framework
Kamal Dhawan1, John E. Tookey2, Ali GhaffarianHoseini3, and Amirhosein GhaffarianHoseini4 1, 2, 3, 4 Auckland University of Technology, Auckland, New Zealand
[email protected] [email protected]
[email protected] [email protected]
Abstract: Urban Consolidation Centres (UCCs) have delivered transferrable sustainability benefits in the urban freight logistics domain. Construction logistics have a high transport component, which has acknowledged social and environmental externalities, in addition to cost implications. The low cost - high volume nature of construction materials points to substantial logistics optimisation possibilities. The UCC transforms into a Construction Consolidation Centre (CCC) in this context. CCCs in Europe and Continental USA have delivered sterling results towards optimising construction logistics. The idea has got impetus in New Zealand as a result of the proposed establishment of a CCC as a logistics solution for a long-term water infrastructure delivery contract in Auckland. It agrees with the Government and industry push for fundamental improvement in the New Zealand construction sector and aligns well with the Construction Sector Accord (2019) and Construction Sector Transformation Plan (2020). Against the backdrop of urban sprawl exemplified in Auckland, this creates a unique contextual research opportunity that can substantially enhance the construction logistics knowledge corpus in New Zealand. This paper attempts to define a research framework for investigating the outcomes of CCC based operations within a collaborative project delivery arrangement as an infrastructure logistics delivery vehicle in New Zealand.
Keywords: Construction Consolidation Centre; Research Framework; Logistics; New Zealand Construction.
1. BackgroundConstruction industry typically contributes circa 6% annually to GDP of advanced economies (UNECE, n.d.), generates employment, creates, and improves infrastructure, while supporting its supplier businesses (Shakantu, Muya, Tookey and Bowen, 2008). It is peripatetic and project-based, moving to where work is (Shakantu et al., 2008; Wegelius-Lehtonen, 2001). It seeks delivery and removal of various materials and resources to and from each site at nominated times (Lindén and Josephson, 2013). The industry frequently operates in urban areas, including cities and large built up areas. Construction projects are individually unique in most of their defining attributes. Supply chains are reconfigured repetitively through all phases of a project. Each project has a customised supply chain with limited standardisation (Guerlain, Renault and Ferrero, 2019; Naismith, Monaghan, Zhang, Doan, GhaffarianHoseini and Tookey, 2016; Wegelius-Lehtonen, 2001).
Fragmentation is endemic in the construction industry. It manifests multi-directionally viz Vertical (various phases of the project being clearly demarcated), Horizontal (different agencies being involved within the execution of each phase) and Longitudinal (different hierarchies managing different projects at different places simultaneously, the dissemination of knowledge and information from experience being difficult or non- existent due to lack of effective communication). It prevents continuity and an integrated approach to work, directly influencing the business models and management philosophies (Balm and van Amstel, 2017). Typically, implemented business models are not well integrated and do not embody Supply Chain Management (SCM) best practices. The result is heavy reliance on contractual sanction instead of participants agreeing on methods for achieving sound financial objectives, leading to adversarial relationships. Such methods invariably create a competitive – arguably confrontational and transactional environment for profit generation, leading to conflict and litigation, damaging the project at the fundamental level. It discourages responsible proponents, and attracts bidders wanting win at any cost. Anomalies cause adversarial relationships, increase transactional costs and foster “best-for-individual” instead of “best-for-project” culture (Dubois and Gadde, 2002; Ying and Roberti, 2013). SCM and associated domains viz Partnering, Alliancing and Public Private Partnership, are possible solutions (Vrijhoef and Koskela, 2000; Ying, Tookey and Roberti, 2014).
Imaginable Futures: Design Thinking, and the Scientific Method. 54th International Conference of the Architectural Science Association 2020, Ali Ghaffarianhoseini, et al (eds), pp. 835–844. © 2020 and published by the Architectural Science Association (ANZAScA).

836
Kamal Dhawan, John E. Tookey, Ali GhaffarianHoseini, and Amirhosein GhaffarianHoseini
The New Zealand construction sector is comprised of a large number of Micro, Small and Medium Enterprises (MSMEs) (Seadon and Tookey, 2018). Only about 10% of these have six employees or more (Statistics New Zealand, 2019). Its performance lags other industries, and major performance indicators have been either near static or have shown a negative growth over the last approximately 45 years (BRANZ, 2018). By virtue of the geographical location of New Zealand, its construction industry is isolated from the rest of the world (Naismith et al., 2016; Singer, 2018), and responds comparatively slowly to improved philosophy, resulting in delayed introduction of new ideas (Ying and Tookey, 2014). The Government and industry leaders have felt the need for fundamental improvements. Notable initiatives are the Construction Sector Accord (2019) and the Construction Sector Transformation Plan (2020) . Prior to Covid-19, its worth was forecast to reach NZ$ 43 bn by 2021 (MBIE, 2017, 2019, 2020), though the long-term impact of COVID-19 remains to be seen. Whilst the current posture of the industry is sub-optimal, it does offer significant opportunities to substantially improve, a benefit of starting ‘low’ – demonstration of significant contribution to improved performance is easier. New initiatives to upgrade construction and its processes have major deficits in knowledge, understanding, and skills, particularly for addressing construction logistics issues (Ying and Tookey, 2014). Organising logistics differently and introduction of energy efficient technologies in logistics operations, are possible solutions.
2. Research direction
2.1. The research opportunity
Watercare is an Auckland Council owned entity whose mission is to provide reliable water and wastewater services in Auckland. It emphasises efficient service delivery and future proofing capabilities through infrastructure development. It plans, constructs, and delivers new water infrastructure cost-effectively. Circa 11% of construction costs have been assessed as being attributable to transport, from previous tendering. Traditionally, each project has been treated standalone (Turner, 2019), indicating short term Construction Supply Chain Management (CSCM) thinking. They have recently commenced a programme to deliver capital water infrastructure across the city under a $2.4bn contract with private partners, over 10 years (“Watercare Inks Contract”, 2019). The programme proposes employing a Construction Consolidation Centre (CCC) approach under a collaborative project delivery model aiming at reducing 20% construction costs and 40% construction carbon by 2024, and 20% H & S improvements year on year (Duncan, 2019). This portfolio-based rethink of infrastructure procurement is a step change in practice with potentially far reaching implications for future governmental procurements.
2.2. Research definition
CCCs and collaborative infrastructure delivery models in Europe, Continental America and Australia have been discussed extensively in literature. New Zealand is an exception, arguably due its geographical isolation. The New Zealand construction sector being conservative in its outlook, a contextual Research Problem of analysing the effects of applying SCM principles on its performance, exists. A Research Gap specific to the benefits accrued out of establishing a CCC within collaborative project delivery, requires to be addressed. Examining whether a case for this exists in the New Zealand context is the defined Research Aim with quantification of accrual of benefits in terms of productivity, efficiency and sustainability being the Main Research Objective (Dhawan, 2020).
3. The research context
3.1. Organising logistics differently: Integrated models for project delivery
Integration in project delivery establishes close relationships and aligns the activities of Supply Chain actors, enhancing performance and efficiency, and improving process quality. Collaboration, a people-focussed concept dealing with social relationships, such as trust and commitment, and Integration, comprising project level practices concerned with tangible activities or technologies, such as the shared use of resources, are the primary drivers (Koolwijk, van Oel, Wamelink and Vrijhoef, 2018). Application of collaborative approaches over a series of construction projects has demonstrated a possible 30% - 50% reduction in costs and 80% reduction in time (Egan, 1998). Broadly, under the umbrella of Relational Project Delivery Arrangements (RPDAs), these manifest in three primary models, specifically Project Partnering (PP), Project Alliancing (PA) and Integrated Project Delivery (IPD) (Lahdenperä, 2012).
Collaborative arrangements have a staged progression viz Transactional (coordinating and standardising administrative practices); Informational (concerning the mutual information exchange, stocks, deadlines etc., requiring confidentiality and competition to be taken into account); Decisional / Operational Planning (related to day to day operations); Tactical Planning (involving decisions like forecasts, inventory management and quality control); and Strategic Planning (related to long term decisions such as network design, logistics platform location, commercial strategies etc.) (Morana, Gonzales-Feliu and Semet, 2014). A comparison of their attributes is at Figure 1.

837
Optimising New Zealand construction consolidation centres: Defining a research framework
Figure 1: A comparison of RPDAs (Source: Lahdenperä, 2012)
3.1.1. The Watercare collaborative project delivery model
The long-term collaborative contract between Watercare and its partners is a classic instance of ‘Alliancing’. Christened ‘Forward Work Programme’ (Turner, 2019), the model is an adoption of the innovative ‘Enterprise Model’, based on ‘Project 13’, an industry-led initiative in the UK to improve delivery and management of high- performing infrastructure (ICE, 2018). An example of ‘Programme Alliancing’, not the classical ‘Project-by- project Alliancing’, it is a ‘first’ in New Zealand (Duncan, 2019) (though the SCIRT alliance model for rebuild, and NZTA project-by-project alliance models for road infrastructure exist) (Che Ibrahim, Costello, and Wilkinson, 2015; Wilkinson, Tookey, Potangaroa, MacGregor, Milicich, Ghodrati, Adafin, Stocchero, and Bayan, 2017). FWP is new infrastructure delivery over a decade, hence, providing an opportunity for assessing the effects of integration for new infrastructure delivery under different process dynamics (from rebuild, as well as from ‘project-by-project’ alliancing). It also presents substantial opportunities for outcomes to drive change and continuous improvement.
3.2. Organising logistics differently: Consolidation
Consolidation of goods from more than one supplier into one shipment is a potent alternative for reducing negative impacts of urban goods transportation (Allen, Browne, Woodburn and Leonardi, 2014). The volume of materials delivered to construction sites presents significant logistical challenges. By efficiently utilising vehicle capacities, individual deliveries can be consolidated onto a single vehicle platform. This can achieve reduction in the number of freight vehicles entering urban areas, minimisation of total vehicle movements, improvement of vehicle utilisation factors and reduction in part delivery (Verlinde, Macharis and Witlox, 2012). Consolidation is a pragmatic and easily implementable solution for optimising construction transport utilisation and reducing costs and associated externalities (Shakantu, Muya, Tookey and Bowen, 2012); as well as an improved opportunity to include back-hauls of Construction and Demolition waste on the same transport. The consolidation process needs to balance loading efficiency and operational frequency (Kohn and Brodin, 2008; Vidalakis and Sommerville, 2013). The CCC concept has been adopted from consolidation in the Urban Goods Distribution domain. It aims at coordinating material and waste transportation within an urban area. A CCC may be located in close proximity of, or be in the form of a warehouse solution farther away, serving one or a group of construction sites (Transport for London, 2013; WRAP, 2011). CCCs are a special case of Urban Consolidation Centres (UCCs) (Allen et al., 2014). These may be defined as “…specialised distribution centres on the edge of urban areas that receive construction materials from a number of different transport operators with loads for development sites in urban areas and then consolidate the construction materials into “full” loads for individual sites for delivery” (DG MOVE European Commission, 2012, p. 113). Figure 2 illustrates the concept of a CCC.
Figure 2: The Construction Consolidation Centre Concept (Source: WRAP, 2011)
3.2.1. CCC as a logistics (transport) solution
Considering a CCC as a transport solution requires consideration of Urban Freight Transport (UFT) in the context of goods transportation and distribution. UFT can be characterised by a systemic framework consisting

838
Kamal Dhawan, John E. Tookey, Ali GhaffarianHoseini, and Amirhosein GhaffarianHoseini
of Demand of goods, Supply of goods and the Context within which these are enabled by logistics operations and vehicle movements. The main stakeholders in the UFT domain are Receivers, who generate demand for goods; Shippers, who send goods to fulfil this demand; Logistics Service Providers, who undertake logistics operations and actual deliveries; Local Authorities, who regulate contextual movements; and Citizens, who inhabit the physical environment where all this takes place (Kin, Verlinde and Macharis, 2017). Construction sites are material intensive and, irrespective of their size, need supplies to be aligned to their requirements, which may be irregular and in precise quantities (Quak et al., 2011 (in Dutch) cited by Balm and van Amstel, 2017). The primary areas of concern due to the transportation component of construction logistics are the costs and the externalities.
3.2.1.1. Transportation costs. Construction logistics have transportation as their largest cost element (Bowersox, Closs and Cooper, 2013). The “Cost Staircase” at Figure 3 illustrates the contribution of transportation to the cost of building materials.
Figure 3: The “Cost Staircase” (Source: Bertelsen and Nielsen, 1997)
With materials accounting for approximately 30% - 50% of a building project cost (Ibn-Homaid, 2002; Vidalakis and Tookey, 2005), transportation costs constitute circa 39% - 58% of the total logistics costs and between 4% - 10% of the selling price of the building (Shakantu, Tookey and Bowen, 2003). Another estimate pegs transportation costs between 10% - 20% of construction costs (BRE, 2003). Even modest levels of construction have substantial transportation requirements, since construction materials are generally low cost and high volume, as compared to other industries (Balm and van Amstel, 2017; Shakantu, Muya, Tookey and Bowen, 2008).
3.2.1.2. Transport externalities. Construction transport, being road dominant, is achieved primarily with motorised vehicles. By virtue of the sheer volume of the material to be transported, it consumes significant amounts of energy and generates large amounts of emissions. Hence, it is intricately linked to environmental externalities inter alia Emissions, Use of non-renewable Fuels, Waste, Loss of Ecosystems or Effect on Biodiversity, Congestion, Noise, Accident Risk, Gridlock, Air Pollution, Water Pollution, Public Health, Damage to Built Environment, and Reduction in Quality of Life (Behrends, 2015; Browne, Allen, Nemoto, Patier and Visser, 2012; Vrijhoef, 2015). Studies on load factors point out that these are consistently under 50%, at times down to 15%, due to delivery vehicles not fully loaded on their onward trips and completely empty on return, with the reverse being true for waste removal vehicles (Vrijhoef, 2015). This leads to very high per unit carbon emissions vis-a-vis the tonnage handled (WRAP, 2011), and externalities vis-à-vis the numbers of vehicles on the road. Smith, Kersey and Griffiths (2003) have assessed that transportation of construction materials account for an estimated 20% of the energy consumption and approximately 9% of the Greenhouse Gas (GHG) generation by the industry. While contributing to only 20% - 30% of road traffic, 80% - 90% logistics related carbon emissions and 16% - 50% of the overall emission of air pollutants are attributable to construction transport (Lindholm and Behrends, 2012). These impacts make road transport one of the least sustainable transport modes. Empty running, earlier identified as a wasted resource, is now considered an environmental liability. Most sustainable distribution strategies, at both the Government and individual business levels, focus acutely on reducing empty running of vehicles (McKinnon and Ge, 2006), as a means of minimising of the Total Environmental Impact (Kohn and Brodin, 2008). Table 1 shows the relative externalities caused by various modes of road transport in New Zealand.
Table 1. Types of health hazards related to transport and their relative importance at national level (NZ) (* approximate ranking of health risk) (Source: Kjellstrom and Hill, 2002)

839
Optimising New Zealand construction consolidation centres: Defining a research framework
3.2.1.3. Energy efficiency of construction transport. The transport sector is a substantial contributor to GHG emissions in addition to mono-nitrogen oxides, oxides of sulphur, carbon monoxide, particulate matter (PM) and volatile organic compounds (VOC). Vehicular emission of Carbon Dioxide (CO2) contributes to approximately 25% increase in CO2 concentration across the world. All these pollutants have identified negative health effects (Bernard, Samet, Grambsch, Ebi and Romieu, 2001). Consequently, there is a strong focus at the national, and local levels for a switch to zero emissions technologies to mitigate these. Figure 4 illustrates the historical data of New Zealand GHG emissions, by end-use and the aggregation of transport related GHG emissions.
Figure 4: Historical GHG emissions by end-use, New Zealand (Source: Concept Consulting Group Limited, 2017)
“A sustainable transport system is one that throughout its full life-cycle operation, allows generally accepted objectives for health and environmental quality to be met, for example, those concerning air pollutants and noise proposed by the World Health Organisation (WHO); is consistent with ecosystem integrity, for example, it does not contribute to exceedence of critical loads and levels as defined by WHO for acidification, eutrophication and ground level ozone; and does not result in worsening of adverse global phenomena such as climate change and stratospheric ozone depletion” (OECD, 2002, p. 16). Figure 5 illustrates the routes of energy transformation from sources to different types of vehicles, necessary for understanding the energy efficiency of construction transport.
Figure 5: Routes from primary energy sources to its final use in vehicles (Source: van Essen, 2008)
3.2.1.4. Electric vehicle technology. Electric Vehicles (EVs) include battery electric vehicles, plug-in electric vehicles, hybrid-electric vehicles (HEVs), and fuel cell technologies. Battery Electric Vehicles (BEVs) are propelled by an electric motor drawing power from a battery pack within the vehicle. Batteries are recharged from the electricity grid. Since they do not use an additional fuel source, BEVs are considered “all-electric” vehicles. Electrification of UFT for construction is a likely viable sustainable alternative for construction transport as urban driving speeds are lower than long-haul speeds, electric engines have a higher efficiency at low speeds, and construction logistics routing is deterministic, facilitating design and location of battery charging infrastructure (Ministry of Transport, 2019).
Diesel and petrol vehicles, in addition to causing pollution, are entailed with high fuel prices and larger Maintenance, Repair and Tyre Replacement (MRT) costs while BEVs have the benefits of low electricity prices, low maintenance costs, and efficient energy consumption. From an economic point of view, BEVs can be overall cheaper than petrol vehicles for LCV application (Lebeau, Macharis, Van-Mierlo and Lebeau, 2015). A conversion to EVs shifts GHG emissions from the vehicle tailpipe to power generation facilities, with emission reduction being possible only within a scenario of low-carbon electricity generation (Juan, Mendez, Faulin, de Armas and Grasman, 2016). New Zealand is well posited for this, since bulk of electric power is clean (Coal and Gas generate only 23% of the electricity requirements, balance being provided by Hydro, Geothermal, Wind, and Biomass) (Walmsley, Walmsley, Atkins, Kamp, Neale and Chand, 2015). New Zealand is also a signatory to the Electric Vehicle Initiative (EVI) under the International Energy Agency (International Energy Agency, 2018). The introduction of EVs in the freight transport sector is highly relevant and imminent with developing

840
Kamal Dhawan, John E. Tookey, Ali GhaffarianHoseini, and Amirhosein GhaffarianHoseini
technology. Hydrogen and Biofuels are not being considered for discussion as there is limited understanding of factors dictating their use inter alia an understanding of lifecycle costs of GHG emissions; externalities associated with commercial production and fuel utilisation; costs of infrastructure, storage, transportation and distribution; economics of vehicle modification and vehicle operation; public perception; and technology introduction and absorption (Ministry of Transport, 2019). A fair idea of the “Well-to-Wheel” efficiencies of BEVs and fossil fuel powered vehicles is at Figure 6.
Figure 6: A comparative chart of “Well-to-Wheel” efficiency (Source: Concept Consulting Group Limited, 2019)
3.2.1.5. Alternate fuels. Transport contributes to circa 18% of total emissions in the world, the balance being from energy (26%), industry (19%) and buildings (10%). Approximately 80% of the passenger traffic and 60% of the goods traffic is road bound (IPCC, 2014). A reduction in emissions is possible by improving engine efficiency or by using fuels containing a lower concentration of carbon (Kathuria, 2005). A short discussion of two such cleaner fuels is as follows:-
Compressed Natural Gas (CNG). CNG is comprised primarily of Methane. It is a clean-burning alternative fuel with a significant potential for reducing harmful emissions, especially Particulate Material (PM), as it does not contain poly-aromatic hydrocarbons (PAHs). It permits engines to operate at higher compression ratios due to a high anti-knock index (Gwilliam, Kojima and Johnson, 2004), hence extracting more per unit power. Besides low PM emissions, airborne toxins and oxides of sulphur, CNG vehicles exhibit smoother, quieter operation, and lesser odour, emitting only about one-eighth of emissions compared to equivalent diesel engines. On a life cycle cost basis, GHG emissions are 12% lower (Kathuria, 2005).
Liquefied Petroleum Gas (LPG). LPG is a mixture of light hydrocarbons viz propane/propene and butanes/butenes. It is cleaner than petrol and diesel, as it contains very little sulphur, and additives. Emissions contain lower levels of HC, NOx, CO, oxides of sulphur, air toxics, and PM, as compared to diesel and petrol vehicles. It is easier to store and distribute compared to CNG, requiring lesser storage pressure. It has an octane number of 104 (lower than CNG) and excellent anti-knock properties. The exhaust emission reduction benefits are similar to those of CNG (Gwilliam et al., 2004; Liu, Yue and Lee, 1997).
CNG and LPG require engines to be modified and demand more intensive maintenance and higher replacement of components over the vehicle lifecycle. These stand as viable options as an interim measure for reducing externalities till EV technology evolves and proliferates sufficiently for full fleet electrification.
3.2.2. CCC as a business opportunity
A CCC is an opportunity for business and economic development, since all businesses cannot establish exclusive logistics centres or obtain the latest support technologies (software, radio frequency identification systems, real time communication network, etc.). They also may not have the associated management skills. Established CCCs provide these services without added infrastructure costs or ownership risks. CCCs can perform multifarious functions such as inventory management, distribution including consolidation, sorting, break-bulk, distribution network management/vehicle routing, e-commerce, road terminal and equipment, administration and maintenance services. Businesses may utilise some or all of these, based on individual supply chain requirements (Hamzeh, Tommelein, Ballard and Kaminsky, 2007).
Figure 7 brings out the range of potential activities at a CCC along with their outcomes (primarily in the areas of stocking, transport and services), and effects of a CCC on the supply chain by employment of better loaded vehicles operating ahead of the CCC, compared to poorly loaded vehicles on direct delivery.
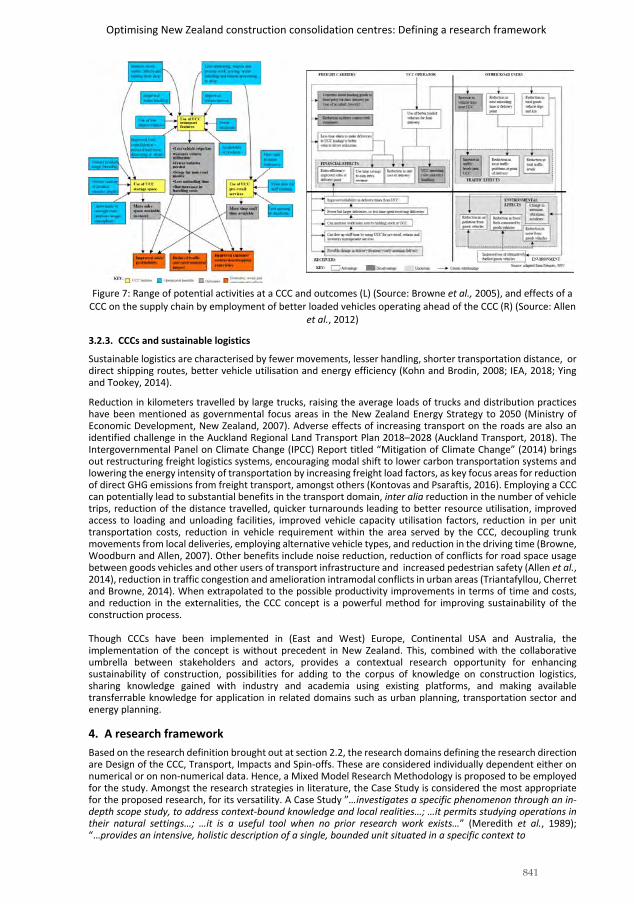
841
Optimising New Zealand construction consolidation centres: Defining a research framework
Figure 7: Range of potential activities at a CCC and outcomes (L) (Source: Browne et al., 2005), and effects of a CCC on the supply chain by employment of better loaded vehicles operating ahead of the CCC (R) (Source: Allen
et al., 2012)
3.2.3. CCCs and sustainable logistics
Sustainable logistics are characterised by fewer movements, lesser handling, shorter transportation distance, or direct shipping routes, better vehicle utilisation and energy efficiency (Kohn and Brodin, 2008; IEA, 2018; Ying and Tookey, 2014).
Reduction in kilometers travelled by large trucks, raising the average loads of trucks and distribution practices have been mentioned as governmental focus areas in the New Zealand Energy Strategy to 2050 (Ministry of Economic Development, New Zealand, 2007). Adverse effects of increasing transport on the roads are also an identified challenge in the Auckland Regional Land Transport Plan 2018–2028 (Auckland Transport, 2018). The Intergovernmental Panel on Climate Change (IPCC) Report titled “Mitigation of Climate Change” (2014) brings out restructuring freight logistics systems, encouraging modal shift to lower carbon transportation systems and lowering the energy intensity of transportation by increasing freight load factors, as key focus areas for reduction of direct GHG emissions from freight transport, amongst others (Kontovas and Psaraftis, 2016). Employing a CCC can potentially lead to substantial benefits in the transport domain, inter alia reduction in the number of vehicle trips, reduction of the distance travelled, quicker turnarounds leading to better resource utilisation, improved access to loading and unloading facilities, improved vehicle capacity utilisation factors, reduction in per unit transportation costs, reduction in vehicle requirement within the area served by the CCC, decoupling trunk movements from local deliveries, employing alternative vehicle types, and reduction in the driving time (Browne, Woodburn and Allen, 2007). Other benefits include noise reduction, reduction of conflicts for road space usage between goods vehicles and other users of transport infrastructure and increased pedestrian safety (Allen et al., 2014), reduction in traffic congestion and amelioration intramodal conflicts in urban areas (Triantafyllou, Cherret and Browne, 2014). When extrapolated to the possible productivity improvements in terms of time and costs, and reduction in the externalities, the CCC concept is a powerful method for improving sustainability of the construction process.
Though CCCs have been implemented in (East and West) Europe, Continental USA and Australia, the implementation of the concept is without precedent in New Zealand. This, combined with the collaborative umbrella between stakeholders and actors, provides a contextual research opportunity for enhancing sustainability of construction, possibilities for adding to the corpus of knowledge on construction logistics, sharing knowledge gained with industry and academia using existing platforms, and making available transferrable knowledge for application in related domains such as urban planning, transportation sector and energy planning.
4. A research frameworkBased on the research definition brought out at section 2.2, the research domains defining the research direction are Design of the CCC, Transport, Impacts and Spin-offs. These are considered individually dependent either on numerical or on non-numerical data. Hence, a Mixed Model Research Methodology is proposed to be employed for the study. Amongst the research strategies in literature, the Case Study is considered the most appropriate for the proposed research, for its versatility. A Case Study ”…investigates a specific phenomenon through an in-depth scope study, to address context-bound knowledge and local realities…; …it permits studying operations in their natural settings…; …it is a useful tool when no prior research work exists…” (Meredith et al., 1989); “…provides an intensive, holistic description of a single, bounded unit situated in a specific context to

842
Kamal Dhawan, John E. Tookey, Ali GhaffarianHoseini, and Amirhosein GhaffarianHoseini
provide insights into real life situations. It is a versatile strategy which permits the use of a variety of research methods, the ability to establish rapport with research subjects and obtaining a sufficiently rich description that can be transferred to similar situations.” (Ponelis, 2015). The research is proposed in an area which is entirely groundbreaking in the context of New Zealand, therefore, contemporary, for which no contextual literature or data in the form of a precedence or research exist. Processes within the scope of the research are proposed to be measured extensively, within the singularity of the setting available for detailed investigation. Establishment of a CCC and its subsequent operations in New Zealand fulfil most requirements for a Case Study Research problem. Secondary data from previous research, relevant documented parameters and standards can assist ‘scenario-building’ and assessment, guided by the research direction. Figure 8 illustrates the proposed Research Framework. The Object of Research (CCC), associated research domains, research questions and expected outcomes are illustrated in the graphic (outwards from the centre).
Figure 8: The proposed research framework
Some of the possible contextual research questions are as under:-
RQ1. How does the business model of the CCC compare with the traditional construction logistics model? RQ2. What is the optimal location of a CCC to serve a large city in New Zealand? RQ3. What metrics can be used for benchmarking CCC based transport operations? RQ4. What is the scale of productivity improvements (cost and time savings) achieved by a CCC? RQ5. What is the scale of H&S and Social and Environmental benefits achieved by a CCC? RQ6. How does the implemented CCC design compare with a universal model? RQ7. What are the training requirements to maximise benefits of the CCC, as well as gainfully utilise outcomes towards academic enrichment and professional enhancement of construction in New Zealand? RQ8. How is information sharing to be achieved between various participants for meaningful implementation of the concept? RQ9. How do outsourced logistics fit into the overall scheme of CCC operations? RQ10. Can the CCC be only a business opportunity enabler rather than a business establishment? RQ11. What are the reverse logistics possibilities on the CCC vehicle? Is the local context ready for these? RQ12. How can collaboration and CCC contribute to higher sustainability of New Zealand construction.
The proposed research framework enables more research questions to be framed and addressed through different concurrent, or subsequent studies, towards enriching the existing knowledge corpus of construction logistics in the New Zealand context.
5. ConclusionThe New Zealand construction sector is conservative in its perspective and approach to work, owing to its geographical isolation. Its transformation and growth, therefore, faces multifarious challenges. Notable governmental efforts to achieve transformation of the sector are the Construction Sector Accord (2019) and the Construction Sector Transformation Plan (2020). Watercare, an Auckland Council owned entity, and their supply chain partners have identified a CCC approach as a logistics solution for capital water works delivery across Auckland, under a NZ$ 2.4bn contract, over 10 years. The collaborative contract and establishment of a CCC present a unique contextual research opportunity. The concepts have been implemented and researched in Europe, Continental America, and Australia, however, are without precedent in New Zealand. The paper defines a research framework for this unique research opportunity, which is likely to lead to outcomes having a direct and fundamental impact on transformation of the New Zealand construction sector. The outcomes are also expected to support academia and professional bodies in drawing transferrable knowledge for domains
Achievement of Aims

843
Optimising New Zealand construction consolidation centres: Defining a research framework
such as urban planning, urban freight management, energy planning etc., and delivery of relevant training and education.
References Allen, J., Browne, M., Woodburn, A. and Leonardi, J. (2014) A Review of Urban Consolidation Centres in the Supply Chain
Based on a Case Study Approach, Supply Chain Forum: An International Journal, 15(4), 100–112. Allen, J., Browne, M., Woodburn, A. and Leonardi, J. (2012) The Role of Urban Consolidation Centres in Sustainable Freight
Transport, Transport Reviews, 32(4), 473–490. Balm, S. and van Amstel, W. (2017) Exploring Criteria for Tendering for Sustainable Urban Construction Logistics., in Taniguchi,
E. and Thompson, R.G. (Eds.) City Logistics 1: New Opportunities and Challenges, John Wiley & Sons Inc, Hoboken, USA,251–263.
Behrends, S. (2015) Factors Influencing the Performance of Urban Consolidation Schemes, Proceedings of the 2nd Interdisciplinary Conference on Production Logistics and Traffic 2015, 351–357. Available at: https://doi.org/10.1007/978-3-319-21266-1_23
Bernard, S., Samet, J., Grambsch, A., Ebi, K. and Romieu, I. (2001) The Potential Impacts of Climate Variability and Change on Air Pollution-Related Health Effects in the United States, Environmental Health Perspectives, 109, 199–209.
Bertelsen, S. and Nielsen, J. (1997) Just-In-Time Logistics in the Supply of Building Materials, 1st International Conference on Construction Industry Development: Building the future Together, 9-11 December 1997. Singapore.
Bowersox, D., Closs, D. and Cooper, M. (2013). Supply Chain Logistics Management, McGraw-Hill, New York, NY, USA. Browne, M., Sweet, M., Woodburn, A. and Allen, J. (2005) Urban Freight Consolidation Centres: Final Report, Transport
Studies Group, Ministry of Transport, London, UK. Browne, M., Woodburn, A. and Allen, J. (2007) Evaluating the Potential for Urban Consolidation centres, European
Transport\Transporti Europei, 35(35), 46–63. Browne, M., Allen, J., Nemoto, T., Patier, D. and Visser, J. (2012) Reducing Social and Environmental Impacts of Urban
Freight Transport: A Review of Some Major Cities, Procedia – Social and Behavioral Sciences, 39, 19–33. Building Research Association New Zealand (BRANZ). (2018). Study Report SR 388 (2018) Productivity in the Construction
Industry 2017. Che Ibrahim, C., Costello, S., & Wilkinson, S. (2015). Development of an Assessment Tool for Team Integration in Alliance
Projects. International Journal of Managing Projects in Business, 8(4), 813-827. Concept Consulting Group Limited. (2017) Summary Insights on Energy Related Carbon-abatement Opportunities. Concept Consulting Group Limited. (2019) Hydrogen in New Zealand Report 2 – Analysis. Cox, A. and Ireland, P. (2002) Managing Construction Supply Chains: The Common Sense Approach, Engineering,
Construction and Architectural Management, 9(5), 409–418. DG MOVE European Commission. (2012). Study on Urban Freight Transport. Available at: https://civitas.eu/sites/default /files/2012_ec_study_on_ urban_freight_transport_0.pdf Dhawan, K. (2020) PGR9 Confirmation of Candidature Research Proposal, Auckland University of Technology (Internal). Dubois, A. and Gadde, L.E. (2002) The Construction Industry as a Loosely Coupled System: Implications for Productivity and
Innovation, Construction Management and Economics, 20, 621–631. Duncan, A. (2019). Construction Lifelines. Unpublished proposal, BRANZ, New Zealand. Du-Pleiss, C. (2002) Agenda 21 for Sustainable Construction in Developing Countries – A Discussion Document, International Council for Research and Innovation in Building and Construction Technology, United Nations Environmental Programme International Environment Technology Centre, Pretoria, South Africa. Egan, Sir J. (1998) Rethinking Construction, Department of Trade and Industry, London, UK. Eriksson, P. (2015) Partnering in Engineering Projects: Four Dimensions of Supply Chain Integration, Journal of Purchasing &
Supply Management, 21(1), 38–50. Guerlain, C., Renault, S. and Ferrero, F. (2019) Understanding Construction Logistics in Urban Areas and Lowering its
Environmental Impact: A Focus on Construction Consolidation Centres, Sustainability, 11(21), 6118. Gwilliam, K., Kojima, M. and Johnson, T. (2004). Reducing Air Pollution from Urban Transport. Washington DC: The
International Bank for Reconstruction and Development / The World Bank. Hamzeh, F., Tommelein, I., Ballard, G. and Kaminsky, P. (2007) Logistics Centers to Support Project-Based Production in the
Construction Industry, Proceedings of the 15th Annual Conference of the International group for Lean Construction, IGLC 15, East Lansing, USA.
Ibn-Homaid, N. (2002) A Comparative Evaluation of Construction and Manufacturing Materials Management, International Journal of Project Management, 20(4), 263-270.
Institution of Civil Engineers (ICE). (2018) P13 Blueprint. Available at: http://www.p13.org.uk/wp- content/uploads/2018/06/P13-Blueprint-Web.pdf
Intergovernmental Panel on Climate Change (IPCC). (2014) Climate Change 2014: Mitigation of Climate Change. (AR5), Cambridge Press, New York, USA.
International Energy Agency (IEA). (2018) Global EV Outlook 2018 Towards Cross-Modal Electrification, Paris, France. Janné, M. and Fredriksson, A. (2019) Construction Logistics Governing Guidelines in Urban Development Projects,
Construction Innovation, 19(1), 89–109. Juan, A., Mendez, C., Faulin, J., de Armas, J. and Grasman, S. (2016) Electric Vehicles in Logistics and Transportation: A
Survey on Emerging Environmental, Strategic and Operational Challenges, Energies, 9(2), 1–21. Kathuria, V. (2005) Vehicular Pollution Control in Delhi: Impact of Compressed Natural Gas, Economic and Political Weekly,
40(18), 1907– 1916. Kin, B., Verlinde, S. and Macharis, C. (2017) Towards a Sustainable Urban Freight Transport System - Axes for Intervention,
The Logistics Research Network Annual Conference. Southampton, United Kingdom. Kjellstrom, T. and Hill, S. (2002) New Zealand Evidence for Health Impacts of Transport, National Health Committee, New
Zealand. Kohn, C. and Brodin, M.H. (2008) Centralised Distribution Systems and the Environment: How Increased Transport Work Can
Decrease the Environmental Impact of Logistics, International Journal of Logistics Research and Applications, 11(3), 229–245.
Kontovas, C. and Psaraftis, H. (2016). Transport Emission: Some Basics, in Harilaos N.P. (ed.) Green Transportation Logistics: The Quest for Win Win Solutions (pp. 41–79). Springer, Kgs. Lyngby, Denmark, 41–79.
Koolwijk, J., van Oel, C., Wamelink, J. and and Vrijhoef, R. (2018) Collaboration and Integration in Project-Based Supply Chains in the Construction Industry, Journal of Management in Engineering, 34(3), 1–13.

844
Kamal Dhawan, John E. Tookey, Ali GhaffarianHoseini, and Amirhosein GhaffarianHoseini
Lahdenperä, P. (2012) Making Sense of the Multi Party Contractual Arrangements of Project Partnering, Project Alliancing and Integrated Project Delivery, Construction Management and Economics, 30(1), 57–79.
Lebeau, P., Macharis, C., Van-Mierlo, J. and Lebeau, K. (2015) Electrifying Light Commercial Vehicles for City Logistics? A Total Cost of Ownership Analysis, European Journal of Transport and Infrastructure Research, 15(4), 551–569.
Lindén, S. and Josephson, P. (2013) In-housing or Out-sourcing on-site Materials Handling in Housing?, Journal of Engineering, Design and Technology, 11(1), 90–106.
Lindholm, M. and Behrends, S. (2012) Challenges in Urban Freight Transport Planning – A Review in the Baltic Sea Region, Journal of Transport Geography, 22, 129–136.
Liu, E., Yue, S. and Lee, J. (1997) A Study on LPG as a Fuel for Vehicles, Research and Library Services Division, Legislative Council Secretariat, Hong Kong.
McKinnon, A. and Ge, Y. (2006) The Potential for Reducing Empty Running by Trucks: A Retrospective Analysis, International Journal of Physical Distribution & Logistics Management, 36(5), 391–410.
Meredith, J., Raturi, A., Amoako-Gyampah, K. and Kaplan, B. (1989) Alternative Research Paradigms in Operations, Journal of Operations Management, 8(4), 297–326.
Ministry of Business, Innovation and Employment (MBIE). (2017) National Construction Pipeline Report 2017, Wellington. Ministry of Business, Innovation and Employment (MBIE). (2019) Construction Sector Accord, Wellington. Ministry of Business, Innovation and Employment (MBIE). (2020) Construction Sector Transformation Plan, Wellington. Ministry of Economic Development. (2007) New Zealand Energy Strategy to 2050: Powering our Future, Wellington. Ministry of Transport, NZ. (2019) The Green Freight Project, Wellington. Morana, J., Gonzales-Feliu, J. and Semet, F. (2014). Urban Consolidation and Logistics Pooling: Planning, Management and
Scenario Assessment Issues, in Morana, J., Gonzales-Feliu, J. and Semet, F. (eds.), Sustainable Urban Logistics: Concepts, Methods and Information Systems, EcoProduction (Environmental Issues in Logistics and Manufacturing). Springer, Berlin, 187–210.
Naismith, N., Monaghan, B., Zhang, T., Doan, D., GhaffarianHoseini, A. and Tookey, J. (2016) Examining the Productivity in the NZ Construction Industry, The 2nd NZAAR International Event Series on Natural and Built Environment, Cities, Sustainability and Advanced Engineering, Kuala Lumpur.
Organisation for Economic Cooperation and Development (OECD). (2002) OECD Guidelines towards Environmentally Sustainable Transport, https://dx.doi.org/10.1787/9789264199293-en
Ponelis, S. (2015) Using Interpretive Qualitative Case Studies for Exploratory Research in Doctoral Studies: A Case of Information Systems Research in Small and Medium Enterprises, International Journal of Doctoral Studies, 10, 535–550.
Seadon, J. and Tookey, J. (2018) Drivers for Construction Productivity, Engineering, Construction and Architectural Management, 26(6), 945–961.
Shakantu, W., Tookey, J. and Bowen, P. (2003) The Hidden Cost of Transportation of Construction Materials: An Overview, Journal of Engineering, Design and Technology, 1(1), 103–118.
Shakantu, W., Bowen, P., Muya, M. and Tookey, J. (2008) Flow Modelling of Construction Site Materials and Waste Logistics: A Case Study from Cape Town, South Africa, Engineering, Construction and Architectural Management, 15(5), 423–439.
Shakantu, W., Muya, M., Tookey, J. and Bowen P. (2012) Evaluating Truck Empty Running in Construction: A Case Study from Cape Town, South Africa., Australasian Journal of Construction Economics and Building, 8(2), 41–49.
Singer, L. (2018). Creating Value through Procurement: A Report into Public Sector Procurement of Major Infrastructure Projects.
Smith, R., Kersey, J. and Griffiths, P. (2003) The Construction Industry Mass Balance: Resource Use, Wastes and Emissions {Vridis report VR4 (Revised)}, Vridis, United Kingdom.
Statistics New Zealand. (2019) Business Operations Survey: 2018. Available at: https://www.stats.govt.nz/information- releases/business-operations-survey-2018
Transport for London. (2013) Construction Logistics Plan Guidance for Developers, London, UK. Triantafyllou, M., Cherret, T. and Browne, M. (2014) Urban Freight Consolidation Centres – Case Study in the UK Retail
Sector, Transportation Research Record: Journal of The Transportation Research Board, 2411(1), 34–44. Turner, C. (2019). Draft Proposal for Whangaparaoa Peninsula Watercare Projects. (Unpublished), Watercare, Auckland. United Nations Economic Commission for Europe (UNECE). (n.d.). Share of Construction in GDP. Available at:
https://w3.unece.org/PXWeb/en/Charts?IndicatorCode=8 (Accessed on 04 July 2020) van Essen, H. (2008) The Environmental Impacts of Increased International Road and Rail Freight Transport, The Global
Forum on Transport and Environment in a Globalising World, 10-12 November 2008, Guadalajara, Mexico. Verlinde, S., Macharis, C. and Witlox, F. (2012) How to Consolidate Urban Flow of Goods without Setting up an Urban
Consolidation Centre?, Procedia - Social and Behavioral Sciences, 39, 687–701. Vidalakis, C. and Tookey, J. (2005) The Involvement of Builders Merchants in the Development of Improved Construction
Logistics, Proceedings of the 2nd Scottish Conference for Postgraduate Researchers of the Built and Natural Environment (PRoBE), Glasgow Caledonian University, Rotterdam, 337–350.
Vidalakis, C. and Sommerville, J. (2013) Transportation Responsiveness and Efficiency within the Building Supply Chain, Building Research & Information, 41(4), 469–481.
Vrijhoef, R. (2015) Reducing the Environmental Impact and Improving Efficiency of Construction Transport, Proceedings of the Joint CIB Symposium Going North for Sustainability: Leveraging Knowledge and Innovation for Sustainable Construction and Development, 23-25 November 2015, London South Bank University, London, UK.
Vrijhoef, R. and Koskela, L. (2000) The Four Roles of Supply Chain Management in Construction, European Journal of Purchasing & Supply Management, 6(3–4), 169–178.
Walmsley, M., Walmsley, T., Atkins, M., Kamp, P., Neale, J. and Chand, A. (2015) Carbon Emissions Pinch Analysis for Emissions Reductions in the New Zealand Transport Sector through to 2050, Energy, 92(2015), 569–576.
Waste and Resources Action Plan (WRAP). (2011) Using Construction Consolidation Centres to Reduce Construction Waste and Carbon Emissions. Available at: http://www.wrap.org.uk/sites/files/wrap/CCC%20combined.pdf
Watercare Inks $2.4b 10-year Contract with Fulton Hogan, Fletcher Construction. (27 September 2019). The New Zealand Herald.
Wegelius-Lehtonen, T. (2001) Performance Measurement in Construction Logistics’, International Journal of Production Economics, 69(1), pp. 107–116.
Wilkinson, S., Tookey, J., Potangaroa, R., MacGregor, C., Milicich, M., Ghodrati, N., Adafin, J., Stocchero, A. and Bayan, K. (2017) Transforming the Building Industry (Working Paper), National Science Challenge, Wellington, New Zealand.
Ying, F. and Tookey, J. (2014) Managing Logistics Cost – A Missing Piece in Total Cost Management, International Cost Engineering Council IX World Congress, Milano, Italy.
Ying, F., Tookey, J. and Roberti, J. (2014) SCM Competencies in Construction: Lessons learned from New Zealand. Available at: http://openrepository.aut.ac.nz
845
The 54th International Conference of the Architectural Science Association (ANZAScA) 2020
Outdoor Thermal Comfort
A Model Based on Thermal Adaptation in New Zealand
Kasun Perera1, Michael Donn2, Marc Aurel Schnabel3 1, 2, 3Victoria University of Wellington, New Zealand
[email protected], {Michael.Donn2, MarcAurel.Schnabel3}@vuw.ac.nz
Abstract: In the recent past outdoor thermal comfort research has moved to investigate the combined effects of sun, wind and temperature with the human adaptation aspects which had led to identifying many contradictions between the results provided by physiological models and actual thermal perceptions in real outdoor environments. These discrepancies are primarily due to human adaptation to the thermal environment. This paper reports a model developed to comprehend and test adaptation aspects involved and how it influences thermal comfort assessment based on peoples’ thermal expectations and preferences. This investigation involves the Universal Thermal Climate Index (UTCI), an advanced outdoor comfort model currently used globally to examine its applicability in the New Zealand context. The study reveals that standard physiological models cannot be directly applied to different climates to predict comfort levels for various thermal expectations.
Keywords: Outdoor thermal comfort; thermal adaptation; thermal perception and expectations; UTCI.
1. IntroductionOutdoor thermal comfort in an urban environment is a complex issue, which cannot be limited merely to temperature or windiness. However, it is one of the factors that influence outdoor activities in streets, plazas, playgrounds, urban parks, etc. The amount and the intensity of such activities are affected by the level of the discomfort experienced by the inhabitants when they are exposed to the climatic conditions in these outdoor spaces (Givoni, 2003). Peoples’ sensation of thermal comfort is affected by the local microclimate and becomes a decisive factor in the use of space. Gehl (1971) in his work, “Life between Buildings: Using public space” studied the influence of microclimate on outdoor activities by counting people sitting on sunny and shady benches. He showed that local sunny or shady conditions significantly affect the desire of people to either stay or leave.
Altering the physical conditions of public space could enhance the usability and comfort levels of outdoor space. Moreover, a better understanding of the relative influence of the climatic parameters on human comfort in different thermal environments would be highly beneficial in successfully altering the physical conditions of space.
Current models and indices of outdoor comfort follow the theory of thermal acceptance and sensation for comfort calculations based on widely used physiological models of thermoregulation in the human
Imaginable Futures: Design Thinking, and the Scientific Method. 54th International Conference of the Architectural Science Association 2020, Ali Ghaffarianhoseini, et al (eds), pp. 845–854. © 2020 and published by the Architectural Science Association (ANZAScA).

846
Kasun Perera, Michael Donn, Marc Aurel Schnabel
body. In the field, human aspects of comfort assessment have for many years acknowledged behavioural adaptation. For example, the well-known ‘Lawson Criteria’ of comfort in windy environments differentiate between comfort for activities that involve sitting or standing for a extended period and comfort for activities where people are briskly walking through urban space. (Lawson, 1978) In looking to examine thermal comfort, incorporating wind, sun, and temperature effects on people, it becomes necessary to survey not only the subjective rating of comfort but also to record activity-related information.
Due to the complexity of the dynamic and subjective aspects of comfort assessment, a physiological approach alone cannot reflect the behavioural or adaptive influences of people in real environments. Chen (2012) suggests a framework to capture climate knowledge and human knowledge with physical, physiological, psychological, and behavioural attributes.
Thermal comfort studies outdoors have shown an increasing interest in the adaptive approach over the past two decades. These approaches have investigated the relative influence of the weather parameters on human comfort about tolerance rather than the degree of adaptation. According to Nicol (2008), there are two main reasons for this interest. First, are uncertainties of the possibilities of transforming the experimental results obtained under controlled laboratory environments to characterise the complex conditions of real environment settings. Second, is the trend evident in many the field studies that people adapt to the prevailing climatic conditions and tend to be more tolerant of thermal condition variations than is predicted by the laboratory-based physiological models (Brager and De Dear, 1998; Nikolopolou, Baker and Steemers, 2001; Walton, Dravitzky and Donn, 2007; Nasir and Ahmad, 2012; Rajapaksha and Rathnayaka 2019). Also, Hoppe (2002) finds that people spend only ten per cent of their time outside which goes some way to suggest that if it is indeed uncomfortable, they may elect not to do so.
2. Thermal adaptation and thermal comfortPeople gain greater choice outdoors but at the expense of having to tolerate whatever environment they elected to be exposed to (Walton et al, 2007). They have less control over the environmental parameters compared to indoor environmental conditions. Adaptation is likely to be the most suitable option for people to be comfortable outdoors.
Studies done by Webb (1959), Nicol (1973) and Humphreys (1975) were the first experiments which identified differences in the results obtained by subjects and theoretical models in indoor environments. As reported by many indoor thermal comfort assessment studies done in real environments using real subjects (Sharma and Ali, 1983; Busch, 1992; Matthews and Nicol, 1995; Taki, 1999, Nicol, 1999; Bouden, 2001; de Dear and Brager, 1998) using PMV, the index that was created in a controlled environment, indicated that people were not comfortable. In contradiction to the prediction by PMV, many subjects reported they were comfortable.
Similar to the differences discovered in indoor studies, discrepancies occurred between predicted comfort levels and the subjective votes in outdoor field studies (Nikolopolou, Baker and Steemers, 2001; Thorsson, 2004; Feriadi and Wong, 2004; Zhang et al., 2007; Lin et al., 2011; Ng and Cheng, 2012; Yahia and Johansson, 2013). Early outdoor thermal comfort field studies employed indoor thermal indices such as PMV for comfort assessment (Mayer and Hoppe, 1987; Hoppe and Seidl, 1991). All the above studies done in indoors and outdoors reported contradictions between the predicted comfort levels by the theoretical models and actual subjective votes for comfort levels. Thus, it is apparent that none of these short-term changes are adequately accounted for in heat balance models (Nicol, 2004). Moreover, most

847
Outdoor Thermal Comfort
importantly, the thermal steady state between the subject and the microclimate is a rare occurrence in the outdoors.
2.1. Microclimate and human behaviour – integrating adaptation in comfort assessment.
Nikolopoulou and Steemers (2003), define “adaptation” as the gradual decrease of the organisms’ response to repeated exposure to a stimulus, involving all the actions that make them better suited to survive in such an environment. In the context of thermal comfort this may involve all the processes which people go through to improve the fit between the environment and their requirements. Brager and de Dear (1998) separated the adaptive opportunity into three different processes:
• Physical adaptation (behavioral adjustment)• Physiological adaptation (genetic adaptation or acclimatisation)• Psychological adaptation (habituation or expectation)
Thermal sensation votes are the most prominent method of assessing human adaptation aspects inthermal comfort assessment. However, this one-dimensional psychrometric tool is initially designed for indoor environments (Liu et al. 2020). Its outdoor application has many doubts in indicating precise effects of dynamic climatic parameters on thermal comfort which are substantially governed by thermal adaptation and expectations. The initial studies in the indoor environments the neutral thermal sensation (neither cold nor warm) represented the most desired temperature. However, when it comes to outdoor comfort many studies reported discrepancies between neutral thermal sensation and preferred temperature range (Huang et al. 2017; Lin, De Dear, and Hwang 2011).The one-dimensional thermal sensation scale is mainly a representation of momentary thermal perception which does not provide a good understanding of the thermal effect of the sun, wind and temperature and their dynamic effect on thermal adaptation and expectation.
In 2007, D. Walton, M. Donn and V. Dravitzky followed a different approach to develop an adaptive comfort model for Wellington (the WDD model). The model primarily focused on integrating various human adaptation aspects into thermal comfort assessment. It is mainly a multi-dimensional model that comprises of descriptive scales that explore the perceptions of climate variables and affective scales to gauge the effect of climate variables on thermal perception. The WDD model was based on the hypothesis that the majority of people have chosen to be there will “report as comfortable outdoors”. Thus, the primary question becomes – what changes have been made to be comfortable outdoors?
The WDD model formulates adaptive opportunity as an output scale to evaluate to what degree people must change their behavior or the way they use a space in order to reach the preferred thermal neutrality. To evaluate the adaptive opportunity, 33 aspects related to human thermal perception, adaptation and expectation are evaluated to form a single scale that describes the thermal effect. This study aims to extend the WDD model to comprehend the influence of physical parameters in a broader climate range.
2.2 Method
The field survey methodology of the WDD model was followed with certain modifications to extend the climate to more seasons and a more comprehensive range of temperature, sun and wind conditions. A public park in Christchurch was added into survey locations to expand the low and high temperature

848
Kasun Perera, Michael Donn, Marc Aurel Schnabel
range. Christchurch has lower temperatures in winter and higher temperatures in summer compared to the site of the original study – Wellington, where high wind speeds are more regular. To improve the interpretability of the model, this extended WDD model was analysed against one of the current popular outdoor comfort models: Universal Thermal Climate Index (UTCI) (Jendritzky, de Dear, and Havenith 2012).
2.3.1 Field data collection
Local wind speed, air temperature, mean radiant temperature (shaded and exposed) and relative humidity were measured. All the equipment in the main weather station were attached at 1.5m height, which provided the pedestrian level wind and temperature data. Measured globe temperatures were converted to mean radiant temperatures using the following ASHRAE (1997) equation.
(1)
Where: MRT = mean radiant temperature (°C); 𝜀𝜀 = emissivity of the globe (0.95); 𝑝𝑝 = diameter (0.075 m); GT = globe thermometer temperature (°C); T𝑎𝑎 = ambient temperature (°C); 𝑣𝑣𝑎𝑎 = air velocity (m/s).
Survey locations were selected in central Wellington and Christchurch where the public mostly gathered to have a coffee or lunch and spend time, relax, to meet people etc. The choice of location was based partly on the availability of variation of seating choices in terms of sun/wind exposure, types of surface and use of the space during the survey hours. Variation in seating spaces provides people surveyed with the option of changing the physical conditions they experience, opening the survey to a broader range of potential responses.
Field data collection of the 2007 study was done over nine months and sampling was done over 13 days. 540 questionnaire responses were obtained in this instance and the sampling was done between 11am and 3pm. In the 2017 study, sampling was done on 24 days over sixteen months (February 2016 – June 2017) in Wellington and Christchurch. Sampling was done during the same hours and 560 responses were obtained in this survey. A total of 1100 subjective responses were collected with the climate data in both field surveys.
2.3.2 Questionnaire interview
Questionnaires were handed over to participants in these locations. The participants were selected randomly, and the main prerequisite was that the participants had reached thermal equilibrium with the thermal environment. It becomes a prime aspect as reaching thermal equilibrium is vitally crucial in precisely understanding the effect of climate on comfort. 10-minute averages of climate data were calculated for the duration people were answering the questions.
Out of all 1100 participants from 2007 and 2016 study, 50.8% were female and 48.8% were male. Most of the participants were in the age category of 16-35. The intended main use of the location was one of the crucial aspects of the survey. As the survey was done between 11am and 3pm, most of the responders were out in the parks to have their lunch or to have a small break. It was evident by the numbers, as 53.3% said they were outdoors to rest or to eat/drink.

849
Outdoor Thermal Comfort
The structure of the questionnaire is the same as WDD study in 2007. Thermal sensation or impression was questioned through a seven-point ASHRAE (1981) scale which ranges from -3 to +3 with a neutral category in the centre. Four questions were related to the time of exposure to the thermal environment including the intended time of stay. Participants were asked to rate the appropriateness of their clothing for the weather conditions and “clo” value was determined via an item checklist that was provided. Choice of seating position is an essential aspect in this study, as participants have the control of exposing themselves to sun or wind in an open Park. Thus, apart from the questions related to the time of exposure, questions to examine the spot participants chose to sit, the reasons for the selection, rating of the spot compared to other spaces and if they would move to another spot were asked. Three items asked for their preference for warmth, wind, and sunshine.
3. Analysis
3.1 Thermal sensation – evidence for thermal adaptation.
Similar to the results in the 2007 study, the middle three categories of comfortably warm, neutral and comfortably cold received the highest number of votes with a percentage of 80.7%. It provides further evidence to the original hypothesis that most people are likely to be comfortable outdoors as they choose to do so.
3.2 Combined Adaptive Factor (CAF) – exploring human adaptation.
Combined Adaptive Factor – CAF, is the most significant scale that was developed in this research. CAF builds on the 2007 WDD and integrates all the responses into a single scale that represents the adaptation indicated by all survey responses. This representation of human adaptation is a result of a Principal Component (statistical) Analysis (PCA) –a method of Exploratory Factor Analysis. PCA identifies and isolates the possible relationships and patterns within a set of variables to reflect potential underlying theories. This reduction of dimensionality of a big set of variables, is achieved by regrouping them into a limited series of clusters based on their correlation to each other (Bartholomew, Knott, and Moustaki, 2011). The clusters are generally known as components or factors. “Rotation” of these clusters improves the interpretation of the clusters by interrelating variables to form simple structures.
The standardised scores of all the survey responses provided four prominent clusters using PCA with Promax rotation, which had an eigenvalue score of 1. Eighteen variables were loaded into these four components and these components amount to 51% of the total variance of the dataset. The PCA analysis received a Kaiser-Mayer-Olkin measure of sample adequacy score (Kaiser, 1970) of 0.81, indicating the correlations are relatively compact and PCA can generate very distinct and reliable factors (Hutcheson and Sufroniou, 1999).
Table 01 gives the variable clusters and the likely underlying theory for these clusters can be interpreted as follows:
1. Warm or cold related – peoples’ impression of the warmth and coldness of the surroundings andtheir thermal sensation, level of sunlight and clothing.
2. Time of exposure – the time people have been exposed to outdoor climate, the time they wouldlike to be exposed and their estimation before getting exposed.
3. Wind level impressions – the intensity of the wind, it is the cooling effect and if they prefer to have more/less wind.

850
Kasun Perera, Michael Donn, Marc Aurel Schnabel
4. Preference of sun/warm – peoples’ preference for sun levels and how warm they would want to be.
Table 01: Principal Component Analysis extraction – variable clusters.
Abbreviated versions of the questions (not in order of Components asking) Warm or Time of Impression Preference
cold exposure of wind of related levels sun/warm
How warm or cold your surrounding? .748 Wetness of your surrounding .736
Your impression of the sunlight level? .712 Level of clothing -.660 Impression of how warm or cold you feel? .638 Today is a good day to be outdoors. Agree/Disagree? Before sit, how long you expected to stay?
.567 .905
How much longer do you intend to stay here? .748 How much longer would you like to stay here? .674 How long have you been here? Your impression of the wind level?
.660 .778
The wind is annoying today. Agree/Disagree? .759 Wind strong in exposed places? .692 What you usually prefer in terms of the wind? .524 Your impression of the cooling effect of the wind? What you usually prefer in terms of sunshine?
.503 .839
What you usually prefer in terms of warmth? .804 When exposed to the sun it feels you? .494 .542
The first and third factors directly reflect peoples’ thermal impression as measured by UTCI and PMV. The second and fourth factors determine peoples’ reactions to the other two factors. To generate a single scale that represents the entire climate variables and peoples’ impressions, these factors are combined to develop the CAF score.
The CAF score is generated by computing the weighted aggregate for each component which precisely represents the contribution of each variable to the factor. CAF scale interpretation was done by mapping CAF scores with actual subjective responses. It was identified that lower CAF scores indicated that people were feeling cold higher wind/wind chill impressions and preferred more sun and to be warm. The lower CAF scores were linked with lower exposure times as well. Higher CAF scores indicated that people felt relatively warm and preferred more wind and less sun.
The CAF score was examined to find the neutral range where people are comfortable. For this purpose, two questions were used – impression of warm or cold (a descriptive variable) and is it a good day to be outdoors (an affective variable). It should be noted that, only these two questions were used in this study to setup the framework for the multi-dimensional thermal affective CAF model. The actual comfortable range and preferred comfortable range can be more precisely understood by engaging more variables into the analysis. Figure 1 and 2 shows that people have indicated CAF range of 38.8 – 44.7 is comfortable.

851
Outdoor Thermal Comfort
Figure 01 – CAF score averages for Warm or cold impression responses; Figure 02 – CAF score averages for agreement to if it is a good day to be outdoors.
3.3 Thermal Adaptation Index (TAI) – linking human adaptation to climate. To investigate the influence of sun, wind and temperature on thermal comfort, CAF score was regressed with climatic data for all 1100 responses. The model had R2 = 0.40 with a significance of p < 0.01. Ambient temperature, wind and wind gust seem to be the prominent predictors of adaptivity in this case.
Thermal Adaptation Index.
= 24.53 + 0.42 (ambient Temperature) + 0.31 (Wind Speed) – 0.58 (Wind Gust) + 0.05 (Relative Humidity) + 0.15 (Mean R Temp – Exposed) + 0.24 (Mean R Temp – Shaded) (1)
Wind gust has a negative effect on outdoor comfort, which is in line with what people have reported. It is reasonable to assume that RH does not have a significant impact on overall comfort levels. Both wind speed and ambient temperature have a positive impact on comfort levels, while MRT exposed has less impact than MRT shaded.
3.4 Thermal Adaptation Index (TAI) and UTCI
The TAI equation provides an understanding of the thermal effect of physical parameters in New Zealand climate. However, the neutral ranges for TAI should be identified and the stress inflictor on each extreme end need to be determined. For this purpose, two methods are used, 1. Identify and confirm the scale with CAF score. 2. Analyse the scale against UTCI to reveal and confirm the representations of comfort by TAI.
TAI score is regressed against CAF (y = 24.6 + 0.4x, R2 = 0.4) and the neutral range for TAI was discovered as 39.2 (comfortably cold) to 43.08 (comfortably warm. Moreover, the neutral TAI score for this assessment was identified as 40.83.
To confirm the TAI score represents heat and cold stress accurately, it was regressed with UTCI. UTCI is a function of ambient temperature (Ta), Relative Humidity (RH), Wind velocity (V10) and Mean
Radiant Temperature (Tmrt) given in the following equation (Blazejczyk et al. 2012) and the calculation was done using the Rayman Pro software package.
UTCI= f (Ta; Tmrt; V10; RH) = Ta + Offset (Ta; Tmrt; V10; RH) (2)

852
Kasun Perera, Michael Donn, Marc Aurel Schnabel
Mean Radiant Temperature (Tmrt) for exposed spaces that was calculated earlier has been used in UTCI calculations. Wind speed at 10m above ground level is another requirement for UTCI calculation. Since the wind speed was obtained at the pedestrian level, which is 1.5m above ground level, the power of law equation by Gandemer and Guyot (1976) was used to calculate wind speeds at 10m level.
𝑈𝑈 ̅𝑧𝑧 / �̅�𝑈𝐺𝐺= (Z / Z𝐺𝐺)𝑎𝑎 (3)
Ūz = Mean wind speed at the site (m/s), ŪG = Mean wind speed at the gradient boundary layer, Z = Wind speed at 10m height, ZG = height of weather station – 1.5m, 𝑎𝑎 = Terrain-roughness co-efficient (0.35 for small density city)
TAI and UTCI have a very significant correlation with R2 = 0.90 (y= 28.13+0.76) which suggests that TAI scores can be interpreted using UTCI categories.
UTCI is expressed as “an equivalent ambient temperature (°C) of a reference environment providing the same physiological response of a reference person as the actual environment” (Blazejczyk et al. 2012). Generally, UTCI comfortable range spans from +32 to 0 °C, with the no thermal stress reported for the range from +9 to +26 °C. To clearly understand the distribution UTCI and TAI were calculated based on the as measured data collected in the 1100 survey measurements in 5 °C temperature brackets.
Figure 03 – Mean UTCI and TAI in different temperature brackets – adjusted TAI scale UTCI and the TAI score follow the same trend confirming that low TAI scores indicate cold stress and
high TAI scores indicate heat stress. However, the raw TAI score does not vary over as wide a range as UTCI, so we cannot assume that TAI produces an exact facsimile of the UTCI which calculates an equivalent air temperature representative of each combination of sun, wind and temperature.
Figure 03 shows the adjusted UTCI and TAI graph with equal neutral scores. This arbitrary scaling converts the value of the TAI score into a temperature. Since the same climate parameters are used to generate both UTCI and TAI, it is reasonable to assume the neutral or the comfortable equivalent temperature range would be somewhat similar. However, when it is colder, TAI gives a lower score than UTCI. Which means either UTCI overestimates the comfort levels in much colder thermal environments or TAI exaggerates the discomfort. It turns the other way around where UTCI predicts much greater tolerance to warmer climates than TAI. Further looking into the subjective responses on warm/cold

853
Outdoor Thermal Comfort
impression, the subject sample that was taken for this study - predominantly people in temperate climate - have reported somewhat differently than what is predicted by UTCI.
Fig 04 - Subjective response distribution for thermal perceptions – UTCI and subjective responses The physiological model has overestimated the comfort levels when it is directly compared with
subjective responses. From the above figures it is evident that people are more affected by heat and cold stress in warmer and colder days than is predicted by UTCI. This model can be developed using the results from component 2 – a time of exposure to investigate the relative influence of sun, wind, and temperature on various exposure time scenarios. It could develop the model into a much more useful tool to predict preferred comfort levels for various functions and use of space. When the TAI score is calculated for people who are planning to sit outside for long or short periods, the slope of the TAI score is significantly different.
5. DiscussionPeople have different choices and preferences when exposed to the outdoor climate. Also, they adapt to the existing environmental conditions in order to increase comfort levels. CAF provides a much reliable indication of thermal effect and comfort over one-dimensional thermal sensation votes. In CAF, only 36.7% of the total people indicated to be comfortable, whereas subjective warm and cold impressions indicated 80.7% are comfortable. It is a significant drop of 44%.
This study has given satisfactory evidence for the fact that people do get adapted to the thermal environment and the ways they adapt is the key to assess comfort precisely.
Furthermore, it signifies the drawbacks of physiological models in predicting what people feel and prefer in outdoor environments. It points to the need for calibrating physiological models to various climates where people have different perceptions and expectations of thermal environments. A generic physiological model is insufficient for capturing the richness of local adaptation.
The adaptive model presented needs further investigation in a broader range of climates range – including hot humid, hot dry and colder climates to precisely comprehend how it could be developed to identify the unique adaptation characteristics.

854
Kasun Perera, Michael Donn, Marc Aurel Schnabel
References Blazejczyk, K., Epstein, Y., Jendritzky, G., Staiger, H. and Tinz, B. (2012) Comparison of UTCI to Selected Thermal
Indices, International Journal of Biometeorology, 56(3), 515–35. Brager, G., de Dear, R. (1998) Developing an Adaptive Model of Thermal Comfort & Preference, ASHRAE Transactions. Chen, H., Ooka, R., Harayama, K., Kato, S., Li, X. (2004) Study on outdoor thermal environment of apartment block in
Shenzhen with coupled simulation of convection, radiation and conduction, Energy & Buildings, 36(12), 1247–58. Gehl, J. (1971) Life Between Buildings: Using Publics Pace, Island Press, Washington. Givoni, B. (2003) Urban Design and Climate Chapter, in D. Watson, A.J. Plattus, R.G. Shibley (eds.), Time Saver
Standards for Urban Design, McGraw Hill. Blazejczyk, K., Epstein, Y., Jendritzky, G., Staiger, H. and Tinz, B. (2012) Comparison of UTCI to Selected Thermal
Indices, International Journal of Biometeorology, 56(3), 515–535. Huang, T., Li, J., Xie, Y., Niu, J. and Mak, C.M. (2017) Simultaneous Environmental Parameter Monitoring and Human
Subject Survey Regarding Outdoor Thermal Comfort and Its Modelling, Building and Environment, 125, 502–514. Jendritzky, G., de Dear, R. and Havenith, G. (2012) UTCI—Why Another Thermal Index?, International Journal of
Biometeorology, 56(3), 421–28. Lawson, T.V. (1978) The Wind Content of the Built Environment, Journal of Wind Engineering and Industrial
Aerodynamics 3(2-3), 93–105. Lin, T.P., de Dear,R. and Hwang, R.L. (2011) Effect of Thermal Adaptation on Seasonal Outdoor Thermal Comfort,
International Journal of Climatology, 31(2). Liu, S., Nazarian, N., Niu, J., Hart, M.A. and de Dear, R. (2020) From Thermal Sensation to Thermal Affect: A Multi–
Dimensional Semantic Space to Assess Outdoor Thermal Comfort, Building and Environment 182, 107112. Mahmoud, A.H.A. (2011) Analysis of the microclimatic and human comfort conditions in an urban park in hot and arid
regions, Building and Environment, 46(12), 2641–2656. Makaremi, N., Salleh, E., Jaafar, M.Z. and GhaffarianHoseini, A. (2012) Thermal comfort conditions of shaded outdoor
spaces in hot and humid climate of Malaysia, Building and Environment, 48(1), 7–14. Moreno, M.M., Labaki, L.C. and Noguchi, E. (2008) Thermal comfort zone for outdoor areas in subtropical climate,
25th International Conference on Passive and Low Energy Architecture: Towards Zero Energy Building, PLEA 2008, University College, Dublin.
Nasir, R.A., Sabarinah Sh, A. and Azni, A.Z. (2012) Psychological Adaptation of Outdoor Thermal Comfort in Shaded Green Spaces in Malaysia, Procedia - Social and Behavioural Sciences, 68, 865–878.
Ng, E., Cheng, V. (2012) Urban human thermal comfort in hot and humid Hong Kong, Energy and Buildings, 55, 51–65 Nicol, F., Wilson, M., and Chiancarella, C. (2006) Using field measurements of desktop illuminance in European offices
to investigate its dependence on outdoor conditions and its effect on occupant satisfaction, and the use of lights and blinds, Energy and Buildings, 38(7), 802–813.
Nikolopoulou, M., Baker, N. and Steemers, K. (2001) Thermal comfort in outdoor urban spaces: understanding the human parameter, Solar Energy, 70(3), 227–235.
Perera, K., Schnabel, M. A., Donn, M. and Maddewithana, H. (2015) Addressing Human Thermal Adaptation in Outdoor Comfort Research – A Literature Review, in U. Rajapaksha, et al (eds.) 8th International Conference of Faculty of Architecture Research Unit (FARU), University of Moratuwa, Sri Lanka, 477–490
Rajapaksha I. and Rathnayaka C. (2014) Thermal acceptability for urban parks in tropics: Evaluating the effects of environmental attributes on user perceived controls, Proceedings of the 8th Windsor Conference.
Thorsson, S., Honjo, T., Lindberg, F., Eliasson, I. and Lim, E.M. (2007) Thermal comfort and outdoor activity in Japanese urban public places, Environment and Behaviour, 39(5), 660–684.
Walton, D., Dravitzki, V., Donn, M. (2007) The relative influence of wind, sunlight and temperature on user comfort in urban outdoor spaces. Building and environment, 42(9), 3166–3175.

855
The 54th International Conference of the Architectural Science Association (ANZAScA) 2020
PARAMTR: Enhanced generative design tools for large-scale housing developments within a prefabrication context
Joshua Joe1, Antony Pelosi2 and Christopher Welch3 1, 2 Victoria University of Wellington, Wellington, New Zealand
[email protected], [email protected] 3 Victoria University of Wellington, Wellington, New Zealand
Abstract: The research investigates how enhanced, generative design tools can improve building performance and effectiveness of prefabrication at scale, while also encouraging design variance. In this context, enhanced generative design tools refers to a partially algorithmic design tool that supports the designer in their decision-making whilst retaining designer authorship during the design phase.
Designers encounter more issues with residential projects as complexity, scale and performance requirements increase. Prefabrication has the potential to significantly reduce construction time, cost, and material waste at scale. Generative design tools allow for more complex and contextual modelling. When considered in relation to large-scale low-density housing developments, both technologies have the potential to revolutionise and increase economic and environmental viability for future developments.
A new generative tool has been created (PARAMTR) to address the above issues using a design-based research methodology. After identifying critical priorities based on a literature review, the research goal is to produce four different residential designs generatively optimised for prefabrication at scale.
Results from initial research show potential for vastly improved design variance, qualitative and quantitative aspects, and increased time efficiency. The paper will discuss progress towards designing and building smarter homes at scale.
Keywords: Generative design; parametric; residential; prefabrication.
Imaginable Futures: Design Thinking, and the Scientific Method. 54th International Conference of the Architectural Science Association 2020, Ali Ghaffarianhoseini, et al (eds), pp. 855–864. © 2020 and published by the Architectural Science Association (ANZAScA).

856
Joshua Joe, Antony Pelosi and Christopher Welch
1. IntroductionThe world is currently facing the largest shortage of housing supply in history – a problem that New
Zealand is not excluded from. Despite the rapidly increasing demand for residential developments, traditional design and construction methods have failed to adapt, and are presenting more issues than solutions.
New Zealand is painstakingly building thousands of near-identical houses by hand, traditionally, on- site at the increased risk of weather, construction delays and quality defects (Shahzad et al., 2015). In addition, with over 40% of New Zealand’s housing stock damp and mouldy according to the New Zealand Green Building Council (NZGBC, 2020), the industry is not creating smart or good houses. Generative tools and BIM software have matured to the point where tight integration of fabrication, software and designer is now possible. When working at scale, it logically makes sense to utilise these tools together - this is what the research focuses on. The objective of this research is to create, implement and investigate an enhanced generative tool to improve manufacturing efficiencies, quality, and performance of residential buildings at scale.
2. Literature reviewThree primary areas formed the research background – generative design/authorship, existing
generative tools, and prefabrication methodologies/issues. These are directly addressed within PARAMTR itself (section 4) in response to the issues and problem areas identified below.
2.1 Generative design It was found that there are strengths and weaknesses for using human and generative design tools
alike. Generative design tools have strengths in well-defined, complex, and quantifiable problems. They are far superior to humans in terms of design solution output and speed when solving complex problems involving many data sources, constraints and relationships (Sakamoto & Ferré, 2008). However, whilst “…performance increases with reliance on tested good cases, architecture generally will not” (Kalay, 1992). It was found that because of the computational overhead involved with simulating and/or replicating human design behaviour, humans themselves are generally faster and better at dealing with problems that are more qualitative and subjective.
Both parties independently are not enough to reach an efficient, well-designed residential solution. To get the best of both worlds, the tool must facilitate collaboration and interaction for both human and computer at any stage in the design process.
2.2 Existing systems & tools As part of the literature review, an investigation into existing tools within the research topics were
performed. The primary purpose of this was to reduce the duplication of work in areas that has already been further developed by other commercial or research entities.
A common limitation found amongst the tools and projects is that they often did not address construction. Tools such as Finch3D are primarily “…a tool for Architects to leverage their designs in the early phases of a project” (FINCH, 2019) and help accelerate the conceptual design process (Figure 1).

857
PARAMTR: Enhanced generative design tools for large-scale housing developments within a prefabrication context
Figure 1: Existing tools, such as Testfit.io and Finch3D exist, but not without limitations that require significant user intervention at some point in the design process (FINCH, 2019) (TestFit, 2020)
However, it was also learnt that not addressing construction (such as prefabrication) in the conceptual and developed design phases resulted in additional time and money later in the design program. Primarily, the greatest difficulty was “converting” the design to manufacturable components (J. Betz, personal communication, June 11, 2020). There were also several limitations found in the existing tools such as:
Lack of holistic climate analysis or considerations into the generative design process. No consideration of large-scale prefabrication of components, focusing instead on
individual elements (such as windows, curtain wall panels, etc.)
There are several opportunities for the research to improve on and create innovative solutions to these limitations in a way that has not been considered before.
2.3 Prefabrication method & issues
Existing prefabrication methodologies were investigated, and their issues evaluated, mostly within New Zealand. Current systems of prefabrication in New Zealand are made using precast concrete and timber framing, with timber being a superior choice over masonry/concrete in residential construction due to its lower cost, greater flexibility and easier transportation/assembly (Shahzad et al., 2015).
It was found that there could be up to 50% reduction in time on residential projects. Cost would decrease as the size of the projects increased (economy of scale) (Shahzad et al., 2015). However, there are several barriers preventing the mass-adoption of prefabrication. Currently, designers have to deal with increased design complexity, program time and cost when considering prefabrication as a construction methodology (Jaillon & Poon, 2010).
Additionally, standardisation of components and modularity must be tightly controlled to ensure that there is enough flexibility for most projects, whilst keeping the benefits of economies of scale and manufacturing, cost and time efficiencies gained (Gravina da Rocha et al., 2019).
3. Research frameworkTwo primary methods formed the research framework – research for design and design
-based research.

858
Joshua Joe, Antony Pelosi and Christopher Welch
3.1. Research for design Most of the research for design was performed in the beginning with a literature review. Relevant
material was sourced from conference papers, peer-reviewed theses, books, and websites relating to digital tools used as precedence or investigation. The literature review was chosen as a research methodology in order to more accurately learn the limitations, specifications and intended abilities to take into consideration when developing the generative tool later in the research phase. In addition, this ensured that the research (as much as possible) did not overlap with any pre-existing features, approaches or programs to prevent “doubling up” on existing work.
In addition, research for design was also performed throughout the course of the design-based research phase to further improve and support development of the tool and research goal. Continuous research has ultimately resulted in faster, more efficient development and more relevant research findings.
3.2. Design-based research Design-based research forms most of the research timeframe. As the research is evaluating the
development and implementation of an enhanced generative system, this phase is critical to uncovering findings for this paper. Continuous and rapid design-based research allowed for the author to develop the generative tool in an efficient, quick manner in response to any new developments or research found. Continuous design-based research methodology in combination with research for design allowed the author to develop the generative tool in an efficient, rapid manner. In addition, this allowed for quicker responses to any new research findings discovered. The author utilized a versioning number system as a form of “milestones”, with set goals and features for each successive version followed by reflections and evaluate at each stage. Consistent design research, reflection and rapid improvement ultimately proved an effective methodology for the nature of the research at hand.
Based on the issues and shortcomings of existing tools found in section 2.2, a combination of Grasshopper, Rhinoceros 7 and Rhino.Inside were chosen for design development of the tool. Grasshopper is a visual scripting generative tool, specifically designed to interface with the program Rhino 7 (McNeel & Associates, 2019). With the Rhino.Inside plugin, native geometry from Grasshopper and Rhino can be generatively imported into Revit, a mainstream BIM program used in the industry (Rhino.Inside®.Revit, n.d.). The combination of software tools allows for the flexibility, authorship and control required to iteratively create a new generative tool.
4.2. Authors’ names Authors’ given names should precede their family names. This makes it easier to distinguish the given
and family names and makes indexing and searching more predictable. Include author information only when your paper has been accepted for inclusion in the conference.
The authors’ names use the ‘ASA Author’ style - Calibri, 10 pt, centred, no indentation, 24 pt before.

859
PARAMTR: Enhanced generative design tools for large-scale housing developments within a prefabrication context
4. PARAMTR v0.9 – how does the produced tool enhance design and construction at scale?
4.1 Overview
Section 4 discusses the current progress towards the research goal at time of writing. As such, it is a work in progress and subject to change until final publication. This paper discusses three of the fundamental issues being addressed by the research: authorship, enhanced generative design and generative prefabrication.
4.2. Authorship
One of the fundamental issues with implementing a fully automated, generative design system is that the authorship stays with the tool and its original author. Generative tools work best in solving problems in a linear fashion (Peters & De Kestelier, 2013), which goes against the definitively non-linear architectural design process.
The created tool (Personally Augmented Real-Time Algorithm Modularly Tweaked Runtime, or PARAMTR) is designed to address these limitations at a foundational level. Instead of taking a black-box approach (Figure 2) like existing tools (where the inner workings, parameters and variables are inaccessible by the designer), PARAMTR utilises an open-box strategy. This was described by Chris Welch as transforming the design process into “…a discussion of iteration and tweaking [with] disagreement and tweaking [producing] a range of sketch design ideas” (Welch & Moleta, 2014). The result is a design process that allows for greater human involvement in the generative design process (Figure 2) over a traditional black-box approach, with all the power and benefits of an advanced generative system.
Figure 2: Most generative tools take a black-box approach (above), where the inner workings and operation of the tool are unavailable to the end-user. An open-box strategy (below) allows the user
greater control and involvement during the design process.
In PARAMTR, the balance of human and generative design input is mediated with control nodes and a “chunk-based” approach. This approach also has the benefit of allowing the designer to work in a non- linear fashion, another weakness of existing generative tools. Each “chunk” represents a portion of the

860
Joshua Joe, Antony Pelosi and Christopher Welch
overall design process (such as floorplan generation, area optimisation, etc.), with control nodes between each chunk allowing the designer to override, import and export from the tool (Figure 3). In addition, components are standardised across chunks for ease of use, rapid development updates and a higher level of control over aspects of each chunk.
Figure 3: Instead of one large script with a number of fixed parameters, each “chunk” represents a different phase of design, with user-controlled nodes between each chunk in order to allow the
designer import, export and override control over the generative output
The net result is an enhanced generative design approach that allows for a controllable, customisable amount of both generative and human design input. If required, the system can work in an entirely automated or manual fashion. The human designer can interrupt any stage of the design process, manually iterate on a generated design and then refer back to a previous stage of the design at any given point in time. The system naturally encourages human input and therefore encourages co-authorship between human and generative design in a way that existing tools do not realise.
4.3. An enhanced generative design approach
Encouraging co-authorship between human and generative designer requires an understanding of the strengths and weaknesses of each party. From the research performed in section 2.1, it was found that computers are fundamentally better at quantitative, advanced problem solving involving large datasets and many variables (Sakamoto & Ferré, 2008). Humans meanwhile are better at solving qualitative and ill-defined problems such as design and behaviour (Kalay, 1992).
PARAMTR is therefore not a fully automated design tool. Instead, it aims to combine the strengths of human and generative designers to accelerate the conceptual and developed design process of large-scale residential developments. As an example, the initial floorplan generation is mostly automated with defined room sizes and tolerances defined by the designer. The generative tool, however, optimises the placement of specified rooms for optimal sunlight exposure and proximity within a defined working area. The generated output, however, is expected to be tweaked by the designer to match the design and spatial intent (Figure 4). Integrated collaboration is key to a complete, good design solution when working generatively – neither party can work as efficiently and effectively alone.

861
PARAMTR: Enhanced generative design tools for large-scale housing developments within a prefabrication context
Figure 4: Unlike other generative design tools, PARAMTR is designed to leave work better left for humans, rather than attempting to do a bad job of it. This includes problems such as circulation,
design and other qualitative aspects that computers traditionally struggle with
However, there are aspects of the design process within PARAMTR that are better relegated to the generative tool and human alike. Human designers are expected to work with “simple” changes in the tool – such as moving rooms around for better access and circulation or altering the design for aesthetic or practical reasons (Figure 4). These types of problems become computationally inefficient for generative systems to solve. Meanwhile, portions of the tool such as the generative prefabrication chunk are so complex and reliant on mathematics that they are exponentially faster for the generative system to solve.
As of the time of writing, the enhanced approach to a generative tool has resulted in design solutions that would have been otherwise painstaking to produce by humans, or impractically theoretical when generated by computers. A complete design can be generated in 40 minutes or less when an experienced designer is working with the tool, with initial optimisations for prefabrication taking no more than a few minutes. This is expected to increase over time as does complexity, however producing a series of completely different residential designs, optimised for sunlighting and prefabrication within this time range is still markedly faster than how the industry is designing today.
4.4. Generative prefabrication methodologies
In section 2.2, it was discussed that one of the barriers stopping the widespread adoption of prefabrication within the New Zealand design/construction industry is implementation. Complexity, additional time and (therefore) cost make it difficult for the average architectural designer to implement prefabrication at any scale, let alone large-scale residential developments. This is something experienced by the author within the industry.
For this reason, there are two problems that PARAMTR addresses in this area – simplification and implementation of prefabrication systems.
PARAMTR works with the fundamental principles of prefabrication throughout all aspects of the design process. They are as follows:
Standard dimension tolerance - to reduce the occurrence of unique dimensions.

862
Joshua Joe, Antony Pelosi and Christopher Welch
Standardised parts – typologies should share as many common components as possible to increase manufacturing efficiency and preserve the benefits of economy of scale.
Reduced total number of components – designs should be comprised of as little components as possible for manufacturing simplicity
Based on these holistic principles, PARAMTR is designed to accelerate and simplify the implementation of prefabrication at scale. PARAMTR asks for a defined dimension tolerance (currently set to the nearest metre, but adjustable as appropriate) and creates room dimensions that make prefabrication simpler in future. The generative prefabrication “chunk” can currently find common wall components across multiple typologies (over 4 different buildings) and categorise them by exterior or interior (Figure 5). Walls can then be isolated for individual window placement and actively applied to all typologies, in real-time (Figure 6). In the aforementioned figure, 4 different typologies share 20 identical components with 131 instances of each. The commonality approach to prefabrication reverses a typical problem in traditional design – the greater the variance in design, the greater the manufacturing efficiency as more typologies share more components.
Figure 5: PARAMTR is able to differentiate between exterior and interior walls, the two primary differences in wall types in a residential typology.
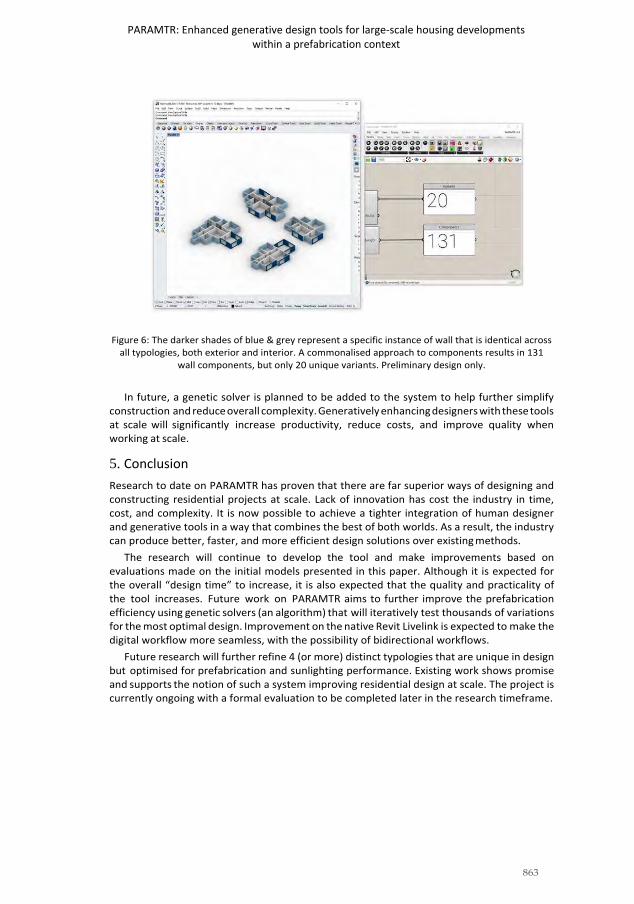
863
PARAMTR: Enhanced generative design tools for large-scale housing developments within a prefabrication context
Figure 6: The darker shades of blue & grey represent a specific instance of wall that is identical across all typologies, both exterior and interior. A commonalised approach to components results in 131
wall components, but only 20 unique variants. Preliminary design only.
In future, a genetic solver is planned to be added to the system to help further simplify construction and reduce overall complexity. Generatively enhancing designers with these tools at scale will significantly increase productivity, reduce costs, and improve quality when working at scale.
5. ConclusionResearch to date on PARAMTR has proven that there are far superior ways of designing and constructing residential projects at scale. Lack of innovation has cost the industry in time, cost, and complexity. It is now possible to achieve a tighter integration of human designer and generative tools in a way that combines the best of both worlds. As a result, the industry can produce better, faster, and more efficient design solutions over existing methods.
The research will continue to develop the tool and make improvements based on evaluations made on the initial models presented in this paper. Although it is expected for the overall “design time” to increase, it is also expected that the quality and practicality of the tool increases. Future work on PARAMTR aims to further improve the prefabrication efficiency using genetic solvers (an algorithm) that will iteratively test thousands of variations for the most optimal design. Improvement on the native Revit Livelink is expected to make the digital workflow more seamless, with the possibility of bidirectional workflows.
Future research will further refine 4 (or more) distinct typologies that are unique in design but optimised for prefabrication and sunlighting performance. Existing work shows promise and supports the notion of such a system improving residential design at scale. The project is currently ongoing with a formal evaluation to be completed later in the research timeframe.

864
Joshua Joe, Antony Pelosi and Christopher Welch
Looking forward, the future in a collaborative human/generative approach brings many benefits to an industry currently struggling with an outdated approach to construction and design. Further work on the research project will progress towards the research goal, with findings to be presented in the final paper.
Acknowledgements This research was made possible by the BRANZ and Building Research Levy.
References Betz, J. (2020, June 11). Discussion with industry members at PrefabNZ CoLab conference 2020 [Verbal
discussion over teleconference]. FINCH. (2019). https://finch3d.com/ Gravina da Rocha, C., El Ghoz, H. B. C., & Jr Guadanhim, S. (2019). A model for implementing product modularity
in buildings design. Engineering, Construction and Architectural Management, 27(3), 680–699. https://doi.org/10.1108/ECAM-02-2019-0096
Jaillon, L., & Poon, C.-S. (2010). Design issues of using prefabrication in Hong Kong building construction. Construction Management and Economics, 28(10), 1025–1042. https://doi.org/10.1080/01446193.2010.498481
Kalay, Y. E. (1992). Evaluating and predicting design performance. Wiley. McNeel & Associates, R. (2019, March 12). Rhino 7 Features. McNeel Forum.
https://discourse.mcneel.com/t/rhino- 7-features/80163 NZGBC. (2020, May 14). Budget boost for warmer homes will bring healthy, safe places for New Zealanders but leaves
thousands in the cold. https://www.nzgbc.org.nz/KNOWLEDGEHUB/Story?Action=View&Story_id=563 Peters, B., & De Kestelier, X. (2013). Computation works: The building of algorithmic thought. John Wiley & Sons. Rhino.Inside®.Revit. (n.d.). Retrieved March 18, 2020, from https://www.rhino3d.com/inside/revit/beta/ Sakamoto, T., & Ferré, A. (2008). From control to design: Parametric/algorithmic architecture. Actar-D. Shahzad, W., Mbachu, J., & Domingo, N. (2015). Marginal Productivity Gained Through Prefabrication: Case
Studies of Building Projects in Auckland. Buildings; Basel, 5(1), 196–208. http://dx.doi.org.helicon.vuw.ac.nz/10.3390/buildings5010196
Welch, C., & Moleta, T. J. (2014). Selective Interference: Emergent Complexity Informed by Programmatic, Social and Performative Criteria. ACADIA 2014. https://www.academia.edu/29423366/Selective_Interference_Emergent_Complexity_Informed_by_Programm atic_Social_and_Performative_Criteria
865
The 54th International Conference of the Architectural Science Association (ANZAScA) 2020
“Plug and play” modular façade construction system for building renovation to achieve nearly Zero Energy Building (nZEB)
Mr. Jorge Torres1, Dr. Roberto Garay Martinez2, Mr. J. Ignacio Torrens-Galdiz3, Ms. Amaia Uriarte4, Mr. Alessandro
Pracucci5, Mr. Oscar Casadei6, Mrs. Sara Magnani7, Ms. Noemi Arroyo8, Mr. Angel M. Cea9 1,2,3,4TECNALIA, Basque Research and Technology Alliance (BRTA), Derio, Spain
jorge.torres, roberto.garay, ignacio.torrens, [email protected] 5,6,7Focchi Spa, Poggio Torriana, Italy
a.pracucci, o.casadei, [email protected] 8Durango Eraikitzen S.A.U., Durango, Spain
[email protected] 9MAAB Arquitectura y Urbanismo SLP. Bilbao, Spain
Abstract: Following energy performance improvement policies, there is a need for the massive renovation of the European building stock. The prevalence of multi-rise buildings with concrete structure and poor thermal performance offers a significant opportunity for renovation packages that facilitate the improvement of the building fabric, with its insulation, air-tightness and integration of building services and solar technologies. The RenoZEB project develops a "plug and play" modular facade construction system answering to this need. This prefabricated plug and play modular system has been tested by reproducing the holistic methodology and new technologies in the market by means of real and virtual demonstrators. The applicability and effectiveness of the methodology has been tested by means of a full- scale mock-up system has been constructed and installed in the KUBIK by Tecnalia test facility. The design, construction, manufacture & installation cycle has been tested. Its applicability for a real construction project for a multi-rise residential building in Spain is presented.
Keywords: Building Retrofit; Energy performance; Industrialized Construction. Building envelope, H2020,
1. IntroductionAs Pérez-Lombard (2008) has pointed out, the building sector is responsible for 40% of primary energy
consumption in Europe and about 33% of total GHG (greenhouse gases) emissions according to United Nations Environment Programme (2015).
In this context of unsustainable energy consumption, the strategy proposed by the European Commission "Europe 2020" which aims to achieve "smart, sustainable and inclusive growth" has become the main continental initiative that defines the roadmap to improve this situation. Three main objectives
Imaginable Futures: Design Thinking, and the Scientific Method. 54th International Conference of the Architectural Science Association 2020, Ali Ghaffarianhoseini, et al (eds), pp. 865–874. © 2020 and published by the Architectural Science Association (ANZAScA).

866
Jorge Torres, Dr. Roberto Garay Martinez, J. Ignacio Torrens-Galdiz, Amaia Uriarte, Alessandro Pracucci, Oscar Casadei, Sara Magnani, Noemi Arroyo, Angel M. Cea
have been defined: the reduction of GHG emissions, the increase of renewable energies and the improvement of energy efficiency. The EU Directives (Council Directive 2002/91/EC and 2010/31/EU), and the EU Construction Products Regulation (2011), contain a number of basic requirements applied specifically to the building sector for the "Energy Economy and Heat Retention".
In Europe, many studies such as Ravetz (2008) state that 75% of the dwellings estimated for 2050 have already been built. About 40% of Europe’s residential building stock was constructed before 1960 when energy building regulations were very limited. As Economidou et al. (2011) has pointed out, the majority of these buildings are apartment blocks. These aged and poor-performing buildings represent an opportunity for building renovation to achieve the aforementioned objectives. This is also the case for Spain, where, although a recently deployed building code CTE (2019) requires NZEB performance for new buildings, its building stock was mainly constructed before the initial building codes with some energy requirements, NBE CT presented in (1979) and a renovation rate of about 1%, as UE (2019) has pointed out.
The most common renovation technique involves adding insulation on the external part of the building envelope on site. This process is considered to require extensive labor on site and presents high damage risks for damage because of being exposed to different conditions (outdoor force, weather conditions). The use of a modular "Plug and play" façade can diminish these risks and reduces the time needed during the renovation process on site (fewer disturbances for the inhabitants).
HVAC systems installed in the existing buildings are often difficult to retrofit since their installations are spread through the whole building having indoor and outdoor components. To solve this, many studies suggest the use of prefabricated modules. Apartment blocks have commonly a lack of useful surface for the installation of solar generation systems on the roof. A solution to this is the integration of Photovoltaic and Solar thermal systems in facades.
The RenoZEB project aims to unlock the nZEB renovation market through a new systematic approach to retrofitting. Among other activities, a "plug and play" modular façade construction system has been designed for the renovation of existing residential buildings towards NZEB performance. The "Plug and play" system has been developed to include and respond to all problems identified above.
Transitioning from research & development to implementation in commercial projects tends to take significant time and may imply undertaking considerable risks. To minimize these risks and accelerate the escalation of RenoZEB to ready-to-use innovative façade solutions the RenoZEB project includes a pre- validation phase. For this purpose, a full-scale system validation has been conducted in the KUBIK by Tecnalia infrastructure in Bilbao, Spain presented in (Chica et al., 2011; Roberto Garay et al., 2015).
2. System DefinitionThe RenoZEB "plug and play" modular façade is unitized facade system that overlaps the existing building without removing its original envelope. The system performs the following functions: Addition of insulation, improvement of envelope airtightness, replacement of fenestration and the integration of solar systems and efficient HVAC systems.
2.1. RenoZEB system’s fixing design
The definition of the structural system of existing buildings has a central part in the design of the facade solution. It is important to ensure that the building can support the load added to the building due to the retrofit. Each building should be studied to determine the load bearing capacity and connection points.
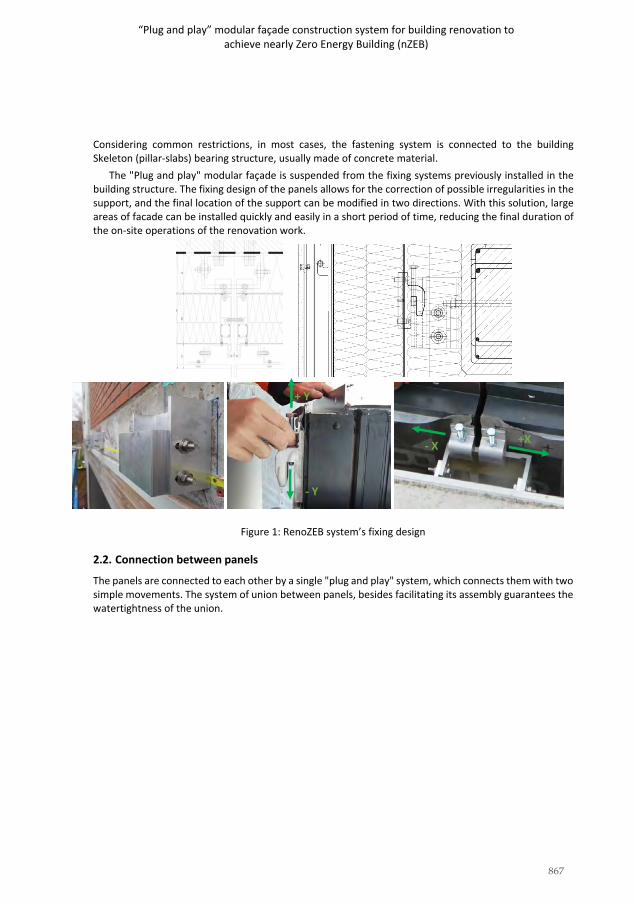
867
“Plug and play” modular façade construction system for building renovation to achieve nearly Zero Energy Building (nZEB)
Considering common restrictions, in most cases, the fastening system is connected to the building Skeleton (pillar-slabs) bearing structure, usually made of concrete material.
The "Plug and play" modular façade is suspended from the fixing systems previously installed in the building structure. The fixing design of the panels allows for the correction of possible irregularities in the support, and the final location of the support can be modified in two directions. With this solution, large areas of facade can be installed quickly and easily in a short period of time, reducing the final duration of the on-site operations of the renovation work.
Figure 1: RenoZEB system’s fixing design
2.2. Connection between panels
The panels are connected to each other by a single "plug and play" system, which connects them with two simple movements. The system of union between panels, besides facilitating its assembly guarantees the watertightness of the union.
+ Y
- X +X
- Y

868
Jorge Torres, Dr. Roberto Garay Martinez, J. Ignacio Torrens-Galdiz, Amaia Uriarte, Alessandro Pracucci, Oscar Casadei, Sara Magnani, Noemi Arroyo, Angel M. Cea
Figure 2: The RenoZEB system panel connection design
2.3. Wall composition
Once renovated, the building envelope is composed of three layers: • Existing wall: This layer corresponds with the existing envelope of the building object of
renovation. It is not necessary to be removed. • Cavity: This layer is required to host the bracket that anchors the RenoZEB system and to absorb
eventual tolerances of the existing wall. It is also designed to accommodate additional thermalinsulation, if required.
• A prefabricated solution based on an aluminium frame anchored at the existing wall. This system incorporates thermal insulation, an external finish, Windows, or technical systems such as solarsystems, or HVAC components.
Figure 3: RenoZEB envelope system's wall composition (left) and Mock-up of the RenoZEB facade module (right)
The window frame unit can be adapted in size. The maximum height of the unit is 2500 mm and the maximum width of the unit is up to 2100 mm because of the maximum size of the façade modules. So, the system offers the possibility to get a wide range of different window openings.

869
“Plug and play” modular façade construction system for building renovation to achieve nearly Zero Energy Building (nZEB)
Figure 4: RenoZEB envelope vision unit cross section and parts
4. Early-stage full scale deploymentThe RenoZEB “Plug and Play” module has been tested at full scale in KUBIKby Tecnalia test facility, a full scale experimental infrastructure for R&D+I on energy efficiency and testing of building envelope systems. As some researchers (Garay et al., 2014; Garay et al., 2017; Garay et al., 2018) have pointed out, this building has already served as test environment for various building envelope retrofit systems. As Elguezabal et al. (2015) and Garay et al. (2016) have indicated, additionally to the thermal performance, it also allows to evaluate and develop the assembly and erection procedures, especially for industrialized solutions such as the RenoZEB "Plug and play" modular construction system.
The test setup has consisted on a two-floor façade section with an area of more than 20 m2. Opaque panel units with windows have been used.
Figure 5: Installation of the RenoZEB Plug and Play façade system

870
Jorge Torres, Dr. Roberto Garay Martinez, J. Ignacio Torrens-Galdiz, Amaia Uriarte, Alessandro Pracucci, Oscar Casadei, Sara Magnani, Noemi Arroyo, Angel M. Cea
The time taken for installation was much less than that required for the installation of a conventional ventilated facade system and the auxiliary equipment needed is also less than that required for the installation of a conventional system. Only need a scissor lifts to access work area from externally and a Mobile crane/ Telescopic handler to lift the units during installation. For the installation is not necessary protection scaffolding. The total costs of the facade installation are reduced due to the saving of time and auxiliary equipment.
This test setup was used to validate critical points in the installation process. The full installation procedure was tested, including the installation of anchors in the façade, hanging of façade elements on them and sealing of junctions. A validation protocol was set so that the system proved to be adaptable to variations in anchor locations in 3D, allowed access for the assembly team to perform such adaptations and resulted in a satisfactory seal of junctions.
5. Retrofit of a real buildingThe renovation of a real building will be carried out in Durango (Spain). The building consists of a 3 Floor Residential building with 7 apartments, with an exempt rectangular floor plan (22m x 9m) and 12.00m in height, a gross area of 792 m2 and net space conditioned area of 374 m2. Originally built in 1960 with a reinforced concrete structure, the building was renovated in 2005. In its configuration prior to the renovation, façades consists of a cavity wall comprising, an outer hollow brick layer, 4 cm insulation, air chamber, an interior hollow brick layer and 3 cm plaster. The facades have an exterior finish of two types; a base and lateral finish of natural stone, combined with face brick.
Figure 6: Pictures of the building
The retrofit of the facade will span over 196 m2 and is programed for initiation in October 2020. With triple target of 60% energy use and 80% CO2 reduction, and providing 20% of renewable energy.
Along with the energy targets, the "plug and play" modular facade system is expected to perform large reductions in cladding materials (50%), insulation boards (20%) and construction waste (25%).

871
“Plug and play” modular façade construction system for building renovation to achieve nearly Zero Energy Building (nZEB)
The final design is the outcome of a parametric energy simulation process with the different intervention possibilities. Multiple combinations of retrofitting variants have been simulated, assessing the space heating and ventilation energy needs, and the intervention cost.
Its configuration comprises highly insulated opaque sections (U= 0.2 W/m2K) and windows (U= 1,1 W/m2K), as well as a large installation of solar thermal and PV panels in the South-exposed walls. The energy savings achieved are indicated in the following table:
Table 1: Results of energy simulations of retrofit
PRE Retrofit (kWh/m2) POST Retrofit (kWh/m2) Space heating energy demand 110 14.5
DHW demand 19 19 SH+SH energy use 180 33
Figure 7: Left: Current stage building drawings in REVIT based on building’s 3D scanning. Right: retrofitting proposal, modules lay out

872
Jorge Torres, Dr. Roberto Garay Martinez, J. Ignacio Torrens-Galdiz, Amaia Uriarte, Alessandro Pracucci, Oscar Casadei, Sara Magnani, Noemi Arroyo, Angel M. Cea
Previous construction works at KUBIK validated that the fixing system was reliable and replicable, as well as the quality of module-to-module junctions.
This system works perfectly for the renovation of buildings with flat roofs, and for all floors of a building with a sloping roof except for the top floor. Due to the typology of the roof, the vertical displacement of the panel for its fixation on the façade is not possible.
This is actually the configuration of the wall-to-roof junction in Durango. It comprises a relevant protrusion which has posed a significant challenge for the definition of the installation works.
For this reason, a system has been designed to hang the panel so that it can be fixed to the façade, avoiding the roof eaves. A specific connection detail and tooling design has been required for this case. Because the "Plug and Play" modular façade is not fixed to the structure and the panels are suspended from the fixing systems previously installed in the building structure. For this reason, they must be installed by moving them vertically on the building's façade as shown in the following image. As it can be seen, it has been necessary to modify the system of hanging the panels in order to be able to carry out the installation.
1. Mobile crane2. System of hanging3. Sloping roof4. Facade module
Figure 8: fixing system meeting with sloping roof
This system will be replicable for any other building with this type of roof, allowing the use of the plug and play system designed for all existing building typologies.
6. Discussion & ConclussionsThe RenoZEB project, responds to the need for renovation packages that facilitate the improvement of the building fabric, incorporating insulation, providing air-tightening and allowing integration of building services and solar technologies. The developed facade system allows in a simple and fast way to carry out the renovation of an existing building allowing the and achieving near zero energy consumption buildings (nZEB) reducing the final duration of the on-site operations of the renovation work.

873
“Plug and play” modular façade construction system for building renovation to achieve nearly Zero Energy Building (nZEB)
The design, construction, manufacture & installation cycle, and the solution of anchoring and fixing of the modular "plug and play" facade system has been tested, and it has been verified that the execution times and auxiliary equipment needed are reduced compared to the execution of a conventional ventilated façade.
The implementation of the “plug and play” modular facade system at full-scale in KUBIK has served to validate the system under controlled conditions and remove uncertainty from the escalation process.
The fixation system developed for the system allows for adaptation to the common irregularities in existing walls, so that the Plug and Play system can be applied under real conditions. However, the authors’ acknowledge that a proper structural analysis of the existing wall needs to be performed so that its load bearing capacity is guaranteed and it is necessary to resolve how the modular facade system are integrated in the building’s system, considering all the adjacent elements, such as wall-to-roof junction.
In the retrofit of a real building, it has been necessary to modify the system of hanging the panels in order to be able to carry out the installation because the sloping roof prevented the vertical displacement of the panel for its fixation on the façade, which has posed a significant challenge for the definition of a system to hang the panels, but will be replicable for any other building with this type of roof.
Acknowledgements This project has received funding from the European Union’s Horizon 2020 research and innovation programme under grant agreement No 768718.
References
Chica, JA et al, (2011), KUBIK: Open building approach for the construction of an unique experimental facility aimed to improve energy efficiency in buildings. Proceedings of the O&SB2010 “Open and Sustainable Building”, ISBN: 978-84-88734-06-8
Council Directive 2002/91/EC on the Energy Performance of Buildings. EPDB. Council Directive 2010/31/EU, on the Energy Performance of Buildings. EPDB (recast). Council Regulation (E.U.) No. 305/2011 laying down harmonised conditions for the marketing of construction
products. CPR. Economidou, M., Atanasiu, B., Despret, C., Maio, J., Nolte, I., & Rapf, O. (2011). Europe’s buildings under the
microscope. A country-by-country review of the energy performance of buildings. Buildings Performance Institute Europe (BPIE).
Elguezabal Esnarrizaga, Peru; Garay Martinez, Roberto. (2015), Experiences When Employing Different Alternatives For Envelope Upgrading, Journal Of Facade Design And Engineering, V. 3, N. 1, P. 81-89,. ISSN 2213-3038. <https://doi.org/10.7480/jfde.2015.1.921>.
EU, JRC,Comprehensive study of building energy renovation activities and the uptake of nearly zero-energy buildings in the EU Final report, <https://ec.europa.eu/energy/sites/ener/files/documents/1.final_report.pdf. >
Garay Martinez, Roberto, (2018), Hybrid numerical and experimental performance assessment of structural thermal bridge retrofits, Journal of Facade Design and Engineering, v. 6, n. 2, p. 095-106,. ISSN 2213-3038. <https://doi.org/10.7480/jfde.2018.2.2206>.
L. Pérez-Lombard, et al., (2008). A review on buildings energy consumption information, Energy Build. 40 Ravetz, J. (2008), State of the stock – What do we know about existing buildings and their future prospects? Energy
Policy, 36(12), 4462-4470.

874
Jorge Torres, Dr. Roberto Garay Martinez, J. Ignacio Torrens-Galdiz, Amaia Uriarte, Alessandro Pracucci, Oscar Casadei, Sara Magnani, Noemi Arroyo, Angel M. Cea
Roberto Garay Martinez, Josu Benito Ayucar, Beñat Arregi Goikolea, (2017), Full scale experimental performance assessment of a prefabricated timber panel for the energy retrofitting of multi-rise buildings, Energy Procedia, Volume 122, 2017, Pages 3-8, ISSN 1876-6102, <https://doi.org/10.1016/j.egypro.2017.07.288>.
Roberto Garay, Amaia Uriarte, Inés Apraiz, (2014), Performance assessment of thermal bridge elements into a full scale experimental study of a building façade, Energy and Buildings, Volume 85, Pages 579-591, ISSN 0378-7788, <https://doi.org/10.1016/j.enbuild.2014.09.024>.
Roberto Garay, Beñat Arregi, Peru Elguezabal, (2016), Experimental Thermal Performance Assessment of a Prefabricated External Insulation System for Building Retrofitting, Procedia Environmental Sciences, Volume 38, 2017, Pages 155-161, ISSN 1878-0296, <https://doi.org/10.1016/j.proenv.2017.03.097>.
Roberto Garay, José Antonio Chica, Inés Apraiz, José M. Campos, Borja Tellado, Amaia Uriarte, Víctor Sanchez, (2015), Energy efficiency achievements in 5 years through experimental research in KUBIK, Energy Procedia, Volume 78, Pages 3222-3227, ISSN 865-870, <https://doi.org/10.1016/j.egypro.2015.11.009>
United Nations Environment Programme (2015)– Sustainable Buildings and Climate Initiative, Retrieved March 30, from <http://www.unep.org/sbci/AboutSBCI/Background.asp>
Web (1979), NBE CT-79 Norma Básica de la Edificación <https://www.boe.es/buscar/doc.php?id=BOE-A-1979- 24866>
Web (2019), CTE 2019 <https://www.codigotecnico.org/DocumentosCTE/DocumentosCTE.html>

875
The 54th International Conference of the Architectural Science Association (ANZAScA) 2020
Practical understandings and use of smart city concepts in Australia
Fanni Melles1, Jeni Paay2, Ian Woodcock3 and Gergana Rusenova4
1,2,3,4 Swinburne University of Technology, Melbourne, Australia {fmelles1, jpaay2, iwoodcock3, grusenova4}@swin.edu.au
1,2,3 Centre for Design Innovation, Melbourne, Australia 2,3,4 Smart Cities Research Institute, Melbourne, Australia
Abstract: Humanity and its only home, the planet Earth, are facing significant challenges. Habitats need to prepare for crises such as overpopulation, climate change, and economic instability. Cities, providing home for more than half of human kind, are known to consume the majority of the Earth’s resources, produce most of the waste and emit great amount of greenhouse gasses. As acknowledged by many international, national, and regional organisations, these challenges require new approaches to urban planning, design and management to transition existing urban areas to more resilient and sustainable futures. The smart city is proposed as a potential approach, although its adoption is far from widespread, especially in urban design. This paper investigates how the smart city concept is used and implemented, and the presented challenges are targeted in design practices of Australia, through interviews with design practitioners. We present preliminary findings on different understandings of the smart city and the required changes for cities. Early evidence indicates lack of agreement around the smart city concept, and overarching themes with various elements regarding the concerns, opportunities and strengths of the future of cities by those who use it in their design practice.
Keywords: Smart city; practical use; interviews; professional understanding.
1. IntroductionUndoubtedly, cities are required to change due to unprecedented challenges humanity is facing, among others the climate change and overpopulation (European Commission, 2012; United Nations, 2018). As the number of people is projected to grow, 10 billion by 2050, their habitat is predicted to be majorly urban; 55% of people were living in cities in 2018, which is also said to increase to 68% by 2050, adding at least 2.5 billion more people and their consequences to urban areas (United Nations, 2018). Although cities only cover 3% of the Earth’s dryland, they are known to consume 60-76% of its resources, produce 70% of its waste, and emit of 71-76% of its greenhouse, thus being the key to the needed change (International Organization of Standardization, 2017; United Nations, 2018). However, how this transformation can occur in cities is not yet accepted (Albino et al., 2015; Madden, 2019).
Imaginable Futures: Design Thinking, and the Scientific Method. 54th International Conference of the Architectural Science Association 2020, Ali Ghaffarianhoseini, et al (eds), pp. 875–884. © 2020 and published by the Architectural Science Association (ANZAScA).

876
Fanni Melles, Jeni Paay, Ian Woodcock and Gergana Rusenova
The next generation of cities could positively contribute to these challenges (Murgante and Borruso, 2015; Madden, 2019). Accordingly, international organisations, governments, and research groups had started researching how future cities might look; such as the United Nations established 17 Sustainable Development Goals, European Union’s European Commission guards sustainability, ISO issued its ISO/TC 268 for Sustainable Cities and Communities (European Commission, 2012; International Organization of Standardization, 2012; United Nations, 2015). However, many also have started to examine smarter ways to approach the city; thus, the smart city concept has been receiving greater attention (Amsterdam Smart City, 2009; Cocchia, 2014; International Organization of Standardization, 2017).
There is no one accepted definition for the term smart city (Cocchia, 2014; Zheng et al., 2020). One understanding is the digital, technologically advanced city, with sensors and Internet of Things (IoT), using the collected data to enhance the procedures in the city creating a more efficient, thus sustainable way of life (Su et al., 2011; Schindler and Marvin, 2018). Smart city also can be associated with smart citizens emphasising their quality of life and level of agency (Kunzmann, 2014; Musa, 2018). According to some research, smart city cannot be smart without being sustainable, resilient, and conscious about its habitants’ wellbeing (Ahvenniemi et al., 2017; Zhu et al., 2019). Additionally, smart cities can be identified through different pillars and levels, while the identification often involves indices measuring smartness based on different criteria sets (Giffinger and Gudrun, 2010; Musa, 2018; Zhu et al., 2019).
Nevertheless, the smart city concept is not supported by everyone researching future cities. Two of the biggest issues are the many different definitions and the ‘smart city’ labelling trend taking away the meaning of the term (Giffinger and Gudrun, 2010; Cocchia, 2014). Many critiques point out that people are missing from the technological approach, while others question if smart citizens are needed, how they will be nourished, and what happens with the existing inhabitants (Hollands, 2008; Hill, 2013). Furthermore, the motivations are questionable whether smart city is only invented for the sake of the technology industry and how the efficiency, associated with smart city, would affect the inhabitants (Hollands, 2008; Albino et al., 2015). Finally, even the individual existence of the smart city concept can be challenged due to overlapping concepts of different urban futures (Hollands, 2008; Budde, 2013).
However, this whole discussion seems to be separated from the profession responsible for designing the built environment; thus, affecting people and nature at once. The design professionals are rarely involved in establishing the operationalisability of the smart city concept creating a gap between theory and practice. Furthermore, the lack of agreement in the outline of future cities results in diverse approaches fragmenting the professionals’ impact on the built environment. Thus, they are challenged to work with their best knowledge, individually, without a shared understanding and operationalisability of the future of cities. (Giffinger and Gudrun, 2010; Cocchia, 2014; Murgante and Borruso, 2015)
This article reports the ongoing research on how Melbourne-based practitioners approach the design of future cities and the smart city concept through interviews about their practice. Although the interview phase is still ongoing, the following parts introduce initial findings derived from the already conducted interviews with practitioners, also involved in research. The article reports the different approaches of the smart cities impacting the professionals in their design and their associated key points – fears, opportunities, and strengths – as crucial parts of the design for future cities are analysed.
2. MethodologyThe investigation is based on semi-structured interviews with Melbourne-based professionals, including architects, urban planners and designers, and engineers due to their role in designing elements of urban areas. The participants are chosen for their description available on online platforms as working for the

877
Practical understandings and use of smart city concepts in Australia
future city and considering different aspects of it. They are contacted via email, and, after a positive response, additional details, such as the Interview Guide (the basis of the semi-structured interviews), are shared. The participation involves being interviewed online in a semi-structured format, providing the opportunity to follow interesting lines of reasoning beside the questions. During the interview, the established questions start the conversation about their vision for the future of cities and then their opinion on the smart city as warm-up questions. For usability, the questions are open for the interviewee being for or against the smart city concept, and the conversation continues based on their vision. Therefore, this analysis presents the results on the future of cities and smart cities combined.
The two warm-up questions identify the interviewee’s approach to the future of cities, whether they have a definite vision for it and how they imagine it. The initial inquiries are followed by the 3 questions: what are the three biggest (1) fears; (2) opportunities; and (3) strengths of the future of cities in their professional opinion? With these questions, they are encouraged to handle the future of cities as an entity and give details for their visions. The limitation of three items assists them to give more focused answers and removes the burden of giving all the examples. Additionally, the 3 questions provide the chance for the participants to think of themselves as advocates of their vision for the future of cities.
Transcripts of the interviews are created using the Otter.ai transcribing service. Then the analysis starts with the use of NVivo software. Different nodes and cases are coded into each transcript according to the participant’s view of the topic. Based on the codes, overarching themes can be identified, and recurring items highlighted and collected. The software facilitates different analytical tools from running a word frequency analysis to the more complicated explorations with coding.
The following section introduces preliminary findings from the analyses of the 11 interviews conducted until May 2020. The 11 participants were mostly architects by profession of the first interviews, as shown in the Demographics (Table 1). They were also all related to academia engaged with teaching activities, involved with research. Being more connected to theory than a usual professional prevented the analysis of the gap between theory and practice for now. The interview stage is continuing and to be finished with at least 15 practitioners from each profession by 2020.
Table 1 Demographics of the participants in the investigation until May 2020
Demographic data of initial participants Number Percentage (N=11) Age
60-70 3 27% 50-60 2 18% 40-50 2 18% 30-40 4 36% 20-30 0 0%
Gender female 2 18% male 9 82%
Profession architect 7 64% architectural engineer 2 18% engineer 2 18% urban designer 0 0% urban planner 0 0%
Interview lengths 30-45 3 27% 45-60 4 36% 60-75 4 36%

878
Fanni Melles, Jeni Paay, Ian Woodcock and Gergana Rusenova
3. Findings
In response to the question about ‘is the smart city the future city’, 45% of the participants answered the question as ‘not exactly’ – either they were not familiar enough with the smart city concept, or they would rather not use this label. Interestingly, 27% of the participants were strongly against the smart city concept due to their concerns of loss of agency or technological advancements for the sake of technology. This start provided information to direct the interview into fruitful areas where the details could be discussed instead of sticking to a term which may not align well with the participant’s thinking.
Following, the (1) question opened up the concerns about the future of cities, and it seemed to be a good start because it was easy to answer for the participants. When asked about their 3 biggest fears, most professionals wanted to include more than 3 items, and these provided information about what the designers must take care of, or at least think of during the design. Fears, challenges, and concerns seemed easy to articulate because all of the participants had been thinking about the problems. The (2) question introduces the chance to break pessimism and turn towards what one can hope and highlight as possibilities for the future. The opportunities were a harder topic; however, with perseverance, their ideas were also discussed. (It must be said that none of the participants was a real pessimist, but more than 80% of them found it easier to talk about the challenges at first.) Many of the answers for (2) question were concentrating on the enhancements of current circumstances. The topic of strengths (3) proved to be the most challenging because they were asked to name the strengths of something abstract, which may not even exist yet. Nevertheless, the participants seemed to embrace the challenge and managed to identify strengths for their visionary future of cities. Sometimes, the strengths did not come from the envisioned future of cities, but the existing cityscapes. In their opinion, these features of the city seemed worth keeping or even further developing while transforming to the future of cities.
4. DiscussionThe findings from the preliminary interviews can be discussed around two main themes: Visions for the future and smart city; and Fears, opportunities and strengths for the future of cities. The latter contains seven subtopics which were recurring themes through the interviews: the built and the natural environment; city as an entity; community; design; economy and energy; and technology.
4.1. Visions for the future and smart city
Talking about the future of cities answering the ‘what does the future city mean?’ question, many participants highlighted that their visions were based on current cities. They noted that the physical presence of a city might not change quickly since cities were founded centuries ago, continuously providing habitat for humanity. Thus, their vision was based on current experiences in cities, giving their opinion on how to enhance that. However, one indicated that one of humanity’s purposes is “to explore beyond the Earth to look for other places to live”; hence, there will be chances to establish new habitats learning from current experiences. Finally, some also noted that while “the city as an entity cannot change easily, the human approach must”. According to their interpretation, the city itself is an existing circumstance; thus, the required changes seem possible to arrive rather from the inhabitants, being more conscious about their effects on the built and natural environment.

879
Practical understandings and use of smart city concepts in Australia
Answers to whether smart city is the future city presented the challenges also detectable in research of the future of cities. The participants did not have a clear definition of smart city, understandably, as there is no common one (Cocchia, 2014). Additionally, many highlighted the fact that they are not supporters such terms due to their wide use for marketing purposes only, as the literature also indicates (Giffinger and Gudrun, 2010). Only one of the engineers defined smart city clearly; however, even this professional acknowledged that this might be only an additional meaning beside the existing numerous ones. Even though they did not agree on the aims, they agreed on having urban challenges ought to be addressed with diverse approaches. Many even mentioned that smarter approaches to urban design and way of living in cities could be beneficial, even required. These answers were investigated further in detail to the challenges human habitats facing (see Introduction for the challenges).
4.2. Fears, opportunities and strengths in the future of cities
As the interviews continued with the questions about what are the three biggest (1) fears; (2) opportunities, and (3) strengths of the future of cities in their professional opinion, the professionals included several items of what the research had shown to be crucial. Although they rarely gave the same answers, the replies tended to be categorisable around: the built and the natural environment; city as an entity; community; design; economy and energy; and technology. The differences of the answers can be observed through the word frequency analysis presented as word clouds (Figure 1). However, rarely was an item repeated or continued throughout the 3 questions, as the further examination presents, suggesting the concerns, opportunities and strengths can be separated. (Table 2).
Figure 1 Word frequency analysis on the Fear, opportunity, and strength questions with NVivo software (displaying the most frequent 100 words and stemming them together)
Regarding the built environment, a recurring topic was transportation and mobility with ‘too long travel distances’ and increased carbon footprints of otherwise sustainable materials. Additionally, designers were concerned that people might realise they do not wish to live in dense areas due to higher risks for their health with the current COVID-19 pandemic, although this had been a concern before the pandemic as well. Interestingly, densification was nominated as a strength for the future of cities, indicating that this movement is established, only further progress is needed. While the participants acknowledged the natural environment, their approach was less focused on this area; ‘endangering biodiversity’ in urban areas was a bigger concern, and opportunities seemed to be diverse.
The practitioners' mind was best occupied with the concerns entitled to the city as an entity being the biggest group in number (14). Many participants highlighted the concern regarding improper regulation connecting to leadership, sensibility and strategy – and this was also noted as an opportunity

880
Fanni Melles, Jeni Paay, Ian Woodcock and Gergana Rusenova
for the future city to have governance which sensibly supports evolution and development. On the other hand, diversity and ‘multicentralisation’ seemed to be opportunities and strengths, which highlighted the importance of taking these into account when designing for the city.
The topic of community had the biggest emphasis on ‘not fulfilling humanity’s potential’ and not learning from the current circumstances. Fortunately, these problems were turned to opportunities as well, and the knowledge transformation with adaptability appeared even as strengths. While ‘privacy’, ‘unhealthy control over people’, and ‘loss of agency’ were challenges, designers also struggle to find collaborators for future-focused projects. The future of cities had opportunities and strengths for a more active engagement of people in the city. It also must be highlighted that the opportunities for the community were the second in numbers with 13 items presenting the professionals’ conviction in the possible advancements of provided by and for the community.
The challenges for design was the third in number with its 12 elements. Although the group itself was fragmented, practitioners emphasised the concerns of good communication. Additionally, they feared the ‘loss of influence of designers on the built environment’. As for opportunities, the ‘information- and evidence-based design’ seemed to be the most important utilising the current or future tools. Despite the high number of opportunities regarding design, there was only one strength noted may be as a result of the lack of smart design approach in practice, or the lack of direction to the future of cities and how designers can approach it in their profession.
Concerning economy, there were only a few highlights in this field. The ‘lack of local manufacturing’ was a concern and an opportunity at the same time for cities. Many participants highlighted that the evolution and development of cities also involve economic effects as well, such as the opportunity to receive ‘better value for money’. Fears were not articulated regarding energy; however, the participants established opportunities and even more strengths for the future of cities. One of the recurring topics was efficiency, levelling up the current conditions by living more efficiently including, for example, better energy use and resource management.
The professionals called attention to many different concerns about technology, with a major focus on data collection and considerably over-relying on technology. The technology and community themes seemed connected with the ‘increasing gap between knowledge and technology’ and ‘not fulfilling the potential’, and the surveillance element with ‘privacy’ and overcontrol over people. Again, these challenges were not only seen as problems but opportunities to evolve. One of the biggest opportunities seemed to be ‘understanding and utilisation of collected data’ as a way to transform it to knowledge also being the greatest strength of the future of cities which should be considered by designers.
Table 2 The mentioned elements and their frequency of each theme
Fears, challenges, concerns Opportunities Strengths
built
env
ironm
ent carbon footprint of 1
materials' transportation cost of renovation, 1
refurbishment decreasing density due 3
to COVID-19 lack of preparation for 1 long term maintenance
better handling of waste 1
better mobility 2
better thermal comfort 1
better transport 4
better transportation 1
denser areas 2
energy-efficient buildings 1
reducing the physical 1 infrastructure

881
Practical understandings and use of smart city concepts in Australia
too long travel distances 1 decreasing transportation times
more prefabrication
2
1
reducing waste 1
purpose-built rentals 1
ural
i
endangering biodiversity 2 better understanding of nature better water
management
less pollution
1 better food management 1
micro-climatic effects of cities
not enough green space
1 1
1 1
nat reducing carbon 1 emissions
city
as a
n en
tity
concentration of capital 1 cities disfranchising themselves connectivity throughout
the city differentiation among
cities
multicentralism
1
1
1
1
decentralisation, 2 multicentralisation location dependency 1
more diverse cities 1
preserving uniqueness 1
destabilisat. of countries 1 with strong citieserosion of public space 1
growth of endless city 2
lack of evidence-based 2 regulation supporting 1 decision making evolution, development
lack of proper leadership 1
leaving out rural from 1 the evolutionloss of identity 1
not allowing things to 1 grow naturally andnot clear gov. intentions 1 behind using tech.polarity between rural 2 and urbantoo m. freedom in devel. 1 without sense and strat. too much globalisation 1
too much regulation 4 without sense
com
mun
ity
finding the right people for the project giving up freedom and
rights
loss of agency
missed opportunities to learn from current not fulfilling humanity's potential
2 becoming more intelligent better accessibility to
services better citizen
engagement better citizen
involvement
better democracy
2 accessibility 1
adaptability 1
anonymity in the city 1
being able to use smarts 1
better and faster 1 knowledge
1 1
1 1
2 1
3 1

882
Fanni Melles, Jeni Paay, Ian Woodcock and Gergana Rusenova
privacy
unhealthy control people
over
3
2
better local existence 1 better health care system
greater level of agency for people
recalibrating urban life
1
1
1
better public health
better user experience
1
2
increasing community control over their area increasing enjoyment
level increasing the
explorational capability learning from current
(COVID-19) experience
more cohesive societies
2
1
1
1
1
desi
gn
communication across 1 different disciplines connecting decisions to 1
use of specific materials cost over sustainability 1
decreasing design quality 1
designing diff. without 1 any kind of strategy judging sustainability 1
insufficiently keeping the design 2
quality alive during lack of designer control 1
over design outcomes lack of good comm. thus 1
not achieving the goal loss of designers' 2
influence on the city positively handling 1
tensions sustainable decisions 1 without real knowledge
better sustainable 1 options better understanding of 2
places through data empower the relation 1
betw. designer and city information-, evidence- 2
based design rethinking how cities are 1
designed smarter approach to big 1 problems
dropping the worst the industrialisation
of 1
nom
y lack of manufacturing
local 2 affordability
affordable housing
better economy in the city
better value for money
1
1
1
1
better working city 1
more cost-effective 1 solutions ec
o
increasing local manufacturing
local recycling
1
1

883
Practical understandings and use of smart city concepts in Australia
Ener
gy
generating electricity 1 locally generating energy locally 1
less energy consumption 1
better efficiency 2
better heating and 1 cooling control better heating and 1
cooling distribution better production of 1
domestic hot water increasing the use of 1
renewable energy reducing overall energy 1
demands reducing the use of fossil 1 fuels
Tech
nolo
gy
data collection 3 closing the gap between 2 knowledge and tech. increasing the amount of 1
available information understanding and 2
utilising collected data using gathered knowl. to 2 incre. the growth of cities
better connection through the whole world utilising data for a better living environment
1
focus on tech. instead of people increasing the gap betw.
tech. and knowledge relying on too much
tech.
surveillance
1 1
2
1
2
too much tech. 3
vulnerability against big 2 comp. providing tech.
5. ConclusionIn conclusion, the found fragmentation concerning the aims and operationalisation of smart cities indicated challenges in the design profession for solving the problems in urban areas. We found that the professionals, related to research and interviewed this far, did not have a collective understanding of the smart city or even the future of cities. They had different approaches with shared elements; thus, this article and the interviews were not directed solely to smart cities, but including the future of cities.
Asking about the fears, opportunities, and strengths regarding the future cities helped to identify the differences in how cities might change and revealed what the professionals are occupied with. Their answers could be grouped into eight overarching themes, the built and the natural environment; city as an entity; community; design; economy and energy; and technology. However, few of the items were mentioned answering each question, the strengths usually being the outlier. Fears and opportunities were often connected seeing the first rather as a challenge which could be overcome during the designs. Interestingly, ‘too much regulation without sense’ was the most agreed concern, while ‘better transport’ seemed to be the greatest opportunity. Regarding the strengths of future cities, the attention was distributed among ‘denser areas’, ‘decentralisation, multicentralisation’ and ‘better efficiency’.
Finally, these answers presented a fragmented focus of the profession itself. The professionals were occupied with recurring themes; however, their identified items were very diverse. This, on the one hand, was useful because their attention covered a broader field. On the other hand, their fragmented

884
Fanni Melles, Jeni Paay, Ian Woodcock and Gergana Rusenova
attention may also cause problems as the fragments may never come together. This fragmentation can be observed in research for the future of cities; thus, it was not surprising. Moreover, this fragmentation indicated a serious problem regarding the future of cities: although, as the literature presents, there is a clear need for cities to change, as long as there is no agreement on the required changes or the operationalisable outline of the future of cities, it will not take place in the professions responsible for establishing the built environment through design affecting humanity and its habitat.
The interviews are continuing collecting data about the practitioners’ approach in order to understand that and the gap between the theory and practice.
References Ahvenniemi, H., Huovila, A., Pinto-Seppä, I. and Airaksinen, M. (2017) What are the differences between sustainable
and smart cities?, Cities, 60, 234-245. Albino, V., Berardi, U. and Dangelico, R. M. (2015) Smart Cities: definitions, dimensions, performance, and
initiatives, Journal of Urban Technology, 22(1), 3-21. Amsterdam Smart City (2009) Amsterdam Smart City. Available from: <amsterdamsmartcity.com> (accessed
10/10). Budde, P. (2013) Smart cities of tomorrow, in S. T. Rassia and P. M. Pardalos (eds.), Cities for smart environmental
and energy futures, Springer, Berlin, Heidelberg, 9-20. Cocchia, A. (2014) Smart and digital city: A systematic literature review, in R. P. Dameri and C. Rosenthal-Sabroux
(eds.), Smart City: How to Create Public and Economic Value with High Technology in Urban Space, Springer International Publishing, Cham, 13-43.
European Commission (2012) The European Innovation Partnership on Smart Cities and Communities. Available from: European Union <https://eu-smartcities.eu/> (accessed 09/01).
Giffinger, R. and Gudrun, H. (2010) Smart cities ranking: An effective instrument for the positioning of the cities, ACE: Architecture, City and Environment, 4.
Hill, D. (2013) On the smart city, in N. Mackenzie (ed.),But what is the question?, Medium, medium.com. Hollands, R. G. (2008) Will the real smart city please stand up?, City, 12(3), 303-320. International Organization of Standardization (2012) ISO/TC 268 Sustainable cities and communities. Available from:
ISO <https://www.iso.org/committee/656906.html> (accessed 05/09). International Organization of Standardization (2017) ISO and smart cities, in International Organization of
Standardization (ed.), ISO, 1-20. Kunzmann, K. R. (2014) Smart cities: A new paradigm of urban development, CRIOS, 2014, 9-20. Madden, D. (2019) Editorial: City of emergency, City, 23(3), 281-284. Murgante, B. and Borruso, G. (2015) Smart cities in a smart world, in S. T. Rassia and P. M. Pardalos (eds.), Future
city architecture for optimal living, Springer, Cham, Switzerland, 13-35. Musa, S. (2018) Smart cities - A road map for development, IEEE Potentials, 37(2), 19-23. Schindler, S. and Marvin, S. (2018) Constructing a universal logic of urban control?, City, 22(2), 298-307. Su, K., Li, J. and Fu, H. (2011) Smart city and the applications,2011 International Conference on Electronics,
Communications and Control (ICECC), 1028-1031. United Nations (2015) Sustainable Development Goals. Available from: United Nations
<https://www.un.org/sustainabledevelopment/> (accessed 10/10). United Nations (2018) World urbanization prospects, the 2018 revision, Department of Economic and Social Affairs,
United Nations, 1-126. Zheng, C., Yuan, J., Zhu, L., Zhang, Y. and Shao, Q. (2020) From digital to sustainable: A scientometric review of
smart city literature between 1990 and 2019, Journal of Cleaner Production, 258, 120689. Zhu, S., Li, D. and Feng, H. (2019) Is smart city resilient? Evidence from China, Sustainable Cities and Society, 50,
101636.

885
The 54th International Conference of the Architectural Science Association (ANZAScA) 2020
Preservation issues and controversies: Challenges of underutilised and abandoned places
Julia Hamilton1, Renata Jadresin Milic2
1, 2 Unitec Institute of Technology, Auckland, New Zealand [email protected], [email protected]
Abstract: Research and Enterprise Office at Unitec Institute of Technology focuses on opportunities, challenges, and problems in a wide variety of subjects. In 2019, a project of heritage digitisation in New Zealand was approved. The project aims to present vulnerable, underutilised, or abandoned historical heritage through a multimedia presentation on the one hand, and to set up an information tool for preservation, restoration, and maintenance, on the other. It aims to have both academic and practical value in advancing knowledge about heritage in New Zealand: to provide a means for establishing New Zealand's current state of knowledge in the practice of archiving heritage buildings; to be useful for the end-user; and to aid in learning about the built environment. This paper will present data collected in the first phase of the project. A literature review and data about New Zealand's current state of knowledge in the practice of archiving heritage buildings will be developed. International state of the knowledge in the field and the practice in Aotearoa New Zealand will be compared. The benefits of the project are expected to be wider than historical recording only and can be used for refurbishment of buildings, facility maintenance, etc.
Keywords: Heritage; preservation; New Zealand; recording.
1. IntroductionIn 2019, a project of heritage digitisation in New Zealand was approved by Research and Enterprise Office at Unitec Institute of Technology. The project aims to set up an information tool for preservation, restoration, and maintenance. It aims to have both academic and practical value in advancing knowledge about heritage in New Zealand: to provide a means for establishing New Zealand’s current state of knowledge in the practice of archiving heritage buildings and their possible adaptive reuse opportunities; to be useful for the end-user and to aid in learning about the built environment.
The undertaken literature review presented in this paper reflects on New Zealand’s current state of knowledge by providing an overview of cultural heritage issues nationally and then more specifically in local areas. It includes information on legislative policies and regulations that are being followed at present along with highlighting key problems that arise. It then talks about the range of conservation methods available and the benefits or evaluation points for each, after analysing the different heritage conservation practices.
Imaginable Futures: Design Thinking, and the Scientific Method. 54th International Conference of the Architectural Science Association 2020, Ali Ghaffarianhoseini, et al. (eds), pp. 885–894. © 2020 and published by the Architectural Science Association (ANZAScA).

886
Julia Hamilton, Renata Jadresin Milic
The settlement of indigenous Māori and European to New Zealand has embedded a unique cultural and architectural heritage that is unlike anywhere else in the world. Although New Zealand’s cultural heritage is relatively young in comparison to other larger European cities; its sites, landscapes, gardens, monuments, sacred places, buildings, and structures are assets with distinctive value that have developed meaning over time. At present, these national treasures are at serious risk of being lost as a result of inadequate heritage protection systems that are currently in place. Like the rest of humanity, New Zealand shares a general responsibility to safeguard its cultural heritage in the interests of present and future generations nonetheless the probability of permanently losing significant cultural heritage building and sites is a nationwide problem causing prevalent concern amongst the Tangata Whenua (people of the land).
International Council on Monuments and Sites (2010) notes that Tangata Whenua of Aotearoa New Zealand has particular methods and principles of observing, connecting to, and sustaining cultural heritage. A statement of these professional principles has been set out as a guide in the New Zealand Charter for the Conservation of Places of Cultural Heritage Value adopted from the International Charter for the Conservation and Restoration of Monuments and Sites (ICOMOS). The New Zealand charter provides the following definition of the purpose of conservation, “the purpose of conservation is to care for places of cultural heritage value,” and includes specific information relating to indigenous cultural heritage. Acknowledging that indigenous cultural heritage has particular values, meanings, and associations with its ancestors; that carries the responsibility to uphold and pass on all related knowledge of information, skills, and practices.
Ministry for Culture and Heritage (2017) discuss that the Treaty of Waitangi is New Zealand’s founding document, which was an agreement made between the British Crown and Māori rangatira (chiefs) in 1840. The document comprises three articles. ICOMOS (2010) has stated that in the second article, the Treaty identifies and assures the safeguard of tino rangatiratanga, and sanctions kaitiakitanga as accustomed guardianship over their taonga (anything valued highly for its historical, cultural, spiritual, economic or traditional value), to be employed by the Tangata Whenua.
Between 1994 and 1995 numerous individuals and community groups, and iwi brought forward several concerns to the attention of the Parliamentary Commissioner for the Environment (1996), these concerns indicated several problems regarding the state of New Zealand’s heritage management systems. In 1996, Parliamentary Commissioner for the Environment published the report: Historic and Cultural Heritage Management in New Zealand. The Parliamentary Commissioner for the Environment (1996) presented in the report that “the Resource Management Act 1991 and the Historic Places Act 1993 established a new framework for the management of natural and physical resources, including our historical and cultural heritage.” At the time of publication, it was the first report to evaluate the Government system to ascertain how heritage was being managed; however, it concluded that adequate heritage protection was not being achieved. Improved management of historical and cultural heritage along with written and spoken evidence, is urgently needed. Currently, the management of artefacts, places, sites, and surrounding landscapes are all interconnected but are the accountability of numerous, mostly uncoordinated organisations. The Parliamentary Commissioners report highlights the New Zealand Places Trust’s increasing membership numbers between 1993-1996 and the growing amount of public visiting and seeking protection for heritage places. Due to the emergent of community engagement, there are now several positive stories of heritage conservation. Majority of which are at a local level which emphasises the level at which communities and people value their cultural heritage. Taylor et al. (1997) raise that at present, there is an inherent conflict concerning private ownership rights and public morals which is not able to be fixed easily. This problem is heightened by the fact that

887
Preservation issues and controversies: Challenges of underutilised and abandoned places
due to the many different organisations that manage heritage in New Zealand, there is an apparent lack of synchronisation and direction for all types of protection over cultural heritage which is the country’s biggest concern.
2. Context
2.1. Nationally
As Bower (2009) has pointed out, New Zealand is not as advanced as Europe when it comes to architectural heritage conservation. At the time that laws and regulations were devised in Europe concerning the preservation of cultural heritage buildings and sites, the arrival of European settlers to New Zealand was just starting. Until this day, an act that aims to protect conservation areas in New Zealand has yet to be passed by the government. Due to the lack of legislation around conservation areas, many significant cultural heritage buildings have been lost by demolition or unsympathetic developments.
Howse and Jadresin Milic (2019) discussed that modern-day New Zealand is aware that cultural heritage and heritage buildings and sites are integral components of the urban fabric of a city and have begun redefining its relationship between the present and the past through recognition of its heritage. Heritage New Zealand is a government organisation primarily focused on promoting the significance and relevance of cultural heritage. They are in charge of heritage building and site listings. Heritage listings are based on a building or site's cultural significance and are categorised as either Category 1 or Category 2 listings. Heritage places listed as Category 1 are deemed to have ‘special’ of ‘outstanding’ historical significance while those listed as Category 2 are deemed to have notable historical importance. There are various other categories which are employed to list heritage areas rather than buildings as well as Maori heritage. However, cultural heritage identified and listed by Heritage New Zealand is not automatically guaranteed security from demolition, or deterioration beyond repair that can be caused by buildings becoming redundant or neglected. Howse and Jadresin Milic (2019) also mention that at present, heritage protection from destruction is managed by New Zealand local councils. Local councils hold the highest authority to ensure the demolition protection of historical buildings as they include obligations under legislation for protection and management of cultural heritage. Legislative acts such as The Resource Management Act 1991, The Local Government Act 2002, The Building Act 2004, and Heritage New Zealand Act 2014.
2.2. Locally
While New Zealand heritage policies involve central and local actions, it is also worthwhile to evaluate key local policies. Howse and Jadresin Milic (2019) have found that in New Zealand’s largest cities such as Auckland and Wellington, city development rates as a consequence of a significant increase in population at the end of the 20th century ultimately resulted in an exponential demolition of cultural heritage buildings.
Auckland Council (2020) has identified several important heritage sites that are currently under threat from insensitive development pressures in the Auckland Unitary Plan. The main objective of Auckland’s heritage policy is to provide provision for the protection, restoration, conservation, and maintenance of its listed heritage places. The strategy aims to ensure that where building adaptation is

888
Julia Hamilton, Renata Jadresin Milic
necessary, it will enable the development and use of the site so long as the significance of the place is not adversely affected. Auckland Council (2020) have also clarified that building adaptation must be carried out under good practice following conservation methods and principles that support long term viability. Although, in comparison with other local councils, Auckland's regulations concerning demolition are quite lenient. This leniency is stressed by Besen et al. (2020) findings that under 70% demolition of a heritage building is considered to be non-compliant activity but is not prohibited. As a result of this, there are many examples of where 'façadism' has been fostered. Façadism is the full or often partial retention of the external façade, while the interior and interior structure is removed to make way for new construction.
Wellington City Council (2020) recognises that heritage is a ‘precious and finite resource’ and has made prominent efforts to protect its cultural heritage. Wellington’s City Council’s policies aim to offer flexibility for activities of economic value which may benefit a site's conservation, such as that it enables users and owners to make financial or reasonable use of it. Besen et al. (2020) has discovered that the Wellington City District Plan selectively mentions the need to upgrade accessibility, fire escape means, and structural stability as it recognises the essential aspects to upgrade while minimising effects on heritage values.
The South Island city of Christchurch suffered an unprecedented loss of cultural heritage following the event of the 22 February 2011 earthquakes. Wilson (2013) highlighted the devastating circumstance that over 50% of listed heritage buildings located in the central city prior to the earthquakes had been lost by the end of the following year. The scale of loss over a short period is rare on both national and international terms. The experience of the earthquakes and in particular the loss of cultural heritage emphasised the limitations of listing as the sole offering for protection of heritage buildings, other items, and their values. The losses stress the need to adapt and take an alternative approach to continue telling the city’s past despite the significant loss of heritage sustained. Wilson (2013) commented that the damage caused to heritage by this devastating event has highlighted that modifications to the City Plan should apply further consideration relative to the changed circumstances when managing of historic places.
Besen et al. (2020) also analysed the strategies of Dunedin City Council and found that the heritage strategy for Dunedin acknowledges the positive impact that heritage contributes to its tourism. The city council aims to protect its heritage assets to maintain the legacy and economic value of heritage sites. Dunedin City Council (2007) heritage strategy acknowledges that retention of built heritage and items are best facilitated by sustainable and economical use and in some cases may require building adaptation rather than the contrasting method of closure and uneconomical maintenance to provide preservation and protection.
3. Policy literature and legislationIn New Zealand, cultural heritage is managed through a large number of organisations and requires shared responsibility between both the local and central governments. This shared management of duty differs from many other countries that manage heritage under a centralised government agency. Besen et al. (2020) recognised that when it comes to historic preservation in New Zealand, preservation ordinances enacted by local governments typically hold the highest jurisdiction. As McClean (2007) pointed out, the Resource Management Act 1991 (RMA) provides for the protection of historic heritage from inappropriate subdivision, use, and development. The Resource Management Act supports the

889
Preservation issues and controversies: Challenges of underutilised and abandoned places
sustainable management of natural and physical resources, and in 2003, Section 6(F) of the RMA improved the standard for heritage planning assessment by elevating the protection of historical heritage to a national importance matter.
The two leading national agencies that manage heritage protection here in New Zealand identified by Besen et al. (2020) are the Department of Conservation and the New Zealand Historic Places Trust/Pouhere Taonga. Following these leading agencies, Besen et al. (2020) conclude that there are numerous other organisations and regulations involved in cultural heritage management that creates a complex system lacking co-ordination and direction that is an apparent problem for heritage management in New Zealand. The need for heritage provisions within district plans to be more consistent is evident in heritage provisions, to ensure that uncertainty between all parties who are involved can be avoided within the process.
Identification and protection of New Zealand's cultural heritage are promoted by and managed by the New Zealand Historic Places Trust (NZHPT). The trust maintains a register of listed historical places, established under the Historic Places Act 1993 (HPA). As previously stated, ICOMOS (2010) outline that places of heritage value are listed under two categories by Heritage New Zealand - Category 1 and Category 2. Conversely, although the buildings scheduled in the heritage list are recognised, recognition in the way of listing does not ensure protection. Besen et al. (2020) have recognised that the protection of these buildings then falls on the measures included in local district plans.
The NZHPT is responsible for liaising with local councils to assist with the identification and protection of heritage sites within their governing districts. They are also responsible for monitoring and providing guidance to landowners and developers proposing development for sites and properties that are listed on the register of historic places. Many people are under the incorrect understanding that places and sites listed under the Historic Places Register are assured protection from modification or demolition which is dismally not the case. Heritage listing is solely acknowledgement that a site has significance and is worth protecting. Taylor et al. (1997) have exposed that even if a place is registered, the NZHPT does not possess the authority to prevent opposing historic preservations such as modification and demolition. However, if necessary, the trust has the power to issue a Heritage Order under the Resource Management Act 1991 (RMA).
The Department of Conservation (DOC) is, on the other hand, responsible for managing cultural heritage resources that are located on conservation estate. Resources located on the department's land are already under their protection, and this factor significantly restricts the role of the department. Taylor et al. (1997) have learnt that The Conservation Act 1987, on the other hand, states conflicting information which has sparked a great deal of debate over the department’s role, as the act delegates the department the assignment of advocating for and safeguarding significant heritage resources that are found outside of conservation territory.
Under the Resource management act, local government plays a crucial role in cultural heritage management. Even so, the council’s performance for safeguarding cultural heritage is highly variable as noted by the Parliamentary Commissioner for the Environment (1996). Taylor et al. (1997) also note that district plans of local authorities are prepared under the Resource Management act and must include all places listed under the Historic Places Act and although listing allows people the opportunity to express support for preservation, it does not guarantee protection.
Heritage Orders are another possible route provided under the Resource Management Act, which offers protection for places of cultural heritage. Revealed by Taylor et al. (1997) as a provision under the

890
Julia Hamilton, Renata Jadresin Milic
district plan, the heritage order prevents action that may impact the heritage characteristics of a building or site unless granted written approval from the appropriate heritage protection authority such as the Historic Places Trust, local authority, or any other organisation permitted as a heritage protection authority approved under the RMA.
A noticeable heritage problem identified is the reality that the majority of registered heritage places in New Zealand are privately owned. This issue is highlighted by the understanding that heritage places and sites under heritage agency ownership, such as the NZHPT have the highest amount of protection. Taylor et al. (1997) has found that in some cases, local councils or heritage agencies may purchase a significant site to secure protection. Unfortunately, the number of places offered by this nature of security is limited due to arising challenges and significant costs associated with acquisition, conservation, maintenance, and management of the building or site.
4. Heritage conservation methods and practice
4.1. Overview of conservation methods
When dealing with existing heritage projects, a range of conservation processes may be employed. Conservation methods are measured by the degree of intervention with guidance from the conservation principles set out in the International Council on Monuments and Sites (2010) NZ Charter. The NZ charter states that any intervention that may compromise the cultural heritage value of a place is unfavorable and should not be undertaken. They advise that the minimum degree of intervention required for heritage conservation works is preferable in coherence with the charter. ICOMOS includes comments on the method of re-creation. They define re-creation, “meaning the conjectural reconstruction of a structure or place; replication, meaning to make a copy of an existing or former structure or place; or the construction of generalised representations of typical features or structures” however, do not consider this method a conservation process nor a desirable approach.
McClean (2007) trusts that efficient outcomes can be achieved when considering the current cultural heritage value of a site and identified policies for its management at the conceptual planning stage early on. ICOMOS (2010, p.1-6) advise that ideally all work dealing with heritage conservation should be subject to a conservation and maintenance plan with guidance from the New Zealand Historic Places Trust (NZHPT) or qualified heritage professionals. The ICOMOS NZ Charter provides support for those involved with the conservation and management of cultural heritage places and should be made an integral document regarding statutory and regulatory heritage policies, plans, and management. The charter outlines and defines the methods of heritage conservation in order of the level of intervention required, which includes; preservation, restoration, reconstruction, adaptation, and non-intervention.
4.2. Adaptive reuse
Kiroff and Tan (2015, p.1) describe adaptive reuse as “a process which changes or modifies a derelict building and repurposes it while retaining its cultural heritage value.” They recognise that adaptive reuse is often recognised as a viable alternative method for demolition to safeguard losing existing cultural heritage. Many findings included in this paper discuss the juxtaposition of benefits (environmental, social, and economic) that adaptive reuse methods offer when dealing with cultural heritage. These methods are commonly considered as an alternative solution that can improve the

891
Preservation issues and controversies: Challenges of underutilised and abandoned places
performance of a building while also reducing its environmental loading impact. However, Kiroff and Tan (2015, p.1) have found that there is little research published that investigates the intangible value added through the practice of building adaption and its significance as a resource for place-making and branding strategies.
Until recently, limited attention to adaptive reuse has been received in New Zealand as the result of the general perception that new construction is the single answer to meeting client demand. However, this is not necessarily the case as Kiroff and Tan (2015) deem that building adaptation proves itself to be a successful alternative for urban redevelopment movements through the sustainable opportunities it provides. Reid (2018) has defined adaptive reuse as a "process of retrofitting old buildings for new uses, which allows structures to retain their historic integrity while providing for occupants' modern needs". The ICOMOS (2010) New Zealand Charter lends support to this definition by stating that, “Proposals for adaptation of a place may arise from maintaining its continuing use, or from a proposed change of use.” The texts examined all refer to the benefits of adaptive reuse as an environmentally, economically, and socially viable option through retention and adaptation of older existing buildings as opposed to undertaking a new development.
The conversion of established industrial structures provides an alternative solution to the demolition of an existing structure that no longer meets expectations. Identification of heritage as a commodity in recent years has been described as a pervasive trend by Kiroff and Tan (2015) in the literature, Adaptive Reuse of Industrial Buildings in a New Precinct in Auckland's CBD. The text also mentions the limited published research that explores the intangible value added through building adaptation and its significance as an essential resource in place-making strategies and its role in place branding.
4.2.1. Program
The programmatic and typological approach are both adaptive reuse strategies that involve the adaption of a building to host a new program or function. Wong (2017) states that at the core of adaptive reuse is a change of use that gives a new purpose to an unused or underutilised structure. When exchanging one type of activity to another within a given structure or in the case of bringing an unused building or structure back to life, this can be referred to as change of use. The ICOMOS (2010) Charter advises that "Where the use of a place is integral to its cultural heritage value, that use should be retained. Wong (2017) concludes that "The design of these different spaces, their sizes, and relationships to each other is an interpretation of the architectural program, a document translating a client's needs for a building into spatial terms." Often adaptive reuse transformations include a mixture of different uses/types within a given structure. Wong (2017) defines mixed-use occupancy as the co- existence of several user groups within a single structure.
4.2.2. Environmental benefits
Many definitions of sustainability have been proposed. Rabun and Miles (2009) state that a generally accepted explanation for sustainability is, "Meeting today's needs without compromising the ability of future generations to meet their needs." The literature investigated are all informative of the strong link and benefits of adaptive reuse as a sustainable architectural approach to design. With a global focus in recent years, Wong (2017) acknowledges that with the effects of climate change and the recognition that buildings are the primary source of global demand for energy and materials that produce by- product greenhouse gases, adaptive reuse offers itself as a viable option under the circumstances.

892
Julia Hamilton, Renata Jadresin Milic
Whilst Rabun and Miles (2009) comment that natural resources such as minerals, fossil fuels, and water are limited, and ultimately the growing population will exert pressure on the supply. In the long-range view, the earth's resources are finite, and it will be prudent to use as few new resources as possible. Conservation in place provides a better alternative than recycling or reuse of resources which is fundamental to the practice of adaptive reuse.
4.2.3. Social benefits
By retaining and reusing existing buildings, adaptive reuse can contribute to a sense of place and identity for a community who has experienced significant loss. Adaptive reuse can provide many benefits such as social, architectural, cultural, and historical advantages to aid in urban regeneration and community revitalisation. According to Kiroff and Tan (2015), when historical buildings are senselessly demolished, it is not only recognised as an ecological waste but also as a loss of local identity, cultural heritage, and socio-economic values. Retention of the style and character of a building can be maintained through building adaption. When restoring the cultural heritage significance of a building, there are potential twofold benefits for the communities that value them when executed well. Kiroff and Tan (2015) also state that "Buildings could be considered as a physical embodiment of cultural memory and historical narratives in terms of their conditions and materiality. Furthermore, it can contribute to the development of new stories and identities through the process of urban regeneration."
Urban heritage and adapted industrial buildings play a crucial role in place branding and are recognised as essential resources in place-making strategies. Kiroff and Tan (2015) claim that "The physical properties of the built form give identity to a city on a macroscale and contribute to a great extent to a sense of place on a micro-scale alongside wide-ranging economic activity. Heritage, which plays a key role by evoking images of a nostalgic past through the use of cultural and historical references, is seen as lending "a desired aura" to a place. The power to evoke memories outlines how distinctive characteristics of a building or place can be used as a powerful marketing tool associated with successful branding to create unique identities.
It is evident that the three aspects of sustainable thinking (economic, environmental, and societal), have the opportunities to be developed through an adaptive reuse project. As adaptive reuse is a process that is continually evolving, this gives end-users the ability to continue shaping and altering their immediate surroundings while the areas they inhabit can remain dependent on its city’s development. Therefore, time is a new aspect that can be added to the list of concepts of sustainable thinking which adaptive reuse brings forward. It provides new possibilities and opportunities and demonstrates how sustainability itself can offer a developing process rather than a fixed and definitive proposition.
5. ConclusionsFrom the Literature Review, the research found that the main problem at present combines an inherent conflict concerning private ownership rights and the fact that there is an apparent lack of synchronisation and direction between many different organisations that manage heritage in New Zealand. From drawing this conclusion, we intend to transition from understanding what the current state of knowledge in literature is, to what is happening in practice currently. We want to investigate what is being practised by heritage professionals and the architectural/building industry. Future research will include conversations and interviews with architects and engineers from the sector, district

893
Preservation issues and controversies: Challenges of underutilised and abandoned places
councils, and government organisations such as Heritage NZ, with the primary aim to learn how New Zealand could and may benefit from some modifications in policies it has at the moment. Private owners of heritage buildings will also be consulted, to gain an understanding of what would be valuable for them to help heritage buildings be retained and adaptively reused, and not demolished. Adaptive reuse of heritage buildings is directly connected with sustainability and environmental topics through related fields of the energy retrofit and seismic retrofit, and we see a lot of potentials for change that may improve our environment to help us all live in a healthier world. We strongly believe that schools of architecture in New Zealand should play a role in helping this happen and take responsibility for calling for the change/modifications in policies.
Acknowledgements This paper is part of an ongoing project “Digitalization of Heritage in New Zealand” funded by our home institution - Unitec Institute of Technology. We would like to express our gratitude to Unitec for support.
References Aigwi, I.E, Egbelakin T, Ingham J, Phipps R, Rotimi J, and Filippova O. (2019) A Performance-Based Framework to
Prioritise Underutilised Historical Buildings for Adaptive Reuse Interventions in New Zealand, Sustainable Cities and Society, 48. Available from: https://doi.org/10.1016/j.scs.2019.101547 (accessed 21 June 2020).
Anagnostopoulos, I. and Lampropoulou, A. (2015) SKFuture: Adaptive reuse in the SKF quarter in Gamlestaden, Göteborg SKFuture. Available from: https://issuu.com/johannes.anagnostopoulos/docs/skfuture_- _adaptive_reuse_in_the_sk?issuu_product=document_page&issuu_context=action&issuu_cta=save_publicatio n (accessed 21 June 2020).
Auckland Design Manual. Adaptive Re-use Print. Available from: http://www.aucklanddesignmanual.co.nz/sites- andbuildings/mixed-use/guidance/thebuilding/mixeduseconfigurations/adaptivereuse (accessed 16 June 2020).
Auckland Council, Auckland Unitary Plan: D17. Historic Heritage Overlay. Besen, P., Boarin, P. and Haarhoff, E. (2020) Energy and Seismic Retrofit of Historic Buildings in New Zealand:
Reflections on Current Policies and Practice, Historic Environment: Policy and Practice. Taylor and Francis Ltd., 11(1), 91–117. doi: 10.1080/17567505.2020.1715597.
Bower, A. (2009) Back to Front: Mixing it up in Ponsonby. Unitec Institute of Technology, Auckland. Bullen, P. (2007) Adaptive reuse and sustainability of commercial buildings. Facilities, 25, 20-31. Bullen, P. and Love, P. (2010) The rhetoric of adaptive reuse or reality of demolition: Views from the field. Cities,
27(4), 215-224. Christchurch Earthquake Recovery Authority et al. (2014) Christchurch Central Recovery Plan. Dunedin City Council, A Heritage Strategy for Dunedin City. International Council on Monuments and Sites (ICOMOS) (2010) ‘ICOMOS New Zealand Charter for the
Conservation of Places of Cultural Heritage Value’, ICOMOS New Zealand Charter, (v), pp. 1–11. Available from: http://icomos.org.nz/wp-content/uploads/2016/08/NZ_Charter.pdf.
Howse, W., and Jadresin Milic, R. (2019) Functional Heritage. Reconnecting with the Iron Web, in Amoruso, G. and Salerno, R. (Eds.), Cultural Landscape in Practice. Conservation vs. Emergencies, Basel, Switzerland: Springer, 271-295. doi: https://doi.org/10.1007/978-3-030-11422-0.
Kiroff, L. and Tan, X. (2015) Adaptive reuse of industrial buildings in a new precinct in Auckland’s CBD, in Global Science and Technology Forum (Ed.), Proceedings of the 1st International Conference on Urban Planning and Property Development, Singapore (44-54)
Lawrence, A.R. and Schafer, A. (2006) Re-programming. Columbus, OH: Praxis. Lukman, Y.A, Ekomadyo A.S. and Wibowo, A S. (2018) Assembling the Past and the Future of the City through
Designing Coworking Facilities, in IOP Conference Series: Earth and Environmental Science, 158: 012051. https://doi.org/10.1088/1755-1315/158/1/012051.

894
Julia Hamilton, Renata Jadresin Milic
McClean, R. (2007a) Sustainable Management of historic heritage. Guide No. 6 Building Act 2004. McClean, R. (2007b) Sustainable Management of Historic Heritage: Heritage Landscape Values, Society. NZ Historic Places Trust. (2011). Heritage redesigned. Adapting historic places for contemporary New Zealand.
Auckland: New Zealand Historic Places Trust. Otakaro Limited. (2019) “Ōtākaro (and formerly CERA) Resource Documents” Otakaro Limited. Available from:
https://www.otakaroltd.co.nz/about-us/resources/ (accessed 13 August 2019). Our Heritage Management. Department of Conservation. Available from:
https://www.doc.govt.nz/ourwork/heritage/managing-heritage/our-heritage-management/ (accessed 13 August 2020).
Parliamentary Commissioner for the Environment (1996) Historic and Cultural Heritage Management in New Zealand. Available at: https://www.pce.parliament.nz/media/1526/historic-and-cultural-heritage- managementin-new-zealand-june-1996-small.pdf.
Plevoets, B. and Van Cleempoel, K. (2011) Adaptive reuse as a strategy towards conservation of cultural heritage: a literature review. Structural Studies, Repairs and Maintenance of Heritage Architecture XII, 155-163.
Rabun, J.S. and Miles K.R. (2009) Building Evaluation for Adaptive Reuse and Preservation. Hoboken, NJ: John Wiley & Sons.
Reid, N. (2018) Craft Breweries, Adaptive Reuse, and Neighbourhood Revitalization. Urban Development Issues 57. Available from: https://doi.org/10.2478/udi-2018-0013.
Taylor, R. et al. (1997) The state of New Zealand’s environment, 1997. Ministry for the Environment. Available from: https://www.mfe.govt.nz/publications/environmental-reporting/state-new-zealand’s-environment-1997.
Warnock, C. (2007) Bringing Existing Buildings into the Sustainability Equation, New Zealand Sustainable Building Conference, 1–9. Available from: http://citeseerx.ist.psu.edu/viewdoc/download?doi=10.1.1.520.1586&rep=rep1&type=pdf.
Wellington City Council, Wellington City District Plan. Wilson, J. (2013) Contextual Historical Overview - Christchurch City, (June 2005). Available from:
https://goo.gl/p5cytg (accessed 13 August 2020). Wong, L. (2017) Adaptive Reuse: Extending the Lives of Buildings. Basel: Birkhäuser. Wood, B. (2017) The Co-Working Hubs Re-Energising Our Cities. The Spaces Blog. October 28. Available from:
https://thespaces.com/the-co-working-hubs-re-energising-our-cities/ (accessed 13 June 2020). Wright, D. (2018) Match Made in Heaven: Investment Benefits of Coworking Spaces in Historic Sacred Places,
Cornell Real Estate Review, 16 (2018): 51. Available from: https://scholarship.sha.cornell.edu/crer/vol16/iss1/17/ (accessed 21 June 2020).
“Web page without author info” (1997) New Zealand's Cultural Heritage. Ministry for the Environment. Available from: https://www.mfe.govt.nz/publications/environmental-reporting/state-new-zealand’s-environment-1997- chapter-two-place-and (accessed 10 July 2020).
“Web page without author info” (2017) The Treaty in brief. Ministry for Culture and Heritage. Available from: https://nzhistory.govt.nz/politics/treaty/the-treaty-in-brief (accessed 10 July 2020).

895
The 54th International Conference of the Architectural Science Association (ANZAScA) 2020
Privacy in the houses of eastern parts of Iran, during the transition period with an emphasis on the architecture of
housing entrances
Mohsen Tabassi1, Sepideh Mousavi2 1, 2 Islamic Azad University, Mashhad, Iran
[email protected] [email protected]
Abstract: The culture of the West gradually penetrated the traditional Persian world and during transition period (late Qajar and Pahlavi I dynasty), the speed of westernization was doubled. The research problem is that due to changes, the lifestyle has undergone some changes, which has affected in particular housing entrances. This research examines the process of changes in the entrances of houses in eastern Iran during the transition period with an approach towards the principles of privacy. The statistical population includes over 200 identified houses built during the transition period, in the east of Iran. Forty houses (about 20 %) are selected as examples. The results show that the changes in the political, social and cultural structures provided the grounds for changes in the physical structure of cities. For various reasons, the physical changes of houses were less frequent and slower. The people of eastern Iran resisted as much as possible the social and cultural transformation as well as the physical changes it caused. Since the principle of Privacy in architecture is inextricably linked to religious beliefs and the lifestyle of the people of this area, the changes could not eliminate the privacy of entrances of the Iranian eastern houses.
Keywords: House, entrance, privacy, Iran.
1. IntroductionFrom the middle of the Safavid period, Western culture gradually penetrated the traditional Iranian world. The change in the structure of power from Qajar to Pahlavi and Reza Shah's modernist ideas also caused the disintegration of the traditional world to accelerate without providing a way to enter the modern world and providing the infrastructure. Iranian architecture (and especially the house) was no exception. The return of educated architects from Europe, the presence of foreign archaeologists (Kiani, 2004) and architects in Iran (Bani Masoud, 2012), nationalist tendencies (Shirazi and Younesi, 2011) and Reza Shah's militaristic temperament (Mohammadi, 1995) and so on caused the formal and technical
Imaginable Futures: Design Thinking, and the Scientific Method. 54th International Conference of the Architectural Science Association 2020, Ali Ghaffarianhoseini, et al (eds), pp. 895–904. © 2020 and published by the Architectural Science Association (ANZAScA).

896
Mohsen Tabassi, Sepideh Mousavi
continuity of Iranian architecture to face fundamental challenges and a new style emerged. This style underwent many changes in the following years under the influence of factors such as construction technology, rising land prices, government oil revenues and changes in the lifestyle of Iranians. One of the most important turning points in the history of Iranian architecture is the transition period (late Qajar period and the beginning of the Pahlavi dynasty). The problem of the present study is: As a result of the political, social, and cultural developments of the transition period, the Iranian life style underwent changes. These changes affected the architecture of houses so that all parts of the country (including the eastern regions) gradually experienced physical changes in houses. Therefore the main question of the research is: How did the political, social, and cultural developments of the transition period affect the architecture of the entrances of the houses in the eastern part of the country? And could these developments destroy the principle of privacy in the homes of these areas?
Based on this question, the following hypothesis is formed: The principle of privacy is strongly related to Iranian religious culture and beliefs. For this reason, political, social and cultural developments during the transition period could not eliminate the principle of privacy at the entrances of houses in eastern Iran.
2. Theoretical foundations of research
2.1. Privacy
The Persian equivalent of privacy is ‘Mahramiyat’ (محرم ت), which is taken from the Arabic root Haram. In the Loghat-nameh (the greatest dictionary of Persian language), the word is defined as ‘to be a mahram’, ‘a secretary and a kinship’ (Dehkhoda, 1998). The same concept is referred to as ‘privacy’ and ‘security’ in most English dictionaries. The online dictionary of Merriam Webster defines privacy as “the quality or state of being apart from company or observation”. However, it is not made clear if the description refers to humans or objects. In the Dictionary of Architecture and Construction, the phrase ‘private area’ is defined as “the area whether within or outside a building, which is reserved for the exclusive use of a single family” (Harris, 1975: 380). To find the architectural aspects of privacy, first, the verses of the Quran (Muslims’ holy book) have been considered. According to the Quran verses, houses can be considered as two types of privacy. First, the internal privacy that preserves the dignity of family members; second, the external privacy that protects family members from unauthorized access, sight, and encroachment. In general, the principles of traditional Iranian architecture that have been effective in shaping the privacy are cultural considerations, hierarchy (Ghafourian, Peysokhan and Hesari, 2017), introversion, visual privacy (Seifian & Mahmoudi, 2007) and separation of public and private areas (Madanipour, 2003).
2.2. Iranian house
The Iranian houses have a variety of spaces but more or less similar. The present study focuses specifically on entrances. The entrance spaces in Iranian architecture are composed of different components such as Sar dar (Gate), Hashti (an octagonal space) and Dalan (Corridor) (Soltanzadeh, 2005, p. 106).
2.3. The period of transition

897
Privacy in the houses of eastern parts of Iran, during the transition period with an emphasis on the architecture of housing entrances
The last one hundred and fifty years in the history of Iran have had turning points, the most important of which must be considered the end of the Qajar era and the beginning of the Pahlavi dynasty. In the present study, the third period of Qajar era, i.e. from 1880 to 1925, and the first Pahlavi government, from 1925 to 1941 has been considered and is called the transition period.
3. Literature Review
3.1. Sources on theoretical foundations
Saremi and Radmard (1997) have mentioned the issue of privacy in a part of their book titled "Sustainable Values in Iranian Architecture". Bemanian et al. (2010) have also examined the architectural identity elements of Iranian houses and, for instance, have paid attention to the house of Rasoulian in Yazd. In the theoretical foundations of housing identity components based on the Quran verses and hadiths, Okhovat (2011) has also paid special attention to privacy. Valizadeh Oghani (2014) studying the ethical principles of the architecture of Iranian houses, has specifically considered privacy and has explained and interpreted these concepts as much as possible. By studying the Islamic concepts of housing design, Hosseinpour et al. (2018) have tried to provide some examples for recreating contemporary housing and, in particular, have pointed to privacy and entrance.
3.2. Sources of case studies
In studying the historical houses of Birjand, Hashemi Zarjabadi et al. (2015) believe that introversion is the main factor in creating privacy in the houses of this region. Alimohammadi et al. (2015) have examined privacy at the entrance of Qajar houses in Qazvin and have shown the effect of cultural changes on the element of entrance and the principle of privacy. Mo'meni et al. (2018) have examined privacy in Qajar houses in Dezful and showed the differences between them and the houses in other cities. Varmaghani et al. (2018) have examined the effect of culture on the entrance of Qajar houses in Gilan and Mazandaran provinces, as well as the similarities and differences between these houses in these two provinces. Hekmatnia (2018) has studied privacy in Yazd houses in connection with the Iranian Islamic lifestyle. After conducting the studies, the independent variables of the research were extracted and divided into four groups including strategies and principles, main goals of the entrance, main functions, and executive solutions (Table 1).
Table 1: Independent variables of the research based on literature review.
Strategies and principles
Main goals of the entrance
Main functions Applied solutions
Hosseinpour, 2018 Hierarchy
Separation Connection
privacy security Monitoring ----
Hekmatnia, 2018
Hierarchy Separation --- ---- ---
Mo’meni, 2018 Separation Maintaining --- Entrance elements (Hashti & corridor)
Varmaghani, 2018 Hierarchy Separation
Introversion
privacy security ----
elements (Hashti & corridor)

898
Mohsen Tabassi, Sepideh Mousavi
Ghafurian, 2017 Hierarchy
Separation Introversion
privacy ---- The way to access to the courtyard
Alimohammadi, et al. 2015
Hierarchy Introversion Connection
privacy security ---- ----
Hashemi Zarjabadi, 2014 Hierarchy --- ---- Entrance elements (Hashti &
corridor)
Valizadeh Oghani, 2014
Separation of spaces privacy ----
The way to access to the courtyard Entrance elements (Hashti &
corridor) Okhovat, 2011 Separation privacy ---- ----
Bemanian, 2010 --- privacy --- ----
Seifian, 2007 Hierarchy
Introversion Connection
privacy security --- ----
Soltanzadeh, 2005 Hierarchy
Separation of spaces
privacy security
Relationship Monitoring
The way to access to the courtyard Entrance elements (Hashti &
corridor) Nasr, 2001 Hierarchy privacy ----
Saremi, 1997 --- privacy --- The way to access to the courtyard
4. MethodologyThe present study has a proving approach to the issue in terms of research methodology and the main purpose. The variables obtained on the basis of documentary studies are: Strategies and principles, including the principle of spatial hierarchy, the principle of separation of public and private spaces, the principle of introversion, the principle of connection with nature. The main purposes of building an entrance: include maintaining both privacy and family security. The main functions of the entrance: include communication, access, traffic monitoring Applied strategies for creating privacy: include access to the courtyard, privacy, related entrance elements (Hashti and corridor). As mentioned earlier, since in addition to the above, the number of entrances and their location can also help maintain privacy, in the present study, these two factors have been considered in the form of executive solutions. The statistical population of the present study includes houses built in the third period of the Qajar era (1881-1925) and the entire period of Reza Shah Pahlavi's (1925-1941) in cities of Mashhad, Neishabour, Sabzevar, Torbat-Heidariyeh, Gonabad, Boshroyeh, Ferdows, Birjand, and Zahedan. Based on the researchers' judgment, the samples were randomly selected, and in order to clear up the ambiguity about the validity of the sampling, an attempt was made to select the samples with the following conditions: - They are registered in the list of national monuments. Although some houses have not yet beenregistered in the list, others have been destroyed before or during the investigation, and some have beenremoved from the list of national monuments by voting of the Court of Administrative Justice. - They have architectural and artistic values, in such a way that they provide the possibility of analytical studies. - They are examples of residential houses of all classes of society.- The geographical distribution of the samples is considered throughout the studied geographical area.

899
Privacy in the houses of eastern parts of Iran, during the transition period with an emphasis on the architecture of housing entrances
- The temporal distribution of the samples (in terms of year and period of construction) during thespecified periods is also considered. Based on the above, out of the total of 200 Qajar and Pahlavi houses identified in the mentioned cities, 40 houses (20%) have been selected as the sample. It is clear that due to the multiplicity of the studiedindicators and the high volume of the statistical population, the number of samples has been selected insuch a way that the amount of duplicate data is minimized. The selected samples by city are Boshroyeh(Panahee, Mostovfi, Sharifi, Edalatpanah, Ashiyanpoor); Birjand (Hadavi, Arasteh, Etamadinia, Khavasi); Torbat Heydariyeh (Amini); Sabzevar (Jafarzadeh, Hejazi, Torshizi, Owliya); Ferdows (Badiee, Rasaee,Majd, Moezi); Gonabad (Beidokhti, Saeedian) Neishabour (Mojtahedi, Vakili); Zahedan (Khatami, Raja,Zaeem, Sarhdi, Soltani, Sanatnama, Taheri); Mashhad (Ghafouri, Amiri, Davoudi, Kermani, Barati,Tamaddoni, Rajayi, Mojtahedzadeh, Majidiyan, Mousavi). The plans of several samples are shown inFigures 1.
Figure 1: Plan of several sample houses. (Source: Authors) Entrances highlighted with a green arrow and atria highlighted in red.

900
Mohsen Tabassi, Sepideh Mousavi
5. Research Findings
5.1. Documentary findings
After Reza Shah came to power and established order and security in the country's transportation routes, the east of the country, especially Mashhad, became one of the centers of pilgrimage, trade, and tourism. Due to population development, interference in the fabric of cities also began with the destruction of parts of the old fabric and the construction of new streets. In addition to these interventions, some other activities provided the grounds for the transformation of the appearance and physical growth of the city. Even with the powerful element of religion in the city of Mashhad, the city and other eastern cities have virtually failed to avoid major social changes (which were taking shape at the national level); These include removing the hijab, uniform men's clothing, forming new social classes (military and governmental), establishing a new administrative system, changing the style of education and establishing new schools, bringing cars into the urban transportation network, etc., each of which has had a profound effect on people's lifestyles. However, all these changes took place not overnight, but gradually. The changes in the lifestyle of the people of this vast area of the country in the late Qajar and Reza Shah periods are summarized in Table 2.
Table 2: Research findings; the effect of structural changes of the society on the lifestyle of the people of eastern parts of Iran during the transition period.
Components Objective examples of change The impact of changes on people's lifestyles
Changes in the physical structure of the cities
Demolition of the old fabric of the city Development of public and collective
spaces Construction of streets Arrival of cars in the intra-city
transportation network Creating modern urban spaces such as
squares and streets Market reshaping and creating
showcases Promoting consumerism
Changing the style of shopping
Changes in the official structures of the society
Establishment of government offices and departments
Development of public and collective spaces
The formation of a new social order
Changes in the financial & economical structures of the
cities
Establishment of banks Change in the form of earning income, savings, and financial management of life
Establishment of factories and manufacturing institutions Mass production of goods
Establishment of cargo and passenger transport garages
Consumption importance Change in travel style
Trade development through the transportation and delivery of products
Changes in the health & treatment structures of the cities Construction of hospitals and
pharmacies
Increase of life expectancy Increase of the city's population
Increase of household size Retirement age
Changes in the social structure of the cities
Establishment of charity institutions
Separation of sections of society from the body of families

901
Privacy in the houses of eastern parts of Iran, during the transition period with an emphasis on the architecture of housing entrances
Construction of public promenades
Development of collective and public spaces
Construction of cinemas Change in leisure style
Construction of cafes, restaurants, hotels
Change in eating style and food taste Change in leisure style
Increase in the population of travelers and pilgrims in the city throughout the year
Formation of an independent family institution
Changes in family decision-making The gradual separation of generations
Changes in the cultural foundations and structures of
cities
Establishment of modern schools, libraries, printing houses
Belief in science and rationalism Preferring experimental science over
traditional science Anti-traditionalism
Discover women's hijab
Changing the role of women in the structure of the family and society
Women's entry into the field of production and business
Uniform men's clothing Inducing new social order to individuals Formation of military and
national social classes Creating class distance in society
5.2. Field findings
After preparing the relevant maps and documents, the house plans were reviewed in terms of the research variables obtained from reviewing the research background. These variables are classified into four groups as strategies and principles (including the principle of spatial hierarchy, the principle of separation of public and private spheres, the principle of introversion, the principle of connection with nature); the main goals of building an entrance (including maintaining both privacy and family security); the main functions of the entrance (including communication, access, and traffic monitoring), and finally, applied strategies for creating privacy (including access to the courtyard and privacy-related entrance elements, like porch and corridor).
6. Discussion and AnalysisA glance at the findings shows that the houses in the eastern part of the country in both the Qajar and Reza Shah Pahlavi periods have similar characteristics, in most of which the principle of separation of public and private spheres is observed and direct access to the courtyards of the houses is avoided. Also, by constructing an entrance, an attempt is usually made to maintain the main functions (communication and monitoring) and the main objectives (maintaining privacy and security) of the entrance. Table 3 shows that the two most important principles of segregation of public and private spheres (with a frequency of 37 cases) and introversion (with a frequency of 36 cases) are the most important principles of creating privacy. (Table 3).

902
Mohsen Tabassi, Sepideh Mousavi
Table 3: Quantitative analysis of the findings on strategies and principles.
Spatial Separation of public & private Introversion Connection with the hierarchy areas nature
F % F % F % F % Qajar era 19 96 19 95 18 90 12 60 Reza Shah
era 15 75 18 90 18 90 10 50
Total 34 --- 37 --- 36 --- 22 --- Percentage 85 --- 92.5 --- 90 --- 55 ---
* F means Frequency of cases.
In terms of the functions and main purposes of entrances, there is no significant difference between these two periods. The difference is limited to a 5% reduction in the traffic monitoring function in the samples of Reza Shah's period compared to the Qajar one (Table 4).
Table 4: Quantitative analysis of the findings regarding the major goals and functions of the entrances.
Main functions of the entrance Major goals Access & connection Monitoring arrival & departure Protecting privacy Protecting security
F % F % F % F % Qajar era 20 100 15 75 19 95 14 70
Reza Shah era 20 100 14 70 19 95 14 70 Total 40 --- 29 --- 38 --- 28 ---
Percentage 100 --- 72.5 --- 95 --- 70 --- * F means Frequency of cases.
Table 5 outlines the implementation strategies to maintain privacy. 70% of Qajar houses and 65% of Reza Shah's houses have one entrance and there is no significant difference in this regard. The entrance of 80% of Qajar houses are located in the corners or near the corners, while this figure is 65% in the samples of Reza Shah’s period which shows a difference of 15%. In terms of the type of access to the courtyard, 95% of the houses in both periods have indirect entrances (creating a visual restriction) to the courtyard, and in this respect, there is no difference. Considering the fact that the Hashti help to maintain privacy, they are observed in 55% of Qajar houses and only 15% of the houses of Reza Shah’s period. A 40% reduction in the construction of the Hashti is considered a major change in the architectural structure of the entrance to the houses (Table 5).
Table 5: Quantitative analysis of findings on executive solutions.
Number of entrances Position of entrances* Form of access to the courtyard**
Elements related to privacy***
1 2 3 The corner
Near the
corner
Middle of a side
Direct
Indirect Only Hashti
Only corridor Both
F % F % F % F % F % F % F % F % F % F % F %
Qajar 14 70 4 20 2 10 10 50 6 30 6 30 3 15 19 95 3 15 7 35 8 40
Reza Shah
13 65 6 30 1 5 9 45 4 20 10 50 6 30 19 95 1 5 16 80 2 10
Total 27 --- 10 --- 3 --- 19 --- 10 --- 16 --- 9 --- 38 --- 4 --- 23 --- 10 ---
% 67.5 --- 25 --- 7.5 --- 47.5 --- 25 --- 40 --- 22.5 --- 95 --- 10 --- 57.5 --- 25 ---
*Some houses have more than one entrances in different positions.**Some houses have both ways of access. ***Some houses have no Hashti or corridor.

903
Privacy in the houses of eastern parts of Iran, during the transition period with an emphasis on the architecture of housing entrances
In addition to the quantitative analysis of research findings, it is necessary to explain that the findings of the present study are consistent with the findings and results of two other studies. A study of the historical houses of Birjand by Hashemi Zarjabadi et al. (2015) shows that the principle of introversion is the main factor in creating privacy in the houses of South Khorasan (especially Birjand). Unfortunately, apart from the above study, no other research has been done paying attention to Khorasan houses in this regard. However, considering the closeness as well as climatic and cultural similarities between Yazd and Khorasan provinces, the study conducted by Hekmatnia (2018) regarding Yazd's houses can also be considered. The study shows that providing and maintaining privacy in Yazd's houses is based on the Iranian-Islamic way of life of the people of that area. In other words, the observance of privacy is one of the characteristics of the Islamic lifestyle, which, in the case of houses, is provided by paying attention to the principle of introversion. But in addition to the similarities in findings and results, it should be noted that both studies emphasized the principle of introversion through the spatial organization, while the present study focuses on the body and shape of entrances.
7. ConclusionGiven the main question and hypothesis raised in the study, the study shows that with the influence of Western culture and thought on the traditional world of Iranians, modern ideas spread rapidly and accelerated the break with the traditional world. With the changes in political, social, and cultural structures (especially during the reign of Reza Shah), the grounds for a change in the physical structure of cities throughout Iran were provided, and the eastern regions of the country were no exception. On the other hand, unlike the architecture of public buildings, the physical changes of houses during the transition period took place at a slower rate, because the physical changes in the home environment are highly dependent on the lifestyle and cultural characteristics of the residents. In this way, the people of the east of the country resisted as much as possible against social and cultural changes, as well as the resulting physical changes. The present study shows that the degree of adherence to the principle of separation of spaces and the principle of introversion in the houses of both periods has been almost the same. The main functions and goals of the entrance are very similar in both periods. However, in terms of applied solutions in the period of Reza Shah Pahlavi, there are changes compared to the Qajar period. In other words, since the principle of privacy in architecture is inextricably linked to religious beliefs and lifestyles in the eastern regions of the country, political, social and cultural developments during the transition period failed to eliminate the principle of privacy from the entrances of Khorasan houses (at least in the short term). Studying the history of Iranian architecture can provide valuable information to architects. Investigating the entrances of houses in the past can lead to finding solutions for designing contemporary houses if the present study is completed by studying the houses of the Pahlavi II (Mohammad Reza Shah) and the Islamic republic periods.

904
Mohsen Tabassi, Sepideh Mousavi
References
Alexander, C. (2011). The timeless way of building. Translated by Mehrdad Ghayyomi. Third edition, Tehran، Shahid Beheshti University Press.
Alimohammadi, F.; Bemanian, M.R. and Pour Fathollah, M. (2015). Comparative study of the effect of cultural changes on privacy at the entrance of traditional houses of the Qajar period; Examples of traditional houses in Qazvin. Motaleat-e Mian Farhangi, 10 (27), 115-140.
Bani Masoud, A. (2012) Contemporary Iranian architecture (in the struggle between tradition and modernity). Fifth Edition, Second Edition, Tehran، Publishing the Art of the Century.
Bemanian, M.R.; Gholami Rostam, N. and Rahmat Panah, J. (2010). Identity-building elements in the traditional architecture of Iranian houses; case study: the House of the Rasoulian in Yazd. Motaleat-e Honar-e Islami, 7 (13), 55-68.
Dehkhoda, A. (1998). Loghat Nameh. Under the supervision of Mohammad Moin and Seyed Jafar Shahidi, 16 volumes, Tehran: University of Tehran Press.
Ghafourian, M. and Pey Sokhan, M. and Hesari, E. (2017) Typology of the Space Organization and the Hierarchy of Entry into Iranian Houses with Emphasis on Confidentiality. Barnamerizi Tosee Kalbodi (7), 129-144.
Harris, C. M. (1975). Dictionary of Architecture and Construction. New York: Mc Grow Hill. Hashemi Zarjabadi, H.; Taqavi, A. and Masoudi, Z. (2015). Introversion and reflection of the principle of privacy in
Iranian-Islamic architecture; Case Study: historical houses of Birjand. Motaleat-e Ejtamaee Farhangi Khorasan, 9 (2), 123-146.
Hekmatnia, H. (2018). Measuring the level of privacy of houses according to the Iranian Islamic lifestyle; case study: the old and new texture of Yazd city. Pazhohash haye Goghrafiyaee Barnamerizi Shahri, 6 (3), 585-603
Hosseinpour, R.; Bilali Oskooi, A. and Ki Nejad, M. A. (2018). Assessing the Islamic Concepts of Housing Design with the aim of recreating contemporary housing. Pazhohesh haye Memari Islami, 6 (20), 21-48.
Kiani, M. (2004). The effects of Aristocracy on the architecture of the first Pahlavi period. Tarikh-e Moaser-e Iran (32), 45-70.
Madanipour, A. (2003). Public and Private Spaces of the City. New York: Routledge. Mohammadi, M. (1995) Change in the power structure in Iran and the transformation of the city. Proceedings of the
First Congress of Iranian Architectural and Urban History, vol. 2، 605-628. Tehran، Cultural Heritage Organization. Mo'meni, K.; Attarian, K.; Didehban, M. and Vesal, M. (2018). Privacy in the architecture of Dezful houses in the
Qajar period. Jelveh-e Honar, 10 (20), 79-92. Nari Qomi, M. (2010). Semantic studies on the concept of introversion in the Islamic city. Memari va Shahrsazi, (43),
69-82.Nasr, S. H. (2001). Knowledge and the sacred. Translated by Farzad Haji Mirzaei, Tehran: Farzan Rooz Publishing. Okhovat, H. (2011). Recognition of the identity components of traditional housing based on Quranic verses and
hadiths.Pazhohesh haye Quran-e Karim, 3 (2), 68-86. Saremi, A. and Radmard, M. T. (1997). Sustainable values in Iranian architecture. Tehran: Publications of the Cultural
Heritage Organization of the country. Seifian, M. K. and Mahmoudi, M. R. (2007). Privacy in traditional Iranian architecture. Hoviat-e Shahr, 1 (1), 3-14. Shirazi, A. and Younesi, M. (2011). The Impact of Nationalism on the Architecture of the Governmental Buildings of
the First Pahlavi Period. Motaleat-e Shahr-e Irani Eslami (4), 59-69. Soltanzadeh, H. (2005). Entrance spaces of old houses in Tehran. Tehran، Office of Cultural Research. Valizadeh Oghani, M. B. (2014). Moral Principles and Thoughts in the Spatial Structure of Traditional Houses of
Islamic Iran; Case Study: privacy. Pajouhash-e Honar, (7), 47-60. Varmaghani, H.; Sultanzadeh, H. and Tahaei, S. A. (2018). Comparative study of the effect of culture on the entrance
of Qajar houses in Gilan and Mazandaran. Armanshahr, (25), 237-249. “http://www.merriam-webster.com” (2020) (accessed 20 April 2020).

905
The 54th International Conference of the Architectural Science Association (ANZAScA) 2020
Recognition of the architecture of Safavid caravanserais from the view of passive defense
Mohsen Tabassi1, Hasan Naseri Azghandi2 1, 2 Islamic Azad University, Mashhad, Iran
[email protected] [email protected]
Abstract: A study of Safavid history shows that security is a factor in the emergence of political authority and directly affects trade and the economy. The concept of defense can be defined in two ways: active defense and passive defense. Although the same goals are seen in both types, the methods used in passive defense are very different. The purpose of this study is to study the caravanserais of the Safavid period from the perspective of passive defense. The research method is a comparative description. 43 Safavid caravanserais are classified into four groups and the principles of passive defense are examined in them. The results show that the relationship between active defense factors or passive defense in caravanserais has varied, depending on the geographical location, the importance of the routes, and the architectural form of the caravanserais.
Keywords: Architecture; caravanserai; passive defense; Iran.
1. IntroductionThroughout history, human beings have always traveled for various reasons and motives, such as economic and commercial factors, tourism and pilgrimage, visiting relations and friends, and so on. One of the most important travel requirements is a shelter for comfort and safety from dangers along the way. In this regard, the Iranians have built caravanserais along the transportation routes, an architectural type that reached its peak of evolution during the Safavid period; Therefore, studying the different architectural aspects of this building can be an effective step in recognizing the architectural values of the past as much as possible, but so far no independent research has been done on the security of caravanserais. Threats have always been an integral part of human life, endangering his material and spiritual capital and even his life at various levels. In this direction, in an effort to counter these threats and create security, human beings have pursued measures in three areas: prevention, countermeasures, and action to return to pre-accident conditions. Passive defense is one of the topics that has always been considered in cities and villages and the transportation routes between them in different historical periods.
Imaginable Futures: Design Thinking, and the Scientific Method. 54th International Conference of the Architectural Science Association 2020, Ali Ghaffarianhoseini, et al (eds), pp. 905–914. © 2020 and published by the Architectural Science Association (ANZAScA).

906
Mohsen Tabassi, Hasan Naseri Azghandi
Looking back on Iran's past, one can see the role of stable states and governments in expanding roads and communications, with different social, commercial, religious, political, military, and security goals. On-the-road facilities such as caravanserais, towers, bridges, toll-houses, etc. are among the buildings that have played different roles in line with the above objectives, and among these, caravanserais are one of the most important types of architecture (from the perspective of this research). Regardless of the types of classifications, security, accommodation, and trade have always been the most important factors in shaping caravanserais. Due to the obvious differences in the caravanserais of different regions, the present study examines their physical differences from the point of view of security and passive defense. Knowing the factors affecting the body of past architecture is a way of discovering identity as well as recognizing form and content in these ancient works so that the missing link between past and contemporary architecture can be revived. From this point of view, the authors hope that other aspects will be considered in future research. Given the purpose of the research, the question is, what is the relationship between the use of active and passive defense in the formation of caravanserais? The research hypothesis is based on three principles: 1- In areas where there are no natural elements of passive defense and active defense has not beenjustified, the maximum use of physical elements of passive defense has been done. 2 - In areas where there are natural elements of passive defense (e.g. mountains) in the construction ofcaravanserais less physical-security components and elements (such as towers and fortifications, etc.)have been used. 3. In areas where active defense is available, the use of passive defense elements has been minimized.
2. Theoretical foundations of research
2.1 Definition of specialized terms
Passive Defense: Passive defense is of particular importance as a defensive strategy in land management. The term is in contradiction with Active defense. The word ‘passive’ indicates the use of civilian facilities (Hausen, 2013, p. 6). Conceptually, active defense means defending against military aggression; therefore, the passive defense is a set of policies and measures that can maintain the security and repel the enemy and risk without the need to use military equipment (Lacina, 2006, p. 91). History shows that the formation of early civilizations in the world has always been associated with war. To prevent enemy attacks and save lives, humans created group security by refuging in caves, building fortifications and forts, and digging trenches (Nagaraj, 2015, p. 319). The people of Iran have always faced threats and attacks as a result of the specific Iranian-Islamic worldview, and therefore many of the defensive considerations have their roots in this type of worldview (Tahan et al., 2009, p. 50). Among the measures of passive defense in different historical periods, the following can be mentioned; In Urartu civilization, the castle was built at the highest points. Although these points had a special defensive value, the Urartians did not content themselves with them and used various methods to defend the walls using earth and topography facilities. In the Median period, the use of environmental factors for defensive purposes has been well used. During this period, forts were built on top of natural heights and features. The special feature of these cities was their location at heights and multi-layered forts, which became stronger as they approached the ruling residence. In the Achaemenid period, factors such as heights and rivers (as natural factors) and the creation of fences and defensive towers (artificial factors) to create security were mentioned. Parthian cities often had only one gate, and the Parthians used circular schemes to deal with the tension of the time. In the

907
Recognition of the architecture of Safavid caravanserais from the view of passive defense
Sassanid period, although the construction of circular cities continued, to achieve greater security than the Parthian period, a quadrangular shape was also used. The passive defense has been used to secure settlements, especially important cities or crossroads. The above-mentioned defensive fortifications and measures of defense reflect the defensive thoughts and ideas based on the principles that we now recognize as passive defense measures. The more sensitive and vital the centers were, the more complex and advanced protection measures were employed. The above implies that any action taken by the human community, the natural and artificial environment, with a protection-oriented approach and civilian action, is considered a passive defense. Passive defense follows the rule of prevention rather than the function of structural strength (Kamran et al., 2011, p. 109).
Caravanserai: The word "caravanserai" is originally taken from Persian ‘karavan-sarai’, literally means caravan-house or the house of a caravan and was a place where travelers temporarily resided. In some Persian texts other terms have been used as equivalents including ‘karavangah’ and ‘karavan khane’, literally meaning ‘caravan place’ and ‘caravan home’ respectively (Hadizadeh Kakhki, 2014, p. 60). Various functions have been mentioned for the caravanserai, some authors have considered it as a center for the exchange of goods and a kind of guest house in the eastern lands (Tavernier, 1990, p. 122), and others have called it a safe place for the protection and comfort of caravanserais (Wicquefort, 1984, p. 121). In fact, the caravanserai was a large building outside the city or within the city that caravans used primarily for commercial purposes and later for military, political, religious, and social purposes. Its architecture depended on the geography of the region and also had service and welfare facilities. (Shanvaz and Khaghani, 2015, p. 20).
2.2. Literature review
Sources about caravanserais: Kiani & Kleis (1994) introduced different architectures of caravanserais from climate and shape perspectives in their book ‘The list of Iranian caravanserais’. They have provided lists of Iranian caravanserais by province. In the context of introducing caravanserai’s roles, they emphasized the security of travelers. In addition, a caravanserai can provide services such as bakery, milling, mosque, etc. to the villages located in the area. In another book titled ‘Iranian caravanserais’, Kiani & Kleis (1983), mentioning the above points, provided documentation and maps of Iran’s caravanserais in different locations. The book can be considered a complete reference of Iran’s caravanserais, and it has been employed by the authors of this study as one of their main sources. In his book of ‘ Islamic architecture: form, function, and meaning’, Hillenbrand (2004) investigated the features of Islamic architecture from different perspectives and described the most significant patterns of each period. He introduced different terms & concepts related to caravanserais and defined it as a place where caravans used for trade as well as taking protection from thieves and natural trouble of roadways (2004, p. 397). Through an analytical study, he introduced some of the most well-known caravanserais of Islamic countries and stressed the function of caravanserais in providing services to pilgrims in roadways to religious places (2004, p. 441). In a book titled ‘Iran’s caravanserais and small mid-way buildings’, Maxime Siroux (1983) mentioned Iran’s trade routes, caravans, and transportation instruments. He gave various classifications of caravanserais from perspectives of financial resources, geographic location, and type of construction. He

908
Mohsen Tabassi, Hasan Naseri Azghandi
divided caravanserais to two types, on the basis of their climate: mountainous and desert caravanserais (1983, p. 12). In his book titled ‘Remembrance of the caravanserais, robats, and caravans in Iran’, Ehsani (2002) discussed the history of caravanserais, defense and welfare, roadway, caravan and other details of caravanserais. Hadizadeh Kakhki (2014) in ‘Caravanserais in Iran’ discussed caravanserais from different perspectives such as type of roadways, dependent structures, functions, architectures, and different styles of caravanserais depending on the climate. In his book of ‘Iranian architecture in Islamic period’ Kiani (2014) investigating caravanserais from the historical perspective, classified them into three types based on the climate conditions: Fully covered mountainous caravanserais, near low-altitude areas of the Persian Gulf, and caravanserais with a courtyard in the central areas of Iran. In the book of ‘Iranian caravanserais in the Safavid era’, Shahnavaz and Khaghani (2015) gave another definition of the caravanserai. According to them, a caravanserai was a large building outside or inside the cities which was used by caravans for trade purposes as their first goal, and military, political, religious, or social purposes as the other secondary purposes. This book discussed the history, development, function, and architecture of the Safavid caravanserais. The authors believed that the peace and stability of the Safavid era was the reason why there were no military towers, or only decorative if any, in the layout of caravanserais (2015, p. 54). In addition to these books, many articles are written about caravanserais. Rafifar and Lorafshar (2013) emphasized the role of business and commercial activities in the economic growth of the Safavid period and subsequently the construction of more caravanserais (2013, p. 46). They studied the caravanserais on a certain route and investigated the cultural structures as well as anthropological of people through studying the caravanserais. Soheili and Rsouli analyzed the specific relations dominant in the architecture of Iranian caravanserais through space syntax technique. They believed that security and accessibility were the most important factors in the generation of spacial relations in Iranian caravanserais (Soheili & Rasouli, 2014, p. 47). Kaviyan and Gholami (2016) investigated the evolution of caravanserais, leading to higher safety and comfort of caravans, in different historical periods. Ebrahimzadeh and Gharakhani (2017) discussed different functions and physical typology of caravanserais in respect to climate and shape perspectives.
About passive defense: The concept of security includes all dimensions of human life and has a meaningful relationship with human survival. Security is a feeling which rises from structures and processes in which a person considers himself protected from any subjective or objective threat. With these explanations, it is clear that security is an inferential issue which is realized through special efforts. Experts mentioned various perspectives about security and related issues. Investigation of such ideas leads to the discovery of the link between securing caravanserais and knowledge of the passive defense. In the book ‘architectural requirements in the stable passive defense’, Asghariyan Jeddi (2013) discussed the history of theories about threats, passive defense, and architecture. In the book ‘Defensive structures in the Islamic era of Iran’, Pazouki Taroudi (1997) analyzed the defensive strategies and structures used in different historical periods for ensuring the security of Iran and emphasized the role of position and geographic features in the establishment of security. In their book titled ‘Passive defense, national and urban security’, Moghli et al. (2015) investigated the basis and historical philosophy of passive defense and security in the context of urban planning. They proposed three main approaches in the field of passive defense which are threat-based, capability- based, and opportunity-based, describing and discussing the features of each one. The authors believed

909
Recognition of the architecture of Safavid caravanserais from the view of passive defense
that camouflage, concealing, covering, tricking, distributing, defensive structures, notification, survivability, and deceptive position are the main elements of passive defense. In terms of articles about passive defense, the research by Asghariyan Jeddi and Mirhashemi (2016) can be mentioned, in which the authors discussed the native knowledge of the passive defense and its role in architecture and urbanization in different periods of Iran’s history. The researchers believed that passive defense in the context of architecture and urbanization consists of a few stages: planning, anti- surveillance and visual distraction, protection against direct observation of the enemy, and architectural designing. The efforts made in each of these stages are different. The planning stage consists of steps such as positioning, making obstacles, and distribution. The anti-surveillance and visual distraction consist of acts such as the installation of anti-radar and satellite systems is modern warfare and actions such as smoke removing in previous centuries. In the stage of protection against direct observation of the enemy, solutions such as camouflage, concealing, and tricking are used. In the architectural designing phase, actions such as multi-functional spaces, secure internal architecture, emergency entrance and exit, repair ability and design of the internal and external facades are considered (2016, p. 7). Amanpour et al. (2015) in a paper titled ‘An investigation of the defensive considerations of Iran’s historical cities’ analyzed the passive defense features in different dynasties including Medes, Achaemenids, Seleucids, Parthian, and Sasanian. They believed that positioning of the city's initial core, the city's defensive hierarchy, the impact of distance measure in the efficiency of distance measure in efficiency of passive defense, and efficient use of topographical features in urban positioning and accessing are the most important considerations for ensuring the safety of cities. In total, 15 principles of passive defense were mentioned as follows: Selection of safe locations inside the geographical conditions of the country; determining the appropriate scale of population and urban activities in the provided space; distribution of activities according to threats and geographic considerations; decreasing the scale and cost as well as innovation in the field of passive defense; economic feasibility of the project; parallelization of supportive systems; improving the strength of structures; positioning of functions; management of defensive crisis in the situations; camouflage and invisibility; blocking the enemy’s information system; concealing by natural and geomorphological features; having initiative and diversity in all activities; information protection for critical systems; construction of bi-dimensional structures. In addition to the above-mentioned factors, the authors emphasized other factors such as the creation of new defensive buildings, increasing the depth of accessing essential spaces, and control of physical communications. Most of the studies considered resources, positioning, strengthening, defensive buildings, distribution, and coverage as the most important elements of passive defense. Some of these factors can be extended to the urban areas and residential buildings. After reviewing the available studies, it became clear that no research investigated the relationship between passive defense and caravanserais in a meaningful way.
3. MethodologyIn accordance with its main objective, the current study takes a proving approach as its methodological choice. The variables extracted according to documentary studies are geographic location and the importance of roads, the shape of caravanserai’s plan (caravanserais with rectangular and polygonal courtyards, covered introverted and extroverted), elements related to passive defense (number of entries, guard room, watchtower), physical analysis (the depth of accessibility to rooms, number of

910
Mohsen Tabassi, Hasan Naseri Azghandi
space layers). These variables focus on security and passive defense. The statistical population of the current study consists of caravanserais constructed in the Safavid era which are classified into 4 groups based on the shape of plan and form, as shown in Table 3. The samples were selected on the basis of the judgment of researchers in a non-probabilistic and non-random way. In order to eliminate any obscurity about the validity of sampling, samples are selected in a way which satisfies the following considerations: - The caravanserais should preferably be registered as national heritage. Although some of them are notregistered in this list and some others are destroyed in previous years. Therefore, the selection of thesestructures for analytical purposes has a much higher value for maintaining their documents. - They have the required artistic and architectural values so that they can be studied analytically. - The geographical distribution of samples covers all parts of the geographical area under study. - The temporal distribution of samples (year and interval of construction) and establishment in the Safavid dynasty was the last requirement. According to the consideration mentioned above, 43 caravanserais were selected as the sample andclassified into four “shape groups”. It is clear that in respect to a large number of analytical features andelements of the statistical population, the size of the sample is selected in a way that minimizes thenumber of repeated data. The acquired samples are: Type I. Rectangular with a courtyard: Baladabad, Behjatabad, Bahram, Koohpayeh, Hoseiniyeh,Poldooshan, Zavareh, Barsiyan, Sagzi, Shahvan, Miyankotal, Dokoohak, Chehelpayeh, Yangiemam,Qusheh, Jam, Qalehpahlou, Badni III. Type II. Polygon with a courtyard: Zeynoddin, Aminabad, Banarooyeh, Khankhoreh, Dehbid.Type III. Roofed Introverted: Shelbi, Kooycheh Beel, Sang too, Khaneh Sorkh, Gadook, Mirza Abdollah,Aminabad, Emamzadeh Hashem. Type IV. Roofed Extroverted: Bargeh Seta, Badni I, Badni II, Hashem, Dasht, Tekyehkhaneh, Shono, BerkehSoltan, Berkeh Sefid, Shargh Tangeh No, Tangeh Dokan, Gachineh II. (Figure 1)
4. Research findingsThe study shows that the physical factors that create security are: - Using rampart and extended towers in four edges of building and sometimes parallel to the walls(defensive factor: creation of fortifying elements) - Necessity of passing through spaces such as internal gate, porch, corridor, courtyard, and balcony inorder to reach residential rooms (defensive factor: increasing the depth of access to spaces with a higher level of security) - Using the entrance gate (defensive factor: controlling connection between inside and outside)- Creating guarding spaces or rooms in entrance porch (defensive factor: controlling connection betweeninside and outside) - Using polygonal or circular shapes (defensive factor: having higher control on location of caravanserai) - Creation of spatial layers such as outdoor fence, stable, rooms, courtyard from outside toward inside in a continuous manner (defensive factor: positioning the location of functioning units) Since form and shaped are considered as basic elements in analysis of caravanserais, five influencingfactors are used for dividing caravanserais to four types. In fact, these variables lead to significantdifferences in passive defense methods and their level of implementation. (Table 1).

911
Recognition of the architecture of Safavid caravanserais from the view of passive defense
Figure 1. Several plan of the selected caravanserais. (Source: Kiani, 1994)

912
Mohsen Tabassi, Hasan Naseri Azghandi
5. Discussion and analysis
5.1 Physical analysis of rectangular caravanserais with the courtyard (Type I)
The initial core of this type of caravanserais consists of an open space (central courtyard) and some small independent spaces which were used as rooms and units for caravans and travelers to rest in. Such spatial arrangement has a significant impact on the creation of spatial layers (Soheili and Rasouli, 2014, p. 57). Asghariyan Jeddi & Mirhashemi (2016) considered it an important architectural factor for ensuring the security of passive defense (2016, p. 7). In these caravanserais, the linkage between courtyard and rooms is generated through only one door and this limitation leads to better control of entrance and exit and so the security of caravanserai would increase. Towers constructed in a semi- circular or cylindrical shape and located in four edges or in line with external walls were structured to protect the building from thives and attackers (Ebrahimzadeh and Gharakhani, 2017, p. 7). Towers, guarding rooms, and thick external walls were the main fortifications of caravanserais.
5.2 Physical analysis of polygonal caravanserais with the courtyard (Type II)
The general form of these structures is circular or polygonal from outside; however, the internal space where courtyard and residential rooms are located has a polygonal arrangement. The arrangement of spatial layers, like rectangular caravanserais with the courtyard, includes the external wall, stable, rooms, and the courtyard. Access to residential rooms only through one entrance door and pass through the porch, the guarding room, and the courtyard indicates that entering and exiting was strictly controlled. The extended cylindrical towers, located along the external wall, were used for improving the defensive capacity of caravanserais and its surrounding. According to the reports of tourists and contents documented by researchers, these caravanserais were mostly constructed for military and security purposes (Siroux, 1983; De Silva Figueroa, 1984). Hillenbrand (2004) believed that Khankhore caravanserai with octagonal architecture had military and security functions (2004, p. 365).
5.3 Physical analysis of roofed introverted caravanserais (Type III)
The simplest form of these caravanserais consists of central roofed rooms or a line of roofed rooms and a set of stables in the same location. Such caravanserais had only one entrance, a feature which had a significant role for controlling the internal space of caravanserai and implementation of passive defense. In some cases, the entrance of the rooms is directly after the gate, while in some others they are located after porch or corridor. These features reflect the fact that factors such as fortifications, spatial layers, and depth of access weren’t considered as the main components of passive defense (Tahan et al., 2009).
5.4 Physical analysis of roofed extroverted caravanserais (Type IV)
These caravanserais usually have a rectangular structure with a central cross-shaped room and some other rooms. There were no guarding rooms or watchtower in any of the caravanserais in this area. Not using passive defense measures in this area is only due to the fact that security and peace of this era were provided by the active defense (Shahnavaz & Khaghani, 2015, p. 53). According to a formal report provided by English officers who traveled to Iran in the Safavid era, the Isfahan-Jask path has a high level of security and most travelers used these paths with a large amounts of money, without the fear of being robbed (Steensgaard, 1974, p. 400).

913
Recognition of the architecture of Safavid caravanserais from the view of passive defense
6. ConclusionAlthough the transformation and evolution of the architecture of Iranian caravanserais in different historical periods (from Sasanian to Safavid) were influenced by factors such as climate, culture, religion, skill, etc. There is no doubt that the security of caravans was one of the most important needs of people, and the architecture of caravanserais was defined in order to ensure the security of them. Although it is clear that various factors had affected the generation of different parts of caravanserais. Table 2 shows that three types of caravanserais had great similarities using physical elements for ensuring security, while roofed extroverted caravanserais (type IV) had some features different from other caravanserais. This study shows that in locations where natural elements of the passive defense (such as mountain, river, etc.) were unavailable and the active defense is infeasible because of other factors, the architecture tried to use the physical elements as much as possible. Reducing the number of entrances, establishment of guarding room and watchtower, increasing the depth of access or number of spatial layers all led to better passive defense against probable threats. On the other hand, the strategic location of roadways along the Persian Gulf and the important role of these business roadways in providing national, commercial, and economic services made it necessary for the government to guarantee their security through the active defense measures. Therefore, less pressure was put on architectures to ensure the safety of caravanserais in this region. Finally, it should be mentioned that ensuring the safety of caravans and the lives and properties of people shows the political and economic power of the government. The intelligent Iranian architets, considering the type and importance of commercial roadways, used contextual and climate factors, geographical features, and physical elements to create or improve the security of caravanserais. Given that the study of the history of architecture focuses only on a part of history, the authors hope that future studies will be conducted in other historical periods as well, through which we can find solutions for architectural design in the contemporary period by considering the principles of passive defense.
Table 2. Analysis of research findings, (Source: Authors)
Type
No. of Entrance
s
Guardian Room
Watch tower
Depth of Access to the rooms No. of Spatial layers
1 + 1 1 2 3 4 5 2 3 4 F % F % F % F % F % F % F % F % F % F % F % F %
I 1 8
10 0 0 0 14 77 12 66 0 0 0 0 0 0 2 11
1 6 89 0 0 6 33
1 2 67
II 5 10 0 0 0 5 100 4 80 0 0 0 0 0 0 0 0 5
10 0 0 0 1 20 4 80
III 8 10 0 0 0 4 50 4 50 0 0 2 25 6 75 0 0 0 0 2 25 5
62. 5 1
12. 5
IV 0 0 1 2
10 0 0 0 0 0
1 0 86 2 14 0 0 0 0 0 0 2 14
1 0 86 0 0
Tot al
3 1
72 1 2
28 23 53 20 47 1 0
23 4 9 6 14 2 5 2 1
49 4 9 2 2
51 1 7
40
References - Amanpour, S. Ahmadi, R., & Davoudi Manjazi, A. (2015). An investigation of defense considerations in historicalcities of Iran. Passive Defense, 6(4), 1-14 - Asghariyan Jeddi, A. (2013) Architectural requirements in the stable passive defense. Tehran, Shahid Beheshti University Press.

914
Mohsen Tabassi, Hasan Naseri Azghandi
- Asghariyan Jeddi, A., & Mirhashemi, S. E. (2016) Indigenous science of the passive defense and in architecture and urbanization in different periods of Iran’s history and developed samples. The Journal of Indigenous Sciences of Iran,3(1), 7-42 - Ebrahimzadeh, A., & Gharakhani, A. (2017) A Study of functions and architectural details of Safavid caravanseraisand how to revive them. International Conference on Civil Engineering, Architecture and Urbanism of ContemporaryIran. Tehran, Iran. - Ehsani, M. T. (2002) Remembrance of the caravanserais, robats, and caravans in Iran. Tehran, Iran: Amir Kabir- Hadizadeh Kakhki, S. (2014). Caravanserai in Iran. Tehran, Iran: Cultural research office.- Hausen, K. (2013). Active vs. Passive defense against a strategic attacker. International Game Theory Review, Vol.13(1): 1-12. - Hillenbrand, R. (2004). Islamic architecture: form, function, and meaning. Columbia University Press, USA.- Kamran, H., Varesi, H. R., Parizadi, T., & Hosseini Amini, H. (2011). Investigating the role of physical developmentprojects in urban sprawl with a passive defense approach; a case study of Sanandaj city. Geography and areadevelopment, 17(9), 179-209. - Kaviyan, M., & Gholami, Gh. (2016). Investigating the architectural evolution of courtyard caravanserais in central Iran, Journal of Asar. 75(37), 49-65. - Kiani, M. Y. (2014). Iranian architecture in Islamic period. Tehran, Iran: SAMT.- Kiani, M. Y., & Kleis, W. (1983). The list of Iranian caravanserais. Tehran, Iran: National Antiquities Protection Organization of Iran. - Kiani, M. Y., & Kleis, W. (1994). Iran’s caravanserais. Tehran, Iran: Cultural Heritage Organization.- Lacina, B. (2006). Explaining the severity of civil wars. Journal of Conflict Resolution, 50 (2): 89–276.- Moghli, M., Mottaghi, A., & Hosseini Amini, H. (2015). Passive defense, national and urban security. Tehran, Iran: Nashr-e Entekhab. - Nagaraj, A. (2015). Protection of simple series and parallel systems with components of different values. ReliabilityEngineering and System Safety, 87: 315- 323. - Pazouki Taroudi, N. (1997). Defensive structures in the Islamic era of Iran. Tehran, Iran: Cultural HeritageOrganization. - Rafifar, J., & Lorafshar, E. (2013). Anthropological review of caravanserais in the Safavid era, Iranaian Journal of Antropology. 4(2), 37-60. - Shanvaz, B., & Khaghani, R. (2015). Iran’s caravanserais in the Safavid era. Tehran, Iran: Nashr-e Pazineh.- Siroux, M. (1983). Iran’s caravanserais and small mid-way buildings (I. Behnam, Trans.). Tehran, Iran: National Antiquities Preservation Organization. - Soheili, J., & Rasouli, N. (2014). Comparative study of the architectural space of caravanserai in Qajar period, Cityidentity. 26(4), 47-60. - Steensgaard, N. (1974). Caravans and companies. Chicago, USA: University of Chicago.- Tahan, F., Hosseini, B., & Naghizadeh, M. (2009). Evaluation of passive defense in the historical city of Shushtar,Passive defense. 1(1), 49-59. - Tavernier, J. B. (1990). Tavernier travelogue (A. Nouri, Trans.). Tehran, Iran: Nasher-e Tayid.- Wicquefort, A. (1984). L’Ambassade D. Garcia de Silva en Perse. (Gh. R. Samiee, Trans.). Tehran, Iran: Nasher-e Nov.

915
The 54th International Conference of the Architectural Science Association (ANZAScA) 2020
Research trends in construction and demolition waste management in Australia
Yuchen She1, Nilupa Udawatta2 and Olubukola Tokede3 1, 2, 3 Deakin University, Geelong, Australia
{shesh1, nilupa.udawatta2, olubukola.tokede3}@deakin.edu.au
Abstract: Construction and demolition (C&D) waste generation has adverse impacts on the environment. Researchers have identified different methods to improve waste management practices, but waste generation still continues. It is necessary to identify the current trends in waste management to provide better solutions for waste generation. This research aims to provide a holistic understanding of the studies on Australian C&D waste management in the last two decades. For achieving this, trends and directions of Australian C&D waste management from January 1998 to June 2018 were systematically analysed in the research by using diagrams and tables. A total of 24 journal articles focusing on Australian C&D waste management were retrieved from seven international peer-reviewed journals. A framework, integrating with this research’s findings, was developed to recommend future research directions for Australian C&D waste management. This framework suggests to find the most suitable waste management approaches by integrating technical and human aspects in waste management practices, consider the lifecycle of construction projects in C&D waste management by involving the circular economy concept and managing all relevant stakeholders in waste management practices. Thus, this study can serve as a guide for practitioners and researchers to provide better solutions in Australian C&D waste management.
Keywords: Australia; construction and demolition waste; construction projects; waste management.
1. IntroductionThe construction industry generates a large amount of construction and demolition (C&D) waste and often discards them in an unsustainable manner. Construction and demolition waste is one of the most massive waste flows in the world (Islam et al., 2019). It is estimated that over 10 billion tonnes of C&D waste is generated annually in the world (Wang et al., 2019). When it comes to the Australian context, C&D waste as the second-largest waste stream and it produces approximately 19 million tonnes annually (Pickin et al. 2018). The other two core waste streams (i.e., commercial and industrial waste, and municipal solid waste) are generated near 33 million tonnes and 13 million tonnes, respectively (Pickin et al. 2018). Poon et al. ( 2013) also investigated that the average of C&D waste in various countries has come to around 33% of their total waste, but this rate is near 44% in Australia.
Imaginable Futures: Design Thinking, and the Scientific Method. 54th International Conference of the Architectural Science Association 2020, Ali Ghaffarianhoseini, et al (eds), pp. 915–924. © 2020 and published by the Architectural Science Association (ANZAScA).

916
Yuchen She, Nilupa Udawatta and Olubukola Tokede
Construction and demolition waste tends to be highly heterogeneous depending on its origin. More than 90% of these comprise of concrete, mortar, brick, block, metal and timber (Islam et al., 2019). The composition of C&D waste could also contain hazardous substances (e.g. asbestos, particulate matters, etc.), which could be toxic and carcinogenic (Gálvez-Martos et al., 2018). Similarly, waste generation has negative impacts on the environment (Mukherjee and Muga, 2009) due to the consumption of non- renewable natural resources and energy; generation of harmful gases; and the land and water pollution (Ding et al., 2016; Marzouk and Azab, 2014; Yuan, 2013; Lu and Yuan, 2011; Yuan and Shen, 2011). Roussat et al. (2008) have highlighted that human health also could be affected as a result of hazardous components produced from demolition waste.
So far, several studies, researching an extensive range of topics related to C&D waste management have been published in the literature in the last few decades. However, these studies have different emphases hence the need to synthesise the state-of-art in Australian C&D waste management practices towards improving performance and consolidating on sustainable practices is required. The National Waste Policy has appealed to better support economy, protect people’s health, and reduce environmental problems in Australia by controlling and using the value of waste materials moving towards a circular economy (Australian Government Department of the Environment and Energy, 2018). The circular economy concept focuses on closing a loop of one product’s lifecycle while maximally maintaining its service value through bringing the product back into its lifecycle loop at the end of the utilisation (European Commission, 2019). This concept can be applied to not only to minimise the use of resources and waste generation but also to maximise the opportunities in recycling area by creating markets and jobs, which will have positive impacts on the economy (European Commission, 2019). However, most previous Australian research has represented a waste management hierarchy as the gold standard; this hierarchy manages waste by using waste avoidance, reduction, reuse, recycling, treatment, and landfill in ascending order of their adverse effects on the natural environment from low to high. It seems that this gold standard which is only based on the environmental preference is out of date for catching up the circular economy. Therefore, it would be useful and effective to evaluate the latest trends of C&D waste management in Australia in order to find possible solutions to improve current waste management practices.
Lu and Yuan (2011) explained that published studies generally indicate changes of interests and attention on some specific subjects as influenced by the respective authors. Furthermore, they revealed that such alternating interests had become a reason for the absence of a systematic study related to C&D waste management in many published studies. Thus, the aim of this research is to provide a systematic review of C&D waste management in Australia from January 1998 to June 2018, and further analyse whether those trends have been discussed and acknowledged in the current literature related to the Australian context.
The rest of the paper is structured as follows: Section 2 describes the research methodology; Section 3 deduces significant findings in light of a systematic and sequential review of the literature to spotlight the C&D waste management; Section 4 reveals future directions for Australian C&D waste management.
2. Research methodA systematic review was undertaken in this research by analysing journal articles published in seven major international journals from 1998-2018 in order to understand a holistic view of the current C&D waste management studies in Australia. The systematic review was conducted by following the approach adopted by Lu and Yuan (2011). The procedure for retrieving relevant papers involved, setting

917
Research trends in construction and demolition waste management in Australia
keyword boundaries (Figure 1) as string ‘texts’ in the Google Scholar, Scopus and Science Direct database for crucial facets of C&D waste analysis, including waste generation, waste management approach, waste management hierarchy, and sustainability impacts. A 3-step process was followed to ensure that the relevant papers were searched, retrieved, and analysed. The specific processes include selecting scholarly journals, retrieving papers, and analysing content by using NVivo software package.
Figure 1: Keyword boundaries of the study
2.1. Selecting scholarly journals and retrieving papers
When selecting the journal articles, this research also considered rationales used by other researchers, who conducted similar studies in the waste management area. For example, Lu and Yuan (2011) and Yuan and Shen (2011) considered eight academic journals in their reviews in waste management. These journals are Resources Conservation and Recycling (RC&R), Waste Management (WM), Waste Management and Research (WM&R), Construction Management and Economics (CME), Building and Environment (B&E), Journal of Construction Engineering and Management (CEM), Automation in Construction (AIC), Engineering Construction and Architectural Management (ECAM). Among of them, WM, WM&R, and RC&R are three internationally reputable scholarly journals, mainly focusing on waste management (Lu and Yuan, 2011), and publishing some articles regarding the C&D waste management (Lu and Yuan, 2011; Yuan and Shen, 2011). According to Yuan and Shen (2011), CME, B&E, CEM, AIC, and

918
Yuchen She, Nilupa Udawatta and Olubukola Tokede
ECAM are also mainstream journals, publishing works related to C&D waste management. Other journals, publishing papers about C&D waste management, can also be potential target journals in this research. These journals are Construction Innovation (CI), Management of Environmental Quality: An International Journal (MEQ), Journal of Industrial Ecology (JIE), and International Journal of Construction Management (IJCM). Thus, the retrieving work started with searching academic articles in the twelve journals via the selected database based on the keyword boundaries. This initial search yielded a list of 21 papers. Authors have checked the above mentioned twelve journals issue-by-issue from January 1998 to June 2018 to identify the papers published in relation to the Australian C&D waste management. After this process, WM, WM&R, RC&R, CME, ECAM, MEQ, and IJCM were identified as the potential journals to include in the review and 3 extra academic articles were identified from this process. It was, therefore, decided to choose these seven journals as final target journals for identifying academic articles relevant to Australian C&D waste management. As a result of that a total of 24 scholarly papers were included in the review.
2.2. Analysing content by using NVivo
An in-depth analysis of relevant publications is required to extract meaning and validate trends. As content analysis is one of the widely and flexibly adopted research techniques to analyse text data, it was applied to identify the trends and patterns of Australian C&D waste management in this research. Krippendorff (2013, pp. 24) defined content analysis as ‘a research technique for making replicable and valid inferences from texts (or other meaningful matter) to the context of their use’. In its most straightforward format, content analysis is the extraction and categorisation of information from documentary sources (Zhou et al., 2015). Saldaña (2016) provided a thorough review of various software programs for content analysis, considering functions, characteristics, and limitations of these software programs. Particularly, NVivo 12 Plus software program has been found useful for importing source materials or bibliographical data from other data sources. Specifically, some essential functions in NVivo 12 Plus software program (e.g. ‘Code’ and ‘Model’) provide help for users to classify, organise and manage tremendous amounts of information, and explore complicated relationships in the information. Thus, NVivo 12 Plus computer-assisted qualitative data analysis software was used in this research to analyse the data. A tentative framework matrix was created to analyse the 24 journal articles retrieved from seven selected journals. The first-level nodes and second-level nodes were created to analyse the data on selected papers based on the keyword boundaries. For example, Table 1 summarises the first-level and second-level nodes, which were created to identify project stakeholders related to C&D waste management in the selected time period.
Table 1: A tentative framework matrix developed on NVivo
Year (Continuing)
First-Level Nodes (Continuing)
Construction project stakeholders
Second-Level Nodes (Continuing)
Clie
nt/C
usto
mer
Ow
ner
Use
r
Arch
itect
Desig
ner/
Cons
ulta
nt En
gine
er
Offi
ce-b
ased
m
anag
er Pr
ojec
t man
ager
Site
man
ager
Wor
ker/
Labo
ur
Cont
ract
or/B
uild
er
Subc
ontr
acto
r
Gov
ernm
ent
Supp
lier
Publ
ic
1998-2004 √ √ √ √ √ √ √ √ 2005-2011 √ √ √ √ √ √ √ 2012-2018 √ √ √ √ √ √ √ √ √ √ √ √ √ √
919
Research trends in construction and demolition waste management in Australia
3. Analysis and discussionIn order to better understand the overview of current waste management studies in Australia, it is vital to analyse all identified C&D waste management studies systematically. All retrieved papers were classified based on the classification of the selected period divided into three equal analysis periods as 1998-2004, 2005-2011 and 2012-2018. Based on the previous tentative framework matrix, a visual summary was established to assist in analysing and understanding the development of Australian C&D waste management research, as shown in Figure 2. This figure is divided into three main sections: the green section represents the Australian C&D waste management research from 1998-2004; the blue section represents from 2005-2011, and the yellow section shows research from 2012-2018. Each section includes a curve pie indicating a total number of studies published in the selected period with its percentage of total studies published in 21 years. It should be mentioned that the sum of these percentages exceeds 100% as some of these studies focus on more than one area; for example, in the spectrum of C&D waste management hierarchy, the sum of all percentages exceeding 100% because of some retrieved studies focusing on more than one method in the waste management hierarchy.
Figure 2 highlights the C&D waste management hierarchy, construction project lifecycle demonstrating the stages in which C&D waste is distinctive and in which C&D waste management strategies/approaches can be applied. It also emphasises waste management approaches ranging from human factors to technical factors, and construction project stakeholders regarding C&D waste management. The C&D waste management approaches were classified under technical and human factors in line with technical viewpoints (i.e. technologies) and social issue standpoints (i.e. economic or managerial measures) used by Lu and Tam (2013) in their research. In Figure 2, technical factors tend to be measurable, and their impacts are significant, real and explicit; for example, a specific design, infrastructure or principle developed in order to enhance waste management practices. Human factors pertain to be immeasurable, and their impacts are recognised as relations of context, power and identities which can transform waste management practices based on human power; for example, interpersonal skills, relationship management or communities of practice in order to improve waste management practices. Also, fifteen types of stakeholders relevant to C&D waste management mentioned by researchers were identified, as shown in Figure 2. It should be mentioned that among these types of stakeholders, some of the papers only used the term ‘designer’ without a specific clarification; thus this paper kept the term ‘designer’ instead of merging with other different individual stakeholders (e.g. architect, engineer). This paper also combined the term ‘designer’ and ‘consultant’ as they represent the cluster of different stakeholders. Besides, synonymous terms are arranged in the same group (e.g. ‘client’ and ‘customer’; ‘worker’ and ‘labour’).

920
Yuchen She, Nilupa Udawatta and Olubukola Tokede
Figure 2: A visual summary of C&D waste management studies in Australia
3.1. Waste management hierarchy and construction project lifecycle
Based on the studies examined, from January 1998 to June 2018, waste recycling (12, 49.9%) and waste reduction (10, 41.6%) have become the predominant waste management strategies, and the reuse of waste has gotten increased attention. These three waste management strategies have less adverse environmental impacts based on the stakeholder preference in the waste management hierarchy. However, waste reduction, reuse and recycling should be considered and be involved in all stages of the construction project lifecycle (Treloar et al., 2003). It also is important to find the most suitable strategies/ approaches for each stage of the building lifecycle, rather than only based on the stakeholder preference. Thus, it can be argued that the circular economy concept can be applied to improve the current C&D waste management practices as this concept tries to merge all best existing strategies to benefit the environment, economy and society, as highlighted in section 1. Majority of studies focused on construction (20, 83.33%) and demolition (5, 20.83%) stages in waste management practices throughout the selected period. However, it is important to consider the whole lifecycle when it comes
921
Research trends in construction and demolition waste management in Australia
to C&D waste management rather than only focusing on individual stages. Even at the predesign stage, waste management should be considered as a part of the tender documents to allow adequate time and resources for waste management (Udawatta et al., 2015b). Contractually, it is highly essential to keep agreements and contract documents without any mistake, deficiency, ambiguity and unjust risk transfer for minimising and avoiding any potential to rework and produce waste (Mendis et al., 2013). From the whole building perspective, the maintenance and retrofit stages can also be the best places to minimise and improve the environmental impacts of waste management (Treloar et al., 2003). Thus, it can be argued that embracing a lifecycle perspective on buildings as well as considering the most suitable waste management approaches will further improve outcomes in implementing waste management practices.
3.2. C&D waste management approaches and construction project stakeholders
From January 1998 to June 2018, there was a growing concern to technical factors of C&D waste management approaches, i.e. 1998-2004 (2, 8.3%), 2005-2011 (5, 20.8%) and 2012-2018 (12, 50%). As many researchers tend to focus on identify new technology tools or methods in improving waste management practices (e.g. Wijayasundara et al., 2018, 2016; Arrigoni et al., 2018; Rameezdeen et al., 2016; Tam, Tam and Le, 2010; Tam, 2008; Paranavithana and Mohajerani, 2006). Some authors even tried to develop and test possible technology for improving C&D waste management in Australia. Paranavithana and Mohajerani (2006) put forward a possible application of using crushed demolished concrete elements in asphalt concrete. Arrigoni et al. (2018) also examined rammed earth incorporated recycled concrete aggregates with a consequence of which way is a sustainable, resistant and breathable construction solution. Wijayasundara et al. (2018) evaluated net benefits of producing recycled aggregate concrete in terms of avoidance of concrete waste landfill, extraction of natural aggregate, and transportation of waste and by-products; they obtained a favourable outcome in the use of manufactured recycled aggregate concrete. However, any innovative technique requires many experiments and examinations before using in real projects. These kinds of requirements may challenge the Australian construction industry to the improvement of eco-efficiency as its limited ability in boosting profits but with its demand for more money in introducing advanced technologies (Hu and Liu, 2017). As a result of that, financial support from external stakeholders is crucial to introducing and applying technologies in sustainable construction practices (Hu and Liu, 2017; Tam, 2008). Therefore, it seems that human factors can influence technical factors in C&D waste management approaches when improving C&D waste management practices.
However, the majority of the C&D waste management research focused on technical factors with a lesser emphasis on human factors, as shown in Figure 2. Attitudes and behaviour of project stakeholders are commonly unsupportive on C&D waste management as the profit-driven nature of the construction industry (Udawatta et al., 2015a). The unwillingness of changing institutions slows down the implementation of technology or practices for minimising waste in construction projects (Park and Truck; 2017). Thus, it is necessary to consider human factors in waste management practices to improve current waste management practices (Hu and Liu, 2017; Udawatta et al., 2015a; Lingard et al., 2001). Although researchers have rapidly increased and expanded their interest to different types of stakeholders, most analyses and concerns to project stakeholders were decentralised in their research studies. Based on the studies examined, from January 1998 to June 2018, around half of them mainly focused on some of the internal stakeholders when considering C&D waste management; for example, contractors (13, 54.17%), clients (12, 50%) and workers (12, 50%). However, external stakeholders (e.g.

922
Yuchen She, Nilupa Udawatta and Olubukola Tokede
owners, public, and government) can also become the primary drives of sustainable construction practices to some extent (Hu and Liu, 2017). It is essential to construct relationships among all project stakeholders by high degrees of involvement, cooperation and sharing risks in construction projects with proper supervision under clear instructions for enhancing the performance of waste management practices (Udawatta et al., 2015b). For example, waste management professionals need to receive elaborate training on waste management procedures and techniques (Udawatta et al., 2015b). It would seem, then, that human and technical factors are equally important in C&D waste management approaches. Both of them could serve as barriers when implementing waste management practices in construction projects (Udawatta et al., 2018). In order to achieve robust C&D waste management, it is necessary to consider both technical and human factors with managing all project stakeholders relevant to waste management in construction projects.
4. Future directionsBased on published studies, the line of investigation of this study unearthed two main research areas that can promise in enhancing Australian C&D waste management, as shown in Figure 3.
Figure 3: A proposed framework for future C&D waste management practices in Australia
5. ConclusionsThis review-based paper was applied to provide a holistic understanding of the research trend in Australian C&D waste management from January 1998 to June 2018. By using qualitative analysis techniques, trends and directions in Australian C&D waste management were systematically analysed and evaluated. A total of 24 academic articles focusing on Australian C&D waste management were screened and retrieved from seven international peer-reviewed journals. Based on these papers, a framework was presented to map out future research directions in Australia’s C&D waste management sector. This framework can be used to help in ensuring that a coherent approach to waste management

923
Research trends in construction and demolition waste management in Australia
is enacted and monitored in Australia. This framework also can be applicable to the global context as it highlights the importance of considering the involvement of different stakeholders and life cycle thinking in C&D waste management. An improved understanding of the research trends in Australian C&D waste management will preclude a whole lifecycle perspective of buildings when implementing waste management practices in the future. The proposed framework of the research does not seek to inform waste management practitioners about what to do but rather provide an avenue for what they might do to achieve a more holistic and effective C&D waste management sector. This study, therefore, provides insights and strategies that can be harnessed by researchers, policymakers and practitioners when enhancing C&D waste management practices in Australia.
References Arrigoni, A., Beckett, C. T. S., Ciancio, D., Pelosato, R., Dotelli, G. and Grillet, A.C. (2018) Rammed earth incorporating
recycled concrete aggregate: a sustainable, resistant and breathable construction solution, Resources, Conservation and Recycling, 137, 11–20.
Australian Government Department of the Environment and Energy (2018) National waste policy 2018. Available from: Open Source Repository <https://www.environment.gov.au/system/files/resources/d523f4e9-d958- 466b-9fd1-3b7d6283f006/files/national-waste-policy-2018.pdf> (accessed 29 Janurary2020).
Ding, Z., Yi, G., Tam, V.W.Y. and Huang, T. (2016) A system dynamics-based environmental performance simulation of construction waste reduction management in China. Waste Management, 51, 130–141.
European Commission (2019) Sustainable products in a circular economy – towards an EU product policy framework contributing to the circular economy. Available from: Open Source Repository <https://ec.europa.eu/environment/circular-economy/pdf/sustainable_products_circular_economy.pdf> (accessed 01 March 2020).
Gálvez-Martos, J.L., Styles, D., Schoenberger, H. and Zeschmar-Lahl, B. (2018) Construction and demolition waste best management practice in Europe, Resources, Conservation and Recycling, 136, 166–178.
Islam, R., Nazifa, T. H., Yuniarto, A., Shanawaz Uddin, A. S. M., Salmiati, S. and Shahid, S. (2019) An empirical study of construction and demolition waste generation and implication of recycling, Waste Management, 95, 10–21.
Krippendorff, K. (2013) Content analysis: an introduction to its methodology, SAGE Publications, Los Angeles. Lingard, H., Gilbert, G. and Graham, P. (2001) Improving solid waste reduction and recycling performance using goal
setting and feedback, Construction Management and Economics, 19, 809–817. Lu, W. and Tam, V.W.Y. (2013) Construction waste management policies and their effectiveness in Hong Kong: a
longitudinal review, Renewable and Sustainable Energy Reviews, 23, 214–223. Lu, W. and Yuan, H. (2011) A framework for understanding waste management studies in construction, Waste
Management, 31, 1252–1260. Marzouk, M. and Azab, S. (2014) Environmental and economic impact assessment of construction and demolition
waste disposal using system dynamics, Resources, Conservation and Recycling, 82, 41–49. Mendis, D., Hewage, K.N. and Wrzesniewski, J. (2013) Reduction of construction wastes by improving construction
contract management: a multinational evaluation, Waste Management and Research, 31(10), 1062–1069. Mukherjee, A. and Muga, H. (2009) A decision-making framework to assess stakeholder value in adoption of
sustainable practices in construction, in: T. Samuel and M. Eddy (eds.), Construction Research Congress 2009, pp. 548–557.
Paranavithana, S. and Mohajerani, A. (2006) Effects of recycled concrete aggregates on properties of asphalt concrete, Resources, Conservation and Recycling, 48, 1–12.
Park, J. and Tucker, R. (2017) Overcoming barriers to the reuse of construction waste material in Australia: a review of the literature, International Journal of Construction Management, 17, 228–237.
Pickin, J. and Randell, P. (2017) Australian national waste report 2016. Available from: Open Source Repository <https://www.environment.gov.au/system/files/resources/d075c9bc-45b3-4ac0-a8f2- 6494c7d1fa0d/files/national-waste-report-2016.pdf> (accessed 22 December 2018).

924
Yuchen She, Nilupa Udawatta and Olubukola Tokede
Poon, C.S., Yu, A.T.W., Wong, A. and Yip, R. (2013) Quantifying the impact of construction waste charging scheme on construction waste management in Hong Kong, Journal of Construction Engineering & Management, 139(5), 466-479.
Rameezdeen, R., Chileshe, N., Hosseini, M.R. and Lehmann, S. (2016) A qualitative examination of major barriers in implementation of reverse logistics within the South Australian construction sector, International Journal of Construction Management, 16, 185–196.
Roussat, N., Méhu, J., Abdelghafour, M. and Brula, P. (2008) Leaching behaviour of hazardous demolition waste, Waste Management, 28(11), 2032-2040.
Saldaña, J. (2016) The coding manual for qualitative researchers, SAGE Publications. Tam, V.W.Y. (2008) Economic comparison of concrete recycling: a case study approach, Resources, Conservation and
Recycling, 52, 821–828. Tam, V. W. Y., Kotrayothar, D. and Loo, Y.C. (2009) On the prevailing construction waste recycling practices: a South
East Queensland study, Waste Management and Research, 27(2), 167–174. Tam, V.W.Y., Tam, L. and Le, K.N. (2010) Cross-cultural comparison of concrete recycling decision-making and
implementation in construction industry, Waste Management, 30, 291–297. Treloar, G.J., Gupta, H., Love, P.E.D. and Nguyen, B. (2003) An analysis of factors influencing waste minimisation and
use of recycled mat erials for the construction of residential building, Management of Environmental Quality, 14(1), 134–145.
Udawatta, N., Zuo, J., Chiveralls, K. and Zillante, G. (2015a) Attitudinal and behavioural approaches to improving waste management on construction projects in Australia: benefits and limitations, International Journal of Construction Management, 15, 137–147.
Udawatta, N., Zuo, J., Chiveralls, K. and Zillante, G. (2015b) Improving waste management in construction projects: an Australian study, Resources, Conservation and Recycling, 101, 73–83.
Udawatta, N., Zuo, J., Chiveralls, K., Yuan, H.P., Zillante, G. and Elmualim, A. (2018) Major factors impeding the implementation of waste management in Australian construction projects, Journal of Green Building, 13, 101– 121.
Wang, J., Wu, H., Tam, V.W.Y. and Zuo, J. (2019) Considering life-cycle environmental impacts and society’s willingness for optimising construction and demolition waste management fee: an empirical study of China, Journal of Cleaner Production, 206, 1004–1014.
Wijayasundara, M., Mendis, P. and Crawford, R.H. (2018) Net incremental indirect external benefit of manufacturing recycled aggregate concrete, Waste Management, 78, 279–291.
Wijayasundara, M., Mendis, P., Zhang, L. and Sofi, M. (2016) Financial assessment of manufacturing recycled aggregate concrete in ready-mix concrete plants, Resources, Conservation and Recycling, 109, 187–201.
Hu, X. and Liu, C. (2017) Slacks-based data envelopment analysis for eco-efficiency assessment in the Australian construction industry, Construction Management and Economics, 35(11-12), 693-706.
Yuan, H. (2013) Key indicators for assessing the effectiveness of waste management in construction projects, Ecological Indicators, 24, 476-484.
Yuan, H. and Shen, L. (2011) Trend of the research on construction and demolition waste management, Waste Management, 31, 670–679.
Yuan, H. (2017) Barriers and countermeasures for managing construction and demolition waste: a case of Shenzhen in China, Journal of Cleaner Production, 157, 84-93.
Zhou, J., Love, P. E.D., Matthews, J., Carey, B., Sing, C.P. and Edwards, D.J. (2015) Toward productivity improvement in electrical engineering documentation, International Journal of Productivity and Performance Management, 64, 1024-1040.

925
The 54th International Conference of the Architectural Science Association (ANZAScA) 2020
Reviewing indoor environmental quality of high-rise social housing
Felipe Jara Baeza1, Priyadarsini Rajagopalan2 and Mary Myla Andamon3
1, 2, 3 RMIT University, Melbourne, Australia
[email protected], {priyadarsini.rajagopalan2, mary.andamon3}@rmit.edu.au
Abstract: People spend most of their time indoors and majority of this time is spent inside their homes. The vulnerable population, including those with low-income, consider housing as central to their lives. More so for the elderly and sick as they stay inside their residences for even longer times. In Australia, almost 14% of the population live below poverty line. Therefore, social housing for low-income population is key to the national housing sector. In Melbourne, many social housing are single-sided units in high-rise buildings. The indoor environmental quality (IEQ) in these units is generally poor due to building design and characteristics, lack of maintenance and absence of appropriate heating, ventilating and air conditioning systems, causing health-related problems to a vulnerable group. This paper will present a critical review of the IEQ in social housing units in high-rise buildings and its impact on occupant health and comfort. This paper will also explore the interrelationships between the IEQ factors to get a holistic view of their performance focusing on how the design of the building envelope and the provision of windows affect the overall indoor environment of the residential units.
Keywords: Indoor environmental quality; social housing; public health; comfort; building envelope.
1. IntroductionIn Australia, people living under poverty line has increased from 11.5% in 2003 to 13.6%–more than 3.2 million–in 2020 (Davidson et al., 2020). However, the social housing stock has shown a decline, affecting the quality, type and security of housing for low-income families (Flanagan et al., 2019). Close to the city centre of Melbourne, a considerable proportion of social houses are high-rise buildings (McNelis and Reynolds, 2001). Furthermore, apartment units in high-rise buildings are usually single-sided due to the compact layout of the building blocks and their configuration (Aflaki et al., 2016).
A link has been found between the building characteristics of Australian social housing, particularly with indoor environmental conditions and resident’s health (Baker et al., 2014; Baker et al., 2016). Exposure to poor levels of IEQ can lead to diseases such as asthma, migraine, depression, anxiety and heart diseases, among others, contributing to morbidity and mortality (Haddad et al., 2019). A study encompassing 35% of the nationwide social housing stock has shown that the majority of them have been constructed 20 years ago or more, and 58% of them before the first Building Code of Australia was launched in 1988, meaning that no IEQ regulation was required (Barnett et al., 2013). As a consequence
Imaginable Futures: Design Thinking, and the Scientific Method. 54th International Conference of the Architectural Science Association 2020, Ali Ghaffarianhoseini, et al (eds), pp. 925–934. © 2020 and published by the Architectural Science Association (ANZAScA).

926
Felipe Jara Baeza, Priyadarsini Rajagopalan and Mary Myla Andamon
of building characteristics of social housing, low-income families are more likely to be exposed to poor levels of IEQ, reporting higher number of health-related issues and lower indoor satisfaction (Barnett et al., 2013; Baker et al., 2016). Further, due to their economic vulnerability, social housing mostly relies on passive systems (Curado et al., 2015), stressing the effect of envelope design, particularly windows on their IEQ. Currently, the Victorian Government requires public housing to consider the Better Apartments Design Standards (DELWP, 2016), to promote natural light, ventilation and energy efficiency (Department of Health and Human Services, 2020). This standard encompasses IEQ related aspects for the spaces such as minimum dimensions, maximum depth, windows on external walls, minimum noise levels, appropriate orientation, and cross ventilation for at least 40% of the units (DELWP, 2016).
The current COVID-19 pandemic lockdowns, which have transformed homes into a multi-activity space for teaching, working, and exercising, have significantly impacted the social housing residents who are already suffering from poor IEQ conditions. Further, Raynor et al. (2020) have suggested that, due to the pandemic, a good strategy would be to invest the public money into the development of social housing to cope with their housing market decline; reactivate the economy through construction and employment; and reduce homelessness. If this strategy could take place, it would be fundamental to set appropriate IEQ guidelines for multifunctional spaces.
The objective of this paper is to critically analyse the different parameters that affect the IEQ factors in high-rise social housing units. It will focus on the aspects of the current social-housing design standards with respect to IEQ factors, namely thermal, acoustic, lighting and air quality. Finally, the paper will focus on windows which is a central element connecting all these factors.
2. Indoor environmental quality factors
2.1. Thermal comfort
Thermal comfort is affected by environmental parameters such as air temperature, mean radiant temperature, relative humidity and air velocity, and personal parameters such as metabolic rate and level of clothing, nonetheless, other variables such as gender, age, race and climate are also affecting the thermal perception (ASHRAE, 2017). With these subjective variables, different people can have different perceptions of the thermal conditions and comfort in the same environment (Marino et al., 2015). Further, a study in small apartments in Hong Kong has established that residents were more sensitive to temperature changes than residents of bigger units, as they are used to a steadier and unchangeable environment, developing a lower tolerance and adaptation (Mui et al., 2018). In addition, people with control over the windows have a more forgiving attitude towards the building, than those with low level of control (Brager et al., 2004).
Low temperature settings can lead to respiratory infections and increase in blood pressure (Collins, 1986), while high temperatures can cause a severity range of thermoregulatory system failure (Koppe et al., 2004). Both studies argue that extreme temperatures can be more severe for vulnerable and elderly people. In addition, Frontczak and Wargocki (2011) have observed that thermal comfort is the most relevant factor affecting IEQ satisfaction. The indoor thermal environment is important for social housing because these are usually overcrowded and lack proper ventilation, heating and insulation (Domański et al., 2006). A study in natural ventilated social housing apartments in Sydney has shown that the indoor temperature was most of the time outside the comfort band and the relative humidity was mostly above the 60% threshold when the associated problems appear, having 16% and 62% of the social housing residents dissatisfied with the thermal quality in winter and summer respectively (Haddad

927
Reviewing indoor environmental quality of high-rise social housing
et al., 2019). Likewise, a study involving 180 social houses in seven buildings in Toronto have shown that discomfort is a cross-seasonal issue, as their results pointed out that in summer, more than a quarter of the units in each building were overheated, which was more than a half of the whole sample, and in winter, a quarter of the units in three buildings were underheated and almost 25% of the whole units were overheated (Vakalis et al., 2019). Diaz Lozano Patiño et al. (2018) have confirmed what has been exposed by other researchers related to overheating in social housing during the warmer summer days. Further, a study in Germany by Galassi and Madlener (2017) has shown that 67% of the respondents feel less comfortable with a warm environment, leading them to open windows, even when the HVAC system is running. On the contrary, a data analysis from a study of low-income houses in Europe have reported that temperatures are lower than the recommended minimum temperature of 18°C, with a minimum average between 5.2°C and 18.8°C, locating 5% of the surveyed houses at freezing levels (Kolokotsa and Santamouris, 2015). Additionally, an investigation in Wales by Burholt and Windle (2006) found a relationship between insulation and the number of extra clothes on, as 90% of the residents from insulated houses–double glazed windows and roof insulation–did not need extra clothing, while 39% of the houses with no roof insulation needed them.
Studies have reported that variations on the window sizes do not bring significant changes to the heating demand in winter, but, variations on windows sizes will change the cooling demand in summer, due to direct sunlight and heat gains, (Persson et al., 2006; Catalina and Iordache, 2012). In contrast, a research on social houses in Canada postulate that window sizes may have an impact on the thermal conditions either for summer and winter (Vakalis et al., 2019). Further, an improvement of 10% on the energy consumption when single-glazed windows were changed to double-glazed, with minimal wall insulation, was observed (Domínguez et al., 2012). Energy improvement can get up to 50%, as shown in another study, if very high efficient windows are used and solar gains maximized, performing even better than having only highly insulated walls (Persson et al., 2006). Barnett et al. (2013) explored a set of interventions for social housing using building simulations and noted that after roof insulation, shading control and window insulation are some of the best adaptations for improving thermal comfort.
2.2. Indoor air quality (IAQ) and ventilation
IAQ and ventilation are critical in social housing as it has been recorded that their levels are poor mainly due to low air change rates (Zota et al., 2005). An investigation in USA has presented higher levels of pollutants in inner-city houses than suburban ones (Simons et al., 2007), where the majority of high-rise social housing buildings in Melbourne are located (McNelis and Reynolds, 2001). Further, reported CO2 concentrations in several social housing buildings are above the recommended levels, directly related to indoor occupancy density, domestic activities, and daily pattern of occupancy (Haddad et al., 2019).
A study on the effect of wind on the thermal conditions into single-sided ventilation units has defined that the wind conditions, such as speed and direction, strongly affect the indoor airflow (Pokhrel et al., 2020). Even though Andersen et al. (2009) has presented some inconsistencies about the relevance of wind speed over the operability of windows, there seem to be an agreement on the fact that their operability is strongly related to outdoor temperature. Further, Prakash and Ravikumar (2015) stated that among all variables affecting ventilation, window opening is the easiest strategy to be considerate in the building for ideal ventilation performance. Nonetheless, an important aspect related to preferences, as shown in a Melbourne residential study, is that families prefer air conditioning over natural ventilation, reducing resilience to heat stress, which can be preoccupying in case of power

928
Felipe Jara Baeza, Priyadarsini Rajagopalan and Mary Myla Andamon
failures (Willand et al., 2016). Interestingly, a study has revealed that in warm conditions, around 30°C, even people feeling slightly cool mentioned their desire for more air movements (Toftum, 2004).
A study on the parameters affecting natural ventilation performance, led to an assertion that the ventilation mode—cross ventilation or single-sided ventilation—is the most relevant compared to window-to-wall ratio (WWR), space area, window type, or the orientation (Fung and Lee, 2014). The authors have also documented that even though the proximate context can have a considerable impact on ventilation performance, it does not affect the relative effect between parameters. Interestingly, Fung and Lee (2014) has identified that single-side ventilation provides higher ventilation rates than cross ventilation mode. By contrast, others argue that higher ventilation rates can be obtained by cross ventilation (Evola and Popov, 2006). Elshafei et al. (2017) found an increase in the air velocity by six-fold when the size of the window where maximized, reducing also the indoor temperature by 2.5%.
Different recommendations have been presented on the window arrangement for single-sided ventilation mode. Simulations have shown that the biggest impact on this mode is driven by the vertical position of the opening, followed by its width and wall thickness (Favarolo and Manz, 2005). Another study showed that the best performance was achieved with two separate cornered openings rather than two close ones at the centre (Hassan et al., 2007). In addition, other researches have demonstrated that locating the opening on the leeward face, rather than the windward face, provides a higher ventilation rate (Evola and Popov, 2006; Gao and Lee, 2011). For the type of windows, bottom hung and side hung windows were tested and it was observed that bottom hung windows performed better when the indoor/outdoor temperature difference is big, mainly because the cold air-flow can be directed above the occupied area (Heiselberg et al., 2001). Another study concluded that, for pollutants removal performance, a centre-pivoting window is highly efficient due to its level of control (Chou et al., 2008).
2.3. Lighting
Daylight has many attributes that affect IEQ such as its impact on the visual perception and thermal comfort, contributing to a reduction on the use of artificial light and heating/cooling systems, and the regulation of the circadian rhythms, sleeping patterns, and minimize seasonal affective disorders (Mercatelli et al., 2015). Nevertheless, the technological advancement of artificial light has made people more dependent on it, contrary to the recommendations following health and environmental concerns, which states that the daylight should be maximized and artificial light used only as a supplement (Meek and Wymelenberg, 2014). Furthermore, cultural differences have shown variations in visual satisfaction and comfort, demonstrating the complexity of assessing individual visual perceptions (Halonen et al., 2012). Moreover, residential spaces are complex due to the variety of lighting requirements for different performed activities like reading, writing, or cooking, just to name a few (Darula and Kittler, 2018). Despite the fact that in many countries low-income households are suggested being affected by visual discomfort (Kolokotsa and Santamouris, 2015), in Australia, the consideration of windows in the building code is mostly dictated for ventilation rather than illumination (Nedhal et al., 2016).
Boubekri and Lee (2017) note that natural light is considered difficult to be assessed due to its dynamic changes, especially when direct sunlight is involved, being the main reason for the large variety of metrics used. They highlighted that the commonly used are daylight factor (DF), daylight autonomy (DA), mean hourly illuminance (MHI) and useful daylight illuminance (UDI). They also have concluded that DA is the most appropriate to be used as it is a dynamic metric and it is not only useful for the amount of indoor illumination, but also for assessing direct sunlight, energy savings, and the use of artificial light, although it should be also used with DF and UDI if the goal is to estimate user comfort.

929
Reviewing indoor environmental quality of high-rise social housing
Boubekri et al. (1991) have highlighted that the positive aspects of direct sunlight are the free heating source and an increase in the visual, emotional, and psychological well-being, however, one of the problems is the unwanted penetration of direct sunlight such as glare and thermal discomfort due to unwanted heat gains. They have suggested that measuring the sunlight by the total time of penetration, rather than the amount of penetration, is inadequate, and concluded that the preferred amount of penetration is between 15% and 25% of the floor area.
A study by Acosta et al. (2016) on residential units in Madrid, which has a similar degree of latitude as Melbourne but on the northern hemisphere, has recommended a WWR, for a DA 250 lux of 50% on north windows, of 10% to comply up to 2m deep from the façade and 20% to comply up to 6m away from the facade. Also, they have shown that higher windows can provide an improvement on the DA of 9% for 2-4m deep or 32% for 4 to 6m deep.
2.4. Acoustics
The World Health Organization (2011) has identified noise pollution as one of the biggest environmental problems affecting health and quality of life, contributing to cardiovascular diseases, cognitive impairment in children, sleep disturbance and annoyance. They stated that many of these problems can be present from a range of 40dB(A) to be very dangerous over 55dB(A), except for sleep disturbance where some minor issues can be seen on a range of 30-40 dB(A). In their study on apartment buildings, Wong et al. (2009) mentioned that noise was pointed as the IEQ factor with worst performance, a regular complaint between homes that according to Smith et al. (2006) increased by 5 times in 15 years since 1991. Residents inside their homes are very sensitive to low levels of noise, causing distress and affecting relaxation, task performance, focus and sleep patterns (Nurzynski, 2018). Further, increasing urbanisation has led to residential developments near the traffic networks, which are the main source of noise such as roads, train tracks, or airports (Tong and Tang, 2017). In addition, low-income neighbourhoods are usually located close to those sources (Kolokotsa and Santamouris, 2015), and, consequently, they have reported being exposed to environmental acoustic risk (Pujol et al., 2012).
There are two main strategies to control traffic noise, one is along the transmission path, which has been proven as more efficient, and the other one is on the receiver, which many times is the only alternative (Buratti, 2006). For example, acoustic barriers for traffic diffract the noise to higher levels, being only a solution for the lower levels, making upper levels to take other actions to mitigate noise (Lam et al., 2018). Windows have been defined as the weakest building element for outdoor noise, (Naticchia and Carbonari, 2007), but at the same time, windows were described as the most cost- effective façade's component to treat outdoor noise (Habibi, 2019). Results on a residential case study have shown that improvements on the windows from single-glazed to double-glazed can have positive acoustics results (Habibi, 2019), nevertheless, double-glazed windows are not as good for low frequencies like traffic noise, where they can reduce around 20dB, as they are for high frequencies, where they can reduce around 40dB (Hu et al., 2013).
After reviewing many studies, it was concluded that the reduction of noise difference from the outdoor and the indoor can be around 10-13dB(A) for open windows, 14-19dB(A) for tilted windows, and 26-31dB(A) for closed windows (Locher et al., 2018). However, one of the big problems of many European regulations is that noise levels are measured with closed windows (Buratti, 2002), as the most common negative relation between noise and other IEQ factors is caused by closing the windows to avoid noise intrusion, resulting in a diminution of natural ventilation, affecting IAQ and thermal

930
Felipe Jara Baeza, Priyadarsini Rajagopalan and Mary Myla Andamon
conditions (Lam et al., 2018). In contrast, a study on noise found that the most annoying aspect of it is not being able to open the windows (Öhrström, 2004).
3. IEQ weighting and indexWhile earlier studies focused on the analysis of a single IEQ factor, new studies are trying to analyse their relationship to get a quantitative indicator when assessing general IEQ and comfort (Frontczak and Wargocki, 2011). Many of the rating systems consider a variety of IEQ factors on their assessment, however, others have more consideration on thermal comfort, leaving behind acoustic, IAQ, and visual comfort; even if some of them consider other factors, the interrelationship between them are not addressed well (Andargie et al., 2019). When some tools have tried to combine all IEQ factors in an IEQ index, the most challenging part is the weighting between the factors, especially because of the subjective component and user preferences, as they can rate the level of importance differently (Humphreys, 2005). Rohde et al. (2019) argued that the four main factors of IEQ are considered as of equal importance by many studies and, on top of that, some of the surveyed users believed that each factor contributes to a similar way on the overall IEQ perception. Further, an interesting proposal on their research was to include expert surveys and expert panels to estimate the appropriate weighting.
As presented by Heinzerling et al. (2013), an ideal index should have a validation between subjective and objective data, or objective with a set of criteria, and combine them as a single number. First, it is important to establish the stage of the project to estimate the extent of it. For example, if the project is on the design stage, no on-site measurements or surveys will be considered as part of the parameters, and it will only include physical building characteristics as geometry, context, systems components, and material, however, if the building is in the operational stage, all of them should be considered for the index (Rohde et al., 2019). Further, Candido et al. (2015) have raised concerns on considering the subjective information to get user satisfaction within a tool, even though is very valuable information, as it can be too subjective and contain bias.
4. Design standards and windowsBefore the building code was launched, IEQ factors were not among the main priorities for design. The Better Apartments Design Standards (DELWP, 2016) specify minimum performance for IEQ in the design and construction of social houses in Victoria (Department of Health and Human Services, 2020). As windows have been identified as key elements controlling IEQ in the absence of active systems, a thorough analysis of the design standards related to window configuration is presented in this section.
The design standard recommends orienting the windows facing north, however, that has not been demonstrated to be the best orientation for all situations. For instance, as it was mentioned by Galassi and Madlener (2017), even though the majority of the residents would prefer a warmer environment in winter, there are still others that may be uncomfortable in that expected temperature. This means that different windows types should be recommended for different orientations to perform properly, as suggested by Amaral et al. (2016), instead of promoting north orientation as a general rule.
Cross-ventilation is encouraged by the design standards and it is required that at least 40% of the units in an apartment should have cross ventilation, but there is no mention about minimum window size (DELWP, 2016). The window’s size can be calculated by the requirement on the NCC where it says that 5% of the window-to-floor ratio (WFR) needs to be opening for ventilation purposes (Commonwealth of Australia and the States and Territories, 2020). However, 60% of the units are still

931
Reviewing indoor environmental quality of high-rise social housing
going to be single-sided ventilated with 5% WFR without an adequate level of ventilation. Also, as it is mentioned by Fung and Lee (2014) if single-sided ventilation can be demonstrated to have a better ventilation rate than cross-ventilation, it should be allowed to break the restriction of the minimum 40% of units with cross-ventilation after showing a proper ventilation assessment.
Similarly, natural light is also promoted by the design standards but only the NCC provides a relation with windows’ sizes by suggesting a minimum of 10% of the WFR. The main problem is that, as it was shown in section 2.3, the DA is going to be very different according to the orientation of the window, indicating that a better approach would be a specific window size according to the orientation. Further, considering that social housing apartments will have the minimum ceiling height to maximize the yield, and following the relation of the height and depth provided by the design standards, the average maximum depth of the rooms is going to be between 6m to 9m. Thus, following the recommendations from Acosta et al. (2016), 20% WWR would be appropriate for daylight to reach 6m for a south-facing unit, but a much bigger relation would be needed for rooms that are between 6m to 9m deep. It is arguable if WWR and WFR are the best metrics, in terms of window sizing, as a unit with a very deep but narrow floor plate would have a very big window if WFR is followed, while it would be a very small window if WWR is used. Similarly, the opposite would occur with a very wide but shallow apartment.
In terms of acoustics, the design standards suggested a maximum noise level in bedrooms of 35dB(A) at nighttime, measured with windows closed. However, as discussed in the acoustic section, there are still some minor issues causing sleep disturbance in that range. It was also highlighted that maintaining low noise levels and good ventilation rates is challenging, but considering that social housing relies on natural ventilation, it should be considered to assess acoustic conditions with open windows, as suggested by Buratti (2002). This demonstrates that the design standards and guides have inadequately addressed the acoustical requirement, especially for passive strategies.
5. Conclusion and further researchThe most relevant factors impacting the IEQ in social housing and the interrelationships between them were reviewed and presented. Uncomfortable cross-seasonal temperatures, poor ventilation rates, visual discomfort, and noise exposure, are indoor conditions commonly seen in social houses as a consequence of poor building characteristics and, particularly, by the type, size, and configuration of windows. These conditions are exacerbated in social housings, particularly in high-rise buildings, as they are usually located in areas with higher air pollution, closer to the source of traffic noise and the building configuration limiting the ventilation mode. Further, their residents are many times more vulnerable, as they can be in a big percentage formed by elderly and sick groups. Most of the reviewed literature on windows and IEQ, do not adopt an integrated approach for performance assessment, and many times the literature provides contradicting results. Furthermore, there are limited researches on IEQ of social housing in the Australian context and even less on a holistic approach in the local context of Victoria. The next stage of the study will specifically assess the interaction of IEQ factors in high-rise social housing through single-sided windows, to provide the ideal type of windows for ideal performance and healthy indoor environment.
References Acosta, I., Campano, M. Á. and Molina, J. F. (2016) Window design in architecture: Analysis of energy savings for
lighting and visual comfort in residential spaces, Applied Energy, 168, 493-506.

932
Felipe Jara Baeza, Priyadarsini Rajagopalan and Mary Myla Andamon
Aflaki, A., Mahyuddin, N. and Baharum, M. R. (2016) The influence of single-sided ventilation towards the indoor thermal performance of high-rise residential building: A field study, Energy and Buildings, 126, 146-158.
Amaral, A. R., Rodrigues, E., Gaspar, A. R. and Gomes, Á. (2016) A thermal performance parametric study of window type, orientation, size and shadowing effect, Sustainable Cities and Society, 26, 456-465.
Andargie, M. S., Touchie, M., apos and Brien, W. (2019) A review of factors affecting occupant comfort in multi-unit residential buildings, Building and Environment, 160, 106182.
Andersen, R. V., Toftum, J., Andersen, K. K. and Olesen, B. W. (2009) Survey of occupant behaviour and control of indoor environment in Danish dwellings, Energy and Buildings, 41(1), 11-16.
ASHRAE (2017) ANSI/ASHRAE Standard 55-2017: Thermal Environmental Conditions for Human Occupancy, American Society of Heating, Refrigerating Air-Conditioning, Engineers (ASHRAE), Atlanta. GA, 66.
Baker, E., Lester, L. H., Bentley, R. and Beer, A. (2016) Poor housing quality: Prevalence and health effects, J Prev Interv Community, 44(4), 219-232.
Baker, E., Mason, K., Bentley, R. and Mallett, S. (2014) Exploring the Bi-directional Relationship between Health and Housing in Australia, Urban Policy and Research, 32(1), 71-84.
Barnett, G., Beaty, M., Chen, D., McFallan, S., Meyers, J., Nguyen, M., Ren, Z., Spinks, A. and Wang, X. (2013) Pathways to climate adapted and healthy low income housing, ed., National Climate Change Adaptation Research Facility Gold Coast.
Boubekri, M., Hull, R. B. and Boyer, L. L. (1991) Impact of window size and sunlight penetration on office workers' mood and satisfaction: A novel way of assessing sunlight, Environment and Behavior, 23(4), 474-493.
Boubekri, M. and Lee, J. (2017) A comparison of four daylighting metrics in assessing the daylighting performance of three shading systems, Journal of Green Building, 12(3), 39-53.
Brager, G., Paliaga, G. and De Dear, R. (2004) Operable windows, personal control and occupant comfort, ASHRAE Transactions, 110 (2), 17–35.
Buratti, C. (2002) Indoor noise reduction index with open window, Applied Acoustics, 63(4), 431-451. Buratti, C. (2006) Indoor Noise Reduction Index with an open window (Part II), Applied Acoustics, 67(5), 383-401. Burholt, V. and Windle, G. (2006) Keeping warm? Self-reported housing and home energy efficiency factors
impacting on older people heating homes in North Wales, Energy Policy, 34(10), 1198-1208. Candido, C., Kim, J., de Dear, R. and Thomas, L. (2015) BOSSA: a multidimensional post-occupancy evaluation tool,
Building Research & Information, 44(2), 214-228. Catalina, T. and Iordache, V. (2012) IEQ assessment on schools in the design stage, Building and Environment, 49,
129-140.Chou, P.-C., Chiang, C.-M., Li, Y.-Y., Lee, C.-Y. and Chang, K.-F. (2008) Natural Ventilation Efficiency in a Bedroom
with a Central-Pivoting Window, Indoor and Built Environment, 17(2), 164-172. Collins, K. J. (1986) LOW INDOOR TEMPERATURES AND MORBIDITY IN THE ELDERLY, Age Ageing, 15(4), 212-220. Commonwealth of Australia and the States and Territories (2020) NCC 2019 Volume One Amendment 1, Australian
Building Codes Board. Curado, A., Freitas, V. P. d. and Ramos, N. M. M. (2015) Variability Assessment of Thermal Comfort in a Retrofitted
Social Housing Neighborhood Based on “In Situ” Measurements, Energy Procedia, 78, 2790-2795. Darula, S. and Kittler, R. (2018) The Window Size in Residential House Facades After the Current and New CEN
Standard,2018 VII. Lighting Conference of the Visegrad Countries (Lumen V4), IEEE, 1-5. Davidson, P., Bradbury, B., Wong, M. and Hill, T. (2020) Poverty in Australia 2020: Part 1, Overview,Poverty in
Australia, Australian Council of Social Service and UNSW Sydney. DELWP, Department of Environment,, Land,, Water & Planning. State of Victoria (2016) Better Apartments Design
Standards, 40. Department of Health and Human Services, State Government of Victoria (2020) Public housing redevelopment.
Available from: <https://www.housing.vic.gov.au/public-housing-redevelopment> (accessed 25/06/2020). Diaz Lozano Patiño, E., Vakalis, D., Touchie, M., Tzekova, E. and Siegel, J. A. (2018) Thermal comfort in multi-unit
social housing buildings, Building and Environment, 144, 230-237. Domański, H., Living, E. F. f. t. I. o. and Conditions, W. (2006) First European quality of life survey: social dimensions
of housing, ed., European Foundation for the Improvement of Living and Working Conditions.

933
Reviewing indoor environmental quality of high-rise social housing.
Domínguez, S., Sendra, J. J., León, A. L. and Esquivias, P. M. (2012) Towards energy demand reduction in social housing buildings: Envelope system optimization strategies, Energies, 5(7), 2263-2287.
Elshafei, G., Negm, A., Bady, M., Suzuki, M. and Ibrahim, M. G. (2017) Numerical and experimental investigations of the impacts of window parameters on indoor natural ventilation in a residential building, Energy and Buildings, 141, 321-332.
Evola, G. and Popov, V. (2006) Computational analysis of wind driven natural ventilation in buildings, Energy and Buildings, 38(5), 491-501.
Favarolo, P. A. and Manz, H. (2005) Temperature-driven single-sided ventilation through a large rectangular opening, Building and Environment, 40(5), 689-699.
Flanagan, K., Martin, C., Jacobs, K. and Lawson, J. (2019) A conceptual analysis of social housing as infrastructure, AHURI
Frontczak, M. and Wargocki, P. (2011) Literature survey on how different factors influence human comfort in indoor environments, Building and Environment, 46(4), 922-937.
Fung, Y. W. and Lee, W. L. (2014) Identifying the most influential parameter affecting natural ventilation performance in high-rise high-density residential buildings, Indoor and Built Environment, 24(6), 803-812.
Galassi, V. and Madlener, R. (2017) The Role of Environmental Concern and Comfort Expectations in Energy Retrofit Decisions, Ecological Economics, 141, 53-65.
Gao, C. F. and Lee, W. L. (2011) Evaluating the influence of openings configuration on natural ventilation performance of residential units in Hong Kong, Building and Environment, 46(4), 961-969.
Habibi, S. (2019) Improving building envelope performance with respect to thermal, sound insulation, and lighting: a case study, Building Acoustics, 26(4), 243-262.
Haddad, S., Pignatta, G., Paolini, R., Synnefa, A. and Santamouris, M. (2019) An extensive study on the relationship between energy use, indoor thermal comfort, and health in social housing: the case of the New South Wales, Australia, IOP Conference Series: Materials Science and Engineering, 609, 042067.
Halonen, L., Tetri, E. and Bhusal, P. (2012) Energy efficient electric lighting for buildings - Project summary Report,IEA International Energy Agency ECBCS Energy Conservation in Buildings and Community Systems.
Hassan, M. A., Guirguis, N. M., Shaalan, M. R. and El-Shazly, K. M. (2007) Investigation of effects of window combinations on ventilation characteristics for thermal comfort in buildings, Desalination, 209(1), 251-260.
Heinzerling, D., Schiavon, S., Webster, T. and Arens, E. (2013) Indoor environmental quality assessment models: A literature review and a proposed weighting and classification scheme, Building and Environment, 70, 210-222.
Heiselberg, P., Svidt, K. and Nielsen, P. V. (2001) Characteristics of airflow from open windows, Building and Environment, 36(7), 859-869.
Hu, S., Rajamani, R. and Yu, X. (2013) Directional cancellation of acoustic noise for home window applications, Applied Acoustics, 74(3), 467-477.
Humphreys, M. A. (2005) Quantifying occupant comfort: are combined indices of the indoor environment practicable?, Building Research & Information: Building Performance Evaluation, 33(4), 317-325.
Kolokotsa, D. and Santamouris, M. (2015) Review of the indoor environmental quality and energy consumption studies for low income households in Europe, Sci Total Environ, 536, 316-330.
Koppe, C., Sari Kovats, R., Menne, B., Jendritzky, G., World Health Organization. Regional Office for, E., London School of, H., Tropical, M., European Commission. Energy, E., Sustainable, D. and Deutscher, W. (2004) Heat- waves : risks and responses, Copenhagen : WHO Regional Office for Europe.
Lam, B., Shi, C., Shi, D. and Gan, W.-S. (2018) Active control of sound through full-sized open windows, Building and Environment, 141, 16-27.
Locher, B., Piquerez, A., Habermacher, M., Ragettli, M., Roosli, M., Brink, M., Cajochen, C., Vienneau, D., Foraster, M., Muller, U. and Wunderli, J. M. (2018) Differences between Outdoor and Indoor Sound Levels for Open, Tilted, and Closed Windows, Int J Environ Res Public Health, 15(1).
Marino, C., Nucara, A., Peri, G., Pietrafesa, M., Pudano, A. and Rizzo, G. (2015) An MAS-based subjective model for indoor adaptive thermal comfort, Science and Technology for the Built Environment, 21(2), 114-125.
McNelis, S. and Reynolds, A. (2001) Creating better futures for residents of high-rise public housing in Melbourne, Ecumenical Housing.

934
Felipe Jara Baeza, Priyadarsini Rajagopalan and Mary Myla Andamon
Meek, C. and Wymelenberg, K. V. D. (2014) Daylighting and Integrated Lighting Design, ed., Taylor & Francis Group, London, UNITED KINGDOM.
Mercatelli, L., Sansoni, P. and Farini, A. (2015) Sustainable indoor lighting, ed., Springer. Mui, K. W., Tsang, T. W., Wong, L. T. and William Yu, Y. P. (2018) Evaluation of an indoor environmental quality model
for very small residential units, Indoor and Built Environment, 28(4), 470-478. Naticchia, B. and Carbonari, A. (2007) Feasibility analysis of an active technology to improve acoustic comfort in
buildings, Building and Environment, 42(7), 2785-2796. Nedhal, A.-T., Sharifah Fairuz Syed, F. and Adel, A. (2016) Relationship between Window-to-Floor Area Ratio and
Single-Point Daylight Factor in Varied Residential Rooms in Malaysia, Indian Journal of Science and Technology, 9(33).
Nurzynski, J. (2018) New Acoustic Classification Scheme for Residential Buildings in Poland,2018 Joint Conference- Acoustics, IEEE, 1-4.
Öhrström, E. (2004) Longitudinal surveys on effects of changes in road traffic noise—annoyance, activity disturbances, and psycho-social well-being, J Acoust Soc Am, 115(2), 719-729.
Persson, M.-L., Roos, A. and Wall, M. (2006) Influence of window size on the energy balance of low energy houses, Energy and Buildings, 38(3), 181-188.
Pokhrel, M. K., Anderson, T. N. and Lie, T. T. (2020) The effect of wind on the convective heat transfer from the floor of single-sided naturally ventilated cubical enclosures, Architectural Science Review, 1-8.
Prakash, D. and Ravikumar, P. (2015) Analysis of thermal comfort and indoor air flow characteristics for a residential building room under generalized window opening position at the adjacent walls, International Journal of Sustainable Built Environment, 4(1), 42-57.
Pujol, S., Berthillier, M., Defrance, J., Lardiès, J., Petit, R., Houot, H., Levain, J.-P., Masselot, C. and Mauny, F. (2012) Urban ambient outdoor and indoor noise exposure at home: A population-based study on schoolchildren, Applied Acoustics, 73(8), 741-750.
Raynor, K., Pert, A., Bentley, B. and Crawford, R. (2020) Investing in Social Housing During a Pandemic. Available from: The University of Melbourne <https://pursuit.unimelb.edu.au/articles/investing-in-social-housing-during- a-pandemic> (accessed 15/07/2020).
Rohde, L., Steen Larsen, T., Jensen, R. L., Larsen, O. K., Jønsson, K. T. and Loukou, E. (2019) Determining indoor environmental criteria weights through expert panels and surveys, Building Research & Information, 48(4), 415- 428.
Simons, E., Curtin-Brosnan, J., Buckley, T., Breysse, P. and Eggleston, P. A. (2007) Indoor environmental differences between inner city and suburban homes of children with asthma, Journal of Urban Health, 84(4), 577-590.
Smith, D. S., Wood, J. B. and Mackenzie, R. (2006) Housing and Sound Insulation: Improving Existing Attached Dwellings and Designing for Conversions, ed., Arcamedia.
Toftum, J. (2004) Air movement – good or bad?, Indoor Air, 14(s7), 40-45. Tong, Y. G. and Tang, S.-k. (2017) Acoustical Benefits of Plenum Window as Facade Device – A Parametric Study,
MATEC Web of Conferences, 103. Vakalis, D., Touchie, M., Tzekova, E., MacLean, H. L. and Siegel, J. A. (2019) Indoor environmental quality perceptions
of social housing residents, Building and Environment, 150, 135-143. Willand, N., Ridley, I. and Pears, A. (2016) Relationship of thermal performance rating, summer indoor temperatures
and cooling energy use in 107 homes in Melbourne, Australia, Energy and Buildings, 113, 159-168. Wong, S. K., Wai-Chung Lai, L., Ho, D. C., Chau, K. W., Lo-Kuen Lam, C. and Hung-Fai Ng, C. (2009) Sick building
syndrome and perceived indoor environmental quality: A survey of apartment buildings in Hong Kong, Habitat Int, 33(4), 463-471.
World Health Organization (2011) Burden of disease from environmental noise: Quantification of healthy life years lost in Europe, ed., World Health Organization. Regional Office for Europe.
Zota, A., Adamkiewicz, G., Levy, J. I. and Spengler, J. D. (2005) Ventilation in public housing: implications for indoor nitrogen dioxide concentrations, Indoor Air, 15(6), 393-401.

935
The 54th International Conference of the Architectural Science Association (ANZAScA) 2020.
Rewind on imagining future cities through drama and design
Susan J. Wake Unitec NZ Ltd, Auckland, New Zealand
Abstract: It is asserted that people in first world countries have become consumed by ‘things’ and ‘wants’, rather than ‘needs.’ This mindset has been challenged by the Covid-19 pandemic, as we have experienced a reduced existence from ‘normal’, without travel, shopping malls, restaurants/cafes, sport, social gatherings, libraries, pools and, especially for children, playgrounds. These ‘things’ have turned out to be ‘non-essential’ as people’s safety is prioritized, which has led to some creative alternatives for play and amusement.
As we emerge into a post-Covid-19 alert level world, this paper proposes that we need to reconsider what children ‘need’ from their city, given that many public amenities were recently off-limits, as unsafe. It does this by re-visiting a recent design project that focused on using children’s imagined ideas for improving future Auckland, generated through drama. Following a description of the performance- art project, which involved local schoolchildren, and an outline of the data collection process, the paper re-evaluates the data and its interpretation into design moves, that were done by a Masters student.
Critiquing a previous project, in light of new information, highlights the importance of designing with flexibility and ‘use affordance’ when creating enduring and sustainable public spaces that capture the imagination of children.
Keywords: children’s participation, city design, drama in education, imagination
1. IntroductionNever has the saying ‘times change’ been more true than in 2020. Back in 2017, sixteen 9-10 year-olds participated in a drama project through their school and a visiting performance artist, which was presented during the Auckland Fringe Arts Festival that year. Called ‘Lookout’, it was unique in being a one-on-one conversation between each child, standing in a high city vantage point with an adult stranger and sharing their perspectives of the city, past, present and future.
The performance used material recorded during the preparation workshops as a cue, followed by spontaneous conversation. It embodied feelings, memories, disappointments & hopes of the intergenerational pairs of participants. It was also coloured by the events of the time. For example, this was a time of widespread media reports about the Auckland housing crisis with its spiraling prices and plummeting availability due to immigration and rural decline. The children mirrored these concerns during the focus groups that we held, soon after the performances concluded. Of interest, within this
Imaginable Futures: Design Thinking, and the Scientific Method. 54th International Conference of the Architectural Science Association 2020, Ali Ghaffarianhoseini, et al (eds), pp. 935–945. © 2020 and published by the Architectural Science Association (ANZAScA).

936
Susan J. Wake
paper, is how such valuable information, gathered from children, can be used productively within a design process, to create public spaces and landscapes that are engaging and enduring for children. Further, how can the process ensure design robustness in the face of world-wide health and safety emergencies as has occurred in 2020 as a result of the global Covid-19 pandemic? It is proposed that central to this is a combination of deep listening and understanding what children are communicating, alongside application of ‘use affordance’, in endeavoring to create places that meet the needs of children in a flexible and continuous way. In 2020, due to this pandemic, the reliability of spaces and places provided to children (eg schools, playgrounds, libraries, swimming activities) has been jeopardized due to closures resulting from different levels of ‘Lockdown’ for extended periods of time, both in Auckland and across large parts of the world. This is acknowledged as one of many contributors to children’s increased stress and suffering as a result of the pandemic (Gill, 2020b).
2. Literature ReviewIn this section the capability of children as design contributors within the environments they inhabit is established. The value of nature and natural landscapes and materials in children’s lives will be confirmed. Affordance theory will be explained and the role of drama as a vehicle for daylighting issues of identity, climate change, equality and generally enabling a process of sharing stories, will be addressed. Finally, consideration of the effect of the Covid-19 pandemic on children will bring this discussion back to how incorporating stronger affordance into the creation of children’s environments could help in building greater resilience in the face of potentially rapidly changing conditions. This provides background to the critique of a design based on children’s ideas for improving their city.
2.1. Design Capability
It has been established as a right through the UN Convention on the Rights of the Child (UNHCHR, 1989) that children should have a say in matters that affect them, for example the design of their environments. Further, it has been established as a reality through the new social studies of childhood that children are competent decision-makers who can play an active role in shaping their environment, rather than being seen as passive order-takers (Holloway and Valentine, 2000). Under the banner of UNICEF, the ‘Child Friendly Cities Initiative’ (CFC) has, over the last decade or so, taken on the role of setting out steps for cities to take to ensure their young people feel welcome and involved rather than marginalised and frustrated (see www.childfriendlycities.org). Despite this, children are still often believed to be ‘out of place’ in urban environments and are therefore frequently marginalised from contributing meaningfully in city design and functioning (Christensen et al., 2017). In addition, as Gill (2020a) points out, there are two issues children need both places to go and a way to get there.
Children’s environments researchers in the UK have defined consultation as seeking opinions on design with intention to take these into consideration, while co-design involves children actively participating in the design process - being hands-on with research, modelling and decision-making, within their abilities (Parnell, 2014). In the case of the project being critiqued here, the input of children was consultative only. However, as pointed out by Kraftl (2020), children already participate in shaping the urban environment through their active engagement as place- and community-builders; since they rapidly build a knowledge of routes, facilities, opportunities and relationships with fellow inhabitants in

937
Rewind on imagining future cities through drama and design
their neighbourhoods through their everyday lives and schooling. In this way, Kraftl (2020) asserts, it is important to think beyond play (eg playgrounds) and independent mobility (the extent to which children can move independently – considered to have diminished since the 1970s), since playgrounds can stereotype activity and are often burdened with tension over what ages are catered for. Rather, he suggests, designing places that foster intergenerational connections could result in vibrant, playful, multifunctional urban spaces.
2.2. Affordance theory & the role of nature in children’s lives
Exposure to nature and ‘green space’ is increasingly regarded as essential for ‘wellbeing’ (Souter-Brown, 2015). With children it is often (uneasily) proposed as a prerequisite to the development of caring or empathy for the environment, which is, according to Chawla and Cushing (2007), a precursor to development of pro-environmental behaviours. Much has been written and said about the lamentable loss of time and freedom to explore ‘wild’ nature for First World children today (Louv, 2005), although a recent study by Novotny et al. (2020) indicates that nature experiences of the contemporary test group of children were significantly increased from those given the same questionnaire 120 years previously. What was known about was different but modern-day children had greater exposure due to recreation time and field trips, compared to the children of the past, who had greater understanding of traditional farming methods of the early 20th century.
Providing some relief within a litany of negatives about the prospects of youth growing up in concrete-dominated, device-filled urban situations is the suggestion that length of time exposed to nature is less important than how it is spent. This connects well with Heft’s (1988) proposal that the most important aspect is not what the environment is, but how it functions. Using Gibson’s original concept of affordance, which advocated functionality within design, Heft looked at children’s environments and proposed that affordability refers to the multiplicity of uses for any single thing within an environment, with the intent being to design for flexible use. For example, a swing has limited affordability while a tree has high affordability since it affords unlimited opportunities for play. The more prescriptive a play environment is the less affordances it has and the potentially less value it therefore has to users. Under this definition, strongly nature-based environments will have greater affordance since there is the possibility of multiple ways of use and engagement. This, however, still depends on the open-endedness of the design.
2.3. Performance art as a method of participation in design
There has been much written about the pros and cons of different methods to enable children to participate meaningfully in a design process. Since Hart presented his ‘ladder of children’s participation’ (Hart, 1997) there has been stronger awareness of examples of ‘non-participation’ such as ‘tokenism’, ‘decoration’ and ‘manipulation’, but ways of involving children in the design process so that they are actively contributing (co-design) rather than just being consulted is still difficult to achieve, often as much due to budget constraints and the considerable time requirements for an authentic process, than to lack of intention by designers. Design charrettes, photo story boards and narrated walkabouts are examples of well-documented methods (Carroll and Witten, 2017; Francis and Lorenzo, 2006; Robbé, 2017).
This paper considers the potential of performance art as a method of children’s participation in design, using the ‘Lookout’ performance in Auckland. To understand the process it is important to

938
Susan J. Wake
explain how the writer of the ‘Lookout’ project, Andy Field, prepped the children for this experience. His particular interest is in creating spaces for sharing, especially putting together unexpected relationships to see how they play out (Field, 2018). In the case of ‘Lookout’ he wanted to give children the tools to interact with adults on their level. This resonates with Kraftl (2020) pointing out the need to include adults and children in participatory processes in order to seek intergenerational urban design solutions. These should be spaces that work for multiple age groups without being prescriptive to very limited age groups, as many playgrounds are, even within the realm of what we consider childhood to cover (usually 0-18years). He also makes the point, as have others, that children have overlapping needs with other demographic groups that make up communities and, therefore, design that works well for them is likely to work well for all.
The workshops held the week before the performances were critical in setting up the conditions that played out during the performances. It led to the children feeling confident and in a position of control when interacting with each adult participant. Warm-up skits got the children doing roleplay and this was played forward and backward in time, allowing the children to imagine the same activity happening in the past and future. Time was also spent looking at overseas examples of urban development so the children were aware of how other cities were implementing ‘greening’ projects. In the process, they thought deeply about their own city, now and in the future and came up with questions to ask the adult participants about their views and interactions with Auckland city.
This type of theatre is known as ‘process theatre’ or ‘pedagogical theatre’, defined as involving trained performers working with non-trained participants (such as school children) to partially or completely develop a piece to perform (Curtis et al., 2014). According to McNaughton (2004) one of the strengths of performance art as a tool for eliciting feelings and ideas is that it immerses actors in their role while, simultaneously, giving them a degree of separation or anonymity. This provides two important criteria of successful participation - deep involvement and understanding of the issues being addressed (immersion) plus a shield created by the ‘mask’ of the character being played that helps draw out inhibitions through creating a comforting ‘distance’.
2.4. Effect of Covid19 pandemic on children’s play and freedom
As Gill (2020b) summarises in his May 14 post, measures to limit spread of Covid-19 are likely to result in children’s physical and mental well-being suffering as they are denied contact with friends, access to playscapes and other recreational activities, reduced medical and educational services, plus increased anxiety over safety and the future. He recommends increasing outdoor activities as both an antidote and safer, since children and outdoors are a natural accompaniment and it appears likely that spread of the virus is lessened outdoors. Connecting with this, Weedy (2020) reports on a Finnish study that indicates improved immune systems, in general, in young children who play on natural groundplane surfaces. Outdoor games that can be played without contact, eg hopscotch are proposed as an alternative to shared playground equipment (O’Neill, 2020), while initiatives such as ‘school streets’ that close streets in front of schools off to vehicles during drop-off and pick-up times, are emerging in the UK as a way of encouraging outdoor play in an unconventional setting (Barnes and Val Martin, 2020).

939
Rewind on imagining future cities through drama and design
3. Method
3.1. Performances
‘Lookout’ involved a conversation between an adult and a child (aged 8-10 years) about the future of their city, while looking out over it from a high vantage point. It was performed over three days with a cast of schoolchildren interacting with one adult theatre-goer each, three times per day. Prior to the performances, the children workshopped their dialogue so that some of it was scripted and recorded on small audio devices held by the theatre-goer and some was ad-libbed. The focus of the performance was a ‘shared dialogue’ between the adult and the child about their city, especially focused on imagining the future - 30, 60 and 90 years ahead, including under conditions caused by a natural disaster, such as may occur due to climate emergency.
3.2. Data collection
The original data collection was May 2017, following the performances occurring in March. Ethics approval was obtained from an approved tertiary institute committee. Sixteen children from an inner- city Auckland primary school took part in the project (12 girls and 4 boys) and they were aged 8-10 years. Two focus groups of eight children each ran for 45 minutes. These asked the children to talk about their experience of the project and provided them with a sheet of warm-up questions that were probed in more detail during the focus groups. Then, to capture the perspective of adult participants, 45 minute interviews were held in person, over the phone or by Skype with 4 parents (who had all participated in ‘Lookout’, although not paired with their own child), the lead teacher during the project and Andy Field, the lead artist and creator. These interviews were audio recorded and transcribed. Data was analysed thematically (Braun and Clarke, 2006) to be used in another project with an environmental education focus.
A further ethics approval for different use of the data was granted in 2018 so that a Masters of Landscape Architecture student could apply it in a ‘research by design’ process (Roggema, 2016) to answer the research question ‘How can an alternative participatory process apply to the design of green spaces for children as Auckland densifies?’ For the purposes of this project, the data was again analysed, this time focusing on design ideas from both the children during the focus groups and the interviewed adults who took part in the Lookout performances.
Most of the design ideas came from the children during the focus groups – see Table 1 below. This was due to the original data collection being for a different purpose. The main theme that came through from the interviews with adults was one of nostalgia. For example, one parent said “I said to her (child-performer), most of these buildings weren’t here when I was a little girl and I’m looking around at the modern buildings and I can’t actually see one that I would pick as my favourite because they don’t mean anything to me. Lots of the buildings that I probably knew from childhood, some of them aren’t there anymore.”
Themes Examples the children mentioned Safer 10 children contributed comments
More lights, cleaner - less broken materials, no smoking, less violence, kids can walk home on their own, subway tunnels, less drunk drivers, less cars.
More environmentally- Different rubbish technology (eg flying), more rubbish bins, less people chucking

940
Susan J. Wake
friendly 16 children contributed comments
inappropriate things on the ground - cleaner, solar powered cars, no smoking, no traffic.
More fun/play 13 children contributed comments
More playgrounds and parks, more activities for kids, water parks, more for kids, theme parks and carnivals, Cooler playgrounds, lots of parks and greenery, less electronics, more silly/funny things, more arts & graffiti, more trampoline parks & pools.
Mobility 11 children contributed comments
More bike and walking paths, flying trams, technology, more bikes.
Greener/more nature 15 children contributed comments
Less ugly buildings, more colourful buildings and not square (interesting shapes), more parks and trees, cleaner places, rivers/parks/more nature, less building demolition, nicer buildings.
More inclusive 16 children contributed comments
Nicer people, more animal friendly places, so that you can buy the food you need, eco- friendly buildings for $20, less expensive housing, homeless shelters, less expensive public transport, more libraries, public concerts & stuff people don’t have to pay for.
Table 1: Children’s suggestions for improving Auckland City from the ‘Lookout’ Project focus groups (Source: Wake & Zhan, 2019)
3.3. Design
The site chosen was a neglected reserve in the Auckland Central suburb of Roskill South. This area is currently undergoing large-scale redevelopment by Kainga Ora (ex-Housing NZ) to replace 1940-1960 housing stock with new, densified social housing dwellings on a much smaller land/garden footprint. As a result, there is likely to be higher demand on public open spaces and some remediation work on the reserve was already planned through the local Board and Auckland Council. The focus of the student’s design was additional to this and concentrated on providing more activities for children and a place for community gatherings and growing food (see Fig 1). The links between key themes derived from the data and the related design moves, are charted in Table 2.
Theme Design intervention
Historic/ Inclusive
At the main entrance an ex-State house will be renovated to provide a nostalgic glimpse of what was once a widespread view in this neighbourhood, and fast disappearing. This will serve as a community hub, with book share library & community fridge for sharing surplus food. A place for community groups & meetings.
Historic/ Inclusive
At the rear of the ex-State house community centre, garden will be set up like the vernacular ‘kiwi backyard’ of old. A concrete path to the washing line and community raised gardens for vegetables and an orchard will encourage different ages, abilities & cultures to interact and grow and share vegetables & fruit important in their culture. A traditional mara kai (Māori food garden) will be included, for growing kūmāra (sweet potato). This will also promote wellness.
Historic/ cultural
Concrete pipes from the stream daylighting project will be mounted end on end on the highest point of the reserve and modified to create a giant periscope from which the nearby extinct volcano, Puketapāpa can be viewed (otherwise unable to be seen from the site). This maunga (mountain) is a sacred place to Māori, as an ancient Pā site (fortified village).
Play/fun Other stacks of recycled concrete pipes will be stacked up and fitted with slides - in tandem, to allow for races. Tandem zigzagging wheel tracks will snake down the hill for racing on scooters, bikes etc.
Inclusive/ Cultural/fun
All the concrete ‘towers’ will be colourfully painted in street art style by local artists to represent the many different cultures in Mt Roskill. This will also be carried out with smaller sections of the pipe along the street in a route to the local primary school to add colour, fun and meaning.
Inclusive/ Cultural/fun
Seats have been designed, also out of recycled concrete pipes. These will be situated within the reserve for relaxing and socialising. They will also be painted as above.
Table 2: Design ideas - connection to the themes from the ‘Lookout’ data. (Source: Wake & Zhan, 2019)

941
Rewind on imagining future cities through drama and design
Figure 1: Activity & Cultural Zone perspective showing periscope tower (left rear) to view Mt Roskill, racing slides & wheel tracks (right) and daylighted stream with opportunities for exploration and engagement. (Source: Wake & Zhan, 2019)
4. Critique and discussionLooking at Table 1, only two of the six themes are strongly represented in the resulting design (see Table 2 and Fig 1 above). These are ‘More fun/play’ and ‘More inclusive’. These manifest as the tandem slides, tandem tracks for wheels and the viewing periscope as the ‘play elements’ and the community hub (repurposed ex-state house) and garden as the ‘inclusive element’. According to Table 2 this is also ‘Historic’. Unfortunately, none of these elements would be usable during a pandemic such as 2020 has seen (except perhaps harvesting fruit from the orchard). Looking at the site plan in Figure 3,
Figure 3: Concept plan for Freeland Reserve. (W. Zhan). Figure 4: closed playgrounds

942
Susan J. Wake
the picnic and chillout zone contain the only possible ‘allowable’ items in this design, and even this has elements that would be deemed ‘unsafe’. All over Auckland, and the world, community buildings have been closed and playgrounds have been roped off with uninviting signs during Covid-19 ‘lockdowns’ (see Figure 4). So, what have children and their families been doing? Watching sunrises, exploring waterways, walking dogs and biking – to name a few (see Figures 5 and 6).
Figure 5: Outdoor activities during ‘lockdown’, Sunrise watching, exploring waterways (Te Auaunga), walking
I believe this highlights that while playground design appears to be the ‘go-to’ response in order to create child-friendly and family-friendly environments, they are both a hugely expensive asset to install and maintain, as well as being vulnerable to closure during times of health alerts. In addition, as Kraftl (2020) points out, they are not actually very child- or family-friendly if they create tensions over ownership between differently-aged children or, as in my personal experience, leave parents sitting uselessly bored on the sidelines, at best pushing a swing. Engagement of the whole family would be more fulfilling, yet many playground pieces are ‘one use only’, which, according to Heft (1988), equates with low affordance.
Figure 6: Outdoor activities during ‘lockdown’ – pump track biking and treeclimbing (Māra Hupara) (Author’s own photos)

943
Rewind on imagining future cities through drama and design
It is unsurprising, given the prevalence and acceptability of playgrounds, that a novice designer would turn to playground-type equipment (albeit bespoke) in interpreting some quite rich data about what children think about the design of their city. These children had recently been through an immersive drama experience, following on from well-crafted preparation workshops led by skilful facilitators. The range of ideas they had were wide (see Table 1) and could have been explored more fully rather than narrowing in on a few broad themes. For example, the theme of safety was worthy of greater attention. In their research, Carroll et al.(2015) identified this as a key issue for children as they move around the city, with children being wary of drunks, smokers and large dogs. This also connects with Gill (2020a), who emphasises the importance of safe mobility for children. The design also focuses on cultural/heritage aspects, for example, the retention of a piece of Kiwiana (the ex-State house as a community hub) for nostalgia reasons (as put forward by middle class parents living more centrally). However, this extrapolation may fall flat due to lack of relevance to future inhabitants, many of whom will be non-New Zealand born.
Returning to consider what kind of design may have been more resilient for the site under consideration, as the selection of ‘Covid-activity’ photos show, most activities were strongly nature- based and low on required inputs. This, however, can be deceptive since recent stream restoration and daylighting projects in Auckland, such as La Rosa in Green Bay and Te Auaunga (Oakley Creek) between Sandringham Rd and Richardson Rd (Underwood and Wesley Reserves) had large budgets ($10 million+ for the latter). But the gains are many-fold – creating green and grey infrastructure and enduring outdoor environments for play, learning and exercise or relaxation. Within this space is the Māra Hupara traditional Māori playground made entirely of natural materials, with great flexibility and therefore high affordance. This playground was not closed during Covid-19 lockdown since there is nothing to close – it is fully integrated within its environment. Te Auaunga at Wesley and Underwood Reserves is an exemplar project of water-sensitive environmental design, overlaid with cultural and recreation imperatives (Tom Mansell, pers comm. 2018).
5. ConclusionThe data from the Lookout project provided a range of ideas from the participants on how to improve their city, and these gave the Masters student an intriguing design project . As a method of participation in design it had merit, although, given the most common reason for lack of participation by children in design projects is budget constraints, the process would need some streamlining, as well as training of facilitators. One important difference was the time spent workshopping role play scenarios with the children, which ensured they were invested in their roles and therefore able to converse equally with the adult theatregoers they were paired with. This resonates well with researchers’ recommendations that participation should not become separated into age-based categories. It should be inclusive of all community-members.
The design moves by the Masters student were based on interpretation of the data in a closed rather than open way. This is not to say it was wrong, but it could have focused on greater affordance, which would have made it more resilient in the face of a pandemic. Given the stealth and speed of Covid-19’s

944
Susan J. Wake
advance in 2020, coupled with its persistence, the recommendation of O’Neill (2020) that we rethink provision of outdoor facilities for recreation, seems sound. Some recently designed public spaces, eg Māra Hupara and restoration of Te Auaunga, are successfully leading the way in this regard and should be seen as models for future water sensitive urban planning (see Figures 7 and 8). Extending the opportunity for community involvement, eg through gardening and local waterways stewardship within our public spaces are examples that could provide huge value for all and even incorporate some of the children’s more inventive ideas for their city, eg rubbish management, introducing more colour and varied shapes. Providing amenities children can reach safely and have high affordance and green credentials (ie nature-based) are more likely to be pandemic-proof as well as restorative. This is an area of great scope and importance as we move into a world that is more fragile than ever, yet, could encourage great strength of ideas and engagement.
Figure 7: Te Auaunga at Underwood Reserve. Figure 8: Log maze at Māra Hupara (author’s photos)
References Barnes, A. and Val Martin, M. (2020) How ‘school streets’ could create safer, healthier cities. Available from:
<https://www.childinthecity.org/2020/10/26/how-school-streets-could-create-safer-healthier-cities/> (accessed 27 Oct 2020).
Braun, V. and Clarke, V. (2006) Using thematic analysis in psychology, Qualitative Research in Psychology, 3(2), 77- 101.
Carroll, P. and Witten, K. (2017) Children as urban design consultants: A children's audit of a central city square in Auckland, Aotearoa/New Zealand, in K. Bishop and L. Corkery (eds.), Designing cities with children and young people: Beyond playgrounds and skate parks, Routledge, NY, 105-118.
Carroll, P., Witten, K. and Kearns, R. (2015) Kids in the city: Everyday life in inner-city Auckland, in C. Freeman and P. Tranter (eds.), Space, Landscape, and Environment, Volume 12 of Skelton, T. (ed.-in-chief), Geographies of Children and Young People. , Springer.
Chawla, L. and Cushing, D. F. (2007) Education for strategic environmental behaviour, Environmental Education Research, 13(4), 437-452.
Christensen, P., Hadfield-Hill, S., Horton, J. and Kraftl, P. (2017) Children living in sustainable built environments: New urbanisms, new citizens, ed., Routledge, UK.

945
Rewind on imagining future cities through drama and design.
Curtis, D. J., Howden, M., Curtis, F., McColm, I., Scrine, J., Blomfield, T., Reeve, I. and Ryan, T. (2014) Drama and environment: Joining forces to engage children and young people in environmental education, Australian Journal of Environmental Education, 29(2), 182-201.
Field, A. (2018) Lookout, Performance Research, 23(1), 85-88. Francis, M. and Lorenzo, R. (2006) Children and city design: Proactive process and the 'renewal' of childhood, in C.
Spencer and M. Blades (eds.), Children and their environments, Cambridge University Press, Cambridge, MA, 217-237.
Gill, T. (2020a) Child in the City COVID-19 webinar: “Let’s stay connected”. Available from: <https://www.childinthecity.org/2020/09/23/child-in-the-city-covid-19-webinar-lets-stay-connected/> (accessed 27 Oct 2020).
Gill, T. (2020b) Covid-19 and children: what does the science tell us, and what does this mean as the lockdown is eased? Available from: <https://rethinkingchildhood.com/2020/05/14/covid-19-children-science-lockdown- schools-childcare-outdoor-play/> (accessed 27 Oct 2020).
Hart, R. (1997) Children's participation: The theory and practice of involving young citizens in community development and environmental care, ed., Earthscan, London.
Heft, H. (1988) Affordances of children's environments: A functional approach to environmental description, Children's Environments Quarterly, 5(3), 29-37.
Holloway, S., L. and Valentine, G. (2000) Children's geographies and the new social studies of childhood, in S. L. Holloway and G. Valentine (eds.), Children's geographies: Playing, living, learning, Routledge, London, 272.
Kraftl, P. (2020) Including children and young people in building cities. Available from: <https://medium.com/reframing-childhood-past-and-present/including-children-and-young-people-in-building- cities-3964f0c1c832> (accessed 1 August 2020).
Louv, R. (2005) Last child in the woods: Saving our children from nature-deficit disorder, ed., Algonquin Books, Chapel Hill, North Carolina.
McNaughton, M. J. (2004) Educational drama in the teaching of education for sustainability, Environmental Education Research, 10(2), 139-155.
Novotny, P., Zimova, E., Mazouchova, A. and Sorgo, A. (2020) Are children actually losing contact with nature, or is it that their experiences differ from those of 120 years ago?, Environment and Behaviour, 1-22.
O’Neill, M. (2020) How COVID-19 Is Changing Our Perspective on Playgrounds. Available from: <https://www.architecturaldigest.com/story/covid-19-playground-design> (accessed 27 Oct 2020).
Parnell, R. (2014) Designing with Children - Glossary. Available from: The University of Sheffield and The Leverhulme Trust <http://designingwithchildren.dao.theusefularts.org/glossary> (accessed 29 September 2015).
Robbé, F. (2017) Designing with children: A practitioner's perspective, in K. Bishop and L. Corkery (eds.), Designing cities with children and young people: Beyond playgrounds and skate parks, Routledge, NY, 177-193.
Roggema, R. (2016) Research by design: Proposition for a methodological approach, Urban Science, 1(2), 1-19. Souter-Brown, G. (2015) Landscape and urban design for health and well-being: using healing, sensory, therapeutic
gardens, ed., Routledge, UK. UNHCHR (1989) United Nations Convention on the Rights of the Child. Available from:
<http://www.ohchr.org/EN/ProfessionalInterest/Pages/CRC.aspx> (accessed 24 March 2014). Weedy, S. (2020) Forest-based children’s play yards can quickly boost their immune systems. Available from:
<https://www.childinthecity.org/2020/10/15/forest-based-childrens-play-yards-can-quickly-boost-their- immune- systems/?utm_source=newsletter&utm_medium=email&utm_campaign=Newsletter%20week%202020-42> (accessed 27 Oct 2020).

946
The 54th International Conference of the Architectural Science Association (ANZAScA) 2020
Semi-passive Architecture Facade Design
Pei-Hsien Hsu1 and Hong Cing Tung2
1, 2 Graduate Institute of Architecture, National Chiao Tung University, Hsinchu, Taiwan {phsu1, jack3661mao 2}@arch.nctu.edu.tw
Abstract: “Making architecture smart” is a key issue for contemporary architecture. Previous research in this direction has been mostly focused on the improvement of control systems insides buildings by making them more intelligent. This research, however, takes a different approach. Rather than focusing on the control systems, this research seeks a breakthrough in the designing of building elements. It proposes a design of architectural façade which incorporates a kinetic mechanism based on smart materials. Through the capability of smart materials in sensing and reaction, a prototype of building façade which has the ability to change dynamically is developed to respond to the changing natural environment and to furthermore affect the performance of architecture and conditions of the built environments (e.g. ventilation, shading and lighting). The proposed design also incorporates an electronic-device-based mechanism and, along with the smart material component, jointly forms a dual actuation system, which aims to equip the façade system with the ability to respond to the environment without consuming power for the majority of time while maintaining the ability to react instantly if required.
Keywords: Kinetic building façade; smart façade; double skin façade; smart materials
1. introductionBased on case studies at the early stage of research (De Gracia, Castell, Navarro, Oró, & Cabeza, 2013), this study proposes a new façade design which can simultaneously control the sunlight intake and ventilation of a building, different from other existing models mostly limited to controlling the intake of sunlight only. In addition, this study proposes a dual system with both energy saving and control capabilities. It consists of a mechanism driven by smart materials which does not rely on electronic devices (Doumpioti, 2011). The major goal is to develop a dynamic façade module and assembly mechanism based on mechanical movements. Within the developed module design, there is a shading component and windshield component, linked by a designed mechanism. Generally, the two parts are in a fixed relative angle and position, which may be changed in a short time through a clutch mechanism. Based on this design, a special relationship has been created: a complementary relationship between ventilation and sunlight intake. We used shape material alloy (SMA) as an actuator which responds to temperature changes. The transformation of the actuator causes the façade unit to rotate. As the temperature of the environment rises, the rotation angle of the building skin unit increases, and this makes shading element block the daylight effectively (decrease in the amount of sunlight intake) and at the same time widen the gaps between the upper and lower units, increasing the amount of ventilation per unit area of the building
Imaginable Futures: Design Thinking, and the Scientific Method. 54th International Conference of the Architectural Science Association 2020, Ali Ghaffarianhoseini, et al (eds), pp. 946–955. © 2020 and published by the Architectural Science Association (ANZAScA).

947
Pei-Hsien Hsu and Hong Cing Tung
surface. Therefore, as the temperature is relatively high, the façade can reduce solar radiation into the interior and increase the amount of ventilation, causing the indoor temperature to be in a relatively comfortable range. Conversely, when the temperature is relatively low, the façade can increase sunlight intake and reduce the amount of ventilation, keeping the interior in a relatively warmer temperature range.
2. Research method
2.1 Façade shading system
According to our literature review and case studies, it is found that the most of existing façade designs with dynamic behaviors control the size of opening of the façade to affect both the sunlight and air intake, and there is a proportional and interdependent relationship between the amount of ventilation and the amount of sunlight intake. This proportional relationship results from a change in the size of opening of the façade, corresponding to the change of the natural environment. Such dynamic façade designs, however, lack of positiveness to comfortability of interior of building, and results in low efficiency.
In contrast, the complementary relationship proposed in this study has a relative advantage (Figure 1). The purpose of façade design is to solve the demand of ventilation and shading at the same time. The two environmental factors do not interfere with each other. In this study, the unit structure of the shading elements and the translucent panels (windshield elements) is linked in a fixed angle. Shading elements are on the outer layer. It blocks the sunlight outside and decreases the indoor solar radiation. Translucent panels are on the inner layer. It controls and adjusts the amount of ventilation. The temperature triggers the actuator, SMA, driving each façade units to achieve the goal of reducing the use of electricity.
Figure 1: The design of façade module complementary relationship between
the level of sunlight intake and ventilation
Based on the climate in Taiwan, we propose the following four modes and its switching mechanism (Table 1).
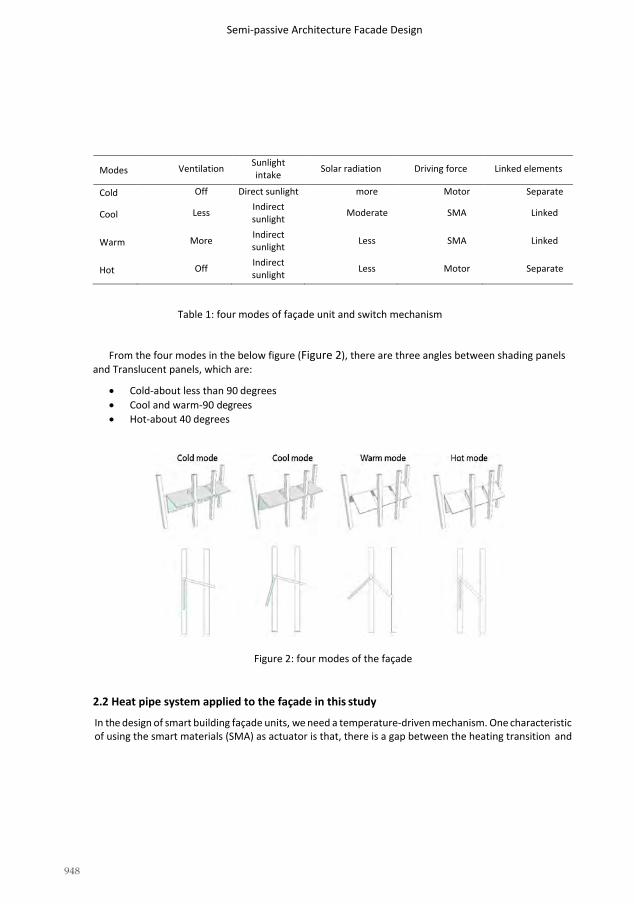
948
Semi-passive Architecture Facade Design
Modes Ventilation Sunlight intake
Solar radiation Driving force Linked elements
Cold Off Direct sunlight more Motor Separate
Cool Less Indirect sunlight
Moderate SMA Linked
Warm More Indirect sunlight Less SMA Linked
Hot Off Indirect sunlight
Less Motor Separate
Table 1: four modes of façade unit and switch mechanism
From the four modes in the below figure (Figure 2), there are three angles between shading panels and Translucent panels, which are:
• Cold-about less than 90 degrees• Cool and warm-90 degrees • Hot-about 40 degrees
Figure 2: four modes of the façade
2.2 Heat pipe system applied to the façade in this study
In the design of smart building façade units, we need a temperature-driven mechanism. One characteristic of using the smart materials (SMA) as actuator is that, there is a gap between the heating transition and

949
Pei-Hsien Hsu and Hong Cing Tung
the cooling transition, is not the same temperature. In the mechanism design, the smart memory alloy is used as the actuator, but temperature needed to initiate the transition can vary. If the driving temperature of the material is set relatively low, the material can be easily driven. Similarly, the temperature necessary for cooling transition is relatively low, which may cause the reverse temperature state of demand to be difficult to achieve.
Based on this problem, this part of research tried to build a heat accumulative mechanism to enable the shading elements to collect solar thermal energy, to obtain a higher temperature than the outside temperature. Then, heat pipes transfer the collected heat energy to the SMA. As a result, heat conduction is the key point of the problem(Burry et al., 2013).
In the thermal conduction part, the heat pipe is adopted. The design work that needs to be handled is the combination relationship between the heat pipe and the façade units, while not conflicting with the heat pipe processing. In addition, there is a dynamic mechanism on the façade units, which can rotate to change the angle of the shading elements. The path of the heat pipe needs to be connected to the fixed structure. Therefore, the heat pipe system needs to have elasticity. To face this problem, the heat pipe is connected to an elastic hose rather than rigid like the adjacent heat pipe. The hose position is placed at the rotating shaft of façade units to reduce the hose deformation.
First of all, in the research of heat pipes, the classification of heat pipes can be categorized into the four types by the internal wick structure, which are sinter, groove, fiber and mesh. Among those types, sinter-type is the best, can be placed at arbitrary angle with high thermal conductivity. However, the cost is relatively high. On the other hand, we also study the gravity heat pipe. The gravity heat pipe is a vertical structure. In the heat pipe, cooler end of the pipe is above hot end of the pipe and liquid flows by gravity from top to bottom. Therefore, we only can adopt vertical or tilted ways. The thermal conduction of this type of heat pipe is unidirectional. With its simple structure, convenient processing and relatively low cost, this gravity heat exchange systems are widely used in industrial emission.
Figure 3: Heat pipe system configuration and assembly in the Smart façade unit

950
Semi-passive Architecture Facade Design
In the selection of heat pipes, gravity-type heat pipes are adopted instead of wick-type heat pipes to provide good processing performance. Although the wick-type heat pipe has good performance in thermal conductivity, it is not easy to manufacture, and there is a big limitation in the bending of the heat pipe. Excessive bending will destroy the wick structure and decrease the thermal conductivity. Therefore, it is difficult to integrate building façade design with heat pipe system. Based on such considerations, "gravity heat pipe" is our main option.
2.3 Smart building façade mechanism: design and Implementation
In the overall design, the heat pipe is arranged on the façade units to absorb the solar energy. In order to match the vapor flow of the heat pipe thermal energy to the blinds, we modified the distance and the number of blinds and then combine it with a gravity heat pipe, by bending it with a manual pipe bender with a minimum diameter of Ø4mm. In production, in order to reduce the weight of smart façade units, the basic structure is almost made by 3D printing. As for shading elements, we design and place the gravity heat pipe on the grooves of façade unit. Because the heat pipe conducts the collected solar energy to the SMA, the SMA spring shrinks and extends as the environmental temperature changes, and then it causes the lower general spring to initiate the overall operation. In the end, the amount of sunlight intake and air intake can be adjusted (Figure 3).
Figure 4: The thermal flow process in heat pipe system and SMA-driven mechanism in a façade unit

951
Pei-Hsien Hsu and Hong Cing Tung
From the path of thermal conduction in heat pipe system, at the rotating shaft of façade units, we increase the flexibility of the mechanism by connecting the heat pipe and a copper-welded tube with a hose. The SMA spring, enclosed inside the copper tube, will reflect the changes in the received Thermal energy. We fixed two hooks at top and below of structure of unit. The shrink force of SMA spring can be balanced between upper SMA spring and lower general spring.
Figure 5: Exploration diagram of a façade unit assembly
Figure 6: Exploration diagram of motor-driven mechanism assembly (left) and Electronic equipment used in façade unit, which is stepper motor, microcontroller unit and stepper motor controller (right)

952
Semi-passive Architecture Facade Design
Figure 8: prototype of smart building façade units Figure 7: Simulating the physic model
Figure 4. Explain the façade unit assembly relationship. There are two driving mechanisms in this smart building façade unit, one is from the energy of the transformation of the SMA spring, as explained in 3-2. The other is from the power of the motor. In the part of the motor, we choose stepper motor because rotating angle can be set arbitrarily. The Translucent panels can be turned off by stepper motor, combined with a clutch to achieve keeping the angle unchanged ( Figure 5).
2.4 Implement process of smart building façade
In the production of the physical unit, we established a 3D digital model on the computer, and then plan the production of form and simulate the smart building façade with fluid dynamics. Finally, Assembly of the components was produced through 3D printing, and then the various components were assembled together by screws and metal locks (Figure 6).
In the follow-up, experimental tests on materials and dynamic mechanisms were carried out. The heat pipe system was laid on the façade unit. Also, the façade unit was equipped with motors and other power mechanisms and wire configuration, Finally, a 2 x 2 movable array unit was built through trial and error. Heating lamps simulated the sunlight temperature to actuate SMA spring (Figure 8).
3. Computational fluid dynamics analysis softwareWe compare the temperature change of the building façade of this research with two common building façade designs by using the computational fluid dynamics (CFD) analysis software (Autodesk CFD Simulation). The two common building façades are the window opening mode and the common double skin façade mode (Figure 7). In the temperature setting, the simulated outdoor environment was set to

953
Pei-Hsien Hsu and Hong Cing Tung
18°C (cool mode) and 28°C (warm mode) as a benchmark for comparison. The wind field was simulated to visually analyze the influence of smart building skin on part air flow (Coussirat et al., 2008).
Figure 9: Diagram of compared models
In order to reduce the influence of solar radiation, thermal conduction between the wall and the ground, also, to make the factor of influence the interior temperature as the external building façade, we simulated a 3-storied building in the CFD mutual model framework setting and take the indoor average temperature on the second floor for comparing the results. To elaborate the framework setting, each floor is a cube of the same space, with an opening on the outer wall, allowing wind to enter smoothly. The top of the space on the third floor will be directly exposed to solar radiation so that it would excessively affect its indoor temperature. For this reason, it was not adopted. At the bottom of the first- floor space, the floor will absorb the heat from the surface of the ground because of its lower temperature, and the wall on the leeward side will be affected by a little wind blowing back, so the first floor is not adopted. We only sampled the second-storied space (the darker part of the picture) to calculate the average temperature in the space (Figure 9).
Figure 10: CFD analysis when outdoor temperature at 18℃ (top) and 28℃(below)

954
Semi-passive Architecture Facade Design
3.1. Result of computational fluid dynamics analysis
This study proposes a smart façade method in the natural ventilation condition and warmer condition (28°C). We can know that general window opening type and the common double skin façade type can facilitate lower indoor temperature to improve indoor comfortability (Figure 10).
This study proposes a smart façade method in the natural ventilation condition and cooler condition (18°C). we can know that general window opening type and the common double skin façade type have no direct help for indoor comfortability and need more follow-up analysis.
Figure 11: comparison of computational fluid dynamics analysis in 18°C and 28°C condition
4. Conclusion and future workThis research proposes a façade design that can control both sunlight intake and ventilation of the building. It has a dual power system and combines the SMA-driven mechanism and electricity-driven mechanism so that this façade skin system consists of energy-saving and control capabilities.

955
Pei-Hsien Hsu and Hong Cing Tung
Computational fluid dynamics analysis and comparison proves that the smart façade method proposed in this study is indeed helpful for indoor comfort when outdoor temperature at 28°C, but has no significant benefit when outdoor temperature at 18°C.
Through the execution of this study, the module of smart building façade can work. The future research will focus on the following parts:
• understand the relationship between different outdoor and indoor temperature by CFD:
We can simulate the CFD in conditions of temperature with a difference of 1°C, and then observe the change of average indoor temperature. Therefore, we can clearly realize the effect of building façade of this research in different temperature conditions.
• Adjust the CFD mutual model framework settings: The building façade in this study has the advantage of a shading system to prevent solar radiation directly into the interior. This factor can be added into other comparative models and expected to gain more accurate indoor average temperature.
• Mechanism design and manufacture: Completeness of manufacture and assembling components can be enhanced. • Connection to the Internet of Things:
The smart building façade can be connected to the Internet of Things platform on the campus in order to send real-time information of the smart façade and can accept commands from the cloud storage to respond. On the concept of smart campus, we can integrate software and hardware network system, and prepare for the cooperation with the building information modeling (BIM).
References Baldinelli, G. (2009). "Double skin façades for warm climate regions: Analysis of a solution with an. integrated movable
shading system." Building and environment 44(6): 1107-1118. Burry, J., F. Salim, M. Williams, S. Anton Nielsen, A. Pena de Leon, K. Sharaidin and M. Burry (2013). "Understanding
heat transfer performance for designing better facades." Coussirat, M., A. Guardo, E. Jou, E. Egusquiza, E. Cuerva and P. Alavedra (2008). "Performance and. influence of
numerical sub-models on the CFD simulation of free and forced convection in double-glazed ventilated façades." Energy and Buildings 40(10): 1781-1789.
De Gracia, A., A. Castell, L. Navarro, E. Oró and L. F. Cabeza (2013). "Numerical modelling of. ventilated facades: A review." Renewable and Sustainable Energy Reviews 22: 539-549.
Doumpioti, C. (2011). Responsive and Autonomous Material Interfaces. Paper presented at the Integration through Computation: Proceedings of the 31st Annual Conference of the Association for Computer Aided Design in Architecture (ACADIA).
Hensen, J., M. Bartak and F. Drkal (2002). "Modeling and simulation of a double-skin facade system." ASHRAE transactions 108(2): 1251-1259.
Khorasani, M. L., J. Burry and M. Salehi (2014). "Thermal performance of patterned facades-Studies on. effects of patterns on the thermal performance of facades."

956
The 54th International Conference of the Architectural Science Association (ANZAScA) 2020
Sentiment analysis on social media for identifying public awareness of type 2 diabetes
Yuezhong Liu1, Rudi Stouffs2 and Yin Leng Theng3 1, 3 Nanyang Technological University, Singapore
{yz.liu1, TYLTheng3}@ntu.edu.sg 2 National University of Singapore, Singapore
Abstract: Many studies have investigated how Type 2 Diabetes Mellitus (T2DM) is impacted by environmental characteristics. However, it is unclear whether the public is aware of this relationship. This paper aims to infer public awareness based on sentiment analysis of environmental characteristics from social media (news) as context-based clues for supporting planners and designers to achieve a health-supportive environment. We apply natural language processing (NLP) techniques to past years’ news (from 1992 to 2020) to understand the public awareness on the relationship between the prevalence of T2DM and environmental characteristics. The results not only verify that the public aware little that prevalence of T2DM correlates with environmental characteristics in Singapore (1% news related to both diabetes and environment), but also present a hypothetical urban design study to demonstrate how this approach can be adapted to identify the health-related urban issues at the early design stage. This study can offer urban planners and designers an innovative design perspective to incorporate residents' health into the design process.
Keywords: Urban design; Sentiment Analysis, Type 2 Diabetes Mellitus, Health-supportive Environment.
1. IntroductionWith the increasing prevalence of Type 2 Diabetes Mellitus (T2DM) among Singapore residents, there is a need to better understand the factors that influence the prevalence of T2DM in the design of a healthy urban environment. The influence of the neighbourhood and environmental characteristics on health including T2DM is increasingly recognised and studied in recent years (Renalds, Smith, & Hale, 2010). Many studies have investigated how the prevalence of T2DM is impacted by environmental characteristics from urban design solutions. However, it is unclear whether the public acknowledges this relationship between environmental characteristics and T2DM. We propose to deduce public awareness of this kind of relationship from sentiment analysis in news as a scalable approach.
In particular, we applied natural language processing (NLP) techniques to past years’ news (opinions from 1992 to 2020) in Singapore to understand the influence of lifestyle choices as impacted by urban design activities on the prevalence of T2DM. By analysing the words used in the opinions and editorials,
Imaginable Futures: Design Thinking, and the Scientific Method. 54th International Conference of the Architectural Science Association 2020, Ali Ghaffarianhoseini, et al (eds), pp. 956–965. © 2020 and published by the Architectural Science Association (ANZAScA).

957
Yuezhong Liu, Rudi Stouffs and Yin Leng Theng
this research extracts the good and bad comments associated with urban design related news associated with the public attitudes and lifestyles as impacted by design activities and correlates these with the annual prevalence of T2DM from public datasets (MOH, 2018). The proposed method includes four steps: 1) Integrate Opinions and Comments News Corpus: Integrating the opinion news from Factiva(https://www.dowjones.com/products/factiva/) and comments extracted by a news web- scraper inJavaScript Object Notation (JSON) format. From these opinions and comments, we identify sentences that describe urban issues, such as food choices, open spaces, mobility or accessibility of transportation. 2)Apply NLP analysis to simplify the news and reviews, and extract and clean root words by using the Natural Language Processing Toolkit (NLTK) tokenizer. Public awareness can be revealed from the sentimentanalysis of each news and review in time series. The multi-class categorization (positive/neutral/negative) of sentiment analysis linked with urban design activities is counted in terms of frequency, location, andtime interval in each year (Liu, 2012). 3) Conduct correlation analysis between the sentiment results from step 2 and the annual prevalence of T2DM to identify the trends of public awareness. The years with aslower rise in diabetes prevalence were the focal point for the correlation analysis process. 4) Ahypothetical urban design case of East Coast 2050 demonstrates how to integrate these influencevariables within the urban design process and visualize the solutions to designers & public.
The remainder of the paper is structured as follows: Section 2 describes the background context, as well as related work. Section 3 presents the proposed data corpus and method. Section 4 illustrates and discusses the sentiment analysis studies between public health and online opinions and comments. Section 5 demonstrates the urban design case study for how to identify health-related urban issues (T2DM) during the design process. Finally, Section 6 summarizes the conclusions and discusses future lines of research.
2. Literature review
2.1. Health-supportive design: Diabetes
Diabetes mellitus (DM) is characterized as a group of metabolic diseases characterized by hyperglycemia resulting from defects in insulin secretion and/or insulin action (American Diabetes Association, 2009). The pathophysiology of T2DM has not been completely elucidated until now, but influencing factors include genetic susceptibility, environmental and behavioural factors such as sedentary lifestyle, nutrition and gut metagenome (Wu, Ding, Tanaka, & Zhang, 2014; Zimmet, Alberti, & Shaw, 2001). A variety of lifestyle factors such as sedentary lifestyle (Zimmet et al., 2001), smoking (Manson, Ajani, Liu, Nathan, & Hennekens, 2000) and alcohol consumption (Cullmann, Hilding, & Östenson, 2012), are of importance to the development of T2DM (Wu et al., 2014). The latest diabetes prevention programs in the United States have demonstrated the efficacy of lifestyle factors interventions that could reduce the risk of progressing from impaired glucose tolerance (IGT) to diabetes by 58%. Hence, with this basic knowledge of diabetes, achieving a supportive built environment for human health is an interdisciplinary research area involving evidence-based urban planning and design, and public health and related practice. Renalds et al. (2010) identified that aspects of the built environment can play an important role in supporting lifestyle choices that result in either beneficial or adverse health consequences for the individual and at the community level. Kent & Thompson (2012) concluded that professionals in health and the built environment (designers and policy-makers) should work together to translate health knowledge into effective policy and practice. Lowe et al. (2014) provided an overview of the evidence of

958
Sentiment analysis on social media for identifying public awareness of type 2 diabetes
the association between the built environment and chronic diseases, highlighting progress and future challenges for health promotion. Focusing on diabetes, this paper proposes an integrated approach to investigate the diabetes factors (lifestyle choices) with respect to the built environment for inclusion in the urban planning/design process.
2.2. Sentiment analysis
Liu (2012) defines sentiment analysis as “the field of study that analyses people’s opinions, sentiments, evaluations, appraisals, attitudes, and emotions towards entities such as products, services, organizations, individuals, issues, events, topics, and their attributes”. Unlike traditional content analysis, sentiment analysis is a more automated process, using a sentiment dictionary and a computer program to analyse large data sets (Hollander & Renski, 2015; Yuan, Cong, Ma, Sun, & Thalmann, 2013). Sentiment analysis of news and social media data has been used to detect social/environmental issues in many studies. Bollen et al. (2011) conducted a sentiment analysis on Twitter and calculated a daily mood for their corpus and correlated that with external notable events that took place in the period. Bertrand et al. (2013) applied sentiment analysis to Tweets and found that the public mood is generally the highest in public parks and lowest at transportation hubs, and located other areas of strong sentiment such as cemeteries, medical centres, a jail, and a sewage facility. Balahur et al. (2010) pointed out the difference in tasks for sentiment analysis between social media and news and distinguished three different possible views on newspaper articles: author, reader and text. Salas-Zárate et al. (2017) applied sentiment analysis into the health domain for diabetes, but unrelated to the urban environment. Chen et al. (2017) and Psyllidis et al. (2015) both proposed to apply sentiment analysis as part of urban data analysis for decision-making during the urban planning and design process. Hence, there still lacks clear research that could link public health issues (individual level) with sentiment analysis of news for a health-supportive urban planning and design process (community/urban level).
3. Data and methods
3.1. Opinion and comments corpus
The focus of this research lies in opinion news and their comments. Previous studies (Balahur et al., 2010; Kolhatkar et al., 2018) have demonstrated that the opinion news/articles tend to receive more interesting comments, which are more subjective than general news/articles. To understand the public awareness on the relationship between T2DM and environmental characteristics, the proposed build-up method for this corpus is modified from an existing solution by Kolhatkar et al. (2018). The proposed data sources contain two parts: 1) news searched and downloaded from Factiva, and 2) parts of comments scraped using Python. After integrating the two results, this research created a Singapore context-based opinion and comments corpus for the last 29 years (1992-2020). Currently, the corpus contains 23,301 opinions together with their comments.
3.2. Research method
Within sentiment analysis, the texts belong to either positive or negative classes or are multi-valued like positive, negative and neutral (or irrelevant). This research followed the existing lexical analysis approach to analyse the opinion and comments data corpus (Medhat et al., 2014; Thakkar & Patel, 2015). There are five steps during the lexical and comparative analysis.

959
Yuezhong Liu, Rudi Stouffs and Yin Leng Theng
The first step converts the corpus into tokens (broken into single words) by the Natural Language Processing Toolkit (NLTK) Tokenizer (http://www.nltk.org). Then the second step cleans and transforms the unnecessary excess words according to pre-tagged lexicons. The following step checks and marks every new token encountered from the lexicon in the dictionary. If there is a positive match, the total pool of scores for the input corpus will increase. For instance, if “impressive” is a positive match in the dictionary then the total score of the text is incremented. Otherwise, the score is decremented. At the fourth step, the lexical analysis results are prepared and ready for the last comparative analysis by Pearson correlation.
4. Sentiment analysis of opinions and commentsThis study filters the commentaries/opinions news by the existing identified environmental characteristics (Dendup et al., 2018): “amenities”, “facilities”, “walkability”, “urban sprawl”, “public transport” and “green space”. Eight searches are conducted using eight search terms (Table 1): 1) combined keyword 1: (amenities or facilities or walkability or (urban sprawl) or (public transport) or (green space)); 2) combined keyword 2: diabetes and (amenities or facilities or walkability or (urban sprawl) or (public transport) or (green space)); 3) amenities; 4) facilities; 5) walkability; 6) urban sprawl; 7) public transport; 8) green space.
Table 1: The total annual number of news (Commentaries/Opinions) by each search terms.
Year Combined keyword 1
Combined keyword 2 amenities facilities walkability urban
sprawl public transport
green space
1992 4 0 3 3 0 0 0 0 1993 1 0 1 0 0 0 0 0 1994 4 0 0 4 0 0 0 0 1995 5 0 0 5 0 0 0 0 1996 5 0 1 3 0 0 1 0 1997 2 0 1 1 0 0 0 0 1998 3 0 0 2 0 0 1 0 1999 2 0 1 1 0 0 0 0 2000 35 0 3 33 0 0 0 1 2001 20 0 0 19 0 0 1 0 2002 13 0 1 7 0 0 6 0 2003 13 0 0 13 0 0 0 0 2004 10 0 1 9 0 0 0 0 2005 25 0 3 20 0 0 4 0 2006 94 3 8 69 0 0 22 0 2007 63 1 1 54 0 0 10 0 2008 46 0 5 33 0 0 12 0 2009 65 1 4 52 0 0 9 0 2010 83 1 10 62 0 0 13 0 2011 27 0 1 23 0 0 3 0 2012 17 0 1 14 0 0 3 0 2013 25 0 0 20 0 0 5 0 2014 37 1 2 30 0 1 5 0 2015 44 0 3 33 0 0 11 1

960
Sentiment analysis on social media for identifying public awareness of type 2 diabetes
Year Combined keyword 1
Combined keyword 2 amenities facilities walkability urban
sprawl public transport
green space
2016 18 0 0 14 0 0 4 0 2017 28 0 2 18 0 0 7 1 2018 62 0 8 55 0 0 5 0 2019 81 1 10 53 0 0 23 0 2020 164 2 11 120 0 1 39 2
4.1. Correlation analysis
Firstly, Table 1 indicates that the number of news that includes both environmental characteristics and T2DM (combined keyword 2) is far below the number of news with environmental characteristics (combined keyword 1). In other words, the opinions and comments related to T2DM are less linked with the aspects of environmental characteristics. And table 1 also reveals the public attention about environmental characteristics is changed annually. Depends on the number, environmental characteristics can be ranked from high to low to public attention: facilities, public transport, amenities, urban sprawl and green space, walkability. According to each characteristic, the basic word frequency analysis processes in word cloud chart. Figure 1 presents the most popular keywords for each environmental determinant. The top keywords for amenities are "hawker centres" & "asian infrastructure". The facilities contain "global city", & "regional hull market". The keywords within urban sprawl are "recent news" & "week visit". And the words "barrels per day (bbl day)" and "nuclear future" are related to public transport. And green space includes something like "winter trip", "tiny island" and "urban jungle". However, there is no opinions and comments from news related to walkability.
Figure 1: High-frequency keywords from the news for environmental characteristics from 1992 to 2020 From the result of sentiment analysis in Figure 2 also shows that most of the results of the news are
negative (positive: 7 and negative: 887). The annual prevalence rates of Diabetes in Singapore are 8.6% in 1992, 9.0% in 1998, 8.2% in 2004, 11.3% in 2010 and 11.4% in 2014 (MOH, 2018). The correlation is calculated between sentiment analysis and annual prevalence rate of Diabetes by Pearson correlation (SPSS 2.5). And the strength of the correlation using the guide: (0.00, 0.19): “very weak”; (0.20-0.39): “weak”; (0.40-0.59): “moderate”; (0.60-0.79): “strong”; (0.80-1.0): “very strong” (Evans, 1996). Here are the findings:

961
Yuezhong Liu, Rudi Stouffs and Yin Leng Theng
• The news collected by combined keyword 2: diabetes and (amenities or facilities or walkabilityor (urban sprawl) or (public transport) or (green space)) (R2 = 0.965) have a strong correlation with prevalence of T2DM.
• The news collected by combined keyword 1: (amenities or facilities or walkability or (urbansprawl) or (public transport) or (green space)) (R2 = 0.697), facilities (R2 = 0.715) and publictransport (R2 = 0.709) have moderate correlation with prevalence of T2DM.
• The news searched by amenities (R2 = 0.361), urban sprawl (R2 = 0.384) walkability (norelated news) and green space (no related news) have a weak correlation with prevalence of T2DM.
From the first finding, the news includes diabetes match with the prevalence of T2DM, it means that public care for the prevalence of T2DM. However, the total number 1% (10 articles in 996 articles between 1992 and 2020) of news filtered by combined keyword 2 is very small compared to other topics. It means that public awareness of the relationship between environmental characteristics and the prevalence of T2DM in Singapore is little. The second finding reveals the fluctuation of the sentiment analysis result on the issues from facilities, public transport match with the prevalence of T2DM. The second finding indicates the news filtered by keywords “facilities” and “public transport” may reflect the prevalence of T2DM in Singapore.
Figure 2: Sentiment analysis of news including environmental characteristics without T2DM from 1992 to 2020
5. Case study and discussionThis hypothetical case study is based on an actual team-based design studio project. The proposed design rethinks the T2DM challenges at an urban scale: walkability with amenities, green space, clusters of buildings and transportation. The site is located near East Coast Park in Singapore (total population of 5.64 million). Considering the high risk of T2DM and if nothing were to be done, the number of diabetics under 70 in Singapore is expected to rise to 670,000 by 2030. Figure 3 displays the site survey of lifestyles near East Coast Park.

962
Sentiment analysis on social media for identifying public awareness of type 2 diabetes
Figure 3: Site survey of lifestyles near East Coast Park (image adapted from Integrated Project Studio) Following the proposed sentiment analysis approach, word cloud and annual sentiment analysis chart
related to East Coast Park are showed in Figure 4. All the annual sentiment analysis is negative. As concluded above, the news filtered by keywords “facilities” and “public transportation” related to East Coast Park will help to reflect the prevalence of T2DM in this region. To help designers to understand the news context, the sentiment analysis results are mapped into open source GIS software (QGIS), the mentioned locations, times and topics from the news are mapping into the site. From Figure 4, it is useful for designers to figure out the design issues from public attitudes and concerns. The public complains about both facilities and public transportation mainly come from Bedok and facilities concern come from Bayshore, Joo Chia and Katong.
Figure 4: (a) Negative news related to East Coast Park mapping in QGIS; (b) High-frequency keywords of facilities and public transport news from 1992 to 2020; (c) the details of each negative news
The hypothetical urban design process provides several insights which we believe are important for adequacy and environment equity assessment of public health (T2DM) in cities. Environmental characteristics provision indicators during the design process by top-down approach tend to have

963
Yuezhong Liu, Rudi Stouffs and Yin Leng Theng
skewed distributions, and therefore the choice of the sentiment analysis of news (bottom-up approach from public concern) will perform as a supplement the outcome of public health (T2DM) adequacy and equity assessment. In particular, the hotspot complained from the public should be more considered as urgent issues for favourable and equitable health-supportive environment provision than others. This demonstrated design process have implications on considering public concerns by sentiment analysis of social media for a health-supportive environment in cities. We further discuss the implications, possible methods contributing to the health-supportive design process and highlight areas needing further research.
• Is there inequality of environmental characteristics distribution in Singapore and does the spatial scale of study make a difference related to public health (T2DM)?
It is well-documented in different cities that public health is associated with environmental characteristics distribution (Balti, Echouffo-tcheugui, Yako, & Kengne, 2014; Dendup et al., 2018; Kauhl, Schweikart, Krafft, Keste, & Moskwyn, 2016; Tan & Samsudin, 2017). However, research knowledge has not been recognized by the public widely. The public concerns about environmental characterise (particularly facilities and public transport) could help planners/designers to propose the health- supportive solution progressively. Tan & Samsudin (2017) have pointed out spatial scale has a large impact on equity assessment in Singapore and unequal distribution of parks will lead to uneven wealth and income. Hence, as the same, public health also will be impacted by inequality of environmental characteristics distribution and spatial scale. This also indirectly shows the importance of sentiment analysis from the public by different region/precinct. The planning/design process should consider/include this proposed sentiment analysis workflow.
• How is the proposed sentiment analysis dealing with other public health issues (coronavirus disease, allergies, food safety, etc.) during the design process in Singapore?
From the literature, data derived from social media has been successfully used for capturing diverse trends about public health issues(Paul & Dredze, 2014; Salathé & Khandelwal, 2011; Samuel et al., 2020; Zunic et al., 2020). Most of these approaches are based on natural language processing and share a similar workflow which involves data collection, human annotation, classification, and subsequent sentiment analysis. The approach has proven promising in many cases, but it also remains gaps to apply to the design process. Considering urban design as a broad and complex discipline, a broad range of research has confirmed that the design process requires urban designers to have the ability to tackle ill- defined problems through both problem-solving and reflective practice, including problem structuring and formulating (Cross, 2006; Lawson, 2005). Hence, the gaps mainly come from how to retrieve right & useful social media information linked with design parameters. To include public health, we need further narrow down social media by topic with spatial information. As a pilot study and concluded in part 4.1, we identified that the news filtered by keywords “facilities” and “public transport” may reflect the prevalence of T2DM in Singapore. This sentiment analysis enhanced by correlation analysis also has the potential ability to address the other public health issues. And the precondition for designers is to understand the impact of public health by which physical design parameters. Then we could link the public opinions and concerns on design parameters and public health topic. Hence, the proposed sentiment analysis workflow could help to perform as a bridge to cover the gaps between public health and the design process.

964
Sentiment analysis on social media for identifying public awareness of type 2 diabetes
6. ConclusionThe environmental characteristics are everyday facets of urban living and individually account for most of the variations in people's lifestyle choices. This research shows public awareness of environmental characteristics related to the prevalence of T2DM and how urban designers can consider the prevalence of T2DM from a design perspective. Comparing historical news with sentiment analysis, we conclude that the public awareness of the relationship between environmental variables and diabetes is little in Singapore (1% news for both diabetes and environment). However, the news filtered by keywords “facilities” and “public transportation” may help to reflect the prevalence of T2DM in Singapore. Based on this finding, an urban design case study is proposed to demonstrate how and where this sentiment analysis can be applied to the urban design process to support design from a public health perspective. There are still many limitations to this research. The sentiment classifier by lexicons needs further improvement for news articles and the validation of the suggested points should be narrowed down to the neighbourhood level. For the future, we will enrich the current corpus by enabling analysis of multiple languages by Google translation API and seek to evaluate these design hypothesis with context- based real data.
Acknowledgements The authors would like to acknowledge the infrastructure project “Ageing-related Data Repository” supporting the data collection and analysis process. We thank all the other professors and students from the Ageing Research Institute for Society and Education (ARISE), NTU, who have involved in the discussion to provide the ideas and methods.
References American Diabetes Association. (2009). Diagnosis and classification of diabetes mellitus. Diabetes Care, 32(SUPPL.
1). Balahur, A., Steinberger, R., Kabadjov, M., Zavarella, V., Goot, E., Halkia, M., Belyaeva, J. (2010). Sentiment Analysis
in the News. In Proceedings of the 7th International Conference on Language Resources and Evaluation (pp. 2216–2220). Valletta, Malta.
Balti, E.V., Echouffo-tcheugui, J.B., Yako, Y.Y., & Kengne, A.P. (2014). Air pollution and risk of type 2 diabetes mellitus : A systematic review and meta-analysis. Diabetes Research and Clinical Practice, 106(2), 161–172. https://doi.org/10.1016/j.diabres.2014.08.010
Bertrand, K. Z., Bialik, M., Virdee, K., Gros, A., & Bar-Yam, Y. (2013). Sentiment in New York City: A High Resolution Spatial and Temporal View. ArXiv Preprint, 1–12.
Bollen, J., Mao, H., & Pepe, A. (2011). Modeling Public Mood and Emotion: Twitter Sentiment and Socio-Economic Phenomena. In Proceedings of the Fifth International AAAI Conference on Weblogs and Social Media (Vol. 36, pp. 194–205).
Chen, N.C., Zhang, Y., Stephens, M., & Nagakura, T. (2017). Urban Data Mining with Natural Language Processing: Social Media as Complementary Tool for Urban Decision Making. In the 17th International Conference on Computer Aided Architectural Design Futures (pp. 101–109). Istanbul, Turkey.
Cross, N. (2006). Designerly ways of knowing. London: Springer-Verlag. Cullmann, M., Hilding, A., & Östenson, C.G. (2012). Alcohol consumption and risk of pre-diabetes and type 2 diabetes
development in a Swedish population. Diabetic Medicine, 29(4), 441–452. Dendup, T., Feng, X., Clingan, S., & Astell-burt, T. (2018). Environmental Risk Factors for Developing Type 2 Diabetes
Mellitus : A Systematic Review. International Journal of Environmental Research and Public Health, 15(1), 78. Evans, J. D. (1996). Straightforward statistics for the behavioral sciences. Pacific Grove: CA: Brooks/Cole Publishing.

965
Yuezhong Liu, Rudi Stouffs and Yin Leng Theng
Hollander, J.B., & Renski, H. (2015). Measuring Urban Attitudes Using Twitter: An Exploratory Study. Kauhl, B., Schweikart, J., Krafft, T., Keste, A., & Moskwyn, M. (2016). Do the risk factors for type 2 diabetes mellitus
vary by location? A spatial analysis of health insurance claims in Northeastern Germany using kernel density estimation and geographically weighted regression. International Journal of Health Geographics, 15(1).
Kent, J., & Thompson, S. (2012). Health and the built environment: Exploring foundations for a new interdisciplinary profession. Journal of Environmental and Public Health, 2012, 10.
Kolhatkar, V., Wu, H., Cavasso, L., Francis, E., Shukla, K., & Taboada, M. (2018). The SFU Opinion and Comments Corpus: A Corpus for the Analysis of Online News Comments.
Lawson, B. (2005). How designers thinks: the design process demystified. Architectural Press (Fourth). Elsevier. Liu, B. (2012). Sentiment Analysis and Opinion Mining. Morgan & Claypool Publishers. Lowe, M., Boulange, C., & Giles-Corti, B. (2014). Urban design and health: Progress to date and future challenges.
Health Promotion Journal of Australia, 25(1), 14–18. Manson, J.A.E., Ajani, U. A., Liu, S., Nathan, D.M., & Hennekens, C.H. (2000). A prospective study of cigarette smoking
and the incidence of diabetes mellitus among US male physicians. American Journal of Medicine, 109(7), 538–542.
Medhat, W., Hassan, A., & Korashy, H. (2014). Sentiment analysis algorithms and applications: A survey. Ain Shams Engineering Journal, 5(4), 1093–1113.
MOH. (2018). The War On Diabetes. Singapore. Paul, M. J., & Dredze, M. (2014). Discovering health topics in social media using topic models. PloS One, 9(8),
e103408–e103408. Psyllidis, A., Bozzon, A., Bocconi, S., & Titos Bolivar, C. (2015). A platform for urban analytics and semantic data
integration in city planning. In the 16th International Conference on Computer Aided Architectural Design Futures (Vol. 527, pp. 21–36).
Renalds, A., Smith, T.H., & Hale, P. J. (2010). A systematic review of built environment and health. Family and Community Health, 33(1), 68–78.
Salas-Zárate, M.D.P., Medina-Moreira, J., Lagos-Ortiz, K., Luna-Aveiga, H., Rodríguez-García, M.Á., & Valencia- García, R. (2017). Sentiment Analysis on Tweets about Diabetes: An Aspect-Level Approach. Computational andMathematical Methods in Medicine, 2017.
Salathé, M., & Khandelwal, S. (2011). Assessing Vaccination Sentiments with Online Social Media: Implications for Infectious Disease Dynamics and Control. PLOS Computational Biology, 7(10), e1002199.
Samuel, J., Ali, G.G.M.N., Rahman, M.M., Esawi, E., & Samuel, Y. (2020). COVID-19 Public Sentiment Insights and Machine Learning for Tweets Classification. Information.
Tan, P.Y., & Samsudin, R. (2017). Landscape and Urban Planning Effects of spatial scale on assessment of spatial equity of urban park provision. Landscape and Urban Planning, 158, 139–154.
Thakkar, H., & Patel, D. (2015). Approaches for Sentiment Analysis on Twitter: A State-of-Art study. Wu, Y., Ding, Y., Tanaka, Y., & Zhang, W. (2014). Risk factors contributing to type 2 diabetes and recent advances in
the treatment and prevention. International Journal of Medical Sciences, 11(11), 1185–1200. Yuan, Q., Cong, G., Ma, Z., Sun, A., & Thalmann, N.M. (2013). Who, Where, When and What: Discover Spatio-
temporal Topics for Twitter Users. Proceedings of the 19th ACM SIGKDD International Conference on Knowledge Discovery and Data Mining, 605–613.
Zimmet, P., Alberti, K. G. M.M., & Shaw, J. (2001). Global and societal implications of the diabetes epidemic. Nature, 414(December 2001), 782–787.
Zunic, A., Corcoran, P., & Spasic, I. (2020). Sentiment Analysis in Health and Well-Being: Systematic Review. JMIR Medical Informatics, 8(1), e16023–e16023.

966
The 54th International Conference of the Architectural Science Association (ANZAScA) 2020
Smart solar urban furniture: design, application, limits and potentials
Alessandro Premier Future Cities Research Hub, University of Auckland, Auckland, New Zealand
Abstract: Smart urban street furniture is a growing reality with several projects and companies producing objects integrated with photovoltaic technologies. Smart bus stops, pergolas, canopies, carports, solar trees, solar benches are just some examples of the objects available today. Some of the opportunities offered by smart urban street furniture are self-powered rechargeable docks for smartphones or other devices, information screens, public lighting, free wi-fi, rechargeable stations for electric vehicles. They can be used to collect big data, offering opportunities for our daily lives, also after the covid-19 pandemic. The aim of this research is to provide a classification of the most important solar urban street furniture, to understand the strategies adopted in case studies and to understand the main problems related to the adoption of these devices and where future research should focus. The methodology involved a selection of international case studies in important urban contexts to gather information as: architectural integration, context sensitivity, system visibility. The preliminary results indicate that potential limits to the application of these technologies are urban morphology and lack of design of some solutions. This study can be useful to understand the potential use of these products in our territory.
Keywords: Smart street furniture; Smart city; Photovoltaics; Sustainable design.
1. Smart and solar urban furnitureThe use of building integrated photovoltaics (BIPV) in urban elements is a reality. There are many examples of PV technology integrated also in urban furniture or vehicles, boosted by the BIPV modules adaptability to end-user’s requirements regarding transparency, colour or glass treatments (Rico et al., 2019).
A recently published research demonstrated a significative increase in patent activity around the world for Smart Furniture. The number of patents increased from less than 5 in 2009 to more than 50 in 2018 (Krejcar et al., 2019). This research was focused on the identification of a unique definition for the term smart furniture based on literature and patent analysis. The databases investigated included SCOPUS, Web of Science, and IEEE Xplore and ESPACENT for the patents. The chosen period was between 1998 and 2017. The results indicated that smart furniture should be defined as “designed, networked furniture that is equipped with an intelligent system or is controller operated with the user's
Imaginable Futures: Design Thinking, and the Scientific Method. 54th International Conference of the Architectural Science Association 2020, Ali Ghaffarianhoseini, et al (eds), pp. 966–975. © 2020 and published by the Architectural Science Association (ANZAScA).

967
Alessandro Premier
data and energy sources” (Krejcar et al., 2019). Thus, smart furniture should be implemented with sensors and actuators able to adapt to the users’ needs.
This research is focused on “smart” solar urban furniture, thus on urban furniture implementing solar technologies. There is a growing interest on this topic demonstrated by a number of projects and real-world applications. Amongst them, The Land Art Generator Initiative, a design competition held in 2019, gathered entrants from around the world to create a renewable energy-producing artwork for the UAE’s Masdar City in Abu Dhabi. The book including the most significative design proposals comprises more than 70 projects demonstrating the aesthetic possibilities of renewable energy infrastructures. These projects involved spaces for recreation and contemplation, illustrating the possibilities of living well in a post-carbon future (Monoian & Ferry, 2020).
As it is well known, there are several types of solar urban furniture. Besides that, we should consider that we might have self-powered as well as grid-connected devices. Self-powered smart urban street furniture can help cities and communities to increase the attractivity of public spaces by providing public services, information, and connectivity, while at the same time enabling the collection of valuable data for optimizing processes and reducing costs (Müller, 2017). Several examples of smart street furniture solutions can be found all around the world. Goals of smart street furniture are to make life easier for citizens and visitors, to optimize the management of public infrastructure, to provide connectivity such as free Wi-Fi and so forth. Digital signs and screens can provide information to citizens and users on public transportation availability or traffic congestion; smart benches can be used as rechargeable docks for smartphones; bus stops can spread localized Wi-Fi signal.
Given the current state of the art of the development of smart solar urban furniture and their use, it seems necessary to provide a classification of the different objects we may encounter globally, while providing some practical examples. Aim of this research is to reflect on potential applications in the Pacific regions and in particular in Auckland, New Zealand.
2. Classification of solar urban furnitureA literature review has been performed on books, journal articles, conference papers and websites collecting projects and built examples of solar urban furniture. More than 80 examples have been found, leading to a preliminary classification of the different types of urban furniture that can be designed and integrated with solar and smart technologies. Solar urban furniture that have been identified are:
Canopies Pergolas Carports Bus stops Benches Solar trees Street lighting Experimental objects

968
Smart solar urban furniture: design, application, limits and potentials
The following section describes some examples amongst those included in the research. Each case study described below is indicative of one of the different types of smart solar urban furniture listed above.
2.1. Canopies
A typical example of solar canopy is the Union City station project in San Francisco, USA. The so-called BART station system carries over 320,000 passengers daily, placing it in the 5th position of the most used infrastructures in the United States. Given the heavy traffic and massive energy consumption, it has been decided to refurbish the existing canopy comprised of 800 crystalline silicon photovoltaic glass modules. This is a large installation of PV modules on a “V” shaped metal roof structure. The panels are visible from the people walking below the structure and their pattern also contribute to the solar shading of the area. They are installed on glass panels. The context of this installation might be considered of low sensitivity because it is a civil infrastructure. The architectural integration is provided by the fact that the panels constitute the roof of the structure. Another famous photovoltaic canopy is the one at the North Sydney Coal Loader which is part of a large project of urban regeneration. In this case the metal structure of the canopy is linear (squared arches). PV panels are distributed only on a small portion of the canopy and they are almost flat (non-tilted). The visibility of the panels is high, but they constitute the roof of the structure. Since the panels are not distributed on the entire structure they don’t change the perception of the light metal structure, thus resulting in a balanced architectural integration.
2.2. Pergolas
It is well known that photovoltaic systems can be installed on top of pergolas. In Europe, perhaps the best known example is the huge pergola under which the Barcelona Forum was held in 2004. This was the biggest urban photovoltaic plant in Europe in 2004 (Frolova et al., 2015). This is another large urban installation concentrated on a single structure. The visual impact of the structure is high as it is installed in front of the sea (a sensible context). However, the whole area is a urban park clad in concrete and surrounded by contemporary buildings. In such a context the huge structure is just one of the available infrastructures and it is integrated with the context. Smaller structure like kiosks can be conceived as mart urban furniture creating also a network of digital urban nodes that facilitate citizen city communication and interaction.
2.3. Carports
Amongst the several project and prototypes designed and built in the last few years, an example of a carport could be the Volvo Pure Tension Pavilion. This was a tensile pavilion covered in solar panels that could be used to charge an electric car and then folded up to fit in its boot. It was designed by Synthesis Design + Architecture with Buro Happold engineers for the car brand Volvo to showcase its electric hybrid V60 car during a promotional tour of Italy in 2013. The fabric surface, made of from a vinyl encapsulated polyester mesh membrane, was implemented with 252 flexible photovoltaic panels. According to the external conditions, a power transmission controller automatically turned off the panels collecting least energy to ensure maximum power generation, whatever the pavilion's location. Power produced by the panels was fed through wiring integrated into the fabric skin into a portable battery to charge the car. In optimum sun conditions the systems generated 450W of power which were able to recharge a fully depleted car battery in about 12 hours. This was a temporary (removable)

969
Alessandro Premier
installation where thin-film solar cells were integrated on a membrane. Visibility of the cells was very high as they covered almost the entire surface of the carport. However, solar cells were custom designed according to the fluid form of the object. Context sensitivity was variable according to the place of installation. Anyhow, the special form (and removability) of the pavilion was suitable for different context, even for temporary installations in historic centres.
2.4. Bus stops
There are several example of smart bus stops projects and prototypes. Solar bus stops can be used to transmit information such as, advertisements, information on the public transit, but also touristic information, weather alerts, e-mail access and more. A similar bus stop has been developed by researchers at the SENSEable City Lab of the Massachusetts Institute of Technology. EyeStop is a project for an interactive bus stop designed for the city of Florence, Italy. Eyestop project is powered by sunlight and can detect air pollutants and weather changes. The bus stop is integrated with smart maps and touchscreens. The users just have to tap on the station they want to go and the screen will automatically show them which route they can follow. The screen shows real time information aiming at keeping the users up to date about any possible obstacles (Willemijn, 2014). The bus stop is designed as a single piece of curved glass where all the technologies are integrated in. This object was conceived as a piece of industrial design. The use of glass and the transparency of the structure was chosen for an adaptability to sensitive historical context like Florence.
2.5. Benches
In the last few years several start-ups started offering new smart urban furniture. They employed the IoT technology to create small urban furniture able to provide different services. Some examples are the US start-up and MIT spin-off “Changing Environments Inc.” which produced Soofa Bench and Soofa Sign, (Müller, 2017). Hundreds of these Soofa benches have been installed in 65 different cities in the US and Canada by mid-2017. These are simple benches made of steel and timber with a solar panel installed in the middle. The solar panel, in this case, is not part of the bench as the people cannot sit on top of it. The design is functional but basic and the visibility of the PV panel is high due to its position. The architectural integration of the panel is also low as the panel is just placed on top of the bench.
The installation of the new solar street furniture on KAUST campus in Saudi Arabia has been completed in 2020. This is a circular outdoor seating, incorporating flexible, lightweight and transparent solar technologies developed by King Abdullah University of Science and Technology (KAUST) Solar Center (Solar Novus Today, 2020). The seating is shaped as a circular object where PV panels are placed on the external curved surfaces. These modules are constituted by organic photovoltaics (OPV) and they are semi-transparent. Due to its shape the object is highly visible in an urban context. However, the integration of PVs with the form of the bench is achieved through the flexibility of the adopted cells which also merge into the design.
2.6. Solar trees
Experiments and prototypes of tree-like structures have become very popular in the last years. The goal is to utilize the minimum land for maximum solar power generation. In solar trees, solar panels are arranged along the branches of a tree-like structure. Each node should only have one solar panel (e.g. in a spiral phyllotaxy arrangement). The aim is that panels avoid shading from each other and each panel

970
Smart solar urban furniture: design, application, limits and potentials
gets a good share of solar energy. In some arrangements, branches and solar panels follow Fibonacci pattern (Gangwar et al., 2019). This configuration allows panels to receive solar energy in different directions, thus making use of sunlight throughout the day. In this way, a solar tree becomes more efficient and also the land requirement of installing it reduces as compared to installation of conventional panels (Gangwar et al., 2019). A famous solar tree has been designed in 2007 by Ross Lovegrove. An exemplar was installed in Piazza Gae Aulenti, in Milan, Italy (Figure 1). Solar trees are often characterized by a high visibility of the panels which are generally optimized for the maximum solar power generation. An achievement of this project is the form of the “leaves” which are not just holding standard PV panels but are custom designed according to the overall design of the structure.
2.7. Street lighting
Another type of urban furniture in which solar technologies can be incorporated is street lighting. An early prototype of PV lighting was built and installed in summer 2006 in the garden of the ENEA (Italian National Agency for New Technologies, the Energy and the Environment) Research Centre in Portici, Italy. The prototype was called Stapelia following the homonymous tropical flower. The geometry of this PV lighting was based on a pentagon, and the basic idea was that one or more elements can be installed where an electrical supply is required (Scognamiglio et al., 2007). This type of street lighting with architectural integrated PV seems not to be very common. Today solar street lighting products are available everywhere. PV street lighting are installed along important streets in many European countries and similar products are also sold in New Zealand. They are highly visible objects. However, these products need a lot of design and their visual impact is still not adequately optimized
2.8. Experimental projects
Experimentation is always very important to find innovative solution, especially at the urban scale where problems of overshadowing may arise. Joseph Cory, designer of Geotectura Studio with the help of the aerospace engineer Pini Gurfil designed floating solar balloons (SunHopes) capable of capturing the energy from the sun even in those urbanized areas where high-density would make the positioning of traditional solar panels practically impossible. This technology can also be placed in desert areas, in islands or in forests. In addition, the quick and easy assembly of this device makes it suitable for emergency situations. SunHopes consists of a control panel, a supply cable for helium, a power cable and a flask filled with helium. The latter is also covered with a fabric coated with thin film, waterproof, elastic and UV-resistant photovoltaic solar cells. The PV coating was made using a particular material made up of semiconductor metal titanium dioxide nanoparticles coated either with cadmium sulphide or with cadmium selenide. Finally, these modular platforms are hooked to the ground with a system of cables that allow the balloons to be supplied with gas and, at the same time, to transfer the energy to the ground (Chino, 2018). Although highly visible objects, these are special designs that might be easily integrated in different contexts due to their decontextualized form (Figure 1).

971
Alessandro Premier
Figure 1: from left Solar Tree by Ross Lovegrove; SunHopes project. (Source: Geotectura Studio)
3. Aims, potentials and limits of smart solar urban furnitureWhy should our cities and communities consider “smart” solar urban furniture? Benefits often stated by professionals in the smart cities business are (Müller, 2017):
• Free solar-powered charging docks for smartphones and other portable devices;• Free Wi-Fi connectivity; • Information delivered via screens and interactive tools;• Education on renewable energy; • Saving energy consumed by electric powered street furniture (public); • Saving energy consumed by households and companies (private); • Collecting big data to improve public services (e.g. pedestrian traffic, use of public
facilities, comparison of different locations; weather data); • Advertisement.
It should be noted that smart furniture continues providing their services also during periods of lockdown as it happened during the Covid-19 pandemic. Hence, if connected to the grid, they can generate electricity for other purposes.
3.1. Critical aspects
A problem which is usually highlighted by the press and by the people who are sceptical of these technologies, is the possibility of stealing solar panels. Although this is a real problem (Feek, 2017), special joints have been studied over the years to reduce this risk (Cabanillas Saldana, 2012). Furthermore, the integration in glass panels or other materials embedded in the furniture can reduce this issue. Vandalism might be another issue, but education may help in reducing this phenomenon.
One of the main issues when dealing with photovoltaics is the visual impact of these technologies on buildings and the environment. It is always important to stress out the strategic role of architectural design for visual integration of photovoltaics and this can be achieved only with customised design and following guidelines developed by the councils (Munari Probst & Roecker, 2012). Although many of the

972
Smart solar urban furniture: design, application, limits and potentials
objects described in section 2 of this paper showed a high level of architectural integration of smart technologies, some of the commercial products (e.g. street lights, solar benches) showed a lack of design and a high visual impact of PV technologies. This means that there is room for architects and designer to improve the quality of these objects.
Variations in solar energy distribution throughout the year and space requirements for solar PV installations pose challenges for wide spread deployment of solar PV systems (Dey et al., 2018). In fact, the third critical aspect is the position of the furniture within the urban context. 3D city models combining terrain reliefs, buildings, city furniture (and possibly vegetation) are increasingly used to simulate the solar irradiance on built surfaces, and therefore the solar energy generation. For new urban projects built in dense urban areas, it is essential to consider the existing surrounding buildings and the possible external shadings and reflexions. 3D city models are available for an increasing number of cities (especially the open standard CityGML). Based on the 3D city model of new urban developments and existing environments, solar simulation tools for 3D modelling can help in the design of the furniture form optimising the solar utilisation (Lundgren et al., 2018) as well as the position of solar urban furniture within the urban context to avoid overshadowed areas.
According to Lobaccaro (2019) a correct approach to the design of solar plants in the urban context follows a protocol that evaluates the architectural visibility, sensitivity and quality of solar installation. “Architectural integration quality” is the assessment of the quality of integration of solar systems. According to this evaluation, in order to perceive the system as integrated, it has to be designed as an integral part of the architecture or of the urban settlement. Geometry, materiality and modularity are assessed. “Urban context critical issue” evaluates how the quality requirements for architectural integration have been adapted to the local situation, specifically to the sensitivity of the urban area and the visibility of the furniture. “Context sensitivity” is the socio-cultural value of the urban zone where the urban furniture is located. Historical centres are generally ranked as high-sensitive areas while industrial areas or low-quality suburbs are ranked as low-sensitive. “The system visibility” assesses the perception of solar systems from the public spaces. It can be defined as “close visibility” from an urban perspective, or “remote visibility” from a far observation point (Lobaccaro et al., 2019).
A preliminary survey of the selected projects and built examples has been carried out following the three above mentioned criteria: “architectural integration”, “context sensitivity” and “system visibility”. Figure 2 shows the results of this preliminary investigation. It is evident that canopies and pergolas constitute the majority of the case studies. On the vertical axis is the number of identified objects for each type of solar urban furniture. Overall, for both categories there seems to be a high level of architectural integration in the design. They both have been installed in contexts with an average to low level of sensitivity, thus mainly in suburbs, industrial areas or modern city centres. The solar system visibility seems to be average to low, highlighting once again the high level of architectural integration. There seem to be furniture that need more attention in the design, like street lighting and solar trees which present a high level of system visibility.

973
Alessandro Premier
Figure 2: evaluation of the design of the selected case studies
Most of case studies are installed in plazas, along streets and in urban parks. Some of them are part of larger projects of urban regeneration (e.g. North Sydney Coal Loader). In general, a lower visibility of the system is associated to a higher level of architectural integration. The most successful projects, from this point of view, seem to be the smallest ones: bus stops or custom designed benches (e.g. KAUST), in particular where solar panels are highly integrated in the design and not just placed on top of the object. It has to be noted that solar benches can generate energy when people are not sitting on them. Further investigation is needed to analyse only the built case studies as many objects are commercial products but their applications are still sporadic. Investigation on built case studies may lead to a better understanding of the efficiency of the smart urban furniture and their appreciation by the people.
4. Possible applications in AucklandIt has been demonstrated that, through smart technologies, Auckland’s suburbia could transform to an energy contributor not only for its own transport needs but also to the city as a whole (Byrd, 2012). Auckland rooftop solar potential has been demonstrated also by a research carried out by the Energy Centre of the School of Business of the University of Auckland, Auckland Council and the Centre for eResearch (Suomalainen et al., 2017). A webtool (Energy Centre, 2017) has been developed after this research and it is available for the public. The user can select a building on the map by clicking on it and the annual solar radiation on the best spots on the roof will be given for 4 different areas. The tool is only focused on buildings’ roof-tops, however it does not analyse open areas which are used for smart urban furniture. It should be noted that in a city like Auckland, only a few open areas of the CBD could host smart urban furniture, because of urban density and the presence of tall buildings overshadowing each other. In the CBD these tools can be useful to help homeless people to recharge their phones and offer access to free Wi-Fi. Energy generation can be useful also for providing temporary heating during winter.

974
Smart solar urban furniture: design, application, limits and potentials
In suburban areas more extended projects could be pursued: smart bus stops can be used for providing useful information to locals and tourists; smart street lighting can be helpful to prevent delinquency in the most problematic neighbourhoods. In addition, Tāmaki iwi are interested in solar community projects and specific programmes can be pursued with them.
There is a great need of research to understand what is the smart urban furniture that could be applied in the different areas of such a big city like Auckland. This research is at an initial stage and it is aimed at extending the knowledge on smart urban furniture and at understanding their potential application at our latitudes, also through experimental prototypes or pilot projects that can be funded by private or public institutions. A research proposal recently funded by the University of Auckland will investigate these aspects and develop a co-creative project.
5. ConclusionsThis research focused on “smart” solar urban furniture, thus on urban furniture implementing solar technologies. A growing interest on this topic is demonstrated by several projects and real-world applications, with an increasing number of patents. The research identified 7 types of solar urban furniture: canopies, pergolas, carports, bus stops, benches, solar trees and street lighting; in addition, a number of experimental objects have been found present innovative solutions for the next future. More than 80 case studies have been investigated according to the criteria “architectural integration”, “context sensitivity” and “system visibility”. A selection of case studies has been described in this paper. Aims and potentials of solar urban furniture have been introduced as well as a number of limits that emerged from the case study preliminary analysis. The research highlighted the possibility of Auckland of hosting different types of projects of solar urban furniture, according to the expected goals and the features of the built environment. While Auckland CBD could host small projects in open areas such as public parks, the suburbs could host a distributed network of different tools. This research could be important also in conjunction with other strategic contributions to minimize energy loss in the energy distribution though the development of smart grids (Passey et al., 2011). In NZ, research projects on smart grids are being carried out by several institutions (Nair et al., 2015). Further steps of this research will involve: a more extended literature review, analysis of governmental policies, the study of possible prototypes, pilot experimental projects involving also Tāmaki iwi.
Acknowledgements This research has been carried out within the Future Cities Research Hub of the School of Architecture and Planning of the University of Auckland.
References Byrd,H. (2012). The Solar Potential of Auckland.
https://cdn.auckland.ac.nz/assets/creative/about/research/Transforming-Cities/Publications/Solar-potential- booklet.pdf%5Cnhttp://anzasca.net/2011papers/fullpapers/37P59.pdf
Cabanillas Saldana, J. P. (2012). Dual-Axis Solar Tracker (Patent No. US 8.237,098 B2). United States Patent. https://patents.google.com/patent/US8237098B2/en
Chino, M. (2018). SOLAR BALLOONS: SunHope Renewable Energy. Inhabitat. https://inhabitat.com/sunhope-solar- balloons/
Dey, S., Lakshmanan, M. K., & Pesala, B. (2018). Optimal solar tree design for increased flexibility in seasonal energy

975
Alessandro Premier
extraction. Renewable Energy, 125, 1038–1048. https://doi.org/10.1016/j.renene.2018.02.017 Energy Centre. (2017). Solar Potential Map. The University of Auckland Energy Centre.
http://solarpower.cer.auckland.ac.nz/ Feek, B. (2017). Burglars steal remote Waikato marae’s solar panels. NZ Herald.
https://www.nzherald.co.nz/nz/news/article.cfm?c_id=1&objectid=11966817 Frolova, M., Nada, P. A., & Cases, S. E. (2015). Renewable Energies and European Landscapes. In Renewable Energies
and European Landscapes. https://doi.org/10.1007/978-94-017-9843-3 Gangwar, P., Singh, R., Tripathi, R. P., & Singh, A. K. (2019). Effective solar power harnessing using a few novel solar
tree designs and their performance assessment. Energy Sources, Part A: Recovery, Utilization and Environmental Effects, 41(15), 1828–1837. https://doi.org/10.1080/15567036.2018.1549162
Krejcar, O., Maresova, P., Selamat, A., Melero, F. J., Barakovic, S., Husic, J. B., Herrera-Viedma, E., Frischer, R., & Kuca, K. (2019). Smart Furniture as a Component of a Smart City-Definition Based on Key Technologies Specification.IEEE Access, 7(September), 94822–94839. https://doi.org/10.1109/ACCESS.2019.2927778
Lobaccaro, G., Croce, S., Lindkvist, C., Munari Probst, M. C., Scognamiglio, A., Dahlberg, J., Lundgren, M., & Wall, M. (2019). A cross-country perspective on solar energy in urban planning: Lessons learned from international case studies. Renewable and Sustainable Energy Reviews, 108(February), 209–237. https://doi.org/10.1016/j.rser.2019.03.041
Lundgren, M., Dahlberg, J., Maps, S., Kanters, J., Kappel, K., Nault, E., Nouvel, R., Peronato, G., & López, C. S. P. (2018). 2D and 3D Solar Maps. In M. Lundgren & J. Dahlberg (Eds.), Approaches, Methods and Tools for Solar Energy in Urban Planning (pp. 53–55). IEA SHC work. https://doi.org/10.18777/ieashc-task51-2018-0004
Monoian, E., & Ferry, R. (2020). Return to the Source: New Energy Landscapes from the Land Art Generator Initiative (E. Monoian & R. Ferry (eds.)). Prestel Verlag.
Müller, T. (2017). Smart Urban Street Furniture Solutions in Smart Cities. https://hub.beesmart.city/en/solutions/smart-urban-street-furniture-solutions
Munari Probst, M. C., & Roecker, C. (2012). Criteria for architectural integration of active solar systems IEA Task 41, Subtask A. Energy Procedia, 30, 1195–1204. https://doi.org/10.1016/j.egypro.2012.11.132
Nair, N. K. C., Bahadornejad, M., & Joish, J. H. S. (2015). Smart Grid ICT infrastructure: New Zealand perspective (Issue March 2015). http://unitec.researchbank.ac.nz/handle/10652/4256
Passey, R., Spooner, T., MacGill, I., Watt, M., & Syngellakis, K. (2011). The potential impacts of grid-connected distributed generation and how to address them: A review of technical and non-technical factors. Energy Policy. https://doi.org/10.1016/j.enpol.2011.07.027
Rico, E., Huerta, I., Caño, T. del, Villada, L., Gallego, Á., Velasco, V., Zubillaga, O., Seoane, J. M. V. de, Arrizabalaga, I., Yurrita, N., Aizpurua, J., Imbuluzketa, G., & Cano, F. J. (2019). PVCOM Project: Manufacture of PV Modules Encapsulated in Composite Materials for Integration in Urban Environments. In S. Nesmachnow & L. H. Callejo (Eds.), Smart Cities. First Ibero-American Congress, ICSC-CITIES 2018 Soria, Spain, September 26–27, 2018 Revised Selected Papers (Vol. 1, pp. 38–52). Springer. https://doi.org/10.1007/978-3-030-12804-3
Scognamiglio, A., Cancro, A., Formisano, F., Privato, C., Fumagalli, S., & Leonardi, G. (2007). OPTIMIZATION OF THE LIGHTING PHOTOVOLTAIC COMPONENT STAPELIA. 22nd European Photovoltaic Solar Energy Conference, 3-7 September 2007, Milan, Italy, September, 3–7.
Solar Novus Today. (2020). Solar Outdoor Furniture Offers USB Charging, Lighting and Research Data. https://www.solarnovus.com/solar-outdoor-furniture-offers-usb-charging-lighting-and-research- data_N12182.html
Suomalainen, K., Wang, V., & Sharp, B. (2017). Energy Centre ’ s Auckland solar power online tool documentation. http://solarpower.cer.auckland.ac.nz/resources/readme.pdf
Willemijn, M. (2014). Smart urban furniture and screens in the future city. https://milouwillemijn.wordpress.com/2014/04/27/smart-urban-furniture-and-screens-in-the-future-city/

976
The 54th International Conference of the Architectural Science Association (ANZAScA) 2020
Social Dimension of Sustainability: A Least Investigated Criterion for Built Environment Assessment Tools
Keerthi Priya Ramineni1, Susan Ang2 and Sarah Shuchi31, 2,3 School of Architecture and Built Environment, Deakin University, Geelong, Australia
{[email protected], [email protected], [email protected]}
Abstract: Sustainability has driven built environment discourse increasingly in the last decades since the twentieth century. Expectations for buildings and built environment to be ‘sustainably measurable’ have increased. There has been a growth of development and introduction of built environment assessment tools, implemented as a measure of how ‘sustainable’ the built environment is, alongside inherent complexities of readily quantifiable indicators as well as less easily qualifiable indicators. This paper raises questions of how assessment tools are aligned with the myriad of diverse and dynamic scenarios of a rapidly changing built environment. Now, more than ever, exists the need to explore one of the least, if not the least considered criterion of sustainability in the built environment, the social dimension, and its critical inclusion in built environment assessment tools. The research study evaluated current available built environment assessment tools and the associated underpinning sustainable frameworks. The findings indicated there was a measure of aspiration and regard for this criterion which left room for a dedicated investigation for the incorporation and integration of social impact considerations. Exploring the ways in which social dimensions sit in fields other than built environment provided valuable reflection and ways forward for built environment assessment tools to be more holistically sustainable in its measurement approaches.
Keywords: Social dimension; built environment; assessment criterion; sustainability.
1. IntroductionAlthough many a theory not at the time labelled as sustainability have been seen through time from the fifties (Brown, et.al 1987) to start with, the origins of integrating ‘sustainability’ into an action were adopted only after the Brundtland Commission (WCED) 1987 stepped in, defining sustainable development as,
‘Development that meets the needs of the present without compromising the ability of future generations to meet their own needs’.
Thus, broadly leading classifying it into the three dimensions of environmental, economic and social, as parts of sustainability, with each of the dimensions explored with different goals. Since then, concepts of sustainability on a global scale have evolved from being vague moldable definitions formed
Imaginable Futures: Design Thinking, and the Scientific Method. 54th International Conference of the Architectural Science Association 2020, Ali Ghaffarianhoseini, et al (eds), pp. 976–985. © 2020 and published by the Architectural Science Association (ANZAScA).

977
Keerthi Priya Ramineni, Susan Ang and Sarah Shuchi
out of necessity (Solow, 1991) to obscurely coherent ideas, morphing with time, to frameworks and tools as a form of measurement. Incorporation of the global concern of sustainability in built environment disciplines can be partially reflected from the statistics (SUMAS 2019) derived from the factors that can be majorly regulated from within the built environment such as energy usage, materiality, water use, recycling, waste management, to name a few, which make up half of the global usage. This invariably led to a focus upon sustainability and sustainable development in the built environment driven from the triple agented dimensions of environmental, economic and social. The physical outcomes of the built environment tend to last for a longer time making it an intergenerational character which when used appropriately can result in working to achieve sustainability rather than adding to the factors that produce a necessity for it (Sarkis, Meade, and Presley, 2008).
Within the context of the built environment, sustainability has branched across dimensions of environment, economy and social, interconnecting and linking associated categories and sub-categories, giving conditions and character counted with a numeric scale for a building or a built environment to be considered as a prospect of sustainability (Pearce, 1999). These categorised variables have served to determine the conditioned sustainability as a form of measurement to compare and certify the scale of sustainability in the built environment quite well. Along with its prominence, the pertinence of concepts to frameworks to tools as a measure the sustainability grew over time. These tools, evolved in the last half of the century as a unit of assessment from the concepts and frameworks of sustainability and used as practical aids to evaluate and measure, collectively referred to as Built Environment Assessment Tools (BEAT).
This research paper sought to firstly, summarise current understanding of the scope of criteria of seven different BEAT from a comprehensive literature review on sustainable assessment framework. The tools most used in built environment (BREEAM, CASBEE, DGNB, HQE, LEED, SBTool, criterion analysis conducted by Bernardi et. al., 2017) and the tool only that measures the social aspect in equity to its quantitative side (DeKay’s ISD framework (DeKay 2011) and Moloney, et.al., 2017) are considered. Secondly, the focus of the research study sought to investigate social considerations as a measurable criterion of sustainability in the built environment. In addition, a light review of social sustainability definitions and applications in disciplines outside of built environment was undertaken to primarily offer reflection on how the consideration and uptake of the social criterion might be widened within the built environment. The research identified an argument for a more holistic and integral framework of sustainability be adopted within built environment design and practice. This research study is part of a larger post graduate research thesis study undertaken by the lead author (Ramineni) which had sought to understand the available literature on sustainable assessment frameworks and tools, their criteria and evidence a general oversight or lack of regard and consideration for ‘social’ dimensions in the discourse of sustainability in the built environment.
The findings of this study enabled a critical reflection upon a more holistic view of sustainability in the form of an Integral approach, introduced by de Kay (2011) theory in sustainable built environment design. The scope of relevant literature included in the review was between 1987-2020. A method of identification through absence was the principal means of identifying the gap while also that this approach has its limitations. Breaking the literature review, a study of sustainability and the tools of sustainability categorising their criterion was conducted. The findings of the previous study conducted with the tools (Bernardi et. al., 2017), in which the criterion was measured in terms of its priority within the tools, showed quantitative measures as the most covered, hinting the least inclusion or the lack of inclusion of the social dimension in them. The study was based on the six most used built environment assessment tools and their criterion was already broken down as to which are given most priority, used

978
Social Dimension of Sustainability: A Least Investigated Criterion for Built Environment Assessment Tools.
as a comparative tool to measure the social dimension indicators (Figure 2). The study investigated how social sustainability might be included in built environment assessment tools demonstrating the need for a more holistic approach and referencing examples where an integral design framework was adopted as a reference. The outcome of this research has established the evidence of a gap in the depth and complexity of current literature available on social sustainability. The research proposal was impacted by the available accessible literature on the topic of exploring sustainability and its inclusion of social aspect in the assessment tools. The research study limited itself to the scope of prominent frameworks and tools only with its scale of most used tools at national level and global level. The study for the concepts of the dimensions of sustainability is limited to the three dimensions of environment, economy and social.
2. Literature review
2.1. Sustainability and its dimensions
Working definition of sustainability in this context refers to the balance of its dimensions, or rather the equity in the balance of its three dimensions, namely environmental, economic and social. Social dimension of sustainability can be defined as the interaction quality of the social being with their surroundings tangible and non-tangible, i.e., both the physical settings and the social world. The three dimensions and the theories behind them can be explained on paper but in practice creates paradox within each dimension and each with the other dimensions given the nature of their complexity (Solow, 1991). Derived from Goodland’s (1995) definitions, all the three dimensions of sustainability are termed in context to capital and sustainability can be achieved and maintained from their interest i.e., environmental capital, economic capital and social capital.
Environmental Sustainability (ES) is rooted from the social concerns, (Goodland, 1995) is defined by the input/output rule, their balance and sustenance of each other while maintaining the natural capital, non-renewable resources, manufactured capital, non-substitutable, cost and value, and proportion of population to physical health (Goodland and Daly, 1996). Economic Sustainability (EcS) can be defined as the maintenance of financial capital and living off from its interest without depletion and with stability (Goodland, 1995), later leading to the consideration of scale as an influencing factor in sustainability. Social Sustainability (SS) can either be the first domino of making the change or the last domino falling to make the world sustainable again. Time is a factor in this regard, but the output of the fall can determine the fate of the future generations to come (Feng, Yang Deo, et al., 2019). According to Goodland (1995), social sustainability can only be achieved through community participation and strong civic society. Describing it as ‘moral capital’, he covers aspects of community, unity, cultural identity, diversity, sodality, comity, tolerance, humility, compassion, patience, forbearance, fellowship, fraternity, institutions, love, pluralism, commonly accepted standards of honesty, laws, discipline, etc., as a measure of attaining social sustainability.
Environmental dimension of sustainability is perceived as a pre-requisite for the social dimension of sustainability to be achieved (Goodland, 1995), which seems to be the major case in built environment with architecture as a response to social and environmental concerns globally (Owen and Lorrimar- Shanks, 2015). The relationship of sustainability to the built environment has shifted the focus of the fields (as defined by Bourdieu's sociology) evident from the dialogue of inclusion, exclusion and of being separate entities is a reflection from the social dynamics which lead to the rethinking of ‘sustainability’ in the field of built environment and making it more integrated (Owen and Dovey, 2008).

979
Keerthi Priya Ramineni, Susan Ang and Sarah Shuchi
2.2. Measures of sustainability in built environment
The ideology lead to concepts and theories to frameworks and tools being the instrument of assessment of sustainability in built environment. The majorly accepted framework is the TBL: Triple Bottom Line, the dimensions of triple bottom line, Profit, People and Planet, translated and evolved in built environment as Economics, Social and Environmental dimensions of sustainability. In an ideal case each dimension is weighed equally and synergy forming a ‘sustainable’ way forward but taking the present day where the sustainability is already imbalanced, would require different weightage to the response of each dimension and its interrelations to the other. The drawbacks of TBL lies not in the theory but in the form of measurement, the economic dimension can mostly be measure in quantitative terms, while the social and economic dimensions provide a challenge of quantitative and qualitative, resulting in a more subjective way of understanding.
2.3. Built environment assessment tools: an overview
A framework once structured, requires a measuring entity, this is the ‘tool’. The BEAT are the scales of sustainability in which the intangible concept is reflected to action-based response. In the ocean of tools used as a measure of sustainability in the built environment form the past few decades, not all the tools measure the same part of sustainability. The major distinction in the tools can be classified as tools that assess the life cycle and tools that measure the impact on the environment, named as Life Cycle Assessment Tools (LCA) and Environmental Impact Assessment Tools (EIA). Further classifications termed from the intention of the tool and the phase of the building (design phase, construction phase, demolition phase etc.), typology of the building (residential, commercial, industrial, recreational, mixed use, retrofitting, conservational etc.) and the software used in assessing the performance of the buildings. Tools can be broadly divided into quantitative and qualitative of measurement quantitative dealing with numeric, scaled values and qualitative dealing with relative and subjective aspects (Forsberg and Von Malmborg, 2004).
The assessment of criterion is an examination of an aspect being assessed in reference to the framework of tool being employed for the sustainability. The criterion of the assessment tools is scaled in three-part, global issues and use of resources, local issues and indoor issues (Cole, 1997). The standard measurement of BEAT developed from the categories of sustainability, sub divided into indicators (measurable entities) and aspects (identified but non-measurable). A criterion can always be measured in quantitative and qualitative. This resulted in the quantification of the social dimension into sub-categories like walkability, access etc. However, the criteria for measuring sustainability in built environment is boundless, not all aspects of the built environment are measured by the assessment tools (Day et.al., 2015). Here comes a question of prioritization of what criterion overrules the other, not to devalue the criterion rather focusing on what can be tangibly measured to see results. The criteria of the tools considered for sustainability are broadly categorised into eight parts (Cole, 1997) with slight variations of weightage depending on the purpose of the tools and its usage (local, nation or global).
The criterion developed as a base from the matrix of sustainability, to the built environment assessment tools (BEAT) are, materials, land use, water, urban context, responsibility, air, energy and wastes (Cole, 1997). The form of measurement for the criterion derived from the matrix of sustainability (Cole, 1997) sits in the quantitative measurement side and the aspects covered are aligned to the environmental dimension of sustainability. The quantitative/numeric values derived from these criteria are often translated to economic sustainability in terms of capital, investment, maintenance and demolition. The qualitative scale of measurement is often not given much weightage, leading to almost
980
Social Dimension of Sustainability: A Least Investigated Criterion for Built Environment Assessment Tools
a scant participation of the social dimension in the tools of built environment. One of the recent tools which weighs quantitative and qualitative aspects with equity is the Integral Sustainable Design (ISD), by DeKay. Developed from Integral theory by Wilber, ISD: Integral Sustainable Design (Moloney et.al., 2017), has four quadrants on varying levels later adapted into built environment. The quadrants are divided in half based on qualitative aspects and quantitative aspects as scales of measurement making the tool more integrated than the previously devised BEAT in terms of social dimension weightage. Majority of the BEAT focus on tangible quantitative aspects than qualitative aspects. Integral theory also shows the interconnections between its different levels making it a ‘holistic’ tool in comparison with other available tools (DeKay 2011) that gives equal priority to both quantitative and qualitative aspects.
3. MethodsThe research approach employed for this research was comprehensive review of existing literature to understand sustainability in built environment and the social dimension of sustainability. Secondary sources from books, online and published journal articles, published papers and internet search. The search was conducted considering, the title of the articles, abstract and the keywords and number of citations (Bernardi et. al., 2017). Importance in selection of literature was given to the studies which have already attempted the comparison of the tools’ criterion, and not the building typology the tools were used to study on, as this research focuses on criterion of the tools than the tools themselves. Why only studies which already broke down the criterion? Factors like time to the magnanimity of knowledge available in the built environment regarding the assessment tools and social conditions (COVID-19 leading to access of only online sources) has directed the research to be more effective when using the available data on the tools as the foundation, than aiming to conduct a primary research. The tools have not been tested in this research, only their criterion which has been studied regarding answering the social dimension form the secondary sources (which have used other systems of classifications for their respective research) have been considered taking the dimensions of TBL (ES, EcS, SS) as a reference of contextual comparison.
4. Findings and discussionThe three major dimensions of sustainability being environmental, economic and social are not exclusive of each other but rather, are interrelated. Each dimension has the other dimensions as part of it. Most of the environmental impact assessment tools focus their criterion in terms of environment, then economic value and social aspects with the least prominence. This has been a reoccurring pattern in the history of tools until De Kays’ Integral Sustainable Design came along and proposed a different perception of including the social dimension, its aspects and qualitative measurement as a form of measuring tool for built environment. One such tool which gives equal importance between qualitative and quantitative aspects, in comparison to the vastness of tools currently used in the world for only measuring the quantitative side, is still being explored and lacks acceptance in the field and (Buchanan, 2012). Although there is research into exploring the integral sustainable design, (Roetzel, Fuller and Rajagopalan, 2017, and Whittem and Ang, 2020), to be more integrated in-built environment, the findings of such researches often also reflect on the nature of inclusion of qualitative aspects and the social dimension and also the lack on holistic nature of the other tools measuring sustainability in built environment.

981
Keerthi Priya Ramineni, Susan Ang and Sarah Shuchi
The illustration (Figure 1) of the timeline from 1950 to 2015, comparing theories of sustainability and the BEAT, using the data for the theories form Kidd, (1992) and Kauffman, (2011), and the tools from Bernardi et. al., (2017), Moloney et.al., (2017), Masri et.al., (2015), Ding, (2008), shows the depth of the gap, and the effective nature of the current data available for the tools to be more integrated with the concepts that include all three dimensions of sustainability.
Figure 1: Comparative timeline of Theories to Tools in context of sustainability in built environment (by Authors, 2020)
4.1. Built environment assessment tools
The considerations of criterion for the tools are given each a weightage for the three dimensions and their categories varying on the framework the tool is developed from and its purpose in built environment. Many a study has been conducted on breaking down the criterion into the qualitative and quantitative contexts of built environment assessment tools (Bernardi et. al., 2017) and the qualitative non-inclusion of social dimensions (Atanda, 2019). These criterions when contextualized taking the existing criteria of the BEAT as positive terms reflect on the non-included criteria of social sustainability as a non-positive or negative open a possible direction for future exploration, reaffirming the lack of

982
Social Dimension of Sustainability: A Least Investigated Criterion for Built Environment Assessment Tools
evidence and the non-inclusivity. A detailed list of indicators contrasted (referring Figure 2) from the six widely accepted built environment assessment tools (BEAT) by Bernardi et. al., (2017) and non-inclusion of social dimension indicators taken from Atanda, (2019), were compared in context as ‘positive’ and ‘negative’ within the qualitative indicators to offer a diametric probe into the complexity of considerations for the criterion in the BEAT. This enabled a more tailored outcome from using the tools, than when taking into account only the quantifiable aspects labelled as positive as the measure of sustainability in built environment.
Figure 2: Sustainability criterion from a top down approach with a context to the aspects of quantitative criterions indicating a “positive” and aspects of social sustainability as “negative” in comparison to each
other for evaluation criteria of the tools (context illustration by Authors, 2020)
4.2. How can social dimension be explored?
The theories/concepts in sustainability are derived not from built environment but from economical and sociological fields, this shows the origin of the criterion for sustainability outside of built environment. Leading to the proposal for understanding the social dimension in built environment is to address it

983
Keerthi Priya Ramineni, Susan Ang and Sarah Shuchi
from outside of built environment, i.e., from sociology. Partial inclusion of social sustainability has been attempted on an urban scale, Colantonio (2008), providing a direction of the themes of social sustainability to be incorporated in built environment. Strengthening the social dimension, social indicators also reflect the perception of how built environment is experienced, creating synergy with the built environment and its consumers. Few of the social themes to start with, by Colantonio (2008) and Atanda (2019) are, social equity, satisfaction, participation and control, social cohesion, cultural value, identity, sense of place and culture, empowerment, participation, access, health and safety, social capital, demographic change, social mixing, wellbeing, happiness, quality of life. Although the qualitative aspects are subjective, the only way to deal with forming a measurable structure is by developing the knowledge base exploring the complexity of the social dimension both in and outside of built environment, which may not always be feasible due to the social dimension being a complex dimension, but it does not justify the non-inclusion of its criterion in the tools that measure sustainability in built environment. While it is of significance to view sustainability as a part of built environment, it is in equal gravity to perceive built environment as a part of sustainability, especially when developing holistic tools of measurement. This research may not provide a framework which can be adapted in social dimension for built environment assessment tools but aims to provide a base for further research in the exploration of it. Other components, to state a few, for social dimension of sustainability and built environment assessment tools are not researched but identified as follows:
Stakeholders: Fields of built environment, construction, current rating systems, user group, owners, political, economic, cultural etc.
Scale: Evolution of the framework of tools from a single building to the built environment, to local, national, regional and global.
Education: Inclusion as not just an area of study but as a necessity or the future generation to come.
Awareness: In not only the academic, but in professional and more importantly in the user group. Time: In terms of having records documented which may clear up the ambiguity the term sustainability faces, credibility of the rating tools in context to the many evolving today.
5. ConclusionsSocial dimension in sustainability is rather a multiplexity of parameter to deal with, though it is challenging to deal with the factors that make it subjective, the idea behind this research is to show that it is needed to be considered when accounting for achieving sustainability. Exploring the ways in which social dimensions sit in fields other than built environment provided valuable reflection and ways forward for built environment assessment tools to be more holistically sustainable in its measurement approaches. The research evaluated current available built environment assessment tools and the associated underpinning sustainable frameworks, developed from the theories as a form of measurement for sustainability regarding their inclusion of all the dimensions of sustainability. The purpose if this research is to show the prominence of the social dimension by itself and the social aspect which needs to be considered within the environmental dimension when using as a scale of sustainability. The lack social aspects in the environment becomes the evidence, solidifying the gap while also pointing out the projected benefits of inclusion from integral sustainable design.

984
Social Dimension of Sustainability: A Least Investigated Criterion for Built Environment Assessment Tools
References Atanda, J.O., (2019) Developing a social sustainability assessment framework. Sustainable Cities and Society, 44, 237-
252. Bernardi, E., Carlucci, S., Cornaro, C. and Bohne, R.A., (2017) An analysis of the most adopted rating systems for
assessing the environmental impact of buildings, Sustainability, 9(7), p.1226. DOI: 10.3390/su9071226. Brown, B.J., Hanson, M.E., Liverman, D.M. and Merideth, R.W., (1987) Global sustainability: toward definition.
Environmental management, 11(6), 713-719. Buchanan, P., (2012) The Big Rethink Part 4: The Purposes of Architecture, Architectural Review, Available from:
https://www.architectural-review.com/archive/campaigns/the-big-rethink/the-big-rethink-part-4-the-purposes- of-architecture?blocktitle=part-4&;contentid=14939 (accessed 12 July 2020).
Colantonio, A. and Lane, G., (2008) Measuring Social Sustainability: Best Practice from Urban Renewal in the EU 2008/02: EIBURS Working Paper Series November 2008, Oxford Institute for Sustainable Development (OISD)– International Land Markets Group.
Cole, R.J., (1997) Prioritizing environmental criteria in building design and assessment, Evaluation of the built environment for sustainability, 183-199.
Day, K., Rivera, M., Soler, R., Kent, C. and Kochtitzky, C.S., (2015) Transforming communities to make healthy living easier: the built environment: an assessment tool manual (an adaptation of MAPS).
DeKay, M., (2011) Integral sustainable design: Transformative perspectives, Routledge, Earthscan, London, U.K. Ding, G.K., (2008) Sustainable construction-The role of environmental assessment tools, Journal of environmental management, 86(3), 451-464. DOI: 10.1016/j.jenvman.2006.12.025. Feng, Q., Yang, L., Deo, R.C. et al., (2019), Domino effect of climate change over two millennia in ancient China’s
Hexi Corridor, Nature Sustainability 2, 957–961, DOI: 10.1038/s41893-019-0397-9. Forsberg, A. and Von Malmborg, F., (2004) Tools for environmental assessment of the built environment, Building
and environment, 39(2), 223-228, DOI: 10.1016/j.buildenv.2003.09.004. Goodland, R. and Daly, H., (1996) Environmental Sustainability: Universal and Non-Negotiable, Ecological
Applications, 6(4), pp. 1002-1017. DOI: 10.2307/2269583. Goodland, R., (1995) The concept of environmental sustainability, Annual review of ecology and systematics, 26(1),
1-24.Kauffman, J., (2011) A brief history of the sustainability science approach, National Academy of Sciences, Available
from: https://en.unesco.org/sites/default/files/sustainabilityscience_s1_p1_casestudy_joannekauffman.pdf, (accessed 17 April 2020).
Kidd, C.V., (1992) The evolution of sustainability, Journal of Agricultural and Environmental Ethics, 5(1), 1-26. Masri, M., Yunus, R.M. and Ahmad, S.S., (2015) Creating cultural innovation: towards a holistic approach in shaping
a sustainable future, Procedia-Social and Behavioral Sciences, 168, 249-260. DOI: 10.1016/j.sbspro.2014.10.230. Moloney, J., Globa, A., Wang, R. and Roetzel, A., (2017) Serious games for integral sustainable design: Level 1,
Procedia engineering, 180, 1744-1753. DOI: 10.1016/j.proeng.2017.04.337. Owen, C. and Dovey, K., (2008) Fields of sustainable architecture, The Journal of Architecture, 13(1), 9-21. DOI:
10.1080/13602360701865373 Owen, C. and Lorrimar-Shanks, J., (2015) Framing the Field: The Award for Sustainable Architecture, In Arts, Vol. 4,
No. 2, 34-48. ISSN 2076-0752, Multidisciplinary Digital Publishing Institute. Pearce, A.R., (1999) Increasing the Sustainability of the Built Environment: A Metric and Process for Prioritizing
Improvement Opportunities. UMI Dissertation Services, Ann Arbor, MI, USA. Roetzel, A., Fuller, R. and Rajagopalan, P., (2017) Integral sustainable design–Reflections on the theory and practice
from a case study, Sustainable cities and society, 28, pp.225-232. Sarkis, J., Meade, L. and Presley, A., (2008) Sustainability in the built environment: factors and a decision framework,
ResearchGate, Available from: https://www.researchgate.net/publication/228364314, (accessed 17 April 2020).

985
Keerthi Priya Ramineni, Susan Ang and Sarah Shuchi
Solow, R.M., (1991) Sustainability: An Economist’s perspective, Economics of the Environment: Selected Readings, The Eighteenth Seward Johnson Lecture (14 June) The Woods Hole Oceanographic Institution, Woods Hole, Massachusetts, USA.
SUMAS, (2019) Sustainability Statistics Worth Knowing in 2019, Available from: https://sumas.ch/sustainability- statistics/ (accessed 10 March 2020).
WCED, (1987) World Commission on Environment and Development. (Brundtland G.H., Chair.), Our Common Future, Oxford University Press, New York, New York, USA.
Whittem, V., and Ang., S., (2020), Introducing Integral Sustainable Design as a Method for Evaluation of Community Co-Design Projects, Engagement to Impact: 1st International Research Symposium on Sustainable Rural Built Environments (SRBE), iD-IDF Sustainable Rural Built Environments Research Network through the International Islamic University, Malaysia.

986
The 54th International Conference of the Architectural Science Association (ANZAScA) 2020
Space Vehicle-Building Design Process Issues and Models. A framework
Zhelun, Zhu1, Antonio Fioravanti2 and Ugo Maria Coraglia3 1, 2, 3 Sapienza University of Rome, Rome, Italy
{zhelun.zhu1, antonio.fioravanti2, ugomaria.coraglia 3}@uniroma1.it
Abstract: Human-crewed Space missions have had a renewed interest in recent years related to long- term strategies for humankind’s sustainability. It involves avantgarde scientific fields and deals with the vital problems of shielding astronauts from the hostile extra-terrestrial environment as well as to provide them comfort in order to guarantee an acceptable life quality during the Space missions. Due to these peculiarities, all extra-terrestrial dwellings are characterised by high level of technologies, punctual controls and constant maintenances. Moreover, Spacecrafts are not fully considered as “buildings” despite the crews’ long permanence and activities inside them. So far, the stringent conditions have required that their design and construction process must be tackled by mechanical and aerospace industries. From the perspective of long period missions, it is necessary to involve architects and building experts in order to enhance the user experience through the definition of more habitability and liveability requirements in Spacecrafts. This research wants to involve the participation of architects and building experts during the design process of a Space Vehicle-Building (SVB) by detecting a framework for Space architecture and construction Design Processes.
Keywords: Space architecture; Building Information modelling; design and construction process.
1. Space Favourable TimesThis paper aims to propose a framework for the design and construction process of dwellings for human activities in an extra-terrestrial environment. In the perspective of long period missions, it is fundamental to consider the dualism of those particular dwellings, which are both vehicles and buildings and therefore extend the concept of ‘building’ to manned Space vehicles: the Space Vehicle-Buildings.
Recently, there has been a favourable momentum for space missions, and the theme has gained hype on media as well as it has been financed by factories and private firms. The main Space agencies from all over the world have forecasted the extension of the human presence from low-Earth orbit to the Moon, Mars and deeper Space destinations as a long-term goal and set it as a strategic plan for the next generations (Schaffer, 2008). According to planned missions to the red planet, the duration of the journey has been estimated 180 days each way together with 60 days of in loco mission (Baldelli et al., 2016). Astronauts are going to spend almost all the time on space vehicles and that is the reason why spacecrafts should provide an effective journey at no expense of the physical and psychological wellness
Imaginable Futures: Design Thinking, and the Scientific Method. 54th International Conference of the Architectural Science Association 2020, Ali Ghaffarianhoseini, et al (eds), pp. 986–995. © 2020 and published by the Architectural Science Association (ANZAScA).

987
Zhelun, Zhu, Antonio Fioravanti and Ugo Maria Coraglia
of the crews that eventually leads to the success of the mission (Martinez, 2007). As a key issue of this challenge, it is important to take carefully into consideration the human living requirements in an extra- terrestrial environment.
Since 70’s Spacecrafts have been considered as new typology of habitation for astronauts. The architecture of dwelling for humans in low-orbit or in general extra-terrestrial environments, has been defined by Harrison (2010) as “the theory and practice of design and building environment for humans in outer Space”. At the same time, Häuplik-Meusburger and Bannova in "Space Architecture and Habitability: an asset in Aerospace Engineering and Architectural Curricula" (2016) have highlighted the role of Architects and Building Experts during the design process of Space architecture. Simultaneously, the process of designing and constructing Space architectures has to manage a higher level of complexity so consequently more efficient processes have to be applied.
This paper focuses on manned Space Vehicle-Building – from now on SVBs – which allow crews to stay a long period in the orbit, like the International Space Station, or Space vehicles used for reaching far destinations (Figure 1).
Figure 1 : Examples of Space Vehicle-Building – SVB. SVBs are very complex engineering systems that deals with many scientific disciplines (Won et al.,
2001). Their design, construction and development must consider the dual characteristic of being a vehicle and a building at the same time. The design and building processes of SVBs should therefore take into account not only this dualism, but all disciplines equally important; so to be effective it is needed a synergic collaboration between Architects, Engineers, Health experts and so on. For this reason, the design process should consider problems of coordination between specialists in a Collaborative design paradigms (Gianfranco Carrara. et al., 1997; Gianfranco Carrara and Fioravanti, 2002).
988
Space Vehicle-Building Design Process Issues and Models - A framework
To work on an enterprise as such it needs a great effort in coordination, especially when the project is progressively defined, under unexpected and unavoidable changes. As a matter of fact, in advanced, intertwined and ever-changing fields from components, technologies, economic factors, changes are normal conditions (Moayeri et al., 2017). In fact, the key factor of project delays, loss of its quality and arising costs in both Aerospace and AECO sectors is represented by unsuitable management, shortcomings and conflicts among involved actors (Penttilä, 2009; Xu et al., 2013).
According to above cited literature, it is vital to individuate an efficient collaboration strategy between involved disciplines. Further, a common platform of data exchange among actors is needed.
Moreover, the present methodology wants to propose an alternative design process which should enable designers to take advantage of BIM capabilities based on knowledge. Therefore, the BIM methodology needs to be extended to a wider field, introducing “Space Vehicle-Building Modelling (SVBM)”.
2. SVB specificationsAs mentioned before, although many spacecrafts can be considered as a dwelling due to the presence of astronauts for a long time period, it is also a vehicle that performs transportation functions. The Fig. 1 shows examples of buildings, spacecrafts and then SVBs. It is important hence to make many important considerations in order to identify and analyse those dissimilarities.
1. SVBs deal with objects which are endowed with a propulsion system that allows them to movefrom one point to their destination or maintain a certain position in an orbit. This is a fundamentaldifference from an ordinary building, and it induces to inquire about the stability of a vehicular- building during its movement. It is necessary therefore to simulate and analyse the whole entity under mechanical efforts and dynamic studies. 2. SVBs could be isolated systems that need to keep their tightness from their surroundingenvironment. Special equipment, like air and water recycling units, temperature and humiditycontrols, biological waste collections, must be integrated during the design and construction phasewhile they must be constantly monitored in their uses. 3. SVBs have to be built with modern and innovative construction methodologies. They must assuremany performance requirements which are hard-to-reach using traditional technologies andconstruction methods. Materials like bricks or concrete have not been considered yet due their unitweight and/or their technical performances like isolation capacity. 4. Raw materials are difficult to be provided and take their time to be delivered. Sustainabilityprinciples in Space Vehicle-Buildings are therefore essential and must be taken into consideration. Renewable energy sources like the solar one must be part of the whole building system. 5. Due to cargo restrictions and/or less weight efforts, Space Vehicle-Buildings often deal with limited habitable volume which is defined as “the free space that one can maneuver around within aspacecraft. This excludes any volume occupied by equipment” (Porter & Bradley, 2016). Together withthe point 2, space limitation and its closure are key factors that determinate an Isolated and ConfinedEnvironment (ICE) which compromises a dwelling’s liveability performance (Häuplik- Meusburger, S.et al. 2017). 6. SVBs that leave the Earth’s atmosphere are subjected to zero or microgravity condition. This means that there could not be a reference plane which is commonly defined “floor one”. Since in

989
Zhelun, Zhu, Antonio Fioravanti and Ugo Maria Coraglia
zero gravity environment it is possible to move among all x, y and z directions, each surface could be used. 7. In order to face up the particular and lethal environment in outer Space, it is necessary to provide dedicated shelters. As a matter of fact, outer Space is featured by radiation exposure and possiblecollision of meteorites. By defining those dissimilarities of a Space-Vehicle Buildings from terrestrial ones, it is possible to have
a better comprehension of these objects. Furthermore, these features contribute to delineate the field of investigation for Space Architecture.
3. State of the artIn Aerospace and Mechanical Industries, the design framework is mostly supported by the software CATIA, developed by Dassault Systèmes which allows to cover the entire process life cycle of the project (Daneshjo et al., 2012). It was born as a CAD based platform with considerable experience in simulations, then moved to a more mature mechanical information system that was integrated with Computer Aided Engineering (CAE) and Computer Aided Manufacturing (CAM) systems (Naprstkova, 2011). Furthermore, it was endowed with several sets of human ergonomic models which can simulate an optimal utilization of the design (Yogasara, 1999).
Afterwards the CATIA, Gehry and Partners pioneered its use in architecture and eventually has been exploited in AEC field by Gehry Technologies, founded in 1990s. The developed software ‘Digital Project’, allows an accurate control of complex projects and makes possible a considerable effort/cost reduction of the design process (Shelden, 2002). An outstanding example has been the Walt Disney Hall in Los Angeles where by means of the design process the curved façade skin have been approximated by large flat tiles 50%, simple curved ones 45% and double curved ones 5% (Dillet, 1994) that led to a considerable cost reduction. In the perspective to provide a valid design support to all building, BIM methodology implementation has been adopted by ‘Digital Project’ (Gehry et al., 2020).
As a matter of fact, the increasing performances required in contemporary AECO industries make buildings become more and more complex systems. For this reason, the BIM methodology has gained momentum inasmuch it allows “the generation and management of digital representation of physical and functional characteristic of a facility” (BuildingSmartAlliance, 2015). Moreover, the requirements from AECO sector pushed forward the development of BIM methodology which is able to manage the 5th (costs) and 6th (energy and sustainability) ‘dimension’ (Charef et al., 2018).
Aziz et al. (2016) have suggested the benefits of applying BIM methodology to Facility Management (FM), which are: effective operational costs, shorter times for decision making, more resources for decision making, better documentations, collaboration and work flexibilities, clash detections and updated information .
The managing of these characteristics and functions are vital in a complex system like Spacecrafts (Won et al., 2001), and in particular in a SVBs, which involves even more professions. So far, the strategy of managing different disciplines that deal with processes, models and tools to handle complex engineering projects is called System Engineering (Guo, 2010).
In particular, Polit-Casillas and Hove (2013) from Jet Propulsion Laboratory of California Institute of Technology, have experimented the application of BIM methodology together with the Systems Engineering Language (SysML) for a virtual Construction of Space Habitats. The authors have defined the Virtual Space Construction Process (VSC) which is a specific BIM based approach for aerospace design

990
Space Vehicle-Building Design Process Issues and Models - A framework
workflow (Figure2). It is possible, therefore, a bi-directional connection between complex-relationships management based on system engineering language like SysML and CAD models through BIM environment. The researchers have then reported the modelling process and many technical simulations of Multi-Purpose Logistics Module (MPLM) from the International Space Station (ISS) using the VSC approach.
The mentioned evidences show that BIM methodology is a promising methodology during the design process for complex buildings. Together with other benefits from application of this methodology, BIM should be considered as a valid, although limited, design support of Spacecraft dwelling and it should be adopted in Space architecture.
Figure 2: Lifecycle of aerospace hardware development according to VSCP (Virtual Space Construction Process), Polit-Casillas and Howe, 2013
Nevertheless, there are strong differences between a terrestrial building and a Spacecraft. Considering those dissimilarities and recognizing the livability and habitation issues are essential requirements of a manned Space vehicle, this paper is going to introduce a framework for Space architecture: The Space Vehicle-Building Modelling, SVBM.
4. Proposed model
4.1. Involvement of Architecture and Building experts in Space Architecture
The application of concepts of Knowledge, Semantics and Ontologies is vital in the design and construction process of a Collaborative design (Carrara and Fioravanti, 2009), which is strongly required

991
Zhelun, Zhu, Antonio Fioravanti and Ugo Maria Coraglia
in Space Architecture. This is the reason why the proposed model wants to extend the BIM methodology, which is a well-known design strategy among AEC industries, for SVBs. The dissimilarities from ordinary buildings, reported in the above paragraph, must be considered during the design and construction process and so does in the proposed methodology, which becomes “Space Vehicle-Building Modelling”, SVBM.
SVBM must be able to communicate with Aerospace and Mechanical knowledge and, at the same time, enable the management of habitability and liveability requirements by Architecture and Building experts. To facilitate the communication, a common data exchange format is needed. The Figure 3 shows the data-exchange flow between operators, which are represented by the Aerospace and Mechanical industries, the Architecture and Building experts and the Manufactures, can be supported by Industry Foundation Classes (IFC) format (“View and Convert 3D CAD files”).
Figure 3: Communication between operators
4.2. Role of SVBM
It is a common agreement about benefits of using a BIM methodology in the AEC industry where data can be queried during a building’s whole life cycle by involved actors. The interoperability capability at data level of this methodology allows experts from different disciplines to manage the same building objects, to improve dialogues among them and to speed up the decision-making process. Thus, the proposed framework wants to take advantage of those benefits during the design and construction process of SVBs.
In the design phase, a common platform of SVBM methodology should be based on Knowledge, making the interdisciplinary collaboration easier, reducing the incongruence and facilitating the multidisciplinary collaboration (Fioravanti, 2006). The benefits can be the reduction of time and effort during the design phase as well as the raise of quality of the project. Moreover, the knowledge-based platform, together with concepts of Agents, will enhance the level of accuracy of performance simulations, allowing a more realistic testing result (Simeone et al., 2013). In the second place, the enhancement of collaboration between all involved disciplines can speed up the processes as well as economic benefits in design investments.

992
Space Vehicle-Building Design Process Issues and Models - A framework
During the construction phase the SVBM should represents a dynamic and interactive model allowing a more accurate realization, coordinate the time schedule and reduce the construction cost. (Chen & Luo, 2014).
There can be several applications of SVBM during the operation phase. For instance, it can enable interactive data storage and visualization, trough incessant data updating by users and/or devices allowing an efficacy facility management. In Space Architecture, which is featured by extreme conditions, it could be vital making the dwellings able to interact with its users, environmental conditions and the maintenance survey. This implementation has already been used in building exploiting data input through sensors, algorithms as “black-box” that elaborates data and then actuators as output (Trento et al., 2019).
4.3. SVBM conceptual framework
The Figure 4 shows the conceptual framework of SVBM during its lifecycle. The Knowledge from specific disciplines constitutes the base for definition of requirements, which by
means of synthesis and performance simulations, reaches the modelling of the final elaboration of entities. A SVBM should therefore be a composition of ontologies and semantics that expresses the meaning of instances.
The SVBM should provide a dynamic and interactive data visualization and extrapolation of objects. Inasmuch it is endowed with Knowledge, this methodology should behave like an intelligent database allowing users to simulating and obtain needed information during the design, construction and utilization phase.
A SVBM model needs to be continuously updated in every phase of its life cycle. All changes during the design phase, variations during the construction, and data gathering during the utilization should be recorded.
The enhancement of the SVBM model may contribute to reach Knowledge achievement. The data gathering during the life cycle, including the design strategies, construction technologies, functional usages and members behaviors, could be recorded in order to enable new acquaintances in Space Architecture and therefore, development of further Knowledge.
Figure 4: Conceptual framework of Space Vehicle-Building Modelling – SVBM.

993
Zhelun, Zhu, Antonio Fioravanti and Ugo Maria Coraglia
4.4. SVBM requirements
The dissimilarities of SVB obtained in the previous section represent the definition of this new typological habitations. Moreover, they constitute also arguments that must be tackled with an appropriate design strategy. The proposed methodology, SVBM, should take advantages from advanced design strategies and capabilities from traditional BIM, at the same time fulfill new requirements.
1. The integration with a mechanical system has been partially tackled in the AECO sector, forexample by Calatrava’s motion buildings. In SVBs, the entire system could be dynamic.Therefore, the interoperability issue, through IFC, with mechanical/rockets engineeringsector is vital.
2. Due to the limited available spaces in SVBs, each piece of the technological systems has to be designed as an integrated and multipurpose entity. In order to allow prompt maintenance,SVBM should be endowed with an integrated sensors network and an automatized reactingsystem that interacts with users’ needs and environment changes.
3. The integration with innovative construction methods and building management isdemanded.
4. The SVBM requires a performative energy control and simulation strategy.5. In order to take into consideration human factors, the SVBM should allow complex model
analysis like human behaviour simulation and perceptive studies through advanced designstrategies and technologies, i.e. agent-based intelligences, Augmented Reality, VirtualReality.
6. The micro or zero gravity environment allows users to move equally among all 3 axes, SVBIM should consider this feature and consequently evaluate related issues like the colocation ofthe reference plan.
7. The SVBM should allow to verify structure and radiation exposure resistance as well as othersimulations of external hazards that may compromise the safety and liveability of SVB.
To manage a complex system like SVB, a unifying rule is needed in order to make collaboration between disciplines efficient and possible. This goal could be reached through a Knowledge-based structure as defined by Carrara and Fioravanti (2009). The SVBM methodology is therefore the very first step toward a more advanced design support tool.
5. Future developmentsThe proposed framework needs to be supported and validated with a real project. This work must be achieved only with the support of the Aerospace and Mechanical Industry which can provide more accurate technical information which are hardly procurable. Only through a synergic cooperation between actors, this framework based on collaboration of each environment can be tested.
During the definition of SVBs, the authors have noticed that part of the considerations made in this research could be extended to a wider field. Although this work starts with focusing on Space Vehicle- Buildings, it is possible to apply achievements of this research to many other manned vehicles. As a matter of fact, the points 1-5 of the Space Vehicle-Buildings definition could also describe Isolated and Confined systems like submarines and airplanes which operate in harsh and particular conditions. All these habitations must perform human accommodation duties in an uncommon environment, and, at

994
Space Vehicle-Building Design Process Issues and Models - A framework
the same time, need to provide functions of a vehicle. This means that this framework is worthy of further researches due to its possible future application and benefits. It is possible then to think about a more general definition of Vehicle-Buildings as well as their framework, VBM.
6. Discussion and conclusionFrom the perspective of further exploration in outer Space, it is reasonable to imagine extra-terrestrial human settlements for the following generations. According to todays’ technologies, moving from Earth to other planets requires several months and Space pioneers are going to spend a huge amount of time on their Space vehicles. Spacecrafts with crews should be therefore designed in order to maximize safety and livability. This research proposes to recognize manned Space vehicles as field of investigation of Space architecture and therefore to be considered as a new typology for human dwelling where design and constructive methodologies used so far cannot stand the pace with encountered problems.
The result of this research is the definition of a conceptual framework for Spacecrafts of next generations, which are different from an ordinary habitation. These dissimilarities then have been then considered as the requirements of this advanced methodology.
The proposed framework aims to involve the systemically participation of architects, building experts and health experts, into the design, construction and operating processes of SVBs. The collaboration of these professions, which have already started to contribute in this avantgarde field, is essential in order to develop a possible scenario of a futuristic human settlement and therefore, the extension of human presence in outer Space.
References Aziz, N. D., Nawawi, A. H., & Ariff, N. R. M. (2016). Building Information Modelling (BIM) in Facilities Management:
Opportunities to be Considered by Facility Managers. Procedia - Social and Behavioral Sciences, 234, 353– 362. https://doi.org/10.1016/j.sbspro.2016.10.252
Baldelli, M., Brown, S., Ferrero, A., Hardy, O., Henson, R., Menghini, L., Bertran, G. M.-T., Pisacreta, J., Silvestrelli, S., Volponi, M., & Zailani, A. (2016). A feasibility Study for A short Duration Himan Mission to the Martian Surface. Acta Futura, 91–107.
BuildingSmartAlliance. (2015). Natinonal BIM Standard-United States Faktaark. National BIM Standard-United States ®, 2. www.nibs.org
Carrara., Gianfranco, Fioravanti, A., & Novembri, G. (1997). An Intelligent Assistant for architectural design studio. Challenges of the Future, Proceedings of 15th ECAADe Conference, Wien. http://info.tuwien.ac.at/ecaade/proc/carrara/carrara.htm
Carrara, G., & Fioravanti, A. (2009). Knowledge based collaboration for cross-disciplinary architectural design. Computing, Cognition and Education: Recent Reseach in the Architectural Sciences, 75–84.
Carrara, Gianfranco, & Fioravanti, A. (2002). ‘Private Space’ and ‘Shared Space’ Dialectics in Collaborative Architectural Design. Collaborative Decision-Support Systems, Focus Symposium and InterSymp-2002 Conference Proceedings, Baden-Baden, 27–44.
Charef, R., Alaka, H., & Emmitt, S. (2018). Beyond the third dimension of BIM: A systematic review of literature and assessment of professional views. Journal of Building Engineering, 19(May 2020), 242–257.
Chen, L., & Luo, H. (2014). A BIM-based construction quality management model and its applications. Automation in Construction, 46, 64–73. https://doi.org/10.1016/j.autcon.2014.05.009
Daneshjo, N., Korba, P., & Eldojali, M. (2012). The CATIA design process, design and manufacture in aviation. Transfer of Inovation, 23(23), 194–196.
Dillet, M. (1994). Entretien avec Frank.O. Gehry. Techniques & Architecture, août-septe, 18–23. Fioravanti, A. (2006). An e-Learning Environment to Enhance Quality in Collaborative Design. Architecture and

995
Zhelun, Zhu, Antonio Fioravanti and Ugo Maria Coraglia
Modern Information Technologies, 1–12. Gehry, F., Lloyd, M., & Shelden, D. (2020). Empowering Design: Gehry Partners, Gehry Technologies and Architect-
Led Industry Change. Architectural Design, 90(2), 14–23. https://doi.org/10.1002/ad.2542 Guo, J. (2010). Incorporating Multidisciplinary Design Optimization into Spacecraft Systems Engineering. 8th
Conference on Systems Engineering Research, January 2010, 314–323. Harrison, A. A. (2010). Humanizing outer space: architecture, habitability, and behavioral health. Acta Astronautica,
66(5–6), 890–896. https://doi.org/10.1016/j.actaastro.2009.09.008 Häuplik-Meusburger, S., Binsted, K., Bassingthwaighte, T., & Petrov, G. (2017). Habitability Studies and Full Scale
Simulation Research: Preliminary Themes Following HISEAS Mission IV. 47th International Conference of Environmental Systems, July, 1–17.
Häuplik-Meusburger, Sandra, & Bannova, O. (2016). Space Architecture and Habitability: an asset in Aerospace Engineering and Architectural Curricula. Acta Futura, 9–22. https://doi.org/10.2420/ACT-BOK-AF04
Martinez, V. (2007). Architecture for space habitats. Role of architectural design in planning artificial environment for long time manned space missions. Acta Astronautica, 60(4-7 SPEC. ISS.), 588–593. https://doi.org/10.1016/j.actaastro.2006.09.034
Moayeri, V., Moselhi, O., & Zhu, Z. (2017). Design Change Management Using BIM-based Visualization Model. International Journal of Architecture, Engineering and Construction, 6(1), 1–11. https://doi.org/10.7492/ijaec.2017.001
Naprstkova, N. (2011). Using of catia V5 software for teaching at faculty of production technology and management. Engineering for Rural Development, 554–557.
Penttilä, H. (2009). Services in Digital Design: New Visions for AEC-Field Collaboration. International Journal of Architectural Computing, 7(3), 459–478. https://doi.org/10.1260/147807709789621257
Polit-Casillas, R., & Howe, A. S. (2013). Virtual Construction of Space Habitats: Connecting Building Information Models ( BIM ) and SysML. American Institue of Aeronautics and Astronautics, 1–19.
Porter, S. J., & Bradley, F. (2016). Architectural Design Principles for Extra-Terrestrial Habitats. Acta Futura, 23–35. https://doi.org/10.5281/zenodo.202160
Schaffer, A. M. (2008). What do nations want from international collaboration for space exploration? Space Policy, 24(2), 95–103. https://doi.org/10.1016/j.spacepol.2008.02.004
Shelden, D. R. (2002). Digital surface representation and the constructibility of Gehry’s architecture. Doctorate Thesis. https://dspace.mit.edu/handle/1721.1/16899
Simeone, D., Kalay, Y. E., Schaumann, D., & Carrara., G. (2013). Adding users’ dimension to BIM. EAEA, 483–490. Trento, A., Wurzer, G., & Coraglia, U. M. (2019). A Digital Twin for Directing People Flow in Preserved Heritage
Buildings. ECAADe 37, 561–568. https://doi.org/10.5151/proceedings-ecaadesigradi2019_479 Won, C. H., Sale, D., Schultz, R. R., Johnson, A. F., & Semke, W. H. (2001). Spacecraft systems engineering - The
initiation of a multidisciplinary design project at the University of North Dakota. ASEE Annual Conference Proceedings.
Xu, Y., Malisetty, M. K., & Round, M. (2013). Configuration management in aerospace industry. Procedia CIRP, 11, 183–186. https://doi.org/10.1016/j.procir.2013.07.052
Yogasara, T. (1999). The use of computer aided design (catia v5 r8) for ergonomics analysis. 356–364.

996
Spaces of Empowerment: Shaping Inclusive Public Places through Decolonising Participatory Design in Aotearoa New Zealand
Spaces of Empowerment: Shaping Inclusive Public Places through Decolonising Participatory Design in Aotearoa New
Zealand
Rosie Evans1, Dr. Adele Leah2 and Dr. Emina Kristina Petrović 3 1, 2,3 Te Herenga Waka Victoria University of Wellington, Te Whanganui a Tara Wellington,
Aotearoa New Zealand [email protected]
{adele.leah,2 emina.petrovic3}@victoria.ac.nz
Abstract: How can the architectural sciences contribute to reducing inequalities and thus shape sustainable cities and communities? This paper proposes that one mechanism in this process is to empower people through inclusive participatory design process. In Aotearoa New Zealand this means new ways of designing are needed, that are genuinely inclusive of the public, and rooted in partnership with indigenous people. This paper integrates existing knowledge, original input from indigenous and public architecture professionals, and insights gained from design explorations. It aims to unpack some of the key dynamics in participatory processes in Aotearoa New Zealand. Elements of an integrated framework are proposed, alongside seven actions toward decolonising participatory design that could help shape future design thinking, and thus contribute to strengthening the inherent interconnections between architectural and social sciences. The findings demonstrate the potential to empower communities through genuinely inclusive participation, and the production of distinctive, meaningful public places.
Keywords: Participatory design; decolonisation; public engagement; urban design.
1. IntroductionParticipatory design is concerned with empowering communities through collaborative design processes towards good design outcomes and more sustainable ways of living (Hoddinott, 2018; Sanders and Stappers, 2008). Good participatory design facilitates the expertise of communities to shape the design process, typically using workshops and consultation. It engages people in ‘meaningful and purposive adaptation and change to their daily environment’ (Sanoff, 2007). Internationally, the landscape of design practice is evolving from user-centred approaches towards co-design, and in doing so, ‘creating new domains of collective creativity’ (Sanders and Stappers, 2008). Positive outcomes of participatory design include greater connection to, and ownership of, new places (Rennie, 2017), and the establishment of new collaborative connections across existing societal networks which leads to greater societal
Imaginable Futures: Design Thinking, and the Scientific Method. 54th International Conference of the Architectural Science Association 2020, Ali Ghaffarianhoseini, et al (eds), pp. 996–1005. © 2020 and published by the Architectural Science Association (ANZAScA).

997
Rosie Evans, Dr. Adele Leah and Dr. Emina Kristina Petrović
sustainability (Smith and Iversen, 2018; Dindler and Iversen, 2014). Such processes that strive to generate built environment design partnered with or governed by the community, take special care to include groups who may historically have been excluded (Sanoff, 2007). While achieving a totally inclusive process may be an impossibility (Mouffe, 2007; Till, 2005), this approach to design makes a shift towards increased inclusion. Councils across Aotearoa New Zealand (hereafter referred to as Aotearoa) are committed to the increased use of participatory design methods in the design of public places (Wellington City Council, 2017; Christchurch City Council, 2016).
One of the largest challenges facing Aotearoa in regards societal sustainability is decolonisation (Tomlins-Jahnke, 2011; Campbell, 2011; Consedine and Consedine, 2001). Decolonisation originally referred to the ‘formal process of handing over the instruments of governance to the indigenous inhabitants of a colony (Smith, 1999)’. However in former colonies such as Aotearoa, where the colonisers now form a majority settler population (Huygens 2016), decolonisation has become a process involving ‘the bureaucratic, cultural, linguistic and psychological divesting of colonial power (Smith, 1999)’. Such processes of decolonisation are long term ones (Smith, 1999) and may be pursued across different domains and at multiple levels; from the ‘macro-international level of geopolitics (Kho, 2017)’, through societal scales down to the intimate level ‘pertaining to the interiority of the individual person (ibid).’ In built environment design in Aotearoa this process currently manifests through efforts to recognize and combat negative effects of colonisation, and enact changes which centre partnership and value indigenous knowledge. For example the New Zealand Institute of Architects’ (NZIA) recent commitment to decolonial efforts through the signing of Te Kawanata o Rata, a covenant with Ngā Aho, the Māori Designers Network.
Participatory design theory originates from western design traditions, initially from 1960s Europe, and latterly North America (French et al., 1960; Pateman, 1970; Luck, 2018). Subsequently, the power dynamic the literature supposes between governance and public, does not include a treaty partner in power, which poses challenges for its practice in Aotearoa. There is a gap in the literature regarding the shape of participation led by indigenous and governance in partnership, this is the focus of this paper.
Literature advocates inclusion strategies in participatory design processes to ensure productive and ethical engagement with minority groups (Sanoff, 2007). While such strategies could be adapted to serve Māori in Aotearoa, given the foundational nature of the Treaty relationship this project instead considers it desirable to develop a field of participatory design discourse which centres Treaty values and dynamics. Established inclusion strategies are of course vital regarding engagement with minority groups across society in Aotearoa – both within Māori and tangata Tiriti (people of the Treaty / non-Māori New Zealander) groups, however these discussions are outside the scope of this paper.
Providing further motivation is Brereton, Roe and Lee Hong’s assertion that design processes which explore indigenous values lead to more successful projects (2012), which suggests that the explicit development of a Tiriti-centric approach to participatory design that engages Māori values will improve design outcomes for public projects.
The actions advocated in this research may add time and cost to projects in the short term. This research asserts that councils and government need to put more resource into public participation in design if they are truly committed to ethical participatory process and sustainable design outcomes.
1.1. Methodology
This research was spurred by one researcher’s involvement with The Arcades Pathway Project, a participatory design project by Te Pūtahi – Christchurch Centre for Architecture and City-making in 2016-

998
Spaces of Empowerment: Shaping Inclusive Public Places through Decolonising Participatory Design in Aotearoa New Zealand
2017, at The Commons in Ōtautahi Christchurch, a council site in the city centre. The project involved stakeholder engagement, two stages of public participation, interpretation and the design of a pathway which was never built.
The research method involved developing a case study of The Arcades Pathway Project by undertaking a literature review and interviews. Two participatory design consultants and two project architects from the case study were interviewed, along with Matapopore Charitable Trust – who represent Ngāi Tūāhuriri (the local mana whenua (tribal group with territorial rights and responsibilities over an area)) in co-design projects and cultural consultancy in Ōtautahi Christchurch; two urban design experts; and an Ōtautahi Christchurch based Māori artist and arts educator who identifies as manuhiri (guest) in Ōtautahi. Thematic analysis (Braun and Clarke, 2006) of participatory data and professional notes from The Arcades Pathway Project were used to generate design explorations. In concert, these actions prompted the development of elements of an Aotearoa-specific participatory design model.
1.2. Aotearoa New Zealand participatory design literature review
Current literature locating the role of Māori in participatory design focuses primarily on the creation of Māori spaces. Awatere, Rolleston and Pauling (2011) advocate participation in developing design principles for papakāinga (village, collective or communal housing); Jade Kake (2019) advocates a consensus design model, also for papakāinga; Ricketts (2008) illustrates the benefits of participatory design for Māori communities, and Marques, MacIntosh, Grabasch and Campays (2017;2018) describe steps in collaborative design-led research and participatory design with indigenous communities in Australia and Aotearoa. Kiddle (2019) identifies the need for
‘more projects, more pilots, more methodological testing to push the boundaries of placemaking in Aotearoa cities in ways that privilege indigeneity.’
However, none specifically address te Tiriti in participatory design practice regarding public projects where Māori participants are the minority.
2. The need for, and approach to, an Aotearoa-specific framework forparticipatory designAotearoa’s Treaty partners have differing world views and traditions of design and democracy, key concepts in participatory design. Exemplifying this philosophical difference, Kake (2019) argues that consensus is suited to a kaupapa Māori design process (design process in line with Māori world view), however, much western literature on participatory design sees consensus as necessarily exclusionary and therefore at odds with participatory design aims (Keshavarz and Ramia, 2013).
Indeed, design by consensus, which Kake advocates as aligned with Māori values, is described by Keshavarz and Ramia (2013) as ‘potentially irreconcilable with change processes involving emancipation from oppressive norms and traditions’, as a matter of political philosophy, drawing on Ehn (1988).
Contemporary strains of participatory design literature which focus on a dissensus approach seek to ‘address the conflictuality inherent in coexistence (Keshavarz and Ramia, 2013)’, and are concerned with ‘possible forms of politics that make democracy meaningful as an ongoing struggle rather than as a fixed state or goal (ibid.).’ This approach is underpinned by the idea that ‘democratic theory needs to acknowledge the ineradicability of antagonism,’ and at the same time ‘the impossibility of achieving a fully inclusive rational consensus (Mouffe 2007).’

999
Rosie Evans, Dr. Adele Leah and Dr. Emina Kristina Petrović
In this Treaty based democracy, where increased participation in design is seen as desirable (WCC, 2017: CCC, 2016), how might a participatory design process nurture multiple world views, and enable inclusive participation that furthers our Treaty partnership? We propose that further development toward an Aotearoa specific framework for participatory design is required.
Such a framework is likely to be values based and situational. Luck (2007) writes that ‘participatory practice is not vested in a method or role, but in the context of a situation’, as such, this project proposes that any framework be responsive to its place and participants. Māori design frameworks such as the Matapopore Urban Design Guide (Matapopore, 2015), Te Aranga Principles (Auckland Council, 2020), and Māori urban design principles for papakāigna development (Awatere et al., 2011) take a place-specific values-based approach to shaping design.
Helen Verran’s attention to ‘going on well together in difference’, offers insight to us (Verran, 1998, 1999, 2001). As explored by Joks and Law (2017) in relation to conflicts arising from disparate world views between the indigenous Sami people and biologists in Norway, the concept of care can be employed to bridge cultural divides and facilitate both progress and difference.
Care crosses cultures as a concept of value, and may be the catalyst for an inclusive participatory design model. Campbell (2011) reflects on the potential of the contemporary partnership of tangata whenua (indigenous people) and tangata Tiriti through the concept of manaakitanga, ‘reciprocal, unqualified caring (Ritchie 1992, in Campbell, 2011), which is grounded in maintaining and enhancing mana.’ Mana, being a supernatural force in a person, place or object, often translated as status, power or prestige (Māori Dictionary, 2020). Described in the frame of a marae encounter, which becomes metaphor for the country, Campbell states that manaakitanga elevates the mana of both tangata whenua and manuhiri, ‘hosts’ and ‘visitors’ respectively, and in the process, the relationship is enhanced also.
It is this type of relationship that Aotearoa specific participatory design should aim to facilitate, where the mana of all participants, and the quality of their relationships are enhanced, and where Māori and Tangata Tiriti comfortably inhabit their identities as tangata whenua and manuhiri in partnership.
The work of Verran, Joks and Law, and Campbell (year?) suggests societies can ‘go forward together in difference’, where a commitment to the relationship, and a commitment to care or manaakitanga is the understood unifier. It is from this position, of valuing care, and seeking a pragmatic path forward, that this research acts.
3. Seven actions decolonising Aotearoa participatory designDeveloping this further, the question is, what are some actions that designers, tangata whenua, and institutional clients can take, which centre care and manaakitanga in Aotearoa participatory design? This research has identified seven actions, which represent a beginning to this mahi (work).
It is of note that this paper has been developed in extension of design research regarding a prominent council owned central city site of significance to mana whenua. As such, it speaks primarily to design processes for significant projects on public sites. However, it is envisaged that the actions outlined may be adapted for smaller and private projects.

1000
Spaces of Empowerment: Shaping Inclusive Public Places through Decolonising Participatory Design in Aotearoa New Zealand
Table 1: Seven actions decolonising Aotearoa participatory design
Action Essence 1. Relationship building with
Mana Whenua - Relationships must be developed between mana
whenua, institutional clients and designers beforecollaborative design is possible
- This can take years
2. Project must be developed inpartnership with Manawhenua at ‘Stage 0’
- Mana whenua must be part of the process from theoutset
- Project must be developed and conducted in partnership
- Mana whenua to define their own role in hosting events
3. Project rooted in understanding of Mana Whenua aims and value systems
- Institutional clients and designers must be familiar withMāori concepts, and willing to learn
- Some hapū (kinship group or subtribe - the primarypolitical unit in traditional Māori society) havedeveloped design principles already, others will requiretime and support to develop these, should this approachbe appropriate
- Mutual understanding of role definitions andboundaries
4. Protection and promotion ofmana whenua aims throughparticipatory design process
- Opportunity to increase cross cultural understanding / develop sustainable society
- Amelioration of harm- Maori to be explicitly included
5. Integration of mana whenuain evaluation at each designstage
- Mana whenua to be engaged in design evaluation ateach stage of design, independent from the public, andgiven opportunity to impact the design
- Upholds mana, autonomy, and enhances manawhenua/client/designer relationship
- Safeguards design process from cultural appropriationand misinterpretation of mana whenua values
- Iterative design requires iterative feedback
6. Paying mana whenua - money and prestige
- Mana whenua must be paid for their time and expertise as cultural consultants
- Credit must be given to mana whenua as project partners
7. Specific invitation extendedfrom mana whenua tomātāwaka / taura here (Māori who live outside their tūrangawaewae (homeland))
- Genuine invitation to mātāwaka / taura here can only beextended by mana whenua
- It is important to ensure all public do feel empowered to participate

1001
Rosie Evans, Dr. Adele Leah and Dr. Emina Kristina Petrović
The following sections expand on the proposed actions decolonising Aotearoa participatory design.
3.1. Relationship building with mana whenua
‘Achieving integrated urban outcomes, and meeting Māori aspirations requires an ongoing commitment to ensuring Māori involvement and activity in the design of sustainable settlements (Awatere et al. 2011).’
This requires strong relationships between mana whenua, institutional clients and designers, which naturally requires extensive relationship building. As ‘architectural practice narrowly accommodates time needed for community understanding, engagement and approvals,’ (Della Costa, 2019), this will challenge traditional design time frames. Relationship building may include understanding place through walking, social interaction with the wider family and tribe and sharing food (Marques et al. 2017:2018) and may take place over a number of years. Trusting relationships form the bedrock for sustainable and respectful design, and require active effort.
3.2. Project must be developed in partnership with Mana whenua at ‘Stage 0’
Participatory design projects on publicly owned sites must be conducted in partnership with mana whenua. Mana whenua have a different role to that of a general stakeholder, particularly in the public sector, given their statutory partnership (Church 2017). To achieve the most robust design process, and ‘ensure the inclusion of mātauranga Māori, Māori aspirations and values’ (Kiddle, 2019), this partnership must be in effect from ‘Stage 0’ of the design process. Smith and Iversen (2018) state that a participatory design project can be sculpted at this early stage to promote and protect desirable outcomes for social sustainability. Indeed, they propose that it is impossible not to sculpt the project to some extent at the outset, during the development of ‘Stage 0’, which precedes public participant involvement. This study therefore recommends mana whenua are embedded in partnership in these early stages, and thus afforded instrumental position in the shaping and direction of the project. It is desirable also that mana whenua define their own role in the hosting of participatory design events.
3.3. Project rooted in understanding of Mana Whenua aims and value systems
The project must be rooted in understanding of mana whenua aims for the site, the area and the people. This requires designers and clients to have understanding, willingness and learning. Urban designer Tim Church (Ngāi Tahu) (2018) describes,
“(it’s about) having the consultants with that sensibility to cultural values and cultural design because you know it's quite a big leap for some consultants to bring on some of those concepts.”
It is key that clients and designers understand where boundaries lie regarding the cultural appropriateness of various work, that mana whenua are comfortable this understanding exists, and there are appropriate avenues for concern to be expressed.
Brereton et al. (2012), with respect to Australia but equally relevant to Aotearoa, state that it is possible to achieve more successful, well used developments by using cross cultural design processes that actively support exploration of Aboriginal value systems in relation to design. In Aotearoa then, public projects ought to engage design processes that actively explore Māori value systems to achieve more

1002
Spaces of Empowerment: Shaping Inclusive Public Places through Decolonising Participatory Design in Aotearoa New Zealand
successful developments, as owing to Te Tiriti all public projects may be viewed ‘cross-cultural’, following Brereton et al.
In some rohe (tribal regions), mana whenua have articulated design guides or principles such as the aforementioned Matapopore Urban Design Guide in Ōtautahi Christchurch and the Te Aranga Principles in Tāmaki Makaurau Auckland. In other regions, the aims of mana whenua may only be understood through conversation, or may require time and support for mana whenua to develop such principles before being able to collaborate in this manner.
3.4. Protection and promotion of mana whenua aims through participatory design process
The democratic aspirations of participatory design if executed poorly, can in fact silence the wishes of minority groups (Till, 2005; Luck, 2007). This means that the voices of tangata whenua, currently a minority, may need support to be upheld throughout a typical participatory design process. This can be achieved through designing the participatory process to uphold and explore the values of mana whenua, and explicitly include Māori.
In Ōtautahi Christchurch, mana whenua have described a large amount of public support for the furthering of hapū desires and general alignment with the desires of public and mana whenua where collaboration has been present (Tikao, 2017). However, this may not always be the case.
In the case study, public participants were informed in person about the history of the site and significance to mana whenua, while being asked to contribute their opinions and desires for the site. Subsequently, one of the major themes participants expressed desire to see included in the design, was the narrative of the site’s history and continued contemporary significance.
This type of mechanism can be designed in service to both community empowerment, and to decolonisation or societal sustainability. The former, as participants feel buoyed by contributing to the project, evidenced by the enthusiasm of many participants to chat longer than necessary; and the latter, through the dissemination of local histories. In this instance, many participants learnt more about their city and deepened their understanding of mana whenua. Sharing of stories is identified by Consedine and Consedine as an important part of the healing journey for countries facing their colonial past (2001), while Smith and Iversen (2018) echo earlier authors (Nygaard, 1979; Kensing, 2003) in declaring
‘the result of a project has to be determined not merely by the . . . objects it produces, but also by the learning outcomes it produces for the involved stakeholders.’
If designed and executed judiciously, strategies such as history sharing may become pivotal to the creation of a shared narrative and sense of purpose in a participatory project.
3.5 Integration of mana whenua in evaluation at each design stage
As designers interpret and create in response to mana whenua and participant input, mana whenua must be engaged in design evaluation at each design stage to safeguard the design’s alignment with mana whenua aims and values. In the case study, mana whenua design evaluation led to the alteration of iconography which was seen to be out of place. Mana whenua design evaluations should be facilitated in such a way as to uphold the group’s autonomy, and further their role as project partner. The iterative and direct nature of these evaluations can contribute to better design outcomes, and the role of design expertise in the participatory process can also be strengthened (Till 2005, Hoddinott 2018).

1003
Rosie Evans, Dr. Adele Leah and Dr. Emina Kristina Petrović
3.6. Paying mana whenua - money and prestige
Where mana whenua are acting as cultural consultants on projects their time should be paid. Interviews highlighted that both the mindset of clients, and the capacity of iwi organisations present challenges to collaboration,
“it's a long process of building those resources and knowledge up in order for them (mana whenua) to contribute. . . it comes back to how the hapū and the iwi are empowered (Church, 2018).”
The designers interviewed also flagged that developers often don’t factor cultural engagement into their budget. In the case study which spurred this design research, mana whenua were not paid for their input or budgeted for, despite the project being council funded and on a historic pā (Māori settlement). This limited the extent to which the project team could access, or felt would be appropriate to access the advice of mana whenua. It also led designers and participatory design consultants to interpret mana whenua aims themselves and apply them to the participation and design.
It is critical that credit is paid to mana whenua design partners. Kake (2020) and Kiddle (2019) highlight recent instances where pivotal contributions to architecture by Māori designers have gone unacknowledged. Such omissions are incongruent to developing sustainable relationships.
3.7. Specific invitation extended from mana whenua to mātāwaka / taura here
For mātāwaka or taura here (Māori who live outside their tūrangawaewae (homeland) (Palmer, 2016 in Kiddle 2019)) to be welcome in participatory processes, genuine and specific invitation needs to come from mana whenua directly. In all of the four largest Aotearoa cities, mana whenua populations are outnumbered by mātāwaka (Ryks et al., 2016), making mātāwaka a significant population, who need to be included. Kiddle (2019) and Rykes et al. (2016) flag that that mātāwaka may be excluded from representation with respect to urban development and planning due to a lack of recognition of mātāwaka as a population group. Kiddle (2019) notes that engagement processes do not tend to be nuanced enough, and often fail to include mātāwaka, who risk being excluded from decision-making processes altogether.
Interviews suggest that this cohort can only be empowered to participate if explicit invitation is extended by mana whenua. This means that for mātāwaka to be genuinely invited, mana whenua must be directly involved as hosts, and extend meaningful invitation.
4. ConclusionIn considering participatory design, it is important to acknowledge the international context, and the research that exists. However, within Aotearoa, it is equally, if not more important, to consider the country’s unique cultural context. This paper suggests that the process of participatory design can itself be used as tool to support decolonising efforts in Aotearoa. Unfortunately, this assertion also highlights that any participatory work that is not actively engaging with decolonising and cultural considerations has a potential to fail, and negatively reinforce colonising dynamics. A future Aotearoa-specific framework for participatory design holds potential to further the contemporary expression of the Treaty partnership through built environment design and societal connections. Such a framework should be situational, values-based, and developed in collaboration with tangata whenua. The concepts of manaakitanga and care may serve as driving values toward the manifestation of a framework, however more work needs to be done to develop this field.

1004
Spaces of Empowerment: Shaping Inclusive Public Places through Decolonising Participatory Design in Aotearoa New Zealand
To foster the development of strongly connected and resilient communities, it is important to develop participatory design processes which are sensitive to local social and cultural dynamics. The participatory process can greatly enhance or weaken the success of projects, and with a move to a focus on social sustainability, true inclusion and the active development of context-specific frameworks for participatory design are required.
References Auckland Council, (2020), Te Aranga Principles, Auckland Design
Manual, http://www.aucklanddesignmanual.co.nz/design-subjects/maori-design/te_aranga_principles Awatere, S., Rolleston, S. and Pauling, C. (2011), Developing Māori urban design principles, in Stuart, K. and
Thompson-Fawcett, M. (eds.), Tāone Tupu Ora: Indigenous Knowledge and Sustainable Urban Design, New Zealand Centre for Sustainable Cities, University of Otago , Wellington, New Zealand, pp.17-22
Braun, V. and Clarke, V. (2006) Using thematic analysis in psychology, Qualitative Research in Psychology, 3:2, 77- 101
Brereton, M., Roe, P., & Lee Hong, A. (2012), Evolving a relationship for cross-cultural participatory innovation, in Clausen, M. & Tunstall, E. (Eds.) 2012 Participatory Innovation Conference Digital Proceedings, Swinburne University, Australia, pp. 1-5.
Campbell, B. (2011), Te Tiriti o Waitangi: A Blueprint for the Future. In Mana Tangata Politics of Empowerment. Huia, New Zealand.
Christchurch City Council, (2016), Public Participation in Community and City Governance and Decision-making: Long Term Plan 2015-2025, amended July 2016. Christchurch City Council. https://www.ccc.govt.nz/assets/Documents/The-Council/Plans-Strategies-Policies-Bylaws/Plans/Long-Term- Plan/ActivityManagementPlanPublicParticipationInDemocraticProcessesCityGovernanceAndDecisionMaking.pdf
Church, T. in conversation with Rennie, J. and Evans, R. September 26, 2018. Consedine, R., & Consedine, J. (2001), Healing Our History The Challenge of the Treaty of Waitangi. Penguin, New
Zealand, pp. 176 Della Costa, W. (2018), Indigenous Placekeeping Framework (IPKF): An Interdisciplinary Architectural Studio as
Praxis, in Kiddle, R., stewart, l. p. and O’Brien, K. (eds.), Our Voices: Indigeneity and Architecture, Our Voices Publishing Collective, ORO Editions, pp. 150.
Dindler, C. and Iversen, O.S. (2014), Relational expertise in participatory design, in Proceedings of the 13th
Participatory Design Conference: Research Papers, Vol. 1, New York, pp. 41-50 Ehn, P. (1988), Work-Oriented Design of Computer Artifacts. Arbetslivscentrum, Stockholm French, J. R. P., Israel, J., and Aas, D. (1960). An experiment in Participation in a Norwegian Factory. Cited
in Pateman, C. (1970). Participation and Democratic Theory. Cambridge University Press, London. Pg. 68 Hoddinott, W. (2018), Elegance in participatory design: Enabling design culture in landscape architecture, Lincoln
University, Christchurch, New Zealand, pp. 8-41. Hoddinott, W., Swaffield, S., Stewart, E. (2019), Participation by or for design? The case of Albion Square in post-
earthquake Ōtautahi Christchurch, Journal of Landscape Architecture, 04 May 2019, Vol.14(2), pp.54-69 Huygens, I. (2016), Pākehā and Tauiwi Treaty education: an unrecognised decolonisation movement?, Kōtuitui: New
Zealand Journal of Social Sciences Online, 11:2, pp.146-158, DOI: 10.1080/1177083X.2016.1148057 Kensing, F, (2003), Methods and Practices in Participatory Design, Dissertation, ITU Press, Copenhagen Kake, J. (2019), Contemporary Papakaigna Design – Principles and Applications, in Kiddle, R., stewart, l. p. and
O’Brien, K. (eds.), Our Voices: Indigeneity and Architecture, Our Voices Publishing Collective, ORO Editions, pp. 164-175.
Kake, J. (2020), Kōrero Tuku Iho: Wai 262 and Protecting the Knowledge of our Tūpuna, Pantograph Punch, https://www.pantograph-punch.com/posts/korero-tuku-iho
Keshavarz, M. and Ramia, M. (2013), Design and Dissensus: Framing and Staging Participation in Design Research, Design Philosophy Papers; Crows Nest 11/1, pp. 7-29

1005
Rosie Evans, Dr. Adele Leah and Dr. Emina Kristina Petrović
Kho, T. (2017), The Urgency of Decoloniality, The SOAS Journal of Postgraduate Research Vol.11, pp. 133-152. Kiddle, R. (2018), Contemporary Māori Placemaking, in Kiddle, R., stewart, l. p. and O’Brien, K. (eds.), Our Voices:
Indigeneity and Architecture, Our Voices Publishing Collective, ORO Editions, pp. 55. Kiddle, R. (2019), The buildings are ‘Uniquely Aotearoa’. Their Māori designers are ignored.
The Spinoff, https://thespinoff.co.nz/atea/24-06-2019/the-buildings-are-uniquely-aotearoa-their-maori- designers-are-ignored/
Luck, R. (2007), Learning to talk to users in participatory design situations. Design Studies, 28(3), 217-242 Luck, R. (2018), Particiipatory design in architectural practice: Changing practices in future making in uncertain
times, Design Studies, 59 / C, pp.139-157. Māori Dictionary, (2020), Mana, https://maoridictionary.co.nz/search?idiom=&phrase=&proverb=&loan=&histLoanWords=&keywords=mana Marques, B., Grabasch, G. and McIntosh, J., (2018), Fostering Landscape Identity Through Participatory
Design With Indigenous Cultures of Australia and Aotearoa/New Zealand, Space and Culture 1–16, Sage, DOI: 10.1177/1206331218783939, pp.11
Marques, B., McIntosh, J. and Campays, P. (2017), Participatory Design for Under- Represented Communities: A Collaborative Design-Led Research Approach for Place-Making, in Chhabra, S. (ed.),
Handbook of research on civic engagement and social change in contemporary society, IGI Global Ebooks, DOI: 10.4018/978-1-5225-4197-4.ch001
Matapopore Charitable Trust, (2015), Matapopore Urban Design Guide, Matapopore, http://www.matapopore.co.nz/wp-content/uploads/2016/05/Matapopora-UDG-Finalv3-18Dec2015.pdf
Mouffe, C. (2007), Artistic Activism and Agonistic Space, Art & Research, vol.1, no. 2, summer 2007, pp. 5 Nygaard, K. (1979), The Iron and Metal Project: Trade Union Participation, in Sandberg, A. (Ed.), Computers Dividing
Man and Work e Recent Scandinavian Research on Planning and Computers from a Trade Union Perspective, Malmø, Sweden: Swedish Center for Working Life, Demos Project report no. 13, Utbildningsproduktion.
Pateman, C. (1970). Participation and Democratic Theory. Cambridge University Press, London. Pg. 68 Rennie, J. in conversation with Church, T. and Evans, R. September 26, 2018. Rykes, J., Pearson, A.L. and Waa, A., (2016), Mapping urban Māori : a population-based study of Māori
heterogeneity, New Zealand Geographer, 72 (1), pp. 28-40. Sanders, E. and Stappers, P. (2008), Co-creation and the new landscapes of design, Co-Design, 4:1, 5-18, DOI:
10.1080/15710880701875068 Sanoff, H. (2007), Editorial - Special issue on participatory design, Design Studies Vol.28(3), pp.213-215 Smith, LT (1999) Decolonising methodologies: research and indigenous peoples. Zed, Tāmaki Makaurau Auckland, New Zealand. Smith, R. and Iversen, O. (2018), Participatory design for sustainable social change, Design Studies 59 (2018) Tikao, D. in conversation with Evans, R. September 25, 2018. Till, J. (2005), The negotiation of hope, in Blundell Jones, P., Petrescu, D. and Till, J. (eds.), Architecture &
Participation, Spon Press, Oxford, pp. 23-42. Tomlins-Jahnke, H. (2011), Colonial Theories of the State: Māori/State Relations. In Mana Tangata Politics of
Empowerment. Huia, New Zealand. Verran, H. (1998), Re-imagining land ownership in Australia, Postcolonial Studies, 1, 237–254. Verran, H. (1999), Staying true to the laughter in Nigerian classrooms, Actor Network and After (pp. 136–155). Oxford, UK: Blackwell and The Sociological Review. Verran, H. (2001), Science and an African logic. Chicago, IL: The University of Chicago Press. Wellington City Council, (2017), Wellington City Council Engagement Improvement Plan -Positioning for the Future,
Wellington City Council Website, Retrieved 14/10/17 from: wellington.govt.nz/...council/.../A256EC23E4684BBFA1E73B7C5074ACEE.ashx
1006
The 54th International Conference of the Architectural Science Association (ANZAScA) 2020
Street Design in a Different Cultural Context: The Case of Great South Road in Auckland, New Zealand
Maryam Lesan1, Morten Gjerde2 1, Babol Noshirvani University of Technology, Babol, Iran
[email protected] Victoria University of Wellington, Wellington, New Zealand
Abstract: Despite its bi-cultural history of New Zealand, it is largely European preferences that have shaped the public spaces. However, with immigration and travel, the country is rapidly becoming multi- cultural. Pasifika people and Asians now comprise larger proportions of the population alongside those who identify as Māori and European. If public spaces are to respond to these changing demographics, there is little empirical evidence to help urban designers and public space managers achieve this. Using field observations and interviews, this paper examines Great South Road (a Polynesian shopping district) in South Auckland. The research identifies characteristics that support people’s stationary and social activities along the street. The findings will be of interest to other researchers, urban practitioners and city officials.
Keywords: Street design, Polynesian people, Great South Road, cultural contexts.
1. IntroductionPublic spaces provide a range of values for societies; from an arena for political representation to symbolic and representative functions. Public spaces are considered as the most perceptible and recognizable aspect of public life and cultural vitality of cities (Pugalis, 2009b). The role of public space for the enhancement of social cohesion and social integration of underprivileged populations is well understood and the quality of these spaces are increasingly seen as a precondition for the economic health and development of cities. Public spaces can also foster sense of community and mutual trust between the users by the values and norms they share within the community (Madanipour, 2004; Mulgan et al., 2006; Pugalis, 2009b). Streets and their footpaths represent an important part of urban public open space and have a significant role in enriching public life of cities. Similar to other urban environments, streets also reflect and embody the societies that have created them and are considered as cultural landscapes.
When people migrate to another country, they often bring the characteristics of their culture with them. In many cases, ethnic areas are recreated in the new country in order to make the unfamiliar environment more familiar. Such ethnic enclaves present elements and characteristics that are familiar
Imaginable Futures: Design Thinking, and the Scientific Method. 54th International Conference of the Architectural Science Association 2020, Ali Ghaffarianhoseini, et al (eds), pp. 1006–1015. © 2020 and published by the Architectural Science Association (ANZAScA).

1007
Maryam Lesan, Morten Gjerde
to their place of origin(Edmonds, 2020). A study on the type of activities that occur in Chinatown and Little Italy in the USA shows differences between the spatial organization, cultural functions, and many informal social activities(Fernando, 2006). New Zealand is one of the countries where ethnic diversity is increasing at a rapid pace. While people of European descent are predominant, it is estimated that by 2026 more than 40% of the population will be non-European. (Swarbrick, 2012). This includes Pacific and Asian people as well as the indigenous Māori. Accordingly, urban public places are increasingly shared by people from different ethnic and cultural backgrounds. As the Western cultural norms that have shaped public spaces in New Zealand may not be universally appropriate, it is useful to understand what attracts other cultures. This paper reports on research that investigated the factors that encourage people in Great South Road, in the Otahuhu neighbourhood of South Auckland, to linger and socialize. The extent to which public spaces are utilized for social activity is considered an important measure of the value people hold for them.
3. Great South Road, OtathuhuGreat South Road is a popular shopping destination in Auckland. Observations on Great South Road took place in April 2013 between High Street and Princes Street on one kerbside and Park Avenue and Ings Asian Food Warehouse on the other kerbside (figure 1). The street runs along a north-west south-east direction. It is a place of ethnic commerce, with the majority of premises operated by Asians (Chinese, Indians/ Fijian Indians) and is well-known for its low-priced goods. Most of the businesses are fashion and household item shops.
Figure 1: Map showing the studied blocks on Great South Road in Otahuhu neighbourhood
These premises offer a wide range of goods, from ethnic fashion items to blankets, suitcases, and souvenirs. There are fewer numbers of services such as pharmacies, butchers, and banks along the street. Food and eating establishments are limited to a number of takeaways, bakeries, Asian restaurants and an international fast-food restaurant. The services and food establishments are a minority amongst the large number of Asian fashion and household shops. The shopping strip is

1008
Street Design in a Different Cultural Context: The Case of Great South Road in Auckland, New Zealand
frequented by the Polynesian population and thus is now known as a Polynesian shopping district (ethnic strip). It is an enlivened street overflowing with people and activities. The businesses appear to attract people from Pacific island and Asian backgrounds. Many of the shops extend their displays out into the street, which in turn leads to dishevelled and chaotic appearances (figure 2). There are no clear boundaries between the adjacent businesses and it is difficult to see the shopfronts or the inter-tenancy walls separating one shop from the other. Clothes, bags, blankets, artificial flowers (including lei or garlands) are all hung out outside the shops from the awnings. The prices and sale items are marked on the products. The customers can touch and engage with the products on the footpaths without the need to go inside the stores. Culture is not displayed here by fixed architectural characteristics such as the building facades. Instead, it is represented in the non-fixed elements of the street such as signs, window displays or the goods expanded on the footpaths as well as the sensory qualities of the street such as smells from cultural food (Pacific Island food) or music.
Figure2: Left: Footpaths are used as an extension of many of the shop interiors in Great South Road. Right: Artificial flowers, rich colour clothing and fabrics with floral patterns constituted a significant
part of the open shop frontages in the study area. Image source: first author Many premises advertise themselves with bold signboard displays such as “Island Fashion”,
“Polynesian Fashion”, “Island Groceries”, “Extra-large sizes” and “Extra Wide Fittings”. While walking in front of the sari shop, one is able to get an essence of India by looking at different colourful sari dresses and listening to Indian music. Most product descriptions and prices are stated in English and not in the ethnic language of those that the shop targets as customers. While the signboards are written in English, the names of many are clearly ethnic in derivation; for example, an Indian shop named Roop Ki Rani. A few numbers of businesses have bilingual signage, both in English and an ethnic language.
4. Activity Observations an Interviews
The research methodology involved mapping people’s behaviours along the street with a view to linking patterns of use with the design characteristics of the street. A second part of the methodology involved interviewing a number of people that had been observed lingering or socialising along the street. Behaviour maps were recorded once an hour between 10:00 AM and 6:00 PM on weekdays and weekends during a three week period in April. This is a time of year when the weather remains warm and relatively stable, helping to encourage people to engage in outdoor activities. Data were collected

1009
Maryam Lesan, Morten Gjerde
on days with varying cloud cover and light winds but not when it was raining. People who were simply walking along the street and did not stop were not recorded on the behaviour maps.
A total of 2554 people were engaged in some form of stationary activity along Great South Road during the observation period. Some 144 of the recorded activity included shopkeepers and salespeople (141), and a very small number of vendors (2) and performers (1). The majority of the business owners and salespeople in Otahuhu are Asian (Chinese and Indians, including Fijian Indians). The remaining 2410 people were engaged in different types of static or stationary activities during observation periods. Some 75% of these people were Māori/Pacific Islanders compared with 25% coming from other ethnicities. in order to avoid making wrong interpretations, Māori and Pacific Island people were grouped together in this part of the study. However, subsequent interviews revealed most users to be Pacific Islanders. Asians (476) and Europeans (121) were recorded in relatively smaller numbers compared to Māori/PacificIslanders. A group of ‘others’ was also created to record the 12 people who did not fit into the four maincategories of interest.
5. The Social Structure of GroupsFigure 3 shows that the proportions of different ethnic cultures engaged in different types of static activities does not relate to the ethnic population distribution of Mangere-Otahuhu, the particular suburb in which Great South Road is located. The street clearly attracts higher proportions of Asians and lower proportions of Europeans.
Figure 3: A comparison of the percentages of ethnic cultures living in the area, with those of each culture observed and interviewed. The demographics of Mangere-Otahuhu are based on
Statistics New Zealand, 2006 Europeans were less represented in the social structure of the street environment and used the street
environment for leisure and social activities less than other groups did. Therefore, fewer numbers of Europeans were interviewed than was expected from the demographic population ratios. In contrast, the street was extensively used by Pacific Islanders that gave the researcher the opportunity to interview a considerable number of Pacific Islanders compared to other cultural backgrounds. In total, 28 people, comprising 2 Europeans, 6 Māori, 12 Pacific Islanders and 8 Asians, were interviewed. In the following section we will discuss our findings in three main categories: social structure of groups, retail activities and design characteristics of the sidewalks.
Adults were seen in proportionately greater numbers, and teenagers were seen the least. The numbers of women engaged in different static activities outnumbered men. While the number of male

1010
Street Design in a Different Cultural Context: The Case of Great South Road in Auckland, New Zealand
and female users was almost balanced within European and Asian groups, females significantly outnumber male users amongst those who were recorded as Māori & Pacific Islanders. Most users came to the street with friends or family members and were usually encountered in groups rather than alone. This was consistent amongst all ethnicities observed in this study. Europeans were observed in both smaller numbers and group sizes on Great South Road. A greater percentage of Europeans were observed individually on the street.
Pacific Islanders took part in social activities in larger groups. Many of them came to the street accompanied by family members and friends for their activities. In interviews, several Māori noted that they socialise in smaller numbers in the street environment compared to Pacific Islanders. One Pacific Islander stated that: “Our groups are big, we have bigger cars, we have families where we all meet up together and then we start walking together”.
There were fewer Asian groups of a larger size compared to Pacific Islanders. A considerable number of children were observed in family groups.
6. Business, Culture and ActivitiesThe shopping area was most often frequented by members of Pacific Island communities, followed by Asian people. The interviews validated our observations that business activities were the most important aspect of the street environment to users from all ethnic backgrounds. Many shops along the study area target the different Polynesian (Pacific Island) groups with signage and in the ways fashion and other cultural products were displayed on footpaths outside the premises. More than any other general location, Polynesians were observed to be engaged in social activities around these businesses.
Asian and Indian fashion and jewellery shops appeared to attract larger numbers of Asians to the street. However, it was not limited to Asians; and many Māori/Pacific Islanders were recorded window shopping at these premises. The importance of cultural shops and eating places for social activities among Asians was reinforced through the interviews. Services such as banks and fruit shops also attracted both Polynesian and Asian groups. In contrast, the businesses along the street and the atmosphere they contribute to, were not considered attractive to Europeans. Comparatively fewer Europeans were seen to be window shopping along the street and instead were most often observed on the commercial seating of a local bar.
Maintaining current diversity of shops and businesses along the street, and even adding to this, were among the most frequent recommendations made by Pacific Islanders, Māori and Asians. Adding more quality shops, chain stores/supermarkets, cafés, restaurants and eating places on the main street were the specific changes these respondents noted most often.
Most static activities (1150) while window shopping/standing occurred in front of the shops with open displays, which were seen along the majority of Great South Road shop frontages. While the affordable and vibrant open shop frontages with the extreme number of standing/lingering activities around might create a familiar or attractive street pattern for users of some cultures, such as Pacific Islanders and Asian, it generated an unfamiliar and exotic setting for those of other cultures, especially Europeans and Māori. Their recommendations often included bringing order to the apparently chaotic environment. The findings of the interviews revealed that Europeans found it difficult to tolerate the dense and overcrowded footpaths. In addition to the quality of the premises, this could be another reason to explain why Europeans visited the street less frequently. However, the preference for these types of open frontages might not always be a cultural preference; as revealed in the interviews,

1011
Maryam Lesan, Morten Gjerde
economic access and affordability also play a great role. Their preferences for affordable and socially accessible shops, businesses and eating premises could be highly related to their socio-economic circumstances.
Children interacted with the open shop frontages which expanded their merchandise onto the footpaths. Some placed toys and items attractive for children on the floor or at the level of children’s height. Children found the opportunity to touch and play with these items while parents were shopping.
Figure 4: Children also interacted with the shop fronts by walking close to it; touching and playing with different toys. Image source: first author
Observations and interviews suggest that merchandise and cultural products often target different ethnic groups (figure 5). Pacific Islanders and Asians stated the ways in which different cultural premises respond to their needs as what they liked most about Great South Road. A Tongan participant states that the diversity of retail activities accommodates their cultural needs;
“The diversity of shops caters to my culture more than anywhere else (in New Zealand). We can buy Tongan stuff and clothes here; were we cannot find anywhere else or in the mall”.
Asians stated the importance of cultural shops including Indian clothing and sari and jewellery shops, Indian restaurants and sweet shops as places for their ethnic group social activities. There were a considerable number of Asian restaurants on Great South Road, yet Asian participants would like to add to this range. Asians also (Indians) referred to the visual culture and decorations of the storefronts such as “Roop ki Rani” and other stores that sell Indian saris or Indian jewellery shops as different locations where they enjoy window shopping. Pacific Islanders usually stopped to have a look at various traditional clothing worn by Polynesians such as lava lavas and other fabrics with flower patterns. Items such as blankets, shoes, bags, and fashion items attracted people of diverse cultural backgrounds.
Many people, especially women, dress Polynesian style. Plant products have a great importance for body decoration in the Pacific Island societies (Morrison, Geraghty, & Crowl, 1994). Flowers were a significant feature in Great South Road. Many Islanders were observed while shopping for artificial flowers. Many Asian premises along the street advertised artificial flowers in their shop fronts and interiors. Flowers and colour (bright colours such as green, purple, pink, and yellow) seem to be an important element, part of Polynesian costume. Many Pacific Islanders on the street tucked large single flowers behind their ears, either right or left (which can display different meanings) or wore circular headbands of flowers and greenery twigs around their heads. The use of flowers was not limited to head

1012
Street Design in a Different Cultural Context: The Case of Great South Road in Auckland, New Zealand
adornments. Rich coloured clothing and fabrics with floral patterns constituted a significant part of the open shop fronts and daily fashion wear in the study area.
Figure 5: Premises advertising cultural materials and merchandise attract people of own culture and other cultures in Great South Road. Image source: first author
Many social activities were recorded in front of eating premises (figure 6). Interviews confirmed the importance of food and eating places for social activities of different cultural groups. Half of the respondents outlined the importance of the connection between food and their ethnic group social activities on Great South Road. Cultural eating premises constituted an important factor in the assessment of Asian culture where all Asian (Indian) participants that referred to food and eating premises associated it with an ethnic theme (Indian).
Figure 6: left: Takeaways with open and permeable frontages created lively frontages. Right: Fruit shops attracted a great number of static activities within two cultures: Pacific Islanders and Asians.
Image source: first author Other cultural groups did not place much weight on cultural and ethnic eating premises. Pacific
Islanders, for example, mainly stated bakeries, takeaways, and the international fast-food restaurant (McDonalds) as places that they usually visit for their social activities. The provision of Island food was only mentioned once by participants. Māori/Pacific Islanders outnumbered Asians in front of bakeries and both Chinese and Island takeaways.

1013
Maryam Lesan, Morten Gjerde
The fruit shops extended their territory by displaying fruit and grocery boxes outside the store onto the footpath (figure 6). The type of fruit and vegetables displayed could also convey meaning for some cultures. For example; taro is an important staple food for Polynesian people and is displayed extensively in these shop fronts.
7. Street Design CharacteristicsThe design attributes of Great South Road were considered by users to be the next most important
factor influencing use, after the business activities. Among all cultural groups, Pacific Islanders and Māori were the most eager users of footpath spaces. They sat and relaxed on the public seating and open spaces adjacent to the footpaths for longer time periods. Pacific Islanders made the most positive comments about footpath features and other design attributes. These two groups also made the highest number of recommendations for how footpaths could be enhanced. For them, the footpath was primarily a social space and as the main users, they were also acutely aware of how some design features serve to limit accommodation of their activities.
The studied section of Great South Road had a considerable number of public seating (23 benches), a circular green space with sitting edges around and a number of other physical artefacts. Seating spaces in relation to activity supporting businesses in lively sections of the street were more frequently occupied. When the quality was supported by physical and environmental comfort aspects, it generated more interest among users of public space. Observations showed that Māori/Pacific Islanders were the most eager users of public benches on Great South Road, followed by Asians, Europeans and Others.
Pacific people have strong spiritual and cultural relationships with food and family (Ruth, 2009). Sitting, eating and socialising in groups was a popular activity among Pacific Islanders on footpath benches. Public seating and ledges seem to have an important role for social activities of Pacific Islanders. Public benches along the main strip were often well used and sometimes overused by Pacific Islanders. Many larger groups (up to 9 people) of Pacific Islanders frequented public benches; however, within these groups, some members had to stand or lean or even squeeze together on the benches. The numbers and arrangements of the seating did not accommodate for sitting activities in larger groups. Even when adequate numbers of seats were provided, they were located too far away from each other, thus could not be conveniently used by the members of large groups. Seating remains the main design concern to Pacific Islanders where 8 out of 12 participants referred to seating as an important artefact that accommodates their leisure/social activities.
Fewer numbers of Asians were recorded seated. Unlike Pacific Islanders, Asians did not use the public benches for eating/drinking activities. For them, communal eating activities mostly took place inside the food premises rather than on footpath benches. Most Asians used the benches to take a rest after and in between shopping, or while waiting for friends/family members. Participants also mentioned the importance of tables for social activities that can be included in footpath design. As the frequent users of the street, Pacific Islanders and Māori were also conscious about the climatic comfort characteristics of the street.
While footpaths have a reasonable width in substantial lengths of the street, sometimes the congregation of groups, especially those with larger numbers, blocked the footpaths for pedestrian traffic. Many Pacific Islanders meet, stand and socialise on the footpaths in larger groups for longer time periods and talk. Some window shopping took place in larger groups. The nature of the storefronts displaying various goods and commodities on footpaths and the number of shoppers lingering and socialising in larger groups blocked the footpaths and made it hard for pedestrians to pass by (figure 7).

1014
Street Design in a Different Cultural Context: The Case of Great South Road in Auckland, New Zealand
While these images might create a familiar street pattern for users of some cultures, people of other cultures sometimes found it difficult to tolerate the overcrowded footpaths. Interviews also suggested footpath width to be an important design factor.
Figure7: Left: Pacific Islanders usually stood and socialised on footpath spaces in larger groups. Right: The nature of the storefronts displaying various goods on footpaths and the large number of shoppers lingering and socialising in larger groups led to dense and overcrowded footpaths Source: first author
The street environment provided opportunities for children to stand, play or window shop freely on the footpaths. In general, the environment was perceived to be reasonably safe for children. This could be further discussed in relation to the management and design qualities of the street and sidewalks; bus removal and traffic management, wider sidewalks and the existence of physical barriers along extensive lengths of the sidewalks which kept the vehicular traffic and pedestrian movement divided.
8. ConclusionGreat South Road succeeds in attracting people from some ethnic backgrounds to the footpaths and to support their various social and individual activities. This is mainly due to the different business activities on offer and to the physical characteristics of the footpaths. This research has found that some people, who could otherwise be expected to use the shopping area because they live nearby, do not visit or do not linger when they do. This refers primarily to Europeans and Asians. On the other hand, the street appears to attract members of the Pacific Island community from outside the immediate catchment area. By mapping people’s social and lingering activities along the street, and then engaging in discussion with them about their preferences and behaviours, the research identified several physical attributes and business characteristics that can influence social behaviour. Designers wishing to enhance the attractiveness of streets to a wide ethnic range of users in New Zealand could consider these factors in their work.
The findings confirm earlier studies suggesting that retail tenant mix and atmosphere are the most significant factors in attracting people to a street (Teller, 2008). There were both similarities and differences among different cultural groups for the preferences for locations of daily shopping, functional and other commercial activities as well as the locations they chose for leisure and social activities. Many of the businesses that offered daily goods and services such as fruit shops and banks were most commonly preferred and attracted people of various cultural backgrounds to the street environment. Others such as ethnic delicatessens mostly targeted specific cultural groups. Many static

1015
Maryam Lesan, Morten Gjerde
activities were recorded in relation to these businesses. having a fine business agglomeration that serves daily/weekly shopping, and leisure places to eat/drink and other services such as fashion and footwear, among other services is important for the street to attract different ethnic groups.
Users’ needs were associated with wider footpaths and more seating places along the footpaths. The number of people and different group sizes (especially Pacific Islanders) involved in seated activities reinforced the insufficient number of sitting opportunities and the need for selection and configuration of supportive furniture planning and design. The importance of environmental comfort characteristics such as shade and shelter from rain is another factor that needs to be addressed. Although observations showed success in Great South Road in terms of children’s activities, interviews suggested designing for children in the commercial street is a priority.
References Carr, S., Francis, M., Rivlin, L., & Stone, A. (1992). Public Space: Cambridge University Press. Edmonds, A. (2020). Connecting People, Place and Design. Bristol: Intellect. Fernando, N. A. (2006). Open-ended space: urban streets in different cultural contexts. In K. A. Franck & Q. Stevens
(Eds.), Loose Space: Possibility and Diversity in Urban Life (pp. 54-72). New York: Routledge. Fernando, N. A. (2007). Culture and Identity in Urban Streets: A Case Study of Chinatown, New York City. (PhD). The
University of Wisconsin-Milwaukee, Hass-Klau, C., Crampton, G., Dowland, C., & Nold, I. (1999). Streets as Living Space : Helping public places play their
proper role. London: Landor Loukaitou-Sideris, A. (2002 b). Regeneration of Urban Commercial Strips: Ethnicity and Space in Three Los Angeles
Neighborhoods. Journal of Architectural and Planning Research, 19(4), 334-350. Madanipour, A. (2004). Marginal public spaces in European cities. Journal of Urban Design, 9(3), 267-286. Mazumdar, S., Mazumdar, S., Docuyanan, F., & McLaughlin, C. M. (2000). Creating a Sense of Place: The
Vietnamese-Americans And Little Saigon. Journal of Environmental Psychology, 20, 319-333. Mehta, V. (2007). Lively Streets Determining Environmental Characteristics to Support Social Behavior. Journal of
Planning Education and Research, 27(2), 165-187. Mehta, V. (2009). Look Closely and You Will See, Listen Carefully and You Will Hear: Urban Design and Social
Interaction on Streets. Urban Design, 14(1), 29-64. Morrison, J., Geraghty, P., & Crowl, L. (1994). Science of Pacific Island People, vol 3: Fauna, Flora, Food and Medicine
(Vol. 3). Fiji: Institute of Pacific Studies, the University of the South Pacific. Mulgan, G., Potts, G., Audsley, J., Carmona, M., De Magalhaes, C., Sieh, L., & Sharpe, C. (2006). Mapping Value in the
Built Urban Environment. Retrieved from London: Pugalis, L. (2009b). The culture and economics of urban public space design: Public and professional perceptions.
Urban Design International, 14, 215-230. Ruth, E. (2009). Food Security for Pacific Peoples in New Zealand. A report for the Obesity Action Coalition. Retrieved
from Wellington: Swarbrick, N. (2007). Flax and flax working - Māori use of flax. Te Ara - the Encyclopedia of New Zealand,
http://www.TeAra.govt.nz/en/flax-and-flax-working/page-2 (accessed 20 October 2020) Teller, C. (2008). Shopping streets versus shopping malls-determinants of agglomeration format attractiveness from
the consumer's point of view. The International Review of Retail, Distribution and Consumer Research, 18(4), 381-403.

1016
The 54th International Conference of the Architectural Science Association (ANZAScA) 2020
Study on Integrated Conservation Strategy of the Buffer Zones of Historical Ancient Cities from the Perspective of Coordinated
Development of New and Old Urban Areas:A Case Study on the Space Around Jingzhou Ancient City
Kexin Chen1 , Zhe Hu2 and Yi He3 1,2,3 Huazhong University of Science and Technology, Wuhan, China
2 Wuhan Institute of Technology, Wuhan, China {ckexin5101,2, heyihust4}@163.com
Abstract: The urban construction in China takes the historical city as the core position for constantly transforming and expanding internally. In history, the marginal zone formed by the consolidation of the city walls has gradually changed into a special zone of “half city and half country” in the process of internal and external two-way erosion. As a result, the buffer zone between the old and new urban areas plays an important role. In reality, the boundary development of historical city is approaching the historical heritage itself and causing it to lose the original historical aura. Combing with the characteristics and problems under the conservation and development of new area in ancient city, this paper puts forward the conservation and development strategies in three aspects: transportation inside and outside the ancient city, interaction of new and old styles, and industrial planning transfer in view of the buffer zone with half urban and half rural environmental characteristics between the ancient city and the new area, hoping to promoting unified planning of renewal of ancient city and construction of new area to ensure the coordinated development of them, to realize the overall conservation plan of the ancient city, and the buffer zone within it.
Keywords: Historic city; New urban area; Buffer zone; Integrated conservation
1. IntroductionIn the process of urban modernization in China, historical ancient cities, most of which lie in the center of cities, undergo constant transformation and renovation inward and expand outward. Integration is lacked in the renewal of ancient cities and the construction of the new urban area. On one hand, Ning Chen and Bingzhong Zhou (2007) presented in there are many problems in terms of transformation of ancient cities: too fast, too big and large traffic pressure, and historic feature and landscape characteristic is losing due to large population and construction density. On the other hand, there are also some problems in the growth of new urban areas: urban context being ignored and single industrial
Imaginable Futures: Design Thinking, and the Scientific Method. 54th International Conference of the Architectural Science Association 2020, Ali Ghaffarianhoseini, et al (eds), pp. 1016–1025. © 2020 and published by the Architectural Science Association (ANZAScA).

1017
Kexin Chen, Zhe Hu and Yi He
structure. Conflicts mainly gather in the surrounding zone of the historical cultural cities, which changed into a special zone of “half city and half country” in the process of internal and external two-way erosion.
The protection of noumental value is in conflict with the creation of economic value, modern lifestyle in conflict with traditional material space. No importance is attached to the value and function of historical ancient cities in controversy. In respect of the problems above, by studying documents on international heritage conservation, this paper combs the theoretical cognition of buffer zone conservation planning from the international perspective, and combines with the characteristics and problems under the conservation and development of new area around ancient cities. Then it puts forward the overall conservation plan of historical ancient city, including the buffer zone
2. The proposal and evolution of the concept of buffer zoneComparatively sound theory and practice research foundation in terms of historical heritage has been established. As the research goes further, the conservation of heritage is not limited to the very heritage, and it begins to take the surrounding zone where heritage exists into account. There are two main opinions on the zone around historical heritage. Some people hold that the zone can be included into modern urban area so that important landscape can be seen clearly with a strong contrast of ancient and new elements. While others think that there should be a buffer zone between heritage site and modern urban area, functioning as a transition of ancient and new, history and modern (See Figure 1).
Figure 1:Two Different Surrounding Zones of Historical Heritage. The black in the left represents heritage site and the red stands for modern urban area. While there is a yellow buffer zone between heritage site
and modern urban area. (Source: Drawn by the author, 2018)
In 1977, the concept of buffer zone was originally put forward in Article 104 in Instructions on Implementation of World Heritage Convention(2016) (WHC, 2017) : “Buffer zone is a zone around the heritage, which is set up to effectively protect declared heritage site. Its exploitation is limited by relevant laws and/or common regulations as a kind of protection for heritage site.” The fifth Congress of ICOMOS passed Xi’an Declaration, which is a monumental document in the field of historical cultural heritage conservation. It defines surrounding zone around monument and site for the first time, further explains the range and content of heritage conservation and makes the concept of historical cultural heritage conservation fuller and more complete. Then, ICOMOS convened World Heritage and Buffer Zone Meeting in Davos, Switzerland in 2008 (WHC, 2017). It put forward that “buffer zone is not only a secondary zone supporting important conservation, but a complementary and indivisible zone as equal

1018
Study on Integrated Conservation Strategy of the Buffer Zones of Historical Ancient Cities from the Perspective of Coordinated Development of New and Old Urban Areas:A Case Study on the
Space Around Jingzhou Ancient City
as important conservation.” ICOMOS proposes to explore a method to define and integrate the boundary of buffer zone and heritage site. The design of buffer zone should be consistent with the social, economic and cultural value of heritage as well as material value. Paper 25-World Heritage and Buffer Zone(referred as Paper 25 below) (WHC, 2017) formed at the meeting now becomes the most complete document on the research of world heritage buffer zone and is taken as authoritative.
With the progress of human economy and society, the complete research on “buffer zone” was finally finished (see Paper 25) from the proposal of the concept—buffer zone. Buffer zone becomes a way to heritage conservation from being dispensable. It covers wider urban background and geographical environment, transcending the old “history-oriented” or “the whole area”. It combines heritage conservation and social& economic growth. Material and non-material elements are both considered. At first, heritage conservation only focuses on continuing heritage, but now it considers the relevant social, economic and cultural value so integrated protection of historical heritage and its surrounding zone can be achieved in a more perfect and scientific way.
3. Research on strategies of the development of buffer zone in historicalancient cities—a case study on space around Jingzhou ancient cityAncient and new urban areas in historical ancient cities have relatively obvious difference in space function, but buffer zone can act as a transition for conservation and economic promoting. Buffer zone plays an important role in preserving characteristic of ancient city, relieve traffic and functions. With buffer zone contributing to spacial harmony, ancient and new urban space can be optimized and blended to realize a win-win situation.
Buffer zone of Jingzhou ancient city covers peripheral area of ancient city wall, “Huancheng(around the city)” area for short. The area reaches Huancheng Road(N) to the north, the east of Huancheng Road(E) to the east, Fenghuang Avenue to the south and Huancheng Road(W) to the west. The planned area is about 8.38 Sq.km., as large as about 1.78 of the ancient city (See Figure 2).
Figure 2: Buffer Zone of Jingzhou Ancient City. (Source: Drawn by the author, 2018)
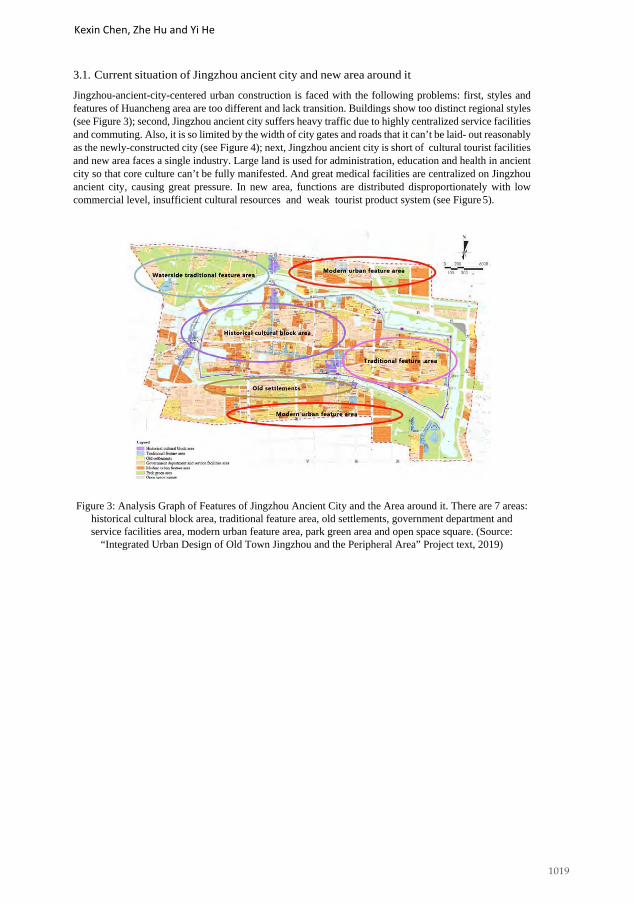
1019
Kexin Chen, Zhe Hu and Yi He
3.1. Current situation of Jingzhou ancient city and new area around it
Jingzhou-ancient-city-centered urban construction is faced with the following problems: first, styles and features of Huancheng area are too different and lack transition. Buildings show too distinct regional styles (see Figure 3); second, Jingzhou ancient city suffers heavy traffic due to highly centralized service facilities and commuting. Also, it is so limited by the width of city gates and roads that it can’t be laid- out reasonably as the newly-constructed city (see Figure 4); next, Jingzhou ancient city is short of cultural tourist facilities and new area faces a single industry. Large land is used for administration, education and health in ancient city so that core culture can’t be fully manifested. And great medical facilities are centralized on Jingzhou ancient city, causing great pressure. In new area, functions are distributed disproportionately with low commercial level, insufficient cultural resources and weak tourist product system (see Figure 5).
Figure 3: Analysis Graph of Features of Jingzhou Ancient City and the Area around it. There are 7 areas: historical cultural block area, traditional feature area, old settlements, government department and service facilities area, modern urban feature area, park green area and open space square. (Source:
“Integrated Urban Design of Old Town Jingzhou and the Peripheral Area” Project text, 2019)
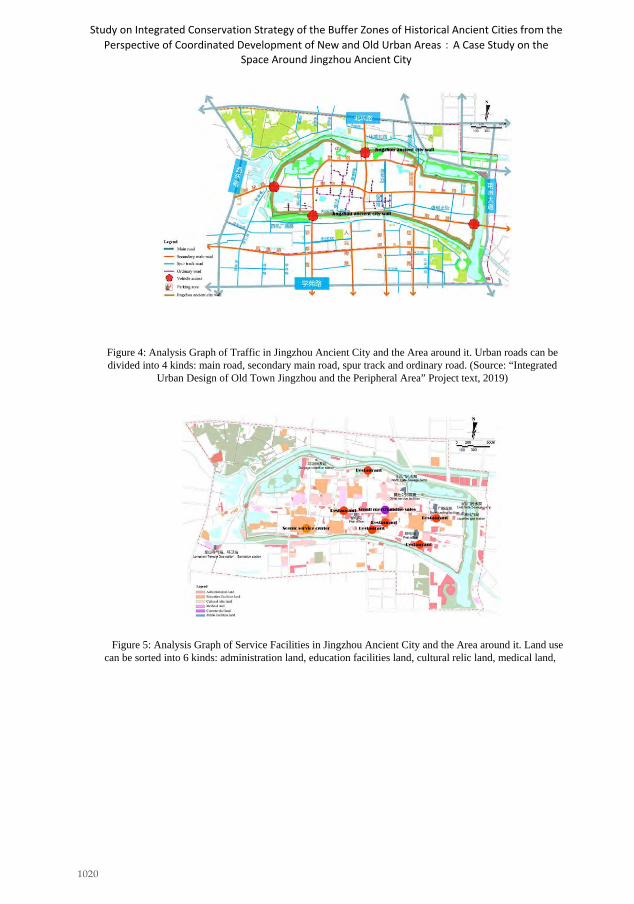
1020
Study on Integrated Conservation Strategy of the Buffer Zones of Historical Ancient Cities from the Perspective of Coordinated Development of New and Old Urban Areas:A Case Study on the
Space Around Jingzhou Ancient City
Figure 4: Analysis Graph of Traffic in Jingzhou Ancient City and the Area around it. Urban roads can be divided into 4 kinds: main road, secondary main road, spur track and ordinary road. (Source: “Integrated
Urban Design of Old Town Jingzhou and the Peripheral Area” Project text, 2019)
Figure 5: Analysis Graph of Service Facilities in Jingzhou Ancient City and the Area around it. Land use can be sorted into 6 kinds: administration land, education facilities land, cultural relic land, medical land,

1021
Kexin Chen, Zhe Hu and Yi He
commercial land, public facilities land. (Source: “Integrated Urban Design of Old Town Jingzhou and the Peripheral Area” Project text, 2019)
3.2. Strategies of the development of buffer zone of Jingzhou ancient city
3.2.1. Coordinate ancient and new characteristics of ancient city
The spacial pattern and surroundings of historical ancient city can be coordinated with that of new area with the help of buffer zone. Determine which old buildings need renovating, place a strict control on them according to norms and requirements of building renovation in the range of construction control. As to the buildings out of the range in buffer zone, remedial measures should be proposed. In the renovation and construction, modern elements can be adopted properly since they can make the area more attractive. Historical area should be protected along with modern living needs met, which should be a part of urban social and economic growth. Meanwhile, public participation should be paid attention to.
Place a proper control on renovation. Prohibit a large scale of highly centralized pseudo-classic architecture. With renovation in certain points enhanced, the whole area complemented and line connection formed, ancient city with ancient and new elements combined come into being. Ancient city is featured with ancient and new elements blended harmoniously and jointly, profound historic foundation, city skyline in control and main streets in charge; modern city is featured with modern characteristic, the height of architecture in proper control and area along the river in charge (see Figure 6).
Figure 6: Planning of Features of Jinagzhou Ancient City and the Area around it. There are 4 featured districts according to the leading feature in each and every area with different control measures:
traditional feature area in ancient city, waterside traditional feature area, traditional feature

1022
Study on Integrated Conservation Strategy of the Buffer Zones of Historical Ancient Cities from the Perspective of Coordinated Development of New and Old Urban Areas:A Case Study on the
Space Around Jingzhou Ancient City
coordination area, feature coordination area in modern city. (Source: “Integrated Urban Design of Old Town Jingzhou and the Peripheral Area” Project text, 2019)
3.2.2 Traffic interception in ancient city
Slow traffic strategy— “traffic intercepted in outer ring and flow of people and vehicle split” is adopted in the area around Jianzhou ancient city. To keep the strategy independent, vehicle around the city will be intercepted in small circle lines within every district. Small circle lines lie on the 4 main roads(outer ring), separate from slow-traffic road around the city. Outside of small circle lines and three blocked streets, parking facilities are centralized to intercept tourist buses outside of the ancient city. Tourists can walk into the ancient city through blocked streets to keep tourist environment and slow traffic guaranteed in ancient city (see Figure 7, Figure8).
The realization of slow traffic strategy depends on buffer zone intercepting vehicle. On one hand, traffic pressure can be relieved, and on the other hand, traffic in new urban area can be lighter with the help of small circle lines in buffer zone.
Figure 7: Sketch Map of Slow Traffic Strategy: “Traffic Intercepted in Outer Ring and Flow of People and Vehicle Split”. Area around Jingzhou ancient city acts as press-reducing valve and buffer belt. (Source:
Drawn by the author, 2018)

1023
Kexin Chen, Zhe Hu and Yi He
Figure 8: Road Traffic Planning of Jingzhou Ancient City and the Area around it. Vehicle around the ancient city is intercepted in small circle lines in every district. Small circle lines lie on the 4 main
roads(outer ring), separate from slow-traffic road around ancient city. Outside of small circle lines and three blocked streets, parking facilities are centralized to intercept tourist buses outside of the ancient city. (Source: “Integrated Urban Design of Old Town Jingzhou and the Peripheral Area” Project text,
2019)
3.2.3 Decrease density and optimize function layout in ancient city, and support industrial growth in new area
Xin Wang et al. (2006) has pointed out, when industrialization and urbanization come to certain stage, ancient city is eager to move resource-intensive and labor-intensive industry out so it can make full use of its comparative advantages: capital and technology and optimize industrial structure. On the basis of cultural resource of ancient city, coordinate growth planning of ancient city and that of every district to provide foundation and motive force to industry in the new urban area. Cultural tourist lines of ancient city extend outward to give tourist casual culture in new city connection and support. The development of the new urban area is aimed to break spacial limitation of ancient city area, expand urban development and nurture new urban core.
The leading function of ancient city in the future will show the trend: historical presentation, traditional life and cultural tourism dominates inside of ancient city, while outside of it, on the basis of ancient culture, cultural tourism and a complete and comprehensive system will be developed. Ancient city is affected by dual pressure from population and traffic, so it can’t meet the demand of growth. Such functions as Central Hospital in the city, No. 5 Hospital, Women and Children Hospital and municipal office that don’t belong in ancient city should be relieved in priority. The function relief should consider the layout of ancient city in the future. Vigour, daily life facilities and units related to ancient

1024
Study on Integrated Conservation Strategy of the Buffer Zones of Historical Ancient Cities from the Perspective of Coordinated Development of New and Old Urban Areas:A Case Study on the
Space Around Jingzhou Ancient City city conservation should all be reserved. As for some meaningful public units, integrity of land use and continuation of their buildings should be attached importance to and in proper control as a reminder of old times (see Figure 9).
Figure 9: Planning and Guidance of Industrial Function in Jingzhou Ancient City and the Area around it. Focus on land resource in the south of the city. On the basis of universities along Xueyuan Road,
construct “industrial park of Jingchu culture crowd innovation” under city wall between Yingdu Road and Quyuan Road(S). Business-starting groups can gather in interval pergola with low-density
construction and service facilities shared. (Source: “Integrated Urban Design of Old Town Jingzhou and the Peripheral Area” Project text, 2019)
4. ConclusionAncient and new urban areas in historical ancient cities in the process of urban construction have relatively obvious differences in space function, but buffer zone can act as a basis for urban spacial integration. This paper reviews international conservation document for the proposal of the concept— buffer zone and its evolution. Buffer zone becomes a way to heritage conservation from being dispensable. It covers wider urban background and geographical environment, transcending the old “history-oriented” or “the whole area”. It combines heritage conservation and social and economic growth.
Then, by studying situations in the conservation and growth of ancient and new urban area in Jingzhou, this paper puts forward strategies to develop buffer area: coordinating ancient and new elements of ancient city, implementing traffic interception in ancient city, relieve functions of ancient

1025
Kexin Chen, Zhe Hu and Yi He
city and support industrial growth in new urban area so as to optimize space for the whole urban economic system. Conservation and renovation of historical ancient city and construction of new urban area are planned and implemented jointly, in order that integrated protection of historical heritage and its surrounding zone can be achieved in a more perfect and scientific way.
Acknowledgements This thesis would not have been possible without the consistent and valuable reference materials the I received from my supervisor, whose insightful guidance and enthusiastic encouragement in the course of my shaping this thesis definitely gain my deepest gratitude.
References Ning, C.and Bingzhong, Z. (2007) Transformation of old city and protection of historical and cultural heritage in the
process of Urbanization, Economic Altar, (1), 39-42. WHC, (2017) State of conservation of properties inscribed on the World Heritage List WHC-15/39.COM/7B, Available
from: Open Source Repository <http://whc.unesco.org/en/documents> (accessed 2017) WHC, (2017) State of conservation of the properties inscribed on the List of World Heritage in Danger.”
WHC/17/41.COM/7A, Available from: Open Source Repository <http://whc.unesco.org/archive/2017/whc17- 41com-7A-en.pdf> (accessed 2017)
WHC, (2017) State of conservation of the properties inscribed on the List of World Heritage in Danger.” WHC- 07/31.COM/7A, Available from: Open Source Repository <http://whc.unesco.org/archive/2007/whc07-31com- 7Ae.pdf> (accessed 2017)
Xing, W. (2006) The coupling relationship between industrial function orientation and urban development strategy of the New District -- Taking Haidian New District of Beijing as an example, City Issues, (6), 11-15

1026
The 54th International Conference of the Architectural Science Association (ANZAScA) 2020
Sustainable renovation of heritage buildings through IPDish and BIM: a case Study
Bani Feriel Brahmi1, Souad Sassi Boudemagh2, Ilham Kitouni3, Aliakbar Kamari*4 1, 2 AVFM laboratory-University of Constantine3 –Salah BOUBNIDER-, Constantine, Algeria
{feriel.brahmi, souad.sassi}@univ-constantine3.dz 3 University of Constantine2 -Abdelhamid MEHRI-, Constantine, Algeria
[email protected] *4 Aarhus University, Aarhus, Denmark
Abstract: Renovation of heritage buildings plays an important role in enhancing the built environment on integrating sustainable development aspects, considering both environmental, economic, cultural, and social contexts. A central, fundamental challenge within this field is handling enormous complexity through the adaptation of more sophisticated technologies and project management models to improve the quality of renovation projects and increase their sustainability and final performance. In the light of this, this research paper aims to review and summarize a successful example of implementing Integrated Project Delivery (IPD) strategies and tools, supported by Building Information Modelling (BIM) technologies for the renovation of a heritage building, the Renwick Gallery of the Smithsonian Art Museum, located in Washington, USA. The project goals, in particular, are set to reducing waste as well as energy consumption of the building, and the IPD philosophy (IPDish) and BIM are used to enable the collaboration and optimize efficiency in all project phases. The research study in this paper adopts a qualitative approach through an analysis of the relevant literature as well as data collection from the case study. As such, it explores the potential advantages of the IPDish+BIM application to managing the renovation project and to enhancing its sustainability aspects.
Keywords: Integrated Project Delivery (IPD); Building Information Modelling (BIM); Heritage Building; Sustainable Renovation.
1. IntroductionThere is increasing attention around the world that heritage buildings are substantial social capital to any country and that heritage renovation/conservation puts out economic, cultural, and social advantages to urban communities (Tweed & Sutherland, 2007). Therefore, the renovation of heritage buildings has become a revivification pathway to promote sustainability as well as to protect the heritage buildings' significance and values (Fouseki & Cassar, 2014). Research about energy renovation existing buildings to include also heritage buildings is expected to reduce the CO2 emissions and achieve
Imaginable Futures: Design Thinking, and the Scientific Method. 54th International Conference of the Architectural Science Association 2020, Ali Ghaffarianhoseini, et al (eds), pp. 1026–1035. © 2020 and published by the Architectural Science Association (ANZAScA).

1027
Bani Feriel Brahmi, Souad Sassi Boudemagh, Ilham Kitouni, and Aliakbar Kamari
added benefits, such as the reduction of life cycle cost of operating heritage building, improving energy consumption, and decreasing maintenance costs. It, likewise, can be extended to enhance the indoor climate and help to create a sense of place and belonging for people (Tweed & Sutherland, 2007). From the sustainability perspective, heritage buildings are generally categorized to have a very high-energy demand, as well as a poor indoor climate standard, particularly when it comes to a desirable indoor climate (Rasmussen et al., 2015; Tomšič et al., 2017).
Many researchers and practitioners in heritage renovation focus on the contradiction between the principle of "minimum intervention" and the current objectives of energy performance, as it has a high impact on the architectural values, which should be preserved through the renovation intervention (Kamari at al., 2017a). To deal with that, the sustainable renovation of heritage buildings requires cross- disciplinary (Kamari et al., 2019b), sophisticated methods to develop holistic decision-making frameworks (Kamari et al., 2018a) that will help professionals decide on the most appropriate renovation solution ( Kamari et al., 2018b, 2019c), to strike a balance by bringing further improvement to the users' living conditions, the safety of the building, safeguarding heritage values, and reducing the energy consumption (Fouseki and Cassar, 2014; Tomšič et al., 2017). Likewise, finding an optimal number of interrelating policies, processes, and technologies that will contribute to this success with many involved stakeholders, are yet another remaining challenges.
Integrated Project Delivery (IPD) and Building Information Modelling (BIM) are two innovative project management methods driven by advances in technology and the redrawing of social relationships (Rowlinson, 2017). IPD and BIM were emerged and being developed to improve the quality in the construction projects, increase their performance, and eliminate weaknesses of current project delivery systems (Azhara et al., 2014; Rowlinson, 2017). However, many studies revealed that IPD and BIM should play together complementary and synergistically to provide more pragmatic and effective solutions to complex project issues (Fakhimia et al., 2016). Shifting towards the application of IPD strategies and BIM could be a beneficial and effective avenue to enable collaboration and achieve the target balance of the sustainable renovation of heritage buildings.
Based on this underlying hypothesis, this paper presents the in-depth results of studying an original heritage building, implemented via IPD philosophy (IPDish) and BIM. To this end, the article provides empirical evidence of both the value and challenges of the current shift into IPD+BIM in such applications on achieving the project sustainability goals effectively and efficiently, through a comprehensive qualitative study. The case study conducted is the renovation of Renwick Gallery of the Smithsonian American Art Museum, located in Washington, USA. The primary objective of the building renovation has been stabilizing the historic structure for another 50–years, reducing waste, improving its energy efficiency, and preserving its historic character.
The paper is organized in Section 2, beginning by defining IPD and BIM in the context of this paper, and then reviewing the synergy between them and their application for heritage projects via an in-depth study of the relevant literature in these areas. In Section 3, the study uses a qualitative exploratory case study design (Yin 2003). A single case analysis (Yin 2003) was conducted to explore the phenomena and investigate the changes occurred on using the synergy between BIM and IPD in a specific example, to gain new insight. The data are collected from the technical articles of the renovation project, published in reports and online services. This section provides a short presentation of the case study at first. Then, the 4P+T model from Kamari and Kirkegaard (2019a) consisting of the five strands, people, product, process, policy, and technology is used as an analytical framework to investigate the potential of shifting towards the application of IPD+BIM, where it enhances the renovation context to attain sustainability in

1028
Sustainable renovation of heritage buildings through IPDish and BIM: a case Study
broader perspectives. The efforts are put in place to determine the collaborative practices across the project and the degree to which the project team including the owner, architects, engineering, and general contractor is able to effectively implement the tools and processes. Finally, section 4 presents a brief conclusion and sets out recommendations for further research.
2. BackgroundIPD emerged as an alternative delivery method based on a relational contract to reduce wastes and improve the construction industry performance (AIA, 2007). Today, many projects use the IPD as a philosophy, where using incomplete models of integration through the application of different IPD strategies and principals to a variety of contractual arrangements (Sive and Hays, 2009). However, BIM is a digital delivery method to generate a systematic approach for managing the critical information within a unique and shared platform, forming a reliable basis for decisions, throughout the building life cycle (Succar, 2009).
Recent studies and documents highlight several connections and the benefits of using BIM and IPD together (Kahvandi et al., 2017). They argue the integration requirement that can be effectively accomplished by BIM implantation to achieve better decision-making and remove IPD implementation barriers to deliver high-performance buildings (Azhara et al., 2014; Fischer et al., 2014).
Contrariwise, IPD is proposed by specialists as the best project management method to leverage BIM functionalities (AIA, 2007). Migilinskasa et al. (2013) and later Fischer et al. (2014) discuss that BIM adoption supported by the integrated agreement, can remove collaboration barriers, and enables the project team to function as a virtual organization within the search for better project delivery solutions and alternatives rather than the fights for individual benefits. Figure 1 illustrates the ability of IPD design process through BIM to make changes and provide optimal solutions, at an early design stage, to deal with the project complexity at a much lower cost than is otherwise possible.
Figure 1: MacLeamy curve of the current shift into IPD and BIM on construction project (Source: adapted from Smith and Tardif, 2009; Kamari and Kirkegaard, 2019a)
Based on the current IPD+BIM implementation experience, lessons learned from best practice examples can be extracted from (AIA, 2012; Cheng, 2015). In addition, evidence of success in achieving sustainable projects (Kamari at al., 2017b) within a high performing and collaborative environments is essential, but that does not currently exist to a great extent within the literature (Ilozor and Kelly, 2012; Nawi et al., 2014), especially for Heritage buildings. Counsell and Taylor (2017) report that IPD is particularly helpful as a benchmark against which to analyse the goal of Heritage Building Information Modelling (HBIM) as an integrated heritage building's delivery to conserving the cultural sustainability of built heritage during their lifetime used management mechanism that incorporates all stakeholders. Lucarelli et al. (2019) argue that the IPD methodology allows the improvement of the building process due to data sharing and communication between stakeholders by eliminating any possible delay. Jensen

1029
Bani Feriel Brahmi, Souad Sassi Boudemagh, Ilham Kitouni, and Aliakbar Kamari
et al. (2018) highlight the benefits of relational contracting and IPD for sustainable renovation projects on creating trust and using a wide range of strategic, tactical, and operational tools by collaborative teams. However, Megahed (2015) recommends BIM as support for IPD that allows model-based collaboration between people, systems, and business structures and practices.
Unfortunately, Heritage conservation projects are very lack and far between the real-life case studies carried out in the current literature. From the rare examples, Cambeiro et al. (2012) explore the rehabilitation example of an old barn situated in a rural landscape in Spain converted into a modern complex of apartments. The authors (Cambeiro et al., 2012) discuss the role of IPD elements application as a solution to minimize the occurred budgetary deviations and to reduce the risks assumed by every participant. It is stated that the team project creates collaborative decision-making around the different involved agents, and succeeds in reducing the reworking and errors through iterative design alternatives. In another project, IPD and BIM resulted in the achievement of a net-zero energy building (Cheng, 2015). The renovation of the Wayne N. Aspinall Federal Building Courthouse (in Colorado, USA) was a design-build project-deliver, with co-located integrated firms that placed emphasis on strong collaborative relationships and an open-minded approach (Cheng, 2015). BIM was linked to the energy model early in the project to facilitate the discussion by making clear connections between design changes and energy-performance impact. The project succeeds in achieving 84% energy reduction from the national average to be selected as the first net-zero historic preservation project in the USA.
In addition, to understand in more detail how the synergy between BIM and IPD enhance the renovation context and achieve sustainability, we conduct an in-depth qualitative case study. The analysis of case study facilitates exploring different outcomes to gain new insight.
3. Case study - The Renwick Gallery of the Smithsonian Art Museum
3.1. Brief presentation of the project
The Renwick Gallery of the Smithsonian Art Museum, of 46,800 sqft building, is located at Pennsylvania Avenue, Washington, USA. The building is the first purpose-built art museum in the USA. It was designed in the ornate Second Empire style by James Renwick Jr. and completed in 1859 as the Corcoran Gallery of Art (see Figure 2). The structure was last renovated between 1967 and 1972. The project was listed on the National Register of Historic Places on March 25, 1969, and is considered one of the first buildings of the modern historic preservation movement.
The building had a cultural interior renovation consisting of a roughly $20 million budget and an overall project cost of $30 million with funding through a 50-50 public-pri-
Figure 2: The façade of the Smithsonian Art Museum during the construction phase. (Photo by Prakash Patel; Courtesy of Consigli Construction, Co. Inc)
vate partnership, supported in part by a Save America's Treasure Grant. The project's core group included the following companies: Smithsonian Institution (owner), DLR Group-Westlake Reed Leskosky

1030
Sustainable renovation of heritage buildings through IPDish and BIM: a case Study
(architects), and Consigli Construction Co. (general contractor). Team selection began in 2012, and the Smithsonian Institution took over the building in July 2015, it was open to the public on November 2015.
3.2. Investigation of the potential shift of IPD and BIM for the renovation of Renwick Gallery
We use the 4P+T model from the study by Kamari and Kirkegaard (2019a) as an analytical framework to analyze and explore the potential shift of the IPDish approach supported by BIM for the sustainable renovation of the Renwick Gallery in more detail; with a set of defined variables consisting of the five strands (people, process, policy, technology, product). We address the benefit of the strategies, business models, and tools applied by the team project (owner, Architects, engineering, and general contractor) to achieve collaboration success through a specific example.
1) People - The team composition (and selection) was a key factor in establishing an influentialcollaborative culture found in the project. The owner representatives had extensive experience from previous major renovation projects in the past decade. The Smithsonian Institution selected the design- bid-build contract for the project, and several elements of IPD were integrated. Best-value-selection processes were fulfilled, and several factors affected the members' selection process, the increased team involvement, the high-performance goals, and the economic-stimulus. The owner selected the DLR Group+Westlake Reed Leskosky (WRL), an integrated design firm, advocate for sustainable design in all project types around the globe.
In addition, the team broadens their definitions of project stakeholders to include subcontractors, manufacturers, facilities managers, and community (participatory conservation). The increased number of engagement points leveraged more aspects of building products and building use to influence the overall performance. The design team and the General Contractor (GC) worked closely with a significant number of external agencies to minimize the external impact of changes to the appearance of the building.
However, the project team faced a primary challenge with the building chiller plant. The vendor has had an inferior performance on the project, with slow, incomplete, and inconsistent responses to design, construction, and operations feedback. Contrariwise, the manufacturer of the LED lighting was considered excellent in collaborative work. They invested additional time in research and development to create a product that met a whole series of demanding attributes: cost, color stability, lumen output, luminous efficacy, beam control, and flexibility.
Creating connections was essential to extending trust and sharing ideas among team members. The experience of the owner representatives allowed them to set reasonable contingencies for construction and provide an efficient decision-making structure. Decisions were made in a systematic and coordinated manner to fix careful planning, focusing on "best for the project" that create balance preservation objectives with interior systems. The teamwork provided an opportunity to share knowledge, learn lessons and capitalize best practices and strategies to apply IPD in future projects, as well as achieve continual improvement in the renovation of historic structures and augment the cultural consciousness among them. That gave them some market advantages over those that never used it before.
2) Process - The early-involved key participants within an integrated design process were the primarysuccess of the project. The collective team had a deep appreciation for the "why" of the project, rather than just the "how" of the project. A 50–year overall life cycle, before another major renovation, was targeted. In the Planning phase, the design team worked closely with the contractor and the owner
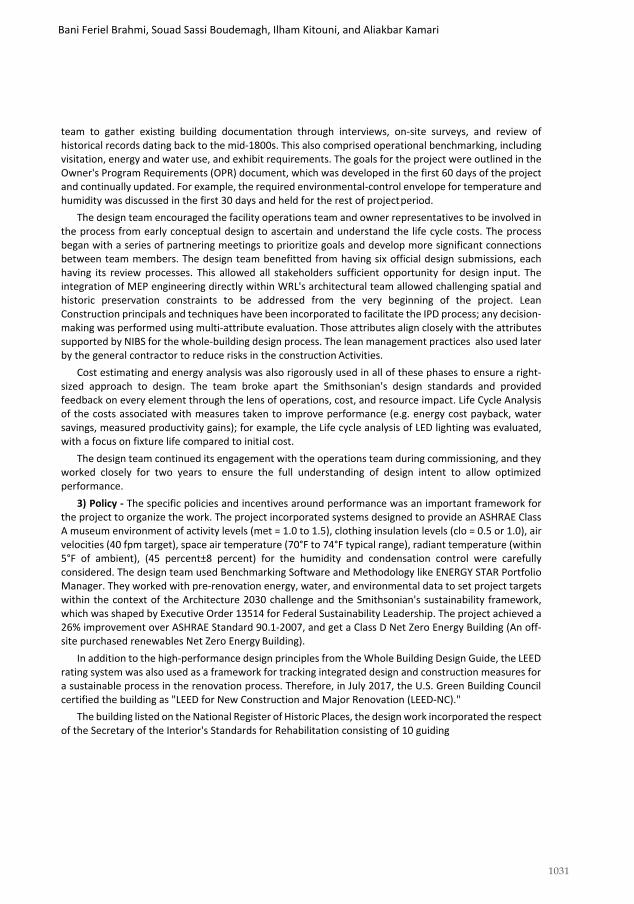
1031
Bani Feriel Brahmi, Souad Sassi Boudemagh, Ilham Kitouni, and Aliakbar Kamari
team to gather existing building documentation through interviews, on-site surveys, and review of historical records dating back to the mid-1800s. This also comprised operational benchmarking, including visitation, energy and water use, and exhibit requirements. The goals for the project were outlined in the Owner's Program Requirements (OPR) document, which was developed in the first 60 days of the project and continually updated. For example, the required environmental-control envelope for temperature and humidity was discussed in the first 30 days and held for the rest of project period.
The design team encouraged the facility operations team and owner representatives to be involved in the process from early conceptual design to ascertain and understand the life cycle costs. The process began with a series of partnering meetings to prioritize goals and develop more significant connections between team members. The design team benefitted from having six official design submissions, each having its review processes. This allowed all stakeholders sufficient opportunity for design input. The integration of MEP engineering directly within WRL's architectural team allowed challenging spatial and historic preservation constraints to be addressed from the very beginning of the project. Lean Construction principals and techniques have been incorporated to facilitate the IPD process; any decision-making was performed using multi-attribute evaluation. Those attributes align closely with the attributes supported by NIBS for the whole-building design process. The lean management practices also used later by the general contractor to reduce risks in the construction Activities.
Cost estimating and energy analysis was also rigorously used in all of these phases to ensure a right- sized approach to design. The team broke apart the Smithsonian's design standards and provided feedback on every element through the lens of operations, cost, and resource impact. Life Cycle Analysis of the costs associated with measures taken to improve performance (e.g. energy cost payback, water savings, measured productivity gains); for example, the Life cycle analysis of LED lighting was evaluated, with a focus on fixture life compared to initial cost.
The design team continued its engagement with the operations team during commissioning, and they worked closely for two years to ensure the full understanding of design intent to allow optimized performance.
3) Policy - The specific policies and incentives around performance was an important framework forthe project to organize the work. The project incorporated systems designed to provide an ASHRAE Class A museum environment of activity levels (met = 1.0 to 1.5), clothing insulation levels (clo = 0.5 or 1.0), air velocities (40 fpm target), space air temperature (70°F to 74°F typical range), radiant temperature (within 5°F of ambient), (45 percent±8 percent) for the humidity and condensation control were carefully considered. The design team used Benchmarking Software and Methodology like ENERGY STAR Portfolio Manager. They worked with pre-renovation energy, water, and environmental data to set project targets within the context of the Architecture 2030 challenge and the Smithsonian's sustainability framework, which was shaped by Executive Order 13514 for Federal Sustainability Leadership. The project achieved a 26% improvement over ASHRAE Standard 90.1-2007, and get a Class D Net Zero Energy Building (An off-site purchased renewables Net Zero Energy Building).
In addition to the high-performance design principles from the Whole Building Design Guide, the LEED rating system was also used as a framework for tracking integrated design and construction measures for a sustainable process in the renovation process. Therefore, in July 2017, the U.S. Green Building Council certified the building as "LEED for New Construction and Major Renovation (LEED-NC)."
The building listed on the National Register of Historic Places, the design work incorporated the respect of the Secretary of the Interior's Standards for Rehabilitation consisting of 10 guiding

1032
Sustainable renovation of heritage buildings through IPDish and BIM: a case Study
principles for historic-building projects. Significant tax and grant incentives available through federal and state programs are contingent on the successful implementation of these standards.
4) Technology - For efficient environmental performance analyses and sustainability enhancement,the team members used a set of sophisticated technologies including Design Software (Autodesk AutoCAD and Revit, Trimble Sketchup. Photo-realistic rendering); Energy Simulation Software, (Trane Trace 700; the NIST BLCC tool), and lighting simulation software (AGI-32 lighting evaluation tool). The exchanging data between them fostered efficient information management and provided project transparency to meet the high degrees of the building complexity.
The teamwork used laser scanning, photogrammetry, and other materials and technologies for the building examination. The laser-scanning process allowed the development of a high-fidelity existing spatial-condition model of the building not previously possible allowed for final integration of systems, and greater clarity for system maintenance. A massive quantity and stores semantic inter-related information are represented as well as external documents, and it integrates geometric and non- geometric datasets. Virtual modeling was critical to allowing clash detection of art with building systems, as it moved through the basement from the building entrance to the workshop.
5) Product - Cost and schedule predictability were important drivers of using IPD mindset and BIM onthis project in addition to its technical complexity, which required interdisciplinary teamwork. The team's success was evaluated on the ability to meet the project budget and schedule while meeting the goals outlined in the Owner's Program Requirements (OPR). Managing the schedule and keeping the project on track was a challenge given the technical complexity of the building. The total construction cost budget was $20 million ($427/sqft), excluding exhibit fit-out support infrastructure, in contrast to the average cost for 137 museum projects that was $772/sqft based on data from the American Alliance of Museums (2003-2010).
The Renwick's improvements deliver comfort energy savings with creative retrofits. The measured net EUI had a 49% reduction from the national average, and the renovation provided daylight to 90% of the staff areas. The design team worked closely with Scott Rosenfeld, the Smithsonian's staff lighting designer, to develop a flexible and efficient LED lighting scheme. The team further worked with several LED lighting manufacturers (Meetings included joint visits to manufacturers, review of precedents at other institutions, and meetings with other discipline leaders), which led to the development of a new type of LED source specifically for the specialized needs of the Renwick (narrow-spot, high-throw). This resulted in approximately 60 % first cost savings and under a 3-year payback over the use of halogen only sources. The building is one of the first museums in the United States to use an all-LED solution for gallery lighting, and the source is now being sold for use in other markets, such as hospitality and retail.
The building incorporates modern life-safety systems, while at the same time improving indoor environmental quality. The building systems can now support a wide range of exhibits with greater HVAC, electrical, and structural load capacity and flexibility. The Renwick Gallery quickly exceeded its previous annual visitation average in attendance from 175,000 annual visitors in 2012 to 800,000 annual visitors since the museum's reopening in 2015.
On the other hand, the collaborative environment allowed the teamwork to preserve heritage values and deal with technical and spatial constraints. The museum encountered issues with surface condensation, due to a lack of air movement and stable supply air dew-point control. These spatial limitations demanded strong coordination and open communication among team members to provide optimal solutions. According to Roger Chang (principal, director of engineering, Westlake Reed

1033
Bani Feriel Brahmi, Souad Sassi Boudemagh, Ilham Kitouni, and Aliakbar Kamari
Leskosky), the most significant achievement of the IPD mindset was the avoidance of raising the building's roof height by 10 ft. Fortunately, the structure created by the Smithsonian's processes was beneficial, as it allowed for predictability of documentation expectations and an orderly way to capture the change in a transparent way. This led to a strong focus on reduced cooling-load demand, facility operations input, risk reduction for art, and overall space usability.
The virtual product - The project was one of the first to use a full virtual-construction model, which has now become a requirement for future modernization projects for the Smithsonian Institute. The contractor worked closely with subcontractors and the design team to develop a detailed 3D model to a 400 level of definition of all building systems. This process allowed for the final integration of systems with a dimensional fidelity not previously possible
Figure 3 summarized 31 benefits of the potential shift of IPD+BIM in the sustainable renovation of the Renwick Gallery through the analytical application of 4P+T seminal strands.
Figure 3: The potential shift of IPD+ BIM in the renovation of Renwick Gallery
The results reveal that the use of IPD through BIM over a design-bid-build delivery model enables the high stakeholders' involvement and collaboration in this project, with effective communication and accurate, proactive decision-making at an early design stage. In terms of building outcomes, the project attained the above target balance as it has met the budget and schedule goals and has achieved a high level of innovation and advanced sustainable-building technologies together with preserving the heritage buildings' characteristics and features. The project has achieved 49% energy reduction from the national average and obtained the LEED Silver certification. These findings are relevant to building design researches and practitioners, who can use the resultant to better navigating the IPD through BIM, and advance the sustainable renovation of heritage buildings with multiple stakeholders.
In addition, many lessons can be learned from the project, and the most important among others is that the composition of teamwork plays a vital role in enabling the adoption of an IPD approach in an
1034
Sustainable renovation of heritage buildings through IPDish and BIM: a case Study
efficient track. The selection of qualified integrated firms committed to the collaboration process, along with the owner in complex projects, could facilitate the trust built among team members to achieve project goals. Moreover, the choice of industrial manufacturers should be taken after careful consideration to avoid any disrupts in the project and maximizing their values.
4. ConclusionThe need for collaborative approaches to managing heritage renovation projects is evident concerning the requirements for reaching sustainability together with preserving the heritage buildings' characteristics and features. This paper presented an in-depth discussion and results of the application of two innovative project management methods driven by advances in technology, IPD+BIM, for sustainable renovation of the heritage buildings. To this end, a literature review and concrete case study were carried out. Even though the significant limitation to this study concerned the data collection in terms of willingness, the findings indicate that there are potential advantages of IPD strategies adoption through BIM on sustainable renovation projects over a traditional design-bid-build delivery model. Likewise, it was observed that the early involvement of key participants allows the stimulation of integrated intervention design, establishing efficient environmental performance analyses and sustainability-enhancement, at an early stage. In a collaborative environment, stakeholders endeavoured to cope with the complexity of achieving a balance between sustainable building performance (environmental, budget, time) and heritage values preservation, through a full virtual- construction model, which can be used for operation and maintenance, as well as future upgrading of the building.
The case study may be of particular value to future studies that seek the best implementation of IPD in the different delivery models for heritage renovation projects. However, it is of great importance to investigate the readiness of the heritage industry to improve its project delivery process through the implementation of the synergy between IPD and BIM. The understanding of the challenges and value- adding potential is fundamental at this early stage. Furthermore, the choice of the organizational and business structure should be smoothly adapted to the sustainable renovation characteristics and best suited to the capabilities and participants' needs to implement the heritage projects efficiently, and in an applicable tendency
References AIA and AIA California council (2012) IPD case studies. AIA Minnesota, School of Architecture, University of
Minnesota. Minneapolis, MN. Azhara, N., Kanga, Y., and Ahmad, I. U. (2014) Factors Influencing Integrated Project Delivery In Publicly Owned
Construction Projects: An Information Modelling Perspective. Procedia Engineering, 77, 213 – 221. Cambeiro, F. P., López, P., and Brodeschi, M. (2012) Gestión, Financiación y Costes Filosofía IPD aplicada a la
Rehabilitación de Construcciones de la Arquitectura Tradicional. 4º Congreso de patología y rehabilitación de edificios, (12-14 April 2012). Santiago de Compostela, Spain.
Chang, R. (2017, October) How to use IPD for design-bid-build success. Consulting - Specifying Engineer. Available from: https://www.csemag.com/articles/how-to-use-ipd-for-design-bid-build-success/
Chang, R. (2019, January) The Renwick Gallery of the Smithsonian American Art Museum, Washington, D.C. High Performing Buildings. Available from: http://www.hpbmagazine.org/Case-Studies/The-Renwick-Gallery-of-the- Smithsonian-American-Art-Museum-Washington-DC/.
Cheng, R. (2015) Integration at Its Finest: Success in High-Performance Building Design and Project Delivery in the Federal Sector. American Institute of Architects / School of Architecture, University of Minnesota.

1035
Bani Feriel Brahmi, Souad Sassi Boudemagh, Ilham Kitouni, and Aliakbar Kamari
Counsell, J. and Taylor, T. (2017) What are the goals of HBIM? New York, NY: Routledge. Heritage building information modelling. 15-31.
DLR Group, Westlake Leskosky (2017) The Renwick Gallery of the Smithsonian American Art Museum. Architect. El-adaway, I., Abotaleb, I. and Eteifa, S. (2017) Framework for Multiparty Relational Contracting. Journal of Legal
Affairs and Dispute Resolution in Engineering and Construction, 9(3). Fakhimi, A.H., Majrouhi Sardroud, J., and Azhar, S. (2016) How can Lean, IPD and BIM Work Together?
33rdInternational Symposium on Automation and Robotics in Construction (ISARC 2016), Auburn, Alabama. Fischer, M., Reed, D., Khanzode, A., and Ashcraft, H. (2014) A Simple Framework for Integrating Project Delivery. In:
IGLC22, 25-27 June 2014, Oslo, Norway, 22, 1319-133. Fouseki, K., and Cassar, M. (2014) Energy Efficiency in Heritage Buildings- Future Challenges and Research Needs,
The Historic Environment: Policy & Practice, 5 (2), 95-100. Ilozor, B. D., and Kelly, D. J. (2012) Building Information Modeling and Integrated Project Delivery in the Commercial
Construction Industry: A Conceptual Study. Journal of Engineering, and Production Management, 2(1), 23-36. Kahvandi, Z., Saghatforoush, E., Alinezhad, M. and Noghli, F. (2017). Integrated Project Delivery (IPD) Research
Trends. Journal of Engineering, Project, and Production Management, 7(2), 99-114 Kamari, A., Jensen, S. R., Corrao, R., and Kirkegaard, P.H. (2017a) Towards a holistic methodology in sustainable
retrofitting: Theory, Implementation and Applications. In WSBE 2017, Hong Kong, China. 702-708. Kamari, A., Corrao, R. and Kirkegaard, P.H. (2017b) Sustainability focused Decision-making in Building Renovation.
International Journal of Sustainable Built Environment, 6(2), 330-350. Kamari, A., Laustsen, C., Petersen, S., and Kirkegaard, P.H. (2018a) A BIM-based decision support system for the
evaluation of holistic renovation scenarios. Journal of Information Technology in Construction, 23 (1), 354-380. Kamari, A., Schultz, C., and Kirkegaard, P.H. (2018b). NovaDM - Towards a formal, unified Renovation Domain Model
for the generation of holistic renovation scenarios. In ECPPM 2018, Copenhagen, DK. Kamari, A., and Kirkegaard, P.H. (2019a) Potential shift of Integrated Design (ID) through BIM in Sustainable Building
Renovation. IOP Conf. Series: Earth and Environmental Science 329 (2019) 012025. Kamari, A., Jensen, S.R., Corrao, R., and Kirkegaard, P.H. (2019b) A Holistic Multi-methodology for Sustainable
Renovation. International Journal of Strategic Property Management, 23 (1), 50-64. Kamari, A., Schultz, C., and Kirkegaard, P. H. (2019c) Constraint-based renovation design support through the
renovation domain model. Automation in Construction, 104, 265-280. Lucarelli, M., Laurini, E., Rotilio, M., and De Berardinis, P. (2019) BEP & Mapping Process for the Restoration Building
Site. The International Archives of the Photogrammetry, Remote Sensing and Spatial Information, 747–752. Megahed, M. A. (2015) Towards a Theoretical Framework for HBIM Approach in Historic Preservation and
Management. International Journal of Architectural Research, 9(3), 130-147. Migilinskasa, D., Popovb, V., Juoceviciusc, V., and Gediminas, L. U. V. (2013) The Benefits, Obstacles and Problems of
Practical BIM Implementation. Procedia Engineering, 57, 767–774. Rasmussen, T. V., Møller, E. B., and Buch-Hansen, T. C. (2015) Extensive Renovation of Heritage Buildings: Reduced
Energy Consumption and CO2 Emissions. Open Construction & Building Technology Journal, 9, 58 -67. Rowlinson, S. (2017) Building information modelling, integrated project delivery and all that. Construction
Innovation, 17 (1), 45-49. Smith, D.K. and Tardif, M. (2009) Building Information Modeling: A Strategic Implementation Guide for Architects,
Engineers, Constructors, and Real Estate Asset Managers, Wiley, New Jersey. Sive, T. and Hays, M. (2009) Integrated Project Delivery: Reality and Promise, A Strategist's Guide to Understanding
and Marketing IPD, Society for Marketing Professional Services Foundation, White Paper on IPD. Washington. Succar, B. (2009) Building information modelling framework: a research and delivery foundation for industry
stakeholders. Automation Construction, 18 (3), 357–375. Tomšič, M., Mirtič, M., Šijanec Zavrl, M. and Rakušček, A. (2017) Energy renovation of cultural heritage buildings "by
the book". Procedia Environmental Sciences, 38, 212 – 219. Tweed, C. (2007) Built cultural heritage and sustainable urban development. Landscape and Planning, 83 (1), 62-69. WBDG (2017) The Renwick Gallery of The Smithsonian American Art Museum (updated on 03-10-2017). Yin, R. K. (2003) Case study research: Design and methods (3rd ed.). Thousand Oaks, CA: Sage.

1036
The 54th International Conference of the Architectural Science Association (ANZAScA) 2020
System Fail: A review of the systems approach as a decision makingMethod for lifeline infrastructure systems
Chris Ford1 and Jan Auernhammer2
1 Stanford University, Palo Alto CA, USA [email protected]
2 Stanford University, Palo Alto CA, USA [email protected]
Abstract: Lifeline infrastructure systems are planned and implemented to provide urban dwellers with critical resource units. These resource units include food (kCals), communication (mHz), energy (kWh), and water (MGDs), while also discharging units of waste (tons). Decision-makers historically responsible for shaping these lifeline systems (including members of the Planning, Civil Engineering, and Architecture disciplines) have demonstrated a collective systems-centric mindset for infrastructure implementation. This paper reviews the Systems Approach as the prevailing decision-making method responsible for shaping the majority of infrastructure used in the United States today. However, a legacy effect of past systems-centric infrastructural action is one that entrains the majority of infrastructural planning, design, engineering and construction within a decision-making process now challenged by complexifying urban contexts of the 21st century. Through problem-oriented inquiry, this paper: 1) identifies a bias for the system as a solution type for the design of urban infrastructure; 2) explains the systems approach as a thought model and process for decision-making; 3) advances people-centered mindsets will be essential for designing next-generation infrastructure solutions appropriate for 21st century urban futures.
Keywords: Infrastructure; lifeline systems; systems approach; design methodology.
1. Cities and their infrastructural resource systemsThe city, as a specific form of human settlement, has proven to be a preferable option for human dwelling. Despite humanity’s ~250,000 year history, current archaeological evidence suggests cities first emerged in Mesopotamia only 5000 years ago. Cities are the largest form of technology that humans make, and they now house greater than 50% of the world’s population. The number of persons either born into or choosing to live as urban dwellers is expected to rise, and the United Nations (2018) forecasts 68% of the world population will live in cities by the year 2050. Remarkably, cities comprise a very small portion of the Earth’s surface, and cities in the United States today form a combined urban footprint equivalent to only 3.5% of its land area (Cohen 2015). The full extent to which COVID-19-induced deurbanization affects this trend remains to be seen.
Imaginable Futures: Design Thinking, and the Scientific Method. 54th International Conference of the Architectural Science Association 2020, Ali Ghaffarianhoseini, et al (eds), pp. 1036–1045. © 2020 and published by the Architectural Science Association (ANZAScA).

1037
Chris Ford and Jan Auernhammer
The city remains the strongest material evidence of our human desire to dwell collectively. Yet the development of each city as a place-specific environment for urban dwelling necessitates the co- development of its respective infrastructure systems. Similar to submarines, cruiseships, and space stations, cities also require life support systems to enable sustained human inhabitation. While the boundaries of lifeline systems are evident within a contained vessel, the extents of urban systems are either beneath or beyond visible range as they often exceed municipal boundaries.
1.1. Vulnerabilities and hazards to lifeline infrastructure systems
In this modern era, the implementation of urban infrastructure is the responsibility of a range of stakeholders and decision-makers. First generation modern infrastructure systems were brought online around the year 1890 and were built according to then-good engineering practice with a service life expectancy of 50 – 75 years (Rainer 1990). At their moment of implementation however, there was no corresponding plan for system repair or replacement. Fortunately, some infrastructure was deliberately over-engineered with generous safety factors, and this in part explains how some infrastructure continues to perform beyond its originally planned service life.
Designed for robustness and reliability, first-generation infrastructure also considered its own scalability. However, these same systems operate in contexts different from those present when conceived. Today’s contexts introduce increasing load on existing system capacities, changing fiscal models, and are vulnerable to a greater range of hazard types exhibiting increased strength and ferocity, some regionally unprecedented. When categorized, these external and internal hazards include natural catastrophes, mechanical faults, human interventions, and stock compromises. As urban dwellers require on-demand availability of resource units, these hazards pose the greatest threat to infrastructure integrity. To be an urban dweller today involves a special vulnerability to the very environment in which one chooses to reside.
Considering the longer gestational arc for infrastructural design decisions, the future security and vitality of urban settlements require forward-looking designs today that anticipate use in predicted but wholly unforeseeable contexts (Ford, 2019). Infrastructural development over recent decades in the United States has reinforced a strain of engineering action that emphasizes the design of robust, centralized systems as a preferred means for on-demand delivery of critical resource units. Such a position is reasonable from the perspectives of scaling new service and optimizing urban system operations. In this Anthropocenic epoch characterized by strengthening hazards however, an imperative for persistent operation prompts greater consideration of resilient, decentralized solutions for delivering critical resource units to urban dwellers. Must decisions regarding next-generation urban solutions be resolved by members of other disciplines, or is it reasonable for urban planners and architects to practice disciplinary promiscuity and lead the development of superior urban solutions using the best of their own disciplinary skill sets?
It seems pertinent to first understand the historic primacy placed on the system as a form for infrastructural implementation. In the interest of questioning the system as a design strategy and investigating its associative tactics for infrastructure implementation, the following questions are posed: What explains the historical prevalence of systems-centric thinking utilized by infrastructural decision- makers across multiple disciplines? What are the key features of this thinking and what are its implications? How might the nurturing of an alternative mindset improve decision-making on the delivery of viable, feasible, and desirable solutions for resource unit delivery in future urban yet unforeseen contexts?

1038
System Fail: A review of the systems approach as a decision makingMethod for lifeline infrastructure systems
2. Defining systemsA system has been defined by others as:
• “…a collection of entities interrelated in a specific way to accomplish a particularobjective.” (Lapatra 1973)
• “…any whole as composed of interrelated parts.” (Ferguson 1975, p14)• “…a time-varying configuration of [persons], hardware, and operating procedures
grouped together for the purpose of accomplishing a useful function or functions.” (Dickerson 1975, p16)
• “…a set of elements or parts that is coherently organized and interconnected in apattern or structure that produces a characteristic set of behaviors, often classified as its function or purpose.” (Meadows 2008, p188)
Effective definitions of a system share certain elements. The first three were published between the span of 1973 to 1975 within larger discussions about the Systems Approach. The last one, by Donella Meadows in her title Thinking in Systems, includes similar elements but with more qualification and nuance for improved application to a greater number of system types. Meadows’ definition lends itself well for recognizing systems that are either physical such as a grocery store chain, or non-physical such as the legislative system.
Each of these definitions acknowledges the compositional relationship between parts-to-whole. Whereas each component of a system can be read as a singular entity, its properties and features also signal a contributory role in the making of a larger entity. Orchestrating a system requires planning action that is deliberate, intentional, and specific. From a system’s interior, complexity is easily found in “the multiplicity of interactions within the system and the multiplicity of outputs of the system for each input” (Dickerson, 1975, p4). From their exterior, small systems can possibly be perceived in their fullness, but larger systems such as urban infrastructure are dependent upon either numeric or graphic conventions for holistic representation. Depending upon the scale at which a system is examined, it is likely multiple systems will be found working simultaneously, and sometimes with interdependent relationships to one another. This is certainly true for both the human body and the urban corpus. When perception oscillates in scale, it is then easier to recognize “any system is a subsystem of a broader system, in that its function is a part of a larger function” (Dickerson, 1975, p17). In some cases, two or more systems may share a system component. If deliberately designed in this way, and the achieved relationship is not detrimental to its own fidelity, then “the principle of combining functions is very useful in reducing effective costs” (Dickerson, 1975, p18). However from a risk assessment perspective, components shared between two or more systems present increased risk and require heightened fidelity for serving multiple roles.
The basic behavior of a system is demonstrated through the bi-directional translation of a type of flow into a system stock, or vice versa. A stock is “a store, a quantity, an accumulation of material or information that has built up over time” (Meadows, 2008, p15). For lifeline infrastructural systems, critical resource units such as kWhs of electricity and GBs of data are system stocks for the duration the units reside within its respective system. A flow is stock within a system and is measured as inflows into the beginning of a system, or as outflows at system end.
Whereas a system can be conceived independently from a specific context or environment, all implemented systems negotiate with and operate in specific environments. The water systems serving Ras Al Khair, Saudi Arabia; Flint, Michigan; and San Francisco, California feature some similarities while also expressing peculiarities. Importantly, a system bounds and demarcates itself from the larger

1039
Chris Ford and Jan Auernhammer
environment within which the system is positioned. This environment presents extrinsic elements not part of the designed system, but can affect the function of the system in some way (Dickerson, 1975, p19). Environments present context-specific hazards and vulnerabilities thereby generating an informative feedback loop for resilient design requirements prior to system implementation. Some foresight is required. Systems can also introduce impacts to their environments and infrastructure planning has historically been challenged to anticipate their full range once operational. Each decision maker “is eager to provide optimal conditions within [their respective] system. [However, each] tends to neglect the overall effects of [their] decisions upon other systems within the urban environment” (Ferguson, 1975, p7). For instance, the environmental and social costs associated with elevated freeways in Boston and San Francisco are well documented, as well as the rediscovery of benefits when these same freeways were demolished. Also, a stronger appreciation for environments as realms of use may raise emphasis on the usability of system outflows rather than on system expression and self-embodiment. For urban systems, one explanation for short-sightedness is disciplinary bias and the emotional reward of form making at urban scale. The pursuit of this “fix” is repeatable and is demonstrated across multiple disciplines responsible for our amalgamated urban assemblage. Urban planners, architects, and civil engineers have been accused of perceiving the city as “a container of social, economic, and political phenomena, and they appreciate the significance of these activities in giving physical form to the city” (Ferguson, 1975, p4). Such outlooks gave rise to egocentric form-giving in the urban realm, most notably at the height of Modernism. In such circumstances, the designer no longer made decisions with the good of the urban dweller in mind, but rather made highly individualistic creative statements to themselves (Papanek 2000). Cities and their urban dwellers meanwhile continue to demonstrate non-form-based needs deserving of designers’ best engagement. To this end, Keller Easterling’s distinction between active forms and object forms is a helpful clarification for informing some portion of future infrastructural action (Easterling 2014). However, the continued pairing of an architect’s value with the giving of urban form drastically underrepresents their full agency for addressing the overall quality of urban dwelling, including the design of lifeline infrastructure systems.
3. Intuition as a prevailing paradigmWhen personal, internalized expectations guide the generation of design options, then an egocentric mindset is responsible for decision making. For experienced designers, the ease with which one implicitly evaluates significant facets and navigates complex problem spaces to achieve an intuitive feeling for a solution, is both helpful and welcome (Handler, 1970, p3). Prior to the emergence of the systems approach, decision-making about complex urban systems tended to rely on introspective mental models and methods that were also egocentric, and identified as intuition in systems approach literature. Intuition was allegedly activated when “analysis must rely on imprecise models, data is sparse, or computations get difficult” (Dickerson, 1975, pxiii). The use of intuition, while an acceptable practice for small, private, and isolated architectural solutions, was proving ineffective for large, public, urban design problems characterized by complexity and distributed across the urban field. For designers to rely on intuition as a means for overcoming complexity is often incompatible with reality. “The situation is analogous to flying an airplane in zero visibility. The pilot who relies on [their] senses will make decisions which, on the average, are worse than if [they] relied on [their] instruments” (Dickerson, 1975, pxiii). The challenges of operating by intuition arise from available mental capacity oversaturated with all available information, and lacking ability to objectively process it without inherent bias. One’s ability to “take into account all of the factors on an intuitive basis is quite poor. But [their] intuition gets better as [systems] analysis shows us why our first impressions were wrong” (Dickerson, 1975, p10).

1040
System Fail: A review of the systems approach as a decision makingMethod for lifeline infrastructure systems
Methods utilized to pursue one’s personal expectations for design solutions were deemed inadequate for engaging the complexity of urban design problems, and critics called for a greater systemization of relevant planning and design processes (Ferguson, 1975, p1). The prevalence of intuition was then superseded by the emergence of the systems approach as a preferable method for decision making. Such a shift requires loosening personal expectations for form-giving and developing a comprehensive aptitude for navigating a greater number of external constraints and internal design requirements.
4. The systems approachAs a method for engaging urban design problems that were increasingly complex and dynamic, the systems approach emerged as a preferred tactic. Origins of the systems approach have been traced to Operations Research during World War II (Churchman 1979) and its application to the built environment through the Functionalist Movement (Handler, 1970, 5). It is understandable how urban decision- makers have over time cultivated systems-centered mindsets and how a preference for more systemic thinking has ensued. In other fields, various amounts of system-centrism are responsible for yielding formidable technological advancements, including the space race to the moon. When cities grow, urban complexity scales through juxtaposed material practices, as urban dwellers increase the cumulative load exerted on lifeline infrastructure systems.
Figure 1: Representations of the systems approach differ across disciplines. Left: from Dickerson, S.L. and Robertshaw, J.E. (1975) Planning and Design: The Systems Approach. DC Heath and Company, Lexington, p18. Right: from Marakas, G.M. (2006) Systems Analysis & Design: An Active Approach. McGraw Hill, New York, p23.
4.1. Description of the systems approach
The systems approach is a procedure-based thought model for problem solving. Dickerson and Robertshaw have characterized the systems approach as “a plan for making plans,” (1975, p23) while Ferguson describes it as “a guide to attacking a problem” (1975, p4). Whereas the systems approach semantically suggests a methodology for designing systems, it is instead a method for systemic thinking through the articulation of deliberate action items moving from the general to the specific. In broad terms, it can be understood as four basic steps: Problem Formulation, Modeling, Analysis and Optimization, and Implementation (Lapatra, 1973, p7). As a method for decision making, it can be applied to different types of problems, whether a product or a service, yet presents comparative advantage when engaging larger, complicated problems. The systems approach has been embraced as a conceptual framework for facing complexity, as “it reflects a search for the interrelatedness of things in any problematic situation. As a planning tool, it means approaching the city as a very complex whole within which many elements act interdependently” (Ferguson, 1975, p5).

1041
Chris Ford and Jan Auernhammer
Methods for action-taking are often representationally abstracted to share with others and enable generalizable application to different types of problems. Specifically, the systems approach requires highly rational outcomes through the making of actionable plans such as general workflow diagrams and problem-specific critical paths (Fig.1). Both convey procedural steps for action, however the realities of their respective action-taking will be quite different on a per problem basis.
Across the review of multiple authors however, there are two pervasive features that are central to all helpful descriptions: holism in the identification of a problem, and rationality in engaging the problem.
4.1.1. Key characteristic: Holism
Disciplinary bias and intuition are often characterized as two phenomena inhibiting the identification and recognition of problems. Interestingly, R. Buckminster Fuller observes the emphasis placed on specialization is also detrimental to holistic problem identification. Fuller asserts failures in our world are a consequence of many factors, but “possibly one of the most important is the fact that society operates on the theory that specialization is the key to success, not realizing that specialization precludes comprehensive thinking” (Fuller, 1970, p13). To effectively engage problems of the world, Fuller argues society needs to develop comprehensive propensities. For planners and designers, this requires the sustained interrogation of a problem space for a longer period of time by a greater number of people to acknowledge how a problem’s extents transgress disciplinary boundaries. The wicked nature of planning urban systems “is not concentrated in any single head,” as there are no specialists for wicked problems and the expertise required is usually distributed over many people (Rittel, 1982, 45).
Users of the systems approach aspire to consider problems holistically and in their fullness. The problem is identified and developed “by taking a general, broad look at the situation, that is, by considering the total system, including its environment” (Dickerson, 1975, p30). A holistic perspective is extremely difficult to achieve in practice whether executed as an individual, or by an experienced team of interdisciplinary design professionals. Subconscious behaviors, habits, and mindsets work at different moments, strengths, and scales to oppose stated goals and aspirations for altruistic decision-making.
Whether knowingly or unknowingly, the direction of one’s concern and attention to a portion of a problem comes at the expense of a more holistic problem definition. This dynamic is characteristic of most 20th century urban solutions, and is especially true in infrastructure design. Infrastructural history contains examples of solutions that have inadvertently introduced detrimental and undesirable effects creating new social, political and economic problems to be managed by others at some future moment. Examples in the United States include the removal of the Key System streetcars from the East Bay bridge, Robert Moses’ bridge designs on the periphery of New York City, and PG&E electrical equipment failures responsible for igniting multiple wildfires in 2018, 2019, and 2020 across California (Penn and Eavis, 2020).
The explicitly stated pursuit of holism implies an unlikeliness it will be achieved.
4.1.2. Key characteristic: Rationality
The systems approach also requires rationality in both thought and action. When reviewing project materials produced with the systems approach, the expression of this rationality is the most identifiable characteristic of its presence (Ferguson, 1975, p7-8). Evidence of rationality also includes the systematizing of a design process, far exceeding any expectation for rational decision-making, and often takes the form of procedural block diagrams (Fig 2).

1042
System Fail: A review of the systems approach as a decision makingMethod for lifeline infrastructure systems
A key feature of the systems approach is the analysis of inflows and outflows that differentiates this process from others (Jones, 1970, p121). Increased rationality also prompts a consistent evaluation of possible solutions through the calculation and itemization of applicable benefits and penalties for each. From a rational perspective, the measure of a benefit is called effectiveness, and the measure of penalty is called cost (Dickerson, 1975, p21).
Rational decision making however poses challenges of its own, including three aspects “which are often overlooked or badly handled. First, the entire lifetime of the consequences of the decision must be considered… Second, certain types of benefits and penalties are often badly underestimated or overestimated… Third, secondary benefits and penalties are often badly mishandled by a type of double bookkeeping” (Dickerson, 1975, p14). Anticipating consequences is valuable for the design of urban systems, however a paradox of rationality emerges. The anticipation of consequences of decisions “is consequential by itself because it takes time, labor and money to trace consequences” (Rittel, 1982, 38). These expenditures underscore the importance of not only calculating impacts at the moment of project completion, but to anticipate use in future operational contexts. Life cycle assessment and design foresight are among several tools available for identifying future benefits and penalties. In infrastructure design, they are tools for anticipating and incorporating consideration of use over a solution’s useful life.
Figure 2: Block diagrams for specific problems representing specific procedure-based actions.
Within decision making for urban systems, rationality is found applied to different ends. For instance, technical rationality is pursued during acts of optimization. Given the demands for persistent performance at scale, decision makers responsible for the operations of urban systems are motivated to optimize wherever possible. However, an inherent “underlying variation in conceptions of the urban system that roughly correlates with variation in the discipline or field – the perspective – with which a decision-maker views the system” offers one explanation for overall sub-optimality (Ferguson, 1975, p18). Economic rationality is a different end, and is one motivated by cost effectiveness. Economic optimization is an evaluation and selection of a design feature, when two or more potential features compete with one another (Diesing, 1962, p17). Technical and economic rationality are the prevailing forms of rationality found in the shaping of urban systems, and at times to the near exclusion of others (Ferguson, 1975, p15).
4.2. Benefits and penalties of the systems approach
When making decisions about new urban systems, net benefits and penalties can be calculated and assessed systemically. By acknowledging some urban communities as under-represented and having been negatively impacted by past decision making, then separation is created between efficiency and equity. If efficiency refers to the result of summing benefits and penalties, then equity refers to the consideration that benefits and penalties need to be distributed to communities across the socio-economic spectrum (Dickerson, 1975, p6). The history of unevenly distributed impacts have prompted requirements for public information sessions as part of jurisdictional approval processes for new infrastructure proposals. While this phenomena elevates the role of social equity in co-identifying a project’s benefits, it also introduces additional costs for public engagement, including the preparation of design materials suitable for public review and their post-processing.

1043
Chris Ford and Jan Auernhammer
When taken to an extreme, there are certainly penalties for hyper-rationalization. Despite methodological gains when evaluating the problem, so far as team bias allows, the systems approach requires rational decision making through the reduction of all effectiveness and cost measures to a single measure (Dickerson, 1975, p22). This seems unhelpful and likely problematic. In so doing, valuable details and nuances of potential solutions are immediately discounted or eradicated, thereby precluding any continued consideration or influence. This singular outcome for decision making is unfortunate because it artificially reduces and compromises the very holism the systems approach seeks to ascertain. Heightened emphasis on economy and the preservation of resources during the design process can also be detrimental to longterm operations of infrastructural asset classes. In particular, planning processes are considered efficient when “labor, materials, and services as input to the process” are reduced to minimums (Dickerson, 1975, p22). As administrators of infrastructure are already challenged to accomodate increasing demand with less financial resources, recent infrastructural failures prompt a timely reconsideration of fiscal priorities for persistent infrastructural maintenance. The recent collapses of the I-35 West bridge in Minneapolis MN (2007), the Ponte Morandi in Genoa Italy (2018), and the Nanfang'ao bridge in Taiwan (2019) tragically foreground human costs when both the design of infrastructural assets is economized and responsibilities for asset maintenance is deferred.
As a design tactic however, the systems approach presents a key benefit compared to other methods. Intuition-led design may enable longer uninterrupted periods of design generation, however the systems approach requires design generation coupled by periodic vetting and approvals by non-design decision makers. By periodically testing the appropriateness of one’s design activity against the analytical scrutiny of others, such action positively informs forthcoming solutions with higher levels of fitness and improved end use.
4.3. Limits of system-centrism
A literature review of the systems approach suggests its effectiveness for decision making is proportional to the degree to which a design problem can be clearly defined. However multiple design methodologists including Horst Rittel (1982) and Peter Rowe (1987) observe all design problems to be either ill-defined or wicked. “Assuming that the problem was defined,” as Dickerson and Robertshaw observe, “only one alternative needs to be synthesized – the best one. If we truly have a planning problem, we do not know the best alternative and can only hope to approach it by comparing potentially best alternative systems” (Dickerson, 1975, p27). The systems-centric mindset often confuses solution spaces with the problem spaces from which they originate, and any implied correlation between more tightly defined problems and more ideal solutions implies a dynamic that experienced designers will find false and inconsistent with experience.
To its credit, the systems approach is well-intentioned for making decisions in a way that emphasizes objective and holistic thought. Furthermore, any condemnation of the systems approach must be coupled with the recognition of its legacy as the preferred method for many city planners. Although users of the systems approach seek to base decisions on a shared framework larger than those used by single decision-makers, a planning paradox arises from foreshortened problem analysis.

1044
System Fail: A review of the systems approach as a decision makingMethod for lifeline infrastructure systems
A lack of foresight into those future contexts in which infrastructure systems will operate signals a key vulnerability to the fidelity of this decision making method. There is no fault in being unable to predict the future. For the systems analyst however, the direction in which one analyzes is, ironically, behind them. Orienting oneself to the past allows for reflection and analysis. Design however is projective and therefore is not the result of analysis alone. The better one succeeds in being rational, “the less one can derive from that what one should do now” (Rittel, 1982, 39). For a thought model characterized as both holistic and rational to bring value to the shaping of the urban environment, then it must allow for the purview of future contexts for use. With effort, these contexts are broadly forecastable. Widening the cone of vision to include both past and future will improve the fitness of future solutions compared against those generated with the reflective and analytical functions for which the systems approach is best known.
5. ConclusionExpectations for heightening rationality during infrastructural problem-solving further complicates the already complicated problem of wicked problem solving. There are helpful conceptual and methodological advantages to first acknowledge the wicked nature of infrastructural design problems and to also proceed without expectations for authoring concise problem statements. Such acknowledgement circumvents premature convergence to either incompletely identified design problems, or misidentified ones. Whereas experienced designers are typically comfortable “dancing with ambiguity” inherently found within problem spaces, legislators are not. Planners using the systems approach for decision making fall somewhere in the middle.
5.2. Fixation on the urban system
There remains an obligation to conclude with notes regarding the systems approach for the design of future lifeline infrastructure solutions. Through systems approach literature, there is an interesting emphasis on a system as a telegraphed solution type. Ferguson observes, “In practice, we cannot expect different actors to assert compatible definitions of what is to be done with the urban system, nor even to agree on what its problems might be” (Ferguson, 1975, p18). It is possible planners and designers assert the systems approach for those instances in which decision making about an urban project is required by non-designers. It is also possible those who have historically championed the systems approach become convinced systems are an appropriate solution type for any complex design problem. Might there however be some spectrum of creative possibility made visible as soon as one ceases any expectation for future infrastructure solutions to manifest as either a system or as an extension of existing systems?
Urban dwellers have so far tolerated the systems-centric mindset in the municipal arena, as they continue to benefit from persistent urban infrastructure operations during normal conditions. However, when the environments enveloping these urban systems assert acute and chronic loads, we now witness and experience an increased number of urban system failure incidents. For the design of resilient urban infrastructure, a change in the paradigm historically used for infrastructural decision-making is necessary.
5.3. Opportunity for people-centrism
A people-centric paradigm has been utilized in other fields such as industrial design and interaction design, and may introduce similar gains when applied to the design of future urban systems. In this application, people-centered decision making requires a strategic methodological convergence to the demonstrated needs of urban dwellers and developing an ability to anticipate the active contexts responsible for people’s physical, intellectual and emotional needs (McKim 1959; Fuller 1970).

1045
Chris Ford and Jan Auernhammer
People-centrism explicitly elevates the demonstrated needs of urban dwellers as paramount to other constraints, requirements, and considerations found in the problem space, thereby overcoming some of the key limitations of the systems approach identified by Horst Rittel (1982). As a method for designing infrastructure solutions, people-centric design links the implicit (people’s needs and cultural diversity) with the explicit (systems or the physical environment). Collaborative and dialectic reasoning allows one to gain a wider perspective from multiple point of views and enables design for a pluralistic society. If applied to problems of urban systems, then the people-centric process of Design Thinking would empower decision making beyond the mere observation of system functions, and include observations of how, when, and why urban dwellers utilize infrastructure. Design Thinking also prompts a massive opportunity to prototype potential next- generation urban solutions and test their use within specific urban contexts. Feedback generated by such design action would be of value exceeding “unhuman” computation-based simulations and public polling.
Until superior lifeline design solutions authored by people-centric mindsets can be tested against the infrastructural status quo, urban dwellers remain dependent upon persistent resource unit flows conceived by system-centric mindsets for sustaining both an urban lifestyle and human life itself. The systems approach, as a decision-making method, has so far been instrumental in shaping these lifeline systems.
References Cohen, D.T., Hatchard G.W., and Wilson, S.G. (2015) “Population Trends in Incorporated Places:
2000 to 2013,” U.S. Department of Commerce, United States Census Bureau. Issued March 2015, 11.
Churchman, C.W. (1979) The Systems Approach, Second Edition. Dell Publishing, New York, ix. Dickerson, S.L. and Robertshaw, J.E. (1975) Planning and Design: The Systems Approach. DC Heath, Lexington. Diesing, P. (1962) Reason in Society. University of Illinois Press, Urbana, 17. Easterling, K. (2014) Extrastatecraft: The Power of infrastructure space. Verso, London, 81. Ferguson, F. (1975) Architecture, Cities and the Systems Approach. George Braziller Publishers, New York. Ford, C. (2019) “Processing,” Editorial. Technology | Architecture + Design (Journal), 3:1, 2-3. Fuller, R.B. (1970) Operating Manual for Spaceship Earth. Simon & Schuster, New York, 13. Handler, A.B. (1970) Systems Approach to Architecture. Elsevier, New York. Horgan, R. (2019) “Fatal Taiwan bridge collapse is latest example of maintenance failings,” New
Civil Engineer. Oct 7, 2019. Jones, J.C. (1970) Design Methods: Seeds of Human Futures. Wiley Interscience, London, 121. LaPatra, J.W. (1973) Applying the Systems Approach to Urban Development. Dowden Hutchinson & Ross, Stroudsburg. McKim, R. H. (1959) Designing for the Whole Man. In J. E. Arnold, Creative Engineering seminar, 1959. Stanford, CA: Stanford University. Meadows, D.H. (2008) Thinking in Systems: A Primer. Chelsea Green Publishing, White River Junction. Papanek, V. (2000) Design For The Real World. Second Edition. Academy Chicago Publishers, Chicago, 40. Penn, I. and Eavis P. (2020) “PG&E Pleads Guilty to 84 Counts of Manslaughter in Camp Fire
Case.” The New York Times. Updated June 18, 2020. Rainer, G. (1990) Understanding Infrastructure: A Guide for Architects and Planners. John Wiley &
Sons, New York, p.xxiii. Rittel, Horst. (1982) “Systems Analysis of the First and Second Generations.” In Human and Energy
Factors in Urban Planning: A Systems Approach, edited by P. Laconte, J. Gibson & A. Rapoport. Chapter 2.3. The Hague: Martinus Nijhoff Publishers.
United Nations. (2018) “68% of the world population projected to live in urban areas by 2050, says UN,” News, Department of Economic and Social Affairs. May 16, 2018.

1046
The 54th International Conference of the Architectural Science Association (ANZAScA) 2020
Te aitanga pepeke me ngā pūngāwerewere/The world of insects and spiders.
Kerry Francis Unitec Institute of Technology, Auckland, New Zealand
Abstract: “Insects are by far the most varied and abundant animals [on the planet] outweighing humanity by 17 times... They are essential for the functioning of all ecosytems... “so wrote journalist Damian Carrington in the Guardian newspaper in February of 2019. As the planet becomes increasingly urbanised the quantum and quality of habitable animal and particularly insect environment decreases. Buildings can have a role in mitigating this habitat loss by providing conditions supportive of insect life. This was the proposition put to first year MARCP students at the Unitec School of Architecture in the second semester of 2019. While the logic of making buildings supportive of other life forms seemed obvious to the staff, the proposition was greeted with considerable skepticism by the student body. The experience highlighted the issue of empathy for other forms of life as a critical factor in the pedagogy of architectural learning. This paper examines the initial phases of the project and the attempts by staff to engage the students. The complexities around the development of architectural projects that could accomodate insect life are discussed. The paper concludes by suggesting principles and strategies for further development of an empathetic architectural pedagogy.
Keywords: Design; studio; insects; empathy.
1. Introduction“What is the point of including space/potential/possibility for insects in buildings?” Whenever I broach the subject of non-anthropocentric architecture with colleagues (and lay people) this is the inevitable question. It is often followed by ” but what about cockroaches?” There are two words that usually figure in my response; empathy and inclusivity. Empathy involves some sort of understanding and appreciation of the essence, of the being of that other and a recognition of shared feelings. Empathy is a necessary first step to being open to accepting and including the other. The two conditions are connected. I would argue that if you feel empathetic then you are more naturally disposed to inclusivity. This paper discusses the problematic relationship between empathy and learning about architecture asd it played out in the initial phases of the project described below.
For three years I have been introducing the idea of non-anthropocentric architecture to successive groups of students in the first year MARCP Design Studio through suggested readings. This partial strategy has never achieved the kind of engagement intended. In 2019 I decided to approach the issue
Imaginable Futures: Design Thinking, and the Scientific Method. 54th International Conference of the Architectural Science Association 2020, Ali Ghaffarianhoseini, et al (eds), pp. 1046–1055. © 2020 and published by the Architectural Science Association (ANZAScA).

1047
Kerry Francis
directly. Spurred on by reading Donna Haraway’s Tentacular Thinking (2016) and various reports and articles like those of Damian Carrington (2019) and Matt Brown (2019), I framed a design research project for students in the first year of their MARCP called Te Aitanga Pepeke me ngā Pūngāwerewere /The World of Insects and Spiders. The project was deliberately titled with the animals in the centre of the frame. The title was shared with Māori to include their world view, Te Ao Māori, alongside that of a western scientific rationalist view that identifies the destruction of insect life as a powerful vector of human extinction.
This paper discusses only the first portion (three weeks) of that project. The architectural design issues and resources are identified before a description of design tasks from those first three weeks. The paper records the stuttering attempts to generate an empathetic understanding of insect life. It identifies issues that complicated the intentions of the project before discussing insights and modes of preparation that could potentially have enriched student engagement and produced more informed works of architecture.
2. Architectural issuesThere were two obvious ways in which the insect focus could be addressed in this design research project.
2.1. Kaitiakitanga
First: We must consider them, alongside ourselves, as a critical part of the primary client group. They are the lives that we must treasure. They are the lives over which we must exercise kaitiakitanga/guardianship. However, if we are to make a work of architecture, we need to derive a programme, select materials and construction methods and locate the project. We will have to produce a coherent work that at every level supports Te Aitanga Pepeke me ngā Pungawerewere /The World of Insects and Spiders.
2.2. Form and performance Second: The insects provide examples of ways of being and doing things that may be useful to us and that may subsequently inform the making of the project. The challenge for the project is tease out all the possibilities that the insect/ spider focus provides. Some of these possibilities reside in form (segmentation, hard shell/expansion, support /jointing, texture), performance (breathing, sensing, reproduction, metamorphosis), inhabitation (spatial, acoustic, resource provision) and culture (myth, legend, narrative). The acts of drawing that we encouraged as a method of research exploration were intended to form a kind of bridge between research for design and the active engagement in design exploration.
3. Resources
3.1. People
The project was co-taught by three Architects, staff members of the Unitec School of Architecture, Magdalena Garbarczyk, Renata Jadresin-Milic and the author. Design Studio was timetabled for 3 hours, one day a week on a Monday. In addition to the direct staffing resources from the Architecture

1048
Te aitanga pepeke me ngā pūngāwerewere/The world of insects and spiders
Programme we had input from two staff members from other Unitec departments. Each department is assigned a kaihautu or learning guide by the MAIA, the Maori Development Centre. Kimoro Taiepa was able to provide the students with whakapapa (genealogy) of the various insects. His presentation was made within the Unitec wharenui, Ngākau Māhaki, so embedding it in the cultural context of Te Ao Maori. Department of Environmental and Animal Sciences Lecturer, Adam Parkinson, gave a presentation covering, in detail, three native species; the Puriri moth (Aenetus virescens), Nurseryweb spider (Dolomedes minor) and the Bag moth (liothula omnivora). For each insect he described with images their biostatus, recognizable features, life stages, hunting strategies and predators. This identification of categories was a template for the assembling of knowledge about the other species of interest to individual students.
3.2. Drawings
The students were provided with scanned copies of two collections of powerful line drawings. The classic Auckland Museum Handbook Native Animals of New Zealand by AWB Powell (1998) contains line drawings and descriptions of large numbers of insects, moths, butterflies and spiders. Bulletin 8 of the New Zealand Entomylogical Society (1982): “Drawings of New Zealand insects.” showcases the work of Desmond Helmore, an illustrator and painter, who produced exquisite line drawings for this publication. Helmore’s extraordinary attention to detail in the illustrations of 23 insects, as well as providing a record of the insects, was set as a resource to inspire an interest in the craft of drawing.
4. ProcessDrawing from this plethora of material from Te Ao Māori, science and art practice, the students were initially asked to select one insect and redraw that insect using the architectural conventions of plan and section. This conventional drawing method was deliberately chosen to underline structural, spatial and surface issues and to bring the student attention to the physical organisation of the insect.

1049
Kerry Francis
Figure 1: Joseph Banks (holding a piece of tapa cloth) bartering with a Māori for a crayfish. Watercolour and pencil by Tupaia. 1769 (Source: British Library Reference: Add MS15508 f1.2 Public Domain)
4.1. Exchange
The act of exchange was chosen as a deliberate strategy to engage the students with a human-insect relationship. The students were asked to envisage and draw an exchange between human and insect based on an existing image of colonial exchange between an unidentified Māori and Joseph Banks. This image drawn by Tupaia, the priest navigator from Ra’iatea who had joined Cook’s first voyage in 1769, shows Banks offering the Māori a piece of cloth or possibly tapa in exchange for a crayfish. This drawing task was the first time that the students had to confront the issues of some sort of communication between the species and conscious co-location of those two species. The pedagogical intention was to move the students through a two stage process. The first step was thinking about and drawing about the process of exchange. A series of fertile questions were offered as a means of exploring how this exchange might take place.

1050
Te aitanga pepeke me ngā pūngāwerewere/The world of insects and spiders
What is being exchanged (offered by each party) that would positively support the relationship? How does what is being exchanged positively support the relationship?
How would the bodies of the participants be arranged? [ individually and in relationship to one another]
What is the scale relationship between the parties? [This is a speculative image. You are imagineering what the relationship could be. You should not be constrained by the true sizes of the parties]
What would the physical/architectural context be? Would there be furniture? [What would be the setting that would make both parties most comfortable] What could the physical environment be where both parties are equal?
What gender would represent the species?
How would the individuals be clothed (or would they)?
What other issues/characteristics would be evident/relevant in supporting the intent of the image?
How does this relationship positively contribute to the habitat of each species?
What would a single human look like if it were to represent the whole human species?
What would an insect look like if it were to represent the whole insect/spider world?
Your image should represent the intent of both parties to establish a positive, mutually beneficial relationship. (Author, Project Outline, 2019)
The author assumed an ideal of equal exchange where the participants would be of equal physical size. This expectation was embedded in the third question set. The scale of the participants was something the students struggled with. They found it difficult to imagine, therefore to draw, insects that were the same size as a human. What seemed like a useful suggestion to simplify the task became immediately complicated by scale even before objects of exchange could be considered. These drawings were presented, discussed in terms of the fertile questions in an attempt to establish a basis for the next stage. This idea of introducing them as fertile questions came from the Te Puna Mātauranga/National Library of New Zealand website when I was looking for the image. The framing of the questions as fertile elevated the status of those questions and offered more discursive possibilities.
However, these possibilities did not translate into design outcomes. The next stage stuttered. Our task originally asked for the students to make a drawing of a co-working space; humans and insects working together. After considerable staff discussion we withdrew that task and instead asked for a space which they [human plus selected insect] co-inhabited. That original co-working drawing required consideration of programme which we realised complicated the task.
Only a small number of the cohort attempted making this drawing. We asked again, this time with an expanded and a much more prescriptive description of the task that asked for a drawing of only one space.

1051
Kerry Francis
Work individually.
Make a NEW drawing
Make one image of one co-living space that will support both human and insect.
The image shall be a Cross Section through the space.
This image should describe an architecture that privileges the spatial and environmental needs of your selected insect (species). [Think of your insect(s) as your primary client]
Go back and do further detailed research on your selected insect habitat and spatial requirements.
The boundary of the space should work for both insect and human and acknowledge the environmental context and the connection of the space to its context.
To achieve this connection, you need to provide detailed thresholds that allow human(s) and insect(s) to enter and leave the space... to transition from outside to inside and...from inside to outside.
Additionally, you need to provide space for a human to stand, sit and lie down... to observe and be with this insect world.
The image should include information about the architecture and atmosphere generated by that architecture. It should also include figure(s) from both human and your one selected insect species involved in a beneficial mutually supportive co-living relationship.
This image may be digital or analogue. (2019)
The intention was that the students used the human-sized insect as the model for this task and that following this task, the true scale of the insect could be re- instated for the next design stage. Again the issue of scale appeared to have been a confounding factor. As I mentioned earlier, this was envisaged as a two-stage process. First a magnifying glass design workshop operation and then, following this big view, the students would return to true scale to actually design. The underlying strategy was to anthropomorphise the insect to try and generate empathy. It may, however, have been a counter- productive strategy for a couple of reasons. First, the up-scaled/magnified insect may have generated confusion and disconnection rather than empathy. Insects, after all, are never the same size as us. Secondly, the reasons for these scale change processes may not have been clearly communicated. I hindsight, the task was too much of a leap and needed the staged assembly of a number of items and that these processes should have taken much more time and been more carefully planned.
In retrospect, we missed an opportunity to more richly utilise the Tupaia drawing. It was only recently while watching an episode of Anne Salmon’s TV series Artefacts on Māori Television that I realised the depth of cultural processes embedded in the Tupaia drawing. As described in the programme, the offer and presentation of gifts in Te Ao Māori involves not only the transfer of the artifact but also the gift is accompanied by the hau or essence of that person and the gift carries with it obligations. The process is spiritual as well as transactional and it is reciprocal. The giver and the receiver are joined together at a number of levels through this process that involves mutual recognition of the status of the other. If we had been able to more expansively, more richly engage with the cultural

1052
Te aitanga pepeke me ngā pūngāwerewere/The world of insects and spiders
nuances of this process and discuss with the students the embedded values then the outcome of the task may have been different and reflected a deeper understanding. The critical point here is that I, as Pakeha New Zealander, did not have enough insight to recognize the richness of the Māori cultural process and were consequently unable to take advantage of its potential as a model to effect a change in attitude, a change in perception.
4.2. First design response
This was initial phase of the project three weeks leading up to the mid semester break. This period culminated in a formal presentation on the last Thursday of the quarter that we described as a first design response forum. The presentation requirements were as follows:
Rework the image that you produced for Design Studio yesterday (Rāhina/Monday) to acknowledge the learning from yesterday.
Write the specific aim/specific strategy of the image along the bottom of the image.
[The text must be able to be read from 3 meters away. Maximum 20 words]
Make a new image of the most significant insect threshold. This image needs to recognize the physiology (insectometrics) and the habitat requirements of your specific insect. You should also consider the scale required to communicate this information.
Provide a curated selection of all work to date that records and explains the development of your design to date. [This material to sit below the three items listed above so that the progression through this material to them is evident] (2019)
The students presented in groups of three, each having two minutes to present their individual project and then staff were able to review all three together. The students were also encouraged and given space to give each other critique during this process. This review format allowed for common threads of response without the same critique having to be repeated three times.
5. Student receptionThe project had experienced difficulty in reception from the students and one mature student took the responsibility of organizing an informal survey of student attitudes to the project. There appeared to be two main threads to the student difficulties with the project.
The first was organizational. The experimental nature of the project may well have generated a perception of lack of organization. The staff group were feeling their way through the project and there were certainly changes in direction and clarifications of task that arose from student feedback and professional reflection. There were certainly organization matters that could have been better communicated.
The second thread was about the validity and usefulness of making buildings that would treat insects as equals and the relevance of this position in the education of a professional architect. This was more fundamental. We believed that the project intention was clear and was clearly recorded in the project aim:

1053
Kerry Francis
Develop an architectural proposition for Tamaki Makaurau/Auckland that puts kaitiakitanga/guardianship/care for insects and spiders at its core and brings this care to wider public attention. (2019)
However, the student perception did not seem to be one of recognition and inclusion of the insect as an equal. While they appreciated and understood the role and necessity for insect life as part of the natural world, they did not see the need to include them or provide for them in a work of architecture. They appeared to maintain a position of separation and superiority above the life forms of insects in a similar way that white races believed at the end of the 19th century (and many still do) that they were the pinnacle of the human species. Timothy Morton (2017) describes this attitude as speciesism and relates it to racism.
The basis of speciesism—distinguishing dramatically between humans and non-humans— is racism. Racism is exactly defined as an attempt to delete the uncanny spectrality of being human, relegating it to a sort of invisible mass grave where abject beings (objects of anti-Semitism, zombies, androids) have been thrown, in order to set up the racist (and “ableist”) concept of the “healthy human being.”(Morton 2017)
This is a more difficult response to contend with and it is not an attitude restricted to architecture students. [I refer you to the remarks reported at the beginning of this paper.] We, the author and colleagues, had been reading and thinking about these issues for some years and, as I mentioned earlier, introducing questions of non-anthropocentric design to previous year groups. In this project there was a breakdown of trust. The students did not believe that the issue was important to their process of learning about architecture and this trust was further undermined by an impression that we did not know what we were doing.
Timothy Morton (2017) has spoken and written about this issue of generating engagement with pressing concerns in a way that provides some opportunities. Morton refers to this idea of the symbiotic real, his term for our web of connectedness to everything in opposition to the binary structuring of subject/object, man/ environment, nature/culture and so on…If we are to avoid the catastrophe of extinction then he maintains we must:
… start with a kind of terminological liberation from the fixation on “species” and the“human”—a liberation that reveals our fundamental entanglement with the non- human. (Morton 2017)
Morton’s “terminological liberation” offers some direction for a renewed understanding of the relationship between inhabitants of the symbiotic real. The question then remains; how do you structure an engagement with pressing ecological issues that does not involve what he himself calls “ecological religionism.” How do you introduce material that is a fundamental way of re-thinking relationships but is not immediately obvious as architectural? Morton in an interview with Christian Holler in 2017 perhaps suggests a way. Holler asks Morton;
…In what ways do these art forms provide particular test cases for overcoming the traditional subject-object divide and thus exemplify our entanglements with non-human entities?... Morton: Art holds open the possibility that the future can be different. Who knows what the meaning of this poem really is? It's just out of reach... When you appreciate art, you are having some kind of mind-meld (like Mr. Spock) with a being that probably isn't alive, let alone conscious. So, the basic flavor of the art experience is
1054
Te aitanga pepeke me ngā pūngāwerewere/The world of insects and spiders
solidarity with non-humans. And because of the intrinsic futurality, this solidarity is unconditional. (Morton 2017)
Again, here is a potential method, a potential model suggested for achieving some sort of recognition of the other. In this case it is the method that is critical to understand and implement. But how do you produce an experience of “mind meld” and secondly how do you alert the student to the fact that this experience has taken place? In many ways this method is intrinsically interwoven with the redrawing of the Tupaia image and is another dimension of the same experience. If the process of making the drawing with new characters can engage the maker, then ideally the experience of viewing the image can produce the mind meld. There is much work to be done around this method.
6. ConclusionThis paper has presented the difficult part of Design Studio project that attempted to introduce a non- anthropocentric design view to the student cohort. It describes and discusses only a small portion of that project titled Te Aitanga Pepeke me ngā Pungawerewere /The World of Insects and Spiders. But it was a critical portion and, as we experienced and observed, the rest of the project was compromised by the lack of a rich student engagement with those preparatory tasks. Reflection, in the process of developing this paper, has identified understandings that may be useful for further development in projects like this. The Tupaia drawing as a model has been discussed as a potential window into another way of being that involves acknowledgement of the lives and status of other species. The staff group failed to take full advantage of the discursive and hence design potential of this model because we did not recognize the complexities inherent in that image and the value of what we had. Critically, we did not seek help that was close at hand with our kaihautu. Future projects can learn from a more thorough interrogation of such a critical image. The art experience described above by Morton as noted becomes an intrinsic part of the discussion and remaking of this image.
Perhaps the most significant oversight involved empathy. All the while we were trying to generate empathy towards insects in the student, we as staff, failed to be productively empathetic in our response to the students. We must learn to do this better to improve the work of students and to produce a richer and more inclusive architecture.
Acknowledgements Thank you to the students who persevered with the project, my colleagues who worked directly on the project and importantly the other members of our staff who supported the idea.
References Brown, M (2019) Disappearing insects cause for concern, Available from Stuff, January 2019
<https://www.stuff.co.nz/environment/109865556/disappearing-insects-cause-for-concern(accessed 16 August 2020)
Carrington, D. (2019) Plummeting Insect Numbers Threaten Collapse of Nature, Available from Guardian, February 2019 < https://www.theguardian.com/environment/2019/feb/10/plummeting-insect-numbers-threaten- collapse-of-nature (accessed 16 August 2020)
Haraway, D. (2016) Tentacular Thinking: Anthropocene, Capitalocene and Chthulucene. Available from e-Flux Journal #75 September 2016 < https://www.e-flux.com/journal/75/67125/tentacular-thinking-anthropocene- capitalocene-chthulucene/ (accessed 16 August 2020)

1055
Kerry Francis
Helmore, D (1982) Drawings of New Zealand Insects, Bulletin of the Entomological Society of New Zealand No. 8, 1982
Morton, T. (2017) Dark Ecology, Interview with Christian Holler <https://www.springerin.at/en/2017/4/finstere- okologie/ (accessed 16 August 2020)
Powell, AWB, (1998) Native Animals of New Zealand, Auckland Museum/David Bateman, Auckland, New Zealand.

1056
The 54th International Conference of the Architectural Science Association (ANZAScA) 2020
The Collaborative Algorithmic Design Notebook
Renata Castelo-Branco1, Inês Caetano2, Inês Pereira3, and António Leitão4 1, 2, 3, 4 INESC-ID, Instituto Superior Técnico, University of Lisbon, Portugal
{renata.castelo.branco1, ines.caetano2, ines.pereira3, antonio.menezes.leitao4}@tecnico.ulisboa.pt
Abstract: Design studios are increasingly interested in collaborative Algorithmic Design (AD) practices. However, AD uses algorithmic descriptions that are often difficult to understand and change, hindering the adoption of AD in collaborative design. We propose improving collaborative AD by adopting a programming environment that allows for (1) developing designs incrementally, (2) documenting the history of the design with visual artifacts, (3) providing immediate feedback during the development process, and (4) facilitating the comprehension of collaborative AD projects. Given that computational notebooks are currently being explored in scientific research to solve similar problems, in this paper, we adapt the notebook workflow to support collaborative AD processes, outlining three main collaboration strategies. We evaluate currently existing notebook environments regarding each of the strategies and the impact they have on the development of AD projects.
Keywords: Collaborative design; algorithmic design; computational notebook.
1. IntroductionThe increasing complexity of current architectural design projects motivates the need for design teams to integrate different experts, creating more collaborative design environments (Laing, 2019). This allows the design process to benefit from more diverse knowledge and different problem-solving perspectives, leading to an increase in the quality of the solutions (Self, 2019). The collaborative scenario, however, requires design representations that are understandable by all participants.
Architects use sketches, drawings, models, diagrams, mock-ups, etc., to represent and communicate their ideas (Bresciani, 2019; Buxton, 2007). However, the introduction of Algorithmic Design (AD), which is based on algorithmic representations of the designs (Caetano et al. 2020), creates a problem, as algorithms tend to be both difficult to understand and develop by designers (Woodbury, 2010). This hinders the adoption of AD techniques within collaborative design environments, as the communication of ideas between team elements is a hard and far-from intuitive task. To address this, we need to bring AD closer to the architectural design needs and to the visual nature of the profession, making it suitable for collaborative design processes.
We believe improving AD representation methods requires a programming environment that not only allows for visually documenting the developed designs but also supports the incremental development of AD programs in an integrated storytelling experience that is critical for collaborative
Imaginable Futures: Design Thinking, and the Scientific Method. 54th International Conference of the Architectural Science Association 2020, Ali Ghaffarianhoseini, et al (eds), pp. 1056–1065. © 2020 and published by the Architectural Science Association (ANZAScA).

1057
Renata Castelo-Branco, Inês Caetano, Inês Pereira, and António Leitão
design. The notebook philosophy (Rule et al. 2018), which is used in different scientific fields, addresses some of these issues, allowing users to intertwine text, formulas, data, code, and graphics in the same document, telling the story of an experiment and, thus, supporting its reproducibility, while improving its understandability and sharing among multiple participants.
2. Algorithmic designAD is a design approach that relies on algorithms to create designs, making it possible to automate tedious and time-consuming tasks and generate more complex design solutions. By using algorithms, designers can parametrically describe designs, which means changes are automatically propagated, avoiding design errors as well as reducing the time needed to explore different solutions (Burry, 2011). AD increases architects’ creativity and productivity (Terzidis, 2003) but requires programming knowledge and abstract thinking capabilities (Woodbury, 2010).
A recent study (Gardner, 2018) revealed that many practitioners find a barrier of technical complexity in AD and some still view it as a non-humane way to design and as an obstacle to creativity. The issue might be explained, in part, by the fact that conventional programming languages are difficult to learn and use, particularly so for non-expert programmers, which constitutes the great majority of the architectural community. Additionally, AD programs frequently turn up to be the unstructured product of successive copy&paste of program elements, which result from the experimentation process that characterizes design thinking (Woodbury, 2010). Hence, programming architects find it difficult to understand AD programs that represent complex designs, particularly those developed by others.
To improve program understanding, Donald Knuth proposed Literate Programming (1984) as a way to conceive comprehensible computer programs. Literate Programming is based on the idea that a program should be developed as a literary work, written to be read by humans and, thus, documenting not only the implementation details but, more importantly, the rationale behind it. Unfortunately, the idea is not directly applicable to architecture as most documentation strategies only provide textual explanations and architecture prefers visual ones, such as sketches and schematics.
3. The computational notebookAn interesting take on this topic has been forwarded by the computational notebook philosophy (Rule et al. 2018), starting with Mathcad and Wolfram’s Mathematica, and following up to more recent tools like the Jupyter notebook. These tools allow for incremental development with immediate feedback on the program’s results, as well as the intertwining of code, textual and visual documentation, namely mathematical formulas, plots, and rich media, generated by the program itself or loaded from external sources. Notebooks were designed to support computational narratives, allowing users to execute, document, and communicate their experiments, which appeals to a vast audience particularly in the academic and scientific fields.
In the case of AD, computational notebooks show great potential to aid the development of design projects, since architects can have their sketches and explanatory texts within the same environment where the algorithmic description is being created. Furthermore, the notebook philosophy fosters incremental development, which in itself motivates a more responsive and comprehensible coding activity. Finally, it allows users to make their work reproducible and, along with improved program comprehension, it has the potential to streamline collaborative development of AD projects.
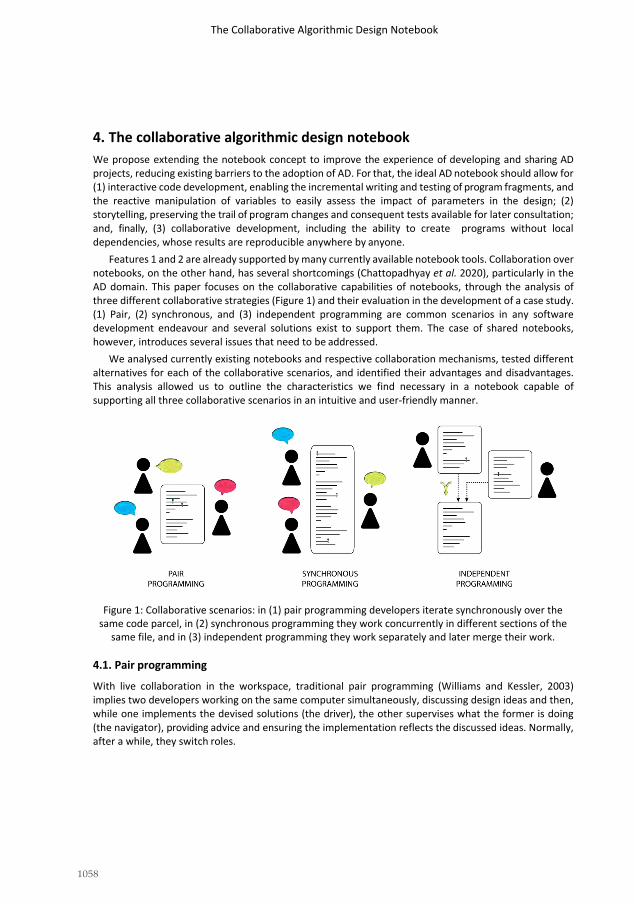
1058
The Collaborative Algorithmic Design Notebook
4. The collaborative algorithmic design notebookWe propose extending the notebook concept to improve the experience of developing and sharing AD projects, reducing existing barriers to the adoption of AD. For that, the ideal AD notebook should allow for (1) interactive code development, enabling the incremental writing and testing of program fragments, and the reactive manipulation of variables to easily assess the impact of parameters in the design; (2)storytelling, preserving the trail of program changes and consequent tests available for later consultation; and, finally, (3) collaborative development, including the ability to create programs without localdependencies, whose results are reproducible anywhere by anyone.
Features 1 and 2 are already supported by many currently available notebook tools. Collaboration over notebooks, on the other hand, has several shortcomings (Chattopadhyay et al. 2020), particularly in the AD domain. This paper focuses on the collaborative capabilities of notebooks, through the analysis of three different collaborative strategies (Figure 1) and their evaluation in the development of a case study. (1) Pair, (2) synchronous, and (3) independent programming are common scenarios in any softwaredevelopment endeavour and several solutions exist to support them. The case of shared notebooks,however, introduces several issues that need to be addressed.
We analysed currently existing notebooks and respective collaboration mechanisms, tested different alternatives for each of the collaborative scenarios, and identified their advantages and disadvantages. This analysis allowed us to outline the characteristics we find necessary in a notebook capable of supporting all three collaborative scenarios in an intuitive and user-friendly manner.
Figure 1: Collaborative scenarios: in (1) pair programming developers iterate synchronously over the same code parcel, in (2) synchronous programming they work concurrently in different sections of the
same file, and in (3) independent programming they work separately and later merge their work.
4.1. Pair programming
With live collaboration in the workspace, traditional pair programming (Williams and Kessler, 2003) implies two developers working on the same computer simultaneously, discussing design ideas and then, while one implements the devised solutions (the driver), the other supervises what the former is doing (the navigator), providing advice and ensuring the implementation reflects the discussed ideas. Normally, after a while, they switch roles.

1059
Renata Castelo-Branco, Inês Caetano, Inês Pereira, and António Leitão
Remote collaboration, on the other hand, allows for other possibilities, namely distributed pair programming (Stotts et al. 2003; Baheti et al. 2003), which involves more than two developers collaborating remotely. There are two main strategies for this workflow: (1) terminal sharing and (2) screen sharing, with or without screen annotation capabilities. The first one allows colleagues to work on the same code base simultaneously, tracking each other in the document. In the second strategy, users do not share a terminal, but rather one of them simply shares his view of the code with others. This modality is frequently called the token system, wherein only one person can edit a file at a time. This eliminates some of the editing confusion that may arise with more than two participants. For remote collaboration, however, it may also be hard to express programming ideas without specifically pointing at code pieces or even demonstrating the idea textually.
The pair programming workflow is most beneficial for difficult developments where the expertise of several co-workers is required. Having several participants working on the same task usually ensures a better outcome, not only guaranteeing continuous code review, but also motivating a more focused mind-set. However, it is also a waste of resources; ergo, other collaborative workflows are required.
4.2. Synchronous programming
Synchronous programming implies having several developers simultaneously and concurrently working on the same program file, in this case a notebook. In synchronous programming, users are not only aware of each other, but also sharing the same programming environment in real-time and the same program state, meaning any changes made by one of the developers will automatically impact the program for all developers in session. This workflow is the coding equivalent to the shared document development popularized by GoogleDocs. Synchronous programming is most useful when time runs short, allowing multiple developers to edit different notebook sections simultaneously. However, it requires a more strategic work coordination (Wang et al. 2019) to avoid repeated work. To make the workflow more productive, co-workers should speak to each other during the shared session.
Guaranteeing reproducibility and consistency among different participants requires running the program on the server of the company providing the sharing service, to guarantee all users have access to the exact same program state. However, there are frequent limitations to what users can add or install on companies’ servers, for both space and safety reasons. On account of communication delays, performance is also typically worse than on a local system. The first two problems are often resolved with more expensive versions of the collaborative software, but not the latter.
4.3. Independent programming
In this workflow, co-workers separately develop, in their own time, different program files or different sections of the same file and combine them from time to time. This technique is often used in large software development endeavours, where projects can be divided in several parts to be distributed among developers. Merging, however, can be challenging, hence, requiring elaborate version control systems capable of comparing different versions of the same file and settling out any conflicts that may arise. This provides a more productive workflow, since users can work simultaneously on the same file.
5. Related workThis section presents an overview of currently available notebook platforms and their native collaboration mechanisms, as well as available version control and collaboration alternatives to

1060
The Collaborative Algorithmic Design Notebook
complement them. We analysed seven different computational notebook platforms, namely Wolfram’s Mathematica, Jupyter Notebook, NextJournal, Deepnote, CoCalc, Pluto, and MathCAD, to identify the options that are most suitable for a collaborative AD practice.
5.1. Computational notebook platforms
Most notebooks are based on input cells that, once run, produce immediate output. Only MathCAD uses a different approach, recreating the traditional math checkered notebook. Moreover, users do not need to know programming to use it. Both MathCAD and Pluto promote reactivity, meaning that when one expression is changed, the dependent expressions are automatically updated. With the exception of these two, all notebooks support multiple programming languages, particularly interactive ones that promote incremental development, such as Python, Julia, and R. Only Mathematica and Jupyter allow users to mix languages in the same notebook, and Jupyter even allows users to install new languages.
Regarding collaborative work, MathCAD does not support version control nor real-time collaboration, but the notebooks produced look like pages from a manual, which facilitates the comprehension of the project across the different collaborators. Jupyter and Pluto also do not allow different users to develop code simultaneously, but an approximation to collaborative work can be achieved by using the supported applications for version control and code sharing, such as GitHub or Binder. Mathematica Online allows users to add collaborators and work in real time, as well as save the version history of the notebook. Nextjournal, Deepnote, and CoCalc, are all cloud-based and natively prepared for real-time collaborative work. The three of them support versioning, with Nextjournal and CoCalc doing so automatically. Deepnote offers code review options and allows users to directly connect with other collaborative tools, such as GitHub and GitLab. CoCalc allows users to track each other and access the history of the project per collaborator and has a built-in text and audio chat, allowing for more diverse strategies of collaborative work, such as pair programming.
5.2. Collaboration mechanisms
Regarding screen sharing, plenty of communication tools will do the job (e.g., Skype, Teams, or Facebook’s Messenger). Nevertheless, with this workflow, it frequently becomes hard to vocally express programming intentions when making suggestions. This can be addressed with more elaborate communication platforms that turn the screen into an interactive whiteboard (e.g., Zoom or TeamViewer), or that support a terminal sharing workflow (e.g., USE Together), which allows viewers to interact with the program as well, although it is running in the host’s machine entirely. The latter solution facilitates interaction, but the guests are still limited to the view of the screen shared by the host at any moment, which means it does not suffice for Synchronous Programming.
Sharing notebooks can be achieved using simple file sharing applications (e.g., Dropbox or OneDrive) but since these do not have merging capabilities, users must manually handle versioning and conflict resolution. For the task at hand, it is simpler and more efficient to use specialized services such as GitHub. However, conflict resolution in notebooks can be tricky because the underlying representation does not meet the expectations of the typical comparison tools used in those services. For this reason, specialized comparison tools have been created to handle notebook version control (e.g., NBdiff and NBdime). Nevertheless, the learning curve for these tools should also be considered.

1061
Renata Castelo-Branco, Inês Caetano, Inês Pereira, and António Leitão
6. EvaluationTo evaluate the proposed collaborative workflows, we developed a case study inspired by the Irina Viner-Usmanova Rhythmic Gymnastics Centre, in Moscow, Russia, originally designed by the CPU Pride office. An AD notebook adaptation of this project was developed in five working days by three architects. Figure 2 presents a schematic chronogram of the collaborative development process. The project was modelled using the Julia programming language and Khepri (Sammer et al. 2019), an AD tool that is portable between multiple design tools and that was recently extended to be integrated in the notebook format. Based on the information collected previously, we selected the tools we considered most suitable for the three collaborative scenarios - Jupyter, Nextjournal, and Pluto -, as well as two version control systems - GitHub with and without NBdime - and two communication platforms - Skype and USE Together. The following paragraphs describe the application of the three collaborative scenarios in the development of the case study.
Figure 2: Diagrammatic schedule of the case study’s development process.
Pair programming was used several times during the development process with two main tools: Skype for screen sharing and USE Together for terminal sharing. Screen sharing occurred when developers (1) felt they needed help with a code piece, (2) wanted to share ideas, or (3) had doubts about each other’s work. Terminal sharing was used for more detailed help sessions. For instance, the USE Together tool was used by more experienced programmers to remotely guide less experienced ones. The tool allowed them to exemplify things directly in the latter’s computer, which facilitated communication. However, this has some disadvantages, namely the performance penalty and the

1062
The Collaborative Algorithmic Design Notebook
confusions resulting from the occasional simultaneous inputs provided by two different users. Figure 3 shows a screenshot of this workflow.
For synchronous programming we used Nextjournal, which avoided the need for merges, as the developers were concurrently working on the same file in the server. However, since no two cells can run simultaneously, we could only push one execution onto the server at a time, thus having to repeatedly wait for each other’s processes to finish. Because of this, we ended up doing more pair than synchronous programming.
Independent programming occurred throughout most of the project. All three developers kept committing their changes to the various notebooks in use in the same GitHub project. Using this platform, there were no restrictions to simultaneous file use, which led to several conflicts when using the Jupyter notebook. Even when users were developing separate areas of the notebook, usual text- based version control tools (e.g., Git) could not sort out the merge, which had, thus, to be settled using NBdime. Figure 4 shows the NBdime diff tool in use for the Jupyter notebook. We also tested the independent development workflow using Pluto. Since this notebook’s underlying file representation is human-readable, merges are a lot easier and can frequently be automatically handled by GitHub. Figure 5 presents a successful merge of two committed versions of the Pluto notebook by developers 1 and 2.
The Pluto notebook, however, forced a rather different workflow to notebook development from the one we had been employing, for instance, in Jupyter. Due to Pluto’s reactive evaluation strategy, it was not possible to keep the program’s evolution history since repeated definitions are not allowed. In the end, we decided to maintain two concurrent versions of the notebook: one in Jupyter, where we kept the development history, and a summarized version in Pluto. The final product of this collaborative notebook sprint can be found at https://github.com/KhepriNotebook/GymnasticsPavilion_Moscow.
Figure 3: Developers 2 and 3 working on the Jupyter notebook with USE Together.

1063
Renata Castelo-Branco, Inês Caetano, Inês Pereira, and António Leitão
Figure 4: The NBdime tool comparing conflicting versions of the Jupyter notebook via GitHub.
Figure 5: GitHub desktop application autonomously merging two independent versions of the Pluto notebook file submitted by developers 1 and 2.

1064
The Collaborative Algorithmic Design Notebook
7. ConclusionArchitecture and, by extension, Algorithmic Design (AD), requires the elaboration of design hypotheses, their evaluation, and their optimization to achieve designs with good performance. However, the design process is strongly based on visual and spatial reasoning, which is not always easy to translate onto computational descriptions. Consequently, AD programs are generally hard to develop and understand. These problems are aggravated in collaborative design, where multiple participants need to be involved in the development of an AD program and need to understand each other’s work.
To address these problems we improved the understandability of algorithmic descriptions by adapting computational notebooks for AD development, allowing architects to collaboratively intertwine text, formulas, data, code, and graphics in a way that not only preserves the story of a design but also supports the reproducibility of the AD process.
7.1. Ideal notebook features
Given the different advantages and limitations of existing computational notebooks, we do not endorse any specific one, formulating instead three principles we believe an ideal notebook should include.
Interactive code development motivates users to immediately test program fragments, visualizing the corresponding result. These tests also serve as documentation for users who wish to verify if the program is yielding the proper results. All the notebooks used in the case study – NextJournal, Jupyter, and Pluto – possess this feature, although they deal with state and interactiveness in different ways. While the former two offer users complete freedom over the evaluation order of the cells, the latter restricts it for the sake of reactivity. The latter approach prevents the accumulation of bugs that arise in less restrained workflows: by automatically propagating the changes along the program, users are immediately informed about the result and errors that might have been introduced.
Storytelling preserves the development history, which includes program changes and tests, presenting it in a comprehensible way to help future developers understand and maintain the AD program. In this regard, while Jupyter and NextJournal allow users to more loosely define and redefine program structures, Pluto always imposes program consistency, not allowing outdated code fragments in the middle of the notebook. While the former two allow for telling the design development story by keeping the different stages of the program in the notebook itself, the latter requires the use of version control mechanisms. However, absolute freedom frequently motivates chaos that, in this case, results in inconsistent program state. Hereupon, Pluto leads to more organized and coherent programs that are easier to comprehend by third parties. We believe an ideal notebook should join the best of both: allowing for keeping the development history and, if desired, hiding it away for final presentation.
Collaborative development requires the ability to coordinate multiple developers. Although none of the used notebooks proved to suit the three outlined collaboration scenarios, we could achieve them by using different combinations of existing tools. We conclude an ideal environment for collaborative AD should provide efficient mechanisms for pair, synchronous, and independent programming.
7.2. Future work
As future work, we plan on researching outlining techniques capable of hiding intermediate program developments or program extraction techniques that can retrieve a summarized version of an AD

1065
Renata Castelo-Branco, Inês Caetano, Inês Pereira, and António Leitão
notebook containing the final program only. Refactoring techniques may also help improve the typical scruffy nature of incrementally developed AD notebooks for explanation purposes.
We also plan to address education scenarios, an area where computational notebooks have been showing promising results. One of the main setbacks for the applicability of AD approaches in architectural projects lies in the difficulty of learning to represent designs in the form of algorithms. Using notebooks as learning environments, along with the proposed collaboration strategies, can help overcome this barrier, particularly when it comes to remote teaching.
Acknowledgements This work was supported by national funds through FCT, Fundação para a Ciência e a Tecnologia, under project references UIDB/50021/2020 and PTDC/ART-DAQ/31061/2017, and by the PhD grant under contract of FCT with reference SFRH/BD/128628/2017.
References Baheti, P., Gehringer, E. and Stotts, D. (2002) Exploring the Efficacy of Distributed Pair Programming, in Wells, D. and
Williams, L. (ed.), Extreme Programming and Agile Methods - XP/Agile Universe 2002, Springer Berlin Heidelberg, 208–220.
Bresciani, S. (2019) Visual Design Thinking: A Collaborative Dimensions framework to profile visualisations, Design Studies, 63, Elsevier Ltd., 92–124.
Burry, M. (2011). AD Primers: Scripting Cultures: Architectural Design and Programming, West Sussex, UK : John Wiley & Sons Ltd.
Buxton, B. (2007). Sketching User Experience: Getting the Design Right and the Right Design, Morgan Kaufmann. [Online]. Available at: doi:10.1016/B978-0-12-374037-3.X5043-3.
Caetano, I., Santos, L. and Leitão, A. (2020) Computational Design in Architecture: Defining Parametric, Generative, and Algorithmic Design, Frontiers of Architectural Research, 9, 287-300.
Chattopadhyay, S., Prasad, I., Henley, A., Sarma, A. and Barik, T. (2020) What’s Wrong with Computational Notebooks? Pain Points, Needs, and Design Opportunities, in Proceedings of the 2020 CHI Conference on Human Factors in Computing Systems, ACM, New York, USA, 1–12.
Gardner, N. (2018) Architecture-Human-Machine (re)configurations Examining computational design in practice, in Computing for a better tomorrow - Proceedings of the 36th eCAADe Conference, Lodz, Poland, 139–148.
Knuth, D. (1984) Literate Programming, The Computer Journal, 27(2), 97–111. Laing, R. (2019) Digital Participation and Collaboration in Architectural Design, Routledge: Taylor & Francis Group. Rule, A., Tabard, A. and Hollan, J. D. (2018) Exploration and explanation in Computational notebooks, in Conference
on Human Factors in Computing Systems – Proceedings, ACM, Montreal, Canada, 1–12. Sammer, M., Leitão, A. and Caetano, I. (2019) From Visual Input to Visual Output in Textual Programming, in
Intelligent & Informed, Proceedings of the 24th International Conference of the Association for Computer-Aided Architectural Design Research in Asia (CAADRIA), 645–654.
Stotts, D. et al. (2003) Virtual Teaming: Experiments and Experiences with Distributed Pair Programming, in Maurer, F. and Wells, D. (ed.), Extreme Programming and Agile Methods - XP/Agile Universe 2003, Springer Berlin Heidelberg, 129–141.
Terzidis, K. (2003) Expressive Form: A Conceptual Approach to Computational Design, Spon Press, New York. Wang, A. Y., Mittal, A., Brooks, C. and Oney, S. (2019) How Data Scientists Use Computational Notebooks for Real-
Time Collaboration, in Proceedings of the ACM on Human-Computer Interaction, ACM, New York, NY, USA. Williams, L. and Kessler, R. (2003) Pair Programming Illuminated, Person Education, Inc. Woodbury, R. (2010). Elements of Parametric Design, New York : Routledge.

1066
The 54th International Conference of the Architectural Science Association (ANZAScA) 2020
The eco-friendliness of Bio-Structural Insulated Panels (SIPs)
Melissa Chan1 and Funmilayo Ogunjobi2 1 Victoria University, Footscray, Australia
[email protected] 2 Deakin University, Geelong, Australia
Abstract: Globally, it has been noted that construction industry uses non-regenerative materials that has significant impacts on the environment. This study is to find suitable alternative manufacturing process for structural insulated panels (SIPs). Although the conventional SIPs when compared to conventional timber framing (CTF) are eco-friendly, clean materials and energy efficiency very high. SIPs are made of two facing boards called oriental strand board (OSB) and the inner continuous insulating core of either expanded polystyrene foam (EPS) or extruded polystyrene foam (XPS) or polyurethane foam (PUR). Formaldehyde adhesive has been a common binding material for almost all furniture, building materials including OSB. EPS or XPS or PUR are non-renewable materials but by-product of fossil fuel that “present environmental impacts”. If SIPs manufacturers can consider alternative for inner core, it will increase the eco-friendly of SIPs. The research methodology is to compare the attributes of conventional SIP with biologically based structural insulated panel (Bio-SIP). Green Seal standards (criteria) is used to evaluate Bio- SIP with conventional SIPs to formulate matrix and SWOT analysis.
Keywords: Environmental impact; sustainability; conventional structural insulated panel (SIPs); biologically structural insulated panels (Bio-SIPs).
1. IntroductionThe construction industry has been facing some challenges in the transition to low carbon construction due to one-way approach to the choice of building materials and technologies. Right from the choice of raw materials, processing, manufacturing to waste disposing, all contributed to the negative environmental impact. The global concern is that the building materials globally consume 30-50% of available raw resources and produce about 40% of waste to landfill in Organisation for Economic Co- operation and Development (OECD) country. Australia, as one of the countries in OECD, produced a larger quantity of carbon-dioxide (CO2) emission and solid waste especially from the built environment (Productivity Commission 2006). The awareness created world advocating for sustainable buildings which have zero or low carbon footprint. Conventional SIP has been seen as a way to achieve the goal of energy efficiency and minimizing waste, though the material components and the manufacturing
Imaginable Futures: Design Thinking, and the Scientific Method. 54th International Conference of the Architectural Science Association 2020, Ali Ghaffarianhoseini, et al (eds), pp. 1066–1074. © 2020 and published by the Architectural Science Association (ANZAScA).

1067
Melissa Chan and Funmilayo Ogunjobi
process of conventional SIP have health risk such as rash, eye irritation, headache, allergic, skin reaction, even carcinogenic to humans and production of greenhouse gases depending on the deteriorating state of SIP. The choices of replacing conventional SIP with bio-SIP is to improve and have a building that is eco-friendly. A building that uses renewable resources (plant-based materials) which can reduces carbon footprint, locally source and recycled naturally (biodegradable) can improved the quality of life of the end users. This research is to compare conventional SIP with bio-SIP products based on literature review and manufacturers' catalogues and specification. Laboratory or chemical test nor field test is beyond the scope of this research. The figures below are diagrams of conventional SIP and bio-SIP components.
Figure 1: Typical conventional structural insulated panels (SIP) with conventional facing boards (OSB) and inner insulating core (expanded polystyrene foam EPS) or extruded polystyrene foam (XPS) or polyurethane foam (PUR)
Figure 2: Typical biologically structural insulated panels (Bio-SIP) with the alternative facing boards OSBB (oriented straw strand board) or ORHSB (oriented rice husk strand board) or OBSB (oriented bamboo strand board) and inner insulating core [greensulate (mushroom insulation board) or Bio- PUT (soy bio-based foam)]
2. Historical background of structural insulated panel (SIPs)
SIPs literally called sandwich panel has been dated back to the innovation of “beauty and simplicity in cost effective homes” (Morley 2000) by famous Architect Frank Lloyd Wright when he designed Usonian houses in 1930s and 1940s (Morley 2000, p.8). The earlier SIP lack adequate insulation materials but today's SIP has been greatly improvements with the additional strong and continuous inner core insulating material. The use of structural insulated system in Australia has been dated back to the past fifty years though popularly used for commercial construction known as “Insulated sandwich panel otherwise referred to ‘insulated concrete form’ (ICF) (Steinhardt, Manley & Miller 2013). Now, attention is being drawn to SIPs for residential buildings especially in Western Australia and in other developed countries such as United State of America (USA), United Kingdom (UK).

1068
The eco-friendliness of Bio-Structural Insulated Panels (SIPs)
SIPs constituted two layers of structural boards -oriented strand board (OSB), sandwiched with the new improved inner core of closed cell foams of either expanded polystyrene foam (EPS) or extruded polystyrene foam (XPS) or polyurethane foam (PUR) or composite honeycomb (HSC) (Morley 2000, p.21- 26). SIPs serve as one of the "energy efficient building materials for walls, roofs and floors" (Purasinghe & Dusicka 2013) and can be placed on any foundation type. The energy efficiency of SIPs has contributed to better sealing of the building against heat loss and heat gain whereby bring about durability, indoor air quality and improvement on environmental. Moreover, the fast construction method with less labour intensive and reduction of site waste gives the edge above conventional timber framing. The insulation is inculcated to the facing boards which makes the inner-core, continuous, stable, create constant and uniform thermal reduction and minimized thermal bridging (Doan Oct 2012, p.32).
3. Terminologies definedTable 1 is the definitions of the terms used in this research
Table 1: Terminologies for Bio-Structural Insulated Panels (SIPs)
Terms Definitions Regenerative material
Regenerative material is defined according to free dictionary, as material that can reconstitute or reuse again into a better form. It can be derived from living tree, plant, animal or ecosystem. Regenerative are renewable, biodegradable, compostable, ecologically friendly and there is tendency for the regenerative materials to undergo natural recycling and reduce carbon footprint.
Biodegradable material
Biodegradable material can decompose by the action of biological agents especially bacteria that bring about reduction in the volume of waste into the landfill site. It is the action that takes place when microorganisms act on a material; break the components down into carbon-dioxide (CO2) and water
Compostable materials Eco-friendly or ecological friendly
Compostable materials are the biopolymer materials that can undergo breaking down by 90% within six months through an industrial compositing process. Eco-friendly or ecological friendly can literally refer to earth- friendly, non-toxic, recyclable and biodegradable. According to 'Longman' dictionary, eco-friendly is defined "as products that are environmentally friendly that do not harm the environment when they are made or when you use them".
4. Evaluation CriteriaAs the global world is becoming aware and responsive to the large environment impacts of building materials, effort is been made to choose building materials that are eco-friendly. This can be done if the life cycle assessment is done which include production, manufacturing, distribution, maintenance and disposal of the materials. In selecting the appropriate criteria for this research, green seal criteria will be used. The key aspects of evaluation criteria of Bio-SIPs versus conventional SIPs has been based on green seal evaluation criteria to improve these products. Green seal-based evaluation criteria (steps) focus on life cycle assessment are: (1) Source of raw materials; (2) Extraction of the materials; (3)

1069
Melissa Chan and Funmilayo Ogunjobi
Manufacturing process; (4) Intended Use; and (5) Disposal/recycling. According to the green seal evaluation criteria, products should have the following attributes:
• Promotion of good indoor air quality that can reduce emissions of volatile organic compound. • Source form renewable materials such as plants that are locally available
• Require low energy consumption for production and process therefore low embodied energy and reduction in the greenhouse gas emission.
• To be recycled or are biodegradable with no risk to health. • Promote reduction of waste.
5. Assessment of SIPsSIPs are made of oriented strand board (OSB), sandwiched with the new improved inner core of closed cell foams of either EPS or XPS or PUR or composite honeycomb (HSC) (Morley 2000, p.21-26). SIPs are known for energy efficiency, waste minimisation, not labour intensive and reduction in cost of labour in comparison with timber framing construction. The materials components are assessed below based on literature reviews and manufacturers’ catalogue. No laboratory test was carried out which is beyond the scope of this research.
5.1. Oriented strand board (OSB) - Material components assessment
OSB is the combination of wood and adhesives strengthen the panel against deflection, delamination and warping. It is widely used by the manufacturers. 'There are currently no Australian regulations, standards or codes that specifically deal with OSB, but Suppliers are able to provide specifications on the OSB products they stock.
5.2. EPS, XPS and PUR - Material components assessment
EPS or XPS (inner insulating core) are so suitable to be used with OSB" (Pfundstein et al. 2008, p.34) because of the closed-cell moisture resistant structure composed of millions of tiny air- filled pockets. EPS /XPS are widely used unlike PUR which are used by few manufacturers because is expensive and the blowing agent CFC is toxic (see table 2).
5.3. Biologically based structural insulated panels (Bio-SIPs)
Bio-SIPs can be referred to as biologically structural insulated panels that are made from plant-based materials. It is a natural and organic materials that may contribute positively to the environment by reducing the carbon emission and embodied energy during production, and construction. Bio-SIP can be a better option to conventional SIP because of the availability of materials, source from renewable materials and ability to undergo natural recycling that is biodegradable. In Australia, there are a lot of residue from timbers, agricultural waste, domestic and commercial waste such as paper that can be used to make Bio-SIPs without depending on the importation of the OSB and raw materials for EPS or XPS.

1070
The eco-friendliness of Bio-Structural Insulated Panels (SIPs)
5.4. Bio-based board analysis - Material components assessment
Wheat straw, rice husk, flax, hemps, bamboo, cork, palm kernel tree, straw bale, reeds, sheep’s wool, wood chip or pellet available in Australia that can be used to manufacture engineered boards. Australia’s hardwood plantation estate has been largely planted and managed to produce pulplogs destined for the woodchip export market. There is need to divert the timber residue to produce valuable boards (Forest Industry Advisory Council, March 2015). In this research, literature reviews were used to source for renewable, biodegradable and locally available materials that can be used for the facing board and inner-core insulation.
5.5. Bio-based adhesive/binder - Material components assessment
Bio-based adhesive is an engineered bio-based binder system from a renewable material that can replace the formaldehyde-based resin of the conventional SIP. This product is non-toxic, and the process does not utilize solvent and does not produce toxic by-products. The bio-based binder can perform better than synthetic binder because it possesses the ability to bind efficiently, resistance to moisture, eliminate or reduction of volatile organic chemical (VOC) and involved renewable manufacturing processes which either minimize or eliminate non- renewable ingredients. According to Ireland et al of EcoSynthetix stated "replacing urea formaldehyde-based resins with engineered biopolymer binder will results in a 33 percent reduction in carbon footprint based on chemistry comparison. Greater sustainability of process and product, compared to formaldehyde-based resin, is expected when energy efficient processing and more effective transportation are taken into consideration".
5.6. Bio-based or biopolymer inner-core insulation-Material components assessment
Biopolymer is a new technology which has captured the attention of materialist scientists though natural polymer has been in existence before the emergence of synthetic polymer from fossil fuel in twenty century. The attention being shifted from synthetic polymer (non-renewable materials) to biopolymer or bio-based (renewable materials) are due to global warming, depletion of ozone and all other environmental issues associated with synthetic polymer. The use of biopolymer to replace EPS /XPS/PUR in SIPs can improve the eco-friendly of SIP. Biopolymer is known to have higher specific heat capacity and denser than conventional EPS. 'Biopolymer are biodegradable and compostable plastics whose components are derived entire or in part from renewable raw materials. Biopolymer can be derive from plant oils, polysaccharides (mainly cellulose and starch), sugars, wood and others synthetic material. (Meier, Metzger & Schbert 2007, p. 7).
6.0 Analysis of bio-SIPs versus convention SIPs:
A recent article on Sustainable brand focus on "trending: fossil fuel divestment enters primetime" written by Brynn W. McNally on May 8, 2015. The article was on behavioural change toward the use of fossil fuel. Even there was a projection that "greenhouse gas will grow to two hundred and eighty million tonne (280Mt) by 2050 an increase of 110% on 2005 emissions" (Property Council of Australia nd). So, there are variety of materials that are available locally that can be used to manufacture Bio-SIP

1071
Melissa Chan and Funmilayo Ogunjobi
to replace conventional SIP. The range of bio-based boards and insulations has be discussed above. This section focusses on the Bio-SIPs versus Conventional SIPs as the research look at the strength, weaknesses, opportunity and treats (SWOT) as per Australia context, the benefits and drawbacks of both products. The information is based on literature review and manufacturers’ catalogue, no laboratory test. Below are the SWOT analysis bio-SIP and evaluation of bio-SIP versus conventional SIP.
6.1. Bio-SIPs versus Conventional SIPs on Literature Review and Manufacturers’ catalogue
The comparison of conventional SIP with bio-SIP boards are based on literature reviews and manufacturers’ catalogue. The green labelling criteria is explored to compare these two products. There are about fifty green labelling programs among which are LEED, Energy star, green globe and Green seal and each group are administered by different organizations though tend to direct their effort toward different goals but in different ways. The green seal criteria were used in this research to assess material components of these products though actual chemistry or laboratory or field test are not carried out. Green seal tends to look at the environmental and /or health attributes of products.
Table 2: Different attributes between conventional SIP and Bio-SIP based on green seal labelling
Benefits Conventional SIPs Bio-SIPs
Indoor air quality (IAQ) High IAQ, low off-gassing on exposure to moisture
High IAQ, low off-gassing on exposure to moisture.
Durability and strength Structurally sound and long-life span. Structurally sound and long-life span depend on the materials components
Recycle content Low recycle content High recycle content
Renewable resources & Availability
Renewable and non-renewable materials. Not available locally, overseas raw materials.
Renewable materials. Locally available
Toxicity High or low toxic depending on the materials used by the manufacturers for fire retardant, blowing agent and adhesive.
No or low toxic depending on the materials used by the manufacturers for fire retardant, blowing agent and
adhesive. Sustainability and biodegradable
Biodegradable -NO Biodegradable – YES
Waste minimization Low to medium waste minimization (timber wastes and residues for the board)
Medium to high waste minimization (agricultural and timber wastes for the
boards & inner core insulation) Disposal and recycling Undamaged SIP can be reused but recycling
is very hard but end up in landfill Undamaged bio-SIP can be reused. Easily disposable because it is biodegradable
depend on the content of the materials. Resistant to fire, moisture and insects
Resistant to fire is low unless treated with fire retardant. Insect resistant depending on the type and resistant to moisture is high if not exposed to moisture.
Resistant to fire, moisture and insect naturally. Though some Bio-SIPs need additional retardant and moisture protection to function as or
exceed conventional SIP Energy efficiency and use
The thermal performance is high therefore energy efficiency is high.
The thermal performance is high therefore energy efficiency is high.

1072
The eco-friendliness of Bio-Structural Insulated Panels (SIPs)
6.1. Benefits and Drawbacks of Conversional SIPs versus Bio-SIP
A lot has been said about the components of Conversional SIPs and bio-SIP, the tables below summarised the benefits that can be derived and the drawbacks in the context of Australia. The table 3 summarised the eco-friendliness of conventional SIP and the need for regenerative SIP.
Figure 5: Benefits and drawbacks of conventional SIP

1073
Melissa Chan and Funmilayo Ogunjobi
Figure 6: Benefits and drawbacks of conventional Bio-SIPs

1074
The eco-friendliness of Bio-Structural Insulated Panels (SIPs)
7.0 Discussion
Based on the facts gathered about bio-SIP, it has a great potential and possess attributes which can make it suitable to replace conventional SIP. Bio-SIPs components are locally sourced and renewable materials which has no VOCs, and it is biodegradable. The structural ability and resistant to moisture need improvement to meet up or exceed the conventional SIP. Oriented bamboo strand panel board is worth exploring by seeking alternative bio-based adhesive to replace the Polymeric diphenylmethane diisocyanate (pMDI). Also, the initial cost of producing bio-SIP will be high and technical know-how may not be available too. Further research can be done to verify the laboratory or chemistry test of these materials and the energy efficiency of Bio-SIP. Also, it requires to further test the integrated of bio-SIP with other building component and suitability for Australia climate. The conventional SIP cannot be recycled though little waste are generated in the cost of production and construction, but the replacement of the inner insulation core is very important to avoid dependence on fossil fuel and increasing of greenhouse gases.
8.0 Conclusion
In this paper, Bio-SIP will reduce dependence on non-renewable, none locally available materials and reduce environmental impacts (embodied energy, pollution). Bio-SIP are biodegradable and will generate economic opportunities to the agricultural sector. The use of bio-SIP will reduce energy consumption during production and cost of maintenance. Although cost bio-SIP will be higher initially than conventional SIP, so more research needs to be done in reducing the cost of developing bio-SIP. For effective implementation of sustainability development in construction industry, the use of agricultural products and waste including timber residue can bring about reduction of energy consumption and turning of waste to valuable materials.
References Doan, VTT Oct 2012, 'Integrated design soltn of a residential SIPs', Doctor of philosophy thesis, The University of
Birmingham. Ireland, JD, Salehpour, S, Anderson, C & Richard, D nd, 'Bio-Based Binder Systems for Composite Wood:The Journey
to Engineered Biopolymers in Wood Composites', Jabeen, S, Naveed, S, Yousaf, S & Ramzan, N 2014, 'Effect of Wheat Straw Pretreatments and Glue Formulations on Particle Board Properties', Journal of the Chemical Society of Pakistan, vol. 36, no. 1, pp. 50-5.
Meier, MA, Metzger, JO & Schubert, US 2007, 'Plant oil renewable resources as green alternatives in polymer science', Chemical Society Reviews, vol. 36, no. 11, pp. 1788-802.
Morley, M 2000, Building with structural insulated panels (SIPs) : strength and energy efficiency through structural panel construction, Newtown, Conn.; [Great Britain] : Taunton Press.
Pfundstein, M, Gellert, R, Spitzner, MH & Rudolphi, A 2008, Insulating materials : principles, materials, applications, Basel : Birkhäuser
Purasinghe, R & Dusicka, P 2013, 'Use of energy efficient wood structural insulation panels in seismic regions', University of Moratuwa.
Steinhardt, DA, Manley, K & Miller, W 2013, 'Profiling the nature and context of the Australian prefabricated housing industry', Queensland University of Technology.

1075
The 54th International Conference of the Architectural Science Association (ANZAScA) 2020
The effect of COVID-19 on household energy demand
Robert H. Crawford The University of Melbourne, Parkville, Australia
Abstract: The emergence and global spread of the Severe Acute Respiratory Syndrome Coronavirus 2 (SARS-CoV-2) at the beginning of 2020 changed the way we live our lives, including how and where we undertook our everyday activities. Strict lockdown rules, put in place to limit the spread of the virus, saw activity centres, workplaces and schools deserted, and homes become places of work and education. This shift led to a reduction in energy demand for many businesses. However, much of this energy demand transferred to households with most householders occupying their houses for most of the day, leading to increased use of heating, cooling, lighting and appliances, such as computers. This study analyses the total energy usage data for a household in Melbourne, Australia to explore the possible effect of the COVID-19-related lockdown on the household’s energy demand. Energy usage data was sourced from energy bills and the electricity distributor. Data associated with the period where all householders were working and studying solely at home (March to June 2020) were compared to six years of historical energy usage data for the same time period. The analysis shows a 26% increase in household energy demand. This also hasimplications for household finances.
Keywords: Severe Acute Respiratory Syndrome Coronavirus 2; COVID-19; energy; household; Australia.
1. IntroductionOn the 11th March 2020, the World Health Organization (WHO) announced the spread of the Severe Acute Respiratory Syndrome Coronavirus 2 (SARS-CoV-2) as a global pandemic, the first ever caused by a coronavirus (World Health Organization, 2020). Thought to have originated in China in late 2019, the virus spread rapidly around the world, causing over 500,000 deaths within the 6 months after it was first recognised as a novel coronavirus in early January 2020.
In an attempt to limit the spread of SARS-CoV-2 and the disease caused by infection with the virus, COVID-19, many countries began to enforce strict lockdown rules, with around 30% of the global population put into lockdown and more than 80% of all workplaces either partly or fully closed (Chen et al., 2020). These lockdowns were implemented to limit human to human contact, while minimising social and economic impacts as much as possible. In countries or jurisdictions where COVID-19 continued to spread, these lockdowns became more restrictive, often moving through various ‘stages’ (The Guardian, 2020). For example, in the Australian state of Victoria, a State of Emergency was announced on 16th March 2020, which was later extended to 16th August (State Government of Victoria,
Imaginable Futures: Design Thinking, and the Scientific Method. 54th International Conference of the Architectural Science Association 2020, Ali Ghaffarianhoseini, et al (eds), pp. 1075–1084. © 2020 and published by the Architectural Science Association (ANZAScA).

1076
Robert H. Crawford
2020). From 21st March, Victoria, along with the rest of Australia, moved into Stage 1 restrictions, which limited social gatherings and banned many facilities from opening (Prime Minister of Australia, 2020). The Victorian school holidays were brought forward to begin on 25th March and workers were asked to work from home if possible at this time. From 31st March, the Victorian Government enforced a mandatory stay-at-home order as part of Stage 3 restrictions, which meant that householders were only allowed to leave their homes for four reasons: work or study, exercise, shopping for supplies, and medical care or caregiving. At the conclusion of the school holidays on 15th April, school-based learning was replaced with remote learning for Victorian school students. School-based learning returned for most students on 9th June, until a second state-wide lockdown from 5th August.
As people began working and studying from home, an increasing number of workplaces and schools shut down. This, together with a decline in commercial and industrial activities resulted in a reduced demand for energy as these facilities no longer needed to be heated, cooled or lit. Countries saw a considerable reduction in energy demand of up to 25% on average (IEA, 2020) during the peak of lockdown. Demand within Australia’s National Electricity Market (NEM) in March dropped by 6.7% (Energy Networks Australia, 2020a). However, with the occupancy of many households increasing and work and study activities increasingly taking place in the home, household energy demand increased due to greater demand for heating, cooling, lighting and appliance use, such as computers and tablets (Mastropietro et al., 2020). Residential electricity consumption in the state of Victoria increased by 20% for the months of April to June compared to 2019 (Energy Networks Australia, 2020b). This increase in residential electricity demand is not a new phenomenon, with many studies demonstrating a correlation between household energy demand and occupancy rates. For example, studies such as those by Seryak and Kissock (2003); Yao and Steemers (2005); Yohanis et al. (2008); and Jazaeri et al. (2019) have shown that electricity use increases as the number of occupants and hours of occupancy of a house increases.
However, the current pandemic is unique, said to be ‘one hundred years since we had anything of comparable worldwide spread and destructive capacity’ (O'Kane, 2020). The strict lockdowns have not only increased household occupancy rates, as evidenced by a 10-33% increase in time spent at home in Australia on weekdays during the lockdown (Google LLC, 2020), but combined with directives to work and study from home, many of the work and study activities that householders would usually leave home for began to be conducted at home. With these activities relying on technology more now than at any time in history, this is likely to have led to a higher than usual use of devices, such as computers and tablets, within these households. For this reason, energy is also likely to be in greater demand by householders than ever before.
Several studies have considered the demand for energy during the COVID-19 pandemic. These have predominately looked at energy use at a state or city scale, including New York (Agdas and Barooah, 2020; Chen et al., 2020) and Ontario (Abu-Rayash and Dincer, 2020) or at a whole-of-sector level, such as the residential sector (Energy Networks Australia, 2020b). While the study of Chen et al. (2020) surveyed individual householders, it relies on householder’s perceptions of energy use rather than actual household energy data. A longitudinal study of actual electricity demand in 400 New York City apartments has shown a 4-7% daily increase in demand during their stay-at-home order (Meinrenken et al., 2020). Other than these studies, there has been very little or no research to have explored the effect of the COVID-19 lockdown and the resultant change to household occupancy on the demand for energy within individual households, particularly in Australia. Therefore, the aim of this study was to assess the effect of the COVID-19-related lockdown on an Australian household’s operational energy demand.

1077
The effect of COVID-19 on household energy demand
2. Research approachThis section outlines the approach used to assess the effect of the COVID-19-related lockdown on household energy demand. This analysis focuses on the operational energy used within the house, including electricity and natural gas for heating, cooling, hot water, lighting, cooking and appliances. In addition, this analysis also aimed to explore the main contributors to any change in energy demand during the lockdown period.
2.1. Household description
The house chosen for the analysis is a typical outer suburban detached house with a total floor area of 291.3 m2 (254.4 m2 residence and 36.9 m2 garage), located just outside of Melbourne, Australia (Figure 1). The house has a reticulated electricity and natural gas supply. Electricity is used for cooling, lighting, oven cooking and appliances. Natural gas is used for hot water, stovetop cooking and ducted heating.
Figure 1: Floor plan and south elevation of the case study house. (Source: Metricon, 2010) (plan)
There are six occupants that regularly reside within the house, including two adults and four children. Three children are of high school age while the fourth is of pre-school age. The three high school-aged children are typically away from the house from 8.30am to 4pm weekdays. The pre-school- aged child is typically away from the house for 15 hours a week. One of the adult occupants (Adult A) is typically away from the house during the day on weekdays and the other (Adult B) is predominately home-based during the day and out of the house most evenings for work.
2.1.1. Changes to householder activities due to COVID-19-related lockdown
The COVID-19-related lockdown meant that the three high school-aged children in the household undertook remote learning from home from 15th April until 8th June 2020. During this period, each child used a laptop computer to engage in online classes, communicate with their teachers and peers, and access school work for the majority of the time between 9am and 3pm weekdays. It is anticipated that this would increase the demand for appliance-related electricity demand within the house.

1078
Robert H. Crawford
The government directions to work from home (where possible) from 25th March also meant that both adults began working from home regularly from this date. This meant that both adults relied on a computer and internet access to conduct their work activities. This use is anticipated to have been even higher than during non-lockdown times as all activities, including meetings, teaching etc. that would usually be done in person, needed to be moved online. A timeline of the changes to usual activities for the household during lockdown is shown in Figure 2.
Figure 2: Timeline of lockdown changes during COVID-19 for the case study household.
2.2. Quantifying household energy demand during COVID-19-related lockdown
The operational energy demand associated with the household during the COVID-19-related lockdown was determined based on the energy usage data provided by the electricity distributor (Powercor) and the gas bills. Powercor provides an online interactive interface for visualising and downloading electricity usage data, called myEnergy. This data covers all electricity used within the house in 30 minute increments, but is not able to be disaggregated by use or circuit. Electricity usage for the period from 1st March to 30th June 2020 was extracted from myEnergy. Natural gas usage is only available as a monthly total due to no incremental metering. Gas bills for March, April, May and June 2020 were obtained, covering the main lockdown period in the location of the house.

1079
The effect of COVID-19 on household energy demand
2.3. Variation in energy demand due to COVID-19-related lockdown
In order to determine the influence of the COVID-19-related lockdown on the household’s energy demand, the energy data collected for the lockdown period was compared to the energy usage data for a non-lockdown period. As energy usage often fluctuates dramatically throughout the year, due to weather conditions, in particular, it was important to compare the energy demand to the same time period in previous years, assuming similar weather conditions. To do this, energy usage data was collected as per Section 2.2, for the same time period for the years 2014 to 2019.
2.3.1. Influence of weather on energy demand
While occupancy rates and behaviours/activities within the household will influence energy demand, other variables, such as weather (ambient temperatures), can also contribute significantly to variations in energy demand, particularly for heating, cooling and hot water. Daily temperatures can be significantly different for the same time period, from year to year. In order to consider the potential influence of weather on the comparison of lockdown-related energy demand to typical energy demand for the same time period in previous years, the energy usage data was compared to weather data for the same time periods. Daily minimum and maximum dry-bulb temperatures were obtained from the Bureau of Meteorology’s Climate Data Online (CDO) portal (Bureau of Meteorology, 2020) for the closest weather station to the house (~7km apart).
2.3.2. Correlation of electricity demand to device use
A significant increase in the use of technological devices (computers, mobile phones, tablets) inside the house during the lockdown period would suggest an increase in the use of electricity. As individual circuits within the household are not separately metered it was not possible to attribute any quantity of electricity to these uses. However, to provide an indication of the possible influence of the increased use of these devices on the household’s electricity demand, information on the amount of data downloaded through the household’s NBN internet connection was used as a proxy as research has shown the correlation between data use and electricity demand (Coroama et al., 2013; Morley et al., 2018). Daily data use was obtained from the internet service provider, but was only available for a 12-month period.
3. Results and Discussion
This section provides the energy demand of the case study household during the COVID-19-related lockdown and compares this to the energy demand for the equivalent time period of the previous six years. This is followed by a discussion of the potential effect of the lockdown on this energy demand.
3.1. Household energy demand
Based on the electricity data obtained from the electricity distributor, a total of 1,240.31 kWh was used from March to June 2020, inclusive. This equates to an average daily electricity demand of 10.17 kWh, which is a 26% increase on the average electricity demand for the same time period over the six previous years (2014-2019). A comparison of the total electricity demand for the 4-month period for 2014-2020 is shown in Figure 3. Electricity demand in previous years has been fairly constant, despite a slight upward trend in 2019, which saw a 12% increase on the average for the previous five years. However, the annual moving average only began to rise in 2020.

1080
Robert H. Crawford
Figure 3: Total household electricity demand from March to June for 2014 to 2020.
Figure 4 shows a breakdown of the electricity demand per month over the past seven years. For March this year, there was only a slight increase in electricity demand compared to 2019 (2.2%), but a 12.5-23% increase over every other year. However, the increase in electricity demand was not expected to be the greatest for the month of March as the lockdown commenced in the last week of the month, which began with school holidays. The most dramatic increase in electricity demand came in April, with a 31-54% increase compared to the previous six years. The month of May also saw a significant increase in electricity demand compared to previous years, from 21-29%. Electricity demand was lower than typical in June 2014 and 2016 as the house was unoccupied for half of the month. Compared to other years, there was only a slight increase in electricity demand in June (3.5-18.5%), most likely due to the fact that school reopened on 9th June and remote learning ceased.
400
350
300
250
200
150
100
50
0 March April May June
2014 2015 2016 2017 2018 2019 2020
Figure 4: Monthly household electricity demand from March to June for 2014 to 2020.
kWh

1081
The effect of COVID-19 on household energy demand
While data on natural gas demand was obtained from household bills, it was found to be problematic to compare natural gas use on a monthly basis across years due to variance in billing cycles (length and timing) from year to year. Natural gas use is not metered/billed on a daily basis as electricity is. The best possible comparison was across the period from early March to mid-June, however a number of assumptions had to be made due to variances in billing cycles. To normalise to a common time period (i.e. 9th March to 12th June), daily use was determined for several days at the beginning and end of the period by determining average daily usage for that billing cycle. The results showed a range from 90-142 MJ/day for the above time period, across the seven years. The 2020 data was actually the lowest, indicating a possible reduction in gas use during the lockdown. However, extreme caution should be used when relying on this finding due to the low reliability in the data comparison. A major change in gas demand was not expected as demand for gas for cooking and hot water were unlikely to have changed as the number of daily showers and use of stove-top cooking remained the same. As Adult B is usually home-based during the day, gas demand for ducted heating was also not expected to increase substantially with more people in the household. Operation of the heating remained essentially the same, with the same zones within the house heated to the same temperature (18°C) between the hours of 7am and 10pm. If anything, hours of operation may have increased marginally due to a small increase in the number of hours in which someone was in the house and thus the heating was on. The possible reduction in gas demand indicated by the data could be a sign of warmer than typical weather over the period and thus reduced hours of operation of the heating system. However, detailed analysis of the weather data showed no major change in the min. and max. temperatures compared to previous years. In fact, compared to the March to June period over the previous six years, the total number of heating degree days (from a base of 18°C) was the highest for 2020, by a minimum of 6%. This would usually indicate a higher demand for heating.
3.2. Correlation of electricity demand and device use
The three high school-aged children had access to three devices each (laptop, tablet and mobile phone) at all times of the day. This was much greater access than they would usually have during non-lockdown times. Use of these devices was also greater than it would have been at school as much more of their school work was completed on a device during remote learning. Both adults also did the majority of their work on a laptop computer. While an increase in the use of some household appliances (such as televisions) and lighting is expected with a higher occupancy, the most significant change in occupant activities during lockdown was this increased use of devices. This is evidenced by the increase in data use during the period, as seen in Figure 5. Typical data use increased at the beginning of 2020 due to the purchase of several new devices within the household in early January and a subsequent increase in access to the internet connection for the youngest of the three school-aged children. As Figure 5 shows, there was a marked increase in data use during the lockdown period. Average daily data use from August to December 2019 was 10.5 GB. This increased to 17.5 GB from the beginning of January to 24th March 2020 and further to a peak of 27.6 GB during remote learning, from 15th April to 8th June, almost triple the August to December 2019 daily average. January and February saw an average of 10 days with less than 15 GB of data use, while March saw four days, April and May only 1 day and June three days. The period of lockdown resulted in a clear increase in data use, which became even higher during the period of remote learning. Once school returned on 9th June, data use returned to lower levels.

1082
Robert H. Crawford
45
40
35
30
25
20
15
10
5
0 1/09/2019 1/10/2019 1/11/2019 1/12/2019 1/01/2020 1/02/2020 1/03/2020 1/04/2020 1/05/2020 1/06/2020
Figure 5: Internet data use for the period August 2019 to June 2020.
It is anticipated that this increase in device and internet use would lead to a subsequent increase in electricity demand and may be one of the main causes for the increase in electricity demand for April and May in particular, as seen in Figure 3 and 4. In the absence of circuit metering, the amount of data downloaded daily through the household’s NBN internet connection was compared to the daily electricity demand (Figure 6), for the period where daily data records were available (August 2019 to June 2020). This shows a moderate positive correlation of 0.61.
20
18
16
14
12
10
8
6
4
2
0 0 5 10 15 20 25 30 35 40 45
Gigabytes (GB)
Figure 6: Correlation between electricity demand and data use for the period August 2019 to June 2020.
Gig
abyt
es (G
B)
kWh

1083
The effect of COVID-19 on household energy demand
3.3. Limitations
This study provides an analysis of the energy demand associated with a single household during the COVID-19-related lockdown. The findings are representative of only this household and may differ substantially from other households that have different usage patterns, occupancy rates and circumstances. A larger sample covering a broader range of household types is needed to draw any wider conclusions on the effect of lockdown on household energy use more generally.
In the absence of more reliable data, the amount of internet data downloaded was used as a proxy for device-related electricity demand. While much of the use of the devices did rely on data (Zoom and Webex meetings, downloading school activities, emailing etc.), not all device use relied on internet access (e.g. word processing). Caution should thus be exercised when assuming that data use is a direct and reliable proxy for electricity demand. Further analysis of individual device use would be needed to improve the reliability of this assumption.
This study only considers household energy demand associated with heating, cooling, cooking, lighting and appliances. It does not consider energy use associated with transport or the purchase of goods and services. The inclusion of these aspects in further research would provide a more holistic perspective on the broader implications of COVID-19 on the household’s energy demand as well as related environmental effects, such as greenhouse gas emissions.
4. ConclusionThe aim of this study was to assess the effect of the COVID-19-related lockdown on a household’s operational energy demand. Energy usage data was obtained for a detached house located on the outskirts of Melbourne, Australia, for the months in which the household was under lockdown (March to June 2020). Total electricity demand for this period was 1,240.31 kWh (10.17 kWh per day). This was shown to be a 26% increase on the average electricity demand for the same time period of the previous six years. Electricity demand during the months of April and May, which were entirely within the lockdown period, was found to be between 21 and 54% higher than the electricity demand for the same months over the previous six years. Demand for natural gas during the lockdown period was found to be 90 MJ/day, but comparing this to previous years proved problematic given varying billing cycles and unavailability of daily usage data. The best possible comparison suggested a minimal change in natural gas usage due to the lockdown. This seems realistic given it was found there was no major difference in ambient temperatures or demand for hot water, heating or cooking.
Internet access and associated data usage was seen as a possible indicator of electricity demand and a way of confirming the influence of technological device use on electricity demand. Data use increased during lockdown and further once remote learning commenced. At its peak, data use was 27.6 GB/day (during remote learning), almost three times greater than the average daily data usage for the last four months of 2019. When comparing daily data use and electricity demand, a moderate positive correlation of 0.61 was found. This indicates that an increase in device and data use may have been one of the key reasons for the increase in electricity demand during the lockdown.
The increase in household energy demand during the COVID-19-related lockdown is expected to be similar for households in similar circumstances, but could vary for households with no school-aged children or adults required to shift their work to home. This additional energy demand will also increase energy costs, which may cause additional financial stress for householders, especially those that may have lost their job as a result of the pandemic.

1084
Robert H. Crawford
References Abu-Rayash, A. and Dincer, I. (2020) Analysis of the Electricity Demand Trends amidst the COVID-19 Coronavirus
Pandemic, Energy Research & Social Science, 101682. Agdas, D. and Barooah, P. (2020) The COVID-19 pandemic's impact on U.S. electricity demand and supply: an early
view from the data, [Working Paper] (Unpublished). Bureau of Meteorology (2020) Climate Data Online (CDO), Commonweath of Australia. Chen, C.-f., Zarazua de Rubens, G., Xu, X. and Li, J. (2020) Coronavirus comes home? Energy use, home energy
management, and the social-psychological factors of COVID-19, Energy Research & Social Science, 68, 101688. Coroama, V.C., Hilty, L.M., Heiri, E. and Horn, F.M. (2013) The Direct Energy Demand of Internet Data Flows, Journal
of Industrial Ecology, 17(5), 680-688. Energy Networks Australia (2020a) Commercial Down vs. Residential Up: Covid-19’s Electricity Impact. Available from:
https://www.energynetworks.com.au/news/energy-insider/2020-energy-insider/commercial-down-v- residential-up-covid-19s-electricity-impact/ (accessed 4 August 2020).
Energy Networks Australia (2020b) Mapping the impact of COVID-19 on electricity demand. Available from: https://www.energynetworks.com.au/news/energy-insider/2020-energy-insider/mapping-the-impact-of-covid- 19-on-electricity-demand/ (accessed 4 August 2020).
Google LLC (2020) Google COVID-19 Community Mobility Reports. Available from: https://www.google.com/covid19/mobility (accessed 4 August 2020).
IEA (2020) Global Energy Review 2020 - The impacts of the Covid-19 crisis on global energy demand and CO2 emissions, IEA, Paris.
Jazaeri, J., Gordon, R.L. and Alpcan, T. (2019) Influence of building envelopes, climates, and occupancy patterns on residential HVAC demand, Journal of Building Engineering, 22, 33-47.
Mastropietro, P., Rodilla, P. and Batlle, C. (2020) Emergency measures to protect energy consumers during the Covid-19 pandemic: A global review and critical analysis, Energy Research & Social Science, 68, 101678.
Meinrenken, C.J., Modi, V., Mckeown, K.R. and Culligan, P.J. (2020) New data suggest COVID-19 is shifting the burden of energy costs to households, Columbia University. Available from: https://blogs.ei.columbia.edu/2020/04/21/covid-19-energy-costs-households (accessed 4 August 2020).
Metricon (2010) Floor plan of Bel-Air house design, Metricon Pty Ltd, Melbourne. Available from: www.metricon.com.au (accessed 18 March 2010).
Morley, J., Widdicks, K. and Hazas, M. (2018) Digitalisation, energy and data demand: The impact of Internet traffic on overall and peak electricity consumption, Energy Research & Social Science, 38, 128-137.
O'Kane, B. (2020) The COVID19 pandemic is not a one in one hundred year event, Medium. Prime Minister of Australia (2020) Update on Coronavirus measures, Department of the Prime Minister and Cabinet.
Available from: www.pm.gov.au/media/update-coronavirus-measures-220320 (accessed 15 July 2020). Seryak, J. and Kissock, K. (2003) Occupancy and behavioral affects on residential energy use, American Solar Energy
Society. State Government of Victoria (2020) Victoria's restriction levels, Department of Health and Human Services,
Melbourne. Available from: www.dhhs.vic.gov.au/victorias-restriction-levels-covid-19 (accessed 31 July 2020). The Guardian (2020) Australia’s Covid-19 lockdown rules and coronavirus restrictions explained, Guardian News &
Media Ltd. Available from: https://www.theguardian.com/australia-news/2020/aug/05/australia-covid-19- lockdown-rules-coronavirus-restrictions-how-far-can-travel-interstate-border-social-distancing-nsw-victoria-vic- queensland-qld-wa-sa-act-how-many-people-over-house (accessed 31 July 2020).
World Health Organization (2020) WHO announces COVID-19 outbreak a pandemic, https://www.euro.who.int/en/health-topics/health-emergencies/coronavirus-covid- 19/news/news/2020/3/who-announces-covid-19-outbreak-a-pandemic, 11th March.
Yao, R. and Steemers, K. (2005) A method of formulating energy load profile for domestic buildings in the UK, Energy and Buildings, 37(6), 663-671.
Yohanis, Y.G., Mondol, J.D., Wright, A. and Norton, B. (2008) Real-life energy use in the UK: How occupancy and dwelling characteristics affect domestic electricity use, Energy and Buildings, 40(6), 1053-1059.

1085
The 54th International Conference of the Architectural Science Association (ANZAScA) 2020
The effect of data age on the assessment of a building’s embodied energy
Robert H. Crawford1 and André Stephan2 1The University of Melbourne, Parkville, Australia
[email protected] 2Université Catholique de Louvain, Louvain-la-Neuve, Belgium
Abstract: Data used to quantify the embodied energy of a building, known as life cycle inventory (LCI) data, varies widely in temporal relevance. The energy associated with construction material production and building construction changes regularly due to improvements in manufacturing and construction processes, and energy mix and intensity. Older LCI data may not be representative of the current industry. Due to the time and costs involved in compiling LCIs, many studies rely on outdated data, yet no studies have considered the effect of data age on the analysis of a building’s embodied energy. A reliable embodied energy value is critical to ensure energy reduction efforts have been effective. This study compares the life cycle embodied energy of a typical Australian house using data from a 2010 and 2019 LCI database, compiled using an identical technique. The 2019 data lead to a 27.7% decrease in life cycle embodied energy. This reveals that the age of data may have a considerable effect on the value of a building’s embodied energy, indicating that LCI data should be regularly updated to respond to changes in manufacturing and construction processes as well as energy mix and intensity.
Keywords: Embodied energy; Life cycle assessment; Life cycle inventory; Buildings; Data age.
1. IntroductionOur built environment, the buildings and infrastructure of our towns and cities, contribute more than any other single sector to global energy use (36%) and greenhouse gas (GHG) emissions (39%) (IEA, 2019). Energy use and GHG emissions have continued to increase, and in 2018, they reached record highs, up 7% from 2010 levels, despite global efforts to reduce them. Improvements to building envelopes and building energy systems have offset some of the growth in building-related energy demand and GHG emissions in recent years. However, they have continued to rise due to increasing demand for electricity. Global population growth and rising living standards will put further pressure on energy demand and GHG emissions, fuelled largely by an expected threefold increase in air conditioning use by 2050 (IEA, 2018). Buildings thus represent one of the most important and cost-effective options for mitigating global energy demand and GHG emissions (IPCC, 2014).
Historically, reducing energy demand associated with heating and cooling, hot water, cooking and appliance use has been the focus of global building-related energy and GHG emissions reduction efforts.
Imaginable Futures: Design Thinking, and the Scientific Method. 54th International Conference of the Architectural Science Association 2020, Ali Ghaffarianhoseini, et al (eds), pp. 1085–1094. © 2020 and published by the Architectural Science Association (ANZAScA).
1086
Robert H. Crawford and André Stephan
However, embodied energy associated with the manufacture of building materials accounts for around a third of all building-related GHG emissions (Adams et al., 2019) and up to 97% of a building’s total life cycle GHG emissions (Chastas and Theodosiou, 2016). As buildings head towards net-zero operational energy and GHG emissions, their embodied energy and emissions will become even more significant. In response to this, the World Green Building Council (Adams et al., 2019) has called for a 40% reduction in construction-related embodied GHG emissions by 2030 and net zero embodied GHG emissions by 2050.
A detailed, well-informed understanding of the embodied energy implications of a building project, especially during the design phase, based on reliable data and a comprehensive analysis, is crucial in our efforts to reduce a building’s life cycle embodied energy demand. This understanding is usually informed with the use of software-based life cycle assessment tools or using simplified calculations based on embodied energy coefficients of construction materials. However, the quality of the data used, particularly in terms of geographic and temporal relevance, can vary greatly. Some of the key reasons why the embodied energy associated with the production of construction materials may vary include differences in manufacturing processes, variation in production efficiencies, quantity and treatment of waste, regional differences in fuel mix, and transport distances. These differences can be further exacerbated with the passing of time. This means that the older the data, the less likely it is to be representative of the energy associated with current material production. Despite this, many decision- makers continue to rely on data from sources that are several decades old (for example, Lawson (1996) and Alcorn (2003)).
There have been no studies that have looked at the effect of the use of this older data on the value of a building’s embodied energy and the subsequent implications for building design and construction decision-making. Even the international standard for conducting life cycle assessments (International Organization for Standardization (ISO), 2006) places little emphasis on data age. The only reference to data age within this standard is in the specification of data quality requirements. The requirement here is that if ‘a study is intended to be used for comparative assertions intended to be disclosed to the public’, the age of data must be addressed. The standard does not however further define how this is to be addressed, but leaves this decision to the discretion of the individual. Therefore, the aim of this study was to assess the effect of LCI data age on the embodied energy of a building.
2. Research approachThis section outlines the approach used to assess the effect of LCI data age on a building’s embodied energy. This includes a comparison of LCI data from 2010 and 2019 databases as well as a comparison at the material, element and whole building level for a case study house.
2.1. Life cycle inventory databases
To minimise the effect of different methods for compiling LCI data on the findings, and restrict the comparison to the age of the data alone, LCI data compiled using an identical approach was compared. In order to maximise the completeness of an LCI, a hybrid approach is recommended (Crawford, 2011; Majeau-Bettez et al., 2011). Therefore, this study focuses on a comparison of hybrid LCI data. Several methods can be used to produce hybrid LCIs, as reviewed by Crawford et al. (2018). This study compares LCI data compiled using the Path Exchange method for hybridisation. This technique was first developed by Treloar (1998) and formalised by Lenzen and Crawford (2009). The two databases compared were released in 2010 and 2019 and contain LCI data for materials in the form of coefficients, providing embodied energy data in GJ per unit of material for a range of materials. The main difference between

1087
The effect of data age on the assessment of a building’s embodied energy
databases is that the 2010 version uses LCI data from the mid-1990s, while the 2019 version relies on LCI data from the last decade. A summary of the key attributes of both databases is provided in Table 1.
Table 1: Key attributes of the hybrid life cycle inventory databases.
Database name Database of embodied energy and water values for materials
Environmental Performance in Construction (EPiC) Database
Year of release 2010 2019 Reference Crawford and Treloar (2010) Crawford et al. (2019) No. of materials 58 284 Hybridisation technique
Path exchange hybrid analysis (manual) Path exchange hybrid analysis (semi- automated, based on Stephan et al. (2018))
Input-output data Based on 1996-97 input-output tables (ABS, 2001), 106 sectors + fixed capital
Process data Based on AusLCI data (ALCAS, 2011) and others from the 1990s
Based on 2014-15 input-output tables (ABS, 2017a), 114 sectors + fixed capital Based on AusLCI data (ALCAS, 2011) with ecoinvent2.2 (2010) shadow database
(4,531 processes, 2015 version) Flows (units) Energy (GJ per kg/m2/m3/no.)
Water (kL per kg/m2/m3/no.) Energy (GJ per kg/m2/m3/no.) Water (kL per kg/m2/m3/no.) GHG emissions (kgCO2-e per kg/m2/m3/no.)
2.2. Comparison of 2010 and 2019 hybrid coefficients
Comparison of material embodied energy coefficients from the 2010 and 2019 databases was performed in order to establish key differences. As the 2019 database contains a larger number of materials, only a selection of common construction materials contained within the 2010 database were compared. The change in coefficient values between the two databases was determined.
2.3. Effect of data age on building embodied energy
To determine the effect of the age of LCI data on the embodied energy of a building, the embodied energy of a case study house (see Section 2.4) was quantified. The life cycle energy of the case study house was quantified using the coefficients contained within the 2010 and 2019 databases. A bill of material quantities (BoQ) was extracted from construction documentation, including drawings, specifications and schedules. Each material quantity (Qm) was then multiplied by its respective 2010 and 2019 hybrid embodied energy coefficient (EECm). In order to account for on-site construction wastage and thus the need to order more materials than will end up in the project, a wastage factor (Wm) was applied (see Wainwright and Wood (1981); CSIRO (1994) for a list of common wastage factors). The resultant values provide the embodied energy for each material within the house, which when summed provide the material-based total embodied energy (EEh) for the house, in GJ.
In a hybrid analysis, any minor material or non-material-related energy (e.g. materials not included in the BoQ, direct energy associated with on-site activities or site-support activities such as financing, machinery and equipment) are accounted for using pure input-output data. This is a unique characteristic of the Path Exchange hybrid approach and accounts for processes and related energy demand not typically included in similar studies. This energy, for the processes referred to as other items, is determined by subtracting the total input-output-based flows associated with the material production processes for the materials contained within the BoQ (TERm) (this data is extracted from a

1088
Robert H. Crawford and André Stephan
M
4 R.H. Crawford and A. Stephan
pure input-output model) from the total input-output-based energy requirement of the relevant economic sector, n (TERn), in this case Residential Building Construction. This input-output component needs to be scaled to the level of the house by multiplying it by the cost of the house (Ch) (Equation 1).
EE = ∑M (Q ×EEC ×W )+ TER
− ∑ TER × C (1)
h m=1
m m m n
m=1 m h
The recurrent embodied energy associated with replacement of materials and maintenance of the house throughout its assumed life of 50 years was calculated using Equation 2, as outlined in Crawford et al. (2016).
M POA REE = ∑ − 1×[(Q m ×EECm ×Wm )+ (TERn − TERm −NATERm )×Cm ,h ] (2)
m=1 SLm
Where REEh is the recurrent embodied energy of the house, h in GJ; POA is the period of analysis, in years; SLm is the service life of the material m, in years; NATERm is the total energy requirement of all input-output pathways not associated with the installation or production process of material m being replaced, in GJ/AUD, e.g. pathways representing concrete production when replacing aluminium; and Cm,h is the cost of the material m in AUD in the house, h. Other variables are the same as in Equation 1. Once the initial and recurrent embodied energy of the house were calculated using both 2010 and 2019 hybrid coefficients, the results were compared at a material, elemental and whole building basis.
2.4. Case study description
A typical suburban three-bedroom single-family house was chosen as the case study (Figure 1).
Figure 1: Floor plan and front elevation of the case study house.
h
1089
The effect of data age on the assessment of a building’s embodied energy
This house was developed by the Housing Industry Association (HIA) as a representative sample of new Australian houses for costing purposes. The brick veneer house has a net conditioned floor area of 135.4 m² (when modelled according to the Australian Nationwide House Energy Rating Scheme technical guidelines and zoning protocols) and a gross floor area of 202 m². This house is representative of housing in Australia, where more than 70% of all dwellings are detached houses (ABS, 2017b).
3. Results and Discussion
This section compares a selection of the embodied energy coefficients contained within the 2010 and 2019 databases, followed by the results of the embodied energy analysis of the case study house using the 2010 and 2019 databases. The embodied energy of the house is compared on a material and element basis. This is followed by a discussion of the influence of each database on the overall embodied energy of the house and broader implications for the use of this data.
3.1. Embodied energy coefficient comparison
This section compares the embodied energy coefficients from the 2010 and 2019 databases for a selection of common construction materials. Figure 2 shows the percentage change in the 2019 coefficients compared to the 2010 coefficients. This shows that the majority of coefficients decreased in value for the 2019 database, with a small number increasing. This decrease is most likely to be due to an overall increase in the energy efficiency of manufacturing, year on year. Also, the proportion of process data to input-output data for a specific material can have a considerable effect on its hybrid embodied energy coefficient. The coefficients contained within the 2019 database integrate significantly more detailed process data compared to those within the 2010 database. Process data tends to reflect far more accurately the energy demand associated with the relevant industrial processes for manufacturing specific materials. Where limited process data is available for a specific material, a high proportion of the coefficient is represented by input-output data. If the total embodied energy requirement of the input-output sector representing the material underestimates the embodied energy of the material, then the resultant coefficient will likely be lower than in reality (as for aluminium, cement mortar, clay brick and timber in the 2010 database, for example). In this situation, as more process data is included, the coefficient increases, as has happened with the 2019 data for these materials (see Figure 2). However, if the input-output data overestimates the embodied energy for a material, adding more process data will likely reduce the coefficient. This is what has happened with the 2019 data for paint and glass, for example. One way in which an overestimation can occur with the use of input-output data is related to the cost of the material. The use of input-output data relies on the use of material costs and the resultant embodied energy coefficient is directly proportionate to the cost of the material (see Equation 1). This is a limitation of the use of this data, as often cost is not directly proportionate to energy use. However, research has shown that the use of input-output data in this way is much better than just excluding the embodied energy not covered by the available process data (Crawford, 2008; Pomponi and Lenzen, 2018). If material costs are overestimated, this can artificially inflate the embodied energy coefficient of a material. Despite this, as Crawford (2008) has shown, input-output data can be a good representation of process data, but this does not usually diminish the importance of using process data where it is available as it is usually more representative of reality. This means that while coefficients for materials have fluctuated both up and down between 2010 and 2019 databases, it is most likely that the 2019 values are more representative of reality given the much higher proportion of process data used (29% v 43%).

1090
Robert H. Crawford and André Stephan
100% +95% +95%
80%
60%
40%
20%
+52%
+64%
+12%
+28%
+72%
+11%
0%
-20%
-40%
-60%
-32%
-51%
-29%
-46%-49%-48% -45%
-49%
-37%
-51% -52%
-18%
-30%
-49% -54% -43%
-80%
-100%-81%
-72% -60%
-83% -76%
-58%
-91%
-65% -67%-69%
-87% -91%
Figure 2: Percentage change in embodied energy coefficients for the 2019 database, compared to the 2010 database.
3.2. Life cycle embodied energy of the case study house
The life cycle embodied energy of the case study house decreased by 27.7% when using the 2019 database, compared to the older database. This reflects the general decrease in coefficient values for the newer database. Table 2 provides the breakdown of the embodied energy by database and life cycle stage (initial construction and material replacement). The initial embodied energy is higher than the recurrent embodied energy due to the use of more energy-intensive materials, with a longer life span, many of which are not replaced during the life of the house (e.g. concrete slab, brick walls).
Table 1: Life cycle embodied energy of the case study house over 50 years, by life cycle stage.
Indicator 2010 database 2019 database Relative difference Initial embodied energy (GJ) 2,536 (12.6 GJ/m²) 1,987 (9.8 GJ/m²) -21.6%Recurrent embodied energy (GJ) 2,091 (10.3 GJ/m²) 1,360 (6.7 GJ/m²) -35%Life cycle embodied energy (GJ) 4,627 (22.9 GJ/m²) 3,347 (16.6 GJ/m²) -27.7%
3.3. Life cycle embodied energy comparison of case study materials
The total life cycle embodied energy of individual materials within the case study house varies considerably between 2010 and 2019 databases (Figure 3). For example, the life cycle embodied energy of ceramics did not change significantly (+12.7%), while the life cycle embodied energy associated with paint fell by 91%. The only materials that saw an increase in their total embodied energy were ceramics
Alum
iniu
m
Alum
iniu
m re
flect
ive
foil
Carp
et -
nylo
n Ca
rpet
- w
ool
Cem
ent m
orta
r Ce
ram
ic ti
le
Clay
bric
k Cl
ay ro
of ti
le 2
0mm
Co
ncre
te 2
0MPa
Co
ncre
te 2
5MPa
Co
ncre
te 3
2MPa
Co
ncre
te ro
of ti
le 2
0mm
Co
pper
Fi
bre
cem
ent s
heet
4.5
mm
Fi
bre
cem
ent s
heet
6m
m
Flat
gla
ss 4
mm
Gl
assw
ool i
nsul
atio
n 80
mm
Gr
avel
Ha
rdw
ood
kiln
-drie
d dr
esse
d LD
PE fi
lm 1
mm
M
DF/p
artic
lebo
ard
Oil
base
d pa
int
Plas
terb
oard
10m
m
Plas
terb
oard
13m
m
Plas
tic
Poly
styr
ene
(EPS
) ins
ulat
ion
Port
land
cem
ent
Sand
So
ftw
ood
kiln
-drie
d St
ainl
ess s
teel
St
eel
Stee
l she
et c
orru
gate
d St
eel s
heet
cor
ruga
ted
pain
ted
Toug
hene
d gl
ass 6
mm
U
PVC
pipe
100
mm

1091
The effect of data age on the assessment of a building’s embodied energy
and timber, reflective of the increase in their embodied energy coefficient in the 2019 database compared to the 2010 version. In addition to this, the ranking of materials from highest to lowest contribution to the embodied energy of the house changed. Based on the 2010 database, steel, carpet, timber, paint and appliances were the top five contributors to the life cycle embodied energy. For several of these materials (carpet, paint and appliances) this was predominately due to their recurrent embodied energy demand due to their relatively frequent replacement. With the 2019 database, this ranking changed to timber, carpet, steel, concrete and ceramics. Timber ranked higher using the 2019 database due to an increase in the embodied energy coefficient of all timber materials and a considerable decrease in the embodied energy coefficient of steel products. Likewise, the shift from paint and appliances in the top five materials to concrete and ceramics was due to a considerable decrease in the embodied energy coefficient of paint and appliances.
1,600 REE 2010 IEE 2010
1,400
1,200
1,000
GJ 800
600
400
200
0
Figure 3: Initial and recurrent embodied energy of the case study house, using 2010 and 2019 databases, by material. IEE: initial embodied energy; REE: recurrent embodied energy.
3.4. Life cycle embodied energy comparison of case study elements
Figure 4 shows the life cycle embodied energy of the case study house by element, based on the 2010 and 2019 databases. As per the material level, the embodied energy of most elements within the house varies considerably depending on whether the 2010 or 2019 database is used. The total life cycle embodied energy for each element is considerably lower with the use of the 2019 database, with the exception of walls. The reason for the 31.5% increase here is due to the increase in the embodied energy coefficient for bricks and timber in the 2019 database, which was also evident in Figure 2 and 3.
Oth
er it
ems
Stee
l
Carp
et
Tim
ber
Pain
t
Appl
ianc
es
Conc
rete
Plas
tic
Plas
terb
oard
Gla
ss
Fibr
egla
ss in
sula
tion
Cera
mic
s
Dire
ct e
nerg
y
Elec
tric
al
Alum
iniu
m
Copp
er
Sand

1092
Robert H. Crawford and André Stephan
For all other elements, the reduction in embodied energy ranges from 39.1% to 75.3% with the use of the 2019 database.
The ranking of elements from highest to lowest contribution to the embodied energy of the house changed only due to the increase in embodied energy for the walls element. Based on the 2010 database, finishes, driveway and fences, substructure, plumbing and windows and doors elements were the top five contributors to the life cycle embodied energy. The embodied energy of the finishes element was highest due to the recurrent embodied energy demand from the replacement of paint and carpet, in particular. Using the 2019 database, this ranking changed to finishes, walls, driveway and fences, substructure and plumbing.
1,600 REE 2010 IEE 2010
1,400
1,200
1,000
GJ 800
600
400
200
0
Figure 4: Initial and recurrent embodied energy of the case study house, using 2010 and 2019 databases, by element. IEE: initial embodied energy; REE: recurrent embodied energy.
The other items shown in Figure 3 and 4 represent the minor materials not included as part of the main materials quantified within the case study house as well as non-material inputs required in the construction and on-going refurbishment/repair of the house (e.g. construction equipment or services to support the builder, such as insurance, finance, marketing etc.). These other items represent 833 GJ, or 18% of the total life cycle embodied energy of the house using the 2010 database, and 1,387 GJ or 41% of the total life cycle embodied energy of the house using the 2019 database. While these items were not included in the material and element rankings discussed above, they nonetheless account for a higher proportion of the embodied energy of the house than any single material. The significant increase in these other items from the older to newer data is due to the fact that the energy intensity of the other items in GJ/AUD has remained almost identical (2010: 0.0036 GJ/AUD; 2019: 0.0039 GJ/AUD),
Fini
shes
Oth
er it
ems
Driv
eway
& fe
nces
Subs
truc
ture
Plum
bing
Win
dow
s &
doo
rs
Wal
ls
Roof
ing
Join
ery
Appl
ianc
es
Insu
latio
n
Dire
ct e
nerg
y
Elec
tric
al

1093
The effect of data age on the assessment of a building’s embodied energy
while the building’s cost has increased by 51%, due to inflation. This indicates that the energy intensity of the Residential Building Construction sector has reduced within the last several decades, by a total of 41% according to the input-output data used to compile the two databases (from 0.01 GJ/AUD to 0.006 GJ/AUD). This is due to improvements in the energy efficiency of the construction process as well as the industrial processes associated with other organisations within the construction supply chain. Despite this considerable increase in the embodied energy of other items, it is not as significant as the reduction in embodied energy across all other materials, thus leading to a net reduction in the life cycle embodied energy of the house.
4. ConclusionThe aim of this study was to assess the effect of LCI data age on the embodied energy of a building. Embodied energy coefficients from two databases, compiled using an identical approach, were used to quantify the embodied energy of a case study house. In general, coefficients were found to have decreased from the 2010 to 2019 database. The key reasons for this include improvements to manufacturing practices and efficiencies and an increase in the proportion of process data used to compile each coefficient, further improving their overall reliability. When applied to the case study house, at a whole building level, increases in the embodied energy of the timber, ceramics and other items were not enough to offset decreases in the embodied energy of all other materials within the case study house. This meant that the total life cycle embodied energy of the house decreased by a total of 27.7% with the use of the 2019 database compared to the older data. Regardless of the database used, steel, carpet and timber remained the most significant contributors to the embodied energy of the house, which means that reducing the embodied energy of these materials is important regardless of the age of the data used. While this study provides the first insight into the effect of LCI data age on the analysis of a building’s embodied energy, further analysis is needed, covering a broader range of building types and scenarios. While the findings of this study would likely be just as relevant to other environmental flows, such as GHG emissions, this should also be a focus of further research.
The field of LCA and associated data availability and quality continues to be an area in which further development is needed. This study shows that access to comprehensive and reliable data has improved over recent decades. It has also highlighted the need to ensure data is regularly updated in response to the changes to manufacturing practices and efficiencies, fuel mix and intensity. Users should continue to be cautious when relying on LCI data to make design decisions, and should be particularly conscious of the age of data being used.
References ABS (2001) Australian National Accounts, Input-Output Tables, 1996-97, Australian Bureau of Statistics, Canberra,
Australia. ABS (2017a) 5209.0.55.001 - Australian National Accounts: Input-Output Tables, 2014-15, Australian Bureau of
Statistics, Canberra, Australia. ABS (2017b) Census 2016, Dwelling Structure by Dwelling Type (SA2+), Canberra. Adams, M., Burrows, V. and Richardson, S. (2019) Bringing embodied carbon upfront, World Green Building Council,
London. Alcorn, A. (2003) Embodied energy and CO2 coefficients for New Zealand building materials, Centre for Building
Performance Research, Victoria University of Wellington, Wellington. Australian Life Cycle Assessment Society (ALCAS) (2011) The Australian National Life Cycle Inventory Database
(AusLCI). Available from: <www.auslci.com.au> (accessed 17 August 2020).

1094
Robert H. Crawford and André Stephan
Chastas, P. and Theodosiou, D.B. (2016) Embodied energy in residential buildings-towards the nearly zero energy building: A literature review, Building and Environment, 105, 267-282.
Crawford, R.H. (2008) Validation of a hybrid life cycle inventory analysis method, Journal of Environmental Management, 88(3), 496-506.
Crawford, R.H. (2011) Life Cycle Assessment in the Built Environment, Taylor and Francis, London. Crawford, R.H., Bartak, E.L., Stephan, A. and Jensen, C.A. (2016) Evaluating the life cycle energy benefits of energy
efficiency regulations for buildings, Renewable and Sustainable Energy Reviews, 63, 435-451. Crawford, R.H., Bontinck, P.-A., Stephan, A., Wiedmann, T. and Yu, M. (2018) Hybrid life cycle inventory methods – A
review, Journal of Cleaner Production, 172, 1273-1288. Crawford, R.H., Stephan, A. and Prideaux, F. (2019) Environmental Performance in Construction (EPiC) Database, The
University of Melbourne, Melbourne. doi.org/10.26188/5dc228ef98c5a. Crawford, R.H. and Treloar, G.J. (2010) Database of embodied energy and water values for materials, The University
of Melbourne, Melbourne. Available from: <https://dx.doi.org/10.4225/49/588eeeeda28af> (accessed 11 August 2020).
CSIRO (1994) Quote: Cost Estimating System for House Builders, CSIRO, Division of Building, Construction and Engineering, Australia, Highett.
IEA (2018) The Future of Cooling, IEA, Paris. IEA (2019) Global Status Report for Building and Construction 2019, IEA, Paris. International Organization for Standardization (ISO) (2006) ISO 14044: Environmental management - life cycle
assessment - requirements and guidelines, Geneva. IPCC (2014) Climate Change 2014: Mitigation of Climate Change. Contribution of Working Group III to the Fifth
Assessment Report of the Intergovernmental Panel on Climate Change [Edenhofer, O., R. Pichs-Madruga, Y. Sokona, E. Farahani, S. Kadner, K. Seyboth, A. Adler, I. Baum, S. Brunner, P. Eickemeier, B. Kriemann, J. Savolainen, S. Schlömer, C. von Stechow, T. Zwickel and J.C. Minx (eds.)], Cambridge University Press, Cambridge, UnitedKingdom and New York, NY, USA, 851.
Lawson, W.R. (1996) Building Materials, Energy and the Environment: Towards Ecologically Sustainable Development, The Royal Australian Institute of Architects, Red Hill, 135p.
Lenzen, M. and Crawford, R.H. (2009) The Path Exchange Method for Hybrid LCA, Environmental Science & Technology, 43(21), 8251-8256.
Majeau-Bettez, G., Strømman, A.H. and Hertwich, E.G. (2011) Evaluation of process- and input-output-based life cycle inventory data with regard to truncation and aggregation issues, Environmental Science & Technology, 45(23), 10170-10177.
Pomponi, F. and Lenzen, M. (2018) Hybrid life cycle assessment (LCA) will likely yield more accurate results than process-based LCA, Journal of Cleaner Production, 176, 210-215.
Stephan, A., Crawford, R.H. and Bontinck, P.-A. (2018) A model for streamlining and automating path exchange hybrid life cycle assessment, The International Journal of Life Cycle Assessment, 24(2), 237-252.
Treloar, G.J. (1998) A comprehensive embodied energy analysis framework, Ph.D. Thesis, School of Architecture and Building, Deakin University, Geelong.
Wainwright, W.H. and Wood, A.A.B. (1981) Practical Builders' Estimating, Hutchinson, London.

1095
The 54th International Conference of the Architectural Science Association (ANZAScA) 2020
The Effect of Parapets on the Performance of Unglazed Solar Collectors
Delight M. Sedzro 1, T. N. Anderson1 and Roy Nates 1 1Auckland University of Technology, Auckland, New Zealand
[email protected], [email protected], [email protected]
Abstract: Roof-mounted unglazed solar collectors are one of the most promising low-cost renewable energy technologies. However, their application is limited due to wind-induced heat loss which reduces their performance. That said, the wind flow over roof surfaces, where solar collectors are typically mounted, can be affected by a host of parameters related to the surrounding terrain and building topology. Perimetric parapets have shown an ability to reduce wind loads on roofs, particularly in low- rise buildings, and it is conceivable that this may also benefit solar collectors. Studies related to the effect of parapets on roof-mounted solar technologies have however been limited to wind loads on roof-top equipment or structural support systems, rather than on the heat loss. In this study, the performance of an unglazed solar collector mounted on a low-rise building with perimetric parapets was examined through wind tunnel experiments and computational fluid dynamics (CFD) simulations. The average pressure coefficients determined from the wind tunnel measurements were used to validate steady-state 3D Reynolds Averaged Navier-Stokes simulations. Subsequently, simulations were carried out for different wind velocities and directions with variations in parapet height. When normalised with Reynold’s and Nusselt numbers, the results showed the quantitative effect of these parameters. It is shown how sensitive the thermal performance of the collector is to parapet height, wind velocity and collector mounting location.
Keywords: Solar Collector, CFD, Parapets. Keywords: Solar Collector, CFD, Parapets
1. IntroductionParapets can be described as outwardly designed architectural features, that take the form of solid or segmented attachments to the roof of a building, or, an extension from it. Often, the intent of parapets or similar building features, are ornamental, although most function as structures which visually obscure, from the ground or other levels, the lateral view of building services equipment. Its influence on local pressure coefficients and roof wind loads have been the focus of several numerical and experimental studies. For buildings with flat roofs, the effect of parapets on wind induced pressure coefficients under uniform and turbulent flow conditions has been documented, see (Baskaran and Stathopoulos, 1988; Kopp et al., 2005b; Lythe and Surry, 1983).
Imaginable Futures: Design Thinking, and the Scientific Method. 54th International Conference of the Architectural Science Association 2020, Ali Ghaffarianhoseini, et al (eds), pp. 1095–1104. © 2020 and published by the Architectural Science Association (ANZAScA).

1096
Delight M. Sedzro, T. N. Anderso and Roy Nates
Nonetheless, as the integration of various renewable energy technologies to buildings continues to draw significant interest, the effect of parapets on roof mounted technologies such as solar have received marked attention. These have however tended to focus on how wind loads affect solar support structures (Browne et al., 2013; Cao et al., 2013; Kopp et al., 2012; Mier-Torrecilla et al., 2014). This is particularly true in low rise buildings where the flow motion is characterized by flow separations, attachments, and the creation of vortices. In fact several studies have demonstrated that perimetric parapets can mitigate wind loads by influencing wind velocity at varying heights and configurations, (Cao et al., 2013; Lythe and Surry, 1983; Stathopoulos et al., 1999; Stathopoulos and Baskaran, 1987).
That said, very few studies have however explored the impact of parapets on the performance of solar technologies, which is interesting given that their thermal performance is influenced by the local wind velocity. In particular, unglazed solar thermal collectors have been limited to low temperature application due to the high heat losses induced by convective heat transfer to the surroundings. In terms of cost however, Burch et al., (2005) argue that the cost saving associated with unglazed collectors is higher compared to other types of solar collectors.
Given that solar thermal collectors installed on the roof top of buildings have become popular in recent times, there is the need to critically investigate the relation between some roof top features such as parapets and how they affect convective heat loss. Furthermore, with the current focus on ensuring that solar technologies aesthetically appeal or appear as part of the facades architectural concept (Chemisana, 2011), the location of roof mounted collectors relative to parapets remain of great interest. This then raises questions as to whether passive wind breaks, such as parapets, could be used to reduce the heat loss experienced by these collectors. Or, in the case of photovoltaic modules, could these windbreaks alternatively be used to increase the cooling of these panels to improve their efficiency.
2. MethodTo determine the relationship between parapets and the heat transfer from unglazed solar collector, it was decided to undertake a simulation study using a commercial 3-D steady-state computational fluid dynamics (CFD) solver (ANSYS Fluent), to be followed by an experimental validation of the method.
2.1. Numerical modelling
In undertaking the CFD analysis, three model geometries of a standalone solar collector mounted on a flat roof building were modelled; without parapets, with a low perimetric parapet height of 0.03m and with a high perimetric parapet of height 0.06m. These were chosen to represent low (h/(H+h)≤ 0.17) and high (h/(H+h) ≥ 0.23) parapets (where h is the parapet height and H is the building height) as documented by Kopp et al., (2005a) and were generated using the ANSYS design tool SpaceClaim.
To capture the flow field, a computational domain was developed as detailed in best practice guidelines by Franke et al., (2007). Accordingly, the domain allowed 5H between the inflow boundary and the lateral sides of the buildings (where H is the vertical height from the trailing edge of the collector to the base of the building), and was extended 15H downstream of the building to capture all other affected parameters at wind incidence of 0⁰ and 45⁰, see Figure 1.
Higher resolution meshes were generated around the collector, parapet, and roof top. Regions away from the buildings were however of coarse mesh to improve computational speed. Overall, the whole computational boundary domain was discretized using hexahedral meshes after which they were converted to polyhedral. This was done to reduce cell counts and convergence time. Skewness was

1097
The Effect of Parapets on the Performance of Unglazed Solar Collectors
nonetheless maintained below 0.80. Two bodies of influence were used around the building and collector to refine the mesh around these regions. Six inflation layers with first cell height of 0.1mm was used to capture the boundary layer on the collector surface. The first cell height was varied to achieve a y+ value of less than 1 on the collector surface. A mesh sensitivity analysis was also undertaken to ensure that the computational method is independent of number of elements.
Figure 1: Computational domain For the inlet boundary condition in each case, a uniform constant inflow velocity (u) 10 m/s was
adopted as the inlet boundary condition and defined as velocity inlet. The bottom boundary condition was set as a non-slip wall, while the top boundary conditions was specified as symmetry. The outlet boundary condition was specified as pressure outlet. For the 𝑘𝑘𝑘𝑘−𝜀𝜀𝜀𝜀 turbulence model, realizable was used for the closure of the transport equation. The SIMPLE algorithm scheme was used as the pressure velocity coupling. Pressure interpolation in second order and second-order discretization schemes were specified for both the convection and the viscous terms of the governing equations. The solution was initialized by the values of the inlet boundary conditions. The chosen convergence criterion was specified so that the residuals decreased to 10-6 for all the equations. To ascertain the heat transfer, the collector was assumed as an isothermal plate at a constant temperature of 333K with an ambient temperature of 303K throughout the domain.
2.1. Experimental method
In line with validating the numerical simulation for this study, experimental studies were conducted in the Atmospheric Boundary Layer (ABL) Wind Tunnel at the University of Auckland. The test section of the wind tunnel is 20 m long, 2.5 m high, and 3.6 m wide. The test model made of polymethyl methacrylate sheet (see Figure 2), was constructed at a length scale of 1:20 to accurately model the rooftop perimetric parapets and to measure the wind pressures on the requisite surfaces. The model dimensions were 0.8m (D) × 0.8 m (B) × 0.2m (H) representing a height to breadth ratio of 1:4 and

1098
Delight M. Sedzro, T. N. Anderso and Roy Nates
breadth to depth ratio of 1:1. A flat plate of thickness 0.003m, and dimension 0.4m (L) × 0.2m (B) was mounted on the flat roof of the buildings at a tilt angle of 20°. Here, the flat plate was set at different locations of 0.2m, 0.4 and 0.6m on the roof. Two parapet heights 0.03m, 0.06m were considered.
Overall, 100 pressure taps were uniformly distributed across the model: 5 on the surface of each parapet, 50 on the roof and 30 on the upper surface of the collector (flat plate). The wind directions were varied from 0° to 90° in the wind tunnel test. Two approaching flow characteristics were considered, a uniform and an open flat terrain with a ground roughness terrain category 2 based on AS/NZS1170.2 (2011). In the current study however, wind direction of 0°, collector location of 0.2m, parapet height 0.03m and a free stream velocity of 10m/s are reported for the validation of the numerical model.
Figure 2: Experimental set up with model and collector in wind tunnel
2.3. Model validation
To validate the numerical results, the experimental results were compared in terms of flow visualization and the pressure coefficient distribution on the surface of the collector, parapet, and roof. The wind pressure coefficient at specific taps, Cpi, were determined by Equation 1. Where Pꝏ is the static pressure at infinity, ρ is the air density, Uref is the mean wind velocity and Pi(t) is the pressure measured at the tap. The pressure coefficient at the same location on the experimental model was compared to that on the simulated model, as shown in Figure 3. Similarly, the flow around the collector at 0⁰ for both methods were also compared as shown Figure 4. Both methods of validation showed a good agreement between the experimental and computational data.
(1)

1099
The Effect of Parapets on the Performance of Unglazed Solar Collectors
Figure 3: Comparison of experimental and numerical data for low parapet (h/(H+h) ≤ 0.17) at 5m/s. Where Xc is the position long surface of collector, Lc is the length of collector, Xp is the position along the face of the parapet and Lp is the length of parapet.
(a) (b)
Figure 4: (a) Photograph of flow visualization in wind tunnel test (b) Flow visualization with contours and streamline in vertical plane of CFD for 0˚ wind incidence and collector location of 0.2m
3. Results and discussionHaving validated the modelling method, it was decided to examine the flow behaviour and heat loss for a broader range of conditions than could be examined experimentally. Figure 5 shows the flow topologies of the 3D model on the mid isoplane (y=0.4). By examining the influence of the parapet height on the flow around the collector at 5m/s and wind incidence 0˚, it is observed that the flow impinges directly on the surface of the collector. This is influenced by the flow separation at the edge of the roof. Without the parapets (Figure 5 a), a recirculation bubble is created on the windward side of the collector along with higher wind velocity as shown in the contours. Now, when a lower parapet is

1100
Delight M. Sedzro, T. N. Anderso and Roy Nates
installed as shown in figure 5 b, the recirculation bubble extends although with reduced velocity as depicted in the contours. As expected, an increase in the perimetric parapet as shown in figure 5c, shows a reduction in the velocity near the surface of the collector. Again, a larger recirculation bubble is formed upstream of the collector which extends towards the trailing edge of the collector.
Figure 5: Contours of mean velocity magnitude (5m/s) with streamlines at 0˚ incidence and 0.6m collector location for (a) no parapet (b) low parapet (c) high parapet
When the collector is moved 0.6m away from the edge of the collector (at mid isoplane y=0.4m), a different observation is made. As shown in Figure 6, larger recirculation bubbles are created in all cases. The position of the recirculation bubbles however varies with change in the height of the parapet. For flat roof without parapet, the oncoming flow impinges on the surface of the collector forming a smaller recirculation bubble (see Figure 6a). The velocity contours show the wind velocity is high in this case.
(a)
(b)
(c)

1101
The Effect of Parapets on the Performance of Unglazed Solar Collectors
The reversed flow is also lower compared to that of the higher parapet. As the height of the parapet increases, the bubble upstream of the collector expands, separating at the trailing edge of the collector. Higher wind velocity however exists on the surface of the collector at the higher parapet (Figure 6c) compared to velocities at lower parapet (Figure 6b).
Figure 6: Contours of mean velocity magnitude (5m/s) with streamlines at 0˚ incidence and 0.6m collector location for (a) no parapet (b) low parapet (c) high parapet
Now, the flow fields of the 3D model on the isoplane (x=2.3) at 45˚ wind incidence is examined. Figure 7 displays the velocity magnitude on the roof with higher perimetric parapets, in plan view. At the 0.2m location, a higher wind velocity is observed on both the leeward and windward side of the
(a)
(b)
(c)

1102
Delight M. Sedzro, T. N. Anderso and Roy Nates
collector. This is due to the closeness of the collector to the parapet and leading edge of the building where the flow separation is predominant, see Figure 7 (a). When the collector is moved further away at 0.4m, higher wind velocities are observed on windward side of the collector while lower velocities are seen at the leeward side of the collector.
Evidently, the flow separation at the leading edge of the building to the 45˚ wind incidence impinges more on the surface of the collector, leading to higher velocities at its sideward edges (See Figure 7b). The above observation is even marked at the collector location of 0.6m where higher velocities (5m/s) are seen around a greater part of the collector.
(a) (b)
(c)
Figure 7: Contours of mean velocity magnitude (5m/s) at 45˚ incidence at high parapet for (a) 0.2 m collector location (b) 0.4 collector location (c) 0.6 collector location
Finally, given that the topology of the flow and wind velocity around the collector is decisive in the amount of convective heat loss, the effect of parapets on heat loss is analysed. To do this, a generalized

1103
The Effect of Parapets on the Performance of Unglazed Solar Collectors
relation of aspect ratio (L/h) is determined, where L is the length of the cavity of the roof and h, the height of the parapet. For the case of no parapet, the aspect ratio is defined at infinity (∞), where h is assumed in this case to be some arbitrary number. The wind velocity is also varied between 2m/s to 10m/s, chosen based on studies such as Soltau, (1992). As shown in Figure 8, the average Nusselt number Nuavg decreases at a lower aspect ratio for the same Reynolds numbers (Re). This is primarily due to vortices created behind the parapets, especially in the case of higher parapets, consistent a similar observation made by Mesalhy et al., (2010) for flows in shallow cavities. When the Reynolds number, is increased, it is observed that Nuavg increases accordingly. Nuavg is however lower at infinity where no parametric parapets are installed.
Figure 8: Effect of changing cavity aspect ratio on average Nusselt number at 0.2m collector location
4. ConclusionsAnalysis of the data reported above suggest a promising benefit of parapets to roof mounted solar technologies, particularly unglazed solar thermal collectors. The most obvious fact is that parapets can minimise the local velocities around collectors, leading to a reduction in convective heat loss. For collector placed on roofs with higher parapets, this could be advantageous albeit the effect of shading cannot be overlooked. The data show Nuavg is sensitive to aspect ratio (L/h) and Reynolds number. Notwithstanding this observation, the data presented show significant changes in flow topology depending on the location of the collector away from the parapet. The further the collector is moved away from the parapet, the lesser its likelihood to minimise the wind velocity. What this suggests is that, collectors placed very far away from the parapet are likely to experience the same velocities with or without the parapets in place. Now, collector inclination angle and wind incidence angle are significant in evaluating the performance of solar thermal collectors, thus there is a significant scope in estimating the sensitivity of Nuavg to these factors at varying parapet height and collector location.

1104
Delight M. Sedzro, T. N. Anderso and Roy Nates
Acknowledgements The authors would like to thank Professor Richard Flay and Dr Yin Fai Li of the University of Auckland for providing access to the wind tunnel.
References Aly, A. M. (2016) ‘On the evaluation of wind loads on solar panels: The scale issue’, Solar Energy. doi:
10.1016/j.solener.2016.06.018. Baskaran, A. and Stathopoulos, T. (1988) ‘Roof corner wind loads and parapet configurations’, Journal of Wind
Engineering and Industrial Aerodynamics. doi: 10.1016/0167-6105(88)90147-X. Browne, M. T. L. et al. (2013) ‘Wind loading on tilted roof-top solar arrays: The parapet effect’, Journal of Wind
Engineering and Industrial Aerodynamics. doi: 10.1016/j.jweia.2013.08.013. Burch, J., Salasovich, J. and Hillman, T. (2005) ‘An assessment of unglazed solar domestic water heaters’, in
Proceedings of the Solar World Congress 2005: Bringing Water to the World, Including Proceedings of 34th ASES Annual Conference and Proceedings of 30th National Passive Solar Conference.
Cao, J. et al. (2013) ‘Wind loading characteristics of solar arrays mounted on flat roofs’, Journal of Wind Engineering and Industrial Aerodynamics. doi: 10.1016/j.jweia.2013.08.014.
Chemisana, D. (2011) ‘Building integrated concentrating photovoltaics: A review’, Renewable and Sustainable Energy Reviews. doi: 10.1016/j.rser.2010.07.017.
Duffie, J. A. and Beckman, W. A. (2013) Solar Engineering of Thermal Processes: Fourth Edition, Solar Engineering of Thermal Processes: Fourth Edition. doi: 10.1002/9781118671603.
Franke, J. et al. (2007) Best practice guideline for the CFD simulation of flows in the urban environment, COST action.
Hottel, H. C. and Whillier, A. (1958) ‘Evaluation of flat-plate solar-collector performance’, Transactions of the Conference on Use of Solar Energy.
Huang, P., Peng, X. and Gu, M. (2017) ‘Wind tunnel study on effects of various parapets on wind load of a flat- roofed low-rise building’, Advances in Structural Engineering. doi: 10.1177/1369433217700425.
Jürges, W. (1924) ‘Der Wärmeübergang an einer ebenen Wand Beih.’, zum Gesundh.-Ing., pp. 1227–1249. Kopp, G. A., Farquhar, S. and Morrison, M. J. (2012) ‘Aerodynamic mechanisms for wind loads on tilted, roof-
mounted, solar arrays’, Journal of Wind Engineering and Industrial Aerodynamics. doi: 10.1016/j.jweia.2012.08.004.
Kopp, G. A., Mans, C. and Surry, D. (2005) ‘Wind effects of parapets on low buildings: Part 2. Structural loads’, Journal of Wind Engineering and Industrial Aerodynamics. doi: 10.1016/j.jweia.2005.08.005.
Kopp, G. A., Surry, D. and Mans, C. (2005) ‘Wind effects of parapets on low buildings: Part 1. Basic aerodynamics and local loads’, Journal of Wind Engineering and Industrial Aerodynamics. doi: 10.1016/j.jweia.2005.08.006.
Lythe, G. and Surry, D. (1983) ‘Wind loading of flat roofs with and without parapets’, Journal of Wind Engineering and Industrial Aerodynamics. doi: 10.1016/0167-6105(83)90091-0.
McAdams, W. H. (1954) Heat Transmission (third ed.),. third ed. Kogakusha, Tokyo, Japan: McGraw-Hill. Mesalhy, O. M., Abdel Aziz, S. S. and El-Sayed, M. M. (2010) ‘Flow and heat transfer over shallow cavities’,
International Journal of Thermal Sciences. doi: 10.1016/j.ijthermalsci.2009.09.007. Mier-Torrecilla, M., Herrera, E. and Doblaré, M. (2014) ‘Numerical calculation of wind loads over solar collectors’, in
Energy Procedia. doi: 10.1016/j.egypro.2014.03.018. Soltau, H. (1992) ‘Testing the thermal performance of uncovered solar collectors’, Solar Energy. doi: 10.1016/0038-
092X(92)90005-U. Stathopoulos, T. and Baskaran, A. (1987) ‘Wind pressures on flat roofs with parapets’, Journal of Structural
Engineering (United States). doi: 10.1061/(ASCE)0733-9445(1987)113:11(2166). Stathopoulos, T., Marathe, R. and Wu, H. (1999) ‘Mean wind pressures on flat roof corners affected by parapets:
Field and wind tunnel studies’, Engineering Structures. doi: 10.1016/S0141-0296(98)00011-X. Stathopoulos, T. and Zhou, Y. S. (1995) ‘Numerical evaluation of wind pressures on flat roofs with the k-ε model’,
Building and Environment. doi: 10.1016/0360-1323(94)00038-T.

1105
The 54th International Conference of the Architectural Science Association (ANZAScA) 2020
The evolution of information flows in construction projects: a contemporary study on the embracing of Augmented Reality
Akila Rathnasinghe1, Lesaja Weerasinghe2, Mahesh Abeynayake3 and Udayangani Kulatunga4 1, 2, 3, 4 Department of Building Economics, University of Moratuwa, Sri Lanka
{akilar1, mabeynayake3, ukulatunga4}@uom.lk
Abstract: The successful completion of a construction project involves the collaboration of various stakeholders which generates extremely exhaustive and varied information. Consequently, the effectiveness of the information flows ominously impact the strong work relationships between project stakeholders. Even though various adversarial effects to the construction project management threshold; cost, quality and time, are triggered by disordered information trails, numerous barriers for the effective information transfusion stay as a grey area. As an innovative tide towards overpowering the information management barriers in a conventional construction project, execution of Augmented Reality (AR) has been highlighted by scholars. Even though AR is already being incorporated in industries like automobile and aviation, it has not yet been considerably executed in the construction industry. Therefore, to exploit the potential of AR to improve information management, a qualitative research approach was incorporated. The extensive literature synthesis revealed the sustainability to adopt AR in the construction industry while highlighting the associated barriers in its pathway. In conclusion, the AR implementation for mitigating the barriers was evaluated and it indicated on AR's promising nature for such mitigation. This study will be an initiative to integrate the conventional construction environment with AR to enrich the efficiency of project information management.
Keywords: Augmented Reality (AR); information flows; information management; barriers to information management.
1. IntroductionInnovation is much essential to perform existing activities from a different perspective to achieve convenience and greater efficiency in any business (Bygballe & Ingemansson, 2014). However, the innovativeness in the construction industry which is known for highly labour intensive and outmoded mechanisms is not in a sturdy position and subsequently, it has caused the deprived value in return for mega investments compared to the other trades (Zubizarreta, Cuadrado, Iradi, Garc´ıa, & Orbe, 2016).
The success of a construction project can be appraised upon the well-known project management threshold of time, cost and quality (Lambropoulos, 2013). Even though the success of a project is influenced by such factors, communication within the project environment can also be considered as a key aspect to a project management pathway lead towards the productivity (Vasanthi & Abubakar,
Imaginable Futures: Design Thinking, and the Scientific Method. 54th International Conference of the Architectural Science Association 2020, Ali Ghaffarianhoseini, et al (eds), pp. 1105–1114. © 2020 and published by the Architectural Science Association (ANZAScA).

1106
Akila Rathnasinghe, Lesaja Weerasinghe, Mahesh Abeynayake and Udayangani Kulatunga
2011). Accordingly, Keyton (2011) defined the communication in a construction project environment as the process of transferring information; ideas, thoughts, orders, views, feelings and emotions through writing, speaking, signals and actions among the project stakeholders. Thus, Donsbach (2006) identified the need for a meeting of minds between the sender and receiver as a result of such information exchange. However, Priyadarshani and Kumar (2015) viewed the complexity in project communication due to the involvement of a larger number of stakeholders and the diversity of information within the construction projects. Accordingly, any construction project output may lead to a catastrophe as in the result of inadequate information management between its participants. Therefore, Rajhans (2013) demanded a proper collaboration and integration of information at every level of a construction project to have strong information channels between the stakeholders.
In response to such burdens, Rankohi and Waugh (2013) identified the importance of innovative information technologies for the Architecture, Engineering and Construction (AEC) industry, due to its complex supply chain nature and high demand for access to information for evaluation, communication and collaboration. Accordingly, many scholars have started to speculate on Augmented Reality (AR) as one of the powerful information management techniques which can significantly benefit the communication through visualization and by exploring real-world structures together with additional contextual information (Kalkofen, Sandor, White, & Schmalstieg, 2011). However, Daponte et al. (2014) found out the adoption of AR in AEC industry to mitigate the communication barriers is in a primitive stage compared to other industries like automobile and aviation with obvious productivity enhancement. Consequently, this paper acknowledges the technological viability to adopt AR into the information management in construction processes while highlighting its effect towards the information channels.
2. BackgroundThe term communication is commonly expressed as the process of transferring information from one person to another (Keyton, 2011). As Donsbach (2006) identified, unless the exchange of information achieves a consensus ad idem of the sender and receiver, a productive communication does not occur. Accordingly, the communication process fundamentally comprises of three components; sender, medium and receiver (Oppong & Birikorang, 2014). The further clarification on communication process revealed that the communication will be initiated by the sender through encoding the idea in a form of verbal, nonverbal or written. The message will be decoded by the receiver into meaningful information (Lunenburg, 2010a). However, the communication process can be obstructed by environmental and personal barriers (Oppong & Birikorang, 2014). Further to authors, whatsoever distorts a message can be considered as a barrier in terms of language, interludes, and different perceptions of the message. Finally, the feedback occurs when the receiver responds and returns it to the sender (Lunenburg, 2010). Consequently, the sender can decide whether the message has been received and understood by the receiver.
In light of the above general explanation on communication and its process, Priyadarshani and Kumar (2015) viewed project communication as the process of exchanging of project-specific information among the participants to form a common attitude. Information within construction projects is usually diverse due to the involvement of various parties in many stages (Dainty, Moore, & Murray, 2006). Therefore the success of a project is highly influenced by the information management aspects to have a proper collaboration and integration among the project stakeholders (Valitherm & Rahman, 2014).
1107
The evolution of information flows in construction projects: a contemporary study on the embracing of Augmented Reality
2.1. Information flows in a construction project
Information flows in a construction project can be identified under three distinct directions as downward, upward and horizontal (Lunenburg, 2010). Downward flows transmit information from higher to lower levels in the organization structure. In construction projects, this type of flows sends information such as notices, regulations and memos from supervisors to subordinates (Turkalj & Fosic, 2009). As identified by O'Toole, Meier and Crotty (2005), information is transmitted from a lower level to the higher level through the upward information flows. An instance of engineering team sends suggestions, the progress of works, and explanations to the chief engineer can be considered as an example for upward information flows. Moreover, information transmission between the participants who are in the same level of the organization structure is considered as horizontal information flows (Turkalj & Fosic, 2009). Horizontal information flows are more important for the coordination within the construction team. In addition to these three types of basic information flows, ‘Lateral communication flows’ are there along the different paths in addition to the hierarchy of the organization (Vasanthi & Abubakar, 2011).
Furthermore, Turkalji and Fosic (2009) described the construction information flows under the categorisation of formal and informal. Formal information channels transfer information such as the procedures, goals and policies within the project environment (Kandlousi, Ali, & Abdollahi, 2010). Moreover, the authors found out that formal communication occurs as a systematic process in a pre- planned pathway and follows a chain of command. However, Turkalj and Fosic (2009) claimed of inevitable existence of informal communication networks in any formal working environment to fill any gaps caused through strict and hierarchical communication. On the other hand, the authors identified the need for a proper balance between formal and informal communication to avoid any chain of command being disrupted by informal communication.
3. Research MethodThis paper expects to answer the research problem of “how far the AR can be incorporated into the construction processes to eradicate the barriers for effective information management” through a qualitative research method. Thus, the qualitative research method is appraised as its ability to achieve an in-depth analysis of incipient and new concepts which are also consisted of trivial literature supporting. Accordingly, this research is mainly focussed upon an in-depth investigation on literature sources about the implementation of AR in the construction industry concerning mechanisms to incorporate AR in construction project stages, information management through AR’s perspective and barriers for such integration.
4. Augmented Reality (AR)Carmigniani (2011) simply defined AR as “actual view of a built environment that has been enhanced by adding the virtual information” (p.377). An AR system aims to syndicate the real world with the computer-generated world to appear as a uniformed environment (Yuen, Yaoyuneyong, & Johnson, 2011). Therefore AR can be simply described as a type of Virtual Reality (VR) where the display is transparent. Although virtual reality is the approach where the user is completely immersed in a virtual environment, AR allows the user to interact with both the virtual and real objects in a seamless manner (Zhou, Duh, & Billinghurst, 2008). Further, the authors have explicated that when the user is moving around the real objects, the virtual objects are acting as they are completely integrated with the real

1108
Akila Rathnasinghe, Lesaja Weerasinghe, Mahesh Abeynayake and Udayangani Kulatunga
world. Even though the virtual objects move, their movements will seem as they are registered to the real world, providing the user with a perception of an integrated working environment (Yuen et al., 2011). Accordingly, users can acquire additional information of real-world by rendering this mixed overlay in devices such as head-mounted displays, see-through glasses and hand-held monitors (Jiao, Zhang, Li, Wang, & Yang, 2013).
The core in an AR system can be considered as the software and database running in a portable computer (Sørensen, 2013). The database comprises of the 3D models which are to be viewed and their geo-location. These are positioned by the software consistent with the data retrieved through the registration systems. Then the composite renderings of the virtual model will be superimposed by the software, on the display device based on the data of location, the orientation of the viewer and virtual model, and the field of view of the display device (Sørensen, 2013). The ‘Augmented Reality’ was coined as a term in the early 1990s by Caudell and Mizell who developed an AR system to assist workers at Boeing Corporation (Agarwal & Thakur, 2014). At present, numerous mobile platforms such as smartphones, tablet PCs and personal digital assistants (PDA) are capable of supporting AR technologies (Agarwal & Thakur, 2014). Moreover, it has become possible because of modern technologies to develop AR applications by simply using software development tools such as ARToolKit which are available free of charge (Li, Yi, Chi, Wang, & Chan, 2018).
5. Barriers to Effective CommunicationTo achieve effective communication, particular information should be reached to the receiver only with negligible distortion, without altering the core idea noticeably (Cheng et al., 2001). However, complications in ineffective communications occur when the receiver does not fully understand the particular information sent by the sender. In the construction industry, studies have identified various difficulties in sharing information between the stakeholders due to the unique nature in project setups (Zeng, Lou, & Tam, 2006). Accordingly, such barriers may create disturbances and interferences result in ineffective communication. As identified by Priyadharshini and Kumar (2015), the impacts resulted by inefficient communication in construction projects are the delays in projects, overrun of cost due to rework, lack of coordination, lack of quality of works, reduced performance of the organization, delays in procurement, misunderstanding and misrepresentation, changes in scope, failure of the project, risk initiation during closeout phase, disputes and arbitration.
Various researchers have classified the barriers to communication in construction projects under several methods. Lunenburg (2010a) has divided the barriers for effective communication into four categories as a process, physical, semantic and psychosocial. Process barriers comprise of the barriers invoice with the components in the communication process such as; sender barrier, encoding barrier, medium barrier, decoding barrier, receiver barrier, and the feedback barrier (Lunenburg, 2010a). The physical attributes of the environment which negatively affect the effectiveness of the communication can be considered as physical barriers (Nijkamp, Rietveld, & Salomon, 1990). Examples of physical barriers are environment or climate, time and distance, and technical problems. Semantic/ language barriers can be considered as the most common communication barriers which result in misunderstandings or misinterpretations (O’Leary, Federico, & Hampers, 2003). Lunenburg (2010a) has identified the psychosocial barriers in three types as experience, filtering, and psychological distance. Examples for causes of psychosocial barriers are memory, selective perception, filtering and attention, culture, and tradition.

1109
The evolution of information flows in construction projects: a contemporary study on the embracing of Augmented Reality
Dainty et al. (2006), Priyadharshini and Kumar (2015), Luka et al. (2014), and Valitherm (2014) acknowledged a common set of barriers for efficient communication in construction projects. Accordingly, the complex nature of information transmitted within a construction project environment has been identified as a barrier to achieve the efficiency where information is diversified and specialised upon the transmitter's professional expertise. Therefore, the receiver might not have the required knowledge or proper understanding to decode the message which would ultimately create a disturbance or misunderstanding in the flow of bureaucracy. In line with this particular hindrance, Dainty, Green and Bagilhole (2007) viewed the complexity of information as in the result of heavy workforce diversification in a construction project environment. It is a well-known fact that the construction workforce consists of a wide range of occupational cultures such as skilled, unskilled, managerial, professional and administrative which requires a proper stakeholder management mechanism to achieve a common communication ground in between these professional layers. Further, studies have identified that language and cultural discrepancy among the construction workforce would also complicate the effective information flows within the construction project environment. Because professionals and workforce from different countries and races would be employed in construction projects which roots for a community with different languages and cultural norms. Rather than those, above studies emphasised on lack of clear objectives, faulty transmission through inappropriate mediums, and less use of innovative information technologies as to cause barriers to achieving effective information flows among the construction project stakeholders.
6. Application of AR for Information Management in the ConstructionIndustry
Currently, AR technology in construction industry intends to improve the practices of design process, architecture visualization, engineering management systems and building construction processes (Wang, 2009). Dunston and Wang et al. (2014) found out that the information accessibility for decision making on work planning, design reviews, work execution and monitoring can be enhanced through a combination of real and virtual environments. Rankohi and Waugh (2013) have further identified numerous capabilities of AR in AEC industry such as; virtual site visits, pre-empting schedule disputes, comparing as-built and as-designed works, enhancing collaboration, training/ planning for similar projects.
As said by Dong and Kamat (2013), the AEC industry can be benefited by AR at least in three levels of visualization, information retrieval and interaction. Accordingly, Dunston and Wang (2007) have explored potential applications of AR for training operators in heavy construction equipment. A 4- dimensional AR model has been developed by Golparvar-Fard, Peña-Mora and Savarese (2009) for automating activities in construction phases such as data collection, progress monitoring, processing and communication. Further, Behzadan and Kamat (2011) have investigated a mobile 3-dimensional AR system to visualize the dynamic site operations in the construction stage. To record the construction progress, a web-based augmented panoramic environment has been developed by Wang, Cho and Gai (2012). Therefore, it is evident that the construction industry is now moving towards AR technologies to achieve added benefits in information management of a construction project (Rankohi & Waugh, 2013). Accordingly, the application of AR for information management in a construction project will be discussed in this paper under the design and construction stages.

1110
Akila Rathnasinghe, Lesaja Weerasinghe, Mahesh Abeynayake and Udayangani Kulatunga
6.1. AR in the design stage of a construction project
Architecture and design industries require in-built visualization platforms for the efficient use of digital information (Dunston & Wang, 2005). Further, the authors have acknowledged AR to provide a unique advantage of integrating the design into the as-built environment perspective. Accordingly, a building scheduled on a future date can be showcased through AR by letting the customers realize on how the building will look in real and also pre-visualize its placement (IndexARSolutions, 2018). An AR system for the architectural design visualization has been firstly developed by Kensek, Noble, Schiler and Tripathi (2000) for indoor facility management and maintenance. AR systems can be used also for on-site experiences by the project stakeholders such as architects, designs, constructors, owners to observe the appearance of a new design and to evaluate its functions and aesthetics (Sørensen, 2013). Thereby, AR can assist the project stakeholders to safeguard the quality assurance and constructability review. During the design stage of a project, a large amount of data and information would be utilised by various project stakeholders and a potential application of AR would allow them to access such information cooperatively through an augmented workspace (Wang, 2009). As stated by Wang et al. (2014), usually the placement of a building is demonstrated by the designers through creating scaled physical mock-ups or digitally enhanced photographs which are expensive and time-consuming processes. Hence these difficulties can be mitigated with AR prototypes and test platforms (Wang et al., 2014). Moreover, AR “popup” models is another approach that links AR models with physical drawings while allowing the users to understand them comprehensively (Dunston & Wang, 2005). Further, Wang (2009) has mentioned that most of AR applications for architecture and design have incorporated the "ARToolkit”, a platform to simplify the possible implementation of AR in construction projects.
6.2. AR in the construction stage of a construction project
Different stakeholders involved during the construction stage of a project, mainly provide attention to their tasks with less focusing on interdependencies among the tasks. Whereas AR provides an integrated sight of the components for project participants at the right location in real scale and time (Wang et al., 2014). As identified by Dunston and Wang (2005), AR enables project partners to work collaboratively by moving the map in a seamless way of having an immersive view of the design. Each of the project participants can communicate on complex relationships between several constructions works in a more comprehensible manner rather than using computer-generated sketches (Wang et al., 2013). As further explained by Wang et al. (2014), wastage of money and time due to misinterpretation of drawings can be reduced with the use of AR by having a better link between information and physical resources.
Further to Jiao et al. (2013), AR can be applied in the construction stage of a project in various areas such as progress monitoring, conflicts avoidance, cost control and tenant management. As one of best uses of AR, construction works can be inspected by examining the alignments of as-built conditions compared with as-designed drawings of models to discover discrepancies (IndexARSolutions, 2018; Rankohi & Waugh, 2013). Further Wang et al. (2014) have stated that the progress of the construction works can be determined by overlaying as-planned models on the as-built situations. For example, various colour schemes can be used to indicate the building components as “behind schedule”, “on schedule” and “ahead of schedule" (Wang et al., 2014). Moreover, information retrieval can be enhanced through the use of AR with several mechanisms to filter data and information and removing redundant data to get the most relevant information (Chu, Matthews, & Love, 2018).
Use of AR will accelerate the construction tasks since it depresses the frequency of switching between the workpieces of tasks and related information resources by making the information readily

1111
The evolution of information flows in construction projects: a contemporary study on the embracing of Augmented Reality
available in a real context and real-time (Wang et al., 2014). Therefore, AR can provide instructions for the workers such as correct work procedures by displaying digitalized information to improve accuracy and safety (Li, Yi, Chi, Wang, & Chan, 2018). For example, when a technician is performing a task while looking at the information on papers, it is inevitable to avoid the physical and mental detachment from the designated work repeatedly. However, if the technician has worn a head-mounted display with an AR system to instruct, AR system will retrieve information to perform the work seamlessly (Wang et al., 2014). Further, the AR can be used to determine the exact positions to place the components instead of setting out (Dunston & Wang, 2005). Besides, positions of enclosed components can also be figured out effortlessly. For example, an operator of a backhoe excavator can recognize the positions of buried utilities through incorporating AR (Dunston & Wang, 2005).
Also, Wang et al. (2014) have admitted the integration of Building Information Modelling (BIM) with AR to mitigate the lack of information combination between the computer-generated and real world. The authors have revealed that BIM + AR will allow to navigate and find the linked drawings by clicking on a location. Chu et al. (2018) have stated that such integration of BIM with AR can provide an interactive 3D solid model with a visual understanding of details for the workers which may ultimately enhance the constructability.
6.3. Barriers to the implementation of AR in the construction industry
The barriers of implementing AR in a typical industry can be discussed under technical and social barriers (Vakoms, 2017). In this paper, the identified two deviations of barriers will be discussed concerning the construction industry.
6.3.1. Technical barriers
Miniaturization Issues - To be highly adaptable, the hardware used for AR systems should be lightweight and quick enough to demonstrate graphics (Mekni & Lemieux, 2014). Whereas when it comes to construction, due to the huge amount of information which has to be dealt, high- capacity storage and high-performance components are required (Busel, 2017). Therefore making light and small devices with high performances to the required extent is a challenge.
Battery life -Portable AR devices are necessary for most of the applications in construction. Hencean adequate capacity of the battery will be required to work uninterruptedly (Mekni & Lemieux,2014).
Accuracy and reliability -Enhanced tracking systems are required to display the information isaccurate and reliable manner. And the devices should have well-functioning software to obtain,filter and retain the information, discard the inadequate data and display the precise information (Mekni & Lemieux, 2014; Smith et al., 2016).
6.3.2. Social barriers
• Social Rejection - Stakeholders in construction usually tend to embrace common practiceswhich are in their “comfort zone” rather than evaluating and adopting new technologicalsolutions like AR (Mekni & Lemieux, 2014; Busel, 2017). This may raise as a serious issue touptake AR tools into the existing cultural and social settings of the industry.
• Cost - Cost is generally a key consideration for any technological implementation.Consequently, AR solutions may require an expensive start-up cost for widespread use(Smith et al., 2016).

1112
Akila Rathnasinghe, Lesaja Weerasinghe, Mahesh Abeynayake and Udayangani Kulatunga
• Poor Experience - As AR is a novel concept in much orthodox construction industry, it isobvious that the professionals may not have the required knowledge or experience in working with AR. Thus, professionals are required to be trained or hired (Mekni & Lemieux, 2014;Busel, 2017).
• Health and safety issues -Digital fatigue may occur as a result of excessive use of digitaldisplays. For example, health problems such as eyestrain and migraines may happen. Further, when a person uses AR displays on the site, his surroundings will be covered by the augmented contents and it may cause for physical danger. (Smith et al., 2016; Busel, 2017).
As per the overall findings, it can be identified that the use of AR will be positively effective for mitigating each barrier to communication in construction. Accordingly, the applicability of AR for mitigating the communication barriers can be condensed to a comparable manner as depicted in Table 1.
Table 1: Potential of AR to mitigate the barriers to communication.
Barriers to communication in a construction project
Potential of AR to mitigate the identified barriers
Convolution of data * Associated real-time encounter with a 360-degree visualization
• Intersecting additional data such as dimensions, features, assignment span
• Facility to inspect outlined 3D illustrations on definitelocations in a live setting
Diversified workforce * Capability for any skill levels of persons to learn on-sitegraphical data
• Ability to supervise aides with optical directions• Observing the operations and recognising flaws
Communication struggles * Enhanced understandability of expressed messages with concurrent application of AR visualization
• Translating features of the overlaid information
Absence of precise purposes * Presenting a precise opinion on possible conditions on site• Comprehensibility for the persons who are unknown with
the circumstances
Inadequate conveyance * Presenting a fitting insight into the information for discovering suitable transmission techniques
Insufficient capital * Reducing the expenses for samples via visualizing with AR • Decreasing the accidental project expenses
The restricted practice of innovative information management tools
*The expectation to be welcomed by the people due to theelite experience given by AR
7. ConclusionsThe comprehensive literature synthesis provided knowledge on the components, mediums and the patterns of the communication and the importance of effective communication for construction projects. It was identified that proper communication is essential for the successfulness of project delivery. Whereas findings indicated that barriers to communication in construction remain. As per the findings, implementing AR in construction is viable based on the current technological means. However,

1113
The evolution of information flows in construction projects: a contemporary study on the embracing of Augmented Reality
the accuracy and reliability of the functioning of AR will depend on the scale. Therefore, AR can be initiated with a capable level and gradually, the AR applications can be expanded with the development of the technology. Moreover, this study acknowledged the barriers to implement AR in the construction industry. Among those, most of the social barriers occur due to the unawareness of people about the applicability of AR technology and its conceivable benefits. Therefore, making construction professionals knowledgeable about every aspect of AR is foremost to overcome most of the social challenges. Considering the overall findings, it can be concluded that applying AR in construction will be positively affected to mitigate the communication barriers and in enhancing the efficacy of information management in construction projects.
References Agarwal, C. and Thakur, N. (2014). The Evolution and Future Scope of Augmented Reality. International Journal of
Computer Science Issues (IJCSI), 11(6), 59. Behzadan, A. H. and Kamat, V. R. (2011). Integrated information modelling and visual simulation of engineering
operations using dynamic augmented reality scene graphs. Journal of Information Technology in Construction (ITcon), 16(17), 259-278.
Busel, M. (2017). The 6 biggest challenges facing augmented reality. Retrieved from haptic.al. Bygballe, L. E. and Ingemansson, M. (2014). The logic of innovation in construction. Industrial Marketing
Management, 43(3), 512-524. DOI:10.1016/j.indmarman.2013.12.019 Carmigniani, J., Furht, B., Anisetti, M., Ceravolo, P., Damiani, E. and Ivkovic, M. (2011). Augmented reality
technologies, systems and applications. Multimedia tools and applications, 51(1), 341-377. Chu, M., Matthews, J. and Love, P. E. (2018). Integrating mobile Building Information Modelling and Augmented
Reality systems: An experimental study. Automation in Construction, 85, 305-316. Daponte, P., De Vito, L., Picariello, F. and Riccio, M. (2014). State of the art and future developments of the
Augmented Reality for measurement applications. Measurement, 57, 53-70. DOI:10.1016/j.measurement.2014.07.009
Dong, S. and Kamat, V. R. (2013). SMART: scalable and modular augmented reality template for rapid development of engineering visualization 81 applications. Visualization in Engineering, 1(1), 1.
Donsbach, W. (2006). The identity of communication research. Journal of Communication, 56(3), 437-448. DOI:10.1111/j.1460-2466.2006.00294.x
Golparvar-Fard, M., Peña-Mora, F. and Savarese, S. (2009). D4AR–a 4-dimensional augmented reality model for automating construction progress monitoring data collection, processing and communication. Journal of information technology in construction, 14(13), 129-153.
IndexARSolutions. (2018). AUGMENTED REALITY FOR CONSTRUCTION. Retrieved from Indexarsolutions.com Jiao, Y., Zhang, S., Li, Y., Wang, Y. and Yang, B. (2013). Towards cloud augmented reality for construction application
by BIM and SNS integration. Automation in construction, 33, 37-47. Kalkofen, D., Sandor, C., White, S. and Schmalstieg, D. (2011). Visualization techniques for augmented reality.
Handbook of Augmented Reality, 65-98. DOI:10.1007/978-1-4614-0064-6_3 Kandlousi, N. S. A. E., Ali, A. J., and Abdollahi, A. (2010). Organizational citizenship behaviour in concern of
communication satisfaction: The role of formal and informal communication. International Journal of Business and Management, 5(10)
Kensek, K., Noble, D., Schiler, M. and Tripathi, A. (2000). Augmented Reality: An application for architecture. In Computing in Civil and Building Engineering (2000) (pp. 294-301).
Keyton, J. (2011). Communication and organizational culture: A key to understanding work experiences. Sage. Lambropoulos, S. (2013). Objective construction contract award using cost, time and durability utility. Procedia-
Social and Behavioral Sciences, 74, 123-133. DOI:10.1016/j.sbspro.2013.03.052 Li, X., Yi, W., Chi, H. L., Wang, X. and Chan, A. P. (2018). A critical review of virtual and augmented reality (VR/AR)
applications in construction safety. Automation in Construction, 86, 150-162.

1114
Akila Rathnasinghe, Lesaja Weerasinghe, Mahesh Abeynayake and Udayangani Kulatunga
Lunenburg, F. C. (2010b). Formal communication channels: upward, downward, horizontal, and external. Focus on Colleges, Universities, and Schools, 4(1), 1-7.
Mekni, M. and Lemieux, A. (2014). Augmented reality: Applications, challenges and future trends. Applied Computational Science, 205-214.
Oppong, A. A. A. and Birikorang, A. E. (2014). Communication in the Workplace: Guidelines for improving effectiveness. Global Journal of Commerce & Management Perspective, 208-213.
Priyadharshini, N. and Kumar, S. S. (2015). Project communication: is key to productive construction and it's research needs in the future of construction engineering and management. International Journal of Science, Technology & Management, 4(1), 1493-1499
Rajhans, K. (2013). Role of Communication in the Large-scale Construction Projects in India. Retrieved from http://vslir.iimahd.ernet.in:8080/xmlui/bitstream/
Rankohi, S. and Waugh, L. (2013). Review and analysis of augmented reality literature for the construction industry. Visualization in Engineering, 1(1), 9. doi:10.1186/2213-7459-1-9
Smith, S., Lead, V. and Bechtel. (2016). Will Augmented Reality in construction deliver on its promise? Retrieved from Institution of Civil Engineers
Sørensen, S. S. (2013). The development of augmented reality as a tool in architectural and urban design. NA, 19(4). Retrieved from http://arkitekturforskning.net/na/article/download/131/102
Turkalj, Z. and Fosic, I. (2009). Interdisciplinary Management Research. Organizational Communication as an Important Factor of Organizational Behaviour, 33-42.
Vakoms. (2017). The Biggest Challenges for AR. Retrieved from Up-work: https://www.upwork.com/hiring/for- clients/biggest-challenges-augmented-reality/
Valitherm, A. and Rahman, A. (2014). Communication barrier in Malaysia construction sites. International Journal of Education and Research, 2(1), 1-10.
Vasanthi, R. and Abubakar, A. (2011). The Needs for Standardization of Document towards Efficient Communication in the Construction Industry. World Applied Sciences Journal, 13(9), 1988-1995.
Wang, C., Cho, Y. K. and Gai, M. (2012). As-is 3D thermal modelling for existing building envelopes using a hybrid LIDAR system. Journal of Computing in Civil Engineering, 27(6), 645-656.
Wang, J., Suenaga, H., Hoshi, K., Yang, L., Kobayashi, E., Sakuma, I. and Liao, H. (2014). Augmented reality navigation with automatic marker-free image registration using 3-D image overlay for dental surgery. IEEE transactions on biomedical engineering, 61(4), 1295-1304.
Wang, X. (2009). Augmented reality in architecture and design: potentials and challenges for application. International Journal of Architectural Computing, 7(2), 309-326.
Yuen, S. C., Yaoyuneyong, G., & Johnson, E. (2011). Augmented reality: an overview and five directions for AR in education. Journal of Educational Technology Development and Exchange, 4(1), 119-140.
Zhou F., Duh, H. B. and Billinghurst, M. (2008). Trends in augmented reality tracking, interaction and display: A review of ten years of ISMAR. 2008 7th IEEE/ACM International Symposium on Mixed and Augmented Reality, 193-202.
Zubizarreta, M., Cuadrado, J., Iradi, J., Garc´ıa, H. and Orbe, A. (2016). Innovation evaluation model for macro- construction sector companies: a study in Spain. Evaluation and Program Planning, 2-5. doi:doi.org/10.1016/j.evalprogplan.2016.10.014

1115
The 54th International Conference of the Architectural Science Association (ANZAScA) 2020
The global sand shortage: study of the role of glass in contemporary New Zealand residential architecture
Lauren Hayes1, Emina Kristina Petrović2 1, 2 Victoria University of Wellington, Wellington, New Zealand
{lauren.hayes1, emina.petrovic2}@vuw.ac.nz
Abstract: Sand and aggregate are the world’s second-most extracted resource behind only water and more than 75% of dredged-up sand is used in construction as the key component of glass and concrete, often causing major damage to ecosystems and coastlines. Sand extraction is rapidly increasing worldwide, while the recognition that worldwide supplies are finite is still limited. Sustainable natural resource use has been acknowledged by the United Nations as a pivotal factor to improving economic prosperity and human wellbeing globally. Meanwhile, New Zealand architecture is increasingly reliant on glass as a key conveyor of the landscape, freedom and command of space. This presents a major contradiction between sustainable natural resource use and themes in idealised residential architecture. This paper hypothesises that the construction industry must find alternatives to glass as a heroed material in architecture. It will investigate opportunities of designing with less glass through residential design, analysing existing buildings’ sand usage and determining limitations for a framework for designing with less glass. The paper aims to raise awareness of the discrepancies between sustainable resource use and current themes in New Zealand architecture. The acknowledgement of these issues must be accelerated in the architecture community in order to prepare for the imminent crises of the sand shortage and its architectural implications.
Keywords: Glass; sand shortage; sustainable construction; New Zealand housing.
1. IntroductionThe notion of the global sand shortage is acknowledged by comparatively few when it comes to
sustainable futures in the construction industry (UNEP, 2019). Sand is second only to water as the world’s most sought-after natural resource and it is extracted more than fossil fuels and biomass combined (Peduzzi, 2014; Beiser, 2018). The extraction of sand is causing major destruction of ecosystems, coastlines, and habitats worldwide, drying up lakes and riverbeds, and causing islands to vanish beneath the waves (Delestrac, 2013; Padmalal and Maya, 2014; UNEP, 2019). This problem falls significantly on the shoulders of architecture because more than three-quarters of dredged up sand is locked away in construction and infrastructure as a key component of glass and concrete (Torres et al., 2017; Beiser, 2018). Yet New Zealand contemporary housing is increasingly reliant on glass as the conveyor of our most valued possession: the landscape. This paper contributes to the development of much needed scholarship
Imaginable Futures: Design Thinking, and the Scientific Method. 54th International Conference of the Architectural Science Association 2020, Ali Ghaffarianhoseini, et al (eds), pp. 1115–1124. © 2020 and published by the Architectural Science Association (ANZAScA).

1116
Lauren Hayes, Emina Kristina Petrović
which addresses and problematises the issues associated with the fact with that in the near future, the construction industry will have to find alternatives to using glass as a heroed material in architecture.
The vast majority of existing research on material flow data globally, let alone in New Zealand, tends to be limited to fossil fuels, metals and biomass. Existing research on the sand shortage and its relationship to architecture tends to focus solely on alternatives to concrete (Değirmenci and Yilmaz, 2011; Padmalal and Maya, 2014; Munda et al., 2016; Peduzzi, 2020), while glass is a more difficult issue to resolve. With polymers as the only alternative to glass and the increase in recognition of health issues associated with these (Petrović, 2017), there are no sustainable commercial product alternatives to glass in the marketplace. Furthermore, global sand consumption is currently not adequately quantified due to extraction as an open-pool resource. Few nations set limitations on sand dredging and when regulated, sand dredging becomes subject to illegal trade and extraction (Rege, 2016; Roos, 2017). The problem is that regulations tend to have been set in countries where sand suitable for construction is already limited, so any additional extraction is a real issue (Torres, 2017; Tweedie, 2018). Examples of this include the Singapore Government illegally importing sand from Cambodia for reclaimed land purposes, and Dubai importing sand for construction from Australia due to its own sea floor being already depleted (Global Witness, 2010; Delestrac, 2013). Research relating to the studies of sand consumption globally must be accelerated in order to generate more accurate data and reliable sources. This will allow for the use of standard theories and tools in future studies of sand extraction and its relationship to the construction industry. This paper aims to raise awareness of this fact and act as basis for future studies.
Standard tools and research that exists within the disciplines of quantifying other natural resources, such as water, metals, fossil fuels and biomass, do not exist for assessing the use of sand in construction. Because of this, quantifying sand usage in buildings is not a priority for designers or construction industry professionals. This paper reports on original development of one tool which can help in this area and generally hopes to raise awareness of the topic as a starting point for future studies.
In order to evaluate and establish the extent of the problem in New Zealand, this paper presents results of a study of selected case studies residential buildings in New Zealand. The focus is on evaluating the silica sand (commonly used for the manufacture of glass) content of each example in order to determine and quantify the reliance on glass, and start setting parameters for designing for a future with less glass. These results can be used by others as a tool for evaluating the extent of use of glass and send. Most importantly, the research aims to raise awareness of the discrepancies and contradictions between using glass sustainably and current themes in New Zealand residential architecture, which tends to rely on windows as a key conveyor of the view.
2. Background
2.1. The material crisis
Over the last century, industrialisation and urbanisation have had enormous environmental impacts, including the exploitations and abolitions of the earth’s natural resource deposits. This is due to associated environmental costs such as climate change, biodiversity loss, desertification and ecological degradation (Behrens et al., 2007). In 2015, the United Nations unveiled a set of seventeen Sustainable Development Goals, designed to provide a “better and more sustainable future for all” (United Nations, 2015). These goals recognise that sustainable natural resource use is a pivotal factor to improving economic prosperity and human wellbeing in order to achieve overall objectives. These objectives not only recognise the need for improved human wellbeing and equality, but raise awareness to the science that proves an improved

1117
The global sand shortage: study of the role of glass in contemporary New Zealand residential architecture
environmental ecological situation will benefit the planet as a whole (UNEP, 2016). Bárcena and Potočnik (2016) stated in the UNEP report Global Material Flows and Resource Productivity that
“It has been widely acknowledged that such a world can only be achieved if we take better care of, conserve and use natural resources and significantly improve resource efficiency in both consumption and production in the years to come”.
This shift in the belief that sustainability is becoming a focal point of global development has been reflected in new architecture since the turn of the century (Narvydas, 2014).
Exponential increases in industrialisation and urbanisation as a result of evolving social, economic and technological needs over the past fifty years in particular have had an everlasting impact on our planet’s changing environment. This has drawn global attention to the issues of climate change, resource depletion and accumulating waste. While population growth has contributed to the rising demand for materials, more significantly has the global expansion of the middle class. Millions of civilians lifted out of poverty over the past fifty years has resulted in new consumers requiring products and services with a higher material intensity, causing the global economy to need significantly more materials per unit of GDP (Schandl et al., 2018). Consequently, this contributes to growing environmental pressure with “detrimental effects for the ability to mitigate major environmental impacts and stay within planetary boundaries” (Schandl et al., 2018). This demonstrates that a decrease in population is not the key to solving natural resource exploitation and depletion issues. Manufacture and construction methods must be altered to rely on fewer mineral resources (Beiser, 2017; Mikadze, 2018).
These exponentially increasing changes in society has seen an extraordinary expansion in the extraction of natural resources. Schandl et al., (2018) collaborated various studies evaluating the global demand for materials, finding that between 1970 and 2019 material resource extraction more than tripled, increasing from 22 billion tonnes to 70 billion tonnes (Figure 1). The largest increase proportionally was non-metallic minerals. Furthermore, Kraussmann et al. (2014) evaluated that the global of natural resources used in buildings and infrastructure increased by 23 times between 1900 and 2010. This increase came at a time when global economic and population growth have been slowing, and is strongly related to the industrialisation and urbanisation of emerging economies, such as China and other Asia and Pacific nations, requiring “unprecedented amounts of iron, steel, cement, energy and construction materials” (Schandl et al., 2018). China used more cement in three years than the United States did last century (Smil, 2014; Owen, 2017). However, the more densely populated regions of Europe, Asia and the Pacific have been failing to meet demand for their extraction of natural resources, thus relying on large imports from other regions. Furthermore, Schandl (2018) discovered that 30 billion tonnes of extracted material were required to produce 10 billion tonnes of directly traded goods. Expressly this means two thirds of extracted material for trade becomes accumulated waste, and exemplifies the need for locally sourced materials, particularly for isolated countries such as New Zealand where overseas trade incurs significant carbon footprints. Moreover, New Zealand’s position as a country with a very high development index (HDI) suggests that the nation’s materials footprint per capita is more than double that of the world average (Figure 2). (United Nations Environment Program, 2016; Schandl et al., 2018).

1118
Lauren Hayes, Emina Kristina Petrović
Figure 1: Global material resource extraction 1970-2010 (Source: Schandl et al., 2018)
2.2. Sand Shortage Issues
Figure 2: Material footprint per capita, by HDI level (Source: Schandl et al., 2018)
The fight for natural resources has been a pivotal debate among scientists, politicians and media for thirty years as the global climate crisis reaches a pinnacle. As we watch sea levels rising, glaciers melting, and forests burning, the scarcity of sand is acknowledged by comparatively few. What is not known by many is that sand is a prevalent material in electronics, cosmetics, infrastructure, glass, concrete, and paper, but its extraction process has disastrous effects on many aspects of the natural environment (Delestrac, 2013; Torres et al., 2017; UNEP, 2019). Peduzzi (2020) estimates about 18kg of sand is used per person per day on the planet (UNEP, 2019). The sand shortage has the potential to be one of the greatest crises of the current generation, however scarce media attention has deemed it uncharted to many. This paper contributes to rising awareness of the issues associated with the limited availability of sand through the original development of tools that can be used in future studies for quantifying sand usage in buildings.
Despite the limited availability of sand and the fact that it accounts for the largest share of extracted materials annually, it is an open pool resource (Torres et al., 2017). Further to that, the absence of global data on its extraction makes environmental assessment very difficult because its access can only be extracted at a high cost (Peduzzi, 2014; Rege, 2016; Torres et al., 2017). This is especially relevant within the realm of architecture, whom the sand crisis will affect most due to sand being a key component of glass and concrete, however research on the topic within the discipline is almost non-existent.
The main driver behind the global sand shortage and its relationship to the construction industry is that desert sand, which is abundant and covers more than a third of the earth’s landmass, is unsuitable for glass and concrete production due to its roundness – caused by harsh winds that plague desert environments (Error! Reference source not found.3). Sand extracted from beaches and riverbeds is much rougher and stronger (Welland, 2009; Owen, 2017). The extraction of this sand is the process that destroys ecosystems, habitats and coastal communities worldwide as a result of erosion, physical disturbance of habitats and suspended sediments (Krause et al., 2010). Its transport contributes to the effects of climate change by producing carbon dioxide, and reduces natural protection against extreme weather events such as floods, storms and droughts (Peduzzi, 2014).
Peduzzi (2014) suggests that reducing consumption of sand is necessary by “optimising the use of existing buildings and infrastructure” and that “recycling glass bottles would also reduce sand consumption”. However, as Schandl et al. (2018) demonstrated, global demand for buildings and

1119
The global sand shortage: study of the role of glass in contemporary New Zealand residential architecture
infrastructure, and therefore sand, is increasing exponentially. The process of simply recycling glass bottles will not meet global consumption requirements, and its manufacture process continually contributes to the production of greenhouse gases. Peduzzi acknowledges that there is a knowledge gap on the effect of the sand crisis on the construction industry, one that can be reduced through the training of architects and engineers, new laws and regulations, and positive incentives (2014).
2.3. The role of glass
Sand is a key component of both concrete and glass, two of the world’s most dependable construction materials, but as previously identified there is a knowledge gap on the effect of the sand shortage on the glass industry. This creates a lack of recognition of the architectural implications of designing with less glass, particularly for New Zealand where designers are becoming increasingly reliant on glass as a key conveyor of the landscape, freedom and command of space.
In New Zealand, sand and crushed aggregate for construction accounted for 26.1% of the country’s total domestic material extraction in 2017 (Lutter et al., 2020). Annual mineral industry statistics provided by the Petroleum & Minerals department at New Zealand’s Ministry of Business, Innovation & Employment shows that silica sand mining in New Zealand is variable, but is trending downwards over the past fifty years. It can therefore be assumed that demand for glass in New Zealand is increasingly reliant on overseas imports, the production of which contributes to the growing global sand demand issues as well as increasing carbon emissions from its transportation. This demonstrates a need for decreasing the reliance the New Zealand architecture industry has on glass.
Thus, a contradiction is presented between sustainable natural resource use and trends in New Zealand architecture. This paper aims to formalize these findings through a report on three types of residential dwellings in New Zealand in order to identify a framework for designing architecturally ‘successful’ dwellings with less glass.
2.4. Cultures of glass in architectural history
Humanity’s relationship with glass is ever-evolving, shaped by technological and societal changes over time. The majority of architectural thinking surrounding the use of glass is derived from humans’ relationship with nature, and the need for protection from natural forces and elements (Elkadi, 2006).
The connection glass provides with nature has been debated by philosophers and designers for centuries. The Arcadian approach values architecture that follows natural laws and the unaltered characteristics of natural materials. Elkadi (2006) argues that architects who promote this approach cannot extensively utilise glass because it is an unnatural, manmade material. In contrast, the Enlightenment period in Europe of the 18th century suggested clear glass was necessary to “enhance the beauty” of other elements (Elkadi, 2006). Ruskin and Viollet-le-Duc were at opposing ends of this spectrum. Ruskin rejected glass; he considered glass to be unnatural and harmful due to the large amounts of energy needed to produce it. Meanwhile Viollet-le-Duc believed iron and glass were the materials of the future; ones which would turn architecture into a more efficient and modern discipline (Elkadi, 2006).
The industrial revolution revealed further changing attitudes towards glass in architecture. This period saw the invention of the first large flat sheets of clear glass, providing architects with the power to challenge and manipulate environmental forces. The need for the façade to provide protection from exterior elements no longer interfered with the need to transmit light deep into the building’s interior or

1120
Lauren Hayes, Emina Kristina Petrović
to open up the envelope to views to the outside. In the twentieth century, the façade’s role shifted from being a shield of natural forces to being a manipulator of them. In 1914, Paul Scheerbart said
“We live for the most part in closed rooms. These form the environment from which our culture grows. Our culture is to a certain extent the product of our architecture. If we want our culture to rise to a higher level, we are obliged, for better or for worse, to change our architecture. And this only becomes possible if we take away the closed character from the rooms in which we live. We can only do that by introducing glass to architecture”. (Scheerbart, 2014).
Scheerbert’s quote depict a modernist’s view of the role of glass in architecture and anticipates the large, curtain-walled buildings of the mid 20th century. Today, windows are still used in western architecture to frame the natural beauty and capture the view, a role which has not changed for over five hundred years (Elkadi, 2006).
3. Case study analysis
3.1. Case study analysis methodology
The sand usage of the case studies was calculated based on the volume of glass each building contained. This data was measured from the construction drawings of each project using digital scaling tools, and was based on a standardised 4mm glass thickness. The glass weight was calculated by multiplying the volume by 2500, as one cubic metre of glass is 2500kg. The sand content in kilograms of glass in New Zealand is around 75%, thus to find the total silica sand content of the glass, the weight was multiplied by 0.75 (Hollingsworth, 2016). The sand weight was then multiplied by a factor of 1.53 to find its volume in cubic metres. As the selected case studies were of varying floor areas, the total sand volume for each building is represented in cubic metres per square metre to give a comparable value across the data set. This methodology was developed as a way of estimating the comparable ratios of sand quantities in buildings, in the hope that future studies will allow for more standardised tools and theories surrounding the topic can be developed to provide better insight into the extent of sand crisis issues in various contexts.
3.2. Case study selection
Despite the desirability of reducing the use of glass in architecture, in recent years importance of the view continues to be major design driver in architectural residential dwellings in New Zealand. Meanwhile one existing limitation is that there is a limited popular understanding of how much sand is used for glass in normal situations. In order to quantify the issue, an analysis was undertaken of three types of dwellings in New Zealand: architectural award-winning homes, passive houses and standard specification design- and-build houses.
Eight case study award-winning residential buildings (category A), six passive houses (category B) and six standard specification houses (category C) were selected for sand content analysis (Table 1 and Figure 5). Each of the award-winning case studies were selected for its relationship to the environment as a design driver, and its success at capturing the view through openings. The second criteria for selection in Category A was the building’s success in the New Zealand architecture market through awards such as the NZIA New Zealand/Local Architecture Awards or HOME Magazine’s Home of the Year competition. Case studies were selected from opposing geographical regions of the country (Otago versus Northland,

1121
The global sand shortage: study of the role of glass in contemporary New Zealand residential architecture
A: A
war
d w
inni
ng a
rchi
tect
ural
Auckland, & upper Waikato) because this allowed for the greatest exploration of climatic factors alongside capturing the view. The two regions allowed for an architectural comparison between two of New Zealand’s most contrasting climatic conditions. Buildings of different scales and from a variety of architecture firms were selected to assess disparate outcomes of design techniques for conveying the surrounding environment.
3.3. Results
The following tables quantify the glazing areas and silica sand content measured from each case study. The glass content of each case study was evaluated as a percentage of the floor area. EveryAll case studies was double glazed except for passive houses, which were triple glazed (the factor of which is accounted for in the total glazed area).
Table 1: Calculated silica sand contents and glazing area of selected case studies
Project Location Designer Awards Floor area (m2)
Sand content (kg/m2)
Glazed area (m2)
Glazed area (% floor
area) Timms Bach Great Barrier Herbst 2011 AAA 185 1711.5 32.3 17.5% K Valley Coromandel Herbst HOTY 2016 178 2824.4 51.3 28.8% St Marks Lane Queenstown Dorrington
Atcheson 2019 SAA (Shortlist)
282 2951.4 84.9 30.1%
Mountain Retreat
Closeburn Fearon Hay 2009 NZAA, 2008 WAA
100 3107.4 31.7 31.7%
Closeburn Station
Closeburn Warren & Mahoney
2015 SAA 458 4207.2 196.5 42.9%
Black Peak Wanaka Eliska Lewis 2019 SAA 337 4896.3 168.3 49.9% Alpine Terrace Arrowtown Fearon Hay 2019 SAA 347 5040.9 178.4 51.4% Lindis Lodge Lindis Valley Architecture
Workshop 2019 NZAA, 2019 WAA
670 6472.5 442.3 66.0%
St Clair Dunedin Architype 236 2514.3 40.4 17.1% Taupiri Waikato eHaus 252 3004.8 51.5 20.4% Te Miro Waikato eHaus 322 3276.3 71.7 22.3% Kowhai Dunedin Rafe Maclean 2019 NZAA 117 3107.4 28.3 24.2% George St Wanaka Rafe Maclean 2113964.4 56.9 27.0% Öko Barn Auckland Öko Konstrukt 288 Standard specification design & build homes, designed for multiple locations
Fletchers 161 2796.4 45.9 28.5% Landmark 265 2341.0 63.2 23.8% Jennian 211 1758.4 37.9 17.9% Stonewood 244 3122.4 77.7 31.8% Signature 163 2365.5 39.4 24.1% David Reid 146 4043.6 60.2 41.3%
AAA = NZIA Auckland Architecture Awards HOTY = Home Magazine Home of the Year
Competition
• SAA = NZIA Southern Architecture Awards• NZAA = NZIA New Zealand Architecture Awards• WAA = World Architecture Festival Awards
C: S
tand
ard
B: P
assiv
e

1122
Lauren Hayes, Emina Kristina Petrović
Figure 3: Glazing area as a percentage of floor area in selected case studies (Source: Author’s graph)
4. Discussion
4.1. Architectural success versus glazing proportions
The undertaken study explores an area with limited knowledge. While it is possible to assert that further analysis and broader sampling is needed to refine and confirm the findings presented here, the reported data start to indicate trends which grant further exploration. This makes the study preliminary and explorative in nature, and necessary to foster more research in the area. Results show that award-winning houses tended to have higher glazing percentages than both passive houses and standard specification houses. The extent of glazing evident in many analysed award-winning houses finds that architectural success in New Zealand homes tends to be represented by projects with large windows that use the landscape as a design driver. Meanwhile, passive houses and standard specification houses tended to have lower glazing per m2 floor area. However, there were some instances of architectural success being apparent in houses whilst maintaining lower glazing ratios, as seen in both Timms Bach by Herbst and Rafe Maclean’s passive house, as well as the K Valley House by Herbst which received the Home of the Year award in 2016. These homes all had glazing ratios of less than 30% of the floor area, and Timms Bach demonstrated that architectural success could be achieved with a glazing ratio of just 17.5%. This shows that while these homes are deemed architecturally successful, it is possible to have both captivating architecture that conveys the view and a low glazing ratio.
4.2. Glazing ratios of passive houses in comparison to net energy usage
Passive houses tended to have lower glazing to floor area percentages, and had more consistent values per square metre. Passive houses also consistently achieved lower results despite having triple glazing as opposed to double glazing. This demonstrates that not only is it possible to have lower glazing ratios, but that perhaps an optimal specific range of glazing ratios contributes to a building’s sustainable success in

1123
The global sand shortage: study of the role of glass in contemporary New Zealand residential architecture
terms of its net energy usage – a factor that is often overlooked when evaluating architectural success through the marketing of award-winning New Zealand homes.
4.3. Geographical advantages
Results showed that Category A dwellings in the Northern regions of New Zealand tended to have lower glazing ratios than their Southern counterparts. This is perhaps to be expected due to the higher average temperatures of the Northern regions, thus requiring less glazing to prevent overheating. This therefore presents a greater challenge for designers in Southern regions when designing with less glass.
4.4. Development of standardised tools for designers
The study found largely varied glass to floor area ratios, ranging from 17.1% to 66%, with a median of 27.9%. Passive houses tended to have lower and more consistent glazed area ratios, indicating an optimal value range for reducing net energy usage while achieving architectural success. One case study showed that award-winning architecture can be achieved whilst maintaining a very low glass to floor area ratio. It can therefore be recommended to designers aspiring to design for a future with less glass that a limitation of a maximum 20% of the floor area should be equivalent to the total glazed area of the building.
5. ConclusionThis paper brings to consideration the importance of considering sand as a limited resource for
architectural construction. It brings the knowledge already evident in other disciplines to an architectural audience, and by doing so highlights the importance of the sand shortage as an architectural problem. The original and in many ways preliminary study of a range of houses shows some clear patterns that houses with higher emphasis on the view also use more glass. What is relevant to note is that the same houses are currently still receiving architectural recognition and celebration without a recognition of the adverse impacts of the extensive use of glass in these houses. In the future of architecture, this position will need to change, and it is exciting that some examples already use less glass and receive architectural recognition. Finally, the work sets a clear and measurable target for the reductions in use of glass in residential architecture, which can assist anybody interested to adjust their practices to more easily achieve the needed change. The research brings to light the need for more standardized tools for quantifying the use of non-metallic minerals in buildings in order for ecosystem impacts of using sand in the construction industry to be more accurately evaluated.
References Behrens, A., Giljum, S., Kovanda, J., & Niza, S. (2007). The material basis of the global economy: Worldwide patterns
of natural resource extraction and their implications for sustainable resource use policies. Ecological Economies, 64(2), 444–453.
Beiser, V. (2017, February 27). Sand mining: The global environmental crisis you’ve probably never heard of. The Guardian. www.theguardian.com/cities/2017/feb/27/sand-mining-global-environmental-crisis-never-heard
Beiser, V. (2018). The World in a Grain: The Story of Sand & How It Transformed Civilisation. Penguin. Değirmenci, N., & Yilmaz, A. (2011). Effective Utilization of Waste Glass as Cementitious Powder and Construction
Sand in Mortar. Indian Journal of Engineering and Materials Science, 18(4), 303–308. Delestrac, D. (2013). Sand Wars [Documentary]. La Compagnie des Taxi-Brousse. https://www.cie-
taxibrousse.com/en/film/sand-wars-2/#play Elkadi, H. (2006). Cultures of Glass Architecture. Ashgate Publishing Ltd.

1124
Lauren Hayes, Emina Kristina Petrović
Global Witness. (2010). Shifting Sand: How Singapore’s demand for Cambodian sand threatens ecosystems and undermines good governance. Global Witness. www.globalwitness.org/en/archive/shifting-sand-how- singapores-demand-cambodian-sand-threatens-ecosystems-and-undermines-good/
Hollingsworth, J. (2016). Glass Weight Calculator – How to Calculate the Weight of Glass. Glass Domain. glassdomain.co.uk/blog/glass-weight-calculator/
Kharas, H. (2017). The Unprecedented Global Expansion of the Middle Class. Brookings Institution Global Economy and Development Program.
Krause, J. C., Diesing, M., & Arlt, G. (2010). The Physical and Biological Impact of Sand Extraction: A Case Study of the Western Baltic Sea. Journal of Coastal Research, SI(51), 215–226.
Krausmann, F., Wiedenhofer, D., Lauk, C., Haas, W., Tanikawa, H., Fishman, T., Miatto, A., Schandl, H., & Haberl, H. (2017). Global socioeconomic material stocks rise 23-fold over the 20th century and require half of annual resource use. Proceedings of the National Academy of Sciences of the United States of America, 114(8), 1880– 1885.
Lutter, S., Stafan, G., Gozet, B., Lieber, M., & Gutschlhofer, J. (2020). Domestic Extraction of a country by material groups. Vienna University of Economics and Business Institute for Ecological Economics. http://www.materialflows.net/visualisation-centre/
Mikadze, K. (2018). The global sand crisis and its link to urbanisation. Municipal World, 128(6), 41–42. Munda, S., Sindhi, P. R., Chandwani, V., Nagar, R., & Agrawal, V. (2016). Crushed rock sand: An economical and
ecological alternative to natural sand to optimize concrete mix. Perspectives in Science, 8, 345–347. Narvydas, A. (2014). Trends of Sustainable Residential Architecture. Rigas Tehniskas Universitates Zinatniskie Raksti,
9, 33. Owen, D. (2017, May 29). The world is running out of sand. The New Yorker. Padmalal, D., & Maya, K. (2014). Sand mining: Environmental impacts and selected case studies. Springer. Peduzzi, P. (2014). Sand, rarer than one thinks. Environmental Development, 11, 208–218. Peduzzi, P. (2020). Head in the sand. Land Journal, 10–11. Petrović, E. K. (2017). An overview of health hazards from materials: Application of principles. In Materials for a
healthy, ecological and sustainable built environment (pp. 203–236). Woodhead Publishing. Rege, A. (2016). Not biting the dust: Using a tripartite model of organized crime to examine India’s Sand Mafia.
International Journal of Comparative and Applied Criminal Justice, 40(2), 101–121. Roos, D. (2017, March 6). Sand is in such high demand, people are stealing tons of it. HowStuffWorks.Com.
https://science.howstuffworks.com/environmental/conservation/issues/sand-is-such-high-demand-people-are- stealing-tons-it.htm
Schandl, H., Fischer-Kowalski, M., West, J., Giljum, S., Dittrich, M., Eisenmenger, N., Geschke, A., Lieber, M., Wieland, H., Schaffartzik, A., Krausmann, F., Gierlinger, S., Hosking, K., Lenzen, M., Tanikawa, H., Miatto, A., & Fishman, T. (2018). Global Material Flows and Resource Productivity: 40 Years of Evidence. Journal of Industrial Ecology, 22(4), 827–838.
Scheerbart, P. (2014). Glass! Love!! Perpetual motion!!! : A Paul Scheerbart reader. Christine Burgin. Smil, V. (2014). Making the Modern World: Materials & Dematerialisation. John Wiley & Sons Ltd. Torres, A., Brandt, J., Lear, K., & Liu, J. (2017). A looming tragedy of the sand commons. Science, 357(6355), 970–
971. Tweedie, N. (2018, July 1). Is the world running out of sand? The truth behind stolen beaches and dredged islands.
The Guardian. www.theguardian.com/global/2018/jul/01/riddle-of-the-sands-the-truth-behind-stolen-beaches- and-dredged-islands
UNEP. (2016). Global Material Flows and Resource Productivity: Assessment Report for the UNEP International Resource Panel. UNESCO.
UNEP. (2019). Sand and Sustainability: Finding new solutions for environmental governance of global sand resources. United Nations Environment Programme.
United Nations. (2015). About the Sustainable Development Goals. www.un.org/sustainabledevelopment/sustainable-development-goals/
Welland, M. (2009). Sand: The Never-Ending Story (1st ed.). University of California Press

1125
The 54th International Conference of the Architectural Science Association (ANZAScA) 2020
The influence of green design elements on the visibility of low- rise houses in hot and humid climate
Molood Seifi1, Aaldrin Abdullah2, Danielle M. Reynald3 1University College of Technology Sarawak, Sibu, Malaysia, [email protected]
2Universiti Sains Malaysia, Penang Island, Malaysia, [email protected] 3Griffith University, Brisbane, Australia, [email protected]
Abstract: To achieve thermal comfort in the hot and humid climatic condition of Malaysia, house design utilizes architectural and landscape elements such as sunscreens, specific orientation of openings, and vegetation to reduce the indoor temperature. However, the green elements might reduce the visibility of the house to the residents and their neighbours which results in residential burglaries. Thus, this study sought to investigate the impact of the designs of the green elements on the visibility of houses and levels of burglary. 114 houses with green elements were randomly selected from three residential neighbourhoods in Penang Island and were audited for burglary experience. Besides, an architectural observation method was used to measure the visibility of the houses. Structural equation method using Warp-PLS software was employed to analyse the collected data. The findings showed that vertical shading devices and the location of the windows on the rear facade of the house were among the design factors with a relatively higher negative impact on visibility. The study concludes that there is a non- linear, positive and significant relationship between green elements of the houses which provide visibility and the incidents of burglary in the study context.
Keywords: Green Elements, Visibility, Residential Burglary, low-rise houses.
1. IntroductionThe role of the building envelope as a mediator between indoor and outdoor space is to protect the occupants from the unpleasant climatic conditions. 88% of the solar radiation can be transmitted to the indoor space through the glass surface of the openings (Miller & Blac, 1932), which makes them the most significant component of the building envelope. The glass openings in buildings are responsible for up to 45% of total heat gains (Greynning et al., 2013). Hence, controlling the ingress of solar radiations through windows is a crucial part of the design for heat reduction in buildings. Apart from being a vital part of the thermal performance of a building, windows act as the eyes of the house that provides the residents with the view of their surrounding areas. Research suggests that that the proper placement of windows allows residents to monitor their immediate environment which evokes a sense of risk in the potential offenders and prevents them from committing the act of burglary (Jacobs, 1961; Montoya, 2016; Newman, 1972). Repetto (1974) and Armitage (2006) ascertained that burglars avoid houses with
Imaginable Futures: Design Thinking, and the Scientific Method. 54th International Conference of the Architectural Science Association 2020, Ali Ghaffarianhoseini, et al (eds), pp. 1125–1134. © 2020 and published by the Architectural Science Association (ANZAScA).

1126
Molood Seifi, Aaldrin Abdullah, Danielle M. Reynald
a high level of visibility to the neighbouring properties. Hence, provision of visibility through windows plays a major role in the offender’s selection of target and decision to burglarize it (Armitage, 2012).
Past studies have mostly focused on one or two green elements to determine the best thermal performance of the building. Computer simulations are used to predicted and examine the impact of design parameters, namely window-t-wall ratio (WWR), window orientation, and shading elements on heat reduction (Ma et al., 2015; Ochoa et al, 2012; Thalfeldt et al., 2013; Vanhoutteghem et al, 2015, Zhai et al., 2018). Some of the features of windows can facilitate visibility, while others might reduce it. For instance, Minnery and Lim (2005) posited that the overhead projections, sunshades or even the screens and trellises might obstruct the view of windows. For the fact that the impact of window parameters on visibility is not as frequently studied as their effect on thermal performance, the interaction between the green elements and visibility is less explored. According to Forughi et al. (2018), the selection of suitable parameters in window design is a challenging phase for designers due to the high number of variables involved. Thus, adding a new design parameter such as visibility will make the window design process even more challenging. Typically window design is a multi-parameter process, thus it is important to consider all the factors in the early stage of design to find the balance and the interaction between various variable to attain an optimized solution (Zhai et al, 2018). Seifi et al. (2019) mentioned that built environment professionals can moderate the conflicting physical elements to create secured living spaces through a systematic exploration of their impacts on design. Hence, this study sought to explore the influence of the green elements of windows on visibility and incidence of burglary.
2. Literature2.1 Green elements for heat mitigation
Since the primary mission of green buildings is to create energy-efficient and comfortable spaces, research has mainly focused on finding the optimum solution in the selection of windows parameters such as the size of shading devices, the orientation of windows and the glazing areas (Zhai et al., 2018). Solar shading devices attain indoor thermal comfort by regulating the sun entry to the buildings. The function of the windows shading devices is to moderate the entry of solar radiation into an indoors space (Foroughi et al., 2020). Ralegaonkar and Gupta (2010) found that the external static shading devices were efficient in restricting solar radiations before it enters the windows. Hence, having a well- designed shading device can control the amount of excessive solar radiation (Kim et al., 2012). A study by Atzeri et al. (2014) showed that the impact of shading devices largely depend on other design factors such as the size and orientation of the windows. In countries with a hot and humid climatic condition such as Malaysia, designing windows which control heat gain can save a considerable amount of energy. In addition to shading device design, an appropriate window to wall ratio plus the right window orientation can have a critical role in deciding the optimal window performance (Lee et al., 2013). Foroughi et al. (2020) and Tzempelikos and Athienitis (2010) studied the optimum glazing areas known as the window to wall ratio in combination with the properties of the shading device. It is evident from the review of literature that the window design for heat reduction involves a serious of interrelated design factors and amongst the most commonly deployed are WWR, horizontal and vertical shading devices, orientation and the use of nearby vegetation.

1127
The influence of green design elements on the visibility of low- rise houses in hot and humid climate
2.2 Visibility for burglary reduction
Openings of the house are the point of entry and escape of the burglars so, making them more visible to the residents and neighbours makes potential offenders feel that they are watched. Statistics show that most of the burglars are not shy to break through the main entrance (Armitage, book) or go through the windows. To burglars, openings of the house are the means of getting access to the target for committing the act of burglary. The stated reasons show that the visibility of the house has an impact on burglary reduction. Previous research has confirmed the positive and significant effect of visibility on burglary reduction (Brown & Altman, 1983; Crowe, 2000; Norman, 1974; Chang, 2009). Shu (2009) posited that proper inter-visibility is indeed an inherent quality of non-burglarized-houses. Contrarily, the burglarized house often had less visual contact with neighbours. According to Norman (1972), the design has the potential to facilitate visibility to the occupants and enable them to watch their house and their surroundings. Hence, the design of the openings has to provide a clear line of sight to the residents to make them look after their living spaces. Any elements installed or attached on windows need to be checked for visibility so, they do not obscure residents’ view of the outside and the neighbours from viewing the windows, this may even include the landscape feature which is placed near the openings (Minnery and Lim, 2005). (Figure 1) shows the conceptual model developed to examine the influence of the multiple design parameters on the visibility of the house. The ultimate goal of this study is to develop a validated model to examine the effect of the green elements on the visibility of the house and understand the relationship between the overall visibility and the incidence of burglary. The developed model consists of six green elements which form the visibility construct and then linked to the burglary construct.
Figure 1: Hypothesized model of study consisting of the green elements of windows
3. Methods3.1 Survey question and architectural observation
The present study was conducted in three residential neighbourhood in Penang Island. The study areas were located within the hotspots zones of residential burglary generated by Seifi et al. (2020). Penang Island’s houses have seen a transition of converting the traditional design to contemporary houses. However, the typical and most common low-rise houses in the Island are the double story semidetached

1128
Molood Seifi, Aaldrin Abdullah, Danielle M. Reynald
and terrace of the middle socioeconomic class. Hence, 150 houses were randomly selected for the survey and architectural observation study (50 from each neighbourhood). The contemporary, corner houses and the houses with drastically different size or design were avoided. A high response rate of 76% returned a total of 114 answered questionnaire from the households. The main question addressed the level of incidence of burglary by asking the residence a yes and no question of whether their house was burglarized in the past three years taken from Minnery and Lim (2005). Besides, asking them whether they have modified the design of their openings since the incidence. 26% of the houses in the context of the study had the experience of burglary or attempted burglary where nothing was stolen from the house. In addition to measuring the incidents of burglary, the questionnaire involved 12 questions about the green design features of the openings to find out the extent to which the visibility was obscured by these elements. Each question was then accompanied by an architectural observation. An example of the question and the scale of measurement for the window to wall ratio is given in (Table 1).
Table 1 Scale for measuring window to wall ratio or window size to facilitate visibility
Score 1 2 3 4 5
Ratios 0 25 50 75 100
Architectural observation
Absence of windows
Small windows Medium
windows
Large windows
very large windows
Respondents answer
Very limited visibility
Limited visibility
Average visibility
high visibility Very high view
3.2 Data analysis procedure
The present study needed a suitable multivariate analysis to test the effect of each green elements on visibility and simultaneously examine the impact of overall visibility on levels of burglary. Hence, the higher second generation of statistical analysis called as structural equation modelling (SEM) was a suitable method to understand the relationship between multiple variables (Hair et al., 2016). This study deployed partial least square (PLS) using Warp-PLS software to analyse the collected data. Kock (2011) posited that this software can test the hypothesis and establish an accurate relationship between the variables. Kock (2017) mentioned that non-linearity in the generated results of the method can give a more enounced interpretation of the data in hand. Hence, the present study used Warp-PLS to test the convergent validity of the visibility construct and establish a valid model which involves enough number of indicators. Subsequently, it relied on the results of indicators cross loading and weights and their p- value to understand the relationships between the variables in the model of the study.
4. Results and discussionIn this section, the results of structural equation modelling on the effect of each green design elements are presented and discussed. The results demonstrated that all the six green design factors of the windows had a significant contribution in facilitating visibility. Nearby vegetation has the highest contribution to the visibility design while vertical shading devices had the least contribution. The results show that vertical shading devices and the location of windows on the rear façade are the problematic feature of the windows which needs attention. (Table 2) shows the result of the assessment of each

1129
The influence of green design elements on the visibility of low- rise houses in hot and humid climate
green design element on visibility. In addition, (Figure 2) shows the average visibility score of each green elements of windows in burglarized houses and non-burglarized houses.
Table 2 Results of the assessment of measurement model for first order constructs
Green elements Indicators Indicators weights
p-values of indicator Indicators cross
loadings
p- valuesof cross
Figure 2 Visibility scores of green elements of windows in burglarized and non-burglarized houses
4.1 Window wall ratios-WWR (%)
The average WWR for the front windows in the burglarized-houses were 64%, whereas this value in the non-burglarized houses were 72%. Most of the non-burglarized-houses in the study areas had WWR of 80% whereas, most of the burglarized-houses had WWR of 50%. These rates were smaller for the rear and side facades. Besides, according to the results of surveys, the residents of the non-burglarized houses ascertained that the high WWR of the front and back windows of their houses provides almost a complete view of the house and the surrounding areas. On the other hand, the residents of the burglarized-houses mentioned that the front and back windows provide partial view of the immediate environment due to average WWR. Hence, the WWR of non-burglarized houses were larger and provided higher level of visibility as compared to burglarized houses.
Past research shows that small WWR in the building envelope is more effective for heat mitigation. A simulation study of windows in Southeast Asian countries with similar climatic conditions as Malaysia by Lee et al. (2013) found that the WWR of 25% on the south, west, and east face and WWR of 50% for the
weights loadingsWindow to wall ratio 0.32 0.006 0.65 <0.001 Horizontal shading device 0.36 <0.001 0.69 <0.001
Windows Design Vertical shading device 0.26 0.002 0.54 <0.001 Location on front façade 0.32 0.002 0.65 <0.001 Location on rear façade 0.28 0.006 0.58 <0.001 Nearby vegetation 0.39 <0.001 0.78 <0.001

1130
Molood Seifi, Aaldrin Abdullah, Danielle M. Reynald
northern façade appears to be effective in reducing heat gains and subsequently cooling energy consumption. Pearson (2006) and Lee et al. (2013) posited that higher level of WWR increases the cooling peak load so, it should be avoided to improve thermal comfort and reduce energy consumption. Hence, most of the northern-facing burglarized-houses comply with the 50% WWR that is suitable for reducing heat gain. The southern-facing burglarized houses and non-burglarized houses exceed the WWR rate of a green opening.
4.2 Shading Devices
The 'architectural observation' of the houses of the study area showed that the shading of the windows to reduce solar heat gain were provided by recessing the windows or through adding vertical and horizontal shading devices around the windows on the façade. The most common window type in the surveyed houses were flush casements with vertical and horizontal shading devices. The size of the vertical shading devices in the burglarized-houses was slightly larger than those in non-burglarized ones. Vertical shading devices and the recessed design in 32% of the windows of the burglarized-houses obstructed most of the view of the residents that gave them less than average inter-visibility (48%). This visibility rate was only slightly higher (54%) in the non-burglarized houses.
Figure 3 Problematic green features of windows obscuring visibility
The results of the survey analysis demonstrated that the residents of burglarized and non- burglarized-houses, both believe that the vertical elements and the recessed window design despite providing shades for the windows block their line of sight and leave them a limited view of their surrounding areas. On the other hand, the horizontal shading devices which were mostly on top of the windows, mostly did not obstruct the view of windows. Vertical shading devices were the most problematic green elements of windows which reduced the visibility of almost all the houses in the context of the study. (Figure 3) shows two houses with vertical shading elements blocking the view of neighbours and the obstruction caused by the outer screen and trees. The use of vertical shading devices on the southern facade in Penang Island houses could be inspired by the recommendations given by the local architects published in one of the most frequently referred green architecture guidelines known as the code for practice on energy efficiency, Green Building Index-MS1525 (Aun, 2009). The design recommendation claims that the vertical shadings devices are thermally effective on the south-facing windows. Another study in Malaysia shows that as the depth of the shading device increase the solar heat gain reduces (Al-Tamimi, 2012).” Ralegaonkar and Gupta (2010) posited that

1131
The influence of green design elements on the visibility of low- rise houses in hot and humid climate
sunshades are an essential part of a house design that protects the building components by restricting the sun. Hence, the use of shading devices in the context of the study seems practical for heat mitigation. However, what is not known is the use of vertical and horizontal interchangeably and the actual required length that does not compromise visibility.
4.3 Windows orientation
The results of architectural observation showed that in the houses that their façade faces north along with street axis, most of the windows were located on the northern face and in the houses which face the street with their southern façade, most of their windows were located on the southern face. For all the surveyed houses, more than 50% of the windows were on the street-facing façade. Mostly 25% on the rear façade of the houses, with very few windows on the west or east side. Even though, the positioning of the windows seemed to contribute to the building performance by reducing the heat gain through windows, but the blind walls (the walls with no windows) limits the visibility of houses. Besides, the below-average score of burgled houses on the design criteria “position on the rear façade” proves that the location of the windows on this façade is not appropriate. On average, the location of the front windows in burglarized-houses could facilitate 64% visibility. Residents of the burglarized houses mentioned that they could only partially view their surrounding areas through front windows. Whereas, the well-located windows in non-burglarized houses provided an average of 80% visibility and their residents expressed that they almost had full visibility. After the poorly designed vertical shading devices, the location of the windows on the rear façades of the houses were the second most problematic criteria that cased visibility as low as 56% in burglarized-houses. The residents of these houses believed that their view is just average due to incorrect placement of the windows. On the other hand, the residents of the non-burglarized houses had above-average visibility of 74% through rear windows.
Majority of the previous research recommend the north-orientation for the houses located in Malaysia (Al-Tamimi, 2011). According to Lee et al. (2013), the northern face that admits less solar radiation seems to be an efficient location for windows that are the main source of heat gain in buildings. South, west, and east should be respectively the second, third and fourth options for heat mitigation. In the context of the study, the houses which have their rear façade to the north can go for more number of windows or higher WWR. Whereas, the rear windows in the south-facing blocks were as small and limited in number as the northern facing blocks which lead to a low level of visibility. Even though, the orientation design factor of windows does not go against the visibility provision of the windows, but design for visibility was not considered while designing the rear windows of the burglarized-houses.
4.4 Nearby vegetations
The results of the analysis showed that on an average 86% of the windows of non-burglarized-houses were not obstructed by any vegetation. The residents of non-burglarized-houses expressed that surrounding trees covers a small portion of the windows of their houses. Similarly, the residents of burglarized-houses believed that the vegetation does not block most of the windows. The average visibility of burglarized-houses was 73% which was less than 86% in the non-burglarized-houses. Hence, the vegetation of the houses did not seem to reduce the levels of visibility of the houses in the study context to a great extent. It was observed that not many trees existed in the courtyard of the houses

1132
Molood Seifi, Aaldrin Abdullah, Danielle M. Reynald
and the green structures such as Trellises with vegetation which resembled bio façade obstructed a small portion of the windows.
However, Ching and Shapiro (2014) posited that vegetation, despite protecting the building from heat can adversely contribute to humidity. This phenomenon is not very pleasing in a hot and humid context such as Malaysia. Hence, the residents have their landscape away from the main block of their house in bigger plots or avoid having them in smaller ones. Even though deciduous trees are known for providing more shades and they produce cooling up to 50% (Parker, 1983), but trees with less leaf or even leafless trees are still effective in reducing radiations on the building façade from 10% to 40% (depending on the type and size of the trees) (Olgyay, 1963; Heisler, 1986). The landscape of the house used to define the territory of the house can sometimes block the visibility of the neighbours (Seifi, et al., 2019). The landscape needs to be well maintained to contribute to the visibility of the houses. In the context of the study above 73% visibility through vegetation is required for the house to reduce burglary.
4.4 Influence of visibility on incidence of burglary
The findings show that there is a positive and significant relationship between visibility and the reduction of incidence of burglary as shown in (Figure 4). The value of 0.23 for R2 in statistics is considered as weak (Chin, 1998). However, in different fields, the interpretation may vary. In the current study, this value means that the green elements of the windows influenced facilitating visibility and any amount of enhancement in visibility increases the chance of burglary prevention or reduction. In (Figure 5) the green parameters, namely window to wall ratio, Horizontal shading devices, vertical shadingdevices, location of front windows, location of rear windows, and nearby vegetation are mentioned inabbreviation form which are respectively WWR, HSD, VSD, LFF, LRF, and NV.
5. Conclusion
Figure 4 Relationship between visibility and incidence of burglary
Understanding the relationship between windows design factors, thermal reduction and visibility is not a straightforward process. The effect of each green design factor on thermal reduction and visibility level depends on other design factors. Even though the difference in the visibility score of each green design element in a burglarized-house versus a non-burglarized-house seems small, but the sum of their influence has a significant impact on the overall visibility which ultimately increases or reduces the incidents of burglary. The findings of this study have made it obvious that the vertical shading devices of any size need to be avoided in design of openings for visibility. Moreover, there is no doubt that the high

1133
The influence of green design elements on the visibility of low- rise houses in hot and humid climate
WWR which are suitable for visibility facilitation comes on the way of designing for heat reduction. In other words, reducing the WWR to 50% on the northern façade and 25% on the south, west, and east will definitely restricts visibility. Hence, architects need to find the most appropriate location for the limited WWR on the façade of the houses or protect the higher WWR with more projected horizontal shading devices at a suitable angle. The use of double layered coated glass and other technologies might allow architects to design higher WWR without compromising thermal comfort. Ignoring the provision of visibility that considers the line of sight of occupants at the early design stage is the main cause of designing windows that limit surveillability of the residents. The right positioning of the windows on the front and back façade of non-beglared houses provided the residents with the view to almost every areas in the immediate surrounding of their house which was missing in burglarized houses. If adding to the WWR on the rare façade (or the west/east façade) is going to adversely impact the thermal comfort of the occupants, the study recommends to utilize a higher number of small windows protected by sunshades and locate them strategically on the façade. For instance, placing a narrow window at the eye level of a desk at the study or the windows kitchen which are actively used by residents can provide inter-visibility at the right locations.
5.1 Influence of green elements on visibility and burglary and direction for future research
The findings of the study demonstrated that windows visibility design measured by multivariate green factors have a non-linear, positive and significant relationship with the reduction in the incidents of burglary. The interpretation of the overall visibility of the burglarized-houses showed that while the average visibility of these houses was 65% but most of them had 60% of visibility. Only five burglarized- houses had above-average visibility, many of them had visibility as low as 20% that made them extremely vulnerable. On the contrary, non-burglarized houses have an average visibility of 70%, most of them had it as high as 80%, and very few had low visibility of 40%. Interestingly, the evaluation of the influence of the green design factors and visibility factors simultaneously on the incidents of burglary shows that the visibility of more than 80% has no effect in reducing the incidents of burglary and it adversely affects the heat mitigation of the houses. So, the green design of the windows should aim at providing 70%-80% visibility in the context of the study to reduce the incidents of burglary. Figure 4 shows the nonlinear relationship between the green design factors of visibility and the incidents of burglary. Future studies should consider that currently, thermal performance and security do not have many interactions due to the specific expertise required by each field. Even though the prevention of crime through environmental planning is a well-established field, very few architects such as Altlas (2006) have studied and discussed crime prevention through architectural design. Hence, the role of the green architecture elements in crime prevention can be further explored in future studies. According to Persson (2006), the higher glass insulation can remove the limitations with regards to size and the place of windows. Thus, there is a potential to examine the type of glazing along with other variables of window parameters and visibility parameters. Besides, the window design in contemporary houses in Penang Island is necessary as this type of houses are replacing the old ones. Operable windows are a potential alternatives when it comes to combining a good climate responsive and visibility design.
References Al-Tamimi, N. A. M. (2011). Impact of building envelope modifications on the thermal performance of glazed high-
rise residential buildings in the tropics. Malaysia: University Science Malaysia.

1134
Molood Seifi, Aaldrin Abdullah, Danielle M. Reynald
Al-Tamimi, N. A., & Fadzil, S. F. S. (2011). The potential of shading devices for temperature reduction in high-rise residential buildings in the tropics. Procedia Engineering, 21, 273-282.
Armitage, R. (2006). Predicting and preventing: developing a risk assessment mechanism for residential housing. Crime Prevention and Community Safety, 8(3), 137-149.
Atzeri, A. M., Cappelletti, F., Gasparella, A., Shen, H., & Tzempelikos, A. (2014). Assessment of Long-Term Visual and Thermal Comfort and Energy Performance In Open-Space Offices With Different Shading Devices.
Aun, C. S. (2009, February). Green Building Index-MS1525: Applying MS1525: 2007 Code for Practice on energy efficiency and use of renewable energy for non-residential buildings. In GBI CPD Seminar (Vol. 2009, pp. 1-22).
Babaizadeh, H., Haghighi, N., Asadi, S., Broun, R., & Riley, D. (2015). Life cycle assessment of exterior window shadings in residential buildings in different climate zones. Building and Environment, 90, 168-177.
Cheung, C. K., Fuller, R. J., & Luther, M. B. (2005). Energy-efficient envelope design for high-rise apartments. Energy and buildings, 37(1), 37-48.
Chin, W. W. (1998). The partial least squares approach to structural equation modeling. Modern methods for business research, 295(2), 295-336.
De Luca, F., Voll, H., & Thalfeldt, M. (2016). Horizontal or vertical? Windows’ layout selection for shading devices optimization. Management of Environmental Quality: An International Journal.
Foroughi, R., Mostavi, E., & Asadi, S. (2018). Determining the optimum geometrical design parameters of windows in commercial buildings: Comparison between humid subtropical and humid continental climate zones in the United States. Journal of Architectural Engineering, 24(4), 04018026.
Foroughi, R., Asadi, S., & Khazaeli, S. (2020). New Approach in Designing a Kinetic Window Shading Using Optimization Methods. Journal of Architectural Engineering, 26(3), 04020023.
Hair Jr, J. F., Hult, G. T. M., Ringle, C., & Sarstedt, M. (2016). A primer on partial least squares structural equation modeling (PLS-SEM): Sage Publications.
Kim G., Lim H. S., Lim T. S., Shaefer L. et Kim T. J. 2012. Comparative advantage of an exterior shading device in thermal performance for residential buildings, Energy and buildings, vol. 46, p. 105-111.
Kock, N. (2011). Using WarpPLS in e-collaboration studies: An overview of five main analysis steps. Advancing Collaborative Knowledge Environments: New Trends in E-Collaboration: New Trends in E-Collaboration, 180.
Kock, N. (2017). WarpPLS 5.0 user manual. scripwarp systems: Laredo, TX. Lee, J. W., Jung, H. J., Park, J. Y., Lee, J. B., & Yoon, Y. (2013). Optimization of building window system in Asian regions
by analyzing solar heat gain and daylighting elements. Renewable energy, 50, 522-531. Lamoreaux, D., & Sulkowski, M. L. (2020). An alternative to fortified schools: Using crime prevention through
environmental design (CPTED) to balance student safety and psychological well-being. Psychology in the Schools, 57(1), 152-165.
Ma, P., Wang, L. S., & Guo, N. (2015). Maximum window-to-wall ratio of a thermally autonomous building as a function of envelope U-value and ambient temperature amplitude. Applied Energy, 146, 84-91.
Miller, R. A., & Blac, L. V. (1932). Transmission of radiant energy through glass. Jour. Heating, Piping, and Air Conditioning, 143-148.
Ochoa, C. E., Aries, M. B., Van Loenen, E. J., & Hensen, J. L. (2012). Considerations on design optimization criteria for windows providing low energy consumption and high visual comfort. Applied energy, 95, 238-245.
Persson, M. L. (2006). Windows of Opportunities: The Glazed Area and its Impact on the Energy Balance of Buildings (Doctoral dissertation, Acta Universitatis Upsaliensis).
Ralegaonkar, R. V., & Gupta, R. (2010). Review of intelligent building construction: A passive solar architecture approach. Renewable and Sustainable Energy Reviews, 14(8), 2238-2242.
Seifi, M., Abdullah, A., Haron, S., & Salman, A. (2019, October). Creating Secured Residential Places: Conflicting Design Elements of Natural Surveillance, Access Control and Territoriality. In IOP Conference Series: Materials Science and Engineering (Vol. 636, No. 1, p. 012017). IOP Publishing.
Thalfeldt, M., Pikas, E., Kurnitski, J., & Voll, H. (2013). Facade design principles for nearly zero energy buildings in a cold climate. Energy and Buildings, 67, 309-321.
Tzempelikos, A., Bessoudo, M., Athienitis, A. K., & Zmeureanu, R. (2010). Indoor thermal environmental conditions near glazed facades with shading devices–Part II: Thermal comfort simulation and impact of glazing and shading properties. Building and Environment, 45(11), 2517-2525.
Vanhoutteghem, L., Skarning, G. C. J., Hviid, C. A., & Svendsen, S. (2015). Impact of façade window design on energy, daylighting and thermal comfort in nearly zero-energy houses. Energy and Buildings, 102, 149-156.

1135
The 54th International Conference of the Architectural Science Association (ANZAScA) 2020
The influence of work-group numbers and demographic characteristics on frequency of interruptions and perceived
productivity of building users.
Eziaku Rasheed1, Maryam Khoshbakht2 and George Baird3
1School of Built Environment, Massey University, Auckland, New Zealand [email protected]
2Cities Research Institute, Griffith University, Gold Coast, Australia [email protected]
3School of Architecture, Victoria University of Wellington, Wellington, New Zealand [email protected]
Abstract: Considerable effort has been expended over recent decades to understand how the physical environment of commercial and academic buildings influences the comfort, health and productivity of the occupants. Somewhat less attention has been given to the study of the effects of distractions and interruptions on the productivity of individual occupants. In the course of their surveys of some 68 buildings worldwide and their 5149 occupants using the Building Use Studies Methodology, the authors have amassed a database which, as well as containing information on the occupants’ perceptions of physical and environmental parameters, included unmined data on frequency of interruptions. In this paper, the authors detail evidence of clear correlations between frequency of interruptions and perceived productivity in different settings from an individual user point of view. The significant differences found between differently sized work-groups, between males and females, and between younger and older workers, are explored in detail. It is anticipated that these findings will add useful information to the growing literature on this comparatively neglected aspect as designers strive towards that elusive holy grail of office design.
Keywords: work-groups; demographics; interruptions; productivity.
1. IntroductionConsiderable effort has been expended over recent decades to understand how the physical
environment of commercial and academic buildings influences the comfort, health and productivity of their occupants. This has resulted in much consideration having being given to the thermal, visual and acoustic aspects, and the layout and configuration of office environments; and to architectural and technical systems and facilities management processes capable of responding quickly to changing conditions and occupant needs (Khoshbakht et al., 2018). Somewhat less attention has been given to the study of distractions or unwanted interruptions on the productivity of individual occupants.
Fortunately, at least one pioneer of post-occupancy evaluation (POE) foresaw that this was an important issue. Adrian Leaman, developer of the now well-established Building Use Studies Methodology (Cohen et al., 2001), had included this aspect in his standard office questionnaire right
Imaginable Futures: Design Thinking, and the Scientific Method. 54th International Conference of the Architectural Science Association 2020, Ali Ghaffarianhoseini, et al (eds), pp. 1135–1144. © 2020 and published by the Architectural Science Association (ANZAScA).

1136
Eziaku Rasheed, Maryam Khoshbakht and George Baird
from the start. Tucked alongside a series of questions on acoustics, respondents are asked to “Please estimate how you are affected by unwanted interruptions …” on a 7-point semantic differential scale ranging from “Not at all” (which would score 1 on the scale) to “Very frequently” (scoring 7).
Despite having employed this questionnaire for over a decade in surveys of buildings worldwide, it has to be confessed that the responses to the “Unwanted Interruptions” question have been almost totally ignored – the most focus has been on all the other aspects. One earlier attempt to include it in a paper on acoustic aspects was attempted by Haapakangas et al. (2014), who investigated four acoustic conditions in an open-plan office laboratory. While our database of buildings and numbers of respondents expanded, responses to this question remained largely dormant and ignored, particularly in the various work-group numbers. That is until we heard a radio interview with David Astle, author of “Rewording the Brain” (Astle, 2018). While the main aim of the book is to outline “How cryptic crosswords can improve your memory and boost the power and agility of your brain”, his chance remark that you would need 23 minutes and 15 seconds to get back on track after a 2 minutes off-topic interruption struck a chord – not just because of the amount of time and the apparent precision of its duration, but because it echoed one’s own experience.
It is not by accident that so many authors seem to work on their novels in the garden shed or a remote part of the house or the country; focus groups go into a retreat to hammer out policy, and academics pine for the mythical ‘quality time’ to conduct and write-up their research. All recognise the need to avoid off-topic interruptions to enable full focus on the task at hand. Intrigued by that remark, the book was read from cover to cover, and sure enough, the precision of the figures quoted by Astle (2018) in page 26 was backed up by academic research references (more of which later in Literature Review); though sadly, one’s facility with cryptic crosswords has yet to improve.
Thus prompted, and to see if this phenomenon might be apparent in our data, a belated pilot study was undertaken of relevant data from 29 buildings featured in Baird’s survey of “Sustainable Buildings in Practice” (Baird, 2010). This involved a simple comparison of the averages for each building of the “Unwanted Interruptions” scores versus the percentage increase or decrease in perceived productivity, this latter being adjudged to be the variable most likely to be influenced by interruptions. Twenty buildings reported increases in perceived productivity averaging +9.4% overall, corresponding to an unwanted interruptions score averaging 3.57 (on the 7-point scale where 1 signifies the least effect; and 7 the greatest). For the 9 buildings which reported average decreases of -5.0% overall, the unwanted interruptions score averaged 4.59. The trend was clear, albeit on the basis of building averages rather than individual respondents.
Thus encouraged, the decision was taken to explore this aspect further in relation to the estimates and perceptions of individual users and over the entire database of 68 buildings and 5149 respondents. Office occupants can be categorised into several work-groups from cellular offices with a single occupant to open-plan offices with more than eight occupants. Work-group numbers have a direct influence on office distractions as a result of noise generation in workplaces that is the most dominant in larger work-group numbers (Haynes, 2008). Depending on the work-group sizes, office occupants may also experience various levels of visual and acoustic privacy, and consequently, different amount of distractions and unwanted interruptions (Yildirim et al., 2007). Office design layout such as proximity to a window, and workstation partition height influence occupant satisfaction, and perceived productivity in workplace environments and compensate for the negative aspects of open-plan offices (Yildirim et al., 2007). An individual may develop preferences for seat selection in open-plan layouts to increase their productivity when given choices (Gou et al., 2018). Differences in perceived productivity in various work-

1137
The influence of work-group numbers and demographic characteristics on frequency of interruptions and perceived productivity of building users
group sizes were observed by previous studies, particularly comparing commercial office buildings with academic office buildings (Rasheed et al., 2019; Khoshbakht et al., 2020).
Nonetheless, the effect of distractions on various user groups has been rarely studied in a systematic way. The aim of this research is to compare the tolerance of unwanted interruptions among several user groups in our database. Thus, differences in sensitivity to unwanted interruptions between differently sized workplace clusters, between males and females, and between younger and older workers are explored in detail.
2. Methodology
Post-occupancy evaluation (POE) studies and the BUS Methodology survey questionnaires were adopted for the investigation in this study. The BUS Methodology survey has been effectively employed in numerous research projects worldwide. The survey consists of questions regarding user background information and various satisfaction questions. Full detail of the BUS Methodology and the actual questionnaire are presented in earlier studies (Baird et al., 2012). From 68 buildings, 5149 survey responses were collected over a 12-year period. For the purpose of this study, a subset of the questionnaire responses was used for the analysis. The included questions were about the age of participants, the gender of participants, and work-group sizes. The question relating to productivity asks survey participants to estimate how they think their productivity at work is decreased or increased by the environmental conditions in the building using a 9-point scale (where a 5 signifies conditions have no effect, less than 5 signifies a decrease and greater than 5 an increase). As noted above participants were asked to estimate how they were affected by unwanted interruptions on a 7-point scale. The paper questionnaires were distributed in the buildings in person, and the responses were typically collected after five to seven days. Response rates greater than 75% was required to ensure results were representative. Pearson’s correlation was used to test the correlation between the variables. One-way ANOVA was also utilised to test the significance of differences in mean scores between groups.
3. Results
In what follows, the authors explore the differences in tolerance of interruptions found between individuals under and over 30 years of age (section 3.1), and whether male or female (section 3.2); and the effect of work-group size (section 3.3). The findings are discussed under each heading, and some overall conclusions advanced.
3.1. Age of occupant – Under 30 years versus 30 years or over The mean score of productivity was better in the under 30 years group with a score of 5.39 compared to the 30 years or over group with a mean score value of 5.04 (Table 1). For 30 years or over, unwanted interruptions were scored worse with the mean score of 4.22 in comparison with the under 30 years group with a mean score value of 3.85 (Figure 1). One-way ANOVA tests showed a significant difference (p-value<0.001) between the mean scores of productivity and unwanted interruptions for the under 30 years and 30 years or over age groups (Table 2).

1138
Eziaku Rasheed, Maryam Khoshbakht and George Baird
Table 1. Descriptive statistics of productivity and unwanted interruptions for under 30 years and 30 years or over.
Parameters variables Mean Std. Deviation N Under 30 years Productivity 5.39 1.729 1200
Unwanted interruptions 3.85 1.668 1208 30 years or over Productivity 5.04 1.672 3473
Unwanted interruptions 4.22 1.649 3479
Figure 1. Comparative analysis of mean scores of productivity and unwanted interruptions between under 30 years and 30 years or over.
Table 2. One-way ANOVA analysis comparing productivity and unwanted interruptions for under 30 years and 30 years or over.
Sum of Squares df Mean F p-valueSquare
Productivity Between Groups 104.669 1 104.669 36.788 <0.001** Within Groups 13289.805 4671 2.845 Total 13394.475 4672
Unwanted Interruptions Between Groups 121.384 1 121.384 44.355 <0.001** Within Groups 12821.297 4685 2.737 Total 12942.681 4686
Note: ** Statistical significance p-value<0.05
For both age groups, negative Pearson correlation coefficients were found with statistical significance lower than 0.001. between productivity and unwanted interruptions in sustainable and conventional buildings, respectively. The Pearson correlation coefficients were -0.350 and -0.367 for under 30 years and 30 years or over, respectively. The Pearson correlation coefficients show that the 30 years or over group were more sensitive to unwanted interruptions and the productivity levels were more affected in comparison to the younger age group.

1139
The influence of work-group numbers and demographic characteristics on frequency of interruptions and perceived productivity of building users
3.2. Gender – Male versus female The productivity scores were better for the male group with a mean score of 5.25 compared to the female group, with a mean score value of 5.00 (Table 3). The mean score of 4.21 for unwanted interruptions scored by female participants was worse than the mean score of 4.05 by the male participant group (Figure 2). One-way ANOVA tests also showed a significant difference between the mean scores of productivity and unwanted interruptions when comparing males and females (Table 4).
Table 3. Descriptive statistics of productivity and unwanted interruptions for different genders.
Parameters variables Mean Std. Deviation N Male Productivity 5.25 1.650 2413
Unwanted interruptions 4.05 1.605 2369 Female Productivity 5.00 1.728 2247
Unwanted interruptions 4.21 1.718 2301
Figure 2. Comparative analysis of mean scores of productivity and unwanted interruptions between male and female gender groups.
Table 4. One-way ANOVA analysis comparing productivity and unwanted interruptions for male and female gender groups.
Sum of Squares df Mean F p-valueSquare
Productivity Between Groups 68.197 1 68.197 23.935 <0.001** Within Groups 13271.737 4658 2.849 Total 13339.934 4659
Unwanted Interruptions Between Groups 30.708 1 30.708 11.123 0.001** Within Groups 12887.738 4668 2.761 Total 12918.446 4669
Note: ** Statistical significance p-value<0.05

1140
Eziaku Rasheed, Maryam Khoshbakht and George Baird
For both gender groups, negative Pearson correlation coefficients were found with statistical significance lower than 0.001. The Pearson correlation coefficients were -0.359 and -0.371 for the male and female groups, respectively, which indicates a higher sensitivity of female participants to unwanted interruptions.
3.3 Work-groups The tested work-groups were sole occupant, shared with one other, shared with 2 to 4, shared with 5 to 8, and shared with over 8 people. The productivity scores were the best for the sole occupant group with a 5.32 mean score value and the worst for shared with more than 8, with a mean score value of 4.99 (Table 5). Unwanted interruptions were the worst in the largest work-group with a mean score value of 4.25 and the best in the second smallest work-groups (shared with one other) with a mean score value of 3.85 (Figure 3). One-way ANOVA tests also showed a significant difference between the mean scores of productivity and unwanted interruptions when comparing various work-groups (Table 6). Although unwanted interruptions were worse in offices with a single user compared to offices shared with one other, the productivity scores were better in offices with a sole occupant in comparison to offices shared with one another. However, for the rest of the comparisons in work-groups, the worse the unwanted interruptions, the worse was the productivity scores.
Table 5. Descriptive statistics of productivity and unwanted interruptions for different work-groups.
Parameters variables Mean Std. Deviation N Sole occupant Productivity 5.32 1.607 1056
Unwanted interruptions 4.09 1.675 1028 Shared with one other Productivity 5.21 1.637 367
Unwanted interruptions 3.85 1.670 357 Shared with 2-4 Productivity 5.13 1.740 781
Unwanted interruptions 4.09 1.603 798 Shared with 5-8 Productivity 5.13 1.726 685
Unwanted interruptions 4.08 1.696 702 Shared with more than 8 Productivity 4.99 1.724 1720
Unwanted interruptions 4.25 1.668 1740

1141
The influence of work-group numbers and demographic characteristics on frequency of interruptions and perceived productivity of building users
Figure 3. Comparative analysis of mean scores of productivity and unwanted interruptions among various work-groups.
Table 6. One-way ANOVA analysis comparing productivity and unwanted interruptions for different work-groups.
Sum of Squares df Mean F p-valueSquare
Productivity Between Groups 77.330 5 15.466 5.390 <0.001** Within Groups 13230.293 4611 2.869 Total 13307.624 4616
Unwanted Interruptions Between Groups 58.633 5 11.727 4.245 0.001** Within Groups 12782.466 4627 2.763 Total 12841.099 4632
Note: ** Statistical significance p-value<0.05
4. DiscussionThe highest cost of running businesses is staff salaries and benefits, accounting for about 90% of business operating costs on average (Alker et al., 2014). Thus, creating a productive workplace can have a major financial implication for employers. The present study emphasises the importance of matching work patterns with user preferences and requirements. The matching of office user needs with space provision can only be accomplished through understanding the way people work in office environments and identifying their specific requirements. What is been reinforced is the importance of building user involvement in the evaluation of building performances and in the creation of the space.

1142
Eziaku Rasheed, Maryam Khoshbakht and George Baird
Previously not many studies investigated the role of acoustic design and unwanted distractions on the productivity of knowledge workers. One earlier study found evidence that with online distractions blocked, participants reported higher productivity and focus in office environments (Mark et al., 2018). We have shown that distractions influence perceived productivity in different ways, depending on the physical and behavioural environments. We compared the effect of unwanted interruptions on perceived productivity across various user groups, including age, gender and work- group size. In all categories, significant correlations between unwanted interruptions and productivity were found. In all subsets of our dataset, the more frequent the unwanted interruptions were, the worse the perceived productivity. This showed that the ability to concentrate has a substantial influence on perceived productivity as supported by previous research (Maarleveld and De Been, 2011). The physical environment and acoustic performance of the office support employee productivity. The negative correlations between unwanted interruptions and knowledge worker productivity provided further evidence that the acoustic design of the office environment has a decisive effect on user experience in buildings. Our research showed that respondents that were less troubled by unwanted interruptions, were also more likely to experience the workplace as supportive for their productivity.
In our dataset, older occupants (over 30 years) showed lower tolerance over unwanted interruptions in office environments. Likewise, female users reported lower tolerance over unwanted interruptions when compared to male users. These particular findings were consistent with earlier research that demonstrated genders have different responses to the negative aspects of open-plan offices in terms of distractions (Yildirim et al., 2007). In line with our findings, Kalgotra et al. (2016) compared the effect of distractions among different age and gender groups and demonstrated that interruptions caused by technologies significantly increased the task completion time particularly among young adult females and middle-aged males. The study suggested that the higher tolerance of interruptions among young adult female and middle-aged males is because of the multi-tasking abilities. The higher tolerance of unwanted interruptions among younger and male users, in our study, may be explained by Haynes’s research (Haynes, 2008) that correlated the tolerance of unwanted interruptions with multi-tasking abilities. One of the most important implications of this finding is that office designers need to account for the nature of the work in terms of the number of responsibilities for individuals when designing office spaces. Background noise and speech intelligibility in office environments particularly need further examination when designing for more sensitive building users such as female and over 30 years old users.
Our study also demonstrated that the bigger were the size of work-groups, the more frequent were the unwanted interruptions. Open-plan offices may seem aesthetically more pleasing from the design point of view, yet users reported higher productivity in offices shared with fewer people (Rasheed et al., 2019). The performance losses in large work-groups may be associated with the lack of speech privacy and reduced concentration as a result of overhearing other conversations (Roelofsen, 2008). Therefore, creating flexible open-plan offices that simultaneously enable both effective collaboration and undisturbed concentration may remain one of the highest aspirations of architectural design.
5. ConclusionThis research provided further evidence of office worker needs and specific requirements. Overall, a significant negative correlation was found between productivity, and unwanted interruptions in all

1143
The influence of work-group numbers and demographic characteristics on frequency of interruptions and perceived productivity of building users
groups tested. The more frequent the unwanted interruptions were, the worse the productivity scores. There was a significant difference in scores between all groups (age, gender and work-groups) for mean ratings on productivity and unwanted interruptions. It was also shown that acoustic design in office environments need further examination when designing for more sensitive building users such as female and over 30 years old users. These results highlight the importance of the need to account for user demographics when designing office spaces. Our study demonstrated higher levels of unwanted interruptions in bigger work-groups. This finding particularly contradicted conventional wisdom that bigger work-groups improves user overall performance and productivity by enhancing collaborations among building users. This research also provided a simple, effective framework for measuring the influence of physical features and demographics on user perceptions and productivity—the results of this work yield progressive improvement strategies for the relationship between office users and buildings.
For future evaluations, it is suggested that separate questions regarding unwanted interruptions and other forms of office distractions be included in the surveys to capture additional aspects of user spatial perceptions and avoid the confusion over the concepts. In our database, the numbers of 30 years or over were much higher than those under 30 years. It is suggested that smaller age categories to be used in survey questions to balance the number of participants in different age groups.
Acknowledgements
It is a pleasure to acknowledge Mr Adrian Leaman for permission to use the BUS Methodology questionnaire under license. We must also thank all the building managers and occupants for their participation in the surveys. Perhaps too, we should acknowledge Kathryn Ryan of Radio New Zealand, whose interview of David Astle prompted us to carry out these analyses in the first place.
References Alker, J., Malanca, M., Pottage, C. and O’Brien, R. (2014) Health, wellbeing & productivity in offices: The next
chapter for green building, World Green Building Council. Astle, D. (2018) Rewording the Brain: How cryptic crosswords can improve your memory and boost the power and
agility of your brain, ed., Allen & Unwin, Crows Nest, Australia. Baird, G. (2010) Sustainable buildings in practice: What the users think, ed., Routledge. Baird, G., Leaman, A. and Thompson, J. (2012) A comparison of the performance of sustainable buildings with
conventional buildings from the point of view of the users, Architectural science review, 55(2), 135-144. Cohen, R., Standeven, M., Bordass, B. and Leaman, A. (2001) Assessing building performance in use 1: the Probe
process, Building Research & Information, 29(2), 85-102. Gou, Z., Khoshbakht, M. and Mahdoudi, B. (2018) The impact of outdoor views on students’ seat preference in
learning environments, Buildings, 8(8), 96. Haapakangas, A., Hongisto, V., Hyönä, J., Kokko, J. and Keränen, J. (2014) Effects of unattended speech on
performance and subjective distraction: The role of acoustic design in open-plan offices, Applied Acoustics, 86, 1-16.
Haynes, B. P. (2008) Impact of workplace connectivity on office productivity, Journal of Corporate Real Estate. Kalgotra, P., Sharda, R. and McHaney, R. (2016) Understanding the impact of interruptions on knowledge work: An
exploratory neuroimaging study,2016 49th Hawaii International Conference on System Sciences (HICSS), IEEE, 658-667.

1144
Eziaku Rasheed, Maryam Khoshbakht and George Baird
Khoshbakht, M., Baird, G. and Rasheed, E. O. (2020) The influence of work group size and space sharing on the perceived productivity, overall comfort and health of occupants in commercial and academic buildings, Indoor and Built Environment, 1420326X20912312.
Khoshbakht, M., Gou, Z., Dupre, K. and Best, R. (2018) Occupant Satisfaction and Comfort in Green Buildings: A Longitudinal Occupant Survey in a Green Building in the Subtropical Climate in Australia,International Conference of the Architectural Science Association, 371-381.
Leaman, A. and Bordass, B. (2007) Are users more tolerant of ‘green’buildings?, Building Research & Information, 35(6), 662-673.
Maarleveld, M. and De Been, I. (2011) The influence of the workplace on perceived productivity,EFMC2011: Proceedings of the 10th EuroFM research symposium: Cracking the productivity nut, Vienna, Austria, 24-25 May, 2011, EuroFM.
Mark, G., Czerwinski, M. and Iqbal, S. T. (2018) Effects of individual differences in blocking workplace distractions,Proceedings of the 2018 CHI Conference on Human Factors in Computing Systems, 1-12.
Onyeizu, E. (2014). The Delusion of Green Certification: The case of New Zealand Green office buildings. Proceedings of the 4th New Zealand Built Environment Research Symposium (NZBERS). Auckland, New Zealand. 14 November.ISSN 2324-1829 (Online).
Rasheed, E. O., Khoshbakht, M. and Baird, G. (2019) Does the Number of Occupants in an Office Influence Individual Perceptions of Comfort and Productivity?—New Evidence from 5000 Office Workers, Buildings, 9(3), 73.
Roelofsen, P. (2008) Performance loss in open-plan offices due to noise by speech, Journal of Facilities Management. Yildirim, K., Akalin-Baskaya, A. and Celebi, M. (2007) The effects of window proximity, partition height, and gender
on perceptions of open-plan offices, Journal of Environmental Psychology, 27(2), 154-165.

1145
The 54th International Conference of the Architectural Science Association (ANZAScA) 2020
The intersection of carbon sequestration and habitat provision in built environments: building rating tools comparison
Kamiya Varshney, Maibritt Pedersen Zari and Nilesh Bakshi Victoria University of Wellington, Wellington, New Zealand
{kamiya.varshney, maibritt.pedersen, nilesh.bakshi}@vuw.ac.nz
Abstract: The expansion of the built environment is a significant driver of climate change and the loss of biodiversity. Subsequently, ecosystem services required for the basic survival of humans are often reduced or removed altogether in many urban contexts. There are numerous building rating tools that are used to conduct building assessments in order to reduce impacts through building design and innovation. This study explores the potential relationships (synergies and trade-offs) between carbon sequestration and habitat provision in building design, and how these can be implemented as an important part of building rating systems. This paper presents a comparative analysis of three building rating tools identifying how they take the provision of habitat and the sequestration of carbon into account during building assessment. Results demonstrate that the building rating systems tend to aim for minimisation of carbon emissions rather than sequestering of carbon from the environment. The only exception to this is the Living Building Challenge. Furthermore, habitat provision is seldom assessed in great detail. The paper concludes by proposing a number of strategies for habitat provision that foster or relate to carbon sequestration in the context of building design.
Keywords: Carbon sequestration; habitat provision; building rating tools; ecosystem services.
1. IntroductionHuman interventions have caused approximately 1.0°C of global warming above pre-industrial levels, with a likely range of 0.8°C to 1.2°C. If this continues at the same (or an accelerated) pace, average global warming is likely to reach at least 1.5°C between 2030 and 2052 (IPCC, 2018). Local and regional climates are altered due to urban heat island effects caused by the heat absorption of high mass-built surfaces. Concurrently, greenhouse gas emissions from construction, operation, maintenance, and demolition and some forms of building heating and cooling, significantly affect the functions of ecosystems and biodiversity (Gómez-Baggethun et al., 2013). According to the Intergovernmental Panel on Climate Change (IPCC, 2018), the impacts on biodiversity (including species loss and extinction), are estimated to be lower at 1.5°C of global warming compared to 2°C. Moreover, urbanisation often leads to significant land-use change (though agriculture is still the leading cause of land-use change), which seriously impacts biodiversity, ecological processes, and the quality, quantity, and connectedness of habitats (McDonnell et al., 2008).
Imaginable Futures: Design Thinking, and the Scientific Method. 54th International Conference of the Architectural Science Association 2020, Ali Ghaffarianhoseini, et al (eds), pp. 1145–1154. © 2020 and published by the Architectural Science Association (ANZAScA).

1146
Kamiya Varshney, Maibritt Pedersen Zari and Nilesh Bakshi
Recognising the importance of addressing these issues, over the past three decades (Lee, 2013) sustainable building practices have become more common. An industry-driven response has been the inception and adoption of various building rating tools that aim to optimise building performance and minimise the negative impacts on the environment. Buildings certified by such rating tools are considered to be potentially energy efficient with minimising environmental impact and ones where the physical health conditions of building users may possibly be enhanced (Mattoni et al., 2018). Although neutral or minimal environmental impacts are worthwhile targets for carbon, energy, waste, or water, Pedersen Zari and Jenkin (2009) identify there is significant evidence for the need for net positive, or regenerative ecological, climatic, and human health targets for building design. These can potentially be achieved by concepts such as regenerative design (Pedersen Zari and Jenkin, 2009; Pedersen Zari, 2018). To move towards regenerative design, building rating tools need to assess buildings in a way that encourages design for the provision of ecosystem services (see section 2) aimed at improving ecological health along with human health in both urban and regional contexts (Birkeland, 2012). This potential paradigm shift from negative impact to positive impact, from carbon reduction to carbon sequestration, from vegetation provision for reducing urban heat island effect to habitat provision for multiple species, suggests that the next logical measure would be to establish if, and potentially how current building rating tools can be revised to account for ecosystem services design. To specifically address this line of inquiry this paper focuses on carbon sequestration and habitat provision ecosystem services to better understand the issues and potential of revising current building rating tools.
2. Understanding Ecosystem ServicesToday, approximately 55 per cent of the world’s population resides in urban areas. By 2050, 68 per cent of the world’s population is projected to be urban (United Nation, 2019). With this rise in urban population, urban areas are also expanding. However, humans continue to be dependent on nature (ecosystem services) for survival as well as wellbeing (Gómez-Baggethun et al., 2013). The benefits humans derive from ecosystem functions, either directly or indirectly, are known as ecosystem services (Costanza et al., 1997).
Figure 1: Bundled ecosystem services (modified). Source: (modified from Pedersen Zari, 2018)

1147
The intersection of carbon sequestration and habitat provision in built environments: building rating tools comparison
According to the Millennium Ecosystem Assessment (MEA, 2005), ecosystem goods and services are the benefits people obtain from ecosystems. In the past three decades, there have been numerous definitions of ecosystem services by policymakers and decision-makers with classifications based on social, economic, and environmental factors. Pedersen Zari (2018) translated ecosystem services thinking into the context of the built environment. That research is the basis of a framework for putting the assessment of ecosystem services into practice in the building industry through inclusion in building rating tools discussed in this paper. Figure 1 outlines the bundled ecosystem services (excluding cultural ecosystem services), adapted and modified from Pedersen Zari (2018). The research scope is limited to two ecosystem services: climate regulation (specifically carbon sequestration) and habitat provision as shown in Figure 1.
2.1. Climate regulation ecosystem service: carbon sequestration
Climate regulation relates to the regulation of temperature, precipitation, and other biologically mediated climatic processes at global or local levels (Costanza et al., 1997). At a global scale, the emission and sequestration of greenhouse gases are regulated by ecosystems and at the local scale, land cover and vegetation have an impact on temperature and precipitation (MEA, 2005). Global responses to climate change include mitigation, carbon dioxide removal (CDR), adaptation, and remedial measures (IPCC, 2018). There are many mitigation, adaptation, and remedial strategies which the construction industry have explored or adopted to address climate change through built environment design such as car park minimisation (mitigation), increased use of renewable energy (remedial), and changes to building codes to raise minimum renewable energy requirements or take flooding into account (adaptation) and so on, but little attention is given to carbon dioxide removal from the atmosphere (sequestration) or carbon storage. This paper examines the need for carbon sequestration and storage in the built environment and suggests potential methods to achieve this.
2.2. Habitat provision ecosystem service
Biological ecosystems provide living space for (and are made up of) plant and animal species. The occurrence of most ecosystem functions is due to the species within ecosystems and how they relate to each other, both locally and globally (De Groot et al., 2002). This suggests it is essential to maintain suitable habitat to ensure the provision of ecosystem services, directly or indirectly. Pedersen Zari (2018) described habitat provision in the context of built environment design as comprised of several other ecosystem services. Namely: genetic information; pollination and seed dispersal; fixation of solar energy; biological control; and species maintenance. She bundled them under the umbrella of ‘habitat provision’ because ecosystem services such as genetic information, pollination, etc. cannot be directly integrated or mimicked by the human built infrastructure itself (Pedersen Zari, 2018) (Figure 1). Therefore, this research also considers ‘habitat provision’ as the set of bundled ecosystem services.
2.3. The relationship between carbon sequestration and habitat provision
The inter-related issues of climate change and biodiversity loss signal an urgent need to regenerate ecosystems at local, regional, and global scales. Figure 2 illustrates that biodiversity loss due to anthropogenic interventions may be reduced by regeneration of ecosystems and the generation of additional ecosystem services. Moreover, regenerative development may reduce the direct and indirect impacts of climate change through increasing biomass and thus potentially increasing carbon storage

1148
Kamiya Varshney, Maibritt Pedersen Zari and Nilesh Bakshi
and sequestration. Climate change and ecosystem health are inter-related in a positive feedback loop as illustrated in Figure 2 (Pedersen Zari, 2018). Also, the strategies to address carbon sequestration and habitat provision in the built environment often overlap, mostly because they are both typically reliant on increasing the amount of vegetation in the built environment. So, it is obvious that these two aspects of ecosystem functioning should be addressed together for maximum strategic benefit to both ecosystem services.
Figure 2: Regenerative design impacts. Source: (Pedersen Zari, 2018, p. 6)
2.3.1. Common strategies for carbon sequestration and habitat provision
Most of the biomass of the stems, branches, roots, and foliage of trees is made up of carbon absorbed from the atmosphere. The main strategy for increasing carbon sequestration in the built environment is to increase vegetation. Similarly, ecological corridors (currently largely fragmented) in the form of domestic gardens, green walls, and green roofs at local and regional scales are potential solutions to conserve biodiversity within urban landscapes (Vergnes et al., 2013). Table 1 lists examples of how designers can commonly apply this strategy of increasing vegetation. Other techniques such as using carbon-based materials in design do exist, but their efficacy is in question (Pedersen Zari, 2019). This is an area of further investigation.
Table 1: Some examples for addressing carbon sequestration and habitat provision concurrently Examples Carbon Sequestration Habitat provision ReferencesGreen roof (Hui and Chan, 2011) Green walls (Renger et al., 2015) Internal courtyards/ (Renger et al., 2015) atriums In-ground (Renger et al., 2015; Shafique et al., landscaping Wetlands
2020) (Dymond, 2013)
Agroforestry (Pandey, 2002)

1149
The intersection of carbon sequestration and habitat provision in built environments: building rating tools comparison
2.3.2. Synergies and trade-offs between carbon sequestration and habitat provision
It is important to analyse the contribution of carbon sequestration and habitat provision ecosystem services in the built environment by focusing on the synergies and trade-offs between them. Trade-offs are extremely important to identify so that increasing one ecosystem service does not inadvertently reduce another (Pedersen Zari, 2018). This holistic approach towards regenerative development facilitates ecological and human health and wellbeing. This is elaborated on further with an example of green roofs as a common strategy for carbon sequestration and habitat provision.
Hui and Chan (2011) have developed a systematic method for assessing the biodiversity effects of green roofs through six major factors: (a) species diversity and richness, (b) substrate type and depth, (c) plant species selection, (d) connectivity to natural environment, (e) green roof ratio, and (f) ecologically responsible development. Similarly, Shafique et al. (2020) have provided carbon sequestration assessment of green roofs and suggest that carbon sequestration performance varies with the type of green roof (either extensive or intensive), the plantation type, the green roof coverage (soft v/s hard landscape, blue-green roof), the density of vegetation leaves, composition of the substrate and so on. It is challenging to generalise the role of carbon sequestration and habitat provision in relation to different sustainable strategies adopted. This means that a pragmatic approach is required to know the potential relationships between these two ecosystem services in built environments.
It is important to select species in terms of carbon sequestration, but also for providing habitat. For example, although pinus radiata (a fast-growing exotic pine species to New Zealand) sequesters carbon faster than New Zealand natives initially (when planted in New Zealand), pine forests are not as good as native ones in terms of biodiversity outcomes. Thus, planting pine trees for carbon sequestration would act as a trade-off for habitat provision. Also, it is important to select substrate depth strategically when considering urban vegetation. In the case of green roofs, intensive green roofs sequester more carbon compared to extensive green roofs (Shafique et al., 2020) while intensive green roofs are often better for species diversity and richness (Hui and Chan, 2011). Therefore, the greater the depth of soil, the better it is for both carbon sequestration and habitat provision. This means, within different parameters, it could be possible to provide carbon sequestration and habitat provision concurrently. This would be a synergetic relationship.
3. Examination of three building rating systems
3.1. Methodology
The research method employed in this study is comprised of two stages. Stage 1: matrices related to all ecosystem services listed in Figure 3 were produced. Different aspects
of each building rating tool and different performance goals for sustainable building methods/strategies were examined in order to understand the extent to which ecosystem services are considered during assessment. The matrices were converted into wheel analysis diagrams. Figure 3 illustrates the findings of analysis. Furthermore, a table indicating the summary of the scope of this research examining how climate regulation (carbon sequestration) and habitat provision are considered by each building rating tool was included in Figure 3.
Stage 2 identified the integration of carbon sequestration and habitat provision in building rating tools and indicated the need for more research in this area.

1150
Kamiya Varshney, Maibritt Pedersen Zari and Nilesh Bakshi
Figure 3: Ecosystem services analysis in building rating tools

1151
The intersection of carbon sequestration and habitat provision in built environments: building rating tools comparison
3.2. Green building responses
Starting with BREEAM (Building Research Establishment Environmental Assessment) in the United Kingdom, the first rating tool launched in the early 1990s, there has been a significant rise in the number of building rating tools that promote and/or try to measure sustainable development (Lee, 2013). LEED (Leadership in Energy and Environmental Design) from the United States of America (USA), Green Star in Australia, New Zealand, and South Africa, LBC (Living Building Challenge) developed in the USA but used globally, the Evaluation Standard for Green Building (ESGB) from China, CASBEE (Comprehensive Assessment System for Building Environmental Efficiency) from Japan, and IGBC (Indian Green Building Council) from India, along with many more have subsequently emerged as building rating tools for assessment and in some cases design (Lee, 2013). To examine how carbon sequestration and habitat provision are or are not included in existing building rating systems, a comparison has been made with three building rating tools: LEED, Green Star NZ, and LBC. These three building rating tools were selected due to their wide acceptance in India and New Zealand because further research will be situated in these locations.
3.2.1. Leadership in Energy and Environmental Design – New Construction (LEED- NC) v4.1
LEED-NC is divided into eight sections including location and transportation (LT); sustainable sites (SS); water efficiency (WE); energy and atmosphere (EA); materials and resources (MR); indoor environmental quality (EQ); innovation (IN) and; regional priority (RP) (USGBC, 2019). LEED-NC does have a focus on carbon, but the focus is on mitigation of carbon emissions (which is of course important). This is evident from various strategies provided by LEED-NC such as reducing vehicle travel distances through effective planning, consideration of access to public transport and bicycle facilities, reducing car parking footprints, provision of ‘green’ vehicles, energy optimisation, additional energy savings, and increased use of renewable energy. After analysis of the LEED building rating system, it does not appear to have any aspect that relates specifically to carbon sequestration. This clearly indicates a potential gap in the existing architectural rating system that should be explored.
LEED-NC does have a subsection of site development: protect or restore habitat under the ‘Sustainable Sites’ category. This urges the importance of “conserving existing natural areas and restoring damaged areas to provide habitat and promote biodiversity” (USGBC, 2019, p. 163). Also, in the sensitive land protection category (under location and transportation) there is a stated aim “to avoid the development of environmentally sensitive lands and reduce the environmental impact from the location of a building on a site” (USGBC, 2019, p. 63). This is to minimise the impact on biodiversity and ecosystem health.
3.2.2. Green Star NZ v3.2 (New Zealand)
Green Star NZ is divided into nine categories, namely: management; indoor environmental quality; energy; transport; water; materials; land use and ecology; emissions; and innovation (Green Star NZ, 2017). These categories have been analysed based on their consideration of carbon sequestration and habitat provision. Green star NZ provides credit for carbon reduction and minimisation of carbon emissions. This is evident from the strategies provided by Green Star NZ (2017) such as greenhouse emission minimisation, car park minimisation, fuel-efficient transport, cyclist facilities, mass commuting transport and travel planning. The Green Star NZ building rating system does not appear to have any aspect that relates specifically to carbon sequestration, however.

1152
Kamiya Varshney, Maibritt Pedersen Zari and Nilesh Bakshi
In terms of habitat provision, Green Star NZ aims “to encourage and recognise the minimisation of ecological impact from development and encourage ecological enhancement of a site for new and existing buildings” (Green Star NZ, 2017, p. 413). An ‘Assessment of Ecological Value’ report is prepared before any construction starts and a ‘change in ecology calculator’ is used to calculate the ecological value before and after construction (Green Star NZ, 2017). Also, wall/roof gardens can be included in the land use and ecology calculator under certain conditions described by Green star NZ in their manual.
3.2.3. Living Building Challenge (LBC) v4.0
The Living Building Challenge (LBC, 2019) is divided into seven categories, namely: place; water; energy health + happiness; materials; equity; and beauty. For this research, ‘Living Certification’ was analysed because it aims for the highest level of sustainability and regenerative design. Categories of LBC have been analysed based on their consideration of carbon sequestration and habitat provision. LBC not only aims for carbon emission reduction through various strategies such as ‘energy + carbon reduction (treating energy as a precious resource)’ and ‘human-scaled living (effective planning to contribute toward pedestrian-oriented community)’ but also aims for ‘net positive carbon (through carbon sequestration or carbon offset purchase)’ which makes it unique among the typical building rating schemes.
Moreover, LBC has an imperative which directly relates to habitat provision; ‘ecology of place’, which is intended to preserve thriving vibrant ecological environments and habitats. For this purpose, LBC (2019, p. 30) states that “all project teams must document site and community conditions before the start of work, including but not limited to identification of the project’s ‘reference habitat(s)’ and all projects must demonstrate that they contribute positively to the ecology of their place and restore or enhance the ecological performance of the site towards a healthy ecological baseline”. However, LBC 2019 v 4.0 is the modified version released in the year 2019. This section was renamed as ‘ecology of place’ (earlier ‘limits to growth’ in v3.1, LBC, 2016). In the previous version 3.1, LBC (2016, p. 24) advised that “projects may only build on greyfields or brownfields: previously developed sites that are not classified as on or adjacent to any of the sensitive ecological habitats such as wetlands, primary dunes, old-growth forest, virgin prairie, prime farmland, or within the 100-year flood plain”. LBC 2019 has updated from the restriction on site selection to a performance-based approach in terms of the project location, local ecology, and community. This clearly signals the increasing awareness and ongoing measures to address biodiversity loss.
3.3. Carbon sequestration and habitat provision in the rating tools studied
Section 3.2.1 and 3.2.2 identify both LEED and Green Star NZ can include carbon dioxide removal (CDR) in building assessment. This will potentially enhance the rating tools by considering carbon reduction and removing existing carbon in the atmosphere through carbon sequestration to address global climate change. Habitat provision is included in LEED and Green star NZ; however, the biodiversity assessment is not provided based on the performance of habitat provision (this is further elaborated upon below).
LBC is ahead of most of the building rating tools (which is noticeable from the comparison done in Section 3.2) because it aims to move towards a fully restorative development. As discussed in Section 3.2.3, the LBC includes the category (‘petal’) of ‘net positive carbon’ that states “all projects must account for the total embodied carbon emissions (tCO2e) from construction, through the utilization of carbon-sequestering materials…”(LBC, 2019, p. 42) However, carbon sequestration is not limited to ‘sequestering materials’, it needs to include factors affecting the efficiency of carbon sequestration and

1153
The intersection of carbon sequestration and habitat provision in built environments: building rating tools comparison
the credits should be awarded according to their performance. The effectiveness of carbon sequestration varies in different scenarios, different climates, different building typologies, the density and type of vegetation, LAI (Leaf Area Index); area/coverage of different land types: pristine land/greenfield/brownfield development/coastal area, new build v/s retro-fit, location of the site, selection of plant species, composition of the substrate, etc. Designs must, therefore, be site specific. Credits should not be awarded for following a certain strategy, however, building rating tools should take into account the efficiency of strategy followed, related to a project’s specific context. This should be included in LBC, Green star NZ, and LEED.
Habitat provision is defined in LBC as ‘all projects must demonstrate that they contribute positively to the ecology of their place and restore or enhance the ecological performance of the site towards a healthy ecological baseline.’ However, as pointed out above, the effectiveness of habitat provision strategies for the enhancement of the ecological performance of a specific site should be carefully monitored over time because it depends on various factors such as species diversity and richness, substrate type and depth, plant species selection, connectivity to natural environment, green roof ratios, ecologically responsible development, building materials used for pavements and ledge walls etc., degree of shading, the presence of microtopography, slopes, the presence of water, and presence of keystone species etc (Lundholm, 2006; Hui and Chan, 2011).
4. Conclusion and scope for future researchBiodiversity loss and climate change are often treated as separate issues, however, they are intimately linked (section 2.4) and must be addressed together, along with an examination of strategies which could help to enhance urban biodiversity and sequester carbon concurrently. Firstly, designers need to understand that buildings should not lead to increased pressure on climate and ecosystems. Secondly, maintaining and enhancing ecosystem health should be considered as equally important as working towards improving human health or aesthetic value (none of which are mutually exclusive).
It is necessary to understand design strategies that enhance or maintain urban biodiversity, and at the same time provide urban infrastructure that meets appropriate engineering, environmental, and societal criteria within the context of climate change (Gómez-Baggethun et al., 2013). Also, there are emerging strategies in advanced construction and building research aiming to go beyond ‘fewer negative’ impacts that could potentially result in embodied carbon payback by considering building- integrated carbon sequestration through increasing biomass (Renger et al., 2015). This study is not exhaustive and there are limitations. However, it provides a good baseline to check whether carbon sequestration and habitat provision are already considered within building rating tools, in order to identify the gap in knowledge and potentials for future research directions. This research shows there is scope to study different strategies in detail, which not only enhance biodiversity by providing habitat but also sequester carbon from the atmosphere as a solution to the inter-related issues of climate change and biodiversity loss. Furthermore, this research suggests that there is a need to identify how to combine these strategies or how to plot synergies and trade-offs between different building techniques or technologies to identify optimal solutions through the medium of building design. Future results will provide guidelines to designers and architects which can be used to concurrently design for building integrated carbon sequestration and habitat provision with minimal trade-offs.

1154
Kamiya Varshney, Maibritt Pedersen Zari and Nilesh Bakshi
References Birkeland, J. (2012) Positive development: from vicious circles to virtuous cycles through built environment design,
ed., Routledge. Costanza, R., d'Arge, R., De Groot, R., Farber, S., Grasso, M., Hannon, B., Limburg, K., Naeem, S., O'neill, R. V. and
Paruelo, J. (1997) The value of the world's ecosystem services and natural capital, nature, 387(6630), 253-260. De Groot, R. S., Wilson, M. A. and Boumans, R. M. (2002) A typology for the classification, description and valuation
of ecosystem functions, goods and services, Ecological economics, 41(3), 393-408. Dymond, J. R. (2013) Ecosystem services in New Zealand: conditions and trends, ed., Manaaki Whenua Press,
Landcare Research. Gómez-Baggethun, E., Gren, Å., Barton, D. N., Langemeyer, J., McPhearson, T., O’Farrell, P., Andersson, E., Hamstead,
Z. and Kremer, P. (2013) Urban ecosystem services, in, Urbanization, biodiversity and ecosystem services:Challenges and opportunities, Springer, Dordrecht, 175-251.
Green Star NZ (2017) Green Star Technical Manual v3.2. Hui, S. C. and Chan, K. (2011) Biodiversity assessment of green roofs for green building design, Proceedings of Joint
Symposium 2011 on Integrated Building Design in the New Era of Sustainability. IPCC (2018) Global Warming of 1.5 C An IPCC Special Report on the Impacts of Global Warming of 1.5 C Above Pre-
Industrial Levels and Related Global Greenhouse Gas Emission Pathways, in the Context of Strengthening the Global Response to the Threat of Climate Change, Sustainable Development, and Efforts to Eradicate Poverty
LBC (2016) LIVING BUILDING CHALLENGE v3.1. LBC (2019) LIVING BUILDING CHALLENGE v4.0. Lee, W. (2013) A comprehensive review of metrics of building environmental assessment schemes, Energy and
Buildings, 62, 403-413. Lundholm, J. T. (2006) Green roofs and facades: a habitat template approach, Urban habitats, 4(1), 87-101. Mattoni, B., Guattari, C., Evangelisti, L., Bisegna, F., Gori, P. and Asdrubali, F. (2018) Critical review and
methodological approach to evaluate the differences among international green building rating tools, Renewable and Sustainable Energy Reviews, 82(P1), 950-960.
McDonnell, M. J., Pickett, S. T., Groffman, P., Bohlen, P., Pouyat, R. V., Zipperer, W. C., Parmelee, R. W., Carreiro, M. M. and Medley, K. (2008) Ecosystem processes along an urban-to-rural gradient, in, Urban Ecology, Springer, 299-313.
MEA (2005) Ecosystems and human well being, General synthesis, Island Press, Washington DC, USA. Pandey, D. N. (2002) Carbon sequestration in agroforestry systems, Climate policy, 2(4), 367-377. Pedersen Zari, M. (2018) Regenerative urban design and ecosystem biomimicry, Routledge research in sustainable
urbanism, ed., Routledge, Abingdon, Oxon Pedersen Zari, M. (2019) Ecosystem services impacts as part of building materials selection criteria, Materials Today
Sustainability, 3, 100010. Pedersen Zari, M. and Jenkin, S. (2009) Re-defining cutting edge sustainable design: from eco-efficiency to
regenerative development. Renger, B. C., Birkeland, J. L. and Midmore, D. J. (2015) Net-positive building carbon sequestration, Building
Research and Information, 43(1), 11-24. Shafique, M., Xue, X. and Luo, X. (2020) An overview of carbon sequestration of green roofs in urban areas, Urban
Forestry and Urban Greening, 47, 126515. United Nation (2019) Department of Economic and Social Affairs, Population Division, World Urbanization
Prospects: The 2018 Revision (ST/ESA/SER.A/420). USGBC (2019) LEED v4. 1 BUILDING DESIGN AND CONSTRUCTION. Vergnes, A., Kerbiriou, C. and Clergeau, P. (2013) Ecological corridors also operate in an urban matrix: a test case
with garden shrews, Urban Ecosystems, 16(3), 511-525.

1155
The 54th International Conference of the Architectural Science Association (ANZAScA) 2020
The life cycle embodied energy and greenhouse gas emissions of an Australian housing development: comparing 1997 and
2019 hybrid life cycle inventory data
Alejandro Lara Allende1, André Stephan2 and Robert H. Crawford3 1,3 The University of Melbourne, Melbourne, Australia
[email protected], [email protected] 2 Université catholique de Louvain, Louvain-la-Neuve, Belgium
Abstract: Data used to conduct a life cycle assessment, called a life cycle inventory (LCI), is rarely scrutinised and its effects on the results of an environmental assessment is understudied. Hybrid analysis is the most comprehensive technique to compile an LCI. It combines bottom-up industrial process data and top-down macroeconomic input-output data. This study compares two hybrid LCIs of construction materials, using the same technique, developed in 1997 and 2019. This paper evaluates the effect of LCI data on the life cycle embodied energy and greenhouse gas emissions of a recent housing development in Melbourne, Australia. The case study development consists of six different apartment buildings (~14,000m² gross floor area; 555 inhabitants) that have an improved environmental performance compared to business-as-usual. Results show that the 2019 LCI lead to a decrease in the life cycle embodied energy and greenhouse gas emissions over 50 years, from 39.1 GJ/m² to 32.2 GJ/m² (-17.6%) and from 2,338 kgCO2e/m² to 2,218 kgCO2e/m² (-5.1%), respectively. The embodied energy and greenhouse gas emissions ranking of some materials changed by up to five positions, while at the assembly level the top five assemblies did not change much. This analysis provides rare insights into the effects of hybrid LCI data on the life cycle assessment of built environment assets and implications for design.
Keywords: Embodied energy; embodied greenhouse gas emissions; hybrid life cycle inventory; housing; Australia.
1. IntroductionThe current climate emergency, resulting from a significant increase in anthropogenic greenhouse gas emissions, needs to be addressed at once to avoid catastrophic disruptions to millions of lives and to global ecosystems (IPCC, 2018). The construction and operation of buildings are amongst the main drivers of energy use and greenhouse gas emissions, globally (IPCC, 2014). However, it is critical that energy use
Imaginable Futures: Design Thinking, and the Scientific Method. 54th International Conference of the Architectural Science Association 2020, Ali Ghaffarianhoseini, et al (eds), pp. 1155–1164. © 2020 and published by the Architectural Science Association (ANZAScA).

1156
Alejandro Lara Allende, André Stephan and Robert H.
and greenhouse gas emissions associated with buildings are reduced across the entire life cycle of a building to avoid simply shifting burdens between life cycle stages (Crawford, 2011). The majority of existing studies on the life cycle assessment of buildings rely on process analysis which can significantly underestimate embodied energy and greenhouse gas emissions (Majeau-Bettez et al., 2011). In order to ensure a more comprehensive coverage of embodied energy and greenhouse gas emissions, process data can be augmented with top-down macroeconomic data, known as input-output data. The resulting hybrid life cycle inventory provides embodied energy and greenhouse gas emissions figures that cover the entire supply chains of materials (Crawford et al., 2018). Yet, there are very few databases of hybrid embodied energy and greenhouse gas emissions for construction materials, globally. This has impeded the uptake of hybrid analysis and is the reason behind the lack of comparison of hybrid life cycle inventories over time, compared to process or input-output life cycle inventories. Recently, Crawford et al. (2019) produced the EPiC Database of embodied environmental flow coefficients for construction materials in Australia. This comprehensive database uses the same method (Lenzen and Crawford, 2009) as the former database of Crawford and Treloar (2010) (which is based on 1997 input-output data and process data from the 1990s) to produce the hybrid coefficients. This offers a unique opportunity to compare the previous and new databases of hybrid coefficients, as applied to a case study development, in order to understand the changes in the data and their implications on decision-making. This comparison addresses the need for more applications and transparency in hybrid life cycle inventories, as called for by Pomponi and Lenzen (2018).
The aim of this paper is to compare the life cycle embodied energy and greenhouse gas emissions performance of a housing development, using 1997 and 2019 data, to determine the effect of data age on project decision-making.
The scope is limited to the initial and recurrent embodied energy and greenhouse gas emissions of a housing development in Melbourne, Australia. The system boundaries of this work account for life cycle embodied energy (LCEE) and life cycle embodied greenhouse gas emissions (LCEGHG). LCEE and LCEGHG are defined as the sum of primary energy and greenhouse gas emissions associated with the construction process, including construction materials and associated transportation, administration and other services including the recurrent embodied energy and greenhouse gas emissions related to the replacement of materials. These are equivalent to stages A1-A5 and B4 in the European Standard 15978 (2011). The period of analysis is 50 years.
2. Comparing embodied energy and greenhouse gas emissions data
2.1. Research design
Considering the lack of studies that analyse the influence of the age of different datasets when performing hybrid life cycle analysis on built environment assets, we decided to use a revelatory case study approach (Yin, 2018). This approach is characterised by the lack of application of the subject matter at hand and thus of the impossibility to rely on large samples of cases for the comparison.
We chose a new housing development located in Melbourne, Victoria, Australia as the case study to conduct the comparison. The development is characterised by its strong agenda on improved environmental performance, notably through a reduction in materiality to reduce embodied flows (Moore and Doyon, 2018). The case study is described in detail in Section 2.2.
We used Energy Metric (Beta 0.2), the advanced software tool developed by Stephan (2013), to quantify the embodied energy and greenhouse gas emissions of the development. This program enables

1157
The life cycle embodied energy and greenhouse gas emissions of an Australian housing development: comparing 1997 and 2019 hybrid life cycle inventory data
specification of the dimensions of each building, estimating bills of material quantities and the initial and recurrent embodied environmental flows over a specified period of analysis. It is the only existing software that is able to conduct a hybrid life cycle assessment of buildings and neighbourhoods. We relied on the two versions (Crawford and Treloar, 2010; Crawford et al., 2019) of the hybrid embodied energy and greenhouse emissions coefficients. The use of the same software and assumptions for the quantification of embodied energy and greenhouse gas emissions enables a more robust comparison. The life cycle embodied energy and greenhouse gas emissions are quantified in the software using Equation 1. The quantities of materials within each building within the development are multiplied by their relevant hybrid embodied flow coefficient and by a wastage coefficient that accounts for on-site waste. A so-called input- output remainder is added to the total to account for non-material inputs along the supply chain of the buildings. More details on the quantification approach at a coefficient and building level are available in Stephan et al. (2018) and Crawford et al. (2019), respectively.
Table 1: comparison of the hybrid life cycle inventory databases of 1997 and 2019, by indicator
Indicator 1997 data 2019 EPiC data Number of processes in the process database <200 4,531 Number of input-output sectors 106 (including capital) 114 + 4 sectors for capital expenditure Number of materials 58 284 Environmental flows included Energy, Water Energy, Greenhouse gas emissions, Water
Where: LCEFd is the life cycle embodied flow of the development d in flow unit (e.g. kgCO2e for greenhouse gas emissions); B is the total number of buildings in the development d; A is the total number of assemblies in the building b; M is the total number of materials in assembly a; Qm,a,b,d is the quantity of material m in the assembly a in the building b in the development d (e.g. tonnes of steel); FCm is the hybrid flow coefficient of material m in flow unit per functional unit of material (GJ/tonne); TFBSb,d is the total flow requirement of the input-output sector associated with the building type of building b (e.g. residential building), in flow unit/currency unit (e.g. kgCO2e/AUD); TFRm is the total flow requirement of the input-output pathway representing material m, in flow unit/currency unit (e.g. kgCO2e/AUD); Cb,d is the cost of building b in development d in currency unit (e.g. AUD); POA is the period of analysis in years (e.g. 50 years); SLm is the service life of the material m, in years; NATFRm is the total flow requirement of all input-output pathways not associated with the installation or production process of material m being replaced, in flow unit/currency unit (e.g. kgCO2e/AUD), e.g. pathways representing concrete production when replacing aluminium window frames; and Cm,a,b,d is the cost of the material m used in assembly a, in building b, in development d in currency unit (e.g. AUD).
We subsequently compare the life cycle embodied energy and greenhouse gas emissions at a material and assembly level for each hybrid dataset. This enables us to compare both the initial (upfront) and recurrent embodied energy and greenhouse gas emissions across the 50-year life cycle of the

1158
Alejandro Lara Allende, André Stephan and Robert H.
development, for each database of hybrid embodied flow coefficients. Note that the service life of all materials remains constant across both cases to ensure consistency in the analysis. A flowchart diagram of the research design is presented in Figure 1.
Figure 1: Flowchart of the overall research design. Note: LCI=life cycle inventory; GHG=greenhouse gas
2.2. Case study description
The Nightingale Village (Figure 2) is expected to be finalised in 2021 and will deliver 185 dwellings and integrated services within six mixed-use multi-storey buildings with approximately 14,000m² of gross floor area. Assuming an average of three users per dwelling, the development will host approximately 555 residents. ‘Green’ environmental credentials are claimed following a comprehensive sustainability strategy that touches on the embodied, operational and transport phases of the life cycle, a minimum 7.5 Nationwide House Energy Rating Scheme (NatHERS) rating and an average 80% Built Environment Sustainability Scorecard (BESS) rating across all buildings (Nightingale Housing, 2019).
The materials and construction assemblies of the case study are informed by the architectural plans and materiality schedules included in the planning application documentation advertised by Moreland City Council (2018) to ensure the broadest possible representativeness. Table 2 contains the characteristics of the six buildings of the development.
Figure 2: Perspective of the case study development.

1159
The life cycle embodied energy and greenhouse gas emissions of an Australian housing development: comparing 1997 and 2019 hybrid life cycle inventory data
Table 2. Characteristics of the case study development.
Characteristic Value(s) Average unit area 71.6 m² (including a 6 m² balcony)
Number of units 25, 27, 27, 35, 40, 41 (six buildings with different units in each) Household size (number of occupants per unit) 3
Height between floors 3 m Location Brunswick, Victoria, Australia
Period of analysis (years) 50 Structure type Concrete columns/beams; reinforced concrete slab on ground
Façade R4 exposed precast concrete sandwich panel with no render (with 130 mm of EPS insulation); double glazed aluminium- framed windows (60% and 80% window-to-wall-ratios)
Roof R8 reinforced concrete roof (with 275 mm of EPS insulation) Flooring Recycled hardwood timber flooring in bedrooms and living
areas; precast terrazzo tiles for wet areas. Internal walls Timber-framed internal walls with plasterboard
PV solar panels Monocrystalline (1.2 x 1.8 m), two panels per unit
3. ResultsThe life cycle embodied energy (LCEE) and greenhouse gas emissions (LCEGHG) of the case study development decreased by 17.6% and 5.1%, respectively when using the 2019 EPiC Database, compared to the older database of hybrid coefficients. Table 3 provides the breakdown of the embodied energy and greenhouse gas emissions for each data set. Note the significant initial embodied environmental flows due to the choice of more energy-intensive and emissions-intensive materials, with a longer life span.
Table 3: Life cycle embodied energy and greenhouse gas emissions of the case study development over 50 years, by life cycle stage.
Indicator 1997 data 2019 EPiC data Relative difference
Initial embodied energy (GJ/m²) 25.9 21.9 -15.5%Recurrent embodied energy (GJ/m²) 13.2 10.3 -21.8%Life cycle embodied energy (GJ/m²) 39.1 32.2 -17.6%Initial embodied greenhouse gas emissions (kgCO2e/m²) 1,548 1,526 -1.4%Recurrent embodied greenhouse gas emissions (kgCO2e/m²) 789 692 -12.4%Life cycle embodied greenhouse gas emissions (kgCO2e/m²) 2,338 2,218 -5.1%
The extent of difference in the LCEE and LCEGHG intensities of individual materials between 1997 and 2019 data varies broadly (Figures 3-4). For instance, the LCEE and LCEGHG of paint did not change significantly (+3.8% and +5.1%, respectively), while the LCEE and LCEGHG of sand and stone rose dramatically, increasing by 5,622% and 7,280%, respectively. The LCEE and LCEGHG of glass dropped by ~80%. These changes are in part due to the much higher resolution in the process data of the 2019 database (~4,500 processes), compared to the few hundred processes available in the older version. When applied to the case study development, the ranking of materials changed. Using 1997 data, steel, glass, other finishes, concrete and aluminium where the top five contributors to both LCEE and LCEGHG.

1160
Alejandro Lara Allende, André Stephan and Robert H.
With the 2019 data, this ranking shifts to aluminium, steel, concrete, paint and insulation for LCEE and to concrete, aluminium, steel, paint and insulation for LCEGHG. Ceramics, which are not widely used in the case study development due to their energy-intensive manufacturing process, witnessed a +356% and a +204% increase in their LCEE and LCEGHG. This further supports the design decision to reduce the amountof ceramics in the case study development.
80
70
60
50
40
30
20
10
0
Figure 3: Initial and recurrent embodied energy, using 1997 and 2019 hybrid life cycle inventory data, by material. Note: IEE: initial embodied energy; REE: recurrent embodied energy.
4,500
4,000
3,500
3,000
2,500
2,000
1,500
1,000
500
0
Figure 4: Initial and recurrent embodied greenhouse gas emissions, using 1997 and 2019 hybrid life cycle inventory data, by material. Note: IEGHG: initial embodied greenhouse gas emissions; REGHG: recurrent
embodied greenhouse gas emissions.
2019 data - REGHG 2019 data - IEGHG
1997 data - REGHG
1997 data - IEGHG
Prim
ary e
nerg
y ov
er 5
0 ye
ars (
TJ)
Gree
nhou
se g
as e
miss
ion
over
50
year
s (tC
O2e
)
-54.
8%
-43.
7%
-83.
8%
-80.
8%
-98.
0%
-97.
6%
-42.
9%
+28.
9%
+41.
8%
+93.
8%
-54.
5%
-50.
0%
+3.8
%+5
.1%
-58.
4%-5
2.9%
+46.
5%+2
7.9%
-69.
9%-7
2.6%
+356
.2%
+203
.5%
-93.
1%-9
1.1%
+29.
2%+2
3.5%
+728
0.4%
+562
2.3%

1161
The life cycle embodied energy and greenhouse gas emissions of an Australian housing development: comparing 1997 and 2019 hybrid life cycle inventory data
100
90
80
70
60
50
40
30
20
10
0
6,000
5,000
4,000
3,000
2,000
1,000
0
Figure 5: Initial and recurrent embodied energy (top) and greenhouse gas emissions (bottom), using 1997 and 2019 hybrid life cycle inventory data, by assembly.
Figure 5 depicts the life cycle embodied energy and greenhouse gas emissions of the case study development, by assembly type, using 1997 and 2019 data. It shows a significant reduction in both embodied energy and greenhouse gas emissions, across most assembly types. These reductions range from -18.4% to -98.2% and from -15.3% to -98.4% for embodied energy and greenhouse gas emissions,
2019 data - REE 2019 data - IEE 1997 data - REE 1997 data - IEE
2019 data - REGHG 2019 data - IEGHG 1997 data - REGHG 1997 data - IEGHG
Gre
enho
use
gas e
miss
ions
ove
r 50
year
s (tC
O2e
) Pr
imar
y en
ergy
ove
r 50
year
s (TJ
)
-49.
6%
-32.
8%
-95.
0%
-93.
8%
-18.
4%
-15.
3%
-51.
4%
-17.
7%
-52.
3%
-19.
4%
+60.
3%
+49.
7%
-46.
6%
+4.7
%
-46.
4%
-21.
4%
-46.
6%
-26.
0%
-54.
6%
-43.
6%
-58.
1%
-30.
9%
-62.
1%
-32.
8%
-50.
3%
-55.
7%
-50.
3%
-55.
7%
-48.
5%
+20.
1%
-27.
7%
-26.
4%
-49.
6%
-35.
7%
-98.
2%
-98.
4%
-37.
4%
-50.
7%
+308
5.1%
+2
399.
1%
+80.
0%
+73.
7%

1162
Alejandro Lara Allende, André Stephan and Robert H.
respectively. The most notable decrease is in the embodied energy and greenhouse gas emissions of photovoltaic panels, both in absolute and relative terms. Some assemblies such as finishes (+60.3% and +49.7%) and flooring (ceramic tiles) (+2,399% and +3,085%) witness an increase in their embodied energy and greenhouse gas emissions. The ranking of assembly types by life cycle embodied energy is notsignificantly affected, with the top five assembly types remaining the same, except for other finishesreplacing photovoltaic panels due to their respective increase and drop. Note that the top five assemblycategories by life cycle embodied greenhouse gas emissions using 2019 data is the same as for embodied energy, except for upper floor slabs replacing beams at the 5th position. Non-material inputs across thesupply chain represent 179.3 TJ and 10,673 tCO2e using 1997 data. These change to 255.7 TJ (+42.6%) and 15,791 tCO2e (+48%) when using the new data. We did not plot these on the graphs since they are notassociated with a particular material or assembly but they are extremely significant, representing moreembodied energy and greenhouse gas emissions than any assembly category, when using either 1997 or2019 data. The increase is non-material inputs is due to the fact that the overall energy and greenhousegas emissions intensities of the Residential Building Construction sector have remained similar in GJ/AUD and kgCO2e/AUD, while the price of construction per square metre has increased following the baseinflation rate.
4. Discussion and conclusionThis study compared the initial and recurrent embodied energy and greenhouse gas emissions of a new housing development, based on LCI data from 1997 and 2019. Results show an overall decrease in life cycle embodied energy and greenhouse gas emissions when using more recent data. This is due to multiple factors. Firstly, there was an overall increase in the energy efficiency of industrial processes over the last two decades, which is translated into reduced embodied energy and greenhouse gas emissions. For example, state-of-the-art kilns used for cement production can significantly reduce greenhouse gas emissions during the firing process (Habert et al., 2020). Secondly, the 2019 data integrates significantly more detailed process data compared to the 1997 data, which reflect far more accurately the relevant industrial processes of specific materials. Table 1 provides a more detailed comparison of the 1997 and 2019 data. Despite these significant changes in the embodied energy and greenhouse emissions of materials, the ranking of assembly types is not significantly affected. This means that the areas of focus to reduce embodied energy and greenhouse gas emissions remain fairly similar, i.e. reducing glazed surfaces, removing unnecessary partitions, reducing the amount of finishes where possible, and carefully choosing structural materials. However, when looking at particular materials, the new data shows significant changes to embodied energy and greenhouse gas emissions intensities.
The proportion of process data to input-output data for a specific material can have a considerable effect on its hybrid embodied energy and greenhouse gas emissions coefficient/intensity. Where limited process data is available for a specific material, a high proportion of the coefficient is represented by input-output data. If the total flow requirement of the input-output sector representing the material underestimates the embodied energy or greenhouse gas emissions of the material, then the resultant coefficient will likely end up being lower than reality. In this situation, as more process data is included, the coefficient increases, as has happened with the 2019 data for ceramics and aluminium, as seen in Figure 3 and 4. However, if the input-output data overestimates the embodied energy or greenhouse gas emissions for a material, adding more process data will likely reduce the coefficient. This is what has happened with the 2019 data for steel and glass, as can be seen in Figure 3 and 4. One way in which an overestimation can occur with the use of input-output data is related to the cost of the material. The use of input-output data relies on the use of material costs and the resultant embodied energy or greenhouse

1163
The life cycle embodied energy and greenhouse gas emissions of an Australian housing development: comparing 1997 and 2019 hybrid life cycle inventory data
gas emissions coefficient is directly proportionate to the cost of the material (see Equation 1). This is a limitation of the use of this data, as often cost is not directly proportionate to energy use or greenhouse gas emissions. However, research has shown that the use of input-output data in this way is much better than just excluding the embodied energy or greenhouse gas emissions not covered by the available process data (Crawford, 2008; Pomponi and Lenzen, 2018). If material costs are overestimated, this can artificially inflate the embodied energy or greenhouse gas emissions coefficient of a material. Despite this, as Crawford (2008) has shown, input-output data can be a good representation of process data, but this does not usually diminish the importance of using process data where it is available as it is usually more representative of reality. This means that while coefficients for materials have fluctuated both up and down between 1997 and 2019, it is most likely that the 2019 values are more representative of reality given the much higher proportion of process data used.
At a whole development level, increases in the embodied energy or greenhouse gas emissions intensities of particular materials are compensated by decreases in others. This results in a slight decrease in the overall embodied energy and greenhouse gas emissions intensity of the entire case study development, over the 50-year period of analysis (-17.6% and -5.1%, respectively).
The field of LCA and associated data availability and quality continues to be an area in which further development is needed. This study shows that access to comprehensive and reliable data has improved over recent decades. However, users should continue to be cautious when relying on this and similar data to make design decisions.
Authors contributions AS and RC conceptualised the study. ALA collected the case study data, conducted the analysis and produced the results, under the supervision of AS. ALA, AS and RC wrote the manuscript. AS and RC revised the manuscript. ALA and AS created the figures.
Acknowledgements This work is based on the Masters thesis of Alejandro Lara Allende in the Master of Urban Planning at the University of Melbourne, Australia, supervised by André Stephan.
References Australian Life Cycle Assessment Society (ALCAS) (2011) The Australian National Life Cycle Inventory Database
(AusLCI). Available from: <www.auslci.com.au> (accessed 17 August 2020). Crawford, R. H. (2008) Validation of a hybrid life cycle inventory analysis method, Journal of Environmental
Management, 88(3), 496-506. Crawford, R. H. (2011) Life cycle assessment in the built environment, Spon Press, London. Crawford, R. H., Bontinck, P.-A., Stephan, A., Wiedmann, T. and Yu, M. (2018) Hybrid life cycle inventory methods – a
review, Journal of Cleaner Production, 172, 1273-1288. Crawford, R. H., Stephan, A. and Prideaux, F. (2019) Environmental Performance in Construction (EPiC) database, The
University of Melbourne, Melbourne. Crawford, R. H. and Treloar, G. J. (2010) Database of embodied energy and water values for materials, The University
of Melbourne, Melbourne. European Standard 15978 (2011) Sustainability of construction works -Assessment of environmental performance of
buildings - Calculation method, European Committee for Standardization (CEN), Brussels, 66.

1164
Alejandro Lara Allende, André Stephan and Robert H.
Habert, G., Miller, S. A., John, V. M., Provis, J. L., Favier, A., Horvath, A. and Scrivener, K. L. (2020) Environmental impacts and decarbonization strategies in the cement and concrete industries, Nature Reviews Earth & Environment.
IPCC (2014) Climate change 2014: mitigation of climate change. Contribution of working group III to the fifth assessment report of the intergovernmental panel on climate change, in O. Edenhofer, R. Pichs-Madruga, Y. Sokona, J. C. Minx, E. Farahani, S. Kadner, K. Seyboth, A. Adler, I. Baum, S. Brunner, P. Eickemeier, B. Kriemann, J. Savolainen, S. Schlömer, C. v. Stechow and T. Zwickel (eds.), Cambridge University Press, Cambridge.
IPCC (2018) Global Warming of 1.5°C. An IPCC Special Report on the impacts of global warming of 1.5°C above pre- industrial levels and related global greenhouse gas emission pathways, in the context of strengthening the global response to the threat of climate change, sustainable development, and efforts to eradicate poverty, Cambridge University Press, United Kingdom.
Lenzen, M. and Crawford, R. H. (2009) The Path Exchange Method for Hybrid LCA, Environmental Science & Technology, 43(21), 8251-8256.
Majeau-Bettez, G., Strømman, A. H. and Hertwich, E. G. (2011) Evaluation of process- and input-output-based life cycle inventory data with regard to truncation and aggregation issues, Environmental Science & Technology, 45(23), 10170-10177.
Moore, T. and Doyon, A. (2018) The Uncommon Nightingale: Sustainable Housing Innovation in Australia, Sustainability, 10(10).
Moreland City Council (2018) Nightingale Village Masterplan: Town Planning Application, Kennedy Nolan; Clare Cousins Architects; Architecture Architecture; Hayball; Austin Maynard Architects; Breathe Architecture., Melbourne, Australia.
Nightingale Housing (2019) Nightingale Village. Available from: <https://nightingalehousing.org/nightingale-village> (accessed 24 April, 2019).
Pomponi, F. and Lenzen, M. (2018) Hybrid life cycle assessment (LCA) will likely yield more accurate results than process-based LCA, Journal of Cleaner Production, 176, 210-215.
Stephan, A. (2013) Towards a comprehensive energy assessment of residential buildings. A multi-scale life cycle energy analysis framework, Ph.D. thesis, ULB-BATir - Building, Architecture and Town planning and UoM-ABP - Architecture, Building and Planning, Université Libre de Bruxelles and The University of Melbourne, Brussels.
Stephan, A., Crawford, R. H. and Bontinck, P.-A. (2018) A model for streamlining and automating path exchange hybrid life cycle assessment, The International Journal of Life Cycle Assessment, 24(2), 237-252.
Yin, R. K. (2018) Case study research and applications: design and methods, Sixth ed., SAGE, Los Angeles.

1165
The 54th International Conference of the Architectural Science Association (ANZAScA) 2020
The New Zealand Construction Industry and Sustainable Construction through C&D waste minimisation: a review of the
life cycle approach
Rohit Gade1, Jeff Seadon2 and Mani Poshdar3 1-3Auckland University of Technology, Auckland, New Zealand
[email protected], [email protected] , [email protected]
Abstract: The construction industry is at the core of the global economy and in New Zealand it is the fifth largest industry. One global issue with the construction industry is that it generates a large amount of waste; making it unsustainable. In N.Z., Construction & Demolition (C&D) waste is the most prevalent waste stream and contributes to half of the landfill waste. In recent years, C&D waste has become an alarming issue for the N.Z. construction industry and emphasises the urgent need for waste minimisation. This research study adopts in-depth review of literature. The literature findings on the state-of-the-art of C&D waste minimisation suggested that the current waste minimisation approaches are far from optimum and need integration to increase their practicability. In addition, the review of the literature shows that the N.Z. construction industry needs to adopt life cycle study, i.e. Pre-design, design, construction, refurbishment, and demolition to minimise C&D waste. Further, some of the factors which need special attention are; industrial diversity thinking during pre-design, change in scope while designing, poor resource management during construction, and lack of secondary market. The N.Z. construction industry needs to adopt a circular resource thinking to achieve circular economy; ultimately advocate sustainable construction.
Keywords: Construction industry; sustainable construction; construction & demolition waste; New Zealand
1. IntroductionThe word construction has its root from the Latin word "construere" which means putting together
(Oxford, 1968). The existence of building construction is parallel to the existence of the human settlement. The modern-day definition of construction includes activities such as build, operate, install, repair, and refurbish (Worksafe NZ, 2017). The construction industry (CI) is an organised performance of such activities by people to create a sustainable built environment (Les, 2006). According to Australian and New Zealand Standard Industrial Classification (ANZSIC), 2006, code E, CI includes the construction of buildings and other structures with their additions, alterations, reconstruction, installation,
Imaginable Futures: Design Thinking, and the Scientific Method. 54th International Conference of the Architectural Science Association 2020, Ali Ghaffarianhoseini, et al (eds), pp. 1165–1174. © 2020 and published by the Architectural Science Association (ANZAScA).

1166
Rohit Gade, Jeff Seadon and Mani Poshdar.
maintenance, and repairs, while it excludes manufacturing . The ANZSIC definition was further bifurcated by BRANZ by diving all building structures into three different types; Residential, non- residential and infrastructure (Ministry of Business Innovation and Employment, 2017).
The CI has always been a topic of interest not only for businessmen but also for different institutions and recognised as one of the largest industries in most of the countries due to its competitiveness and profit-driven nature (Timofeeva, 2017). The construction sector is at the core of the global economy. As an industry, construction accounted directly for 6% of global GDP with China as the frontrunner through its 3.1 trillion USD construction market followed by the USA and Japan with 1.2 trillion USD and 470 billion USD respectively (World Economic Forum, 2017). In N.Z., in 2019, the CI worth 39 billion NZD with the largest share of 16 billion NZD from Auckland and predicted to grow until 2023 (MBIE, 2019). However, the growth and contribution brought concerns. The Auckland CI suffered from unsustainability due to its poor resource consumption, high Construction & Demolition (C&D) waste generation, and high energy and water consumption (Purchas and Ainsworth, 2019).
Sustainable Construction (S.C.) has become an urgent need for New Zealand CI due to its rapid growth and increasing concerns. S.C. is a broad topic and includes social, economic, and environmental aspect commonly known as Triple Bottomline Approach (TBL) (Purchas and Ainsworth, 2019). These aspects are interdependent, and enhancing one can result in benefits for the other two. For example, construction projects prove economically viable and provide good social standards of living when the environmental aspect is given proper consideration during the life cycle of the project (Vatalis et al., 2011). From the extraction of natural resources to disposal of C&D waste into landfill CI is encompassed within the environment. Hence, many studies argued that environmental aspect needs special consideration form industry practitioners to advocate S.C. (Akotia, 2014). The environmental aspect is often subject to issues such as air pollution, scarcity of water, poor consumption of natural resources, and high C&D waste generation (United Nations Environment Programme, 2015).
C&D waste is not only a concern of CI in N.Z. but also a global threat to S.C. In N.Z., C&D waste is referred to as "non-household and non-putrescible waste generated from the construction, renovation, repair, and demolition of structures" (Waste Management Institute New Zealand, 2018). Worldwide, every year, a broad group of Municipal Solid Waste (MSW), Commercial & Industrial (C&I) waste, and C&D waste estimated to be 7-10 billion tonnes with China contributing 2 billion tonnes of C&D waste (UNEP, 2015; Wu et al., 2019). In N.Z., 3.5 million tonnes of C&D waste is generated every year, which contributes to half of the landfills nationwide (NZ Transport Agency, 2019). In Particular with Auckland, C&D waste is the largest waste stream and some of the factors that influence high C&D waste are; lack of industrial diversity thinking during pre-design; poor selection of green materials while design; inefficient resource handling and management during construction; and lack of secondary market for recycled products after the demolition (Auckland Council, 2019; Purchas and Ainsworth, 2019).
Eliminating waste as per their occurrence over the life cycle of a project, in other words, providing a solution to factors influencing the waste at each stage is referred as waste minimisation (Phillips et al., 1999). The CI adopts different techniques of waste minimisation, but all are classified under two broad categories of; waste minimisation at source and waste minimisation by recycling. The former design out waste, while the latter offers treatment to materials after their useful life (Environmental Protection Department, 2003). Further, CI adopts various waste minimisation approaches such as; waste management hierarchy, guidelines and regulations, and waste minimisation tools. The waste management hierarchy is a structure that represents a step by step procedure to handle the waste (Ministry for the Environment, 1997). The regulations include waste levy and compulsory waste

1167
The New Zealand Construction Industry and Sustainable Construction through C&D waste minimisation: a review of the life cycle approach
management plan and common tools used to minimise C&D waste are; lean construction, supply chain management, and building information modelling (Building Research Association of New Zealand, 2014).
The current situation in N.Z., in particular, Auckland suggest that, C&D waste is a growing concern and an environmental threat. This research adopts a systematic review of literature approach to understand what factors influence high C&D waste generation over the life cycle of a project, the current industry practices of waste minimisation, and opportunities and challenges in waste minimisation. Further, this research offers a standalone viewpoint on factors that needs special consideration from CI to minimise C&D waste effectively.
The remainder of this paper is organised as follows: Section 2 explains historical development, importance and contribution of CI; Section 3 overviews Sustainable Construction and its challenges; section 4 discusses C&D waste and waste minimisation; section 5 reviews various waste minimisation approaches, and section 6 concludes the paper with future recommendations.
2. Construction Industry, historical development, importance andcontribution
The word construction has its root from the Latin word "construere "which means putting together (Oxford, 1968). In the context of a building, construction defined as the execution of building works with the management of construction activities (Worksafe NZ, 2017). The construction industry (CI) is an organised performance of construction activities delivered through the consumption of resources (humankind, material, and machinery) ( Fernandez-Solis and Arch, 2019). The history of construction and CI have long roots. Agricultural revolution around 12,000 BC years ago triggered early human settlement and humans started to build earth homes instead of hut shelters (Tattersall, 2013). Different parts of the world experience different sites of human settlement in later centuries such as construction site at Catal Huyuk around 7000 BC and Mohanjo Daro around 3250 BC (United Nations Educational Scientific and Cultural Organisation, 2012; Vesilund et al., 2002). Over the years, humans started working as a team and improved their construction skills. The construction of the Great Pyramids of Giza around 2500 BC can be said to be the first notable construction performed by the Construction Industry (Tecle and Mahelet, 2012). The Babylonian king Hammurabi from 18th century B.C. established the first platform of the Construction Industry. He made 282 different edicts which included family laws, administrative laws, and professional contracts. The laws laid the foundation for the establishment of the modern-day CI (Harper, 1904).
N.Z. considered the last landmass in the world to be occupied by humans. The history of first human settlement in New Zealand was still a topic of debate, but most believed that it was dated back around the 13th century (Irwin and Walrond, 2016). The history of first dwelling appeared around the same time, and the early homes in N.Z. were constructed with wooden frames covered in leaves with mats on earth floors (Brown, 2014). The country experienced growth in population around 15th-century when Polynesian people started to settle. As a result, the concept of sleeping houses with several rooms was introduced (Brown, 2014).
Further, pataka (storehouse), and kauta (cooking house) were added to existing houses (Brown, 2014). The European settlers arrived in N.Z. on several occasions between 16th to 18th century, and many of the natives adopted European-styled houses after this period with the introduction of high roofs and glass windows as an addition to timber homes (Watters, 2018). In the late 18th-century building materials such as nails, sawn timber, and metal sheets were first used in N.Z. for construction

1168
Rohit Gade, Jeff Seadon and Mani Poshdar.
work (Brown, 2014). At the beginning of the 19th century, many construction firms were established, and this laid cornerstone of the N.Z. construction industry. During the mid-19th century, the infrastructure demand had increased demand for factories, schools, hospitals, and offices (Walrond, 2010). In the early and mid-70s, N.Z.'s economy took a downturn, but by late 1980s, it rose with investment from the government and private sector (Stats NZ, 1980). Table 1 shows the economic contribution of the N.Z. construction industry to total GDP and Employment.
Table 1: Contribution of the construction industry to total GDP and Employment of New Zealand
Year Value of Construction GDP contribution Employment References
In 2018, for every 10-working people in N.Z., 1 was a construction industry employee with Auckland as the largest shareholder (MBIE, 2018). Residential building activity became the biggest contributor to national construction (MBIE, 2018). In addition to the private sector, the government of N.Z. had also invested in residential construction by introducing "Kiwibuild" programme for 100,000 new homes (MBIE, 2018). The N.Z. construction industry experienced substantial growth in every sector. In the last 40 years, CI witnessed dramatic fluctuations, but it was predicted that until 2023 CI grow gradually (MBIE, 2018). With a total value of 41.4 billion NZD, and Auckland with the highest regional value of 17 billion NZD. The construction Industry in Auckland, and New Zealand, services almost all other industries by creating economic value or by creating infrastructure (MBIE, 2018). Unfortunately, the impact of industry was not solely positive (Auckland Council, 2019). The industry suffered from some serious concerns, including, but not limited to, high material consumption, carbon emissions, high energy consumption, and waste generation (Thomas, 2018; Purchas and Ainsworth, 2019).
3. Sustainable Construction
The word "Sustainable" indicates an ability to perform efficiently for a long time without little or no damage to the environment and the modern-day records suggests that it was first used in 1924 in the context of resource consumption (Cambridge University Press, 2008). In 1973-74, six Middle Eastern countries lowered their import of oil which resulted in higher demand for oil in the international market. The oil crisis introduced uncertainty about future demand and availability of oil; hence many countries choose to optimise their oil consumption to avoid fall of the economy and to maintain the infrastructure growth (Mitchell, 2010). According to Brundtland Commission, "Sustainable Development" can be defined as "Development that meets the needs of the present without compromising the ability of future generations to meet their own needs" (United Nations, 1987).
Industry (NZD billions) (%) Contribution (%)
1980 2.6 5.6 7.5 Stats NZ, 1980
2000 10 3.3 6.2 Stats NZ, 2000
2005 18.5 4.9 7.7 Stats NZ, 2006
2010 21.3 4.5 6.2 Stats NZ, 2010
2015 32 6 9.1 MBIE, 2015
2018 37 6.1 10 MBIE, 2018

1169
The New Zealand Construction Industry and Sustainable Construction through C&D waste minimisation: a review of the life cycle approach
'Sustainable Construction' often considered as a subset of "Sustainable development" which includes 'cradle to cradle' approach that allows circular resources thinking (NZGBC, n.d). In the New Zealand CI, SC has often been translated as sustainable building or Green building, and at the beginning of sustainable development in construction the industry used term S.C. for many years until the concept of the green building became famous in N.Z.; all the terms promote balancing of Triple Bottomline Approach (TBL) (Building Act, 2004). The New Zealand Green Building Council defines Green building as 'a building with optimising the consumption of resources throughout the lifecycle of a project (NZGBC, n.d.). History of S.C. in N.Z. showed that the concept of protecting the environment has always been topic of interest in N.Z. and after the Brundtland Commissions definition of sustainable development, the environmental agenda was reassured again (MfE, 2007). The government of N.Z. took its first initiative towards S.C. by introducing the Resource Management Act (RMA) in 1991. As per Section 5 of the RMA, the use of natural and physical resources has to be optimised and should allow social, economic and environmental well-being for everyone (RMA, 1991). The act provided a sustainable framework towards resource consumption by considering the environment at the centre in the definition of S.C. (RMA, 1991).
Though the act gave equal rights and responsibilities to every user towards protecting the environment, some believed that the act was time-consuming, provides only environmental benefits and hinder overall sustainability (Parliamentary Commissioner for the Environment, 1998). In response to the "only environment focused" argument, the N.Z. government introduced the Building Act in 1992 to address all sustainable aspects under one title (Building Act, 1992). The act established building regulations in 1992 and clause F 5.3.1 from building code promoted the S.C. agenda by covering a range of areas from personal hygiene to energy efficiency. In addition, it also introduced guidelines on how to avoid construction and demolition hazards. Overall, the act established social and economic equality, along with the environmental aspect (Building Act, 1992). In later years, the construction industry and its output grow and to address each environmental issue. The N.Z. government published separate regulations (MfE, 2005). As a part of this, the Energy Efficiency and Conservation Act 2000 was introduced. The purpose of the Act was to promote national energy efficiency and conservation strategy through the introduction of energy efficiency, energy conservation, and the use of renewable sources of energy. (Energy Efficiency and Conservation Act, 2000).
During a similar time, the private sector developed their interest in the sustainable built environment, and BRANZ produced their first report on "Built environment and climate change" (Camilleri, 2000). The research identified different climate-changing factors that can affect the built environment and concluded that the issue of flooding and house overheating needs to address quickly to make CI sustainable. In later years, BRANZ investigated different built environment issues such as leaky buildings, excess building energy consumption, fire-safety, construction waste and provided solutions to such issues (BRANZ, n.d.). To promote S.C. awareness at district levels government introduced the Local Government Act in 2002. The act provided power to the local authority to deal with district-level sustainability issues (Local Government Act, 2002). In the same year, MfE introduced a guide to the management of cleanfills to tackle the waste issue. The guide mentioned that; C&D waste was the primary source of waste sent to landfills (MfE, 2002). The guide provided waste acceptance criteria and the best possible methods to manage cleanfills (MfE, 2002). Further, the N.Z. government introduced the Building Act 2004 in N.Z. (Building Act, 2004). The Act introduced guidelines for construction, alteration, demolition and maintenance. The Building Code under the Act described how a building must perform in its intended use rather than describing

1170
Rohit Gade, Jeff Seadon and Mani Poshdar.
how it should be design and constructed (Building Act, 2004). The Act introduced several amendments in the next few years by considering political drivers, social expectations, and adaptation of new construction technologies. The reformation strengthens overall sustainability framework (Buckett, 2014). However, researchers believed that the Act can be still improved. Section 18 of the Act mentioned that building work is not required to achieve performance criteria additional to the Building Code. It allowed contractors to set a baseline for minimum expectation. Instead, the section can be redrafted as "Any building work complies to sustainable building guidelines will have priority for resource consent, also, on validation of the building as a green building the contractor may demand incentives from a client (Kirpensteijn, 2017). Both public and private sector made their contribution towards S.C. awareness and implementation. The public sector added an initiative through the introduction of the Green Building Council (GBC). The New Zealand CI formed their own GBC (NZGBC) in 2005 and collaborated with WorldGBC a year after (NZGBC, n.d.). It started a new era for S.C. with a synonym of green building. The WorldGBC defined "green building" as a building that creates positive impacts on the environment through design, construction, and operation of construction activities; to enhance the quality of life. The term "green building" evolved constantly, and different countries have different definitions, depending upon their climate, culture, traditions, socio-economic benefits, and environmental impact (WorldGBC, n.d.). In other words, challenges faced by CI are listed down under the title of green building, to convertthem into opportunities (WorldGBC, n.d). In 2008, the N.Z. government introduced the WasteMinimisation Act (WMA) to tackle the waste issue and promote sustainability (WMA, 2008). Although the acts published over the years advocate S.C., their implementation was loosely conducted by CI. As a result,CI suffer from many challenges and Table 2 overviews some key challenges.
Table 2: S.C. challenges in N.Z. construction Industry
Challenges Pre -Design Design Construction Demolition Reference Social Physical and
mental health Understanding of CI culture
Economic Feasibility study of resource Precise cost
analysis
Environmental Balancing ecosystem
Education and training
Political influence
Lack of Health, Safety
Quality of life against the
cost Rising costs of construction
Effect of materials on environment
People "At the centre" approach Cultural values of
CI people
Labour & capital shortages
Adaptation of expensive
technologies Atmospheric
emission Use of local
materials
Less demand for reuse
Illegal dumping of waste
Cost of waste collection
Low profit on recycled material
Skill & expertise to demolish buildings
Warnock, 2005;
Thomas, 2018
NZGBC, 2015; Beacon
Pathway, 2006
Byrd and Leardini, 2011;
It can be seen from Table 2 that, some of the important S.C. challenges are poor understanding of S.C., cost of construction, resource consumption, energy efficiency, skill shortage, indoor quality, water use and recycling and C&D waste (Beacon Pathway, 2006; Byrd and Leardini, 2011; Thomas, 2018). The next section overviews C&D waste and its minimisation.

1171
The New Zealand Construction Industry and Sustainable Construction through C&D waste minimisation: a review of the life cycle approach
4. C&D wasteThe word "waste" means empty or desolate and received its modern-day meaning in 15th century (Petrák, 2016). According to U.N. Statistical Division "waste can be considered as materials that are not prime products with no further use for their purpose of production, transformation or consumption, and which need to discard, or intend or is required to discard" (UN Statistics Division, 2011). In the context of OECD countries, waste referred to any "unavoidable materials for which there is currently or no near- future economic demand and for which treatment and/or disposal may be required" (OECD, 1997). In the context of building construction, any substance or object generated during C&D process, which the holder discards or intends or is required to discard is known as C&D waste (European Council, 1991). In N.Z., C&D waste referred to waste generated during the construction, repair, maintenance, refurbishment, and demolition, including contaminated soil (Auckland Council, 2019). Figure 1 shows the C&D waste generated in 2018 in different regions of the world.
Figure 1: C&D waste generation in different regions of the world (UNEP, 2015; World Bank Group, 2018)
In N.Z., the 1990s construction boom put C&D issue upfront, and in 1995 C&D waste became third- largest waste stream after organic and paper and ever since it is increasing (MfE, 1997). By early 2010, C&D waste represented a quarter of total landfill waste, and by 2016, half of the landfill (Auckland Council, 2017). In 2018, C&D waste became one of the largest waste streams in N.Z., with 20 % of all waste going to landfill and 80 % to Cleanfill (NZ Transport Agency, 2019). In particular, with Auckland, C&D waste was the largest waste stream and contributed to half of the landfill waste (Auckland Council, 2018). Various factors influence high C&D waste, and Figure 2 shows some of the key factors considering the life cycle of a project.
Figure 2: Factors influencing C&D waste generation (Ali et al., 2018; Islam et al., 2019)

1172
Rohit Gade, Jeff Seadon and Mani Poshdar.
4.1. Waste minimisation
C&D waste minimisation often guided by the need for a sustainable built environment and considered as a subset of waste management(BRANZ, 2014). There are different perspectives to define C&D waste minimisation, and all are considered under two broad categories; i) at source, and ii) by recycling (BRANZ, 2014). Waste minimisation 'at source' referred to the minimum consumption of resource at the beginning of the project, while 'at recycling' referred to the usage of recycled materials that have reached the end of their useful life (BRANZ, 2014). In addition, by source waste minimisation design out waste before it becomes physical waste, while waste minimisation by recycling deals with physical waste and minimises waste through reuse and/or recycle and/or recover (EPD, 2003). The CI has adopted various waste minimisation approach, as explained in the next section.
5. C&D waste minimisation approaches
5.1. Waste Management Hierarchy
The waste management hierarchy was introduced in N.Z. in the early 90s. In 1990 the N.Z. government introduced National Waste Management Policy to minimise solid waste through the application of reduction techniques (MfE, 1997). The policy promoted recycling at the local level, and in 1992 it was revised to add a waste management hierarchy for achieving the best possible waste minimisation results (MfE, 1997)). The N.Z. version of the waste hierarchy includes six different steps; Reduction, reuse, recycle, recover, treat, dispose or residual dispose. The first step of the guide (reduction) was most preferred to increase sustainable standards while the last step (dispose) was least preferred to avoid degradation of such standards (MfE, 2009). The current practices in N.Z. lack in implementing the waste management hierarchy effectively, and as a result, C&D waste is becoming a national concern (Purchas and Ainsworth, 2019).
5.2. Guidelines and Regulations
The conservation of the environment through guidelines and regulations has been the interest of the N.Z. government for decades (Nathan, 2007). Some of the earliest examples of such interest are Nelson Water Works Act (Nelson Waterworks Act, 1863) for the wastewater issue and Dunedin city Fish- markets and Empowering Act (Dunedin City Fish-Markets And Empowering Act, 1918) for addressing the issue of waste product from fish. During the early 90s, the government increased its concerns over resource efficiency and published RMA (RMA, 1991), building regulations (Building Act, 1992), and N.Z. waste strategy (MfE,1997). Further, between 2000- 2008, different waste management regulations were published to achieve S.C. For example, landfill guidelines in 2000 (MfE, 2002a), zero waste strategy in 2002 (MfE, 2002b), cleanfill guidelines in 2002 (MfE, 2002a) and the Waste Minimisation Act in 2008 (WMA, 2008). The highlights of the Act were the introduction of the waste levy, product stewardship, and the role of territorial authorities to promote waste minimisation and management. Clause 43 of the Act required territorial authorities to have a Waste Management and Minimisation Plan (WMMP), and clause 51 required waste assessments (WMA, 2008).
5.3. Tools
In addition to the guidelines and regulations enforced by governmental organisations, there are few non-governmental organisations such as BRANZ who has own C&D waste minimisation guidelines

1173
The New Zealand Construction Industry and Sustainable Construction through C&D waste minimisation: a review of the life cycle approach
dedicated to helping industry and community (BRANZ, 2014). The Auckland council and BRANZ collaborated to resolve C&D waste issue and formed the Resource Efficiency in the Building-Related Industries (REBRI) programme in 1995 (BRANZ, n.d.). The REBRI programme grows over the years and published waste minimisation guidelines from project tendering to the deconstruction stage (BRANZ, 2014). The REBRI programme adopted LCA and provided different tools such as resource routing calculator, waste management plan, recycling directory, and waste transfer form (BRANZ, n.d.). The use of Lean Construction and Supply Chain Management for minimising C&D waste was not a common practice in N.Z. However, few validated case studies suggested that the application of lean tools helped to minimise C&D waste through source reduction and on-site sorting (Vilasini, 2014) and practice of SCM for material procurement promotes environmental benefits (Samarasinghe, 2014). The use of Building Information Modelling for C&D waste minimisation had been in practice worldwide since long, and in N.Z., it had been around for a decade ( Construction Excellence NZ, 2010). Similarly, simulation in construction had also been avoided. However, it had been argued that simulation is the future of New Zealand CI as it provides better decision-making choices by understanding the real-time process which helps to track the origin of the waste (Zaeri, 2017).
6. Conclusions and future recommendationsThe rapid urbanisation and increasing demand for infrastructure in N.Z. are posing a threat to a sustainable built environment. The in-depth review of the literature suggests that advocating S.C. through C&D waste minimisation while considering the life cycle of a project received less interest from both academic scholars and industry practitioners. Although the N.Z. government and private sector have introduced guidelines, regulations and tools for waste minimisation, the construction industry still lacks in providing desired outcomes. Some of the factors which require special attention from the construction industry are; early involvement of stakeholders, eco-labelling of materials, coordination and communication among all stakeholders, specification writing, handling and storing of material, waste sorting and management, and secondary market for recycled products. This study proposes findings based on the literature and recommends further study to be done in practice to integrate the current findings. In addition, the study opens a new pathway to understand C&D waste through a life cycle approach in N.Z. construction industry, and more studies in this area are required to propose a waste minimisation framework.
References Ali, S. F., Ali, A. & Bayyati, A. 2018. Factors affecting the construction waste management in terms of refurbishing,
reusing or recycling. Beacon Pathway 2006. Barriers and Incentives to Sustainable Building in Auckland Auckland, New Zealand. BRANZ. n.d. Research reports [Online]. New Zealand. Available:
https://www.branz.co.nz/cms_display.php?st=1&sn=18&pg=17270 [Accessed 8 July 2019]. Buckett, N. 2014. A code to build by. Build Magazine. New Zealand. Building Act 1992. Building Regulations 1992. New Zealand. Building Act 2004. Building Act 2004. In: Housing, D. o. B. a. (ed.). New Zealand: Parliamentry Counsel Office. Byrd, H. & Leardini, P. 2011. Green buildings: Issues for New Zealand. Procedia Engineering, 21, 481-488. Cambridge University Press 2008. Cambridge Advanced Learner's Dictionary, Cambridge University Press. Camilleri, M. J. 2000. Implications of Climate Change for the Construction Sector: Houses New Zealand: Bulding
Research Association of New Zealand (BRANZ). Construction Excellence NZ 2010. Constructing Great New Zealand Projects New Zealand.

1174
Rohit Gade, Jeff Seadon and Mani Poshdar.
Energy Efficiency and Conservation Act 2000. Energy Efficiency and Conservation Act 2000. New Zealand: New Zealand Govrnment.
Islam, R., Nazifa, T. H., Yuniarto, A., Shanawaz Uddin, A. S. M., Salmiati, S. & Shahid, S. 2019. An empirical study of construction and demolition waste generation and implication of recycling. Waste Management, 95, 10-21.
Kirpensteijn, H. 2017. Planning for Green Building Design and Technology in New Zealand. Masters, Lincoln University.
Local Government Act 2002. Local Government Act 2002. In: Affairs, D. o. I. (ed.). Wellington, New Zealand: Crown copyright.
MBIE 2015. National Construction Pipeline Report 3 New Zealand: Government of New Zealand. MBIE 2018. National Construction Pipeline Report 2018. In: Emloyment, M. o. B. I. (ed.) 6th ed. New Zealand:
Ministry of Buisness Innovation & Emloyment. MfE 2002. A guide to the mangement of cleanfills. In: Environment, M. f. t. (ed.). Wellington, New Zealand. MfE 2005. Sustainable developmnt. New Zealand: New Zeland Government. Mitchell, T. 2010. The Resources of Economics. Journal of Cultural Economy, 3, 189-204. NZGBC 2015. Strategic Review of the Green Building Market. New Zealand: New Zealand Green Building Council. NZGBC. n.d. Why Green Building [Online]. New Zealand. Available:
https://www.nzgbc.org.nz/Category?Action=View&Category_id=219 [Accessed 7 June 2019]. Parliamentary Commissioner for the Environment 1998. Towards Sustainable Development. Wellington, New
Zealand: Office of the Parliamentary Commissioner for the Environment. Purchas, C. & Ainsworth, A. 2019. C&D Waste as a resource: Applying circular economy principles to the construction
sector. WasteMINZ Conference 2019. Hamilton, New Zealand: Waste Minimisation Institutue New Zealand. RMA 1991. Resource Management Act 1991. Wellington, New Zealand: Ministry for the Environment. Samarasinghe, D. 2014. Building Materials Supply chians: An evaluative study of the NZ Residential Contruction.
Doctoral, Auckland University of Technology. Stats NZ 1980. The New Zealand Official Year-Book, 1980 New Zealand. Stats NZ 2000. New Zealand Official Yeabook 2000. New Zealand: David Bateman Ltd. Stats NZ 2006. New Zealand official Year book 2006. New Zealand: David Bateman Ltd. Stats NZ 2010. New Zealand Year Book 2010. New Zealand: David Bateman Ltd. Thomas, M. 2018. Sustainable Design, Construction and Maintenance- Chanage and Opportunity [Online]. New
Zealand: Prendos. Available: https://www.prendos.co.nz/sustainable-design-construction-and-maintenance- change-and-opportunity/ [Accessed 13 July 2019].
United Nations 1987. Our Common Future. Switzerland. Vilasini, N. 2014. Generating value in alliance contacts through the lean concepts. Doctoral, Auckland University of
Technology. Warnock, A. C. 2005. Sustainable construction in New Zealand. NEW ZEALAND JOURNAL OF ENVIRONMENTAL LAW. WMA 2008. Waste Management Act. In: Environment, M. f. t. (ed.). Wellington, New Zealand: Crown copyright. World Bank Group 2018. What a Waste 2.0. Washington DC, USA: The World Bank. WorldGBC. n.d. What is Green Building [Online]. World Green Building Council. Available:
https://www.worldgbc.org/what-green-building [Accessed 8 July 2019]. Zaeri, F. 2017. Exploring the potential for the application of simulation methods in construction project delivery in
New Zealand. Doctoral, Auckland University of Technology.

1175
The 54th International Conference of the Architectural Science Association (ANZAScA) 2020
The presentation of local data on site through augmented reality
Faruk Can Ünal1 and Yüksel Demir2 1, 2 Istanbul Technical University, Istanbul, Turkey
{farukcanunal1, yukseldemir2}@gmail.com 1 Yeditepe University, Istanbul, Turkey
Abstract: This paper proposes a model that uses augmented reality for the presentation of local data on site. Due to the fact that architecture interacts directly with environmental factors, the architect needs to take into account the data about the surrounding context of the site while developing the design. Focusing on the data need of the architect during the site visit and analysis before starting a conceptual design, the representation of local data through augmented reality is conceptually pointed out in this study. Afterwards, the technical structure of the model is presented by the regulation of the flowchart that bases on data acquisition, query, and display. This model enables the architect to participate more closely in the exploration of the site during the early design phase. Thus, instead of collecting data separately from various mediums, it provides a holistic view of the local data on site, and converts the real environment to working medium.
Keywords: Local data; augmented reality; architectural design.
1. IntroductionThroughout the design process, architects interact with a variety of data to inform design decisions. Architectural design is closely related to spatial relationships of surrounding data. Local data can be used by architects to improve the design process to match natural and cultural context (LaGro, 2008; Farrelly, 2012; Ünal & Demir, 2020). Architects need local data of the site in the early design phase, therefore site visits come to the forefront for understanding the context in which a design is going to be located in. It is a well-known fact that architects spend considerable time to explore contextual properties of the site and afterwards local data from various mediums are collected to analyse the site before the development of the design (Skov et al., 2013). For this reason, the presentation of local data is important over the course of the site visit, site analysis and conceptual design.
Due to the increased amount of data necessary for evaluation, a holistic view to local data is needed. Digital technologies present great opportunities for architects to acquire and use local data. Technological developments have enabled to access large quantities and different types of data. Besides, mobile computing with portable display devices organises and presents spatially referenced
Imaginable Futures: Design Thinking, and the Scientific Method. 54th International Conference of the Architectural Science Association 2020, Ali Ghaffarianhoseini, et al (eds), pp. 1175–1182. © 2020 and published by the Architectural Science Association (ANZAScA).

1176
Faruk Can Ünal and Yüksel Demir
data (Jo and Kim, 2016). All these developments reveal new possibilities to inform architects for understanding the context of the place.
In connection with the rise of digital culture, augmented reality provides to deal with the interface between the physical environment and virtual environment, rather than focusing one of these environments (Picon, 2010). Augmented reality can be used in a location based approach, that enables to produce constructive relationships on information with the use of the location. It offers an immersive experience of surrounding information from different viewpoints while on the move (Kim, 2013; Abboud 2014). It is also possible to acquire data of the site and present it in situ via location based augmented reality for architectural design. This study focuses on a location based augmented reality model which provides contextual information about the site. Using such a model for the exploration of the site supports the architect to collect and analyse local data. By bringing architects into more direct contact with the site, the model facilitates the architect to understand the surrounding local data in situ.
2. Augmented reality supported model with architectural perspectiveThe general priorities of the architectural design related to the site are to get a sense of the physical site, find patterns, and discover new insights about the physical location and its characteristics. With the use of augmented reality at the site visit, architects can actively be engaged in the exploration of the environment. This study introduces a model that can help architects to understand the spatial impacts of the surrounding context better, particularly during the site visit. Local data can be presented on site by retrieving and visualizing all the properties and details concerning. It is possible to make local data visible and reduce barriers access to data by using augmented reality.
Before starting to use the model, the user should be ready on the site where local data to be observed. The model can be used on portable display devices, because of the need to move freely on the site. Initially, the model sends current location information to request the related local data. Then, local data is provided based on the selected categories to display on the site by scanning in a given field diameter corresponding to the current location. When the user looks at the site through augmented reality, surrounding local data is shown on the display device (Figure 1). As a common medium via augmented reality, the model represents local data overlaid on reality. The model helps to present local data in an augmented environment without being in different environments for hardcopy or digital sources. This circumstance makes easier for the user to focus on local data. The user observes all the virtual content directly with the real environment.
The model enables a fully interactive augmented environment that allows the user to navigate in the real environment. Instead of being fixed to an environment, the augmented reality encourages users to move freely within the space. In model, data visibility is provided firstly by the user’s perspective of view. Besides, the model presents local data around the user according to the field of radar which is controlled over the interface. Changing the field diameter is useful for displaying local data among the crowded data. It provides a spatial approach to data mapping on the physical site. There is a strong need for 3D representation to visualise the data in a proper form. The model breaks the constraints imposed by 2D representation, moving toward 3D representation of the environment. For this model, a particularly important aspect of the augmented reality is its ability to make the user feel naturally surrounded by local data. The model can give users powerful new ways to observe relationships and connections between the local data. Augmented reality is able to display integrated views of local data in a spatial context (Figure 2).

1177
The presentation of local data on site through augmented reality
Figure 1: On site access to local climate data with the use of model.
Figure 2: Representation of invisible properties on site. As a sample to architectural use of the model from the site, topographical contour lines and legal
boundaries can be visualized on the site. Generally, architects take drawings of the site from the local municipality to consider height changes and boundaries on the site. Then, architects need to interpret these heights and boundaries for their designs without breaking the relationship with the site. Architects can have a printed copy of the site drawing with them during the site visit, otherwise they wait for working on digital format of the site drawing. This model can present height changes and boundaries from the digital drawings that can be provided open access from the local municipalities or national government database. It can draw topographical contour lines from height points in a computational process (Figure 3).

1178
Faruk Can Ünal and Yüksel Demir
Figure 3: The visualization of topographical contour lines and legal boundaries via augmented reality. When evaluating the site from the architectural perspective, the use of the surrounding area and the
built environment must be taken into consideration. Therefore, the architect firstly checks the current state of the surrounding area and the built environment through the site visit. Although it is important to observe the site with the current state, it does not provide comprehensive data for the architect. It is necessary to obtain the city development plan that contains the data of the existing structures from the related municipality or its web service. This model can present land use and built environment data by covering the view of the site (Figure 4). The user of the model can easily evaluate current state with provided data for architectural design.
Figure 4: The presentation of land use and built environment data on site.

1179
The presentation of local data on site through augmented reality
3. Technical structure of the model in augmented realityAugmented reality has received increasing attention as an interactive medium that allows users to search for information in a realistic 3D space (Kim et al., 2017). Especially, the improvements in mobile devices and the use of location as the basic resource for context aware services have provided useful components for using augmented reality in the field of architecture (Fukuda et al., 2014; Riera et al., 2015; Grubert et al., 2017). Most of the location based augmented reality systems are designed to present information about point of interests, similarly, the proposed model offers local data regarding an architectural site survey. In the determination of the model components, studies related to structures of the location based augmented reality systems are taken into consideration (Ünal & Demir, 2018).
The current devices on location based augmented reality use hand-held or head-attached displaying. This model targets hand-held and head-attached devices to display local data while on the site. Hand- held displays come to the forefront with the widespread access, while head-attached displays provide natural platform with hands-free working environment. For introducing the model, hand-held displays are used because of being widely available range from smartphones to tablets.
Augmented reality encompasses user interfaces that allow for interaction with digital content embedded into the physical environment of users. Information browsers, as an augmented reality user interface, provide to monitor and control information that is registered to the physical site. When the capabilities of the information browsers are taken into account, facilities of the filtration and the radar are the significant tools during the display of the site. Consequently, information browsers are the most suitable interface type for this model and can be used without any experience. The design of the user interface in the model should be simple and user-friendly. Therefore, the interface needs to be organized based on the user, the environment and the data. The sample visualizations of the model in the user scenario are kept as simple as possible.
Hybrid tracking based on GPS and inertial sensors is sufficient with the development of the model. Nowadays, mobile devices from smartphones to tablets are already equipped with GPS and inertial sensors. It also shows that these types of equipment are provided automatically by the hand-held devices. These display, interaction and tracking types can be used to realise this model.
The operability of the model is provided by an integrated workflow. The workflow of the model is extensively explained under the stages of data acquisition, data query and data display (Figure 5). In the acquisition of data, commonly used methods and different methods which emerged with developing technology are discussed in relation to the model. The query and display infrastructure of the model is explained based on the working principles of the studies carried out in the field of location based augmented reality.
3.1. Data acquisition on the model
The data acquisition system is needed to provide, manage, and filter the data of the model. Data is obtained from sources according to the data classification in local data framework that is specified for architectural design in the model. It is presented as a well-structured framework which could be readily used by augmented reality systems to support architectural site survey. On the other hand, this model also needs access to available and reliable data sources. It is necessary to link the model to databases that contain necessary information associated with the site.

1180
Faruk Can Ünal and Yüksel Demir
Figure 5: Workflow of the model. Regarding databases, firstly, the model can acquire data from relational databases. Relational
databases provide structured data according to required parameters and different levels of accuracy depending on the source. In the case of a data format, it may be necessary to convert or adapt to other formats for local data, compatible with the model. Therefore, standardization of data type formats may facilitate communication between different databases. If databases contain different data associated with a location, they can be compared directly to provide a way to validate by data comparison facilities. Generally, these databases are stored in a cloud system to access information about the current location when needed.
Beyond the relational databases that are primarily used in data acquisition, big data and crowdsourcing methods can be utilized to acquire data (Bermejo et al., 2017; Huang et al., 2014; Vico et al., 2011; Ioannidi et al.,2017). Big data can analyze the data that has a location information without any
1181
The presentation of local data on site through augmented reality
data classification. Any data fed into this model with big data has to be pre-processed, in this way it provides classified data that can be used. Therefore, it is necessary to develop an automatic and intelligent domain information extraction mechanism to always provide relevant information with respect to the local data classification. By crowdsourcing method, users can upload their individual data to a cloud database system that is integrated into model. This allows users to actively participate in the local data creation process by sharing content in situ in an augmented environment. Besides, IOT allows a variety of information to be collected by sensors linked to the internet (Leppänen et al., 2014). It allows users to access heterogeneous data from different pervasive sources in a site visit.
4.2. Data query on the model
In the model, data is queried in specific steps. Firstly, GPS as location, compass as direction, and accelerometer as orientation information are acquired to provide sensor data. When the acquired location information is sent to the query to obtain local data, direction and orientation information are used to calculate the point of view. By the use of location information and effective field diameter, local data is queried from the data arranged in the local data framework. The effective field diameter allows the querying of data in a specific distance from the current location. In addition, the use of filtration through data categories affects query results. By the calculation of the point of view with the use of direction and orientation information, local data results are queried to display.
4.3. Data display on the model
In the model, data display is performed with the data obtained from the query process. Local data is presented to the user when it is covered by view angle, filter options and effective field diameter. The change of the point of view affects the data to be displayed. According to the new point of view, the local data acquired during the query process is taken into the display process. Besides, the change of the filter options affects the data to be displayed according to the preferred data classes. When the effective field diameter is changed, local data is queried again according to the new field diameter. According to changing situations; local data newly included in the display is added, local data outside the display is removed, and local data that remains in the display is preserved. In addition, the model allows local data to be displayed on site with appropriate visualizations of the data. Data visualization is to be considered for the representation of each local data in the local data framework.
5. ConclusionThis study introduces a model that present local data in a location based augmented reality system to use in early stages of architectural design. By considering the necessities of local data in architectural design, the potentials of location based augmented reality are utilized in the development of this model. The proposed model is presented conceptually to express its contributions from the architectural perspective. Besides, technical requirements for the operation of this model are stated with suitable components and workflow. Thus, this model is extensively handled by different viewpoints.
Focusing on the data need of the architect during the site visit and site analysis before starting a conceptual design, the proposed model provides data on site according to the local data framework through augmented reality. Using such a model for the exploration of the site supports the architect about common medium, data classification, spatial approach to data mapping, holistic view, data visibility, representations with time component, data analysis, taking note and sharing, helping

1182
Faruk Can Ünal and Yüksel Demir
architects and providing expertise. By bringing architects into more direct contact with the site, the model facilitates to understand the surrounding local data in situ and supports the reasoning process to design. As local data can be made easily available within the context of the site, architects can carry out site survey more effectively and efficiently.
This model has potential to be the base with the local data framework to the applications of architectural design in augmented reality. This model presents a medium around the user in order to be aware of surrounding conditions accordingly to the current local data. As a further study, this model can be developed as an in situ design platform for architectural design.
Acknowledgements We acknowledge The Scientific and Technological Research Council of Turkey (TUBITAK), The Department of Science Fellowships and Grant Programs for financially supporting.
References Abboud, R. (2014) Architecture in an Age of Augmented Reality: Opportunities and Obstacles for Mobile AR in Design,
Construction, and Post-Completion, Retrieved from http://www.codessi.net/sites/codessi/files/ IWDS2013%20AR%20PAPER.
Bermejo, C., Huang, Z., Braud, T. and Hui, P. (2017) When Augmented Reality meets Big Data, In 2017 IEEE 37th International Conference on Distributed Computing Systems Workshops (ICDCSW), 169-174, IEEE.
Farrelly, L. (2012) The fundamentals of architecture, Bloomsbury Publishing, 12-33. https://doi.org/10.1109/TIFS.2012.2215324.
Fukuda, T., Zhang, T. and Yabuki, N. (2014) Improvement of registration accuracy of a handheld augmented reality system for urban landscape simulation, Frontiers of Architectural Research, 3(4), 386-397.
Grubert, J., Langlotz, T., Zollmann, S. and Regenbrecht, H. (2017) Towards pervasive augmented reality: Context- awareness in augmented reality, IEEE transactions on visualization and computer graphics, 23(6), 1706-1724.
Huang, Z., Hui, P. and Peylo, C. (2014) When augmented reality meets big data, arXiv preprint arXiv:1407.7223. Ioannidi, A., Gavalas, D. and Kasapakis, V. (2017) Flaneur: augmented exploration of the architectural urbanscape, In
2017 IEEE Symposium on Computers and Communications (ISCC), 529-533. Jo, D. and Kim, G. J. (2016) ARIoT: scalable augmented reality framework for interacting with Internet of Things
appliances everywhere, IEEE Transactions on Consumer Electronics, 62(3), 334-340. Kim, M. J. (2013) A framework for context immersion in mobile augmented reality, Automation in construction, 33,
79-85.Kim, H., Matuszka, T., Kim, J. I., Kim, J. and Woo, W. (2017) Ontology-based mobile augmented reality in cultural
heritage sites: information modeling and user study, Multimedia Tools and Applications, 76(24), 26001-26029. LaGro, J. A. (2008), Site analysis: A contextual approach to sustainable land planning and site design, John Wiley &
Sons. Leppänen, T., Heikkinen, A., Karhu, A., Harjula, E., Riekki, J. and Koskela, T. (2014) Augmented reality web applications
with mobile agents in the internet of things, In 2014 Eighth International Conference on Next Generation Mobile Apps, Services and Technologies, 54-59.
Picon, A. (2010) Digital culture in architecture, Basel, Switzeland: Birkhauser, 55-57. Riera, A., Redondo, E. and Fonseca, D. (2015) Geo-located teaching using handheld augmented reality: good practices
to improve the motivation and qualifications of architecture students, Universal Access in the Information Society, 14(3), 363–374. https://doi.org/10.1007/s10209-014-0362-3.
Skov, M. B., Kjeldskov, J., Paay, J., Husted, N., Nørskov, J. and Pedersen, K. (2013) Designing on-site: Facilitating participatory contextual architecture with mobile phones, Pervasive and Mobile Computing, 9(2), 216-227.
Ünal, F. C. and Demir, Y. (2018) Location Based Data Representation through Augmented Reality in Architectural Design, Archnet-IJAR: International Journal of Architectural Research, 12(3), 228-245.
Ünal, F. C. and Demir, Y. (2020) Local data: A new approach to data in architecture, A/Z: ITU Journal of The Faculty of Architecture. 17(1), 13-23. doi: 10.5505/itujfa.2019.45220.
Vico, D. G., Toro, I. M. and Rodríguez, J. S. (2011) Collaborative content generation architectures for the mobile augmented reality environment, In Recent trends of mobile collaborative augmented reality systems, Springer, New York, 83-97

1183
The 54th International Conference of the Architectural Science Association (ANZAScA) 2020
The reintroduction of Japanese metabolism to sustainable architecture
Alexander Trudelle1 and Fan Zhang2 1, 2 Griffith University, Gold Coast, Australia
[email protected], [email protected]
Abstract: The Metabolist movement of the 1960s ended with the start of the energy crisis and sustainable consciousness. Despite its failure, metabolism provides meaningful and valuable explorations and references for the future design practice. Japanese Metabolism focuses on buildings that can adapt to changes and be re-creatable, not dissimilar to sustainability concerned with the adaptation to future occupants. This paper adopts a theoretical research method and expert interviews to describe and analyse metabolism and sustainability, compares their similarities and discrepancies, and explores the possibilities and opportunities of combining these two different design thinking. Results show that notion of sustainable architecture mainly concerns with technical domains rather than contribute to the setup of a wholistic sustainable system. Metabolism architecture is inherently sustainable, and its biological metaphor and systemic thinking can help sustainable design thinking build a resilience culture should they be combined. This study also proposes specific design guidelines and strategies for implementing this combined design thinking in the practice.
Keywords: Sustainability; Japanese Metabolism; prefabrication; cultural resilience.
1. Introduction“The end of the 20th century can be considered to be the age of a vigorous technological development of man but, simultaneously, a period of considerable damage to his natural environment” (Cywinski, 2001, pp. 12)
Sustainability plays an integral part in the 21st century lifestyle. Everything from food, transportation, and infrastructure, to society has begun to reconnect with the natural systems. “Sustainability is a human project; an approach to structuring our relationships with the other kinds of systems and beings on our planet” (Parker, 2014, pp. 47). Architectural sustainability developed from a growing concern that humanity has been “pushing Earth systems to their limits where they will no longer be able to support the human prospect in the same way” (Jacques, 2014, pp. 19). It became a widespread concern around the idea of sustainability in the late 1980s when the ‘Brundtland Report’ from the ‘World Commission on Environment and Development’ called for sustainable development, defined as “development that meets the needs of the present without compromising the ability of future generations to meet their own needs” (Brundtland Commission, 1987). This push was the first of many sustainable movements that revolutionized the world of architectural sustainability.
Imaginable Futures: Design Thinking, and the Scientific Method. 54th International Conference of the Architectural Science Association 2020, Ali Ghaffarianhoseini, et al (eds), pp. 1183–1192. © 2020 and published by the Architectural Science Association (ANZAScA).

1184
Alexander Trudelle and Fan Zhang
Japanese metabolism architecture grew from the ashes of world war II. After experiencing the destruction of the war, Kisho Kurokawa developed the theory of metabolism based on the fact that there must first be a destruction of the present growth for the new growth to evolve from the overgrown system (Taro, 2018). Kurokawa believed that Japanese metabolism architecture “was predicated on change” and therefore had no completed form (Taro, 2018, pp. 50). With the beauty of imperfection, the building was always growing and changing, much like the human body and society (Taro, 2018). Metabolism architecture is “built around a spine-like infrastructure with prefabricated, replaceable cell-like parts—easily attached and readily removable when their lifespan is over” (Craven, 2019). Japanese metabolism architecture was not only a design style, but also a philosophy that could be used as a guideline to keep up with a constantly growing city, moving ever faster towards closed communities and meaningless neighborhoods (Kurokawa, 1977).
The initial failure of Japanese metabolism architecture was probably because it was too radical and visionary for its time. The 1970s and 1980s also held various challenges for the philosophy. With the start of the energy crisis and the birth of sustainable design, the megastructure design quickly lost its popularity, being considered “dinosaurs of the modern movement” (Lin, 2010, pp. 516). However, seen from contemporary perspective, metabolism still provides meaningful and valuable explorations and references for today and the future design practice.
This study aims to examine the core tenets of sustainability and metabolism, compare their similarities and differences, and explore the opportunities of combining these two different design philosophies. Another aim is to propose design guidelines for practitioner architects to integrate the two design philosophies in current and future design practice.
2. MethodsTo fulfil the first research objective, two different research methods were adopted—theoretical research and expert interview. To fulfil the second objective, the expert interview was adopted. Details for each method were as follows.
2.1 Theoretical research
This study adopted the theoretical research method to describe and critically analyze sustainability and metabolism. For each design philosophy, the overarching principles and features were reviewed, together with a case study utilizing this design thinking. The analysis also pointed out the similarities and discrepancies between the two design philosophies, along with the opportunities to integrate them.
2.2 Expert interviews
Due to lack of research literature in this topic, structured interviews were carried out to gain insight from experts in academia and design practice regarding the feasibility and necessity of combining Japanese metabolism architecture with sustainable design, and if possible, come up with applicable design guidelines for practitioner architects to implement integrated design philosophies. Interviewees should ideally come from various countries, must have at least 15 years of work experience in either academia or practice, and should be familiar with either sustainable architecture or metabolism architecture philosophy (ideally both). All research protocols have been fully approved by human research ethics committee in Griffith University.

1185
The reintroduction of Japanese metabolism to sustainable architecture
The interview comprises 6 open-ended questions designed to allow for varied and explained responses from the participants. The interview often began with asking the participants their experiences in the field of architecture, specifically with sustainable and metabolism architecture. Then, the interviewer asked about the similarity with tiny homes and modular buildings, the issues with sustainability and metabolism, and how they could complement one another in these areas. If interviewees expressed favorable opinions on combining the two philosophies, the interviewer also asked them to come up with some integration guidelines and strategies. At last, interviewees were asked if they have any more comments or thoughts on this research topic. A total of 6 expert interviews have been conducted in July 2020 in the form of video calls. The demographic information of the interviewees can be found in Table 1. To analyze the interview results, standard thematic analysis was carried out.
Table 1 Demographic information of the interviewees
Interviewee A B C D E F Country Canada Australia China Australia Australia China Profession Professor of Associate Professor of Professor of Professional architect Professional
Architecture Professor of Architecture Architecture architect Architecture History
Education Master of Master of Doctor of Master of Bachelor of Bachelor of Architecture Architecture Architecture Architecture Architecture. Architecture
Advanced Diploma Architectural Technology
Experience 30 years in 35 years in 30 years in 25 years in 15 years in practice 20 years in practice; Practice Academia academia practice 15 years in 16 years in Academia Academia
3. Theoretical research
3.1 Principles and features of sustainable architecture
Sustainable architecture has gained momentum, becoming a more prevalent design style as the increase of incentive programs, community awareness, and environmental problems drive socially conscious architecture (Parker 2014). However, as we develop more towards this ideology we leave behind the buildings of the past. These sustainable buildings usually employ the best combinations of sustainable and renewable technologies at the time of design but have little consideration for any change that may happen in the future or even beyond the buildings’ life cycle. Like all buildings, sustainable buildings can also have problems, however these problems not only cause issues to the building but also compromise the environmental aspect of a building. One example of this is the Philip Merrill Environmental Center, the first LEED platinum building under USGBC LEED, which suffered a failure of its building enclosure after only a few years (Desmarais, Gonçalves, and Trempe 2010). These failures have to potential to lead to “building enclosures result[ing] in environmental, social, and economical impacts that can reduce or even negate the positive effects of those green buildings” rendering the building no longer sustainable (Desmarais, Gonçalves, and Trempe, 2010, pp. 2). As humanity consistently faces disasters, land and housing shortages, and technological obsoletism we leave little benefit for innovation over elimination.

1186
Alexander Trudelle and Fan Zhang
The Mesinaga Tower in Malaysia was to be a “progressive and environmentally responsible image that proved so valuable that it actually increased surrounding land value” and as a result implemented many sustainable design strategies prior to LEED (Leadership in Energy and Environmental Design) (Chan et al., 2004, pp. 2) The building implemented many sustainable design strategies for a high-rise building that included orientation for maximum efficiency, shading devices for passive cooling, vertical gardens that shade and ventilate the building, and open floorplans to promote natural ventilation shown in Figure 1 (Chan et al., 2004). The materials were also specifically chosen and placed to maximize efficiency with “[t]he core [using] extensive passive heating and cooling strategies [with] no mechanical support” (Chan et al., 2004, pp. 4). Furthermore, the east wall of the building, the concrete core, acts as a shade and heatsink; blocking out the eastern sun, and heating the building at night with radiant energy (Chan et al., 2004). As a sustainable building, steps are taken to lower energy usage including (but not limited to) natural ventilation and natural heating; methods that make it difficult to maintain an ideal temperature and can be difficult to adjust, a sustainability method that is not always acceptable in every climate.
Figure 1 Axonometrics: (Left to Right) Built Form; Planting and Sky Gardens; Solar Orientation; Shading Devices (Source: Chan et al., 2004)
3.2 Principles and features of metabolism architecture
The aim of metabolism is to “find catalysts for urban development to solve the issues that came with the rapid growth of megacities”, namely, “questions of land scarcity, housing shortage, and unplanned sprawl” (Schalk, 2014, pp. 293). The central essence of the metabolism movement is focused on the idea of interchangeability and perceiving a building structure as that of a living organism. Metabolism exemplifies this in the use of two elements, a centralized permanent ‘core’ representing the body of the structure, and transmissible modules, acting as appendages that can attach and detach from the core. In its building typology, the building physically evolves and changes over the course of its life, never truly ‘dying’ but responding to needs as they arise and changing in their absence.
The Nakagin Capsule Tower in Japan represents “the finest built work resulting from the historic Metabolist movement” (Lin, 2010, pp. 514). This building serves as the epitome of the metabolist movement and denotes both the beginning and end of the style. The building followed suit with the metabolist philosophy as it was designed to have interchangeable parts as the capsules surrounding the central column which was bolted on from 4 anchor points along the central column. These capsules were very small, only a few square meters in area and were to act “not [as] an apartment house”, instead “intended to provide single bedroom dwellings in the heart of Tokyo” as a temporary living or

1187
The reintroduction of Japanese metabolism to sustainable architecture
workspace as shown in Figure 2 (Kurokawa, 1977, pp. 105). Designed as a response to ‘urban nomads’ these small capsules were intended to last for roughly 20 to 25 years before being replaced as a social necessity (Lin, 2010). The typical metabolist building featured a central column that would house the access and services to all of the attached modules and act as a stem to the building’s leaves. The idea of a metabolic city fell short when re-development overtook the potential to replace the modules and “[outpaced] the ‘metabolism’ that the Metabolists envisioned” (Lin, 2010, pp. 519). Metabolism only works if there is an aspect of growth rather than rebirth within a city, however favouring demolition over renovation regardless of the ease of access makes metabolic architecture redundant.
Figure 2: Axonometric of Capsule (Source: Lin, 2010)
3.3 Similarities, discrepancies, and opportunities
By reviewing previous literature on sustainability and metabolism, the similarities, discrepancies and opportunities for cooperation of the two types of design thinking have been synthesized as follows.
3.3.1 Similarities
Meike Schalk in the paper ‘The Architecture of Metabolism’ investigates and examines sustainable architecture present in “metabolist theories and products” (Schalk, 2014, pp. 279). In this paper, Schalk concluded that although the term ‘sustainable architecture’ did not exist in the 1970s, it was still present in the ideology of metabolism as it strived for a resilient world (Schalk, 2014). Schalk points out that sustainability and metabolism are driven by similar challenges—land scarcity, unequal development, pressure on infrastructures, and democratic issues in planning. The conference paper by Tharaka Gunawardena et al. (2014) discussed and compared the sustainable aspects of modular construction, showing unwitting research into sustainable metabolist architecture with modular systems that are a key component of the philosophy (Gunawardena et al., 2014).
3.3.2 Discrepancies
In regard to sustainability, Anna Hurlimann states that “there’s the need for adaptation, to physical[ly] adapt buildings and settlements to withstand present and future changes” (Harris, 2019). This style of

1188
Alexander Trudelle and Fan Zhang
architecture carries a physical resilience, however, lacks any form of philosophical perspective of building resilience in its design methodologies. As Schalk (2014, pp. 280) points out, albeit “sustainable architecture” has been widely used in recent decades, “the term is mainly used to refer to recent ecotechnical building solutions, new materials, and ecolabeling, and rarely to social and cultural settings and practices.” This is where the introduction of Japanese Metabolism Architecture can compensate the shortfalls of sustainable design. While both sustainability and metabolism encompass the notion of resilience, the former physical, and the latter philosophical, Japanese metabolism style was designed to “[respond] to the human and environmental [catastrophes] … [and] vulnerability to natural disasters” and as a result carries the potential for change (Schalk, 2014, pp. 280).
3.3.3 Opportunities
Through the use of Japanese metabolism architecture, sustainable architecture can further itself in efforts to lessen carbon footprints due to the heavy prefabrication of the buildings. “The prefabrication of buildings has proven to reduce construction waste by up to 52%” resulting in greatly “improved energy, cost and time efficiency of construction” (Gunawardena et al., 2014, pp. 1). This philosophical resilience that Japanese metabolism architecture promotes not only gives perspective to a building, but incorporates growth into a building that epitomizes life, a living building. Furthermore, a common adage in recent years is that the most sustainable building is one already built. Rather than replacing an entire building, renovation is most always preferred from a sustainability standpoint. With Japanese metabolism, this inevitable renovation that all buildings require at some point in their lifecycle, can be made more sustainably and even prolong the life of the structure (Elefante, 2012). As the initial failure of Japanese metabolism architecture was largely in part due to the era of its inception, there are seemingly less hurdles for the style this time around. As a combination between sustainability and metabolism, energy would not become an issue regardless of a potential crisis due to sustainability’s focus on energy conservation. Furthermore, the building type is not limited to megastructures, however the recent re-immergence of megastructures in overpopulated cities with high density provides additional opportunities for the implementation of sustainable metabolic architecture. The development of this style also gives room for the implementation of Japanese metabolism architecture and sustainable design into pre-existing styles as an additional feature. The sustainable modularity can be applied to any style of building, from art deco houses, to post modern art galleries. This style not only works well on its own, but also can be incorporated into many other styles symbiotically bettering the building.
4. Findings from InterviewsThe interviewees’ opinions and ideologies bifurcated on whether metabolism is still valuable and whether the two types of design thinking should be combined. The following section summarizes a typical proponent (Interviewee A)’s opinion and a mixed opinion from interviewee B.
4.1. Different opinions about integration
4.1.1 A typical proponent’s opinion
Professor A is a proponent of integrating the two types of design thinking. He works in the architectural discipline in Canada. He started his career by working with Ken Yeang. He has been involved in the architectural design of Menara Mesiniaga Tower in Malaysia, one of Ken’s most notable projects in

1189
The reintroduction of Japanese metabolism to sustainable architecture
sustainability. Prof. A also has experience in modular construction in the form of panelized housing. When asked about the failure of Japanese Metabolism, Prof. A explained that “it came a bit too early” and that “societies were not quite ready at the time to accept it on a global scale”. Prof. A is very enthusiastic about the idea of incorporating Japanese metabolism into sustainable design and has shared many interesting opinions and views on the matter.
When talking about the relationships between the two types of design thinking, Prof. A has expressed that all metabolism architecture is inherently sustainable as the modules are prefabricated, and the smaller size allows for less energy use and higher density, and there is less of a footprint for demolition of the structure as the modules are removable. He sees metabolism as “sustainability without a label”. Prof. A believes that this inherent sustainability proves important to the collaboration of metabolism and sustainability as it can be difficult to get society to be sustainable when it does not benefit them directly. This underlying sustainability will allow those who would be more resistant to the notion of sustainable buildings due to the need for more effort on their parts to be open to the idea of a sustainable building without the same level of effort.
Another important view of Prof. A is his analogy between a metabolist building and a tree. He explains that the process a tree grows to fill the space below others resembles how metabolist buildings may be erected—they do not crowd the space of others; instead, they change direction to make their own paths. They are “living together as a community, … [knowing] how to navigate past each other”.
4.1.2 A typical mixed opinion
Associate Professor B works in an Australian university with over 35 years of experience in practice and 16 years in academia and has an interest in Japanese metabolism architecture. During the interview Professor B expressed his opinion that Japanese metabolism architecture was past its time and that “Metabolist architecture occurred at a particular point in time and it had a particular … set of values” that we have moved past with some qualities being revisited now in the form of modular construction and smaller spaces. He does not believe that the Metabolist idea of “megastructures and plug-in cities” will be revisited due to the changed technology and political systems around the world. Because of this political situation where “countries are more focused on their internal issues, problems and approaches to things”, he believes that metabolism is less likely to succeed as it “demands too much of a commonality between all the participants in terms of build outcomes”. Another reason he believes metabolism to be outdated technologically is because “we’re in an era particularly with mass- production where [it no longer] requires every item to be the same” with mass-production accompanying mass-individualization, lessening the need for factory line construction as our technology promotes creativity.
Despite the above opinion, Professor B does believe that there are values in the Metabolism philosophy at the time, which is to build more sustainable, cohesive, and economical settlements with efficiency. The meta ideals still exist today, but how it is achieved has changed through production techniques and society, with underlying principles still present. Overall Professor B views the reintroduction of metabolism with a realistic sense of doubt due in part to the past failure and the association with old metabolism ideals, but believes there is an increasing interest in customizable, plug- in pieces for high-rises and apartments, especially regarding the more advanced construction requiring plumbing and electrical works. Despite the seemingly negative aspect of metabolism addressed in this interview, Professor B offers first-hand examples of what the original metabolism philosophy can be

1190
Alexander Trudelle and Fan Zhang
changed to raise the social acceptance of the style in the 21st century, with the help of sustainable design.
4.1.3 A summary
Among 6 interviewees, 4 of them are favourable of reintroduction of Metabolism into sustainability, while another 2 have expressed some concerns and/or doubts. In general, there is a strong belief from the participants that the metabolist philosophy will take root in the 21st century and may fit in well with experimental architecture. Of the participants that were unsure of metabolist architecture, there was still a belief that the style was appropriate to the 21st century, with underlying doubts due to the initial death of the philosophy.
4.2. Integration Design guidelines
The four interviewees in favour of integrating two design philosophies were further asked to propose integration guidelines. By carrying out a thematic analysis, these design guidelines have been categorized into 3 overarching categories: overall building, modular design, and structure.
4.2.1 Overall building
The following design guidelines focus on the overall design of the building in its final form, and the cooperation between the building and the site.
• Core + replaceable modules. A sustainable metabolist building should have a typicalmetabolism building typology, featuring a three-dimensional skeleton of long-term servicestructures, and various functional modular units of different life cycles.
• Sustainable design. The building design should seek to reduce environmental effects through the use of passive design. Passive design strategies should include natural ventilation through the vertical connection of building levels utilizing the stack effect. Building orientation andpassive shading should be utilized to promote natural cooling methods.
• Creation of communal spaces. Communal spaces can be used as a method to break the dullmatrix of modular units, and to create connection and communication between them.
• Resilience in physical form. Utilizing more resilient materials such as concrete or stone tomaintain the building for longer periods of time with a primary focus on durability.
4.2.2 Modular design
These design guidelines focus more on the individual modules that are used as the primary aspect of metabolism design.
• Larger spaces. Typical metabolist buildings were designed as compact spaces, which mighthave limited the building functions and compromised user comfort. Larger spaces in modular units were ideal if possible.
• Prefabricated construction. Maintaining the prefabricated ideology promotes sustainabilityand fast construction.
• Removable modules. By having the modules easily removable and replaceable the buildingcan grow and change.

1191
The reintroduction of Japanese metabolism to sustainable architecture
• Incorporate greenery. Promote the use of greenery to clean the air naturally and invigorate the indoor environment.
• Customization. Allowing for the personal customization of the module units to promote individualism in a larger system.
4.2.3. Structure
These three guidelines focus on the structure of the building involving the style of structure and implementation of module movement within the building and alternate sites.
• Mobility. Allowing for ease of mobility of units on the site will promote the use of this feature. • Built-in crane. The inclusion of a permanent crane within the structure of the building leads to
ease of mobility. • Permanent structure. The use of a stem (classic), cage (modern), or hanging (abstract) structural
form.
5. ConclusionMetabolism is a modern architecture movement originating in Japan, which sees cities and buildings not as static entities, but as living organisms. Sustainable architecture and metabolism architecture emerged from similar historical background, aiming to achieve similar goals of cultural resilience. However, sustainable architecture more focuses on technical aspects like materiality and technology, while metabolism proposes a systematic conceptual approach to reorganize the city and public systems. Integration of the two philosophies are therefore possible and beneficial, meaning that sustainable buildings will have prefabricated modular units that are movable and replaceable when their lifespans are over, and metabolism buildings will also incorporate sustainable design principles and features. Practical design guidelines and strategies were also proposed to integrate the two design philosophies.
Acknowledgements The authors would like to thank all interviewees who have participated in this study, and all academics from the Architectural Design Discipline in Griffith University who have provided valuable suggestions to this research. The authors would also like to thank the reviewers’ comments.
References Boye, A. (2014) Sustainable Compromises, ed., University of Nebraska Press. Brundtland Commission (1987) Our Common Future, ed., Oxford University Press. Chan, B., Fung, M., Lam, K. and Liu, V. (2004) Menara Mesiniaga. Cho, H. and Shin, C. (2014) Metabolism and Cold War Architecture, The Journal of Architecture, 19, 623-644. Cywinski, Z. (2001) Current Philosophy of Sustainability in Civil Engineering, Journal of Professional Issues in
Engineering Education and Practice, 12-16. Desmarais, G., Gonçalves, M. and Trempe, R. (2010) Why Do Green Building Enclosures Fail and What Can Be Done
about It?, ASHRAE. Douglass-Jaimes,D.(2015)AD Classics: Menara Mesiniaga. Available from:
<https://www.archdaily.com/774098/ad-classics-menara-mesiniaga-t-r-hamzah-and-yeang-sdn-bhd> (accessed April 15).
Dutil, Y., Rousse, D. and Quesada, G. (2011) Sustainable Buildings: An Ever-Evolving Target, Sustainability, 3, 443- 464.

1192
Alexander Trudelle and Fan Zhang
Eken, C. (2017) Learning from Architecture of Metabolism: Future City and Urbanism, Open House International, 42. Eken, C. and Atun, R. A. (2019) The Self-Organizing City and the Architecture of Metabolism: An Architectural
Critique on Urban Growth and Reorganization, Sustainability, 11, 1-19. Elefante, C. (2012) The Greenest Building Is... One That Is Already Built. Feisal, Z. and Momtaz, R. I. (2010) Sustainability in Architecture Between the Past and the Future, International
Conference on Urbanism and Green Architecture, October 30. Gunawardena, T., Mendis, P., Ngo, T. D., Aye, L. and Alfano, J. (2014) Sustainable Prefabricated Modular Buildings, December. Hannis, M. (2016) Freedom and Environment: Autonomy, Human Flourishing and the Political Philosophy of
Sustainability, ed., Routledge, New York and London. Harris, J. (2019) The good, the bad and the urgent: actions for sustainable architecture. Available from:
<https://architectureau.com/articles/the-good-the-bad-and-the-urgent-actions-of-sustainable-architecture/> (accessed April 27).
Jacques, P. (2014) Sustainability: The Basics, ed., Routledge. Kurokawa, K. (1977) Metabolism in Architecture, ed., Cassell & Collier Macmillan Publishers Ltd., London, Sydney,
Auckland, Toronto, Johannesburg. Kurokawa, K. (1994) The Philosophy of Symbiosis, ed., Academy Pr. Lin, Z. (2010) Kenzo Tange and the Metabolist Movement: Urban Utopias of Modern Japan, ed., Routledge, London. Lin, Z. (2010) Nakagin Capsule Tower and the Metabolist Movement Revisited, in B. Goodwin and J. Kinnard (eds.),
ACSA Annual Meeting Proceedings, Rebuilding, University of North Carolina at Charlotte, 514 -524. Miles, M. (2013) Metabolism: A Japanese Modernism, Cultural Politics, 9(1), 70-85. Norton, B. G. (2005) Sustainability: A Philosophy of Adaptive Ecosystem Management, ed., University of Chicago
Press, Chicago and London. Nyilas, A. (2018) Beyond Utopia, ed., Routledge, New York, Oxon. Parker, J. (2014) Critiquing Sustainability, Changing Philosophy, ed., Routledge, New York. Pernice, R. (2004) Metabolism Reconsidered Its Role in the Architectural Context of the World, Journal of Asian
Architecture and Building Engineering, 3, 257-363. Russell, S. (2008) Metabolism Revisited: Prefabrication and Modularity in 21st Century Urbanism, Without a Hitch:
New Directions in Prefabricated Architecture, Amherst, September 25-27, 246-254. Schalk, M. (2014) The Architecture of Metabolism. Inventing a Culture of Resilience, Arts, 3, 279-297. Soares, L. and Magalhães, F. (2014) A Year in the Metabolist Future of 1972. Available from: Failed Architecture
<https://failedarchitecture.com/a-year-in-the-metabolist-future-of-1972/> (accessed March 8). Squared Design Lab and Höweler + Yoon Architecture (2012) Eco-pod. Available from:
<http://www.squareddesignlab.com/projects/eco-pod> (accessed April 18). Tamari, T. (2014) Metabolism: Utopian Urbanism and the Japanese Modern Architecture Movement, Theory,
Culture & Society, 31, 201-225. Tandela, V. (2001) Form and structure in traditional Japanese architecture as an alternative grid system solution for
Western magazine design, Graphic Design, Iowa State University, Ames, Iowa. Tanizaki, J. I. (1977) In Praise of Shadow, ed., Leete's Island Books, Inc., Stony Creek. Taro, I. (2018) Contemporary Japanese Architecture: Profiles in Design, ed., Japan Publishing Industry Foundation
for Culture, Tokyo. Walker, S. (2014) Designing Sustainability, ed., Routledge, London, New York.

1193
The 54th International Conference of the Architectural Science Association (ANZAScA) 2020
Thermal Performance of School Building not only Impact Indoor Thermal Comfort
Bin Su, Renata Jadresin-Milic, Peter McPherson and Lian Wu Unitec Institute of Technology
[email protected], [email protected], [email protected], [email protected]
Abstract: Auckland has a temperate climate with comfortable warm, dry summers and mild, wet winters. Auckland school building thermal design not only focuses on winter indoor thermal comfort but also indoor health condition related to high relative humidity. A conventional Auckland school has a number of low-rise, isolated buildings with light weight envelopes. In over 90% of Auckland schools, each isolated building only has one to four classrooms. For these types of school buildings with a big ratio of building surface to volume, the thermal performance of building envelope becomes the most important design factor for indoor thermal and health conditions. Field study data of winter indoor microclimate of three classrooms with different insulation and thermal mass in their building envelopes are used for this study. The study not only compares and evaluates winter indoor thermal condition but also indoor health conditions of classrooms with different R-value and thermal mass in their envelopes. Increasing R-value without thermal mass in building envelope can increase winter indoor thermal conditions but cannot reduce fluctuations of indoor air temperature and relative humidity. Adding thermal mass in building envelope with similar R-value not only can improve indoor thermal condition but also improve indoor health conditions.
Keywords: Building thermal performance; indoor health condition; indoor thermal comfort; school building envelope.
1. IntroductionThe World Health Organisation recommends a minimum indoor temperature of 18 °C; and 20–21 °C for more vulnerable occupants, such as older people and young children (WHO, 1987; WHO, 2009a;). Previous studies show that the minimum threshold of indoor temperature required for limiting respiratory infections is 16 °C: there is increased risk of respiratory infections when indoor temperatures are below 16 °C (Collins, 1986; Braubach, Jacobs, & Ormandy 2011). Indoor temperatures below 12 °C can cause short-term increases in blood pressure and blood viscosity, which may increase winter morbidity and mortality due to heart attacks and strokes. When elderly people are exposed to indoor temperatures of 9 °C or below for two or more hours, their deep body temperature can start decreasing (Lloyd, 1990; Hunt, 1997; Goodwin, 2000). Extreme low indoor temperature not only negatively impacts occupants’ thermal comfort but also occupants’ health conditions.
Imaginable Futures: Design Thinking, and the Scientific Method. 54th International Conference of the Architectural Science Association 2020, Ali Ghaffarianhoseini, et al (eds), pp. 1193–1202. © 2020 and published by the Architectural Science Association (ANZAScA).

1194
Bin Su, Renata Jadresin-Milic, Peter McPherson and Lian Wu
Most of the factors that adversely affect health, such as bacteria, viruses, fungi, mites, etc., have increases associated with high indoor relative humidity. Maintaining indoor relative humidity between 40% and 60% can minimise the indirect health effects (Arundel, Sterling, Biggin, & Sterling, 1986). Maintaining indoor relative humidity below 50% can reduce indoor dust mites and their allergens, mite populations are almost eliminated in winter when indoor relative humidity is maintained within 40 to 50% (Arlian, Bernstein, & Gallagher, 1982; Korsgaard, 1982; Murray & Zuk, 1979). A range of 60–80% relative humidity provides ideal conditions for the reproduction of mites. Mites are hardy, surviving and multiplying best when relative humidity is 75-80% (Arundel, Sterling, Biggin, & Sterling, 1986). The indoor relative humidity required by dust mites to thrive is 75–80% or higher (Arlian Bernstein, & Gallagher, 1982; Arlian, Rapp, & Ahmed, 1990; Arlian, Neal, & Vyszenski-Moher, 1999; Arlian, Yella, & Morgan, 2010; Hart, 1998). According to international and national standards, indoor relative humidity should be lower than 60% for optimum indoor air quality (ASHRAE, 1993a; SNZ, 1990; DBH, 2001). The threshold of indoor relative humidity for mould survival and growth conditions is 60%. Mould growth is likely on almost any building material if equilibrium relative humidity of the material exceeds 75–80% (Coppock, 1951; Block, 1993; Pasanen et al., 1992). Mould germination requires not only high relative humidity (80%) but also time (30 days) (Hens, 2000). One option to prevent mould growth on indoor surfaces is to control the indoor relative humidity to a level below the threshold (80%) of mould germination (Su, 2006; ASHRAE, 1993b). New Zealand has some of the highest levels of indoor dust mite allergens in the world (Siebers, Wickens, and Crane 2006). Visible mould growth on indoor surfaces is a common problem in over 30% of New Zealand houses (Howden-Chapman et al. 2005). Previous study shows that indoor mean relative humidity adjacent to the floor must be maintained below 70% and indoor relative humidity adjacent to the floor must be maintained below 75% for 20 hours a day during winter and below 80% all the time in winter to control indoor dust-mite allergens at an acceptable level. If durst-mite allergen in the carpet can be maintained at an acceptable level, relative humidity adjacent to the floor can be controlled below the threshold for dust mites to thrive (75%) for 20 hours a day during the winter, the house is unlikely to have a mould problem in the local climate with mild and wet winters (Su and Wu, 2019).
According to the New Zealand Ministry of Education, in New Zealand there are 14637 school buildings built from pre-1940s to 1990s (see Figure 1). There could be a significant number of New Zealand school classrooms without sufficient insulation in their envelopes and with single glazing windows. Auckland has a temperate climate, with comfortable warm, dry summers and mild, wet winters. High relative humidity during the Auckland winter is a major issue for building indoor health conditions. An Auckland school building normally does not need air condition for cooling during the summer (window ventilation and ceiling fan) only need space heating during the winter. School building thermal design should more focus on winter thermal performance and indoor health conditions. There are about 425 schools built in Auckland before 2010. An Auckland school commonly includes a number of low-rise isolated buildings with a timber structure and lightweight envelopes spread over a large site. Most Auckland schools have a number of low-rise isolated buildings with one to four classrooms in rows. Most classrooms have a big external surface area which includes two sides or three sides of external walls and roof surface areas. For this type of school buildings, the building envelope becomes the most important building element for building thermal performance.
From 2010 to 2014, the redevelopment of Avondale College represents one of the biggest school rebuilding programs in New Zealand’s history. The project includes 92 new and refurbished teaching and resource spaces. It is the first time for the insulated precast panels to be used as the main structure and building envelope of a number of new buildings in a secondary school in New Zealand. Three classrooms

1195
Thermal Performance of School Building not only Impact Indoor Thermal Comfort
with different insulation levels and thermal mass in their building envelopes in the Avondale College are selected for this study. Table 1 shows the construction elements of the three classrooms. The classroom 1 is in a new building with precast insulated concrete panel wall and concrete structure, the classroom 2 is in a retrofitted building without thermal mass in its envelopes, and the classroom 3 is an old prefabricated classroom without thermal mass in its envelopes. The three classrooms used space heating during the school hours (from 8:30am to 3:30pm). Based on the field study data of indoor microclimate of the three classrooms, the study not only compares and evaluates indoor thermal conditions but also indoor health conditions of three classrooms with different insulation levels and with or without thermal mass in their envelopes during the Auckland winter.
Figure 1. Number of school buildings built from pre-1940s to 1990s in New Zealand
Table 1 Construction elements of the 3 classrooms
Building elements Classroom 1 Classroom 2 Classroom 3 Structure Precast concrete Timber Timber
Roof Steel, R3.2 polyester insulation, 200mm air gap and suspended ceiling
tile system Wall N, E, W walls: Precast insulated
concrete panels (70mm external concrete, 40mm XPS rigid insulation,
Internal 150mm concrete); S wall: Fundamax laminate panels
Floor Concrete floor with 40mm XPS rigid insulation under slab
Steel roof, R2.9 polyester insulation, 13mm Plaster
board ceiling Fundamax high pressure laminate cladding, 90mm
framing with R2.2 polyester insulation
Hardwood floorboards, Floor 150mm joists with R2.4 (150mm polyester)
Iron roofing, R1.9 old fiber insulation
Timber/Plasterboard, R1.5 old fiber
insulation
Old carpet, wood floorboards, R0.9 polyester insulation
Glazing Double glazing Double glazing Single glazing
2. Research methodIndoor air temperatures and relative humidity near ceiling and floor of the three classrooms and outdoor air temperature and relative humidity under the eaves of the roof were continuously measured at 15-minute intervals 24 hours a day by Lascar EL-USB-2 USB Humidity Data Logger during the winter months. Both very low and high relative humidity can not only cause some physical discomfort but also negatively affect indoor health conditions. All field study data of air temperatures and relative humidity of indoor and outdoor have been converted into percentages of winter time related to different ranges

1196
Bin Su, Renata Jadresin-Milic, Peter McPherson and Lian Wu
of indoor air temperature and relative humidity. The study used percentages of winter time when indoor air temperatures are greater than or equal to 16°C, 18°C, 20°C and 22°C to mainly compare indoor thermal conditions and use percentages of winter time when indoor air temperatures are lower than 16°C, 12°C, 10°C and 9°C to compare indoor health conditions. The study used indoor mean relative humidity and percentages of winter time when indoor relative humidity is greater than or equal to 40%, 50%, 60%, 70%, 75%, 80%, 90% and in the range of 40% to 60% for the purposes of comparing indoor healthy conditions of the three classrooms with different insulation and thermal mass in their building envelopes. The study investigates the 24-hour mean variations of winter indoor air temperatures of the three classrooms, and identifies the difference in indoor thermal and health conditions of the three classrooms, especially during a winter evening, night and early morning without space heating. All field study data of air temperatures have been converted into hourly mean air temperature during the winter.
3. Data analysis
3.1. Indoor air temperature and indoor thermal and health conditions
During the winter time (see Table 2) indoor mean air temperature of the classroom (19.0°C) with sufficient insulation and thermal mass in the building envelope is 1.7°C higher than the retrofitted classroom (17.3°C) with sufficient insulation and without thermal mass in the building envelope and 4.1°C higher than the prefab classroom (14.9°C) without sufficient insulation. Percentage of winter time in the classroom with thermal mass in the building envelope (74%) is 34% higher than the retrofitted classroom (21%) and 59% higher than the prefab classroom when indoor air temperatures are greater than or equal to 18°C. During the winter night time (7pm to 7am) without space heating (see Table 3) indoor mean air temperature of the classroom (19.0°C) with thermal mass is 2.8°C higher than the retrofitted classroom (15.8°C) and 4.5°C higher than the prefab classroom (14.1°C). Percentage of winter time in the classroom (70%) with thermal mass is 54% higher than the retrofitted classroom (16%) and 65% higher than the prefab classroom (5%) when indoor air temperatures are greater than or equal to 18°C. During the school hours (8:30am to 3:30pm) with space heating (see Table 4) indoor mean air temperature of the classroom (19.6°C) with thermal mass is 0.2°C higher than the retrofitted classroom (19.4°C) and 3.8°C higher than the prefab classroom (15.8°C). Percentage of winter time in the classroom (80%) with thermal mass is 10% higher than the retrofitted classroom (70%) and 53% higher than the prefab classroom (27%) when indoor air temperatures are greater than or equal to 18°C. Increasing insulations and adding thermal mass in the school building envelope not only can improve indoor mean air temperature but also significantly increase the percentage of winter time when indoor mean air temperatures meet the minimum requirement for indoor thermal comfort and healthy conditions.
Table 2 Winter indoor temperature and pecentage of winter time related to different teperature ranges
Classrooms Prefab Retrofit Thermal mass Indoor spaces Floor Ceiling Mean Floor Ceiling Mean Floor Ceiling Mean Outdoor Average (°C) 14.6 15.2 14.9 17.0 17.5 17.3 18.9 19.2 19.0 12.2 Max (°C) 20.8 24.2 22.0 29.1 28.2 27.4 24.0 25.5 24.2 20.6 Min (°C) 6.7 5.4 6.0 8.7 8.3 8.5 14.5 14.2 14.3 1.9 Fluctuation 14.1 18.9 15.9 20.5 20.0 18.9 9.5 11.3 9.8 18.7

1197
Thermal Performance of School Building not only Impact Indoor Thermal Comfort
Time T≥16°C 31% 42% 37% 61% 65% 63% 94% 93% 94% 11% Time T≥18°C 9% 22% 15% 36% 42% 40% 73% 75% 74% 2% Time T≥20°C 0% 8% 3% 16% 25% 21% 26% 32% 30% 0% Time T≥22°C 0% 2% 0% 5% 11% 7% 1% 6% 3% 0% Time T≥24°C 0% 0% 0% 1% 3% 1% 0% 0% 0% 0% Time T≥26°C 0% 0% 0% 0% 0% 0% 0% 0% 0% 0%
Table 3 Winter night indoor temperature and pecentage of winter night time related to different teperature ranges
Classrooms Prefab Retrofit Thermal mass Indoor spaces Floor Ceiling Mean Floor Ceiling Mean Floor Ceiling Mean Outdoor Average (°C) 14.2 14.0 14.1 15.8 15.8 15.8 18.6 18.6 18.6 10.7 Max (°C) 18.9 20.1 19.5 22.3 23.9 23.1 21.5 22.0 21.7 17.7 Min (°C) 7.3 6.0 6.7 9.1 8.8 9.0 14.7 14.4 14.6 2.0 Fluctuation 11.6 14.1 12.8 13.2 15.1 14.2 6.7 7.6 7.2 15.7 Time T≥16°C 21% 24% 23% 47% 46% 46% 93% 92% 93% 1% Time T≥18°C 4% 6% 5% 16% 16% 16% 70% 70% 70% 0% Time T≥20°C 0% 0% 0% 2% 4% 3% 16% 18% 17% 0% Time T≥22°C 0% 0% 0% 0% 1% 0% 0% 0% 0% 0% Time T≥24°C 0% 0% 0% 0% 0% 0% 0% 0% 0% 0% Time T≥26°C 0% 0% 0% 0% 0% 0% 0% 0% 0% 0%
Table 4 Winter school hours’ indoor temperature and pecentage of winter school hours related to different teperature ranges
Classrooms Prefab Retrofit Thermal mass Indoor spaces Floor Ceiling Mean Floor Ceiling Mean Floor Ceiling Mean Outdoor Average (°C) 14.9 16.6 15.8 18.6 20.1 19.4 19.4 19.9 19.6 14.3 Max (°C) 20.8 24.2 22.0 29.1 28.2 27.4 24.0 25.5 24.2 20.6 Min (°C) 6.7 5.4 6.0 8.7 8.3 8.5 14.6 14.4 14.5 2.6 Fluctuation 14.1 18.9 15.9 20.4 19.9 18.9 9.4 11.1 9.6 17.9 Time T≥16°C 38% 60% 51% 79% 87% 85% 95% 95% 95% 27% Time T≥18°C 13% 41% 27% 61% 77% 70% 78% 83% 80% 7% Time T≥20°C 0% 18% 7% 35% 59% 48% 38% 51% 46% 0% Time T≥22°C 0% 4% 0% 13% 31% 20% 4% 16% 9% 0% Time T≥24°C 0% 0% 0% 3% 8% 4% 0% 1% 0% 0% Time T≥26°C 0% 0% 0% 0% 1% 1% 0% 0% 0% 0%
Indoor air temperatures of the classroom with thermal mass in their building envelopes are more stable than the prefab classroom and the retrofitted classroom during the winter time (24 hours) with space heating during the school hours (see Figure 2) and the winter night time (7:00pm to 7:00am) without space heating (see Figure 3). Indoor air temperature fluctuations of the prefab classroom and the retrofitted classroom without thermal mass in their building envelopes are significantly larger than the classroom with thermal mass as the lightweight structure and building envelope heat up quickly and also cool down quickly. Large fluctuation can cause very low indoor air temperatures during the winter evening, night and early morning before the school hours (see Figure 4). Minimum hourly mean air temperature of the prefab classroom (12.6°C) and the retrofitted classroom (14.1°C) are significantly

1198
Bin Su, Renata Jadresin-Milic, Peter McPherson and Lian Wu
lower than the classroom with thermal mass (17.8°C) during the winter evening, night and early morning before the school hours (see Figure 4). Increasing indoor hourly mean air temperatures of the retrofitted classroom from 14.1°C (at 6:30am) to 18°C (at 10:00 am) takes over 3 hours, which not only negatively impact indoor thermal comfort but also cost more space heating energy to heat up the space. Increasing insulation in the building envelope without thermal mass can increase indoor mean air temperature but cannot reduce the fluctuation of indoor air temperature during the winter. Adding thermal mass in the building envelope not only can increase indoor mean air temperature but also reduce fluctuation of indoor air temperature.
Figure 2 Fluctuation of indoor temperature of the three classroom during the winter time (24 hours)
Figure 3 Fluctuation of indoor temperature of the three classroom during the night time (7pm to 7am)

1199
Thermal Performance of School Building not only Impact Indoor Thermal Comfort
Figure 4 Winter indoor and outdoor hourly mean air temperatures of the three classrooms
Indoor hourly mean air temperatures of the classroom with thermal mass are higher or close to 18°C during a winter evening, night and early morning (see Figure 3). There are at least 7 hours of space heating during the school hours from 8:30am to 3:30pm. When heat is lost from indoor to outdoor through the building envelope of the classroom with thermal mass, some heat will be stored in the thermal mass in the building envelope and released to the indoor space late after the heater is turned off, which can continuously maintain the indoor air temperature at a high level during the evening, night and early morning. For the prefab classroom and the retrofitted classroom without thermal mass in their envelopes, when the heat is lost from indoor to outdoor through the building envelopes, not much heat is stored in their building envelopes, and the indoor temperature will sharply decrease without space heating, which causes very low indoor air temperatures during the evening, night and early morning. Very low indoor temperature not only can impact thermal comfort but also can negatively impact occupants’ health. During the winter time (see Table 5), percentage of winter time of the prefab classroom without sufficient insulation and the retrofitted classroom with sufficient insulation and without thermal mass, when indoor air temperatures are lower than 16°C, 14°C, 12°C, 10°C, and 9°C, are significantly higher or clearly higher than the classroom with sufficient insulation and thermal mass in the building envelope. Adding thermal mass in the building envelope not only can improve indoor thermal comfort and energy efficiency for space heating but also can raise the baseline of winter indoor air temperature and improve indoor healthy thermal conditions for occupants.
Table 5 Pecentage of winter time related to low indoor air temperature ranges
Classrooms Prefab Retrofit Thermal mass Indoor spaces Floor Ceiling Mean Floor Ceiling Mean Floor Ceiling Mean Outdoor Average T (°C) 14.6 15.2 14.9 17.0 17.5 17.3 18.9 19.2 19.0 12.2 Max T (°C) 20.8 24.2 22.0 29.1 28.2 27.4 24.0 25.5 24.2 20.6 Min T (°C) 6.7 5.4 6.0 8.7 8.3 8.5 14.5 14.2 14.3 1.9 Fluctuation 14.1 18.9 15.9 20.5 20.0 18.9 9.5 11.3 9.8 18.7 Time T<9°C 2% 3% 2% 0% 0% 0% 0% 0% 0% 18% Time T<10°C 4% 7% 6% 0% 0% 0% 0% 0% 0% 25% Time T<12°C 16% 17% 17% 3% 3% 3% 0% 0% 0% 46% Time T<14°C 38% 35% 36% 16% 15% 15% 0% 0% 0% 70% Time T<16°C 69% 58% 63% 39% 35% 37% 6% 7% 6% 89%

1200
Bin Su, Renata Jadresin-Milic, Peter McPherson and Lian Wu
3.2. Indoor relative humidity and indoor health conditions
As indoor relative humidity increases or decreases are associated with a decrease or increase of indoor air temperature, very low indoor air temperature can cause very high relative humidity. During the winter time (see Table 6), the indoor mean relative humidity of prefab classroom (70%) without sufficient insulation and thermal mass is about 10% higher the retrofitted classroom (60%) with sufficient insulation and without thermal mass in the building envelope and the classroom with sufficient insulation and thermal mass in the building envelope (58%). Maintaining the indoor relative humidity between 40% and 60% can minimize the indirect health effects such as bacteria, viruses, fungi, mites, etc. Percentage of winter time of the classroom (67.4%) with sufficient insulation and thermal mass in the building envelope, when indoor relative humidity is in the range of 40% to 60%, is 21.4% higher than retrofitted classroom (46.0%) with sufficient insulation and without thermal mass in the building envelope and 64.7% higher than prefab classroom (2.7%) without sufficient insulation and thermal mass in the building envelope. Indoor mean relative humidity of the prefab classroom is higher than the range of 40% to 60%. Indoor mean relative humidity of the retrofitted classroom and the classroom with thermal mass are in the range of 40% to 60% during the winter time. Sufficient insulation in the school building envelope can increase winter indoor mean air temperature and decrease winter indoor mean relative humidity. Adding thermal mass in the building envelope not only decrease winter indoor mean relative humidity but also increase winter time when indoor relative humidity is in the range of 40% to 60%, which can improve indoor health conditions.
Table 6 Winter indoor temperature and pecentage of winter time related to different relative humidity ranges
Classrooms Prefab Retrofit Thermal mass Indoor spaces Floor Ceiling Mean Floor Ceiling Mean Floor Ceiling Mean OutdoorAverage RH (%) 70 70 70 61 59 60 58 57 58 80 Max RH (%) 84 85 84 84 83 84 77 76 76 99 Min RH (%) 51 52 53 28 32 30 37 33 35 35 Time RH≥40% 100% 100% 100% 99% 98% 99% 100% 100% 100% 100% Time RH≥50% 100% 100% 100% 91% 84% 88% 90% 89% 90% 98% Time RH≥60% 97% 96% 97% 57% 49% 53% 33% 31% 32% 93% Time RH≥70% 53% 53% 53% 11% 8% 9% 4% 3% 3% 78% Time RH≥75% 16% 15% 14% 2% 2% 2% 1% 0% 0% 69% Time RH≥80% 1% 2% 1% 1% 1% 1% 0% 0% 0% 58% Time RH≥85% 0% 0% 0% 0% 0% 0% 0% 0% 0% 44% Time RH≥90% 0% 0% 0% 0% 0% 0% 0% 0% 0% 26% Time RH≥100% 0% 0% 0% 0% 0% 0% 0% 0% 0% 0% Time 40%≤RH≤60% 3.2% 3.8% 2.7% 41.9% 49.1% 46.0% 66.5% 68.6% 67.4% 7.5%

1201
Thermal Performance of School Building not only Impact Indoor Thermal Comfort
4. CouclusionsIn New Zealand, there are a significant number of schools buildings built before 2000 without sufficient insulation and single glazing window. Those old school buildings have poor thermal performance, very low indoor temperature and high relative humidity during the winter time, which can negatively impact indoor thermal and health conditions for occupants. In the current situation, retrofitting old school building mainly focus on increase R-value (sufficient insulation and double glazing window) in the building envelope (without considering thermal mass effect), which can maintain winter indoor mean air temperature at acceptable level durng the school hours with space heating, but cannot reduce the large fluctuation of winter indoor air temperatures and prevent very low indoor air temperatures during the winter evening, night and early morning.
Increasing insulation and adding thermal mass in a school building envelope not only can increase winter indoor mean air temperature but also reduce fluctuation of winter indoor air temperature. Adding thermal mass in a school building envelope with sufficient insulation and double glazing window not only can increase indoor mean air temperature but also significantly increase the percentage of winter time when indoor mean air temperatures meet the minimum requirement (18°C) for indoor thermal comfort and healthy conditions. Adding thermal mass in a school building envelope with sufficient insulation and double glazing window not only can raise the baseline of winter indoor air temperature, which can improve indoor thermal comfort and energy efficiency for space heating, but also significantly reduce percentages of winter time when indoor air temperatures are lower than 16°C, 12°C, 10°C and 9°C, which can prevent very low winter indoor air temperature and maintain indoor healthy thermal conditions.
Adding thermal mass in a school building envelope with sufficient insulation and double glazing window not only can increase the percentage of winter time, when indoor mean air temperatures meet thermal comfort and healthy thermal conditions, but also significantly increase the percentage of winter time, when indoor relative humidity is maintained between 40% and 60%, which can minimize the indoor indirect health effects such as bacteria, viruses, fungi, mites, etc. The classroom with sufficient insulation and thermal mass in the building envelope has a lower percentage of winter time than the classroom with sufficient insulation and without thermal mass when indoor relative humidity is greater than or equal to 60%, 70%, 75% and 80%. For the future school development, adding thermal mass in the school building envelope with sufficient insulation and double glazing window is very important for winter indoor thermal comfort conditions, indoor healthy conditions and energy efficiency of space heating under a temperate climate with a mild and wet winter.
References Arlian, L. G., Yella, L. & Morgan, M. S. (2010). House dust mite population growth and allergen production in
cultures maintained at different temperatures. The Journal of Allergy and Clinical Immunology, 125(2), AB17. Arlian, L. G., Neal, J. S., & Vyszenski-Moher, D. L. (1999). Reducing relative humidity to control the house dust mite
Dermatophagoides farinae. The Journal of Allergy and Clinical Immunology, 104(4), 852–856. Arlian, L. G., Rapp, C. M., & Ahmed S. G. (1990). Development of Dermatophagoides pteronyssinus (Acari:
Pyroglyphidae). The Journal of Medical Entomology, 27(6), 1035–1040. Arlian, L. G., Bernstein, I. L., & Gallagher, J. S. (1982). The prevalence of house dust mites, Dermatophagoides spp,
and associated environmental conditions in homes in Ohio. The Journal of Allergy and Clinical Immunology, 69(6), 527–532.

1202
Bin Su, Renata Jadresin-Milic, Peter McPherson and Lian Wu
Arundel, A. V., Sterling, E. M., Biggin, J. H. & Sterling, T. D. (1986). Indirect health effects of relative humidity in indoor environment. Environmental Health Perspectives, 65, 351–361.
ASHRAE. (1993a). ASHRAE Standard 62-2000 – Ventilation for Acceptable Indoor Air Quality. Atlanta, GA: American Society of Heating, Refrigeration and Air-conditioning.
ASHRAE. (1993b). Thermal Insulation and Vapour Retarders – Applications. In ASHRAE Handbook – Fundamentals (pp. 20-1–20-16). Atlanta, GA: American Society of Heating, Refrigeration and Air-conditioning.
Block, S. S. (1993). Humidity requirements for mould growth. Applied Microbiology, 1, 287–293. Braubach, M., Jacobs D. E., & Ormandy, D. (Eds. 2011). Environmental burden of disease associated with inadequate
housing: A method guide to the quantification of health effects of selected housing risks in the WHO European Region. Copenhagen, Denmark: WHO Regional Office for Europe.
Collins, K. J. (1986). Low indoor temperatures and morbidity in the elderly. Age and Ageing, 15(4), 211–20. Coppock, J. B. M., & Cookson, E. D. (1951). The effect of humidity on mould growth on construction material,
Journal of the Science of Food and Agriculture, December 1951, 534–537. DBH (Department of Building and Housing). (2001). Compliance document for New Zealand Building Code – Clause
G5 Interior Environment. Wellington, New Zealand: Author. Goodwin, J. (2000). Cold stress, circulatory illness and the elderly. In F, Nicol & J. Rudge, (Eds.), Cutting the cost of
cold: Affordable warmth for healthier homes (pp. 48–61). London, UK: E&FN Spon Ltd. Hart, B. J. (1998). Life cycle and reproduction of house-dust mites: Environmental factors influencing mite
populations. Allergy, 53, 13–17. Hens, H. L. S. C. (2000). Minimising fungal defacement. ASHRAE Journal, October 2000, 30–44. Howden-Chapman, P., K. Saville-Smith, J. Crane and N. Wilson. 2005. “Risk Factors for Mould in Housing: A National
Survey Indoor Air.” Indoor Air 15(6): 469-476. Hunt, S. (1997). Housing-related disorders. In J. Charlton & M. Murphy (Eds.), The health of adult Britain: 1841-1994
(pp. 156–170). London, UK: The Stationery Office. Korsgaard, J. (1982). Preventive measures in house-dust allergy. The American Review of Respiratory Disease, 125,
80–84. Lloyd, E. L. (1990). Hypothesis: Temperature recommendations for elderly people: Are we wrong? Age and Ageing,
19, 264–267. Murray, A. B., & Zuk, P. (1979). The seasonal variation in a population of house dust mites in a North American city.
Journal of Allergy and Clinical Immunology, 64, 266–269. Pasanen, A. L., Juutinem, T., Jantunem, M., et al. (1992). Occurrence and moisture requirements of microbial growth
in building materials. International Biodeterioration and Biodegraadation, 30, 273–283. Siebers, R., K. Wickens, and J. Crane. 2006. “House Dust Mite Allergens and Allergic Diseases – the Wellington
Asthma Research Group studies.” New Zealand Journal of Medical Laboratory Science 60(2): 49-58. SNZ (1990). New Zealand Standard 4303:1990 Ventilation for Acceptable Indoor Air Quality. Wellington, New
Zealand: Standards New Zealand. SNZ (2007). NZS 4342.1:2007 Energy Efficiency – Large Buildings Part1: Building Thermal Envelope. Wellington, New
Zealand: Standards New Zealand. SNZ (2009). New Zealand Standard 4218:2009 Thermal Insulation – Housing and Small Buildings. Wellington, New
Zealand: Standards New Zealand. Su, B. (2006). Prevention of winter mould growth in housing. Architectural Science Review, 49(4), 385–390. WHO (1987). Health impact of low indoor temperatures. Copenhagen, Denmark: World Health Organisation,
Regional Office for Europe. WHO (2009). WHO guidelines for indoor air quality: dampness and mould. Copenhagen, Denmark: World Health
Organization, Regional Office for Europe.

1203
The 54th International Conference of the Architectural Science Association (ANZAScA) 2020
To improve the strategic decision making for effective governance of public-spend regenerative projects.
Jas Qadir1, Dave Moore2, Ali GhaffarianHoseini3, Clare Tedestedt George4, James O. Rotimi5 1 Researcher, School of Future Environments, Auckland University of Technology (AUT), Auckland, New
Zealand. [email protected] 2 Health and Safety by Design Manager, Health and Technical Services Group, WorkSafe New Zealand
3 Head of Department of Built Environment, School of Future Environments, AUT, New Zealand 4 Researcher, Mackie Research and Consulting Ltd
5 Associate Professor, School of Built Environment, Massey University, New Zealand
Abstract: This paper aims to present an investigation of definitions, barriers and systems for change in the landscape of regenerative development (RD), through semi-structured interviews to contextualize it to the New Zealand (NZ) built environment. This work informs a larger ongoing study designed to improve strategic decision-making in major public sector projects in New Zealand with a view to incorporate regenerative development principles. The findings were obtained using two data collection methods – Pilot Interviews with selected New Zealand built environment industry stakeholders from across the system and Archival Data to discuss the findings. The sampling criteria included participants with the motivation and knowledge for change making in various sub-sectors of the built environment system. The Archival Data was selected based on the relevance of the data to Living Standards Framework, public spend projects with broader aspirations and closeness to beyond sustainability and regenerative development. This paper contributes to the literature by extending and elaborating the understanding of RD landscape of NZ and on contextual factors influencing strategic decision-making from the governance, management, and procurement aspects. The paper also presents the initial findings of wider contextual conditions that facilitate or hinder RD projects, it allows industry and government to respond better to the urgent global challenge of producing broader social, cultural, natural and human outcomes through built environment projects.
Keywords: Regenerative Development, Strategy, Governance, Broader Positive Outcomes.
Imaginable Futures: Design Thinking, and the Scientific Method. 54th International Conference of the Architectural Science Association 2020, Ali Ghaffarianhoseini, et al (eds), pp. 1203–1212. © 2020 and published by the Architectural Science Association (ANZAScA).

1204
Bin Su, Renata Jadresin-Milic, Peter McPherson and Lian Wu
1. Introduction.
1.1 Rationale and Significance. The aim of this paper is to present an initial landscape of understanding of regenerative development and various contextual factors influencing its uptake in New Zealand built environment industry. The paper presents this through an initial exploration of various system definitions, reported benefits, and considers barriers to Regenerative Development (RD) in the New Zealand context. This work informs a larger ongoing study designed to improve strategic decision-making in major public sector projects in New Zealand with a view to incorporate regenerative development principles. This paper is a continuation of an exploratory research paper which employed Literature Content Analysis and Informal Interviews as Data Collection Methods. Key themes from the exploratory paper consist of system definition of regenerative development and the contextual factors influencing the processes for place-based, value-centred, long-term community problem solving through the aspects of governance, management, and procurement.
1.2 Literature Review. Projects with regenerative approaches adopt a living systems-based approach, within which buildings are not considered individual objects, but instead are designed as parts of larger nested systems, allowing complex and mutually beneficial interactions between the built environment, the living world and human inhabitants (Regenesis, 2016). For the purposes of this study the Robinson & Cole definition was adopted as a starting point for its match with contemporary anecdotal usage in the New Zealand Regenerative Development community, ‘Regenerative Development aims to restore or create the capacity of ecosystems where potential is created by the social, cultural, human, natural and financial values of the place collectively informing the development process’ (Robinson & Cole, 2015). The motivation for the study arose from a combination of current international socio-enviro- economic-political issues, that jointly have resulted in the New Zealand Government seeking to systematically gain wider measured benefits from public building and infrastructure projects. These issues go beyond policy problems as they are all encompassing. Hall (2019) states that in trying to resolve these inter-related issues, human beings should be weary of creating new ones, specifically in the socio-political domain. The interactions between costs and benefits being as important strategically as the elements themselves. These are suggested as Governance barriers that provided further motivation for this specific study. These included reportedly fragmented interaction between Central and Local government and, between public and private sector, especially regarding planning for climate change adaption and mitigation.
2. Approach and methods.The following questions were posed for data collection:
• What does Regenerative Development and Design mean to NZ built environmentindustry?
• What are the potential benefits?
• What are the barriers in the New Zealand context?

1205
To improve the strategic decision making for effective governance of public-spend regenerative projects
The flowchart in Figure 1 describes the approach for data collection in detail. The findings were obtained using two data collection methods – Pilot Interviews (Kabir, 2016) with selected New Zealand built environment industry stakeholders from across the system as per Table 1 and Archival Data to discuss the findings (Creswell & Creswell, 2017; Gibbs, 2018; Longhofer, Floersch, & Hoy, 2012). The Archival Data was selected based on its relevance to RD from both academic literature and projects in New Zealand. Archival reading material suggested by the Pilot Interview participants were also taken in consideration. Google Search tool and Auckland University of Technology’s Library Tool were the primary data search tools.
The Pilot Interviews, 10 in total, were analysed by transcribing the audio-recordings. These transcripts were then coded and checked to ensure that the codes were appropriately grouped and consistent across all the interviews (Creswell & Creswell, 2017; Gibbs, 2018; Longhofer, Floersch, & Hoy, 2012). These codes resulted in the identification of emerging themes which are discussed in Section 3. The analysis of the Interview data further resulted in the identification of perceptions about definitions of RD, reported barriers and System Map for the flow of strategic decision-making which are discussed in Section 3.
Finally, the participant identifiers including names and organisations were deleted and replaced with code PI# where PI stands for Pilot Interview and # denotes the participant number.
Figure 1: Data Collection Approach and Method

1206
Bin Su, Renata Jadresin-Milic, Peter McPherson and Lian Wu
Table 1: Participant Selection Criteria
NZ Built Environment Role Participant Professional Role and Responsibility
Government departments responsible for public-spend decisions Example: Top-tier Government and State Sector Bodies
• Involved in inter-generational decision- making for the public-funded built environment AND
• Encouraging development of best practice for decision-making on public spend AND
• Representing the minor population through an organized governance systemAND
• Participants involved in the maintenance and upkeep of the built environment AND
• Participants spend 6-8 hours/day interacting with the same built environment AND
• Participants involved in the maintenance and upkeep of the built environment.
Policy departments and Territorial Authorities informing the public-spend decisions Example: Top-tier Ministry departments, Regulatory Bodies and Local Councils
Sector Bodies informing policymakers and Territorial Authorities Example: Regulatory Bodies, Top-tier Research Agencies informing policy and public-spend decision-making.
Individual Organizations undertaking built environment projects Example: Design, Project Management and Contractor Firms amongst others
Community Organizations informing sector bodies, policymakers, and individual organisations Example: Local Community Groups, Mana Whenua and Tangata Whenua
End Users including Facility Management Example: Local Community, Specific End Users such as university students and staff amongst other examples.

1207
To improve the strategic decision making for effective governance of public-spend regenerative projects
3. Findings and discussion.In Section 3, the findings are discussed, compared and contrasted with the literature and Archival Data on the effectiveness of current definitions and systems-focused problem-solving processes to achieve broader outcomes though the research questions asked on definitions, benefits and barriers to RD. The Ecological Model adapted from Brofenbrenner’s Ecological Systems Theory (George, C. T., 2018) shown in Figure 2 below identifies the contextual factors acting as barriers determined as findings from Phase 1 Interviews. These contextual factors are further explained in Sections 3.2 and 3.3. It is hoped that the following Phase 2 will identify an increased number of contextual factors as barriers for adoption of RD.
Figure 2: Ecological Systems Model showing reported barriers from Phase 1 (George, C. T., 2018)

1208
Bin Su, Renata Jadresin-Milic, Peter McPherson and Lian Wu
Figure 3 below shows the initial Socio-Technical System Map based on Rasmussen’s Socio-Technical Framework, 1997. This is an early System Map identified as a finding of Phase 1 Interviews, highlighting the strategic decision-making flow between various system participants and it is hoped that it will further be developed through Phase 2 Interviews. This Socio-Technical System Map is important as it can used by communities and people acting as funders to navigate the Built Environment Industry to understand strategic decision-making requirements and influence change. The lines around the System Map identify the adjoining industries and sectors that directly engage with the NZ Built Environment for capital projects or indirectly to influence decision-making and change. This model of representation is based on the “three lines of work” (Regenesis, 2016) and Whole Systems Economic Development Approach (Ungard & Haggard, 2020; Mang & Reed, 2012).
Figure 3: Socio-Technical System Map as finding of Phase 1 Interviews (Rasmussen, 1997)
3.1. Definition. The most stated definition by the participants was, “It is a community-based problem-solving approach with a two-way communication and information flow facilitating overall system collaboration. It develops and utilizes methods of accelerating decision-making but without abandoning evidence-based calculations, strategic integrity or holistic embrace.” (PI1, PI2, PI3, PI4, PI5, PI7, PI9, PI10)

1209
To improve the strategic decision making for effective governance of public-spend regenerative projects
Further, the findings indicate that there is a lack of one single definition which is agreed upon by the entire system. Each stakeholder understands regenerative development mostly influenced by where they are in the system and their level of work and influence within that sub-system. As a result, this can create confusion and misunderstanding of key terms and concepts between various project stakeholders, thereby sometimes adversely affecting the project. A built environment specific definition will create clarity, trust, and ownership among various stakeholders, both public and private. It will further eliminate the possibility of anecdotes being used as a public-relations exercise due to the lack of a single built environment definition and long-term objective case-study examples. In addition, from the available literature and case studies, most projects have a degree of urban-rural farming attached to the overall development project. Given the deep relationship RD aims to explore with the land and ecology, it seems as though the conversation always circles back to a framing-growing space. This indicates that regenerative development is yet to be applied to renovation, extension, and refit projects to explore the complete relationship the concept shares with built environment. Acknowledging this aspect will further help clarify the intent of the definition for regenerative development. The following questions arose most regularly in relation to this part of the analysis but largely remain unanswered and will form the focus for Phase Two and Three of the study:
• What is Te Ao Maori perspective with regards to connection to land and how does this influence the definition for regenerative development?
• What is the perception of regenerative development by top-tier industry executives andpoliticians making strategic decisions for the complete industry?
3.2 Strategic governance, management and procurement: Processes for long-term community problem solving. The findings highlighted the various negative short and medium consequences of built environment developments focused solely on short-term economic gains (PI1, PI2, PI3, PI4, PI5, PI6, PI7, PI8, PI9 & PI10). These consequences reportedly include disharmony among stakeholders, a loss of trust and/or unrealistic expectations regarding time, cost and scope (Advisian Worley Group, 2019). Such expectations may force the project staff members to take unnecessary or miscalculated risks (Advisian Worley Group, 2019). These findings as barriers are represented in Figure 2 and strategic decision- making flow is represented in Figure 3. The evidence also points towards certain long-term consequences. These are mostly experienced by the occupants and others interacting with the completed project. Practical issues occur in tandem with an increased sense of disconnection with the culture of the place, and its values in future generations - as mentioned by a community leader participant. Fundamentally, the findings underline strongly key differences in the Te Ao Maori and Western world views. These world views are notably different, and integration is complicated by historical events. It is critical therefore, that meaningful consultation be successfully undertaken during the early strategic decision-making stages of a project in New Zealand to incorporate the values of all concerned to ensure the project reflects these in the Key Performance Indicators (KPIs). The findings indicate that regenerative projects can transgress into the policy landscape due to the systemic functioning of the project. This provides opportunity to review existing policy and legislation to accommodate the needs of the projects within multiple capital-related outcomes. In New Zealand, the

1210
Bin Su, Renata Jadresin-Milic, Peter McPherson and Lian Wu
Treasury has adopted the Living Standards Framework (LSF) to incorporate the delivery of multiple value-based outcomes, however there is significant gap in the alignment of LSF’s objectives and current strategic decision-making and procurement practices. The cost of limiting the scope of our policies and legislations to facilitate collaboration and partnership among organizations is a reported barrier to systems integration and enabler of the existing organisational ‘silos’ (PI1, PI2, PI3, PI4, PI5, PI6, PI7, PI8, PI9 & PI10). Broadening the scope of the policy will further assure the stakeholders, especially those directly interacting with the built environment of the alignment in expectations of the leadership and other systemic actors (Advisian Worley Group, 2019). Further, this indicates the need for innovation in project strategic decision making and governance structures. The cost of doing it later in the project or doing it wrongly may be unnecessarily expensive than doing it well as early as possible in the project, preferably in the pre-feasibility stages. This further indicates that the decision-making and governance structures will need to be flexible and accommodating of various stakeholders’ expectations. The analysis of the findings points towards the importance of purposeful and increased democracy in the form of inclusion and participation of stakeholders in early strategic decision-making. It is acknowledged that this may not occur without its own associated challenges, however multiple aspirations, attitudes, and behaviors will need to be managed and harmonized through value-based communication.
3.3 Other contextual factors. Currently, the evidence of projects undertaken indicates that RD works for people with resources to wait a while, either in the form of finances, time, skills, or capability. Literature further states that both capacity and capability need to be built in terms of resources - finance, skills, materials, and subject matter experts to realize such projects (Cole, 2012 & Clegg, 2015). These contextual factors as barriers are represented in Figure 2 and strategic decision-making flow is represented in Figure 3. Further, the literature and evidence provided through projects undertaken suggest that Government assistance is essential to bridge the access to RD for everyone without the resources to wait for better financial, timing, and legislative conditions. Given the upfront integration of professionals, and added new ones as advisors from the natural, human, social, and cultural capitals domains as required, it means substantial upfront costs for the project. Some projects are trialing appointment of Iwi representatives as professional design, delivery and decision-making partners which can further elaborate the risk profile of the project (Kāinga Ora, 2020). International projects suggest this as a pattern. Government assistance and political will are commonly emerging themes as supporting agencies of change (Advisian Worley Group, 2019; The Construction Sector Accord, 2019). The upfront costs of pre-feasibility discussion and conceptualization of projects will be a major challenge initially due to the novelty and lack of long-term case study examples (Cole, 2012; Clegg, 2015; Regenesis 2016). It is important to acknowledge these upfront costs in early project planning and use the existing set-up of systems to integrate the delivery (New Zealand Government Procurement, 2019). Some of the processes that can be plugged-in together system-wide include the Living Standards Framework and Better Business Cases Tools by NZ Treasury (Advisian Worley Group, 2018) and Broader Outcomes Programme by NZ Procurement (New Zealand Government Procurement, 2019). It is important that the upfront costs are addressed as early as possible in the planning, so the costs are not borne by the future generations and lessens the burden of spend on the current and future generations of taxpayers.

1211
To improve the strategic decision making for effective governance of public-spend regenerative projects
Lastly, the lack of mainstream professional energy in this field could further reflect the fact that as experienced people gain understanding they notice the conceptual and practical loopholes and move on due to the lack of on-going projects and case-study examples (The Construction Sector Accord, 2019). Further, reflecting on the data indicates that there is an overall systems knowledge gap on how to collectively gather the existing knowledge, skills and experience to realize these projects (PI1, PI2, PI3, PI4, PI5, PI6, PI7, PI8, PI9 & PI10). Lastly, there appears to be a difference in the understanding of method versus result. The industry has an affinity with the result in the form of finished buildings, certifications, awards and branding and public agencies are more inclined towards method. Projects perceived as ‘gloss’ factor are often rejected by public spend organisations factoring it towards expensive and unjustifiable spend of taxpayer funds (PI5).
4. Conclusion.The findings, emerging themes and gaps from this study consolidate the thinking that that the global ecosystem is currently faced with complex and inter-related social, cultural, economic, natural, human and political challenges including climate change, biodiversity and equity loss (Zari, 2019; Regenesis, 2016). Findings discussed in Section 3 will further be explored in detail in Phases Two and Three of this research. This leads to the following questions regarding gaps in available literature and strategic decision-making and project governance practice:
• How does effective partnership look like in a regenerative project?• How can strategic decision making facilitate effective partnership, governance, and
procurement? Can existing systems and processes facilitate this? • There is no coordinate national definition, strategy or response to dealing with
interconnected, systemic challenges such as climate change, homelessness, etc. What doesthis strategy look like?
Acknowledgements The reported research was internally funded and supported by the Design and Creative Technologies Faculty of Auckland University of Technology, Auckland, New Zealand.

1212
Bin Su, Renata Jadresin-Milic, Peter McPherson and Lian Wu
References 7Group, & Reed, B. (2009). The integrative design guide to green building: redefining the practice of sustainability. Advisian Worley Group. (2019). An examination of issues associated with the use of NZS Conditions of Contract. NZ
Treasury: Infrastructure Transactions Unit. Beatrice Ungard and B. Haggard (2020). Whole Systems Economic Development: A Regenerative Approach,
Medium. Clegg, P. (2012). A practitioner’s view of the ‘Regenerative Paradigm’. Building Research and Information, 40(3),
365-368.Cole, R. J. (2012). Regenerative design and development: current theory and practice. Building Research and
Information, 40(1), 1-6. Cole, R. J., Busby, P., Guenther, R., Briney, L., Blaviesciunaite, A., & Alencar, T. (2012). A regenerative design
framework: setting new aspirations and initiating new discussions. Building Research and Information, 40(1), 95- 111.
Creswell, J. W., & Creswell, J. D. (2017). Research design: Qualitative, quantitative, and mixed methods approaches. Thousand Oaks, CA, US: Sage Publications.
George, C. T. (2018). An Inquiry into Contextual Factors Impacting the Occupational Health, Safety, and Well-Being of New Zealand Truck Drivers: A Ecological Systems Approach. School of Business, Economics, and Law. Auckland, New Zealand, Auckland University of Technology, Doctor of Philosophy (PhD).
Gibbs, G. R. (2018). Analyzing qualitative data (Vol. 6). Thousand Oaks, CA, US: Sage Publications. Hall, D. (2019). On care and carelessness. In D. Hall (Ed.), A Careful Revolution: Towards a Low-Emissions Future (pp.
163-183). New Zealand: BWB Texts.Kabir, Syed Muhammad. (2016). Methods of Data Collection. MacGregor, C., et al. (2018). The built environment and climate change: A review of research, challenges and the
future. BRANZ Study Report SR403. Judgeford, New Zealand, BRANZ Ltd. Mang, P., & Reed, B. (2012). Designing from Place: A Regenerative Framework and Methodology. Building Research
and Information. Mang, P., & Reed, B. (2014). The nature of positive. Building Research and Information. New Zealand Government Procurement. (2019). Construction Sector Procurement Guidelines. Retrieved from
https://www.procurement.govt.nz/procurement/principles-charter-and-rules/government-procurement-rules/ New Zealand Treasury. (2018). The Treasury Approach to the Living Standards Framework. Regenesis, G. (2016). Regenerative development and design: A framework for evolving sustainability. Retrieved
from https://ebookcentral.proquest.com Robinson, J., & Cole, R. J. (2015). Theoretical underpinnings of regenerative sustainability. Building Research and
Information, 43(2), 133-143. Sertyesilisik, B. (2017). A preliminary study on the regenerative construction project management concept for
enhancing sustainability performance of the construction industry. International Journal of Construction Management, 17(4), 293-309. doi:10.1080/15623599.2016.1222665
The Construction Sector Accord. (2019). Construction Sector Accord: Transformation Plan. Retrieved from https://www.constructionaccord.nz/
Zari, M. P. (2019). Ecosystem services impacts as part of building materials selection criteria. Materials Today Sustainability, 3-4(2019).
Zari, M. P., Kiddle, G. L., Blaschke, P., Gawler, S., & Loubser, D. (2019). Utilising nature-based solutions to increase resilience in Pacific Ocean Cities. Ecosystem Services.

1213
The 54th International Conference of the Architectural Science Association (ANZAScA) 2020
To understand the systemic and contextual factors to improve the strategic decision making of regenerative projects
Jas Qadir1, Dave Moore2, Ali GhaffarianHoseini3, Clare Tedestedt George4, James O. Rotimi5 1 Researcher, School of Future Environments, Auckland University of Technology (AUT), Auckland, New
Zealand. [email protected] 2 Health and Safety by Design Manager, Health and Technical Services Group, WorkSafe New Zealand
3 Head of Department of Built Environment, School of Future Environments, AUT, New Zealand 4 Researcher, Mackie Research and Consulting Ltd
5 Associate Professor, School of Built Environment, Massey University, New Zealand
Abstract: This paper presents an exploratory investigation of definitions, benefits, barriers, and drivers in the landscape of regenerative development (RD), mainly through international developments but contextualizes it to the New Zealand (NZ) built environment. We combined the content analysis of relevant literature with Informal Interviews and industry discussion programme involving key stakeholders from the NZ built environment sector. We contribute to the literature by extending and elaborating our understanding of regenerative development landscape of NZ. We extend the literature on factors influencing strategic decision-making of regenerative projects by exploring the landscape via industry stakeholders. We further elaborate on how regenerative projects are facilitated or hindered by wider contextual conditions. These included the use of value-based decision making, the need for governance and partnership among stakeholders of varying cultural aspirations; capturing, measuring and tracking the overall performance of the through social, human, natural, political, cultural and financial capitals; the potential for increased democracy and participation amongst stakeholders; and flexible and adaptable policy facilitating collaboration among private and public sector organisations. The paper concludes with recommendations for future work on these questions.
Keywords: Regenerative Development, Value-Based Decision Making, Governance and Partnerships.
Imaginable Futures: Design Thinking, and the Scientific Method. 54th International Conference of the Architectural Science Association 2020, Ali Ghaffarianhoseini, et al (eds), pp. 1213–1222. © 2020 and published by the Architectural Science Association (ANZAScA).

1214
Bin Su, Renata Jadresin-Milic, Peter McPherson and Lian Wu
1. Introduction.
1.1 Rationale and Significance. The purpose of this study was to provide an understanding of the early regenerative development landscape in New Zealand’s (NZ) built environment. The paper discusses various definitions, sets out reported benefits, and considers barriers to Regenerative Development (RD) in the New Zealand context. This work informs a larger ongoing study designed to improve strategic decision-making in major public sector projects in New Zealand with a view to incorporate regenerative development principles.
1.2 Literature Review. Projects with regenerative approaches adopt a living systems-based approach, within which buildings are not considered individual objects, but instead are designed as parts of larger nested systems, allowing complex and mutually beneficial interactions between the built environment, the living world and human inhabitants (Regenesis, 2016). For the purposes of this study the Robinson & Cole definition was adopted as a starting point for its match with contemporary anecdotal usage in the New Zealand Regenerative Development community, ‘Regenerative Development aims to restore or create the capacity of ecosystems where potential is created by the social, cultural, human, natural and financial values of the place collectively informing the development process’ (Robinson & Cole, 2015). The motivation for the study arose from a combination of current international socio-enviro- economic-political issues, that jointly have resulted in the New Zealand Government seeking to systematically gain wider measured benefits from public building and infrastructure projects. These issues go beyond policy problems as they are all encompassing. Hall (2019) states that in trying to resolve these inter-related issues, human beings should be weary of creating new ones, specifically in the socio-political domain. The interactions between costs and benefits being as important strategically as the elements themselves. These are suggested as Governance barriers that provided further motivation for this specific study. These included reportedly fragmented interaction between Central and Local government and, between public and private sector, especially regarding planning for climate change adaption and mitigation.
2. Approach and methods.The following questions were posed for data collection:
• What does Regenerative Development and Design mean to NZ built environmentindustry?
• What are the potential benefits?• What are the potential challenges?• What are the barriers in the New Zealand context?
The findings were obtained using two data collection methods – literature content analysis and Modified Informal Interviews (Kabir, 2016) with selected New Zealand built environment industry stakeholders from across the system (Creswell & Creswell, 2017; Gibbs, 2018; Longhofer,

1215
To understand the systemic and contextual factors to improve the strategic decision making of regenerative projects
Floersch, & Hoy, 2012). Table 1 clearly presents the step-by-step process undertaken for Informal Interviews and Industry Discussions. Figure 1 presents the flow-chart for the Data Collection Approach and Method. To analyse the data, the literature content was inductively coded with the Informal Interviews data using the research questions as “first order codes” and as the analysis proceeded they were able to be grouped together to develop “second order” themes (Creswell & Creswell, 2017; Gibbs, 2018; Longhofer, Floersch, & Hoy, 2012) as value-based decision making, the need for governance and partnership among stakeholders of varying cultural aspirations; capturing, measuring and tracking the overall performance of the through social, human, natural, political, cultural and financial capitals; the potential for increased democracy and participation amongst stakeholders; and flexible and adaptable policy facilitating collaboration among private and public sector organisations. In this way, an initial coding framework was developed, and a picture of the regenerative landscape and context was built up. Interview transcripts and notes were coded drawing upon the initial coding framework, which was further developed as we contrasted the literature content and interview evidence.
Figure 1: Data Collection Approach and Method

1216
Bin Su, Renata Jadresin-Milic, Peter McPherson and Lian Wu
Table 1: Informal Interviews and Industry Discussions
Modified Informal Interviews Total participants
1. International best practice organisations in the
regenerative landscape
3
2. NZ best practice design and project delivery
organisations in the regenerative landscape
7
3. NZ developers of regenerative projects 6
4. NZ built environment industry events for
leading graduate innovators held in
collaboration with tertiary education providers
5
Industry Discussions Purpose
5. National advocacy agency for green building Attended organized events in Auckland to
obtain an understanding on the direction
of green building and change-
making advocacy.
6. Leading building industry conference - an expo of
trades, professionals, developers, leading
change-making advocates, and ministers to
obtain an understanding of the current state of
business-as-usual and the desired future state.
Listening to various speakers,
summarizing their thoughts and vision for
the future of the NZ built environment.
7. Audio-visual documented resources on the internet, public access, compiled by
international innovators, both practitioners and academics, in the regenerative
development landscape.

1217
To understand the systemic and contextual factors to improve the strategic decision making of regenerative projects
3. Findings and discussion.In Section 3, the Informal Interviews findings are discussed, compared, and contrasted with the literature content. The findings were analysed based on the research questions asked. However, the findings suggest that the answers, as far as they are available, lie most naturally in cross-cutting themes, reflecting the integrated nature of the topic, and especially the possible ways forward. The cross-cutting nature of answering the semi-structured questions further indicates that the participants were naturally comfortable answering them in a cross-cutting manner.
3.1. Place-based, value-centered development. The findings highlighted the various negative short and medium consequences of built environment developments focused solely on short-term economic gains. These consequences reportedly include disharmony among stakeholders, a loss of trust and/or unrealistic expectations regarding time, cost and scope. Such expectations may force the project staff members to take unnecessary or miscalculated risks (Zari, 2019). The evidence also points towards certain long-term consequences. These are mostly experienced by the occupants and others interacting with the completed project. Practical issues occur in tandem with an increased sense of disconnection with the culture of the place, and its values in future generations - as mentioned by a community leader participant. Long term impacts on the natural capital can include further degradation of the ecology of the project area and receiving environments, leading to reduced resources and capitals with which the future generations can support themselves. Participants spoke of the links between environmental degradation and impacts on social and human capital where a population has sufficiently the deep connection with the place (Zari, 2019). Specifically, the potential loss of will and determination amongst inhabitants was recorded (Mang & Reed, 2014). Fundamentally, the findings underline strongly key differences in the Te Ao Māori and Western world views. These world views are notably different, and integration is complicated by historical events. It is critical therefore, that meaningful consultation be successfully undertaken during the early strategic decision-making stages of a project in New Zealand to incorporate the values of all concerned to ensure the project reflects these in the deliverable KPIs (7 Group & Reed, 2009). Lastly, the following questions arose most regularly in relation to this part of the analysis but remained largely unanswered.
• Can place-based, value-centered outcomes be aligned with the current business case requirements for public-spend projects in New Zealand? Or do the requirements need to change?
• How can a workable level of trust and confidence be developed, most quickly and reliably, amongst stakeholders in the pre-feasibility / early discussion stage for public-spend RD projects specifically?
• How can the negotiation regarding harmony amongst necessary value-centered outcomes bedemonstrated and evidenced?

1218
Bin Su, Renata Jadresin-Milic, Peter McPherson and Lian Wu
3.2 Democracy, Partnership, and Information Transparency. The analysis of the findings points towards the importance of purposeful and increased democracy in the form of inclusion and participation of stakeholders in early strategic decision-making. It is acknowledged that this may not occur without its own associated challenges, however multiple aspirations, attitudes, and behaviors will need to be managed and harmonized through value-based communication (Hall, 2019). Further, in order to ensure ‘everyone is on the same page’, it is necessary the project workshop, wānanga or meeting outcomes are captured and disseminated in a manner that is least time consuming to the reader; with information drafted in a fashion that everyone can understand and captures the values and expectations regarding ‘why, who, what and when’ of the project. The cost of continuing with business-as-usual may result in increased dissatisfaction and decreased transparency of decision rationale. Engaging everyone early in a strategic, integrated process with clarity on vision, purpose and values can prove to be of monumental benefit (Hall, 2019; Regenesis, 2016). Together, this leads to the following questions regarding gaps in available literature and industry practice:
• How can transparency in early, pre-feasibility discussions be facilitated and evidenced?• As some of the stakeholders may be external parties and therefore, new to the discussion – how
can trust be developed to enable everyone to contribute to the best of their capability? • If there a requirement for rules of engagement in early strategic decision meetings with multiple
stakeholders? If yes, how will they be developed? • What systems and processes are already available in early strategic decision making to help
facilitate the integrative approach for procurement and delivery? • Who will be accountable for key decision-making? • How does an effective partnership among stakeholders look like?• Is there a systemic view and recording of the benefits, challenges, barriers, policy and regulations
impacting the project and visa-versa?
3.3 Adaptable Policy. The findings indicate that regenerative projects can transgress into the policy landscape due to the systemic functioning of the project. This provides opportunity to review existing policy and legislation to accommodate the needs of the projects within multiple capital-related outcomes. In New Zealand, the Treasury has adopted the Living Standards Framework (LSF) to incorporate the delivery of multiple value-based outcomes, however there is significant gap in the alignment of LSF’s objectives and current strategic decision-making and procurement practices (NZ Treasury, 2018; NZ Government Procurement, 2018). The cost of limiting the scope of our policies and legislations to facilitate collaboration and partnership among organizations may prove to be a barrier to systems integration and enabler of the existing organisational ‘silos’. Broadening the scope of the policy will further assure the stakeholders, especially those directly interacting with the built environment of the alignment in expectations of the leadership and other systemic actors (Hall, 2019). Further, this leads to the following questions regarding gaps in available literature and policy-making:
• How can public-spend decisions be depoliticized and maintained within the boundaries of public- spend business case frameworks?

1219
To understand the systemic and contextual factors to improve the strategic decision making of regenerative projects
• How can the departments within territorial authorities pertaining to the systemic policies andregulations impacting the project be integrated in the project at an early stage?
• How can the timeframes for Ministerial, Cabinet, Treasury and Territorial Authority business case approvals be achieved in a timely and effective manner?
• How can the value system of the project consisting of social, human, natural, cultural, financial andpolitical capitals be captured and aligned with the scope of available public-spend business case requirements?
3.4 Strategic decision-making and project governance. The above discussion further indicates the need for innovation in project strategic decision making and governance structures (Sertyesilisik, 2017; Clegg, 2012). The cost of doing it later in the project or doing it wrongly may be unnecessarily expensive than doing it well as early as possible in the project, preferably in the pre-feasibility stages. This further indicates that the decision-making and governance structures will need to be flexible and accommodating of various stakeholders’ expectations (NZ Treasury, 2018; NZ Government Procurement, 2018; Regenesis, 2016). Further, this leads to the following questions regarding gaps in available literature and strategic decision-making and project governance practice: Strategic decision-making in the pre-feasibility stage of projects: Development of built environment from values with regards to multiple capitals
• What does regeneration mean in the specific project context? • How are decisions made in the pre-feasibility stage? • What are the stakeholders’ needs and wants?• What does success look like in a project of varied values? • What does a project of inter-generational value look like in New Zealand?
Governance and leadership of RD + D projects: How can core project teams develop and lead RD projects? • How does leadership and governance look like in a regenerative development?• How are team roles and responsibilities impacted? • Communication: How does the flow and capture of decisions and information look like?• What are the selection criteria for project teams and governance strategies?• How is accountability of project teams maintained for regenerative projects?
• What legal defense systems are in place for stakeholders and project teams?• How will be the delivery of key performance indicators be tracked and measured including post
occupancy? • What are the key deficiencies in high-level territorial authority leadership departments and their
leaders? Procurement: Who do we obtain services on RD projects and how do we track performance?
• How does procurement for a regenerative project look like?• Are the current procurement standards restricting an integrative approach?

1220
Bin Su, Renata Jadresin-Milic, Peter McPherson and Lian Wu
• How are materials procured for regenerative projects? What are the challenges?• Does regeneration affect and if so, how does it affect NZ Forms of Contract?• What are the impacts on professional indemnity?• What are the perceived system weaknesses in design and procurement processes that may
become barriers?Risk Management: How will risk be identified, measured and, conflict be addressed and managed?
• How does the change in roles and responsibilities impact business insurances?
• How can multiple service providers on the project identify the ‘unknowns’ and how canthat riskbe shared?
3.5 Value-based key performance indicators. Another key theme to arise from the analysis of the findings is the need to capture the place-based, value-centered performance indicators related to the outcomes early in the project’s decision-making, preferably in the pre-feasibility stage (Regenesis, 2016). These performance indicators define all the subsequent key strategic and tactical decision-making, and project outcomes. The cost of not allowing for place-based, value-centered KPIs could result in a singular, focused decision making, mainly to facilitate financial gains and thereby, losing the opportunity presented by incorporating the social, cultural, human, political, and natural capitals. Not all projects support or require multiple capital outcomes, however by broadening the scope, the project-specific and place-based values can be assessed, rationalised and subsequently, delivered and measured for value-based performance over its lifecycle as stated by majority of the participants (Sertyesilisik, 2017; Clegg, 2012).
3.6 Rate of change. This brings us to the question asked by one of the informal interview participants – “how fast is fast enough?” This question has become increasingly relevant and necessary in the current socio-geo- political scenario, especially with regards to climate change. Although there is uncertainty on the rate of change, it has been well-acknowledged in all the informal interviews that people will have to be taken on this journey together and make regular, small changes in behaviors, attitudes and actions that it compounds to substantial changes in the long term. The role of effective strategic partnership, education and conscious critical questioning is key in accelerating this change (Hall, 2019; Zari, 2019). As mentioned by one of the participants in the informal interviews, the future New Zealand will be safer, inclusive for all cultures and still catching up with the world due to its geographic positioning. This will continue to be an advantage for New Zealand in the future in building a controlled, educated, skilled and competent capacity of human resources in service of the planet.
4. Conclusion.The findings, emerging themes and gaps from this study consolidate the thinking that that the global ecosystem is currently faced with complex and inter-related social, cultural, economic, natural, human and political challenges including climate change, biodiversity and equity loss (Zari, 2019; Regenesis, 2016).They further emphasise on the need for further understanding in design and development processes acknowledging the existence of the multiple capitals, their inter- relatedness, indivisibility and; benefits and challenges in doing so. In order to do so, and contribute value through multiple

1221
To understand the systemic and contextual factors to improve the strategic decision making of regenerative projects
capitals, applicable both globally and in New Zealand, it is important to understand what regeneration means to us as a species, cultural beings and what exactly it is we aim to regenerate. The study contributes to the literature by extending and elaborating our understanding of regenerative development landscape of NZ. It extends the literature on factors influencing strategic decision-making of regenerative projects by exploring the landscape via industry stakeholders. It further elaborates on how regenerative projects are facilitated or hindered by wider contextual conditions. The study also has practical utility. More understanding of how the wider contextual conditions facilitate or hinder regenerative development projects, allows industry and government to respond better to the urgent global challenge of producing broader social, cultural, natural, and human outcomes through built environment projects. This can be achieved by the use of value-based decision making, the need for governance and partnership among stakeholders of varying cultural aspirations; capturing, measuring and tracking the overall performance of the through social, human, natural, political, cultural and financial capitals; the potential for increased democracy and participation amongst stakeholders; and flexible and adaptable policy facilitating collaboration among private and public sector organisations. The suggested next steps include researching on how regenerative design and development can:
• impact and transform a project’s strategic decision making, especially in the early pre-feasibility stage?
• impact and transform the project governance structures?
• impact and influence governmental and organizational policies?• impact and influence the collaboration across governmental organisations?• impact and influence project financial, legal and insurance structures? • impact and influence urban and rural planning decisions? • impact and influence on the business models of businesses adopting regenerative design and
development?
Acknowledgements The reported research was internally funded and supported by the Design and Creative Technologies Faculty of Auckland University of Technology, Auckland, New Zealand.

1222
Bin Su, Renata Jadresin-Milic, Peter McPherson and Lian Wu
References 7Group, & Reed, B. (2009). The integrative design guide to green building: redefining the practice of sustainability. Advisian Worley Group. (2019). An examination of issues associated with the use of NZS Conditions of Contract. NZ
Treasury: Infrastructure Transactions Unit. Clegg, P. (2012). A practitioner’s view of the ‘Regenerative Paradigm’. Building Research and Information, 40(3),
365-368.Cole, R., Lorch, R., Baker, N., Brager, G., & Carter, J. (2003). Buildings, Culture and Environment: Informing Local and
Global Practices. Cole, R. J. (2012). Regenerative design and development: current theory and practice. Building Research and
Information, 40(1), 1-6. Cole, R. J., Busby, P., Guenther, R., Briney, L., Blaviesciunaite, A., & Alencar, T. (2012). A regenerative design
framework: setting new aspirations and initiating new discussions. Building Research and Information, 40(1), 95- 111.
Creswell, J. W., & Creswell, J. D. (2017). Research design: Qualitative, quantitative, and mixed methods approaches. Thousand Oaks, CA, US: Sage Publications.
Gibbs, G. R. (2018). Analyzing qualitative data (Vol. 6). Thousand Oaks, CA, US: Sage Publications. Hall, D. (2019). On care and carelessness. In D. Hall (Ed.), A Careful Revolution: Towards a Low-Emissions Future (pp.
163-183). New Zealand: BWB Texts.Kabir, Syed Muhammad. (2016). Methods of Data Collection. Longhofer, J., Floersch, J., & Hoy, J. (2012). Qualitative methods for practice research. Oxford, UK: Oxford University
Press. MacGregor, C., et al. (2018). The built environment and climate change: A review of research, challenges and the
future. BRANZ Study Report SR403. Judgeford, New Zealand, BRANZ Ltd. Mang, P., & Reed, B. (2009). Designing from Place: A Regenerative Framework and Methodology. Building Research
and Information. Mang, P., & Reed, B. (2014). The nature of positive. Building Research and Information. McLeod, K. (2018). Our people - Multidimensional wellbeing in NZ. New Zealand Government Procurement. (2019). Construction Sector Procurement Guidelines. Retrieved from
https://www.procurement.govt.nz/procurement/principles-charter-and-rules/government-procurement-rules/ New Zealand Treasury. (2018). The Treasury Approach to the Living Standards Framework. Regenesis, G. (2016). Regenerative development and design: A framework for evolving sustainability. Retrieved
from https://ebookcentral.proquest.com Robinson, J., & Cole, R. J. (2015). Theoretical underpinnings of regenerative sustainability. Building Research and
Information, 43(2), 133-143. Sertyesilisik, B. (2017). A preliminary study on the regenerative construction project management concept for
enhancing sustainability performance of the construction industry. International Journal of Construction Management, 17(4), 293-309. doi:10.1080/15623599.2016.1222665
The Construction Sector Accord. (2019). Construction Sector Accord: Transformation Plan. Retrieved from https://www.constructionaccord.nz/
Zari, M. P. (2019). Ecosystem services impacts as part of building materials selection criteria. Materials Today Sustainability, 3-4(2019).
Zari, M. P., Kiddle, G. L., Blaschke, P., Gawler, S., & Loubser, D. (2019). Utilising nature-based solutions to increase resilience in Pacific Ocean Cities. Ecosystem Services.

1223
The 54th International Conference of the Architectural Science Association (ANZAScA) 2020
Toward a Pre-Assessment Framework for Green Star: A survey on New Zealand building professionals
Jisun Mo1, Paola Boarin2, Alessandro Premier3
1,2,3The University of Auckland, Auckland, New Zealand [email protected], [email protected]
Abstract: A relatively large number of buildings around New Zealand have been certified through green building rating systems, signalling the interest of the building market to expand the use of different sustainability approaches. However, existing green rating systems are still not capturing full market potential and the attention of building professionals and/or stakeholders to foster widespread adoption of green building rating systems in the country. This paper investigates the barriers involved in implementing green building certification systems for New Zealand buildings, with a focus on Green Star, by using a qualitative approach based on surveys offered to building and design professionals and Green Star accredited professionals. The questionnaire process involved the collection of email addresses publicly available on professional organisation websites. The questionnaire was set-up using the Qualtrics survey tool that is offered by The University of Auckland. The questionnaire was conducted through an anonymous online survey over a month. The most significant barriers identified in the research were: insufficient knowledge about green building rating systems guidelines/manuals; time pressure and increased time investment; additional unforeseen costs usually ‘hidden’ in the certification process. Additional information emerged about critical aspects related to specific topic areas and credits of the Green Star rating system. This study offers direct, first-hand, knowledge about specific barriers to consider at each stage of the certification process for New Zealand buildings.
Keywords: Barriers; Green building rating system; Green Star certification; Pre-Assessment Tool
1. IntroductionAs a result of a growing movement and pressure to link the construction and property industry with sustainable investments, sustainability has not only raised the awareness on the commercial property market but also its implementation has increased remarkably over the past decade (Harrison & Seiler, 2011). However, the level of involvement with sustainable activities in the building industry does not mean the same level of their interests to participate in sustainability. Smith and Baird (2007, as cited in Ministry for Environment, 2006) stated that the implementation of Green Star NZ rating system can only be successful if the rating system is commonly recognised and used by members of the building industry. The uptake of the voluntary tool will not occur and its implementation will be slow unless key stakeholders are willing to adopt it. “Even though the New Zealand Green Building Council (NZGBC) and government have taken targeted measures, considerable hesitation and scepticism are existing in the property market from both an investor’s and building owner’s perspective” (Myers, Reed and Robinson, 2008, p.298). The New Zealand property industry had been pressurised by the government to implement green-rated buildings and thus all new constructions must achieve Green Star-certified buildings with at least 4-star rating, which is one of the eligibility criteria of Green Star NZ. However, this policy was abolished in 2010 because green buildings were not regarded as a top priority for the government anymore. In recent years, the NZGBC and the Property Council of New Zealand have
Imaginable Futures: Design Thinking, and the Scientific Method. 54th International Conference of the Architectural Science Association 2020, Ali Ghaffarianhoseini, et al (eds), pp. 1223–1232. © 2020 and published by the Architectural Science Association (ANZAScA).

1224
Jisun Mo, Paola Boarin, and Alessandro Premier
announced a new policy plan for the built environment at the Green Property Summit in 2017. They have focused on how the construction and property sector in New Zealand work with the government collaboratively to make better homes and buildings, especially commercial buildings, communities and cities. They aim to meet lower carbon emissions for the environment and to create healthy cities for New Zealanders. This plan will combine building green and provide suppliers and innovator with certainty that could convince them to invest in development funds for new techniques and products for building green. In this sense, developing policy plans is likely to start increasing the number of certifications or the use of rating tools (NZGBC, 2017).
Figure 1: The number of Green Star NZ™ certified projects in New Zealand between 2007 and 2019
Figure 1 shows the number of Green Star NZ certified projects for about 12 years. There was a positive trend from 2007 to 2009 reaching a 15% increase of certified projects which shows a higher perception and influence of the importance of sustainable buildings design in the New Zealand building industry. It is assumed that many of the first project registrations would have occurred in 2007 and since then these registrations have resulted in the number of certified projects from 2009 to 2011, showing the highest growth from 14% to 16%. However, the trend seems to have deteriorated thereafter and the number of actual certified projects is still comparatively low from its first introduction. Doan et al. (2017) also mentioned that the number of Green Star certified buildings is still limited. There could be a possible reason why the number of certified projects has decreased between 2009 and 2019. Therefore, the following section is created to identify respondents’ variety of perspectives on main barriers to the implementation of a green building rating system and the reasons for the downturn of the certified green buildings in New Zealand. Hence, it will help to understand how they can see opportunities to promote green-rated buildings or certification in the New Zealand building industry.
2. Research MethodologyThe research methodology involved the development of a questionnaire for stakeholders and/or experts who are involved in the New Zealand building industry sector and/or who have had experience with the Green Star. The purpose of the questionnaires was to grasp the current situation of the green building market in the New Zealand building industry and to investigate building professionals’ awareness of a green building rating system, including the drivers, obstacles and reasons for implementing green building certification. The targeted population for the questionnaires involves Green Star professionals

1225
Toward a Pre-Assessment Framework for Green Star: A survey on New Zealand building professionals
who are directly involved in NZGBC, especially in the application of the Green Star NZ rating tool, and comprise Green Star Accredited Professionals, Green Star Practitioners, Green Star Accredited Energy Modellers, Green Star Consultants, and NZGBC Assessors. About 400 email addresses of participants were obtained from the public list of the accredited professionals that are available on the New Zealand Green Building Council (NZGBC) websites. An email was sent to all of these contacts directly, inviting them to take part in the online survey and asking them to voluntarily fill the questionnaire. This questionnaire took approximately 15-20 minutes of their time and was conducted through an anonymous online survey for one month. Ethical Approval from the University of Auckland was required in order to conduct a questionnaire with people involved in the design and building industry. The survey was approved by the University of Auckland Human Participants Ethics Committee (UAHPEC) on the 25th of January 2019 for a period of 3 years, which is part of a wider study for Doctoral research. The online tool used for the web-based survey was QualtricsXM, offered by The University of Auckland. Responses are stored in a survey database and processed automatically, creating visual reports like charts and graphs for presenting trends and patterns of data. The online survey included an introduction explaining the research intent and the specific aims of the questionnaire. A reminder email was sent to the participants who had not completed the online survey. The survey was constituted by a set of a question, mainly multiple choices, Likert scale and open-ended questions. A scalar format with ordered response categories has been adopted, and the scale was expanded to a 4 point scale with options as extremely easy, somewhat easy, somewhat difficult, and extremely difficult. Other closed type ended questions consisted of ‘tick all which apply’ categories or single ‘yes’ or ‘no’ answers. The survey investigated the professionals and stakeholders’ knowledge and the current barriers to conduct a green building certification process. Section 1 of the survey collected basic information on the respondents in the building industry. This section also sought to survey their awareness of the Green Star rating system by asking how they knew about it for the first time. Section 2 of the survey focused on those respondents who have been involved in the certification process and who have worked with Green Star NZ projects. This section sought to capture their views or experiences on a range of issues around their involvement in three barriers related to knowledge, cost, and time. Section 2 of the survey was divided into three parts. Part 1 was designed to evaluate the knowledge and practical experience of participants with the Green Star rating system such as understanding the difficulties or challenges they faced in the past. Part 2 was created to identify time barriers caused by delayed schedules that impedes the progress of the Green Star certification. In Part 3, respondents were asked if they had any experience with an increased budget to achieve the certification for their buildings.
3. Green Star professionals’ perspectives on Green Star NZ rating system
3.1 Respondent Background Information
The survey on Green Star NZ was sent to about 400 professionals. Of the total respondents, only 34 completed the survey. The majority of the respondents were Green Star accredited credentials (78%), followed by Green Star Practitioners (19%). When asked how they knew about a green building rating system for the first time, 25% of respondents had prior experience with green building projects and 19% were involved in green building projects as part of a contract requirement. However, no one has responded they knew about the green building rating system through case studies. The reason for this response is that building professionals commented that they want to see case studies that have more data and analytics showing how green buildings have performed efficiently or how much green building

1226
Jisun Mo, Paola Boarin, and Alessandro Premier
certification is worth in the building sector. 69% of respondents have been involved in green building certification projects, especially Green Star office projects. However, the other 31% who have not been involved in a green building project before said that it is hard to put the Green Star certification into practice (18%) and they have not had any suitable projects to put it into practice (26%). Many respondents responded that they cannot easily put them into practice in their building. It can be seen that many opportunities to implement green building certification have been limited in the New Zealand building market even if respondents have knowledge of a green building rating system and became Green Star accredited professionals. Other respondents (32%) noted that it is because “green building certifications (or credits of it) are not required under New Zealand Building Code which is what projects are built to (i.e. minimum standard as best practice)”. Besides, there were common views about lack of support from main contractors and subcontractors. In some cases, clients and building owners have not chosen to follow the Green Star process and their budget has not allowed for a green building rating system.
3.2 Barriers to green building certification with Green Star NZ
3.2.1 Knowledge barriers
The respondents were required to answer what is the most important thing to know before the engagement on the Green Star certification process and then how difficult it is to accomplish several aspects in the Green Star certification process. The survey found 3 categories related to knowledge barriers: complying with the requirement; understanding the certification process; satisfying the minimum rating levels. Respondents regarded compliance requirements (47%) and the certification process (26%) as somewhat difficult (Figure 2). According to the Green Building Market report, the survey result also showed that lack of information on certification requirements (38%), the difficulty of the certification process (35%), and time of the certification process (33%) are considered as the most important barriers to green building certification throughout South East Asia (Krups et al., 2014). Although some respondents have done training programmes on a green building rating system or passed the GSAP exam it was not sure if they were technically trained to understand the essential information about the Green Star rating system and to effectively work on Green Star projects. They also commented that “people do not truly understand the process until they go through it, no matter how well Green Star is taught” and “lack of Green Star Knowledge embedded in the industry because of employment of GSAPs consultants rather than existing project team members”. Markelj et al. (2014, p. 8778) stated that “most of the existing building sustainability assessment methods are either not adapted for independent use by the architects or are the requirements for criteria fulfilment quite complex and require specific knowledge of an expert consultant”. Despite the importance of the level of expertise and knowledge through green building education, the public or any group of stakeholders are not likely to be content with green building practices unless they are educated and informed. Therefore, the role of education and training systems could be important for the public to be motivated towards green building development and to promote the green building market significantly (Niroumand et al., 2013; Smith, 2008; Udawatta et al., 2015). Also, the respondents additionally commented that “knowing the required design parameters and strategies and knowing where to access evidence or files which do not have any information in the technical manual is also an important aspect before starting with the Green Star certification process”. They also wanted to know about the implementation costs (e.g. costs of design features) and benefits of green buildings for the owner and users that can drive Green Star certifications. Meanwhile, satisfying the minimum rating levels was rated as easy to be accomplished by

1227
Toward a Pre-Assessment Framework for Green Star: A survey on New Zealand building professionals
respondents (58%) (Figure 2). Technically, buildings will be able to achieve a Green Star rating from 1 to 6 star, but at least 4 Green Star rating (a total of 45 points) must be awarded to receive formal certification. It could be possible to achieve a minimum requirement with a basic credit that is usually easy to obtain, regardless of a building’s basic information (Park et al., 2017).
Figure 2: How difficult is it to accomplish the following aspects in the Green Star certification process?
Figure 3 shows that a lack of public awareness on green building certification (23%) was still the most difficult barrier to a higher success rate of green building projects. It is interesting that even though the green building movement has been increasingly grown in recent years, limited knowledge on the benefits of certified green buildings (15%) and lack of research on certified green buildings such as limited data on the performance of New Zealand case studies (13%) was perceived as the current barriers faced by New Zealand professionals. Samari et al. (2013) also remarked that limited knowledge and low awareness of the benefits of green building are barriers to adopting green building rating systems among the construction industry professionals. 22% of respondents choose that “lack of coordination or consistency between green building professionals and designers (or the other professionals involved)” and “poor level of compliance with the New Zealand Building Code” was considered as another challenge in acquiring Green Star certification which can result in a lower success rate. NZGBC (2017) claimed that the current building code hasn't been updated from 2007 and thus its policy is inadequate to build sustainability.
Figure 3: What are the specific barriers to knowledge?

1228
Jisun Mo, Paola Boarin, and Alessandro Premier
3.2.2 Time barriers
The second section investigated the time barriers that the building industry professionals commonly faced when undertaking green building certification. The time barriers are related to the whole period of completing the submission documentation and predicting the certification timeline. Figure 4 shows that respondents deemed submission documentation (68%) and the certification timeline (43%) to be difficult aspects. According to Krups et al. (2014), the additional time needed for researching suitable materials and training on the whole green certification process are perceived as barriers by contractors, owners, and professional services.
Figure 4: How difficult is it to accomplish the following aspects in the Green Star certification process?
These results are also related to figure 5 showing that additional time needed for preparing the submissions documents (37%) was considered as the biggest obstacle that arises frequently in many previous works of literature. Besides, 28% had protracted periods of project time and 26% had additional time for the certification process, as the main time barriers (Figure 5). These identified barriers are correlated to the time taken by the certification process. Most building professionals who are indirectly or directly involved in the certification process said that they devote long hours to the job, especially for the submission documentation. Other comments were about lack of demand from the clients who just wanted green buildings to rate it themselves rather than go through the official measures offered by rating systems.
Figure 5: what are the specific barriers that increase the time for obtaining the certification?
When asked at what stage of the building process was usually discussed with clients to pursue green building certification, the majority of respondents said that this happened during the “Initial discussion” (31%), in the “Pre-design phase” (15%) and the “Concept & preliminary design phase” (23%). This shows

1229
Toward a Pre-Assessment Framework for Green Star: A survey on New Zealand building professionals
that they discussed at the early stage of the design process which is a crucial time for all stakeholders, professionals and clients. Hence, all the information related to certification should be as accurate as possible at the schematic design stage, presenting how the certification process flows and how professionals can assist in the management of the certification. However, 8% of respondents discussed at the stage of “Contractor procurement”. It seems very late in the process because the early stage of discussions of the certification should be encouraged to provide information on appropriate details to the clients and reduce conflicts and constraints during the construction process. The other respondents (23%) answered that discussion about green building certification was carried out in all the process of building work. They also commented that “Design rating is usually on the basis of construction issue documentation and can take 3-6 months from design drop. For a built rating stage, as-built and commissioning data are required which can take anywhere from 3 months to 1 year following the principal contractor (PC), but it depends on how readily documentation can be provided to GSAP”.
When office projects took longer than planned in the certification process, the responses to the question were a few months (27%), half a year (55%), and more than a year (18%) respectively. The whole certification process of Green Star took normally about 6 months longer to be completed. Then, there was the open-ended question related to the previous question asking the reason why the delay happened in the certification process. Many respondents pointed out chasing the information for the documentation from required people such as consultants, contractors and suppliers. They had difficulties in getting the submission documentation together from subcontractors, particularly when they were no longer involved in the job related to HVAC and their O&M information needed for multiple credits. Besides, there were delays to meet the compliance requirement. Respondents said that the delay usually happened after the first round of assessment and assessors required more time than usual. One of the respondents said that “Documentation is not provided promptly by subcontractors, in particular materials data. This depends on the type and quality of systems set up to procure and record information during construction works. Once they have been paid it is also typically harder to get further documentation”. Most of the respondents highlighted that it was caused by the delayed documentation from third parties who provide project teams with the information or submission for evidence. The Green Star rating system is a documentation-based assessment which should be managed and maintained by individuals or companies. “The difficulty of achieving a credit depends on practical procedures such as paperwork, the proportion of time-consuming work, and confirmation also greatly affect the difficulty” (Park et al., 2017, p.4). One of the respondents noted that it is hard to get partial and/or full documents from people involved in a timely manner. Also, the length of the project, the type and quality of the system and the processing time of assessors were other reasons that led to a delay in the Green Star certification process.
3.2.3 Cost barriers
The third section asked respondents about what cost barriers make Green Star certifications difficult. It is clear that the prediction of the extra cost related to green building certification was difficult as shown in Figure 6. Some respondents commented on the difficulties in achieving a specific credit when building industry professionals are new to the certification. For example, they experienced that “The additional cost is usually needed during the design process, as a result of incorporating design features or strategies into the building in order to comply with the Green Star requirements”. Geng et al. (2012) also argued that the movement towards green building practices requires the need of additional costs related to new technologies for renewable energy exploitation which need the employment of skilled

1230
Jisun Mo, Paola Boarin, and Alessandro Premier
workers or experts. Others stated that specialist modelling for energy, daylight and comfort caused extra costs to achieve a specific credit under the Green Star rating tool. For this reason, the leading challenge of building market is that nobody will show the willingness to embrace additional costs involved in building green (Perrett, 2011).
Figure 6: How difficult is it to predict extra costs in advance?
The key to this question is to find out what is causing their cost increase. Respondents stated that a higher upfront cost, whether actual or perceived, is the major barrier to promote green building certifications (23%) (Figure 7). It was followed by expenditures for certification (15%), lack of incentives from a central government (15%) and additional consultant costs (15%). Unexpected or hidden costs (14%) are also the barriers that generate uncertainty for the cost of attaining green building certification Other respondents (4%) also mentioned lack of documentation management or governance between project teams for streamlined submissions and lack of funding for certification. They often believe that “There is a perception of higher associated costs so it is avoided by clients unless they are owner- occupiers”.
Figure 7: what are the specific barriers to cost?
The next question was about whether or not the building professionals have discussed with clients about the possibility of exceeding the budget in order to increase the number of points or the rating level to be achieved. 67% of respondents answered that they had a discussion and amongst the people who said yes, 56% of respondents were able to increase the certification level or the number of points after the discussion, while the rest of 44% said that it did not happen. Additional comments on why those people did not increase the rating level or points were also received. One of the comments was that “The concept design includes a list of recommended features for an initial budget. At later stages that are not usually desired to increase budget were not agreed initially. We have been able to increase

1231
Toward a Pre-Assessment Framework for Green Star: A survey on New Zealand building professionals
rating via cost neutral ‘innovation’ opportunities”. Another respondent commented that “A discussion was whether we could push an additional few points to potentially hit 6 stars. This was not quite possible in the end” and “The business case that has done had a budget and the business was not in a position to spend more as there were other projects in the pipeline too”.
Most respondents said that extra costs incurred at the step of ‘Preparing for submission’. At Eligibility and Certification Registration stage, respondents can notice extra costs such as registration fees when they register their projects through the application as these costs can be found on the NZGBC website. However, extra costs are needed more at preparing for submission than the other stages. This is because one of the respondents noted that “Assuming preparing for submission includes managing the collection of all documentation from the design team. If people target both design rating and built rating, then costs can double. Implementation costs, additional design features, additional on-site monitoring by the main contractor and GSAP engagement (design team and contractor/on-site) can be extra costs”. Other respondents commented that “Additional fees are usually needed to address the assessor comments depending on what they have asked for”. For example, “Assessors’ comments typically result in additional consultant fees at Round Two”. Moreover, “Significant staff time in evidence documentation or file organisational structure was also related to extra costs”.
4. ConclusionsThis paper provided building professionals’ views on the current barriers to the implementation of the Green Star NZ rating system in the New Zealand building industry. The results of the survey showed that people seem to think that a green building rating system is a ‘nice-to-have’ requirement rather than a ‘must-have’ requirement in the decision making of their investment. Although the property investment is increasingly used to apply sustainable strategies to the investor’s business initiative, it has not been higher than in other developed countries and has grown relatively slowly in the New Zealand market. The most sensitive barriers to the use of rating tools seem to be the complexity of understanding Green Star rating tool, time-consuming procedures and additional costs that are hidden in the whole process, all of which spread scepticism about the process of rating systems. These barriers are often evident in the certification process of Green Star NZ. First of all, all those professionals who will be responsible for green certification such as the design team or project managers may have difficulties in approaching the assessment process by themselves without employing consulting services. Also, understanding at first sight how the submissions are prepared and approved holistically can be challenging. This results in the need for the repeated explanation of the requirements for the criteria, even if they are educated on the subject or have taken a Green Star course. The second problem is caused by the fact that unskilled people cannot determine how long their projects will need additional time to collect the required information and documentation. Also, people cannot predict the exact time of the certification process to be prepared and to be finished. Thirdly, additional costs are one of the major barriers to promote the Green Star rating system. Many building professionals mentioned high upfront costs such as registration fees, consultant costs, implementation fees, and documentation fee etc. Other fees can be charged in some situations, such as additional reviews and appeals before NZGBC final approval, as well as additional project enquiries and credit interpretation requests. However, there might be other hidden costs for preparing the Green Star credit requirements. Therefore, understanding what barriers building professionals have faced through the survey could lead to the improvement of the application of the Green Star rating system and project teams could be able to more effectively accept the implementation of Green Star in future. For these reasons, further studies are necessary to develop a pre-assessment

1232
Jisun Mo, Paola Boarin, and Alessandro Premier
framework to overcome some of the issues highlighted by this survey. This will constitute the latest development of this research.
References Doan, D. T., Ghaffarianhoseini, A., Naismith, N., Zhang, T., Ghaffarianhoseini, A., & Tookey, J. (2017). A critical
comparison of green building rating systems. Building and Environment, 123, 243-260. Geng, Y., Dong, H., Xue, B., & Fu, J. (2012). An Overview of Chinese Green Building Standards. Sustainable
Development, 20(3), 211–221. https://doi.org/10.1002/sd.1537 Green Building Council Australia, Available from <http://www.gbca.org.au> Harrison, D., and Seiler, M. (2011). The political economy of green office buildings. Journal of Property Investment
and Finance, 29(4-5), 551-565. Krups, M., Krups, R., Berning, P., Smith, D., Kheng, S. (2014). Green Building Market Report South East Asia 2014. BCI
Media Group PTY Ltd Markelj, J., Kuzman, M. K., Grošelj, P., & Zbašnik-Senegačnik, M. (2014). A simplified method for evaluating building
sustainability in the early design phase for architects. Sustainability (Switzerland), 6(12), 8775–8795. https://doi.org/10.3390/su6128775
Ministry for the Environment. 2006. “Green Building Assessment Tool Research Project: Draft Report”. New Zealand Green Building Council. 26. June.
Myers, G., Reed, R., and Robinson, J. (2008). Sustainable property–the future of the New Zealand Market. Pacific Rim Property Research Journal, 14(3), 298-321.
Niroumand, H., Zain, M. F. M., & Jamil, M. (2013). Building evaluation based on sustainable development using questionnaire system. Procedia-Social and Behavioral Sciences, 89, 454-460.
NZGBC (2007), A policy plan for the built environment, policy paper, Retrieved from https://www.nzgbc.org.nz/Attachment?Action=Download&Attachment_id=880, (accessed 22 July 2020).
Park, J. Y., Choi, S. G., Kim, D. K., Jeong, M. C., and Kong, J. S. (2017). Credit optimization algorithm for calculating LEED costs. Sustainability, 9(9), 1607.
Perrett, G. A. (2011). The Key Drivers and Barriers to the Sustainable Development of Commercial Property in New Zealand. Lincoln University. Retrieved from https://researcharchive.lincoln.ac.nz/bitstream/
Samari, M., Godrati, N., Esmaeilifar, R., Olfat, P., & Shafiei, M. W. M. (2013). The investigation of the barriers in developing green building in Malaysia. Modern Applied Science, 7(2), 1–10. https://doi.org/10.5539/mas.v7n2p1
Smith, J. (2008). Implementation of a Building Sustainability Rating Tool: A Survey of the New Zealand. P.21, Victoria University of Wellington. Victoria University of Wellington.
Smith, J., and Baird, G. (2007) Implementation of a building sustainability rating tool: a survey of the New Zealand building industry. Proceedings of SB07 New Zealand Conference on Transforming our Built Environment, Auckland, 1-11.
Udawatta, N., Zuo, J., Chiveralls, K., & Zillante, G. (2015). Attitudinal and behavioural approaches to improving waste management on construction projects in Australia: benefits and limitations. International journal of construction management, 15(2), 137-147.

1233
The 54th International Conference of the Architectural Science Association (ANZAScA) 2020
Towards an understanding of the potential to reuse and recycle building materials in New Zealand
Zahra Balador1, Morten Gjerde2, Brenda Vale3 and Nigel Isaacs4
1, 2,3,4 Victoria University of Wellington, Wellington, New Zealand [email protected], [email protected], {morten.gjerde2 and nigel.isaacs4}@vuw.ac.nz
Abstract: A potential solution to the growing need for building materials is the use of reclaimed and recycled building materials (RRBMs) in New Zealand. Therefore, it is important to understand the attitudes and behaviour of the key stakeholders. This paper looks at the behaviour of three key construction industry stakeholder groups in New Zealand—architects, builders and consumers; and was conducted through the lens of the Theory of Planned Behaviour (TPB) by the means of an online survey questionnaire. While environmental attitude was always a strong predictor for intention and behaviour, the study found that the detailed considerations differed for each group. Architects found perceived behavioural control to be more important than consumers and builders, while the behavioural intentions of the latter could be predicted by the subjective norm. Reuse and recycling behaviour was more predictable based on the TPB components, and specific use of RRBMs was predictable for architects and builders. Policymakers can enhance perceived behavioural control by increasing designers’ awareness with help of educational programs and using new ways of communication.
Keywords: reuse and recycling; building materials; stakeholders; Theory of Planned Behaviour.
1. IntroductionAs the construction industry utilises a large amount of energy and materials, it is also responsible for a large portion of wastes. A significant share of CO2 emissions, and the consequent effect on climate change, can be attributed to the production of building materials. Most of the environmental impacts of common building materials arise through their production (Iacovidou and Purnell, 2016). Nearly 50% of waste streams in New Zealand come from construction sites, a figure not dissimilar to the global proportion of construction waste (REBRI, 2014). A report by REBRI (2008) notes that designers, architects, and engineers can have a significant influence on waste reduction during the design stages of a project (Conder, 2008). The demand for reclaimed and recycled building materials (RRBMs) is directly and indirectly dependent on government policies, clients, designers, contractors and developers (Addis, 2012). Understanding people’s attitudes and behaviours toward environmental issues could be a starting point for change. With this in mind, a number of different frameworks and scales have been developed over the past 45 years to gauge people’s environmental attitudes, knowledge and behaviour (Khan et al., 2012). This study adopts the Theory of Planned Behaviour (TPB) for behaviour and the New
Imaginable Futures: Design Thinking, and the Scientific Method. 54th International Conference of the Architectural Science Association 2020, Ali Ghaffarianhoseini, et al (eds), pp. 1233–1242. © 2020 and published by the Architectural Science Association (ANZAScA).

1234
Zahra Balador, Morten Gjerde, Brenda Vale and Nigel Isaacs
Environmental Paradigm (NEP) for the environmental attitudes of New Zealanders. Studying the perceptions of stakeholders in the building construction industry may reveal patterns that are different from those prevalent in other industries. In addition, attitudes toward the uptake of RRBMs has not yet been fully studied, at least in New Zealand. That is why this topic would appear to be important if future waste reduction strategies are to be based on evidence and to begin to cover this gap in knowledge.
2. Literature reviewAttitudes may influence behaviour when it comes to decreasing waste levels in construction (Begum et al., 2009). Increasing environmental concern has made those involved in marketing interested in finding information on environmentally responsible behaviours in order to stay in the market. Environmental attitudes have a direct, positive influence on people’s preferences for green products, and indirectly on their purchase and recycling behaviours (Lee et al., 2012).
2.1. Theory of Planned Behaviour
Since the 1980s, predicting environmental behaviour has been an evolving area of research in environmental psychology, with several theories having emerged since that time, including Ajzen’s Theory of Planned Behaviour. According to Klöckner (2013), the TPB is one of the most commonly used models in this domain when it comes to green product purchase and recycling behaviour and that there is much experimental and practical evidence to support the validity of the TPB (Balador, 2020). The most relevant factors to consider in the TPB are attitude, subjective norm, and perceived behavioural control (perceived capability). These are discussed in turn in the following section.
A study by Li et al (2015) showed that attitudes and perceived behavioural control have a positive influence on people’s behaviour but subjective norm plays a limited role. The main determinants of this model are shown in Figure 1, which has been adapted for this study. Modifications have been made to the model by dividing factors into sub-categories to measure them separately based on the needs of the study. In the TPB, motivation or intention is essential, and has a direct relationship with the previous factors (Ajzen, 1991). Based on the findings of other studies supporting the TPB, these three factors have an influence on behaviour via intention, but the perceived behavioural control factor also has some direct influence (Li et al., 2015). The TPB has been applied to other relevant fields such as household waste reduction and recycling (Bortoleto et al., 2012, Ramayah et al., 2012, Steg and Vlek, 2009, Tonglet et al., 2004).
Figure 1: Theory of Planned Behaviour, adapted from (Ajzen, 1991) Li et al. came to the conclusion that attitudes and perceived behavioural control could have significant influence on implementing waste reduction strategies at the design stage. They measured perceived behavioural control by probing perceived difficulties and controllability of the situation. Among these

1235
Towards an understanding of the potential to reuse and recycle building materials in New Zealand
factors, perceived behavioural control was the most influential factor for designers based on self- reported rather than observed behaviour (Li et al., 2015). Nevertheless, other previous studies have had different findings. One by Davies et al. (2002) demonstrated that intention was not indicative of behaviour (Davies et al., 2002). However, due to time and cost limitations, self-reporting behaviour was chosen for this research. The key terms and concepts for this research from the conceptual framework are discussed below (Table 1).
Attitude: The New Environmental/Ecological Paradigm (NEP) scale is one of the richest measurement tools for predicting behaviour from attitudes (Roberts and Bacon, 1997). A short version was developed with a 6-item scale in 2008, which is used in this study.
Subjective norm (SN): The subjective norm can be defined as an individual’s perceptions of general social pressure to perform a behaviour (Armitage and Conner, 2001). Recycling is a behaviour influenced not only by personal motivation but also by community and social motives (Klöckner, 2013). Kumar and Ghodeswar also identified social appeal as an influential factor in green product purchase (Kumar and Ghodeswar, 2015).
Perceived behavioural control (PBC): Klöckner used Ajzen’s definition of perceived behavioural control in his research as “the person’s belief as to how easy or difficult performance of the behaviour is likely to be”. This definition can be extended to internal factors like abilities and knowledge, and external factors like opportunity and the cooperation of other stakeholders that lead to the behaviour (Beh) (Klöckner, 2013).
Intention (Int): Lack of motivation is one of the barriers to reducing waste (Chung and Poon, 1999). In the TPB, the intention is to find a determinant that can be a plan for the behaviour that in conjunction with other factors enables the person to perform environmental behaviours (Klöckner, 2013).
Table 1: Measured items for examining the TPB
TPB Constructs Items Reference NEP, 1.The balance of nature is very delicate and easily upset by human (Kurisu, 2015) Likert activities;
2.The earth is like a spaceship with only limited room andresources;3.Plants and animals do not exist primarily to be used by humans;4.Modifying the environment for human use seldom causesserious problems;5.There are no limits to growth for nations;6.Mankind is created to rule over the rest of nature
PBC1, 1.RRBMs are usually available in your nearby suppliers’ stores; (Biswas and Roy, Likert 2.Required information for deciding on RRBMs are easily 2015, Freeman, 1990,
accessible; Dursun et al., 2016, 3.You can easily find specifications of RRBMs; Cheng et al., 2014, 4. People normally find any RRBMs that they want from suppliers Grimmer and near their living areas; Bingham, 2013, 5.Producers and suppliers of RRBMs communicate enough with Tilikidou, 2013, people. Rodriguez-Melo and
PBC2, 1.There are enough regulations related to RRBMs; Mansouri, 2011, Likert 2.You have knowledge about regulations related to the use of Sandhu et al., 2010)
RRBMs in the building construction process;

1236
Zahra Balador, Morten Gjerde, Brenda Vale and Nigel Isaacs
3. There are enough building certificates related to RRBMs;4. There are enough building material certificates related to RRBMs.
PBC3, Likert 1.Price plays an important role in buying RRBMs.SN, Likert 1.People are more concerned about reuse or recycling of materials
these days. (Kumar and Ghodeswar, 2015, Khare, 2015)
Int1, Likert
1. Building or Purchase of sustainable buildings;2. Building or Purchase of buildings with lower carbon footprint; 3.Purchase of buildings made with materials responsiblyproduced.
(Chung and Poon, 1999, Klöckner, 2013)
Int2, Likert
1.Purchase of environment-friendly building materials; 2.Purchase of reclaimed building materials;3.Purchase of recycled building materials.
Beh1, list 1. Recycling paper, plastic, glass bottles, cardboard, aluminium cans, or other products; 2. Repairing items as much as possible; 3.Reusing different products; 4.Reduction in waste generation;5.Selection of products based on carbon footprint; 6.Buying energy-efficient products; 7. Purchase of environment-friendly products;8. Buying recycled products.
(Kurisu, 2015)
Beh2, list 9.Purchase or build energy-efficient buildings; 10.Purchase or building sustainable buildings;11.Purchase or building buildings with lower carbon footprint; 12.Purchase of environmentally-friendly building materials; 13.Purchase of building materials locally produced; 14.Purchase of building materials with lower carbon footprint; 15.Purchase of reclaimed building materials;16.Purchase of recycled building materials.
3. MethodologyThe study took the form of an online survey questionnaire on the Qualtrics platform. The collected data were later imported into the SPSS for statistical analysis. The list of items measured through the survey is shown in Table 1. These are discussed briefly in the section 4. A five-point Likert scale was used as a common way of measuring attitudes, and scores have been calculated through using the average score of each section for each respondent.
3.1. Sample characteristic
Demographic information was also collected in the survey. Architects were identified through the New Zealand Institute of Architects websites (N=159). In some cases, contact information was also taken from the websites of architectural firms. Builders were contacted through the Licensed Building Practitioners Board (N=160). Participants in the client stakeholder group were invited through social media such as Neighbourly (N=144). All were asked to distribute the questionnaire to others as snow ball sampling, which is why the response rate cannot be calculated. The three cities of Auckland, Wellington and Christchurch as the largest in New Zealand were selected for the initial contacts.

1237
Towards an understanding of the potential to reuse and recycle building materials in New Zealand
5
3.2. Reliability
Reliability tests were done for all constructs in Table 1 which include more than one item. Results showed higher alpha coefficient than similar studies and they are within an acceptable range for measuring attitudes (Error! Reference source not found.) (Thomson, 2013, Lovelock, 2010).
Table 3: Reliability test results.
Constructs NEP PBC1 PBC2 Int1 Int2 Cronbach's Alpha Based on Standardized Items .664 .604 .696 .874 .817 N of Items 6 5 4 3 3
4. Results and discussionsA stepwise linear regression analysis was done separately for each group of stakeholders. This paper reports on this analysis and compares the model behaviours of the three separate groups to look for similarities and differences. The analysis procedure is here explained only for the builders group and then final behavioural models have been compared. Comparing the NEP responses from these stakeholders revealed that there is no statistically significant difference among them. Rather, differences could be found in their behaviour (Figure 4). There was a statistically significant difference in the general reuse and recycling behaviour between groups as determined by one-way ANOVA (F(2,398) = 4.536, p = .011). In addition, for reuse and recycling behaviour in professional practice, a significant difference was observed (F(2,297) = 6.150, p = .002).
Table 2: Sample characteristics
Demographics Frequency Male 313 Female 150 18-29 years old 56 30-49 years old 239 50-64 years old 127 65 years and over 41 Secondary school (college) 21 Trade/technical/vocational training 157 Bachelor’s degree 132 Post graduate degree 145 None of the above 8 Less than $19,999 35 $20,000 to $39,999 41 $40,000 to $79,999 152 $80,000 to $109,999 107 $110,000 or more 127

1238
Zahra Balador, Morten Gjerde, Brenda Vale and Nigel Isaacs
Stakeholders Mean
Table 4: Descriptive statistics
95% Confidence
Std. Deviation Std. Error Lower Bound Upper BoundBeh1: Builders 5.3 1.822 .152 5.047 5.647 Architects 6.0 1.856 .158 5.688 6.312 Consumers 5.9 2.091 .192 5.486 6.245
Beh2: Builders 4.2 2.290 .207 3.803 4.623 Architects 4.9 2.444 .224 4.430 5.318 Consumers 3.6 2.350 .306 2.981 4.206
4.1. Builders
Considering the effect of socio demographic in each group revealed some interesting results. In this group, there were 16 women and 144 men. Comparison showed that women as a group had a higher NEP score than men, (F(1,158) = 5.384, p = .022). In terms of reuse and recycling behaviour in their personal lives, there was a statistically significant difference (F(1,142) = 5.788, p = .018), but no difference in practice. Education levels were also noted as influencing attitudes and behaviours. The NEP scores were different, (F(4,155) = 4.198, p = .003), as builders with a bachelor degree had a more environmental friendly attitude than those with post graduate or secondary school experience.
4.1.1. Prediction of intention using the NEP results and perceived behavioural control components
As the primary predictor of behaviour, intention was examined as a dependent variable with all other components as independent variables. Subjective norm and NEP were found to be statistically significantly predictors of Int1. The equation was Int1 = 2.733 + 0.276 (NEP) + 0.168 (SN), p = 0.000, R squared = 0.153. Int2 was also predicted by NEP with the equation of Int2 = 3.122 + 0.261 (NEP), p = 0.005, R squared = 0.046. So, NEP as usual was a strong predictor of Intentions, but interestingly SN was also a good predictor of Int1, coming after NEP. Subjective norm was a predictor of intention to buy and build sustainable buildings but could not contribute to the prediction of Int2 and behaviour (Figure 2).
4.1.2. Prediction of behaviour using the NEP results and perceived behavioural control and intention components
Behaviour was examined as the dependent variable and all other components of NEP, PBC, SN and Intention as independent variables. Beh1 could be predicted by Int2 and NEP in order of importance, Beh1 = 0.055 + 0.725 (Int2) + 0.528 (NEP), p = 0.000, R squared = 0.135. Beh2 was predicted by Int2, Beh2 = 1.330 + 0.680 (Int2), p = 0.28, R squared = 0.031. It seems Int2, which was about the intention to use reclaimed and recycled building materials, was a strong predictor for both general recycling behaviour and recycling in construction. Surprisingly, Int1 was not a good predictor of behaviour (Figure 2).

1239
Towards an understanding of the potential to reuse and recycle building materials in New Zealand
Figure 2: Behavioural model of builders group based on the TPB.
4.2. Architects
Architects did not show any statistically significant difference regarding their sociodemographic data in their attitude or reuse and recycling behvaiour. NEP statistically significantly predicted Int1, Int1 = 3.206 + 0.313 NEP, p = .001, R2 = .074. Both NEP and PBC3 statistically significantly predicted Int2, Int2 = 2.621 + 0.239 (NEP) + 0.149 (Perceived Behavioural Control 3), p = .004, R2 = .063. Int2, NEP and PBC2 statistically significantly predicted Beh1, Beh1 = -3.486 +1.111 (Intention 2) + + 0.840 (NEP) + 0.433 (PerceivedBehavioural Control2), p = .000, R2 = .263 Figure 3). Beh2 was predicted statistically significantly from NEPand Int2, Beh2 = -3.810 + 1.201 (NEP) + 0.812 (Intention 2), p = .000, R2 = .143.
Figure 3: Behavioural model of architects group based on the TPB. NEP was the strongest predictor of intention both for Int1 which concerned the general intention of
buying and building sustainable buildings, and Int2 which was about the use of reclaimed and recycled building materials. When examining Int2, PBC3 was also a predictor, as PBC3 concerned the price of environmentally friendly products. This is consistent with the literature (Li et al., 2015, Freeman, 1990, Ottman, 1998). This component of PBC was a stronger predictor of intention compared to other PBC components. Knowing the level of the environmental attitudes of architects, their intention can be predicted, and when it comes to the intention, knowing about the cost of these materials would also be important.
Int2, NEP and PBC are the strongest predictors of behaviour. For Beh1, strong predictors are Int2, NEP and PBC2. For Beh2, strong predictors are only NEP and Int2. Int2, that is the intention to use reclaimed and recycled building materials, was more related to general recycling behaviour and then to

1240
Zahra Balador, Morten Gjerde, Brenda Vale and Nigel Isaacs
this behaviour in construction practices. This is consistent with the literature that environmental attitude (NEP) can be a good predictor of both recycling behaviours in general and in construction practices, but more in construction practices (Li et al., 2015, Begum et al., 2009, Ogunbode, 2013), although it is not always a good predictor for other environmental behaviours. Also, another reason is that in affluent countries like New Zealand, environmental actions can be more predicted from attitudes (Thøgersen, 1994). Interestingly, PBC2 which is associated with related regulations and certificates for reclaimed and recycled building materials, proved to be a stronger predictor when it came to the prediction of Beh2, which is about recycling in construction practices, and shows the validity of the core intent of the questions. This mirrors the results of Klöckner (2013). So, measuring the environmental attitudes and intention of architects can help in predicting reuse and recycling in the building construction process. With that noted, the knowledge of architects of regulations and certificates can also have an effect on their general recycling behaviour. The findings of this statistical analysis are consistent with the study of Li et al. (2015), who found attitudes and PBC were the two most important predictors of behaviour among designers and architects.
4.3. Consumers
In the group of consumers, older people showed more environmentally friendly attitudes (F(3,140) = 4.117, p = .008). The 65+ group had the most positive attitude, and that of those aged 30-49 had the least positive attitude. Examining the TPB for the consumer group showed that NEP and SN statistically significantly predicted Int1 and Int2. Int1 = 1.669 + 0.524 (NEP) + 0.163 (SN), p = 0.000, R squared = 0.295. Int2 = 1.498 + 0.491 (NEP) + 0.174 (SN), p= 0.000, R squared = 0.217. Beh1 was predicted statistically significantly by Int1 and NEP. Beh1 = -0.453 + 0.733 (Int1) + 0.690 (NEP), p = 0.000, R squared = 0.137. So, reuse and recycling can be predicted by the intention of buying and building sustainable buildings and directly by measuring environmental attitudes (Figure 4). Beh2 is not predictable by these factors for consumers. However, the bond between environmental attitudes, intention of buying and building sustainable buildings, subjective norm and general recycling behaviour can be seen. Interestingly, subjective norm, which is about social pressure, can influence behaviour.
5. Conclusion
Figure 4: Behavioural model of consumer group based on the TPB.
The most important predictor components were the intention of using reclaimed and recycled building materials and environmental attitudes. However, small modifications could be made to the TPB model according to the results presented in Figure 2, Figure 3 and Figure 4 for each group. Results showed that architects do more reuse and recycling in their personal lives as well as in practice. Builders do less

1241
Towards an understanding of the potential to reuse and recycle building materials in New Zealand
general reuse and recycling, but consumers do less reuse and recycling in building construction, which was expected. Architects with stronger environmental attitudes (NEP) have stronger intentions (Int) to do more recycling or buy more recycled materials (Beh). However, their intentions (Int) for doing these behaviours are also influenced by the cost of these materials (PBC3). Also, when architects know more about regulations and certificates (PBC2), they do more of these pro-environmental practices. For builders and consumers subjective norm is a more important influential factor on their behaviour than architects. The reuse and recycling behaviour of consumers in building construction is not predictable by these factors. Knowing the environmental attitudes is important to predict the behaviour of all.
Policymakers can enhance perceived behavioural control by increasing designers’ awareness of waste management through changes in legislation and through educational programs, since a key barrier to environmental practices is the lack of training and expertise in the construction industry. Educating architectural students for design for disassembly could lead to enhanced use of RRBMs in the future. Educating contractors and encouraging them to use RRBMs is probably a role for government. Cost was the concern of everyone when choosing a product, whether or not it was recycled. Communication via a good network between stakeholders could solve many problems, and result in understanding the financial benefits, environmental impacts, and market demand more easily and in a timelier manner. The various policies, guidelines and studies of government and other institutions have resulted in scattered information which is difficult for all stakeholders comprehend. Such information needs to be gathered into a comprehensive and inclusive platform that is accessible for all.
References ADDIS, B. 2012. Building with reclaimed components and materials: a design handbook for reuse and recycling,
London, Routledge. AJZEN, I. 1991. The theory of planned behavior. Organizational Behavior and Human Decision Processes, 50, 179-
211. ARMITAGE, C. J. & CONNER, M. 2001. Efficacy of the theory of planned behaviour: A meta-analytic review. British
Journal of Social Psychology, 40, 471-499. BALADOR, Z. 2020. The role of architects in increasing the use of reclaimed and recycled building materials in New
Zealand PhD, Victoria University of Wellington. BEGUM, R. A., SIWAR, C., PEREIRA, J. J. & JAAFAR, A. H. 2009. Attitude and behavioral factors in waste management
in the construction industry of Malaysia. Resources, Conservation and Recycling, 53, 321-328. BISWAS, A. & ROY, M. 2015. Green products: an exploratory study on the consumer behaviour in emerging
economies of the East. Journal of Cleaner Production, 87, 463-468. BORTOLETO, A. P., KURISU, K. H. & HANAKI, K. 2012. Model development for household waste prevention
behaviour. Waste Management, 32, 2195-2207. CHENG, B., IOANNOU, I. & SERAFEIM, G. 2014. Corporate social responsibility and access to finance. Strategic
Management Journal, 35, 1-23. CHUNG, S.-S. & POON, C.-S. 1999. The attitudes of Guangzhou citizens on waste reduction and environmental
issues. Resources, conservation and Recycling, 25, 35-59. CONDER, T. 2008. Materials, New Zealand, BRANZ. DAVIES, J., FOXALL, G. R. & PALLISTER, J. 2002. Beyond the intention–behaviour mythology: an integrated model of
recycling. Marketing theory, 2, 29-113. DURSUN, I., KABADAYI, E. T., KOKSAL, C. G. & TUGER, A. T. 2016. Pro-environmental Consumption: is it really all
about the environment? Journal of Management Marketing and Logistics, 3, 114-134. FREEMAN, L. 1990. The Greening of America II: Savy Marketers Keep Aboard the Environmental Cause. Advertising
Age

1242
Zahra Balador, Morten Gjerde, Brenda Vale and Nigel Isaacs
GRIMMER, M. & BINGHAM, T. 2013. Company environmental performance and consumer purchase intentions. Journal of Business Research, 66, 1945-1953.
IACOVIDOU, E. & PURNELL, P. 2016. Mining the physical infrastructure: Opportunities, barriers and interventions in promoting structural components reuse. Science of The Total Environment, 557-558, 791-807.
KHAN, A., KHAN, M. N. & ADIL, M. 2012. Exploring the new ecological paradigm (NEP) scale in India: Item analysis, factor structure and refinement. Asia-Pacific Journal of Management Research and Innovation, 8, 389-397.
KHARE, A. 2015. Antecedents to green buying behaviour: a study on consumers in an emerging economy. Marketing Intelligence & Planning, 33, 309-329.
KLÖCKNER, C. A. 2013. A comprehensive model of the psychology of environmental behaviour—A meta-analysis. Global environmental change, 23, 1028-1038.
KUMAR, P. & GHODESWAR, B. M. 2015. Factors affecting consumers’ green product purchase decisions. Marketing Intelligence & Planning, 33, 330-347.
KURISU, K. 2015. Pro-environmental Behaviors, Department of Urban Engineering, The University of Tokyo, Tokyo, Japan, Springer.
LEE, Y.-K., CHOI, J.-G., KIM, M.-S., AHN, Y.-G. & KATZ-GERRO, T. 2012. Explaining pro-environmental behaviors with environmentally relevant variables: A survey in Korea. African Journal of Business Management, 6, 8677-8690.
LI, J., TAM, V. W., ZUO, J. & ZHU, J. 2015. Designers’ attitude and behaviour towards construction waste minimization by design: A study in Shenzhen, China. Resources, Conservation and Recycling, 105, 29-35.
LOVELOCK, B. 2010. Disability and going green: a comparison of the environmental values and behaviours of persons with and without disability. Disability & Society, 25, 467-484.
OGUNBODE, C. A. 2013. The NEP scale: measuring ecological attitudes/worldviews in an African context. Environment, Development and Sustainability, 15, 1477-1494.
OTTMAN, J. 1998. Green marketing: opportunity for innovation, USA, NTC Business Books,. RAMAYAH, T., LEE, J. W. C. & LIM, S. 2012. Sustaining the environment through recycling: An empirical study.
Journal of Environmental Management, 102, 141-147. REBRI. 2014. Why REBRI? [Online]. Available: https://www.branz.co.nz/cms_display.php?st=1&sn=113 [Accessed
01/07/2018]. ROBERTS, J. A. & BACON, D. R. 1997. Exploring the subtle relationships between environmental concern and
ecologically conscious consumer behavior. Journal of business research, 40, 79-89. RODRIGUEZ-MELO, A. & MANSOURI, S. A. 2011. Stakeholder Engagement: Defining Strategic Advantage for
Sustainable Construction. Business Strategy and the Environment, 20, 539-552. SANDHU, S., OZANNE, L. K., SMALLMAN, C. & CULLEN, R. 2010. Consumer driven corporate environmentalism: Fact
or fiction? Business Strategy and the Environment, 19, 356-366. STEG, L. & VLEK, C. 2009. Encouraging pro-environmental behaviour: An integrative review and research agenda.
Journal of Environmental Psychology, 29, 309-317. THØGERSEN, J. 1994. A model of recycling behaviour, with evidence from Danish source separation programmes.
International Journal of Research in Marketing, 11, 145-163. THOMSON, J. 2013. New Ecological Paradigm Survey 2008: Analysis of the NEP results. In: COUNCIL, W. R. (ed.).
Waikato Regional Council. TILIKIDOU, I. 2013. Evolutions in the ecologically conscious consumer behaviour in Greece. EuroMed Journal of
Business, 8, 17-35. TONGLET, M., PHILLIPS, P. S. & READ, A. D. 2004. Using the Theory of Planned Behaviour to investigate the
determinants of recycling behaviour: a case study from Brixworth, UK. Resources, Conservation and Recycling, 41, 191-214.

1243
The 54th International Conference of the Architectural Science Association (ANZAScA) 2020
Towards Creative Systems in Architectural Design
Manuel Mühlbauer1 1 Futureimmersion, Lohr am Main, Germany
Abstract: This position paper describes a pathway and methodology towards creative systems in architectural design. Drawing from creativity research and strategic design methods, an agile approach to exploration of deep learning technology in the context of architectural optimisation was developed. The investigation proposed and defined the nature of a framework, which explored ways of integrating architectural shape design with machine intelligence. Furthermore, the paper elaborates the implications and potential for impact of deep learning techniques on advancing human-computer- interaction for architectural optimisation. However, the described framework might be used as a design scheme for an active tool to drive design processes and support decision-making in early stages of architectural design. The components of the framework defined interfaces and critical points of investigation for application of the presented methodology in creative practice. In this way the research contributes to the theoretical and methodological development of creative systems research. At its heart, this generative design study involved the definition of a clear research trajectory, challenges and opportunities of supporting creative practice by means of design systems. Finally, the potential of machine intelligence to generate creative work with and without human guidance or performance criteria was examined.
Keywords: Strategic Design, Deep Learning, Architectural Optimisation, Generative Design
1. IntroductionThe term human-in-the-loop system describes the possible extension of machine capabilities. On the other side computational systems have the capabilities to enhance human creativity. These creative systems have practical implications. They have impact on the way architects think and practice as any other computational tool. For example, computer-aided design (CAD) software and its associated mechanisms shaped contemporary expression of architecture. In the same way, the proliferation of geometric expressivity using parametric design technology opened ways of organic aesthetic expression. But how will another change in paradigm impact on our planning habits? Principles of creative action were often derived from a perspective of philosophical considerations about aesthetics in art and technology. Embedding strategic design into architectural practice of digital tool making changed the way we managed design processes. Setting and solving the problem, as described by Meroni (2008) was one of the core activities to explore a framework for creative systems. Applying strategic design to the context of computational design and the design of creative systems, meant to change design practice. You will be a designer of the future and for the future, as discussed by Fry
Imaginable Futures: Design Thinking, and the Scientific Method. 54th International Conference of the Architectural Science Association 2020, Ali Ghaffarianhoseini, et al (eds), pp. 1243–1252. © 2020 and published by the Architectural Science Association (ANZAScA).

1244
Manuel Mühlbauer
(2009); a creative problem solver, able to deliver fast design solutions to help clients in the decision- making process. This might be even easier if you were able to master working with creative systems. The creation of tangible, adaptable solutions in close collaboration with clients in multidisciplinary teams and the capability of designing the best experience for the user could align physical and virtual spaces with conceptual spaces explored by the designer. The empiric design of creative systems using agile methods to expand knowledge in artificial intelligence incrementally extended the capabilities of architects using active tools during decision-making.
2. Literature Review
The creative process of artists and architects inspired computer scientists to work on aesthetic support systems for generating images, shapes, and music. This problem has multiple facets that need to be considered to understand the dynamics of creative systems. In evolutionary design, generative design and architectural optimisation, design systems were frequently used to enhance human capabilities to generate and analyse design solutions. Sometimes, even inference in terms of design synthesis was implemented as software feature. Evolutionary algorithms were often utilised to create a variety of design solutions by using genetic operators (mutation and recombination) from geometric encoding of the genotype. Those design solutions, the phenotypes, were assessed for their performance in respect to a variety of performance criteria. One of them being aesthetic guidance, enabling the designer to use inherent design knowledge. Architects use their aesthetic knowledge to express choice or preferences - often without explicitly communicating the rational of the design decision to the computational system. As shown in Figure 1, the computer in response provides shape solutions or information about the solutions for further consideration of the designer.
Figure 1: Relationship between user and design system
The evaluation of performance criteria by means of a fitness function can include simulation of physical properties of the design solutions. However, communicating information about performance criteria to the designer in terms of ranking, offered the designer a way of dealing with calculation outcomes in a more intuitive way. Additional, explicit information may support the designer in gaining additional knowledge about the design case during her or his creative work. Figure 1 shows the relationship between the user and the design system in a human-in-the-loop approach.
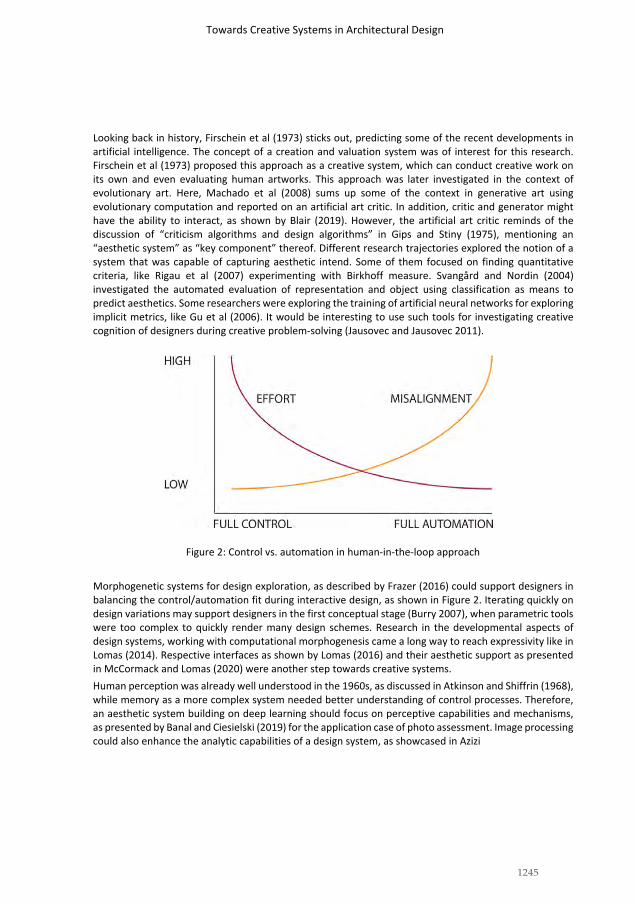
1245
Towards Creative Systems in Architectural Design
Looking back in history, Firschein et al (1973) sticks out, predicting some of the recent developments in artificial intelligence. The concept of a creation and valuation system was of interest for this research. Firschein et al (1973) proposed this approach as a creative system, which can conduct creative work on its own and even evaluating human artworks. This approach was later investigated in the context of evolutionary art. Here, Machado et al (2008) sums up some of the context in generative art using evolutionary computation and reported on an artificial art critic. In addition, critic and generator might have the ability to interact, as shown by Blair (2019). However, the artificial art critic reminds of the discussion of “criticism algorithms and design algorithms” in Gips and Stiny (1975), mentioning an “aesthetic system” as “key component” thereof. Different research trajectories explored the notion of a system that was capable of capturing aesthetic intend. Some of them focused on finding quantitative criteria, like Rigau et al (2007) experimenting with Birkhoff measure. Svangård and Nordin (2004) investigated the automated evaluation of representation and object using classification as means to predict aesthetics. Some researchers were exploring the training of artificial neural networks for exploring implicit metrics, like Gu et al (2006). It would be interesting to use such tools for investigating creative cognition of designers during creative problem-solving (Jausovec and Jausovec 2011).
Figure 2: Control vs. automation in human-in-the-loop approach
Morphogenetic systems for design exploration, as described by Frazer (2016) could support designers in balancing the control/automation fit during interactive design, as shown in Figure 2. Iterating quickly on design variations may support designers in the first conceptual stage (Burry 2007), when parametric tools were too complex to quickly render many design schemes. Research in the developmental aspects of design systems, working with computational morphogenesis came a long way to reach expressivity like in Lomas (2014). Respective interfaces as shown by Lomas (2016) and their aesthetic support as presented in McCormack and Lomas (2020) were another step towards creative systems. Human perception was already well understood in the 1960s, as discussed in Atkinson and Shiffrin (1968), while memory as a more complex system needed better understanding of control processes. Therefore, an aesthetic system building on deep learning should focus on perceptive capabilities and mechanisms, as presented by Banal and Ciesielski (2019) for the application case of photo assessment. Image processing could also enhance the analytic capabilities of a design system, as showcased in Azizi

1246
Manuel Mühlbauer
et al (2020). Many of the challenges encountered during investigation of deep learning and creative systems in the context of architectural design could benefit from similar research in music composition. A comprehensive survey thereof was presented by Briot et al (2017). Another option for introduction of control in design systems using deep learning was human interaction, as presented by Bontrager et al (2018).
As a starting point for reviewing the literature in the field of human-computer-interaction in the context of generative design, I want to use Takagi’s overview of interactive evolutionary computation. Takagi (2001) pointed out that evolutionary computation, neural networks and fuzzy research started in the 1960s and were explored independently until experiments with technological combination of these methods started in the 1980s. Muehlbauer et al (2017) started the investigation of generative design systems with interactive evolution – a technology emerging in the late 1990s. Following the paradigm of interactive evolutionary computation, and inspired by Sims (1992) mentioned “interactive evolution of dynamic systems”, the research developed a framework called Typogenetic Design (Muehlbauer 2018), which allowed the evolution of 3D-shapes using genetic programming (investigated by Koza (1990)). More details about the framework for guidance of evolutionary design in architecture were published in Muehlbauer et al (2020). The design system was used for visual inspiration of designers like the conceptual approach reported in Singh et al (2019). The generative system built on extensive research in “Evolutionary Design Systems and Generative Processes”, as published for example by Janssen et al (2002). The integration of quantitative performance measures closed “the loop of design and analysis”, as discussed earlier by Toth et al (2011).
3. Strategic Design of Creative SystemsFormal and conceptual ideas are the creative basis for architectural design. However, between the first preferences of the designer and the coherent architectural object, the explorative process unlocks a range of possibilities and choices. Design development was often seen as a process that led to a solution by applying a rational. The digital tools used during the design process had impact on the recognition of possibilities and how choices were made. Shaping those tools shaped the design process. The input, process and the proper scale needed to be defined clearly, when digital tools were to support the design process according to a chosen design direction.
The process of designing a digital system to support creative decision-making was a strategic one. Therefore, strategic design offered a methodology to frame this process. To depart from a substantiated research and technology review gave the designer a structure on how to interpret the technology assessment. In a second step, the potential of the digital tool, was reviewed regarding the value of the functionality of the tool and respective novelty, as show in Figure 3. Next, the design strategy for the tool as a concept, schema or design pattern was identified. Based on a project, the design case and problem were defined as a Segway into system practice.
The iterative application of the design method guided the development of a prototype of the creative system. The structured rework of the design system based on the emerging software modularity and functionality led to a software product, which was usable in a variety of design cases. In another step, reflective methods were used to create a point of departure for a review of the process based on three trajectories – analyze, reduce and adapt. This process is displayed to the left of Figure 3.

1247
Towards Creative Systems in Architectural Design
At first, the reduction of complexity of the design system was a key aim. The second aim was the objective analysis of the system, based on statistical analysis of several user experiences in a usability study. Reviewing the user needs in a qualitative study using questionnaires allowed the system designer to understand the investigated design process in the current situation. This method of research provided strategic validation of the process and a rational for designing the master plan of the creative system, as reported in the following section, in such a way that it was logically sound for prospective users.
Figure 3: Overview of strategic design process for creative systems
The methods used for strategic design exploration was suitable in the context of this inquiry – the investigation of a creative system. Scientific methods were used to gather the data, so that a bias towards specific tendencies was minimized. Still the design process itself was subjective and driven by the investigators. Keeping this notion present during the research process helped to gain understanding of the matter in a realistic way. Designing a creative system as a process, meant to investigate on three levels – the application potential, exploration in project-based case studies and an abstract process level, which allowed to create schemata for communicating and abstracting results.

1248
Manuel Mühlbauer
4. Framework for Creative Systems in Architectural DesignA consistent categorisation of creative systems augmenting human creativity still lacks some more understanding about creativity itself. The inspiration of human users in response to unexpected aesthetic results was one option to evaluate the creativity of a system. Supporting users by performing calculation tasks and provide aesthetic support of users during decision making were capabilities understood as supporting creative work in architectural design. Therefore, the integration of visual task automation using human-in-the-loop for aesthetic guidance was investigated. This process was able to provide an emerging direction from user choice during use of creative systems. Starting from an initial designer input, as displayed in Figure 4, was crucial for the valuation system to explore design solutions restricted by grammar constraints (e.g. evaluation restrictions like building law or zoning restrictions). Another key component of the presented schema for creative systems was the selection procedure providing aesthetic guidance supported by an aesthetic fitness function. This aesthetic fitness function was also fed by the automated evaluation of the user selection during artificial evaluation. Interactive decision support was based on the criticism system as part of the control system.
Figure 4: Schema of a creative system supporting designers interactively
Using an optimizer as creation system allowed the introduction of performance criteria as quantitative measures. The strategic alignment of the design process during investigation of the creative system

1249
Towards Creative Systems in Architectural Design
after each stage of project design was central to the strategic design process. During iterative review of the control system as a process, the complexity of the framework was reduced to a level that was easy to communicate and therefore extendable with new innovations. A general overview of the functional layers and layouts of the creative system revealed levels of control and memory necessary for supporting the human designer. The embedding of optical review and visual evaluation as a computer vision tasks, might also lead to feature selection and highlighting of regions of interest by the valuation system. The experiments with 3D shapes, case studies and user experience evaluation were discussed on another occasion. Additionally, the distance-based classification for aesthetic selection as used in the framework was discussed by Muehlbauer et al (2020).
Figure 5: Some Experiments using Creative Systems
In Figure 5, the project development was displayed in its distinct project stages. Firstly, the use of an automated design system, second the use of a semi-automated design system, third a case study to show the application potential of Typogenetic Design framework. The image to the far right in Figure 5 showcases the experimental application adding another stage of 2d-style transfer based on deep learning. Some work was conducted around deep learning application in architectural design using this method. I want to refer to del Campo and Manninger (2019) at this point for further reading.
5. Nature of An Adaptive Design Framework for Creative SystemsThe proposed adaptive design framework extended the process of architectural optimisation to add non-deterministic characteristics and allow designers to explore latent thoughts in an adaptive way. Compared to parametric design environments, the iterative adaptation of the design representation during generative design offered new mechanisms of control. Combining different stages of generative adaptation increased creative freedom during choice of aesthetic expression. Articulation of choice as main interaction catered for the subjective nature of design and engaged the designer interactively as shown in Figure 6. This easy-to-use process offered the designer the possibility to contribute with her or his unique design knowledge. However, the subjective choice was supported by the creative system in providing criteria evaluation and ranking function. Using a distance measure on genotype and phenotype level as part of multi-criteria optimisation allowed to experiment with different design cases. The different levels of representation, aesthetic system and generative system were necessary to fully engage with the application potential of evolutionary algorithms as support for human creativity. The schema was modular and transferable to any generative design engine. On one hand, generative adversarial networks and variational autoencoders could be used to generate two-dimensional or three-dimensional shapes. On the other

1250
Manuel Mühlbauer
hand, convolutional neural networks and recurrent neural networks were better suited to augment human perception as part of the aesthetic system. The framework supported human creative activities, creativity and exhibited adaptive features to cater for latent thoughts, frequently happening during design activities. The unexpected moments created by insights and inspirational moments were a characteristic of exploratory search, which needed to be reflected in the computational mechanisms. Creative systems provided a possibility to expand human creativity. Inspiration by generative art and design will be challenging current modes of aesthetic evaluation even further. The adaptive design framework exhibited characteristics of design systems, which support designer creativity. Those features of the adaptive design framework were compiled, as displayed in comparison to other computational design approaches in Figure 6.
Figure 6: Characteristics of an adaptive design framework using human-in-the-loop system
Creative systems were sometimes seen as creative actors themselves. There was a vivid discussion about this conducted by Sundararajan (2014), broadening the horizon of the reader by negotiating the views of Harald Cohen, Bruce G. Buchanan and Margaret Boden.
6. ConclusionsRemarkably, the creative decision support was opening new avenues of investigation to the designer by using emergent representations. This generative approach allowed the designer to review a wide scope of topologically different designs instead of working on a restricted set of design solutions. As a result, the designer quickly gained insights on the design case from her or his subjective position.

1251
Towards Creative Systems in Architectural Design
The reported methodology for the design and exploration of human-in-the-loop systems enhanced the knowledge about creative systems and the use of artificial intelligence in architectural design. Providing a theoretical basis towards the use of creative systems in architecture, meant gaining additional knowledge about the use of control systems in generative design. Extending the idea of a valuation system with specific mechanisms for aesthetic exploration of design phenomena contributed to creativity research by providing a knowledge representation suitable for evaluation of the choice process undertaken by the designer.
Acknowledgements This work builds on the experience I gained during the PhD I conducted as part of the Practice Research Symposium Programme at RMIT University. During this process I was guided by PD Dr Marcelo Stamm, Prof. Dr Jane Burry and Dr Andy Song. I gratefully acknowledge their provision of advice, support and encouragement during the time of my doctorate.
References Atkinson, R.C., Shiffrin, R.M. (1968) Human memory: a proposed system and its control process, in K.W. Spence (ed.),
The psychology of learning and motivation: advances in research and theory, Academic Press, New York, 89–195. Azizi, V., Usman, M., Patel, S., Schaumann, D., Zhou, H., Faloutsos, P., Kapadia, M. (2020) Floor Plan Embedding with
Latent Semantics and Human Behavior Annotations, Proceedings of the 11th annual Symposium on Simulation for Architecture and Urban Design (SimAUD), pp. 337-344.
Banal, S.L.,Ciesielski, V. (2020) A deep learning neural network for classifying good and bad photos, In: Romero, J., Ekárt, A., Martins, T., Correia, J.(eds.) EvoMUSART 2020. LNCS, vol. 12103, pp. 1–16. Springer, Cham.
Blair, A. (2019) Adversarial evolution and deep learning – how does an artist play with our visual system? In: Ekárt, A., Liapis, A., Castro Pena, M.L. (eds.) EvoMUSART 2019. LNCS, vol. 11453, pp. 18–34. Springer, Cham (2019). https://doi.org/10.1007/978-3-030-16667-0 2
Bontrager, P., Lin, W., Togelius, J., Risi, S. (2018) Deep interactive evolution. In: Liapis, A., Romero Cardalda, J.J., Ekárt, A. (eds.) EvoMUSART 2018. LNCS, vol. 10783, pp. 267–282. Springer, Cham. https://doi.org/10.1007/978- 3-319-77583-8 18
Briot, J.-P., Hadjeres, G., Pachet, F.P. (2017) Deep learning techniques for music generation -- A survey. Arxiv preprint arXiv:1709.01620.
Burry, J. R. (2007). Mindful spaces: computational geometry and the conceptual spaces in which designers operate. International Journal of Architectural Computing, 5(4), pp. 611-624.
del Campo, M., Manninger, S. (2019) Imaginary Plans, Proceedings of the 39th ACADIA Conference - Ubiquity and Autonomy, pp. 412-418.
Firschein, O. Fischler, M. A. Coles, L., Tenenbaum, J. M. (1973) Forecasting and assessing the impact of artificial intelligence on society. IJCAI, 1973.
Frazer, J. (2002). Creative design and the generative evolutionary paradigm. In Creative evolutionary systems, pp. 253-274, Morgan Kaufmann.
Frazer, J. (2016). Parametric computation: history and future. Architectural Design, 86(2), pp. 18-23. Fry, T. (2009). Design futuring. University of New South Wales Press, Sydney, pp. 71-77. Gips, J., Stiny, G. (1975) Artificial intelligence and aesthetics. IJCAI, 1975. Gu, Z., Tang, M. X., Frazer, J. H. (2006). Capturing aesthetic intention during interactive evolution. Computer-Aided
Design, 38(3), pp. 224-237. Janssen, P., Frazer, J., & Ming-Xi, T. (2002). Evolutionary design systems and generative processes. Applied
intelligence, 16(2), 119-128. Jausovec, N., Jausovec, K. (2011) Brain, creativity and education. Open Educ. J. 4, pp. 50–57

1252
Manuel Mühlbauer
Koza, J. R. (1990): Genetic Programming. A Paradigm for genetically breeding populations of computer programs to solve problems. Stanford University.
Lomas, A. (2014): Cellular forms: an artistic exploration of morphogenesis. In: AISB 2014–50th Annual Convention of the AISB, July 2014
Lomas, A. (2016) Species explorer: an interface for artistic exploration of multidimensional parameter spaces. In: Bowen, J., Lambert, N., Diprose, G. (eds.) Electronic Visualisation and the Arts (EVA 2016). ElectronicWorkshops in Computing (eWiC), 12th–14th July 2016. BCS Learning and Development Ltd., London.
Machado, P., Romero, J., Manaris, B. (2008). Experiments in computational aesthetics. In: The art of artificial evolution (pp. 381-415). Springer, Berlin, Heidelberg.
Meroni, A. (2008). Strategic design: Where are we now? Reflection around the foundations of a recent discipline. In: Strategic Design Research Journal 1(1), pp. 31-38. DOI: 10.4013/sdrj.20081.05.
McCormack J., Lomas, A. (2020) Understanding Aesthetic Evaluation with Deep Learning, In: Romero, J., Ekárt, A., Martins, T., Correia, J.(eds.) EvoMUSART 2020. LNCS, vol. 12103, pp. 118-133. Springer, Cham
Muehlbauer, M., Song, A., Burry, J. (2017) Towards intelligent control in generative design. In G. Cagdas, M. Ozkar, L. F. Gul, and E. Gurer, editors, Future Trajectories of Computation in Design, Proceedings of CAADFutures 2017.
Muehlbauer, M. (2018) Typogenetic design - aesthetic decision support for architectural shape generation. Doctor of Philosophy (PhD), Architecture and Urban Design, RMIT University.
Muehlbauer, M., Burry, J., Song, A. (2020) An Aesthetic-Based Fitness Measure and a Framework for Guidance of Evolutionary Design in Architecture. In: J. Romero, A. Ekárt, T. Martins und J. Correia (Hg.): Artificial Intelligence in Music, Sound, Art and Design. Cham, 2020. Cham: Springer International Publishing, S. 134–149, 2020.
Rigau, J., Feixas, M., Sbert, M. (2007). Conceptualizing Birkhoff's Aesthetic Measure Using Shannon Entropy and Kolmogorov Complexity. In Computational Aesthetics, pp. 105-112.
Sims, K. (1992). Interactive evolution of dynamical systems. In Toward a practice of autonomous systems: Proceedings of the first European conference on artificial life, pp. 171-178.
Singh, D., Rajcic, N., Colton, S., McCormack, J. (2019) Camera obscurer: generative art for design inspiration. In: Ekárt, A., Liapis, A., Castro Pena, M.L. (eds.) Evo- MUSART 2019. LNCS, vol. 11453, pp. 51–68. Springer, Cham. https://doi.org/10.1007/978-3-030-16667-0 4
Sundararajan, L. (2014). Mind, machine, and creativity: an artist's perspective. The Journal of creative behavior, 48(2), 136-151.
Svangård, N., Nordin, P. (2004). Automated aesthetic selection of evolutionary art by distance-based classification of genomes and phenomes using the universal similarity metric. In Workshops on Applications of Evolutionary Computation, pp. 447-456. Springer, Berlin, Heidelberg.
Takagi, H. (2001) Interactive evolutionary computation: Fusion of the capabilities of ec optimization and human evaluation. Proceedings of the IEEE, 89(9): pp. 1275-1296.
Toth, B., Salim, F., Drogemuller, R., Frazer, J. H., Burry, J. (2011). Closing the loop of design and analysis: Parametric modelling tools for early decision support. In Circuit Bending, Breaking and Mending: Proceedings of the 16th International Conference on Computer-Aided Architectural Design Research in Asia, pp. 525-534, The Association for Computer-Aided Architectural Design Research in Asia (CAADRIA).

1253
The 54th International Conference of the Architectural Science Association (ANZAScA) 2020
Two minds are better than one: Breeding collaborative mindsets for emerging design-led transdisciplinary practices
Zhengping Liow Singapore Polytechnic, Singapore
Abstract: With an increasingly unpredictable economy, influences of ‘Design’ must strategically expand into non-allied fields as transdisciplinary design-led practices for sailing through looming uncertainties. In recent years, 'democratised' methodologies like Design Thinking and Business Design have gained momentum amid the rise of the 'Empathy' economy where designers co-designs with non-designers. Despite the importance of collaboration, the ubiquitous ‘Master and Apprentice’ studio pedagogy remains an impediment. This paper reports the first stage’s findings of a longitudinal research investigating relationships of first-year architecture students’ academic performances of both Collaborative Team Learning (CTL) and the individualistic One-on-One (OOO) desk critic’s formative studio learning experiences and student’s self-reflective efficacy of their self-directed learning (SDL) peer-to-peer (P2P) discussions (without the tutors’ facilitation). Inferential statistical T-tests reveal positive associations of CTL students with higher scores and registering favourable learning experiences. A subsequent T-test, however, fails to reveal any relationship between their academic performance with their self-reflective efficacy of their SDL P2P collaborations. The latter finding cast further questions on how the development of collaborative mindsets can be ascertained. This is a timely study examining how the studio pedagogy can instil learners with collaborative mindsets and communication skills empowering them for the design-led transdisciplinary practices of the future.
Keywords: Design studio; Non-hierarchical pedagogy; Collaboration; Self-directed learning.
1. IntroductionDesign is projected to take on essential roles driving emerging values and markets, spurring economic competitiveness, and offering human-centred solutions confronting societal challenges (Design Singapore Council - DSC, 2019). The increasing values of design expedite decisions to integrate 'design' into higher education’s non-design programmes (DSC, 2019). Future design trajectories are expected to shift from the prevalent closed-system design process, as dictated by the cognitive styles of individual Master Designers in the production of spaces/products, to an inclusive process of where end-users as non-designers partake in a 'democratised' co-design process involving outcomes of (at times) intangible organisational systems (Kimbell, 2011). Cedric Price (Price & Hardingham, 1984) in his discourse of
Imaginable Futures: Design Thinking, and the Scientific Method. 54th International Conference of the Architectural Science Association 2020, Ali Ghaffarianhoseini, et al (eds), pp. 1253–1262. © 2020 and published by the Architectural Science Association (ANZAScA).

1254
Zhengping Liow
expanding architecture’s agencies, advocated explorations in which physical design outcomes as buildings/spaces may not be ideal solutions in tackling spatial and social challenges. Still, pervasive methods of teaching at many design schools advocating buildings as autonomous objects (Till, 2019) continue to perpetuate. The potential of spatial designers in the built environment disciplines extending their agencies into emerging transdisciplinary design-led practices remains unexploited.
Academia’s mission in fostering collaborative mindsets is being forefronted as an essential aim in preparing graduates for the uncertainties of the 21st Century (Tan, Choo, Kang & Liem, 2017; Fogarty & Pete, 2010). Despite the importance of collaboration, design projects in academia are often facilitated through authoritative one-on-one (OOO) tutor-led pedagogical settings (Goldschmidt et al., 2010; Liow, 2016) in-tandem with learners working on individual design projects. Albeit the siloed pedagogical structure, group and teamwork with ‘non-design outcomes’ are sporadically used. Students' preferred modus operand of embracing a 'divide and conquer' approach in such team/group assignments yield minimal benefits in preparing students for a highly collaborative future workforce. Therefore, this study explores how the choreography of the formative design studios can stimulate collaborative mindsets with a heterarchical culture.
This paper reports on the first stage of a three-year longitudinal research contextualised within the walls of architecture first-year’s studios. This studio pedagogy study departs from the prescriptive OOO Master-and-Apprentice (M&A) model predicated on the dispensation of answers, to the experimented Collaborative Team Learning (CTL). CTL is conceived as a discursive model helping students to navigate through design studios’ pedagogy of uncertainties by exploiting formative design reviews to intrinsically inculcate collaborative mindsets and communication skills through the building up of teamwork/relationships. CTL tutors actively induce discussions in encouraging students to cross- pollinate and collaborate (even) on their individual design projects. The research aims to investigate relationships of students’ academic performances with their learning experiences in both CTL and the OOO formative design reviews and student’s self-reflective efficacy of their self-directed learning (SDL) peer-to-peer P2P discussions (without the tutors’ facilitation). Drawing relationships from the quantitative data from both pedagogical frameworks validate the proposition of CTL’s learning environment yielding beneficial academic outcomes and suggest the instilment of collaborative attitudes. SDL CTL student’s outperformance against their OOO counterparts suggests that they have modelled cross-pollinative prompts and conversations of the design tutor. Regrettably, the statistical relationship between SDL students on their self-perception on the efficacies of their SDL P2P discussions and their academic performance is revealed to be weak. It is speculated that when students are required to make mental assessments in rating their peer’s effectiveness (externally) with themselves’, their accuracies of readings and reflections may be debated (Sarin & Headley, 2002; Newcomer, 2011). This study contributes to a limited body of research discoursing the outcomes of collaborative studio pedagogy in understanding challenges towards measuring collaborative mindsets in design education.
2. Expanding influences of design and the democratised design processIncreasing global economic uncertainties and seismic cultural shifts will inevitably give rise to complex societal challenges and opportunities. With an imminent VUCA (volatility, uncertainty, complexity, and ambiguity) characterised Fourth Industrial Revolution, the humanistic ‘Empathy Economy’ will emerge (Dellot, Mason, & Wallace-Stephens, 2019) as a counterpoint to the Artificial Intelligence-driven workforce. One aspect of the Empathy economy expounds on the development of holistic user/consumer experiences (McDonagh, Woodcock & Iqbal, 2018) propelled through the expanding

1255
Two minds are better than one: Breeding collaborative mindsets for emerging design-led transdisciplinary practices
notions of ‘design’ in collaborative and design-led exploratory enterprises. Such design-led practices are projected to be increasingly sought after by an extended range of industries and public service agencies in creating strategic competitive advantages through the tapping on market potentials by transforming systems (of value exchanges), experiences and organisations (d'Ippolito, 2014; Suri, 2003; DSC, 2019).
In recent years, processes/outcomes of ‘Design’ had expanded its influence into non-ailed fields in the form of Co-design and Participatory Design. In particular, the ‘democratised’ co-design design methodology that engages the participation of non-designers is gaining momentum. Co-design believes in the impartation of necessary design skills and exploiting the sensitivities of non-designers (without design education) as end-users participating actively throughout the different stages of the design process (Sanders & Stappers, 2006). Co-design’s attitudes towards design bear a stark contrast from the closed system of the orthodox Master Designer dictating user’s needs and the creative process. Participatory Design, on the other hand, had been accused on occasions of projecting ‘tokenism’ as non- designers’ involvement were merely in the decision-making process (Lee, 2009). Co-design’s transdisciplinary approach had manifested itself in the form of Tim Brown’s IDEO’s Design Thinking (DT) and Roger Martin’s Business Design (BD) (Cupps, 2014). Gaining traction in the emerging ‘Empathy’ economy, BD’s design thinking framework of strategising of systems/relational engagements by seeking a balance between exploration and exploitation of the stakeholders (Martin, 2009). Various outcomes of DT and BD’s ‘democratised’ design methods often fall into the category of intangible domains such as organisational strategies and sustainable ecosystems driven by mutual value exchanges. The strength of such co-design methodology lies in the evidence-driven ethnographical (Fraser, 2012) processes of data collection and data sense-making, making this design methodology quintessential in developing human- centric services, products, and policies (Suri, 2003).
3. Declining influences and agencies of the Specialist Master DesignerWith the imminence of an increasingly precarious economy, it is curious about why both modus operandi and agencies of design practices of the built environment have remained lukewarm to such disruptions. The relevancies of architects’ role are in a steady decline (World Economic Forum, 2018) as they are often marginalised from the production of the built environment (Samuel, 2018; Bryant, Rodgers & Wigfall, 2019). The narrowed value-systems where outputs of architectural designs solely focus on tangible outcomes, prioritising on its formal expressions (Bryant et al., 2019) are being enculturated through the gates of academia into professional practice. Unless designers can articulate the values (not merely the subjective aesthetical qualities) of their designs, they will continue to see their influence and agencies diminishing. The imminent looming global uncertainties must stir up the designer’s impetus to innovate, to conjure up alternative modes of practice and to diversify their services (Hyde, 2012; Jamieson, 2011) in overcoming complex challenges.
The education of an architect and subsequently, the practice of architecture requires the formulation of coherent solutions from disparate information and complex requirements. Architectural practices, which straddles between the production of human-centred environment and objects, finds itself in an advantageous spot of diversifying its influence within the realms of design-led transdisciplinary practices. Architects, being equipped with ‘empathetic’ design methodologies considering the end-users in mind, are in a prime position to export their design expertise, spatial, narrative and strategic thinking into the design and strategising of the (sometimes) intangible ‘Business’ realm of organisational strategies and planning sustainable business ecosystems.

1256
Zhengping Liow
4. The siloed pedagogy in a socialised and self-directed design studioDesign studios within academies are lively, socialised (Olweny, 2013) informal environments for learning. Architecture/design learners are frequently observed to remain in studios after their scheduled studio hours discussing their designs in-progress with their peers without the tutor’s guidance. Being self-directed does not mean that their learning is in isolation. Learners work in self-directed manners while engaged in group-learning settings (Brookfield, 2009). DeGregori (2007) noted that the social aspects of building supportive friendships in design studios are vital aspects of students’ growth. Having peers’ active engagement in the students’ design process helps to ignite and sustain learners’ passion for their work (Perrewé, Hochwarter, Ferris, McAllister, & Harris, 2014). Our faith in the OOO pedagogy has failed to continually strengthen the instilment of their collaborative mindset and capitalise on the socialised learning environment. The tutor-centric (Goldschmidt, 2002) OOO M&A pedagogy results in missed opportunities in capitalising on the communal cross-pollinative processes of the design that closely mirrors the characteristics of successful millennial startup enterprises (Sollohub, 2019).
Despite progressing towards a highly collaborative future workforce, learners are still ubiquitously working on individual design projects supported with the OOO M&A mode of desk crits (Goldschmidt et al., 2010; Liow, 2016). Recognising the importance of inculcating students’ interpersonal and critical thinking skills (Dochy, Segers, & Sluijsmans, 1999; Gokhale, 1995), design educators sporadically structure team/group assignments within the curriculum design. However, differences between group work and teamwork remain ambiguous. Tucker (2016) clarified that in teamwork, students jointly work on a joint project where members actively contribute to team cohesion and task achievement. In groupworks, students worked separately on different aspects of a project/task, combine their work and often with little attempts at integration. Learners are both likely to adopt a 'divide and conquer' strategy with sharing a unified submission and academic outcome (McPeek, 2009; Pawson, 2016).
5. The experimental Collaborative Team Learning: a broad picture
Figure 1. Comparisons of the orthodox group work model and the experimental CTL model.
The experimental CTL pedagogical framework differs from the ‘Divide and Conquer’ cooperative approach of working in teams and attempts to intrinsically build relationships by having first-year students select their own CTL peers with a fixed pairing of the design tutor (illustrated in figure 1). This arrangement extends throughout the entire academic year. This pairing allows time for the CTL learners to cultivate relationships with one another and with their tutors to develop a safe learning environment. Students can be enculturated to normalise their day-to-day ‘failures' of their design process in a

1257
Two minds are better than one: Breeding collaborative mindsets for emerging design-led transdisciplinary practices
trustworthy CTL environment where constructive peer-to-peer feedback are likely to surface. The tutor actively orchestrates and stimulates formative design review conversations in a heterarchical learning environment. CTL departs from the paradigm of a tutor-centric M&A OOO model where tutors act as an enabler to engage students in cross-pollinative discussions while working on their individual designs.
6. Research design and method of analysisEven as collaborative projects are widely lauded as useful learning models, the highly siloed pedagogy remains an impediment in design education. In this research, both CTL and OOO students attended lectures highlighting the importance of collaboration. However, only CTL learners are being guided collaboratively in their design studios. 16 students were facilitated with CTL, while 19 students are taught in the traditional OOO format. A teaching ratio of 1:14 is maintained throughout all studios with eight hours per week over one academic year with the cohort working on the same design brief and deliverable. All students were evaluated in a review panel comprising of 4 to 7 first-year tutors using a joint assessment rubric accessing their creativities/resolutions of their design intentions, strategies and technical aspects. Tutors’ scores were averaged and moderated to determine students’ final grades.
The overall research is conceptualised as a ‘sequential’ mixed-method methodology with the initial stage aiming to verify the phenomenon of collaborative behaviour through the analysis of quantitative data, followed by a qualitative investigation in the second stage to expand the findings with detailed explorations with the cases or individuals (Creswell & Clark, 2017). This paper presents quantitative data from the first stage of the study of an academic year. Stage one’s objectives of this 3-year longitudinal research sought to investigate relationships of students’ academic performances with their learning experiences in both CTL and the individualistic OOO desk reviews and student’s self-reflective efficacy of their SDL P2P discussions (without the tutors’ facilitation). Due to a difference in the sample size, Inferential statistics (rather than Descriptive statistics) are carried out as to negate the effects of potential ‘outliers’ in distorting the accuracies of the results. An Independent T-Test in Microsoft Excel will infer if the discrepancies between two means are significant with the Probability (P-Value) level by testing the trend to reveal the significance of correlation (Adeyemi, 2009). A significant difference can be validated when the resulting P-value is less than 0.05.
6.1. Research questions, hypothesis and method
This study aims to investigate relationships between students’ studio pedagogical framework with their first year’s academic performance and SDL P2P students’ academic scores with their self-reflective ratings as to ascertain their non-cognitive development of collaborative mindsets. The following research questions are conceived to guide this research.
RQ1: Will there be a significant statistical difference in students ' academic scores and their studio learning experiences amongst learners in the CTL setting as opposed to their OOO counterparts?
RQ2: Since both CTL and OOO students are already self-directing their learning outside of studio hours, would CTL students have benefited (both academically and in the development of collaborative mindsets) from the CTL experience?
For RQ1, it is hypothesised that CTL students immersed in CTL’s learning environment would enjoy an improved learning experience and thus, outperform their OOO peers academically. For RQ2, it is hypothesised that learners would acquire and develop collaborative mindsets through the non- hierarchical CTL pedagogy and apply these traits confidently/effectively in their SDL P2P discussions.

1258
Zhengping Liow
6.1.1. Method to Answer RQ1 [Academic performance and learning experience of SDL students]
Upon the conclusion of the academic year, students were invited to fill in a paper-based questionnaire and assured that their participation was voluntary and would not affect their grades. The first question measures learners’ self-internalised studio learning experience, which is not dictated by themselves nor their peers but on how tutors choreographed the design reviews. Students fill up a 5-Likert scale from (1) very negative, (3) neutral to (5) very positive at the end of both semesters. The final rating is a combined tally from both ratings with an overall score of 10. They are guided with these four questions.
• Q1: Do you feel at ease to voice opinions to your tutor and friends? Are your views being valued? • Q2: After the tutorials, do you have a clearer idea of how to proceed with your design?• Q3: Do you feel that you have received sufficient guidance (not at the expense of the tutor
providing the solutions for you)? • Q4: Has this semester’s learning has been explorative, encouraging and engaging?
The first Independent Samples One-Tailed T-test will determine if there is a significant difference instudent’s academic performance between OOO and CTL learners. The second T-test seeks to investigate statistical differences in the rating of their learning experience. The relationships of both resulting P- values will aid in the support/refute of the premise of students achieving higher academic grades and thus, primarily correlate (statistically) with students’ learning experience in their respective studios.
6 1.2. Method to Answer RQ2 [Self-measured effectiveness in students’ SDL P2P collaboration]
The second question identifies self-directed learners by having students answering ‘Yes’ if they have met up with 2-3 peers to discuss their designs-in-progress at least three times per week outside allocated studio contact hours without the tutor’s facilitation. For learners who had revealed that they have frequently engaged these SDL P2P discussions, they will attempt the last question. The final question measures learners’ externalised learning experience during their SDL P2P cross-pollinative consultations by managing their own design collaborative discussions. These SDL students will self-reflect and on how effective their P2P sessions were through the set of questions (incremental in nature).
• The discussions with my friends often went off the tracks and my tutor was not impressedby my progress. (1 point)
• Discussion with my friends went okay most of the time. The tutor was not too sure that the progress was in the right direction. (2 points)
• The discussions with my friends went smooth most of the time. We came out with various solutions. Tutors had positive comments on how the design can be improved. (3 points)
• The discussions with my friends were often fruitful, helping one another’s design, and the tutor seemed encouraged by the progress my friends and I had discussed. (4 points)
The first Independent Samples One-Tailed T-test will determine if there is a significant difference in student’s academic performance between OOO and CTL SDL P2P students. The second T-test investigates for statistical differences in their self-reflected SDL P2P experience rating. The relationship of both resulting P-values will aid in the support/refute the premise that CTL SDL learners are more effective in their P2P sessions suggesting the inculcation of collaborative mindsets. This speculated statistical relationship would be triangulated and investigated during the subsequent stage of the research with qualitative focus groups interviews to achieve a clearer idea of this phenomenon.

1259
Two minds are better than one: Breeding collaborative mindsets for emerging design-led transdisciplinary practices
7. Results and discussions19 OOO students (11 males and 8 females) and 16 CTL students (11 males and 5 females) participated in this study of which 16/19 (84.2%) OOO and 13/16 (81.3%) CTL students revealed that they are actively collaborating in SDL P2P discussions. With both T-tests, first-year students’ final academic results are as yardsticks of measurement in drawing relationships to answer both research questions.
7.1. Learning experience and academic performance (RQ1)
Table 1a & 1b. Data Table of students’ scores & learning experience(L) & T-Test 1 & 2 (R).
The mean scores for CTL students of 77% are reflected to have outperformed their OOO peers of 69.5%. The significant difference in their means is being validated by the P-value of 0.0005 in T-test 1 (less than 0.05) and thus, supported the hypothesis that CTL learners had academically excelled against their OOO peers. For T-test 2, CTL students’ mean reading for their studio experience stands at 8 while the OOO group stands at 7.05. The P-value of 0.019 validates the notion that CTL’s learners are finding their learning experience positive. As hypothesised, CTL students develop positive collaborative experiences and outperform OOO learners academically. Even with a positive statistical association, this insight is not entirely conclusive and will seek to verify these assertions in the qualitative second stage of this study.
7.1.1. Discussion
Newly enrolled design students depart from the certainties of the algorithmic-driven STEM-based high school subjects and starting their journey amidst the uncertainties of design education with a clean slate. This ‘re-boot’ gives rise to opportunities to inculcate desired collaborative behaviour and continually shaped through positive reinforcement in CTL studios from the very outset. Both T-tests validates benefits of CTL’s tutor’s constant drawing of cross-pollinative discussions from students capitalising on the dynamics of team learning. As first-year learners assimilate into the heterarchical pedagogical framework of CTL, they develop inclinations of having open discussions that seem to contribute to their positive studio experiences. Contrary to the individualistic OOO studio environment (Liow, 2016), CTL’s friendly competition keeps learners motivated during trying times. Exchanges of constructive criticisms in an intimate setting without the fear of offending their peers are valued. Students’ struggle with the uncertain design process seemed to have normalised with the CTL system

1260
Zhengping Liow
which reinforces peers’ involvement, unlike the prescriptive and authoritative OOO M&A pedagogy. This result suggests that CTL is a viable studio pedagogical method to alleviate the rising stress of an international trend of funding cuts resulting in the decrease of OOO studio contact time.
7.2. Self-reflected ratings of students’ SDL P2P sessions and academic performance (RQ2)
Table 2a & 2b. Data Table of students’ Scores & SDL P2P reflective ratings(L) & T-Test 1 & 2 (R).
The mean scores for SDL CTL learners at 77.8% outperformed their OOO peers’ 71.3%. The significant difference in their means is validated by the P-value of 0.0018 of T-test 1 supports the hypothesis that SDL CTL students had fared better. CTL students’ mean readings of their self-reflective efficacies in their SDL P2P discussions of 3.84 is around their OOO counterparts of 3.68. However, T-test 2’s P-value of 0.24 (more than 0.05) rejects the hypothesis that the differences in their means are statistically significant. The hypothesis of CTL SDL students’ cultivating collaborative mindsets in their SDL P2P discussions (validated through their self-reflected confidence and perceived ‘success’) can therefore be rebuffed even though CTL SDL learners had academically excelled against their OOO SDL peers.
7.2.1. Discussion
With SDL CTL students’ outperformance of their SDL OOO peers in T-Test 1, T-Test 2’s rejection of the alternative hypothesis (of SDL CTL learners’ development in the confidence/efficacies during their SDL P2P collaborations through their CTL experience) is surprising. Educational researchers have long been puzzled about the validities/accuracies of conducting externalised (involving accessing peers’ contributions and behaviours) students’ self-evaluative measurements reflecting on their efficiencies in group/teamwork scenarios. To test the validity of students’ self-assessments, researchers conducted correlation test between their self-evaluation and academic performances (Sarin et al., 2002; Newcomer, 2011) and have unanimously concluded that self-assessments are neither excellent predictors of performance nor justified for use in summative assessment. Both Sarin et al. (2002) and Brown, Andrade & Chen (2013) recorded weak positive correlations between student self-ratings and other measures. Some students provide a depressed self-evaluation as they do not want to be reckoned as someone with inflated egos or, due to cultural practices such as self-effacement (Kwok & Lai, 1993). The validation of self-assessment reports is also highly depended on the academic calibre as high achieving learners are revealed to possess a higher ability to perform self-assessments as compared to

1261
Two minds are better than one: Breeding collaborative mindsets for emerging design-led transdisciplinary practices
low performing peers (Sarin et al., 2002). Even with an unfavourable P-value for T-test 2, T-test 1’s positive validation of SDL CTL’s academic outperformance suggests that their SDL P2P collaborations are deemed to be effective. It is speculated that SDL OOO learners’ positive reflections of their self- perceived SDL P2P sessions’ efficacy might have been falsely equated emotionally with their laborious SDL P2P experiences. While design learners are reported to have struggled with the decision-making process without a tutor (Ghassan & Bohemia, 2015), CTL students appear to have overcome this challenge by academically excelling against their SDL OOO peers.
8. ConclusionWith the emergence of the ‘knowledge’ and ‘empathy’ economies projected to rise over disruptions in an increasingly uncertain world, the dependences on the trading of physical commodities are no longer sustainable. Dogmatic design cultures of the Master Designer dispensing design solutions must progressively shift to varying 'democratised' models of transdisciplinary design-led practices in the future. Capitalising on ethnographical data sense-making and involving non-designers as co-creators have placed greater importance on having collaborative traits desirable for future practices. The outdated notion of the Master Designer as the sole decision-maker without considering the real needs of end-users perpetuates in academia and subconsciously enculturates into professional practice (Banham, 1990). This research stimulates an utmost urgency for design educators to conceive an appropriate studio pedagogical cultures that support tomorrow’s collaborative practising models.
This paper reports the first stage of a longitudinal study aiming to unearth quantitative outcomes from leaners’ immersing in the CTL studio. CTL aims to instil collaborative mindsets by having shifting the tutor’s role of an instructor to a neutral enabler, actively orchestrating cross-pollinative formative review discussions in a heterarchical team-based scenario. Within the socialised environment of the studio (Olweny, 2013), CTL students are projected to model collaborative behaviour and construct feedbacks for their peers in their SDL P2P discussions without the assistance of the tutor. As hypothesised, CTL learners academically outperform OOO students. However, a subsequent inferential T-test failed to support the notion that SDL CTL’s outperformance against SDL OOO learners can be attributed to SDL CTL students having cultivated collaborative mindsets. It is speculated that students’ laborious P2P experiences may not necessarily equate to their self-perceived effectiveness.
Despite the emergence of a collaborative economy where design-led transdisciplinary practices would assume significant roles in the future, our siloed M&A studio pedagogy remains curiously unchallenged. Design educators need to reconsider weaving collaborative moments into the studio pedagogy to remain relevant. With CTL’s inclusive pedagogy, tutors spur the development of students’ agencies and non-cognitive skills in empowering them for an increasingly precarious future.
References Adeyemi, T.O., 2009. Inferential statistics for social and behavioural research. Research Journal of Mathematics and
Statistics, 1(2), pp.47-54. Banham, R., 1990. A Black-Box-The Secret Profession of Architecture. New Statesman & Society, 3(122), pp.22-25. Brookfield, S.D., 2009. Self-directed learning. In International handbook of education for the changing world of work
(pp. 2615-2627). Springer, Dordrecht. Brown, G.T., Andrade, H.L. and Chen, F., 2015. Accuracy in student self-assessment: directions and cautions for
research. Assessment in Education: Principles, Policy & Practice, 22(4), pp.444-457. Bryant, C., Rodgers, C. and Wigfall, T. eds., 2019. New Modes: Redefining Practice. John Wiley & Sons.

1262
Zhengping Liow
Creswell, J.W. and Clark, V.L.P., 2017. Designing and conducting mixed methods research. Sage publications. Cupps, E.J., 2014. Introducing transdisciplinary design thinking in early undergraduate education to facilitate
collaboration and innovation. DeGregori, A., 2007. Learning environments: Redefining the discourse on school architecture. Dellot, B., Mason, R. and Wallace-Stephens, F., 2019. The Four Futures of Work: Coping with uncertainty in an age of
radical technologies. RSA. Available online: https://tinyurl.com/y9ggdyer (accessed on 24 September 2019). Design Singapore Council. 2019. Design Education Review Committee Report. d'Ippolito, B., 2014. The importance of design for firms' competitiveness: a review of the literature. Technovation. Dochy, F.J.R.C., Segers, M. and Sluijsmans, D., 1999. The use of self-, peer and co-assessment in higher education: A
review. Studies in Higher education, 24(3), pp.331-350. Fogarty, R. and Pete, B.M., 2010. The Singapore vision: Teach less, learn more. 21st century skills: Rethinking how
students learn, pp.97-116. Fraser, H.M., 2012. Design works: How to tackle your toughest innovation challenges through business design.
University of Toronto Press. Ghassan, A. and Bohemia, E., 2015. Amplifying learner's voices through the global studio. IN: Tovey, M.(ed.) Design
Pedagogy Developments in Art and Design Education, Abingdon. Gokhale, A.A., 1995. Collaborative learning enhances critical thinking. Goldschmidt, G., 2002, September. One-on-one: A pedagogic base for design instruction in the studio. In Proc.
Common Ground, Design Research Society Int. Conf (pp. 430-437). Goldschmidt, G., Hochman, H. and Dafni, I., 2010. The design studio "crit": Teacher-student communication.
Artificial Intelligence for Engineering Design, Analysis and Manufacturing: AI EDAM, 24(3), p.285. Hyde, R., 2012. Future practice: Conversations from the edge of architecture. Routledge. Jamieson, C., 2011. The Future for Architects?, RIBA Kimbell, L., 2011. Rethinking design thinking: Part I. Design and Culture, 3(3), pp.285-306. Kwok, D.C. and Lai, D.W., 1993. The Self-Perception of Competence by Canadian and Chinese Children. Lee, Y., 2008. Design participation tactics: the challenges and new roles for designers in the co-design process. Co-
design, 4(1), pp.31-50. Liow, Z., 2016. Studio Pedagogy’s Operative Framework for the 4th Industry Revolution. In Proc. Project to Practice:
Innovating Architecture Int. Conf. Martin, R., 2009. The design of business: Why design thinking is the next competitive advantage. Harvard Press. McDonagh, D., Woodcock, A. and Iqbal, S., 2018. Experience+ Experience+ Experience= Empathy. Design for health. Newcomer, J.L., 2011. Investigating the Validity of Students’ self-Assessments of Their Ability in Statics. McPeek, K.T., 2009. Collaborative design pedagogy: A naturalistic inquiry of architectural education. Texas A&M. Olweny, M. R., 2013. Socialisation in Architecture Education. In Proc. AAE Conference 2013 conf. Pawson, A., 2016. Collaborative Learning in Design Education Value of Collaboration and Collective Experience. The
International Journal of Design Education, 10(3), 66-72. Perrewé, P.L., Hochwarter, W.A., Ferris, G.R., McAllister, C.P. and Harris, J.N., 2014. Developing a passion for work
passion: Future directions on an emerging construct. Journal of Organizational Behavior, 35(1), pp.145-150. Price, C. and Hardingham, S., 1984. Cedric Price. Architectural Association. Samuel, F., 2018. Why architects matter: Evidencing and communicating the value of architects. Routledge. Sanders, E.B.N. and Stappers, P.J., 2008. Co-creation and the new landscapes of design. Co-design, 4(1), pp.5-18. Sarin, S. and Headley, D., 2002. Validity of student self-assessments. In Proc. 2002 American Society for Engineering
Education Annual Conference & Exposition. Sollohub, D., 2019. Millennials in Architecture: Generations, Disruption, and the Legacy of a Profession. Uni of Texas. Suri, J.F., 2003. The experience of evolution: developments in design practice. The design journal, 6(2), pp.39-48. Tan, J.P.L., Choo, S.S., Kang, T. and Liem, G.A.D., 2017. Educating for twenty-first-century competencies and future-
ready learners: research perspectives from Singapore. Till, J., 2019. Solidarity and freedom. Spatial Practices: Modes of Action and Engagement with the City. Tucker, R. ed., 2016. Collaboration and Student Engagement in Design Education. IGI Global. World Economic Forum, 2018. The future of jobs report 2018. Geneva: World Economic Forum.

1263
The 54th International Conference of the Architectural Science Association (ANZAScA) 2020
Understanding resilience in the built environment: Going beyond disaster mitigation
Sameh Shamout1, Paola Boarin2, Sandeeka Mannakkara3, 1,2,3The university of Auckland,
[email protected] [email protected] [email protected]
Abstract: Although introducing the resilience concept into the built environment context occurred relatively late compared to other disciplines, it has been rapidly gaining ground in urban-related studies. Understanding resilience is necessary to achieve the 2030 agenda for sustainable development as it explicitly acknowledges resilience through two of the SDGs and a range of the SDGs’ targets. There are many definitions for resilience, but there is no universally accepted one yet. Many scholars define the concept of resilience in the built environment with a particular focus on disaster resilience, such as natural disaster challenges. In contrast, others emphasise stresses that disturb the normal life status in cities. This paper aims to establish a better understanding of how to contextualise resilience in the built environment. It first discusses the evolution of the resilience theory from different levels of analysis. It then identifies common keywords used when defining resilience through word-frequency analysis; it analyses 100 definitions of resilience using the software NVivo 12. A conceptual diagram is then developed using those keywords to establish a broader theoretical approach of resilience in the context of the built environment, which is beyond the traditional disaster mitigation approach.
Keywords: Resilience; built environment; adaptation; urban development.
1. IntroductionOver half of the world’s population live in urban areas nowadays, particularly in cities, and the vulnerability of cities has increased due to the high complexity of problems they are facing at all levels: physically, economically, socially and ecologically. Although many cities that have survived for centuries showed resilience against many challenges such as natural disasters and conflicts, enhancing the resilience of cities should become a priority as many other new global challenges have emerged, particularly climate change (Da Silva and Morera, 2014). The resilience concept has attracted a growing interest in public policy globally in recent years as a response to many emerging challenges, such as resource shortages and climate change (Adger et al., 2011; Shamout, Boarin and Wilkinson, 2021). Resilience has become an "impotent buzzword" likened to the reaction encountered by the term sustainability (Saunders and Becker, 2015). In the 2030 Agenda for Sustainable Development (United Nations, 2015), resilience is explicitly acknowledged in two dedicated Sustainable Development Goals (SDGs) (9 and 11) and in a range of the SDGs’ targets (1.5, 2.4, 9.1, 9.a, 11.b, 11.c, 13.1 and 14.2). Introducing the resilience concept into the context of the built environment occurred relatively late compared to other disciplines. However, it has been rapidly gaining ground in urban-related studies (Meerow and Newell, 2019), where it is significantly present in the context of hazards and climate change (Beilin and Wilkinson, 2015). In the context of the built environment, many researchers investigate how resilience can be used as a tool for development in urban planning (Moraci et al., 2018;
Imaginable Futures: Design Thinking, and the Scientific Method. 54th International Conference of the Architectural Science Association 2020, Ali Ghaffarianhoseini, et al (eds), pp. 1263–1272. © 2020 and published by the Architectural Science Association (ANZAScA).
1264
Sameh Shamout, Paola Boarin, and Sandeeka Mannakkara
Shamout, Boarin and Wilkinson, 2021) and architecture (Wilson and Lazarus, 2017). In this paper, the term 'built environment' refers to man-made stocks including neighbourhoods, cities, infrastructure and buildings, that all constitute the natural, physical, economic, cultural and social capital, and it may also address the relationships between the unbuilt and the built (Hassler and Kohler, 2014).
Going back to the SDGs, Goal 9 aims to “build resilient infrastructure” while goal 11 seeks to “make cities and human settlements inclusive, safe, resilient and sustainable” including buildings to be more resilient (United Nations, 2015). Resilience and sustainability can be somehow related. Some consider them to be similar concepts (e.g. (Tobin, 1999)), while others claim they are not related, depending on the context (Shamout, Boarin and Wilkinson, 2021). Godschalk (2003), for example, defines resilient cities as sustainable networks of physical systems and human communities, where human communities are the social element of the city, and physical systems are the built environment element which includes buildings, roads and infrastructure. In the context of buildings, the resilient design can be associated with adaptation to changing conditions, which are resulting from different factors such as earthquakes (Samadian et al., 2019) and the changing climate where climate adaptation aims to reduce climate risk and vulnerability in the built environment (Grynning, Emil and Lohne, 2017; Lisø, Kvande and Time, 2017; Shamout, Boarin and Melis, 2019). In general, resilience can have many interpretations when it applies to the built environment, whether at a city-scale or a building scale. It is a contested concept that is capable of being used, deployed and mobilised by different groups of people in different ways (MacKinnon, 2015). Therefore, it is essential to understand what resilience can mean when it comes to the built environment. The aim of this paper is to develop a meaningful idea of resilience as related to the built environment and, therefore, contribute to the body of knowledge in this field through discovering and analysing the various definitions of resilience pertaining to ecology, society, individual, cities and buildings, and building on all those definitions to come up with a conceptualisation that may be less controversial. If the resilience concept is to be put in a meaningful way to work as a tool for development in the built environment, then it is needed to understand a holistic approach of resilience that combine the different points of views that exist in the literature and practice to be able to define what is that we are trying to foster to achieve resilience.
2. MethodThis paper is mainly based on a literature review, supported by word-frequency method. The article reviews several definitions of resilience and identifies the most repeated key terms by analysing 100 definitions of resilience using word-frequency analysis. The software NVivo 12 is used for the word- frequency analysis to identify shared concepts in those definitions. The analysed definitions are found in sources of peer-reviewed academic research, industry and policy literature, starting from the first time the concept of resilience was defined in ecology (Holling, 1973) until today. Data sources are selected based on a search of a number of keywords, resilience; definition; urban resilience; city resilience, on three main web search engine, ScienceDirect, Scopus and Google Scholar. As the initial searches resulted in a large number of sources, so there was a need to find some key sources that can help obtain more relevant publications/reports for this study. The following are some of the main sources that helped in finding more relevant sources that include definitions of resilience:
• “Trends in Urban Resilience” (UN-Habitat, 2017); a recent UN-Habitat report that revieweddefinitions of resilience by global resilience actors including united nations bodies and theEuropean Union Network, the 100 Resilient Cities programme bodies, the United Kingdom

1265
Understanding resilience in the built environment: Going beyond disaster mitigation
Department for International Development Network and other global actors such as the International Federation of Red Cross and Red Crescent Societies.
• “From resilience to resourcefulness: A critique of resilience policy and activism” (MacKinnonand Derickson, 2013); a peer-reviewed journal article that reviewed definitions of resilience.
• “Defining urban resilience: A review” (Meerow, Newell and Stults, 2016); a peer-reviewedarticle listed 25 major urban resilience definitions identified by citation count and their subject area.
• "Resilience to nature's challenges short-term project working paper, delivery 1, resiliencebenchmarking & monitoring review" (Stevenson et al., 2015); a disaster resilience-focused report that is part of the National Science Challenges funded by The New Zealand Government.
• “Community resilience as a metaphor, theory, set of capacities, and strategy for disasterreadiness” (Norris et al., 2008); a peer-reviewed journal article reviewed severalrepresentative definitions of resilience from different levels of analysis.
59% of the 100 definitions of resilience analysed in this study come from sources published between 2011 and 2020 and 32% come from publications between 2000 and 2010 (Figure 1), and therefore, indicating the increasing attention to defining resilience in academia, industry and policy especially in the last two decades. After collecting 100 definitions of resilience form relevant sources and analysing them, a simple conceptual diagram is then developed using the common keywords that are defined in this study to establish and visualise a comprehensive understanding of resilience in this context.
Figure 1: The 100 definitions of resilience that were analysed in this study, divided into four main categories based on the year of publication.
3. The evolution of the resilience theoryResilience is a broad concept with various definitions and applications across several academic fields. The idea of resilience has roots in physics and mathematics, where it refers to the capacity of systems or materials to recover their shapes following disturbance or displacement (Norris et al., 2008). Resilience was first defined and discussed in ecology (Holling, 1973) and psychology (Coutu, 2002). Later, resilience was applied to many other fields such as societies (Longstaff et al., 2010), engineering systems (Robbins et al., 2012), organisations (Gilbert, Eyring and Foster, 2012), and biology (Kitano, 2004) (known as biological robustness). Table 1 shows a selected range of definitions spawned from subsequent applications with different levels of analysis from physical to ecological systems, individual, social, communities, urban, infrastructure and city systems and down to the scale of buildings.

1266
Sameh Shamout, Paola Boarin, and Sandeeka Mannakkara
Table 1: Selected definitions of resilience. Source: adapted and extended from (Norris et al., 2008).
Author/s Level of analysis Definition (year, page)
Holling Ecological (1973, p. 14)
“A measure of the persistence of systems and of their ability to absorb change and disturbance and still maintain the same relationships between populations or state variables.”
Gordon (1978, p. 90) Werner, 1984 cited in
Physical “The amount of strain energy which can be stored in a structure without causing permanent damage to it.”
“The ability to recover from or adjust quickly to sustained life stress or
(Brown and Kulig, 1996, p. 31) Egeland
Community misfortune.”
“The capacity for successful adaptation, positive functioning, or
(1993, p. 517) Individual
competence…despite high-risk status, chronic stress, or following prolonged or severe trauma.”
Adger (2000, p. 347) Alberti et al.
Social “The ability of groups or communities to cope with external stresses and disturbances as a result of social, political and environmental change.” “. . . the degree to which cities tolerate alteration before reorganising around a
(2003, p. 1170) Godschalk
Urban new set of structures and processes.”
“A sustainable network of physical systems and human communities.” “During
(2003, p. 137) City a disaster,” both the physical system and community networks “must be able
to survive and function under extreme stresses… and unique conditions.” “A resilient built environment should be designed, located, built, operated and
Bosher (2008, p. 13)
built environment
maintained in a way that maximises the ability of built assets, associated support systems (physical and institutional) and the people that reside or work within the built assets, to withstand, recover from, and mitigate for, the impacts of extreme natural hazards and human-induced threats.”
Leichenko (2011, p. 164)
urban “. . . the ability . . . to withstand a wide array of shocks and stresses.”
Tyler and Moench (2012, p. 312)
Hughes et al. (2014, p. 7).
Da Silva et al.
urban climate adaptation
Transportation
“An approach based on resilience encourages practitioners to consider innovation and change to aid recovery from stresses and shocks that may or may not be predictable.” “The concept of resilience is wider than natural disasters and covers the capacity of public, private and civic sectors to withstand disruption, absorb disturbance, act effectively in a crisis, adapt to changing conditions, including climate change, and grow over time.” “The capacity of cities to function, so that the people living and working in cities
(2014, p. 3) City
ISO standards
– particularly the poor and vulnerable – survive and thrive no matter what stresses or shocks they encounter.” “Adaptive capacity of an organisation in a complex and changing environment”
(2016, pp. 1– 2)
U.S. Green Building Council (2018, p. 103)
Community and infrastructure
Buildings
or “the capability of a system to maintain its functions and structure in the face of internal and external change and to degrade gracefully when this is necessary.” “Both mitigation (carbon pollution reductions) addressing the need to prevent near term irreversible unmanageable dangerous climate change (climate bubble/crash), and adapting to the increasing intensified weather and climate events causing well-documented systemic damages to all economic.”

1267
Understanding resilience in the built environment: Going beyond disaster mitigation
The relevant literature identifies a number of universal characteristics of resilience or as can be called dimensions, measures and principles of resilience. The technical terms of the principles of resilience and the methods of grouping these principles might differ from one researcher to another according to the context in which resilience is used. Among these principles are: reflective, robust, redundant, flexible, resourceful, inclusive and integrated (Da Silva and Morera, 2014, p. 5). According to the definition of Thomas O’Rourke, the four main pillars of resilience are: robustness, redundancy, resourcefulness and rapidity, and these definitions may overlap with capacity, tolerance and cohesiveness (Wilkinson. S, 2014; Stevenson et al., 2015). Categorising and defining these principles and dimensions is essential in the context of the built environment, as they can be used to build the broad framework elements from which practical and meaningful measures can then be developed.
4. Findings of word frequency analysis on 100 resilience definitionsResults show the shared concepts that appear the most in the definitions of resilience analysed in this study. Although most of the definitions of resilience are defined within a specific context and contested (Romero-Lankao et al., 2016). Therefore, the 100 definitions used in this study either are related to the built environment or have been cited in urban-related studies, as the scope of this study focuses on the built environment context. By looking at the 30 most frequent words used in the definitions of resilience (Table 2), some reflections can be concluded:
• Six terms may refer to socio-ecological systems, which are communities, city, structures,climate, urban and social. This socio-ecological approach of resilience deals with the recovery process as a unique opportunity for innovation to transform the previous state of the system to a new system with new goals and objectives (Yamagata and Maruyama, 2016). Davoudi et al. (2012) indicated the socio-ecological resilience approach as 'evolutionary resilience'. Asocial-ecological system can be defined as an adaptive, multi-scaled, complex system thatincludes biophysical (ecological) and humans (social and cultural) subsystems in a mutualinteractive way (Gallopín, 2006; Walker and Salt, 2006), and therefore an applicable definition to city systems (Davoudi, Brooks and Mehmood, 2013). This view enhances the recognition of the significance of ecological considerations.
• Five words may refer to verbs that express a reaction, which are adapt, recover, absorb,withstand, respond and maintain.
• Seven words refer to something negative happening, an action that requires a reaction; whichare stresses, shocks, disturbance, disaster, hazards, events and disruption. Most definitionsdo not only refer to something that happens suddenly any more like a shock or a disaster,rather the word ‘stress’ has been used slightly more than the word ‘shock’, which was not the case when the concept of resilience emerged in the built environment context in the 2000-2010 decade. In the 2011-2020 decade, many global actors of international organisations and initiatives adopted the resilience concept to drive change in the global built environment (UN- Habitat, 2017). Many definitions of resilience had a particular focus on disaster resilience,such as natural disaster challenges (Mileti, 1999; Godschalk, 2003; Bosher, 2008; Cutter et al., 2008; UNISDR, 2010). While we can still find definitions that considered stresses in thatperiod, the disaster resilience approach was more dominant. Nowadays, resilience definitions are giving equal importance to chronic stresses alongside with shocks that might disturb the normal life status in cities (Tyler and Moench, 2012; Da Silva and Morera, 2014; Hughes andHealy, 2014).

1268
Sameh Shamout, Paola Boarin, and Sandeeka Mannakkara
Two words refer to being able to do somethings, which are ability and capacity, where theword 'ability' is the top used term, and 'capacity' is fifth.
Two other words refer to the need for action to change the current state to a new state,which is change and transform. This highlights the importance of changing somethings inthe built environment systems to be 'be able', which is opposite to thestructural/engineering resilience approach that restores the system to its original state(Yamagata and Maruyama, 2016). Therefore, this approach may not apply to the builtenvironment and the urban literature.
Other words refer to performance in regards to time and efficiency, which are effectivelyand quickly, indicating that what makes a built environment more resilient than anotherone is how quick and effective it can adapt or recover to reach the new resilient state.
Table 2: The 30 most frequent words in the definitions of resilience analysed in this paper.
Word Length Count Weighted
Similar Words
Percentage (%) ability 7 60 3.98 ability system 6 52 3.45 system, systemic, systems adapt 5 34 2.25 adapt, adaptable, adaptation, adapting, adaptive change 6 33 2.19 change, changes, changing capacity 8 31 2.05 capacities, capacity recover 7 29 1.92 recover stresses 8 29 1.92 stress, stresses shocks 6 25 1.66 shock, shocks functions 9 23 1.52 function, functionality, functioning, functions communities 11 21 1.39 communities, community absorb 6 20 1.33 absorb, absorber’ disturbance 11 20 1.33 disturbance, disturbances city 4 20 1.33 cities, city disaster 8 18 1.19 disaster, disasters hazards 7 18 1.19 hazard, hazardous, hazards withstand 9 16 1.06 withstand structures 10 15 0.99 structure, structures resilience 10 13 0.86 resilience, resilient respond 7 13 0.86 respond, responding events 6 12 0.80 event, events disruption 10 12 0.80 disruption, disruptions, disruptive impacts 7 12 0.80 impact, impacts maintain 8 12 0.80 maintain, maintained, maintaining transforming 12 12 0.80 transform, transformation, transformative, transforming climate 7 11 0.73 climate effectively 11 11 0.73 effectively, effects urban 5 11 0.73 urban quickly 7 10 0.66 quickly social 6 10 0.66 social state 5 10 0.66 state

1269
Understanding resilience in the built environment: Going beyond disaster mitigation
5. A conceptualisation of resilience in the built environmentOne way to make a concept clear is to visualise it. Figure 2 gives a visual representation of the relationship between the most common keywords mentioned above extracted from the definitions analysed in this paper and conceptualises them in the built environment context. The diagram is divided into two main sides, represented by two angled bold lines. The right side represents the terms used in the scenario of the ongoing stresses while the left side shows the terms used in the scenario of the sudden shocks. The two terms of the two main scenarios, stresses and shocks, are circled.
On the one hand, a particular built environment might have more shocks than stresses, such as a city exposed to frequent natural hazards like earthquakes or flooding. In this case, when addressing a particular adverse shock, for example, the definition of resilience in the built environment may include terms such as shocks, disasters, absorb, respond, survive, and recover, as shown in the left part of Figure 2. To make this clearer by using the terms in Figure 2, let us imagine an adverse event occurs in a particular built environment. This adverse event could be called a ‘shock’ as it may occur unexpectedly. If this shock or trauma is intense to a certain level depending on the context, it could be called a disaster or a disruptive disaster. The affected built environment needs to absorb this shock and respond in a certain way to beable to survive. After the disaster ends, the built environment area will need to recover.
On the other hand, terms such as stress, capacity, maintain, change, and adapt, as indicated in the right part of Figure 2, define the concept of resilience better, with regard to addressing particular problems (stresses) that chronically weaken the fabric of a city system or a building. This approach to resilience applies to another built environment that might have more continuous pressures than shocks, such as traffic congestion or lack of natural resources. To make this clearer using the terms in Figure 2, let us imagine that a specific built environment is suffering from chronic stresses. This kind of challenge can add chronic burdens to the functions of the city that might impede inhabitants' lives. Therefore, addressing these stresses will improve the capacity of this specific built environment to maintain its services. Particular changes might be required to adapt to these stresses and achieve resilience in the built environment. After the adaptation process, the specific stresses will have less impact on the built environment as it would then be more resilient.
Combining both approaches seem to be more applicable to the context of a built environment nowadays as it is exposed to both everyday stresses and unexpected adverse events. However, as resilience is a context-specific approach (Romero-Lankao et al., 2016), more importance can be given to either stresses or shocks in resilience-based urban development strategies depending on many indicators such as social, economic, environmental factors. Although Figure 2 shows resilience as an ultimate goal for both approaches whether it is resulting from addressing stresses or shocks, resilience for shocks would not look the same for stresses. Furthermore, according to the broad definition of the built environment adopted in this paper, each element under the umbrella of 'built environment', whether it is infrastructure or buildings, for example, will experience different challenges (shocks and stresses) and their response/recovery properties and resilience properties and needs would also be different.

1270
Sameh Shamout, Paola Boarin, and Sandeeka Mannakkara
Figure 2: A simple diagram framing the relationship between the above frequent terms in the definitions of resilience. Source: Elaboration of the author.
6. ConclusionIn conclusion, this paper analysed 100 definitions of resilience pertaining to ecology, society, individual, cities and buildings, extracted common concepts, and contextualised them in the built environment aiming to provide a blanket resilience understanding of the entire built environment that refers to all man-made stocks including cities, infrastructure, and neighbourhoods down to buildings. The findings highlight that the resilience of the built environment is not necessarily associated only with its vulnerability to standing against disasters. The resilience concept goes far beyond disaster resilience; towards the capacity of the built environment to withstand and adapt with both stresses and shocks facing it. For a shock, it includes absorbing it, respond in a way that ensures quick and effective survival and recovery physically, socially and environmentally. For stress, a resilient built environment is able to change in a way that ensures adapting with stress and maintaining all functions effectively without impacting the social, physical, environmental and climatic state of the built environment. Furthermore, given resilience is a context-specific approach, defining the resilience of the built environment would differ from one area to another, particularly in the kinds of challenges the built environment. This includes, for example, it's a stress-based resilience in case the built environment faces more stresses than shocks or a disaster-based resilience in the opposite case. Another example is the type of challenges the built environment faces whether they are environmental, social, political, economic or health. In general, both stresses and shocks should be taken into account when developing a blanket resilience definition of the entire built environment. Also, many questions can arise to understand those challenges further. For example, are they everyday challenges? Do they occur frequently? What causes these challenges? Many questions should arise before defining the resilience of a built environment. The resilience concept is still evolving in the built environment context and it is a worthy investment (Bosher, 2008), so it is an essential area for further investigating. This paper may contribute to the existing body of knowledge in the field of resilience in the built environment by establishing a holistic understanding of resilience that combine the different points of views that exist in both the academic literature. Further research is needed to define what is that we are trying to foster precisely to achieve resilience.

1271
Understanding resilience in the built environment: Going beyond disaster mitigation
7. ReferencesAdger, W. N. (2000) Social and ecological resilience: are they related?, Progress in Human Geography. Sage
PublicationsSage CA: Thousand Oaks, CA, 24(3), pp. 347–364. doi: 10.1191/030913200701540465. Adger, W. N. et al. (2011) Resilience implications of policy responses to climate change, 2(5), pp. 757–766.
doi: 10.1002/wcc.133. Alberti, M. et al. (2003) Integrating humans into ecology: Opportunities and challenges for studying urban
ecosystems, BioScience, 53(12), pp. 1169–1179. Beilin, R. and Wilkinson, C. (2015) Introduction: Governing for urban resilience, Urban Studies, 52(7), pp.
1205–1217. doi: 10.1177/0042098015574955. Bosher, L. (2008) Hazards and the built environment: Attaining built-in resilience. London ; Taylor & Francis. Brown, D. D. and Kulig, J. C. (1996) The concepts of resiliency: Theoretical lessons from community research.
Health and Canadian Society, 4(1), pp. 29–52. Coutu, D. L. (2002) How resilience works. Harvard business review, 80(5), p. 46–50, 52, 55 passim. Cutter, S. L. et al. (2008) Community and Regional Resilience: Perspectives from Hazards, Disasters, and
Emergency Management (CARRI Research Report 1). Columbia, SC: Hazards and Vulnerability Research Institute. Davoudi, S. et al. (2012) Resilience: A Bridging Concept or a Dead End? “Reframing” Resilience: Challenges for
Planning Theory and Practice Interacting Traps: Resilience Assessment of a Pasture Management System in Northern Afghanistan Urban Resilience: What Does it Mean in Planni, Planning Theory and Practice. Routledge, pp. 299–333. doi: 10.1080/14649357.2012.677124.
Davoudi, S., Brooks, E. and Mehmood, A. (2013) Evolutionary Resilience and Strategies for Climate Adaptation, Planning Practice & Research, 28(3), pp. 307–322. doi: 10.1080/02697459.2013.787695.
Egeland, B., Carlson, E. and Sroufe, L. A. (1993) Resilience as process, Development and Psychopathology. Gallopín, G. (2006) Linkages between vulnerability, resilience, and adaptive capacity, Global Environmental
Change, 16(16), pp. 293–303. Gilbert, C., Eyring, M. and Foster, R. N. (2012) Two Routes to Resilience: rebuild your core while you reinvent
your business model. (Spotlight on How to Manage Disruption)(Cover story), Harvard Business Review. Harvard Business School Press, 90(12).
Godschalk, D. R. (2003) Urban Hazard Mitigation: Creating Resilient Cities, Natural Hazards Review, 4(3), pp. 136–143. doi: 10.1061/(ASCE)1527-6988(2003)4:3(136).
Gordon, J. E. (1978) Structures , or Why Things Don t Fall Down, American Journal of Physics. New York and London: Plenum Press. doi: 10.1119/1.12007.
Grynning, S., Emil, J. and Lohne, J. (2017) Climate adaptation of school buildings through MOM – a case study, Procedia Engineering. SINTEF Building and Infrastructure, 196(1877), pp. 864–871. doi: 10.1016/j.proeng.2017.08.018.
Hassler, U. and Kohler, N. (2014) Resilience in the built environment, Building Research and Information. Taylor & Francis, 42(2), pp. 119–129. doi: 10.1080/09613218.2014.873593.
Holling, C. S. (1973) Resilience and Stability of Ecological Systems, Annual Review of Ecology and Systematics, 4, pp. 1–23.
Hughes, J. F. and Healy, K. (2014) Measuring the resilience of transport infrastructure. 546th edn. Kitano, H. (2004) Biological robustness, Nature Reviews Genetics. Nature Publishing Group, 5(11). Leichenko, R. (2011) Climate change and urban resilience, Current Opinion in Environmental Sustainability,
3(3), pp. 164–168. doi: 10.1016/j.cosust.2010.12.014. Lisø, K. R., Kvande, T. and Time, B. (2017) Climate Adaptation Framework for Moisture-resilient Buildings in
Norway, Energy Procedia. Elsevier B.V., 132, pp. 628–633. doi: 10.1016/j.egypro.2017.09.698. Longstaff, P. H. et al. (2010) Building Resilient Communities: A Preliminary Framework for Assessment’, 6(3). MacKinnon, D. (2015) Resilient City, International Encyclopedia of the Social & Behavioral Sciences. Elsevier,
pp. 561–567. doi: 10.1016/B978-0-08-097086-8.74046-3. MacKinnon, D. and Derickson, K. D. (2013) From resilience to resourcefulness: A critique of resilience policy
and activism, Progress in Human Geography, 37(2), pp. 253–270. doi: 10.1177/0309132512454775.

1272
Sameh Shamout, Paola Boarin, and Sandeeka Mannakkara
Meerow, S. and Newell, J. P. (2019) Urban resilience for whom, what, when, where, and why?, Urban Geography, 40(3), pp. 309–329. doi: 10.1080/02723638.2016.1206395.
Meerow, S., Newell, J. P. and Stults, M. (2016) Defining urban resilience: A review, Landscape and Urban Planning. Elsevier, 147, pp. 38–49. doi: 10.1016/J.LANDURBPLAN.2015.11.011.
Mileti, D. (1999) Disasters by Design : A Reassessment of Natural Hazards in the United States. Washington, UNITED STATES: Joseph Henry Press.
Moraci, F. et al. (2018) Making less vulnerable cities: Resilience as a new paradigm of smart planning, Sustainability (Switzerland). MDPI AG, 10(3). doi: 10.3390/su10030755.
Norris, F. H. et al. (2008) Community resilience as a metaphor, theory, set of capacities, and strategy for disaster readiness, American Journal of Community Psychology, 41(1–2), pp. 127–150. doi: 10.1007/s10464-007- 9156-6.
Robbins, J. et al. (2012) Resilience Engineering: Learning to Embrace Failure, Queue. ACM, 10(9), p. 20. doi: 10.1145/2367376.2371297.
Romero-Lankao, P. et al. (2016) Urban Sustainability and Resilience: From Theory to Practice, Sustainability. Multidisciplinary Digital Publishing Institute, 8(12), p. 1224. doi: 10.3390/su8121224.
Samadian, D. et al. (2019) Seismic resilience evaluation based on vulnerability curves for existing and retrofitted typical RC school buildings, Soil Dynamics and Earthquake Engineering. Elsevier Ltd, 127(September), p. 105844. doi: 10.1016/j.soildyn.2019.105844.
Saunders, W. S. A. and Becker, J. S. (2015) A discussion of resilience and sustainability: Land use planning recovery from the Canterbury earthquake sequence, New Zealand, International Journal of Disaster Risk Reduction. Elsevier, 14, pp. 73–81. doi: 10.1016/J.IJDRR.2015.01.013.
Shamout, S., Boarin, P. and Melis, A. (2019) Energy Retrofit of Existing Building Stock in Amman: State of the Art, Obstacles and Opportunities, in Alalouch, C. et al. (eds) Advanced Studies in Energy Efficiency and Built Environment for Developing Countries. Cham: Springer International Publishing, pp. 133–145. doi: 10.1007/978-3- 030-10856-4_14.
Shamout, S., Boarin, P. and Wilkinson, S. (2021) The shift from sustainability to resilience as a driver for policy change: a policy analysis for more resilient and sustainable cities in Jordan, Sustainable Production and Consumption, 25, pp. 285–298. doi: https://doi.org/10.1016/j.spc.2020.08.015.
Da Silva, J. and Morera, B. (2014) City Resilience Framework. London. Stevenson, J. et al. (2015) National Science Challenges: Resilience to nature’s challenges short-term project
working paper, delivery 1, resilience benchmarking & monitoring review. The International Organization for Standardization (ISO) (2016) BS ISO 37100 — Sustainable cities and
communities — Vocabulary. Tobin, G. A. (1999) Sustainability and community resilience: The holy grail of hazards planning?,
Environmental Hazards, 1(1), pp. 13–25. doi: 10.3763/ehaz.1999.0103. Tyler, S. and Moench, M. (2012) A framework for urban climate resilience, Climate and Development, 4(4),
pp. 311–326. doi: 10.1080/17565529.2012.745389. U.S. Green Building Council (2018) RELi 2.0 Rating Guidelines for Resilient Design + Construction. UN-Habitat (2017) Trends in Urban Resilience. UNISDR (2010) Making Cities Resilient. Available at: https://www.unisdr.org/we/campaign/cities . United Nations (2015) The 2030 Agenda for sustainable development. Walker, B. and Salt, D. (2006) Resilience Thinking: Sustaining Ecosystems and People in a Changing World. Wilkinson. S (2014) What is resilience?, Build, p. p.44. Wilson, A. and Lazarus, M. A. (2017) Resilient Design, in Meyers, R. A. (ed.) Encyclopedia of Sustainability
Science and Technology. New York, NY: Springer New York, pp. 1–18. doi: 10.1007/978-1-4939-2493-6_1031-1. Yamagata, Y. and Maruyama, H. (2016) Urban resilience : a transformative approach. Edited by Y. Yamagata
and H. Maruyama. Switzerland : Springer. 2016.

1273
The 54th International Conference of the Architectural Science Association (ANZAScA) 2020
Understanding the Benefits of BIM/Lean/IPD framework when carried-out simultaneously
Caio Schmitz Machado1, Bani Feriel Brahmi2, Aliakbar Kamari*3 1 Aarhus University, Aarhus, Denmark
[email protected] 2 AVFM laboratory-University of Constantine3 –Salah BOUBNIDER-, Constantine, Algeria
[email protected] *3 Aarhus University, Aarhus, Denmark
Abstract: As a response to an increasingly growing complexity in construction projects, more sophisticated and advanced project delivery methods are being emerged to make the construction process more efficient, productive, and reliable. The methods have evolved from the more conventional methods of design-bid-build, design-build, and construction-manager-at-risk into what are known as Lean Construction (LC), Building Information Modelling (BIM), and Integrated Project Delivery (IPD). In theory, the application of such advanced methodologies provides improvements in the construction process, but recent research studies have reported their ineffectiveness when they are used in isolation. This paper aims to review the benefits of using BIM/LC/IPD framework when used simultaneously. The research begins with a comprehensive review of the literature and then adopts a Qualitative Comparative Analysis (QCA) methodology to study two building cases in the USA and Canada. This is the conclusion of this paper that the application of BIM/LC/IPD framework not only improves the project performance but also results in various advantages. The outcome of this research study is relevant to the companies who are considering implementing these methods, via the use of results to better perceiving and navigating the studied methods and to think about changes in the construction sector.
Keywords: Building Information Modelling (BIM); Lean construction (LC); Integrated Project Delivery (IPD); BIM/Lean/IPD.
1. IntroductionAn efficient pathway from design to final product has always played one of the most important roles in the construction project’s success. Today, information exchange is a key issue facing the evolution of the construction industry. The complexity of solutions and standards for producing better buildings is increasingly in demand, and the need to manage more and more risky projects with multiple stakeholders, often, become problematic concerning deficient communication management throughout the whole process caused inefficiency and low workers production (Otero, 2014).
Imaginable Futures: Design Thinking, and the Scientific Method. 54th International Conference of the Architectural Science Association 2020, Ali Ghaffarianhoseini, et al (eds), pp. 1273–1282. © 2020 and published by the Architectural Science Association (ANZAScA).

1274
Caio Schmitz Machado, Bani Feriel Brahmi, Aliakbar Kamari
As occurs in other economic sectors, the technologies and the best working methodologies, together, should continue to be important allies to overcome the newly introduced complexities (Jiang, 2011). However, the construction industry is often recognized as a tough sector to change its culture and to implement innovative processes to overcome the historical hurdles. This is worrisome as the benefits of improved practices would be a factor to transform the industry into a more coordinated, competitive, and interoperable sector (da Mota, 2015).
Some construction companies have already used different tools, processes, and contractual bonds that tackles the miscommunication among the stakeholders. In this study, we address three innovative approaches, Lean Construction (LC), Building Information Modelling (BIM), and Integrated Project Delivery (IPD), which improve the quality in the construction projects, increase their performance, and eliminate weaknesses of current project delivery systems (Fakhimia et al., 2016). For visualization and design intentions, BIM has emerged as the appropriate solution leading to the digitalization of the construction industry (Tarrafa, 2012). LC proved its value in maximizing work productivity and reducing wastes in terms of time and cost (Sacks et al., 2010). Likewise, IPD is commonly regarded as the most valuable solution regarding the firms contributing to configure integrated organizations and sharing risks and rewards in the project (Fischer et al., 2014).
1.1. Problem statement
The application of LC, BIM, and IPD methodologies provides improvements in the construction process, but recent research studies have reported their ineffectiveness when used in isolation (El. Reifi and Emmitt, 2013; Neff et al., 2010). In addition, as several tools and protocols are being developed and applied, understanding and integration between them can be a complicated process. Methodologies that were supposed to be delivering optimized outcomes using innovative tools, appeared to have discrepancies between the theory and the practice.
Therefore, several studies have already tried to address the synergy between the aforementioned approaches using a bi-dimensional view, sometimes with IPD and BIM (Kahvandi et al., 2017), BIM and LC (Sacks et al., 2010), IPD and LC (Cheng and Johnson, 2016). IPD enabling the use of the virtual design and construction projects (refer to BIM) are already showing advances in large projects. LC and a continuous improved and integrated organization agenda have also been demonstrating significant achievements. But not a lot of studies have looked at the intersection between all the three of them.
There is a great potential for considering the trilateral collaboration of LC, IPD, and BIM methodologies simultaneously (Nguyen and Akhavia, 2019). A detailed analysis of such a combination is, however, critical to measuring the outcomes. To this end, we address the following research questions:
(1) Are there any potential benefits from using the BIM, IPD, and Lean methodologiessimultaneously in a construction project?
(2) What lessons can be learned from the building projects that already use the BIM/LC/IPDframework?
1.2. Research structure
The paper is organized in Section 2, which reviews the concept of IPD, BIM, LC, and their application in the construction industry via exploring the relevant literature in these areas. Section 3 provides a short presentation of the research methodology, data collection, and analysis. In section 4, through the study of two construction projects, the paper investigates the real impact of the shift to BIM/LC/IPD

1275
Understanding the Benefits of BIM/Lean/IPD framework when carried-out simultaneously.
framework, and how it fosters collaboration as well as enhances the performance of the project in broader perspectives. Section 5 presents a brief conclusion and directions for further research.
2. Literature reviewInnovation in the construction industry can take many forms, including changes in project delivery, collaboration, and product improvement. Three of the trending concepts in the construction industry have proven to be highly value-adding and forward-thinking approaches (Ashcraft, 2012). BIM is a concept made up of four key elements: collaboration, representation, process, and lifecycle, in which all interact to generate efficient information management within a digital model, forming a reliable basis for decisions throughout the building life cycle (Bradley et al., 2016).
While LC creates the possibility to achieve improved outcomes of the final product, considering the economic, social, and environmental aspects of the building (Fischer et al., 2014), its operating system seeks to reduce inefficiencies, wastes and maximize the values perceived for the client, from the significant advance of workers’ productivity to the final quality of the product (Sacks et al., 2010; Jaaron and Backhouse, 2012).
Likewise, the IPD based on a single/multiparty construction contract agreements is the way of tying the multiple participants towards the goals outlined in a collaborative environment (Gilligan and Kunz, 2007). The jointly shared risks and rewards among the stakeholders, who are essential to developing a sense of commitment and collaboration, increase communication and creativity and reduces litigation costs (Ashcraft, 2012).
2.1. BIM/LC/IPD
From a construction perspective, the effective and efficient usage of BIM technologies is best accomplished by utilizing mechanisms that foster principles of collaboration and continuous improvement of the daily activities on site (Ghaffarianhoseini et al., 2017).
Similarly, IPD needs to benefit from advanced techniques, including BIM and LC practices collaboration (Ashcraft, 2012). The integration requirement that can be effectively accomplished by BIM implantation to achieve better decision- making and remove its implementation barriers to deliver high-performance buildings (Azhar et al., 2014; Kamari and Kirkegaard, 2019). In contrast, Cheng and Johnson (2016) explore the powerful complementary strength of IPD and LC to support success. They conclude that IPD sets the terms and provides the motivation for collaboration, and LC provides the means for teams to optimize their performance and achieve project goals. Figure 1 illustrates the three components of IPD process and how BIM and LC are incorporated to achieve its success.
Figure 1: The three key components of the IPD process and their synergy with BIM and LC
(adapted from Ashcraft, 2012)

1276
Caio Schmitz Machado, Bani Feriel Brahmi, Aliakbar Kamari
Fakhimia et al. (2016) argue that IPD, BIM, and LC should play together complementary and synergistically to provide more pragmatic and effective solutions to complex project issues. Nguyen and Akhavia (2019) evaluate this synergy in terms of cost and schedule performance measures. The results have shown considerable effectiveness in terms of schedule performance, while the effect on cost performance was not as significant. The collaborative supply chain management could significantly enhance the proper communication (Lostuvali et al., 2012) to decrease the number of conflicts, enhance the design and construction process efficiency, reducing errors, and assuring cost and time optimization (Mesa et al., 2019). On the other side, some companies, with the help of scholars, are running projects and studying their results to measure the final productivity of projects by trying the elements together, to harvest improvements in the future (Hyatt, 2011; Hunzeker and Selezan, 2015).
Added to this, we conduct a Qualitative Comparative Analysis (QCA) in the following two successful projects to understand in more detail how the BIM, IPD, LC framework enhances the construction industry performance. The two building cases' analysis facilitates exploring and comparing different process changes and outcomes to gain new insights.
3. MethodologyThe aim of this paper is to fill in the current underlying research gaps of incorporating IPD, LC, and BIM together. A Qualitative Comparative Analysis (QCA) methodology is used from (Ragin, 1987, 2000) as an effort to thoroughly assess and compare two real building projects to consider where and how the use of BIM (Kamari et al., 2018a,b,c), LC, and IPD can result in changes in the construction process. The QCA methodology is often undertaken when there is not sufficient data to consider a case study statistically, but when the richness of the information about each case allows powerful and compelling stories about the likely causes for desired outcomes to be told (Ragin 2000).
The comprehensive comparative analysis is conducted through using five categories from the study by Cheng (2015) and Cheng and Johnson (2016), including Overview/Context, Commercial Strategies, Leadership Strategies, Logistical and Process Tactics, and Building Outcomes. Moreover, these categories are further divided into 19 criteria to cope with the complexity of BIM/LC/IPD framework focus (see Table 1), and enables us to carry out the case studies in a structured and systematic manner to provide both a comprehensive view of the cases and comparison between them, with a set of defined variables. The 19 criteria are defined from past studies that analyzed the features of collaborative construction processes on using Lean, IPD, and BIM (Cheng 2016; Chudasma 2019)
Table 1: Criteria Categories (source: adapted from Cheng, 2015; Cheng and Johnson, 2016)
Overview/Context Commercial Strategies Leadership Strategies Logistical & Process Strategies
Building outcomes
Project overview
Project timeline
Team organization
Ow
ner identity
Team selection
Contract selection
Process methods
Conflicts resolution
Champion
Decision structure
On Board - O
ff board
Team collaboration
Resources/Facilitations
Processes and Tools
Workplace environm
ent
Technology
Profit/Payout
schedule
Achieved Quality
1277
Understanding the Benefits of BIM/Lean/IPD framework when carried-out simultaneously
Two real-world projects were selected to conduct the comparative analysis.. The two projects have been executed using BIM/LC/IPD simultaneously, they were perceived as particularly suitable for offering relatively new practical and theoretical perspectives on the topic. The projects are located in two different countries (USA and Canada) where BIM, LC, and IPD methodologies are widely adopted by many companies. The data are collected from previous studies, published reports, technical magazines, and online services.
4. Case studyIn this paper, two study cases are presented. The first case is the construction of the “Akron Children’s Hospital” in the United States, and the second one is a residential building, “The UBC Brock Commons” located in Canada. This section analyzes and explores the potential shift of the BIM/LC/IPD framework in the two projects, using the coding scheme, including the categories presented in Table 1. We explore the strategies, business models, and tools applied by the projects’ teams in achieving the projects’ success.
4.1. Case study 1: The Akron Children’s Hospital (Kay Jewelers Pavilion)
The Akron Children’s Hospital (Kay Jewelers Pavilion) is a new seven-story healthcare facility located in Akron, Ohio, USA. It is part of the Akron Children’s Hospital complex expansion (see Figure 2). The project, of 33,910 sq.m. (365,000 sq.ft.), comprises of several facilities, distinguished by 75 private bed Neonatal Intensive Care Units and a labour/delivery centre for high-risk births. The facility was planned to be a flexible environment with expansion thoughts in the future. The rooms are accommodated to be possible to shift in multiple different configurations with little efforts. The project began in November 2011 and ended in May 2015, with a total cost of $180 million. The project is considered as an innovative construction; their goals were set to impact the local business community and achieved the LEED Gold certification through the implementation of LC and IPD together. The approach consists of selecting local and national companies to work together to transfer knowledge and build expertise in the local industry.
4.2. Case study 2: The UBC Brock Commons
The UBC Brock Commons is a timber and concrete certified 18 story student dormitory of the University of British Columbia, located in Vancouver, British Columbia, Canada (see figure 3). This project of 15,250 sq.m. is intended to accommodate university students, and accountable for providing studios and quads rooms with a total of 404 beds and public sharing spaces on the access and the top floor. The project began in November 2014 and ended in July 2017, with a total cost of $52 million. The project is considered innovative since it topped the list of the highest timber structure building on the date of its inauguration as well as obtained the LEED Gold certification. As the project required unusual means of construction, the search for specialized teams was crucial for the construction, even if the partners were from distant locations.

1278
Caio Schmitz Machado, Bani Feriel Brahmi, Aliakbar Kamari
Figure 2: The front façade of the Key Jewelers Pavilion (Source: photo by Thorson Baker)
Figure 3: Aerial view of the UBC Brock Commons (Source: photo by K.K. Law)
4.3. Qualitative Comparative Analysis (QCA) results
In this stage of the research work, a detailed and holistic assessment of the use of BIM/LC/IPD framework was addressed according to the categories and subcategories introduced in Table 1. As such, we assessed and evaluated to what degree the contractual form, the process, and the technology employed were applied in each case. Table 2 summarizes the main characteristics and differences between the two projects, organized into the five categories, and focusing on how the projects were performed. Each category is described below.
Table 2: QCA results for the two building projects
- Overview/ Context Variable:
The two projects had cost and schedule aspects governing the paths to be taken during the process. They both recurred to unusual, innovative construction methods and processes to achieve sustainability and user’s satisfaction goals. Thus, the projects were risky from a traditional standpoint. For Akron Children’s hospital, a clear budget limit to be followed was a real challenge and set a solid case to seek

1279
Understanding the Benefits of BIM/Lean/IPD framework when carried-out simultaneously
integration, with the user’s inputs, and LC process for the project stakeholders to improve the construction materials and processes. For UBC Brock Commons, since it had incentives for using timber elements in their structure, there was greater concern about the duration time and compliance with the code requirements of wooden buildings. In both projects, the level of pre-planning and defining the constraints in early stages fostered in a collaborative structure that allowed them to better control time, quality, and safety in advance compared to traditional projects.
- Commercial Strategies Variable:
The first important point to note is that the projects had different construction contract agreements. Akron’s Hospital used the IPD format, and Brock Commons used the Construction Management at Risk contract. After the choice of the delivery schemes, the rest of the commercial strategies were all based on features and enhancements supported by the best practices for each setting. IPD enabled the use of the incentive pool and, with an innovative proposition, made the hospital client go for full wrap insurance for the project. That solution boosted the collaborative environment of the participants. For the Construction Management at Risk project, the strategy was to use the knowledge and the experience of the owner’s project manager to keep a closer track of the process. Interesting to the latter project is that even with a clear central leader, there was a collaborative environment due to the level of innovation required to develop the timber structure solution, which needed frequent inputs from the project teams.
- Logistics and Process Variable:
Since the first day, the two projects have used continuous improvement techniques. The use of this resource is imperative as the process is innovative, where the learning takes place. In Akron’s Children Hospital, LC principals and techniques have been incorporated to improve the design and construction as well as to find the bests trades to be part of the team. As mentioned earlier, the approach taken in the construction did not have clear leadership, and, while the process was advancing, the role of the leader was changing from phase to phase. This factor was one of the reasons that the owner resorted to making a personality profiling test to reveal the leadership preferences of the teams. Satisfaction surveys during the project were a useful tool used for obtaining feedback and taking necessary steps to keep the project running in the right direction.
In the UBC Brock Commons, the use of BIM had a central role in assessing the decisions and facilitating the participants' work. At first, the project had one model integrating all the disciplines. Then, a VDC (Virtual Design & Construction) company facilitated the BIM work by merging all the design projects. Through BIM, the accomplished simulations and details enabled the use of just-in-time delivery and prefabricated elements on the construction site.
- Leadership Strategies Variable:
Both projects used some sort of mentoring during the process. Due to the different strategies that fit better in each of the end owner’s goals, Akron Hospital invested time in introducing the IPD and LC practices to the team project. At the same time, the Brock Commons training focused mainly on timber and VDC solutions. For the first project, the decentralized decision-making provided more flexibility for the teams to change leadership's role during the process. There was also an opportunity to trade the scope between the firms inside the risk and reward pool. On the contrary, each firm in the second case

1280
Caio Schmitz Machado, Bani Feriel Brahmi, Aliakbar Kamari
has defined roles in the process. The teams discussed and agreed upon the solutions during meetings coordinated by BIM and the mock-up model. After that, each team had a clear job to do.
- Outcome Variables:
The projects were considered successful, as the set goals were achieved. Building sustainability wasone of the crucial success factors, and the energy performance was attained, ensuring the projects LEEDgold labels. Due to the construction contract agreements nature, profit was more important in the Akron Children Hospital, since there was a fixed budget from the beginning. The companies could have theopportunity to improve their fixed payout with a variable payment related to deliver the project in a lower budget and accomplish all the success metrics. UBC Brock Commons anticipated the building completedwithin the market expectations cost, although it was almost impossible to use benchmarking from pastprojects to know how much the product would cost since such an innovative solution did not exist.Another satisfying outcome was the shorter time spent in the implementation of various activities.
The two projects similarly utilized almost half of the whole process time in the phase of defining andconcluding the design buildings. This strategy was successful as the construction time of the two projects was reduced by two months. The thoroughly preplanning in the Akron Hospital Project shown positivedirect results on the amount of punch list items, the safety during the construction, and the user’ssatisfaction. For Brock Commons, it was an opportunity to make the prefabricated timber constructionfeasible and accelerated.
4.4. Discussion
Figure 4 demonstrates the relative graphicalpositioning of the comparative assessment ofthe BIM/LC/IPD framework adoption in the two projects. The figure indicates that the Akron’sChildren Hospital project has attributedconsiderable importance to the commercialstrategies by developing the IPD contract andthe willingness to transfer knowledge to theteam participants. On the contrary, theemphasis of the UBC Brock Commons projectwas on the facilitation of the constructionprogress using design modeling and simulation techniques.
5. Conclusion and future study
Figure 4. The relative graphical positioning of the comparison assessment outcome of the BIM/LC/IPD
framework adoption on the two building projects
The adoption of BIM/LC/IPD methodologies already demonstrates substantial improvements in the construction processes in response to the growth of stakeholder’s motivations and the building performance. They are often used in isolation, as the BIM/LC/IPD framework has not been widely utilized together. To this end, a comprehensive literature review and practical case studies were carried out. The findings indicate that the use of BIM/LC/IPD simultaneously can improve the effectiveness of these methodologies compared when they are used individually. This synergy improves mostly the communication level and team collaboration during the whole construction process. The collaborative

1281
Understanding the Benefits of BIM/Lean/IPD framework when carried-out simultaneously
environment is crucial to decrease the number of conflicts, enhance the design and construction process efficiency, and the time and cost spent on the construction phase are also lower than initially planned.
More specifically about the studied cases, it can be concluded that the applicability of IPD during the pre-planning phase was verified so as to a mean of selecting the project participants, gathering the stakeholders and discussing the best alternatives during the design phase, and during the construction to foster the involvement of the trades to help plan the next construction steps. Likewise, LC tools were used to choose collaborators and target the value streaming process during design and construction processes. Besides, BIM was mainly used in the design phase but also served as support for construction activities. Despite the fact that both of the cases used different types of contracts, they succeed in obtaining proper results regarding team collaboration; nevertheless, the IPD agreement of the Akron’s Children Hospital was more a safeguard to stimulate it. On the other hand, the guidance and the leadership that the owners provided to the participants was crucial for the team culture building.
There are other aspects that may have contributed to the success of the projects and influenced the building outcomes, but they are difficult to assess since the research specifically focused on qualitative issues from the construction process perspective. It would be interesting to measure the BIM/LC/IPD framework implementation through quantitative studies, polls, and more comparative studies in different regions. However, the results of this study can be of particular value for construction companies who seek the shift into the BIM/LC/IPD framework in the future via using the resultant to better perceiving and navigating the studied methods and to think about changes shortly in the construction sector.
References Ashcraft, H.W. (2012) The IPD framework, H. Bridgett, Editor: San Francisco, CA Azhar, N., Kanga, Y. and Ahmad, I.U. (2014) Factors Influencing Integrated Project Delivery In Publicly
Owned Construction Projects: An Information Modelling Perspective. Procedia Engineering, 77, 213. Bradley, A., Li, H., Lark, R. and Dunn, S. (2016) BIM for infrastructure: An overall review and constructor
perspective. Automation in Construction, 71 (2), 139–152. Catalysis (2016). Building a Lean Hospital: Akron Children’s Hospital applies lean thinking and integrated
project delivery to the planning, design, and construction of the $180 million Kay Jewelers Pavilion, Createvalue.
Cheng, R. and Johnson, A.J. (2016) Motivation and Means: How and Why IPD and Lean Lead to Success. Integrated project Delivery Alliance & LCI: Lean Construction Institute.
Cheng, R. (2015) Integration at Its Finest: Success in High-Performance Building Design and Project Delivery in the Federal Sector. Office of Federal High-Performance Green Buildings, U.S. General Services Administration. Available from: http://z.umn.edu/integrationreport
Chudasma, D. (2019) Identifying the key innovative and collaborative strategies of integrated project delivery method to achieve owner goals in housing projects, Master’s thesis, University of British Columbia, Vancouver, Canada.
Da Mota, C.S.A. (2015). Modelo 4D do planeamento da construção apoiado na tecnologia BIM. Master's thesis, Técnico Lisboa, Lisboa, Portugal.
El. Reifi, M. and Emmitt, S. (2013) Perceptions of lean design management. Architectural Engineering Design Management. 9(3), 195-208.
Fakhimi, A.H., Majrouhi Sardroud, J., and Azhar, S. (2016) How can Lean, IPD and BIM Work Together? 33rd International Symposium on Automation and Robotics (ISARC 2016), Auburn, Alabama

1282
Caio Schmitz Machado, Bani Feriel Brahmi, Aliakbar Kamari
Fallahi, A. (2017) Innovation in hybrid mass timber high-rise construction: A case study of UBC’s Brock commons project, Master’s thesis, University of British Columbia, Vancouver, Canada.
Fischer, M., Reed, D., Khanzode, A., and Ashcraft, H. (2014) A Simple Framework for Integrating Project Delivery. In: IGLC22, 25-27 June 2014, Oslo, Norway, 22, 1319-133
Ghaffarianhoseini, A., Tookey, J., Ghaffarianhoseini, A., Naismith, N., Azhar, S., Efimova, O. and Raahemifar, K. (2017) Building Information Modelling (BIM) uptake: Clear benefits, understanding its implementation, risks and challenges. Renewable Sustainable Energy Reviews, 75, 1046-1053.
Gilligan, B., and Kunz, J. (2007). VDC use in 2007: significant value, dramatic growth, and apparent business opportunity. CIFE Technical Report No 171, Stanford University, Stanford, CA.
Hunzeker, Z. and Selezan, D. (2015) BIM to the MAX: Applying Lean Construction to IPD Projects Presentation, S.F. Autodesk University, CA, USA.
Hyatt, B.A. (2011) A case study in integrating lean, green, BIM into an undergraduate construction management scheduling course, The 47th ASC Annual International Conference Proceedings, Fresno.
Jaaron, A. and Backhouse, C. (2012) The effects of lean thinking on service workers value productivity: a conceptual framework. International Journal of Quality Innovation, 2(1), 1-17.
Jiang, X. (2011). Developments in cost estimating and scheduling in BIM technology. Master’s thesis, Northeastern University, Boston, Massachusetts.
Kahvandi, Z., Saghatforoush, E., Alinezhad, M., and Noghli, F. (2017) Integrated Project Delivery (IPD) Research Trends. Journal of Engineering, Project, and Production Management, 7(2), 99-114
Kamari, A., Jensen, S., Christensen, M.L., Petersen, S. and Kirkegaard, P.H. (2018a) A Hybrid Decision Support System (DSS) for Generation of Holistic Renovation Scenarios—Case of Energy Consumption, Investment Cost, and Thermal Indoor Comfort. Sustainability, 10(4), 1255-78.
Kamari, A., Laustsen, C., Petersen, S., and Kirkegaard, P.H. (2018b) A BIM-based decision support system for the evaluation of holistic renovation scenarios. Journal of Information Technology in Construction, 23, 354-380.
Kamari, A., Schultz, C. and Kirkegaard, P.H. (2018c) NovaDM - Towards a formal, unified Renovation Domain Model for the generation of holistic renovation scenarios. In ECPPM 2018 conference, Copenhagen, DK.
Kamari, A. and Kirkegaard, P.H. (2019) Potential shift of Integrated Design (ID) through BIM in Sustainable Building Renovation. IOP publications, proceeding of Sustainable Built Environment (SBE) Cardiff 2019, Cardiff, UK.
Lostuvali, B., Alves T., and Modrich R. (2012) Lean product development at Cathedral Hill Hospital project. Annual conference of the International Group for Lean Construction Vol. 20.
Mesa, H. A., Molenaar, K. R., and Alarcón, L.F. (2019) Comparative analysis between integrated project delivery and lean project delivery. International Journal of Project Management, 37(3), 395-409.
Neff, G., Fiore-Silfvast, B. and Dossick, C.S. (2010) A case study of the failure of digital communication to cross knowledge boundaries in construction. Information, Communication Society, 13(4), 556-573.
Nguyen, P. and Akhavia,R. (2019) Synergistic Effect of Integrated Project Delivery, Lean Construction, and Building Information Modeling on Project Performance Measures: A Quantitative and Qualitative Analysis. Journal of Advances in Civil Engineering, 2019 Otero, R.D.F. (2014) Otimização do planeamento dos trabalhos MEP com recurso a modelos BIM. Master's
thesis, Universidade do Minho, Guimarães, Portugal. Ragin, C. C. (1987) The Comparative Method: Moving Beyond Qualitative and Quantitative Strategies.
Berkeley University of California Press Ragin, C. C. (2000) Fuzzy-Set Social Science. University Chicago Press Sacks, R., Koskela, L.J., Dave, B., and Owen, R. (2010) The interaction of lean and building information
modeling in construction. Journal of Construction Engineering and Management, 136 (9), 968-980. Tarrafa, D.G.P. (2012) Aplicabilidade prática do conceito BIM me projector de structures, Master's thesis,
Universidad de Coimbra, Coimbra, Portugal.

1283
The 54th International Conference of the Architectural Science Association (ANZAScA) 2020
Understanding the challenges of circular economy construction through full-scale prototyping
Gerard Finch1, Guy Marriage2, Morten Gjerde3, Antony Pelosi4 and Yusef Patel51, 2, 3, 4 Victoria University of Wellington, Wellington, New Zealand
{ged.finchl1, guy.marriage2, morten.gjerde3 antony.pelosi4}@vuw.ac.nz 5 Unitec Institute of Technology, Auckland, New Zealand
{ypatel5}@unitec.ac.nz
Abstract: Applying the Circular Economy paradigm in the built environment requires buildings to be designed for deconstruction and material recovery. Achieving circularity is complicated by the fact that requirements for deconstruction are at odds with most current mainstream construction techniques. The widespread adoption of single-use fixings, adhesives and composite materials mean that it is rarely economically or technically feasible to recover materials. To address this issue a highly modified structural timber framing solution has been designed that separates traditionally dependant layers of a buildings weather resistant envelope. As part of evaluating the viability of this modified framing solution a full-scale building prototype was constructed. The prototype adopted an entirely modular, prefabricated light-weight structural frame with provision for the reversible fixing of structural cavity battens, cladding, purlins and internal linings. Experimental thermally modified plywood cladding materials, using a bespoke concealed bracket, were also designed and deployed. The design-build process worked effectively to highlight limitations within the proposed circular building system, however it was observed that many of the issues found could have been identified using detailed BIM modelling (down to a fixing level).
Keywords: Circular Economy; Design for Deconstruction; Circular Construction; Construction.
1. IntroductionSeparating modern construction practices from the environmental destruction caused by unmitigated material extraction, consumption and disposal remains a significant challenge for the building industry. In recent years the Circular Economy has been touted as a framework for transitioning away from a linear consumption model towards waste-free and restorative industrial practices. As such, under the theoretical framework of circularity, this paper documents an attempt to translate best practice theoretical circular design recommendations into the real world. A ‘full-scale’ design-build project undertaken in late 2019 has been documented and critiqued with the aim of generating insights useful to those developing circular building systems and products. The paper documents the technical features
Imaginable Futures: Design Thinking, and the Scientific Method. 54th International Conference of the Architectural Science Association 2020, Ali Ghaffarianhoseini, et al (eds), pp. 1283–1292. © 2020 and published by the Architectural Science Association (ANZAScA).

1284
Gerard Finch, Guy Marriage, Morten Gjerde, Antony Pelosi and Yusef Patel
of this prototype and critically reflects on the circular, economic and constructability performance of the completed building.
2. Background
2.1 The Circular Economy
In the late 1960’s there was a growing sentiment that the impact of modern human activities on the environment was unsustainable. Buckminster Fuller’s seminal book ‘Operating Manual for a Spaceship Earth’ in 1969, followed closely by Barry Commoner’s essay ‘The Closing Circle’ in 1971, outlined an industrial complex held by society that was incompatible with natural processes. Commoner theorized that unlike humans, nature operates as a closed system, an ‘ecosphere’ governed by laws in which waste and pollution becomes fuel and food for another natural process (1971, p. 33-48). Commoner outlined four distinct laws that allow the ecosphere to proposer:
• Everything is connected to everything else. • Everything must go somewhere. • Nature knows best. • There is no such thing as a free lunch.
Commoner suggested that for humans to limit their impact on the environment they would need to operate within the bounds of these ecosphere requirements rather than operating in a linear manner. Commoner’s insights formed the basis of the Industrial Ecology movement, as well as the notion of ‘Cradle-to-Cradle’ and the ‘Product-Life Factor’ (Evan, 1974; Sahay, 2006, p. 215; Stahel, 1981 and 1982). The popularity of these ideas in academic and government organizations grew significantly throughout the 1990’s and early 2000 with the Chinese government being the first to pass such ideas into law in 2009 (Matthews and Tan, 2016). It was at this point the many different proposals for operating our economic and industrial systems in a way that emulates that of nature were captured under the broader umbrella term of circularity (the circular economy) (Geissdoerfer et al, 2017). Stewarded by the Ellen MacArthur Foundation circularity is today described as “…an economy based on the principles of designing out waste and pollution, keeping products and materials in use, and regenerating natural systems” (MacArthur Foundation, 2020). From Barry Commoner’s four laws of ecology in the 1970’s to today’s multi-national circular economy foundations and policy, circularity is widely recognized as the preeminent holistic framework for addressing climate change (Baker-Brown, 2017; MacArthur Foundation, 2020; Babbitt et al, 2018).
2.2 Circularity, the Construction Industry, and the Impact
Almost every construction practice that we adopt today is incompatible with circularity. The unilateral adoption of low-cost composite materials, irreversible chemical connections and fixings that inherently damage the materials they intersect is alarming (Storey et al, 2005). These practices mean that today the building and construction sector is responsible for more than forty percent of the world’s waste (Inglis, 2007; EPA, 2016). Reducing this vast volume of waste materials prevents a spiral of environmentally harmful human behavior (Ajayi et al, 2015; MfE, 1997; Kennedy, 2007; Braungart and McDonough, 2002; Baker-Brown, 2017; Inglis, 2007). Ensuring that building materials normally sent to landfill are instead either reused or reprocessed reduces the demand for new materials (Allwood et al,
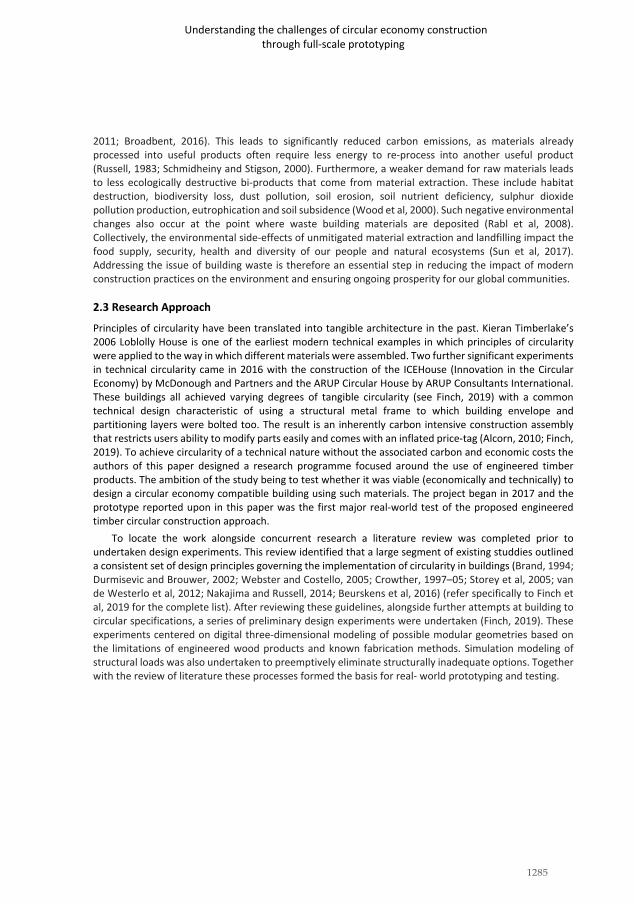
1285
Understanding the challenges of circular economy construction through full-scale prototyping
2011; Broadbent, 2016). This leads to significantly reduced carbon emissions, as materials already processed into useful products often require less energy to re-process into another useful product (Russell, 1983; Schmidheiny and Stigson, 2000). Furthermore, a weaker demand for raw materials leads to less ecologically destructive bi-products that come from material extraction. These include habitat destruction, biodiversity loss, dust pollution, soil erosion, soil nutrient deficiency, sulphur dioxide pollution production, eutrophication and soil subsidence (Wood et al, 2000). Such negative environmental changes also occur at the point where waste building materials are deposited (Rabl et al, 2008). Collectively, the environmental side-effects of unmitigated material extraction and landfilling impact the food supply, security, health and diversity of our people and natural ecosystems (Sun et al, 2017). Addressing the issue of building waste is therefore an essential step in reducing the impact of modern construction practices on the environment and ensuring ongoing prosperity for our global communities.
2.3 Research Approach
Principles of circularity have been translated into tangible architecture in the past. Kieran Timberlake’s 2006 Loblolly House is one of the earliest modern technical examples in which principles of circularity were applied to the way in which different materials were assembled. Two further significant experiments in technical circularity came in 2016 with the construction of the ICEHouse (Innovation in the Circular Economy) by McDonough and Partners and the ARUP Circular House by ARUP Consultants International. These buildings all achieved varying degrees of tangible circularity (see Finch, 2019) with a common technical design characteristic of using a structural metal frame to which building envelope and partitioning layers were bolted too. The result is an inherently carbon intensive construction assembly that restricts users ability to modify parts easily and comes with an inflated price-tag (Alcorn, 2010; Finch, 2019). To achieve circularity of a technical nature without the associated carbon and economic costs the authors of this paper designed a research programme focused around the use of engineered timber products. The ambition of the study being to test whether it was viable (economically and technically) to design a circular economy compatible building using such materials. The project began in 2017 and the prototype reported upon in this paper was the first major real-world test of the proposed engineered timber circular construction approach.
To locate the work alongside concurrent research a literature review was completed prior to undertaken design experiments. This review identified that a large segment of existing studdies outlined a consistent set of design principles governing the implementation of circularity in buildings (Brand, 1994; Durmisevic and Brouwer, 2002; Webster and Costello, 2005; Crowther, 1997–05; Storey et al, 2005; van de Westerlo et al, 2012; Nakajima and Russell, 2014; Beurskens et al, 2016) (refer specifically to Finch et al, 2019 for the complete list). After reviewing these guidelines, alongside further attempts at building to circular specifications, a series of preliminary design experiments were undertaken (Finch, 2019). These experiments centered on digital three-dimensional modeling of possible modular geometries based on the limitations of engineered wood products and known fabrication methods. Simulation modeling of structural loads was also undertaken to preemptively eliminate structurally inadequate options. Together with the review of literature these processes formed the basis for real- world prototyping and testing.

1286
Gerard Finch, Guy Marriage, Morten Gjerde, Antony Pelosi and Yusef Patel
3. Early Stage PrototypingThe prototypes material and construction specification followed strict circular economy design guidelines based on literature. As the implementation of these ideas were largely untested at scale smaller elements were prefabricated and assembled in workshop conditions prior to undertaking full- scale fabrication. These tests examined any tolerance, durability and/or assembly constraints of the proposed system. Initial testing focused on verifying the structural and assembly capabilities of the modular structural frame before expanding to test the assembly parameters of the cladding and roofing assemblies. The critical learnings/observations from these tests largely related to ‘ease-of-assembly’ (and disassembly) issues existing within the proposed construction methods. Substituting nail and screw fixing methods with more durable reversable and non-damaging bolted, or clip connections is generally more labour intensive as a single part is often being replaced with two or more separate fixing components. To counteract the implications of slower fixing installation the proposed circular building system attempted to ensure that a bolted (or multi-part) fixing was always at least duel purpose. In this case a bolt connecting the structural cavity batten to the modular frame also acted to secure parts of that frame in place (figure 1). The smaller prototyping tests revealed that while this was feasible there was additional time costs associated with aligning the elements, effectively counteracting the efficiency of a single fixing.
Figure 1. Early Stage ‘mock-up’ tests (from left to right: Frame Parts (tolerance test), Structural Cavity Batten Fixing, Rigid Air Barrier Testing, integrated weatherboard fixing).
4. Prefabrication and Construction
4.1 Foundations and the Structural Frame
The process of construction adopted by this prototype replicated conventional build methods. Prefabricated timber parts were transported to site and assembled into frames after completion of the foundation structure, with the walls then raised and bolted to that sub-floor system. Roof panels were then lifted into place before building wraps being applied and roofing materials installed. The major differentiating factor compared with conventional construction were the materials being specified at each stage and their fixing methodologies. The sub-floor system was conventional in many respects for a building of this size. Macrocarpa bearers supported by pre-cast concrete foundation slabs were installed first and anchored to the ground using steel rods. The assembly, although not as quickly recoverable as screw piles (which would be the mainstream recommended approach) was identified as low carbon,
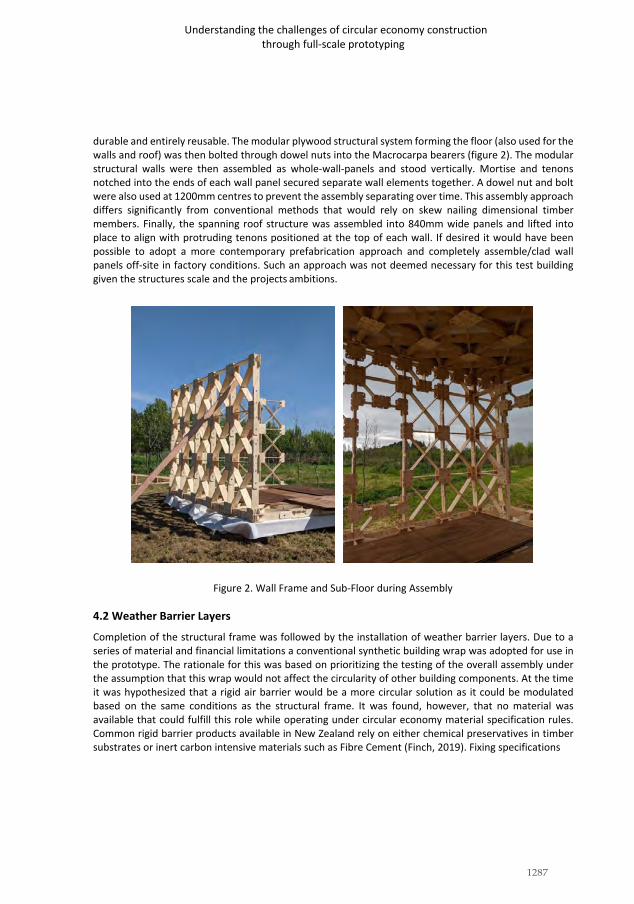
1287
Understanding the challenges of circular economy construction through full-scale prototyping
durable and entirely reusable. The modular plywood structural system forming the floor (also used for the walls and roof) was then bolted through dowel nuts into the Macrocarpa bearers (figure 2). The modular structural walls were then assembled as whole-wall-panels and stood vertically. Mortise and tenons notched into the ends of each wall panel secured separate wall elements together. A dowel nut and bolt were also used at 1200mm centres to prevent the assembly separating over time. This assembly approach differs significantly from conventional methods that would rely on skew nailing dimensional timber members. Finally, the spanning roof structure was assembled into 840mm wide panels and lifted into place to align with protruding tenons positioned at the top of each wall. If desired it would have been possible to adopt a more contemporary prefabrication approach and completely assemble/clad wall panels off-site in factory conditions. Such an approach was not deemed necessary for this test building given the structures scale and the projects ambitions.
Figure 2. Wall Frame and Sub-Floor during Assembly
4.2 Weather Barrier Layers
Completion of the structural frame was followed by the installation of weather barrier layers. Due to a series of material and financial limitations a conventional synthetic building wrap was adopted for use in the prototype. The rationale for this was based on prioritizing the testing of the overall assembly under the assumption that this wrap would not affect the circularity of other building components. At the time it was hypothesized that a rigid air barrier would be a more circular solution as it could be modulated based on the same conditions as the structural frame. It was found, however, that no material was available that could fulfill this role while operating under circular economy material specification rules. Common rigid barrier products available in New Zealand rely on either chemical preservatives in timber substrates or inert carbon intensive materials such as Fibre Cement (Finch, 2019). Fixing specifications
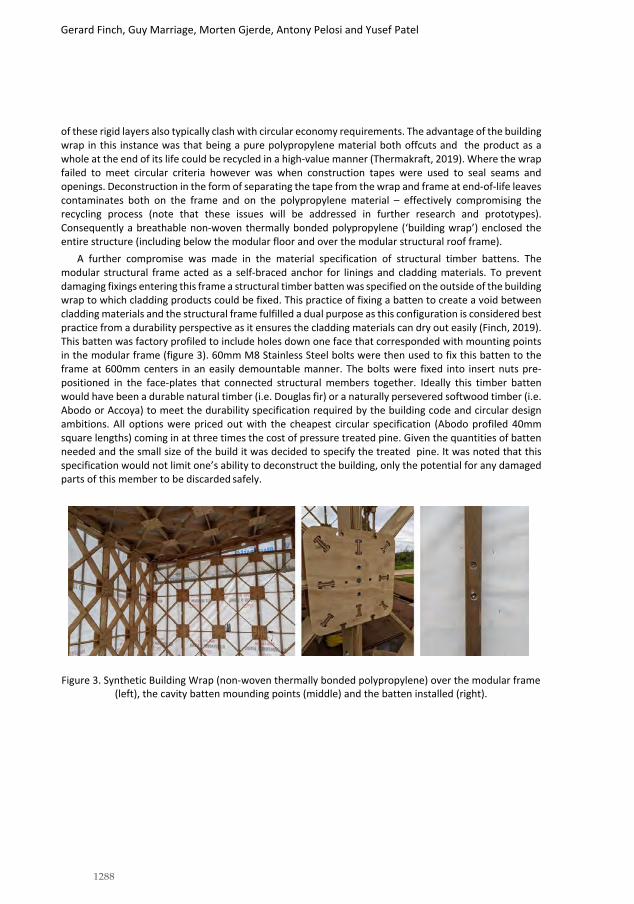
1288
Gerard Finch, Guy Marriage, Morten Gjerde, Antony Pelosi and Yusef Patel
of these rigid layers also typically clash with circular economy requirements. The advantage of the building wrap in this instance was that being a pure polypropylene material both offcuts and the product as a whole at the end of its life could be recycled in a high-value manner (Thermakraft, 2019). Where the wrap failed to meet circular criteria however was when construction tapes were used to seal seams and openings. Deconstruction in the form of separating the tape from the wrap and frame at end-of-life leaves contaminates both on the frame and on the polypropylene material – effectively compromising the recycling process (note that these issues will be addressed in further research and prototypes). Consequently a breathable non-woven thermally bonded polypropylene (‘building wrap’) enclosed the entire structure (including below the modular floor and over the modular structural roof frame).
A further compromise was made in the material specification of structural timber battens. The modular structural frame acted as a self-braced anchor for linings and cladding materials. To prevent damaging fixings entering this frame a structural timber batten was specified on the outside of the building wrap to which cladding products could be fixed. This practice of fixing a batten to create a void between cladding materials and the structural frame fulfilled a dual purpose as this configuration is considered best practice from a durability perspective as it ensures the cladding materials can dry out easily (Finch, 2019). This batten was factory profiled to include holes down one face that corresponded with mounting points in the modular frame (figure 3). 60mm M8 Stainless Steel bolts were then used to fix this batten to the frame at 600mm centers in an easily demountable manner. The bolts were fixed into insert nuts pre-positioned in the face-plates that connected structural members together. Ideally this timber batten would have been a durable natural timber (i.e. Douglas fir) or a naturally persevered softwood timber (i.e. Abodo or Accoya) to meet the durability specification required by the building code and circular design ambitions. All options were priced out with the cheapest circular specification (Abodo profiled 40mm square lengths) coming in at three times the cost of pressure treated pine. Given the quantities of batten needed and the small size of the build it was decided to specify the treated pine. It was noted that this specification would not limit one’s ability to deconstruct the building, only the potential for any damaged parts of this member to be discarded safely.
Figure 3. Synthetic Building Wrap (non-woven thermally bonded polypropylene) over the modular frame (left), the cavity batten mounding points (middle) and the batten installed (right).

1289
Understanding the challenges of circular economy construction through full-scale prototyping
4.3 Cladding and Linings
Over the structural batten was fixed an experimental modular cladding solution centred on a thermally modified plywood material (figure 4). This material is reported to achieve a 15 year durability specification from a softwood based timber without any chemical preservatives. After the lifespan of the cladding the materials can be resurfaced and reused or returned to the earth without any negative side- effects. To complete the circular nature of this bespoke cladding a shingle pattern was created. Circular economy guidelines recommend the use of smaller and more modular components in buildings as they are easier to handle, less prone to damage and simple to fit into a reuse situation (Crowther, 2005; Durmisevic and Brouwer, 2002). The adopted cladding follows this guide and required only three standard parts to enclose the building. The base shingle specification was a 595mm square panel cut from standard sized plywood sheets (resulting in negligible wastage of <1% per sheet). These panels were fixed to the structural battens using a self-aligning galvanised bracket and 50mm long stainless steel screws. The overlapping nature of the singles meant that no corking/sealant was required and the overall assembly used approximately 60% less fixings then normally required.
The building’s interior was insulated using a wool blend insulation and lined with prefabricated modulated panels fixed using a reversible pressure-clip mechanism (figure 4). The choice of woolen insulation was motivated by the local supply of the material, the take-back scheme operated by the manufacturer and the materials hydrophilic capabilities. Given that the prototypes wall assembly did not include a vapor barrier it was deemed essential that there be a material in the wall cavity capable of managing moisture vapor. According to the manufacture (TerraLana, 2020) the wool fibers will absorb moisture vapor and release it back over time when the relatively humidity drops. This action prevents the build-up of condensation on the inside of the building wrap and thus prolongs the life of the building. The prefabricated plywood linings covering this insulation used a 2-part male/female pressure clip. Installation of these clips was accelerated by the prepositioned holes in the modular framing system that corresponded with pre-routed holes in the rear of each lining (figure 4).
Figure 4. Installation of the Thermally Modified Plywood Cladding (left), a close up image of the pressure clip receptacle used for the internal linings (centre) and the finished lined interior (right).

1290
Gerard Finch, Guy Marriage, Morten Gjerde, Antony Pelosi and Yusef Patel
6. ConclusionsThrough prototyping this research explored the technical challenges of achieving a circular economy building with timber as the base structural material. The ten square meter prototype building allowed a series of hypothesized circular building solutions to be examined and evaluated in ‘real-world’ use case. As a result of this process a series of key learnings were identified and used as the parameters to improve the circular building approach.
Undertaking a physical full-scale test of the proposed circular building system was viewed at the time as a necessary step in validating the proposed research ideas. On reflection, however, learnings and outcomes gained from the build process could have been equally identified through a thorough prosecution of a digital 3D model. This observation came post construction when documentation of failures identified during the build process were being produced. It was found that all issues noted during construction could have been flagged by simply ‘deconstructing’ the digital model. The one area where this observation did not apply was to issues of material capabilities (such as plywood parts warping/twisting due to exposure to moisture and thermally modified timber failing to hold short screws).
In future research there is the opportunity to lean further towards natural building methods (adobe, earth, timber post and beam, straw-bale etc) to achieve circularity. This research acknowledges the importance of such techniques and applauds their efforts. The methods adopted in this research attempted to blend natural building techniques with economical materials and scalable techniques and the result is a somewhat compromised version of circular construction. In the context of the 21st century matching ecological practices with economical drivers (both time and cost) will continue to challenge the implementation of circularity in buildings. Alongside this there is also an equal opportunity to lean towards more technical pursuits. Additive manufacturing on a building scale is emerging as a viable method of construction and there may be ecologically sensitive printable materials that allow for circular construction methods.
Physical construction processes revealed that although the standardised structural parts works effectively to create whole of wall panels a better approach would be a modification that allowed wall panels of a standard manageable width to be created and then joined to create longer wall sections. It was also identified that the modular structural system needed to be capable of further redundancies. The process of adding blocking to support cavity battens at their base or at corners introduced major contaminates to the system and slowed construction down. For those conducting research in this field the authors recommend conducting detailed reviews of complete virtual models before building. Finally the authors hope that findings from this field-study are useful for researchers and practitioners alike when aiming to create circular economy compatible buildings.
Acknowledgements This research was funded in part by the Building Research Levy of New Zealand. Construction of the prototype discussed in this paper was also supported by Steel and Tube New Zealand (sponsorship of the metal cladding, roofing and flashings), Abodo (supply of thermally modified plywood cladding), Fastmount (supply internal wall lining clips), Jacobson’s (supply of cradle to cradle certified flooring tiles) and the Faculty of Architecture at Unitec Institute of Technology (use of CNC routing equipment). A

1291
Understanding the challenges of circular economy construction through full-scale prototyping
special thanks to the projects client (Richard Beaumont), Unitec Lecturer (Yusef Patel) and Unitec Technical Staff (Richard Mcilroy).
References Akinade, Olugbenga O., Lukumon O. Oyedele, Saheed O. Ajayi, Muhammad Bilal, Hafiz A. Alaka, Hakeem A. Owolabi,
Sururah A. Bello, Babatunde E. Jaiyeoba, and Kabir O. Kadiri. “Design for Deconstruction (DfD): Critical Success Factors for Diverting End-of-Life Waste from Landfills.” Waste Management 60 (February 2017): 3–13. https://doi.org/10.1016/j.wasman.2016.08.017.
Alcorn, Andrew. “Global Sustainability and the New Zealand House.” PhD Dissertation, Victoria University of Wellington, 2010.
Allwood, Julian M., Michael F. Ashby, Timothy G. Gutowski, and Ernst Worrell. “Material Efficiency: A White Paper.” Resources, Conservation and Recycling 55, no. 3 (January 2011): 362–81. https://doi.org/10.1016/j.resconrec.2010.11.002.
Babbitt, Callie W., Gabrielle Gaustad, Angela Fisher, Wei-Qiang Chen, and Gang Liu. “Closing the Loop on Circular Economy Research: From Theory to Practice and Back Again.” Resources, Conservation and Recycling 135 (August 2018): 1–2. https://doi.org/10.1016/j.resconrec.2018.04.012.
Baker-Brown, Duncan. The Re-Use Atlas: A Designer’s Guide towards a Circular Economy. RIBA Publishing, 2017. Beurskens, Pieter, Elma Durmisevic, Michiel Ritzen, and Jos Lichtenberg. “A Morphological Design and Evaluation
Model for the Development of Circular Facades.” Utrecht, the Netherlands, 2016. Brand, Stewart. How Buildings Learn: What Happens after They’re Built. New York, NY: Viking, 1994. Braungart, Michael, and William McDonough. Cradle to Cradle: Remaking the Way We Make Things. 1st ed. New
York: Farrar, Straus and Giroux, 2002. Broadbent, Clare. “Steel’s Recyclability: Demonstrating the Benefits of Recycling Steel to Achieve a Circular
Economy.” The International Journal of Life Cycle Assessment 21, no. 11 (November 2016): 1658–65. https://doi.org/10.1007/s11367-016-1081-1.
Charter, Martin, ed. Designing for the Circular Economy. London ; New York: Routledge, Taylor & Francis Group, 2018.
Commoner, Barry. The Closing Circle: Nature, Man and Technology. 1st ed. New York: Alfred A. Knopf, INC., 1971. Crowther, P. “Design for Disassembly - Themes and Principles.” RAIA/BDP Environment Design Guide, 2005. Crowther, Philip. “Design for Disassembly: An Architectural Strategy.” In Proceedings of the 1998 QUT Winter
Colloquium, 6, 1999. Durmisevic, Elma, and Jan Brouwer. “Design Aspects of Decomposable Building Structures.” In TG39 - Deconstruction:
Report of the 11th Rinker International Conference on Deconstruction and Materials Reuse, May 2003, 24, 2002. EPA. “Advancing Sustainable Materials Management: 2014 Fact Sheet.” United States of America.: United States
Environmental Protection Agency., 2016. Evan, Harry. “Industrial Ecologies.” Journal for International Labour Review 110, no. 3 (1974): 219–233. Finch, Gerard. “Defab: Architecture for a Circular Economy.” Masters Thesis, Victoria University of Wellington, 2019.
Finch, Gerard, Pelosi, Ant, Gjerde, Morten, Marriage, Guy and Patel, Yusef. “Circular economy optimised energy efficient building skins for residential construction in New Zealand”. Proceedings of the Advanced Building Skins Conference, Bern, Switzerland, 2019.
Fuller, Richard Buckminster, and Jaime Snyder. Operating Manual for Spaceship Earth. New ed. Baden: Müller, 2013.
Geissdoerfer, Martin, Paulo Savaget, Nancy M.P. Bocken, and Erik Jan Hultink. “The Circular Economy – A New Sustainability Paradigm?” Journal of Cleaner Production 143 (February 2017): 757–68. https://doi.org/10.1016/j.jclepro.2016.12.048.
Inglis, Mahara. “Construction and Demolition Waste – Best Practice and Cost Saving.” New Zealand, no. 057 (2007): 12.

1292
Gerard Finch, Guy Marriage, Morten Gjerde, Antony Pelosi and Yusef Patel
Kennedy, Greg. An Ontology of Trash: The Disposable and Its Problematic Nature. State University of New York Press, 2007.
MacArthur Foundation, Ellen. “What Is the Circular Economy,” 2020. https://www.ellenmacarthurfoundation.org/CIRCULAR-ECONOMY/WHAT-IS-THE-CIRCULAR-ECONOMY.
Mathews, John A., and Hao Tan. “Circular Economy: Lessons from China.” Nature 531, no. 7595 (March 2016): 440– 42. https://doi.org/10.1038/531440a.
MfE. “The State of New Zealand’s Environment 1997.” New Zealand: The Ministry for the Environment., 1997. Nakajima, Shiro, and Mark Russell, eds. Barriers for Deconstruction and Reuse/Recycling of Construction Materials.
Working Commission W115 Construction Materials Stewardship 397. International Council for Research and Innovation in Building and Construction (CIB), 2014.
Rabl, Ari, Joseph V. Spadaro, and Assaad Zoughaib. “Environmental Impacts and Costs of Solid Waste: A Comparison of Landfill and Incineration.” Waste Management & Research 26, no. 2 (April 2008): 147–62. https://doi.org/10.1177/0734242X07080755.
Russell, Allen S. “Energy Savings in Aluminum Production, Use, and Recycling.” JOM 35, no. 7 (July 1983): 51–54. https://doi.org/10.1007/BF03338325.
Sahay, B. S., ed. Green Business. New Delhi: Allied Pub, 2006. Schmidheiny, Stephan, and Björn Stigson. Eco-Efficiency: Creating More Value with Less Impact. Dedicated to Making
a Difference. Conches-Geneva: World Business Council for Sustainable Development, 2000. Stahel, Walter R. “The Product-Life Factor.” Edited by G.S. Orr. An Inquiry into the Nature of Sustainable Societies.
The Role of the Private Sector, Houston Area Research Centre, Houston, 1982, 72–105. Stahel, Walter R., Geneviève Reday-Mulvey, and Geneviève Reday-Mulvey. Jobs for Tomorrow: The Potential for
Substituting Manpower for Energy. 1st ed. New York: Vantage Press, 1981. Storey, John B, Morten Gjerde, Andrew Charleson, and Maibritt Pedersen. “The State of Deconstruction in New
Zealand.” In Deconstruction and Materials Reuse - an International Overview, 93. Rotterdam (Netherlands): International Council for Research and Innovation in Building and Construction (CIB), 2005.
Sun, Feifei, Yun Dai, and Xiaohua Yu. “Air Pollution, Food Production and Food Security: A Review from the Perspective of Food System.” Journal of Integrative Agriculture 16, no. 12 (December 2017): 2945–62. https://doi.org/10.1016/S2095-3119(17)61814-8.
Thermakraft. 2019. “Thermakraft 401: Synthetic Self-Supporting Roof Underlay”. Thermakraft BRANZ Appraisal No. 943.
Webster, Mark, and Daniel Costello. “Designing Structural Systems for Deconstruction: How to Extend a New Building’s Useful Life and Prevent It from Going to Waste When the End Finally Comes.” In Proceedings of the 2005 Greenbuild Conference. United States of America, 2005.
Westerlo, B van de, Johannes I M Halman, and E Durmisevic. “Translate the Cradle to Cradle Principles for a Building.” Conference Proceedings of CIB W115 Green Design Conference, 27-29 September, Sarajevo, Bosnia and Herzegovina International Council for Research and Innovation in Building and Construction (CIB) (2012): 33–38.
Wood, Alexander, Pamela Stedman-Edwards, Johanna Mang, and World Wide Fund for Nature, eds. The Root Causes of Biodiversity Loss. London ; Sterling, VA: Earthscan, 2000.

1293
The 54th International Conference of the Architectural Science Association (ANZAScA) 2020
Understanding the performance gap of nearly zero-energy schools in Belgium
Shady Attia Department UEE, Faculty of Applied Sciences, Sustainable Building Design Lab, Université de Liège, 4000 Liège,
Belgium [email protected]
Abstract: This study aims to understand the energy use performance gap of Passive House (PH) schools and nearly zero-energy schools (nZES). The study reports the results of a recent field survey conducted on thirty nearly zero energy buildings constructed between 2015 and 2020. An analysis of energy consumption (electricity and natural gas) and a walkthrough survey were conducted. A representative simulation building energy data set and a reference model was created. The average energy use intensity per school (primary and secondary) was 59 and 42 kWh/m2/year. The paper provides insights into the underlying causes of a discrepancy between predicted and measured energy use. Findings on energy needs and use intensity are useful in temperate and continental climates.
Keywords: performance gap; energy model; energy audit; calibration
1. IntroductionThe European Energy Performance of Buildings Directive (EPBD) requires all new buildings to be nearly zero- energy buildings (nZEB) by 31 December 2020. The nearly zero or very low amount of energy required should be covered to a very significant extent from renewable sources, including sources produced on-site or nearby. Combining renewable energy and resource efficiency can play an essential role in the transition towards sustainability and carbon neutrality.
One of the fastest-growing sectors in Europe is educational buildings. According to Eurostat data (2018), the annual student population is growing. Before 2050, all member states will need to ensure a minimum growth of more than 40,000 new classrooms. Several national and regional governments have a target date of 2021 for every new school to be actively working on becoming energy neutral. In Belgium, education buildings are responsible for 1.5% of Belgium' greenhouse gas emissions (SPF, 2019).
The Passive House concept was strongly adopted in Belgium and evolved to be nearly Zero Energy Building concept. Between 2013 and 2019, more than 50 new nearly Zero Energy Schools (nZES) were constructed, but these new schools are challenging to evaluate. nZES are high-tech buildings that try to balance high indoor air quality and comfort conditions while keeping the ultra-low energy use target (De Reys, 2019). The determination of the boundary conditions, design strategies, and solutions for those schools remains challenging (Wauman et al., 2010).
A substantial knowledge gap in reliable benchmark models for high-performance schools makes it difficult for policy-makers and building professionals worldwide to evaluate the success of their policies and designs (Hernandez et al., 2008). This study' first objective is to conduct a field survey that reports building characteristics and end-use of energy patterns and energy costs. The second objective is to create a valid and up-to-date benchmark model of nearly zero-energy schools in Belgium.
This paper is based on Attia (2020) work and presents two simulation reference models created based on monitoring and analyzing 30 high-performance schools in Belgium. The approach aims to develop two benchmark buildings that are representative of the new schools built-in 2015-2018. The reference models are documented and implemented to use with the EnergyPlus energy simulation program. At the same time, the study provides insights on the energy performance discrepancies of nZES in cold, mild temperate and continental climates. Cities falling in those two regions will improve their understanding of the energy consumption of high- performance schools and how they can better monitor and control it.
Imaginable Futures: Design Thinking, and the Scientific Method. 54th International Conference of the Architectural Science Association 2020, Ali Ghaffarianhoseini, et al (eds), pp. 1293–1302. © 2020 and published by the Architectural Science Association (ANZAScA).

1294
Shady Attia
2. Methodology
2.1. Literature review
A literature review was conducted, including recent international publications that aimed to develop energy performance benchmarks for school buildings. Then, the research scope and focus were narrowed to Passive House schools and nZES. A local literature review followed this in the Belgian context.
2.2. Creation of a database for nearly zero energy schools in Belgium
The current study follows a cross-sectional study design where information was collected from literature and using a survey. An initial database was created and included schools built after 2013 that comply or exceed the requirements of the Belgian Passive House Standard (PHS). The PHS requires a highly insulated and airtight envelope (an air permeability of less than of 0,6vol/h at 50 Pa) (Moniteur Belge, 2008) with a net heating energy demand and net cooling energy demand ≤ of 15 kWh/m².year (AGION, 2015). The energy demand for heating and cooling should be calculated using a quasi-steady-state calculation method; the Passive House Planning Package (PHPP) 2007 (Passive House Institute, 2007). The school should include mechanical ventilation with heat recovery (MVHR) (Feist et al., 2005), and a zone is considered overheated when 5 percent of its occupied period exceeds 25oC (Mlecnik et al., 2011).
The database included several details on each school: location, construction age, occupancy density, measured energy heating and cooling, energy use intensity, energy performance certificate details, measured envelope airtightness, compactness of geometry, and construction cost. A final list and complete list of thirty schools were created to focus on energy efficiency and costs for nZESs for 2015-2018. The sample size was narrowed down in relation to data accuracy and completion—the analysis of the collected data involved finding a correlation between the construction costs and the energy performance.
2.3. Selection of the representative reference schools
According to literature, there are three main approaches to create reference models (Corgnati et al., 2013). The most common method is to develop theoretical reference models based on statistical data of the energy performance or thermal comfort of similar building typologies and functions in similar climates. In this approach, a typical meteorological weather file can be used. Because the data collected for the thirty nZESs were abundant, this modeling approach was chosen for the study.
A typology analysis took place for the thirty schools to select two representative building configurations. Plans and forms of thirty school configurations were described and analyzed, and Brussels typical meteorological year was chosen to perform the simulations. Overall, Belgium's climate is mild-cold and humid, with a significant amount of rainfall during the year.
2.4. Energy characteristics of representative schools
Two types of energy audits were conducted for the selected school buildings (Krarti, 2016). An analysis of energy consumption (electricity and natural gas) for the occupancy period of 2015-2018 was based on monthly consumption data. This step allowed understanding the building performance and identifying the pattern of use, peak demand, and seasonal climate impact. The second type of audit was based on walkthrough visits to identify and characterize the energy systems. This was followed by the envelope's characterization, aiming to identify the construction composition, air tightness, window types, and solar protection.
A survey was used to identify the occupancy density and profiles in classrooms based on a seasonal, monthly, weekly, and daily level. The survey addresses both school teachers and students, and once a repetition of the answers pattern was found, the survey was stopped. The collected data were compiled and analyzed to reflect the energy performance of realistic classroom operation situations when mechanical ventilation, space heating, and space cooling are turned on.
2.4.1. Occupancy density and profiles
Data were uploaded into a geodatabase that is used to store geo-referenced information. Data from all surveyed were analyzed holistically to ensure data integration across all sectors. The annual occupancy schedule has been set based on the Flemish and Walloon 2018-2019 annual teaching schedule because most of the case studies were in this region. The holidays have been subtracted from the occupancy schedule.
2.4.2. HVAC systems and comfort set points

1295
Understanding the performance gap of nearly zero-energy schools in Belgium
A special section in the energy audit involved characterizing the HVAC systems and energy sources. The Domestic Hot Water use (DHW) and consumption were identified from water meters, and the delivered water temperatures were measured. The airflow rate of the MVHR system was measured during different moments of the day to estimate the mechanical ventilation schedule. Also, the Building Management Systems (BMS) was checked, and the required data points for comfort control and management built and connected to field devices were reviewed. The programming and setpoint conditions for air conditioning and boilers were identified.
2.4.3. Lighting load intensity
The lighting of common areas and classrooms was reviewed, and occupancy control was identified. The luminaire type has been described, and it has been supposed that all the lighting equipment in the school were recessed.
2.4.4. Plug load intensity and schedules
An inventory of electrical appliances took place to determine the plug load intensities, as-well-as their operation schedules. The average class electrical appliances' presence and running hours were selected based on the field survey and walkthrough audit, and the plug load intensity was calculated based on appliance catalogs. To facilitate and unify the data on plug loads, all appliance powers were summarized less than one unit of power density for the estimated model.
2.5. Development of the benchmark models
Two representative simulation models were made based on the previously described selection process and building characterization. The validity of the estimate has been further checked against the public statistics and verified through a model calibration and utility bill comparison.
The simulations have been performed through the dynamic energy modeling software tool EnergyPlus (Version 8.2.0) (DOE, 2019). Calibration was done for evaluating the goodness-of-fit of the school buildings energy models according to ASHRAE Guideline 14 (Guideline, 2002) and using the whole building calibrated simulation approach (calibrated simulation). The guideline uses two indices to evaluate the goodness-of-fit of the building energy model. The Mean bias error, MBE, and the Coefficient of variation of the Root mean square error, CV(RMSE). MBE is a non-dimensional measure of the overall bias error between the measured and simulated data in a known time resolution, and it is usually expressed as a percentage:
𝑁𝑁𝑝𝑝 ∑ (𝑘𝑘𝑖𝑖−𝑆𝑆𝑖𝑖)MBE =
Where:
𝑖𝑖=1 𝑁𝑁𝑝𝑝 ∑ 𝑖𝑖=1
[%] (1)
mi = measured data; Si = simulated data at time interval i; Np = total number of data values.
CV (RMSE) represents how well the simulation model describes the variability in the measured data. It is defined as:
1 ∑𝑁𝑁𝑝𝑝 (𝑘𝑘 −𝑆𝑆 )2
CV(RMSE) = √ 𝑖𝑖=1 𝑘𝑘
𝑖𝑖 𝑖𝑖
𝑁𝑁𝑝𝑝[%] (2)
Where:
mi = measured data; Si = simulated data at time interval i; Np = total number of data values; m = average of measured data values.
According to the ASHRAE Guideline 14, the simulation model is considered calibrated if it has MBE that is not larger than 5% and CV(RMSE) that is not larger than 15% when the monthly data are used for the calibration. To get a reliable building energy model and increase the accuracy of estimating the building's performance, the models of schools underwent two subsequent calibrations. The building model was first calibrated on the basis of the building's measured monthly gas consumption ad was then refined in free-running with a second calibration concerning monitored hourly indoor air temperatures (Pagliano et al., 2016).
Hopfe et al. (2011) identified the independent variables that influence the performances of the building and are mostly affected by uncertainty. In this study, the class sizes are fixed and are not considered as a design variable. As the surveys and energy audits allowed to precisely quantify the type of windows, the power density of the electric equipment, and lighting, these parameters are not sources of significant uncertainty (Causone et
𝑘𝑘𝑖𝑖

1296
Shady Attia
al., 2015). The calibration process focused on independent testing variables that describe airtightness and the occupant density and schedule, and the heating system's global seasonal efficiency.
3. Results
3.1. Database for nearly zero energy schools
The database lists thirty projects that complied with the Belgian Passive House Standard requirements. The database includes the most critical energy performance indicators: occupant density, heating and cooling energy use, energy use intensity, and cost. The energy performance data represents the yearly average values collection between 2015 and 2018. The complete database can be found in the work of Attia et al. (2020).
3.1.1. Energy use intensity
The survey revealed that the average total energy use intensity was 50 kWh/m2/year in 2015-2018. As shown in Figure 1, the schools are heating-dominated, and we could conclude that several schools had overheating problems. The major energy use is electric represented by the blue and yellow color: electricity forms almost two-thirds of total energy use. This is mainly due to the mechanical ventilation and plug loads.
Figure 1: Measured energy use and breakdown
3.1.2. cost
The average cost for the thirty investigated project was 1450 euros per square meter. There was no correlation between the energy use intensity and the cost to be found. This cost is lower than the average schools' price in the same period, which is around 1500 euros/m2 (Dhondt, 2018).
3.2. Selected reference schools
Plans and forms of thirty school configurations were analyzed, and the rectangular classroom shape was found across all investigated plans. Two groups of schools were identified from the data collected: primary schools having two floors and a compact mass and secondary school with less compact plans and an average of 4 floors. Both typologies had to be distinguished due to the disparity regarding use, floor layout, building configuration, occupancy density, and energy performance. As shown in Figure 2 and Figure 3, two typical school typologies were identified and referred to as Typology 1 and 2. For this study, both typologies were selected and identified as representative nZES buildings.
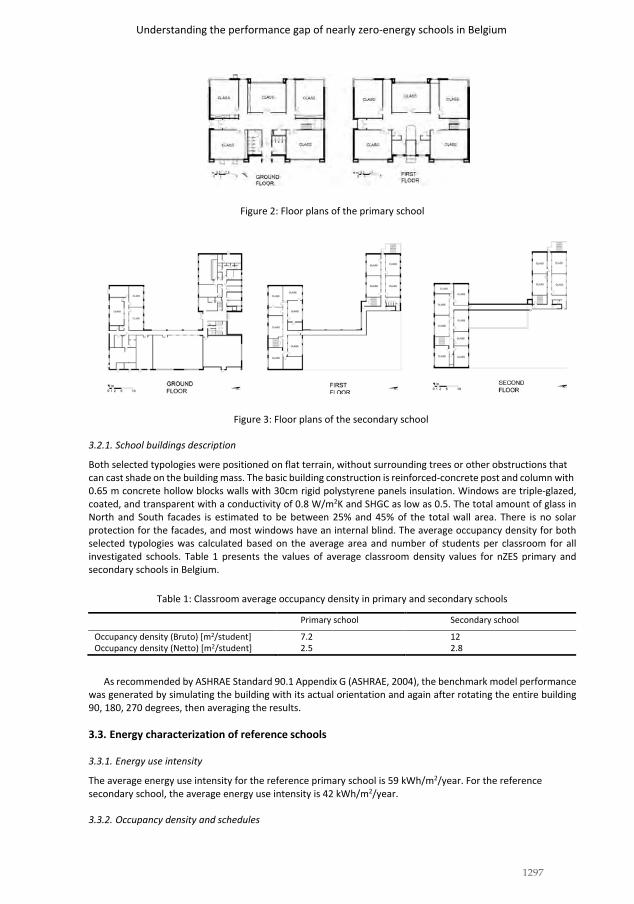
1297
Understanding the performance gap of nearly zero-energy schools in Belgium
Figure 2: Floor plans of the primary school
Figure 3: Floor plans of the secondary school
3.2.1. School buildings description
Both selected typologies were positioned on flat terrain, without surrounding trees or other obstructions that can cast shade on the building mass. The basic building construction is reinforced-concrete post and column with 0.65 m concrete hollow blocks walls with 30cm rigid polystyrene panels insulation. Windows are triple-glazed, coated, and transparent with a conductivity of 0.8 W/m2K and SHGC as low as 0.5. The total amount of glass in North and South facades is estimated to be between 25% and 45% of the total wall area. There is no solar protection for the facades, and most windows have an internal blind. The average occupancy density for both selected typologies was calculated based on the average area and number of students per classroom for all investigated schools. Table 1 presents the values of average classroom density values for nZES primary and secondary schools in Belgium.
Table 1: Classroom average occupancy density in primary and secondary schools
Primary school Secondary school
Occupancy density (Bruto) [m2/student] 7.2 12 Occupancy density (Netto) [m2/student] 2.5 2.8
As recommended by ASHRAE Standard 90.1 Appendix G (ASHRAE, 2004), the benchmark model performance was generated by simulating the building with its actual orientation and again after rotating the entire building 90, 180, 270 degrees, then averaging the results.
3.3. Energy characterization of reference schools
3.3.1. Energy use intensity
The average energy use intensity for the reference primary school is 59 kWh/m2/year. For the reference secondary school, the average energy use intensity is 42 kWh/m2/year.
3.3.2. Occupancy density and schedules

1298
Shady Attia
Based on available data, the occupancy period was defined from 7:00 to 18:00 on weekdays, while on the weekend, the building is considered empty. The model takes into account pupils' occupancy schedules, as-well- as school employees' presence. Absenteeism of 5% is taken into account with an operational schedule of 190 academic days. As shown in Figure 4, a lunch break is assumed daily between 12:00 and 13:00, where students leave the school or go to a commonplace.
Figure 4: Occupation schedule for the two school buildings
3.3.3. Internal load intensities (plug load intensity and schedules)
The clothing insulation and metabolic heat production were estimated based on NBN-EN 15251 (CEN, 2007) and ter Mors (2011). The occupant internal heat gains were estimated to be 80 W/pers, and the equipment heat gains were estimated to be 1 W/m2. All classrooms were modeled without computers: only teachers might have access to PCs in the school, and therefore, it was considered as negligible.
3.3.4. HVAC systems and comfort set points
In both reference schools, mechanical ventilation with heat recovery is installed. The HVAC system is coupled to an air handling unit with a Constant Air Volume (CAV) system to provide the minimum amount of fresh air per person of 20 m3/h based on the average Flemish and Walloon EPBD requirements (NBN EN 13799) (CEN, 2007). The reference case has been modeled using an HVAC template with a CAV. A user profile schedule controls the air handling units. An air-to-air heat exchanger is bypassed when the indoor operative temperature is lower than the indoor air temperature. Each classroom is pre-ventilated for 1 hour before the start of the school. The minimum supply air temperature is 16°C. The heat recovery system preheats the air with an efficiency of 75%.
The gas-fired boiler was modeled with an average a Coefficient of Performance (COP) of 0.9 coupled to the hot water loop for heating and sanitary hot water. The rooms' set point temperature is 20°C (minimum 16°C). Both selected schools had a mechanical cooling system and were modeled with a mechanical cooling system (Variable Refrigerant Flow (VRF) system).
3.3.5. Lighting lead intensity
Lighting systems had a power consumption of 6 W/m2 and was programmed in EnergyPlus as 2W/m2 per 100 Lux of light level. Then, a 300 lux threshold was used to reach the 6 W/m2. A daylight control system is coupled to a centrally positioned daylight sensor. The required illuminance of each classroom is specified in NBN EN 12464-1 (CEN, 2002).
3.3.6. Simulation model and validation
Two representative simulation models were built considering the previously described envelope, occupancy and energy systems, and characteristics. The principal model input parameter values are listed by Attia et al. (2020).
3.3.7. Numerical model calibration
The MBE and CV(RMSE) of monthly energy use for four consecutive years are calculated for both school models and reported in Table 2. Figure 5 and Figure 6 show the estimated gas use simulated in both models and the real gas use of both actual buildings. A good agreement was found in the monthly energy use behavior and curve shapes between the simulated data and the collected data. Figure 7 and Figure 8 show the estimated electricity use simulated in both models and the real electricity use of both actual buildings. Lower extremes represent the lowest and highest measured monthly electricity use. The upper and lower quartile of the red box includes 80% of the monthly measurements.

1299
Understanding the performance gap of nearly zero-energy schools in Belgium
Table 2: MBE and CV(RMSE) if the monthly energy use of both reference school models from 2015 to 2018
2016 2017 2018 2019 Statistical indices MBE CV(RMSE) MBE CV(RMSE) MBE CV(RMSE) MBE CV(RMSE)
(%) (%) (%) (%) (%) (%) (%) (%) Reference school 1 +5 -14 -6 -12 -2 -8 -3 -11 monthly calibration (natural gas) Reference school 1 5 10 3 14 4 12 4 12 monthly calibration (electricity) Reference school 2 3 14 4 10 4 9 4 11 monthly calibration (natural gas) Reference school 2 4 17 5 11 5 11 5 14 monthly calibration (electricity)
Figure 5: Surveyed and simulated monthly gas use of the primary school
Figure 6: Surveyed and simulated monthly gas use of the secondary school
Figure 7: Surveyed and simulated monthly electricity use of the primary school

1300
Shady Attia
Figure 8: Surveyed and simulated monthly electricity use of the secondary school
4. DiscussionTwo reference models for nearly Zero Energy Schools (nZES), represented primary and secondary schools recently built in Belgium, were developed and validated in this study. Benchmarking those newly constructed schools serves as a mechanism to evaluate and assess their real energy performance of buildings over time and share learned lessons. Benchmarking allows characterizing them through reference models to enable reliable simulations and future improvement.
4.1. Strength and limitations of the study
European experts in several organizations, including the Buildings Performance Institute Europe (BPIE), explicitly identified the need to create benchmark models validated and that can be used to assess energy use, indoor environmental quality, and user interaction in high-performance buildings (Atanasiu and Attia, 2011).
Benchmark models significantly influence the design decision-making during design and building energy use and indoor environmental quality during operation (Toleikyte et al., 2016). The implications of energy efficiency on building thermal comfort are severe, and climate change can jeopardize many efforts to reduce the cooling requirements and cooling systems (Yang and Lam, 2014). Benchmark models provide more significant resources for energy modelers and energy simulation experts and allow them to bridge the energy performance gap between operational and designed performance (Dasgupta et al., 2012). They can also be useful for sale or rental purposes.
Another benefit of our two benchmark models is to inform regulation and the regional EPBD experts. The study succeeded in characterizing both reference schools in a prescriptive and performance-based way, which can be vital in changing the regulatory compliance and certification process (Hernandez et al., 2008). The study can also be useful in countries with temperate and continental climates.
The model was calibrated using monthly data for almost four years. Ideally, it should have been tested against hourly operative temperature data, and the variations in occupancy should have been more investigated. The limits of the thirty cases database were pushed to get a good representative sample of the nZES building stock performance that can be developed in the future. However, the used cases were all built-in 2013-2018 with very similar energy performance requirements.
Another limitation is that indoor temperature and air change rates have been assigned standard and estimated values. The benchmark models succeeded in characterizing geometry, envelope, occupancy, and HVAC systems directly related to thermal and energy performance. There is a necessity to define the ventilation rates required in those school spaces about the energy losses and the mechanical ventilation systems' overall efficiency, including heat recovery. The findings indicate that most schools' energy use is electric as an effect of IAQ ventilation.
4.2. Implications for practice and future research
Future work should address indoor environmental quality and portray IAQ ventilation's adverse effect on energy use intensity. Future research should also test our building models with the occupant in the broader context and with a large sample of students concerning indoor environmental quality (Attia et al., 2019). More work is also needed to compare our benchmark model results to estimate the nZEB-tool developed by the PHPP (Kern, 2019). The use of multi-zone dynamic simulation models would lead to less discrepancy between the assumed modeling input and real occupancy and operation conditions concerning ventilation systems and air change rates (Allaerts et al., 2017).

1301
Understanding the performance gap of nearly zero-energy schools in Belgium.
The implication of our work on practice can lead to revision of the EPBD and Belgian Passive House Standard requirements (PMP and Pixii). A comparison can be made during early design stages to assess and evaluate different design assumptions and boundary conditions. Countries with temperate climate in Europe and worldwide could adopt our benchmark models and refine them accordingly to estimate and assess the energy performance of nZES in their context.
This research provided a detailed characterization of the energy performance gap in recently construction high-performance schools. Future research should extend the focus on breaking down the electricity use under more items and measure their validity and relevance. Heat gains, lack of solar protection, and air change rates are the most critical parameters that influence the energy performance of nZES (Attia and Gobin, 2020). Future detailed audits should take place to assess the operation and model assumptions of mechanical ventilation systems. Further research and adoption of the same benchmark models would be excellent avenues for further research for further validating and generalizing the proposed models for nZES design and operation.
5. ConclusionIn this study, the energy use intensity and energy use breakdown of thirty nearly Zero Energy Schools (nZES), located in various areas throughout Belgium, is estimated and compared based on four-year measurement data (2015-2018). Two representative reference models were created and calibrated using EnergyPlus software. Study results indicate that both created reference models have a good validity in assessing the energy performance of nearly Zero Energy Schools built between 2015 and 2018 in Belgium. The models are reliable and consistent and can be used by future building energy modelers and experts. The models were calibrated according to ASHRAE Guideline 14 using two indices to evaluate the goodness-of-fit of the building energy model. The Mean bias error, MBE, and the Coefficient of variation of the Root mean square error, CV(RMSE), were used to prove that both model are accurate and valid.
The dominant energy use of electricity in Belgian nZES is mainly related to the intensive use of mechanical ventilation and electric installations. Most of the investigated schools succeeded in decreasing the energy needs for heating and cooling. However, thermal comfort, which was not investigated in this study, seems to be problematic. The cooing use was significant in a temperature climate such as Belgium and in schools, which are only occupied 27% (in average 2360 hours/yearly) of the year. The lack of solar protection for largely glazed facades, the lack of thermal inertia activation due tonight cooling blocking (for security reasons) are among the reasons for cooling energy needs increase.
The study highlights that most of those schools were built at a similar cost per square meter. The small variance is mainly due to the strict budget control maintained during the project delivery process. In this context, the study provided valuable insights on the cost.
Finally, the study provides several insights on the reference schools building and systems characteristics. The result confirms a significant energy performance gap between the early design performance assumptions and the real performance. The models can guide school design decisions, operators, and school owners about the energy performance and energy use intensity and characterize nearly Zero Energy Schools.
Acknowledgments The authors express their thanks to all survey respondents. The authors would like to acknowledge the Walloon Region and Liege University for funding gratefully. We would also like to recognize the Sustainable Building Design Lab for the use of monitoring equipment in this research and the valuable support during the experiments and data analysis.
References S. Attia, N. Shadmanfar, F. Ricci, "Developing two benchmark models for nearly zero energy schools," Applied Energy, 2020,
vol. 263, p. 114614. E. Recast, "Directive 2010/31/EU of the European Parliament and of the Council of 19 May 2010 on the energy performance
of buildings (recast)," Off. J. Eur. Union, vol. 18, no. 06, p. 2010, 2010. SPF, "The contribution of the main sectors to total emissions and their evolution share of different sectors in Belgium," 2017.
[Online]. Available: https://www.climat.be/fr-be/changements-climatiques/en-belgique/emissions-belges/emissions- par-secteur/. [Accessed: 11-May-2019].
G. De Reys, “Remediëring oververhittingsrisico passiefschool op basis van dynamische simulaties.”B. Wauman, R. Klein, H. Breesch, S. Van Loon, R. Baetens, and D. Saelens, "Determination of boundary conditions for passive
schools: impact on net energy demand for heating and cooling," in Workshop/studio, 2010, vol. 44, p. 100. P. Hernandez, K. Burke, and J. O. Lewis, "Development of energy performance benchmarks and building energy ratings for
non-domestic buildings: An example for Irish primary schools," Energy Build., vol. 40, no. 3, pp. 249–254, 2008.

1302
Shady Attia
Deprez, Bernard, "Be.passive: Schools," no. 3, p. 92, 2010. AkkP 33, Passivhaus-Schulen, Protokollband Nr. 33 des Arbeitskreises kostengünstige Passivhäuser Phase III. Darmstadt:
Passive House Institute, 2006. Moniteur Belge, “Flemish Government Decree concerning energy performances in school buildings, in Flemish: Belgisch
Staatsblad, Besluit van de Vlaamse Regering tot regeling van een aantal aangelegenheden ter uitvoering van het decreet van 7 december 2007 betreffende energieprestaties in scholen,” no. 2007, p. 235, 2008.
AGION, “Pilootproject Passiefscholen Bilan 2015,” AGION, Brussels, 2015. Passive House Institute, Passivhaus Projektierungspaket (PHPP) version 2007. 2007. W. Feist, J. Schnieders, V. Dorer, and A. Haas, "Re-inventing air heating: Convenient and comfortable within the frame of the
Passive House concept," Energy Build., vol. 37, no. 11, pp. 1186–1203, 2005. E. Mlecnik, S. G. M. Attia, and S. Van Loon, "Net zero energy building: A review of current definitions and definition
development in Belgium," in Passive house Symposium, 2011, vol. 1. S. P. Corgnati, E. Fabrizio, M. Filippi, and V. Monetti, "Reference buildings for cost optimal analysis: Method of definition and
application," Appl. Energy, vol. 102, pp. 983–993, 2013. M. Krarti, Energy audit of building systems: an engineering approach. CRC press, 2016. DOE, “EnergyPlus.” [Online]. Available: https://energyplus.net/. [Accessed: 12-Dec-2019]. A. Guideline, "Guideline 14-2002, Measurement of Energy and Demand Savings," Am. Soc. Heat. Vent. Air Cond. Eng. Atlanta
Ga., 2002. L. Pagliano, S. Carlucci, F. Causone, A. Moazami, and G. Cattarin, “Energy retrofit for a climate resilient child care centre,”
Energy Build., vol. 127, pp. 1117–1132, 2016. C. J. Hopfe and J. L. Hensen, "Uncertainty analysis in building performance simulation for design support," Energy Build., vol.
43, no. 10, pp. 2798–2805, 2011. F. Causone, S. Carlucci, A. Moazami, G. Cattarin, and L. Pagliano, “Retrofit of a kindergarten targeting zero energy balance,”
Energy Procedia, vol. 78, pp. 991–996, 2015. K. Dhondt, "Average Construction Cost' Schools of Tomorrow,'" 14-Jun-2018. A. S. ASHRAE, "Standard 90.1-2004, Energy standard for buildings except low rise residential buildings," Am. Soc. Heat. Refrig.
Air-Cond. Eng. Inc, 2004. E. CEN, "15251: 2007 Indoor environmental input parameters for design and assessment of energy performance of buildings
addressing indoor air quality, thermal environment, lighting and acoustics," Bruss. Belg., 2007. S. ter Mors, J. L. Hensen, M. G. Loomans, and A. C. Boerstra, "Adaptive thermal comfort in primary school classrooms: Creating
and validating PMV-based comfort charts," Build. Environ., vol. 46, no. 12, pp. 2454–2461, 2011. CEN, "Ventilation for non-residential buildings – Performance requirements for ventilation and room-conditioning systems,"
CEN, Brussels, 2007. C. E. de Normalisation, "EN 12464-1: Light and Lighting-Lighting of work places, Part 1: Indoor work places," Com. Eur. Norm.,
2002. A. Toleikyte et al., "ZEBRA 2020-Nearly zero-energy building strategy 2020. Strategies for a nearly Zero-Energy Building
market transition in the European Union," 2016. L. Yang, H. Yan, and J. C. Lam, "Thermal comfort and building energy consumption implications–a review," Appl. Energy, vol.
115, pp. 164–173, 2014. A. Dasgupta, A. Prodromou, and D. Mumovic, "Operational versus designed performance of low carbon schools in England:
Bridging a credibility gap," HVACR Res., vol. 18, no. 1–2, pp. 37–50, 2012. S. Attia, S. Garat, and M. Cools, "Development and validation of a survey for well-being and interaction assessment by
occupants in office buildings with adaptive facades," Build. Environ., vol. 157, pp. 268–276, 2019. Kern, Handboek nZEB-tool, voor het ontwerpen van een (nearly) Zero Energy Building. Ede, The Netherlands: Kennis Instituut
Kern, 2019. K. Allaerts, J. Al Koussa, J. Desmedt, and R. Salenbien, "Improving the energy efficiency of ground-source heat pump systems
in heating dominated school buildings: A case study in Belgium," Energy Build., vol. 138, pp. 559–568, 2017. S. Attia, C. Gobin, "Climate Change Effects on Belgian Households: A Case Study of a Nearly Zero Energy
Building". Energies, 13(20), 5357, 2020.

1303
The 54th International Conference of the Architectural Science Association (ANZAScA) 2020
Uniclass 2015 for Smart Cities
John Gelder University of South Australia, Adelaide, Australia
Abstract: Smart Cities (and Smart Precincts) entails the digital interconnection of a vast array of objects. These objects include smart buildings and smart infrastructure – digital twins – and their components. Rather than starting from scratch, those involved in the development of standards for Smart Cities are looking to the development of standards for building information modelling (BIM) for guidance. The UK is widely regarded as having set the framework for standardisation in its push towards BIM Level 2 for rollout in 2016, with the result that many of its standards are being adopted internationally.
One such standard is the classification system, Uniclass 2015, which is being adopted in Australia. Smart Cities does not have such a classification system. Uniclass 2015 is a good candidate as it already covers object classes from Complexes down to Products, across all sectors (buildings, landscapes, civil engineering, process engineering). However, it needs to be extended to properly serve Smart Cities. It particularly needs coherent tables for Regions (including cities) and Districts (including precincts). In this paper some specific proposals for these two tables are made.
Keywords: Classification; Uniclass 2015; Smart Cities; Smart Precincts.
1. IntroductionThe Smart Cities Council (2020a) defines a Smart City as “one that has digital technology embedded across all city functions”, though there are multiple other definitions for the concept (Albino et al, 2015). A vast range of object types is interconnected digitally, as it is for building information modelling (BIM) and building management systems (BMS) (Gerrish et al, 2017).
Those involved with Smart Cities are exploring standardisation (Le, 2019). The digital modelling of Smart Cities builds on BIM standards (Smart Cities Council, 2017; Beck, 2020). SMC’s Centre for Data Leadership held a Digital Twin Standards Discovery Session in July 2020. This addressed lessons to be
Imaginable Futures: Design Thinking, and the Scientific Method. 54th International Conference of the Architectural Science Association 2020, Ali Ghaffarianhoseini, et al (eds), pp. 1303–1312. © 2020 and published by the Architectural Science Association (ANZAScA).

1304
John Gelder
learned from BIM when creating Digital Twin standards, what government needs from such standards, what standards-building approach might be adopted and who should lead the development of these standards (Beck, 2020).
In Australia the Standing Committee on Infrastructure, Transport and Cities recommended “the development of standards for the collection and management of infrastructure related data, including metadata standards; and an objects library” (SCITC, 2016; 105). The adoption of a single classification system was a part of the Committee’s deliberations (SCITC, 2016; 87-89).
There have been a few papers on classification and Smart Cities, but they are not about the classification of the objects within a city that are digitally interconnected, which is what is being described here. Instead they are about the classification of Smart Cities themselves (Anthopoulos & Fitsilis, 2014), research into Smart Cities (Gupta et al, 2019), stakeholders in Smart Cities (van der Hoogen et al, 2019), pathways for Smart City development (Noori et al, 2020), application domains (Yin et al, 2015), or Smart City projects (Perboli et al, 2014).
The development of a single classification system for objects to support Smart Cities is both innovative – one does not exist – and would provide a lasting contribution to the concept – one is needed.
Developing a classification system that serves cities but not areas outside and between cities is a lostopportunity. The Smart Cities concept itself must be extended – most of the land on the planet is not part of a city at all, though some of it may be regarded as part of the hinterland of cities. Smart Precincts is also a self-limiting term, as these are mostly seen as components of cities and come with the same limitations (Newton et al, 2017). More generic terms are needed so that the digital twin concept can be extended fully, e.g. to support Agriculture 4.0 (Austrade, 2019) or even climate modelling (Vaughan, 2020). The suggested terms are Districts and Regions. Their everyday usage (e.g. shopping district, agricultural region) is close to the specialist usage in classification proposed in this paper, and the terms can be applied equally to cities and geographic areas beyond cities.
2. ModellingBIM entails the creation of ‘digital twins’ of buildings and their components, but the concept can be extended both horizontally (e.g. to non-building Entities such as tunnels and landscaping), and vertically, e.g. to aggregations of buildings (Complexes). Modelling for BIM entails mapping ‘part-of’ relationshipsup and down a coherent chain of object classes. For example, going down the chain, an ‘External wall’ (an Element) might comprise a ‘Masonry wall leaf system’ and other Systems, and this in turn comprises ‘Clay bricks’ and other Products. Going up the chain, an External wall, along with other Elements, might be apart-of an Administrative building (an Entity), which in turn is a part-of an Administrative complex (Figure 1).
What do Complexes aggregate to? Complexes include the conventionally understood concept of sites or properties, but they also include the linear or networked sites or properties that serve and support these conventional sites – the road, path and other transport and utility networks. The boundaries of specific Complexes are easy to define. A collection of such sites and networks is a District. Every bit of a District is assigned to one Complex or another. A District might be classed as retail, administrative, residential or industrial, or agricultural. The boundaries of a specific District (an ‘instance’ of a District) might be hard to define, maybe even somewhat arbitrary, and so could be defined differently by different users. For example, the local Council might define them by zoning in the

1305
Uniclass 2015 for Smart Cities
Town Plan, whereas concepts such as Central Business District (CBD) will be adopted by the users of the town or city and may not entirely match Council zoning boundaries. Development agencies may have other views, in the form of Development Precincts (e.g. Brisbane Development, 2020). District boundaries are user-defined.
Figure 1: Part-of vs Type-of relationships
What do Districts aggregate to? The next step up in the model would be the Region, the city being one example. Regional boundaries would also be user-defined – when we talk about Adelaide in SA, do we mean the City of Adelaide council area, metropolitan Adelaide (Data SA, 2020) or the Greater Adelaide Region (DPTI, 2017)? All are legitimate regions from a classification point of view but are nested within each other. Regions may cut across District boundaries in some cases.
Two points should be made here about modelling using these object classes. First, just as an Educational Complex, such as a University, will include non-Educational Entities (such as the admin building or the carpark), so a Residential District will include non-Residential Complexes, such as a corner shop or a park, and of course the road network. The same sort of thing applies to Residential regions.
Second, just as a Complex (or site) may comprise just one Entity (a single building that extends to all the site boundaries), so it is possible for a Region to contain just one District, and for a District to contain just one Complex. This concept applies right down the object hierarchy. A Garden wall (Element) might comprise just one system (Dry-stone wall system), which comprises just one product (Natural rubble

1306
John Gelder
stone). In other words, a site (Complex) boundary could also be the boundary to a District, or even a Region. However, this one-to-one ‘part-of’ mapping will not be common.
3. Uniclass 2015 In contrast to modelling, classification is concerned with ‘type-of’ relationships. BIM (also known as Digital Engineering) is built on classification (Birchall, 2014). BIM tools such as COBie, buildingSMART’s open-BIM .ifc file types, Autodesk Revit, Graphisoft Archicad and NBS Chorus provide homes for classifications, and allow multiple classification systems to be used. In a classification system, each level in the object hierarchy – each object class – is served by a classification table. There will be tables for each of Products, Systems, Elements and so on (Figure 1). For example, in the Products table, Clay bricks are a type-of Masonry unit, along with Concrete blocks and AAC blocks.
For Smart Cities, building on an existing classification that already serves BIM across all sectors (building, landscaping, civil engineering, process engineering) would be ideal, rather than developing a classification system from scratch. There are just two BIM-ready classification systems to choose from: the Swedish CoClass (Svensk Byggtjänst, 2020) and the UK’s Uniclass 2015 (NBS Enterprises Ltd, 2020). The North American OmniClass (CSI, 2020) is not BIM-ready (Gelder, 2013). None of these systems deals with large-scale objects such as precincts and cities – no construction classification system does.
Uniclass 2015 has been adopted in Australia, in NSW and Victoria (Gelder, 2020) and in Queensland (QGCDG, 2020). Uniclass 2015 was recommended for adoption by NATSPEC in Australia and CIL in New Zealand (2018). It has also been adopted in Japan (Murase, 2020) and for projects in Malaysia (Collins, 2020). More formal adoptions are expected. Because of these adoptions this paper focuses on the application of Uniclass 2015 to Smart Cities and beyond, rather than CoClass or OmniClass.
Responding to the Digital Twin Standards Discovery Session (above), the UK government pushed the development of seven standards to support the roll-out of BIM Level 2 in 2016, including a single classification system that complied with ISO 12006-2:2015 and met a range of other competition criteria (SBRI & TSB, 2014). This use of a competition was an unusual approach and led to the completion of Uniclass 2015 by the winning consortium (led by NBS) and its subsequent UK adoption (Gelder, 2015a). Apart from Uniclass 2015, the PAS/BS 1192 series of standards is being adopted internationally, through conversion to the ISO 19650 series (UK BIM Framework, 2020).
Uniclass 2015 includes tables for physical object classes from Complexes down to Products, as outlined above. These tables are designed to support BIM, in which Complexes are mapped to their component Entities, and vice versa. The Uniclass 2015 object class hierarchy is shown in Figure 2. The two dashed tables do not yet exist in Uniclass 2015. Both are needed if the classification system is to fully support Smart Cities and Smart Precincts. They are also needed to support the merge of BIM and geographic information systems (GIS), in practice and through standardisation (Andrews, 2018; ISO/DTR 23262.2, 2020). This takes us outside the scope of ISO 12006-2:2015, which has Complexes as the highest-level physical object class.
Particularly relevant to Smart Cities is the transport and utilities infrastructure content of Uniclass 2015. This has been developed with the assistance of infrastructure agencies in the UK, and with Transport for New South Wales (TfNSW) in Australia. International industry engagement is key to the ongoing development and adoption of this classification system.

1307
Uniclass 2015 for Smart Cities
Figure 2: Uniclass 2015 object hierarchy.
The basic principles of Uniclass 2015 are straightforward (Gelder, 2015b). One of them is congruence between tables where possible. The Complexes, Entities, Spaces and Activities tables are all congruent, being based on activities. For example, each table includes a Residential group (‘residential’ being an activity grouping), and this is Group 45 in every case. This simple concept can also be applied to tables for Districts and Regions. Indeed, applying this concept would generate these two tables in a very simple way, though some editing is needed to cull irrelevant items. That is, we would end up with Di_45 Residential districts, and Re_45 Residential regions. Table 1 shows the congruence between the Groups in the Complexes table, and in the proposed Districts and Regions tables.
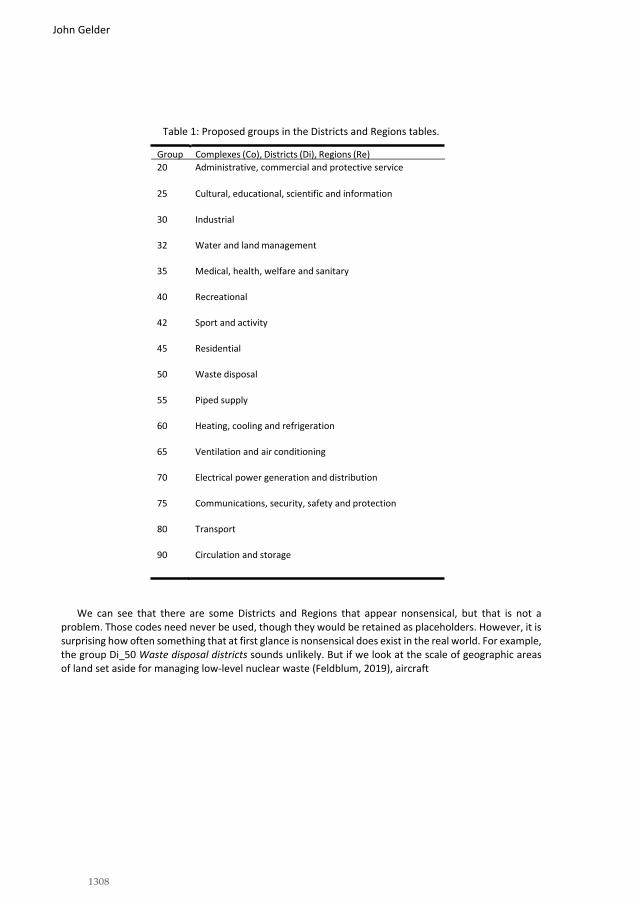
1308
John Gelder
Table 1: Proposed groups in the Districts and Regions tables.
Group Complexes (Co), Districts (Di), Regions (Re) 20 Administrative, commercial and protective service
25 Cultural, educational, scientific and information
30 Industrial
32 Water and land management
35 Medical, health, welfare and sanitary
40 Recreational
42 Sport and activity
45 Residential
50 Waste disposal
55 Piped supply
60 Heating, cooling and refrigeration
65 Ventilation and air conditioning
70 Electrical power generation and distribution
75 Communications, security, safety and protection
80 Transport
90 Circulation and storage
We can see that there are some Districts and Regions that appear nonsensical, but that is not a problem. Those codes need never be used, though they would be retained as placeholders. However, it is surprising how often something that at first glance is nonsensical does exist in the real world. For example, the group Di_50 Waste disposal districts sounds unlikely. But if we look at the scale of geographic areas of land set aside for managing low-level nuclear waste (Feldblum, 2019), aircraft

1309
Uniclass 2015 for Smart Cities
‘boneyards’ (AMARC Experience, 2020) or landfill sites (NYC Department of Parks & Recreation, 2020), the concept is realistic.
In any case, the object classes in Uniclass 2015 are scale neutral. Products are not always small simple things such as bricks or bolts. Some are large and complex, such as chillers. Some Entities are tiny (garden shed) and some are vast (such as Norman Foster’s 2004 Milau Viaduct, at 2460 m long). Likewise, Districts may be relatively small (often the case if we look at zoning maps) or huge, as may Regions.
The concept of congruence illustrated in Table 1 at group level also applies below group level in Uniclass 2015. For example, in the Districts table we would have, in Group 20, Di_20_50_78 Shopping districts (Phillips, 2017) and Di_20_60_66 Navy districts (such as Fleet Base East in Sydney). In Group 25 we would have Di_25_30_04 Astronomical observatory districts (such as the Siding Springs Observatory in NSW), and so on. These are each parallel to objects in the Complexes table, and to objects in the Regions table such as Re_25_30_04 Astronomical observatory regions (e.g. the Square Kilometre Array in WA).
For Groups 50 to 80, we would need to introduce the concept of district networks and regional networks, to cover reticulated districts and regions. This has been sketched out by the author and diverges from the Complexes table. District examples would include Water distribution district networks, Heating district networks, District narrow-gauge rail networks, District hiking ways, and Cable car networks. Examples for Regions are fewer and would include Electrical power transmission and distribution regional networks, Regional freight rail networks, Regional hiking ways (such as the Heysen Trail in SA), and Regional canal networks. These networks may manifest in part as easements on land supporting other activities.
Finally, ISO 12006-2:2015 allows alternative tables for object classes. So, for Entities, the ISO proposes a table by function (as here) and a table by form. This is particularly relevant for Regions. In this proposal a city, with its suburbs, would be classed as a residential region. But other classifications for Regions are widely used, e.g. by climate type, soil type, vegetation type, susceptibility to flooding, land use, geology, language groups, production. These would require separate classifications, many of which already exist, such as the Köppen-Geiger classification for climate (Kottek et al, 2006), the Australian Soil Classification (Isbell & NCST, 2016) and the AIATSIS map of indigenous Australia for language groups (Horton, 1996). The Australian Land Use and Management Classification is focused on what most of the land is doing (production) rather than on what most of the people are doing (activities) (ABARES, 2016). However, it would provide a useful check and balance in the development of the proposed tables. The point here is that a given area of land could have multiple regional classifications, activity (through Uniclass 2015) being just one.
4. Some other issues In modelling using these tables, the object class is just the beginning. In each Region there may be different types of Shopping or Residential districts. For example, ‘Shopping district type A’ may be in the form of an undercover mega-mall, ‘Shopping district type B’ may be an open-air market, and ‘Shopping district type C’ may be in the form of a souk. There may also be more than one instance of these various types, often with their own proper names for this scale of object, such as Chadstone Shopping Centre in Victoria or, for a Residential district, the name of the suburb, such as Burnside in Adelaide. This trio of

1310
John Gelder
class, type and instance is applied to modelling at all levels in the hierarchy, with Door systems being a familiar example at the Systems level. Smart Cities tools should support this trio, as BIM tools do.
There are a couple of other object classes currently missing in Uniclass 2015 – Properties (highlighted in Gelder, 2018) and Vehicles (highlighted in Gelder & Pourazim, 2017). Work on the Properties table is underway.
The classification of Vehicles is essential to Smart Cities, which is often focused on linking vehicles flowing through the city to the city’s vehicle control infrastructure, such as signalling systems. A challenge here is that some vehicles and buildings can be viewed as being on the same continuum, from fixed to mobile. For example, in the real world we have fixed residential entities (houses), transportable homes (no wheels or motive capability), caravans (wheels, but no motive capability), and mobile homes (wheels and motive capability). Do we treat these as a single entity class with a possible property of mobility (along with others such as temporary/permanent, custom-made/off the shelf), or do we classify each separately? If the latter, then we also need to allow for these variations for other entity classes, such as bridges or school buildings, potentially quadrupling the size of the classification system. We also have a possible conflict between the Tools and Equipment table in Uniclass 2015 for objects such as cranes. This requires careful thought to resolve. The general objective of Uniclass 2015 is to keep things simple – so it has Clay bricks, but not Hand-made clay bricks, Recycled clay bricks, Red clay bricks, Wire- cut clay bricks and so on. These other attributes are dealt with as properties and not used for classification. Mobility could be treated in the same way, as just another (potential) property of houses, bridges, school buildings, cranes and so on. Vehicles not on a ‘mobility continuum’ would need to be added to the relevant tables, along with the components of vehicles.
5. Conclusion The creation of ‘digital twins’ at the scale of Smart Precincts and Smart Cities requires the development and implementation of standards, several which have been developed through the UK government’s 2016 BIM mandate. Of these, some are being adopted internationally. One such is the UK’s standard classification system for the digital construction industry, Uniclass 2015 which is being adopted outside the UK, including in Australia. While it covers many object classes that would be of interest in the Smart Cities implementation of a digital twin, it does not yet include three key tables – Regions, Districts and Properties.
These need to be developed. Just as TfNSW is engaged with NBS in the development of transport infrastructure content in Uniclass 2015, so SMC and other stakeholders in the development of Smart Cities and Smart Precincts could engage with NBS in the development of these proposed tables.
References Albino, V., U. Berardi, & R.M. Dangelico (2015) ‘Smart Cities: Definitions, dimensions, performance, and initiatives’,
Journal of Urban Technology, February, DOI: 10.1080/10630732.2014.942092. AMARC Experience (2020), website: www.amarcexperience.com/ui/index.php (accessed 14 August 2020). Andrews, C. (2018) ‘GIS and BIM integration leads to Smart Communities’, Esri Arcuser, Spring, online at:
www.esri.com/about/newsroom/arcuser/gis-and-bim-integration-leads-to-smart-communities/ (accessed 14 October 2020).
Anthopolous, L.G. & P. Fitsilis (2014) ‘Smart Cities and their role in city competition: A classification’, International Journal of Electronic Government Research, August.

1311
Uniclass 2015 for Smart Cities
Austrade (2019) Agtech in Australia: Driving IOT connectivity for farming, Australian Trade and Investment Commission, Canberra.
ABARES (2016) Australian Land Use and Management Classification, Version 8, Australian Bureau of Agricultural and Resource Economics and Sciences, Canberra.
Beck, A. (2020) ‘Digital Twin standards – where to now?’, Digital Twin Hub, online at: www.digitaltwinhub.org/post/digital-twin-standards (accessed 17 August 2020).
Birchall, S. (2014) ‘BIM classification’, PCSG, online at: www.designingbuildings.co.uk/wiki/BIM_classification (accessed 12 October 2020).
Brisbane Development (2020) ‘Major precincts’, Brisbane Development, online at: https://brisbanedevelopment.com/major-precincts/ (accessed 17 August 2020).
Collins, R. (2020) ‘The “I” in BIM: Catch me if you can’, Gamuda Engineering, August, presentation online at: www.youtube.com/watch?v=rM9rtHsQA9k (accessed 1 September 2020).
Construction Specifications Institute (2020) ‘OmniClass’, CSI, online at: www.csiresources.org/standards/omniclass (accessed 12 October 2020).
Data SA (2020) ‘Metropolitan Adelaide Boundary (Development Act 1993)’, Data SA, online at: https://data.sa.gov.au/data/dataset/metropolitan-adelaide-boundary-development-act-1993 (accessed 18 August 2020).
Department of Planning, Infrastructure and Transport (DPTI) (2017) The 30-year plan for Greater Adelaide: 2017 update, DPTI, Adelaide.
Feldblum, S. (2019) ‘All spent nuclear fuel in the U.S. will soon end up in one place’, National Geographic, 30 July, online at: www.nationalgeographic.com/environment/2019/07/new-mexico-nuclear-waste-storage/ (accessed 14 August 2020).
Gelder, J.E. (2013) ‘OmniClassTM: a critique’, thenbs.com, May, online at: www.thenbs.com/knowledge/omniclass-a- critique (accessed 12 October 2020).
Gelder, J.E. (2015a) ‘The design and development of a classification system for BIM’, in BIM 15: First international conference on BIM in design, construction and operations, WIT Press, Southampton (477-491).
Gelder, J.E. (2015b) ‘The principles of a classification system for BIM: Uniclass 2015’, in R.H. Crawford and A. Stephan (eds.), Living and learning: Research for a better built environment: 49th International Conference of the Architectural Science Association 2015, Melbourne, 2-4 December (287-297).
Gelder, J.E. & R. Pourazim (2017) ASA Asset classification review report, AECOM, Sydney (unpublished report for TfNSW).
Gelder, J.E. (2018) Asset data harmonisation stage III: ASP2112 – BIM IFC alignment review, Austroads, Sydney. Gelder, J.E. (2020) ‘The adoption of Uniclass 2015 in Australia’, 10th Annual BIM Report, NBS, Newcastle upon Tyne
(30-34). Gerrish, T., K. Ruikar, M. Cook, M. Johnson, M. Phillip & C. Lowry (2017) ‘BIM application to building energy
performance visualisation and management: Challenges and potential’, Energy and Buildings 144, 1 June (218- 228).
Gupta, P., S. Chauhan & M.P. Jaiswal (2019) ‘Classification of Smart City research – a descriptive literature review and future research agenda’, Information Systems Frontiers 21 (661-685).
Horton, D.R. (1996) AIATSIS map of indigenous Australia, AIATSIS, online at: https://aiatsis.gov.au/explore/articles/aiatsis-map-indigenous-australia (accessed 17 August 2020).
Isbell, R. & National Committee on Soil and Terrain (2016) Australian Soil Classification, 2nd edition, CSIRO Publishing, Canberra.
ISO 12006-2:2015 Building construction - Organization of information about construction works - Framework for classification, ISO, Geneva.
ISO/DTR 23262.2 (2020) GIS (Geospatial) / BIM interoperability (under development), ISO, Geneva. Kottek, M. et al (2006) ‘World map of the Köppen-Geiger climate classification updated’, Meteorologische Zeitschrift
15/3 (259-263). Le, V. (2020) ‘Smart standards for smarter cities’, Standards Australia, 6 April, online at:
www.standards.org.au/news/blog/2020/april/smart-standards-for-smarter-cities (accessed 17 August 2020).

1312
John Gelder
Murase, H. (2020) ‘Japan opted for Uniclass 2015’, Nihon Sekkei, Tokyo, 24 June, private communication. NATSPEC & Construction Information Ltd (2018) The Open BIM Object Standard (consultation draft), CIL/NATSPEC. NBS Enterprises Ltd (2020) ‘Uniclass 2015’, NBS, online at: www.thenbs.com/our-tools/uniclass-2015 (accessed 17
August 2020). Newton, P., J. Plume, D. Marchant, J. Mitchell & T. Ngo (2017) ‘Precinct information modelling: A new digital platform
for integrated design, assessment and management of the built environment’, in A.X. Sanchez et al (eds) Integrating information in built environments: From concept to practice, Taylor and Francis, London.
New York City Department of Parks & Recreation (2020) ‘Freshkills Park’, NYC Parks, online at: www.nycgovparks.org/park-features/freshkills-park (accessed 17 August 2020).
Noori, N., T. Hoppe & M. de Jong (2020) ‘Classifying pathways for Smart City Development: Comparing design, governance and implementation in Amsterdam, Barcelona, Dubai, and Abu Dhabi’, Sustainability 12, 4030.
Perboli, G., A. de Marco, F. Perfetti & M. Marone (2014) ‘A new taxonomy of Smart City projects’, Transportation Research Procedia 3 (470-478).
Phillips, K. (2017) ‘Sydney’s most fashionable shopping precincts’, Travel Insider, online at: www.qantas.com/travelinsider/en/explore/australia/new-south-wales/sydney/the-best-fashion-shopping- precincts-in-sydney.html (accessed 18 August 2020).
Queensland Government Customer and Digital Group (QGCDG) (2020) ‘BIM projects – data and information guideline’, QGCIO, 8 July, online at: www.qgcio.qld.gov.au/documents/bim-projects-data-and-information- guideline (accessed 13 August 2020).
SBRI & TSB (2014) SBRI/TSB 189-010: Functional specification: A digital tool for building information modelling, SBRI, London.
Smart Cities Council (2017) Smart Cities guidance note: Smart Cities standards, SMC. Smart Cities Council (2020a) ‘Definitions and overviews’, SMC, online at: https://smartcitiescouncil.com/smart-
cities-information-center/definitions-and-overviews (accessed 13 August 2020). Smart Cities Council (2020b) ‘Digital Twin Week’, SMC, online at: https://smartcitiescouncil.com/partner-opps-
calendar/digital-twin-week (accessed 17 August 2020). Standing Committee on Infrastructure, Transport and Cities (2016) Smart ICT: Report on the inquiry into the role of
smart ICT in the design and planning of infrastructure, House of Representatives SCITC, Canberra. Svensk Byggtjänst (2020) ‘CoClass’, Svensk Byggtjänst, online at: https://coclass.byggtjanst.se/about#about-coclass
(accessed 12 October 2020). UK BIM Framework (2020) ‘Standards & guidance’, UK BIM Framework, online at:
https://ukbimframework.org/standards-guidance/ (accessed 12 October 2020). Van der Hoogen, A., B. Scholtz & A. Calitz (2019) ‘A Smart City stakeholder classification model’, Conference on
Information Communications Technology and Society, IEEE. Vaughan, A. (2020) ‘Building digital twins of Earth could help Europe cut carbon emissions’, New Scientist 3304, 17
October. Yin, C.T., Z. Xiong, H. Chen et al (2015) ‘A literature survey on smart cities’, Science China: Information Sciences 58.

1313
The 54th International Conference of the Architectural Science Association (ANZAScA) 2020
Unmanned Aerial Vehicle (UAV) Technology Based Safety Monitoring for Expressway Construction Projects
Udaraka Iroshana1, Mathusha Francis2 and Shanika Vidana Gamage3
1, 2, 3 University of Moratuwa, Katubedda, Sri Lanka {[email protected], [email protected], [email protected]}
Abstract: The distinctive nature of construction industry causes for numerous accidents and injuries. Safety monitoring in expressway construction projects is complex because of the extensive use of plants, equipment and workforce. Accidents and injuries can be prevented by proper safety monitoring techniques. On the other hand, the use of UAVs become common in progress monitoring in construction industry. Thus, the study aims to develop a framework assessing UAV technology-based safety monitoring in expressway construction projects in Sri Lanka. Initially a literature review was carried to identify the use of UAVs in construction industry. Review revealed that monitoring unsafe behaviour of workers, integration of site information with storage facilities, autonomous site inspection with GPS technology and identifying safety hazards are the usages of UVAs. Case study strategy is employed with three expressway projects. Experienced safety professionals were interviewed and content analysis was adopted to analyse the data. The findings revealed that UAV technology can be applied for the prospect of using efficient and accurate safety monitoring technique for identifying the presence of unauthorized people and vehicles, faulty works and non-use of safety measures. Research recommends to use UAV technology for safety monitoring in expressway projects in Sri Lanka.
Keywords: Safety monitoring; Unmanned Aerial Vehicle (UAV); expressways
1. Introduction During construction, accidents can be avoided by proper monitoring the workers and the environment of the project (Mohamed et al., 2020). Techniques for monitoring safety on construction projects are mainly manual and are decided on subjective opinion basis (Outay, Mengash & Adnan, 2020). Among safety monitoring activities, inspections and job safety observations are more complex in construction as those are more labour intensive and time-consuming. Recently, Virtual Reality (VR) technology, CCTV technology, Wearables technology and UAV (Unmanned Aerial Vehicle) technology are been used to monitor safety on construction projects while avoiding traditional shortcomings faced by safety supervisors (Tatum & Liu, 2017)
UAV is easily identified as drone, quadcopter, octocopter, helicopter, or fixed wing vehicle (Opincar, 2016). UAVs have been used to acceleration of project progress reports, construction project safety enhancement, quality control, project management and scheduling (Howard & Murashov, 2018). It helps to improve real time monitoring in projects (Tatum & Liu, 2017). Safety supervisor can obtain
Imaginable Futures: Design Thinking, and the Scientific Method. 54th International Conference of the Architectural Science Association 2020, Ali Ghaffarianhoseini, et al (eds), pp. 1313–1322. © 2020 and published by the Architectural Science Association (ANZAScA).

1314
Udaraka Iroshana, Mathusha Francis and Shanika Vidana Gamage
faster and more accurate information on work progress, working environment or identifying illegal activities inside construction project through UAV technology (Howard & Murashov, 2018). The UAVs are also capable of conducting automatic programmed security sweeps periodically to monitor safety in projects (Alizadehsalehi et al., 2018).
Expressway construction projects safety monitoring is complex because of the extensive use of plants, equipment, labourers, multidisciplinary and multitasked aspects of its project workforce. To avoid construction accidents and injuries, suitable safety management approaches are fruitful. Hence, a modern information technology-based method is required rather than traditional approaches for safety monitoring. As, it is difficult to monitor safety in expressway construction projects by traditional approaches, UAV based safety monitoring method will fruitfully enhance the safety monitoring in expressway projects. Although, most of researches have concentrated on enhancing the safety managing, only few have addressed on safety monitoring. Further, no evidences of previous studies were found on the application of UAV technology for safety monitoring in Sri Lankan expressway construction projects. Therefore, the study aimed to explore the applicability of UAV technology for safety monitoring in expressway construction projects in Sri Lanka to develop a framework.
2. Literature review
2.1. Usage of UAV technology in construction industry
Taking above definitions into consideration, Unmanned Aerial Vehicle (UAV) could be introduced as any motorized aerial vehicle that is not transporting a pilot, lifted using forces of aerodynamics, can fly on its own(self-processed) or be controlled by an operator on the ground, can be expendable and can carry a lethal (explosive war heads) or non-lethal (passengers or cargo) payload. Every type of UAV has components like frame, propellers, flight controller, motors, electronic speed controller (ESC) and battery (Tatum & Liu, 2017).
Due to versatile properties of UAVs, they could be widely used in the construction projects (Skorupka et al., 2017). UAVs are being applied in construction projects for various purposes. These technologies include project management, quality controlling, safety, time management, surveillance and uncooperating 3D photos through to a 4D BIM (Opincar, 2016). These technologies can be frequently used to inspect construction projects, monitor work progress, implement safety regulations and observe existing structures which are out of human reach (Outay et al., 2020).
Inspecting infrastructures such as road and rail network, liquid (water and oil) pipelines, aqueducts, tunnels and channels are essential to certify the reliability, strength and durability of these erections due to their massive land coverage areas (Hubbard, et al., 2015). Above authors have stated that UAVs can provide real-time visual details for inspection of the construction project area in bird’s eye view. A UAV can remain or fly over on an infrastructure and produce high quality images and video streams for surveillance and observation purposes (Irizarry & Johnson, 2014). Hence, Liu, et al. (2014) stated that UAVs facilitate a helpful perspective to catch up evidence from an extra point of view and potentially result remarkable advantages to construction industry.
Moreover, UAV technology can be combined with other modern technology to reduce the uncertainty of construction industry (Howard & Murashov, 2018). Most UAVs are programmed to travel along an earlier defined route by a GPS point arrangement known as waypoints that can be used to monitor or inspect infrastructure autonomously (Congress & Puppala, 2019). The UAV utilized with suitable detectors accomplishes taking measurements in different places. The temperature at the site,

1315
Unmanned Aerial Vehicle (UAV) Technology Based Safety Monitoring for Expressway Construction Projects
gas or electricity leaking and abnormally high temperature can be detected using a thermal imaging camera (Liu, et al., 2014). Perfect accuracy, efficiency and measurements speed are advantages of using above technologies. So that application of UAV technology ensures addressing drawbacks from traditional methods (Skorupka et al., 2017). Further, UAVs can be used to Safety Monitoring in construction projects.
2.2. Usage of UAV technology in Construction Industry for Safety Monitoring
Vigorous and automatic ways of field surveillance techniques connected with UAV have been useful for safety monitoring by obtaining details from photos and videos at the site as useful solutions due to current time-consuming and irresponsible visual observational methods (Jawade & Butale, 2020; Alizadehsalehi, Yitmen, Celik & Arditi, 2018). Moreover, using UAV technology for safety monitoring is the best alternatives among computer vision techniques (Howard & Murashov, 2018). Visualization technology with combined site details and storing media, can increase efficacy and usefulness of safety management by assisting Inspection Officers (Safety Officers) in monitoring the insecure activities of employees and construction equipment and tools in real time (Guo, Liu, & Zhang, 2014). Further, the authors stated that UAVs could be served as their eyes in the sky instead of safety managers physically going to each area to identify potential hazards. The Safety Inspection Officer’s responsibility of directly observing the site and interacting with employees constantly in real time are aided with exceptional application of UAVs (Outay et al., 2020). It would facilitate to catch up places with poor human access in the site and assist safety officers with live streaming videos (Gheisari et al., 2014). Therefore, safety officers can interact with workers easily (Siebert & Teizer, 2014). Moreover, the authors have stated that UAVs make it possible for safety inspection officers to communicate with workers if hazardous situations arise (Hubbard, et al., 2015). UAVs can also be useful in applications where accessibility is difficult (Skorupka et al., 2017).
Interference of UAV with AR can be recognized as a model of an effectively operating safety observation (Irizarry & Johnson, 2014). Moreover, the authors mentioned that UAVs with AR with real subjects can be used while performing a safety manager associated job under various conditions such as counting the number of safety helmets. Safety inspection officers should be able to control the UAV visually as well as autonomously (Alizadehsalehi, Yitmen, Celik, & Arditi, 2018). Having predefined paths or waypoints that obtained from GPS technology, UAV can automatically use with minimum user interference (Jawade & Butale, 2020; Opincar, 2016). Modern UAV technologies are being developed which associate X-ray technology and are capable of designing high resolution 3D maps of objects (Mohamed et al., 2020; Irizarry & Johnson, 2014). Above authors also have stated that this technology can be used to establish precise models of unidentified areas such areas behind walls for monitoring the structure of dangerous buildings, bridges or other complexes. In addition, multicomputers have unique advantages compared to other UAV types due to its low purchasing cost, low operational cost and maintenance costs. Its operating flexibility, the ease to steer it accurately in self-processing and pilot modes and good stability are known to be some unique advantages (Siebert & Teizer, 2014). These types of UAVs are capable of staying in sky while flying to monitor something even during rough weather condition (Skorupka et al., 2017).
The usage of UAVs in Sri Lanka has grown exponentially at present (Rifan & Adikariwattage, 2018). Low technological usage level in Sri Lankan construction industry has resulted the lack of using UAV at construction projects (Priyadarshani et al., 2013). However, according to Rifan & Adikariwattage (2018),

1316
Udaraka Iroshana, Mathusha Francis and Shanika Vidana Gamage
UAV technology is mostly used in cinematography field in Sri Lanka rather than in construction field, which only shows 5% total usage of the UAV technology.
3. Research methodology Due to the less popularity of the UAV concept in the construction industry of Sri Lanka, limited number of experts are available who have adequate knowledge and experience on the related area. Nevertheless, the study was carried out based on the opinions of the limited number of experts available in Sri Lankan Construction industry who have a sound knowledge on the subject area. Moreover, Saunders, Lewis & Thornhill (2009) expressed that qualitative approach is the best method when researcher’s objective is to collect the participant’s opinion on their knowledge and experience. Hence, as the most suited method, a qualitative research approach was selected to carry out this research.
Creswell (2014) has stated that research strategy relies upon the research approach, data to be collected and expected outcomes of the research. Furthermore, Saunders et al. (2009) stated that the case study strategy is used in particular interest where the researcher wishes to gain a depth understanding of the context of the study and the processes. Thus, case study strategy is most suited for this study as it requires an in-depth analysis of the applicability of UAV technology for safety monitoring in expressway construction projects in the given context. However, unit of analysis for the case study is considered as ‘expressway construction project in Sri Lanka’. In the process of selection of cases, the study has selected multiple cases against a single case, as multiple cases provide multiple sources of evidence and replication of findings. Therefore, with the intention of increasing the reliability of the overall research, this study selected three expressway construction projects in Sri Lanka which involve sound applications on safety monitoring at different locations such as Colombo, Kandy and Matara. A brief description of the background of three selected cases is given in Table 1.
Table 1: Profile of cases
Case A Case B Case C
Project cost Rs.252 Bn Rs.306 Bn Rs.67 Bn
Scope Construction of 96km long four lane expressway and construction of 06 nr of interchanges
Construction of 76.8 km long four lane expressway and construction of 07 nr of interchanges
Construction of 9.6km long four lane expressway and construction of 02 nr of interchanges
Project Duration 3.5 years 2.5 years 3.5 years
Project Status On going On going On going
All three projects are still ongoing and are broken down into sections due to complexity of expressway
construction projects. However, as depicted in the table 01, all three projects were estimated more than Rs. 50 Bn and Road Development Authority (RDA) is acting as the client on behalf of the government. In terms of project duration, all three projects have exceeded two and half years of project duration and in terms of scope, all three projects are entailed with four lanes and two of them

1317
Unmanned Aerial Vehicle (UAV) Technology Based Safety Monitoring for Expressway Construction Projects
have exceeded 75 km. However, all three projects have applied modern technologies during safety monitoring.
In addition, interviews have been chosen as data the collection technique of cases due to requirement of depth analysis. Thus, semi structured interviews were carried out with the participation of nine experts on the research area to extract relevant information from the interviewees to gather accurate and in-depth data. Under each case, three interviewees were selected representing both contractor and consultant parties and thus altogether nine interviews were conducted. The following Table 2 described the profile of interviewees.
Table 2: Profile of Interviewees
Case A A1 Health, Safety, Environment and Public Liaison Manager
B.Sc. and M. Sc.in Civil and Environmental Engineering
Maintaining safety and health at the project and public liaison
11 Years
A2 Site Engineer National Diploma in Technology in Civil Engineering
Constructing road and Building works
8 Years
A3 Consultant Site Engineer
B.Sc. (Hons) in Civil Engineering
Monitoring the construction works
10 Years
Case B B1 Health Safety and Environment Manager
B. Sc. (Hons) in Physical Science and post graduate diploma in Environmental Management
Maintaining safety and health at the project
20 Years
B2 Health and Safety Manager
B.Sc. (Hons) in Facility Management
Maintaining safety and health at the project
13 Years
B3 Road Safety Engineer B.Sc. (Hons) in Civil
Engineering and following M.Sc. in Occupational Safety and Health Management
Monitoring the safety plan
12 Years
Case C C1 Maintenance Road Safety Engineer
B.Sc. (Hons) in Civil Engineering
Monitoring maintenance work and safety plan
25 Years
C2 Site Engineer B.Sc. (Hons) in Civil Engineering
Monitoring construction works
11 Years
C3 Assistant Safety manager
B.Sc. (Hons) in Civil Engineering
Handling the safety at the site
19 Years
Case
Inte
rvie
wee
s co
de
Posit
ion
Qua
lific
atio
ns
Scop
e of
wor
k
Year
s of
expe
rienc
es

1318
Udaraka Iroshana, Mathusha Francis and Shanika Vidana Gamage
As shown in the above table, majority of interviewees were chosen from contractor party due to their
better experience with safety management procedures within the construction site itself. Accordingly, two interviewees from contractor party and one interviewee from consultant side were selected. In terms of experience all interviewees had more than 8 years of experience in the construction industry with two having 5-10 years of experiences in the field of safety management, four having 10-15years of experiences in same field and rest with more than 15 years of experiences in field of safety management. Hence based on their experience and educational qualification levels, it is clear that all interviewees have extensive knowledge on the related area. Moreover, nine Interviews were conducted as face to face interviews and each interview was conducted around 45 minutes. This revealed that the research employed in-depth data collected from experienced professionals and confirms its reliability. According to Hardly & Bryman (2009) content analysis is essentially used to organize qualitative information to determine the sequence of information while collecting data, maintaining patterns in the presenting and reporting of information. Therefore, content analysis was selected as the data analysis method for the study.
4. Data analysis All interviews were conducted based on the interview guideline prepared and interviewees were questioned on safety monitoring in expressway projects and current application of UAV technology for expressway projects in Sri Lanka. Thus, the data analysis was done based on nine interviews carried out considering three selected cases.
4.1. Safety monitoring in expressway construction projects
Through literature synthesis, visual inspection, manual checklists, CCTV technology, VR technology and wearables technology were identified as commonly used safety monitoring techniques in construction projects. However, in all three cases, visual inspection has been used for safety monitoring. Checklists have also been optimized in all three cases for decreasing complexity of the visual inspection. Under visual inspection, daily, weekly, monthly, random and on time safety monitoring techniques were generally used in all three cases. In case B, based on meeting minutes or investigation reports, safety monitoring has been done without site inspections. Besides for Case C time safety monitoring was not required. Thus, logical thinking capacity of humans to make correct decisions has been highlighted in Case C rather than any technologies. Beside visual inspections, CCTV technology and dash camera of projects’ vehicles were used in case A for safety monitoring. However, all interviewees mentioned the importance of having better safety monitoring techniques for expressway construction projects in Sri Lanka.
4.2. Current application of UAV technology in Sri Lankan expressway construction projects
As all interviewees were knowledgeable about the applicability UAV technology in the expressway projects, they were asked about applicability of UAV technology in Sri Lankan expressways construction projects as per the interview guideline. According to the literature findings, this technology could be

1319
Unmanned Aerial Vehicle (UAV) Technology Based Safety Monitoring for Expressway Construction Projects
frequently used to inspect construction projects, monitor work progress, implement safety regulations and observe existing structures which are out of human reach.
According to the interviewees, Multicomputer with a camera has been used in all three cases for the application of each purposes. In terms of frequency of usage, the UAV technology in the projects, it was limited to once per month due to unfamiliarity with UAV technology in the Sri Lankan context. Although literature identified multiple purposes of application of UAV technology in expressway construction projects, it seems very less in real time. In case A, UAV technology mainly used for progress reporting. In addition to that, the pre-condition survey of the site had been done by using UAV with camera. The video captured from UAV for progress reporting has been used for safety monitoring purposes. In both case B and C, UAV technology was only used for progress reporting purposes.
4.3. Applicability of UAV technology-based safety monitoring in Sri Lankan expressway construction projects
All interviewees were asked about applicability of the UAV technology for safety monitoring in expressway construction project. Monitoring unsafe behaviour of workers easily, integration of site information with storage facilities, autonomous site inspection with GPS technology, creating accurate models of unknown areas by 3D maps, minimizing the invalid safety monitoring and easily identifying safety hazards were identified as outcomes of using UAV technology for safety monitoring in construction projects. Initially, the applicability of UAV technology for safety monitoring in Sri Lankan selected projects was discussed with all interviewees.
Thus, A01 stated that “Progress of safety monitoring works can be evaluated by using the UAV technology. Therefore, safety officers and traffic controllers who are doing their duty can be detected through it”. A01 further stated that the traffic controllers who are on duty near schools might be always on their duty location. If the person is not in his duty location at the time the students leave school, safety manager would easily detect and immediately take action’. Further, the video captured for progress reporting was used for identifying safety hazards under safety monitoring. In addition to that, interviewees of case A described that clear view of the activities was captured easily for better monitoring purposes. Interviewee from C01 explained about invalid safety monitoring activity such as launching beam to the bridge/viaduct. C01 further stated that “It is necessary to check whether the beam is safely launched to the beam before removing cranes. But anyone cannot inspect it without reaching the beam. Reaching the beam while launching is an impossible task for a human”. C01 expressed that this risky safety monitoring activity would be minimized by sending the UAV with a camera near the beam in order to inspect it. Hence, as a mechanism to detect faulty works and to explore safety compliance by workers, UAV can be implemented as per interviewees from Case 01.
Interviewee B02 mentioned that “The UAV can be flown in a limited area. (like 2/3 km). Therefore, it cannot be implemented for daily inspection instead of safety officers. It can be used in confined areas for safety monitoring like batching plants”. In case B, all interviewees stated that capturing aerial view by UAV would be caused to easily identify safety hazards at the whole site. Interviewee B01 mentioned that “UAV can be implemented in confined areas for safety monitoring. A lot of people and machineries are present when working in a confined area like asphalt paving activity. Safety officer cannot inspect it correctly because of lots of people in small range.”. further the interviewee stated that UAV with a camera can be implemented instead of a safety officer for safety monitoring in the project. Thus, UAV

1320
Udaraka Iroshana, Mathusha Francis and Shanika Vidana Gamage
according to interviewees in Case 2, UAV could especially be used to identify the unauthorized people and vehicles and to further detect faulty works.
C02 stated that “UAV technology with camera can be used as real time safety monitoring technique in Sri Lankan expressway sites”. The interviewee further mentioned that the video that captured from the UAV could be live streamed to the site office for the safety manager’s inspection. While agreeing with above mentioned live streaming process, C02 added that “Special places, like batching plants can be monitored with UAV technology as real time safety monitoring is essential due to its chemical usage. And further, safety manager can inspect that flagmen, safety officers are doing their duty in proper manner”. Hence Case 03 interviewees highlighted the minimising invalid safety supervision and improving real time monitoring through application of UAV technology in expressway construction projects in Sri Lanka. However contrary to above findings, C03 stated “If UAV technology is used to find workers who do not wear PPEs, it is unable to find one worker who is not wearing PPEs among 5 or 6 workers gang when all other workers are wearing PPEs because the. UAV fly normally at height about 10 m above the ground level”. According to C02’s opinion, the visual observation that captured from UAV would not be clear enough to identify the safety hazards at the relevant moment which could be identified as a drawback to implement UAV technology in the given context. Thus, the applicability of UAV technology-based safety monitoring in Sri Lankan expressway construction projects was discussed.
5. Conclusions and recommendations The empirical study focused on applicability of UAV technology for safety monitoring in expressway construction projects in Sri Lanka. Initially a comprehensive literature review was done to identify the usage of UAV technology in construction industry for safety monitoring. Then a case study analysis was done based on three selected expressway projects in Sri Lanka to explore the current application of UAV technology for Sri Lankan expressway construction projects and to find the applicability of UAV technology-based safety monitoring in Sri Lankan expressway construction projects.
According to the literature findings UAV technology helps in easily conducting project management, quality controlling, safety, time management, inspection, uncooperating 3D images into a 4D BIM, monitoring work progress, providing real-time visual information and taking the measurement in different places. But considering its usage in site monitoring identified key rewards through literature are monitoring unsafe behavior of workers easily, integration of site information with storage facilities, autonomous site inspection with GPS technology, creating accurate models of unknown areas by 3D maps, minimizing the invalid safety monitoring and easily identifying safety hazards.
However, minimizing invalid safety monitoring, identifying unauthorized people and vehicles, identifying faulty works and non-use of safety measures, improving real time monitoring, easily identifying safety hazards at whole site (unsafe behavior of workers, unsafe conditions of site), identifying disruptive works by third parties(thieves), identifying defaults on duties by safety officers are considered as some of key applications of UAV technology in safety monitoring mechanism of expressway construction projects in Sri Lanka. Thus, based on the study findings a framework was developed as indicated in figure 1 to achieve the ultimate research aim.

1321
Unmanned Aerial Vehicle (UAV) Technology Based Safety Monitoring for Expressway Construction Projects
Figure 1 : Framework for Safety Monitoring Using UAV Technology in Expressway Construction Projects in Sri Lanka
Accordingly, the study critically analyzed the applicability of UAV technology in safety monitoring of expressway construction projects in Sri Lanka. Although, the adaptation of the innovative technologies in Sri Lankan construction industry is still at a lower level, the implementation of UAV technology-based safety monitoring mechanism in Sri Lankan expressway construction projects would facilitate numerous benefits as identified by interviewees and it would ultimately overcome the drawbacks of existing safety monitoring techniques.
6. Limitations This research was carried out amongst a few limitations. The main limitation is restricting the study
only to expressway construction projects as building projects ware not considered because it requires a clear air running route that visible to the operator. Other one is that, although UAV technology could be implemented for safety management process the study was restricted to only for the safety monitoring process in safety management due to the limitation of the time to execute the research.

1322
Udaraka Iroshana, Mathusha Francis and Shanika Vidana Gamage
References Alizadehsalehi, S., Yitmen, I., Celik, T., & Arditi, D. (2018). The effectiveness of an integrated BIM/UAV model in
managing safety on construction sites. International journal of occupational safety and ergonomics, 1-16. doi:10.1080/10803548.2018.1504487
Congress, S. S., & Puppala, A. J. (2019). Novel methodology of using aerial close range photogrammetry technology for monitoring the pavement construction projects. In Airfield and Highway Pavements 2019: Innovation and Sustainability in Highway and Airfield Pavement Technology (pp. 121-130). Reston, VA: American Society of Civil Engineers.
Creswell, J. (2014). Research design: Qualitative, quantitative and mixed method (4 th ed.). SAGE Publications. Gheisari, M., Irizarry, J., & Walker, B. (2014). UAS4SAFETY : The Potential of Unmanned Aerial Systems for
Construction Safety Applications. Construction Research Congress, 1801-1810. Guo, H., Liu, W., & Zhang, W. (2014). A BIM-PT-integrated warning system for on-site workers' unsafe behavior.
China Safety Science, 24(4), 104-109. Howard, J., & Murashov, V. (2018). Unmanned aerial vehicles in construction and worker safety. American Journal of
Industrial Medicine, 61(1), 3-10. doi:10.1002/ajim.22782 Hubbard, B., Wang, H., Leasure, M., Ropp, T., Lofton, T., Hubbard, S., & Lin, S. (2015). Feasibility Study of UAV use for
RFID Material Tracking on Construction Sites. 51st ASC Annual International Conference Proceedings. Associated Schools of Construction.
Irizarry, J., & Johnson, E. N. (2014). Feasibility Study to Determine the Economic and Operational Benefits of Utilizing Unmanned Aerial Vehicles (UAVs). Georgia: Georgia Department of Transportation.
Jawade, V. S., & Butale, M. C. (2020). Quad-copter (UAVs) for Overhead Transmission Lines Monitoring. International Journal of Research in Engineering, Science and Management, 3(8), 276-278.
Liu, P., Chen, A., Huang, Y., Lai, J., Kang, S., Wu, T., . . . Tsai, M. (2014). A review of rotorcraft Unmanned Aerial Vehicle (UAV) developments and applications in civil engineering. Smart Structures and Systems, 13(6), 1065- 1094. doi:doi.org/10.12989/sss.2014.13.6.1065
Mohamed, N., Al-Jaroodi, J., Jawhar, I., Idries, A., & Mohammed, F. (2020). Unmanned aerial vehicles applications in future smart cities. Technological Forecasting and Social Change, 153. doi.org/10.1016/j.techfore.2018.05.004
Opincar, E. (2016). Assessing the Technology Used by UAVs in Data Acquisition on Construction Sites. Retrieved from https://digital.lib.washington.edu/researchworks/handle/1773/38588
Outay, F., Mengash, H. A., & Adnan, M. (2020). Applications of unmanned aerial vehicle (UAV) in road safety, traffic and highway infrastructure management: recent advances and challenges. Transportation research part A: policy and practice, 141, 116-129.
Priyadarshani, K., Karunasena, G., & Jayasuriya, S. (2013). Construction Safety Assessment Framework for Developing. Journal of Construction in Developing Countries, 18(1), 33-51. Retrieved from https://www.researchgate.net/publication/256605844
Rifan, R., & Adikariwattage, V. (2018). Evaluation of Regulatory Gap in UAS Operations in Sri Lanka. 2018 Moratuwa Engineering Research Conference (pp. 408-413). Moratuwa: University of Moratuwa.
Saunders, M., Lewis, P., & Thornhill, A. (2009). Research methods for business students (fifth edition ed.). Essex : Pearson Education Limited.
Siebert, S., & Teizer, J. (2014). Mobile 3D mapping for surveying earthwork projects using an Unmanned Aerial Vehicle (UAV) system. Automation in Construction, 41, 1-14. doi:dx.doi.org/10.1016/j.autcon.2014.01.004
Seo, J., Han, S., Lee, S., & Kim, H. (2015). Computer vision techniques for construction safety and health monitoring. Advanced Engineering Informatics. doi:doi.org/10.1016/j.aei.2015.02.001
Skorupka, D., Duchaczek, A., Waniewska, A., & Kowacka, M. (2017). Optimization of the Choice of Unmanned Aerial Vehicles Used to Monitor the Implementation of Selected Construction Projects. In AIP Conference Proceedings. 1863, p. 230013. American Institute of Physics. doi:doi.org/10.1063/1.4992398
Tatum, M., & Liu, J. (2017). Unmanned Aircraft System Applications In Construction. Creative Construction Conference (pp. 167-175). Primosten: Elsevier Ltd. doi:10.1016/j.proeng.2017.07.187

1323
The 54th International Conference of the Architectural Science Association (ANZAScA) 2020
Unmanned Aerial Vehicle Sustainability Assessment of Heritage Buildings
Tatiana Ermenyi1, Wallace Imoudu Enegbuma2, Nigel Isaacs3 and Regan Potangaroa4
1,2,3,4Victoria University of Wellington, Wellington, New Zealand [email protected], [email protected], [email protected],
Abstract: The conscious shift to sustainable practices in the built environment provides significant contributions to reduction in environmental pollutants. Heritage buildings due to design consideration, material availability and preservation guidelines are huge potentials for sustainability exploration. Unmanned aerial vehicle (UAV) captures heritage building data with less intrusion to building use. Currently, traditional 2D drawings and site visit form the basis for sustainability decisions which makes the process cumbersome and, in some cases, missing building drawings and lack of digital tools further compounds this process. Therefore, this study aims to leverage UAV from a sustainability assessment approach to develop maintenance plan for heritage buildings. Simulation based methodological approach was adopted in this study. UAV flight mission and deployment time were designed to meet the heritage site. Thermal imaging camera was modified into UAV for external thermal data. Handheld moisture meter was used in capturing internal moisture readings. The results revealed thermal images from external and internal moisture aligned in assessment of the roof condition. The sustainability analysis presented a significant savings in electricity consumption by orientation of solar panels and water collection. The results directly impact decision making by policy makers for improvements in sustainability maintenance in heritage building.
Keywords: Unmanned aerial vehicle (UAV), Heritage, Sustainability, HBIM, Digital.
1. Introduction
Heritage buildings are also important to our national identity as they embody the stories of all generations, cultures, traditions and communities. They can be seen in historical photos, drawings and paintings. New Zealand heritage places also include those of Maori culture which are integral to their whakapapa (lineage) and identity. These buildings also help the economy by creating jobs in the construction business (Heritage New Zealand, 2020). Heritage conservation requires accurate data to manage, maintain and operate (Lavay & Sohet, 2007; Lucas, 2012).
Roofs are very difficult to survey and analyse, as access to them prove dangerous, time consuming and expensive. However, the use of Unmanned Aerial Vehicles (UAV) allows for safe, quick and easy analysis of any roof. The outcomes can considerably improve the understanding of the roof which would aid in maintenance plans. Given the need to constantly monitor, maintain and implement conservation plans for heritage buildings, the incorporation of LiDAR, UAV and thermal mapping would provide solutions to the lack of as-built data repository. Furthermore, the implementation of a sustainable analysis would directly influence improvement in maintenance cost and decision making.
This study aims to leverage the use of UAV from a sustainability assessment approach to develop maintenance plan for heritage buildings. A comprehensive literature review of LiDAR, UAV, thermal mapping, site capture, presentation to heritage stakeholder and VR immersion is reported, followed by discussion of the methodology, results of a trial, and discussion and conclusion.
Imaginable Futures: Design Thinking, and the Scientific Method. 54th International Conference of the Architectural Science Association 2020, Ali Ghaffarianhoseini, et al (eds), pp. 1323–1330. © 2020 and published by the Architectural Science Association (ANZAScA).

1324
Tatiana Ermenyi, Wallace Imoudu Enegbuma, Nigel Isaacs and Regan Potangaroa
2. Heritage Asset Management FM is an interdisciplinary practice related to the management/maintenance of buildings and to facilitate building users. FM practices draws on theories and principles of engineering, architecture design, accounting, finance, management and behavioural science (Aziz et al., 2016). Facilities Management is the integration of multi-disciplinary activities within the built environment and the management of their impact upon people and workplace (Boateng, 2011). The FM phase is typically the longest phase in the buildings life-cycle and consequently has a higher cost compared to rest of the building phases (Aziz et al., 2018).
However, studies such as Lucas (2012), Araszkiewicz (2017) and Haddock (2018) found that the FM phase is one of the most disconnected phases from the building life-cycle because of poorly planned handover processes and inconsistent involvement in the early stages of the building life-cycle. This is reflected in lack of updated as- built drawings in the heritage facility in this study. Loss of information and manual and paper based data-entry which has a significant impact on the FM resources and budget (Lavy & Jawadekar, 2014; Araszkiewicz, 2017). This is a major source of concern for building maintenance decision making.
Heritage conservation requires accurate data to manage, maintain and operate (Lavay & Sohet, 2007; Lucas, 2012). Poor management of these buildings could lead to serious consequences relating to loss of vital heritage (Ghosh & Chasey, 2013). Healthcare facilities FM team are constantly faced with the challenges of less resources, personnel, time, and money (Lucas, 2012). For successful implementation of FM in heritage buildings, this requires strategic planning, customer care, benchmarking, environment and staff development.
3. Unmanned Aerial Vehicle (UAV) and Thermal Imaging UAV (also known as “drones”) possesses the capability to carry out flight survey task, enable ground control point distribution, flight route planning and revision (Haur et al., 2018). UAV monitoring was initially applied only in the military, however the potential of the technology has led to it being implemented in engineering environments (Melo et al., 2017). UAV possess the ability to monitor from angles that are out of reach and replace safety/project managers to be at the job hazard area in person, which makes the monitoring work much safer. The ability to manoeuvre around site makes the monitoring work easier as one of these drones can cover the whole site.
Whilst this method is advantageous, UAV monitoring requires trained personnel to handle the flight around the site which can be inconvenient for every site to be monitored by this method. Integration with neighbouring construction sites, 3D site layout, clash avoidance, collaboration and revision of site planning were found to be innovative uses when combined with a BIM platform (Whitlock et al., 2018). It has been found that construction industry stakeholders have a low tendency to adopt BIM technology (Enegbuma et al., 2016). Extensive literature on the application of BIM and UAV for site mapping has shown their use can be improved (Alizadehsalehi et al., 2018). One key study by Tache et al. (2018) established UAV mapping improvement methodology which emphasised the need to apply precision in reference points during time of drone flight. This was incoporated into the flight plan to ensure data precision in this study.
Infrared thermography is a process that enables the spatial variations in infrared radiance from a surface to be converted a two-dimensional image. Moisture distribution within a building material can be measured using infrared thermography method. When the moisture content in a material is high, the moisture within the material begins to evaporate. As a result, the surface temperature of a material will decrease. When a lower temperature is detected by a thermal imaging camera, it may indicate that the surface has greater moisture content and thus has greater evaporative heat loss.
4. Methodology Knowledge on solutions to real time challenges in heritage building maintenance require a defined simulation approach. In retrospect, epistemology focuses on study of knowledge and knowing with emphasis on origins, methods, limits of human knowledge and what we accept as valid knowledge (Fellows and Liu, 2015; Creswell, 2012). The equipments utilised in the methodological process is shown in Figure 1. Detailed on-site data collection of internal thermal analysis was undertaken using the FLIR I40 Thermal Imaging Camera. This enabled the identification of areas of interest with urgent need of analysis using a moisture meter to confirm the percentage of moisture content.

1325
Unmanned Aerial Vehicle Sustainability Assessment of Heritage Buildings.
Figure 1. UAV, Thermal Imaging Camera and Moisture Meter Equipment
The thermal Imaging Camera provides a variety of image settings, including grey scale, colour scale or visual image. For this study, colour scale was the most appropriate as it clearly indicated the areas of a lower (or higher) temperature. The camera was firstly calibrated, then pointed towards the ‘at risk areas’ of the roof and the image taken. The ‘at risk areas’ were considered to be the roof ridge line, valleys and areas surrounding the many (false) chimneys.
The next step was external thermal temperature data collection. The external thermal scanning was done using a DJI Mavric Pro Drone set-up with the FLIR Vue Pro Thermal Imaging camera modified to fit. The drone was controlled by a hand set connected to an IPad mini with a preprogramed flight path. The flight was set to a snake path. A number of thermal scans were undertaken after varying weather conditions and times of the day to determine at risk areas of the roof. This allowed for a wide variety of data and more accurate readings. Early morning flights gave the best results before the sun had warmed the iron roofing. The final step was collection of moisture data. Moisture levels were recorded using a Protimeter moisture meter. The thermal camera allowed for identification of areas that had a large range of temperature differences. When a cooler area was detected the moisture meter was brought in to determine with moisture levels of that area. This often led to the discovery of a leak in a roof.
Four different scenarios of PV panel placements were analysed and compared. The calculations were done using the LG Solar System Output Calculator and the BRANZ Photovoltaic Generation Calculator to estimate the roofs electricity potential. These were used instead of the NIWA calculator because it takes into account the PV Panel efficiency. The LG Solar System Output Calculator was used specifically to determine the monthly generation to compare with the buildings demands. The BRANZ calculator required some specific information to enable effective calculations. These included panel tilt and type. Firstly, two different panel tilts were tested. The first being 20 degrees to match the roof pitch and secondly 40 degrees to match the locations latitude. After comparing the data, it showed that the 20 degree tilt generated more electricity for the building. All three panel types gave similar ratings, however, Amorphous panels were chosen as they gave the highest rating. It was also assumed that standard solar panels have an input rate of around 1000 Watts per square meter, and majority of solar panels available have around 15-20%. Therefore, if the solar panel was 1 square meter in size, then it would likely only produce around 150-200W in good sunlight. This information was then compared to the electricity usage on the university utility dashboard online which has data for monthly usage for 2018 & 2019.
5. Result and Discussion
The interior thermal results carried out on the first day of analysis was done during a warm sunny day, which meant there was little moisture in the roof space. Figure 2 shows initial results of the interior thermal reading. Only two areas around the central area by the clock showed any signs of leaks (blue colour), one of which had already been identified and labelled. However, a second analysis within the roof was done after two days of constant rain and the thermal imaging camera proved very helpful in identifying 10 possible areas that were then confirmed with the moisture meter. These are shown as lighter colours in the images within the added dashed frames

1326
Tatiana Ermenyi, Wallace Imoudu Enegbuma, Nigel Isaacs and Regan Potangaroa
Figure 2. Interior Heritage Building Thermal Images
In the exterior thermal results shown in Figure 3, shadowing was found to synchronize with the thermal imaging as the shaded areas profile were cooler. This resulted in altered results in the daytime flights, limited the value of the images. From then on flights were done at early hours of the morning so the roof had not absorbed heat from the sun.
Imaging shows the ridge line to be warmer than the side of the roof which explains why a hole found at the ridge line did not have an elevated moisture reading. Valleys also appear cooler which could be due to shadowing but during cross referencing of the visual drone footage some of the valley guttering seems to be deflecting away from the roof. Spots on the side of the roof could be an indication of screws getting loose from the roof cladding allowing water to get in. These identified screw spots did not come up in the internal thermal images, suggesting water was not being let in through these points during this study.
Figure 3. Exterior Heritage Building Roof Thermal Images
Figure 4 shows visible photographs beside the IR thermographic images of the same location. The identification of the high moisture areas shown in Figure 4 were facilitated by the ability of the thermal camera to identify areas with large range of temperature differences. Sharp temperature drops signified a possible link between cooler areas and roof leaks. The meter shows levels 6-14% are considered dry (green), 14-21% are considered some moisture (yellow) and 21-60+% is considered wet (red). The resultant monitored result showed that a timber moisture level (17%), located next to the roof access hatch by the clock and this leak is associated with the roof hatch openings. A higher moisture level (17-20%) was located in the lower north valley of the central clock extrusion and was assessed as an existing leak that must have caused problems in the past as it was

1327
Unmanned Aerial Vehicle Sustainability Assessment of Heritage Buildings.
labelled with chalk. Moisture levels (14%) over the heritage library space, lead to the discovery of the origin of the leak in the library which created persistent asset management monitoring during rain. This was associated with the left chimney inside the old archives being utilized as an opening for the ducting extract. However, the opening allowed tree leaves to build-up, leading to blocked drains which then resulted in pooling which weakened waterproofing. The drain plate was also angled away from the drain which exacerbated the problem. A very high moisture level (60+%) was found in the first chimneys in the straight section coming from the library active leaks. On the left side of the chimney north end of the building. This leak was wet to the touch and dripping. The very high moisture level (50+%) located on the right was due to the flue inside the chimney having active dripping that was beginning to pool and mark the plywood.
The high moisture level (40%) located in northern most point of the North wing over the steps on the right side of the left chimney had a serious leak which has been existing for some time as the wooden sarking has noticeable moisture marking. The existence of the leaks was confirmed by the asset management team. The high moisture level (28%) located on the on the left side close to the steps is another leak going down the sarking originating just below the ridge beam. The slightly lower, but still high, moisture level (21%) located by sky light by door had some higher readings. Moisture was found on the bottom sill and on the left side of the skylight. A high moisture level (60+%) was located on right side of the ridge in front of door. Interestingly, this originated from the ridge flowing down the sarking. The other very high moisture level (60+%) located on the right of the door above the second roof lip was to high up for a physical reading but again showed a significant difference in temperature in thermal imaging camera.
Figure 4. Moisture Measurement of Heritage Building Roof
The heritage roof presents a huge potential for generating solar electricity with four potential options and yearly usage versus generation shown in Figure 5 and 6. Option A (North Easterly Direction) would gather most of the morning sun with minimal obstruction to the front façade facing North-East direction (60 degrees) with an area (880 m2). Option D (Heritage Sensitive placement) would provide for a discrete placement of the PV panels to prevent interference with the heritage fabric of the building. This would utilise the NE direction of sunlight and would not disrupt the main façade with an area (870 m2). Option A and D were calculated in the same data set because of the similarity in area they covered and direction they faced. Overall, this option generates nearly 50% of the annual demand of the building. The sunnier months of the year when the building has its lowest occupancy and therefore lowest energy demand, generates between 80-100% of the necessary power. While the busier building in the winter months generates around 20%. This is a considerable option that still remains respectful of the heritage building fabric.
Figure 5. PV Options and Calculations (Left A - Right D)

1328
Tatiana Ermenyi, Wallace Imoudu Enegbuma, Nigel Isaacs and Regan Potangaroa
Option B (North Westerly Direction) would gather most of the afternoon sun but would create some alteration to the heritage facade towards North-West Direction (330 degrees) with an area (575 m2). Option B utilizes a more modest amount of PV panels as the area is much less than either of the other options. Again, the lowest generating month is in June with only 12% generating of the buildings demand. In its sunnier months it can generate between 50-60% of the monthly usage which is still a considerable amount of energy. The annual energy generated from the PV is around 30% of the buildings demand. Still a considerable amount which needs to be assessed against the cost of installing the number of PVs needed.
Figure 6. Yearly Usage and Generation Comparison
Option C (Both Direction Combined) aims to optimize the collection of sunlight. It would ultimately collect sunlight all day with an area all together (1,450 m2). Although Option C is an excessive amount of area to cover with PV panels, it still shows the potential the roof has of generating a high percentage of the building’s electricity. The lowest month still generates 30% of the electricity demand of the building. This has some potential to alleviate some of the buildings running costs. Its highest month in December generates 167% which has the potential of creating some income for that month by selling the extra electricity back to the grid. Overall, this scenario generates 79% of the annual usage of the building.
6. Conclusion
This study began with the aims of leveraging UAV from a sustainability assessment approach to develop maintenance plan for heritage buildings in New Zealand. This was achieved by a comprehensive literature review which highlighted the current challenges in heritage maintenance, gaps in application of sustainability assessment and potential of UAV for heritage data capture. The registered point cloud scans provide a platform for future BIM modelling and development of heritage components. The value of the thermal mapping assessment was shown to be very good. Although requiring very careful analysis of the external (drone) and internal IR images, these provides excellent identification of water leaks which were resulting in either obvious or in some cases hidden water damage. This approach can be applied to future maintenance projects and extensive use in heritage maintenance. The research is limited from assessment of potential cost breakdown for purchase, installation, man-hours and maintenance of PV panels. Future research would focus on developing the BIM model and assessment of indoor environmental quality, and opportunities for the use of higher resolution IR imaging tools.
Acknowledgement
The authors would like to acknowledge Heritage New Zealand Pouhere Taonga for providing funding for this research. Ronnie Pace, Calum Maclean, Anna Maria Rossi and Jonathan Howard for supporting the project and giving concise heritage insight. Victoria University of Wellington for providing supporting fund of this research.

1329
Unmanned Aerial Vehicle Sustainability Assessment of Heritage Buildings.
References Ali, M., Ismail, K. M., Hashim, H. K. S., & Mustafa, M. H. (2018). Heritage Building Preservation through Building Information
Modelling: Reviving Cultural Values through Level of Development Exploration. Journal of the Malaysian Institute of Planners, 16(2), 62–72.
Alizadehsalehi, S., Yitmen, I., Celik, T., & Arditi, D. (2018). The effectiveness of an integrated BIM/UAV model in managing safety on construction sites. International Journal of Occupational Safety and Ergonomics, 1–16. doi:10.1080/10803548.2018.1504487 PMID:30043680.
Araszkiewicz, K. (2017). Digital technologies in Facilities Management - the state of practice and research challenges. Creative Construction Conference (pp. 1034-1042). Szczecin: Procedia Engineering.
Aziz, N. D., Nawawi, A. H., & Ariff , N. R. (2016). ICT Evolution in Facilities Management (FM): Building Information Modelling (BIM) as the Latest Technology. AMER International Conference on Quality of Life (pp. 363-371). Indonesia: Procedia - Social and Behavioural Sciences.
Aziz, N. D., Nawawi, A. H., & Ariff, N. R. (2016). Building Information Modelling (BIM) in Facilities Management: Opportunities to be considered by Facility Managers. Procedia - Social and Behavioral Sciences, 353-362.
Boateng, E. (2011). The Future of Facility Management in Finland. Finland: Jamk University of Applied Science. Chiabrando, F., Turco, M. Lo, & Rinaudo, F. (2017). Modelling the Decay in an HBIM Starting from 3D Point Clouds: A Followed
Approach for Cultural Heritage Knowledge. In The International Archives of the Photogrammetry, Remote Sensing and Spatial Information Sciences (Vol. XLII/W5, pp. 605–612). Ottawa, Canada. https://doi.org/10.5194/isprs- archives-XLII-2-W5-605-2017
Creswell, J. (2012). Research Design. India: Sage. Enegbuma, W. I., Aliagha, U. and Ali, K. (2014). Preliminary Building Information Modelling Adoption Model in Malaysia.
Construction Innovation, 4(14): 408-432. Enegbuma, W. I., Aliagha, G. U., Ali, K. N., & Badiru, Y. Y. (2016). Confirmatory strategic information technology
implementation for building information modelling adoption model. Journal of Construction in Developing Countries, 21(2), 113–129. doi:10.21315/jcdc2016.21.2.6.
Fellows, R., & Liu, A. (2015). Research Methods for Construction. New York: John Wiley & Sons. Francucci, M., Ceccarelli, S., Guarneri, M., Ferri de Collibus, M., Ciaffi, M., & Danielis, A. (2018). Laser Scanners for High- Quality
3D and IR Imaging in Cultural Heritage Monitoring and Documentation. Journal of Imaging, 4(11), 130. https://doi.org/10.3390/jimaging4110130
Ghosh, A., & Chasey, A. (2013). Structuring data needs for effective integration of building information modelling (BIM) with healthcare facilities management. SEC 2013 - 7th International Structural Engineering and Construction Conference, 1471-1476.
Haur, C. J., Kuo, L. S., Fu, C. P., Hsu, Y. L., & Da Heng, C. (2018). Feasibility study on UAV-assisted construction surplus soil tracking control and management technique. IOP Conference Series. Materials Science and Engineering, 301, 012145. doi:10.1088/1757-899X/301/1/012145.
Heritage New Zealand. (2020) Introduction to Heritage New Zealand Pouhere Taonga. Retrieved from: https://www.heritage.org.nz/about-us/introduction.
Karadimas, D., Somakos, L., Bakalbasis, D., & Karadimas, G. (2019). Current and Potential Applications of AR/VR Technologies in Cultural Heritage. INCEPTION Virtual Museum HAMH : A Use Case on BIM and AR/VR Modelling for the Historical Archive Museum of Hydra Greece. In A. Moropoulou (Ed.), TMM_CH 2018 (pp. 372–381). Springer International Publishing. https://doi.org/10.1007/978-3-030-12960-6
Lavay, S., & Sohet, L. (2007). Computer-Aided Healthcare Facility Management. Computing in Civil Engineering ASCE. Lavy, S., & Jawadekar, S. (2014). A Case Study of Using BIM and COBie for Facility Management. Texas: Texas A&M University. Lucas, J. D. (2012). An Integrated BIM Framework to Support Facility Management in Healthcare Environments. Blacksburg:
ProQuest. Mohanta, A., & Das, S. (2016). ICT- Based Facilities Management Tools for Buildings. Advances in Intelligent Systems and
Computing, 125-133. Melo, R. R. S., de-Costa, D. B., Álvares, J. S. and Irizarry, J. (2017). Applicability of unmanned aerial system (UAS) for safety
inspection on construction sites, Safety Science, Vol. 98 No. Supplement C, pp. 174-185. Ohueri, C., Enegbuma, W. I., Kenley, R. (2018). Energy efficiency practices for Malaysian green office building occupants.
Built Environment Project and Asset Management, 2(8). Palestini, C., Basso, A., & Graziani, L. (2018). Integrated Photogrammetric Survey and BIM Modelling for the Protection of
School Heritage, Applications on a Case Study. In The International Archives of the Photogrammetry, Remote Sensing and Spatial Information Sciences (Vol. XLII-2, pp. 821–828). Riva del Garda, Italy: ISPRS.
Tache, A. V., Sandu, I. C. A., Popescu, O. C. and Petrisor, A. (2018). UAV solutions for the protection and management of cultural heritage. Case Study: Halmyris archaeological site. International Journal of Conservation Science, 9(4):795-804.
Themistocleous, K., Agapiou, A., & Hadjimitsis, D. (2016). 3D documentation and BIM modeling of cultural heritage structures using UAVS: the case of the Foinikaria Church. In ISPRS - International Archives of the Photogrammetry, Remote Sensing and Spatial Information Sciences (Vol. XLII-2/W2, pp. 45–49). Athens, Greece: ISPRS. https://doi.org/10.5194/isprs-archives-XLII-2-W2-45-2016
Werner, T. (2013). Helping Preserve and Rejuvenate our History – 3D Laser Scanning for Heritage Buildings and Structures. In 17th Heritage Conference (pp. 137–145). Canberra, Australia.

1330
Tatiana Ermenyi, Wallace Imoudu Enegbuma, Nigel Isaacs and Regan Potangaroa
Whitlock, K., Abanda, F. H., Manjia, M. B., Pettang, C., & Nkeng, G. E. (2018). BIM for construction site logistics management. Journal of Engineering, Project, and Production Management, 8(1), 47–55. doi:10.32738/JEPPM.201801.0006.

1331
The 54th International Conference of the Architectural Science Association (ANZAScA) 2020
Urban resilience: potential for rainwater harvesting in a heritage building
Rachel Paschoalin1, Ronnie Pace2, Nigel Isaacs3
1, 3 Victoria University of Wellington, Wellington, New Zealand [email protected]
[email protected] 2 Heritage New Zealand Pouhere Taonga
Abstract: Population growth and climate change are imposing challenges on the built environment and urban communities, including managing growing water demand. The Wellington water supply network is vulnerable not only to rainfall variation but also earthquakes where it could struggle for water to fight fires post-quake. Rainwater harvesting for greywater would also be beneficial under water scarcity. Historic buildings, an important part of the city’s built environment, can contribute to sustainable development while also reducing water demand. This paper presents a rainwater harvesting study on the Heritage New Zealand Pouhere Taonga Category 1 ‘Old Government Building’. The 145 year old timber building houses the Victoria University of Wellington Faculty of Law, with about 2,000 students and staff. In addition to the challenges due to heritage requirements, the environmental, economic and social benefits are examined. These include resilience to flooding and climate change, a backup plan for building and city fires, water cost reduction, and regional sustainable water management. The recommendations which, while directed at this building, will be appropriate for consideration in other heritage buildings. It must not be forgotten that rainwater is a valuable natural resource that creates a number of opportunities and benefits for the city and communities.
Keywords: historic buildings; water management; urban resilience; climate change.
1. Introduction Population growth and changes in weather patterns due to climate change are imposing challenging times on the built environment and urban communities, including growing water demand. Cities concentrate approximately 53% of world’s population (Nachshon et al., 2016, p. 398). According to Bint (2012), New Zealand demand for potable water is rapidly increasing on domestic and non-domestic buildings, as well as for irrigation and recreational uses. However, many water catchments are already over allocated or close to full allocation, so future scenarios predict water scarcity in many areas in the country. In Wellington, the water supply network is vulnerable not only to rainfall variation but also earthquakes.
Imaginable Futures: Design Thinking, and the Scientific Method. 54th International Conference of the Architectural Science Association 2020, Ali Ghaffarianhoseini, et al (eds), pp. 1331–1340. © 2020 and published by the Architectural Science Association (ANZAScA).

1332
Rachel Paschoalin, Ronnie Pace, Nigel Isaacs
In order to create resilient and sustainable cities, the built environment needs to adapt and reduce its demand on water supplies. If used wisely, buildings can provide an additional source of water. The building’s roof area can be used for rainwater catchment coupled with water reuse systems represent favourable components which can help reduce the city water demand and wastewater treatment in dense built up areas. The continued use of heritage buildings also contributes to cities sustainable development. Good heritage asset management can contribute to reduce its water demand while maintaining its community significance.
This paper firstly describes the main key drivers of collecting and reusing rainwater, and then explores a preliminary feasibility study of implementing a rainwater harvesting system into the historic Old Government Building, a Category 1 listed building (Figure 1). Old Government Building, built in 1876 in the Italian Renaissance revival style, is New Zealand’s largest wooden building. It once housed the entire administration for the New Zealand Government. Currently owned by Heritage New Zealand Pouhere Taonga (HNZPT) and managed by HNZPT Central Regional Office, the building was strengthened in 1931, when the chimneys were removed and replaced by lighter structures and fully restored from 1994 to 1996. Since 1996, it has been leased to the Victoria University of Wellington and is used for the Faculty of Law.
Figure 1. ‘Old Government Building’ - VUW Law School. Source: https://blog.doc.govt.nz/.
2. Key drivers Rainwater is a valuable natural resource and its use can create a number of opportunities and benefits for cities and communities. The rainwater harvesting capacity and the intended reuse depend on both geographic location, and whether there is a centralized or decentralized city water supply. In centralised systems like in Wellington, the rain harvesting offers resilience to disruptions from natural hazards and from breakdowns in the main supplier system (Kettle, 2010, p. 84).
Internationally many governments are creating policies encouraging water reuse in dense urban areas. The New York City Environmental Protection Agency (EPA) has water conservation and reuse grants providing property owners with incentives to install fixture retrofits and other water efficiency technologies, such as on-site water reuse systems. For new and existing buildings with successful on-site

1333
Urban resilience: potential for rainwater harvesting in a heritage building.
water reuse systems reducing the building’s water consumption by at least 25%, there is 25% water and wastewater fee discount (NY City Environmental Protection, 2020).
Most buildings in Wellington have connection to a reticulated, treated main water supply system (Wellington City Council, 2020; Wellington Water, 2020), but they could significantly lower mains water usage by installing a rainwater harvesting and reuse system.
Climate issues described in New Zealand climate reports (Ministry for the Environment, 2018; Pearce, 2017) show an increase in temperatures by 3°C, a reduction up to 15% rainfall and more extreme rainfall events in the Greater Wellington Region by 2090 – all leading to an increasing risk of drought in the Wairarapa region, which is the main area that supply water for Wellington, and an increase in local flooding. The historic Old Government Building is situated in a 1 in 100 year flood zone according Wellington City Council (Figure 2), which could compromise both the building conservation and site protection in the case of more extreme rainfalls. Rainwater harvesting can potentially decrease stormwater runoff, thereby helping to reduce local flooding and creating more resilient urban areas (Wellington Water, 2019).
Figure 2. Flood zones in Wellington. (Source: https://www.wellingon.govt.nz – Maps – Flood Zones).
Beyond climate change, the other main driver relates to the vulnerability of Wellington's water supply network. The city is particularly vulnerable due to its physical isolation east of Wellington fault, concentration of population and lack of access to alternative supplies (Beban et al., 2013, p. 15). In the case of an earthquake of 7.5 or stronger, some suburbs and the CBD could be without water for more than 100 days (Wellington Water, 2020). Wellington would also struggle for enough water to fight fires on post-quakes. According to a Radio New Zealand news (Towle, 2020), a GNS report reveals that the Wellington Water would isolate the city's reservoirs, which would then be prioritised for drinking water, stopping their use for firefighting. Therefore, there is a great opportunity for rainwater reuse for emergency water supply. In this sense, harvesting rainwater would be beneficial for fighting possible fires in the wooden building, concurrently as a backup water storage for the building occupants.

1334
Rachel Paschoalin, Ronnie Pace, Nigel Isaacs
Rainwater reuse in a heritage building can create a conscious attitude towards resilience, protecting and enlarging the life of an urban historic area. Even more, it can add new contemporary values to the historic building. For instance, the Venice city management plan highlights the importance of considering broader and modern aspects on the management of heritage assets (Ursino and Pozzato, 2019). The list of benefits of reusing rainwater represent economic, social and environmental gains, such as reducing water bills, protecting remaining natural water sources, reducing infrastructure operating costs, water emergency supply, resilience to flooding areas and other climate change implications.
3. Preliminary feasibility study The first step in developing an on-site water use plan is to verify if the roof has enough capacity for collecting rainfall to meet the building’s needs. Given the 2,500 m2 of roof area located in a site without major interferences, such as being surrounded by high, dense vegetation, the building has a good potential for harvesting rainwater. This section firstly presents the method for calculating rainwater collection and reuse, and then it also explores realistic end uses compared with the building’s current water usage.
3.1. Rainwater harvesting potential
The design aspect of rainwater harvesting involves optimum sizing of the components, and the amount of water that falls determine the volume of storage tanks required for the different uses of rainwater (Haq, PEng, 2017, pp. 51–54). The formula (1) that calculates the harvesting potential (P) in litres, considers the roof area in the horizontal plan in m2 (A), the mean monthly rainfall levels (L) in mm taken from NIWA records (NIWA, 2020) , and the runoff coefficient (RC) selected from generic lists based on the degree of imperviousness and infiltration capacity of the drainage surface. Estimates consider that roof RCs are within the range of 0.7 - 0.95 for relatively frequent storms. Rooftop runoff water quality is dependent on both the roof type and the environmental conditions of both the local climate and atmosphere pollution (Farreny et al., 2011, p. 3246) .
P = A x L x RC (1)
Where: P = Harvesting potential (litres); A = Plan roof area (m2); L = rainfall (mm); RC = runoff coefficient. The roof area was calculated based on existing plans and a roof report prepared for HNZPT (Ermenyi,
2020) that informed the current roof conditions, materiality, dimensions and angles of the pitched roof. The steel roof was installed in 1996 with a standard warranty of 15 years, and this inspection concluded was that the roof was still performing adequately (Pace, 2020).
The roof area is approximately 2,500 m2 in the horizontal plan. The main corrugated, galvanized steel, pitched roof has an approximate angle of 22o which gives a generic 0.8 runoff coefficient, due to the imperviousness from the roof material (Farreny et al., 2011) . Wellington average monthly and annual rainfall levels (mm) were taken from available NIWA reports (NIWA, 2020) for the 1981-2010 period with at least 5 complete years of data. The potential is almost 2.5 million litres per year. Figure 3 shows the potential monthly water harvest and it is noticeable that the highest potential is during winter months. These results only consider the main existing building, but not the annex building at the back of the site.

1335
Urban resilience: potential for rainwater harvesting in a heritage building.
Figure 3. Monthly rainwater harvesting potential (‘000 litres).
3.2. Building water usage
Beyond estimating how many litres of rainwater the roof can collect, it is essential to understand the water use in order to identify potential savings. To estimate the water consumption two methods were used: firstly overall water records from 2018 and 2019; and secondly regular readings of the building’s water meter during February and March 2020. These readings enabled the understanding of end uses and potential savings, including the minimum building daily water use. The building was washed during the period of meter readings, providing useful data. The garden irrigation system was not working, so it was not possible to confirm the irrigation water use. Toilet flush water use was estimated by comparisons from the literature on the average water use of different appliances.
The typical end uses of rainwater or greywater reuse include landscape irrigation, wash applications, and toilet and urinal flushing (Kapiti Coast District Council, 2017, p. 6) . Discussions with the Water Wellington engineers helped understand the potential water end uses. The concept was not to obtain potable water, as it would require a special and complex system of additional filtration and disinfection treatment. In addition, it is not recommended for potable water reuse in the urban setting due to possible health risks and the large size tanks (Kettle, 2010, p. 83). Therefore, the list of potential rainwater end uses would be for washing the building (normally twice a year, but currently only once a year due to drought); watering the gardens; toilet flushing, and for emergency non-potable water supply.
3.2.1. Victoria University of Wellington (VUW) records from 2018 - 2019
The university has a sustainability dashboard in order to monitor and control the usage of energy, gas and water of university buildings. Given these records, it was possible to assess information from the past two years average water use and identify different water patterns during the year (Figure 4).

1336
Rachel Paschoalin, Ronnie Pace, Nigel Isaacs
Figure 4. Average water use in 2018 and 2019.
The long term records shows between April to October (first and second teaching trimesters), water usage is higher probably due to high building occupancy. Comparing overall use (Figure 4) with rainfall patterns (Figure 3) reveals potential for rainwater reuse, as the highest water use months are also when rainwater potential is higher. The average water use during the last two years was about 8000 litres per day but increased from 2.6 to 3 million litres per year, close to the roof potential of 2.5 million litres per year.
3.2.2. Water meter readings
Water meter readings were carried out to compare with the longer term records and to understand the overall usage. During February - before the first trimester resumed - and March - during the first trimester, but partially in the Covid-19 lockdown - the meter was read twice a day (9 a.m. and 7 p.m.) to record the day and night measurements, also to understand the week and weekend differences (Figure 5).
The Figure 5 shows, like the long-term records, that there is a noticeable difference in water use between the pre-term and the trimester periods. This difference is especially seen during the weekdays when the building is mostly occupied by students and staff. Another important figure represented in the graph is the weekend night use, when the building is expected to be largely unoccupied. However, there is still an average of 90 litres per hour consumption during the weekend night in the pre-term period representing the building minimum water usage. This result is based on a preliminary assessment and suggests longer term monitoring should be carried out in order to have refined results in a future stage, but still shows that there is a potential to reduce the minimum water consumption. The meter readings also confirmed that the meter daily average matches with the average longer-term daily use of 8,000 litres.

1337
Urban resilience: potential for rainwater harvesting in a heritage building.
Figure 5. Litres per hour from February and March meter readings.
Readings were also made for one week when the building was being washed, finding washing the building once a year uses approximately 40,000 litres.
3.2.3. Toilet flush
The toilet flush systems represent an opportunity for improvements, as they can be responsible for leakage faults. Different models have different toilet flush duration, resulting in different water consumption. A comparison method was used to roughly estimate the amount of water used by each flush system in the building. Firstly the different flush systems were identified (11 cyclically flush wall pod urinals and 58 single flush cistern or in-line toilets), then the recorded consumption from the literature (Bint, 2012, pp. 106–109) was used to calculate the overall yearly use (see Table 1 which also gives the assumptions). For example, the single flush toilets over a 52-week occupation used approximately 1 million litres per year.
Table 1: Building toilet flush systems and overall usage.
Number and model of flush systems
Litres per hour used (Bint, 2012, pp. 106–109)
Total litres per year (approximate)
11 cyclically flush wall – pod urinals (2 flushes per hour of 4 litres) 88 litres per hour:
700,000 litres per year
58 single flush (cistern or in-line) toilets
(5 to 11 litres per flush) 464 litres per hour.
52 weeks considering different occupancies 1,000,000 litres per year

1338
Rachel Paschoalin, Ronnie Pace, Nigel Isaacs
4. Analysis of findings This preliminary study identified potential water savings given the significant minimum usage figure from weekend nights, as well as potential for the use of rainwater for washing the building, toilet flushing and garden irrigation. The estimated water savings are listed below.
• Water use for washing the building: 40,000 litres a year. • Estimate toilet flush consumption: 1.7 million litres a year. • Watering lawns or garden irrigation: usage unknown. • Building minimum water use and possible leaks: there is a potential for reduction of around
800,000 litres a year if appliances are improved.
The analysis shows toilet flushing and building washing use a total of about 1.8 million litres per year, which is less than the harvesting capacity of 2.5 million litres per year, suggesting there is still a great potential for emergency water supply and garden irrigation.
To store this collected rainwater would require approximately 2000 m3 of underground volume, although further analysis is required to confirm this would be` appropriate. However, it is important to stress that the first action before implementing any rainwater (or reuse) water system is to reduce the water usage by upgrading old and inefficient appliances. For instance, if the toilet and pod urinal flushing systems were improved there would be a decrease in the toilet flushing which might free rainwater capacity for other end uses, such as emergency water supply for other nearby buildings.
In terms of cost savings, taking into account the 2012 Wellington price of potable water of NZ$ 1.715 per m3 (Bint, 2012) and the yearly harvesting capacity of 2500 m3, the yearly savings would be around NZ$ 4,300. These savings are not great due to the current low rates of water in Wellington, which does not have variable costs on both incoming potable water and the outgoing wastewater like Auckland(Watercare, 2020). However, beyond the low economic savings that might change and increase in the future, there are other relevant social costs to consider, such as reducing local flooding and providing additional resilience for Old Government Buildings in case of a natural disaster.
5. Discussion of benefits and constraints The research findings confirm the social, environmental and economic benefits of implementing a rainwater system in existing buildings. It can represent a long-term water and cost savings in a climate change scenario of water scarcity and future increase in water prices, as well improve resilience for the building (and potentially its neighbours) in case of fire or a natural disaster such as earthquake or flooding. The social and environmental benefits for the building, city and region are also important aspects. Another aim of having a rainwater reuse system, and also upgrading water appliances in historic and heritage buildings is promoting them as responsible consumption benchmarks contributing to create thriving and resilient communities (Ursino and Pozzato, 2019).
Nevertheless, implementing rainwater use systems in heritage buildings can be challenging. The proper and critically designed intervention must not interfere at the authenticity and integrity of the heritage asset. In order to maintain the heritage significance, interventions need to be approved by the correspondent protection agencies that will look to ensure the ICOMOS NZ Charter (or in Australia the Burra Charter) principles of conservation are being followed. These agencies will look for solutions that have minimum interference in the building fabric appearance and are reversible ((ICOMOS Australia, 2013; ICOMOS NZ, 2010), but that may not always be possible. Some Australian guidelines even indicate if an above ground tank is installed in a heritage area, it should be located in the rear yard (ABCB, 2016,

1339
Urban resilience: potential for rainwater harvesting in a heritage building.
p. 44). The upgrades in plumbing systems will require at times intervention in the existing fabric; therefore the solution needs to be carefully designed by a multi-disciplinary team of plumbing engineers and conservation experts.
Another constraint may be the cost investment of a project in this scale. The end uses of a rainwater harvesting system will define the treatment, distribution and storage requirements. Some end uses such as potable water will require a complex filtration and treatment system that incurs in a more expensive initial investment. The use of rainwater for toilet flushing may require adding or upgrading plumbing systems that need to be carefully planned in order to be cost effective solutions. It is important to evaluate the long-term cost benefits and the life cycle cost analysis. Each historic and heritage site need to be assessed individually in terms of potential for intervention, as each will present unique constraints. The research reported in this paper is but a first step towards the future use of rainwater in Old Government Buildings.
6. Conclusions In order to achieve resilience in urban areas, not only new buildings need to adapt to the new climate requirements, but all existing buildings, including historic and heritage at some degree can contribute to thriving and resilient communities. This paper highlighted the numerous social, economic and environmental advantages of including a rainwater system in a historic area and building, enhancing their preventive protection. Despite possible cost and heritage constraints, it does not set aside the feasibility of implementing a rainwater system in Old Government Buildings.
The preliminary findings suggest that the roof space can collect about 2.5 million litres of water per year that could potentially be used in place of approximately 1.8 million litres of city supply water for washing the building, irrigation, toilet flushing and emergency water supply for fighting fires or other disasters. Moreover, harvesting rainwater can decrease the stormwater runoff reducing the risks of local flooding. The rainwater collection system would require simple measures such as, adding filters to the gutters, a first flush diverter and water storage tanks. However, the tanks would need a more detailed concept and design in terms of minimizing the heritage impact.
Further research on the heritage impact of different system options is recommended following this first preliminary study, as well as a long-term water monitoring for further validation. The feasibility analysis in terms of life cycle cost should be carried out in a second stage in order to understand the most cost effective appliances, for instance if flushing and taps are upgraded, and if plumbing works are required.
Acknowledgements The support of HNZPT to carry out these studies is gratefully acknowledged.
References ABCB, 2016. RAINWATER HARVESTING AND USE: Research report. Australian Building Codes Board (ABCB) -
Commonwealth of Australia and States and Territories of Australia, Australia. Beban, J.G., Stewart, C.A., Johnston, D.M., Cousins, W.J., 2013. A study of the role of rainwater tanks as an emergency
water source for the Wellington region following a major earthquake on the Wellington Fault. GNS Science, New Zealand.

1340
Rachel Paschoalin, Ronnie Pace, Nigel Isaacs
Bint, L.Ellen., 2012. Water performance benchmarks for New Zealand : understanding water consumption in commercial office buildings : a thesis submitted to the Victoria University of Wellington in fulfilment of the requirements for the degree of Doctor of Philosophy in Building Science (Thesis (Ph.D.)). Victoria University of Wellington, New Zealand.
Ermenyi, T., 2020. Using Laser Scanners & Drones to Document Heritage Buildings. Old Government Building. 55 Lambton Quay, Wellington, NZ (Victoria University of Wellington Summer Research Project 2019-2020 in partnership with Heritage New Zealand.). Wellington, N.Z.
Farreny, R., Morales-Pinzón, T., Guisasola, A., Tayà, C., Rieradevall, J., Gabarrell, X., 2011. Roof selection for rainwater harvesting: Quantity and quality assessments in Spain. Water Res. 45, 3245–3254. https://doi.org/10.1016/j.watres.2011.03.036
Haq, PEng, S.A., 2017. Harvesting Rainwater from Buildings. Springer International Publishing, Cham. https://doi.org/10.1007/978-3-319-46362-9
ICOMOS Australia, 2013. The Burra Charter: The Australia ICOMOS Charter for Places of Cultural Significance. ICOMOS NZ, 2010. ICOMOS New Zealand Charter for the Conservation of Places of Cultural Heritage Value. Kapiti Coast District Council, 2017. KĀPITI COAST RAINWATER AND GREYWATER CODE OF PRACTICE GUIDELINES. Kettle, D., 2010. Barriers to Water Demand Management: health, infrastructure and maintenance. (Report WA7060/6
for Beacon Pathway Limited). Beacon Pathway Limited. Ministry for the Environment, 2018. Climate change projections for New Zealand. Ministry for the Environment. Nachshon, U., Netzer, L., Livshitz, Y., 2016. Land cover properties and rain water harvesting in urban environments.
Sustain. Cities Soc. 27, 398–406. https://doi.org/10.1016/j.scs.2016.08.008 NIWA, 2020. Annual climate summary [WWW Document]. URL https://niwa.co.nz/climate/summaries/annual
(accessed 10.06.2020). NY City Environmental Protection, 2020. Water Conservation & Reuse Grants [WWW Document]. URL
https://www1.nyc.gov/site/dep/water/water-conservation-reuse-grants.page (accessed 10.06.2020). Pace, R., 2020. OGB roof conditions report (Draft) (Draft). Heritage New Zealand Pouhere Taonga, Wellington, N.Z. Pearce, P.R., 2017. Wellington Region climate change projections and impacts. NIWA Client Report for Greater
Wellington Regional Council, 2017148AK., NZ. Towle, M., 2020. Wellington would struggle for enough water to fight fires post-quake. Ursino, N., Pozzato, L., 2019. Heritage-Based Water Harvesting Solutions. Water 11, 924.
https://doi.org/10.3390/w11050924 Watercare, 2020. Our charges [WWW Document]. URL https://www.watercare.co.nz/Manage-account/Our-charges
(accessed 10.06.2020). Wellington City Council, 2020. Water meter [WWW Document]. URL
https://wellington.govt.nz/services/environment-and-waste/water/water-meters (accessed 10.06.2020). Wellington Water, 2020. Your water [WWW Document]. URL https://www.wellingtonwater.co.nz/your-water/
(accessed 10.06.2020). Wellington Water, 2019. Managing Stormwater Runoff. The use of raintanks for hydraulic neutrality Acceptable
solution #1.

1341
The 54th International Conference of the Architectural Science Association (ANZAScA) 2020
User-specific predictive affective modeling for enclosure analysis and design assistance
Rohit Priyadarshi Sanatani1
1School of Planning and Architecture, New Delhi, India [email protected]
Abstract: There have been multiple recent lines of quantitative inquiry into the correlations between spatial parameters of virtual enclosures, and the corresponding emotional responses in occupants. The application of such empirical approaches for occupant-specific predictive affective modeling and design assistance is, however, a very nascent domain. This paper outlines a design assistance workflow for rapid user-specific data collection and predictive affective analysis of enclosures in early stage design. For demonstration, 100 enclosures randomly generated along 9 spatial parameters – length, width, ceiling height, sill height, lintel height, no of windows, window position, total window width and wall hue – were presented to 5 subjects through cursor controlled displays as well as immersive VR environments, and were subsequently rated on an EmojiGrid, based upon the Circumplex Model of Affect. For design assistance, the framework allowed the designer to import any subject-specific dataset, and then applied K-Nearest Neighbour (KNN) regression algorithms to evaluate the affective impact of a designed test enclosure in real time, based on its spatial parameters and subject-specific training data. This research thus aims to integrate ‘subjective’ patterns of affective response into a computational framework, and open up possibilities for the ‘emotional customization’ of spaces.
Keywords: Affective Customization; Enclosure Analysis; Machine Learning; Design Assistance.
1. Introduction and Background The emotional or ‘affective’ qualities of space have long been referred to as ‘intangible’ aspects that cannot easily be empirically analyzed or evaluated. The sensorial, experiential, and emotional aspects of enclosures are commonly conveyed through artistic media and representation techniques, but seldom through quantitative data driven frameworks. While the field of environmental psychology has over the years developed multiple models for the objective measurement of affective states (Russell 1980, Bradley and Lang 1994), these models have so far seldom been applied to spatial environments, thus making it difficult for designers to adopt a ‘scientific approach’ to the realm of spatial affect.
More importantly, the affective domain is well known to possess a great degree of ‘subjectivity’. It is common knowledge that a single space can incite very different emotional responses in different occupants or user groups. Subjective experience has long been the center of phenomenological discourse, and is often attributed to factors such as cultural background and personality traits (Tweed 2000, Kuppens et al. 2013, Markovic et al. 2016) The ‘positionality’ of the designer thus dominates when
Imaginable Futures: Design Thinking, and the Scientific Method. 54th International Conference of the Architectural Science Association 2020, Ali Ghaffarianhoseini, et al (eds), pp. 1341–1350. © 2020 and published by the Architectural Science Association (ANZAScA).

1342
Rohit Priyadarshi Sanatani
engaging with design decisions pertaining to ‘feelings’ in spatial environments. Designers also rely heavily on their own intuitive processes when dealing with the realm of spatial affect. This subjectivity thus comes in the way of the creation of ‘standards’ for affective design, and counters the development of models that aim to simulate the affective dimension of space.
Nevertheless, over the past two decades, multiple studies have begun to establish frameworks for the systematic inquiry into the correlations between spatial (formal) parameters of architectural and urban enclosures, and the corresponding affective responses in occupants (Franz et al. 2003, Vartanian et al. 2013, Aspinall et al. 2013, Banaei et al. 2017, Marín-Morales et al. 2018, Sanatani 2019). Advances in simulation technologies, coupled with the rapid development and availability of virtual reality systems has opened up new methodological possibilities (Rubiyo-Tamayo et al. 2017).
Very recent advances in the application of affective computing approaches within the domain of architectural design have led to the development of models for the predictive affective evaluation of spatial enclosures (Marín-Morales et al. 2018). There have also been very initial advances by this author in the development of machine learning driven design assistance frameworks for the real-time predictive evaluation of enclosures in early stage design (Sanatani 2020). However, such research directions remain focused on the commonalities of affective experience across all subjects that constitute a dataset, rather than the subjective experiences of individual occupants or groups of occupants. There is thus immense potential for target occupant-specific affective simulation of spatial enclosures for real time predictive evaluation.
This body of research demonstrates a design assistance framework that integrates the rapid collection of target user or user-group specific affective data within an early stage design workflow, and draws upon such data for the real time affective evaluation of enclosures during design phase. The framework thus supplements the positionality and intuition of a designer with machine learning models that have been trained on user-specific datasets, thus responding to the affective nuances of the target occupant(s).
2. Affective Analysis of Spatial Enclosures
2.1 Frameworks for Affective Appraisals
While a number of models have been proposed pertaining to the structure of human emotion (Moors 2009), the Circumplex Model of Affect (Russel 1980) has been widely used within the field of environmental psychology for the objective measurement of affective states. The circumplex model comprises of the two primary dimensions of ‘Valence’ (Pleasant – Unpleasant) and ‘Arousal’ (Activated – Deactivated). According to this model, a wide range of human affective states can be represented as points within this two dimensional emotion–space. A third dimension of ‘Dominance’ (or Potency) is also often considered.
Based on the framework laid down by the circumplex model, Bradley and Lang (1994) developed a language independent scaling system known as the Self Assessment Manikin (SAM) for recording Valence and Arousal values in response to environmental stimuli. The SAM converted the two dimensions of the circumplex into pictorial scales for self-rating (also known as Affective Appraisals). While the SAM has been used widely in a variety of experiments across disciplines, recent methodological advances have pointed towards more appropriate frameworks for the recording of affective appraisals. Notably, the EmojiGrid (Toet et al. 2019) has been gaining popularity as an effective tool in this regard. The EmojiGrid adheres to the circumplex model, and comprises of a two-dimensional

1343
User-specific predictive affective modeling for enclosure analysis and design assistance
square emotion space. The emotions represented by different points along the periphery of the grid are depicted through their corresponding ‘Emojis’, with the geometric center of the grid depicting a neutral Emoji. This grid thus forms an effective and language-independent framework for the collection of affective data.
2.2 Formal attributes and emotional response
Systematic inquiries into the correlations between formal attributes of enclosures (such as shape, size, proportion, color, texture etc.) and emotional response in occupants had long been hindered by difficulties in fabricating parametrically controlled physical enclosures for experimentation. While a few early studies did embark upon such research directions, the development of virtual reality systems has sparked a renewed interest in such lines of inquiry.
Early studies examining the impact of spatial parameters of virtual enclosures on affective response revealed notable correlations between attributes such as ‘spaciousness’ and overall window area. The maxima for rated ‘beauty’ were found to correspond to length/width and width/height ratio values that were very close to the golden ratio (Franz et al. 2005). Shemesh et al. (2015) compared the emotional responses of designers and non-designers to different geometrical configurations of architectural space simulated in a visualization lab, using rating systems comprising of the scales ‘efficient’, ‘pretty’, ‘safe’, ‘pleasant’, and ‘interesting’. Banaei et al. (2017) employed EEG imaging to reveal that enclosures with higher Valence and Arousal values contained curved geometries. Pilot studies conducted by this author in Head Mounted Display (HMD) driven environments employed SAM based affective appraisals of virtual enclosures to reveal strong correlations between daylight factor and Arousal. Peak Valence values corresponded to a total-window-area/total-wall-area ratio of .03, an enclosure volume of 70 cu.m and a length:width range between 1:1 and 1:1.5. The golden ratio was not rated favorably (Sanatani 2019). Affective inquiries in the urban realm have employed mobile EEG systems and emotion recognition software to reveal reductions in Frustration, Arousal and Engagement levels when transitioning from built areas into green spaces (Aspinall et al. 2013).
The data derived through such methodological frameworks have potential to be adopted as training data for predictive affective computing. As discussed, there have been some early advances in the development of a machine learning driven design assistance framework that allow for designers to import pre-existing datasets as training data for the deployment of regression models for real time affective analysis of enclosures (Sanatani 2020). While such frameworks have potential for further development, they do not address the challenges of varying experiences across users. The need for user specific predictive affective modeling has thus become evident.
3. The Design Assistance Framework This section outlines a design assistance framework that will allow for designers to collect such user- specific affective data for the target occupants of a function-specific spatial enclosure, and use that dataset as training data for the real-time predictive affective evaluation of the enclosure being designed.
This framework for ‘customized emotional design’ comprises of two main components – the Data Collection Workflow and the Affective Analysis Workflow. The former integrates the collection of rapid user specific affective datasets into the early stage design process, while the latter draws upon such collected datasets for real-time custom user specific affective evaluation of a design.

1344
Rohit Priyadarshi Sanatani
3.1 The Data Collection Workflow
As already discussed, the affective responses to spatial enclosures are often highly ‘subjective’. Any affective analysis framework would thus have to rely upon data pertaining to the affective nuances of the target user or user groups. The Data Collection Workflow serves that specific purpose and enables the collection of user-specific affective data for predictive analysis.
For demonstration, the Data Collection Workflow was adapted for the Rhino3d + Grasshopper platform. A custom Python script within Rhino generated 100 spatial enclosures (all bedrooms) randomized along 9 spatial parameters, namely length, width, ceiling height, sill height, lintel height, no of windows, window position, total window width and wall hue. A bed, wardrobe, ceiling fan and tube-light were the only furniture/fixture items placed within each of the spaces, in fixed relative locations. These objects were placed primarily to anchor the functional specificity of the enclosure as a bedroom. In addition a dummy human figure was placed near the opposite wall to anchor a sense of scale. All such items were rendered in white, in order to retain primary focus on the spatial parameters of the enclosure. Eye height was fixed at 1500mm and camera position was fixed near one corner of the room, to allow for the subject to get a complete view of the room from the vantage point. Figure 1 shows samples of the generated enclosure scenes. For data collection, two separate methodologies were devised for the framework, as has been detailed in the following sections.
Figure 1: Sequentially generated randomised enclosure scenes
3.1.1 Methodology 1: 2D Display with cursor control
To demonstrate the first data collection methodology, 5 subjects (mean age 26 ± 3 years) were each asked to rate the enclosures rendered in real time using VRay for Rhino, through a 22” LED display with cursor control for movement and 360° viewing. The ratings were in the form of affective appraisals on an EmojiGrid that appeared within the environment, near the observer’s foot (Figure 2). To record their response, the subject had to click on any point on the EmojiGrid, and the Valence/Arousal ratings for the two axes would automatically be registered on a 9-point Likert scale between -4 and +4. A dataset (.csv file) comprising of the values of the spatial parameters for each enclosure, along with their corresponding affective ratings would thus be generated for each subject.

1345
User-specific predictive affective modeling for enclosure analysis and design assistance
Figure 2: The EmojiGrid (Toet et al. 2019) (left) and the rating space in the display environment (right)
3.1.2 Methodology 2: 360° Immersive VR environments
In a second methodology, a custom render pipeline was scripted in Python to automatically generate 360° spherical renders of resolution 1500 x 750 for each of the randomized enclosures using VRay for Rhino (Figure 3). A dataset comprising of the feature values for each of the enclosures was also generated as a .csv file.
Figure 3: 360° spherical renders for immersive VR viewing
The renders were then adapted for immersive stereoscopic VR viewing using the Fulldrive engine and a Head Mounted Display (HMD) unit (Isuru Play VR). The environment was also live-streamed to a

1346
Rohit Priyadarshi Sanatani
laptop for real time monitoring. The subjects (the same as in methodology 1) were exposed to each scene for approximately 20-30 seconds, and manually indicated a point on the EmojiGrid (once again appearing near the feet) for each enclosure. The ratings were converted to Valence/Arousal values and updated on the dataset. While this method provided greater realism and immersion, appropriate systems need to be adopted for the real time generation of VR scenes and the automated collection of affective response within the VR environment itself. On an average, the data collection process per subject took 20-25 minutes to complete.
Figure 4: The HMD setup (left) and the stereoscopic VR scene for a sample enclosure (right).
The aim of the Data Collection Workflow is thus to integrate the rapid collection of user specific affective data in early stage design, for machine learning models to learn the affective preferences of the user. This serves as the foundation for real time design assistance as described in the next section. The quality of immersive visualization as well as the ease and pace of collecting data become critical in this phase. Table 1 describes the key parameters of the datasets obtained through this workflow.
Table 1: Key dataset parameters. Val/Asl ratings are for Subject 3.
l b h sill_h lint_h win_no win_pos win_b wall_hue val asl count 100 100 100 100 100 100 100 100 100 100 100 mean 4411 4824.36 3326.01 755.37 2195.82 1.41 1926.48 1520.88 184.29 0.37 0.05 std 967.58 706.26 381.80 245.13 213.94 0.49 680.12 449.38 97.46 2.34 1.95 min 2834 3500 2710 309 1807 1 988 785 4 -4 -3 25% 3599.75 4280.75 3004.5 560.75 2006.5 1 1411.75 1125.25 104 -2 -2 50% 4385 4929 3333 725 2221 1 1734.5 1480.5 198.5 1.5 0 75% 5251.75 5452.25 3658.75 970.25 2386.5 2 2322 1908.75 255.5 2.5 2 max 5998 5987 3984 1192 2498 2 4034 2392 353 4 4

1347
User-specific predictive affective modeling for enclosure analysis and design assistance
3.2 Affective Analysis Workflow
The affective analysis workflow loads custom user specific datasets for predictive real time affective analysis of designed enclosures. For demonstration, the analysis framework was scripted as a custom python component within Grasshopper3d using the GHCPython component (Abdelrahman 2017) (Figure 5). The key components of the test enclosure (such as walls, windows, floors and ceilings) had to be first defined in the Grasshopper script. The script would them compute the values for the 9 key spatial parameters. This would serve as test data for the machine learning models encoded within the custom python component to make predictions.
Figure 5: The custom KNN regression algorithm within the Grasshopper3d platform
3.2.1 Regression Models and Prediction Accuracy
In the current version of the framework, the python script applied a K-Nearest Neighbor (KNN) regression algorithm on the training data sets using the scikit-learn library (Buitinck et al. 2013), in order to make predictions of Valence and Arousal ratings. For the 5 demonstrative subjects, the model was able to predict the ratings with average root mean squared errors of 1.37 and 1.35 for valence and arousal respectively (on 9-point scales between -4 to +4). Table 2 below summarizes the key error metrics for the framework. On the whole, methodology 2 allowed for greater consistency of responses within the collected dataset, and thus greater accuracy of prediction by the model.
Table 2: Key error metrics for the predictive framework (test size = 15)
Root mean squared error Val (min) Val (mean) Val (max) Asl (min) Asl (mean) Asl (max)
Methodology 1 0.89 1.34 2.05 1.14 1.42 2.07 Methodology 2 (VR) 0.65 1.39 1.97 1.00 1.28 1.84

1348
Rohit Priyadarshi Sanatani
Figure 6: Predicted vs Rated values for Valence and Arousal. (Subject 2, Test size = 20)
3.2.2 The predictive evaluation interface
For design assistance, the predicted Valence and Arousal ratings as computed by the regression models would be converted into a point on the EmojiGrid, and displayed within the Rhino model space. Any changes to the formal attributes of the enclosure would result in the point being updated in the grid. This thus allowed for a real time predictive analysis of the affective impact of design decisions or design alterations. Figure 7 below shows the affective analysis framework in action, predicting different user specific affective states for different spatial configurations for an enclosure in early stage design.
Figure 7: The Design Assistance Interface with predicted affective states reflected on the EmojiGrid.

1349
User-specific predictive affective modeling for enclosure analysis and design assistance
4. Conclusion: Opportunities, Challenges and Future Directions The design assistance framework described in this paper attempts to integrate rapid affective data collection and real-time analysis into the early stage spatial design process. Most importantly, it is a step towards integrating user-specific and ‘subjective’ patterns of affective response into a computational framework, thus opening up possibilities of the emotional customization of spaces.
As discussed right at the outset, this framework situates itself within a very nascent research direction, and thus has much scope for further development and refinement. The data collection process in VR was described as tiring by multiple subjects, largely due the fact that the HMDs had to be worn continuously for the test duration. This would certainly have had an impact on the affective states of the subjects towards the end. A robust data collection methodology involving real time generation of randomized enclosures for immersive VR viewing and rapid appraisal thus needs to be synthesized. This will considerably increase the accuracy of the affective data collected, thus enhancing the reliability of the predictive analysis. Architects have a limited time of engagement with clients, and an immersive yet quick framework becomes the key to smooth collection of affective data. For the affective analysis component as well, more appropriate machine learning models need to be deployed for greater accuracy of predictions. The average root-mean squared error of ~1.36 of the predictions needs to be improved if the framework is to mature into a viable supplement to the designer’s intuitive processes.
There is great potential for the entire framework to be developed as plugins for existing early stage design platforms, which will allow architects to rapidly collect affective data directly from clients, or from representatives of target user groups, and use these custom datasets for real time affective analysis of design outcomes. There has been rapid development over the years in virtual/mixed reality collaborative design platforms (Penn et al. 2004, Belcher et al. 2008, Schubert et al. 2015, Dorta et al. 2016), and the adoption of such platforms for the collection and analysis of affective data can open up new possibilities. Moreover, such predictive models can also plug into existing algorithmic and evolutionary floor plan generation frameworks, as a tool for the optimization of affective parameters. There is also scope for such a predictive framework to provide an affective dimension to the future of dynamic or parametrically alterable physical structures, where such enclosures may be able to change their form based on a desired ‘mood’ of the occupant. It is hoped that such directions towards engaging with user-specific spatial affect opens up new dimensions to the role of the architect in the near future.
References AbdelRahman, M. (2017) MahmoudAbdelRahman/GH\_CPython: Alpha release of GH\_CPython plugin, Zenodo. Aspinall, P., Mavros, P., Coyne, R. and Roe, J. (2015) The urban brain: analysing outdoor physical activity with mobile
EEG, British Journal of Sports Medicine, 49(4), 272-276. Banaei, M., Hatami, J., Yazdanfar, A. and Gramann, K. (2017) Walking through architectural spaces: the impact of
interior forms on human brain dynamics, Frontiers in human neuroscience, 11, 477. Belcher, D. and Johnson, B. (2008) MxR: A Physical Model-Based Mixed Reality Interface for Design Collaboration,
Simulation, Visualization and Form Generation,Proceedings of the 28th ACADIA Conference, 464-471. Bradley, M. M. and Lang, P. J. (1994) Measuring emotion: the self-assessment manikin and the semantic differential,
Journal of behavior therapy and experimental psychiatry, 25(1), 49-59. Buitinck, L., Louppe, G., Blondel, M., Pedregosa, F., Mueller, A., Grisel, O., Niculae, V., Prettenhofer, P., Gramfort, A.,
Grobler, J., Layton, R., Vanderplas, J., Joly, A., Holt, B., Varoquaux, G. (2013) API design for machine learning software: experiences from the scikit-learn project, arXiv: 1309.0238.
Dorta, T., Kinayoglu, G. and Hoffmann, M. (2016) Hyve-3D and the 3D Cursor: Architectural co-design with freedom in Virtual Reality, International Journal of Architectural Computing, 14(2), 87-102.

1350
Rohit Priyadarshi Sanatani
Franz, G., Von Der Heyde, M. and Bülthoff, H. H. (2005) An empirical approach to the experience of architectural space in virtual reality—Exploring relations between features and affective appraisals of rectangular indoor spaces, Automation in construction, 14(2), 165-172.
Kuppens, P., Tuerlinckx, F., Russell, J. A. and Barrett, L. F. (2013) The relation between valence and arousal in subjective experience, Psychological bulletin, 139(4), 917.
Marković, S., Stevanović, V., Simonović, S. and Stevanov, J. (2016) Subjective experience of architectural objects: A cross-cultural study, Psihologija, 49(2), 149-167.
Marín-Morales, J., Higuera-Trujillo, J. L., Greco, A., Guixeres, J., Llinares, C., Scilingo, E. P., Alcañiz, M. and Valenza, G. (2018) Affective computing in virtual reality: emotion recognition from brain and heartbeat dynamics using wearable sensors, Scientific Reports, 8(1), 1-15.
Moors, A. (2009) Theories of emotion causation: A review, Cognition and emotion, 23(4), 625-662. Penn, A., Mottram, C., Wittkämper, M., Störring, M., Romell, O., Strothmann, A. and Aish, F. (2004) Augmented reality
meeting table: a novel multi-user interface for architectural design, in, Recent Advances in Design and Decision Support Systems in Architecture and Urban Planning, Springer, 213-231.
Rubio-Tamayo, J. L., Gertrudix Barrio, M. and García García, F. (2017) Immersive environments and virtual reality: Systematic review and advances in communication, interaction and simulation, Multimodal Technologies and Interaction, 1(4), 21.
Russell, J. A. (1980) A circumplex model of affect, Journal of Personality and Social Psychology, 39(6), 1161. Sanatani, R. P. (2019) An Empirical Inquiry into the Affective Qualities of Virtual Spatial Enclosures in Head Mounted
Display driven VR Systems, in N. Steinø and M. Kraus (eds.),7th eCAADe Regional International Symposium, Aalborg, Denmark, 133 - 142.
Sanatani, R. P. (2020) A machine-learning driven design assistance framework for the affective analysis of spatial enclosures,RE: Anthropocene, Design in the Age of Humans, Proceedings of the 25th International Conference on Computer-Aided Architectural Design Research in Asia (CAADRIA 2020), 741-750.
Schubert, G., Schattel, D., Tönnis, M., Klinker, G. and Petzold, F. (2015) Tangible mixed reality on-site: Interactive augmented visualisations from architectural working models in urban design,International Conference on Computer-Aided Architectural Design Futures, Springer, 55-74.
Toet, A., and van Erp, J. (2019) The EmojiGrid as a Tool to Assess Experienced and Perceived Emotions, Psych, 1(1), 469-481.
Tweed, A. C. (2000) A phenomenological framework for describing architectural experience. Vartanian, O., Navarrete, G., Chatterjee, A., Fich, L. B., Leder, H., Modroño, C., Nadal, M., Rostrup, N. and Skov, M.
(2013) Impact of contour on aesthetic judgments and approach-avoidance decisions in architecture, Proceedings of the National Academy of Sciences, 110(Supplement 2), 10446-10453.

1351
The 54th International Conference of the Architectural Science Association (ANZAScA) 2020
Virtual Reality Activity Based Workplace Simulation Impact on Healthcare Facilities Space Management
Collin, A., Enegbuma, W.I., McIntosh, J. and Tamati, G.
Victoria University of Wellington, Wellington, New Zealand [email protected], [email protected]
Abstract: The paradigm shift towards use of digital tools in facilities management provides immense efficiency improvements for space planning. Growing demand for useable workspace invariably leads to hastened expansion into spaces for different purposes. This in turn leads to poor circulation, diminished access to natural lighting, restrictive airflow, lower productivity, improper storage and poor space planning. This study is leveraged on building information modelling-based VR (BIMBVR) using an activity-based workplace (ABW) design approach to provide better useable spaces within existing healthcare facilities in Wellington, New Zealand. A simulation-based methodological approach was adopted in this study. Using light detection and ranging equipment (LiDAR), a 310-point cloud scan was utilised to create 3D Revit models for four existing floors occupied by various non-clinical departments. Real time VR immersion was then utilised to collect feedback from the facilities management team on the redesigned layout using the FUZOR VR platform. The research asks how BIMBVR can aid in obtaining meaningful feedback from employees on potentially stressful workspace planning initiatives. The results revealed that BIMBVR enabled immersive stakeholder experience in both their existing spaces and then with the proposed design changes. Co-design strategies enabled improvements for better workplace organisation with far less stress and anxiety.
Keywords: Building information modelling (BIM), Virtual reality (VR), Activity-based workplace (ABW), Healthcare, Facility Management (FM).
1. Introduction
Healthcare facilities are going through a period of unprecedented change. Technological developments, demands of an ageing population and the constant challenges of less; resources, personnel, time, and money (Lucas, 2012) make them one of the most complicated facilities to manage, maintain and operate. The technical requirements of a 24-hour, 7 day a week operation (Lavay & Sohet, 2007; Lucas, 2012) limits options for change, while poor management of these buildings can lead to serious consequences impacting on human life (Ghosh & Chasey, 2013).
Successful implementation of facilities management (FM) in healthcare requires strategic planning, customer care, benchmarking, environment and staff development. However, recent studies find that the building management phase is one of the most disconnected from the building life-cycle because of poorly planned handover processes and inconsistent involvement in the early stages of the building life-cycle (Lucas, 2012, Araszkiewicz, 2017, Haddock, 2018). Loss of information, manual and paper-based data-entry, incompatible software programs and systems all have a significant impact on the FM resources and budget (Lavy & Jawadekar, 2014; Araszkiewicz, 2017) and are a major source of concern, particularly for building retrofit decision making.
As growing demand for useable workspace invariably leads to hastened expansion into spaces for different purposes, circulation systems, access to natural lighting, airflow, information storage, space planning and employee productivity are compromised. Maintenance and retrofit decisions become expensive and it becomes increasingly difficult to visualize perceived changes. This problem is exacerbated by the general resistance of healthcare space occupants to support strategic retrofits on their working spaces.
Imaginable Futures: Design Thinking, and the Scientific Method. 54th International Conference of the Architectural Science Association 2020, Ali Ghaffarianhoseini, et al (eds), pp. 1351–1359. © 2020 and published by the Architectural Science Association (ANZAScA).

1352
Collin, A., Enegbuma, W.I., McIntosh, J. and Tamati, G.
Perhaps not surprisingly, new technologies have created a paradigm shift towards use of digital tools in facilities management for efficiency improvements to information flow, strategic planning, benchmarking, space planning and employee productivity. The combination of Building Information Modelling (BIM), Activity based workplace design (ABW), Virtual Reality (VR), and associated add-on technologies such as Light Detection and Ranging (LiDAR) and others, to name but a few, are changing the face of FM. At the heart of FM, BIM is a shared data and knowledge platform for all stakeholders and provides a basis for decision making during the entire lifecycle of the building: from design and build, through maintenance and operation through to and retrofit and demolition (Mohanta & Das, 2016; Enegbuma et al., 2014). However, the application of BIM is widely attributed with new facilities and improvements in accurate up-to-date data for FM decisions making processes (Ohueri et al., 2018). In contract, this study examines the application of these new technologies in a retrofit of an ageing healthcare building where four floors of space were vacated as a new building became available. To test the potential of the technological proposition, this study employs BIM based VR (BIMBVR) to introduce ABW, a relatively new and somewhat controversial space planning system which organises space rather than operational division.
2. Activity-Based Design
ABW is an increasingly popular, modern spatial layout which focuses on creating spaces for a range of activity levels (Wohlers and Hertel, 2017). Within this space planning concept, occupants choose a work setting appropriate to their task. To encourage flexibility in the spaces, there is need for provision of high-quality wireless network coverage for occupants with laptop, computer or mobile device. A key feature of these spaces are anchor points for storage in personal lockers and an ability to have a ‘follow-me’ printing system allowing access to printing/copying facilities anywhere in the building as well as access to all screens in meeting rooms to discourage paper usage. These space layouts create increased collaboration and flexibility of movement which invariably increases knowledge exchange, worker satisfaction and productivity (Skogland, 2017; Cole and Oliver, 2012; Meijer and Frings-Dresen, 2012; Tesyre 2012; McElroy and Morrow, 2010) as well as providing greater work flexibility (Sundstrom, et al. 1980).
In a significant study of 47,913 office employees comparing ABW to a traditional, dedicated workstation, ABW employees were more positive and more satisfied in general with most of the individual features and amenities of their work environment. The design of the ABW workspace had a more positive (perceived) impact on the organisational culture, on the corporate image and on the organisation’s environmental sustainability. Furthermore, the research found that the design of their organisation's workspace contributed to a sense of community, creating an enjoyable environment to work in and which enabled them to work more productively (Appel–Meulenbroek et al, 2016). Studies carried out by Veldhoen + Company found that approximately 35% of people change their workspace during the course of the day; 45% changed every other day; 18% changed 2-3 times a week; and 2% used the same workspace virtually all the time (Hartmans and Kamperman, 2009). As a result of this research, Veldhoen + Company break spaces into three coherent environments; the virtual environment (IT supporting information and knowledge-sharing); the physical environment (building and interior design) and; the behavioural environment (organisational change, attitude and behaviour).
Three successful case studies were analysed to establish the elements of design that most contributed to their success. The first, Macquarie Bank, that has been one of the earliest ABW projects in Oceania and one that has been widely researched, the second two (Spark and TVNZ) are located in New Zealand in non-financial organisations, showing how ABW can be adapted to a variety of organisational types. TVNZ is a television company and Spark is a telecommunications company. The Macquarie Bank case demonstrated how clear identification of the many different spaces could be established through finishes rather than furnishings. Other key features from the case study were the treatment of: waiting areas for visitors, casual meeting areas and working areas, a variety of workstations including café style workstations and flexible workstations, meeting rooms with a strong visual connection to work areas and clear circulations spaces. Variation in finishing was established as an essential element of ABW design and a wide variety of finishing methods were utilised. The effect of this is the ability of the space to signal to the employee the intended use of the space. The space employs visual cues as it changes flooring materials between circulation and work areas (Blerby and Boardman, 2015; Theresianto, 2017).
The Spark offices implemented hot-desking, a controversial and often-polarising office system. The key features of this design were: an open atrium; an open kitchen and social areas, Informal meeting areas and large open workstations. The open atrium created a visual connection between spaces and allowed more natural light to penetrate into the working spaces. The carpet and ceiling finishes are the same on all levels and the furnishings are the only indicator of a change in space. Some criticisms of the space relate to the lack of attention to finishing and an inability to visually differentiable space compared to other ABW case studies. This

1353
Virtual Reality Activity Based Workplace Simulation Impact on Healthcare Facilities Space Management.
case study also highlighted the need for careful consideration of neighbouring spaces. An open social space produced a large amount of noise and location of such space in close proximity to the main workspaces with limited acoustical barriers proved distracting for staff. Similarly, the workstation areas had little variety, limiting options for different ways of working. Finally, the informal meeting areas are not as functional as other ABW case studies due to discomfort of using suspended seated area for work .
Finally, the TVNZ project illustrates the complexity of a refurbishment. The organisation had occupied the same offices since 1989 and the renovation was driven by client request which explicitly stated “This place needs to be more open and alive”. The brief laid emphasis on remodelling to better respond to contemporary workplace expectations and the changes brought by the birth of fast-news and digital media. The project adopted a large number of ABW features including: open social areas for meetings, waiting areas and break- out spaces, Informal meeting areas, small connected private meeting rooms with a range of small cafe style seated areas, varied workstations, including open work areas and group and individual spaces. Strong visual cues were used to distinguish changes of activity and a modern industrial design exposed ceilings and mechanical, electrical and plumbing (MEP) components.
These three case studies each brought about substantial change and required employees to adapt their working behaviours to fit with the new facility design. Implementation was not always ‘smooth sailing’ and ABW has not been beneficial for everyone. There is a need for a custom-made approach to ABW to be successful, allowing organisations to pick and choose characteristics that are most effective for them. Failures in the introduction of new work styles have been attributed to a lack of technology and the need for behavioural changes (Ross, 2011). Establishing a flexible workplace that meets the needs of a diverse workforce is clearly dependent on employee engagement (McGillick, 2013). If staff are not engaged, flexible workplaces cannot be established, expansion may not occur, and changes in workplace culture cannot be developed. The adoption of new technologies can create opportunities for enhanced employee engagement and start the conversation about how change could be positive. The use of BIMBVR allows a 3D immersive visualisation which can be combined with building information and data component capture enabling quick, realistic spatial design planning which can be tested with employees in a co-design process. In this way, the implementation of ABW design elements can be used to give employees greater control over their work environment, engaging in a safe and realistic encounter with new ways of working.
3. VR and BIM in FM
The hunt for a ‘perfect hospital patient room’ continues to elude the design process in hospitals as VR and BIM promises to improve this process (Julia, 2019). Much attention is focused on VR use in medical procedures (Moser and Bergamin, 2020; Green et al., 2019; Desselle et al., 2019; Uwajeh et al., 2019; Caruso et al., 2020) while contemporary studies are beginning to explore the wider use of VR in other aspects of the medical built environment (Farra et al., 2019; McIntosh et al., 2020). Interaction of users within a VR environment is the most natural interaction type when compared to mixed reality (MR) environments (Ergun et al., 2019). Subsequently, to bridge the gap in design innovation for hospitals, researchers are challenged to explore variables of political decisions, social shifts, architectural design trends, transformation in meaning of health, medical developments and economic shifts (Moslehian et al., 2020). In a similar proposition, clusters of dimensions were found to determine the rate of transparency and user involvement in hospital design process. This clusters are linked to project management, design practices, patient-centred operations, designer turnover, fitting together viewpoints, cross-disciplinary working, engagement of professionals, communication and rationale, and patient involvement (Jyrasalo, 2019).
In design collaboration, Ojala et al. (2020) proposed an interactive game based collaborative environment which allows users to interact with BIM models and carry out design reviews. In a contrary finding, Liu et al. (2019) found that although VR was not better than traditional media (drawings) in facilitating design review meetings, VR was however, beneficial in yielding more effective discussions and meeting efficiency. Due to tight design schedules for new buildings, end users may not necessarily enjoy the benefits of patients’ experience-centric innovations (Alhonsuo et al., 2019). Hospital end users are diverse in nature, for instance, to enable improvements in children’s ward space design, VR immersion was carried out with a follow-up interview of 24 random children which discovered that by varying the entertainment features, lighting, colour decoration and green space, children felt more comfortable (Sara et al., 2019). Adult users of mental health services were given a VR-walk through to lend their voices to how they perceived an ideal recovery space would aid their recovery (Liddicoat, 2019). VR played a key role in decision making for visitors’ preference in design of hospital outpatient surgery waiting areas. The factors found within the immersive VR environment were seat comfort, seat type, visual and auditory privacy, and visibility to registration area (Jafarifiroozabadi et al., 2020).

1354
Collin, A., Enegbuma, W.I., McIntosh, J. and Tamati, G.
Hospital professionals discussed and evaluated designs without prior design knowledge more effectively within a VR environment which invariably promotes the concept of co-design (Tiainen and Jouppila, 2019). Different users require different needs and application of immersive virtual reality (IVR) assists architects in design of a more inclusive space as users interact with highly realistic space which evoke behavioural realism (Lach et al., (2019). The selection of material finishes and material performance to interiors space from a user centric perspective is enabled by IVR (Zhang et al., 2019). In this study, one important decision maker to be emphasised are facility management teams. Su (2019) explored a complex computational simulation to assist FM teams in strategic decision making for optimising spatial adjacency in hospital master planning. While this study is not adopting computational programming, the efficacy of building information modelling-based VR (BIMBVR) would be explored to define current spatial layout, support the proposed ABW design solution and collect feedback for continuous codesign improvement for future retrofitting.
4. Methodology
Solutions to real time challenges in healthcare space planning require a multifaceted approach of both simulation and qualitative research. This study began by carrying out a comprehensive literature review on the background of healthcare facilities management. The review extended to ABW including two local and one international case study to establish effective design elements. VR and BIM were then reviewed to ascertain the level of user involvement in decision making. To prepare the building plans for BIM, a series of scans of the current healthcare facilities were undertaken using a Leica BLK360 LiDAR scanner. Scans were taken approximately every 6 m, in every doorway and every room in order to be able to register all of the point cloud scans together correctly. The scans form a network of 310 point-clouds, which are used as a reference to build a BIM Revit model. As scans are sensitive to movement and translucent materials such as glass, the auto- registration proved problematic. To address this situation, scans were indexed manually by selecting three common spots between two scans and registering these. Leica registration software provides a commonality percentage, measuring common points within 6 m of each other. Each floor required approximately 70 scans. Entire floors were scanned except for a few confidential areas. Point-cloud scans contain data including distances, heights, colours and material finishes as well as details including the MEP services which were also modelled. The scans are registered into a 3-D model of the scanned areas shown in Figure 4. The 3-D model was then imported into Revit and used as a guide for constructing the model. All office components were validated using COBIE search parameters and cross-checked in Navisworks Manage. The scans thus provide both point-cloud data and panoramic images which enabled matching of furnishings and finishes as accurately as possible. This provided a second reference replacing the out-of-date floor plans; validating the Revit model construction; and, providing the platform which enabled the move into VR using the FUZOR software. The VR software FUZOR was used to integrate with Revit allowing users to visually experience the space three dimensionally in VR. This was used to qualitatively analyse both current and designed spaces. The analysis of the model in VR then informed the design decisions using a research through design method to develop a revised model using ABW principles and drawing from analysis of the case studies. This is shown in Figure 4. The final space was then evaluated against the design guidelines established in the literature and case study analysis and compared to the current environment. Each part of the process was integral.
Figure 4. Methodological Approach
The finalised healthcare BIM model was exported into the program through an add-in FUZOR attachment in REVIT which has the capability to export all structural, architectural, and textured elements from the

1355
Virtual Reality Activity Based Workplace Simulation Impact on Healthcare Facilities Space Management.
healthcare BIM model into the VR environment. From this point, setting adjustments with FUZOR are necessary to ensure the immersive experience for stakeholders, which is vital to the VR communication process (Chias et al., 2019). Lighting elements can then be accurately adjusted, office sounds introduced, and textures cross- referenced with both the healthcare BIM model and the 3-D point cloud to ensure accuracy. Through this process, immersion in the redesigned VR healthcare environment was enabled using Steam to transfer information to the VR headset. Using the headset, the redesigned environment was assessed and presented to the FM team, enabling an effective and efficient method of client/designer communication.
5. Results and Discussion
The test case healthcare facilities are contained in an older block of the hospital complex and were constructed in 1978 as a hospital ward. The space is currently occupied by administrative functions such as corporate services, finance, strategy, innovations & planning and the Pacific Health Directorate. For this study, Level 12 was used for a detailed test. The floor plate is approximately 1,100 m2 and the floor accommodates 89 administrative and non-clinical personnel occupying 89 workstations. Due to the age of the facility, there was a lack of up-to-date as-built drawings and there were no plans integrating all components of the building (eg. structural and electrical). Reflected ceiling plans were also not available. The floors were underutilised and characterised by high levels of partitioning, excessive furnishings, small rooms and overly wide circulation spaces due to the initial design for a hospital ward. Key issues observed (Figure 5) were:
• No distinguishable workspaces. • A range of office densities. • Poor visual connection between spaces. • A lack of variety of work station. • Poor circulation space. • No variations in material palette. • Low ceiling height.
Figure 5. Workspace features in study test area
The case studies demonstrated that an open floor office building with a net leasable area (NLA) of 1,100m2 could achieve a desirable work environment with 10m2 per staff member, and therefore accommodate a total of 110 staff. To achieve this, the spatial layout required adjustment to improve the feeling of overcrowding and facilitate better employee efficiency, but most importantly to improve well-being for the employees. While the building overlooks greenery, the organisation of the space does not promote views or any connection to nature.
In the corridors, the only source of natural light is at the far ends of the building. The staff social areas are located in the centre of the building and while this spatially attractive, the kitchenette is closed-off and at a distance from the seating area. Reception and the main meeting rooms are disconnected and there is no visual

1356
Collin, A., Enegbuma, W.I., McIntosh, J. and Tamati, G.
connection between spaces. With respect to office areas, there is very little variation between office spaces and no distinction between them. There is also very little variety in types of workspaces. There is no distinction between the different divisions that work on the floor and no differentiability of spaces other than through the size and furnishings of the room.
Figure 6. ABW Design Solution
The proposed changes in the current floor plan include removal of internal walls, a reconfiguration of spaces, an increased number of toilets to account for staff increase, creation of storage facilities and a reception area. The revised plan accommodates 100 workstations, with additional informal working areas (Figure 6.) The removal of the partition walls increases the efficiency and flexibility of the floor, while allowing for greater density but creating a more spacious feeling. In addition, it allows natural light to permeate the spaces that were formerly blocked by partitioning. Due to the confidentiality requirements of the work undertaken a fully- open plan office was deemed unsuitable for some, however, teams could benefit from a more open and collaborative environment.
Figure 7. ABW Workstations
Figure 7 shows the range of spaces developed in one design solution which includes workstations for working in small groups, quiet groups of four workstations further away from social working areas, adjustable desk spaces, centralised café style informal space, casual meeting areas, private seating and standing spaces, social

1357
Virtual Reality Activity Based Workplace Simulation Impact on Healthcare Facilities Space Management.
meeting areas and private conference rooms. Some of the advantages accrued from this design solution are an improved physical environment, social environment, virtual environment; improved floor efficiencies; potential for improved staff productivity; improved potential for collaboration between divisions; greater staff member agency and autonomy and overall the potential for improved staff health.
6. Conclusion
This study began with the aims of leveraging an ABW approach to provide better useable spaces within an existing healthcare facility using BIMBVR. The cases studies examined the practical application of ABW in a variety of circumstances, including the retrofit of an older building. The research found that the use of VR to convey new facility designs was effective and allowed for greater meaningful employee input and testing. This supports research that finds that buy-in from employees by providing greater control can reduce the stress of change. The research further found that choice can be an important component of providing efficiency and that an immersive VR experience that allows staff to visually experience what the space will feel like can be part of a co-design solution with critical feedback.
This study was limited by the lack of cost benefit analysis which would establish the cost implications of spatial re-design decisions. Future studies are necessary to build this element into the BIM platform so that employees can understand the financial implications of re-design decisions. In addition, a post occupancy evaluation is necessary to determine if the final outcome is what was represented in the virtual environment.
Hospital environments are currently undergoing significant change, requiring the flexibility, agility and efficiency previously enacted in the financial quarters and subsequently in other leading industries. For effective FM in large organisations with many stakeholders, BIMBVR is an easily understood solution to communicate spatial initiatives and changes involving the healthcare working environment. Particularly in environment of rapid change, where research finds that a lack of control in a collective environment can lead to higher rates of anxious and depressive symptoms that can contribute to a declining state of mental health. However, in order for an ABW environment to be successful, it requires the organisational culture to be aligned with the working style of the employees. ABW spaces, at a minimum need to be identifiable, flexible and appropriate for the activity levels they serve. BIMBVR is a tool that can make this happen.
References Alhonsuo, M. and Colley, A. (2019). Designing New Hospitals - Who Cares About the Patients? Proceedings of Mench und
Computer, 725-729. Allison, T., Egan, T. and Chesley, J. (2016). Examining the Effects of Activity Based Working on Employees’ Work-Life
Integration, Well-Being, and Productivity. ProQuest Dissertations Publishing. Appel - Meulenbroek, H. A. J. A., Oldman, T., & van Susante, P. J. M. (2016). How employees value the support of activity
based and traditional work environments. In S. Nenonen, & J-M. Junnonen (Eds.), Proceedings of the CIB World Building Congress: Understanding Impacts and functioning of different solutions (pp. 296-308). Tampere University of Technology.
Araszkiewicz, K. (2017). Digital technologies in Facilities Management - the state of practice and research challenges. Creative Construction Conference (pp. 1034-1042). Szczecin: Procedia Engineering.
Aurelija, P. and Ustinovičius, L. (2017). Possibilities for Building Spatial Planning Using BIM Methodology. Procedia Engineering. Vol. 172. Elsevier Ltd, 2017. 851–858. Web.
Aziz, N. D., Nawawi, A. H., & Ariff , N. R. (2016). ICT Evolution in Facilities Management (FM): Building Information Modelling (BIM) as the Latest Technology. AMER International Conference on Quality of Life (pp. 363-371). Indonesia: Procedia - Social and Behavioural Sciences.
Aziz, N. D., Nawawi, A. H., & Ariff, N. R. (2016). Building Information Modelling (BIM) in Facilities Management: Opportunities to be considered by Facility Managers. Procedia - Social and Behavioral Sciences, 353-362.
Bleby, M. & Boardman, B. (2015). Macquarie Bank takes 50 Martin Place back to its beautiful bones. Financial Review. Available at: http://www.afr.com/real-estate/macquarie-bank-takes-50-martin-place-back-to-its-beautiful-bones- 20151012-gk6rwm.
Boateng, E. (2011). The Future of Facility Management in Finland. Finland: Jamk University of Applied Science. Caruso, T. J., O’Connell, C., Qian, J. J., Kung, T., Wang, E., Kinnebrew, S., Pearson, M., Kist, M., Menedez, M. and Rodriguez,
S. T. (2020). Retrospective Review of the Safety and Efficacy of Virtual Reality in a Pediatric Hospital. Pediatr Qual Saf, 5(2): e293.
Cha, Seung Hyun et al. (2018). Towards a Well-Planned, Activity-Based Work Environment: Automated Recognition of Office Activities Using Accelerometers. Building and Environment 144 (2018): 86–93.
Chias, P., Abad, T., de Miguel, M., García-Rosales, G., and Echeverria, E. (201). 3D Modelling and Virtual Reality Applied to Complex Architectures: An Application to Hospitals’ Design. Int. Arch. Photogramm. Remote Sens. Spatial Inf. Sci., XLII-2/W9, 255–260, https://doi.org/10.5194/isprs-archives-XLII-2-W9-255-2019, 2019.

1358
Collin, A., Enegbuma, W.I., McIntosh, J. and Tamati, G.
Cole, R. J., Bild, A. and Oliver, A. (201). The changing context of knowledge-based work: consequences for comfort satisfaction and productivity, Intelligent Buildings International, vol. 4, no. 3, pp. 182-196, 2012.
Creswell, J. (2012). Research Design. India: Sage. Desselle, M., Brown, R. A. and Woodruff, M. A. (2019). Biofabrication VR –The Hospital of the FutureA Serious Game for
Patient Education. IEEE 7th International Conference on Serious Games and Applications for Health. EBOSS (2019). BIM in New Zealand —an industry-wide view2019. Enegbuma, W. I., Aliagha, U. and Ali, K. (2014). Preliminary Building Information Modelling Adoption Model in Malaysia.
Construction Innovation, 4(14): 408-432. Ergün, O., Akın, S., Dino, I. G., and Surer, E. (2019). Architectural Design in Virtual Reality and Mixed Reality Environments: A
Comparative Analysis, IEEE Conference on Virtual Reality and 3D User Interfaces (VR), Osaka, Japan, pp. 914-915, doi: 10.1109/VR.2019.8798180.
Farrah, S. L., Gneuhs, M., Hodgson, E., Kawosa, B., Miller, E. T., Simon, A., Timm, N., and Hausfeld, J. (2019). Comparative Cost of Virtual Reality Training and Live Exercises for Training Hospital Workers for Evacuation. Comput Infrom Nurs, 37(9): 446-454.
Fellows, R., & Liu, A. (2015). Research Methods for Construction. New York: John Wiley & Sons. Ghosh, A., & Chasey, A. (2013). Structuring data needs for effective integration of building information modelling (BIM) with
healthcare facilities management. SEC 2013 - 7th International Structural Engineering and Construction Conference, 1471-1476.
Green, D., Boltin, S., Ward, A., Gowing, F. and Hutchon, B. (2019). Coproducing Virtual Reality Technologies for Rehabilitation, International Conference on Virtual Rehabilitation (ICVR), Tel Aviv, Israel, pp. 1-2, doi: 10.1109/ICVR46560.2019.8994337.
Hartmans, R. and Kamperman, L. (2009). People Organise their Own Flow. BOSS Magazine, 36. Jafarifiroozabadi, R., Joseph, A., Joshi, R., and Wingler, D. (2020). Evaluating Care Partner Preferences for Seating in an
Outpatient Surgery Waiting Area Using Virtual Reality. Health Environments Research and Design Journal. Julia, M. T. (2019). BIM and VR for the design and evaluation of healthcare buildings: Medical/Surgical Unit and Patient
Room. M.Sc. Thesis. Politecnico di Torino. Julie, J. (2017). 4D BIM for Environmental Planning and Management. Procedia Engineering. Vol. 180. Elsevier Ltd, 2017.
190–201. Web. Jyrasalo, T. (2019). Nuturing Patient Experience through Hospital Design. M.Sc. Thesis. Aalto University School of Arts,
Design and Architecture. Lach E. et al. (2020). Immersive Virtual Reality for Assisting in Inclusive Architectural Design. In: Gruca A., Czachórski T.,
Deorowicz S., Harężlak K., Piotrowska A. (eds) Man-Machine Interactions 6. ICMMI 2019. Advances in Intelligent Systems and Computing, vol 1061. Springer, Cham. https://doi.org/10.1007/978-3-030-31964-9_3
Lavay, S., & Sohet, L. (2007). Computer-Aided Healthcare Facility Management. Computing in Civil Engineering ASCE. Lavy, S., & Jawadekar, S. (2014). A Case Study of Using BIM and COBie for Facility Management. Texas: Texas A&M
University. Leica Geosystems (2020). Leica BLK360 Imaging Laser Scanner. 2020. Hexagon Geosystems. <https://leica-
geosystems.com/products/laser-scanners/scanners/blk360>. Liddicoat, S. (2019). Mental health facility codesign: A new research method for integrating the service user voice in design
processes using virtual reality. General Psychiatry, 32(3): e100061. Liu, Y., Castronovo, F., Messner, J. and Leicht, R. (2020). Evaluating the Impact of Virtual Reality on Design Review Meetings
Journal of Computing in Civil Engineering, 34(1). Lucas, J. D. (2012). An Integrated BIM Framework to Support Facility Management in Healthcare Environments. Blacksburg:
ProQuest. McCullough, C. S. (2010). Evidence-Based Design for Healthcare Facilities. Indianapolis, IN: Sigma Theta Tau International. McElroy. J. C. and Morrow, P. C. (2010). Employee reactions to office redesign: A naturally occurring quasi-field experiment
in a multi-generational setting, Human Relations, vol. 63, no. 5, pp. 609-636. McGillick, P. (2013). Banking on Change. InDesign, 52, p.94-103. McIntosh, J., Marques, B., and Harkness, R. (2020). Simulating impairment through virtual reality. International Journal of
Architectural Computing, 18(3):284-295. doi:10.1177/1478077120914020. Meijer, S. J. and Frings-Dresen, M. H. (2012). Effects of office innovation on office workers' health and performance,
Intelligent Buildings International, vol. 4, no. 3, pp. 182-196, 2012. Mohanta, A., & Das, S. (2016). ICT- Based Facilities Management Tools for Buildings. Advances in Intelligent Systems and
Computing, 125-133. Moser, I. and Bergamin, P. (2020). Work-in-Progress—Designing a Multi-User Virtual Reality Environment for Conversational
Skills Training of Dietetic Students. 6th International Conference of the Immersive Learning Research Network (iLRN), San Luis Obispo, CA, USA, pp. 301-304, doi: 10.23919/iLRN47897.2020.9155189.
Moslehian, A. S., Kocaturk, T., and Tucker, R. (2020). An integral view of innovation in hospital building design: understanding the context of the research/practice gap. Building Research and Information.
Ohueri, C., Enegbuma, W. I., and Kenley, R. (2018). Energy efficiency practices for Malaysian green office building occupants. Built Environment Project and Asset Management, 2(8).
Ojala J., Selin J., Partala T., Rossi M. (2020). Virtual Construction: Interactive Tools for Collaboration in Virtual Reality. In: Arai K., Kapoor S., Bhatia R. (eds) Advances in Information and Communication. FICC 2020. Advances in Intelligent Systems and Computing, vol 1130. Springer, Cham. https://doi.org/10.1007/978-3-030-39442-4_26Reza, Z. and

1359
Virtual Reality Activity Based Workplace Simulation Impact on Healthcare Facilities Space Management.
Coloma, E. (2018). Virtual reality-integrated workflow in BIM-enabled projects collaboration and design review: a case study. <https://link.springer.com/article/10.1186/s40327-018-0065-6>.
Rianne, A., Groenen, P. and Janssen, I. (2011). An End-User’s Perspective on Activity-Based Office Concepts. Journal of Corporate Real Estate, 13(2):122–135.
Ross, P. 2011. Activity Based Working-The Hybrid Organisation: Buildings. Sara, N. S., Zeri, K., Reza, A and Seyedjalal, M. (2019). Ideal physical features of environmental design in children’s hospital:
Using children’s perspectives. Facilities, 38 (5-6): 445-466(22). Skogland, M. A. C. (2017). The Mindset of Activity-Based Working. Journal of Facilities Management 15.1 (2017): 62–75. Su, Z. (2019). Optimizing Spatial Adjacency in Hospital Master Planning. In: Lee JH. (eds) Computer-Aided Architectural Design.
"Hello, Culture". CAAD Futures 2019. Communications in Computer and Information Science, vol 1028. Springer, Singapore. https://doi.org/10.1007/978-981-13-8410-3_10.
Sundstrom, R. E. Burt and D. Kamp (1980). Privacy at work: Architectural correlates of job satisfaction and job performance, The Academy of Management Journal, vol. 23, no. 1, pp. 101-117.
Theresianto, S. (2017). Activity-Based Workplace Design: An Australian Perspective. M.Sc. Thesis. The University of New South Wales.
Tiainen, T. and Jouppila, T. (2019). Use of Virtual Environment and Virtual Prototypes in Co-Design: The Case of Hospital Design. Computers, 8, 44.
Ustinovichius, L., Peckienė, A. and Popov, V. (2017). A Model for Spatial Planning of Site and Building Using BIM Methodology. Journal of Civil Engineering and Management 23.2 (2017): 173–182.
Uwajeh, P. C., Iyendo, T. O. and Polay, M. (2019). Therapeutic gardens as a design approach for optimising the healing environment of patients with Alzheimer's disease and other dementias: A narrative review. Explore, 15(5): 352- 362.
Vishal, S., Gu, N. and Wang, X. (2011). A Theoretical Framework of a BIM-Based Multi- Disciplinary Collaboration Platform. Automation in Construction 20.2 (2011): 134–144.
Whitlock, K et al. (2018). BIM for Construction Site Logistics Management. Journal of Engineering, Project, and Production Management 8(1): 47–55.
Wohlers, C. and Hertel, G. (2017). Choosing where to work at work towards a theoretical model of benefits and risks of activity-based flexible offices, Ergonomics, vol. 60, no. 4, pp. 467-486.
Yang, Z. and Kensek, K, (2018). Advanced Design and Facility Management: Virtual Reality for Healthcare Project. Yin, R. K. (2011). Applications of Case Study Research. London: Sage publication. Zhang, Y., Liu, H., Zhao, M. and Al-Hussein, M. (2019). User-centered interior finishing material selection: An immersive
virtual reality-based interactive approach, Automation in Construction, 106.

1360
The 54th International Conference of the Architectural Science Association (ANZAScA) 2020
We don’t need sustainable buildings – We need sustainable people
Ben Slee
Hector Abrahams Architects & UNSW ([email protected])
Abstract: The UN has called for global CO2-e emissions to be reduced by 7.6% each year for a decade. The built environment is responsible for a significant proportion of emissions and consumption and most buildings (98% in Australia) already exist. Therefore, if we are to meet this challenge, we need to find ways of engaging with the people who use and operate existing buildings and organisations. This paper argues that architects are in a unique position to help solve this problem and help communities become genuinely more sustainable because of architect’s ability to embrace complexity, the multifaceted nature of problems and integrate knowledge to solve social problems. The response must be social rather than technical or scientific, although it must incorporate both, because the solutions challenge the identity and self-esteem of individuals and whole communities and so elicit powerful emotional responses in opposition to them. If we are to create buildings and communities that are genuinely sustainable, we must engage with those building-communities in a meaningful way to develop strategies that they are able and willing to implement. The relationship between people and their environment is at the heart of a sustainable response to climate change.
Keywords: Environmental performance, Community consultation, Design-Thinking, High-performance
1. Introduction Buildings are intrinsically complex social, environmental and economic systems that exist within other complex systems. The complexity of these interrelationships and the variety of possible influences and outcomes means that improving the environmental performance of buildings is a Wicked Problem (Buchanan, 1992).
In Australia buildings contribute about 20% (Climate Works Australia, 2018) or slightly more (ASBEC, 2016) to the national greenhouse gas emissions. All state governments have committed to net zero emission by 2030 and the federal government has signed the Paris Climate Accord which makes the same commitment by 2050 (UN, 2015).
However, many scientists and observers say that the climate models show that these targets are too weak and that Australia, and the world, needs to be more ambitious (CCA, 2015; ASBEC, 2016; CCA, 2018; GBCA, 2018). In 2005 the Australian Government’s Climate Change Authority recommended a target of between 45 and 65% below 2005 levels by 2030 (CCA, 2015). The latest modelling from the UN
Imaginable Futures: Design Thinking, and the Scientific Method. 54th International Conference of the Architectural Science Association 2020, Ali Ghaffarianhoseini, et al (eds), pp. 1360–1369. © 2020 and published by the Architectural Science Association (ANZAScA).

1361
Ben Slee
calls for a global annual reduction in CO2 emissions of 7.6% over the next 10 years (UNEP, 2019), that is 55% in total.
Because buildings contribute such a significant portion of this pollution, we must find a way to ensure that buildings make an equal or more significant contribution to reducing emissions nationally and internationally. This is a challenge that must be met by existing buildings, not new buildings. At the beginning of each year in Australia 98% of buildings already exist (ABCB, 2016). It is also true that building new buildings is one of the most polluting things we can do (Hasik et al., 2019; Oldfield, 2019) and so replacing existing buildings will exacerbate the damage we are doing (Preservation Green Lab, 2016).
The observation that is at the core of this paper, is that “buildings are for people” (BPRU, 1972). Unoccupied, buildings themselves actually contribute nothing to global CO2-e emissions (CO2-e – Carbon Dioxide Equivalent). It is the use of buildings by people, primarily to create and control internal environments for comfort, that leads to the consumption of energy, the generation of CO2-e emissions and other pollution. So it is the relationship between people and the buildings they use that is the key to developing a more sustainable community. Thus, we must help ‘building-communities’ discover how they can use their buildings more sustainably.
This paper begins with an exploration of a number of studies that illustrate this point, it then considers why Architects and their integrative designerly (Cross, 1982) approach to thinking are particularly well suited to finding solutions. The paper then draws on other literature to show how a number of core issues can, and should, be approached and framed in a different way to the way in which they are normally considered within building science research. Finally, the paper concludes by proposing a new approach to reducing greenhouse gas emissions from our built environment and the role Architects can play in enabling that to happen.
2. Studies of people in buildings It has been shown that people’s collective relationship with a building makes a significant difference to both the environmental performance of the building and individuals’ perception of comfort and well- being in that building. A study by Deuble and De Dear (2012) of two buildings at the University of Sydney demonstrated that the attitude of the occupants towards the environment was a significant factor in their perception of what was an acceptable level of comfort in the building, sometimes referred to as “the forgiveness factor” (Leaman and Bordass, 2007). Other studies have shown that the perception of personal control over comfort and the indoor environment increases the range of conditions that are considered to be comfortable.
Brager et al (2004) showed that the ability to control the opening and closing of windows in a naturally ventilated building effected the perception of thermal comfort: Those who had control felt more comfortable than those without control despite experiencing the same conditions.
In a review of lessons learnt from multiple post occupancy evaluation studies of buildings Leaman and Bordass (1999) identified personal control as the first of the “killer variables”: “people’s perception of control over their environment affects their comfort and satisfaction”. A finding repeated by others including Leyten et al (2009).
In his theoretical study of the habits of hobbits Humphreys (1995) observes that, given the opportunity, people will make themselves comfortable, they adapt, and that discomfort is largely a consequence of the absence of adaptive opportunity (Way and Bordass, 2005; Leaman et al., 2010). He also suggests that concepts of comfort, and comfort standards, are a self-fulfilling prophecy because

1362
We don’t need sustainable buildings – We need sustainable people.
people will, out of necessity, adapt to their environment. 25 years later Parkinson et al (2020) have used an expanded international database of thermal comfort studies in buildings to demonstrate that this is the case: People’s preferred comfort temperature is directly correlated to their recent thermal experience and because we spend so much time in buildings the thermal experience we experience is the thermal environment that we have constructed in our buildings. The study also illustrates, along with many others, that the more diverse our thermal experience, for example in naturally ventilated buildings, the more adaptable and tolerant we are of thermal diversity.
Studies of buildings in use frequently show that their performance is below what the designers predicted (Leaman et al., 2010). In a study of a project that retrofitted 119 houses in the UK to achieve CO2-e emission reductions of between 65% and 95% Gupta et al (2015) found that technical solutions impact on performance often do not achieve the outcomes that were predicted. Gupta et al found that while predictions could be improved by collecting and using more data from the existing situation the primary flaw in the project was that it ignored the people who live in and use the houses, the social factors and their desires. For example, a person may prefer to live in a warmer house and have longer showers now that they can achieve that for the same financial and energy cost as they paid previously. This is the Jevons, or efficiency, paradox (Rees, 2009; Shove, 2018). Gupta et al argue that a socio- technical approach is needed that engages with both building fabric and technical systems as well as the people who use the building, the human factor. This means helping people to understand how to use the retrofitted building and helping them contribute to developing the strategies that are implemented (Gill et al., 2010; BSRIA, 2014; Gupta et al., 2014; Gupta et al., 2015). Projects that do engage with users and adopt an iterative approach to learning appear to have more success in achieving both reduced carbon emissions and increased user satisfaction (Nevill, 2007; Short et al., 2009; Bordass and Buckley, 2010; Thomas, 2010; Gupta et al., 2014; Gupta et al., 2018).
3. Design Thinking and the role of the Architect The iterative approach to understanding the performance of buildings and the environmental impact of the building-community relies on the collection of quantitative and qualitative data, the analysis and interrogation of that data in the context of both abstract theory and the particular circumstances of the building and the community of people who use the building. The approach then requires the proposition of solutions and strategies, based on abstract knowledge, applied to the specific situation, followed by the testing and evaluation of those systems and strategies in that context. This is the Design-Thinking process, adopted intuitively by design professionals (Schön, 1983) including architects: The continual oscillation between the abstract and the particular, the contextual, articulated by Dong et al (Dong et al., 2015) as “cumulative knowledge building”. It is through this continual abstraction and contextualisation of ideas that knowledge is created (Schön, 1983; Owen, 1998; Maton, 2013; Dong et al., 2015). It is a dynamic and temporal intellectual process described by Schon as a ‘reflective conversation’ (Schön, 1983; Schön, 1992).
The design-led paradigm sets out to construct an integrated and connected knowledge base. Design puts things together to understand what they can become through “the alchemy of the imagination” (Till, 2005). In the words of Buchanan, the concern of design is
“to connect and integrate useful knowledge from the arts and sciences alike, but in ways that are suited to the problems and purposes of the present. Designers, are exploring

1363
Ben Slee
concrete integrations of knowledge that will combine theory with practice for new productive purposes” (Buchanan, 1992).
The design methodology is ecumenical rather than dogmatic. It embraces and explores multiple means for exploring and gathering knowledge. Buchanan (1992) argues that the traditional research paradigms fragment knowledge into ever smaller and more specialised domains and so lose their connection with the “real” world. The goal of science is to understand how things work, and in order to do this it fragments problems into ever smaller pieces in order to isolate and separate variables. Design- Thinking, the approach adopted by architects, gathers this information and reconfigures it to reveal new and more intelligent understanding and explanations of both the challenges and the potential solutions to those challenges.
Gupta (2014), Leaman et al (2010), Humphreys (1995), Parkinson and De Dear (2015) and Nicol (2002) all highlight the complex network of social, cultural and physical interdependencies that influence the way in which we inhabit and interact with our buildings. Leaman et al (2010) argue that understanding how these multiple factors interact is “Real World Research” after Robson (2002) and that it is necessarily contextual, as research into comfort is contextual, although focussed on a fraction of the overall system, and that the purpose of the research is applied since it focusses on solving problems and predicting effects using robust contextual data from the field, a wide range of skills and multiple methods. In the context of the built environment (good) architects bring the ability to listen to, interrogate and understand the social needs and desires of building users, together with their understanding of the construction process, materials and building fabric and systems, combined with an ability to understand abstract scientific knowledge and apply it to a social and physical context.
Solving complex problems to which there can be no singular solution requires the integration of methodologies, or what the Royal College of Art has called “the third methodology of research” (RCA, 1979) sitting alongside the two established methodologies of Science and the Humanities, illustrated by Cross (1982) in his paper “Designerly Ways of knowing” and tabulated below (Table 1)
Table 1: The “three cultures” tabulated from Cross 1982: Design as a third methodology for research
Culture of study Phenomenon of study Appropriate methods Science The natural world Controlled experiment, classification, analysis Humanities Human experience Analogy, metaphor, criticism, evaluation Design The man-made world Modelling, pattern-formation, synthesis
4. Reframing our understanding of sustainability In line with the UN (UNEP, 2019) Gupta et al (2015) argue that we need to set absolute carbon reduction targets for buildings rather than relative targets. Improved efficiency is simply not enough because, paradoxically, efficiency enables more consumption by the system as a whole: Efficiency is defined by the IEA as “more service for the same input, or the same service for less input” (IEA, 2013). This means that
“the effect of improving the efficiency of a factor of production, like energy, is to lower its implicit price and hence make its use more affordable, thus leading to greater use.” (Herring, 2006)
The historic evidence “suggests that we prefer to take the efficiency gains in the form of higher levels of energy service. rather than reduced consumption” (Herring, 2006)

1364
We don’t need sustainable buildings – We need sustainable people.
The concept of efficiency embeds an expectation of equivalent service within research, policy and strategies for the future. Efficiency policy assures equivalence rather than challenging the communities’ expectations of need, policy attempts to meet the same need with less energy, thus avoiding political controversy. At the same time this normalises the definition of service and so invisibly imbeds assumptions about need into future programmes of research, development and implementation. As a consequence Shove (2018) argues that the measurement of energy has been abstracted from the context in which the data is collected and the energy is generated and used, and thus the discussion of energy use, and ways to reduce energy use (efficiency) avoids the need to understand the energy use within the messy and complex context of people’s lives:
“People do not use energy for its own sake, they use it as part of accomplishing social practices at home, at work and in moving around.” (Shove, 2018)
In order to help building-communities develop strategies that enable them to inhabit their buildings sustainably we need to address the social context and purpose of energy use and other consumption that damages rather than enhances the environment. For example, rather than focusing on more efficient heating or cooling systems, or the need to maintain a particular room temperature, if we could encourage a focus on keeping people warm, or cool, or comfortable, the questions, solutions and broader impact maybe different (Chappells and Shove, 2005; Brager et al., 2015; Shove, 2018). We need to find ways of “living well with less”. We need to find ways to embed the savings our efficiency strategies create in real environmental improvements rather than re-deploying them as opportunities for other consumption. The challenge is that efficiency associated with lifestyle choices is often associated with pain – the prospect of having less – and so, understandably, society and political leaders have focussed on technical solutions rather than social and behavioural solutions to the ecological crisis. Efficiency is not a solution in itself, as Rudin (1999) observes: “efficiency tells us what to buy, conservation tells us how to behave”. Rudin, Herring, Shove and others advocate for the concept of “sufficiency”: “Efficiency without ‘sufficiency’ is counterproductive, the latter must define the boundaries of the former.” (Herring, 2006).
The challenge of inhabiting sustainably is a moral one not an economic one and requires a moral and social response not an economic technical response. The challenge is, in part, a question of understanding the conflict this creates and then creating an opportunity for consensus and mutual support for change within a building-community.
5. Radical change: The real challenge is an emotional problem Significant change, or any change, creates uncertainty because of the possibility, and often likelihood, of unexpected consequences. This uncertainty is, or is perceived as, a loss of control by individuals and communities. If the change is imposed then it is the removal of control by someone outside our own community, or other than our-self. This sense of being in control is ontological to one’s sense of self – our self-esteem (Randolph, 2016).
We exist in communities of people, we are “in-the-world-with-others” (Heidegger), and rely on that community to form our own self-esteem. Our understanding of our own identity and our identity as part of that community. We have a strong need to think well, to approve, of our own actions and decisions – and as a consequence for others to validate that approval. Self-esteem, our identity and the identity of the communities we are part of, is constructed on the fundamental values, morals and ethics by which we choose to live our lives. Therefore, it is fundamental to our conception of ourselves. (Randolph, 2016)

1365
Ben Slee
One of the challenges of fundamentally changing the way in which we approach enabling our building-communities to inhabit their buildings in a genuinely sustainable manner is that it will require us all to find ways to “live well with less”. It will challenge the identity and self-esteem of individuals and whole communities and so elicit powerful emotional responses and opposition. For many people wearing a suit to work is an essential part of their identity, to be able to work in a mechanically cooled space or to choose to have a long hot shower are all examples of things that individuals, and building- communities, may have embedded in their sense of identity.
“All conflict is emotional” and “people are never without emotion” (Randolph, 2016). Anger is an extremely common emotion in conflict and is invariably preceded by loss: Actual loss (financial or physical), intangible loss (time, effort, control or self-esteem), envisaged future loss (hopes, dreams, aspirations or an anticipated future). Where solutions, whether social or technical, are imposed on us we feel a loss of control and fear actual, intangible or future loss, and so a loss of dignity or self-esteem. The need to be valued is intrinsic to self-esteem, and the corresponding need to be listened to, to be consulted.
“Not being heard is the equivalent of not being valued and appreciated. Those who believe they are not heard will feel undervalued, ignored, misunderstood or misrepresented, and are likely to suffer a loss of self-esteem.” (Randolph, 2016)
The response to the experience of being undervalued is to ensure, one way or another, that we are heard, to assert power. In building-communities this may be by ignoring new protocols, through non- compliance or non-cooperation with systems that are imposed by “the experts”. This means that however intelligent, effective, or well-meaning the new systems are theoretically, they fail because they have failed to engage with and gain the support of the people who must implement them – the building- community – the “socio-” part of the socio-technical solution (Leaman and Bordass, 1999; Bordass and Leaman, 2013; Gupta et al., 2014).
Peter Blundell-Jones et al (2005) argue that bureaucracy, procedures and experts are intervening between users and the buildings they occupy. These experts bring and impose their own value systems that are at odds with those of the building-community and so a gap emerges between what is constructed, or implemented, and what is needed and desired. Blundell-Jones et al suggest that creating opportunities for genuine participation addresses this gap, creating “an environment that not only has a sense of ownership but is also more responsive to change”.
Jeremy Till calls this “the negotiation of hope” (Till, 2005). He argues for “transformative participation” that genuinely engages with users to enable them to contribute to finding solutions, rather than simply informing them, or listening to them and then ignoring them. This is a partnership, not palliative or placatory consultation (Arnstein, 1969; Till, 2005; IAP2, 2015).
Transformative participation acknowledges the differential in power and knowledge between the “expert” and the “user” or “non-expert”, and seeks to engage with the imbalance to forge a transformative process capable of “Transform[ing] the expectations and futures of the participants” (experts and non-experts alike) (p.27). It is transformative for all parties (p.30) and is an opportunity for real change – reconsidering what we often take for granted.
Till goes on to distinguish between the “Expert-Citizen” and the “Citizen-Expert”. The users are the Expert-Citizens – they are the people with the most knowledge and understanding of their own needs, habits, hopes and desires – often more than they can say or articulate (Schön, 1983). The Citizen-Expert is the architect or designer. The person with the expert abstract knowledge of systems, science and principles. The process of active and genuine participation gives agency to the user and brings forward

1366
We don’t need sustainable buildings – We need sustainable people.
issues the architect/consultant may not otherwise be aware of or able to understand – social and therefore emotional questions. Highlighting the essential role individual and community self-esteem plays in developing sustainable strategies that can be implemented by the people who use the buildings through a genuine partnership between the Citizen-Expert and the Expert-Citizen.
Experts, as Citizen-Experts, need “to listen to, draw out and be transformed by the knowledge of the users (Expert-Citizens)” (p/34). This is a form of Design-Thinking transfigured into a social activity – observing, listening and understanding, applying and sharing abstract knowledge in context, and learning about the consequences. Acknowledging the power and the value of both the abstract and the contextual and moving between the two in partnership (Schön, 1992; Dong et al., 2015).
“One can see how participation …… presents an opportunity to re-invigorate [architectural production] through challenging the very limits and constraints of specialist knowledge” (p/34) (Till, 2005)
6. How? A new approach to creating sustainable building-communities This paper proposes a new approach to developing radically sustainable building-communities by engaging with those communities to work together to understand how we transform the way they inhabit their buildings. This engagement involves sharing technical knowledge, data and abstract ideas about building performance, comfort and ways of behaving and simultaneously listening to and supporting the building-community as it explores, articulates and transforms its own needs and social expectations in the light of new knowledge that is understood together through a partnership and shared endeavour to create a genuinely more sustainable future.
If we return to Humphreys (1995) hypothetical trip to visit the hobbits we see that, as their guest, he observes their behaviour, takes a variety of physical measurements, observes how their buildings are constructed and discusses these things with them to understand the social and emotional significance of their habits. When the hobbits visit Humphreys, he suggests that he should use the knowledge he has gained to construct appropriate accommodation in his own climate. Accommodation that will enable the hobbits to adapt it further to suit their particular requirements.
Based on multiple investigations of the performance of buildings and the perception of those buildings by their users Leaman et al (2010) suggest that a methodology for evaluating the performance of buildings should use three strategies in parallel:
1. physical observations; 2. the collection of quantitative data (temperatures, energy & water etc.); 3. the collection of qualitative data (questionnaires and focus groups). They also point out that it is useful to be able to “drill down” into data – so the data needs to be
collected in a granular form that enables it to be analysed both aggregated and broken into parts. Leaman et al also argue that the purpose of building evaluation is to solve problems. This paper argues
that in order to solve these problems we must engage with and understand the social and emotional challenges as well as the technical challenges and that (good) architects have the skills to do that.
Upadhyay et al (2019) have attempted to begin to bridge the gap between the Expert-Citizen understanding of technical performance data and the Citizen-Expert’s understanding of the data and performance by developing a suite of sensors and a web-interface that makes the technical quantitative

1367
Ben Slee
data accessible to the Citizen-Experts in real time. While this goes someway to helping building- communities understand how to improve their sustainability it does not engage with the social and emotional challenges of change.
Let us imagine that this system is installed in Humphreys’ temporary accommodation for the visiting hobbits: Humphreys could plan and initiate a process of engagement that is founded on the principles of “transformative participation” outlined by Till (2005). Humphreys, and other Expert-Citizens, could use this data to engage with the hobbits, the Citizen-Experts, to develop and test strategies for further improving the performance of the new hobbit-hole houses and make the inhabitation of them more sustainable by changing patterns of behaviour, and adjusting technical aspects of the construction. This would be an iterative process and, together, Citizen-Experts and Expert-Citizens would probably learn some surprising things, and, with a new understanding of the impact of their behaviour, make different choices.
Chappells and Shove (2005) observed that “There is more to comfort than temperature, but exactly where expectations lie along this range is, largely, a matter of culture and convention”. Nicol et al (1999) have shown that expectations of comfort are different in different cultures and climates. Parkinson et al (2020)have demonstrated quantitatively what many have argued qualitatively, that our expectations can change depending on the environment we collectively choose to construct and inhabit.
This paper has argued that if we are to create buildings and communities that are genuinely sustainable, we, as Expert-Citizens, must engage with existing building-communities in a meaningful way, listening to and learning about their particular social and emotional needs, and sharing our abstract technical knowledge, in order to develop strategies that those communities are able and willing to implement. As Citizen-Expert design-thinkers we must use our wide range skills and understanding to mediate between the technical, the social and the emotional in order to facilitate fundamental and radical change. The relationship between people and their environment is at the heart of a sustainable response to climate change.
References ABCB (2016) Upgrading existing buildings handbook, in Australian Building Codes Board (ed.), Australian Building
Codes Board. Arnstein, S. R. (1969) A ladder of citizen participation, Journal of the American Institute of planners, 35(4), 216-224. ASBEC (2016) LOW CARBON, HIGH PERFORMANCE: How buildings can make a major contribution to Australia’s
emissions and productivity goals, Australian Sustainable Built Environment Council (ASBEC). Blundell-Jones, P., Petrescu, D. and Till, J. (2005) Introduction, in P. Blundell-Jones, D. Petrescu and J. Till (eds.),
Architecture and Participation, Routledge, New York. Bordass, B. and Buckley, M. (2010) Soft Landings for Schools: Technical report on the Case Studies, Useable Buildings
Trust, 31. Bordass, B. and Leaman, A. (2013) A new professionalism: Remedy or fantasy?, Building Research and Information,
41(1), 1-7. BPRU (1972) Building performance, ed., Applied Science Publishers, London. Brager, G., Paliaga, G. and de Dear, R. (2004) Operable windows, personal control and occupant comfort. Brager, G., Zhang, H. and Arens, E. (2015) Evolving opportunities for providing thermal comfort, Building Research &
Information, 43(3), 274-287. BSRIA (2014) The Soft Landings Framework, in Building Services Research and Information Association and Useable
Buildings Trust (eds.), Building Services Research and Information Association (BSRIA). Buchanan, R. (1992) Wicked Problems in Design Thinking, Design Issues, 8(2), 5-21. CCA (2015) Final Report on Australia's future emissions reduction targets, in A. G. Climate Change Authority (ed.),
Climate Change Authority.

1368
We don’t need sustainable buildings – We need sustainable people.
CCA (2018) Australia's Rising Greenhouse Gas Emissions, in C. C. o. Australia (ed.), climatecouncil.org.au. Chappells, H. and Shove, E. (2005) Debating the future of comfort: environmental sustainability, energy
consumption and the indoor environment, Building Research & Information, 33(1), 32-40. Climate Works Australia (2018) Tracking progress to net zero emissions, in C. W. Australia (ed.). Cross, N. (1982) Designerly ways of knowing, Design Studies, 3(4), 221-227. Deuble, M. P. and de Dear, R. J. (2012) Green occupants for green buildings: The missing link?, Building and
Environment, 56, 21-27. Dong, A., Maton, K. and Carvalho, L. (2015) The structuring of design knowledge, in P. Y. Rodgers, J. (ed.), Routledge
Companion to Design Research, Routledge, London. GBCA (2018) A carbon Positive roadmap for the built environment, Green Building Council Australia. Gill, Z. M., Tierney, M. J., Pegg, I. M. and Allan, N. (2010) Low-energy dwellings: the contribution of behaviours to
actual performance, Building Research & Information, 38(5), 491-508. Gupta, R., Barnfield, L. and Gregg, M. (2018) Exploring innovative community and household energy feedback
approaches, Building Research & Information, 46(3), 284-299. Gupta, R., Barnfield, L. and Hipwood, T. (2014) Impacts of community-led energy retrofitting of owner-occupied
dwellings, Building Research & Information, 42(4), 446-461. Gupta, R., Gregg, M., Passmore, S. and Stevens, G. (2015) Intent and outcomes from the Retrofit for the Future
programme: key lessons, Building research and information : the international journal of research, development and demonstration., 43(4), 435-451.
Hasik, V., Escott, E., Bates, R., Carlisle, S., Faircloth, B. and Bilec, M. M. (2019) Comparative whole-building life cycle assessment of renovation and new construction, Building and Environment, 161, 106218.
Herring, H. (2006) Energy efficiency—a critical view, Energy, 31(1), 10-20. Humphreys, M. (1995) Thermal comfort temperatures and the habits of Hobbits, Standards for thermal comfort:
indoor air temperature standards for the 21st century, 3-13. IAP2 (2015) Quality Assurance Standard for Community and Stakeholder Engagement, International Association for
Public Participation Australasia, www.iap2.org.au. IEA (2013) Energy Efficiency Market Report 2013, International Energy Agency (Referenced by Shove 2018, What is
wrong with energy efficiency?). Leaman, A. and Bordass, B. (1999) Productivity in buildings: The 'killer' variables, Building Research and Information,
27(1), 4-19. Leaman, A. and Bordass, B. (2007) Are users more tolerant of 'green' buildings?, Building Research and Information,
35(6), 662-673. Leaman, A., Stevenson, F. and Bordass, B. (2010) Building evaluation: Practice and principles, Building Research and
Information, 38(5), 564-577. Leyten, J. L., Kurvers, S. R. and van den Eijnde, J. (2009) Robustness of office buildings and the environmental
Gestalt,Proceedings of Healthy Buildings, 130-133. Maton, K. (2013) Making semantic waves: A key to cumulative knowledge-building, Linguistics and Education, 24(1),
8-22. Nevill, G. (2007) So how are you doing?, Build. Serv.-CIBSE J., no. November, 32-37. Nicol, J. F. and Humphreys, M. A. (2002) Adaptive thermal comfort and sustainable thermal standards for buildings,
Energy and Buildings, 34(6), 563-572. Nicol, J. F., Raja, I. A., Allaudin, A. and Jamy, G. N. (1999) Climatic variations in comfortable temperatures: the
Pakistan projects, Energy and Buildings, 30(3), 261-279. Oldfield, P. (2019) The sustainable tall building: a design primer, ed., Routledge. Owen, C. L. (1998) Design research: building the knowledge base, Design Studies, 19(1), 9-20. Parkinson, T. and de Dear, R. (2015) Thermal pleasure in built environments: physiology of alliesthesia, Building
Research & Information, 43(3), 288-301. Parkinson, T., de Dear, R. and Brager, G. (2020) Nudging the adaptive thermal comfort model, Energy and Buildings,
206, 109559.

1369
Ben Slee
Preservation Green Lab (2016) The Greenest Building: Quantifying the environmental value of building reuse, National Trust for Historic Preservation.
Randolph, P. (2016) The psychology of conflict : mediating in a diverse world, ed., Bloomsbury Continuum, London. RCA (1979) Design in general education, Royal College of Art, London. Rees, W. E. (2009) The ecological crisis and self-delusion: implications for the building sector, Building Research &
Information, 37(3), 300-311. Robson, C. (2002) Real world research: A resource for social scientists and practitioner-researchers, ed., Blackwell
Oxford. Rudin, A. (1999) How improved efficiency harms the environment, (referenced by Herring 2006 and others), 10,
2011. Schön, D. A. (1983) The reflective practitionerhow professionals think in action, ed., Basic Books, New York. Schön, D. A. (1992) Designing as reflective conversation with the materials of a design situation, Knowledge-Based
Systems, 5(1), 3-14. Short, C. A., Cook, M. and Lomas, K. J. (2009) Delivery and performance of a low-energy ventilation and cooling
strategy, Building Research & Information, 37(1), 1-30. Shove, E. (2018) What is wrong with energy efficiency?, Building Research & Information, 46(7), 779-789. Thomas, L. E. (2010) Evaluating design strategies, performance and occupant satisfaction: a low carbon office
refurbishment, Building Research & Information, 38(6), 610-624. Till, J. (2005) The negotiation of hope, in P. Blundell-Jones, D. Petrescu and J. Till (eds.), Architecture and
Participation, Routledge, New York. UN (2015) Paris Agreement, United Nations Paris Climate Agreement. UNEP (2019) Emissions Gap Report Executive Summary, United Nations Environment Program, Nairobi. Upadhyay, A. K., Adhikari, R. D., Osmond, P. and Prasad, D. (2019) Energy and indoor climate visualisation to
encourage households for low carbon living., in C. f. L. C. Living (ed.), CRC for Low Carbon Living, Sydney, Australia, https://apo.org.au/sites/default/files/resource-files/2019-10/apo-nid275071.pdf
Way, M. and Bordass, B. (2005) Making feedback and post-occupancy evaluation routine 2: Soft landings – involving design and building teams in improving performance, Building Research & Information, 33(4), 353-360.

1370
The 54th International Conference of the Architectural Science Association (ANZAScA) 2020
Weather Information Management in Major Construction Projects: State of the Technology
Andrea Y. Jia1
1 Graduate School of Higher Education, University of Melbourne, Australia [email protected]
Abstract: This paper presents a brief review of the state of the technology for managing weather information, with a specific focus on heat stress in major construction projects. Recent technologies of monitoring, referencing, recording and managing heat stress risks are reviewed against their relevance to the project management practice with an aim to identify gaps and potentials for process innovation. The findings suggest the state of the relevant technology is largely serving a top-down, efficiency-driven decision process. However, planners at the top do not have the complete information of the context against which their decisions are being implemented and tested out. The rich information of the work context owned by the frontline operational people, in this case, the nature of the diverse work activities embedded in the diverse geospatial characteristics of the workplaces on construction site, is not being fully values and engaged in the current practice. The review suggests a dual-level weather information management system: engage and empower local actors for personal risk mitigation; tighten inter- project coupling to pool the data for future weather-wise project planning. The challenge with system design is how to register the complex spatial characteristics in the workplaces on construction site; how to put feasible and low-cost sensors to capture and transmit the needed data, including radiant heat and air velocity. This study contributes to a solution-oriented bottom-up approach to weather information management in major construction projects.
Keywords: heat stress; BIM; georeferencing; weather information management, major projects.
1. Introduction In a recent Work Health and Safety brief, Work Safe Australia identified 1 235 workers’ compensation claims related to working in heat during 2008 to 2018. In New South Wales, a cost of $7 million was attributed to workers’ compensation claims for cases of heat stroke, fatigue and skin cancer (SIA, 2016). Heat stress is particularly hazardous to construction workers because on-site work activities are defined and controlled by many administrative and psychosocial factors embedded in the team culture, project organizing structure, the procurement system and the sociopolitical dynamics among key stakeholders (e.g. Jia et al, 2016a, 2018, 2019, 2020). Different sizes of construction projects are faced with different challenges: major projects can have a supervisor to worker ratio of up to 1:40, making it difficult to materialise management decisions as they were proposed. Small projects find their challenges in lack of
Imaginable Futures: Design Thinking, and the Scientific Method. 54th International Conference of the Architectural Science Association 2020, Ali Ghaffarianhoseini, et al (eds), pp. 1370–1379. © 2020 and published by the Architectural Science Association (ANZAScA).
1371
Andrea Y. Jia
resource, unaffordability of personnel upskilling and reskilling, and the lack of information and tools (Loosemore & Andonakis, 2007). However, small projects and firms have a much higher supervisor to worker rate, as much as 1:2 as the author observed on residential building sites in Queensland, where heat stress can be managed through a personal and flexible approach. In major projects, a formal and standardised system is needed to ensure risks are systematically managed and future projects learn from existing experience. This study aims to review the state of the technology on monitoring, referencing and managing heat stress information for major construction project management, based on which identifies gaps and potentials to envision a participatory approach to weather information management in major projects.
2. State of the technology
2.1. Weather information in project planning
In construction project management, weather-related factors such as heat stress have been discussed as one of the leading factors that cause project delay, but is not legitimated as a reason for granting project extension due to a lack of accurate estimation of weather’s impact on productivity loss (Assaf and Al- Hejji, 2006; Jung, et al, 2016). Thorp and Karan (2008: 816) note that ‘although weather delays are typical of the so-called “act of God” type of delay, normal weather is not justification for the granting of an extension of time. Most general conditions of contract state specifically that only adverse weather conditions that cannot be reasonably anticipated would qualify as a basis for time extension.’
Tian and de Wilde (2011) suggest to differentiate between foreseeable and unforeseeable weathers in climate projection modelling. Ballesteros-Pérez et al. (2017) report a case study of estimating weather’s impact on productivity in a RC building project and an SS building project. In their finding, productivity varies with location and season, so is project duration. They demonstrate that projects starting in summer have the shortest durations in comparison to those starting in winter or autumn. Projects located in cities of good weather have a shorter duration than that of bad weather. They used meteorological information to calculate a 5-storey RC building project in the scenarios of if it was built in each city of the 15 regions of Spain.
The importance and necessity of differentiating between normal weather and abnormal weather is made necessary under the structure of laws that need to define which are normal weather and which are not (Nguyen et al., 2010). Nguyen et al (2010) propose a methodology to estimate project schedule delay by analysing construction activities (e.g., excavation, foundation, roofing, etc.) in three attributes: weather-sensitivity and duration of the work activity, and probability of the concerning weather condition. Weather conditions need to be forecasted to enable the estimation. Ballesteros-Pérez et al. (2018) suggest a method of using national historical weather data to predicting delay in by typical construction activities, through which they produce a set of weather delay maps for the UK. With sine curves, they associate daily weather variables with project delay and suggest coefficients for expected productivity loss. The process of transforming a weather-unaware schedule to a weather-aware schedule involves (1) identifying weather-sensitive activities in the schedule, (2) estimating the extended time for each weather-sensitive activity, and (3) calculating the sum of schedule extension. The model suggests that half-year projects are the ones that experience the greatest weather-related variability, while longer projects can off-set this variability through summer and winter. In their case study of a half- year 3-storey reinforced concrete building project, the calculated impact of weather resulted extension of project duration by 21.6%. However, they note that this duration extension is dependent on the

1372
Weather Information Management in Major Construction Projects: State of the Technology.
starting date of the project, as weather conditions vary with seasons, ranging from 5.7% to 38.3%. Therefore, they suggest a weather-wise project plan to take into account of project starting date and seasonal patterns of regional climate.
Furthermore, during high-rise building construction, weather conditions vary vertically, the information of which is not available in the public meteorological system. Jung et al (2016) develop a simulation model to examine the vertical weather profile, comprised of variables of solar radiation, maximum temperature, minimum temperature, average wind speed, average dew point temperature, and precipitation, for a finer forecast of project delay in high-rise building construction.
2.2. Digital tools for personal heat risk management
Spirig et al (2017) develop a prototype for prediction of heat stress and early warning, linked to the monthly weather forecast by the European Center for Medium Range Weather Forecasts (ECMWF). The ECMWF use basic parameters of heat stress, including temperature, humidity, radiant heat and wind speed, to forecast WBGT daily for shaded and unshaded conditions at about 1800 locations in Europe with a lead time of 15-20 days. Thresholds are set as outdoor 27 oC-WBGT and indoor 30 oC-WBGT respectively that trigger warning for workers. In urban heat island research, Rajagopalan et al (2017) developed a mobile App, which citizens were invited to download to their smartphones. Data of environmental heat parameters were captured by a range of sensors including sensor-laden drones, Energy Buses, weather stations, stationery Temp-RH sensors, portable Temp-RH sensors and portable infrared cameras. The participating citizens help harvesting the data from these sensors with their mobile App through Bluetooth Low Energy (BLE) technology via an encrypted wifi and/or 4G cellular system. The mobile App was able to predict thermal comfort level and suggest a simple heat stress mitigation tool. This programme was undertaken mainly for raising public awareness of urban heat island and conscious control of heat stress on the general public, but the protocol has great potential to be applied to the work context of construction site.
In the U.S., the OSHA and NIOSH developed a Heat Safety Tool (NIOSH, 2018; Figure 1) for iPhone, iPad, and iPod touch for individual use. The App provides real-time Heat Index information and hourly forecasts through automatic retrieval from the national meteorological service, anchored by Apple’s location service, although a manual input option is available, too. The App assesses the heat risk in five zones: minimal, low, moderate, high and extreme; as well as provides basic knowledge on heat illness symptoms, linked with first-aid methods for these symptoms. Other pages of the App provide brief summaries of knowledge on risk factors of heat stress including environment heat stress indicators, dehydration, physical exertion, PPE, physical condition and health problems, medication, pregnancy, age and previous heat illness. More tips include acclimatization protocol (7-14 days), training, emergency plan, hydration protocol, reminder for early signs and rest periods, with a link that informs the users of the NIOSH guidelines on heat stress management (NIOSH, 2016). The App is being used by project managers for justifying variations from time used for completing their duties. Feedback from practitioners reflects a need of geo-coordinated information for people working in remote areas. This is particularly relevant for megaprojects in Australia, in which the construction project commences from a piece of wild land, without any landmark or city to reference the location.

1373
Andrea Y. Jia
Figure 1. The Heat Safety Tool App (NIOSH 2016)
Figure 2. Online heat stress calculator provided by Work Health and Safety Queensland, Australia
In Australia, Work Health and Safety Queensland (WHSQ, 2017) provides an online Heat Stress
Calculator as a service among the WHS eTools to facilitate businesses’ and organisations’ risk assessment (Figure 2). The risk assessment results can be printed, saved or converted into pdf file for documentation. The online calculator can be accessed from PC or any mobile devices. It needs manual input of data, using Apparent Temperature as an indicator of heat stress. Heat risk is assessed by variables including Air Temperature, Relative Humidity, type of clothing (not permeable, single layer (light), single layer (moderate), multiple layers), sun exposure (indoor, full shade, part shade, no shade), hot surfaces (room temperature, hot on contact, warm on contact, burn on contact), exposure period (less than 30 min, 30-60 min, 1-2 hours, more than 2 hours), enclosed space (Y/N), task complexity

1374
Weather Information Management in Major Construction Projects: State of the Technology.
(simple, moderate, complex), climbing (none, one level, two levels, more than two levels), distance from cool rest area (< 10 meters, 10-20 meters, 50-100 metres, > 100 metres), understanding heat strain risk (training given/not), wind speed (strong/moderate/light/none), Respiratory protective equipment (none, disposable half face, non-disposable half-face, full face), metabolic work rate (light/moderate/heavy), acclimatization (Y/N). The script of this tool is based on the updated AIOH guidelines by Australian Institute of Occupational Hygienists (AIOH, 2013: 24-25). Data from users of this tool are stored in a database with Queensland Government. The issue with this online tool is that no geospatial information is collected with the risk assessment, which limits the potential of further spatial- temporal analysis of the data that could inform strategic decisions.
2.3. Georeferencing and BIM-GIS integration
Over its development process, the term BIM is being used to mean building information model, building information modelling and more recently, building information management (ISO 19650: 2018), indicating a shift of focus from the product and technology and to the human side of practice. The word ‘building’ has also been extended to roads and infrastructure assets and “the space between constructed elements, traditionally the domain of landscape architects.” (Plume et al., 2015: 10). Linking BIM with location information has been a decade-long endeavour (e.g., Young, 2010). BuildingSMART Australiasian worked with VANZI Ltd to develop a framework for Australia and New Zealand for integrating BIM and GIS for embedding BIM into its environmental context based on a set of laws, practices and web protocols. This is developed in conjunction with the Australia’s National Road Map for BIM. The integration of BIM and GIS will particularly provide geo-referenced models of the built project, which will facilitate emergency response in disaster situations such as fire, storm, flood and earthquake, etc. (buildingSMART, 2012). Integrated BIM-GIS models are used at the initiation and planning stage of a project for public consultation, or the operation stage for facilities management, but its application at construction stage is limited so far.
Deng et al (2019) developed a protocol to integrate 4D BIM and GIS for supplier selection and supply chain management, in which a BIM-GIS integrated model served to anchor information of transportation distance and material unit price. In the delivery of a construction project in The Hague, Ohor et al (2018) developed a system that allows adding georeferencing information to Revit 2018, which enabled the designers to relate the design information to the geographical information of the environment and the site. Ponjavic and Karabegovic (2019) developed a location intelligence system which integrates BIM and GIS, using WebGIS solution, based on OpenGeo architecture. The system was used for asset management of an airport, enabling smartphone access to the infrastructure database for inspection. The system is able to visualize the dynamic information of staff location, aircraft location, wildlife hazard (such as birds) assessment, and features that inform emergency decisions. They suggest a digital archive system for the relevant information for maintenance, upgrading and further development of the airport. Such a system provides a prototype for managing the dynamic process of a major construction project. They suggest to use the Web Service Bus as part of Enterprise Architecture to facilitate integration.

1375
Andrea Y. Jia
3. A participatory approach to weather information management
3.1. Participatory data collection
The participatory approach is often used in urban planning where citizens have an immediate stake in its decisions (e.g., Kahila-Tani et al., 2015; Dionisio et al., 2016). Geospatial tools are being used for stakeholder and community engagement in urban planning, such as Envision and ESP (Envision Scenario Planner) (AURIN, 2019), although concerned were raised that the development of GIS or equivalent technologies brought damage to vulnerable, poor and marginalized social groups (Kyem, 2000). However, the actual process of public engagement happens in a way that planners draw from their professional expertise to make decisions; the community participation process is used more for persuasion of the community or selecting among a few options rather than for real elicitation of information. There is not yet a clear plan how the data will inform the planning decision. In the same rationale, the great potential of data from the daily practice of frontline workers on construction site is not being elicited to inform project planning. This hidden power can be released if better connection is planned, if the data is planned and properly structured and connected to the project planning stage.
Matthews et al (2015) present a case of the RC frame (formwork, reinforcement and concrete) in a commercial office development project in Perth’s New City Link project using cloud-based BIM to manage the progress of the RC structure construction process. They re-engineered the project’s paper- based process to align it with the information structure needed by the cloud-based BIM, and designed a real-time object oriented bi-directional system to capture information on site and synchronize it with a federated BIM model. The adoption of this technological innovation resulted in a process innovation in terms of workflow and progress management. The modelling process acted as a system integrator during which the tasks are aligned with the schedule, the Quality Assurance procedures with the completed tasks reporting, which made the data searchable. The site engineers and foremen were engaged to monitor the real time progress with an iPad and report the data to the project planner, through the cloud-based BIM, for regular project schedule update.
3.2 Agent-based modelling
Agent-based modelling is another technology that frees up BIM from making more and more complicated models to accommodate emergent situations by developing agents of specific behavioural characteristics (Couch, 2016). It is primarily used in Smart Cities modelling for simulating human social behaviours and interactions (Perez et al., 2017), and has the potential to be used for modelling the dynamic environment on construction site. Hattab and Hamzeh (2018) combine agent-based modelling with social network analysis to examine how the adoption of BIM has changed the design workflow. Trivedi and Rao (2018) use agent-based modelling to analyse alternative scenarios of human panic behaviours for evaluation of emergency evacuation strategies and identification of possible bottlenecks and deficiencies, indicated by evacuation time and physical discomfort that caused to agents.
3.3. Envisioning a bottom-up approach
A three-tier safety risk assessment procedure, as observed by the author in 2017 in a megaproject in Australia, includes Safe Work Method Statement (SWMS) every three months, Job Hazard Analysis (JHA) on starting every new task, and personal risk assessment (PRA). SWMS and JHA were conducted by safety advisors or supervisors. The PRA is conducted by every single workers three times a day.

1376
Weather Information Management in Major Construction Projects: State of the Technology.
However, in the established practice on site, the many PRAs completed daily were not followed by immediate mitigation of the risks but were used for documentation only. Such outcome suggests that the PRA is particularly of potential to be mobilized for personalised risk control and automated data collection, which will enable the generation of smart (real-time and interactive) and personal alert and risk management advice.
BIM model carried in mobile device opens the possibility for workers’ participation in design and data collection. Data need to be centralized to inform strategic decisions, and to be localized for effective risk mitigation (Lundgren-Kownacki et al., 2017a). Thus a dule-level weather information management system is suggested for major projects: engage and empower local actors for personal risk mitigation; tighten inter-project coupling to pool the data for future weather-wise project planning. At individual level, what needs to be done is to close the loop of a personal risk management system such that individual workers can assess and mitigate their own heat stress at their specific workplace. A mobile App is needed to input and analyse the parameters of the specific work space as well as the workers’ health information. These data should be available to the individual worker only to ensure privacy while providing the specific user personalized information for a heat risk assessment at a specific workplace. The anonymised data should then be pooled for future estimation and project planning. This has to be realised through inter-project learning.
Figure 3. The envisioned two-tier heat stress risk management system
Database for future
estimation
General information
Inter-project learning
worker Personal heat risk assessment
immediate mitigation
Personal health information Georeferencing

1377
Andrea Y. Jia
4. Conclusion This paper presents a brief review of the state of the technology for weather information management in major construction projects. There is a need to engage workers to participate in and contribute to the whole weather information management process. The information exclusively owned by individual workers is their own personal health information and their local knowledge of the spatial environmental characteristics of the workplace and the task, which is of value to inter-project level and industry level planning. A participatory georeferenced BIM system is needed to mitigate the heat stress risk locally while collecting anonymised data on the complex conditions of construction sites for future project planning. A central database is needed at inter-project level to store and corroborate such information, which should be submitted to a national database for future estimation of project cost and duration in tendering. The challenge with system design is how to register the complex spatial characteristics in the workplaces on construction site; how to put feasible and low-cost sensors to capture and transmit the needed data, including radiant heat and air velocity. This study contributes to a solution-oriented bottom-up approach to weather information management in major construction projects.
Acknowledgement The author would like to acknowledge the support of Melbourne School of Design at University of Melbourne where she worked as a Senior Lecturer in Construction Management during the writing of this paper.
References AIOH 2013. A Guide for Managing Heat Stress, Tullamarine, The Australian Institute of Occupational
Hygienists. Assaf, S. A. & Al-Hejji, S. 2006. Causes of delay in construction projects. International Journal of Project
Management, 24(4), 349-357. URIN 2019. Envision Scenario Planning Tool (ESP), Australian Urban Research Infrastructure Network
(AURIN) and The University of Melbourne, https://aurin.org.au/resources/decision-support/esp. Ballesteros-Pérez, P., Rojas-Céspedes, Y. A., Hughes, W., Kabiri, S., Pellicer, E., Mora-Melià, D. & Campo-
Hitschfeld, M. L. d. 2017. Weather-wise: A weather-aware planning tool for improving construction productivity and dealing with claims. Automation in Construction, 84, 81-95.
Ballesteros-Pérez, P., Smith, S. T., Lloyd-Papworth, J. G. & Cooke, P. 2018. Incorporating the effect of weather in construction scheduling and management with sine wave curves: application in the United Kingdom. Construction Management and Economics, 36(12), 666-682.
Deng, Y., Gan, V. J. L., Das, M., Cheng, J. C. P. & Anumba, C. 2019. Integrating 4D BIM and GIS for construction supply chain management. Journal of Construction Engineering and Management, 145(4) https://doi.org/10.1061/(ASCE)CO.1943-7862.0001633.
Dionisio, M. R., Kingham, S., Banwell, K. & Neveille, J. 2016. Geospatial tools for community engagement in the Christchurch rebuild, New Zealand. Sustainable Cities and Society, 27, 233-243.
ISO 19650-1 2018. Organization and digitization of information about buildings and civil engineering works, including building information modelling (BIM) - Information management using building information modelling - Part 1: Concepts and principles, Geneva, International Organization for Standardization.
1378
Weather Information Management in Major Construction Projects: State of the Technology.
ISO 19650-2 2018. Organization and digitization of information about buildings and civil engineering works, including building information modelling (BIM) - Information management using building information modelling - Part 2: Delivery phase of the assets, Geneva, International Organization for Standardization.
Jia A.Y., Loosemore M., Gilbert D. & Rowlinson S. 2016a. Shielding workers from heat stress: an institutional logics perspective, In P W Chan (Eds.), Proceedings of 32nd Annual ARCOM Conference, Manchester, UK: Association of Researchers in Construction Management.
Jia A. Y., Rowlinson S. & Ciccarelli M. 2016b. Climatic and psychosocial risk factors of heat illness cases on construction site, Applied Ergonomics, 53, 25-35.
Jia A.Y., Gilbert D. & Rowlinson S. 2018. Seasonal patterns of thermal stress in the work environment of construction site in a megaproject in Australia. In Proceedings of the 52nd International Conference of the Architectural Science Association (ANZAScA), Melbourne.
Jia A.Y., Rowlinson S., Loosemore M., Gilbert D. & Ciccarelli M. 2019. Institutional logics of processing safety in production: The case of heat stress management in a megaproject in Australia, Safety Science, 120, 388-401.
Jia A. Y., Gilbert D., Tymvios N., Goh Y.M., Behm M. & Rowlinson S., 2020. Tuning into heat: acclimatization on construction site and horizontal integration in major project management, In Proceedings of the CIB W099/TG59 Annual Conference, Glasgow, UK.
Jung, M., Park, M., Lee, H.-S. & Kim, H. 2016. Weather-delay simulation model based on vertical weather profile for high-rise building construction. Journal of Construction Engineering and Management, 142(6), 4016007.
Kahila-Tani, M., Broberg, A., Kyttä, M. & Tyger, T. 2015. Let the citizens map - public participation GIS as a planning support system in the Helsinki master plan process. Planning Practice & Research, Dec 2015, 1-20.
Kyem, P. A. K. 2000. Embedding GIS Applications into Resource Management and Planning Activities of Local and Indigenous Communities A Desirable Innovation or a Destabilizing Enterprise? Journal of Planning Education and Research, 20, 176-186.
Loosemore, M. and Andonakis, N., 2007. Barriers to implementing OHS reforms – the experiences of small subcontractors in the Australian construction industry, International Journal of Project Management, 25(6), 579-588.
Lundgren-Kownacki, K., Kjellberg, S. M., Gooch, P., Dabaieh, M., Anandh, L. & Venugopal, V. 2017a. Climate change-induced heat risks for migrant populations working at brick kilns in India: a transdisciplinary approach. International Journal of Biometeorology, 62(3), 347-358.
Matthews, J., Love, P. E. D., Heinemann, S., Chandler, R., Rumsey, C. & Olatunj, O. 2015. Real time progress management: Re-engineering processes for cloud-based BIM in construction. Automation in Construction, 58(October 2015), 38-47.
NIOSH 2018. OSHA-NIOSH Heat Safety Tool App, US, National Institute of Occupational Safety and Health, https://www.osha.gov/SLTC/heatillness/heat_index/heat_app.html.
Nguyen, L. D., Kneppers, J., de Soto, B. G. & Ibbs, W. 2010. Analysis of adverse weather for excusable delays. Journal of Construction Engineering and Management, 136(12), 1258 – 1267.
Ohor, K. A., Diakité, A., Krijnen, T., Ledoux, H. & Stoter, J. 2018. Processing BIM and GIS Models in Practice: Experiences and Recommendations from a GeoBIM Project in The Netherlands. ISPRS International Journal of Geo-Information, 7(8) 10.3390/ijgi7080311.

1379
Andrea Y. Jia
Perez, P., Banos, A. & Pettit, C. 2017. Agent-based modelling for urban planning: current limitations and
future trends. In: Namazi-Rad, M.-R., Padgham, L., Perez, P., Nagel, K. & Bazzan, A. (eds.) Agent Based Modelling of Urban Systems. Berlin: Springer.
Plume, J., Simpson, R. & Hobson, A. 2015. Integration of Geospatial and Built Environment - National Data Policy, buildingSMART Australia and SIBA.
Ponjavic, M. & Karabegovic, A. 2019. Location Intelligence Systems and Data Integration for Airport Capacities Planning. Computers, 8(13) DOI: 10.3390/computers8010013.
Rajagopalan, P., Santamouris, M. & Andamon, M. M. 2017. Public engagement in urban microclimate research: an overview of a citizen science project. In: Schnabel, M. A. (ed.) Back to the Future: The Next 50 Years, 51st International Conference of the Architectural Science Association (ANZAScA). Wellington: The Architectural Science Association and Victoria University of Wellington
Spirig, C., Noti, P., Messeri, A., Morabito, M., Kotlarski, S., Casanueva, A. & Liniger, M. 2017. Prototype of a local/regional warning system predicting environmental heat strain based on an ensemble forecast model for the upcoming weeks, RUL: www.heat-shield.edu (accessed on 18 April 2019).
Thorpe, D. & Karan, E. P. 2008. Method for calculating schedule delay considering weather conditions. In: Dainty, A. (ed.) Procs 24th Annual ARCOM Conference, 1-3 September 2008. Cardiff, UK: Association of Researchers in Construction Management.
Tian, W. & de Wilde, P. 2011. Uncertainty and sensitivity analysis of building performance using probabilistic climate projections: a UK case study. Automation in Construction, 20, 1096-1109.
Trivedi, A. & Rao, S. 2018. Agent-based modeling of emergency evacuations considering human panic behavior. IEEE Transactions on Computational Social Systems, 5(1), 277-289.
WHSQ 2017. Heat Stress (Basic) Calculator, Queensland Government, Australia, Work Health and Safety Queensland, Office of Industrial Relations, URL: https://fswqap.worksafe.qld.gov.au/etools.

1380
The 54th International Conference of the Architectural Science Association (ANZAScA) 2020
Authors Index
Aaldrin Abdullah, 1125 Abbas Yazdanfar, 226 Abhishek Raj Singh, 191 Achini Shanika Weerasinghe, 805 Adele Leah, 996 Ahmed A. Serageldin, 481 Akila Rathnasinghe, 1105 Alejandro Lara Allende, 1155 Alessandro Melis, 680 Alessandro Pracucci, 865 Alessandro Premier, 966 Alex Sims, 211 Alexander Trudelle, 1183 Ali GhaffarianHoseini, 306, 385, 561, 835, 1203, 1213 Ali Ghazvinian, 715 Ali Rashidi, 600 Aliakbar Kamari, 395, 1026, 1273 Amaia Uriarte, 865 Amarachukwu Nnadozie Nwadike, 181, 570 Amir Mahdiyar, 541 Amirhosein GhaffarianHoseini, 306, 385, 551, 835 Amirpooya Shirazi, 461 An Le, 181 André Stephan, 1085, 1155 Andrea Y. Jia, 1370 Angel M. Cea, 865 Antonio Fioravanti, 986 Antonio Lara-Hernande, 680 António Leitão, 765, 1056 Antony Pelosi, 855, 1283 Aparna Samaraweera, 61 Arezoo Shirazi, 461 Argaw Gurmu, 501 Arman Khalil Beigi, 715 Athira Azmi, 600 Azadeh Montazami, 815 Ban Jalal Ahmed, 151 Bani Feriel Brahmi, 1026, 1273 Barbora Foerster, 680 Bartlomiej Marek Kotula, 395 Ben Slee, 1360 Beñat Arregi, 425 Bin Su, 795, 1193 Bo Yang,, 521 Brenda Vale, 1233 Caio Schmitz Machado, 1273 Carl Barrett, 825 Carla Resendiz, 286
Carlos Jimenez-Bescos, 151, 650 Charles Clifton, 405 Chenghao Wang, 670 Chris Ford, 1036 Christiane M. Herr, 365 Christopher A. Jensen, 590 Christopher Welch, 855 Christopher Wood, 21 Christos Chantzaras, 689 Clare Tedestedt George, 1203, 1213 Collin, A, 1351 Cristian Schmitt, 699 Danielle M. Reynald, 1125 Danny H.W. Li, 11 Danny Li, 141 Dave Moore, 1203, 1213 David Batchelor, 335 David Beynon, 246 David Dziubanski, 521 David S Jones, 246 Debbie Ross-Symonds, 375 Delight M. Sedzro, 1095 Dermott McMeel, 211 Diego Gonzalez, 425 Dino Pisaniello, 71 Don Amila Sajeevan Samarasinghe, 201 Dong Chen, 296 Dorcas, A. Ayeni, 561 Emina Kristina Petrović, 996, 1115 Emmanuel Aghimien, 141 Enegbuma, W.I, 1351 Erika Bartak, 590 Esmaeil Motaghi, 715 Eziaku Rasheed, 805, 1135 Fabian Delpy, 432 Fan Zhang, 610, 1183 Fanni Melles, 875 Faruk Can Ünal, 1175 Farzad Rahimian, 286 Felipe Jara Baeza, 925 Funmilayo Ebun Rotimi, 561 Funmilayo Ogunjobi, 1066 Gabriela Dias Guimaraes, 31 George Baird, 1135 Gerard Finch, 1283 Gergana Rusenova, 875 Gideon Howell, 815 Gorka Sagarduy, 425 Graeme North, 705 Gregory MacRae, 405

1381
The 54th International Conference of the Architectural Science Association (ANZAScA) 2020
Gregory Nolan, 161 Griffin Cherrill, 735 Guillermo Aranda-Mena, 266 Guy Brown, 630 Guy Marriage, 1283 Haleh Sadeghi, 541 Hannah Robertson, 375 Hans-Christian Wilhelm, 171, 276, 511 Hartwig Kunzel, 161 Hartwig Künzel, 1 Hasan Naseri Azghandi, 905 Hirokazu Abe, 775 Hong Cing Tung, 946 Hugh Morris, 705 Ian Woodcock, 875 Ibrahim Alhindawi, 650 Ilham Kitouni, 1026 Inês Caetano, 1056 Inês Pereira, 765, 1056 Isidoro Malaque III, 640 Itohan Esther Aigwi, 181, 570 Izaskun Alvarez, 425 J. Ignacio Torrens-Galdiz, 865 Jacob Coleman, 276 Jacqueline Paul, 325 James O. Rotimi, 1203, 1213 James Olabode Bamidele Rotimi, 805 James Rotimi, 181 Jan Auernhammer, 1036 Jas Qadir, 1203, 1213 Jeff Seadon, 51, 1165 Jeni Paay, 875 Jo Darkwa, 21 Joanna Merwood-Salisbury, 745 John Calautit, 580 John E. Tookey, 306, 835 John Gelder, 1303 John Kaiser Calautit, 21 Jorge Ochoa Paniagua, 31 Jorge Torres, 865 Joshua Joe, 855 Julia Hamilton, 885 Kamal Dhawan, 306, 835 Kamiya Varshney, 1145 Karl Lofgren, 335 Kasun Perera, 845 Katayoun Taghizadeh Azari, 715 Katie Skillington, 355 Katsunori Nagano3, 481 Keerthi Priya Ramineni, 976 Kensuke Yasufuku, 775 Kerry Francis, 1046 Kexin Chen, 1016
Larissa Arakawa Martins, 71 Lauren Hayes, 1115 Lesaja Weerasinghe, 1105 Lian Wu, 795, 1193 Liang-Jiu Jia, 405 Lorraine Skelton, 201 Lydia Kiroff, 630 M. Reza Hosseini, 541 Mahesh Abeynayake, 1105 Mahesh Babu Purushothaman, 51, 491 Mahmoud Danaee, 551 Mahnaz Farahani, 81 Mahsa Zomorodian, 41 Maibritt Pedersen Zari, 432, 1145 Malik Khalfan, 825 Mani Poshdar, 1165 Manuel Mühlbauer, 1243 Marc Aurel Schnabel, 91, 335, 845 Marc Woodbury, 745 Marisa Claudia Martínez, 451 Mark Dewsbury, 1, 161, 246 Mary Myla Andamon, 925 Maryam Khoshbakht, 41, 1135 Maryam Lesan, 101, 226, 1006 Marzie Mirjafari, 226 Maszura Abd Ghafar, 600 Mathew Aitchison, 699 Mathusha Francis, 1313 Matthew Bradbury, 785 McIntosh, J, 1351 Megan Burfoot, 385 Melissa Chan, 1066 Michael Donn, 735, 745, 845 Min Hall, 705 Mina Lesan, 226 Minzhi Ye, 481 Miyami Dasandara, 61 Mohamad Tahsildoost, 41 Mohammadjavad Mahdavine, 81 Mohsen Tabassi, 895, 905 Molood Seifi, 1125 Morten Gjerde, 111, 1006, 1233, 1283 Muhammad Hegazy, 775 Murray Herron, 246 Nashwan Dawood, 286 Nicola Naismith, 385 Nigel Isaacs, 220, 415, 1233, 1323, 1331 Nilesh Bakshi, 1145 Niluka Domingo3, 236 Nilupa Udawatta, 915 Ning Gu, 31 Nirusika Rajenthiran, 61 Nishat Rashida, 620

1382
The 54th International Conference of the Architectural Science Association (ANZAScA) 2020
Noemi Arroyo, 865 Norhaslina Hassan, 551 Olubukola Tokede, 915 Oscar Casadei, 865 Paige Tien, 580 Paige Wenbin Tien, 21 Paola Boarin, 471, 1263
Paulo Vaz-Serra1, Peter Edwards1, 266 Pei-Hsien Hsu, 946 Peiman Pilechiha, 81 Peiyuan Li, 755 Peter McPherson, 795, 1193 Peter SP Wong, 825 Philip Tong, 171 Phillipa Watson, 1 Phillippa Carnemolla, 286 Pippa Connolly, 375 Piumi Dissanayake, 61 Priscila Besen, 471 Priyadarsini Rajagopalan, 925 Qi Li, 121, 316 Quynh To Thi Huong, 345 Rachel Paschoalin, 1331 Rahinah Ibrahim, 600 Rajesh Dhakal, 405 Rameka Alexander-Tuinukuafe, 442 Rashika Sharma, 630 Ravindu Kahandawa, 181 Rebecca J. Yang, 825 Rebecca Kiddle, 111 Regan Potangaroa, 220, 1323 Renata Castelo-Branco, 1056 Renata Jadresin Milic, 885 Renata Jadresin-Milic, 795, 1193 Reza Jafarzadeh, 181 Rick Kaufusi, 442 Robert H. Crawford, 256, 355, 531, 1075, 1085, 1155 Roberto Garay Martinez, 425, 865 Roberto Petruzzi, 590 Rodney Stewart, 610 Rohit Gade, 1165 Rohit Priyadarshi Sanatani, 1341 Ronnie Pace, 1331 Rosie Evans, 996 Roy Nates, 1095 Rudi Stouffs, 956 Saeed Reza Mohandes, 541 Salman Shooshtarian, 825 Sameh Shamout, 1263 Sanaz Tabatabaee, 541
Sandeeka Mannakkara, 1263 Sara Magnani, 865 Sarah Buet, 415 Sarah Pells, 511 Sarah Shuchi, 451, 620, 976 Sayyed Amir Hossain Maghool, 91 Semisi Potauaine, 442 Sepideh Korsavi, 815 Sepideh Mousavi, 895 Sergio Rodriguez, 286 Shady Attia, 1293 Shahab Ramhormozian, 405 Shailee Goswami, 131 Shanika Vidana Gamage, 1313 Shannon Bridget Griffiths, 745 Sherina Rezvaniour, 551 Shruthy Pamera, 501 Shruti Nath, 1 Shuangyu Wei, 21 Shuangyu Wei1, 580 Shuyang Li, 11 Sibyl Bloomfield, 325, 660 Sina Salimzadeh, 715 Sisi He, 590 Soheila Ghafoor, 256 Souad Sassi Boudemagh, 1026 Stefan Marks, 405 Sumit Kumar, 491 Susan Ang, 451, 976 Susan J. Wake, 935 Suzanne Wilkinson, 236, 570 T. N. Anderso, 1095 Tamati, G, 1351 Tane Moleta, 91 Tanya Sorrell, 181 Tatiana Ermenyi, 220, 1323 Tayyab Maqsood, 825 Terence Williamson, 71 Thai Phan, 405 Thao Thi Phuong Bui1, 236 Thi Nhat Thanh Pham, 201 Thomas Meixner, 521 Tim Law, 296 Toba Samuel Olaoye, 161 Udaraka Iroshana, 1313 Udayangani Kulatunga, 1105 Ugo Maria Coraglia, 986 Vanessa Gomes, 31 Venkata Santosh Kumar Delhi, 191 Veronica Soebarto, 71 Victor Bunster, 699 Victor Momoh, 561

1383
The 54th International Conference of the Architectural Science Association (ANZAScA) 2020
Vinay Natrajan, 131 Waldo Bustamante, 699 Wallace Imoudu Enegbuma, 220, 1323 Wenqiang Chen, 11 Xavier Cadorel, 531 Yawen Duan, 365 YeeKee Ku, 724 Yi He, 1016 Yin Leng Theng, 956 Yuchen She, 915 Yue Yu, 660
Yuezhong Liu, 956 Yüksel Demir, 1175 Yupeng Wu, 580 Yusef Patel, 442, 1283 Zahra Balador, 1233 Zhe Hu, 1016 Zhelun, Zhu, 986 Zhengping Liow, 1253 Zhi-Hua Wang, 755 Zhou Yu, 316

ASA 2020
©2020, All rights reserved and published by The Architectural Science Association (ANZAScA), Australia ISBN 978-0-9923835-7-2