Utilization of the three high-throughput SNP genotyping methods, the GOOD assay, Amplifluor and...
10
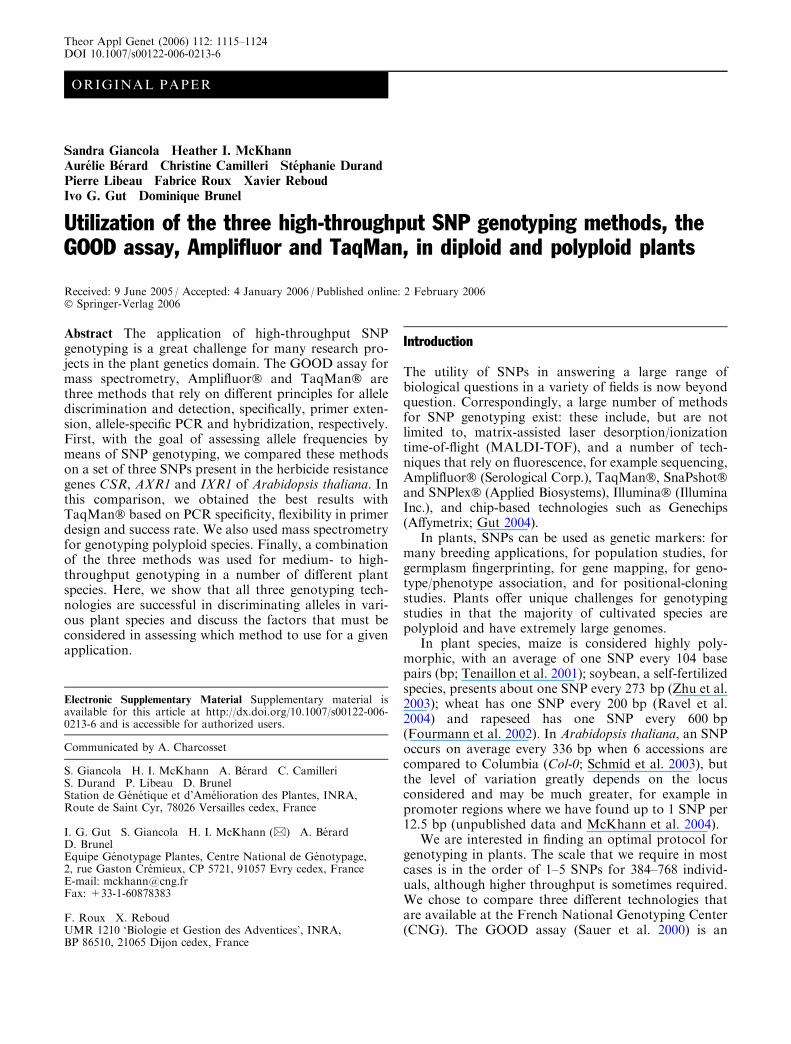
ORIGINAL PAPER Sandra Giancola Heather I. McKhann Aure´lie Be´rard Christine Camilleri Ste´ phanie Durand Pierre Libeau Fabrice Roux Xavier Reboud Ivo G. Gut Dominique Brunel Utilization of the three high-throughput SNP genotyping methods, the GOOD assay, Amplifluor and TaqMan, in diploid and polyploid plants Received: 9 June 2005 / Accepted: 4 January 2006 / Published online: 2 February 2006 ȑ Springer-Verlag 2006 Abstract The application of high-throughput SNP genotyping is a great challenge for many research pro- jects in the plant genetics domain. The GOOD assay for mass spectrometry, AmplifluorȐ and TaqManȐ are three methods that rely on different principles for allele discrimination and detection, specifically, primer exten- sion, allele-specific PCR and hybridization, respectively. First, with the goal of assessing allele frequencies by means of SNP genotyping, we compared these methods on a set of three SNPs present in the herbicide resistance genes CSR, AXR1 and IXR1 of Arabidopsis thaliana. In this comparison, we obtained the best results with TaqManȐ based on PCR specificity, flexibility in primer design and success rate. We also used mass spectrometry for genotyping polyploid species. Finally, a combination of the three methods was used for medium- to high- throughput genotyping in a number of different plant species. Here, we show that all three genotyping tech- nologies are successful in discriminating alleles in vari- ous plant species and discuss the factors that must be considered in assessing which method to use for a given application. Introduction The utility of SNPs in answering a large range of biological questions in a variety of fields is now beyond question. Correspondingly, a large number of methods for SNP genotyping exist: these include, but are not limited to, matrix-assisted laser desorption/ionization time-of-flight (MALDI-TOF), and a number of tech- niques that rely on fluorescence, for example sequencing, AmplifluorȐ (Serological Corp.), TaqManȐ, SnaPshotȐ and SNPlexȐ (Applied Biosystems), IlluminaȐ (Illumina Inc.), and chip-based technologies such as Genechips (Affymetrix; Gut 2004). In plants, SNPs can be used as genetic markers: for many breeding applications, for population studies, for germplasm fingerprinting, for gene mapping, for geno- type/phenotype association, and for positional-cloning studies. Plants offer unique challenges for genotyping studies in that the majority of cultivated species are polyploid and have extremely large genomes. In plant species, maize is considered highly poly- morphic, with an average of one SNP every 104 base pairs (bp; Tenaillon et al. 2001); soybean, a self-fertilized species, presents about one SNP every 273 bp (Zhu et al. 2003); wheat has one SNP every 200 bp (Ravel et al. 2004) and rapeseed has one SNP every 600 bp (Fourmann et al. 2002). In Arabidopsis thaliana, an SNP occurs on average every 336 bp when 6 accessions are compared to Columbia (Col-0; Schmid et al. 2003), but the level of variation greatly depends on the locus considered and may be much greater, for example in promoter regions where we have found up to 1 SNP per 12.5 bp (unpublished data and McKhann et al. 2004). We are interested in finding an optimal protocol for genotyping in plants. The scale that we require in most cases is in the order of 1–5 SNPs for 384–768 individ- uals, although higher throughput is sometimes required. We chose to compare three different technologies that are available at the French National Genotyping Center (CNG). The GOOD assay (Sauer et al. 2000) is an Electronic Supplementary Material Supplementary material is available for this article at http://dx.doi.org/10.1007/s00122-006- 0213-6 and is accessible for authorized users. Communicated by A. Charcosset S. Giancola H. I. McKhann A. Be´rard C. Camilleri S. Durand P. Libeau D. Brunel Station de Ge´ne´tique et d’Ame´lioration des Plantes, INRA, Route de Saint Cyr, 78026 Versailles cedex, France I. G. Gut S. Giancola H. I. McKhann (&) A. Be´rard D. Brunel Equipe Ge´notypage Plantes, Centre National de Ge´notypage, 2, rue Gaston Cre´mieux, CP 5721, 91057 Evry cedex, France E-mail: [email protected] Fax: +33-1-60878383 F. Roux X. Reboud UMR 1210 ‘Biologie et Gestion des Adventices’, INRA, BP 86510, 21065 Dijon cedex, France Theor Appl Genet (2006) 112: 1115–1124 DOI 10.1007/s00122-006-0213-6
Transcript of Utilization of the three high-throughput SNP genotyping methods, the GOOD assay, Amplifluor and...
ORIGINAL PAPER
Sandra Giancola Æ Heather I. McKhann
Aurelie Berard Æ Christine Camilleri Æ Stephanie Durand
Pierre Libeau Æ Fabrice Roux Æ Xavier ReboudIvo G. Gut Æ Dominique Brunel
Utilization of the three high-throughput SNP genotyping methods, theGOOD assay, Amplifluor and TaqMan, in diploid and polyploid plants
Received: 9 June 2005 / Accepted: 4 January 2006 / Published online: 2 February 2006� Springer-Verlag 2006
Abstract The application of high-throughput SNPgenotyping is a great challenge for many research pro-jects in the plant genetics domain. The GOOD assay formass spectrometry, Amplifluor� and TaqMan� arethree methods that rely on different principles for allelediscrimination and detection, specifically, primer exten-sion, allele-specific PCR and hybridization, respectively.First, with the goal of assessing allele frequencies bymeans of SNP genotyping, we compared these methodson a set of three SNPs present in the herbicide resistancegenes CSR, AXR1 and IXR1 of Arabidopsis thaliana. Inthis comparison, we obtained the best results withTaqMan� based on PCR specificity, flexibility in primerdesign and success rate. We also used mass spectrometryfor genotyping polyploid species. Finally, a combinationof the three methods was used for medium- to high-throughput genotyping in a number of different plantspecies. Here, we show that all three genotyping tech-nologies are successful in discriminating alleles in vari-ous plant species and discuss the factors that must beconsidered in assessing which method to use for a givenapplication.
Introduction
The utility of SNPs in answering a large range ofbiological questions in a variety of fields is now beyondquestion. Correspondingly, a large number of methodsfor SNP genotyping exist: these include, but are notlimited to, matrix-assisted laser desorption/ionizationtime-of-flight (MALDI-TOF), and a number of tech-niques that rely on fluorescence, for example sequencing,Amplifluor� (Serological Corp.), TaqMan�, SnaPshot�and SNPlex� (Applied Biosystems), Illumina� (IlluminaInc.), and chip-based technologies such as Genechips(Affymetrix; Gut 2004).
In plants, SNPs can be used as genetic markers: formany breeding applications, for population studies, forgermplasm fingerprinting, for gene mapping, for geno-type/phenotype association, and for positional-cloningstudies. Plants offer unique challenges for genotypingstudies in that the majority of cultivated species arepolyploid and have extremely large genomes.
In plant species, maize is considered highly poly-morphic, with an average of one SNP every 104 basepairs (bp; Tenaillon et al. 2001); soybean, a self-fertilizedspecies, presents about one SNP every 273 bp (Zhu et al.2003); wheat has one SNP every 200 bp (Ravel et al.2004) and rapeseed has one SNP every 600 bp(Fourmann et al. 2002). In Arabidopsis thaliana, an SNPoccurs on average every 336 bp when 6 accessions arecompared to Columbia (Col-0; Schmid et al. 2003), butthe level of variation greatly depends on the locusconsidered and may be much greater, for example inpromoter regions where we have found up to 1 SNP per12.5 bp (unpublished data and McKhann et al. 2004).
We are interested in finding an optimal protocol forgenotyping in plants. The scale that we require in mostcases is in the order of 1–5 SNPs for 384–768 individ-uals, although higher throughput is sometimes required.We chose to compare three different technologies thatare available at the French National Genotyping Center(CNG). The GOOD assay (Sauer et al. 2000) is an
Electronic Supplementary Material Supplementary material isavailable for this article at http://dx.doi.org/10.1007/s00122-006-0213-6 and is accessible for authorized users.
Communicated by A. Charcosset
S. Giancola Æ H. I. McKhann Æ A. Berard Æ C. CamilleriS. Durand Æ P. Libeau Æ D. BrunelStation de Genetique et d’Amelioration des Plantes, INRA,Route de Saint Cyr, 78026 Versailles cedex, France
I. G. Gut Æ S. Giancola Æ H. I. McKhann (&) Æ A. BerardD. BrunelEquipe Genotypage Plantes, Centre National de Genotypage,2, rue Gaston Cremieux, CP 5721, 91057 Evry cedex, FranceE-mail: [email protected]: +33-1-60878383
F. Roux Æ X. ReboudUMR 1210 ‘Biologie et Gestion des Adventices’, INRA,BP 86510, 21065 Dijon cedex, France
Theor Appl Genet (2006) 112: 1115–1124DOI 10.1007/s00122-006-0213-6
allele-specific primer extension protocol that employsMALDI-TOF mass spectrometry. The utility of thismethod has been shown for genotyping SNPs inhumans (Tost and Gut 2002). Amplifluor� technology(Myakishev et al. 2001) is based on competitive allele-specific PCR amplification, while the TaqMan� PCRtechnology (Livak 1999) relies on allele-specifichybridization. Amplifluor� and TaqMan� are simpleSNP genotyping methods where all reagents are addedinto a reaction well, which is then sealed and subjectedto thermal cycling. The mass spectrometry-based pro-tocol requires successive additions of reagents to asample well and the transfer of allele-specific productsonto MALDI target plates for analysis.
For our comparison, we examined three differentherbicide resistance genes from A. thaliana. The geno-typing results were used to assess the evolution of resis-tance allele frequencies in herbicide-free populations(Roux et al. 2004, 2005; F. Roux et al., unpublisheddata), one indirect method to estimate fitness cost asso-ciated with pesticide resistance (Bourguet et al. 2004). Wealso present the results of genotyping of other diploidand polyploid plant genomes using one of these methods.
Materials and methods
Plant material
For A. thaliana, a segregating population of 384individuals issued from the selfing of a heterozygous plantat the CSR, IXR1 and AXR1 genes was used (F. Roux,unpublished data). One SNP that determines herbicideresistance (Haughn et al. 1988; Leyser et al. 1993; Scheibleet al. 2001) from each gene was analyzed. The SNPs arenamed csr1-1, axr1-3 and ixr1-2 for the CSR, IXR1 andAXR1 genes, respectively (Roux et al. 2004). For eachSNP, sixteen DNA samples were added as positive con-trols (12 homozygous and 4 heterozygous). DNA wasextracted from 10-day-old germinated seedlings with avery simple and quick protocol (Saini et al. 1999). Beforethe PCR reaction, the samples were diluted 1/50.
The rapeseed plants (Brassica napus) were recom-binant inbred lines from a cross between two inbredlines, Stellar and Drakkar. Four DNAs from each par-ent were added as positive controls. DNA was preparedfrom 380 adult plants with the cetyl methylammoniumbromide (CTAB) protocol (Doyle and Doyle 1990). Apair of gene-specific primers was designed from thealignments of ADH-homologous gene sequences (Brunelet al. 1999). Other plants mentioned were all extractedusing the CTAB protocol (Doyle and Doyle 1990).
DNA quantification
One microliter of 28 different A. thaliana DNAswere quantified using the PicoGreen dsDNA quantifi-cation kit (Invitrogen France, Cergy Pontoise) with a
SpectraMAX Gemini spectrofluorometer (MolecularDevices, St. Gregoire, France). Standards were fivedifferent dilutions of calf thymus DNA (0–50 ng/ll).
Mass spectrometric analysis
The GOOD assay reaction was performed as describedby Sauer et al. (2000). For each set of 384 samples, twoplates are prepared and genotyped, a ‘‘normal’’ and a‘‘reorganized’’. Briefly, the samples at the exterior of thenormal plate are moved to the center of the reorganizedplate. This is to avoid potential problems resulting fromthe position of the sample in the plate (edge effect). Thedetails of the PCR are described in the SupplementaryMaterials.
Primer extension reaction
Primers for the extension reaction were determinedusing the OLIGO v. 6.0 program (Rychlik et al. 1990).The protocol was as described by Sauer et al. (2000)except we used 0.4U THERMIpol DNA polymerase(Solis Biodyne, Tartu, Estonia).
An initial denaturing step of 3 min at 95�C was usedfollowed by 40 cycles of (20 s at 95�C, 1 min at 58�C and1 min at 62�C).
The gene targets from the different species, sequenceof the extension primers, SNP and expected mass aredescribed in Supplementary Material Table 1.
Computer analysis
The Autoflex MALDI mass spectrometer for SNPgenotyping provides the results from each plate with‘‘Genotools SNP MANAGER’’ software (Pusch et al.2001), which gives a summary of the results in a tablethat relates the well position to genotype. Quality con-trol and genotyping analysis were performed using‘‘SNP Master’’ software (program developed for inter-nal use at the Centre National de Genotypage, Evry,France). The results were determined and a MicrosoftExcel file with the consensus or individual genotypes wasexported to the database.
Amplifluor� analysis
The allele-specific PCR primers and the commonreverse primers (COM) were designed from each genesequence for the different species using Amplifluor�AssayArchitect software (http://www.assayarchitect.com/,Chemicon International, a division of SerologicalsCorporation, Norcross, GA, USA). Oligonucleotideswere synthesized and HPLC purified by MWG Biotech(Ebersberg, Germany). One unique 21-nucleotide tailthat is complementary to the Universal Amplifluor�primer (Bengra et al. 2002) was added to the 5¢ end of
1116
each allele-specific primer (Myakishev et al. 2001).Fluorescent measurements and data analysis forAmplifluor� were as described by Bengra et al. (2002).PCR conditions are described in the SupplementaryMaterials. The gene targets from the different species,the sequence of the PCR primers (two allele-specificprimers, and a COM reverse primer per SNP) usedto amplify each of the three SNPs from the CSR,AXR1 and IXR1 genes, and the length of the amplifiedtarget DNA are shown in Supplementary MaterialTable 2.
Computer analysis
Fluorescence results obtained on an ABI Prism 7900HTwere transferred to a Microsoft Excel file for analysis,and scatter plots for each SNP locus were obtainedusing the SDS Software Workspace (Applied Biosys-tems).
TaqMan� analysis
TaqMan� (Applied Biosystems, Foster City, CA, USA)was performed according to the manufacturer’sinstructions using FAM and VIC reporter dyes.TaqMan� probes and primers were developed byApplied Biosystems by design (AbD). PCR conditionsare described in the Supplementary Materials. Genetargets for the different species, sequences of gene-specific primers, SNPs, probe sequences, correspondingfluorochromes (dyes) and the lengths of amplifiedtarget DNA in base pairs are shown in SupplementaryMaterial Table 3.
Fluorescent measurements, data analysis and com-puter analysis for the TaqMan� assay were performedusing the same methods as described earlier for theAmplifluor� technology.
Results
Comparison of accuracy and repeatability of massspectrometry (GOOD Assay), Amplifluor� andTaqMan� methods
For the direct comparison of the three methods, thegenes csr1-1 and axr1-3 were used since Amplifluor�failed to give results for the IXR1 gene. For the threeSNPs studied by the three different methods, the cor-rect genotypes were confirmed using 16 previouslysequenced DNA controls. In every case, each 384-wellplate was genotyped twice to determine the repeat-ability of the technology. For each method, we esti-mated the percentage of data points that weresuccessful, discordant (different genotypes for the sameDNA) or indeterminate (absence of results). The results T
able
1Comparisonofthepercentageofsuccessfuldata
pointrate
ofthethreetechniques
Technology
Mass
spectrometry
Amplifluor�
TaqMan
�
Gene
Successful
(%)
Indeterminate
(%)
Discordant
(%)
Successful
(%)
Indeterminate
(%)
Discordant
(%)
Successful
(%)
Indeterminate
(%)
Discordant
(%)
CSR
(Arabidopsisthaliana)
94.3
2.6
3.1
96.1
3.9
097
2.5
0.5
AXR
(A.thaliana)
82
18
097.4
2.6
0100
00
IXR
(A.thaliana)
94.3
5.7
00(nonspecific)
––
99.7
0.3
0
1117
for the three SNPs as determined by the three differentmethods are summarized in Table 1.
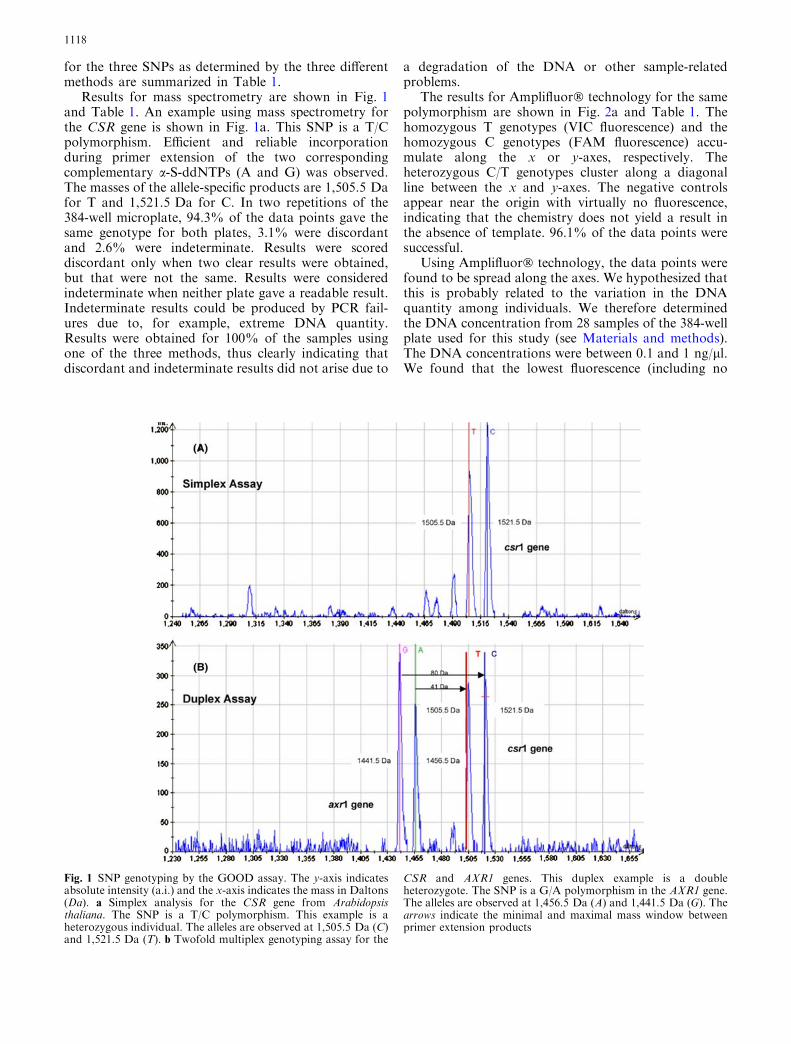
Results for mass spectrometry are shown in Fig. 1and Table 1. An example using mass spectrometry forthe CSR gene is shown in Fig. 1a. This SNP is a T/Cpolymorphism. Efficient and reliable incorporationduring primer extension of the two correspondingcomplementary a-S-ddNTPs (A and G) was observed.The masses of the allele-specific products are 1,505.5 Dafor T and 1,521.5 Da for C. In two repetitions of the384-well microplate, 94.3% of the data points gave thesame genotype for both plates, 3.1% were discordantand 2.6% were indeterminate. Results were scoreddiscordant only when two clear results were obtained,but that were not the same. Results were consideredindeterminate when neither plate gave a readable result.Indeterminate results could be produced by PCR fail-ures due to, for example, extreme DNA quantity.Results were obtained for 100% of the samples usingone of the three methods, thus clearly indicating thatdiscordant and indeterminate results did not arise due to
a degradation of the DNA or other sample-relatedproblems.
The results for Amplifluor� technology for the samepolymorphism are shown in Fig. 2a and Table 1. Thehomozygous T genotypes (VIC fluorescence) and thehomozygous C genotypes (FAM fluorescence) accu-mulate along the x or y-axes, respectively. Theheterozygous C/T genotypes cluster along a diagonalline between the x and y-axes. The negative controlsappear near the origin with virtually no fluorescence,indicating that the chemistry does not yield a result inthe absence of template. 96.1% of the data points weresuccessful.
Using Amplifluor� technology, the data points werefound to be spread along the axes. We hypothesized thatthis is probably related to the variation in the DNAquantity among individuals. We therefore determinedthe DNA concentration from 28 samples of the 384-wellplate used for this study (see Materials and methods).The DNA concentrations were between 0.1 and 1 ng/ll.We found that the lowest fluorescence (including no
Fig. 1 SNP genotyping by the GOOD assay. The y-axis indicatesabsolute intensity (a.i.) and the x-axis indicates the mass in Daltons(Da). a Simplex analysis for the CSR gene from Arabidopsisthaliana. The SNP is a T/C polymorphism. This example is aheterozygous individual. The alleles are observed at 1,505.5 Da (C)and 1,521.5 Da (T). b Twofold multiplex genotyping assay for the
CSR and AXR1 genes. This duplex example is a doubleheterozygote. The SNP is a G/A polymorphism in the AXR1 gene.The alleles are observed at 1,456.5 Da (A) and 1,441.5 Da (G). Thearrows indicate the minimal and maximal mass window betweenprimer extension products
1118
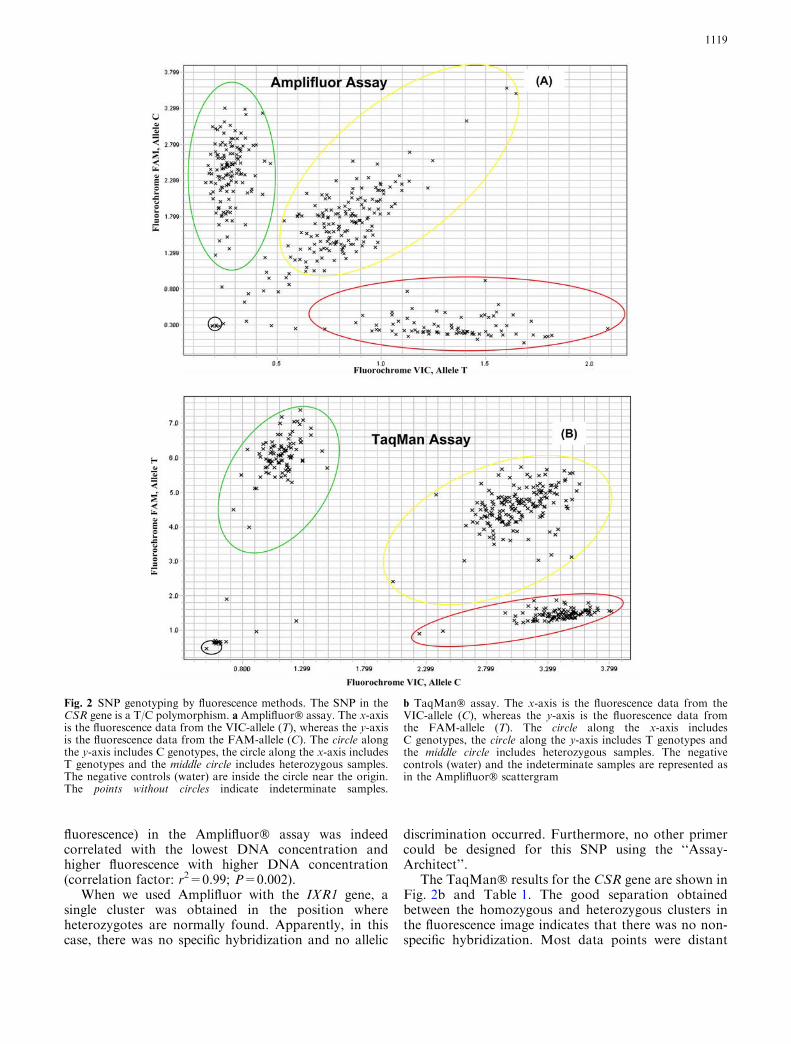
fluorescence) in the Amplifluor� assay was indeedcorrelated with the lowest DNA concentration andhigher fluorescence with higher DNA concentration(correlation factor: r2=0.99; P=0.002).
When we used Amplifluor with the IXR1 gene, asingle cluster was obtained in the position whereheterozygotes are normally found. Apparently, in thiscase, there was no specific hybridization and no allelic
discrimination occurred. Furthermore, no other primercould be designed for this SNP using the ‘‘Assay-Architect’’.
The TaqMan� results for the CSR gene are shown inFig. 2b and Table 1. The good separation obtainedbetween the homozygous and heterozygous clusters inthe fluorescence image indicates that there was no non-specific hybridization. Most data points were distant
Fig. 2 SNP genotyping by fluorescence methods. The SNP in theCSR gene is a T/C polymorphism. a Amplifluor� assay. The x-axisis the fluorescence data from the VIC-allele (T), whereas the y-axisis the fluorescence data from the FAM-allele (C). The circle alongthe y-axis includes C genotypes, the circle along the x-axis includesT genotypes and the middle circle includes heterozygous samples.The negative controls (water) are inside the circle near the origin.The points without circles indicate indeterminate samples.
b TaqMan� assay. The x-axis is the fluorescence data from theVIC-allele (C), whereas the y-axis is the fluorescence data fromthe FAM-allele (T). The circle along the x-axis includesC genotypes, the circle along the y-axis includes T genotypes andthe middle circle includes heterozygous samples. The negativecontrols (water) and the indeterminate samples are represented asin the Amplifluor� scattergram
1119
from the negative controls. These results were thus lesssensitive than Amplifluor� to the variation in DNAquantity among individuals, which could indicate ahigher yield in the PCR reaction using the TaqMan�technology. A low level of discordance was obtainedwith the CSR gene using TaqMan�; the reason for thisis unclear and no homologous sequences were detectedin the Arabidopsis genome.
Using Amplifluor� and TaqMan�, the overallsuccess rate was over 90% in nearly all cases. To achievea similar level of success with mass spectrometry, boththe normal and the reorganized plates are required. Thisis because each single plate only gave between 70 and80% successful data. In general, a low percentage ofdiscordance (<0.5%) was found for each of the threemethods. The only exception was the CSR gene analyzedby mass spectrometry. As discussed above, we eliminatedthe possibility that this was due to problems of the DNAsamples. For mass spectrometry, the discordant resultsmight be partly explained by contamination due to thenumerous successive robot movements. Although thevolume of the reaction is small, similar results wereobtained when the reactions were scaled up, thus sug-gesting that the reaction volume is not a critical factor.
Duplex analysis by mass spectrometry
Duplex PCR and primer extension reactions were per-formed for mass spectrometry. In the duplex PCR pro-tocol, two loci from A. thaliana, AXR1 and CSR, wereamplified simultaneously. Gene-specific PCR primerswere developed to produce different length fragments(AXR1: 500 bp and CSR: 860 bp, see SupplementaryMaterial Table 1) under the same PCR conditions thusallowing the visualization of the PCR products in anagarose gel. The primer extension products were alsodesigned to be of sufficiently different masses to distin-guish each product from the others and the undigestedprimer. Four a-S-ddNTPs were included in the primerextension reaction to detect all alleles of the two SNPsstudied. Figure 1b shows a heterozygote for AXR1(allele G: 1,441.5 Da and allele A: 1,456.5 Da) and forCSR (allele T: 1,505.5 Da and allele C: 1,521.5 Da).
Application to other plant SNPs
In addition to the comparison described earlier, in thecourse of a number of research projects, we have geno-typed a large number of other SNPs in Arabidopsis aswell as in other diploid or polyploid plants. Initially, theonly technology available was the GOOD assay, thusexplaining the large number of results obtained with thistechnology. Subsequently, as Amplifluor and TaqManbecame available, we were able to repeat some experi-ments which were not successful with the GOOD assay.
Further validation of our results was obtained bycomparing the three technologies for a set of markers in
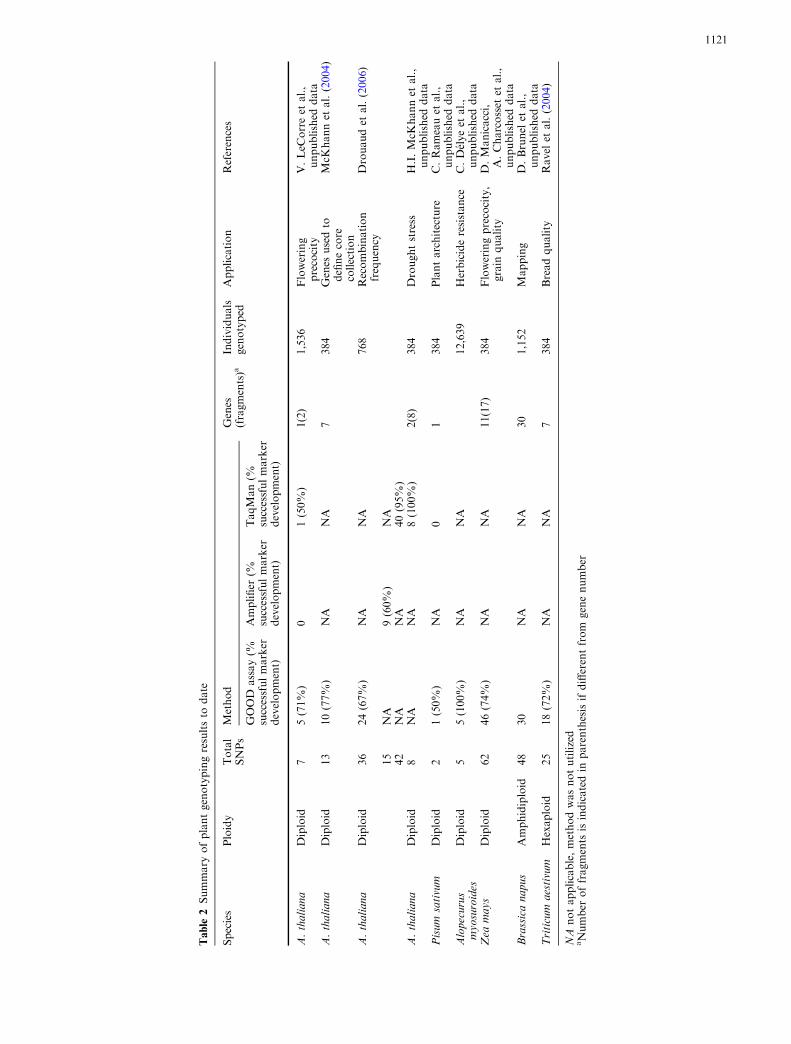
A. thaliana (used for estimating recombination fre-quency, see Table 2). For the GOOD assay, 24 of 36(67%) markers were successfully developed with anaverage of 92% successful data points (maximum98.4%, minimum 81.7%). For Amplifluor, 9 of 15(60%) markers were successfully developed with anaverage of 96.5% successful data points (maximum97.7%, minimum 95.2%). For TaqMan, 40 of 42 (95%)markers were successfully developed with an average of97.3% successful data points (maximum 99.7%, mini-mum 89.8%). Currently, TaqMan is used as a firstchoice. These results are summarized in Table 2.
Polyploid species analysis by mass spectrometry
Plants present particular genotyping challenges becausea large percentage of plants are polyploid. The first stepbefore sequencing or genotyping thus is to define ‘‘geneand genome-specific’’ primers.
Rapeseed (Brassica napus) is considered to be theresult of the addition of two parental diploid genomes:B. oleracea and B. rapa. Accordingly, two or morehomeologous genes are found in rapeseed (Brunel et al.1999). Here, we present the example of the ADH_2 genewhich was genotyped by mass spectrometry. In this case,the SNP is an A/C polymorphism (allele A: 1,465.5 Daand allele C: 1,441.5 Da). The correct analysis of geno-types was confirmed using eight previously sequencedDNA controls. Ninety-nine percent successful resultswere obtained when the normal and reorganized plateswere analyzed and the remaining 1% were indeterminateresults. Indeterminate results were the same in bothplates, suggesting possible DNA degradation. In ourlaboratory, additional SNPs from rapeseed and wheatgenes were successfully analyzed using the GOOD assay(see Table 2).
Discussion
At the Centre National de Genotypage (Evry, France) anumber of high-throughput genotyping technologies areused, primarily for the exploration of the genetic basesof human disease. These include the GOOD assay,pyrosequencing, Amplifluor�, TaqMan�, SNPlex�,Illumina� and Affymetrix�. For the purpose of geno-typing plant samples, we required a reliable, relativelyrapid method for medium-throughput genotyping.
We have compared three different genotypingtechnologies for use in medium- to high-throughputapplications in plants. Our cumulative results demon-strate that all three technologies, mass spectrometryusing the GOOD assay, Amplifluor� and TaqMan�,were successful in discriminating alleles. AlthoughTaqMan� gave the best results under our laboratoryconditions, several factors must be considered inassessing which method to use for a given application(Table 3).
1120
Table
2Summary
ofplantgenotypingresultsto
date
Species
Ploidy
Total
SNPs
Method
Genes
(fragments)a
Individuals
genotyped
Application
References
GOOD
assay(%
successfulmarker
development)
Amplifier
(%successfulmarker
development)
TaqMan(%
successfulmarker
development)
A.thaliana
Diploid
75(71%
)0
1(50%)
1(2)
1,536
Flowering
precocity
V.LeC
orreet
al.,
unpublished
data
A.thaliana
Diploid
13
10(77%
)NA
NA
7384
Genes
usedto
definecore
collection
McK
hannet
al.(2004)
A.thaliana
Diploid
36
24(67%
)NA
NA
768
Recombination
frequency
Drouaudet
al.(2006)
15
NA
9(60%
)NA
42
NA
NA
40(95%
)A.thaliana
Diploid
8NA
NA
8(100%
)2(8)
384
Droughtstress
H.I.McK
hannet
al.,
unpublished
data
Pisum
sativum
Diploid
21(50%
)NA
01
384
Plantarchitecture
C.Rameauet
al.,
unpublished
data
Alopecurus
myosuroides
Diploid
55(100%
)NA
NA
12,639
Herbicideresistance
C.Delyeet
al.,
unpublished
data
Zea
mays
Diploid
62
46(74%
)NA
NA
11(17)
384
Floweringprecocity,
grain
quality
D.Manicacci,
A.Charcosset
etal.,
unpublished
data
Brassicanapus
Amphidiploid
48
30
NA
NA
30
1,152
Mapping
D.Brunel
etal.,
unpublished
data
Triticum
aestivum
Hexaploid
25
18(72%
)NA
NA
7384
Breadquality
Ravel
etal.(2004)
NA
notapplicable,methodwasnotutilized
aNumber
offragments
isindicatedin
parenthesisifdifferentfrom
genenumber
1121
The GOOD assay
Considering the accuracy of the three methods, massspectrometry offers a clear advantage in that the sepa-ration of alleles based on the molecular weight of theprimer extension product is unambiguous. The GOODassay also offers flexibility in primer design as well as thecapacity for multiplexing. For the GOOD assay, theexperimenter designs his own primers. It is possible todesign primers when there are adjacent SNPs with thecaveat that the four nucleotides upstream of the SNPmust be devoid of SNPs. Another advantage of thistechnology is that a wide range of PCR fragment sizescan be used, from about 100 bp up to 1.2 kb (unpub-lished data). This is useful for polyploid species whereone wishes to separate homeologous genes. Whendesigning primers, the masses of the primer extensionproducts can be selected so that different products aredistinguished in multiplex reactions, and eventualproblems can be diagnosed, for example, poor phos-phodiesterase digestion or alkylation. Furthermore, it ispossible to modify the number of phosphorothioates orthe charge tag in order to better distinguish betweenalleles in the case of multiplex reactions. The GOODassay also provides the possibility for multiplexing. Wehave shown here an example of a successful duplexreaction and our results indicate that multiplex geno-typing of more loci, previously described in humans(Ross et al. 1998) is extendable to plants.
Another advantage of the GOOD assay is the soft-ware available to analyze the results. For the massspectrometer, the manufacturer provides a programcalled Genotools Manager which allows the assignmentof genotypes and performs a quality control. It does notallow the correction of genotypes or the comparison ofseveral runs. To overcome this limitation, a programwas developed for internal use at the Centre National deGenotypage, called SNPMaster, which allows for theanalysis of quality control and the genotype. This pro-gram is more flexible in that several plates can be com-pared automatically and consensus results can beexported.
The GOOD assay does suffer a number of seriousdrawbacks however. It necessitates the analysis of rep-licates and there is a higher percentage of discordant andmissing data points (especially for the CSR gene). TheGOOD assay involves a large number of steps: PCR,shrimp alkaline phosphatase, primer extension, phos-phodiesterase and finally alkylation. Lower success rates
may be because this method requires successive reagentadditions that make it more vulnerable to pipettingerrors and contamination.
Another critical point is the deposition of the matrixon the plate. The extremely high percentage of indeter-minate results sometimes obtained with mass spec-trometry (18% in the case of the AXR1 gene) couldindicate a problem with the matrix. It is very difficult tocontrol the uniformity of the matrix from one lot to thenext. It is likely that small variations in the matrix maygive rise to indeterminate results.
Amplifluor� and TaqMan�
Our results here indicate that for both TaqMan� andAmplifluor�, the sample success rate in general is veryhigh (Table 1). Further, the repeatability is high, thusanalysis of a single plate suffices. The percentage ofindeterminate results was low with both TaqMan� andAmplifluor�.
After an assay has been established, an importantfactor for medium- or high-throughput production is thetime and the number of steps required to successfullygenotype a given number of samples. For both Ampli-fluor� and TaqMan�, a single PCR step is necessary,largely eliminating the possibility of errors. Problems ofcontamination are small since wells are sealed after theaddition of reagents and are never opened again. Thesemethods are more robust, thus there is no longer a needto use a ‘‘normal’’ and ‘‘reorganized’’ plate. Thus, thefluorescent technologies are able to give faster results.On the other hand, multiplexing is not possible withthese techniques. We have also assessed the quality andquantity of DNA that is required to give successfulresults with the three methods. We did remark thatAmplifluor� seems to be more sensitive to low quanti-ties of DNA. Discordant and indeterminate results usingthe GOOD assay may also be due in part to low DNAquantity.
In both fluorescent techniques, allelic discriminationdepends on hybridization in which a single base varies;and in certain cases, nonspecific hybridization meansthat some data points cannot be assigned with certainty.An extreme example of this was seen using Amplifluor�with the IXR1 gene for which no individual could beassigned a genotype. While it is true that in certaincases, another primer couple could yield the expectedresults, constraints in primer design, particularly for
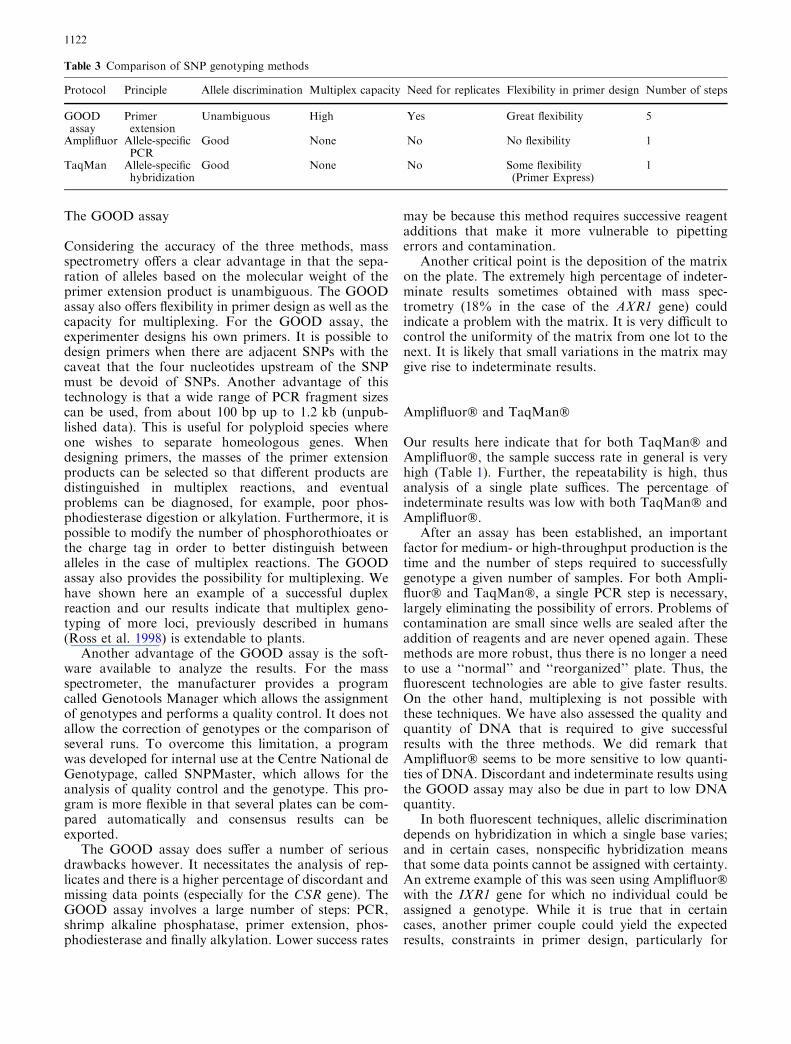
Table 3 Comparison of SNP genotyping methods
Protocol Principle Allele discrimination Multiplex capacity Need for replicates Flexibility in primer design Number of steps
GOODassay
Primerextension
Unambiguous High Yes Great flexibility 5
Amplifluor Allele-specificPCR
Good None No No flexibility 1
TaqMan Allele-specifichybridization
Good None No Some flexibility(Primer Express)
1
1122
Amplifluor� and TaqMan�, sometimes preclude thispossibility (as was the case for the ixr1-2 SNP).
Concerning primer design, the fluorescent technolo-gies are less flexible than the GOOD assay. Amplifluor�technology requires submitting the sequence with thepolymorphism to genotype to a web site, which thenprovides appropriate primers when possible. There canbe no adjacent polymorphisms in the region to which theprimer hybridizes (±20 bases). We have remarked thatcertain primers chosen using the ‘‘AssayArchitect’’software may be flawed due to the presence of excessivesecondary structure. For TaqMan�, probes and primersare developed by Applied Biosystems by design, but withthe constraint that there are no adjacent polymorphismswithin two nucleotides of the SNP to be genotyped. Asecond possibility exists for TaqMan� which is a pro-gram called PrimerExpress (Applied Biosystems). Usingthis software, it is possible to design one’s own primers,thus allowing slightly more flexibility and in particularfor developing probes and primers that are gene andgenome specific, thus theoretically allowing genotypingof polyploid species. It is also possible to design primersthat include a second SNP or that give a larger PCRproduct than is specified using Primer Express (ourunpublished results). For the two fluorescent methods,fragment length is restricted to 150 bp or less when usingthe primer design software AssayArchitect or AppliedBiosystems by design. This constraint could limit theirapplicability to polyploid species. For these two tech-niques, it is critical to perform a BLAST with the regionadjacent to the SNP to ensure there are no homologoussequences (or homeologous, in the case of polyploids)since these methods depend on specific hybridization todiscriminate the alleles.
For Amplifluor� and TaqMan�, there is an analysisprogram that comes with the ABI Prism 7900HT. Thisprogram is able to analyze one plate at a time, and theresults can be exported to an Excel file. However, the
comparison between plates must be done by hand, usingcopy and paste functions. It is possible to perform theanalysis either automatically or manually, thus offeringflexibility. For both methods, data analysis is performedby clustering, thus a genotype is only called in the con-text of the other results. For mass spectrometry, indi-vidual samples are called independently of other results.
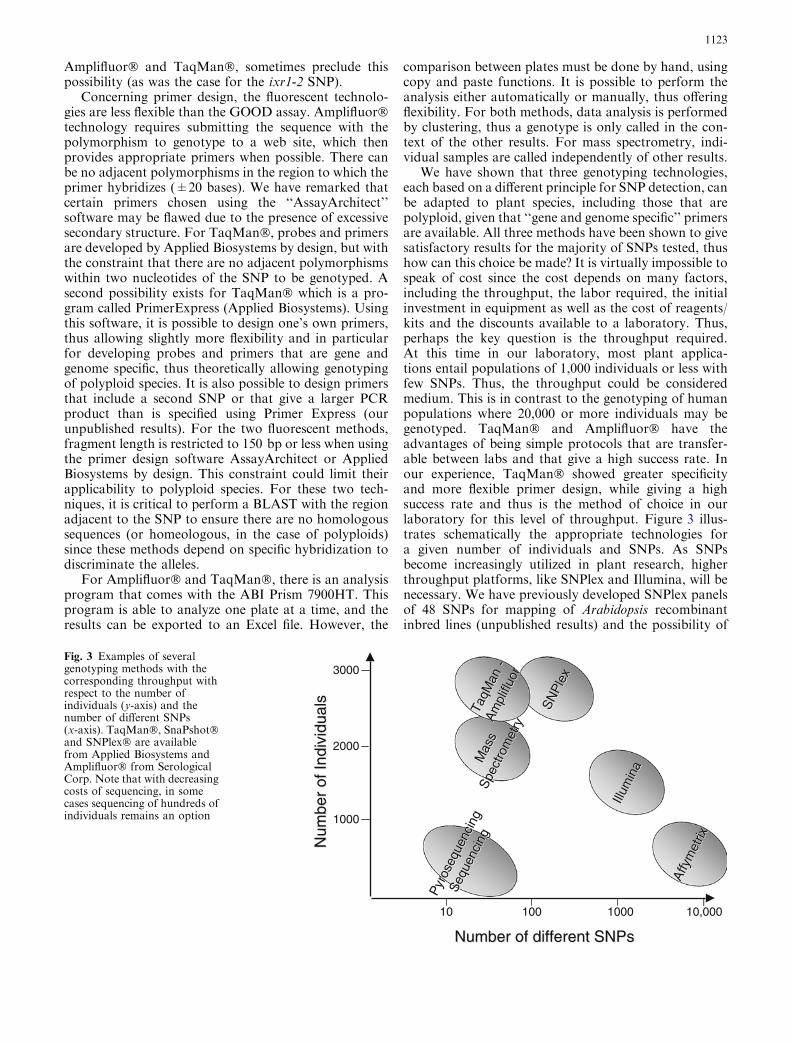
We have shown that three genotyping technologies,each based on a different principle for SNP detection, canbe adapted to plant species, including those that arepolyploid, given that ‘‘gene and genome specific’’ primersare available. All three methods have been shown to givesatisfactory results for the majority of SNPs tested, thushow can this choice be made? It is virtually impossible tospeak of cost since the cost depends on many factors,including the throughput, the labor required, the initialinvestment in equipment as well as the cost of reagents/kits and the discounts available to a laboratory. Thus,perhaps the key question is the throughput required.At this time in our laboratory, most plant applica-tions entail populations of 1,000 individuals or less withfew SNPs. Thus, the throughput could be consideredmedium. This is in contrast to the genotyping of humanpopulations where 20,000 or more individuals may begenotyped. TaqMan� and Amplifluor� have theadvantages of being simple protocols that are transfer-able between labs and that give a high success rate. Inour experience, TaqMan� showed greater specificityand more flexible primer design, while giving a highsuccess rate and thus is the method of choice in ourlaboratory for this level of throughput. Figure 3 illus-trates schematically the appropriate technologies fora given number of individuals and SNPs. As SNPsbecome increasingly utilized in plant research, higherthroughput platforms, like SNPlex and Illumina, will benecessary. We have previously developed SNPlex panelsof 48 SNPs for mapping of Arabidopsis recombinantinbred lines (unpublished results) and the possibility of
SN
Ple
xS
NP
lex
Mas m
sM
ass
Spe
ctro
etry
Spe
ctro
met
ry
Number of different Number of different SNPsSNPs
Num
ber
of In
divi
dual
sN
umbe
r of
Indi
vidu
als
Illum
ina
Illum
ina
10 100 1000 10,000
Pyr
oseq
uen
cin
cing
Pyr
oseq
uenc
ing
Seq
uen
g
Seq
uenc
ing
TaqM
aflu
on
TaqM
an--
Am
pli
r
Am
plifl
uor3000
2000
Affy
met
rix
Affy
met
rix
1000
Fig. 3 Examples of severalgenotyping methods with thecorresponding throughput withrespect to the number ofindividuals (y-axis) and thenumber of different SNPs(x-axis). TaqMan�, SnaPshot�and SNPlex� are availablefrom Applied Biosystems andAmplifluor� from SerologicalCorp. Note that with decreasingcosts of sequencing, in somecases sequencing of hundreds ofindividuals remains an option
1123
using Illumina for panels of 384–1,536 SNPs is becomingincreasingly desirable to study genome-wide geneticvariation in a given species.
Acknowledgements We thank the Mark Lathrop and the membersof the Technology Development group of Ivo G. Gut at the CentreNational de Genotypage: D. Lechner, C. Besse, F. Boussicault,D. Derbala, J-G. Garnier, F. Mauger, J-A. Perrier, C. Plancon andV. Sourice. We also thank the Informatics group: N. Wiart andF. Dos-Santos. We thank Christine Mezard for providing data onsuccess rates. Part of this study was supported by a grant toFR from Bayer Crop Sciences. Genotyping has been financed byAIP-INRA ‘‘Sequencage vegetal et post-sequencage’’ as well as byINRA SPE projects.
References
Bengra C, Mifflin TE, Khripin Y, Manunta P, Williams SM, JosePA, Felder RA (2002) Genotyping of essential hypertensionsingle-nucleotide polymorphisms by a homogeneous PCRmethod with universal energy transfer primers. Clin Chem48:2131–2140
Bourguet D, Guillemaud T, Chevillon C, Raymond M (2004)Fitness costs of insecticide resistance in natural breeding sites ofthe mosquito Culex pipiens. Evolution 58:128–135
Brunel D, Froger N, Pelletier G (1999) Development of amplifiedconsensus genetic markers (ACGM) in Brassica napus fromArabidopsis thaliana sequences of known biological function.Genome 42:387–402
Doyle JJ, Doyle JL (1990) Isolation of plant DNA from freshtissue. Focus 12:13–15
Drouaud J, Camilleri C, Bourguignon P-Y, Canaguier A, BerardA, Vezon D, Giancola S, Brunel D, Colot V, Prum B,Quesneville H, Mezard C (2006) Variation in crossing over ratesacross the chromosome 4 of Arabidopsis thaliana: evidence forthe presence of meiotic recombination ‘‘hot spots’’. GenomeRes (in press)
Fourmann M, Barret P, Froger N, Baron C, Charlot F, DelourmeR, Brunel D (2002) From Arabidopsis thaliana to Brassicanapus: development of amplified consensus genetic markers(ACGM) for construction of a gene map. Theor Appl Genet105:1196–1206
Gut IG (2004) An overview of genotyping and single nucleotidepolymorphisms (SNP). In: Rapley R, Harbron S (eds) Molec-ular analysis and genome discovery. Wiley, Chichester, pp 43–64
Haughn GW, Smith J, Mazur B, Somerville C (1988) Transfor-mation with a mutant Arabidopsis acetolactate synthase generenders tobacco resistant to sulfonylurea herbicides. Mol GenGenet 211:266–271
Leyser HM, Lincoln CA, Timpte C, Lammer D, Turner J, EstelleM (1993) Arabidopsis auxin-resistance gene AXR1 encodes aprotein related to ubiquitin-activating enzyme E1. Nature364:161–164
Livak KJ (1999) Allelic discrimination using fluorogenic probesand the 5¢ nuclease assay. Genet Anal 14:143–149
McKhann HI, Camilleri C, Berard A, Bataillon T, David JL,Reboud X, Le Corre V, Caloustian C, Gut IG, Brunel D(2004) Nested core collections maximizing genetic diversity inArabidopsis thaliana. Plant J 38:193–202
Myakishev MV, Khripin Y, Hu S, Hamer DH (2001)High-throughput SNP genotyping by allele-specific PCRwith universal energy-transfer-labeled primers. Genome Res11:163–169
Pusch W, Kraeuter KO, Froehlich T, Stalgies Y, Kostrzewa M(2001) Genotools SNP manager: a new software for automatedhigh-throughput MALDI-TOF mass spectrometry SNP geno-typing. Biotechniques 30:210–215
Ravel C, Praud S, Canaguier A, Dufour P, Giancola S, BalfourierF, Chalhoub B, Brunel D, Linossier L, Dardevet M, Beckert M,Rousset M, Murigneux A, Charmet G (2004) DNAsequence polymorphism and their application in bread wheat.In: Vollmann J, Grausgruber H, Ruckenbauer P (eds)Genetic variation for plant breeding. Eucarpia: Tulln, Austria,pp 177–181
Ross P, Hall L, Smirnov I, Haff L (1998) High level multiplexgenotyping by MALDI-TOF mass spectrometry. Nat Biotech-nol 16:1347–1351
Roux F, Gasquez J, Reboud X (2004) The dominance of the her-bicide resistance cost in several Arabidopsis thaliana mutantlines. Genetics 166:449–460
Roux F, Giancola S, Durand S, Reboud X (2005) Building anexperimental cline with Arabidopsis thaliana to estimate herbi-cide fitness cost. Genetics (in press)
Rychlik W, Spencer WJ, Rhoads RE (1990) Optimization of theannealing temperature for DNA amplification in vitro. NucleicAcids Res 18:6409–6412
Saini HS, Shefferd M, Henry RJ (1999) Microwave extraction oftotal genomic DNA from barley grains for use in PCR. J InstBrew 105:185–190
Sauer S, Lechner D, Berlin K, Plancon C, Heuermann A, LehrachH, Gut IG (2000) Full flexibility genotyping of single nucleotidepolymorphisms by the GOOD assay. Nucleic Acids Res 28:E100
Scheible WR, Eshed R, Richmond T, Delmer D, Somerville C(2001) Modifications of cellulose synthase confer resistance toisoxaben and thiazolidinone herbicides in Arabidopsis Ixr1mutants. Proc Natl Acad Sci USA 98:10079–10084
Schmid KJ, Sorensen TR, Stracke R, Torjek O, Altmann T,Mitchell-Olds T, Weisshaar B (2003) Large-scale identificationand analysis of genome-wide single-nucleotide polymorphismsfor mapping in Arabidopsis thaliana. Genome Res 13:1250–1257
Tenaillon MI, Sawkins MC, Long AD, Gaut RL, Doebley JF,Gaut BS (2001) Patterns of DNA sequence polymorphismalong chromosome 1 of maize (Zea mays ssp. mays L.). ProcNatl Acad Sci USA 98:9161–9166
Tost J, Gut IG (2002) Genotyping single nucleotide polymorphismsby mass spectrometry. Mass Spectrom Rev 21:388–418
Zhu YL, Song QJ, Hyten DL, Van Tassell CP, Matukumalli LK,Grimm DR, Hyatt SM, Fickus EW, Young ND, Cregan PB(2003) Single-nucleotide polymorphisms in soybean. Genetics163:1123–1134
1124