High Resolution Genetic Mapping by Genome Sequencing Reveals Genome Duplication and Tetraploid...
11
High Resolution Genetic Mapping by Genome Sequencing Reveals Genome Duplication and Tetraploid Genetic Structure of the Diploid Miscanthus sinensis Xue-Feng Ma 1 , Elaine Jensen 2 , Nickolai Alexandrov 1 , Maxim Troukhan 1 , Liping Zhang 1 , Sian Thomas- Jones 2 , Kerrie Farrar 2 , John Clifton-Brown 2 , Iain Donnison 2 , Timothy Swaller 1 *, Richard Flavell 1 1 Ceres, Inc., Thousand Oaks, California, United States of America, 2 Institute of Biological, Environmental & Rural Sciences (IBERS), Aberystwyth University, Gogerddan, United Kingdom Abstract We have created a high-resolution linkage map of Miscanthus sinensis, using genotyping-by-sequencing (GBS), identifying all 19 linkage groups for the first time. The result is technically significant since Miscanthus has a very large and highly heterozygous genome, but has no or limited genomics information to date. The composite linkage map containing markers from both parental linkage maps is composed of 3,745 SNP markers spanning 2,396 cM on 19 linkage groups with a 0.64 cM average resolution. Comparative genomics analyses of the M. sinensis composite linkage map to the genomes of sorghum, maize, rice, and Brachypodium distachyon indicate that sorghum has the closest syntenic relationship to Miscanthus compared to other species. The comparative results revealed that each pair of the 19 M. sinensis linkages aligned to one sorghum chromosome, except for LG8, which mapped to two sorghum chromosomes (4 and 7), presumably due to a chromosome fusion event after genome duplication. The data also revealed several other chromosome rearrangements relative to sorghum, including two telomere-centromere inversions of the sorghum syntenic chromosome 7 in LG8 of M. sinensis and two paracentric inversions of sorghum syntenic chromosome 4 in LG7 and LG8 of M. sinensis. The results clearly demonstrate, for the first time, that the diploid M. sinensis is tetraploid origin consisting of two sub-genomes. This complete and high resolution composite linkage map will not only serve as a useful resource for novel QTL discoveries, but also enable informed deployment of the wealth of existing genomics resources of other species to the improvement of Miscanthus as a high biomass energy crop. In addition, it has utility as a reference for genome sequence assembly for the forthcoming whole genome sequencing of the Miscanthus genus. Citation: Ma X-F, Jensen E, Alexandrov N, Troukhan M, Zhang L, et al. (2012) High Resolution Genetic Mapping by Genome Sequencing Reveals Genome Duplication and Tetraploid Genetic Structure of the Diploid Miscanthus sinensis. PLoS ONE 7(3): e33821. doi:10.1371/journal.pone.0033821 Editor: Samuel P. Hazen, University of Massachusetts Amherst, United States of America Received December 22, 2011; Accepted February 17, 2012; Published March 16, 2012 Copyright: ß 2012 Ma et al. This is an open-access article distributed under the terms of the Creative Commons Attribution License, which permits unrestricted use, distribution, and reproduction in any medium, provided the original author and source are credited. Funding: The work reported in this study was performed under the ‘‘BBSRC Sustainable Bioenergy Centre (BSBEC): Bioenergy from Miscanthus and Salix Species’’ program (BSBEC-BioMASS; http://www.bsbec-biomass.org.uk/; Grant BB/G016216/1). Aberystwyth University also wish to acknowledge BBSRC for funding from the ‘‘Optimizing the development of the energy grass Miscanthus through manipulation of flowering time’’ (BB/E014933/2) and ‘‘Molecular Genetics of Miscanthus’’ (BBS/E/W/00003134A) grants. The funders had no role in study design, data collection and analysis, decision to publish, or preparation of the manuscript. Aberystwyth University designed the experiment and managed plant and field activities while Ceres, Inc. performed the genotyping and analysis which generated the map and comparative genomics as an in-kind contribution to the current study. Competing Interests: The authors, Xue-Feng Ma, Nickolai Alexandrov, Maxim Troukhan, Liping Zhang, Timothy Swaller, and Richard Flavell are employees of Ceres, Inc., a privately held company. The work of Ceres, Inc. described in this study was provided as an in-kind contribution to the ‘‘BBSRC Sustainable Bioenergy Centre (BSBEC): Bioenergy from Miscanthus and Salix Species’’ program (BSBEC-BioMASS; http://www.bsbec-biomass.org.uk/; Grant BB/G016216/1). This does not alter the authors’ adherence to all the PLoS ONE policies on sharing data and materials. * E-mail: [email protected] Introduction The ability to sequence whole genomes has advanced the means of detecting genetic variation genome wide. However, for large genomes that are exceptionally difficult to unambiguously assemble, genetic maps are still needed for genetic studies and plant breeding. Recently, several studies have used genotype-by- sequencing (GBS) to develop genetic maps, but usually on smaller and/or better understood genomes [1–4]. In this work we sought to create a high density genetic map of the large and unknown genome of Miscanthus sinensis using next generation sequencing (NGS) of a large number of heterozygous recombinants to open up the genetic mapping of the species and to support breeding studies. Miscanthus is one of the leading biofuel crops with growing importance [5]. The genus Miscanthus Anderss. (Andropogoninae: Poaceae) consists of many rhizomatous perennial species, most of which are endemic to subtropical and tropical regions of southern Asia, with a few species extending to temperate eastern Asia [6–8]. This extensive distribution provides a wealth of genetic diversity and traits for Miscanthus improvement programs. Species showing the greatest potential as dedicated energy crops include M. floridulus, M. lutarioriparium, M. sacchariflorus, M. sinensis and M. 6 giganteus, among which, M. 6 giganteus is currently the most cultivated species for biomass production in Europe [9–10]. However, M. 6 giganteus is not an ideal candidate for genetic studies and breeding improvement due to its sterility and triploid genome (2n = 3x = 57) resulting from a rare natural cross between diploid M. sinensis (2n = 2x = 38) and allotetraploid M. sacchariflorus (2n = 4x = 76) [11–14]. Since one of the two genomes of the tetraploid M. sacchariflorus was inherited from the diploid M. PLoS ONE | www.plosone.org 1 March 2012 | Volume 7 | Issue 3 | e33821
Transcript of High Resolution Genetic Mapping by Genome Sequencing Reveals Genome Duplication and Tetraploid...

High Resolution Genetic Mapping by GenomeSequencing Reveals Genome Duplication and TetraploidGenetic Structure of the Diploid Miscanthus sinensisXue-Feng Ma1, Elaine Jensen2, Nickolai Alexandrov1, Maxim Troukhan1, Liping Zhang1, Sian Thomas-
Jones2, Kerrie Farrar2, John Clifton-Brown2, Iain Donnison2, Timothy Swaller1*, Richard Flavell1
1 Ceres, Inc., Thousand Oaks, California, United States of America, 2 Institute of Biological, Environmental & Rural Sciences (IBERS), Aberystwyth University, Gogerddan,
United Kingdom
Abstract
We have created a high-resolution linkage map of Miscanthus sinensis, using genotyping-by-sequencing (GBS), identifyingall 19 linkage groups for the first time. The result is technically significant since Miscanthus has a very large and highlyheterozygous genome, but has no or limited genomics information to date. The composite linkage map containing markersfrom both parental linkage maps is composed of 3,745 SNP markers spanning 2,396 cM on 19 linkage groups with a0.64 cM average resolution. Comparative genomics analyses of the M. sinensis composite linkage map to the genomes ofsorghum, maize, rice, and Brachypodium distachyon indicate that sorghum has the closest syntenic relationship toMiscanthus compared to other species. The comparative results revealed that each pair of the 19 M. sinensis linkages alignedto one sorghum chromosome, except for LG8, which mapped to two sorghum chromosomes (4 and 7), presumably due to achromosome fusion event after genome duplication. The data also revealed several other chromosome rearrangementsrelative to sorghum, including two telomere-centromere inversions of the sorghum syntenic chromosome 7 in LG8 of M.sinensis and two paracentric inversions of sorghum syntenic chromosome 4 in LG7 and LG8 of M. sinensis. The results clearlydemonstrate, for the first time, that the diploid M. sinensis is tetraploid origin consisting of two sub-genomes. This completeand high resolution composite linkage map will not only serve as a useful resource for novel QTL discoveries, but alsoenable informed deployment of the wealth of existing genomics resources of other species to the improvement ofMiscanthus as a high biomass energy crop. In addition, it has utility as a reference for genome sequence assembly for theforthcoming whole genome sequencing of the Miscanthus genus.
Citation: Ma X-F, Jensen E, Alexandrov N, Troukhan M, Zhang L, et al. (2012) High Resolution Genetic Mapping by Genome Sequencing Reveals GenomeDuplication and Tetraploid Genetic Structure of the Diploid Miscanthus sinensis. PLoS ONE 7(3): e33821. doi:10.1371/journal.pone.0033821
Editor: Samuel P. Hazen, University of Massachusetts Amherst, United States of America
Received December 22, 2011; Accepted February 17, 2012; Published March 16, 2012
Copyright: � 2012 Ma et al. This is an open-access article distributed under the terms of the Creative Commons Attribution License, which permits unrestricteduse, distribution, and reproduction in any medium, provided the original author and source are credited.
Funding: The work reported in this study was performed under the ‘‘BBSRC Sustainable Bioenergy Centre (BSBEC): Bioenergy from Miscanthus and Salix Species’’program (BSBEC-BioMASS; http://www.bsbec-biomass.org.uk/; Grant BB/G016216/1). Aberystwyth University also wish to acknowledge BBSRC for funding fromthe ‘‘Optimizing the development of the energy grass Miscanthus through manipulation of flowering time’’ (BB/E014933/2) and ‘‘Molecular Genetics ofMiscanthus’’ (BBS/E/W/00003134A) grants. The funders had no role in study design, data collection and analysis, decision to publish, or preparation of themanuscript. Aberystwyth University designed the experiment and managed plant and field activities while Ceres, Inc. performed the genotyping and analysiswhich generated the map and comparative genomics as an in-kind contribution to the current study.
Competing Interests: The authors, Xue-Feng Ma, Nickolai Alexandrov, Maxim Troukhan, Liping Zhang, Timothy Swaller, and Richard Flavell are employees ofCeres, Inc., a privately held company. The work of Ceres, Inc. described in this study was provided as an in-kind contribution to the ‘‘BBSRC Sustainable BioenergyCentre (BSBEC): Bioenergy from Miscanthus and Salix Species’’ program (BSBEC-BioMASS; http://www.bsbec-biomass.org.uk/; Grant BB/G016216/1). This does notalter the authors’ adherence to all the PLoS ONE policies on sharing data and materials.
* E-mail: [email protected]
Introduction
The ability to sequence whole genomes has advanced the means
of detecting genetic variation genome wide. However, for large
genomes that are exceptionally difficult to unambiguously
assemble, genetic maps are still needed for genetic studies and
plant breeding. Recently, several studies have used genotype-by-
sequencing (GBS) to develop genetic maps, but usually on smaller
and/or better understood genomes [1–4]. In this work we sought
to create a high density genetic map of the large and unknown
genome of Miscanthus sinensis using next generation sequencing
(NGS) of a large number of heterozygous recombinants to open up
the genetic mapping of the species and to support breeding studies.
Miscanthus is one of the leading biofuel crops with growing
importance [5]. The genus Miscanthus Anderss. (Andropogoninae:
Poaceae) consists of many rhizomatous perennial species, most of
which are endemic to subtropical and tropical regions of southern
Asia, with a few species extending to temperate eastern Asia [6–8].
This extensive distribution provides a wealth of genetic diversity
and traits for Miscanthus improvement programs. Species showing
the greatest potential as dedicated energy crops include M.
floridulus, M. lutarioriparium, M. sacchariflorus, M. sinensis and
M.6giganteus, among which, M.6giganteus is currently the most
cultivated species for biomass production in Europe [9–10].
However, M.6giganteus is not an ideal candidate for genetic
studies and breeding improvement due to its sterility and triploid
genome (2n = 3x = 57) resulting from a rare natural cross between
diploid M. sinensis (2n = 2x = 38) and allotetraploid M. sacchariflorus
(2n = 4x = 76) [11–14]. Since one of the two genomes of the
tetraploid M. sacchariflorus was inherited from the diploid M.
PLoS ONE | www.plosone.org 1 March 2012 | Volume 7 | Issue 3 | e33821
sinensis, M.6giganteus has two genomes with high homology, and a
third genome with low homology to M. sinensis [11,12,15].
Although the two parental species have populations showing
substantial genetic diversity [6,16], only a few different clones of
M.6giganteus are available and have been widely cultivated through
vegetative propagation [6,17].
M. sinensis and M. sacchariflorus, on the other hand, have also
been introduced and adapted widely to Europe as potential
bioenergy species due to their high biomass potential [10]. These
two species are therefore crucial to enhancing the genetic
variability of Miscanthus crops and generating new high perfor-
mance hybrids [18]. Of the two parental species, M. sinensis has the
most widespread geographical distribution, in terms of latitude,
longitude and altitude, with correspondingly high adaptability
from extensive genetic and phenotypic diversity. It is also generally
diploid in nature, demonstrating greater amenability to hybrid-
ization. Recent studies have demonstrated the existence of
variation in flowering times in M. sinensis that provides extensive
options for hybrid generation and subsequent optimization of
varieties to different climatic zones [19].
Research for the majority of species within the Miscanthus genus is
focused mainly on field trials, positioning knowledge of its basic
biology behind that of current row crops. Little is known about the
genetics behind important agronomic traits that must be improved
for commercialization. Better understanding of the genetics of
biomass yield related traits such as spring emergence date, flowering
time control, senescence, nutrient uptake, and abiotic and biotic
stress tolerances, is needed to aid genetic improvement of the crop.
This in turn can be facilitated by a reference linkage map.
The small numbers of molecular studies on Miscanthus genomes
to-date have concentrated on defining phylogenies and taxono-
mies using limited genetic marker technologies [6–8,15,17].
Researchers are still in the early stages of developing marker tools
for Miscanthus for advanced genome studies [20–24]. The nuclear
size of M. sinensis is about 2.75 pg/1C or 2,650 Mbp, which is
approximately the same size as the maize (Zea mays L.) genome
(2,500 Mbp) [14,25]. The large and highly heterozygous genome
of Miscanthus has caused considerable difficulties in developing
genetic markers and linkage maps of the species. At present, there
is only one published linkage map for Miscanthus, in M. sinensis,
composed of 257 random amplified polymorphic DNA (RAPD)
markers spread over 28 linkage fragments with half of the linkage
fragments containing 2–4 markers only [26]. Although this
singular genetic map has been used for quantitative trait loci
(QTL) mapping of a number of combustion traits [27,28], the
discovered markers linked to the QTL are not easily used in
marker-assisted breeding as the linkage map was built with non-
sequence based RAPD markers. This lack of DNA sequence
information prohibits comparative genomics analyses among other
genome resources of well-studied crops, such as sorghum (Sorghum
bicolor L.), maize and rice (Oryza sativa L.).
It is known that a complete Miscanthus linkage map covering all
chromosomes is needed for a variety of genetic studies, such as
QTL and whole genome association mapping. A complete map
would also enable use of QTL accessible from other grass species
through alignment based on syntenic relationships. In this work,
we report the first complete, high resolution genetic map of M.
sinensis and use of comparative genomics to understand its syntenic
relationships with other species, particularly sorghum.
The linkage map was constructed based on several thousand
single nucleotide polymorphism (SNP) markers using a mapping
population that is composed of progeny of a ‘‘two-way pseudo-
testcross’’, full-sib family, which is typically used for genetic
mapping of highly heterozygous out-crossing plant species [29].
The mapping progeny were genotyped using the Illumina next-
generation sequencing platform [1,2,30,31]. GBS is a robust
approach for diverse species with large genomes [31], and has
proven to be highly efficient for genotyping the mapping
population of M. sinensis in the present work. A significant benefit
of GBS is that genome-wide marker representation is ensured,
which is critical for coverage and completeness of the linkage map.
The linkage maps created from this study include two parental
maps (female and male) and a composite map, created after
confirming that the two parent maps had the same (or similar)
structures detected by common markers. Once the M. sinensis
linkage maps were aligned to the sorghum genome, two-to-one
syntenic matches were observed between the 19 M. sinensis linkage
groups and the 10 sorghum chromosomes, except for one fusion,
proving a tetraploid nature of the diploid M. sinensis. Therefore,
this linkage map not only defines all 19 chromosome linkage
groups for the first time, but also provides a bridge for comparative
genomics to genetic resources of other crops species for the
ultimate improvement of Miscanthus.
Results
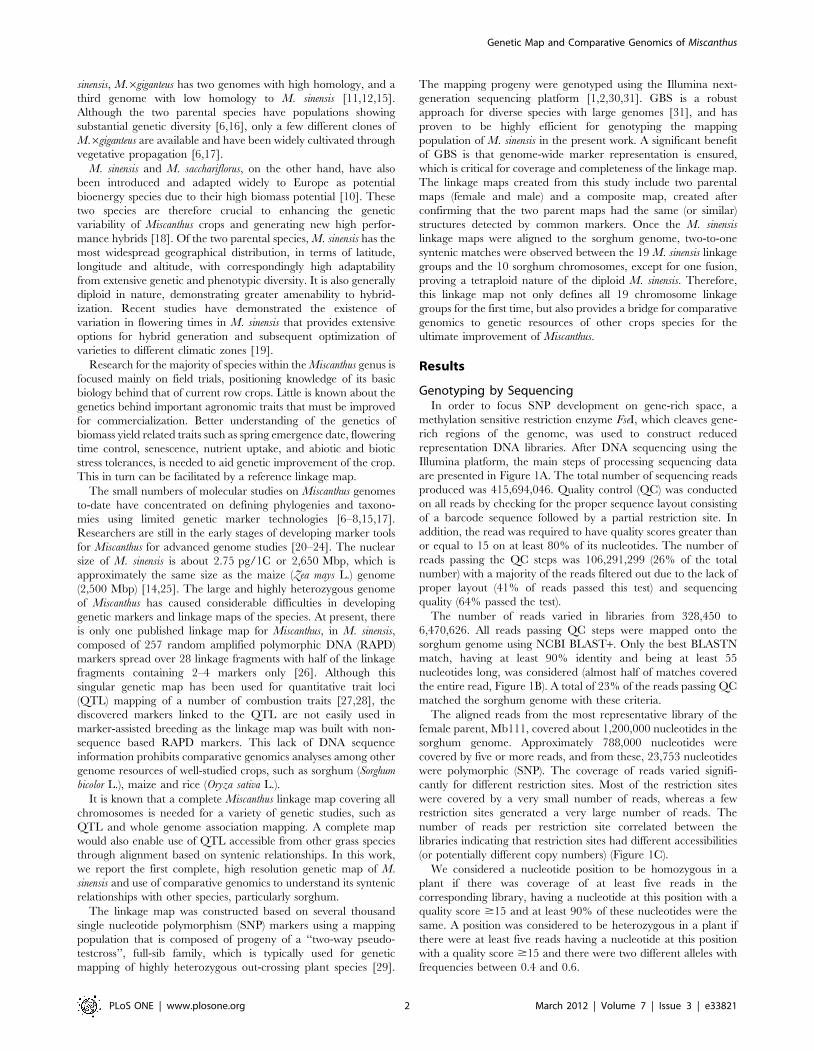
Genotyping by SequencingIn order to focus SNP development on gene-rich space, a
methylation sensitive restriction enzyme FseI, which cleaves gene-
rich regions of the genome, was used to construct reduced
representation DNA libraries. After DNA sequencing using the
Illumina platform, the main steps of processing sequencing data
are presented in Figure 1A. The total number of sequencing reads
produced was 415,694,046. Quality control (QC) was conducted
on all reads by checking for the proper sequence layout consisting
of a barcode sequence followed by a partial restriction site. In
addition, the read was required to have quality scores greater than
or equal to 15 on at least 80% of its nucleotides. The number of
reads passing the QC steps was 106,291,299 (26% of the total
number) with a majority of the reads filtered out due to the lack of
proper layout (41% of reads passed this test) and sequencing
quality (64% passed the test).
The number of reads varied in libraries from 328,450 to
6,470,626. All reads passing QC steps were mapped onto the
sorghum genome using NCBI BLAST+. Only the best BLASTN
match, having at least 90% identity and being at least 55
nucleotides long, was considered (almost half of matches covered
the entire read, Figure 1B). A total of 23% of the reads passing QC
matched the sorghum genome with these criteria.
The aligned reads from the most representative library of the
female parent, Mb111, covered about 1,200,000 nucleotides in the
sorghum genome. Approximately 788,000 nucleotides were
covered by five or more reads, and from these, 23,753 nucleotides
were polymorphic (SNP). The coverage of reads varied signifi-
cantly for different restriction sites. Most of the restriction sites
were covered by a very small number of reads, whereas a few
restriction sites generated a very large number of reads. The
number of reads per restriction site correlated between the
libraries indicating that restriction sites had different accessibilities
(or potentially different copy numbers) (Figure 1C).
We considered a nucleotide position to be homozygous in a
plant if there was coverage of at least five reads in the
corresponding library, having a nucleotide at this position with a
quality score $15 and at least 90% of these nucleotides were the
same. A position was considered to be heterozygous in a plant if
there were at least five reads having a nucleotide at this position
with a quality score $15 and there were two different alleles with
frequencies between 0.4 and 0.6.
Genetic Map and Comparative Genomics of Miscanthus
PLoS ONE | www.plosone.org 2 March 2012 | Volume 7 | Issue 3 | e33821
According to these two definitions, in an average plant, 97.8%
of the sampled nucleotide positions with five or more reads were
homozygous, 0.7% positions were heterozygous, and 1.5%
positions were undetermined. We identified a total of 49,007
SNPs using this set of data.
Reads which did not match the sorghum genome were clustered
using CLC Bio software into 20,169 contigs. For plant Mb111 as
an example, this resulted in 1,432,240 additional positions with
coverage of at least five reads. An additional 13,897 SNPs were
identified from this dataset using the same criteria as the reads
mapped to sorghum. To get better coverage of the discovered
SNPs by as many plants as possible, we used sequences previously
excluded at the QC step to increase the number of reads in defined
SNP positions. We considered all discovered SNPs with at least
four reads and defined the plant as homozygous if the frequency of
a certain nucleotide in this SNP was $0.9; heterozygous if there
were two different nucleotide variants with frequencies between
0.2 and 0.8. Special codes were then assigned to those SNPs
having nucleotide frequencies between 0.8 and 0.9.
In further analyses we considered only SNPs with major allele
frequency in the population less than 0.8. As a result, we obtained
4,437 SNPs aligned and 2,669 SNPs not aligned to the sorghum
genome, making a total 7,106 SNPs, with determined alleles in at
least 120 plants (Figure 1D). Eleven plants were excluded for
further mapping analyses as they contained unknown alleles of
most SNPs. In both aligned and de novo SNPs the most frequent
allele variations were complementary pairs of mutations A/G and
C/T, which occurred about twice more than the next allele pair,
C/G.
Marker segregation analysesThe SNP markers were then coded for JoinMap and 5,600 out
of the 7,106 SNPs were selected for segregation and mapping
analyses. More heterozygous markers were identified in the female
than in the male. Of the 5,600 markers, 2,574 (46%) were
heterozygous only in the female; 1,468 (26%) only in the male; and
1,558 (28%) were heterozygous in both parents. Chi-square tests
indicated that 54% (1,394 out of 2,574) of the female markers and
49% (715 out of 1,468) of the male markers showed segregation
distortion (goodness-of-fit ratio 1:1, a= 0.05), as did 69% (1,078
out of 1,558) of the female and male common markers (goodness-
of-fit ratio 1:2:1, a= 0.05). Thus, markers that were heterozygous
in both parents tended to be more distorted in allele transmission
than when heterozygous in only one of the parents.
Figure 1. Sequence analysis and single nucleotide polymorphism (SNP) marker calling. (A) Processing workflow of the NGS data analysis.(B) Distribution of the alignment lengths for Miscanthus reads matching the sorghum genome. (C) Correlation between the numbers of reads perrestriction site for two plants: Mb111 and P62, having the largest number of reads. Only reads mapped in chromosome 1 of sorghum were used as anexample. Similar correlations were observed for almost all other pairs of plants and other chromosomes. (D) Coverage of SNPs by plants.doi:10.1371/journal.pone.0033821.g001
Genetic Map and Comparative Genomics of Miscanthus
PLoS ONE | www.plosone.org 3 March 2012 | Volume 7 | Issue 3 | e33821

Linkage mappingThe coded data were first used to create parental maps using
two JoinMap populations, one using markers segregating in the
female, and the other in the male [29,32,33]. The markers that
were heterozygous in both parents were used in both parental
maps and served as common markers to match homologous
linkages between the two. As expected, 19 linkage groups were
identified for each parent.
For linkage mapping, framework maps of both parents were
created first with no (p,0.05) segregation distorted markers, and
used for homologous identification and structural comparisons
between the two parental maps. One-to-one homologous relation
was confirmed using markers common between the 19 linkage
groups of the female and the 19 linkage groups of the male. In
addition, good collinearities were observed and no obvious
structural heterogeneities were seen between homologous frame-
work maps of the two parents.
Then, segregation distorted markers were added to the
framework maps by attempting different LOD statistics and/or
different numbers of markers. The final maps selected were usually
the ones having the best collinearities with the framework maps.
Since the female had more heterozygous markers than the male,
the number of markers mapped in each female linkage was
generally more than that in the corresponding linkage of the male
(Table 1).
Since there were no obvious structural heterogeneities between
the female and male maps, a composite map containing both
female and male markers was created to facilitate future QTL
mapping of the population. The composite mapping was done
with an independent JoinMap mapping population by simulta-
neous analysis of all polymorphic markers from both parents.
Again, 19 linkage groups were formed and framework maps
without segregation distorted markers were created first. Com-
parisons between the composite and the two parental framework
linkages showed perfectly collinear marker order agreements for
all 19 linkage groups, indicating good integration of the two
parental linkages by the simultaneous mapping analysis.
The composite framework maps were then extended by
mapping segregation distorted markers using the same mapping
criteria and strategy as the parental maps. Ultimately, a high
density genetic linkage map representing all chromosomes was
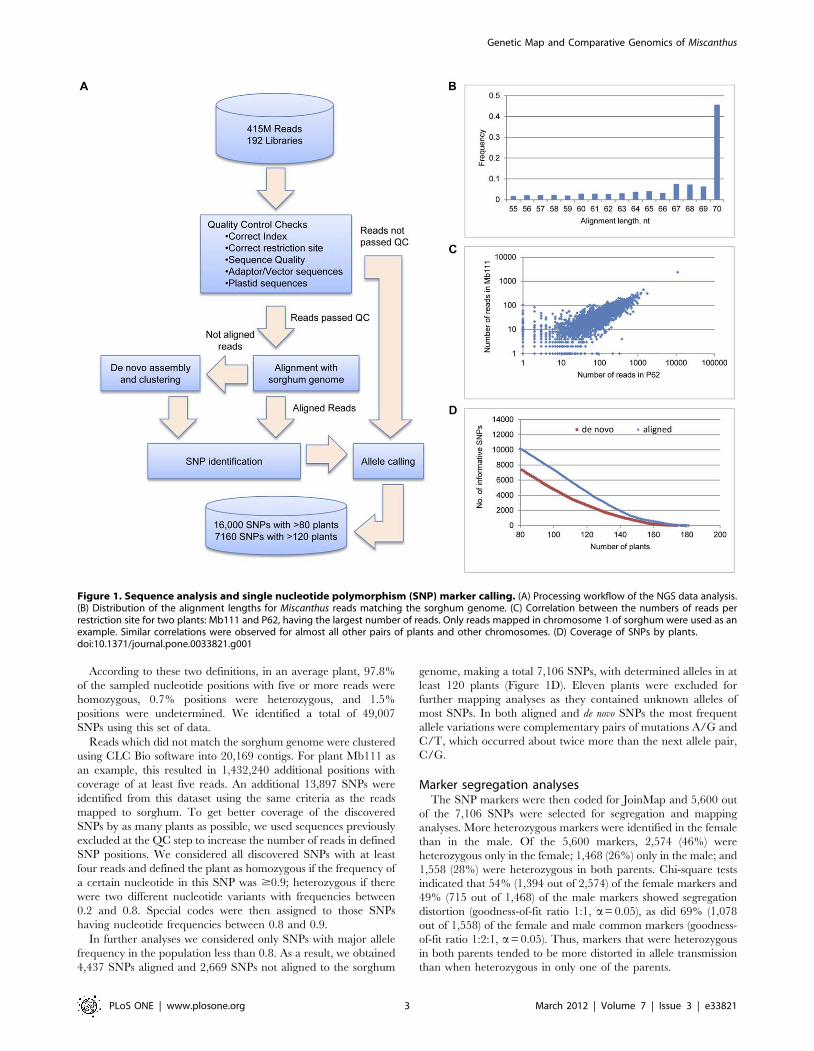
established (Table 1, Table S1 and Figure 2). The linkages were
named LG1 to LG19, following the syntenic relation order of
sorghum chromosomes, described in a separate section below.
The composite map comprised 3,745 SNP markers spanning
2396 cM on 19 linkages. The numbers of markers mapped varied
among the 19 linkage groups from 131 markers in LG10 to 289 in
LG8. The linkage sizes in cM were also very different, from 91 cM
of LG17 to 159 of LG8. The marker density of the composite map
was highly variable from region to region and chromosome to
chromosome, with an average resolution of 0.64 cM (Table 1,
Table S1 and Figure 2).
Map validationGBS has been used in plants recently, but to the best of our
knowledge, this is the first time this technology has been applied in
Table 1. Mapping data summary of the parental and the composite maps.
MiscanthusLG
SorghumSyntenicChr Female map Male map Compose map
Mappedto syntenicsorghumchr
Mappedto othersorghum chr
Not mapped tosorghum chr
No.Length(cM)
Avg(cM) No.
Length(cM)
Avg(cM) No.
Length(cM)
Avg(cM) No. % No. % No. %
1 1 196 139.6 0.71 108 111.1 1.03 226 132.9 0.57 140 61.9 14 6.2 72 31.9
2 1 208 160.6 0.77 132 161.7 1.22 276 150.8 0.66 187 67.8 12 4.3 77 27.9
3 2 201 147.0 0.73 214 144.5 0.68 261 136.8 0.52 167 64.0 5 1.9 89 34.1
4 2 237 140.2 0.59 171 138.1 0.81 268 136.8 0.59 159 59.3 33 12.3 76 28.4
5 3 197 145.9 0.74 76 140.0 1.84 220 153.1 0.73 133 60.5 18 8.2 69 31.4
6 3 180 143.3 0.80 104 146.7 1.41 193 152.4 0.79 127 65.8 4 2.1 62 32.1
7 4 166 127.7 0.77 134 140.0 1.04 219 130.0 0.57 139 63.5 5 2.3 75 34.2
8 4, 7 233 165.2 0.71 232 164.1 0.71 289 158.8 0.55 184 63.7 14 4.8 91 31.5
9 5 134 124.2 0.93 59 94.9 1.61 149 129.0 0.87 40 26.8 23 15.4 86 57.7
10 5 110 113.1 1.03 42 122.8 2.92 131 107.5 0.82 39 29.8 7 5.3 85 64.9
11 6 182 117.5 0.65 77 105.0 1.36 219 115.8 0.53 155 70.8 13 5.9 51 23.3
12 6 135 101.7 0.75 109 96.6 0.89 176 104.6 0.54 132 75.0 7 4.0 37 21.0
13 7 126 115.7 0.92 85 125.0 1.47 143 123.1 0.86 88 61.5 19 13.3 36 25.2
14 8 103 101.4 0.98 100 98.2 0.98 172 113.4 0.65 72 41.9 14 8.1 86 50.0
15 8 109 113.1 1.04 77 106.0 1.38 139 111.2 0.80 89 64.0 12 8.6 38 27.3
16 9 118 111.8 0.95 63 126.9 2.01 150 112.8 0.75 63 42.0 37 24.7 50 33.3
17 9 130 94.8 0.73 95 80.3 0.85 190 91.1 0.47 108 56.8 9 4.7 73 38.4
18 10 137 127.7 0.93 66 121.8 1.84 167 133.5 0.80 111 66.5 7 4.2 49 29.3
19 10 139 100.3 0.72 64 94.0 1.47 157 102.2 0.84 80 51.0 17 10.8 60 38.2
Total 3041 2390.7 0.79 2008 2317.4 1.15 3745 2395.6 0.64 2213 59.1 270 7.2 1262 33.7
doi:10.1371/journal.pone.0033821.t001
Genetic Map and Comparative Genomics of Miscanthus
PLoS ONE | www.plosone.org 4 March 2012 | Volume 7 | Issue 3 | e33821
genetic linkage mapping involving a large number of plants for
such a large unknown genome species, without any reference
sequence of the species itself. Thus, sequence and SNP calling
accuracy and mapping quality needed to be carefully addressed.
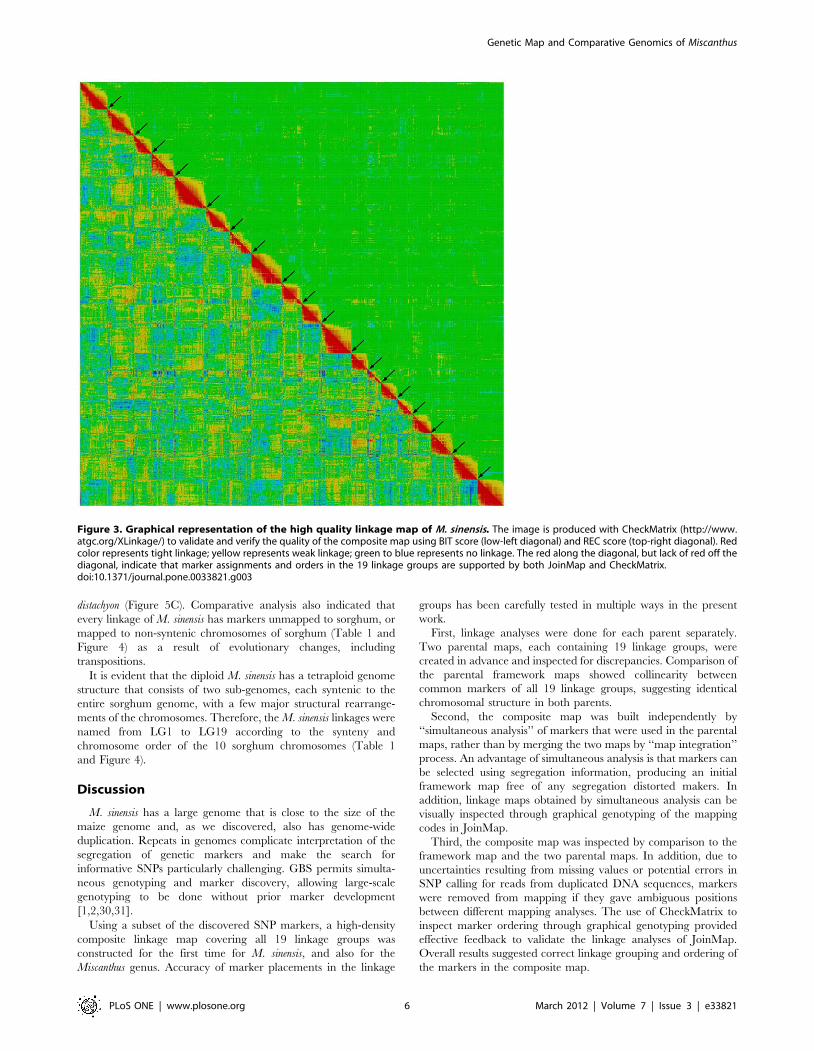
For this study, an independent program, CheckMatrix (http://
www.atgc.org/XLinkage/), was used to validate the linkage map
(Figure 3). All mapped markers, including segregation distorted
markers, were included for CheckMatrix validation. A red color in
CheckMatrix represents tight linkage, thus for each linkage a red
diagonal should be observed if all markers were in the correct
order. Any markers that were found unfit in their positions were
remapped using JoinMap with different LOD statistics or removed
from the final maps until all marker positions were accepted by
both JoinMap and CheckMatrix. After each linkage was verified, a
CheckMatrix of all 19 linkage groups was plotted using 25% of the
mapped markers of each linkage (Figure 3). Overall results
indicated that all markers mapped in the composite map were
assigned to correct linkages and placed in the correct order.
Comparative genomicsThe marker sequences used in this study were aligned to the
genome sequences of sorghum, maize, rice, and B. distachyon using
BLAST+. Most sequence conservation existed between M. sinensis
and sorghum (Figure 4). The sequence alignments of the M. sinensis
linkage map to the three other species (maize, rice, and B.
distachyon) were poor because the ratios of BLAST alignments were
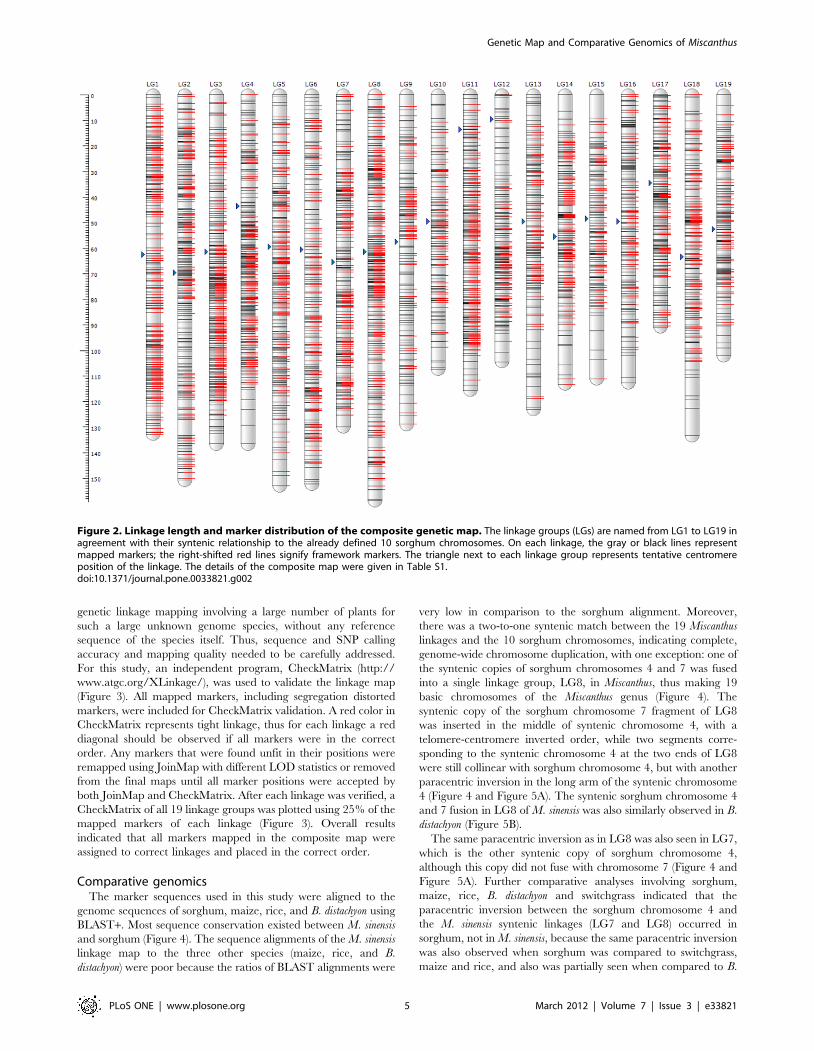
very low in comparison to the sorghum alignment. Moreover,
there was a two-to-one syntenic match between the 19 Miscanthus
linkages and the 10 sorghum chromosomes, indicating complete,
genome-wide chromosome duplication, with one exception: one of
the syntenic copies of sorghum chromosomes 4 and 7 was fused
into a single linkage group, LG8, in Miscanthus, thus making 19
basic chromosomes of the Miscanthus genus (Figure 4). The
syntenic copy of the sorghum chromosome 7 fragment of LG8
was inserted in the middle of syntenic chromosome 4, with a
telomere-centromere inverted order, while two segments corre-
sponding to the syntenic chromosome 4 at the two ends of LG8
were still collinear with sorghum chromosome 4, but with another
paracentric inversion in the long arm of the syntenic chromosome
4 (Figure 4 and Figure 5A). The syntenic sorghum chromosome 4
and 7 fusion in LG8 of M. sinensis was also similarly observed in B.
distachyon (Figure 5B).
The same paracentric inversion as in LG8 was also seen in LG7,
which is the other syntenic copy of sorghum chromosome 4,
although this copy did not fuse with chromosome 7 (Figure 4 and
Figure 5A). Further comparative analyses involving sorghum,
maize, rice, B. distachyon and switchgrass indicated that the
paracentric inversion between the sorghum chromosome 4 and
the M. sinensis syntenic linkages (LG7 and LG8) occurred in
sorghum, not in M. sinensis, because the same paracentric inversion
was also observed when sorghum was compared to switchgrass,
maize and rice, and also was partially seen when compared to B.
Figure 2. Linkage length and marker distribution of the composite genetic map. The linkage groups (LGs) are named from LG1 to LG19 inagreement with their syntenic relationship to the already defined 10 sorghum chromosomes. On each linkage, the gray or black lines representmapped markers; the right-shifted red lines signify framework markers. The triangle next to each linkage group represents tentative centromereposition of the linkage. The details of the composite map were given in Table S1.doi:10.1371/journal.pone.0033821.g002
Genetic Map and Comparative Genomics of Miscanthus
PLoS ONE | www.plosone.org 5 March 2012 | Volume 7 | Issue 3 | e33821
distachyon (Figure 5C). Comparative analysis also indicated that
every linkage of M. sinensis has markers unmapped to sorghum, or
mapped to non-syntenic chromosomes of sorghum (Table 1 and
Figure 4) as a result of evolutionary changes, including
transpositions.
It is evident that the diploid M. sinensis has a tetraploid genome
structure that consists of two sub-genomes, each syntenic to the
entire sorghum genome, with a few major structural rearrange-
ments of the chromosomes. Therefore, the M. sinensis linkages were
named from LG1 to LG19 according to the synteny and
chromosome order of the 10 sorghum chromosomes (Table 1
and Figure 4).
Discussion
M. sinensis has a large genome that is close to the size of the
maize genome and, as we discovered, also has genome-wide
duplication. Repeats in genomes complicate interpretation of the
segregation of genetic markers and make the search for
informative SNPs particularly challenging. GBS permits simulta-
neous genotyping and marker discovery, allowing large-scale
genotyping to be done without prior marker development
[1,2,30,31].
Using a subset of the discovered SNP markers, a high-density
composite linkage map covering all 19 linkage groups was
constructed for the first time for M. sinensis, and also for the
Miscanthus genus. Accuracy of marker placements in the linkage
groups has been carefully tested in multiple ways in the present
work.
First, linkage analyses were done for each parent separately.
Two parental maps, each containing 19 linkage groups, were
created in advance and inspected for discrepancies. Comparison of
the parental framework maps showed collinearity between
common markers of all 19 linkage groups, suggesting identical
chromosomal structure in both parents.
Second, the composite map was built independently by
‘‘simultaneous analysis’’ of markers that were used in the parental
maps, rather than by merging the two maps by ‘‘map integration’’
process. An advantage of simultaneous analysis is that markers can
be selected using segregation information, producing an initial
framework map free of any segregation distorted makers. In
addition, linkage maps obtained by simultaneous analysis can be
visually inspected through graphical genotyping of the mapping
codes in JoinMap.
Third, the composite map was inspected by comparison to the
framework map and the two parental maps. In addition, due to
uncertainties resulting from missing values or potential errors in
SNP calling for reads from duplicated DNA sequences, markers
were removed from mapping if they gave ambiguous positions
between different mapping analyses. The use of CheckMatrix to
inspect marker ordering through graphical genotyping provided
effective feedback to validate the linkage analyses of JoinMap.
Overall results suggested correct linkage grouping and ordering of
the markers in the composite map.
Figure 3. Graphical representation of the high quality linkage map of M. sinensis. The image is produced with CheckMatrix (http://www.atgc.org/XLinkage/) to validate and verify the quality of the composite map using BIT score (low-left diagonal) and REC score (top-right diagonal). Redcolor represents tight linkage; yellow represents weak linkage; green to blue represents no linkage. The red along the diagonal, but lack of red off thediagonal, indicate that marker assignments and orders in the 19 linkage groups are supported by both JoinMap and CheckMatrix.doi:10.1371/journal.pone.0033821.g003
Genetic Map and Comparative Genomics of Miscanthus
PLoS ONE | www.plosone.org 6 March 2012 | Volume 7 | Issue 3 | e33821

The linkage length and number of markers of the M. sinensis
genetic map varied greatly among different linkages. The eight
linkages (LG1 to LG8) that were syntenic to sorghum chromo-
somes 1, 2, 3 and 4 generally contained more markers and also
longer linkages (in cM) than other linkage groups (Table 1). A
similar marker distribution was observed in the switchgrass genetic
map where the first eight linkage groups (1A, 1B to 4A and 4B),
syntenic to sorghum chromosomes 1–4, were also larger than
other chromosome linkages [34]. The M. sinensis and switchgrass
genetic maps also share other common features. For example, the
two M. sinensis linkages (LG9 and LG10) syntenic to sorghum
chromosome 5 contain the least markers and the lowest
percentages (,30%) of markers that map to sorghum, however
markers which mapped to other linkages exhibit much higher
percentages (60% on average) of sorghum syntenic alignments
(Table 1), again, similar to when the switchgrass genetic map was
aligned to sorghum. The data also suggest that linkages syntenic to
sorghum chromosome 5 have encountered more evolutionary
changes than other chromosomes after the species diverged from
each other. A similar result was recently documented in maize, of
which the two ancestral maize chromosomes orthologous to
sorghum chromosome 5 retain the smallest number of syntenic
orthologs to sorghum genes [35].
The marker sequences were mapped to genome sequences of
several grass species. Among grasses with sequenced genomes
(rice, sorghum, maize, and B. distachyon), sorghum has the closest
phylogenetic relationship to Miscanthus. As predicted, the Mis-
canthus DNA reads better matched the sorghum genome than the
maize genome, which in turn was a better match than the rice and
B. distachyon genomes. Similar findings were reported recently
using a survey sequence of M.6giganteus [22].
In the current study, a detailed relationship was established for
the first time between Miscanthus and sorghum. Our map indicates
that the current diploid M. sinensis evolved from genome
duplication of its progenitor that was very close to a sorghum
ancestor, bearing 10 haploid chromosomes. As a result, the
current M. sinensis still maintains two genome subsets, each
containing a complete syntenic set of its progenitor genome or half
of the current diploid M. sinensis genome. A similar genome
structure has been seen in maize, which is also a segmental
tetraploid originating from a tetraploidization event that was
reported to have occurred several million years ago [35,36].
Marker sequence alignments to the sorghum genome suggest
end-to-end complete chromosome coverage of all 10 sorghum
chromosomes (Figure 4). As expected, very few markers from the
M. sinensis linkages were aligned to sorghum centromeric regions
due to low frequencies of FseI cleavage and SNP polymorphism
around the centromeric heterochromatic regions. The overall
results suggest that the composite map has a genome-wide
coverage of gene-rich, euchromatic regions of M. sinensis. High
marker coverage of the genome in this study enabled robust
linkage mapping analysis and a comprehensive genome structure
study using syntenic relationships to other grasses.
The current composite map will also serve as an important
bridge to allow Miscanthus researchers to use genomic resources of
sorghum, as well as many other well studied species that already
Figure 4. Syntenic alignment between the 19 linkage groups of M. sinensis and 10 chromosomes of sorghum. The big gap in eachchromosome plot corresponds to centromere heterochromatic region that inhibits recombination. The image shows genome-wide sequenceduplications and chromosome rearrangements in M. sinensis compared to sorghum.doi:10.1371/journal.pone.0033821.g004
Genetic Map and Comparative Genomics of Miscanthus
PLoS ONE | www.plosone.org 7 March 2012 | Volume 7 | Issue 3 | e33821

Figure 5. Chromosome structural rearrangements of M. sinensis when compared to sorghum and several other species. (A)Chromosome fusion in LG8 of M. sinensis was observed between two sorghum syntenic chromosomes 4 and 7; chromosome 7 is inserted in themiddle of chromosome 4 in telemore-centromere inverted order. However, the other duplicated copies of chromosomes 4 and 7 are not fused,
Genetic Map and Comparative Genomics of Miscanthus
PLoS ONE | www.plosone.org 8 March 2012 | Volume 7 | Issue 3 | e33821
have syntenic relationship established to sorghum, thus greatly
extending the genomics tools that can be used for Miscanthus
improvement. In addition, the present map should provide a good
reference for Miscanthus sequence assembly due to its high
resolution and quality. The map will also be used for QTL
discoveries of traits of importance for biomass production in
Miscanthus.
Materials and Methods
Mapping populationAn outcrossing full-sib F1 mapping population (JoinMap CP
population type) consisting of 230 genotypes was produced
between two parental lines, female Mb111 (synonyms EMI11
and MS-88-110) and male Mb121 (synonym H0023). Parent
Mb121 is one of the progenies derived from a cross between
siblings (F1.1 and F1.7) that originated from another cross between
MS-90-2 and Mb111 [26–28]. Therefore, the male parent Mb121
is a second generation progeny of the female parent Mb111. Seeds
were germinated in JI3 compost (John Innes Manufacturers
Association, Harrogate, UK) in an unlit glasshouse in January and
February of 2006. Seedlings were then transferred into 100 pots for
12 months before the plant rhizome was split to produce viable
clones. In May 2007, one clone from each progeny was planted
into each of three replicated randomized blocks, at a site near
Aberystwyth (52u269N, 3u599W), on the west coast of Wales. This
mapping population, named Mx2, segregates for a number of
important traits, including flowering time, plant height, stem
number, senescence, spring emergence, and biomass yield. Mx2 is
thus an ideal population for QTL studies of biomass related traits
in M. sinensis.
DNA isolation and library constructionA total of 192 (out of the 230) genotypes of the mapping
population, including parents, were selected for genotyping using
the GBS platform [1,2,30,31]. Genomic DNA (gDNA) was
isolated from dried leaf tissue using the DNeasy 96 Plant Kit
(Qiagen). Then, 500 ng DNA of each sample was digested with
FseI enzyme (New England Biolabs (NEBH), Hitchin, UK) at 37uCfor 3 h; subsequently the enzyme was heat-inactivated at 65uC for
20 min.
Twelve unique P1 adapters were designed, each with a different
6 bp barcode to enable a 126 sample multiplex per Illumina flow
cell lane. Each FseI digested DNA sample was ligated to one of the
P1 adapters in a 20 ml reaction mixture containing 1 ml of 10 nM
adapter, 1 ml rATP (100 mM, Promega), 1 ml NEB buffer 4, and
0.5 ml T4 ligase (400,000 cohesive end units/mL, NEB) by
incubating for 4 h at 16uC. The reaction was stopped by incubating
at 65uC for 20 min. Every 12 samples, each with a unique barcode,
were pooled and randomly sheared by Bioruptor UCD-300
(Diagenode) to an average size of 450 bp. The barcoded samples
were electrophoresed on 1.5% agarose gels, and fragments of 300–
500 bp were recovered and purified. The fragments were treated
with T4 DNA polymerase, T4 polynucleotide kinase, and Klenow
DNA polymerase (NEB) for end repairing, followed by treatment
with Klenow exo (NEB) and dATP (Invitrogen) to generate 39
adenine (A) overhangs [1,2,30,31].
A common P2 adapter containing thymine (T) overhangs
(Illumina) was ligated to sheared, size-selected, P1-ligated and
pooled DNA templates with 1 ml of 100 nM adapter and T4 ligase
for 4 h at 16uC [1,2,30,31]. The samples were purified and eluted
to 50 ml. PCR enrichment of the pooled libraries were performed
in 50-ml PCR reactions (30 s at 98uC, followed by 15 cycles of 10 s
at 98uC, 30 s at 65uC, 30 s at 72uC, and a final extension step of
5 min at 72uC). PCR amplicons were electrophoresed on 1.5%
agarose gels, and fragments of 300–500 bp were recovered and
purified. The pooled libraries were loaded onto a 2100 Bioanlyzer
(Agilent) for quality control, evaluating fragment size and
appearance of adapter dimers. The libraries were sequenced
using an Illumina GAIIx instrument following standard protocols.
Sequence analysis and SNP marker callingThe DNA sequences were produced using two Illumina flow
cells, consisting of eight lanes per cell and a multiplex of 12
samples per lane. DNA sequence reads were 76 nucleotides, with
the first six nucleotides barcode sequence specific for given samples
within the lane and the next six nucleotides partial restriction sites
for FseI. DNA sequences were analyzed using the NCBI BLAST+program for mapping reads into the sorghum genome sequence
and CLC BIO software for de novo assembly of reads having no
match with sorghum. An internally developed proprietary Oracle-
based program was used for quality control, marker discovery,
allele calling and data storage. All Miscanthus DNA sequences from
this study were submitted to the National Center for Biotechnol-
ogy Information (NCBI) Short Read Archive (study SRA050103).
Mapping code assignmentThe SNP markers were coded following the coding scheme of
CP population type of JoinMap 4 [33]. Three kinds of segregation
types were involved, including markers that were heterozygous
only in the female (lmxll), only in the male (nnxnp), or in both
parents (hkxhk). Although the majority of data were co-
dominantly coded, dominant codes were also applied for uncertain
genotyping values of hkxhk type.
Marker selectionTo ensure linkage map quality, the SNP markers used for final
mapping were selected by removing markers that (A) showed
differences of allele frequencies between the first 96 plants and the
second 96 plants due to a potential library preparation bias
between the two 96-well gDNA plates or a sequencing quality bias
between the two flow cells; (B) had more than 60 missing values if
they were heterozygous in only one of the parents (segregation
type lmxll or nnxnp), or more than 30 missing values if they were
heterozygous in both parents (hkxhk); (C) showed segregation
distortion with x2.100 of goodness-of-fit tests; and (D) contained
identical recombinant information. Eventually 5,600 SNPs were
selected and imported into JoinMap for linkage mapping analyses.
Linkage mapping analysesMarker data were analyzed with JoinMap 4 using the CP
population type [33]. To ensure that any potential chromosome
structure variations between the two parents were captured,
maternal and paternal maps were first analyzed following the two-
corresponding to LG7 and LG13 in M. sinensis, respectively. Also, a common paracentric inversion in the long arm of the syntenic chromosome 4 wasseen in both the fused copy (LG8) and the non-fused copy (LG7) of M. sinensis. (B) The fusion of sorghum syntenic chromosomes 4 and 7 in M. sinensisLG8 was also similarly observed in chromosome 3 of B. distachyon. (C) The same paracentric inversion between the long arm of the sorghum syntenicchromosome 4 and M. sinensis LG7 and LG8 was also seen when sorghum was compared to switchgrass, rice, and maize, but only partially seen whencompared to B. distachyon.doi:10.1371/journal.pone.0033821.g005
Genetic Map and Comparative Genomics of Miscanthus
PLoS ONE | www.plosone.org 9 March 2012 | Volume 7 | Issue 3 | e33821
way pseudo-testcross strategy [29]. After observing that there was
no obvious structural heterogeneity between the female and male
chromosome linkage groups, a composite map was generated by
simultaneous analyses of all markers from both parents. Therefore,
three independent linkage analyses including female, male and
composite mapping, were performed. The two parental maps
assisted in validating the composite map.
Markers were assigned to correct linkage groups using two-point
grouping analyses in three steps. First, only markers that showed
un-distorted segregation (goodness-of-fit ratio 1:1 if segregating in
only one parent, or 1:2:1 if segregating in both parents, a= 0.05)
were assigned into linkage groups at the minimum independence
test LOD score of 12. Second, ungrouped, including segregation
distorted, markers were assigned to existing linkage groups based
on ‘‘strongest cross link (SCL)’’ with a minimum LOD threshold of
10. Third, markers from different groups that showed strongest
cross link were combined until no strongest cross link was seen
between markers from different groups. After these three steps, the
expected 19 linkage groups were formed for all three linkage
analyses including the female, the male, and the composite
mapping.
Markers within each group were mapped using the regression
mapping algorithm with the minimum LOD score of 1.0 to 5.0
and maximum recombination frequency of 0.35 or 0.40
depending on the linkage group [32,33]. Map distance was
estimated using the Kosambi mapping function. For each linkage
group, a framework map containing no segregation-distorted
markers was created first; segregation-distorted markers were
added to the linkage using the framework map as a reference. In
addition, at least five independent mapping analyses of each group
were performed to compare if marker orders were relatively
consistent between different LOD statistics. Any markers that
showed dramatic discrepancy of their relative position between
different LOD statistics were excluded from further mapping. The
final map selected exhibited the most agreement in marker order
with the framework map.
Mapping validationLinkage maps were all visually inspected by graphic genotyping
in the JoinMap program. Due to potential sequencing errors and
uncertainties caused by missing values and sequence duplication,
the qualities of the final maps were carefully addressed and
validated by an independent program CheckMatrix using PyMap
BIT and REC scores as described by Kozik (http://www.atgc.
org/XLinkage/). Any markers that were detected as having weak
linkage positions were remapped by adjusting JoinMap parame-
ters, or removed from final mapping.
Comparative genomicsUsing NCBI BLAST+ the DNA sequences containing the SNPs
of interest were aligned to the genomes of sorghum, rice, maize
and Brachypodium distachyon (L.). Only BLASTN matches longer
than or equal to 55 nucleotides with identity greater than or equal
to 90% were used. The alignment to sorghum was performed
using raw sequence reads of M. sinensis as described in the
sequence analysis and SNP calling section; however, the alignment
to other species used only sequences that produced SNP markers.
The syntenic genome relationships of M. sinensis to other species
were visualized using an internally developed visualization and
comparative genomics software Persephone (Ceres, Inc.). In
addition, a dot matrix plot was generated with Persephone using
linkage map positions of M. sinensis markers against aligned
sequence positions of the sorghum genome, allowing a whole
genome comparison view of the two species.
Supporting Information
Table S1 Composite map and genotype data of themapping population.(XLS)
Acknowledgments
The authors would like to thank Oene Dolstra for providing plant Mb121
(synonym H0023) as one of the parents, and the following for technical
assistance in setting up the cross and maintenance of plants: Charlotte
Hayes, Peter Roberts, John Norris, Sue Youell and Maurice Hinton Jones.
Author Contributions
Conceived and designed the experiments: XFM EJ ID TS RF. Performed
the experiments: EJ LZ STJ KF JCB. Analyzed the data: XFM NA MT.
Contributed reagents/materials/analysis tools: EJ MT LZ. Wrote the
paper: XFM NA TS.
References
1. Baird NA, Etter PD, Atwood TS, Currey MC, Shiver AL, et al. (2008) Rapid
SNP discovery and genetic mapping using sequenced RAD markers. PLoS ONE
3: e3376.
2. Baxter SW, Davey JW, Johnston JS, Shelton AM, Heckel DG, et al. (2011)
Linkage mapping and comparative genomics using next-generation RAD
sequencing of a non-model organism. PLoS ONE 6: e19315.
3. Chutimanitsakun Y, Nipper RW, Cuesta-Marcos A, Cistue L, Corey A, et al.
(2011) Construction and application for QTL analysis of a restriction site
associated DNA (RAD) linkage map in barley. BMC Genomics 12: 4. DOI:
10.1186/1471-2164-1112-1184.
4. Pfender WF, Saha MC, Johnson EA, Slabaugh MB (2011) Mapping with RAD
(restriction-site associated DNA) markers to rapidly identify QTL for stem rust
resistance in Lolium perenne. Theor Appl Genet 122: 1467–1480.
5. Graham-Rowe D (2011) Agriculture: Beyond food versus fuel. Nature 474:
S6–S8. DOI: 10.1038/474S06a.
6. Hodkinson TR, Chase MW, Lledo MD, Salamin N, Renvoize SA (2002a)
Phylogenetics of Miscanthus, Saccharum and related genera (Saccharinae,
Andropogoneae, Poaceae) based on DNA sequences from ITS nuclear
ribosomal DNA and plastid trnL intron and trnL-F intergenic spacers. J Plant
Res 115: 381–392.
7. Hodkinson TR, Chase MW, Renvoize SA (2002b) Characterization of a genetic
resource collection for Miscanthus (Saccharinae, Andropogoneae, Poaceae) using
AFLP and ISSR PCR. Ann Bot 89: 627–636.
8. Hodkinson TR, Chase MW, Takahashi C, Leitch IJ, Bennet MD, et al. (2002c)
The use of DNA sequencing (ITS and trnL-F), AFLP, and fluorescent in situ
hybridization to study allopolyploid Miscanthus (Poaceae). Am J Bot 89: 279–286.
9. Heaton EA, Dohleman FG, Miguez AF, Juvik JA, Lozovaya V, et al. (2010)
Miscanthus: a promising biomass crop. In: Kader J-C, Delseny M, eds. Advances
in Botanical Research Academic Press. pp 75–137. DOI: 10.1016/S0065-
2296(10)56003-8.
10. Clifton-Brown JC, Lewandowski I, Andersson B, Basch G, Christian DG, et al.
(2001) Performance of 15 Miscanthus genotypes at five sites in Europe. Agron J
93: 1013–1019.
11. Greef JM, Deuter M (1993) Syntaxonomy of Miscanthus6giganteus GREEF et
DEU. Angew Bot 67: 87–90.
12. Linde-Laursen I (1993) Cytogenetic analysis of Miscanthus ‘Giganteus’, an
interspecific hybrid. Hereditas 119: 297–300.
13. Lafferty J, Lelley T (1994) Cytogenetic studies of different Miscanthus species with
potential for agricultural use. Plant Breed 113: 246–249.
14. Rayburn AL, Crawford J, Rayburn CM, Juvik JA (2009) Genome size of three
Miscanthus species. Plant Mol Biol Rep 27: 184–188.
15. Adati S, Shiotani I (1962) The cytotaxonomy of the genus Miscanthus and its
phylogenic status. Bull Fac Agr Mie Univ 25: 1–24.
16. Jørgensen U, Muhs H-J (2001) Miscanthus breeding and improvement. In:
Jones MB, Walsh M, eds. Miscanthus for energy and fibre. London: James and
James. pp 68–87.
17. Greef MJ, Deuter M, Jung C, Schondelmaier J (1997) Genetic diversity of
European Miscanthus species revealed by AFLP fingerprinting. Genet Res Crop
Evol 44: 185–195.
18. Deuter M, Abraham J (1998) Genetic resources of Miscanthus and their use in
breeding biomass for energy and industry. Proc Int Conf Wurzburg. pp
775–777.
Genetic Map and Comparative Genomics of Miscanthus
PLoS ONE | www.plosone.org 10 March 2012 | Volume 7 | Issue 3 | e33821

19. Jensen E, Farrar K, Thomas-Jones S, Hastings A, Donnison I, et al. (2011)
Characterization of flowering time diversity in Miscanthus species. GCBBioenergy 3: 387–400.
20. Hernandez P, Dorado G, Laurie DA, Martın A, Snape JW (2001) Microsatellites
and RFLP probes from maize are efficient sources of molecular markers for thebiomass energy crop Miscanthus. Theor Appl Genet 102: 616–622.
21. Hung K-H, Chiang T-Y, Chiu C-T, Hsu T-W, Ho C-W (2009) Isolation andcharacterization of microsatellite loci from a potential biofuel plant Miscanthus
sinensis (Poaceae). Conserv Genet 5: 1377–1380.
22. Swaminathan K, Alabady MS, Varala K, De Paoli E, Ho I, et al. (2010)Genomic and small RNA sequencing of Miscanthus6giganteus shows the utility of
sorghum as a reference genome sequence for Andropogoneae grasses. GenomeBiol 11: R12.
23. Ho CW, Wu TH, Hsu TW, Huang JC, Huang CC, et al. (2011) Development of12 genic microsatellite loci for a biofuel grass, Miscanthus sinensis (Poaceae).
Am J Bot 98: e201–e203.
24. Zhao H, Yu J, You FM, Luo M, Peng J (2011) Transferability of microsatellitemarkers from Brachypodium distachyon to Miscanthus sinensis, a potential biomass
crop. J Integr Plant Biol 53: 232–245.25. Chandler VL, Brendel V (2002) The maize genome sequencing project. Plant
Physiol 130: 1594–1597.
26. Atienza SG, Satovic Z, Petersen KK, Dolstra O, Martın A (2002) Preliminarygenetic linkage map of Miscanthus sinensis with RAPD markers. Theor Appl
Genet 105: 946–952.27. Atienza SG, Satovic Z, Petersen KK, Dolstra O, Martın A (2003a) Identification
of QTLs influencing agronomic traits in Miscanthus sinensis Anderss. I. Totalheight, flag-leaf height and stem diameter. Theor Appl Genet 107: 123–129.
28. Atienza SG, Satovic Z, Petersen KK, Dolstra O, Martın A (2003b) Identification
of QTLs influencing combustion quality in Miscanthus sinensis Anderss. II.
Chlorine and potassium content. Theor Appl Genet 107: 857–863.
29. Grattapaglia D, Sederoff R (1994) Genetic linkage maps of Eucalyptus grandis and
Eucalytus urophylla using a pseudo-testcross: mapping strategy and RAPD
markers. Genetics 137: 1121–1137.
30. Gore MA, Wright MH, Ersoz ES, Bouffard P, Szekeres ES, et al. (2009) Large-
scale discovery of gene-enriched SNPs. Plant Genome 2: 121–133.
31. Elshire RJ, Glaubitz JC, Sun Q, Poland JA, Kawamoto K, et al. (2011) A robust,
simple genotyping-by-sequencing (GBS) approach for high diversity species.
PLoS ONE 6: e19379.
32. Stam P (1993) Construction of integrated genetic linkage maps by means of a
new computer package: JoinMap. Plant J 3: 739–744.
33. Van Ooijen JW (2006) Joinmap 4: Software for the calculation of genetic linkage
maps in experimental populations Kyazma BV, Wageningen, Netherlands.
34. Ma X-F, Bouton J, Saha M, Narasimhamoorthy B, Russell T, et al. (2008)
Perennial bio-energy crop, switchgrass: genetic linkage map based on high-
throughput SNP and SSR genotyping. Plant and animal genomes XVI
conference. P357.
35. Schnable JC, Springer NM, Freeling M (2011) Differentiation of the maize
subgenomes by genome dominance and both ancient and ongoing gene loss.
Proc Natl Acad Sci U S A 108: 4069–4074.
36. Wei F, Coe E, Nelson W, Bharti AK, Engler F, et al. (2007) Physical and genetic
structure of the maize genome reflects its complex evolutionary history. PLoS
Genet 3: e123. doi:10.1371/journal.pgen.0030123.
Genetic Map and Comparative Genomics of Miscanthus
PLoS ONE | www.plosone.org 11 March 2012 | Volume 7 | Issue 3 | e33821