Pesticide applications by and with genetically modified (GM ...
Upload
independentCategory
view
3download
0
ORIGINAL ARTICLE JJBMR
Identification of Homogeneous Genetic Architecture ofMultiple Genetically Correlated Traits by BlockClustering of Genome-Wide AssociationsMayetri Gupta,1 Ching-Lung Cheung,2,3 Yi-Hsiang Hsu,2,4 Serkalem Demissie,1 L Adrienne Cupples,1
Douglas P Kiel ,2 and David Karasik2
1Department of Biostatistics, Boston University, Boston, MA, USA2Institute for Aging Research, Hebrew SeniorLife, Boston, and Harvard Medical School, Boston, MA, USA3Department of Medicine, University of Hong Kong, Hong-Kong, China4Molecular and Integrative Physiological Sciences Program, Harvard School of Public Health, Boston, MA, USA
ABSTRACTGenome-wide association studies (GWAS) using high-density genotyping platforms offer an unbiased strategy to identify new candidate
genes for osteoporosis. It is imperative to be able to clearly distinguish signal from noise by focusing on the best phenotype in a genetic
study. We performed GWAS of multiple phenotypes associated with fractures [bonemineral density (BMD), bone quantitative ultrasound
(QUS), bone geometry, and muscle mass] with approximately 433,000 single-nucleotide polymorphisms (SNPs) and created a database
of resulting associations. We performed analysis of GWAS data from 23 phenotypes by a novel modification of a block clustering
algorithm followed by gene-set enrichment analysis. A data matrix of standardized regression coefficients was partitioned along both
axes—SNPs and phenotypes. Each partition represents a distinct cluster of SNPs that have similar effects over a particular set of
phenotypes. Application of this method to our data shows several SNP-phenotype connections. We found a strong cluster of association
coefficients of high magnitude for 10 traits (BMD at several skeletal sites, ultrasound measures, cross-sectional bone area, and section
modulus of femoral neck and shaft). These clustered traits were highly genetically correlated. Gene-set enrichment analyses indicated
the augmentation of genes that cluster with the 10 osteoporosis-related traits in pathways such as aldosterone signaling in epithelial
cells, role of osteoblasts, osteoclasts, and chondrocytes in rheumatoid arthritis, and Parkinson signaling. In addition to several known
candidate genes, we also identified PRKCH and SCNN1B as potential candidate genes for multiple bone traits. In conclusion, our mining of
GWAS results revealed the similarity of association results between bone strength phenotypes that may be attributed to pleiotropic
effects of genes. This knowledge may prove helpful in identifying novel genes and pathways that underlie several correlated
phenotypes, as well as in deciphering genetic and phenotypic modularity underlying osteoporosis risk. � 2011 American Society
for Bone and Mineral Research.
KEY WORDS: BLOCK CLUSTERING; GENOME-WIDE ASSOCIATION STUDY; OSTEOPOROSIS; PHENOMICS; PLEIOTROPY
Introduction
Genome-wide association studies (GWAS) using high-density
genotyping platforms offer an unbiased strategy to identify
new candidate genes for different traits and diseases. A number
of candidate genes have been identified for traits associated
with fracture, such as bone mineral density (BMD),(1–3) bone
geometry,(4,5) and lean mass.(6) Although this is a powerful
approach for disease gene discovery, many GWAS focus only on
identification of candidate genes and provide no clues on gene
Received in original form July 15, 2010; revised form November 17, 2010; accepte
Address correspondence to: David Karasik, PhD, Institute for Aging Research, Hebr
E-mail: [email protected]
Additional Supporting Information may be found in the online version of this artic
Journal of Bone and Mineral Research, Vol. 26, No. 6, June 2011, pp 1261–1271
DOI: 10.1002/jbmr.333
� 2011 American Society for Bone and Mineral Research
networks that may underlie the trait variations. Genes do not
work alone, especially in the genetics of complex diseases. More
often, they work in an interactive network synergistically and
coregulate the expression of proteins that are implicated in a
trait variation. In the study of disease networks or interactomes, it
has been suggested that disease genes usually are located
centrally (‘‘hub’’) and are highly connected with other genes in
the interactome such that perturbations of candidate genes in
the same network are more likely to cause either the same or
similar disease phenotypes.(7,8) Given that many traits are
d December 23, 2010. Published online January 4, 2011.
ew SeniorLife, 1200 Center Street, Boston, MA 02131, USA.
le.
1261

correlated genetically, it is possible that common gene
network(s) underlie multiple correlated trait variations. In fact,
using a plethora of genetic information from high-throughput
technologies such as mRNA microarray and GWAS, it is now
feasible to ‘‘reverse phenotype’’ (whereby associations with
genetic markers are used to define phenotype groupings)(9,10)
and classify multiple traits based on the similarity of their genetic
organization. There is a need to develop innovative computa-
tional and informatics tools and high-throughput discovery
technologies for both gene network and phenomic research(11)
given the large numbers of multiple correlated traits that are
common in cohorts performing GWAS.
Age-related osteoporotic fractures are common in the United
States and represent a major public health threat that is likely to
increase in importance as the population ages.(12) Although
osteoporotic fracture per se is a heritable trait, the fracture
phenotype presents a challenge for a genetic study: Nontrau-
matic fractures typically do not occur until later in life. Therefore,
quantitative risk factors for fracture [such as BMD, quantitative
ultrasound (QUS), and bone geometry] are used traditionally,(13–
19) especially because these surrogate traits may be measured
consistently at any age. Combinations of BMD assessments in
more than one region,(20) as well as composite use of BMD with
QUS(17) or BMD with hip geometry,(21) have been suggested to
improve risk assessment in clinical practice. In addition, it seems
worthwhile to use information on muscle mass and strength
together with bone mineralization and its spatial arrangement to
assess the risk of fragility because loads that are applied to the
skeleton are attributable to both overall body weight andmuscle
contractions. These musculoskeletal anatomic structures are a
conglomeration of multiple traits; some of them are phenoty-
pically and genetically correlated. Therefore, it is important to
understand how the relationship among traits is regulated(22) so
as to gain more insights into complex disease etiologies.
In this study we present a biclustering approach for identifying
common genetic architectures of different musculoskeletal traits
using GWAS data. Statistical model-based clustering is useful in
many applications, including gene expression analysis, but one
of its drawbacks is the necessity of allocating all samples (or
genes) to at least one cluster, which, owing to noise in the data,
may lead to artificial clusters that have no real biologic meaning.
One heuristic method that has been proposed to overcome
this problem is tight clustering,(23) in which only samples (or
variables) that are similar enough, according to some predefined
criterion, are clustered together, whereas the rest are left
ungrouped as outliers. However, this method works only in one
dimension, considering either samples or variables, and not if
both directions are to be considered simultaneously, as we wish
to do here. On the other hand, biclustering or block clustering(24–
28) is an approach to simultaneously cluster row and column
variables, deriving local subgroups within a data matrix. Many
biclustering methods also may be adapted so that not all
samples and variables need to be grouped (only ones that are
‘‘similar enough’’ according to some predefined measure). These
approaches have been used previously in discovering local
patterns in gene expression data.(25,26) Based on a Bayesian
statistical model framework proposed by Gu and Liu,(28) but with
modifications to increase the robustness and efficiency of the
1262 Journal of Bone and Mineral Research
model for dealing with the more massive GWAS data, we
developed a fast and accurate algorithm to identify block
clusters of single-nucleotide polymorphisms (SNP) and traits in
data arising from GWAS.(29)
We applied this method to results from bone and muscle traits
from the Framingham Osteoporosis Study. We studied GWAS
data on 23 traits and approximately 433,000 SNPs by a modifi-
cation of our block-clustering algorithm.(29) The primary aim of
this study was to identify homogeneous genetic architectures
among different musculoskeletal traits and to classify these traits
based on a reverse-phenotyping approach.(9) We hypothesized
that correlated musculoskeletal phenotypes would cluster
together based on their SNP associations (thus representing
‘‘phenotypic moduli’’(9)) and that the shared SNPs would indicate
a gene network that contributes to the development and/or
maintenance of the musculoskeletal traits (thus reflecting a
‘‘genetic modularity’’(30)).
Methods
Sample
The sample used for our analyses was derived from two cohorts
of the population-based Framingham Heart Study. Details of
the Framingham Osteoporosis Study (FOS), an ancillary study
of the Framingham Heart Study, have been reported.(31,32) In
brief, the FOS original and the offspring cohorts represent
members of two-generational (mostly nuclear) families recruited
at different times. Descriptions of the family samples with
musculoskeletal phenotypes available for analyses in the FOS are
provided elsewhere,(32,33) as well as being available publicly
through the dbGaP at http://view.ncbi.nlm.nih.gov/dbgap. For
this study, a sample of 2211 women and 1633 men who had
phenotypic measurements and who consented to genetic
analyses was available. Details on the FOS sample also are
available elsewhere.(34,35) The study was approved by the
institutional review boards for human subjects research of
Boston University and Hebrew SeniorLife.
Musculoskeletal phenotypes
The following measures were available in members of both
cohorts of the FOS:
Bone densitometry
The participants underwent dual-energy X-ray absorptiometry
(DXA) with a Lunar DPX-L device (Lunar Corp., Madison, WI, USA)
between 1996 and 2001 to assess BMD at the lumbar spine (LS),
femoral neck (FN), trochanter (TR), and whole body (TOT). The
coefficients of variation (CVs) in normal subjects for the DPX-L
have been reported previously as 0.9% for LS, 1.7% for FN, and
2.5% for TR.(31)
Quantitative ultrasound (QUS)
QUS of the right heel was performed to obtain calcaneal
broadband ultrasound attenuation (BUA) and speed of sound
(SOS) with a Sahara bone sonometer (Hologic, Inc., Waltham, MA,
USA) between 1996 and 2001. Based on duplicate same-day
GUPTA ET AL.

measurements on 29 subjects, CVs for BUA and SOS were 5.3%
and 0.4%, respectively.(36)
Hip geometry
DXA scans were measured with an interactive computer
program(37) that derived a number of proximal femoral structural
variables, including gross anatomic [femoral neck length (FNL,
cm) and neck-shaft angle (NSA, degrees)] and cross-sectional
indices (outer, or subperiosteal, width, cm), cross-sectional bone
area (CSA, cm2), and section modulus (Z, cm3) at the two femoral
regions (narrow neck, NN, and femoral shaft, S). CVs were
reported previously to range from 3.3% (NN outer diameter) to
9.1% (FNL).(37)
Body composition
We obtained whole-body DXA scans from the study participants
with the same Lunar DPX-L machine used for BMD and at
the same visit. The scans were collected at medium speed for
all subjects regardless of weight or body thickness. Regions of
interest were analyzed using the extended analysis of the Lunar
software for body composition. Lean mass was derived by
subtracting regional bonemineral content from the fat-freemass
of the whole body and lower extremities.
Metacarpal measurements by radiogrammetry
In the Framingham original cohort, right-hand radiographs were
obtained in 1967–1969, and the subsample of the offspring
cohort was radiographed using the same techniques in 1993–
1995(38,39) as part of the osteoporosis study. The digitized
radiographic images of the second, third, and fourth metacarpals
were measured semiautomatically (as described in detail
elsewhere(40)). CVs, calculated as root-mean-square average,(41)
ranged from 1.0% (bone length) to 7.0% (midshaft endosteal
diameter). Metacarpal length and midshaft width were mea-
sured directly, whereas cortical cross-sectional indices, such as
metacarpal cortical thickness (MCT, mm), cortical index (MCI, %),
and sectionmodulus (MZ, mm3), were calculated in themiddle of
bone diaphysis(42–44); values of metacarpals 2, 3, and 4 were
averaged.
Other measurements (covariates)
Information on age, sex, height, body mass index (BMI), and for
women, menopausal status and estrogen use were obtained at
the time of bone measurement. Details for these measurements
are available elsewhere.(31,45) Women were assigned to one of
two estrogenic status groups: (1) premenopausal or postmeno-
pausal on estrogen (estrogen replete) or (2) postmenopausal not
on estrogen (estrogen depleted).
Genotyping, quality control, and population structure
Genotyping was conducted through the FHS SHARe (SNP Health
Association Resource) project initiated in 2007 on all Framing-
ham Study participants with DNA available using the Affymetrix
500K (250K Sty and 250K Nsp) mapping array with addition of the
Affymetrix 50K MIP (gene-centric) supplemental array (Santa
Clara, CA, USA). Sample-level exclusions were a participant call
BLOCK CLUSTERING OF GENOME-WIDE ASSOCIATIONS
rate of less than 97%, a per-subject heterozygosity of�5 SD from
the mean, or a per-subject number of Mendelian errors greater
than 165 (99th quantile). Genotyping from 433,510 SNPs in 8481
individuals passed these quality-control measures. Eigenstrat
principal-components analysis(46) was applied to evaluate
population structure using a subset of 425,173 SNPs (minor
allele frequency [MAF]� 0.01, Hardy–Weinberg equilibrium
[HWE] p� 10�6, and call rate� 0.95). Ten principal components
(PCs) were calculated. Since the first 4 of the 10 top PCs were
significantly associated with some musculoskeletal traits
(p< .01), we consistently adjusted for PCs 1 through 4 in the
SNP association analyses.
Statistical analysis
Multivariable regression analysis was performed separately in
men and women from each cohort (original and offspring) to
obtain normalized residual phenotypes adjusted for concurrent
covariates. Cohort- and gender-specific residuals were combined
in ensuing analyses. Musculoskeletal traits were adjusted for age,
age2, height, PC1 through PC4, and estrogenic status. Bone
geometry traits additionally were adjusted for BMI.
Genome-wide association study
We performed GWAS analyses using population-based additive
linear mixed-effects (LME) models(47) with 433,510 SNPs in men
andwomen, separately. LME regressionmodels adjust for within-
family correlations in pedigrees of arbitrary sizes and varying
degrees of relationship. Additive genetic associations were
modeled using R-Kinship software (http://cran.r-project.org).
GWAS database mining
We extracted association statistics for SNPs nominally signifi-
cantly associated at a level less than 10�4 with any trait from the
list of 23 fracture-related phenotypes in LME analyses. There
were 1109 autosomal SNPs in the initial data set. To avoid
artifacts of clustering SNPs owing to patterns of linkage
disequilibrium (LD), we filtered SNPs using the Tagger software
(http://www.broadinstitute.org/mpg/tagger)(48) to exclude SNPs
in higher LD (pairwise genotypic r2� 0.5); we also used two
additional thresholds: a liberal (r2� 0.2) and a conservative, with
r2� 0.8. Since we randomly selected tag SNPs among a group of
SNPs in LD at each threshold, there were several replicates for
each data set. Randomly selected tag SNPs that are representa-
tive of a group at each LD threshold (r2� 0.2, 0.5, or 0.8) were
included in the biclustering procedure to reduce the effect of
correlation between the markers.
Block-clustering model and fitting algorithm
We used a Bayesian model framework for our biclustering (block-
clustering) algorithm. The details of the statistical model and
fitting algorithm are provided in the supplementary materials.
We use amodified version of the evolutionary Monte Carlo (EMC)
algorithm(49) to fit the model. After monitoring the algorithm
until it reaches convergence, we ultimately obtained the best
estimate of the block clusters given the observed data. In the
general case, when we can have more than one cluster in the
Journal of Bone and Mineral Research 1263

Table 1. Number of Significant Associated SNPs for the Indivi-
dual Phenotypes (at a< 10�4)
Trait
No. of SNPs
at a< 10�4 Lowest p value
1 TOT BMD 56 3.84� 10�6
2 FN BMD 53 3.86� 10�6
3 TR BMD 42 1.95� 10�6
4 LS BMD 46 1.45� 10�5
5 BUA 49 5.25� 10�6
6 SOS 51 3.43� 10�7
7 NSA 43 7.98� 10�7
8 FNL 44 5.57� 10�7
9 NN WID 58 4.15� 10�8
10 NN CSA 55 2.73� 10�6
11 NN BR 49 4.70� 10�6
12 NN Z 50 8.31� 10�8
13 S WID 34 9.71� 10�6
14 S Z 45 1.87� 10�7
15 S CSA 70 3.54� 10�6
16 S BR 56 3.02� 10�6
17 Metacarpal length 81 4.54� 10�7
18 Metacarpal WID 53 3.14� 10�7
19 MCI 65 2.61� 10�7
20 MCT 50 3.47� 10�7
21 MZ 62 1.37� 10�6
22 WBLM 61 2.18� 10�6
23 LLM 65 5.88� 10�7
data, we iteratively apply the algorithm repeatedly, adding block
clusters one at a time after one cluster is found in the data until
no more clusters can be found or at least one of the axes has
been completely allocated to block clusters (no more rows or
columns could be added to a cluster).
Bioinformatic analysis
Annotation
The gene annotation was done based on the UCSC table browser
for all RefSeq (hg18) genes. If the SNPwas located outside known
genic region, the nearest RefSeq gene was assigned as the gene
annotation. The distance between nongenic SNPs and the
nearest gene ranged from 32 to 1757 kbp.
Identification of enriched canonical pathway inclustered genes
To determine whether any canonical pathway was enriched in
the clustered SNPs, the clustered genes were imported into
Ingenuity Pathways Analysis (IPA) software (Ingenuity Systems,
Redwood City, CA, USA) to obtain networks for further analysis.
We used IPA to identify the top enriched canonical pathways.
The enriched canonical pathways were ranked by the p values of
the Fisher’s exact test, which indicated the probabilities that the
input genes (from the biclustered gene set) were associated with
genes in the canonical pathways by chance.
Gene network inference via knowledge-based data mining
We next analyzed biologic interactions among clustered genes
using the IPA tool. The gene annotations from the biclustered
SNPs were entered into the IPA analysis tool to construct
the biologic networks of the clustered genes. Networks are
generated from the biclustered gene set by maximizing the
specific connectivity of the input genes, which represents their
interconnectedness with each other relative to other molecules
with which they are connected in Ingenuity’s knowledge
database. Networks were limited to 35 molecules each to keep
them at a functional size. The p value of probability for the
genes forming a network was calculated with the right-tailed
Fisher’s exact test based on the hypergeometric distribution.
To gain biologic insights on whether this novel gene network
is associated with any known canonical pathways, we further
overlaid the novel gene network with canonical pathways using
IPA.
Because musculoskeletal traits are sexually dimorphic and the
genetic mechanisms are likely to be sex-specific,(50) the analyses
were performed separately in men and women. We focused on
results from the 2038 women because osteoporotic fractures are
more common in women, genetic regulation has been shown to
differ by gender,(50,51) and our sample size for women was
greater than for men.
Results
GWAS data set
GWAS analysis by linear mixed-effects models resulted in 1109
unique SNPs associated with the 23 studied traits at the lowest p
1264 Journal of Bone and Mineral Research
values ranging from p¼ 1.45� 10�5 to p¼ 4.15� 10�8 (Table 1).
The number of SNPs associated with each trait at a p value of less
than 10�4 ranged from 34 SNPs for femoral shaft width to 81
SNPs for metacarpal length. When filtered for LD, there were 668
SNPs at threshold r2� 0.5 (at thresholds r2� 0.8 and r2� 0.2,
there were 722 and 589 SNPs, respectively).
Block clustering of SNP data
We first applied the block-clustering algorithm to the data set
that consisted of regression coefficients from a single-SNP,
single-trait association test with an LD cutoff at r2� 0.5 to avoid
the artifact of clustering SNPs in linkage disequilibrium. The SNPs
were chosen randomly among the three replicates for the
specified LD cutoff. From Fig. 1, a clear cluster of traits and SNPs is
observed, the SNPs being negatively correlated with a group of
10 traits: BMD (LS, FN, TR, and TOT), both ultrasound measures,
and cross-sectional area (CSA) and section moduli (Z) of the
femoral neck and shaft.
Next, in order to test the consistency and robustness of our
algorithm to (1) initial choices of SNPs under the same LD cutoff
and (2) different LD cutoffs, we applied the block-clustering
algorithm to all the separate data sets under different LD cutoffs
(at thresholds r2� 0.8 and r2� 0.2). The same 10 traits, namely,
LS, FN, TR, and TOT BMD, both ultrasound measures, and CSA,
and Z of femoral neck and shaft, were clustered in each data set.
Similarly, the same SNPs were selected to be in the bicluster,
almost irrespective of LD thresholds (Supplemental Fig. S1).
GUPTA ET AL.
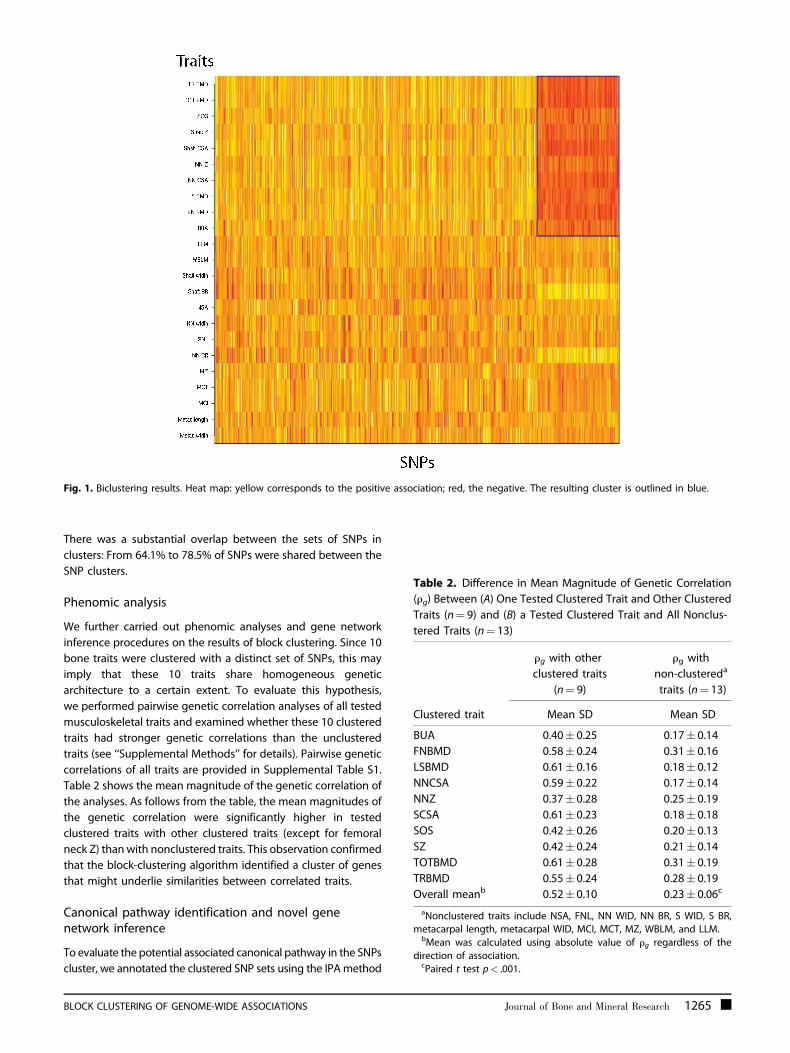
Fig. 1. Biclustering results. Heat map: yellow corresponds to the positive association; red, the negative. The resulting cluster is outlined in blue.
Table 2. Difference in Mean Magnitude of Genetic Correlation
(rg) Between (A) One Tested Clustered Trait and Other Clustered
Traits (n¼ 9) and (B) a Tested Clustered Trait and All Nonclus-
tered Traits (n¼ 13)
Clustered trait
rg with other
clustered traits
(n¼ 9)
rg with
non-clustereda
traits (n¼ 13)
Mean SD Mean SD
BUA 0.40� 0.25 0.17� 0.14
FNBMD 0.58� 0.24 0.31� 0.16
LSBMD 0.61� 0.16 0.18� 0.12
NNCSA 0.59� 0.22 0.17� 0.14
NNZ 0.37� 0.28 0.25� 0.19
SCSA 0.61� 0.23 0.18� 0.18
SOS 0.42� 0.26 0.20� 0.13
SZ 0.42� 0.24 0.21� 0.14
TOTBMD 0.61� 0.28 0.31� 0.19
TRBMD 0.55� 0.24 0.28� 0.19
Overall meanb 0.52� 0.10 0.23� 0.06c
aNonclustered traits include NSA, FNL, NN WID, NN BR, S WID, S BR,metacarpal length, metacarpal WID, MCI, MCT, MZ, WBLM, and LLM.bMean was calculated using absolute value of rg regardless of the
direction of association.cPaired t test p< .001.
There was a substantial overlap between the sets of SNPs in
clusters: From 64.1% to 78.5% of SNPs were shared between the
SNP clusters.
Phenomic analysis
We further carried out phenomic analyses and gene network
inference procedures on the results of block clustering. Since 10
bone traits were clustered with a distinct set of SNPs, this may
imply that these 10 traits share homogeneous genetic
architecture to a certain extent. To evaluate this hypothesis,
we performed pairwise genetic correlation analyses of all tested
musculoskeletal traits and examined whether these 10 clustered
traits had stronger genetic correlations than the unclustered
traits (see ‘‘Supplemental Methods’’ for details). Pairwise genetic
correlations of all traits are provided in Supplemental Table S1.
Table 2 shows the mean magnitude of the genetic correlation of
the analyses. As follows from the table, the mean magnitudes of
the genetic correlation were significantly higher in tested
clustered traits with other clustered traits (except for femoral
neck Z) than with nonclustered traits. This observation confirmed
that the block-clustering algorithm identified a cluster of genes
that might underlie similarities between correlated traits.
Canonical pathway identification and novel genenetwork inference
To evaluate the potential associated canonical pathway in the SNPs
cluster, we annotated the clustered SNP sets using the IPAmethod
BLOCK CLUSTERING OF GENOME-WIDE ASSOCIATIONS Journal of Bone and Mineral Research 1265

Table 3. Top Three Enriched Canonical Pathways in Clustered Data Set 05_01
Canonical pathways p Valuea Ratiob Molecules
Aldosterone signaling in epithelial cells .003 0.04 (4/95) PIK3R1, SCNN1B, NR3C2, PRKCH
Role of osteoblasts, osteoclasts, and chondrocytes in
rheumatoid arthritis
.006 0.03 (6/228) SFRP4, PIK3R1, WNT16, DKK2, BMP7, DKK1
Parkinson’s signaling .008 0.12 (2/17) GPR37, PARK2
aFisher exact p value.bRatio¼ number of molecules in a given pathway that meet cutoff criteria/total number of molecules in that pathway (numbers shown in
parentheses).
(hereafter, we refer to the gene annotation of the clustered SNPs as
clustered genes). The top three enriched canonical pathways are
listed in Table 3 (the full list of the top enriched canonical pathways
in clustered data sets is provided in Supplemental Table S2). The
aldosterone signaling in epithelial cells; role of osteoblasts,
osteoclasts, and chondrocytes in rheumatoid arthritis (RA); and
Parkinson’s signaling pathways are the top three canonical
pathways implicated in the analyzed data set (Fisher exact
p� .01). Other significant pathways that associated with the data
set are provided in Supplemental Table S3.
In addition to the fact that the clustered genes contained
enriched canonical pathways, they also may represent a novel
functional gene network. Therefore, we generated functional
gene networks from the clustered genes using IPA. The most
significant gene network [26S proteasome, AGAP1, ALCAM, BMP7,
COL1A2, collagen a1, collagen(s), cyclin E, DAB1, DKK1, ERK1/2,
focal adhesion kinase, GPR37, Hsp70, LY96, MAP2K1/2, NFkB
(complex), NKX3-1, PARK2, PI3K, PLAUR, POLR2A, PRKCH, PTPRZ1,
PVR, RIOK3, RNA polymerase II, RORA, SCNN1B, SIRPA, SMYD3,
SPRY2, TBX3, TNFAIP2, ubiquitin) had p value of 1� 10�44 (Fig. 2).
This gene network is predicted by the IPA to participate in
cellular assembly and organization, embryonic development,
and cellular movement functions.
Association of bone-related canonical pathways with thefunctional gene network
To gain insight on whether the functional networks were
associated with any known bone-related canonical pathways, we
overlaid the preceding functional network with canonical
pathways and focused on the top canonical pathways that
showed the greatest number of molecules within the gene
network that also participated in the pathway. In the gene
network presented in Supplemental Fig. S2, eight network
molecules showed association with two canonical pathways. The
top associated canonical pathways in this gene network are role
of osteoblasts, osteoclasts, and chondrocytes in RA and
molecular mechanisms of cancer.
Discussion
Osteoporosis is a complex trait with a relatively late age of onset,
making it a challenging disease to study. In terms of quantitative
genetics of complex traits, in the absence of a single valid
endophenotype (an internal feature of a disease(52)), pleiotropy
among the traits is expected to assist phenotypic prioritization
1266 Journal of Bone and Mineral Research
for a study. For example, to decide which is the best phenotype
for a planned genetic study, it is imperative to be able to clearly
distinguish signal from noise. This approach also results in
increased power when mapping correlated phenotypes if they
share pleiotropic genetic effects.(53) Our novel Bayesian block-
clustering algorithm adapted the technique of evolutionary
Monte Carlo(49) for high-dimensional SNP-phenotype data using
genetic information from GWAS. Each partition represented a
distinct cluster of SNPs that had similar effects over a particular
set of traits. Application of this method to our data showed
several SNP-trait connections. Thus we identified (1) 10 traits
showing homogeneous genetic architecture and (2) the
pleiotropic gene networks implicated in these clustered traits
that were connected with several bone-related canonical
pathways.
In this study, we analyzed many musculoskeletal phenotypes
because neither is a perfect proxy for osteoporotic fracture. For
example, among the hip geometry indices, in addition to Z and
CSA, there were femoral neck length, neck shaft angles, and
estimates of mean cortical thickness, cross-sectional moment of
inertia, and an index of bone structural instability (buckling ratio)
that play a role in local susceptibility to fracture.(54) Metacarpal
bone geometry measures also had been used in epidemiologic
research as well as in primary care to identify patients with
osteoporosis.(55–57) We also included the lean mass measures
because the loss of muscle mass with age (‘‘sarcopenia’’) is
accompanied by a decrease in muscle strength and reduced
loading of the skeleton.(58) Using the biclustering approach, we
found a strong cluster of high-magnitude coefficients and/or
lower p values for some bone traits associated with a subset of
SNPs. These 10 traits included BMD of several skeletal locations,
heel ultrasound measures, and cross-section area (CSA) and
section moduli (Z) of the femoral neck and shaft. Biologically,
these 10 traits represent a functional unit of ‘‘bone strength.’’
Indeed, BMD and heel ultrasound measures are among best
predictors of fracture risk.(17,20) For long bones, Z is an index of
bone bending strength, and CSA is an indicator of bone axial
compression strength; both are important indicators of structural
capacity to resist bending or compressive forces, respectively.
Identification of this clustering of bone strength traits can be
interpreted as a potential measure of success of our reverse-
phenotyping efforts. Because high values of the coefficients were
achieved for 10 traits clustering with a group of SNPs, we
hypothesized that these traits should share a strong homo-
geneous genetic architecture. In agreement with the hypothesis,
the mean magnitudes of genetic correlations among these 10
GUPTA ET AL.

Fig. 2. Gene network predicted by the Ingenuity Pathways Analysis based on the clustered genes. Shaded genes are clustered genes identified using the
biclustering algorithm.
traits were higher than with the nonclustered traits, implying that
the block-biclustering algorithm identified a cluster of genes that
form a gene network (or genetic module) that underlies these
traits.
BLOCK CLUSTERING OF GENOME-WIDE ASSOCIATIONS
Our clustering was independent of LD threshold and random
reshuffling of the associated SNPs; indeed, to reduce the effect
of correlation between the markers on the cluster analysis, we
constructed data sets with three thresholds of r2� 0.2, 0.5, and
Journal of Bone and Mineral Research 1267

0.8. Analyses of multiple replicates at the same LD threshold
demonstrated the consistency of our algorithm and its relative
robustness to LD threshold differences. The biclustering
approach also highlighted some aspects of how the SNPs were
selected. Although there was the expected variation in the SNPs
selected to be in a given bicluster based on the different LD-
based data sets, overall, the cluster was highly consistent with
regard to random reshuffling. Whether the selected genes are
truly associated with osteoporosis can only be shown empiri-
cally,(59) and it is not possible to validate our approach to
selection of ‘‘pleiotropic’’ candidate genes without further
functional investigation.
A closer investigation of the top connected networks
generated by IPA provided the following interesting biologic
insights: The most significant canonical pathway associated with
the gene clusters was aldosterone signaling in epithelial cells. It
has been well reported that aldosteronism affects bone
metabolism; for instance, bone mineral and bone strength are
lost in the presence of a high level of aldosterone.(60,61)
Interestingly, two (NR3C2 and PIK3R1) of four pathway genes
from the cluster have been demonstrated to be involved in bone
metabolism. NR3C2 encodes mineralcortical receptor (MR) that is
expressed in osteocytes, osteoblasts, and osteoclasts,(62) and
aldosterone activation of MR promotes osteoblastic differentia-
tion.(63) PIK3R1 encodes a subunit of phosphatidylinositol 3
kinase, which is an important mediator in both osteoblast and
osteoclast differentiation.(64–67) Although no known function of
PRKCH (protein kinase C, eta) and SCNN1B (epithelial sodium
channel) is reported in any bone cell or bone diseases, gene
expression of PRKCH in osteoblasts is correlated with other
bone markers (ie, osteocalcin, bone sialoprotein, and alkaline
phosphatase) at various differentiation and maturation
stages,(68) suggesting that PRKCH is a potential candidate gene
that affects bone metabolism.
The second most significant canonical pathway associated
with the gene clusters was the pathway responsible for
rheumatoid arthritis (RA). RA is a chronic inflammatory disease
that leads to strucutural destruction of both bones and joints.
The pathogenesis of RA in bone is an imbalance of the
osteoblast-osteoclast axis driven by inflammatory processes that
leads to excessive bone resorption by osteoclasts. Six genes
(SFRP4, WNT16, DKK2, BMP7, DKK1, and PIK3R1) from the cluster
are associated with this disease pathway. In fact, four among
these six genes also belong to the Wnt/b-catenin signaling
pathway,(69–71) except BMP7. BMP-7 plays a role in calcium
regulation and bone homeostasis by inducing cartilage and
bone formation. It is a Food and Drug Administration–approved
ectopic bone inducer for clinical use in long bone open fractures,
nonunion fractures, and spine fusion. Therefore, our findings
confirmed two important pathways that underlie the etiology of
osteoporosis and additionally identified PRKCH and SCNN1B as
the novel potential candidate genes that affect bone metabo-
lism.
The role of the third most significant canonical pathway,
the Parkinson’s signaling pathway, in bone strength is more
puzzling. Recent epidemiologic studies pointed out this con-
nection too. Thus, in community-dwelling older women with
Parkinson’s disease (PD), compared with those without it,
1268 Journal of Bone and Mineral Research
women with PD had 7.3% lower BMD.(72) Very similarly, older
men with PD had a significantly greater rate of annualized total
hip bone loss than those without parkinsonism.(73) Dopamine
transporter (Dat)–deficient mice manifest a low-bone-mass
phenotype.(74) We therefore believe that this tantalizing finding
should be explored further, whether or not there is a
dopaminergic-related connection between the diseases.
To further understand signaling cascades engaged by the
most significant gene networks, we overlaid the canonical
pathway genes with the gene network generated from our data
set. It was shown clearly that the top canonical pathways
associated with this new network are related to the skeletal
system (canonical pathway role of osteoblasts, osteoclasts, and
chondrocytes in rheumatoid arthritis). This observation sug-
gested that the gene network underlying bone strength is
governed by multiple signaling pathways and therefore that any
perturbation of these pathways may affect the gene network and
hence bone strength. Future experimentation will be required to
validate these bioinformatic observations.
This study is one of the first forays into phenomics of the
musculoskeletal system. Phenomics has a chance of changing
how we view heritable diseases first by defining latent
phenotypes that underlie genetically similar phenotype cate-
gories and second by revealing unexpected genetic links among
disease entities.(75) The incorporation of genetic data clearly
improves the quality of the predictions over those derived solely
from trait correlations,(76) although phenotypic overlap is often a
very good predictor of functional relatedness of the underlying
genes.(77) Thus van Driel and colleagues(78) found that similarity
between phenotypes did correlate positively with several
measures of gene function, including relatedness at the level
of protein sequence, protein motifs, functional annotation, and
direct protein-protein interaction. We similarly hypothesized that
the correlated phenotypes would share multiple associated
genetic variants. Obviously, there is also an effect of the shared
environmental factors or a confounding by an unmeasured—
intermediate—variable.(79) However, we recently found that the
phenotypic and genetic correlations between a pair of traits
rather than environmental correlation predict how many SNPs
are shared between the two traits.(35)
This study has several limitations. We used SNPs rather than
genes as a source of GWAS mining and later for the gene-
enrichment search. In rare cases where one SNP was located on
two overlapping genes, we mapped the SNP to both genes; by
this, we diminished a bias toward genes that were physically
close. Otherwise, genes with better annotation would be more
likely to be selected, which could result in a bias toward
assortment of well-investigated genes rather than novel
predicted or less well-characterized genes.(59,80) We focused
on SNP-based statistics for clustering because there is not a
widely agreed on and accepted theory for how to combine test
statistics on multiple SNPs in a gene into one single p value (to
obtain a maximum statistic to summarize association signals in
that gene). When multiple distinct variants in the gene
contribute to the overall association signal, the maximum
statistic no longer may be the best statistic to capture such
information.(81) As noted, our model was restricted to non-
overlapping clusters. We are cognizant that gene pathways
GUPTA ET AL.

overlap, as well as phenotypic modules, so that many gene
networks and pathways unavoidably will share the same
genes.(81) However, the restriction of clusters to not overlap
not only leads to a more rigorous model specification but also is
more likely to pick out nonredundant clusters, thus overcoming
one of the major drawbacks of other existing block-clustering
algorithms. Because of the inclusion and exclusion criteria that,
owing to redundant SNPs, might influence algorithm perfor-
mance, we checked the consistency of our results by analyzing
the data sets with several exclusion criteria based on LD between
the SNPs. We did not apply a similar threshold to the phenotypes,
whose selection was based on availability and epidemiologic
evidence of their associations with fracture rather than on
correlations among them. Because musculoskeletal traits are
sexually dimorphic and likely to be influenced by sex-specific
genetic mechanisms,(50) the analyses were performed separately
in men and women; however, we presented results from the
women because the sample size was greater, and women
experience more fractures than men. Results in men appear
similar; however, our study has insufficient power for a formal
comparison of the clustering results between the sexes. Finally,
in this study we adjusted musculoskeletal traits for age, height
(bone geometry for BMI), and estrogenic status; however, some
potentially important factors, such as exercise, diet, and shared
household among family members, were not accounted for.
In conclusion, we used GWAS results to examine pleiotropic
relationships between osteoporosis-related traits. We found a
distinct SNP cluster of negative coefficients of high magnitude
associated with 10 bone-strength phenotypes (mainly BMD,
ultrasound, and hip strength indices). The results of biclustering
can be used for finding modules within and between the
genome and the phenome,(9,30) data reduction, and choosing
the best phenotypes in the pathway to fracture. Accurate
understanding of disease phenotype can lead to success in
identifying genetic determinants for complex disease.(59)
Similarly, the SNP clusters pointed out the presence of potentially
pleiotropic genetic pathways involved in bone strength.
Targeting a gene network common for many aspects of a
disease may be a favorable approach for therapeutic agent
development or predicting the adverse effects of a drug. This
study thus presents a novel approach to the analysis of GWAS
data and provides directions for further refining of the
osteoporosis phenotype and genetic pathways on which to
focus in functional studies of osteoporosis.
Disclosures
All the authors state that they have no conflicts of interest.
Acknowledgments
The study was funded by grants from the US National Institute
for Arthritis, Musculoskeletal and Skin Diseases and National
Institute on Aging (R01 AR/AG 41398, R01 AR 050066, and
R01 AR 057118), as well as from the National Human Genome
Research Institute (R03 HG004946-01). The Framingham Heart
Study of the National Institutes of Health and Boston University
BLOCK CLUSTERING OF GENOME-WIDE ASSOCIATIONS
School of Medicine was supported by the National Heart, Lung,
and Blood Institute’s Framingham Heart Study (N01-HC-25195)
and its contract with Affymetrix, Inc., for genotyping services
(N02-HL-6-4278). A portion of this research was conducted using
the Linux Cluster for Genetic Analysis (LinGA-II) funded by the
Robert Dawson Evans Endowment of the Department of Med-
icine at Boston University School of Medicine and BostonMedical
Center.
References
1. Rivadeneira F, Styrkarsdottir U, Estrada K, et al. Twenty bone-mineral-
density loci identified by large-scale meta-analysis of genome-wide
association studies. Nat Genet. 2009;41:1199–1206.
2. Xiong DH, Liu XG, Guo YF, et al. Genome-wide association and follow-
up replication studies identified ADAMTS18 and TGFBR3 as bonemass
candidate genes in different ethnic groups. Am J Hum Genet.2009;84:388–398.
3. Kung AW, Xiao SM, Cherny S, et al. Association of JAG1 with bone
mineral density and osteoporotic fractures: a genome-wide associa-
tion study and follow-up replication studies. Am J Hum Genet.2010;86:229–239.
4. Kiel DP, Demissie S, Dupuis J, Lunetta KL, Murabito JM, Karasik D.
Genome-wide association with bone mass and geometry in the
Framingham Heart Study. BMC Med Genet. 2007;8:S14.
5. Liu YZ, Wilson SG, Wang L, et al. Identification of PLCL1 gene for hip
bone size variation in females in a genome-wide association study.
PLoS One. 2008;3:e3160.
6. Liu XG, Tan LJ, Lei SF, et al. Genome-wide association and replication
studies identified TRHR as an important gene for lean bodymass. Am
J Hum Genet. 2009;84:418–423.
7. Goh KI, Cusick ME, Valle D, Childs B, Vidal M, Barabasi AL. The humandisease network. Proc Natl Acad Sci U S A. 2007;104:8685–8690.
8. Wachi S, Yoneda K, Wu R. Interactome-transcriptome analysis reveals
the high centrality of genes differentially expressed in lung cancer
tissues. Bioinformatics. 2005;21:4205–4208.
9. Schulze TG, McMahon FJ. Defining the phenotype in human genetic
studies: forward genetics and reverse phenotyping. Hum Hered.
2004;58:131–138.
10. Harris TB, Launer LJ, Eiriksdottir G, et al. Age, Gene/EnvironmentSusceptibility-Reykjavik Study: multidisciplinary applied phenomics.
Am J Epidemiol. 2007;165:1076–1087.
11. Lussier YA, Liu Y. Computational approaches to phenotyping: high-throughput phenomics. Proc Am Thorac Soc. 2007;4:18–25.
12. Johnell O, Kanis JA. An estimate of the worldwide prevalence and
disability associated with osteoporotic fractures. Osteoporos Int.
2006;17:1726–1733.
13. Deng HW, Mahaney MC, Williams JT, et al. Relevance of the genes for
bonemass variation to susceptibility to osteoporotic fractures and its
implications to gene search for complex human diseases. Genet
Epidemiol. 2002;22:12–25.
14. Andrew T, Antioniades L, Scurrah KJ, Macgregor AJ, Spector TD. Risk
of wrist fracture in women is heritable and is influenced by genes that
are largely independent of those influencing BMD. J Bone Miner Res.2005;20:67–74.
15. van Meurs JB, Schuit SC, Weel AE, et al. Association of 5’ estrogen
receptor alpha gene polymorphisms with bone mineral density,
vertebral bone area and fracture risk. Hum Mol Genet. 2003;12:1745–1754.
16. Faulkner KG, Wacker WK, Barden HS, et al. Femur strength index
predicts hip fracture independent of bone density and hip axis
length. Osteoporos Int. 2006;17:593–599.
Journal of Bone and Mineral Research 1269

17. Gluer CC, Hans D. How to use ultrasound for risk assessment: a needfor defining strategies. Osteoporos Int. 1999;9:193–195.
18. Marshall D, Johnell O, Wedel H. Meta-analysis of how well measures
of bone mineral density predict occurrence of osteoporotic fractures
[see comments]. BMJ. 1996;312:1254–1259.
19. Kanis JA, Johnell O, Oden A, et al. The use of multiple sites for the
diagnosis of osteoporosis. Osteoporos Int. 2006;17:527–534.
20. Lu Y, Genant HK, Shepherd J, et al. Classification of osteoporosisbased on bonemineral densities. J BoneMiner Res. 2001;16:901–910.
21. Kaptoge S, Beck TJ, Reeve J, et al. Prediction of incident hip fracture
risk by femur geometry variables measured by hip structural analysis
in the study of osteoporotic fractures. J Bone Miner Res. 2008;23:1892–1904.
22. Jepsen KJ. Systems analysis of bone. WIREs Syst Biol Med. 2009;
14:73–88.
23. Tseng GC, Wong WH. Tight clustering: a resampling-based approachfor identifying stable and tight patterns in data. Biometrics. 2005;
61:10–16.
24. Hartigan JA. Direct clustering of a data matrix. J Am Stat Assoc.
1972;67:123–129.
25. Cheng Y, Church GM. Biclustering of expression data. Proc Int Conf
Intell Syst Mol Biol. 2000;8:93–103.
26. Kluger Y, Basri R, Chang JT, Gerstein M. Spectral biclustering ofmicroarray data: coclustering genes and conditions. Genome Res.
2003;13:703–716.
27. Madeira SC, Oliveira AL. Biclustering algorithms for biological data
analysis: a survey. IEEE/ACM Trans Comput Biol Bioinform. 2004;1:24–45.
28. Gu J, Liu J. Bayesian biclustering of gene expression data. BMC
Genomics. 2008;9 (Suppl 1): S4.
29. Gupta M. Two-way clustering of data matrices using a hierarchicalBayesian model. Technical report Dept. of Biostatistics. Boston, MA:
Boston University; 2010.
30. Segal E, Kim SK. The modular era of functional genomics. GenomeBiol. 2003;4:317.
31. Hannan MT, Felson DT, Dawson-Hughes B, et al. Risk factors for
longitudinal bone loss in elderly men and women: the Framingham
Osteoporosis Study. J Bone Miner Res. 2000;15:710–720.
32. Karasik D, Myers RH, Cupples LA, et al. Genome screen for quanti-
tative trait loci contributing to normal variation in bone mineral
density: the Framingham Study. J Bone Miner Res. 2002;17:1718–
1727.
33. Demissie S, Dupuis J, Cupples LA, Beck TJ, Kiel DP, Karasik D.
Proximal hip geometry is linked to several chromosomal regions:
Genome-wide linkage results from the Framingham Osteoporosis
Study. Bone. 2007;40:743–750.
34. Karasik D, Zhou Y, Cupples LA, Hannan MT, Kiel DP, Demissie S.
Bivariate genome-wide linkage analysis of femoral bone traits and leg
lean mass: Framingham study. J Bone Miner Res. 2009;24:710–718.
35. Karasik D, Hsu YH, Zhou Y, Cupples LA, Kiel DP, Demissie S. Genome-
wide pleiotropy of osteoporosis-related phenotypes: The Framing-
ham Study. J Bone Miner Res. 2010;25:1555–1563.
36. McLean RR, Hannan MT, Epstein BE, et al. Elderly cohort studysubjects unable to return for follow-up have lower bone mass than
those who can return. Am J Epidemiol. 2000;151:689–692.
37. Khoo BC, Beck TJ, Qiao QH, et al. In vivo short-term precision of hip
structure analysis variables in comparison with bone mineral densityusing paired dual-energy X-ray absorptiometry scans from multi-
center clinical trials. Bone. 2005;37:112–121.
38. Felson D, Couropmitree N, Chaisson C, et al. Evidence for Mendeliangene in a segregation analysis of generalized radiographic osteoar-
thritis. Arthritis Rheum. 1998;41:1064–1071.
1270 Journal of Bone and Mineral Research
39. Demissie S, Cupples L, Myers R, Aliabadi P, Levy D, Felson D. GenomeScan for Quantity of Hand Osteoarthritis: The Framingham Study.
Arthritis Rheum. 2002;46:946–952.
40. Karasik D, Shimabuku NA, Zhou Y, et al. A genome wide linkage scan
of metacarpal size and geometry in the Framingham Study. Am JHum Biol. 2008;20:663–670.
41. Gluer CC, Blake G, Lu Y, Blunt BA, Jergas M, Genant HK. Accurate
assessment of precision errors: how tomeasure the reproducibility ofbone densitometry techniques. Osteoporos Int. 1995;5:262–270.
42. Garn S, Rohmann C, Wagner B, Sascoli W. Continuing bone growth
throughout life: a general phenomenon. Am J Phys Anthropol.
1967;26:313–317.
43. Karasik D, Ginsburg E, Livshits G, Pavlovsky O, Kobyliansky E. Evidence
on major gene control of cortical bone loss in human population.
Genet Epidemiol. 2000;19:410–421.
44. Plato CC, Garruto RM, Yanagihara RT, et al. Cortical bone loss andmeasurements of the second metacarpal bone. I. Comparisons
between adult Guamanian Chamorros and American Caucasians.
Am J Phys Anthropol. 1982;59:461–465.
45. Kannel WB, Sorlie P. Some health benefits of physical activity. TheFramingham Study. Arch Intern Med. 1979;139:857–861.
46. Price AL, Patterson NJ, Plenge RM, Weinblatt ME, Shadick NA, Reich D.
Principal components analysis corrects for stratification in genome-wide association studies. Nat Genet. 2006;38:904–909.
47. Boerwinkle E, Chakraborty R, Sing CF. The use of measured genotype
information in the analysis of quantitative phenotypes in man. I.
Models and analytical methods. Ann HumGenet. 1986;50 (Pt 2): 181–194.
48. Barrett JC, Fry B, Maller J, Daly MJ. Haploview: analysis and visualiza-
tion of LD and haplotype maps. Bioinformatics. 2005;21:263–265.
49. Liang F, Wong WH. Evolutionary Monte Carlo: applications to modelsampling and change point problem. Statistica Sinica. 2000;10:317–
342.
50. Karasik D, Ferrari SL. Contribution of gender-specific genetic factorsto osteoporosis risk. Ann Hum Genet. 2008;72 (Pt 5): 696–714.
51. Karasik D, Cupples LA, Hannan MT, Kiel DP. Age, gender, and body
mass effects on quantitative trait loci for bone mineral density: the
Framingham study. Bone. 2003;33:308–316.
52. Almasy L, Blangero J. Endophenotypes as quantitative risk factors for
psychiatric disease: rationale and study design. Am J Med Genet.
2001;105:42–44.
53. Allison DB, Thiel B, St Jean P, Elston RC, Infante MC, Schork NJ.
Multiple phenotype modeling in gene-mapping studies of quanti-
tative traits: power advantages. Am J Hum Genet. 1998;63:1190–1201.
54. Rivadeneira F, Zillikens MC, De Laet CE, et al. Femoral neck BMD is a
strong predictor of hip fracture susceptibility in elderly men and
women because it detects cortical bone instability: the RotterdamStudy. J Bone Miner Res. 2007;22:1781–1790.
55. Adami S, Zamberlan N, Gatti D, et al. Computed radiographicabsorptiometry and morphometry in the assessment of postmeno-
pausal bone loss. Osteoporos Int. 1996;6:8–13.
56. Wishart JM, Horowitz M, Bochner M, Need AG, Nordin BE. Relation-
ships between metacarpal morphometry, forearm and vertebralbone density and fractures in post-menopausal women. Br J Radiol.
1993;66:435–440.
57. Kiel DP, Hannan MT, Broe KE, Felson DT, Cupples LA. Can metacarpalcortical area predict the occurrence of hip fracture in women and
men over 3 decades of follow-up? Results from the Framingham
Osteoporosis Study. J Bone Miner Res. 2001;16:2260–2266.
58. Rubin J, Rubin C, Jacobs CR. Molecular pathways mediating mechan-
ical signaling in bone. Gene. 2006;367:1–16.
GUPTA ET AL.

59. Tiffin N, Okpechi I, Perez-Iratxeta C, Andrade-Navarro MA, Ramesar R.Prioritization of candidate disease genes for metabolic syndrome by
computational analysis of its defining phenotypes. Physiol Genomics.
2008;35:55–64.
60. Law PH, Sun Y, Bhattacharya SK, Chhokar VS, Weber KT. Diuretics andbone loss in rats with aldosteronism. J Am Coll Cardiol. 2005;46:142–
146.
61. Chhokar VS, Sun Y, Bhattacharya SK, et al. Loss of bone minerals andstrength in rats with aldosteronism. Am J Physiol Heart Circ Physiol.
2004;287:H2023–2026.
62. Beavan S, Horner A, Bord S, Ireland D, Compston J. Colocalization of
glucocorticoid and mineralocorticoid receptors in human bone. JBone Miner Res. 2001;16:1496–1504.
63. Jaffe IZ, Tintut Y, Newfell BG, Demer LL, Mendelsohn ME.
Mineralocorticoid receptor activation promotes vascular cell calcifi-
cation. Arterioscler Thromb Vasc Biol. 2007;27:799–805.
64. Mandal CC, Ghosh Choudhury G, Ghosh-Choudhury N. Phosphati-
dylinositol 3 kinase/Akt signal relay cooperates with smad in bone
morphogenetic protein-2-induced colony stimulating factor-1 (CSF-
1) expression and osteoclast differentiation. Endocrinology. 2009;150:4989–4998.
65. Adapala NS, Barbe MF, Langdon WY, Tsygankov AY, Sanjay A.
Cbl-phosphatidylinositol 3 kinase interaction differentially regulatesmacrophage colony-stimulating factor-mediated osteoclast survival
and cytoskeletal reorganization. Ann N Y Acad Sci. 2010;1192:376–
384.
66. Ling L, Dombrowski C, Foong KM, et al. Synergism betweenWnt3a and heparin enhances osteogenesis via a phosphoinositide
3-kinase/Akt/RUNX2 pathway. J Biol Chem. 2010;285:26233–
26244.
67. Miraoui H, Oudina K, Petite H, Tanimoto Y, Moriyama K, Marie PJ.Fibroblast growth factor receptor 2 promotes osteogenic differentia-
tion inmesenchymal cells via ERK1/2 and protein kinase C signaling. J
Biol Chem. 2009;284:4897–4904.
68. Lampasso JD, Chen W, Marzec N. The expression profile of PKC
isoforms during MC3T3-E1 differentiation. Int J Mol Med. 2006;
17:1125–1131.
69. Kamiya N, Kobayashi T, Mochida Y, et al. Wnt Inhibitors Dkk1 andSost are downstream targets of BMP signaling through the type
BLOCK CLUSTERING OF GENOME-WIDE ASSOCIATIONS
IA receptor (BMPRIA) in osteoblasts. J Bone Miner Res. 2010;25:200–210.
70. van der Horst G, van der Werf SM, Farih-Sips H, van Bezooijen RL,
Lowik CW, Karperien M. Downregulation of Wnt signaling by
increased expression of Dickkopf-1 and -2 is a prerequisite forlate-stage osteoblast differentiation of KS483cells. J Bone Miner
Res. 2005;20:1867–1877.
71. Li X, Zhang Y, Kang H, et al. Sclerostin binds to LRP5/6 and antag-
onizes canonical Wnt signaling. J Biol Chem. 2005;280:19883–19887.
72. Schneider J, Fink H, Ewing S, Ensrud K, Cummings S. The association
of Parkinson’s disease with bonemineral density and fracture in older
women. Osteoporosis Int. 2008;19:1093–1097.
73. Fink H, Kuskowski M, Taylor B, Schousboe J, Orwoll E, Ensrud K.
Association of Parkinson’s disease with accelerated bone loss, frac-
tures and mortality in older men: the Osteoporotic Fractures in Men(MrOS) study. Osteoporosis Int. 2008;19:1277–1282.
74. Bliziotes MM, Eshleman AJ, Zhang XW, Wiren KM. Neurotransmitter
action in osteoblasts: expression of a functional system for serotoninreceptor activation and reuptake. Bone. 2001;29:477–486.
75. Oti M, Huynen MA, Brunner HG. Phenome connections. TrendsGenet. 2008;24:103–106.
76. Zhu J, Wiener MC, Zhang C, et al. Increasing the power to detect
causal associations by combining genotypic and expression data insegregating populations. PLoS Comput Biol. 2007;3:e69.
77. Brunner HG, van Driel MA. From syndrome families to functionalgenomics. Nat Rev Genet. 2004;5:545–551.
78. van Driel MA, Bruggeman J, Vriend G, Brunner HG, Leunissen JA. Atext-mining analysis of the human phenome. Eur J Hum Genet.
2006;14:535–542.
79. Drenos F, Talmud PJ, Casas JP, et al. Integrated associations of
genotypes with multiple blood biomarkers linked to coronary heart
disease risk. Hum Mol Genet. 2009;18:2305–2316.
80. Elbers CC, van Eijk KR, Franke L, et al. Using genome-wide pathway
analysis to unravel the etiology of complex diseases. Genet Epide-miol. 2009;33:419–431.
81. Wang K, Li M, Bucan M. Pathway-Based Approaches for Analysis of
Genomewide Association Studies. Am J Hum Genet. 2007;81:1278–1283.
Journal of Bone and Mineral Research 1271
Copyright © 2022 FDOKUMEN