Market Development for Genetically Modified Foods
313
Market Development for Genetically Modified Foods
-
Upload
khangminh22 -
Category
Documents
-
view
1 -
download
0
Transcript of Market Development for Genetically Modified Foods

Market Development for Genetically Modified Foods


Market Development for GeneticallyModified Foods
Edited by
Vittorio Santaniello
Dipartimento di Economia e IstituzioniUniversita degli Studi Roma ‘Tor Vergata’
Rome, Italy
Robert E. Evenson
Economic Growth CenterDepartment of Economics
Yale UniversityConnecticut, USA
and
David Zilberman
Department of Agricultural and Resource EconomicsUniversity of California
Berkeley, USA
CABI Publishing
CABI Publishing is a division of CAB International
CABI Publishing CABI PublishingCAB International 10 E 40th StreetWallingford Suite 3203Oxon OX10 8DE New York, NY 10016UK USA
Tel: +44 (0)1491 832111 Tel: +1 212 481 7018Fax: +44 (0)1491 833508 Fax: +1 212 686 7993Email: [email protected] Email: [email protected] site: www.cabi-publishing.org
© CAB International 2002. All rights reserved. No part of this publication may bereproduced in any form or by any means, electronically, mechanically, by photocopy-ing, recording or otherwise, without the prior permission of the copyright owners.
A catalogue record for this book is available from the British Library, London, UK
Library of Congress Cataloguing-in-Publication DataMarket development for genetically modified foods / edited by Vittorio Santaniello,Robert E. Evenson, and David Zilberman.
p. cm.Includes bibliographical references and index.Papers presented at a conference.ISBN 0–85199–573-X (alk. paper)
1. Genetic engineering industry--Europe--Congresses. 2. Genetically modified foods--Europe--Congresses. 3. Food industry and trade--Europe--Congresses. 4. Genetic engineering industry--North America--Congresses.5. Genetically modified foods--North America--Congresses. 6. Food industry andtrade--North America--Congresses. 7. Market surveys--Europe--Congresses. 8. Market surveys--North America--Congresses. I. Santaniello, V. II. Evenson,Robert E. (Robert Eugene), 1934-III. Zilberman, David.
HD9999.G453 E8516 2001381’.45664--dc21 2001043187
ISBN 0 85199 573 X
Typeset in Adobe Garamond by Wyvern 21 Ltd, Bristol.Printed and bound in the UK by Cromwell Press, Trowbridge.
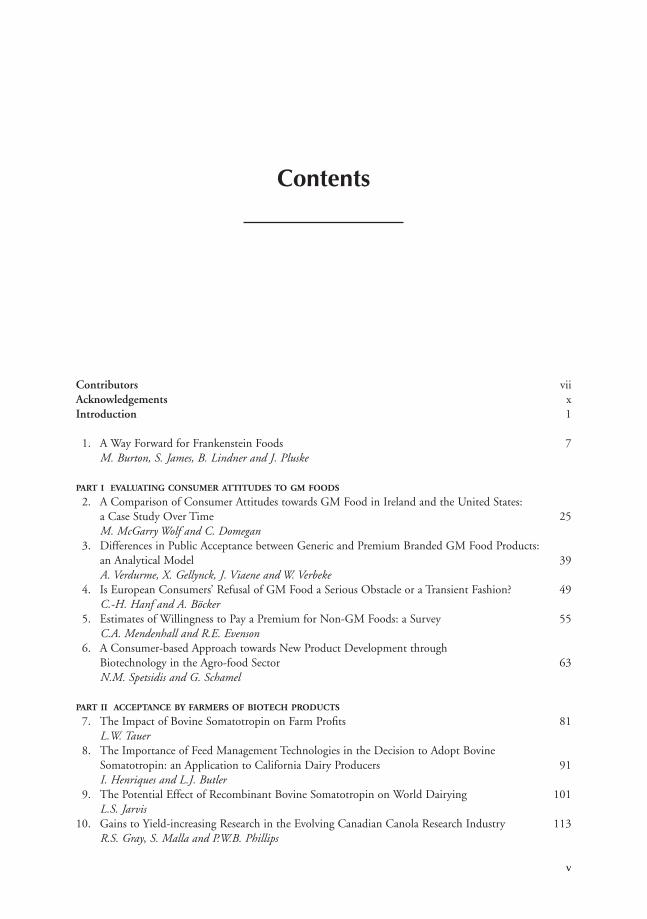
Contents
Contributors viiAcknowledgements xIntroduction 1
1. A Way Forward for Frankenstein Foods 7M. Burton, S. James, B. Lindner and J. Pluske
PART I EVALUATING CONSUMER ATTITUDES TO GM FOODS
2. A Comparison of Consumer Attitudes towards GM Food in Ireland and the United States:a Case Study Over Time 25M. McGarry Wolf and C. Domegan
3. Differences in Public Acceptance between Generic and Premium Branded GM Food Products: an Analytical Model 39A. Verdurme, X. Gellynck, J. Viaene and W. Verbeke
4. Is European Consumers’ Refusal of GM Food a Serious Obstacle or a Transient Fashion? 49C.-H. Hanf and A. Böcker
5. Estimates of Willingness to Pay a Premium for Non-GM Foods: a Survey 55C.A. Mendenhall and R.E. Evenson
6. A Consumer-based Approach towards New Product Development throughBiotechnology in the Agro-food Sector 63N.M. Spetsidis and G. Schamel
PART II ACCEPTANCE BY FARMERS OF BIOTECH PRODUCTS
7. The Impact of Bovine Somatotropin on Farm Profits 81L.W. Tauer
8. The Importance of Feed Management Technologies in the Decision to Adopt BovineSomatotropin: an Application to California Dairy Producers 91I. Henriques and L.J. Butler
9. The Potential Effect of Recombinant Bovine Somatotropin on World Dairying 101L.S. Jarvis
10. Gains to Yield-increasing Research in the Evolving Canadian Canola Research Industry 113R.S. Gray, S. Malla and P.W.B. Phillips
v

11. Determinants of GMO Use: a Survey of Iowa Maize–Soybean Farmers’ Acreage Allocation 127C. Alexander, J. Fernandez-Cornejo and R.E. Goodhue
12. Estimating Adoption of GMO Soybeans and Maize: a Case Study of Ohio, USA 141D.A. Darr and W.S. Chern
13. Ex ante Economic Assessment of Adopting Genetically Engineered Crops in Finland 159J. Niemi and M. Virolainen
14. Biotechnology, Farm Management and Local Agricultural Development 167M.T. Gorgitano and V. Sodano
PART III THE ROLE OF INFORMATION SYSTEMS AND OF ASSOCIATED REGULATORY DEVELOPMENTS
15. Public Acceptance of and Benefits from Agricultural Biotechnology: a Key Role for VerifiableInformation 179W.E. Huffman and A. Tegene
16. Science and Regulation: Assessing the Impacts of Incomplete Institutions and Information in the Global Agricultural Biotechnology Industry 191S. Smyth and P.W.B. Phillips
17. Quantifying Scientific Risk Communications of Agrobiotechnology 205L.A. Marks, S. Mooney and N. Kalaitzandonakes
18. Time Series Analysis of Risk Frames in Media Communication of Agrobiotechnology 217L.A. Marks, N. Kalaitzandonakes, K. Allison and L. Zakharova
19. Case Study in Benefits and Risks of Agricultural Biotechnology: Roundup Ready Soybeans 227J.E. Carpenter and L.P. Gianessi
20. Labelling for GM Foods: Theory and Practice 245P.W.B. Phillips and H. McNeill
21. Estimating the Costs of Segregation for Non-biotech Maize and Soybeans 261W.W. Lin
22. Endogenous Demand and Optimal Product Regulation: the Case of Agricultural Biotechnology 271A. Artuso
PART IV INDUSTRY STRUCTURE ISSUES
23. Tobin’s q and the Value of Agriceutical Firms 279M. Boland
24. The Structure of the European Agro-food Biotechnology Industry: Are Strategic AlliancesHere to Stay? 283W.B. Traill and C.E. Duffield
25. Market Structure in Biotechnology: Implications for Long-run Comparative Advantage 291B.F. Lavoie and I.M. Sheldon
26. Biotechnology in the Supply Chain: Managing a Product Differentiating Technology 301R.D. Weaver and T. Kim
Index 313
vi Contents

Corinne Alexander, Department of Agricultural and Resource Economics, University of California, OneShields Avenue, Davis, CA 95616, USA
Kevin Allison, Economics and Management of Agrobiotechnology Center, Department of AgriculturalEconomics, University of Missouri-Columbia, 125D Mumford Hall, Columbia, MO 65211, USA. Presentaddress: Harvard University, John F. Kennedy School of Government, USA
Anthony Artuso, Department of Agricultural Food and Resource Economics, 55 Dudley Road, Cook College,Rutgers University, New Brunswick, NJ 08901, USA
Andreas Böcker, Department of Agricultural Economics and Market Research, Justus-Liebig-University,Senckenbergstrasse 3, 35390 Giessen, Germany
Michael Boland, Department of Agricultural Economics, 342 Waters Hall, Kansas State University,Manhattan, KS 66506, USA
Michael Burton, Department of Agricultural and Resource Economics, Faculty of Agriculture, University ofWestern Australia, 35 Stirling Highway, Crawley (Perth), WA 6009, Australia
Leslie J. Butler, Department of Agricultural and Resource Economics, Room 2111, Social Science andHumanities, University of California, One Shields Avenue, Davis, CA 95616, USA
Janet E. Carpenter, National Center for Food and Agricultural Policy, 1616 P Street NW, First Floor,Washington, DC 20036, USA
Wen S. Chern, Department of Agricultural, Environmental and Development Economics, The Ohio StateUniversity, 2120 Fyffe Road, Columbus, OH 43210, USA
David A. Darr, Department of Agricultural, Environmental and Development Economics, The Ohio StateUniversity, 2120 Fyffe Road, Columbus, OH 43201, USA
Christine Domegan, Department of Marketing, National University of Ireland, Newcastle Road, Galway,Ireland
Christopher E. Duffield, Department of Agricultural and Food Economics, PO Box 237, The University ofReading, Reading, RG6 6AR, UK
Robert E. Evenson, Economic Growth Center, Department of Economics, Yale University, New Haven, CT06520, USA
Jorge Fernandez-Cornejo, Economic Research Service, USDA, 1800 M. Street, NW Room 4052, Washington,DC 20036-5831, USA
Xavier Gellynck, Faculty of Agriculture and Applied Biological Sciences, Department of AgriculturalEconomics, Division of Agro-Marketing, Ghent University, Coupure Links 653-9000, Ghent, Belgium
Contributors
vii
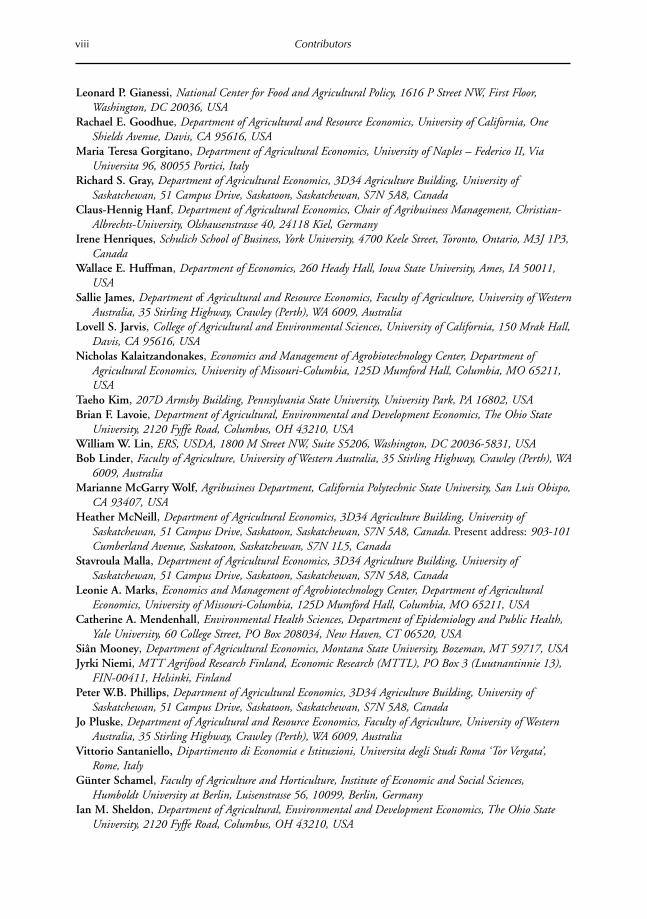
viii Contributors
Leonard P. Gianessi, National Center for Food and Agricultural Policy, 1616 P Street NW, First Floor,Washington, DC 20036, USA
Rachael E. Goodhue, Department of Agricultural and Resource Economics, University of California, OneShields Avenue, Davis, CA 95616, USA
Maria Teresa Gorgitano, Department of Agricultural Economics, University of Naples – Federico II, ViaUniversita 96, 80055 Portici, Italy
Richard S. Gray, Department of Agricultural Economics, 3D34 Agriculture Building, University ofSaskatchewan, 51 Campus Drive, Saskatoon, Saskatchewan, S7N 5A8, Canada
Claus-Hennig Hanf, Department of Agricultural Economics, Chair of Agribusiness Management, Christian-Albrechts-University, Olshausenstrasse 40, 24118 Kiel, Germany
Irene Henriques, Schulich School of Business, York University, 4700 Keele Street, Toronto, Ontario, M3J 1P3,Canada
Wallace E. Huffman, Department of Economics, 260 Heady Hall, Iowa State University, Ames, IA 50011,USA
Sallie James, Department of Agricultural and Resource Economics, Faculty of Agriculture, University of WesternAustralia, 35 Stirling Highway, Crawley (Perth), WA 6009, Australia
Lovell S. Jarvis, College of Agricultural and Environmental Sciences, University of California, 150 Mrak Hall,Davis, CA 95616, USA
Nicholas Kalaitzandonakes, Economics and Management of Agrobiotechnology Center, Department ofAgricultural Economics, University of Missouri-Columbia, 125D Mumford Hall, Columbia, MO 65211,USA
Taeho Kim, 207D Armsby Building, Pennsylvania State University, University Park, PA 16802, USABrian F. Lavoie, Department of Agricultural, Environmental and Development Economics, The Ohio State
University, 2120 Fyffe Road, Columbus, OH 43210, USAWilliam W. Lin, ERS, USDA, 1800 M Street NW, Suite S5206, Washington, DC 20036-5831, USABob Linder, Faculty of Agriculture, University of Western Australia, 35 Stirling Highway, Crawley (Perth), WA
6009, AustraliaMarianne McGarry Wolf, Agribusiness Department, California Polytechnic State University, San Luis Obispo,
CA 93407, USA Heather McNeill, Department of Agricultural Economics, 3D34 Agriculture Building, University of
Saskatchewan, 51 Campus Drive, Saskatoon, Saskatchewan, S7N 5A8, Canada. Present address: 903-101Cumberland Avenue, Saskatoon, Saskatchewan, S7N 1L5, Canada
Stavroula Malla, Department of Agricultural Economics, 3D34 Agriculture Building, University ofSaskatchewan, 51 Campus Drive, Saskatoon, Saskatchewan, S7N 5A8, Canada
Leonie A. Marks, Economics and Management of Agrobiotechnology Center, Department of AgriculturalEconomics, University of Missouri-Columbia, 125D Mumford Hall, Columbia, MO 65211, USA
Catherine A. Mendenhall, Environmental Health Sciences, Department of Epidemiology and Public Health,Yale University, 60 College Street, PO Box 208034, New Haven, CT 06520, USA
Siân Mooney, Department of Agricultural Economics, Montana State University, Bozeman, MT 59717, USAJyrki Niemi, MTT Agrifood Research Finland, Economic Research (MTTL), PO Box 3 (Luutnantinnie 13),
FIN-00411, Helsinki, Finland Peter W.B. Phillips, Department of Agricultural Economics, 3D34 Agriculture Building, University of
Saskatchewan, 51 Campus Drive, Saskatoon, Saskatchewan, S7N 5A8, CanadaJo Pluske, Department of Agricultural and Resource Economics, Faculty of Agriculture, University of Western
Australia, 35 Stirling Highway, Crawley (Perth), WA 6009, Australia Vittorio Santaniello, Dipartimento di Economia e Istituzioni, Universita degli Studi Roma ‘Tor Vergata’,
Rome, ItalyGünter Schamel, Faculty of Agriculture and Horticulture, Institute of Economic and Social Sciences,
Humboldt University at Berlin, Luisenstrasse 56, 10099, Berlin, GermanyIan M. Sheldon, Department of Agricultural, Environmental and Development Economics, The Ohio State
University, 2120 Fyffe Road, Columbus, OH 43210, USA

Contributors ix
Stuart Smyth, Department of Agricultural Economics, 3D34 Agriculture Building, University ofSaskatchewan, 51 Campus Drive, Saskatoon, Saskatchewan, S7N 5A8, Canada
Valeria Sodano, Department of Agricultural Economics, University of Naples – Federico II, Via Universita 96,80055 Portici, Italy
Nickolas M. Spetsidis, Faculty of Agriculture and Horticulture, Institute of Economic and Social Sciences,Humboldt University of Berlin, Luisenstrasse 56, 10099 Berlin, Germany. Present address:55 A. Papandreou Avenue, GR-71305, Iraklion – Crete, Greece
Loren W. Tauer, Cornell University, 451 Warren Hall, Ithaca, NY, 148503, USAAbebayehu Tegene, Resource Economic Division, ERS, USDA, 1800 M Street NW, Room 54194,
Washington DC, 20036-5837, USAW. Bruce Traill, Department of Agricultural and Food Economics, PO Box 237, The University of Reading,
Reading, RG6 6AR, UKWim Verbeke, Faculty of Agriculture and Applied Biological Sciences, Department of Agricultural Economics,
Division of Agro-Marketing, Ghent University, Coupure Links 653-9000, Ghent, Belgium Annelies Verdurme, Faculty of Agriculture and Applied Biological Sciences, Department of Agricultural
Economics, Division of Agro-Marketing, Ghent University, Coupure Links 653-9000, Ghent, BelgiumJacques Viaene, Faculty of Agriculture and Applied Biological Sciences, Department of Agricultural Economics,
Division of Agro-Marketing, Ghent University, Coupure Links 653-9000, Ghent, BelgiumMeri Virolainen, MTT Agrifood Research Finland, Economic Research (MTTL), PO Box 3 (Luutnantinnie
13), FIN-00411, Helsinki, FinlandRobert D. Weaver, 207D Armsby Building, Pennsylvania State University, University Park, PA 16802, USALudmila Zakharova, Economics and Management of Agrobiotechnology Center, Department of Agricultural
Economics, University of Missouri-Columbia, 129D Mumford Hall, Columbia, MO 65211, USADavid Zilberman, Department of Agricultural and Resource Economics, University of California, Berkeley, CA
94720, USA
Acknowledgements
This book has arisen from the conference entitled Biotechnology, Science and Modern Agriculture: a NewIndustry at the Dawn of the Century, convened by the International Consortium on AgriculturalBiotechnology Research (ICABR), held in Ravello, Italy on 15–18 June 2001.
The editors would like to acknowledge the sponsorship provided by the following institutions:CEIS–University of Rome ‘Tor Vergata’; Center for Sustainable Resource Development, University ofCalifornia at Berkeley; and Economic Growth Center, Yale University. The editors would also like to thankthe Italian National Research Council (CNR) for its financial support of the conference.
x
The investment climate for firms producing geneti-cally modified (GM) agricultural products haschanged considerably in recent months. In the US,transgenic crop production has reached very highlevels. The global area planted to transgenic cropsreached approximately 40 Mha in 1999 (12 coun-tries planted transgenic crops and 84% of transgenicarea was in industrialized countries). This was a verypromising beginning for GM products.
However, consumer resistance has turned outto be much stronger than anticipated. Consumerattitudes regarding GM foods are being expressed ina setting where premiums and discounts for GMfood products and GM-free food products havegenerally not yet emerged. At least part of the prob-lem can be seen as a coordination problem. Thesuppliers of ag-biotech products sell to farmers whoproduce GM foods. These foods in turn must beprocessed and marketed by the food industry.Consumer attitudes (after all, ‘the customer isalways right’) must be reflected in farm productmarkets and in farm input (ag biotech) markets.
Consumer movements have already promotedgovernment actions in the form of import restric-tions and prohibitions of the sale of GM products.These actions have the support of groups with alliedinterests. Farm producer groups in importing coun-tries and in the European Union generally have aninterest in maintaining both tariff and non-tariffbarriers to trade. They thus have common interestswith consumer groups opposing GM food sales,even though they may not share consumer attitudes.
The opposition to GM foods has also beenincorporated into broader political movementsopposing ‘globalization’ and related issues. Thegrowth in the political opposition to the expansionin world trade and to the international organizationssupporting this expansion, notably the World TradeOrganization (WTO), but including the WorldBank and the International Monetary Fund, has alsobeen surprising. This movement has many conflict-ing cross currents and reflects a number of interests.Because biotechnology interests and particularlyGM concerns have been incorporated into thisbroader movement, policy issues associated withGM and GM-free food markets are more urgent.
This urgency is further heightened by the cur-rent (early 2001) rise in concern over a related foodissue, the ‘Mad Cow’ disease issue, in a number ofEuropean countries. As there are more reports of theincidence of this disease and of related incidence ofCreutzfeldt-Jakob disease in human populations,confidence in governments’ capacity to monitor andprevent food-related illnesses has fallen. This loss ofconfidence in food safety and regulatory agenciesspills over to biotechnology issues associated withthe environment. It is perhaps not an exaggerationto suggest that public confidence in food safety andregulatory agencies was, particularly in Europe,lower at the end of the 20th century than at almostany other time during the century.
All parties engaged in agricultural biotech-nology activities – the firms developing biotechproducts, the farmers producing food and other
1
Introduction
Robert E. Evenson, Vittorio Santaniello and David Zilberman
© CAB International 2002. Market Development for Genetically Modified Foods(eds V. Santaniello, R.E. Evenson and D. Zilberman)
products, the food and related agribusiness industri-al firms and the consumers of food – will be affectedby changes in regulatory, trade and food safetyregimes. The present system is in disequilibrium.Changes are rapidly being made. Economists have anopportunity and a responsibility to inform and influ-ence these changes to produce a new equilibriumthat is in the public interest in all countries. This newequilibrium may well take different forms in differ-ent countries, but international issues are involved.
It is difficult to predict, at this point, how themove towards a new equilibrium will unveil itself.We almost certainly will see strong labelling require-ments and segregated markets. The current GMproducts are being sold as ‘cost-saving’ products tofarmers. Future products will very likely have foodquality elements for consumers. As price differen-tials and quality differentials become available toconsumers, new equilibria will emerge. The foodindustry has a record of success in introducing manynew products into food markets each year.
The acceptance of biotech products in thehealth field suggests that consumers are likely toaccept GM products that they believe contribute totheir welfare. As new GM foods incorporate desir-able health-related features, it is quite likely thatthey will gain consumer acceptance. Recent devel-opments in Europe indicate that the scientific estab-lishment is attempting to develop better informa-tion for the public regarding safety issues. With therecent publication in Science and Nature of theHuman Genome, a landmark in biological sciencehas been achieved. There is little doubt that a scien-tific revolution is underway and that it will affect theway we do science and the way we produce technol-ogy in the future.
The International Consortium on AgriculturalBiotechnology Research (ICABR) hosted the fourthin a series of conferences on Economics ofAgricultural Biotechnology at Ravello, Italy, on24–28 August 2000. Papers presented at that con-ference (and at the preceding conferences as well)addressed many of the relevant economic policyissues inherent in the move to a new market equi-librium. A subset of those papers is included in thisvolume, which addresses market development issuesin developed countries, primarily in Europe andNorth America. This volume focuses on consumerreactions to GM food information and regulatoryissues, farmer acceptance of biotech products, andchanges in industrial organization in the life scienceand food sector.
The volume is organized in four parts. Part Iincludes chapters evaluating consumer attitudes toGM foods. Part II addresses the acceptance by farm-ers of biotech products. Part III addresses the role ofinformation systems and of associated regulatorydevelopments. Part IV addresses industry structureissues.
The studies reported in this volume do notconstitute a comprehensive treatment of all policyissues associated with GM product market develop-ment. The industries and economic entities are deal-ing with changing conditions and problems contin-uously. In this context, these studies should informand improve this complex process.
The initial chapter by Burton et al. provides ageneral framework for assessing the nature of thenew equilibrium under conditions of market devel-opment as opposed to an equilibrium produced bya high degree of regulation and prohibition of pro-duction and sale of GM food products. The alterna-tives of a partially regulated market outcome withlabelling, segregation and certification and a highlyregulated market outcome with trade prohibitionsand selective food prohibitions are real. The failureto move towards a partially regulated market out-come will lead to the alternative highly regulatedoutcome.
Chapter 1 sets forth the fundamentals for mar-ket development, with labelling and segregation. Amodel is developed and applied to a GM crop(canola). While the model itself is technical, it isinstructive in that it illustrates the types of premi-ums and discounts in the food markets that emergefrom consumer preferences, which are then reflectedin farm price premiums and discounts for canolawith and without GM content. The model incorpo-rates costs of identity preservation. Alternative sim-ulations of the model illustrate the complexities ofmoving to a new market equilibrium. The simula-tions show the importance of identity preservationcosts and of the incorporation of a technology fee bythe suppliers of the biotech seeds. Net welfare meas-ures are also calculated.
Part I of this volume includes five chapters address-ing consumer attitudes and preferences. As the firstchapter demonstrates, if sufficient consumer prefer-ence exists, premiums for non-GM goods willemerge (alternatively, discounts for GM foods willemerge). The magnitude of these premiums (dis-counts) will ultimately depend not just on the cur-rent attitudes of consumers, but on attitudes and on
2 R.E. Evenson et al.
a ‘willingness to pay’ non-GM premiums over a longperiod of time. One of the difficulties of assessingconsumer attitudes under conditions where the pre-miums are not actually paid is that there is uncer-tainty about how consumers will actually behavewhen faced with premiums.
Chapter 2 (Wolf and Domegan) reports a com-parison of consumer attitudes in the USA andIreland. The authors use market survey researchtechniques to develop this comparison. Their sur-veys sought to determine differences in Europeanand US attitudes. Interestingly, the chapter reports asimilar level of familiarity with GM goods betweenconsumers in the USA and Ireland. A minority ofconsumers in both countries indicated a willingnessto pay a non-GM food premium. Consumers inIreland also attributed more negative attributes toGM foods.
Chapter 3 (Verdurme et al.) reports findingsfrom a literature survey, group discussions and in-depth interviews of European consumers where adistinction is made between premium branded andnon-branded food products. This study finds thatconsumer attitudes towards GM technology weremore negative than attitudes towards specific GMfood products. The chapter also reports that, amongGM products, premium branded products are bet-ter accepted than generic products.
Chapter 4 (Hanf and Böcker) focuses on thenon-GM premium and the perception of health andother dangers associated with GM foods. Theauthors conclude that consumers are likely to con-tinue to hold attitudes regarding dangers that aredifficult to overcome with cost reductions. They alsoconclude that high quality GM foods are unlikely toovercome consumer hesitation regarding GMfoods.
Chapter 5 (Mendenhall and Evenson) reports asmall survey of consumers’ ‘willingness to pay’ a pre-mium for non-GM foods. This survey illustrates animportant dimension of market development.Consumers will ultimately have to pay a premiumsufficient to cover the identity preservation (segrega-tion and certification) costs associated with non-GM foods if these markets are to develop. Theauthors find that consumers want labelling but thatnot all are willing to pay a premium for non-GMfoods. The chapter concludes, however, that forfood products where the ratio of consumer value tofarm value is high, even small non-GM premiumscan support non-GM markets.
Chapter 6 (Spetsidis and Schamel) provides a
review of studies of new product development anddiscusses consumer acceptance of GM food prod-ucts in the context of this literature. The chapterprovides a useful European perspective to GM foodissues.
The studies in Part I of this volume are gener-ally based on attitude surveys and related market sur-vey techniques. To date, few true market experimentswhere non-GM foods are actually priced at a premi-um have been conducted. As non-GM premiums(GM discounts) emerge, more studies of consumerattitudes, and especially of ‘willingness to pay’, willbe required to establish guidelines for non-GMproduct market developments. These new studieswill be informed by the studies reported here.
Part II of the volume includes eight chaptersaddressing farmer acceptance and farm profitabilityof ag biotech products. Three chapters (7, 8 and 9)deal with farmer acceptance of bovine somatotropin(bST), one of the earliest biotech products intro-duced to farmers. Other chapters deal with cropbiotech products. These chapters find that farmershave adopted several biotech products rapidly. In thecase of some crop products, diffusion rates havebeen comparable to hybrid maize diffusion rates inthe 1930s and green-revolution wheat and rice dif-fusion rates in the 1960s.
Farmer acceptance of biotech products hasbeen driven by profitability. However, acceptance ofthese products to date has been under conditionswhere few GM discounts have been in place. Thechapters are important in indicating the extent ofprofitability and hence of the possible effects of GMdiscounts on this market.
Chapters 7 and 8 report bST adoption in NewYork (Chapter 7, Tauer) and California (Chapter 8,Henriques and Butler). The New York study reportsrepeated surveys of 138 dairy farms for the years1994 through 1997. Statistical procedures for selec-tivity bias are utilized in the study. This study findsthat bST use results in increased milk productionper cow, but that higher than average profits forbST are generally not being realized. The studyfinds, under one statistical procedure, that only thewell-managed, high-profit farms make profits frombST. The California study of bST adoption consid-ered the complementary use of feed managementpractices. This study concluded that feed manage-ment techniques are important to bST adoption and use. The study has implications for extensionservices.
Introduction 3

Chapter 9 (Jarvis) provides a comprehensivereview of bST adoption in the USA and in 16 othercountries where the technology has been adopted.This study also concludes that bST rewards man-agement skills and higher quality feed. Attitudinal aswell as economic factors are considered in the study.
Chapters 10–13 report evaluations of cropbiotech adoption. Canola is the subject of Chapter10 (Gray et al.). Canola is exceptional in that itemerged from minor crop status in the 1950s to thatof a major crop in Canada today. Plant breeders’rights were important in encouraging private sectorinvestment in canola research. Chapter 10 reportsestimates of rates of return to canola research. Itconcludes that biotechnology has yet to producemeasurable high social rates of return in the canolasector.
Chapter 11 (Alexander et al.) reports a study of adoption of GM maize and soybeans by Iowamaize–soybean farmers. The study concludes thatearly adopters of GM maize and soybean fit the styl-ized facts of early adopters for other agriculturalinnovation.
Chapter 12 (Darr and Chern) reports a surveyof Ohio farmers designed to measure attitudes,beliefs and behaviours. Adoption rates are estimatedfor GMO maize and soybeans.
Chapters 13 and 14 report assessments ofadoption of GM crops in Europe. Chapter 13(Niemi and Virolainen) reports adoption rates ofGM crops in Finland and concludes that GM tech-nology will lower farm costs, increase yields andprovide improved insurance against pests. The chap-ter also considers the implications for consumersand for farm income.
Chapter 14 (Gorgitano and Sodano) evaluatesthe potential effects of biotechnology on theprocessed tomato sector in southern Italy. This studyconsiders local agricultural development issues.
Part III of the volume includes eight chaptersaddressing the information, regulatory and institu-tional issues associated with market development.
Chapter 15 (Huffman and Tegene) provides ananalytical review of models of information and com-munication of information. Verifiable informationis critical to efficient market development. It canreduce the scope for disputes and uncertainty. Oneof the responsibilities of social scientists is to objec-tively evaluate data and provide policy makers withanalytical insight. The development of more verifi-able information will have considerable social value.
Chapter 16 (Smyth and Phillips) also address-es the role of information in shaping the regulatoryenvironment for biotech products. A contrastbetween responses to controversial scientific studiesin the USA (where regulatory agencies have highcredibility) and the UK (where they do not) isdrawn. The chapter concludes that the UK regula-tory responses to consumer concerns were likely tobe more costly and less efficient than the US regula-tory response to similar concerns.
Chapter 17 (Marks et al.) focuses on how therisks of ag biotech have been communicated via themedia in the USA and UK. The media can be seenas one of many influences in the overall acceptanceof ag biotech by consumers. Acceptance has differedbetween the two countries and media reporting haslikewise differed significantly.
Chapter 18 (Marks et al.) documents a poten-tial gap in perceived food safety risks and benefitsbetween food scientists and reporters. The authorsfind, from the journals investigated, that no safetytests of GM foods have been published in them and,hence, are not in the public domain. A tentativeconclusion is that the media (and the public) do nothave easy access to studies of the safety (or lackthereof ) of GM foods from peer-reviewed sources,although this conclusion cannot be generalized to alljournals.
Chapter 19 (Carpenter and Gianessi) reports acase study of risk assessment practice in the case of amajor agricultural biotech product, Roundup Readysoybeans. The study concludes that ‘no indication ofgreater health or environmental risks were foundcompared to those associated with conventionalvarieties’. The study also reports estimates of eco-nomic benefits from reduction in weed controlcosts.
Chapters 20 and 21 report studies addressingtwo important components of identity preservation:labelling, and segregation and certification costs.
Chapter 20 (Phillips and McNeill) reviews thecurrent state of labelling requirements in a numberof countries. The study reports that 18 countriesplus the EU, 29 manufacturers, 21 retailers and sixrestaurant chains have signalled intentions to adoptvoluntary or mandatory labels for GM foods. Thestudy found little convergence in labelling standards.
Chapter 21 (Lin) provides information on thecosts of segregation and certification that are essen-tial to the development of non-GM food markets.There are very few data on segregation costs, andthis study provides badly needed data. It concludes
4 R.E. Evenson et al.
that costs depend on tolerance levels for biotechcontent. The chapter also discusses implications forthe grain handling industry.
In Chapter 22 (Artuso), a formal model ofoptimal product regulation is presented. The linkbetween consumer risk perceptions and regulatorypolicy is emphasized. Under certain conditions it is shown that regulatory requirements may be called for other than those based on scientific riskassessment.
Part IV of the volume includes four chaptersaddressing industrial development to date. It shouldbe noted that the ag-biotech industry is in a state ofdisequilibrium at present.
Chapter 23 (Boland) examines agricultural or‘Life Science’ firm performance. The techniqueapplied is to determine value of Tobin’s q (the ratioof a firm’s market role to its asset value) for firms inthe ag-biotech industries. All firms studied had qvalues greater than one with pharmaceutical firmshaving the highest values.
Chapter 24 (Traill and Duffield) examines theEuropean agro-food biotechnology industry. Theauthors note that the industry has developed‘alliances’ with universities and specialized or dedi-
cated biotech firms. The chapter relies on the‘dynamic capabilities’ business strategy model tosuggest that these alliances are likely to be main-tained over long periods.
Chapter 25 (Lavoie and Sheldon) also exam-ines the dynamics of the biotechnology industry.The role of foreign-based multinational firms in theUSA is considered. The US comparative advantagein these industries is analysed in a real optionsframework. This framework explains the earlieradvantage of US firms. It is also used to explain whyforeign multinationals find it attractive to be in thenew consolidating industrial structure in the USA.
The final chapter in the volume, Chapter 26(Weaver and Kim), addresses industry structure inan integrative supply chain assessment. As noted inthe early part of this review, ag-biotechnology deci-sions made in one part of the supply chain (thebiotech-supplying firms) have implications for otherparts of the supply chain (farmers and the foodindustry). At present, important tensions andincompatibilities must be resolved between differentparts of the supply chain. Chapter 26 offers insightsfor managing technologies for different parts of thesupply chain.
Introduction 5


1 As reported by Thomas Walkom, The Toronto Star, Editorial, ‘GMO folks have a little surprise from Alberta’, 2 May 2000 (www.plant.uoguelph.ca/safefood).
Introduction
Up until the end of the 1990s the future for geneti-cally modified organisms (GMOs) looked bright.Plantings of transgenic soybean, maize, cotton andcanola by American, Argentine and Canadian farm-ers set new benchmarks for the rate of adoption of anew agricultural technology. Virtually the onlycloud on the horizon was widespread consumerresistance to GMOs in Europe. Industry assumedthat this was a temporary problem that could beovercome by an ‘educational programme’ that pro-vided more information about the benefits ofGMOs (Marshall, 1998).
Now, though, the outlook has changed.Consumer resistance to GMOs has intensifiedrather than waned in Europe. Furthermore, it hasnow spread to many other countries as well. Even inCanada and the USA, there are press reports ofsupermarket chains stocking items labelled as genet-ically-modified (GM)-free.1 Moreover, the effect ofeducation programmes may be questionable givenfindings by Zechendorf (1998) that suggest con-sumer acceptance depends on people’s socio-cultur-al attitudes as well as their knowledge about thebenefits of biotechnology.
Despite the uncertainty surrounding consumeracceptance of GMOs, there are lessons to be learntfrom studies of innovation adoption. First and fore-
most, for an innovation to be adopted enduringly, itmust not only create value but also must delivermeaningful net benefits to all potential adopters.That is, the benefits of adoption must be distributedall along the supply chain, including to consumers.
Genetically engineered crops that are alreadybeing grown commercially include tobacco, cotton,soybean, corn/maize, canola/rapeseed, tomato andpotato. In a review, James (1999) noted that seventransgenic crops were grown commercially by 1996on approximately 2.8 Mha, mostly in the US andCanada. Between 1996 and 1998, there was a fur-ther increase in the global area of transgenic crops to27.8 Mha (James, 1999). As James (1999) pointsout adoption rates have been some of the highestever for new agricultural technologies, and reflectgrower satisfaction with significant benefits rangingfrom more flexible crop management, higher pro-ductivity and a safer environment through decreaseduse of conventional pesticides and herbicides.
To date, the overwhelming majority of GMfoods are the products of first generation GM crops.The principal transgenic traits in 1999 were herbi-cide tolerance, insect and viral resistance, and hybridtechnology (James, 1999). As explained by Fultonand Keyowski (1999a), these ‘input traits’ loweraverage costs of production through some combina-tion of reduced costs of control of, and/or smallerlosses from weed, pest and disease infestation, and
7
1 A Way Forward forFrankenstein Foods
Michael Burton, Sallie James, Bob Lindner and Jo PluskeFaculty of Agriculture, University of Western Australia, Perth, Australia
© CAB International 2002. Market Development for Genetically Modified Foods(eds V. Santaniello, R.E. Evenson and D. Zilberman)

through increased yields. Because these beneficialtraits can be introduced into a plant without dis-turbing the rest of the plant’s genetic code, theresulting varieties are potentially much more prof-itable for growers. Realized profitability will fallshort of potential profitability to the extent that aproduct price discount applies to the GM crop,and/or to the extent that growers have to pay a pre-mium to grow the GM crop relative to comparable‘conventional’ crop varieties. Even though thesecrops may deliver lower costs of production to farm-ers, they typically deliver no or least negligible ben-efits to consumers2 unless some of the lower pro-duction costs are passed on as lower retail prices forGM food relative to non-GM food. This has nothappened to date, and will not happen until thenecessary preconditions of retail labelling under-pinned by a credible and verifiable system of identi-ty preserved production and marketing are imple-mented.
Second generation or quality enhanced GMcrops, most of which are still under development,incorporate crop attributes that provide direct bene-fits to the consumer, or in some cases to intermedi-ate producers. Delayed ripening tomatoes, oilseedrape with modified fatty acid, high oleic acid soy-bean, and carnations with extended shelf-life andmodified colour, are examples of second generationcrops that are already in commercial production.Some companies are predicting that the third gener-ation of GM crops will be nutraceuticals.Nutraceuticals are foods that prevent or treat dis-eases or otherwise provide medical or health bene-fits. GMOs that include genes coding for pharma-ceutical drugs are touted as GM crops of the future.In contrast to first generation crops, qualityenhanced crops have not been widely adopted so far(James, 1999).
Alerted by activists, consumers are increasinglyaware of public health concerns about GMOs andthis appears to be the most important considerationregarding their development and use. Within thescientific community, there also are worries aboutthe long-term effects on human health (for example,through the use of antibiotic resistant marker genesand the risk of allergen transfer) and the environ-ment from widespread use of genetically engineeredcrops. Other concerns about GM crops include theinfluence of multinational seed companies on coun-
tries’ economies; and the possible demise of thesmall-scale farmer. While various special interestgroups share these concerns, it is a growing reluc-tance to eat GM food by the general public that islimiting the size of the market for GMOs, threaten-ing the realization of substantial value creation fromgenetic manipulation technologies and perhaps eventhreatening the financial viability of some life sci-ence companies.
Some advocates of GM foods point out thatconsumer reactions to real price differentiatedchoices (as opposed to hypothetical choices)between conventional (i.e. non-GM) and GM foodshave yet to be observed (see, e.g. Caulder, 1998) fora significant number of foodstuffs. They anticipatethat when consumers are more regularly exposed toGM foods, and compare them favourably (or at leastneutrally) with conventional foods, the anticipatedprice differential between GM and non-GM foodswill create a viable market for GM foods (Caulder,1998). If correct, such a response will belie the sur-vey results that suggest such a market is likely to besmall at best.
Work completed by Gamble et al. (2000) indi-cates that when second generation foods becomeavailable, the market for these foods may be largerthan for first generation foods as consumers appre-ciate the extra direct benefits they offer (such aslonger shelf-life, or enhanced nutritional value). It ispossible, depending on the extent of extra benefitsand the willingness of consumers to accept any per-ceived risk associated with the technology, that theseproducts might command a price premium overconventional foods.
That is, for now, a hypothetical scenario. Theimmediate challenge facing producers and advocatesof GM foods is to convince consumer and environ-mental groups that regardless of its generation, anyfood produced using recombinant gene technologyis safe to consume and to produce. General accept-ance of second and third generation crops will notbe realized if the market potential of first generationcrops is thwarted by health and environmental fears,regardless of their legitimacy.
For the biotechnology industry, there is a clearlesson about how to solve the consumer ‘problem’and current lack of demand for GMOs. Trying toallay consumer concerns about the health risk fromeating GMOs by relying on scientific argument has
8 M. Burton et al.
2 There may be indirect benefits to consumers by knowing farmers benefit from lower on-farm costs or by valuingreduced environmental costs.

not, and will not succeed. Consumers want to beassured about the origins of their food, and waysmust be found to allow them to knowingly choosebetween GM and non-GM foods. Moreover, prod-ucts from first generation GM crops will have to sellat a discount (relative to the GM-free equivalents) toinduce significant numbers of consumers to buythem.
The technology component of GM foods is,for our purposes here, a credence attribute. Thismeans that the technology used to produce a (firstgeneration) food is indistinguishable to the con-sumer both before and after purchase (Caswell andMojduszka, 1996; Caswell, 2000). Thus the onlyway a non-GM food producer is able to elicit a pricepremium for his or her product is by indicating thestatus of the product by the use of a label supportedby a credible testing and assurance programme.
So long as identity preservation remains hap-hazard and labelling regulations ambiguous, pricepremiums for any type of good – GM or non-GM,first, second or third generation – are likely to besmall.3 That is, so long as there is no way of differ-entiating between types of good, consumers have nocertain or reliable way of knowing whether the foodthey eat is GM-free. Producers of GM-free productsare unable to advertise (with any integrity) the sta-tus of their product and, as such, rational consumerswill be unwilling to pay more than the ‘non-seg-mented’ market price. This is especially true for firstgeneration GM foods since there are no enhancedattributes from which consumers could derive extra(direct) benefit. Consumer rejection of GM foods isrational if they are not offered it at a lower price.After all, what rational consumer would accept a‘bad’ characteristic in the absence of no offsettingbenefits such as a lower price?4
To deliver a price premium for non-transgenicfood, industry must provide verifiable labelling andmaintain credible identity preserved production andmarketing (IPPM) systems, thus facilitating choiceby consumers of food products that align with theirpreferences. However, work completed by KPMG(1999) indicated that the introduction of an IPPMsystem could prove to be prohibitively expensive.This conclusion, however, is difficult to sustain
given the current widespread practice of segregatingdifferent grades of non-GM crops to separate high-er added value products from other commodities inorder to exploit niche markets. In the case of GMcrops, it is the absence of genetic engineering infood that is the key ‘attribute’ being demanded, soonly non-transgenic food would need to be segre-gated in the marketing chain, labelled and subject tosome form of verification. A particularly appositecase is marketing systems for organic food.
Buckwell et al. (1999) estimated that theincreased cost of segregating GM products couldrange between 5 and 15% of the usual farm gateprice. Despite this cost, the same authors explainthat there could be benefits both to consumers andto farmers as long as consumers are willing to paythe added cost of separating GM from non-GMcrops. Labelling is likely to be the most efficientalternative because market forces would determinethe acceptance of the new technology. So long asmost people demand food that is GM-free, theadvantage of labelling may be minimal, andarguably even unnecessarily expensive if IPPM costsexceed cost savings from growing first generationGM crops. If and when demand for non-transgenicfood declines in the longer run to the point where itbecomes a speciality product, then requiring com-pulsory labelling of GMOs is likely to prove undulycostly. Ultimately, the magnitude and cost structureof an IPPM system will determine, inter alia, themarket determined equilibrium level of the pricedifferential between GM and non-GM foods atfarm gate, and at retail level.
The rest of this chapter reports the findingsfrom some preliminary analyses of the impact onprices at farm gate and at retail of introducing a sys-tem of retail labelling of non-GM food. Estimatedprice differentials obviously depend on the likelycosts of introducing and maintaining a credibleIPPM system. Of interest here is the nature of mar-ket segmentation and price differentiation after afirst generation GM crop (canola, in this example) isproduced and marketed. The simple model that fol-lows explores some possible scenarios for futureprices for GM and non-GM canola under a few keyassumptions. Firstly, the GM crop is of the first
A Way Forward for Frankenstein Foods 9
3 Price premiums for non-GM food will, of course, be market determined, and depend on the proportion of supplythat is non-GM. Recent market reports for maize and soybean have, however, reported premiums of 10–15% and5–35%, respectively (Miranowski et al., 1999).
4 This clearly ignores the possibility of consumers buying GM food because they derive utility from knowing it hasbeen produced using techniques beneficial to the environment.
generation such that consumers will not purchasefood produced using GM canola unless it is sold ata lower price than conventional canola. Clearly themodel would need to be adjusted to allow for anypositive attributes associated with GM foods, suchas those in second or third generation GM foods.Secondly, the production function for both types offoods is assumed to be constant returns to scale witha constant elasticity of substitution. The market ischaracterized by perfect competition. Identitypreservation costs are presented as simple fixed costsin each market.5
Model Specification
Formal modelling of the market with segregatedproduction/consumption will be presented in twoparts. In the first, a simplified model is developedwhich allows for an analytical solution, but is restric-tive. In the second, a more general model is present-ed which can be solved numerically, but not analyt-ically. These models are similar in structure to thosedeveloped by Fulton and Keyowski (1999b) andFalck-Zepeda et al. (1999) but provide a number ofextensions. There is a more formal representation ofthe technology than used in either. Our models alsoremove the restriction of a fixed output level used byFulton and Keyowski, and do not assume that allconsumers accept the product, as assumed by Falck-Zepeda et al.
The simple model
Representative demand functions for the two typesof good, non-GM (subscript, n) and GM (subscript,g) are assumed to be simple linear functions of (nor-malized) own price. It is assumed that at the indi-vidual level, consumers make a decision to purchaseeither one or the other, but not both. Hence, theprice of the alternative form of the product is not anargument to the representative demand functions:
dn = a0 + a1Pn (1.1)
dg = a0 + a1Pg (1.2)
However, the relative price of the two goods doesdetermine which form of the product is selected. As
the good under consideration is a first generationGM crop, there are no intrinsic benefits in con-sumption. Hence we assume there will be nodemand for the GM version if the prices of the twoforms are equal. This is consistent with the argu-ment above that even the slightest residual percep-tion of risk from consuming the product, or concernabout potential non-consumptive issues (on farmecological effects for example) will lead consumersto reject GMOs unless there is price differential.
Assume that there is some latent index of con-cern, c, and some underlying discrete choice processwhich means consumer i will consume the GMproduct if:
f (Pg / Pn) < ci (1.3)
That is, if the price differential is large enough theywill be induced to change. Assuming the functionf (•) is linear in the price ratio, and that c is distrib-uted across the population as a uniform variablefrom 0 to 1, the share of the population that con-sumes non-GM is determined by:
Sn = Pg / Pn (1.4)
With no loss of generality, normalizing the con-sumer population size to unity gives aggregatedemands of:
Dn = (a0 + a1Pn) Pg / Pn (1.5)
Dg = (a0 + a1Pg) (1 – Pg / Pn) (1.6)
The supply side of the model is represented by themarginal cost of production:
MCn = b0 + b1(Qn + Qg) (1.7)
MCg = b0 – bt + b1(Qn + Qg) (1.8)
where bt is the cost advantage enjoyed by the GMcrop. Assuming b1 is positive implies a rising mar-ginal cost, determined by the aggregate productionof both crops. Given the similarity in the two goods,it would be expected that there will be interactionsbetween the two goods in production, leading eitherto joint decreasing marginal productivity ofresources, or common impacts on costs through theinput markets.
Assuming profit maximization and perfectcompetition allows one to equate the marginal cost
10 M. Burton et al.
5 Market forces (specifically the relative elasticities of supply and demand) will determine the incidence of IPPM costs.The likely scenario is that farmers will have to bear part of the cost of segregating, testing and marketing of non-GMcrops and consumers will bear the rest through higher prices.

with the product price, and the market clearing con-dition of Dj = Qj allows a solution to be identified.
Defining Q as aggregate quantity (i.e. Dn + Dg)of both crops leads to:
Q = (a0+ a1Pn)Pg / Pn + (a0 + a1Pg)(1 – Pg / Pn)
(1.9)
Pn = b0 + b1Q + IPn (1.10)
Pg = b0 – bt + b1Q + IPg (1.11)
where Pn and Pg are prices at retail, and IPj is themarginal cost of identity preservation of crop j whenthe GM crop is introduced.
Substituting Equations 1.10 and 1.11 intoEquation 1.9 leads to a single equation which can besolved for Q (see Appendix I), which can then beused to identify prices and quantities of the individ-ual commodities.
The model leads to a number of intuitive con-clusions. So long as there are no identity preserva-tion (IP) costs, the extent of market penetration ofthe GM crop will be directly related to the degree ofcost advantage it enjoys. Furthermore, there will bean increase in the aggregate market for the com-modity as the average cost of producing GMOs fallsbecause the increase in the GM segment of the mar-ket will be larger than the non-GM segment it dis-places. Since marginal cost is specified to rise withincreasing aggregate output, the marginal cost andhence price of the non-GM commodity must risefollowing the introduction of the GM crop. In turn,this will cause a movement along the representativenon-GM demand curve, which will compound thereduction in non-GM demand due to the segmen-tation of the market. The greater the cost advantageenjoyed by the GM crop, the greater the size of theseeffects. Introduction of an IP cost on the non-GMproduct widens the gap between GM and non-GMprices, although the rise in non-GM prices willdepend on the elasticities of non-GM demand andsupply curves: the standard incidence argument.However, that widening will cause further restruc-turing of the market between the two crops. Theintroduction of IP costs on the GM product alonecan simply be seen as an offset for the technologicalcost reduction. If the IP cost is sufficiently large, theGM product may not be able to penetrate themarket.
If the IP costs fall on both sectors, and they arelarge enough, it is possible for both consumer prices
to rise relative to the pre-GM situation, and foraggregate consumption/production to be less. Thiswould lead to the interesting situation that aggregatewelfare would be reduced, and yet all markets wouldbe in equilibrium, and there would be no competi-tive pressure for production of GM to cease.
The model structure used here is rather restric-tive. In particular, the segmentation of the market isa linear function of the ratio of prices, and onemight expect that the expansion of the GM sectorwould accelerate as the price differential expanded.Secondly, the production side of the market is verysimplified, with no differentiation of technicalchange and input market effects on the marginalcost of production.
The extended model
Attempts to derive analytical solutions from moreelaborate models were not successful. Consequently,it was decided to resort to numerical methods toobtain solutions from a somewhat more realisticmodel outlined below. Dropping the requirementfor the model to be solved analytically allowed anumber of changes to be made, including explicitintroduction of production functions utilizing twoinputs, characterized respectively as a seed and her-bicide complex on the one hand, and on the other acomposite factor for all other inputs, including land.Nevertheless, it should be noted that the model isstill very simplified. In particular, the model doesnot explicitly include trade; processing and market-ing activities are subsumed into supply/demandfunctions; and it is assumed that there is a singleconsumer good generated from the farm product(i.e. joint or by-products are not considered).
The representative demand functions areexpressed as a constant elasticity form:
dn = a0Pna1 (1.12)
dg = a0Pga1 (1.13)
The function determining the share of the marketallocated to non-GM is extended, as the proportionof the people consuming the GM product may risenon-linearly as the price differential increases:
Sn = (Pg / Pn)l l > 1 (1.14)
This gives aggregate demands of:
A Way Forward for Frankenstein Foods 11

Dn = a0Pna1(Pg / Pn)
l (1.15)
Dg = a0Pga1(1 – (Pg / Pn)
l) (1.16)
The production functions are given by a two-inputconstant returns to scale (CRTS), constant elasticityof substitution (CES) production function:
(1.17)
(1.18)
where k1n is the amount of input 1 used by the non-GM sector, k2n, the amount of input 2 and so on.
In the GM sector t1 and t2 are the input aug-menting technical change associated with the newinnovation. Setting t1 > 1 implies that k1g is becom-ing more effective. Hicks neutral technical changecan be represented by setting tg > 1.
The other parameters in the function can beinterpreted as follows: g is a general scaling factor; ddetermines (in part) the slope of the isoquant andmust lie between 0 and 1 for it to be downwardsloping; while q determines the elasticity of substi-tution (s) between the two inputs (s = 1/(1 + q)).
For this CRTS, CES the marginal costs of pro-duction are given by:
(1.19)
(1.20)
where P1 and P2 are the prices of k1 and k2 respec-tively, and tf is the technology fee charged by theprovider of the improved inputs. The form of thisfee will be described later, when the model is param-etrized.
Assuming profit maximizing, perfectly com-petitive behaviour, one can directly infer that atequilibrium the product price and marginal cost willbe equal, allowing for any identity preservation coststhat may arise:
Pn = MCn + IPn (1.21)
Pg = MCg + IPg (1.22)
With fixed input prices (P1, P2), marginal costs arenot dependent on the scale of production, andEquations 1.19 to 1.22 will define the product pricefor the two commodities, and hence the resultingdemands. However, things are more interesting ifone makes the input markets endogenous.
The optimal input demand, for a given level ofoutput, is given by:
(1.23)
(1.24)
(1.25)
(1.26)
The (inverse) supply curve associated with eachinput is assumed to be linear and a function ofaggregate input demand:
P1 = b0 + b1(K1n + K1g) (1.27)
P2 = b2 + b3(K2n + K2g) (1.28)
So, although there are no direct interactionsbetween the two types of goods on the cost of pro-duction as a result of changing output levels, thereare indirect effects through the input markets.
12 M. Burton et al.
Q k kn n n= + -( )[ ]- - -g d dq q q
1 2
11
/
Q t t k t kg g g= ( ) + -( )( )È
ÎÍ
˘
˚˙
- --
g d dgq q
q
1 1 2 2
1
1
/
MCP P
Pn = -ÊËÁ
ˆ¯
ÊËÁ
ˆ¯
+Ê
ËÁÁ
ˆ
¯˜1 1 2
1
1
11
gd d
dq
s qs q/
/
+ -( ) -ÊËÁ
ˆ¯
ÊËÁ
ˆ¯
+Ê
ËÁÁ
ˆ
¯˜
P PP
2 1 1
2
1
11
1g
d dd
qs qs q
/
/
MCPt t
PPg = -Ê
ËÁˆ¯
ÊËÁ
ˆ¯
+Ê
ËÁÁ
ˆ
¯˜1
1
1 2
1
1
11
gd d
dg
qs qs q
/
/
+ + -( ) -ÊËÁ
ˆ¯
ÊËÁ
ˆ¯
+Ê
ËÁÁ
ˆ
¯˜
P tft t
PP
2
2
1 1
2
1
11
1g
d ddg
qs qs q
/
/
KQ P
Pnn
1
12
1
1
11= -Ê
ËÁˆ¯
ÊËÁ
ˆ¯
+Ê
ËÁÁ
ˆ
¯˜
dg
dd
q s qs q/
/
KQ P
Pnn
2
1
1
2
11
11=
-( )-
ÊËÁ
ˆ¯
ÊËÁ
ˆ¯
+Ê
ËÁÁ
ˆ
¯˜
dg
dd
q s qs q/ /
KQ
t tPPg
g1
1
1
2
1
1
11= -Ê
ËÁˆ¯
ÊËÁ
ˆ¯
+Ê
ËÁÁ
ˆ
¯˜
dg
dd
q
g
s qs q/
/
KQ
t tPPg
g2
1
2
1
2
11
11=
-( )-
ÊËÁ
ˆ¯
ÊËÁ
ˆ¯
+Ê
ËÁÁ
ˆ
¯˜
dg
dd
q
g
s qs q/ /
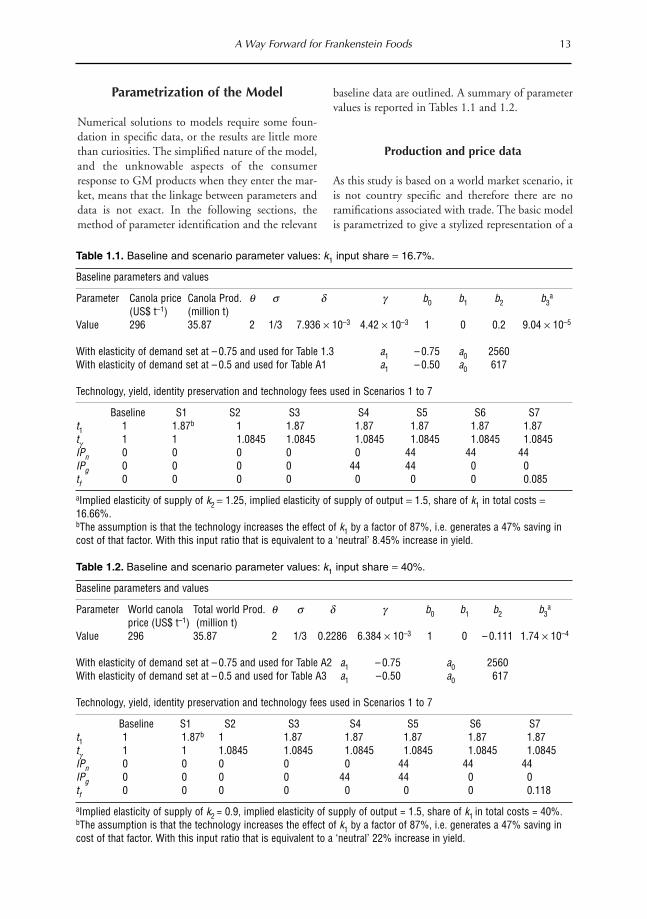
Parametrization of the Model
Numerical solutions to models require some foun-dation in specific data, or the results are little morethan curiosities. The simplified nature of the model,and the unknowable aspects of the consumerresponse to GM products when they enter the mar-ket, means that the linkage between parameters anddata is not exact. In the following sections, themethod of parameter identification and the relevant
baseline data are outlined. A summary of parametervalues is reported in Tables 1.1 and 1.2.
Production and price data
As this study is based on a world market scenario, itis not country specific and therefore there are noramifications associated with trade. The basic modelis parametrized to give a stylized representation of a
A Way Forward for Frankenstein Foods 13
Table 1.1. Baseline and scenario parameter values: k1 input share = 16.7%.
Baseline parameters and values
Parameter Canola price Canola Prod. q s d g b0 b1 b2 b3a
(US$ t–1) (million t)Value 296 35.87 2 1/3 7.936 ¥ 10–3 4.42 ¥ 10–3 1 0 0.2 9.04 ¥ 10–5
With elasticity of demand set at – 0.75 and used for Table 1.3 a1 – 0.75 a0 2560With elasticity of demand set at – 0.5 and used for Table A1 a1 – 0.50 a0 617
Technology, yield, identity preservation and technology fees used in Scenarios 1 to 7
Baseline S1 S2 S3 S4 S5 S6 S7t1 1 1.87b 1 1.87 1.87 1.87 1.87 1.87tg 1 1 1.0845 1.0845 1.0845 1.0845 1.0845 1.0845IPn 0 0 0 0 0 44 44 44IPg 0 0 0 0 44 44 0 0tf 0 0 0 0 0 0 0 0.085
aImplied elasticity of supply of k2 = 1.25, implied elasticity of supply of output = 1.5, share of k1 in total costs =16.66%.bThe assumption is that the technology increases the effect of k1 by a factor of 87%, i.e. generates a 47% saving incost of that factor. With this input ratio that is equivalent to a ‘neutral’ 8.45% increase in yield.
Table 1.2. Baseline and scenario parameter values: k1 input share = 40%.
Baseline parameters and values
Parameter World canola Total world Prod. q s d g b0 b1 b2 b3a
price (US$ t–1) (million t)Value 296 35.87 2 1/3 0.2286 6.384 ¥ 10–3 1 0 – 0.111 1.74 ¥ 10–4
With elasticity of demand set at – 0.75 and used for Table A2 a1 – 0.75 a0 2560With elasticity of demand set at – 0.5 and used for Table A3 a1 – 0.50 a0 617
Technology, yield, identity preservation and technology fees used in Scenarios 1 to 7
Baseline S1 S2 S3 S4 S5 S6 S7t1 1 1.87b 1 1.87 1.87 1.87 1.87 1.87tg 1 1 1.0845 1.0845 1.0845 1.0845 1.0845 1.0845IPn 0 0 0 0 0 44 44 44IPg 0 0 0 0 44 44 0 0tf 0 0 0 0 0 0 0 0.118
aImplied elasticity of supply of k2 = 0.9, implied elasticity of supply of output = 1.5, share of k1 in total costs = 40%.bThe assumption is that the technology increases the effect of k1 by a factor of 87%, i.e. generates a 47% saving incost of that factor. With this input ratio that is equivalent to a ‘neutral’ 22% increase in yield.

canola market. In the model the aggregate quantityof canola grain is set at 35.87 Mt and is based onFAO data for world production of canola grain in1998 (FAOSTAT, 2000). The price for canola grainis assumed to be US$296 t–1 which, according to theUSDA’s Foreign Agricultural Service, was the canolagrain price for 1998 (FAS Online, 2000).
Farm input costs and benefits
Without GM inputs
The two inputs in the production function are char-acterized as k1, the canola complex (seed and herbi-cide) and k2, all other inputs. Fulton and Keyowski(1999a) suggest that the share of the canola complexis some 16% in total cost, and the parameters of theproduction function are selected to generate thisresult at the pre-GM equilibrium. Given an elasticityof substitution (s) set exogenously at 1/3, and nor-malizing the input prices to unity allows the inputratio to be determined (the ratio of Equations 1.23and 1.24) as a function of a single parameter, d.
The scale parameter g is then identified byequating marginal cost (Equation 1.19) with canolaprice.
As an alternative, the original share of 16% isincreased to 40%, which may be closer to the valuefor Australia. This leads to alternative values for dand g (see Table 1.2).
Having identified all parameters of the produc-tion function, the equilibrium input quantities areidentified (Equations 1.23, 1.24). The units inwhich these are measured cannot be interpreted, asthe input prices have been normalized to unity, andthey will change with the differing assumptionabout the input share (or s, if it were altered).However, once the input quantities have been estab-lished at equilibrium, the parameters of their(inverse) supply functions can be obtained.
With GM inputs
Fulton and Keyowski (1999b) suggest that farmerswho have adopted some form of reduced tillage sys-tem are more likely to profit from using HR (herbi-cide resistant) seed. Production of GM canola
requires a one-pass chemical operation (as opposed totwo passes required by non-GM canola) so eliminatesthe cost of additional machine operations over thefield; enables control of the entire spectrum of weedsso giving farmers much more flexibility in terms ofthe timing and type of weed control; and has thepotential to improve the crop yield by removingcompetition for moisture and nutrients (Fulton andKeyowski, 1999a). Even so, the benefits of the newtechnology will only be recognized if returns increasethrough reduced weed control costs and/or increasedyields (CCGA, 2000). Therefore, where weed controlis not a major concern farmers are unlikely to benefitand may be better off using conventional varieties(CCGA, 2000). Ballenger et al. (2000) state that pro-ducers in different countries will consider the relativeprices for biotech and non-biotech crops in relationto their local farming conditions when deciding whatto plant. For the purpose of this study, this statementis extended further to assume that producers will useGMO technology only if it is beneficial to their pro-duction method thereby capturing benefits associat-ed with herbicide reduction and yield increase.Therefore, while acknowledging the argument byFulton and Keyowski (1999a) that total benefitsderived from GMO technology will depend on agro-nomic, management and technology factors facingindividual farmers, we assume here that farmersincluded in this study are alike.
The GM innovation is assumed to have twopotential modes of action in the production func-tion that may occur separately or together. The firstis a change in the effectiveness of the canola complexinputs. This is represented by assuming that theeffectiveness of this input rises by some 87% (t1 =1.87), a figure derived using results found by Fultonand Keyowski (1999a). The implied reduction inmarginal costs (before allowing for substitution andinput price effects) is approximately 8.5% if theinput share is 16%.
The second mode of action is a Hicks neutralshift in the production function. Fulton andKeyowski (1999a) found a yield decrease of around7%6 with the introduction of Roundup Ready™canola; James (1998) found that the average canolayield in Canada increased by 7.5% between 1996and 1997.7 Here we set this value at 8.5%, so that
14 M. Burton et al.
6 As Fulton and Keyowski (1999a) note, farmers were not differentiated in the study and those who have not adoptedconservation practices are unlikely to receive the same benefits as those who have.
7 From Fulton and Keyowski (1999a) almost 4% of canola grown in Canada was GM canola in 1996 compared to33% in 1997 and therefore it could be assumed that part of the overall yield increase could be contributed toproduction of GM canola.
the change in marginal cost due to this change isequivalent to that induced by the input-specificshift.
It should be noted that when the input shareof k1 is raised to 40%, the economic impact of theinnovation is significantly increased for the sameincrease in effectiveness: equivalent to a 22% reduc-tion in marginal cost. In the simulations with thishigher share the yield effect is retained at 8.5%.
Elasticities of supply and demand
The elasticity of supply of the canola complex (k1) isassumed to be infinite. Given constant returns toscale, imposing an elasticity of supply on the otherinputs effectively determines the long-run equilibri-um response of output to changes in the canolaprice. While Johnson et al. (1996) found elasticity ofsupply to be up to 0.85, for the purpose of this proj-ect it was deemed that the long-run supply elastici-ty would be set at 1.5. If the input share of k2 is setat 84% (because the share of k1 has been set at 16%as described above), this implies an elasticity of sup-ply of k2 of 1.25. If the input share is 60%, then theelasticity of supply of k2 is set at 0.9. In both casesthe parameters of the linear marginal supply func-tion for the input can subsequently be identified.
Johnson et al. (1996) indicate the elasticity ofdemand of canola oil to be –0.6 for Canada, –0.69for the USA and for the EU, –0.56. Goddard andGlance (1989) quote elasticity of demand for canolaoil ranging from –1.17 to –0.31 with a mean andmedian of –0.78. Here, we simply specify a singlederived demand for oilseed, with no differentiationby end-use, and an elasticity of demand of either–0.75 or –0.5. This, combined with the base quan-tity/price data allows the parameters of the represen-tative demand functions to be identified.
Market share
Phillips (1999) and Buckwell et al. (1999) argue thatfor non-GM products to enter the market, the mar-ket would have to segment and the cost that this seg-mentation could bear would depend on the willing-ness of consumers to pay extra for non-GMproducts. In the long run consumers around theworld will decide on the premiums they will pay fornon-biotech products (Ballenger et al., 2000).
Miranowski et al. (1999) add that the price pre-mium for a non-GM crop will depend on the sup-ply of that crop and costs of identity preservation.The size of these premiums is unknown and anymarket intelligence concerning GM food is scarce.Differences in regional attitudes towards GM food-stuffs complicate the picture, as does the fact thatcanola generates two products, oil and meal, withhuman and animal feed end-markets. If public con-cerns about GM products do not extend to productsfrom animals raised on GM feeds, then the deriveddemand for meal will not segment.
In the face of uncertainty about possibleresponses, l is set at an arbitrary value of 3, a valuewhich leads to significant segmentation at relativelylow price differentials (e.g. for a GM product pricedat 10% less than non-GM product, the market sharefor the GM product would be 27% of individuals).
Identity preservation costs
Smyth and Phillips (1999) found the cost of anidentity preservation and marketing system forcanola in Canada to be between 12 and 15% of thefarm gate price. This cost is assumed to impose awedge between farm and retail price by raising theeffective marginal cost of supply at retail level. In thesimulations that follow, the cost is set at US$44 t–1,or approximately 15% of the pre-GM farm gateprice.
Farmers must pay for GM canola seed as it isassumed that they are not able to retain any seed forplanting from the previous year. From Fulton andKeyowski (1999a) the increase in GM canola seedprice over non-GM was found to be 2% of the totalreturn. To acquire Roundup Ready™ canola seed,farmers must attend a sign-up meeting and agree toa Technology Use Agreement, pay US$37 ha–1 tech-nology fee and buy a package of seed andRoundup™ herbicide (Phillips, 1999). In thisstudy, these costs are referred to as ‘the technologyfee that is associated with the GM technology’ andis applied to the ‘other’ input (k2), leading to aneffective increase in its price. This is emerging as acommon practice in the industry, with the technol-ogy fee applied to land area planted, rather thanoutput levels or seed. In an initial simulation thetechnology fee is set at 7% of total revenue (at pre-GM equilibrium input quantities and output price).
A Way Forward for Frankenstein Foods 15

Summary of data
Tables 1.1 and 1.2 summarize the data used in themodel. Table 1.1 generates the production parame-ters on the assumption that the input share for k1 is16.7%, and reports alternative values for thedemand elasticity. The lower half reports the valuesfor the technological change parameters, identitypreservation costs and technology fee for seven sce-narios. Table 1.2 is generated on the basis of aninput share of 40%.
The scenarios explore the response of themodel to:
• different forms of technical change;• different incidence of identity preservation costs;• the impact of a technology fee.
Scenarios 1–3 introduce a factor saving innovation,a Hicks neutral innovation and a combination ofboth, but no identity preservation costs. The mostlikely outcome from adoption of herbicide resistantGM canola is assumed to be significant savings inthe cost of the canola complex input, as well as anadditional factor neutral yield increase.
Scenarios 4–6 build on Scenario 3 by intro-ducing identity preservation costs that respectively
affect the cost of retail supply of the GM commod-ity alone, on both commodities and finally on thenon-GM commodity alone. Again for reasons out-lined above, it is thought that the latter is the mostlikely outcome in the market. Finally, a technologyfee is added to the system and is fixed exogenouslyat the rate suggested by Phillips (1999) (Scenario 7).
Results
The full set of simulation results is reported inAppendix II. For simplicity, the discussion will focuson one set of results presented in Table 1.3 based onan input share for the canola complex of 16% andan elasticity of demand of –0.75 (i.e. based onparameter values drawn from Table 1.1).
The first column of Table 1.3 reports the base-line simulation, with the equilibrium price andquantity as initially set. In Scenario 1, the GM tech-nology is depicted as a factor saving technicalchange with an impact on k1 alone. The market seg-ments, with the GM crop taking some of the mar-ket, with non-GM price rising slightly and a sub-stantial fall in the GM price compared with theinitial equilibrium. The expansion in demand by
16 M. Burton et al.
Table 1.3. Simulated values for canola price and quantity, input quantities and welfare impacts.
Baseline S1 S2 S3 S4 S5 S6 S7
Pn 296 298 296 298 296 328 338 333Pg n/a 275 273 254 296 285 250 265Qn 35.8 28.0 28.1 22.0 35.8 21.8 13.1 16.5Qg n/a 8.1 8.2 15.5 0.1 12.7 24.2 19.4
Q 35.8 36.1 36.3 37.5 35.9 34.5 37.3 35.9P2 1 1.01 0.99 1.01 1 0.95 0.99 0.97k1n 1770 1388 1389 1087 1765 1061 647 809k1g 0 215 375 377 2.3 305 588 468
k1 1770 1603 1764 1464 1366 1366 1235 1277k2n 8850 6921 6949 5423 8828 5395 3244 4088k2g 0 2005 1876 3517 21 2900 5517 4423
k2 8850 8926 8825 8940 8849 8295 8761 8511Dcsn –48 16 –44 0 –715 –579 –629(share) (0.78) (0.78) (0.85) (1.0) (0.65) (0.40) (0.50)Dcsg 81 100 319 0 –94 253 62Dps1 0 0 0 0 0 0 376Dps2 61 –20 72 0 –430 –71 –266
∆W 94 96 347 0 –1239 –397 –457
Note: The bottom six rows of the table contain estimates of changes in consumer and producer welfare relative tothe baseline scenario representing no production of GM food. The estimate of share is the proportion of the con-sumers consuming the non-GM food.Dcsj is the change in consumer surplus for those consuming good j, Dpsl the change in producer surplus for suppli-er of input 1(k1), and DW the aggregate effect. See Appendix III for further details on the method of calculation.

those who switch to GM product leads to an expan-sion in aggregate output. While this increased out-put is produced using less of k1 (due to the techni-cal change), an expansion in k2 is necessary due tothe scale effect. The latter causes the price of k2 to bebid up, which is the cause of the increased cost (andhence price) of non-GM output. Note that thereduction in demand for k1 gives no compensatingrelief, as its price does not vary with output.
In the reported estimates of welfare effects, itshould be noted that the changes in consumer sur-plus are reported for the sub-populations of con-sumers. The proportion of the market that remainswith non-GM food is reported. Per capita estimatesof welfare changes could be obtained by multiplyingthe aggregate change in welfare by the share. Thosewho remain with non-GM product are worse offdue to the increased price, while those who switch tothe GM alternative are better off due to the lowerprice. Net, there is an increase in welfare, which isincreased when the increase in producer surplus ofthose supplying k2 is included.8 Parenthetically,comparison of changes in consumer welfare betweenscenarios should be conducted with care, becausethe size of the sub-populations involved varies.
Under Scenario 2, the input specific technicalchange is replaced with a Hicks neutral effect,which, at initial quantities and prices, leads to thesame reduction in marginal cost. However, the dis-tributional effects on the input side differ. Demandfor both inputs falls, despite a slight increase in out-put and hence input price P2 falls. This reduces themarginal cost of producing the non-GM product,leading to welfare gains for both sets of consumers(the price Pn declines by less than the rounding fac-tor used in Table 1.3).
Scenario 3 combines both forms of technicalchange. The increased cost advantage allows theGM market to expand significantly, leading to gainsin consumer surplus of that group. However, due tothe scale effect, adoption of the GM crop againresults in increased demand for k2 and consequentialincreased cost (and hence price) of non-GM food.Thus consumers who continue to purchase the non-GM product despite the price differential are worseoff than they were prior to the introduction of theGM crop, even though there are no identity preser-vation costs under this scenario.
Under Scenario 4, the incidence of the cost ofidentity preservation is assumed to fall exclusively
on the GM crop. In this case, these costs almost out-weigh the benefits of the technical change and,although GM enters the market, it does so onlymarginally.
In Scenario 5, the incidence of IP costs falls onboth commodities. As a result, there is a net reduc-tion in welfare even for those who switch to GMcrop, despite the fact that the price of GM lies belowthe baseline level of 296 (see Appendix III for anexplanation of this). Combined with the losses feltby both the consumers of non-GM product and theproducers of k2, who suffer from the reduction inaggregate supply, aggregate welfare also declines as aresult of the innovation.
Scenario 6 also maintains both forms of tech-nical change, while introducing an identity preser-vation cost for the non-GM product only. Thisincreases the price of the non-GM product, but notby the full US$44 (the incidence is about 90%). TheGM market expands further, but aggregate outputfalls. This, combined with a greater concentration inthe lower input GM sector leads to reduced inputdemands and hence lower input prices. The margin-al cost and hence price of GM product falls.Consumers of non-GM product and suppliers of k2
lose, while GM consumers gain.As noted above, Scenario 7 presents the ‘best
guess’ for possible configurations of a technologyinnovation fee and identity preservation costs. Infact, the level of the technology fee will depend onthe behaviour of the technology provider who maybe expected to set this fee so as to maximize rents.This is an area of research that will be explored at alater date.
In Scenario 7, a technology fee is introducedwhich allows the supplier of the new seed/herbicidecomplex to extract part of the rent associated withthe innovation. IP costs are only placed on the non-GM crop. Compared with Scenario 6 (which hasthe equivalent IP cost, but no technology fee), thenon-GM market recovers some ground, as its lowercost competitor is now facing the technology fee.The rent earned by the fee is reported as the changein producer surplus of input 1 (Dps1).
Increasing the share of k1 in productionincreases the significance of the technological inno-vation: it is clearly more valuable. The results for thissimulation are reported in Table A2 in Appendix II.As the marginal cost of producing the GM productdrops further, the price differential widens and it
A Way Forward for Frankenstein Foods 17
8 Details of how the change in consumer surplus is calculated are reported in Appendix III.
absorbs more of the market. As a result, the IP andtechnology fees used here are no longer sufficient tooutweigh the benefits of the innovation, and netwelfare increases in all scenarios when comparingTables 1.3 and A2.
Comparing Table 1.3 with Table A1 and TableA2 with Table A3 reveals that changing the elastici-ty of demand from –0.75 to –0.5 does little to eitherthe qualitative or quantitative results from themodel. In general, both sets of consumers are betteroff when the elasticity of demand is set at –0.5 ascompared to –0.75, and producers of input 2 areworse off except when input share is 16.7%.
Conclusions
The simulation results presented here are predicatedon a consumer market that can differentiatebetween the production technology used to producethe good, with a heterogeneity of preferences withinthe population which mean that the consumer caresabout the technology used to produce the good.9
This assumption requires segregation and crediblelabelling of the product.
When this occurs, the market segments. Theaggregate and distributional effects of that segmen-tation will depend on the economic and technicalparameters of the underlying system and, in partic-ular, the degree to which the market segments. Thelatter is the great unknown in the GM debate: if pre-sented with genuine choices, how resilient wouldthe consumer concerns that are expressed in surveysbe to price discounts? This chapter does not attemptto answer that question, but derives some implica-tions conditional on an imposed response.
In general the price of conventional, non-GMproduct is increased, owing to the requirement thatit bears identity preservation costs. In the case wherethere is either zero cost, or the cost is borne solely bythe GM crop, it may be the case that the price ofnon-GM product falls, due to changes in the inputmarkets induced by the innovation, but these aresmall.
The key distributional impacts are betweenconsumers. Those for whom the new technologyholds no qualms in general benefit from access tocheaper commodity, while those who remain with
the non-GM product can suffer significant losses:typically greater than the gains to the industry sup-plying the innovation. There are also losses to thesuppliers of other inputs to the industry, as long asthe innovation is input enhancing rather than Hicksneutral. These losses are extended where a technolo-gy fee is associated with these other inputs: thequantity demanded is being adversely affected bythe increase in effective price, without its benefits.
Net welfare effects can be positive or negative.If the identity preservation costs are sufficiently highrelative to the cost savings, and in particular if theyfall on both commodities, aggregate welfare mayfall, but with no competitive incentives for theinnovation to be dis-adopted. Furthermore, the pos-sibility of monopoly rent seeking on the part of thesupplier of innovation increases that likelihood.
The range of conditions under which the latterholds true seems a particularly fruitful area of fur-ther development in the model.
References
Ballenger, N., Bohman, M. and Gehlhar, M. (2000)
Biotechnology: implications for US corn and
soybean trade. Agricultural Outlook April 2000,
24–28. Economic Research Service/USDA.
www.ERS.USDA.gov/epubs/pdf/agout/apr2000/ao
270g.pdf
Buckwell, A., Brookes, G. and Bradley, D. (1999)
Economics of identity preservation for genetically
modified crops. Final report of a study for Food
Biotechnology Communications Initiative (FBCI).
Caswell, J.A. (2000) Labeling policy for GMOs: to
each his own? AgBioForum 3(1), 53–57. www.
agbioforum.org
Caswell, J. and Mojduszka, E. (1996) Using informational
labelling to influence the market for quality in food
products. American Journal of Agricultural Economics78(5), 1248-1253.
Caulder, J. (1998) Agricultural biotechnology and
public perceptions. AgBioForum 1(1), 38-39. www.
agbioforum.missouri.edu
CCGA (2000) Canadian Canola Growers Association –
The canola producers’ perspective on biotech-
nology, December 1999. www.canola-council.org/
biotechweb.htm
Falck-Zepeda, J.B., Traxler, G. and Nelson, R.G. (1999)
Rent Creation and Distribution from the First Three
18 M. Burton et al.
9 This heterogeneity is represented by the preferences that lead to the choice between the two. An alternative speci-fication that extends that heterogeneity to the individual’s demand function is reported in Appendix IV, but theadditional complexity does little to change the basic story told here.

Years of Planting Bt Cotton, ISAAA Briefs No.13,
ISAAA, Ithaca, New York.
FAOSTAT (2000) Agriculture data. www.apps.fao.org/cgi-
bin/nph-db?subset=agriculture
FAS Online (2000) Oilseed prices. www.fas.usda.
gov/oilseeds/circular/2000/00-06/Prices.pdf
Fulton, M. and Keyowski, L. (1999a) The producer bene-
fits of herbicide-resistant canola. AgBioForum 2(2),
85–93. www.agbioforum.missouri.edu
Fulton, M. and Keyowski, L. (1999b) The impact of tech-
nological innovation on producer returns: the case of
genetically modified canola. Paper presented at the
Transitions in Agbiotech: Economics of Strategy and
Policy Conference, 24–25 June 1999, Washington,
DC.
Gamble, J., Muggleston, S., Hedderley, D., Parminter, T.
and Richardson-Harman, N. (2000) Genetic engi-
neering: the public’s point of view. Report to
Stakeholders. The Horticulture and Food Research
Institute of New Zealand Ltd.
www.hort.cri.nz/media/gm_report.pdf
Goddard, E.W. and Glance, S. (1989) Demand for fats
and oils in Canada, United States and Japan.
Canadian Journal of Agricultural Economics 37(3),
421–443.
James, C. (1998) Global Review of CommercialisedTransgenic Crops: 1998, ISAAA Briefs No. 8. ISAAA,
Ithaca, New York.
James, C. (1999) Global Review of CommercialisedTransgenic Crops: 1999, ISAAA Briefs No. 12.
ISAAA, Ithaca, New York.
Johnson, D.D., Satyanarayana, V., Dahl, B.L. and Dooley,
F.J. (1996) Trade in Minor Oilseeds: a SpatialEquilibrium Analysis of Sunflower and Canola,
Agricultural Economics Report No. 353.
Department of Agricultural Economics, North
Dakota State University, Fargo.
KPMG (1999) Report on the compliance costs facing
industry and government regulators in relation to
labeling genetically modified foods. KPMG,
Canberra.
Marshall, K. (1998) What’s in a label? AgBioForum 1(1),
35–37. www.agbioforum.org
Miranowski, J.A., Moschini, G., Babcock, B., Duffy, M.,
Wisner, R., Beghin, J., Hayes, D., Lence, S., Baumel,
C.P. and Harl, N.E. (1999) Economic perspectives
on GMO market segregation. Staff Paper No. 298,
October.
Phillips, P.W.B. (2000) Intellectual property rights, canola
and public research in Canada. In: Santaniello, V.,
Evenson, R.E., Zilberman, D. and Carlson, G.A.
(eds) Agriculture and Intellectual Property Rights:Economic, Institutional and Implementation Issues inBiotechnology. CAB International, Wallingford, pp.
223–248.
Smith, N. (2000) Seeds of Opportunity: an Assessment of theBenefits, Safety and Oversight of Plant Genomics andAgricultural Biotechnology. Report transmitted to the
Committee on Science for the 106th Congress
Second Session, 13 April. www.house.gov/science
Smyth, S. and Phillips, P. (1999) Competitors co-operat-
ing: Establishing a supply change to manage geneti-
cally modified canola. Paper presented at the The
Economics of Quality Control in Agriculture meet-
ing, Saskatoon, 2–4 December 1999.
Zechendorf, B. (1998), Agricultural biotechnology: why
do Europeans have difficulty accepting it?
AgBioForum 1(1), 8–13. www.agbioforum.org
A Way Forward for Frankenstein Foods 19

Appendix I: Solution for Aggregate Output for the Simple Model
[a02 b1
2 + 2a0 b1 (b0 + IPn) + 4 a12 b1
2 (bt2 + 2 bt (IPn – IPg) + (IPg – IPn)
2 )
– 4 a1 b1 (bt2 + 2 bt (IPn – IPg) + (IPg – IPn)
2 ) + (b0 + IPn)2 ]0.5
+ a0 b1 + (b0 + IPn) (2 a1 b1 – 1)
Q = ———————————————————————————–——
2b1(1 – a1 b1)
20 M. Burton et al.
Appendix II: Alternate Simulation Results
Table A1. Simulated values for canola price and quantity, input quantities and welfare impacts, forparameters described in Table 1.1, with elasticity of demand = –0.5.
Baseline S1 S2 S3 S4 S5 S6 S7
Pn 296 297 295 296 296 330 336 333 Pg n/a 274 272 252 296 286 248 265 Qn 35.8 28.1 28.2 22.1 35.8 22.3 13.5 17.0 Qg n/a 8 8.1 14.9 0.1 12.5 23.4 18.8
Q 35.8 36.1 36.3 37 35.9 34.8 36.9 35.8 P2 1 1.01 1 0.99 1 0.96 0.98 0.97 k1n 1770 1389 1388 1089 1765 1088 667 833 k1g 0 211 367 364 2 301 566 455
k1 1770 1600 1755 1453 1767 1389 1233 1288 k2n 8849 6935 6954 5446 8827 5518 3349 4209 k2g 0 1971 1840 3403 18 2859 5322 4299
k2 8849 8906 8794 8849 8845 8377 8671 8508 Dcsn –35 35 0 1 –766 –561 –636(share) (0.78) (0.78) (0.62) (1.0) (0.65) (0.40) (0.50)Dcsg 83 103 338 0 –113 287 64 Dps1 0 0 0 0 0 0 365Dps2 43 –46 –2 –2 –369 –140 –270
∆W 91 92 336 –1 –1268 –414 –477
Note: Dcsj is the change in consumer surplus for those consuming good j, Dpsk the change in producer surplus forsupplier of input k, and DW the aggregate effect.
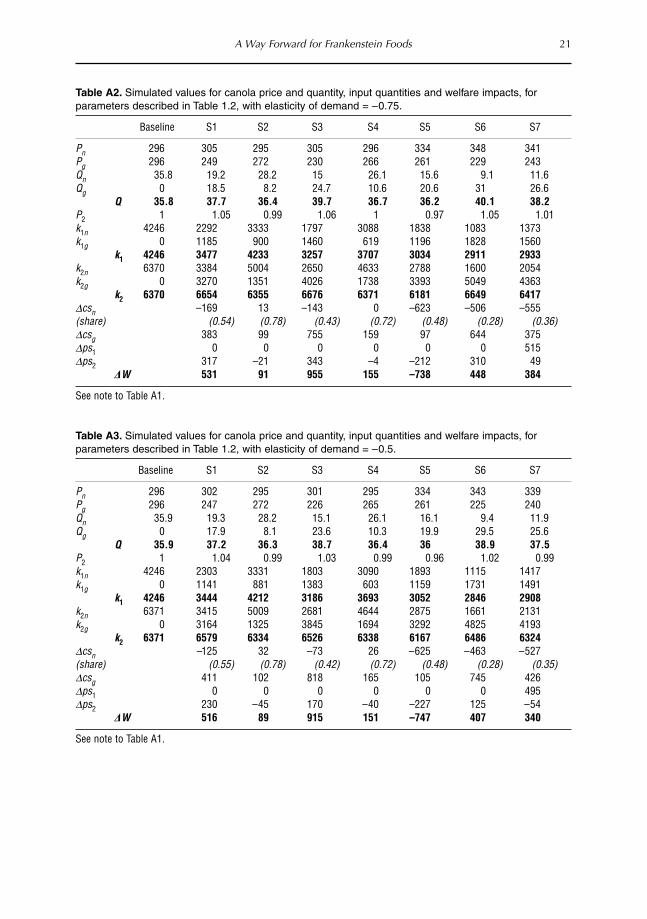
A Way Forward for Frankenstein Foods 21
Table A2. Simulated values for canola price and quantity, input quantities and welfare impacts, forparameters described in Table 1.2, with elasticity of demand = –0.75.
Baseline S1 S2 S3 S4 S5 S6 S7
Pn 296 305 295 305 296 334 348 341Pg 296 249 272 230 266 261 229 243Qn 35.8 19.2 28.2 15 26.1 15.6 9.1 11.6Qg 0 18.5 8.2 24.7 10.6 20.6 31 26.6
Q 35.8 37.7 36.4 39.7 36.7 36.2 40.1 38.2P2 1 1.05 0.99 1.06 1 0.97 1.05 1.01k1n 4246 2292 3333 1797 3088 1838 1083 1373k1g 0 1185 900 1460 619 1196 1828 1560
k1 4246 3477 4233 3257 3707 3034 2911 2933k2n 6370 3384 5004 2650 4633 2788 1600 2054k2g 0 3270 1351 4026 1738 3393 5049 4363
k2 6370 6654 6355 6676 6371 6181 6649 6417Dcsn –169 13 –143 0 –623 –506 –555(share) (0.54) (0.78) (0.43) (0.72) (0.48) (0.28) (0.36)Dcsg 383 99 755 159 97 644 375Dps1 0 0 0 0 0 0 515Dps2 317 –21 343 –4 –212 310 49
∆W 531 91 955 155 –738 448 384
See note to Table A1.
Table A3. Simulated values for canola price and quantity, input quantities and welfare impacts, forparameters described in Table 1.2, with elasticity of demand = –0.5.
Baseline S1 S2 S3 S4 S5 S6 S7
Pn 296 302 295 301 295 334 343 339Pg 296 247 272 226 265 261 225 240Qn 35.9 19.3 28.2 15.1 26.1 16.1 9.4 11.9Qg 0 17.9 8.1 23.6 10.3 19.9 29.5 25.6
Q 35.9 37.2 36.3 38.7 36.4 36 38.9 37.5P2 1 1.04 0.99 1.03 0.99 0.96 1.02 0.99k1n 4246 2303 3331 1803 3090 1893 1115 1417k1g 0 1141 881 1383 603 1159 1731 1491
k1 4246 3444 4212 3186 3693 3052 2846 2908k2n 6371 3415 5009 2681 4644 2875 1661 2131k2g 0 3164 1325 3845 1694 3292 4825 4193
k2 6371 6579 6334 6526 6338 6167 6486 6324Dcsn –125 32 –73 26 –625 –463 –527(share) (0.55) (0.78) (0.42) (0.72) (0.48) (0.28) (0.35)Dcsg 411 102 818 165 105 745 426Dps1 0 0 0 0 0 0 495Dps2 230 –45 170 –40 –227 125 –54
∆W 516 89 915 151 –747 407 340
See note to Table A1.
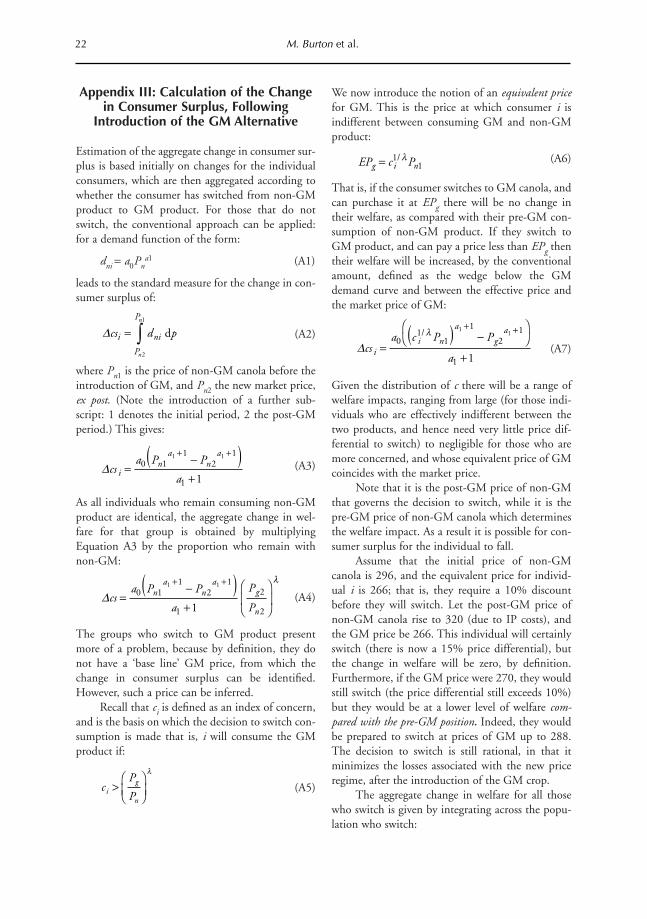
Appendix III: Calculation of the Changein Consumer Surplus, Following
Introduction of the GM Alternative
Estimation of the aggregate change in consumer sur-plus is based initially on changes for the individualconsumers, which are then aggregated according towhether the consumer has switched from non-GMproduct to GM product. For those that do notswitch, the conventional approach can be applied:for a demand function of the form:
dni = a0Pna1 (A1)
leads to the standard measure for the change in con-sumer surplus of:
(A2)
where Pn1 is the price of non-GM canola before theintroduction of GM, and Pn2 the new market price,ex post. (Note the introduction of a further sub-script: 1 denotes the initial period, 2 the post-GMperiod.) This gives:
(A3)
As all individuals who remain consuming non-GMproduct are identical, the aggregate change in wel-fare for that group is obtained by multiplyingEquation A3 by the proportion who remain withnon-GM:
(A4)
The groups who switch to GM product presentmore of a problem, because by definition, they donot have a ‘base line’ GM price, from which thechange in consumer surplus can be identified.However, such a price can be inferred.
Recall that ci is defined as an index of concern,and is the basis on which the decision to switch con-sumption is made that is, i will consume the GMproduct if:
(A5)
We now introduce the notion of an equivalent pricefor GM. This is the price at which consumer i isindifferent between consuming GM and non-GMproduct:
(A6)
That is, if the consumer switches to GM canola, andcan purchase it at EPg there will be no change intheir welfare, as compared with their pre-GM con-sumption of non-GM product. If they switch toGM product, and can pay a price less than EPg thentheir welfare will be increased, by the conventionalamount, defined as the wedge below the GMdemand curve and between the effective price andthe market price of GM:
(A7)
Given the distribution of c there will be a range ofwelfare impacts, ranging from large (for those indi-viduals who are effectively indifferent between thetwo products, and hence need very little price dif-ferential to switch) to negligible for those who aremore concerned, and whose equivalent price of GMcoincides with the market price.
Note that it is the post-GM price of non-GMthat governs the decision to switch, while it is thepre-GM price of non-GM canola which determinesthe welfare impact. As a result it is possible for con-sumer surplus for the individual to fall.
Assume that the initial price of non-GMcanola is 296, and the equivalent price for individ-ual i is 266; that is, they require a 10% discountbefore they will switch. Let the post-GM price ofnon-GM canola rise to 320 (due to IP costs), andthe GM price be 266. This individual will certainlyswitch (there is now a 15% price differential), butthe change in welfare will be zero, by definition.Furthermore, if the GM price were 270, they wouldstill switch (the price differential still exceeds 10%)but they would be at a lower level of welfare com-pared with the pre-GM position. Indeed, they wouldbe prepared to switch at prices of GM up to 288.The decision to switch is still rational, in that itminimizes the losses associated with the new priceregime, after the introduction of the GM crop.
The aggregate change in welfare for all thosewho switch is given by integrating across the popu-lation who switch:
22 M. Burton et al.
Dcsa P P
ai
na
na
=-( )
+
+ +0 1
12
1
1
1 1
1
Dcsa P P
a
P
Pn
an
ag
n=
-( )+
Ê
ËÁ
ˆ
¯˜
+ +0 1
12
1
1
2
2
1 1
1
l
cP
Pig
n
>ÊËÁ
ˆ¯
l
EP c Pg i n= 11
/ l
Dcs
a c P P
ai
i n
a
ga
=( ) -
ÊË
ˆ¯
+
+ +0
11
1
21
1
11
1
/ lDcs d pi ni
P
P
n
n
= Ú d
2
1
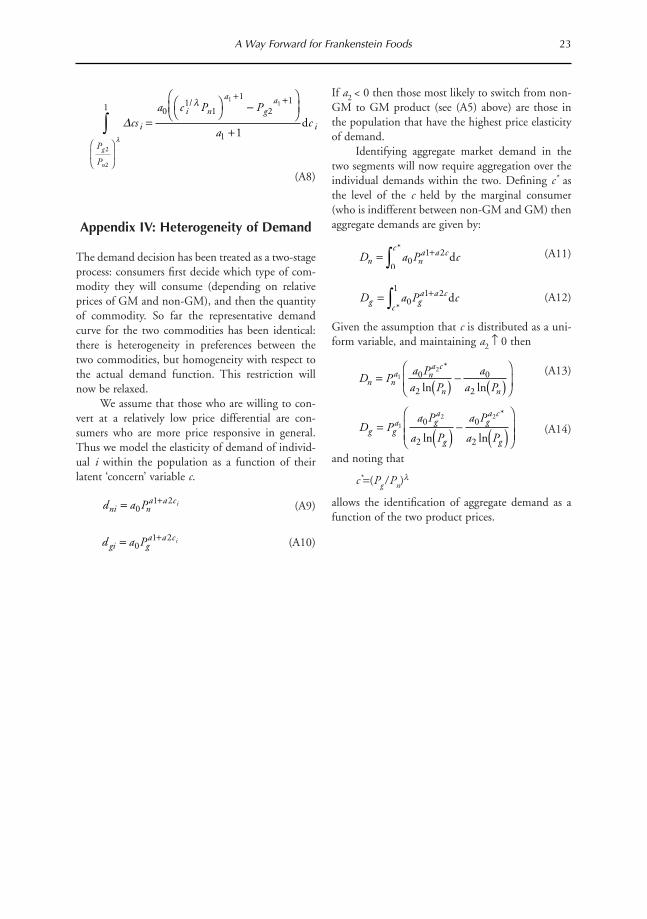
(A8)
Appendix IV: Heterogeneity of Demand
The demand decision has been treated as a two-stageprocess: consumers first decide which type of com-modity they will consume (depending on relativeprices of GM and non-GM), and then the quantityof commodity. So far the representative demandcurve for the two commodities has been identical:there is heterogeneity in preferences between thetwo commodities, but homogeneity with respect tothe actual demand function. This restriction willnow be relaxed.
We assume that those who are willing to con-vert at a relatively low price differential are con-sumers who are more price responsive in general.Thus we model the elasticity of demand of individ-ual i within the population as a function of theirlatent ‘concern’ variable c.
(A9)
(A10)
If a2 < 0 then those most likely to switch from non-GM to GM product (see (A5) above) are those inthe population that have the highest price elasticityof demand.
Identifying aggregate market demand in thetwo segments will now require aggregation over theindividual demands within the two. Defining c* asthe level of the c held by the marginal consumer(who is indifferent between non-GM and GM) thenaggregate demands are given by:
(A11)
(A12)
Given the assumption that c is distributed as a uni-form variable, and maintaining a2 ≠ 0 then
(A13)
(A14)
and noting that
c*=(Pg / Pn)l
allows the identification of aggregate demand as afunction of the two product prices.
A Way Forward for Frankenstein Foods 23
Dcsa c P P
aci
i n
a
ga
i
P
P
g
n
=
ÊË
ˆ¯ -
ÊËÁ
ˆ¯
+
+ +
Ê
ËÁ
ˆ
¯˜
Ú0
11
1
21
1
11
1
2
2
1
/ l
l
d
d a Pni na a ci= +
01 2
d a Pgi ga a ci= +
01 2
D a P cn na a cc
= +Ú 01 2
0d
*
D a P cg ga a c
c= +Ú 0
1 21
d*
D Pa Pa P
aa Pn n
a na c
n n= ( ) - ( )
Ê
ËÁ
ˆ
¯˜1
20
2
0
2
*
ln ln
D Pa P
a P
a P
a Pg g
a ga
g
ga c
g
= ( ) - ( )Ê
ËÁÁ
ˆ
¯˜1
2 20
2
0
2ln ln
*
1 Research assistance provided by: Jacinta M. Ryan and Corey Hartung, Research Assistants, California PolytechnicState University.
Introduction
New products and technologies are becoming avail-able for the production of food. In particular,biotechnology is being used to produce geneticallymodified organisms (GMOs) that are used in foodproduction. Food producers have used the newbiotechnologies. Recent negative consumer responseto these products in Europe, Japan and Australia hascaused farmers to question whether or not to adoptthe new technologies. There is concern thatAmerican consumer attitudes may follow those ofthe Europeans. However, there is a void of knowl-edge about consumer acceptance, regulation, tradeimplications and public opinion.
The objective of this research is to use a casestudy to compare consumer attitudes towards genet-ically modified (GM) food in the USA and Europeusing two communities during two time periods.The communities examined are in California andIreland. This research examines differences in thefollowing between the US and Irish respondent:attitudes towards science and food purchasingbehaviour, familiarity with GM food and consumerattitudes towards GM food. In addition, attitudes ofrespondents in each country were examined basedon two subgroups: those familiar with GM food
compared with those not familiar with GM food;and those that are likely to purchase GM food com-pared with those that are not are likely to purchaseGM food. There are demographic and attitudinaldifferences between the subgroups in each country.
This research shows that there is a similar levelof familiarity with GM food in Ireland and theUSA. Approximately 43% of respondents in bothcountries indicated that they were familiar with GMfood. However, familiar Irish consumers are awarefrom more sources than the US consumer. The Irishconsumers appear to be more interested in GM foodbecause they were more likely to indicate that theyhad discussions with family, friends and colleaguesconcerning GM food. Higher educated respondentsin both countries are more likely to be familiar withGM food.
Most consumers in both countries indicatedthat government imposition of mandatory labellingis important, 95% in Ireland and 81% in the USA.The more familiar US and Irish consumers are withGM food, the more likely they are to indicate thatmandatory labelling is very important. Further,almost three-quarters of US respondents that arelikely to purchase a GM food product indicated thatmandatory labelling is important.
A minority of consumers in each country said
25
2 A Comparison of Consumer Attitudestowards GM Food in Ireland and the United
States: a Case Study Over Time1
Marianne McGarry Wolf1 and Christine Domegan21Agribusiness Department, California Polytechnic State University, San Luis Obispo,California, USA; 2Department of Marketing, National University of Ireland, Galway,
Ireland
© CAB International 2002. Market Development for Genetically Modified Foods(eds V. Santaniello, R.E. Evenson and D. Zilberman)
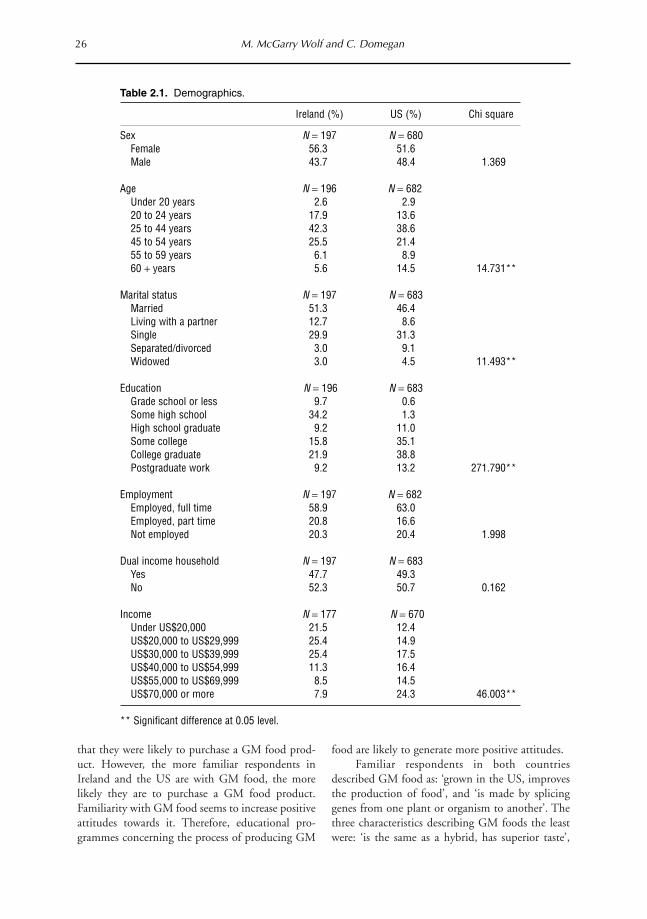
that they were likely to purchase a GM food prod-uct. However, the more familiar respondents inIreland and the US are with GM food, the morelikely they are to purchase a GM food product.Familiarity with GM food seems to increase positiveattitudes towards it. Therefore, educational pro-grammes concerning the process of producing GM
food are likely to generate more positive attitudes.Familiar respondents in both countries
described GM food as: ‘grown in the US, improvesthe production of food’, and ‘is made by splicinggenes from one plant or organism to another’. Thethree characteristics describing GM foods the leastwere: ‘is the same as a hybrid, has superior taste’,
26 M. McGarry Wolf and C. Domegan
Table 2.1. Demographics.
Ireland (%) US (%) Chi square
Sex N = 197 N = 680Female 56.3 51.6Male 43.7 48.4 1.369
Age N = 196 N = 682Under 20 years 2.6 2.920 to 24 years 17.9 13.625 to 44 years 42.3 38.645 to 54 years 25.5 21.455 to 59 years 6.1 8.960 + years 5.6 14.5 14.731**
Marital status N = 197 N = 683Married 51.3 46.4Living with a partner 12.7 8.6Single 29.9 31.3Separated/divorced 3.0 9.1Widowed 3.0 4.5 11.493**
Education N = 196 N = 683Grade school or less 9.7 0.6Some high school 34.2 1.3High school graduate 9.2 11.0Some college 15.8 35.1College graduate 21.9 38.8Postgraduate work 9.2 13.2 271.790**
Employment N = 197 N = 682Employed, full time 58.9 63.0Employed, part time 20.8 16.6Not employed 20.3 20.4 1.998
Dual income household N = 197 N = 683Yes 47.7 49.3No 52.3 50.7 0.162
Income N = 177 N = 670Under US$20,000 21.5 12.4US$20,000 to US$29,999 25.4 14.9US$30,000 to US$39,999 25.4 17.5US$40,000 to US$54,999 11.3 16.4US$55,000 to US$69,999 8.5 14.5US$70,000 or more 7.9 24.3 46.003**
** Significant difference at 0.05 level.
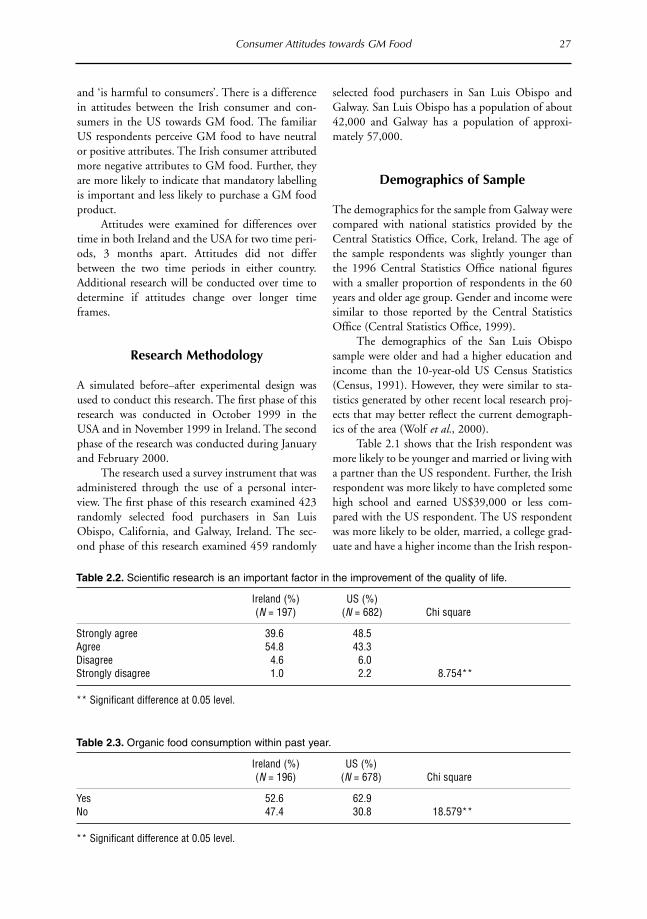
Consumer Attitudes towards GM Food 27
and ‘is harmful to consumers’. There is a differencein attitudes between the Irish consumer and con-sumers in the US towards GM food. The familiarUS respondents perceive GM food to have neutralor positive attributes. The Irish consumer attributedmore negative attributes to GM food. Further, theyare more likely to indicate that mandatory labellingis important and less likely to purchase a GM foodproduct.
Attitudes were examined for differences overtime in both Ireland and the USA for two time peri-ods, 3 months apart. Attitudes did not differbetween the two time periods in either country.Additional research will be conducted over time todetermine if attitudes change over longer timeframes.
Research Methodology
A simulated before–after experimental design wasused to conduct this research. The first phase of thisresearch was conducted in October 1999 in theUSA and in November 1999 in Ireland. The secondphase of the research was conducted during Januaryand February 2000.
The research used a survey instrument that wasadministered through the use of a personal inter-view. The first phase of this research examined 423randomly selected food purchasers in San LuisObispo, California, and Galway, Ireland. The sec-ond phase of this research examined 459 randomly
selected food purchasers in San Luis Obispo andGalway. San Luis Obispo has a population of about42,000 and Galway has a population of approxi-mately 57,000.
Demographics of Sample
The demographics for the sample from Galway werecompared with national statistics provided by theCentral Statistics Office, Cork, Ireland. The age ofthe sample respondents was slightly younger thanthe 1996 Central Statistics Office national figureswith a smaller proportion of respondents in the 60years and older age group. Gender and income weresimilar to those reported by the Central StatisticsOffice (Central Statistics Office, 1999).
The demographics of the San Luis Obisposample were older and had a higher education andincome than the 10-year-old US Census Statistics(Census, 1991). However, they were similar to sta-tistics generated by other recent local research proj-ects that may better reflect the current demograph-ics of the area (Wolf et al., 2000).
Table 2.1 shows that the Irish respondent wasmore likely to be younger and married or living witha partner than the US respondent. Further, the Irishrespondent was more likely to have completed somehigh school and earned US$39,000 or less com-pared with the US respondent. The US respondentwas more likely to be older, married, a college grad-uate and have a higher income than the Irish respon-
Table 2.2. Scientific research is an important factor in the improvement of the quality of life.
Ireland (%) US (%)(N = 197) (N = 682) Chi square
Strongly agree 39.6 48.5Agree 54.8 43.3Disagree 4.6 6.0Strongly disagree 1.0 2.2 8.754**
** Significant difference at 0.05 level.
Table 2.3. Organic food consumption within past year.
Ireland (%) US (%)(N = 196) (N = 678) Chi square
Yes 52.6 62.9No 47.4 30.8 18.579**
** Significant difference at 0.05 level.
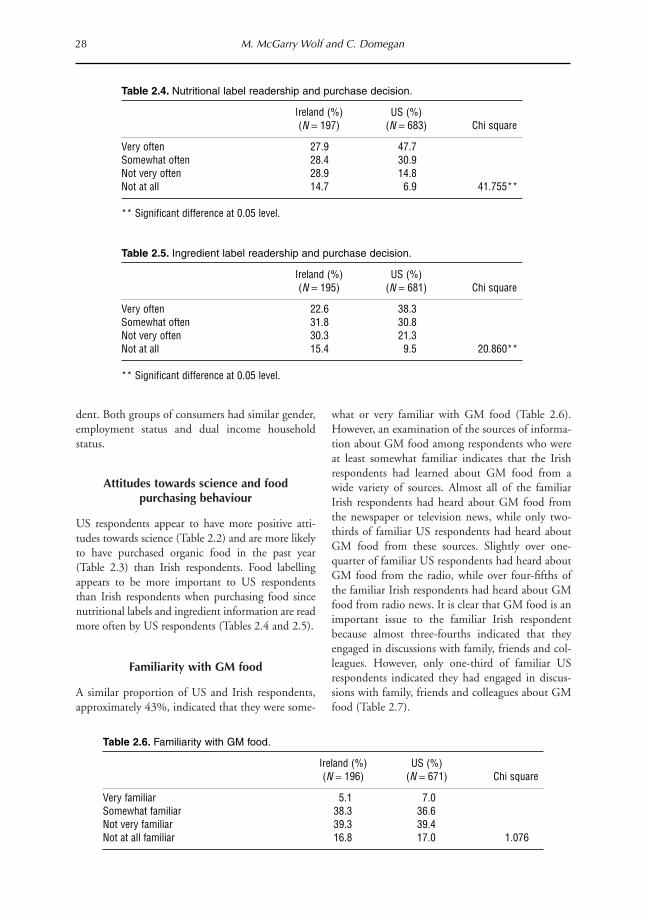
dent. Both groups of consumers had similar gender,employment status and dual income householdstatus.
Attitudes towards science and foodpurchasing behaviour
US respondents appear to have more positive atti-tudes towards science (Table 2.2) and are more likelyto have purchased organic food in the past year(Table 2.3) than Irish respondents. Food labellingappears to be more important to US respondentsthan Irish respondents when purchasing food sincenutritional labels and ingredient information are readmore often by US respondents (Tables 2.4 and 2.5).
Familiarity with GM food
A similar proportion of US and Irish respondents,approximately 43%, indicated that they were some-
what or very familiar with GM food (Table 2.6).However, an examination of the sources of informa-tion about GM food among respondents who wereat least somewhat familiar indicates that the Irishrespondents had learned about GM food from awide variety of sources. Almost all of the familiarIrish respondents had heard about GM food fromthe newspaper or television news, while only two-thirds of familiar US respondents had heard aboutGM food from these sources. Slightly over one-quarter of familiar US respondents had heard aboutGM food from the radio, while over four-fifths ofthe familiar Irish respondents had heard about GMfood from radio news. It is clear that GM food is animportant issue to the familiar Irish respondentbecause almost three-fourths indicated that theyengaged in discussions with family, friends and col-leagues. However, only one-third of familiar USrespondents indicated they had engaged in discus-sions with family, friends and colleagues about GMfood (Table 2.7).
28 M. McGarry Wolf and C. Domegan
Table 2.4. Nutritional label readership and purchase decision.
Ireland (%) US (%)(N = 197) (N = 683) Chi square
Very often 27.9 47.7Somewhat often 28.4 30.9Not very often 28.9 14.8Not at all 14.7 6.9 41.755**
** Significant difference at 0.05 level.
Table 2.5. Ingredient label readership and purchase decision.
Ireland (%) US (%)(N = 195) (N = 681) Chi square
Very often 22.6 38.3Somewhat often 31.8 30.8Not very often 30.3 21.3Not at all 15.4 9.5 20.860**
** Significant difference at 0.05 level.
Table 2.6. Familiarity with GM food.
Ireland (%) US (%)(N = 196) (N = 671) Chi square
Very familiar 5.1 7.0Somewhat familiar 38.3 36.6Not very familiar 39.3 39.4Not at all familiar 16.8 17.0 1.076

Most respondents familiar with GM food wereable to identify tomatoes and maize as crops that aregrown domestically or internationally using GMmethods. The familiar Irish respondents identifiedmore crops as being grown using GM methods(Table 2.8).
Attitudes towards GM Food
Most consumers in both countries indicated thatgovernment imposition of mandatory labelling isimportant, 95% in Ireland and 81% in the USA.Although the Irish respondents were less likely thanthe US respondents to read nutritional labels oringredient labels when making a food purchase deci-sion, they were more likely than the US respondentsto indicate that government imposition of mandato-ry labelling of GM food is very important. Almostthree-quarters of the Irish respondents indicated
that mandatory labelling of GM food is very impor-tant compared with approximately half of USrespondents (Table 2.9).
The Irish consumer is less likely to purchasefood that has been genetically modified than the USconsumer. Over half of the Irish respondents indi-cated that they were not likely to purchase food thathas been genetically modified compared with onlyone-quarter of the US consumers (Table 2.10).
Perceptions of GM food
In order to examine respondents’ perceptions aboutGM food products, they were asked to rate 15 state-ments on a five-point scale concerning how eachstatement describes GM foods. The following ques-tion was used to determine respondents’ knowledgeabout GM food products:
Consumer Attitudes towards GM Food 29
Table 2.7. Sources of GM food awareness among very or somewhat familiar.
Ireland (%) US (%)(N = 86) (N = 297) Chi square
Newspaper 97.6 68.3 28.93**Television news 97.6 64.2 34.88**Radio news 86.3 27.9 90.82**Discussion w/ family, friends, etc. 71.8 36.7 30.43**News magazines 52.2 40.4 3.63**Employment, work in farming or food process 27.6 16 4.35**Consumer reports magazine 25.4 20.5 10.40**Internet 22.8 15.1 2.04Other 0 11.3 6.01**
** Significant difference at 0.05 level.
Table 2.8. Crops believed to be grown domestically/internationally using GM methods amongvery or somewhat familiar.
Ireland (%) US (%)(N = 86) (N = 297) Chi square
Tomatoes 79.5 69.4 2.89*Maize 70.7 65.3 4.87*Wheat 63.6 40.8 11.23**Barley 62.3 34.5 17.78**Potatoes 62.2 33.1 25.2**Soybean 56.2 36.1 14.03**Sugarbeet 55.4 25.5 21.95**Cotton 29.5 39.3 2.28None of the above 0 1.8 0.89Do not know 10.2 15.7 6.49**
* Significant difference at 0.10 level; ** significant difference at 0.05 level.

To the best of your knowledge, how well do each of
the following statements describe GM food? As I
read each statement, please think about how well it
describes GM food. Even if you are not too familiar
with certain aspects of GM food, please rate it based
on your impressions. To answer, please tell me the
number from the scale I read which best describes
GM food on that statement.
(5 = Describes GM food completely
(4 = Describes GM food very well
(3 = Describes GM food somewhat
(2 = Describes GM food slightly
(1 = Does not describe GM food at all
(0 = Not at all familiar with GM food)
A mean rating was calculated for each descrip-tive statement among respondents that used the 1–5rating scale. Respondents that answered 0, not at allfamiliar with GM food, were excluded from thisanalysis of each statement. The results of the analy-sis of means indicated that the familiar respondentsconsidered the descriptive statements to be brokeninto two distinct groups: describes GM food some-what to very well and describes GM food slightly tosomewhat (Table 2.11). The top three characteristicsfrom the list of 15 statements describing GM foodswere: ‘grown in the US, improves the production offood’, and ‘is made by splicing genes from one plantor organism to another’. The three characteristics
describing GM foods the least were: ‘is the same asa hybrid, has superior taste’, and ‘is harmful to con-sumers’.
There are differences between the attitudes ofthe Irish respondents and the respondents from theUS (Table 2.12). The top three characteristicsremain the same for the two groups. However, theIrish gave higher ratings to the descriptive state-ments: ‘is made by splicing genes from one plant ororganism into another plant, has seeds fromMonsanto, is modified to kill pests, may be harmfulto the environment, is grown in Ireland’, and ‘isharmful to consumers’. The respondents from theUS rated the following statements higher: ‘is grownin the US, is modified to help plants withstand weedkillers, is beneficial to the environment’, and ‘hassuperior taste’. The familiar US respondents appearto perceive GM food to have neutral or positiveattributes. Since the Irish respondents gave a lowerrating to ‘is beneficial to the environment’, and ahigher rating to ‘is harmful to consumers and envi-ronment’, it appears that the Irish respondent has aless positive attitude towards GM foods than therespondent from the US. This attitude difference isreflected in a higher importance of mandatorylabelling and a lower likelihood of purchasing GMfood for the Irish consumer.
30 M. McGarry Wolf and C. Domegan
Table 2.9. Government imposition of mandatory labelling for GM food.
Ireland (%) US (%)(N = 197) (N = 681) Chi square
Very important 70.6 52.3Somewhat important 25.4 28.9Not very important 3.6 12.2Not at all important 0.5 6.6 31.709**
** Significant difference at 0.05 level.
Table 2.10. Likelihood of GM food purchase.
Ireland (%) US (%)(N = 197) (N = 679) Chi square
Definitely 3.6 6.9Probably 19.3 28.3Maybe 24.9 37.6Probably not 28.4 18.9Definitely not 23.9 8.4 52.005**
** Significant difference at 0.05 level.

Familiarity with GM Food
Respondents in each country were examined basedon two subgroups: those familiar with GM foodcompared with those not familiar with GM food.Respondents that are identified as familiar indicated
that they were very or somewhat familiar with GMfood. Respondents that are identified as not familiarindicated that they were not very or not at all famil-iar with GM food.
In Ireland and the US familiarity varies withdemographics (Table 2.13). In Ireland, respondents
Consumer Attitudes towards GM Food 31
Table 2.11. Total sample descriptive ratings of GM food characteristics among familiar.
StandardMean rating error N
Describes somewhat to very wellIs grown in the US 3.7790 0.05 751Improves the production of food 3.5481 0.07 771Is made by splicing genes from one plant or organism into another plant 3.5311 0.05 659Is the same as bioengineered food 3.2103 0.05 623Is modified to help plants withstand weed killers 3.0567 0.05 688
Describes slightly to somewhatIs altered to improve nutrition 2.9577 0.06 734Has seeds from Monsanto 2.9386 0.08 342Is modified to kill pests 2.8025 0.05 729May be harmful to the environment 2.7371 0.05 715Is grown in Ireland 2.6320 0.07 413Has seeds from Novartis 2.4435 0.09 230Is beneficial to the environment 2.4342 0.05 714Is the same as a hybrid 2.4227 0.05 608Has superior taste 2.3110 0.05 582Is harmful to consumers 2.2098 0.05 696
Table 2.12. Comparison of descriptive ratings of GM food characteristics.
Ireland US
Describes somewhat to very wellIs grown in the US** (t = –2.49) 3.5460 3.8435Improves the production of food (t = –1.46) 3.4556 3.5740Is made by splicing genes from one plant or organism into another plant* (t = 1.45) 3.6713 3.4922Is the same as bioengineered food (t = 0.70) 3.1377 3.2309Is modified to help plants withstand weed killers** (t = –0.97) 2.9673 3.0822
Describes slightly to somewhatIs altered to improve nutrition (t = –1.310) 2.8280 2.9931Has seeds from Monsanto** (t = 1.781) 3.2143 2.8676Is modified to kill pests** (t = 0.147) 2.8160 2.7986May be harmful to the environment** (t = 4.090) 3.1218 2.6297Is grown in Ireland** (t = 3.792) 2.9931 2.4366Has seeds from Novartis (t = 1.486) 2.7895 2.3750Is beneficial to the environment** (t = –5.092) 1.9740 2.5607Is the same as a hybrid* (t = 1.802) 2.6330 2.3768Has superior taste** (t = –2.413) 2.0752 2.3808Is harmful to consumers** (t = 4.677) 2.6341 2.0789
*Significant difference at 0.10 level using an independent sample t-test; **significant difference at 0.05 level using anindependent sample t-test.
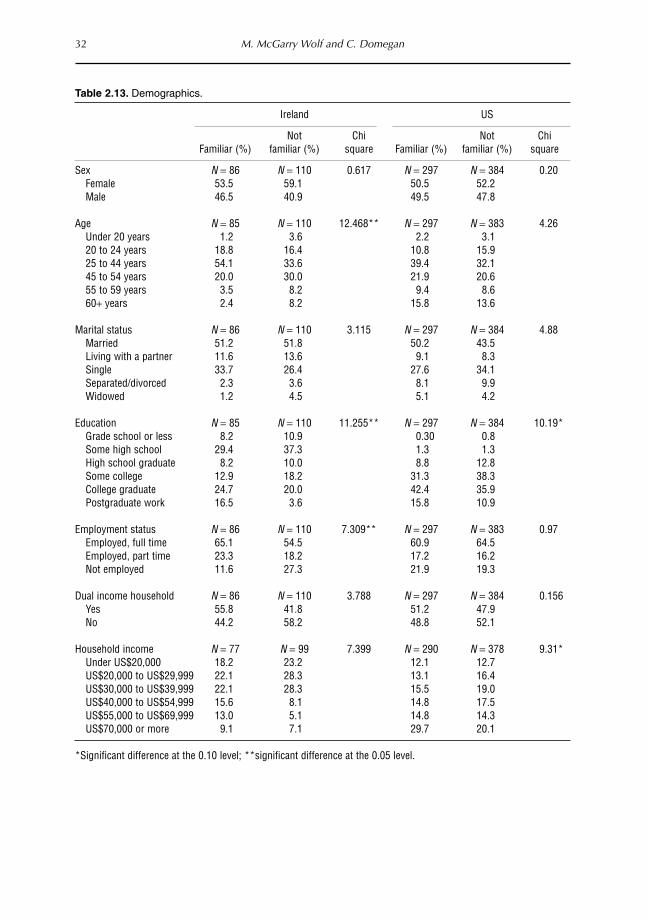
32 M. McGarry Wolf and C. Domegan
Table 2.13. Demographics.
Ireland US
Not Chi Not ChiFamiliar (%) familiar (%) square Familiar (%) familiar (%) square
Sex N = 86 N = 110 0.617 N = 297 N = 384 0.20Female 53.5 59.1 50.5 52.2Male 46.5 40.9 49.5 47.8
Age N = 85 N = 110 12.468** N = 297 N = 383 4.26Under 20 years 1.2 3.6 2.2 3.120 to 24 years 18.8 16.4 10.8 15.925 to 44 years 54.1 33.6 39.4 32.145 to 54 years 20.0 30.0 21.9 20.655 to 59 years 3.5 8.2 9.4 8.660+ years 2.4 8.2 15.8 13.6
Marital status N = 86 N = 110 3.115 N = 297 N = 384 4.88Married 51.2 51.8 50.2 43.5Living with a partner 11.6 13.6 9.1 8.3Single 33.7 26.4 27.6 34.1Separated/divorced 2.3 3.6 8.1 9.9Widowed 1.2 4.5 5.1 4.2
Education N = 85 N = 110 11.255** N = 297 N = 384 10.19*Grade school or less 8.2 10.9 0.30 0.8Some high school 29.4 37.3 1.3 1.3High school graduate 8.2 10.0 8.8 12.8Some college 12.9 18.2 31.3 38.3College graduate 24.7 20.0 42.4 35.9Postgraduate work 16.5 3.6 15.8 10.9
Employment status N = 86 N = 110 7.309** N = 297 N = 383 0.97Employed, full time 65.1 54.5 60.9 64.5Employed, part time 23.3 18.2 17.2 16.2Not employed 11.6 27.3 21.9 19.3
Dual income household N = 86 N = 110 3.788 N = 297 N = 384 0.156Yes 55.8 41.8 51.2 47.9No 44.2 58.2 48.8 52.1
Household income N = 77 N = 99 7.399 N = 290 N = 378 9.31*Under US$20,000 18.2 23.2 12.1 12.7US$20,000 to US$29,999 22.1 28.3 13.1 16.4US$30,000 to US$39,999 22.1 28.3 15.5 19.0US$40,000 to US$54,999 15.6 8.1 14.8 17.5US$55,000 to US$69,999 13.0 5.1 14.8 14.3US$70,000 or more 9.1 7.1 29.7 20.1
*Significant difference at the 0.10 level; **significant difference at the 0.05 level.

Table 2.14. Nutrition label readership.
Ireland US
Not NotFamiliar (%) familiar (%) Chi Familiar (%) familiar (%) Chi
(N = 86) (N = 110) square (N = 297) (N = 384) square
Very often 39.5 19.1 12.726** 54.2 42.2 15.62**Somewhat often 24.4 31.8 30.6 31.0Not very often 24.9 29.1 10.4 18.2Not at all 8.1 20.0 4.8 8.6
**Significant difference at the 0.05 level.
Table 2.15. Ingredient label readership.
Ireland US
Not NotFamiliar (%) familiar (%) Chi Familiar (%) familiar (%) Chi
(N = 86) (N = 110) square (N = 297) (N = 384) square
Very often 32.6 14.7 11.443** 50.2 29.1 34.64**Somewhat often 31.4 32.1 27.6 33.2Not very often 26.7 33.0 8.3 25.4Not at all 9.3 19.3 2.1 12.3
**Significant difference at the 0.05 level.
Table 2.16. Past year organic food purchase.
Ireland US
Not NotFamiliar (%) familiar (%) Chi Familiar (%) familiar (%) Chi
(N = 86) (N = 110) square (N = 297) (N = 384) square
Yes 68.2 40.9 14.367** 75.1 63.9 13.73**No 31.8 59.1 24.9 35.1
**Significant difference at the 0.05 level.
aged between 25 and 44, more highly educated andemployed are more likely to be familiar with GMfood. In the USA respondents that are college grad-uates and have a higher household income are morelikely to be familiar with GM food.
In both Ireland and the USA respondents thatare familiar with GM food are more likely to readnutrition and ingredient labels (Tables 2.14 and2.15). Organic food is more likely to have been
purchased in the past year by respondents familiarwith GM food in both countries (Table 2.16).Therefore, it is not surprising that respondents inIreland and the US that are familiar with GM foodare more likely to feel that mandatory labelling ofGM food is very important (Table 2.17). Familiarrespondents in both countries are more likely topurchase GM food products than respondents thatare not familiar with GM food (Table 2.18).
Consumer Attitudes towards GM Food 33

Likelihood of Purchasing GM Foods
Respondents in each country were examined basedon two subgroups: those that are likely to purchasea GM food product compared with those that arenot likely to purchase a GM food product.Respondents that are identified as purchase GMOindicated that they would definitely or probablypurchase a food product that has been GM.Respondents that are identified as not purchase indi-cated that they would maybe, probably not, or defi-nitely not purchase a food product that has beenGM. The Irish respondent who is likely to purchaseGM food is more highly educated. The US respon-dent who is likely to purchase GM food is morelikely to be male, single, separated or divorced, andfrom a single income household (Table 2.19).
Readership of nutrition or ingredient labelswhen purchasing food products is not related to the
probability that a respondent in Ireland or the USwill purchase a GM food product (Tables 2.20 and2.21). In Ireland past year purchasers of organicfood are more likely to purchase GM food.However, in the USA past year purchasing of organ-ic food is not related to the purchase probability ofGM food (Table 2.22). Respondents in Ireland andthe USA who are likely to purchase a GM foodproduct are more likely to be familiar with GM foodproducts than those that are not likely to purchaseGM food products (Table 2.23).
Attitudes towards mandatory labelling of GMfood are not related to the willingness to purchase aGM food product in Ireland. Mandatory labellingof GM food is less important to likely purchasers ofGM food product in the USA. However, a majority,73%, of respondents in the USA who are likely topurchase GM food indicated that mandatorylabelling of GM food is important (Table 2.24).
34 M. McGarry Wolf and C. Domegan
Table 2.17. Government imposition of mandatory labelling of GM foods.
Ireland US
Not NotFamiliar (%) familiar (%) Chi Familiar (%) familiar (%) Chi
(N = 86) (N = 110) square (N = 297) (N = 384) square
Very important 81.4 61.8 11.746** 56.9 48.7 11.38**Somewhatimportant 18.6 30.9 22.2 34.0Not veryimportant 0 6.4 13.5 11.3Not at allimportant 0 0.9 7.4 6.0
**Significant difference at the 0.05 level.
Table 2.18. Likelihood of purchasing GM foods.
Ireland US
Not NotFamiliar (%) familiar (%) Chi Familiar (%) familiar (%) Chi
(N = 86) (N = 110) square (N = 297) (N = 384) square
Definitely 8.1 0 19.515** 12.2 2.6 36.30**Probably 26.7 13.6 31.1 26.2Maybe 20.9 27.3 31.8 42.0Probably not 18.6 36.4 14.5 22.3Definitely not 25.6 22.7 10.5 6.8
**Significant difference at the 0.05 level.

Table 2.19. Demographics.
Ireland US
Purchase Non- Purchase Non-GMO (%) purchase (%) Chi square GMO (%) purchase (%) Chi square
Sex N = 45 N = 152 0.650 N = 239 N = 437 13.408**Female 51.1 57.9 42.3 57.0Male 48.9 42.1 57.7 43.0
Age N = 45 N = 151 5.431 N = 239 N = 439 10.456*Under 20 years 0 3.3 3.3 2.720 to 24 years 13.3 19.2 16.7 12.125 to 44 years 55.6 38.4 36.4 39.945 to 54 years 20.0 27.2 19.2 22.655 to 59 years 6.7 6.0 12.1 6.860+ years 4.4 6.0 12.1 15.9
Marital status N = 45 N = 152 2.156 N = 239 N = 440 8.742*Married 55.6 50.0 43.1 48.2Living with a partner 13.3 12.5 7.5 9.3Single 28.9 30.3 36.8 28.6Separated/divorced 2.2 3.3 10.0 8.2Widowed 0 3.9 2.5 5.7
Education N = 45 N = 151 11.780** N = 239 N = 440 5.292Grade school or less 11.1 9.3 0.4 0.7Some high school 26.7 36.4 1.3 1.4High school graduate 2.2 11.3 8.4 12.5Some college 15.6 15.9 38.1 33.6College graduate 24.4 21.2 36.4 39.8Postgraduate work 20.0 6.0 15.5 12.0
Employment status N = 45 N = 152 1.876 N = 239 N = 439 3.893Employed, full time 62.2 57.9 67.8 60.1Employed, part time 24.4 19.7 14.2 18.0Not employed 13.3 22.4 18.0 21.9
Dual income household N = 45 N = 152 1.437 N = 239 N = 440 3.078*Yes 55.6 45.4 44.8 51.8No 44.4 54.6 55.2 48.2
Household income N = 40 N = 137 4.534 N = 236 N = 430 2.795Under US$20,000 20.0 21.9 13.1 12.1US$20,000 to US$29,999 17.5 27.7 14.8 15.1US$30,000 to US$39,999 30.0 24.1 17.4 17.7US$40,000 to US$54,999 17.5 9.5 16.9 15.8US$55,000 to US$69,999 5.0 9.5 11.4 15.8US$70,000 or more 10.0 7.3 26.3 23.5
*Significant difference at the 0.10 level; **significant difference at the 0.05 level.
Consumer Attitudes towards GM Food 35

36 M. McGarry Wolf and C. Domegan
Table 2.20. Nutrition label readership.
Ireland US
Purchase Non- Chi Purchase Non- ChiGMO (%) purchase (%) square GMO (%) purchase (%) square
N = 45 N = 152 N = 239 N = 440Very often 35.6 25.7 43.1 50.2Somewhat often 26.7 28.9 33.1 29.5Not very often 28.9 28.9 16.7 13.4Not at all 8.9 16.4 2.629 7.1 6.8 3.465
Table 2.21. Ingredient label readership.
Ireland US
Purchase Non- Chi Purchase Non- ChiGMO (%) purchase (%) square GMO (%) purchase (%) square
N = 45 N = 152 N = 239 N = 440Very often 20.0 23.2 33.5 41.3Somewhat often 37.8 29.8 33.1 29.9Not very often 28.9 30.5 23.4 19.9Not at all 13.3 15.9 1.328 10.0 8.9 4.113
Table 2.22. Past year organic food purchase.
Ireland US
Purchase Non- Chi Purchase Non- ChiGMO (%) purchase (%) square GMO (%) purchase (%) square
N = 45 N = 151 N = 238 N = 437Yes 62.2 49.7 71.4 68.0No 37.8 50.3 2.191* 28.6 32.0 0.868
*Significant difference at the 0.10 level.
Table 2.23. Familiarity with GM foods.
Ireland US
Purchase Non- Chi Purchase Non- ChiGMO (%) purchase (%) square GMO (%) purchase (%) square
N = 45 N = 152 N = 238 N = 439Very familiar 4.4 15.3 14.4** 9.7 5.7 16.74**Somewhat familiar 62.2 31.6 44.1 32.6Not very familiar 24.4 63.45 34.0 41.9Not at all familiar 8.9 19.8 12.2 19.8
**Significant difference at the 0.05 level.

Conclusions
This research shows that there is a similar level offamiliarity with GM food in Ireland and the USA.Approximately 43% of respondents in both coun-tries indicated that they were familiar with GMfood. However, familiar Irish consumers are awarefrom more sources than the US consumer. The Irishconsumers appear to be more interested in GM foodbecause they were more likely to indicate that theyhad discussions with family, friends and colleaguesconcerning GM food. More highly educatedrespondents in both countries are more likely to befamiliar with GM food.
Most consumers in both countries indicatedthat government imposition of mandatory labellingis important, 95% in Ireland and 81% in the US.The more familiar US and Irish consumers are withGM food, the more likely they are to indicate thatmandatory labelling is very important. Further,almost three-quarters of US respondents who arelikely to purchase a GM food product indicated thatmandatory labelling is important. The EuropeanUnion has imposed legislation requiring the manda-tory labelling of food products containing GM ingre-dients. It appears that efforts in the US by legislatorsto require labelling are appropriate. In California,there was an attempt to qualify an initiative for theNovember 2000 ballot that would state that the peo-ple of California wish for labelling of genetically engi-neered food. At the federal level, a bipartisan group of20 sponsors introduced a bill on 9 November 1999 torequire a label on food containing GMOs.
A minority of consumers in each country saidthat they were likely to purchase a GM food prod-uct. However, the more familiar respondents inIreland and the US are with GM food, the morelikely they are to purchase a GM food product.
Therefore, familiarity with GM food seems toincrease positive attitudes towards it. Educationalprogrammes concerning the process of producingGM food to increase consumers’ familiarity arelikely to generate more positive attitudes.
Familiar respondents in both countriesdescribed GM food as: ‘grown in the US, improvesthe production of food’, and ‘is made by splicinggenes from one plant or organism to another’. Thethree characteristics describing GM foods the leastwere: ‘is the same as a hybrid, has superior taste’, andis ‘harmful to consumers’. There is a difference in atti-tudes between the Irish consumer and consumers inthe US towards GM food. The familiar US respon-dents perceived GM food to have neutral or positiveattributes. The Irish consumer attributed more nega-tive attributes to GM food. Further, they are morelikely to indicate that mandatory labelling is impor-tant and less likely to purchase a GM food product.
Attitudes were examined for differences over athree-month time period in both Ireland and theUSA. Attitudes did not differ between the two timeperiods. Additional research will be conducted inOctober 2000 to determine if familiarity and atti-tudes concerning GM food have remained constantor changed over a 1-year period.
References
Central Statistics Office (1999) Home page, principal
statistics. www.cso.ie/principalstat/pristat2.html
US Bureau of the Census (1991) State and MetropolitanData, US Bureau of the Census.
Wolf, M., Amspacher, W. and Noyes, B. (2000) AMarketing Research Study of San Luis Obispo / FiveCites Area Residents’ Attitudes Regarding the LocalViticulture and Wine Industry. California State
University Agricultural Research Initiative.
Consumer Attitudes towards GM Food 37
Table 2.24. Government imposition of mandatory labelling of GM foods.
Ireland US
Purchase Non- Chi Purchase Non- ChiGMO (%) purchase (%) square GMO (%) purchase (%) square
N = 45 N = 151 N = 239 N = 438Very important 68.9 71.1 3.730 41.4 58.2 25.5**Somewhat important 26.7 25.0 31.4 27.6Not very important 2.2 3.9 15.9 10.0Not at all important 2.2 0 11.3 4.1
**Significant at the 0.05 level.

1 Research financed by Flanders Interuniversity Institute for Biotechnology (VIB) in the frame of the TechnologyAssessment Programme.
Problem Definition and Objective
Biotechnology is an enormously expanding disci-pline with various applications in the medical, agri-cultural and food sector. The use of genetic modifi-cation technology in food production is only oneexample, nevertheless a very important one. It offersnew perspectives for product development, costreduction and environmental protection. Accordingto the White Paper, modern biotechnology includesan impulse for competitiveness and economicgrowth (European Commission, 1994). However,biotechnology in general and genetically modified(GM) food in particular came recently to the fore-front of public attention. Abundant questions arebeing asked about safety for human health and forthe environment, ethics, free consumer choice,socio-economic and legal issues.
Public support is especially low for biotechnol-ogy applications in the food sector. Europeans showmore concern and resistance towards GM foodcompared with other parts of the world (Table 3.1).These consumer concerns seriously jeopardize thefuture market success of modern biotechnologyproducts, including GM food products (EFB TaskGroup on Public Perceptions of Biotechnology,1998, 1999). Consequently, gaining insight into
consumer beliefs, attitudes and behavioural inten-tions concerning GM food is essential.1 Against thisbackground, the objective of this chapter is twofold:
• explore consumer attitudes and behaviouralintentions towards GM food as well as theirdeterminants;
• verify whether or not indications of differencesin determinants of consumer attitudes andbehavioural intentions exist between generic andbranded GM food products.
The chapter starts with a description of the researchmethodology. Next, findings in literature are con-fronted using results of qualitative market research.The chapter focuses on determinants of both con-sumer attitudes and behavioural intentions towardsGM food. Hereby, a distinction is made between
39
3 Differences in Public Acceptance betweenGeneric and Premium Branded GM Food
Products: an Analytical Model
Annelies Verdurme, Xavier Gellynck, Jacques Viaene and Wim VerbekeFaculty of Agriculture and Applied Biological Sciences, Department of Agricultural
Economics, Division of Agro-Marketing, Ghent University, Ghent, Belgium
© CAB International 2002. Market Development for Genetically Modified Foods(eds V. Santaniello, R.E. Evenson and D. Zilberman)
Table 3.1. Willingness to eat GM food (%).Example: GM fruit with improved taste. (FromInternational Food Information Council, 1999;Einseidel, 2000; INRA, 2000; Shimbun, 2000.)
Willingness to eat GM food (%)
Europe 25 Japan 38Canada 34 USA 54

generic and premium branded GM food products.Throughout the chapter, food products without abrand name or with a private label are considered asgeneric food products, while food products of well-known top brands are considered as premiumbranded food products. Finally, some conclusionsand topics for further research are formulated.
Research Methodology
Theoretical framework
The formation of beliefs, attitudes and behavioursmay occur directly or indirectly (Mowen, 1993). Inthe case of direct formation, a belief, attitude orbehaviour is created independent of each other. Inthe case of indirect formation, belief, attitudes andbehaviours build on each other to create hierarchies,that is hierarchies of effects. Depending on the typeof purchase process, four hierarchies or orders inwhich beliefs, attitudes and behaviours occur, can bedistinguished (Table 3.2). The various hierarchies ofeffects are idealized representations of consumerbuying behaviour. No matter what the purchaseprocess, consumers are likely to have vague beliefsand attitudes about a product before buying it.However, these different orders in the sequence ofconsumer behaviour provide a feel for the relative
emphasis of beliefs, attitudes and behaviour withinthe different purchase processes.
Since to date only a few GM food productshave been available on the food market, the chapterfocuses on behavioural intentions rather than oneffective behaviour. Behavioural intention is definedas ‘the determination of a consumer to engage insome act, such as purchasing a product’, a GM foodproduct in this research (Mowen, 1993).
Data collection
Based on a study of literature, both consumer atti-tudes and behavioural intentions towards GM foodare identified as well as the determinants. Therefore,several international scientific journals, reports,books, some web sites and a few popular magazinesand newspapers were consulted.
To explore what determines consumer atti-tudes and behavioural intentions towards GM foodin Belgium and, more specifically, in the Flemishregion, qualitative market research was conductedduring the period September 1999 – February2000. It comprised focus group discussions withconsumers and in-depth interviews with experts,such as representatives from public authorities,political parties, scientific world, industries, press,consumer and environmental organizations. In total
40 A. Verdurme et al.
Table 3.2. Purchase processes and their possible hierarchies of effects.
Purchase process Hierarchy of effects Description
High involvement Standard learning hierarchya: 1. Investigating the product to learn about its attributes.
Beliefs Æ affect Æ behaviour 2. Using this information to form attitudes towards it.
3. If attitudes are positive, the product is purchased.
Low involvement Low-involvement hierarchyb: 1. Superficial investigation of the product.
Beliefs Æ behaviour Æ affect 2. Purchase of the product.
3. Formation of attitudes towards it.
Experiential Experiential hierarchyc: 1. Strong affective response to the product.
Affect Æ behaviour Æ beliefs 2. Product purchase.
3. Development of beliefs to justify the buying act.
Behavioural influence Behavioural influence hierarchy: 1. Strong situational factors give rise to product purchase.
Behaviour Æ beliefs Æ affect 2. Attitudes or beliefs form after the buying act.
Behaviour Æ affect Æ beliefs
a Ray, 1973; b Krugman, 1961; Lavidge and Steiner, 1961; Olshavsky and Granbois, 1979; c De Bruicker, 1979.
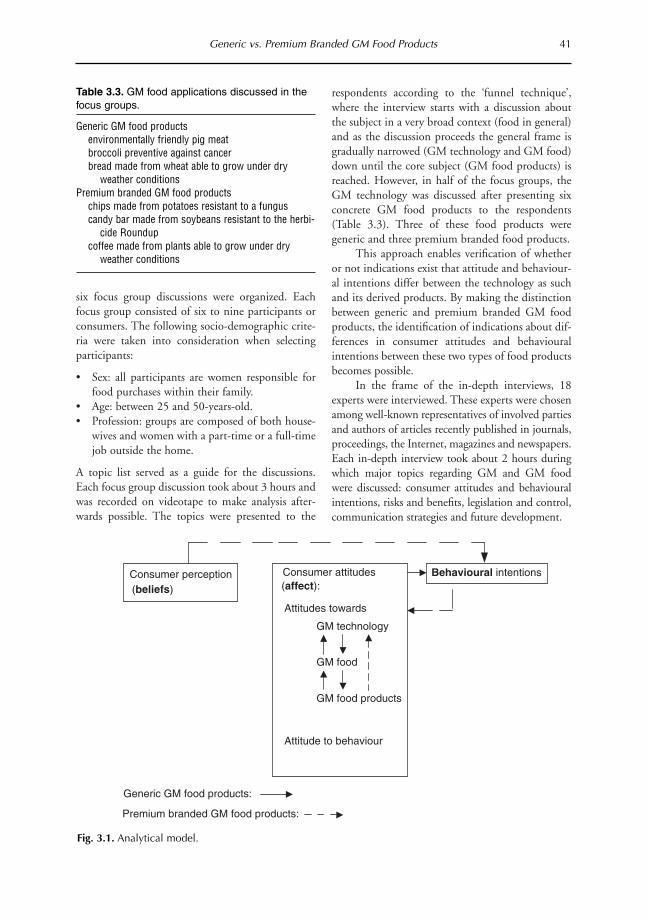
six focus group discussions were organized. Eachfocus group consisted of six to nine participants orconsumers. The following socio-demographic crite-ria were taken into consideration when selectingparticipants:
• Sex: all participants are women responsible forfood purchases within their family.
• Age: between 25 and 50-years-old.• Profession: groups are composed of both house-
wives and women with a part-time or a full-timejob outside the home.
A topic list served as a guide for the discussions.Each focus group discussion took about 3 hours andwas recorded on videotape to make analysis after-wards possible. The topics were presented to the
respondents according to the ‘funnel technique’,where the interview starts with a discussion aboutthe subject in a very broad context (food in general)and as the discussion proceeds the general frame isgradually narrowed (GM technology and GM food)down until the core subject (GM food products) isreached. However, in half of the focus groups, theGM technology was discussed after presenting sixconcrete GM food products to the respondents(Table 3.3). Three of these food products weregeneric and three premium branded food products.
This approach enables verification of whetheror not indications exist that attitude and behaviour-al intentions differ between the technology as suchand its derived products. By making the distinctionbetween generic and premium branded GM foodproducts, the identification of indications about dif-ferences in consumer attitudes and behaviouralintentions between these two types of food productsbecomes possible.
In the frame of the in-depth interviews, 18experts were interviewed. These experts were chosenamong well-known representatives of involved partiesand authors of articles recently published in journals,proceedings, the Internet, magazines and newspapers.Each in-depth interview took about 2 hours duringwhich major topics regarding GM and GM foodwere discussed: consumer attitudes and behaviouralintentions, risks and benefits, legislation and control,communication strategies and future development.
Generic vs. Premium Branded GM Food Products 41
Table 3.3. GM food applications discussed in thefocus groups.
Generic GM food productsenvironmentally friendly pig meatbroccoli preventive against cancerbread made from wheat able to grow under dry
weather conditionsPremium branded GM food products
chips made from potatoes resistant to a funguscandy bar made from soybeans resistant to the herbi-
cide Roundupcoffee made from plants able to grow under dry
weather conditions
Fig. 3.1. Analytical model.
Consumer perception Consumer attitudes
(beliefs) (affect):
Attitudes towards
GM technology
GM food
GM food products
Attitude to behaviour
Generic GM food products:
Premium branded GM food products:
Behavioural intentions

Results
Based on the results from literature study, focusgroup discussions with consumers and in-depthinterviews with experts, an analytical model thatdescribes consumer attitudes and behavioural inten-tions towards GM food as well as the determinants,was developed (Fig. 3.1). In the model, a distinctionis made between generic and premium branded GMfood products.
Consumer attitudes towards GM
By evaluating consumer attitudes towards GM, threelevels can be distinguished (Fig. 3.2). The levelsrange from the rather abstract and distant ‘technolo-gy’ level, to the ‘application’ level and the final andmore concrete ‘product’ level. Objections are not toGM as a technology, but focus rather on the field andthe organism involved (Frewer et al., 1997). Theapplication generating the most objections willdetermine the attitude towards the technology.
At the application level, a distinction is madebetween two aspects, namely the field and organisminvolved. Public support for applications in themedical field such as the detection of hereditary dis-eases is high while extremely low for food applica-tions (INRA, 2000). This difference in public sup-
port according to the application field was also illus-trated during the focus group discussions and can beexplained as follows:
• When people are ill and risk death, they want torecover no matter how, even through GM medi-cine. However, according to the focus groupdiscussions, some consumers fear that geneticmodification will give rise to new diseasesinstead of curing the existing ones.
• Until the 1980s, food was regarded to be essen-tial for human growth and strength in most partsof Western Europe. Market saturation, efforts tosensitize the public regarding diet-related dis-eases (e.g. cancer) as well as food scandals such ashormones, BSE and the dioxin crisis changedthis view and food became more associated withhuman health and shape. Nowadays, some foodproducts such as meat are even regarded ashealth threatening.
• Because of food scandals such as bovine spongi-form encephalopathy (BSE) and the dioxin cri-sis, people are much more aware about the linkbetween health on the one hand and the qualityand quantity of food consumed on the otherhand. Food also has an important socio-culturalfunction (e.g. traditional birthday cake, localfood products). Consequently, food producedaccording to conventional methods is preferred
42 A. Verdurme et al.
Fig. 3.2. Three levels of consumer attitudes towards GM.
Consumer attitudes towards GM
LEVEL 1 Technology
LEVEL 2
Application
Field Involved organism
Medicine Microorganism Agriculture Plant Food Animal Environment Human
LEVEL 3 Product
Generic GM food products:
Premium branded GM food products:
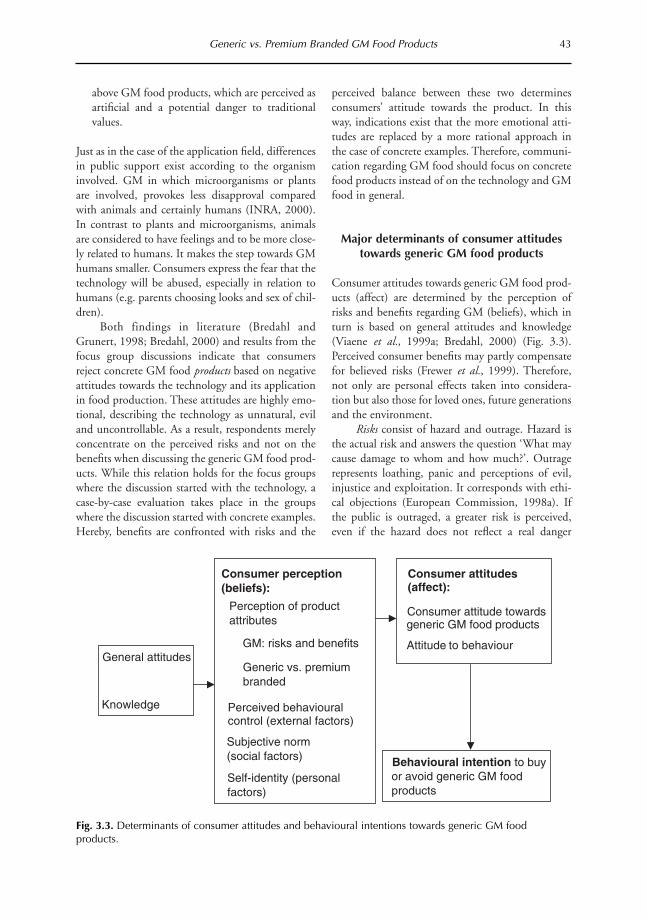
above GM food products, which are perceived asartificial and a potential danger to traditionalvalues.
Just as in the case of the application field, differencesin public support exist according to the organisminvolved. GM in which microorganisms or plantsare involved, provokes less disapproval comparedwith animals and certainly humans (INRA, 2000).In contrast to plants and microorganisms, animalsare considered to have feelings and to be more close-ly related to humans. It makes the step towards GMhumans smaller. Consumers express the fear that thetechnology will be abused, especially in relation tohumans (e.g. parents choosing looks and sex of chil-dren).
Both findings in literature (Bredahl andGrunert, 1998; Bredahl, 2000) and results from thefocus group discussions indicate that consumersreject concrete GM food products based on negativeattitudes towards the technology and its applicationin food production. These attitudes are highly emo-tional, describing the technology as unnatural, eviland uncontrollable. As a result, respondents merelyconcentrate on the perceived risks and not on thebenefits when discussing the generic GM food prod-ucts. While this relation holds for the focus groupswhere the discussion started with the technology, acase-by-case evaluation takes place in the groupswhere the discussion started with concrete examples.Hereby, benefits are confronted with risks and the
perceived balance between these two determinesconsumers’ attitude towards the product. In thisway, indications exist that the more emotional atti-tudes are replaced by a more rational approach inthe case of concrete examples. Therefore, communi-cation regarding GM food should focus on concretefood products instead of on the technology and GMfood in general.
Major determinants of consumer attitudestowards generic GM food products
Consumer attitudes towards generic GM food prod-ucts (affect) are determined by the perception ofrisks and benefits regarding GM (beliefs), which inturn is based on general attitudes and knowledge(Viaene et al., 1999a; Bredahl, 2000) (Fig. 3.3).Perceived consumer benefits may partly compensatefor believed risks (Frewer et al., 1999). Therefore,not only are personal effects taken into considera-tion but also those for loved ones, future generationsand the environment.
Risks consist of hazard and outrage. Hazard isthe actual risk and answers the question ‘What maycause damage to whom and how much?’. Outragerepresents loathing, panic and perceptions of evil,injustice and exploitation. It corresponds with ethi-cal objections (European Commission, 1998a). Ifthe public is outraged, a greater risk is perceived,even if the hazard does not reflect a real danger
Generic vs. Premium Branded GM Food Products 43
Fig. 3.3. Determinants of consumer attitudes and behavioural intentions towards generic GM foodproducts.
Consumer perception(beliefs):
Consumer attitudes(affect):
Perception of productattributes
Consumer attitude towards
GM: risks and benefits
generic GM food products
Generic vs. premiumbranded
General attitudesAttitude to behaviour
Perceived behaviouralcontrol (external factors)
Knowledge
Subjective norm(social factors) Behavioural intention to buy
or avoid generic GM foodproducts
Self-identity (personalfactors)

(European Commission, 1998b). Consumer con-cerns focus on potential hazards for human health(own, others) and for the environment. Ethicalobjections relate to issues of animal welfare, a dislikeof tampering with nature/food and societal injusticesuch as problems in the developing world (Frewer,1998a; Aubrée et al., 1999; Nuffield Council onBioethics, 1999). During the discussions, con-sumers declared that GM food is unhealthy andworked up. Future generations will lose the notionof the natural origin of food. They even comparedthe use of GM technology in the production of foodwith the use of hormones, which are both con-sidered as crossing ethically acceptable limits.
Benefits comprise both producer and consumerbenefits. At the consumer level, personal (e.g.improved taste), environmental (e.g. less pesticideuse) and societal (e.g. solving world hunger) benefitsare distinguished. Products with consumer benefitsare more readily accepted than products that merelybenefit the producer (European Commission,1998b). However, the current GM products offerfew consumer benefits (Isenterant, 1999). The focusgroup discussions made clear that most consumersare aware of this fact and, as a result, renounce GMfood. However, even when the use of GM technol-ogy in food production offers a solution to majorenvironmental or societal problems, alternative solu-tions such as organic farming or a redistribution ofpurchasing power and resources are preferred overthe use of GM. It has to be stressed that the researchfocuses on a saturated food market where consumerscan afford such an attitude.
General attitudes comprise several major atti-tude domains such as general attitudes towardsnature/the environment, technology/science, food,health and trust in public authorities and in indus-tries (Frewer et al., 1997; Cantley and Miyamura,1999; Bredahl, 2000). The Eurobarometer demon-strates that enthusiasm about modern biotechnolo-gy (including GM) is low, although the majority ofEuropeans are not technophobes (INRA, 2000).This study also reveals a strong decline in publictrust compared with 1996. The focus group discus-sions confirm these results. Recent food scandals(e.g. BSE, dioxin) have severely damaged consumertrust in public authorities and industries (Viaene etal., 1999b). More transparency in the risk assess-ment procedure and increased public participationin the decision making process regarding the furtherdevelopment of GM (food) could restore this trustwhich is considered to be essential for consumer
acceptance of GM (food) (Frewer, 1998b; Frewer etal., 1999).
Through its impact on the perception of risksand benefits, knowledge about GM also determinesconsumer attitudes towards generic GM food prod-ucts. In 2000, Europeans’ awareness and knowledgeof GM was still low, despite the widespread contro-versy and increasing press coverage since the previ-ous survey in 1996 (INRA, 2000). A knowledgedeficit arouses consumer uncertainty and leads even-tually to the overall rejection of GM (Aubrée et al.,1999; Scholderer and Balderjahn, 1999).Consequently, increasing the knowledge of GM bythe provision of information may reduce consumers’reluctance. However, several research studies revealthat consumer knowledge about GM is not neces-sarily positively correlated with consumer accept-ance (International Food Information Council,1999; Nuffield Council on Bioethics, 1999; Viaeneet al., 1999b). In contrast, providing informationtends to intensify prior attitudes rather than changethem (Frewer et al., 1999). Moreover, consumerattitudes on the ‘technology’ and ‘application’ levelare characterized by a great deal of emotion and lit-tle reason, which make these attitudes difficult toalter through pure knowledge-oriented and rationalinformation.
Determinants of behavioural intentionstowards generic GM food products
Behavioural intentions to either buy or avoid gener-ic GM food products are determined by consumers’attitude to behaviour (affect) (Fig. 3.3). Attitude tobehaviour is the attitude a consumer holds towardsperforming a certain behaviour (Ajzen and Fishbein,1980), in this case, buying generic GM food prod-ucts (Bredahl et al., 1998). It is influenced by con-sumer attitudes towards generic GM food products(affect) and by social (subjective norm), personal(self-identity) and external (perceived behaviouralcontrol) factors (beliefs).
The subjective norm deals with consumers’motivation to perform the behaviour of whichimportant others (e.g. loved ones) are believed toapprove (Mowen, 1993). In this research, the behav-iour corresponds with purchasing or avoiding gener-ic GM food products. Self-identity is the way anindividual regards him or herself. Consumers tendto affirm and bolster the self-image through specificbuying intentions, including those towards generic
44 A. Verdurme et al.
GM food products (Sparks and Shepherd, 1992).Ajzen (1985) introduced the term ‘perceived behav-ioural control’ in the ‘Theory of PlannedBehaviour’. Applied to generic GM food products,this term covers the effect of various external factorssuch as time, availability and recognition (labelling),which consumers believe to influence the degree ofpersonal choice to buy or avoid generic GM foodproducts (Sparks et al., 1995; Bredahl et al., 1998).A free food choice (or at least the perception of it) isessential for consumer acceptance of generic GMfood products (Robinson, 1997; Viaene et al.,1999b). In the absence of a free food choice, con-sumers feel coerced into acceptance and, as a result,consumers adopt a reluctant attitude towards theproducts. The actual labelling policy does notincrease consumer perception of being able todecide freely since only food products containingmore than 1% of GM ingredients at the moment ofpurchase must carry a label.
Determinants of consumer attitudes andbehavioural intentions towards premium
branded GM food products
The determinants of consumer attitudes and behav-ioural intentions towards premium branded GMfoods are supposed to differ considerably from thoseof generic GM food products. When discussing thepremium branded food products in the focusgroups, consumers became more tolerant towardsGM at all three levels. Premium brands are believedto stand for high quality and tradition (traditionalvalues). The premium brand is considered as beingfully responsible for the safety and soundness of thefood products, not the consumer or the one prepar-ing the food as in the case of generic products.Therefore, it is suggested that in the case of premi-um branded food products, the consumer percep-tion of premium brands (beliefs) determine behav-ioural intentions towards premium branded GMfood products (Fig. 3.1). Based on positive beliefsabout a premium brand, consumers (intend to) buy(GM) food products of the premium brand first andadapt their attitudes towards GM (affect) afterwardsin order to justify their behaviour(al intentions).Therefore, a strong brand may render the modifiednature of the food product less or even irrelevant forconsumers (brand loyalty).
However, the inverse hypothesis that theunfavourable and negative atmosphere surrounding
GM (food) is too strong to be influenced by a pre-mium brand’s positive image is still to be tested. Inthat case, a negative attitude towards GM will con-tribute to the behaviour(al intention) to avoid allfood products of a premium brand associated withGM.
It must be noted that in the analysis of thefocus group discussions, the differences in consumeracceptance between generic and premium brandedGM food products are linked to the consumer per-ception of premium brands. However, all genericfood products discussed were fresh products, whileall the premium branded ones were processed.Therefore, the differences in consumer acceptancecould also be linked to the fact that fresh food prod-ucts are perceived as a bigger threat to human healththan processed food products because no ‘dilutioneffects’ as a result of the processing occur.
Conclusions and Further Research
Based on literature study, focus group discussionswith consumers and in-depth interviews with repre-sentatives of various parties involved with the issueof public acceptance of GM, determinants of con-sumer attitudes and behavioural intentions towardsGM food were investigated. The results show a cleardifference between generic and premium brandedGM food products.
In general, three levels of consumer attitudestowards GM can be distinguished: the ‘technology’level, the ‘application’ level and the ‘product’ level.Attitudes towards the technology are negative andhighly emotional. Its application in food productionreceives little consumer support, especially whereanimals are involved.
With regard to generic GM food products, con-sumer attitudes (affect) are determined by the per-ception of risks and benefits (beliefs), which in turnis based on general attitudes and knowledge. Riskscomprise potential hazards for human health (own,others) and for the environment on the one handand ethical concerns related to animal welfare,nature and the developing world on the other hand.Benefits consist of consumer (personal, environ-mental or societal) and producer benefits. Personalconsumer benefits are valued the highest and pro-ducer benefits the lowest. General attitudes such astrust in public authorities and industries appear toplay a major role in consumer attitudes. Consumers’knowledge about GM is low. The precise relation
Generic vs. Premium Branded GM Food Products 45

between knowledge and attitude remains unclear.However, results suggest that providing pure knowl-edge-oriented rational information about GM willnot alter prior negative attitudes towards it.Behavioural intentions towards generic GM foodproducts are determined by the attitude to behav-iour (buying or avoiding GM food products)(affect) which in turn is influenced by consumerattitudes towards generic GM food products (affect)and by social (subjective norm), personal (self-iden-tity) and external (perceived behavioural control)factors (beliefs).
With regard to premium branded GM foodproducts, behavioural intentions are determined bythe consumer perception of premium brands(beliefs). Consumers (intend to) buy (GM) foodproducts of a specific premium brand first and adapttheir attitudes towards GM (affect) afterwards inorder to justify their behaviour(al intentions). As aresult, a premium brand may render the modifiednature of the food less or even irrelevant for con-sumers (brand loyalty).
Based on the findings in literature and on theresults of the focus group discussions, the followinghypotheses can be developed:
• Consumer attitudes towards GM technology aremuch more negative than towards concrete GMfood products;
• Among GM food products, premium brandedproducts are more readily accepted than genericones.
In order to verify these hypotheses, a quantitativemarket research study was organized in July 2000.In the research, 1000 consumers have been inter-viewed on the basis of a structured questionnaireand according to an experimental design (Table3.4). The experiment consists of discussing the tech-nology before or after concrete GM food products.Moreover, a distinction is made between generic andpremium branded GM food products.
References
Ajzen, I. (1985) From intentions to actions: theory of
planned behaviour. In: Kuhl, J. and Beckmann, J.
(eds) Action Control – From Cognition to Behaviour.Berlin: Springer-Verlag, pp. 11–39.
Ajzen, I. and Fishbein, M. (1980) Understanding Attitudesand Predicting Social Behaviour. Prentice-Hall,
Englewood Cliffs, New Jersey.
Aubrée, H., Diard, S., Garcia, S., Jaegle, S., Lunel, C.,
Mauvielle, V., Messager, O. and Rade, V. (1999)
Organismes génétiquement modifiés et filière agro-ali-mentaire. Etude de filière, 4ème année, 6ème promo-
tion, INSFA, Remmes, France.
Bredahl, L. (2000) Determinants of Consumer Attitudes andPurchase Intentions with Regard to GeneticallyModified Foods – Results of a Cross-national Survey,working paper No. 69. MAPP, Aarhus, Denmark.
Bredahl, L. and Grunert, G. (1998) Consumers’ Cognitionswith regard to Genetically Modified Foods – Results ofQualitative Study in Four Countries, working paper
No. 59. MAPP, Aarhus, Denmark.
Bredahl, L., Grunert, G. and Frewer, L.J. (1998)
Consumers Attitudes and Decision-making with regardto Genetically Engineered Food Products – a Review ofthe Literature and a Presentation of Models for FutureResearch, working paper No. 52. MAPP, Aarhus,
Denmark.
Cantley, M. and Miyamura, Y. (1999) Alimentation, tech-
nologie, réglementation et confiance des consomma-
teurs. l’Observateur de l’OCDE, 216, 21–25.
De Bruicker, F.S. (1979) An appraisal of low-involvement
consumer information processing. In: Maloney, J.
and Silverman, B. (eds) Attitude Research Plays forHigh Stakes. American Marketing Association, pp.
112–130.
EFB Task Group on Public Perceptions of Biotechnology
(1998) Biotechnology in the Public Sphere. A EuropeanSourcebook. Science Museum, London.
EFB Task Group on Public Perceptions of Biotechnology
(1999) Ethical aspects of agricultural biotechnology.
Working Document for the European Conference,
16–19 May 1999, Oviedo, Spain.
Einseidel, E. (2000) Biotechnology and the Canadian
public: 1997 and 2000. Graduate Program in
Communications, University of Calgary, Calgary,
Canada.
46 A. Verdurme et al.
Table 3.4. Experimental design of the survey.
The technology first, GM food products first,Order GM food products next the technology next Total
First premium branded food products 250 250 500First generic food products 250 250 500
Total 500 500 1000
European Commission (1994) Growth, Competitiveness,Employment: the Challenges and Ways Forward into the21st Century. White Paper, Office of Official
Publications of the European Communities,
Luxembourg.
European Commission, DG XII (1998a) Looking at theBiotechnology Consumer. Office of Official
Publications of the European Communities,
Luxembourg.
European Commission, DG XII (1998b) Strategies forCommunication on Food Biotechnology. Office of
Official Publications of the European Communities,
Luxembourg.
Frewer, L.J. (1998a) Consumer opinion on transgenic ani-
mals. AgBiotech News and Information 10, 213–216.
Frewer, L.J. (1998b) Perception of risks and benefits and
consumer decision making regarding genetically
modified food. In: Proceedings of AIR-CAT 5thPlenary Meeting: Effective Communication and GMO-foods. Vienna, Austria, 11–14 June 1998, pp. 15–17.
Frewer, L.J., Hedderley, C., Howard, C. and Shepherd, R.
(1997) ‘Objection’ mapping in determining group
and individual concerns regarding genetic engineer-
ing: risk, benefit and ethics. Agriculture and HumanValues 14, 67–79.
Frewer, L.J., Howard, C., Hedderley, D. and Shepherd, R.
(1999) Reactions to information about genetic engi-
neering: impact of source characteristics, perceived
personal relevance and persuasiveness. PublicUnderstanding of Science 8, 35–50.
INRA (Europe) (2000) Eurobarometer 52.1 – theEuropeans and Modern Biotechnology. European Co-
ordination Office, Brussels.
International Food Information Council (1999) U.S. con-
sumer attitudes towards food biotechnology. Reports
from the Wirthlin Group Quorum Surveys in March
1997, February 1999 and October 1999.
Isenterant, D. (1999) Genetische modificatie in voeding:
wat en waarom? In: Proceedings of the Symposium‘Genetische Modificatie en de Agro-voedingssector’Flanders Expo, Ghent, Belgium, 19–23 April 1999,
pp. 6–14.
Krugman, H. (1961) The impact of television advertising:
learning without involvement. Public OpinionQuarterly 29, 59–62.
Lavidge, R. and Steiner, G. (1961) A model for predictive
measurements of advertising effectiveness. Journal ofMarketing 25, 59–62.
Mowen, J.C. (1993) Consumer Behaviour. MacMillan
Publishing, New York.
Nuffield Council on Bioethics (1999) Genetically ModifiedCrops: the Ethical and Social Issues, fifth report pub-
lished in May 1999.
Olshavsky, R.W. and Granbois, D.H. (1979) Consumer
decision making – fact or fiction? Journal ofConsumer Research 6, 93–100.
Ray, M. (1973) Marketing communications and the hier-
archy-of-effects. In: Clarke, P. (ed.) New Models forMass Communications. Sage Publications, Beverly
Hills, California, pp. 147–176.
Robinson, C. (1997) Genetically modified foods and con-
sumer choice. Trends in Food Science & Technology 8,
84–88.
Scholderer, J. and Balderjahn, I. (1999) Consumer infor-
mation strategies for genetically modified food prod-
ucts. Proceedings of 28th EMAC Conference Marketingand Competition in the Information Age. European
Marketing Academy, Brussels.
Shimbun, Y. (2000) Poll: More than 60% reluctant to eat
GM foods. The Daily Yomiuri, 12 August 2000.
Sparks, P. and Shepherd, R. (1992) Self-identity and the
theory of planned behaviour. Social PsychologyQuarterly 22, 388–399.
Sparks, P., Shepherd, R. and Frewer, L.J. (1995) Assessing
and structuring attitudes towards the use of gene
technology in food production: the role of perceived
ethical obligation. Basic and Applied Social Psychology16, 267–285.
Viaene, J., Gellynck, X., Verbeke, W. and Verdurme, A.
(1999a) Consumer attitudes towards genetic engi-
neered food and development of a segmented com-
munication policy. In: Scientific Report VIB 1999, pp.
197–200.
Viaene, J., Gellynck, X., Verbeke, W. and Verdurme, A.
(1999b) Determinants of consumer attitudes
towards GM food: similarities and differences
between empirical findings in Flanders and abroad.
In: Verhandelingen van de FLTBW, naar Aanleidingvan de 48ste Post-Universitaire Onderwijsdag, no. 39.
Faculty of Agricultural and Applied Biological
Sciences, Ghent University, Ghent, Belgium, 1
December 1999, pp. 57–72.
Generic vs. Premium Branded GM Food Products 47

Introduction
In recent years, several genetically modified (GM)crop varieties have been introduced. In less than 5years, almost half of the US acreage of cotton, soy-beans and maize has been planted with GM vari-eties. In many other countries, the adoption of GMproducts also started well (Franks, 1999: 566). Inthe seeding season 2000, however, the adoptionseems to have been interrupted, and even in the UShesitation has been observed.
This stagnation has its origin in the extensiverejection of GM food by consumers in Europeancountries and in Japan. The EU responded to themassive protests of lobbying groups by introducinga compulsory labelling system for all GM food. Theintroduction of the labelling obligation caused analmost complete stop of imports of GM food toEurope and became a serious import barrier. Thereare two reasons for this:
• Many of the exporting countries do not possessrespective labelling systems, at least not obligato-ry ones, so that no separate trading channels forGM products are developed. In consequence,the exporting firms cannot give a warranty thatno GM food is mixed in and therefore the firmsare forced to label more or less all products as‘GM’ food.
• The vast majority of European consumers arenot willing to accept GM food even if the mod-ified products are somewhat cheaper.
US merchants and producers have not taken veryseriously these reservations of European and espe-cially Northern European consumers. They ratherrelied on their persuasive power and on the fact thatEuropean consumers have always eventually fol-lowed the development in North America with amore or less distinct time lag (Connor, 1994).However, the confidence in an only brief delay ofadoption seems to have vanished in the past months.Recent investigations of consumers’ behaviour cameto the conclusion that the resistance against GMfood has even increased whereas an increasingacceptance of the ‘white gene technology’ in themedical domain has been observed. In this context,two questions arise:
1. Is the rejection of GM food by the Europeanconsumer a serious peril for agricultural geneticengineering, or is it only a fashion that will vanishafter a short time? 2. What can be done to increase the likelihood ofGM food being broadly accepted as fast as possible?
In the following, we will address the above-mentioned questions. At first, we describe a simplemodel of consumer behaviour that can be employed
49
4 Is European Consumers’ Refusal of GMFood a Serious Obstacle or a Transient
Fashion?
Claus-Hennig Hanf1 and Andreas Böcker21Department of Agricultural Economics, Christian-Albrechts-University, Kiel,
Germany; 2Department of Agricultural Economics and Market Research, Justus-Liebig-University, Giessen, Germany
© CAB International 2002. Market Development for Genetically Modified Foods(eds V. Santaniello, R.E. Evenson and D. Zilberman)
to capture the relevant elements of food purchasedecisions. This model and some empirical evidenceis then used to approach the question of persistenceand duration of the non-acceptance period. Finally,the conditions and possibilities of breaching thebuying ‘boycott’ are discussed.
Consumer Behaviour
Occasionally, the European consumer is character-ized as extremely anxious, emotional or even irra-tional. Although the widely held opinion that theconsumer trusts only advocacy groups likeGreenpeace, and deeply mistrusts governments andscientists, is exaggerated to some degree, this pictureis not completely wrong. For example, Frewer et al.(1996: 479 ff.) point out that both government and business representatives are only moderatelytrusted, if their statements are perceived to be madein obvious self-interest. Here, we treat consumers’behaviour in the case of GM food as rational deci-sion making where rationality is defined consideringthat information is costly and information process-ing is effort and time consuming. Hence, it isassumed that consumers act rationally in the senseof bounded rationality.
Despite the intense and ongoing public debateon genetic engineering in food and agriculture, mostconsumers probably still feel inadequately informedabout this topic. For example, Weiss (1997: 427)reports that 84% of 700 adults who participated ina consumer survey in Vienna felt that way. The samestudy revealed that consumers learn about GM foodmainly from television (73%) and newspapers andmagazines (41%), while more sophisticated sourcessuch as books (5%) or lectures (4%) play only aminor role. Television and newspaper reports, how-ever, tend to have been rather extreme, that is, main-ly negative, and biased in that very seldom are bothrisks and benefits reported. Owing to this bias, thecomplexity of the topic and the general lack of ade-quate information at the individual level, it is likelythat consumers tend to perceive the additional riskto be rather high. This belief is closely connectedwith the experience that new and ‘revolutionary’technologies (e.g. the pesticide DDT) often causedunexpected negative outcomes, although the major-ity of scientists and politicians had stated this wouldnot be. The prevailing assumption of Europeanconsumers that GM food is connected with thepossibility of hazard is a logical consequence of the
widely distributed technological pessimism. Basedon a cross-national survey carried out in Denmark,Germany, the UK and Italy, Bredahl (2000) foundthat ‘(a)cross countries, attitudes towards geneticmodification in food production were deeplyembedded in more general attitudes held by con-sumers, in particular attitude towards nature andattitude towards technology’.
The negative attitude towards GM food meansno absolute rejection, but a serious hindrance foradoption. A very simple model of adoption can bedescribed as follows. First, assume that GM tech-nology is targeted at cost reduction only so thatthere is no difference in direct consumer benefitsbetween traditional and GM food, except that GMfood will be less expensive. Consumers will thenchoose the GM variant, if the following holds:
PRtrad – PRGM > P (GM ) ¥ DGM (4.1)
That is, for GM food to be bought, the price differ-ence between traditional (PRtrad) and GM foods(PRGM) must exceed the perceived risk of GM foodconsumption. In this sense, the price difference mayserve as a premium for taking a risk (Dnes, 1996),which is assumed to be individually calculated bymultiplying the expected damage of that consump-tion activity (DGM) with the individually perceivedhazard probability P(GM ).
Now assume that the consumer expects a dif-ferent utility or benefit from GM food (UGM) thanfrom the traditional variant (Utrad). Since overallutility maximization is equivalent to maximizingutility per money unit spent, the decision criterionfor buying GM food can be generalized to:
(4.2)
From Equation 4.2 three possibilities for overcom-ing European consumers’ scepticism can be inferred:
• Reduce the subjectively perceived high damageexpectation, through reducing P(GM ), DGM orboth.
• Lower prices PRGM, which means to transfer costreductions from primary producers to con-sumers.
• Increase perceived benefits of GM foods byemphasizing improvements in existing or devel-opment of new product attributes.
We will argue in the following that it is rather diffi-cult to bring GM food into a competitive positionin Europe by product development even if GM food
50 C.-H. Hanf and A. Böcker
UPR
UPR
P GMDPR
GM
GM
trad
trad
GM
GM
- > ¥( )

possesses advantages over non-GM food. The mainreason is the obligatory labelling.
Expected damage from GM food
The perceived probability of occurrence of a dangerfrom GM food is probably very small but muchoverestimated. There are several reasons for thisassumption. The literature frequently refers to thefact that consumers’ perception of food risks devi-ates considerably from the judgement of experts(Wiegand and von Braun, 1994). Furthermore,Lichtenstein et al. (1978) show that there exists ageneral tendency to overestimate small risks, whilehigh risks are often underestimated. Wiegand andvon Braun (1994) adduce further reasons for anoverestimation of small probabilities; for example, ifthe risk is taken involuntarily, or if the effects of therisk factor are widely unknown (Lowrance, 1976:87). Both these aspects are typical for GM food.Consequently, one should expect the perceivedsubjective probability, although still very small, to bemany times larger than the average expert judge-ment.
Furthermore, a number of psychometric stud-ies have shown that food safety related risk percep-tion is dominated by the perceived severity of ahazard, thus generally reducing the impact of prob-ability information. For example, Slovic et al.(1980), Sparks and Shepherd (1994) and Fife-Shawand Rowe (1996) found that the most importantcomponent of the perception process was related tothe severity of a hazard. The second most importantcomponent or factor related to familiarity andawareness of a hazard. Characteristics related to theprobability or number of people being exposed,however, were loaded on the factor that was onlythird most important.
The strong role of hazard severity in individualrisk perception is strengthened further by the factthat food shopping is usually done by one person forthe entire household. A potential hazard is thus notrestricted to the buyer him or herself, but is insteadmultiplied. Herrmann et al. (1997: 518), for exam-ple, found that the presence of young children in thehousehold led to reduced apple consumption duringthe Alar1 crisis in the late 1980s. Closely related isthe finding of Fife-Shaw and Rowe (1996), that the
perception of hazard severity also includes concernfor others, especially vulnerable groups, but alsofuture generations. This element of hazard severitymust be taken very seriously in the case of GM food,as consumers have learned by the mass media thatthe environmental consequences of a ‘bad case’ – ifit happens – may be catastrophic and long lasting,and may therefore be very expensive to resolve.Although industry has reacted to such environmen-tal issues by increasing the precision of DNA alter-ation and developing measures to reduce the risk ofcross pollination (Franks, 1999: 575), these effortsand the corresponding progress are difficult to com-municate to laypersons.
Altogether, owing to the overestimation bias ofboth hazard severity and probability, the perceivedrisk of GM crops is probably much too large at pres-ent to be easily overcome by marketing measureswithin a few years. But within the EU, considerabledifferences between single countries can beobserved. For example, an international consumersurvey by Bredahl (2000) showed that in Denmarkand Germany about one-third of the sample had astrong intention to avoid purchasing GM food. TheBritish consumers were slightly more willing to pur-chase GM products (yogurt and beer) and theItalian generally least hesitant. We can only specu-late about the reasons for these national differencesin the attitude towards GM food. In several studiesit has been reported that Italians are less pessimisticabout the consequences of technical developmenton the environment. This general attitude may haveaffected the assessment of expected damage and/orperceived probability in such a way that a less pro-nounced rejection resulted.
Competition by prices
A study about the willingness to pay for GM andtraditional food conducted at the University of Kiel(Gath, 1998) came to the result that the price dif-ference between these two types of food must beconsiderable, before a recognizable market share canbe expected for GM food. About one quarter ofconsumers expressed that they would not buy GMfood, even if it cost less than half the price of ordi-nary food. As only very few test persons asserted thatthey would buy GM food without any hesitation,
European Consumers’ Refusal of GM Food 51
1 Alar is a pesticide brand that was widely applied in apple production, until it was shown to cause severe healthproblems.

the majority proved to be price elastic. This majori-ty of consumers, however, would only buy the GMvariant if it was about 25–50% cheaper. The results,which are based on contingent valuation, werealmost the same for cheese, yogurt, vegetables andfruit juice, and are broadly in accordance with thefindings of the international study reported byBredahl et al. (1998) and Bredahl (2000). ForGermany and Denmark, this study revealed thatevery third (fourth) person declared that he or shewould try under all conditions to avoid buying GMyogurt (beer). For both products and both coun-tries, the share of participants indicating an extremepurchase intention was also very low, between 1 and3%. Thus, again, the majority of consumers can beexpected to react to some price and quality change,so in the next step, the necessary magnitude of thatchange will now be discussed.
Luehrs (1987) carried out an investigation ofthe local price distribution and price variation in amedium sized city (300,000 inhabitants) inGermany. She investigated about 25 branded foodproducts and 12 generic products in 11 retail chainsover a period of 30 weeks. Luehrs reports an averageweekly price difference of about 40% for brandedproducts and of about 60% for generic products.Out of the total of 37 prices the share of those thathad changed from one observation to the othervaried between 2.2 and 7.0%. While this seems tosuggest rather stable prices over time, a moredetailed analysis showed considerable differenceswith respect to retail chains. For 5 of the 11 retailchains, the size of the price changes were above20%, and four of these belonged to those retailchains which changed prices relatively often. Theseinvestigation results can be interpreted in the sensethat consumers are used to price differences andprice variations in the range of 20 or 25%. Fromthis, we infer that a price change, in this case areduction, must exceed this range in order to inducethe price elastic majority of consumers to buy GMfood.
A price reduction of at least 25%, however, isunrealistic, if the price reduction is exclusively basedon a respective cost reduction in agriculture. Inprocessed food, the cost share of the agricultural rawmaterial is seldom larger than 25%. But also in thetrade of fresh fruits and vegetables, it seems to berather unrealistic to assume that the cost savings inagriculture alone allow a sufficient purchase incen-tive to be offered to consumers in order to succeedwith labelled GM food.
This cost reduction becomes even more unlike-ly, if – in addition to costly segregating and labellingrequirements – GM crops are burdened by furtherconstraints, which national monitoring organiza-tions have the authority to require for commerciallicences. Franks (1999: 575 ff.) discusses this for theUK, where the corresponding body, the AdvisoryCommittee on Releases to the Environment, maydo so in regions where valuable genetic resourcesmay be put at risk from commercial release. Suchadditional constraints might range from agronomicpractices, such as planting barrier crops or main-taining reproductive isolation distances betweencrops and valuable wild gene pools, to the prohibi-tion of planting GM crops. The consequence is inany case a cost increase relative to conventional ortraditional production techniques.
Creation of superior quality
An alternative starting point to overcome con-sumers’ hesitation over GM food is to be seen in theenlargement of the utility difference between GMand non-GM food. This presupposes a considerableimprovement of the food quality. An often expressedhope of the advocates of GM food is that the secondgeneration of GM food will be likely to concentrateon the improvement of food properties that are pos-itively valued by consumers, or create food withadditional desirable characteristics. One example ofquality improvement is enrichment of grain withvitamins and mineral substances (Erbersdobler,1999); an example of a completely new propertyis the elimination of allergenic proteins in ricevarieties.
Many of those new products are likely to havea nutritional and purchase value that considerablyexceeds the value and price of the conventional pro-duce by far more than 25%. However, an incrementof the nutritional value and of the attributed utilityby 50 or more per cent does not guarantee anincrease of demand for the respective GM food, atleast not in the case of processed food. Almost all ofthe food quality improvements can be realized eitherby improving the basic agricultural raw material orby technological progress in food processing. If afood improvement becomes known for which a suf-ficiently large buyer segment exists which is willingto pay, the respective food will be constructed bysupplementing, mixing, extraction, exchanging andother processing activities (Böcker et al., 1997).
52 C.-H. Hanf and A. Böcker

Breeding a new raw material is only one possi-bility for producing a functional food; food process-ing often offers many. It is different with agricultur-al products that are dedicated to fresh consumptionor are at least consumed without any serious pro-cessing (only cooked or fried). Here, food processingis not such a close substitute for breeding. However,this does not necessarily provide GM products witha very large competitive advantage over convention-al fresh food in developed countries with highincome levels. Consumers can and do afford to feedthemselves on a plethora of food products. If theyneed or believe they need a functional food they canchoose how they provide themselves with the respec-tive function. The individual utility increase whichresults from a single specific food item is therebystrongly limited.
Summary and Concluding Remarks
The above considerations make it clear that it is notvery likely that even a new generation of improvedGM food will raise the individual consumer utilitysufficiently in order to gain a substantial competitiveadvantage over conventional food stuffs. The level ofconsumer acceptance is not only low at present.These strong attitudes towards, that is, mainlyagainst, GM foods are firmly nested in higher-orderattitudes or beliefs (Bredahl, 2000), so that lowacceptance can be expected to prevail in the future.
The only way this obstacle could be effectivelyovercome is by actual and, of course, positive prod-uct experience. For this to happen, however, a sub-stantial increase in consumer benefit, that is value orutility per money unit, would have to be deliveredby new products. In mass markets, where the onlybenefit has to be seen in potentially reduced priceswith no additional value created by genetic engi-neering, we have argued that this is highly unlikely.And even in cases where additional value is created,substitute food processing technologies exist thatcan – at least partially – mimic the benefits, thusreducing the expected competitive advantage ofGM. We therefore argue, that GM food will remainrestricted to high priced niche markets in the nearfuture. From there, supported by the spreading newsof positive product experience, it might increasinglyenter into the mass markets and thus gain in marketshare.
References
Böcker, A., Hanf, C.-H. and Turss, O. (1997)
Interdependenzen der Produktdifferenzierung inner-halb der Nahrungsmittelkette. Diskussionsbeiträge No.
6, 192 S. Institut für Agrarökonomie, Christian-
Albrechts-Universität zu Kiel.
Bredahl, L. (2000) Determinants of Attitudes and PurchaseIntentions with Regard to Genetically Modified Foods –Results of a Cross-National Survey, MAPP Working
Paper No. 69. MAPP, Arhus, Denmark.
Bredahl, L., Grunert, K. and Frewer, L. (1998)
Determinants of Attitudes and Purchase Intentionswith Regard to Genetically Modified Foods – A Reviewof the Literature and Presentation of Models for FutureResearch, MAPP Working Paper No. 52. MAPP,
Arhus, Denmark.
Connor, J.M. (1994) North America as a precursor of
changes in Western-European food-purchasing pat-
terns. European Review of Agricultural Economics 21,
155–173.
Dnes, A.W. (1996) An economic analysis of the BSE scare.
Scottish Journal of Political Economy 43, 343–348.
Erbersdobler, H. (1999) Gesunde Ernährung mit Novel
Food (healthy nutrition and novel food). Schrift-enreihe der Agrar- und ErnährungswissenschaftlichenFakultät der Universität Kiel, Vorträge zur Hoch-schultagung 88, 209–218.
Fife-Shaw, C. and Rowe, G. (1996) Public perceptions of
everyday food hazards: a psychometric study. RiskAnalysis 16, 487–500.
Franks, J.R. (1999) The status and prospects for genetical-
ly modified crops in Europe. Food Policy 24,
565–584.
Frewer, L.J., Howard, C., Hedderley, D. and Shepherd, R.
(1996) What determines trust in information about
food-related risks? Underlying psychological con-
structs. Risk Analysis 16, 473–486.
Gath, M. (1998) Der einfluß der kennzeichnung auf die
verbraucherakzeptanz gentechnisch veränderter
lebensmittel (Impact of labeling on consumer
acceptance of genetically modified food). Master
thesis, Kiel University, Germany.
Herrmann, R., Warland, R.H. and Sterngold, A. (1997)
Who reacts to food safety scares?: examining the alar
crisis. Agribusiness 13, 511–520.
Lichtenstein, S., Slovic, P., Fischhoff, B., Layman, M. and
Combs, B. (1978) Judged frequency of lethal events.
Journal of Experimental Psychology, Human Learningand Memory 4, 551–578.
Lowrance, W.W. (1976) Of Acceptable Risk: Science andDetermination of Safety. W. Kaufman Inc., Los Altos,
California.
Luehrs, F. (1987) Lokale Preisschwankungen bei
Verbrauchsgütern. Diplomarbeit. Universitaet Kiel,
Institut for Agaroekonomie, Kiel.
European Consumers’ Refusal of GM Food 53

Slovic, P., Fischhoff, B. and Lichtenstein, S. (1980) Facts
and fears: understanding perceived risk. In: Schwing,
R.C. and Albers, W.S. (eds) Societal Risk Assessment:How Safe is Safe Enough? Plenum, New York, pp.
181–214.
Sparks, P. and Shepherd, R. (1994) Public perceptions of
the potential hazards associated with food produc-
tion and food consumption: An empirical study. RiskAnalysis 14, 799–806.
Weiss, E.W. (1997) Sicherheitsbeurteilung neuartiger
Lebensmittel (safety evaluation of novel foods).
Ernährung/Nutrition 21, 426–429.
Wiegand, G. and von Braun, J. (1994) Zur ökonomik von
schadstoffen in lebensmitteln. Agrarwirtschaft 43,
257–307.
54 C.-H. Hanf and A. Böcker
Introduction
The genetically modified (GM) food debate has beenintensifying with time. Proponents of the new tech-nologies speak of making healthy foods even morenutritious, reducing the need for toxic chemicals,and increasing the yield of plants, all helping to feedthe Earth’s expanding population. In March 2000,the Food and Agriculture Organization (FAO) issuedits first public statement on genetically modifiedorganisms (GMOs), with the message that geneticengineering could help to increase output in agricul-ture, forestry and fisheries. Genetically engineeringfood may dramatically change the way farming isdone. For example, Frommer et al. (1999) havefound that varieties of a single plant species, such asbarley or tomato, exhibit a high degree of variationin salt tolerance, suggesting that only a few muta-tions in several key transporter or regulatory proteinscould confer salt tolerance on salt-sensitive plants.These plants could change agriculture patterns byallowing agriculture production where previously itwas not possible. The potential for GM crops tochange the way the world is fed may be large.
But fears of GM foods have also been growing.The FAO also issued words of warning in its state-ment: ‘caution must be exercised in order to reducethe risk of transferring toxins from one life form toanother, of creating new toxins or of transferringallergenic compounds from one species to another,which could result in unexpected allergic reactions’.
Since the public’s perception of GM foods iscurrently unknown, there is also a lack of knowledgeregarding the current demand for non-GM cropsrelative to GM crops. Currently, the premium fornon-GM soybeans is around 3–10% (in the USA;estimates as large as 50% have been reported inJapan). This indicates that food processors aredemanding non-GM crops and are willing to pay apremium in order to obtain them. Estimating theactual demand is necessary for preventing the possi-bility of market disruption.
It is possible that the demand for non-GMfoods is sizeable. For example, Marks & Spencerissued a statement in July 1999 stating that it wouldno longer sell GM foods, and would change suppli-ers and processors to make this a reality. In August1999, Gerber and H.J. Heinz baby-food makersrejected the use of modified food ingredients. WholeFoods Market, the largest natural foods chain in theUS, currently requires suppliers of its house brandsto certify that their products are GM-free.
Demand for non-GM maize could possiblyreach 28% of the entire market:
1. Currently, maize processors use 3.2% of themaize market. Supposing that the entire industrywere to demand non-GM maize, around 3% of themaize market would be non-GM.2. If the sweetener industry were also to demandnon-GM maize, 6% of the market could potential-ly be non-GM.
55
5 Estimates of Willingness to Pay a Premiumfor Non-GM Foods: a Survey
Catherine A. Mendenhall1 and Robert E. Evenson21Environmental Health Sciences, Department of Epidemiology and Public Health, and
2Economic Growth Center, Department of Economics, Yale University, New Haven,Connecticut, USA
© CAB International 2002. Market Development for Genetically Modified Foods(eds V. Santaniello, R.E. Evenson and D. Zilberman)

3. Exported maize may have to be certified non-GM. Up to 19% of the market could move to non-GM maize in response (Kansas Corn GrowersAssociation, 2000).
As of 3 March 2000, GM foods were declaredunable to be considered ‘organic’ under federalguidelines. The USDA revised its national standardrequirements for organic food in response to a floodof negative publicity. The industry had repeatedlyrequested national standards, understanding thatwithout guidelines, there is nothing to back up theclaim that a product is organic. Consumers werequestioning what the organic label really meant, andwhether it was worth paying more for food desig-nated as organic.
Determining what factors influence con-sumers’ risk perceptions towards GM foods, andworking up a profile for the individual who is likelyto pay a premium for certified non-GM foods willaid in estimating the overall demand for non-GMcrops. Grobe et al.’s (1999) study of consumer riskperception profiles regarding recombinant bovinegrowth hormone (rbGH) contends that self-protec-tive behaviour, defined as (i) seeking assurance thatmilk purchased came from a non-treated herd; or(ii) changing milk consumption levels, is signifi-cantly affected by household size and identificationwith environmental groups. Grobe also declares thatidentifying and understanding these profiles wouldenable risk communicators to design more effectiverisk communication strategies.
The goal of this chapter is to determine whatfactors influence consumers’ risk perceptionstowards GM foods, to determine the profile for theindividual who is likely to pay a premium for certi-fied non-GM foods, and to estimate the demand fornon-GM crops.
Methods
Public acceptance of GM foods can be measuredeither by analysing the strategy, attitude and politi-cal weight applied by the stakeholders in the GMcontroversy in their attempt to sway public opinion,or by conducting a representative survey among thegeneral public. Since the number of stakeholders inthe GM controversy is too great (governmentalinstitutions, business, non-governmental organiza-tions (NGOs) and churches, and international
NGOs, among others) the second strategy was cho-sen for the present study.
In order to examine the public’s acceptancelevel of GM food, a standardized questionnaire wascreated. The first questions concentrated on theindividual’s concern about GM foods for theirhealth, the environment and their children. Thenext section addressed the individual’s willingness todistinguish between GM and non-GM foods, andtheir willingness to pay a premium for non-GMfoods. The third section focused on statements withregard to the individual’s profile, with general ques-tions regarding age, income and current food pur-chasing habits, in addition to benchmarking theindividual’s concern about his or her health incomparison to his or her peers. Respondents wereasked specifically whether they had heard or readanything about the GM controversy. Sixty per centof the 54 individuals surveyed had heard or readsomething about GM technology. This awarenesslevel was higher than expected, but may have beendue to the media-saturated city in which the surveywas conducted.
Respondents who were not aware of GM tech-nology were provided with a neutral description,given that the framing of the information couldinfluence the respondent’s answers to the question-naire.
The respondent could indicate to what extenthe or she agreed with a certain statement by apply-ing a scale of marks from strongly agree to stronglydisagree. A telemarketed survey of random NewHaven, Connecticut, residences was conducted.Every fifth number in the New Haven phone bookwas dialled. Interviews were conducted with the per-son identified as a household resident ‘who is 18-years-old or older, and responsible for the house-hold’s food purchasing decisions’.
Results
Data consisted of 54 completed surveys, gatheredfrom individuals in the city of New Haven. Initialcontact was made with 131 individuals and theresponse rate for the entire frame sample was 41%.Of these surveys, the average respondent was 32-years-old, and had a median income of approxi-mately US$38,000. The average household size was2.1. Race and sex were not asked.
56 C.A. Mendenhall and R.E. Evenson

Variables
Individuals were questioned on safety (how theyinterpreted the safety of consuming GM foods), pre-mium (their willingness to pay a premium for certi-fied non-GM foods), label (their opinion onwhether GM foods should be labelled), environment(whether they were concerned about GM foods’impact on the environment) and prefer (preferringnon-GM foods in general if given a choice).
Variables reflecting personal health influencesrelevant to food purchases were concern (concernabout health in relation to peers), food (already buy-ing fat-free or low cholesterol foods) and organic(already purchasing at least some organic foods).Variables reflecting social and cultural influenceswere education, smoking and exercise (exercisingregularly).
Variables that were more inherited and lessrelated to individual attitudes were household size,children (presence of children in the household) andage. A person’s perceived sense of control was thought
to be correlated with their income status, so income(annual household income) was used as a proxy.
Statistics
The objective of the descriptive data analysis was toinvestigate which segments of the general public areconcerned about the safety of GM foods, and ifthose concerned would be willing to pay a premiumfor non-GM foods. Statistical tests were performedin SAS. Table 5.1 reports the results of 2-way crosstabulations of the endogenous variables using thechi-square test statistic. Table 5.2 reports compara-ble tests between endogenous variables.
Perceived safety of GM foods
Overall, 26% of those surveyed indicated that theywere very concerned about the safety of GM food.Over 50% said that they were somewhat concerned,
Estimates of WTP Premium for Non-GM Foods 57
Table 5.1. Chi-square analysis (P values).
Willingness ConcernedConcern about Prefer non- to pay a Feel that GM about environ-safety of GM foods in premium for foods should mental impactGM foods general non-GM foods be labelled of GMOs
Concern about health 0.058** 0.031* 0.031* 0.356 0.026*Exercise 0.058** 0.228 0.905 0.182 0.427Smoking 0.232 0.720 0.646 0.290 0.996Age 0.087** 0.636 0.348 0.921 0.270Currently buying fat-free foods 0.197 0.410 0.646 0.324 0.065**Currently buying organic foods 0.025* 0.519 0.041* 0.712 0.050*Education 0.164 0.244 0.636 0.469 0.464Number of people in household 0.795 0.602 0.038* 0.781 0.014*Having children 0.922 0.806 0.216 0.600 0.532Income 0.459 0.252 0.953 0.605 0.657
* Significant; **marginally significant.
Table 5.2. Chi-square analysis, dependent variables (P values).
Willingness Concernedto pay a Feel that GM about Prefer non-premium for foods should environmental GM foods non-GM foods be labelled impact of GMOs in general
Concern about safety of GM foods 0.022* 0.258 0.0001* 0.0001*Willingness to pay a premium for non-GM foods — 0.571 0.131 0.096Feel that GM foods should be labelled — — 0.205 0.003*Concerned about environmental impact of GMOs — — — 0.0001*
* Significant; ** marginally significant.

and the remaining 24% were divided with 5% beingsomewhat unconcerned about GM safety and 19%not at all concerned.
The marginal effect of age (P = 0.087) indi-cates that those who were younger are less inclinedto be concerned about the safety of GM foods, andperceived less of a health risk than those who wereolder. Individuals who are willing to pay a premiumfor non-GM foods are also significantly more likelyto be concerned about the safety of GM foods (P =0.022), with concern increasing with increasingwillingness to pay. Safety is also a function of con-cern about health (concern, P = 0.058). Those indi-viduals that are more concerned about their heath ingeneral are more concerned about the safety of GMfoods.
Using chi-square analyses, it was determinedthat those who currently buy fat-free foods are notmore likely to have concerns over GM foods (P =0.197, marginal significance with t-test, P = 0.076),and those who buy organic are more likely to reportthat they are concerned (P = 0.025). Individualswho exercise have a moderately elevated level of con-cern (marginal significance, P = 0.058). Concernover the safety of GM foods was not related tosmoking (P = 0.232), level of education (P = 0.164),number of people in the household (P = 0.795),having children (P = 0.922) or income (P = 0.459).
Preferring non-GM foods
Fifty per cent of those surveyed indicated that theywould be very likely or somewhat likely to purchasenon-GM foods if they cost up to 20% more thanGM foods. Surprisingly, individuals with two mem-bers in the household are most likely to pay more fornon-GM foods (P = 0.038). Individuals who cur-rently buy organic foods are also those who are moreinclined to buy certified non-GM foods at a premi-um (P = 0.041). Similarly, those currently inclinedto be concerned about their health are more likely topay up to 20% more for non-GM foods (P =0.031).
Willingness to pay a premium for non-GMfoods was not significantly related to exercising (P =0.905), smoking (P = 0.646), level of education (P= 0.636) or income (P = 0.0953).
Labelling
Eighty-two per cent of those surveyed stronglybelieve that the foods made with GM ingredientsshould be labelled. Ten per cent indicated that theysomewhat believe labelling should be mandatory.Overall, over 90% of those surveyed feel that somekind of labelling for GM foods should be required.
Feeling that GM foods should be labelled wasnot significantly related to having children (P =0.600), concern about health (P = 0.356), exercising(P = 0.182), smoking (P = 0.29), currently buyingfat-free foods (P = 0.324) or currently buying organ-ic foods (P = 0.712).
Impact on the environment
If a person was concerned about the safety of GMfoods, they were also likely to be concerned aboutthe impact of GM foods on the environment (P =0.0001). Those who were concerned about theirhealth were also concerned about the environmentalimpact of GM foods (P = 0.026), and individualswho currently bought fat-free foods or organic foodswere also significantly more likely to be concerned(P = 0.065 and 0.050, respectively). Concerndeclined with increasing numbers of people in thehousehold (P = 0.014), and was not related to exer-cise, smoking, age, education level, having childrenor income.
Discussion
Limitations of the study
This is undoubtedly a pilot study. The results andconclusions stated should be interpreted with cau-tion, due to the small sample size and the possibili-ty of bias by non-response. In other words, the indi-viduals that responded to the survey may feel morestrongly about the subject matter, making the surveyresults unrepresentative of the country as a whole.This survey should also be repeated on a nationallevel, for the racial and social economic status ofindividuals in New Haven is not necessarily similarto that of the rest of the US.
Also, if an individual states that he or shewould be willing to pay a premium, it does not nec-essarily translate into the individual actually payinga premium when faced with the decision. Methods
58 C.A. Mendenhall and R.E. Evenson

to deal with this phenomenon should be employedwhen repeating this survey.
Perceptions of GM foods
Over 75% of the individuals surveyed indicatedthat they were at least somewhat concerned aboutthe safety of GM foods, and over 90% felt thatthere should be some form of labelling distinguish-ing food containing GM ingredients from non-GM food. This is not surprising; after all, theEuropean Union just passed legislation requiring alabel for all foods containing more than 1% of GMingredients.
Feeling concerned about GM foods was not afunction of education. However, those individualswho were already concerned about what they wereeating, such as the individuals who already boughtorganic foods, were more likely to be concerned.Participating in an exercise programme or alreadypaying attention to their health in general alsoincreased the level of concern. In summary, the con-cerned consumer was health conscious. Individualswith larger households or with children were not aslikely to be concerned, perhaps due to financial con-straints or other, more pressing, issues.
Willingness to pay a premium for non-GMfoods was not a function of income level or educa-tion. Instead, it was related to the current level ofconcern about the individual’s health and currentbuying practices. If the person was already eatingorganic food (and therefore currently paying a pre-mium for organic food), he or she was willing to paya premium for certified non-GM food, too. An indi-vidual’s willingness to pay a premium decreased withincreasing household size. Again, this may be due tofinancial constraints or more pressing issues con-cerning the household.
Older people were more concerned about thesafety of GM foods and the possible environmentalimpacts of GMOs on the environment, but thisconcern did not translate into willingness to pay apremium for non-GM foods. This appears to beunrelated to financial constraints; in this study, agedid not correlate with income (P = 0.218).
The profile for the consumer who had concernfor the environmental impacts of growing GM cropswas specific, and was similar to the consumer whowas willing to pay a premium for non-GM food.Both had concerns about their health, were alreadyconcerned about the food they consumed, and were
less likely to be concerned when there were moreindividuals in the household.
In conclusion, it appears that the individualssurveyed were concerned about GM food, and thatthey would like to know if GM ingredients were intheir food. The USDA and FDA should looktowards instituting labelling requirements for GMfoods. Being proactive instead of reactive in itslabelling legislation would probably be looked uponfavourably by the general public.
The establishment of willingness to pay a pre-mium for non-GM foods means change for the agri-cultural supply chain: separate fields, separate har-vesting procedures and possibly equipment,separation of GM and non-GM in transportation,processing, packaging and marketing. There is anincrease in cost to the farmer for keeping the GMand non-GM separate, but this is not currentlybeing reflected in the prices for non-GM vs. GMcrops.
At the farm level: an analysis of costs
The high level of concern and willingness to pay apremium indicated by the consumer shows thatthere is room for a non-GM market, and that a pre-mium can be charged for non-GM foods. This isalso verified by the recent creation of a niche marketfor non-GM crops. However, one area that has notshown much change during the creation of this mar-ket is the premium awarded to the farmer for certi-fied non-GM crops. If the current model is notadjusted, farmers will not receive enough to justifygrowing non-GM crops.
Typically, Americans spend 10% of theirincome on food, but that money does not go direct-ly to the farmer. Today, farmers get about 20 centsor less of each food dollar. The remaining 80 centsgoes towards transportation and marketing of theproduct, including packaging, labour and advertis-ing.
The Florida Department of Agriculture andConsumer Services has shown that there is a largediscrepancy between the prices paid to the farmerfor fresh fruits and vegetables and the prices paid atthe store. For the winter and spring of 1996 to1997, Florida retail prices for most popular com-modities were 300–600% above the price paid tothe growers. The bottom line is that a 0.6 cent pre-mium kg–1 for non-GM maize is not going to trans-late into that large a price increase at the consumer
Estimates of WTP Premium for Non-GM Foods 59
level, and if 50% of individuals are willing to pay upto a 10% premium at the consumer level, theamount of price increase at the farmer level can becalculated.
For example, the current farm price for sweet-corn is 11 cents kg–1. The retail price is 24 centskg–1, so farmers are getting 46% of the retail price.If 50% of consumers are willing to spend 10%more, or to pay 26 cents kg–1, we can calculate theprice premium the farmers could obtain. At theretail level 10% translates to 1/0.46 (0.10) = 21%.Everything held constant, the price to the farmercould be approximately 13 cents, or a 21% premi-um. If the percentage spread for farm to retailer is tobe held constant (though this may vary, it is cur-rently 216.66%), the price to the farmer would beapproximately 12 cents, or an 8.3% premium.Either way, this is more than the 3% premium farm-ers are currently receiving for non-GM maize.
Out of a US$3.50 box of Wheaties, the farmerreceives 3 cents,1 or 0.8% of the total. The pricespread is US$3.47, and the percentage spread is11,666.66%. If Kellogg’s was to charge a 10% pre-mium for certified non-GM Wheaties, or US$3.85,holding other expenses constant, the farmer couldconceivably be earning 10% = 1/0.008 (0.10) =1250% of the 3 cents, or 37.5 cents per non-GMWheaties box. In other words, a 10% premium atthe retail level translates into an increasing percent-age along the supply chain. If the farmers are notgiven an increase in the premium paid for non-GMcrops, they may not be able to produce them andthe opportunity for this new market to thrive will belost.
In a final example, margarine currently sells foraround 90 cents kg–1, and is 80% soybean oil.Soybean oil is priced at 9.45 cents kg–1, whichmeans that 7.6 cents from each kg of margarine (or8.4% of the price of margarine) goes to the farmer.If the price of certified non-GM margarine wasraised 10% to 99 cents, it could translate into a 10%= 1/0.084 (0.10) = 120% premium on certifiednon-GM soybeans, or 11.34 cents kg–1.
Policy recommendations
With the current level of interest in non-GM food,the US Government should develop guidelines forcertification. Labelling the non-GM foods as
opposed to the GM foods will be a way to informthe customer without attaching a negative stigma tofood or food products containing GM ingredients.
Those strongly concerned about GM foods arealready taking precautionary measures, such as buy-ing organic food, and will pay a premium to havenon-GM food when the opportunity to do so isoffered to them.
References
Barrett, J. and Segerson, K. (1996) Prevention and treat-
ment in food safety: an analysis of conceptual issues.
In: Caswell, J. (ed.) The Economics of Reducing HealthRisk from Food. Food Marketing Policy Center,
Storrs, Connecticut, pp. 19–43.
Caswell, J.A. and Mojduszka, E.M. (1996) UsingInformational Labeling to Influence the Market forQuality in Food Products, NE-165 Working paper
No. 43. Department of Resource Economics,
University of Massachusetts, Amherst,
Massachusetts.
Douthitt, R., Zepeda, L. and Grobe, D. (1996)
Comparison of National and Poor Households: Resultsof a Survey of Consumer Knowledge and RiskPerceptions of Food-related Biotechnologies, special
report No. 68. Institute for Research on Poverty,
Madison, Wisconsin.
Economic Research Service, USDA (2000) Impacts of
adopting genetically engineered crops in the United
States. [online article] www.econ.ag.gov/whatsnew/
issues/gmo/
Frommer, W.B., Ludewig, U. and Rentsch, D. (1999)
Taking transgenic plants with a pinch of salt [com-
ment]. Science 285(5431), 1222–1223.
Grobe, D., Douthitt, R. and Zepeda, L. (1996a) ExploringConsumers’ Risk Perceptions of Recombinant BovineGrowth Hormone and Recombinant Porcine GrowthHormone by Income and Gender: A Focus Group Study.Institute for Research on Poverty, Madison,
Wisconsin.
Grobe, D., Douthitt, R. and Zepeda, L. (1996b)
Measuring Consumer Knowledge and Risk Perceptionsof Food-related Biotechnologies: Survey Instrument.Institute for Research on Poverty, Madison,
Wisconsin.
Grobe, D., Douthitt, R. and Zepeda, L. (1999) Consumer
risk perception profiles regarding recombinant
bovine growth hormone (rbGH). Journal ofConsumer Affairs 33(2), 254–275.
John, E.L., Rayor, L.S. and Carter, M.E. (1999)
Transgenic pollen harms monarch larvae. Nature399, 214.
60 C.A. Mendenhall and R.E. Evenson
1 www.wheatonline.com/nrtext/price1026.txt

Kansas Corn Growers Association (2000) The many uses
of corn. www.ksgrains.com/corn/uses.html
Kristal, A.R., Levy, L., Patterson, R.E., Li, S.S. and White,
E. (1998). Trends in food label use associated with
new nutrition labeling regulations. American Journalof Public Health 88(8), 1212–1215.
Luoma, J.R. (2000) Pandora’s Pantry. Mojo Wire [serial
online] January–February. www.bsd.mojones.com/
mother_jones/JF00/pandora.html
Marietta, A.B., Welshimer, K.J. and Anderson, S.L. (1999)
Knowledge, attitudes, and behaviors of college stu-
dents regarding the 1990 Nutrition Labeling
Education Act food labels. Journal of the AmericanDietetic Association 99(4), 445–449.
Marra, M., Carlson, G. and Hubbell, B. (1997) Economic
impacts of the first crop biotechnologies, [online
presentation] December. www.ag-econ.ncsu.edu/
faculty/marra/FirstCrop/sld018.htm
Myhr, A. and Traavik, T. (1999) The precautionary princi-
ple applied to deliberate release of genetically modi-
fied organisms. Microbial Ecology in Health andDisease 11(2), 65–74.
Nestle, M. (1996) Allergies to transgenic foods – questions
of policy [editorial; comment]. New England Journalof Medicine 334(11), 726–728.
Estimates of WTP Premium for Non-GM Foods 61

Introduction
The development and application of biotechnologyis set to have revolutionizing effects on the agro-food sector. Its influence is wide ranging: fromenabling new evolutionary insights in living organ-isms to the redesigning of crop plants and the devel-opment of new rational targets for the most com-mon food products. Biotechnology is the toolboxavailable to introduce innovative ways of realizingbiological processes, and to provide opportunitiesnot only to improve production processes but alsoto develop new approaches to control quality andimprove food production.
Having made massive investments in biotech-nology, companies are continuously capitalizing onnew products. Product development using this tech-nology in the agro-food sector has today become abusiness endeavour. Companies have often failed toestablish close coordination between R&D andcommercial success (McElroy, 1999). As technologydevelops rapidly the main focus of product develop-ment activities has been to keep pace with technol-ogy and neglect market performance. The addition-al value that technology delivers was mainly focusedon specific targets and not dispersed to all the actorsinvolved. On the other hand, consumers do notseem willing to accept new technologies employedin food production (Hamstra, 1995), which, inaddition, do not deliver advantages on consumption
and benefit the producers only. Thus, consumersappear to be more reluctant to accept novel productsderived from biotechnology. What appears to bevital is for the producers to shift from this technolo-gy-push situation more into market orientation, bytracing and satisfying consumer needs.
The core idea of this chapter is that continuousresearch into the needs of all the actors involved canbe a valuable guide to the new product development(NPD) process. An assessment of the technology iscarried out in terms of consumers benefits delivery.Screening areas of application within the agro-foodsector, we identify what genetic manipulation tech-nology is able to deliver to consumers (final or inter-mediate). This is illustrated by a match of consumerneeds with certain product features derived from thetechnology. For this illustration we use the methodol-ogy of the ‘house of quality’ (HoQ) using the processof quality function deployment (QFD). Later, thebenefits identified are linked with relevant aspects ofconsumers’ acceptance of genetically modified (GM)foods in order to assess the benefits realization.
Our analysis moves along three dimensions:
1. The technology itself : the nature of biotechnologyhas the potential to provide specific product fea-tures. We analyse the technological developments inplant and food biotechnology and demonstratewhat it could offer in terms of concrete productfeatures.
63
6 A Consumer-based Approach towards NewProduct Development through Biotechnology
in the Agro-food Sector
Nickolas M. Spetsidis and Günter SchamelFaculty of Agriculture and Horticulture, Institute of Economic and Social Sciences,
Humboldt University of Berlin, Berlin, Germany
© CAB International 2002. Market Development for Genetically Modified Foods(eds V. Santaniello, R.E. Evenson and D. Zilberman)
2. The substrate of technology, referring to the prod-uct and its relation to consumers. This will be illus-trated using the process of QFD and the HoQmethodology. We do not start filling in the con-sumer needs, rather the product characteristics thatparticular techniques provide (roof of the house).Later, we match the product characteristics withidentified consumer (either the intermediate or enduser) needs (consumer ‘wants’). Eventually, the out-put is a translation of product features into con-sumer benefits.3. The consumers’ reaction towards biotechnology.Consumers appear reluctant to accept the use ofgenetic modification for food production. Theanalysis focuses on those concerns against the tech-nology itself despite the benefits that it is able toprovide. Since we identify the additional value thattechnology delivers, we investigate the conditionsunder which consumers can realize this value.
The analysis begins with an introduction to theconcept of consumer-oriented NPD and then weprovide an overview of the QFD process. We adaptthe relevant issues of QFD and of consumer-orient-ed NPD to genetic modification for food produc-tion and outline some key issues related to consumerorientation. Further, we shift to technology andsummarize the current state of affairs of geneticmanipulation with regard to plants and food pro-duction. We transpose the technology to the con-sumers’ side by a translation of product features gen-erated by the deployment of technology intoconsumer benefits using the HoQ. The goal is toidentify the additional value and investigate underwhich conditions this is realized by the consumer. Atthe end of the chapter we confront the relevantissues of QFD and of consumer-oriented NPD withkey findings of a survey conducted using specificproduct scenarios with German consumers andderive some main conclusions.
Principles of Consumer-oriented NewProduct Development
Introduction
NPD is widely recognized as a crucial activity formost companies. Long-term survival is increasinglydependent on the ability of companies to developand successfully introduce new products on to themarketplace. It is commonly argued that a substan-
tial share of the expected profits will come fromproducts which are not currently on the market (vanTrijp and Steenkamp, 1998). New productslaunched on the market can provide significantrewards in cases of success and heavy penalties incases of failures. It is generally accepted in marketingliterature that, from the total amount of new ideasturned to new products, only one-third can realizesuccessful commercialization. Rapidly changingtechnologies, heightened competition and thedynamic nature of consumer needs shape an envi-ronment characterized by constant turbulence bothon the technology and on the market side (Cooper,1996; van Trijp and Steenkamp, 1998). This envi-ronment means NPD is an extremely risky but alsoa challenging activity.
The high rates of failure and the high associat-ed costs have given rise to a significant amount ofresearch over the determinants of NPD success. Theultimate goal is to identify elements of success rele-vant to the internal structure of the organization aswell as to its external position and strategy within theindustry and towards the competition. Successdepends among other factors (Urban and Hauser,1993) on the rate that the new products successfullyaddress identified consumer needs and at the sametime surpass the competition. Consumer-orientedNPD takes consumers needs as a starting point forthe product development process and the productand production technology as a derivative thereof(van Trijp and Steenkamp, 1998). Under this con-cept technology is nothing more than the tool usedto make a product that consumers want.Technological developments have their effect on theproducts as they generate opportunities to fulfil exist-ing consumer needs more efficiently through new orimproved products (van Kleef, 1999, WageningenResearch University, personal cooperation and col-laboration). In essence, it is the company’s ability toexploit its technological capabilities to fulfil carefullyselected market opportunities by satisfying identifiedconsumer needs (van Trijp, 1999).
The NPD process needs strong links andcooperation between the functional groups in orderfor it to be established within the organization forthe generation of new ideas that will be translatedinto new products. This is a complex and cross-functional process (Baker and Hart, 1999) whichinvolves the active participation of all the parties ofinterest, namely marketing, manufacturing, suppli-ers and customers (Scott, 1998). It requires a‘balanced’ approach in which marketing and R&D
64 N.M. Spetsidis and G. Schamel

collaborate and share responsibilities (van Trijp andSteenkamp, 1998). The borders are not firm, rathera dynamic interrelationship prevails involving mar-keting moving more towards the manufacturingprocess and R&D to taking more account of theexternal market activities (Scott, 1998). The key tosuccess is how those links operate in order to effec-tively translate marketing inputs into desired prod-uct characteristics. Communication among thefunctional groups turns out to be the cornerstone ofeffectiveness in product development (Moenaert etal., 1994; Cooper, 1996; Griffin and Hauser, 1996;Scott, 1998; van Trijp and Steenkamp, 1998).
Quality function deployment and the houseof quality
The level of integration of different functionalgroups for the product development process is heav-ily influenced by the strategic orientation of thecompany. Gatignon and Xuereb (1997) define tech-nology-oriented firms as ‘firms with the ability andwillingness to acquire substantial technologicalbackground and use it in the product development’.The company develops the capabilities to exploit itstechnical knowledge to provide new solutions thatmeet market demands. On the other hand, Kohliand Jarowski (1990; Jarowski et al., 1993) define
market orientation of firms as ‘the organisationwidegeneration and dissemination of market intelligencerelated to current and future customer needs acrossthe departments and the organisationwide respon-siveness to it’. In this case the company has the mis-sion to identify, analyse and exploit knowledgeabout consumer needs and use it as its core compe-tency in the whole product development process(Gatignon and Xuereb, 1997).
Marketing and R&D responsibilities are nei-ther static nor independent and cannot be analysedseparately (Griffin and Hauser, 1996). Recent evi-dence suggests that the likelihood of product devel-opment success is enhanced if marketing and R&Dstaff members have high levels of communication(Griffin and Hauser, 1993). However, marketing lit-erature and empirical evidence indicate that dishar-mony between R&D and marketing has been therule rather than the exception (Griffin and Hauser,1996; Scott, 1998; Temponi et al., 1999).Marketing and R&D have different levels ofabstraction in realization of consumer needs (vanTrijp and Steenkamp, 1998). The level of commu-nication and cooperation between the groups is acrucial issue in the product development process.
One process for enhancing effectiveness incommunication and cooperation is QFD. It is themechanism that translates the ‘consumer voice’ intotechnical terminology and helps functional groups
A Consumer-based Approach towards New Product Development 65
Fig. 6.1. House of quality.
Consumer requirements (whats)
Technical characteristics (hows)
Relationships
Competitive assessment
Technical target values
Roof

to make key trade-offs between what consumerswant and what the company is able to deliver(Griffin and Hauser, 1996). QFD reduces the inter-nal barriers between marketing and R&D providingthe means to share and utilize information. TheHoQ is the tool used for this communication(Hauser and Clausing, 1998). It is a careful state-ment of consumer wants for the item being devel-oped, followed by a stipulation of technologies thatcan be used to achieve desired product characteris-tics (Crawford, 1996; Govers, 1996; Hauser andClausing, 1998). HoQ is illustrated in Fig. 6.1.
The HoQ begins with filling in the consumerrequirements (‘whats’). This is a structured list ofwhat the consumer ‘wants’ using a familiar con-sumer terminology. The consumer in this case is notonly the end user but also regulators and intermedi-ate users. Competitiveness assessment illustrates thecustomer’s perception of how the company’s prod-uct fulfils perceived needs relative to the competi-tion. This comparison may identify opportunitiesfor product improvement, or sources of competitiveadvantage. At the top of the HoQ, the product isanalysed in technical terminology. In the technicalcharacteristics (‘hows’) section, the product attributesare assigned to physical measurement units. Thus,the roof represents the technical and functionalinterrelations of the product features. In this part,necessary engineering trade-offs are demonstrated.The association of consumer demands towards theproduct and its technical and functional featurestakes place in the central ‘room’ of the HoQ, wherethe impact of the technical response against the con-sumer needs is measured and evaluated. At the bot-tom, the technical target values include a summary ofthe basic technical data that have been generatedfrom the interpretation of the information from themain matrix of the HoQ. In addition, the assess-ment of the competitor’s technical performanceindicates margins of possible advantage. Technicaltarget features indicate the priorities for the productdevelopment process (Hauser, 1993; Cohen, 1995;Temponi et al., 1999).
New product development usingbiotechnology
Companies involved with biotechnology can becharacterized as predominantly technology oriented.The focus of R&D activities is primarily on productand process development and not on successful
commercialization. The process for a successful newproduct development has been largely neglected infavour of more research into the basic levels ofscience (Wheelwright, 1994; Giusepin, 1999,Vlaardigen, The Netherlands, personal communica-tion).
Companies utilizing biotechnology within theagro-food sector could be also considered as ‘high-tech companies’ as they are mainly innovative, usingoffensive technological and marketing strategies toachieve high levels of product innovation (Nyström,1990). They are an example of organizations thatneed to innovate under a turbulent environmentwhere technology and the market are subject to con-stant change. Since the knowledge basis used is con-stantly changing, transformations to the scientificsubstrate surrounding the industry also take place(van Vliet, 1998). New technologies rapidly followone another, either replacing the existing ones, orgenerating new paths for development. Therefore,the technology push is the result of new productionopportunities arising from the evolution of thetechnology.
The innovation process has been mainlyfocused on improving R&D performance, measuredby the number of patents developed or acquired(Giusepin, 1999, personal communication), or onthe generation of products with novel features(McElroy, 1999). The challenge lies with how theproduct development process is capable of bridgingthe gap between what the technology delivers andwhat consumers really want. Increasing competitionin production technology and heightening marketdemands urge companies to realize that rapid andsuccessful NPD should have top priority(Wheelwright, 1994; McElroy, 1999). Rapid andhigh-quality product development can be a keystrategic advantage for a competitive strategy(Wheelwright, 1994). Superior product develop-ment process refers to how rapidly and effectivelynew ideas can be translated into product featuresdesired by consumers.
Genetic Manipulation Technology:Dynamics and Potential
The current state of affairs
Biotechnology can be defined as ‘the set of tech-nologies using living organisms or parts of them tomake or modify products to improve plants or
66 N.M. Spetsidis and G. Schamel
animals or to develop microorganisms for specificuses’ (Darf, 1990). It is the utilization of technolo-gies to explore and exploit the biological potential ofliving organisms to improve processes or to intro-duce new methods of production. Genetic manipu-lation technology and recombinant DNA technolo-gy embrace all the technologies and their derivativetechniques applied to implant foreign agents intothe genetic structure of an organism or to modify itsexisting genetic sequence in order to manipulate tar-get characteristics1 (Persley, 1992; Roller andHarlander, 1998). Therefore, biotechnology has thepotential to offer cost-efficient ways of producing anarray of novel or value-added products.
Genetic manipulation technology is of greatsignificance for agriculture. The world market fortransgenic plants in 1999 was US$3.5 billion with aplanted area of almost 40 Mha (The Economist,2000; ISAAA, 2000). The application of geneticmanipulation initially pursued the same path as theconventional breeding and cultivation methods.The difference was that with biotechnology the timeneeded to achieve the desired results was dramati-cally decreased (Persley, 1992). The primary objec-tive of research was to isolate single genes, transformand introduce them to the desired crops (Darf,1990; Mazur, 1999; McElroy, 1999; www.EuropaBio.be). The so-called ‘first generation’ of genetical-ly modified organisms (GMOs) are products withimproved input agronomic traits such as high yield,resistance to pests and diseases, herbicide toleranceand yield stability. Their value in generating rev-enues was by reducing the costs of production(Mazur, 1999; McElroy, 1999). Advances in tech-nologies for sequencing the genetic material oforganisms allowed the development of techniques toincorporate more than one gene in order to manip-ulate and control more complex traits: the ‘qualitytraits’ (second generation of products) (Rekonski,1997; Haseltine, 1998; Roller and Harlander, 1998;Mazur, 1999; McElroy, 1999).
The key technological driver behind the latestadvances is ‘genomics’. Its potential arises as theadvances in genetic sequencing have provided thetools to identify and investigate groups of genes con-tributing to a biochemical function or trait.Genomics technology identifies the location, impactand function of genes affecting certain traits ofinterest. The constant comprehension of genetic
information by improved genetic sequencing will bethe guide to monitor the ways in which genes inter-act to produce traits of interest. The challenge is toidentify genes that safely and effectively generatecommercial opportunities in agriculture (Mazur,1999). The most important agronomic propertiesare genetically complex. The agronomic propertiesgenerate additional value by changing the propertiesof the final product to meet sophisticated consumerdemands such as combined agronomic traits orquality properties of final products (McElroy, 1999;www.EuropaBio.be).
The task for the future will be not only to con-trol one or two genes, but also to understand andmanipulate whole physicochemical and physiologi-cal procedures (Renkonski, 1997; Mazur, 1999).Developments in sequencing technologies can pro-vide a lot of information about the association ofgenes with corresponding traits, but say nothingabout their functions in the whole organism (func-tional genomics) (Haseltine, 1998; Mazur, 1999;Galperin and Koonin, 2000). The path to take is‘bioinformatics’ which involves the successful man-agement and coordination of huge quantities ofinformation in conjunction with the use of infor-mation technology to achieve the desired output(Mazur, 1999; Thomson, 1999).
Technological advances will give rise to moreradical changes, which will further shorten the prod-uct development process (McElroy, 1999; Hodgson,2000). Genetic manipulation allows new combina-tions of genetic material to improve microorganismsfor tailor-made products of interest. It is now possi-ble to isolate particular genes coding for enzymesand introduce them into microorganisms used infood production (e.g. chymosin derived from thebacteria Kluyveromyces lactis). It is also possible tointervene in the genetic material of enzymes or othermicroorganisms (bacteria), which are often selectedas a host to express particular genes or proteins.Yeast can produce enzymes, precursors for chemi-cals, or specific proteins. Lactic acid bacteria mayalso secrete proteins that serve as natural anti-micro-bial compounds. Moulds are increasingly being cho-sen as large-scale producers of enzymes (Unilever,1995). Modification of basic ingredients can lead totailor-made functional components. It has been esti-mated that 50% of all industrial enzymes havealready been genetically manipulated (Roller and
A Consumer-based Approach towards New Product Development 67
1 The terms biotechnology and genetic manipulation technology are used interchangeably to denote technologieswhich lie beyond classical genetics.

Harlander, 1998). This specific performance achievedby genetic engineering technologies has attracted theindustry’s interest in producing probiotics andextracting bioactive components used for specificpurposes (Belem, 1999). Biotechnology is the toolboxavailable to boost sales of food product categoriessuch as functional foods or functional pharmaceuticalfoods (Belem, 1999; Goldberg, 1999), to rediscoverfood products (Belem, 1999) or to improve the valueof the existing ones by enhancing incremental prop-erties (Roller and Harlander, 1998).
Biotechnology deployment for foodproduction
The use of genetic manipulation for food produc-tion is mainly focused on improving quality in sev-eral ways. The improvement of product quality, andthe reduction of production time and costs illustratesome of the main targets of biotechnology (Frewer etal., 1997a; Roller and Harlander, 1998). The area ofapplications can be wide. In this section some select-ed examples are given to indicate how the technolo-gy is employed to deliver additional value. Extensiveanalysis can be found in the tables in the Appendix.
The objective of improved product qualityincludes targets like fatty acid metabolism, nutrientmetabolism, elimination of undesired properties,extended shelf-life, improved colour and processingquality (www.EuropaBio.be). The first applicationwas in the tomato with a delayed ripening process(the FlavrSavr® tomato) introduced by Calgene.Zeneca also developed tomatoes with retardedripening properties suitable for tomato pulp. Today,tomatoes with increased levels of provitamin A havebeen successfully developed to enhance nutritionalvalue especially for vulnerable consumers (Römer etal,. 2000). Another significant achievement is thehigher level of provitamin A in rice.
The manipulation of lactic acid bacteria forfermented food products such as buttermilk, yogurt,cheese, sausage or sauerkraut was also one of theinitial applications of biotechnology in foods(Wymer, 2000). Some products have already beencommercialized, such as the recombinant chymosinfor cheese, yogurts with modified bacteria(Lactobacillus bulgaricus and Streptococcus ther-mophilus) to prevent the so-called ‘post-fermenta-tion acidification’, and bacteria that overproducealanine from lactose to derive cheese or yogurt withimproved or novel flavours (Wymer, 2000). There
have been recent attempts to modify essential com-ponents of milk for low-lactose content for lactoseintolerant persons. This application ensures ade-quate intake of Ca and at the same time allergenicreactions can be avoided (Whitelaw, 1999).
Biotechnology deployment in agriculture
Application of biotechnology in plant productionwas initiated for plant breeding. A thorough under-standing of the relevant biochemical reactions andtheir control points led to new opportunities toinduce and utilize genetic variation. Genetic engi-neering techniques increase the precision of alter-ations that can be made, by increasing the precisionof the definition of changes needed to achieve adesired phenotype (Persley, 1992). Agronomic prop-erties are a key target of application. Herbicide tol-erance as well as resistance to fungi, insects, nema-todes and viruses was the primary research target.Increased nutrient uptake and efficient nutrientexploitation is another significant application. Astechnologies develop, the focus is on complex traitscontrolled by more than one gene or on complexand combined agronomic properties (e.g. highyields of a given energy storage compound) (Mazur,1999; McElroy, 1999; www.EuropaBio.be). Anextensive description of the application of technolo-gy in agriculture is given in Tables A1 and A2 in theAppendix.
Benefits Delivery and ConsumerReaction
Introduction
Biotechnology has turned out to be of paramountimportance for the companies in the agro-food sec-tor. Its application targets are to enhance an array ofproperties in food products in order to improvetheir functionality or even to create entirely newones. Genetic manipulation offers the capacity tocombine a bundle of different characteristics in oneproduct. Technology is accelerating the pace atwhich new products are in the pipeline to deliveradditional value to consumers. Food or life sciencecompanies increasingly realize that successful com-mercialization is going to be a crucial factor forlong-term profitability and growth. Success will alsodepend on the degree of consumer acceptance
68 N.M. Spetsidis and G. Schamel

whereby the key is benefits realization. There isstrong evidence that the commercial success of newgenetically modified (GM) products will depend onpublic acceptance and the benefits that new prod-ucts will deliver to all actors involved in the chain(Wheelwright 1994; Mazur, 1995, 1999; Rekonski,1997; McElroy, 1999).
Consumers do not value products per se; ratherthey value the benefits they deliver on consumption(Grunert et al., 1997). Consumer theory considerseach product to be a bundle of physical characteris-tics/technical features generated by the productiontechnology. The new product then is a bundle ofconcrete attributes which the company offers forsuperior benefit delivery (van Trijp and Steenkamp,1998). Kaul and Rao (1995) distinguish productattributes and product characteristics. Productattributes are ‘the dimensions that define consumersperceptions relative to the product’, whereas prod-uct characteristics are ‘the various physical featuresthat define the product’. Product attributes areeither concrete or abstract though still directly relat-ed to the product’s characteristics (Steenkamp,1997). Consumers attach to each product an assort-ment of attributes, which differentiate it from alter-natives. Product features influence the formation ofproduct attributes and consumers will choose theproducts that offer superior benefits according totheir perception of these attributes. Superior benefitdelivery is the domain within which a product isable to fulfil the perceived consumer needs betterthan another. The need is merely an ‘unsatisfied’condition of a consumer, which leads him or her toan action that will improve this condition(Steenkamp, 1997; Sheth et al., 1999). The realizedbenefits are the outcome of the product’s use(Steenkamp, 1997).
This section aims to screen and analyse thebenefits that genetic manipulation technology isable to deliver in terms of product characteristics.Despite the benefits that technology provides, sig-nificant concerns are raised by consumers againstthe technology and ultimately against the products.Later, we review the relevant literature and confrontit with key findings from our study of German con-sumers. The survey included specific scenarios ofproducts (yogurt, vegetables and functional foods)derived with the help of biotechnology, and testedthe consumers’ reactions towards concrete benefitsdelivery.
Consumer requirements
There has been extensive research to investigate con-sumer needs with regard to foods. The decision-making process and consumers’ intention to pur-chase foods has been thoroughly investigated andseveral models have been developed to describe thisprocess. Consumers today are more critical aboutthe technologies and processes used to producefoods (Hamstra, 1995). Innovations stemming fromthe employment of new technologies for food pro-duction are confronted with suspicion when theyconvey a certain level of uncertainty relevant to con-sumption. Consumers’ concerns and requirementsmay vary from a simple food ingredient used, to thenature and scope of the technology used. Researchevidence indicates that the majority of Europeanconsumers perceive new technologies as unnecessaryfor food production (Hamstra, 1995; EuropeanCommission, 1997; Frewer et al., 1997; Wohl,1998). Additional technologies employed in thefood chain are perceived not to improve productsbut worsen their quality (European Commission,1997). The findings of the survey conducted inGermany outline this issue. The majority of respon-dents believed that new technologies employed infood production tend to worsen the quality offoods.
A large amount of research suggests that con-sumers attach a significant weight to health issues.Health is judged as one of the most important prod-uct attributes that consumers attach to food(Hamstra, 1991, 1995; Fuller, 1994; Ter Hofstede et al., 1996; Grunert et al., 1997; Bredahl et al.,1998; van Trijp and Steenkamp, 1998; Katz, 1999).Relevant studies indicate that ‘health’ is related tofood products without or with only minimal levelsof additives (Hamstra, 1991, 1995; Bredahl et al.,1998), or with products supplemented with probi-otics, or with low fat content (van Trijp andSteenkamp, 1998).
Concerns about safety are also significant.Food safety is related to the hazards of food con-sumption either in the short run via allergenic reac-tions or in the long run through impact on thehealth of future generations (Fuller, 1994; Hamstra,1995; Bredahl et al., 1998; Wohl, 1998). Food safe-ty can also include aspects of security in the sense oftrust for the product (Bredahl et al., 1998).
The taste appeal is also an element that influ-ences consumers’ acceptance of food products. If theproduct does not taste properly it is not likely to be
A Consumer-based Approach towards New Product Development 69
purchased. The issue of ‘taste’ includes some dimen-sions which are implicitly required such as richflavour (Katz, 1999), rich or smooth texture (Fuller,1994), or low fat content and wholesomeness(Bredahl et al., 1998). Taste is also an element of thequality perception that consumers hold (Fuller,1994; Ter Hofstede et al., 1996; Steenkamp, 1997;van Trijp and Steenkamp, 1998).
Convenience is another factor which influ-ences consumers’ acceptance of foods. Convenienceis related to the perceived ease of use and processingthe product (Hamstra, 1995). It can be related tolong shelf-life (Hamstra, 1995; van Trijp andSteenkamp, 1998), a long storage time (Unilever,1995) or the ease of preparation, handling andcooking (Ter Hofstede et al., 1996; Steenkamp,1997; Katz, 1999).
Translation of product features intoconsumer benefits
To outline the role of genetic manipulation technol-ogy in the NPD process, more insight is requiredabout the benefits that technology delivers to the dif-ferent actors involved. Concrete product featuresderived from genetic manipulation are identified,and translated into concrete customer benefits (usingconsumers’ terminology). Initially, we define whichgenetic manipulation technique is used, and explainhow this technique is applied. Later we translateproduct features derived into product attributes.Thus, product attributes can be translated into ben-efits for each actor (farmer, producer, retailer and enduser consumer) using its own terminology. Thisprocess can be considered as using the HoQ theother way round. The consumer needs are not thestarting point, rather the product features derivedfrom genetic manipulation. Data about the products’physical characteristics are similar to the data at thetop of the HoQ. The attributes delivered resemblethe left part of the house. The final result is an assess-ment of what technology is able to deliver to differ-ent types of consumers. This analysis is illustrated inTables A1–A3 in the Appendix.
Plant production
Table A1 shows that application of genetic manipu-lation in plant production often leads to improve-ments of agronomic traits (like herbicide, insecti-
cide, fungal or bacterial resistance). This contributesin certain cases to the improvement of the quality ofthe final product. Soya, maize or potatoes that areresistant to devastating pests (e.g. Colorado beetle,certain weeds) can provide effective crop protection,resulting in fewer losses. Other advantages are costreduction and enhanced yields. Grains that are her-bicide tolerant lower the management costs. Lowercost contributes to more efficient production. Theproduct entering the market may be of better quali-ty, since it may contain less chemical residues fromherbicides and will probably be of a lower price.Genetically manipulated tomatoes, which are easyto handle during the postharvest process, providebenefits for both producer and consumer.
Food production
Genetic manipulation technology contributes to theimprovement of processing traits in a direct or indi-rect way (Tables A2 and A3). GM tomatoes(through a thicker skin or slow ripening) providebenefits for the producer, since they can be storedfor a longer time. This results in fewer losses.Transport costs can be reduced as well. The qualityof the product remains changeless for a longer time.This offers convenience to the producer for storingand processing the product. Longer storage timealso benefits retailers and consumers.
Genetic manipulation offers more controlledfermentation processes, using raw materials that aremore stable and are of superior performance. GMenzymes or other starter microorganisms (bacteria)can be considered as purer ingredients since theneed for additives can be eliminated. Application oftechnology to oil derivatives targets production ofoil with improved taste characteristics for the con-sumer. Chymosin is also a necessary ingredient forcheese production, which can be produced with thehelp of genetically modified enzymes. Chymosin ispurer in the sense that larger amounts of enzymesare produced compared with the traditionalmethod.
Advances in technology are essential for foodproduct development. New technologies may pro-vide more efficient solutions to production prob-lems or offer the means for more efficient produc-tion. Genetic manipulation technology can beconsidered as a ‘clever way’ to improve processes ofproduction and the characteristics of the products.Technology is applied to intermediate products to
70 N.M. Spetsidis and G. Schamel

improve the processes and provide ways for more‘green production’ since naturally modified ingredi-ents are used instead of chemical ones (Giuseppin,1999, personal communication).
Genetic manipulation technology providesproducts with additional health benefits andimproved taste, and offers ingredients with specificfunction (Roller and Harlander, 1998), at the sametime reducing undesirable effects of specific compo-nents (Giuseppin, 1999, personal communication).With respect to quality of production, geneticmanipulation may reduce the need for chemicaladditives through tailor-made microorganismswhich provide a wide range of specific productattributes for specific target groups (Giuseppin,1999, personal communication).
Consumer acceptance
One issue that is significant for inducing consumers’acceptance of new technologies for food productionis benefits realization (Hamstra, 1995). Many of theproducts introduced so far may carry little or nobenefits to consumers. When consumers have beenasked about the scope and the potential advantagesof the deployment of biotechnology in foods, theadvantage for the producer was by far the most com-mon response (European Commission, 1997;Frewer et al., 1997b; Bredahl, 1998; Sheehy et al.,1998; The Economist, 2000). To date, the complexi-ty of the technology prevented consumers fromunderstanding the attributes that technology pro-vides. This results in an unequal relationshipbetween producer and consumer benefits where theconsumer only sees producer benefits (Frewer et al.,1997; Sheehy et al., 1998).
In general consumers in Europe do not seemwilling to accept the use of genetic modification infoods. When they are confronted with the option toavoid GM products, they would probably do so(Bredahl, 1998, 2000). Consumers show theirunwillingness to accept GM products which provideless perceived additional value than that currentlyavailable from the existing ones (Hamstra, 1995;Bredahl et al., 1998; Sheehy et al., 1998). In thestudy conducted with German consumers the prod-uct scenario with a GM yogurt (with GM bacteria)gained the least acceptance, as it was perceived thatit has the same function as the traditional one but ismore hazardous for health.
It has been verified that consumers’ behaviour
towards the technology and products is shaped by arisk–benefit evaluation of the technology overallcoupled with the evaluation of risks and benefits ofthe products. In addition some general attitudesheld by consumers play an influential role. It hasbeen well documented that a ‘risk averse’ attitudetowards technologies in foods can stimulate reserva-tions to technological innovations (Hamstra, 1995;European Commission, 1997; Bredahl, 2000).Moreover, attitudes towards environment andnature (Hamstra, 1995; Frewer et al., 1997;Kuznesof et al., 1997; Bredahl, 2000), perceivedtrust in regulators and public agencies (Frewer et al.,1996; European Commission, 1997; Bredahl, 2000)and price sensitivity (Zechendorf, 1994; Kuznesof et al., 1997; Bredahl, 2000) can also be elements ofthe general attitudes consumers have. Bredahl, in aseries of studies (Bredahl, 1998, 2000), analysedconsumers’ attitude formation towards geneticmanipulation technology in foods and suggested abehavioural model in which the determinants ofattitudes are the perceived risks and benefits trade-offs related to product and technology. Moreover,the perceived process risks and benefits influence theattitude towards the process of production.However, empirical evidence shows that a clear dis-tinction of attitudes between technology and theproduct could not be inferred (Bredahl, 2000).
Biotechnology is a relatively new, complex andconstantly changing technology surrounded by alevel of uncertainty about the long-term implica-tions. Complexity and uncertainty are issues thatneed time for the consumers to comprehend andultimately evaluate the pros and cons (Menrad et al.,1998; Sheehy et al., 1998; Biefang, 1999). This is amajor factor influencing attitudes formation(Biefang, 1999). This aspect is confirmed by thefindings of the survey of German consumers.Biotechnology was perceived as not ‘a natural way ofproduction’ which involves a high degree of risk. Inthis case, consumers have the perception of beinginvolved in involuntary, man-made risks whichmight have chronic and disastrous impacts onhuman health among other things (Biefang, 1999).Taking all these considerations into account, theperception of risk includes many other factors whichlie beyond the domain of technical and scientificrisks (Wohl, 1998; Biefang, 1999). Risk theory sug-gests that activities or technologies judged as highlyrisky are considered low in benefits (Wohl, 1998;Biefang, 1999). This is probably true in the case ofbiotechnology.
A Consumer-based Approach towards New Product Development 71
There is also strong evidence by research thatthe acceptance of genetically manipulated productscan be assessed on a case by case basis. If we take theexample of ‘rapid method of production’ usingbiotechnology, this was perceived as a positive onefor the cheese products (Hamstra, 1995; Frewer etal., 1997), but not when it was referred to in yogurtor beer (Bredahl, 1998). This argument could beverified by the pattern with which the German con-sumers responded to different product scenariosstemming from the same application of technology.When the scenarios represented explicitly visiblebenefits (functional foods) then there were morepositive responses than for scenarios representingweak or vague consumer benefits (the case of yogurtor vegetables). Recall that the value of visible bene-fit delivery is a key issue.
High levels of consumer awareness are shownin most relevant studies. Information about thetechnology is highly desired and accepted. Clearcorrelation between the level of knowledge and thecorresponding levels of acceptance could not beinferred. Findings by the European Commission(1997) show that increased information does notseem to influence the attitudes consumers hold, butenforces the existing ones. Some authors claim, andevidence exists, that although consumers show highlevels of awareness, the levels of actual knowledgeabout the technology appear to be relatively low(Hamstra, 1995; European Commission, 1997;Sheehy et al., 1998). Sheehy et al. (1998) explainthis situation and suggest that biotechnology is newand complex, thus not evident to the casual con-sumer by the final product. This is an argument jus-tifying consumers’ demand for labelled products(Hoban, 1997, 1999). Consumers seek to beinformed and ask for the right of an informedchoice based on actual information-based labelling.The vast majority of German consumers in ourstudy (over 50%) are willing to accept GM foods inthe market under the condition of clear labelling.
Conclusions
This chapter aimed to analyse the topic of newproduct development with the help of geneticmanipulation technology in the agro-food sector.The analysis moved along three dimensions. Onewas to review the literature on some basic principlesof NPD using a consumer-oriented approach.Application of genetic manipulation technology
offers the opportunities to improve processes of pro-duction or to deliver an entirely new array of prod-ucts. With regard to this aspect, we screenedtechnology in terms of its potential in agricultureand food production, and identified what it is ableto deliver in terms of concrete benefits to all actorsinvolved. Biotechnology has the potential to offeradditional value and the consumer emerges as abottleneck for this additional value delivery. Alongthis line, we ascertain some crucial factors that influ-ence consumers’ acceptance of GM products.
Utilization of genetic manipulation technologyfor NPD is set to take place under a turbulent envi-ronment both on the supply side (producers need tobe adapted to a constantly changing technologicalenvironment) as well as on the demand side (as con-sumer concerns and preferences are subject to con-stant change). Companies need to have a formal andstructured NPD procedure where the consumerneeds and ‘wants’ emerge as a crucial element.Formalized procedures such as the QFD can beappropriate to improve the effective translation ofconsumer needs into physical product featuresdesired by consumers.
Genetic manipulation in food production isemployed to enhance quality by improving meta-bolic pathways, by eliminating undesired properties,by extending the shelf-life of products or by offeringimproved quality in the process of production.Micro ingredients are targets of technology in orderto introduce tailor-made products for specific cases.Agriculture is one of the main areas of biotechnolo-gy application. The main target initially was toimprove breeding, later to introduce crops withdesired traits of interest. Nowadays the focus ofresearch and production is to shift from simple traitsto more complex reactions coded by interactinggenetic sources (genes). Overall, genetic manipula-tion technology has significant potential to provideadditional value to products, which presumably canbenefit the consumer, either the end user or theintermediate. Exhibits in Tables A1, A2 and A3 rep-resent only a fraction of the whole picture, which isconstantly growing.
Although the benefits of biotechnology can beobvious, consumers tend to be increasingly criticalof GM foods. In general, they are inclined to bemore demanding, and become more concernedabout the process of production and the scope oftechnology used. With regard to biotechnology, anumber of factors are identified which influence thelevels of consumer acceptance. The literature sug-
72 N.M. Spetsidis and G. Schamel

gests that a determinant of acceptance is the atti-tudes the people hold towards the technology andaccordingly the product. Attitudes can also be influ-enced by the consumers’ subjective perception of theactual product characteristics. Perceived risks andbenefits have a significant impact in evaluating theproducts and technology overall. The benefits deliv-ery is a crucial factor for determining the risks–ben-efits trade-off. Concrete, specific and affordable ben-efits delivered on consumption can significantlyraise acceptance of GM foods.
Ultimately, product developers within theagro-food sector need to adapt themselves to anenvironment where the consumer benefits appear tobe the bottleneck for added value delivery.Consumer benefit delivery needs to be taken veryseriously into account during the early stages of theproduct development process. At the same timeadequate information should be communicated bythe producer to the public, either by clear labellingor by other risk-communication activities about theactual risks and benefits that the new productsconvey. Product development using biotechnologyin food and plant production needs to be associatedwith additional inputs, which are essential for suc-cessful commercialization. Those include an in-depth intelligence of what consumers already knowand believe about food biotechnology, as well asrecognition that risk is not only a technical conceptbut also a social construct. Those aspects suggestthat success in the market would also have toinclude an in-depth communication strategy whichwould gradually include the whole spectrum ofissues surrounding food biotechnology (Biefang,1999). All these arguments constitute the need forproducers to shift from a technology-push situationmore to a consumer-oriented product development,where radical innovations in technology can besuccessfully transformed into real additional valuerealized by consumers.
References and Background Reading
Baker, M. and Hart, S. (eds) (1999) Product Strategy andManagement. Prentice-Hall, London.
Begemann, B.D. (1997) Competitive strategies of biotech-
nology firms. Implications for US agriculture. Journalof Agriculture and Applied Economics 29, 118–119.
Belem, M.A.F. (1999) Application of biotechnology in the
product development of nutraceuticals in Canada.
Trends in Food Science & Technology 10, 101–106.
Biefang, S. (ed.) (1999) Strategies for Communication onFood Biotechnology, EUR 18600EN. European
Communities, Office for Official Publications of the
European Communities, Luxembourg.
Bredahl, L. (1998) Consumer Cognition with regard toGenetically Modified Foods. Results of a QualitativeStudy in Four Countries, working paper No. 59.
Center for Market Surveillance Research and
Strategy for the Food Sector, The Aarhus School of
Business, Denmark.
Bredahl, L. (2000) Determinants of Consumer Attitudes andPurchase Intentions with Regard to GeneticallyModified Foods: Results of a Cross-national Survey,working paper No. 69. Center for Market
Surveillance Research and Strategy for the Food
Sector, The Aarhus School of Business, Denmark.
Bredahl, L., Grunnert, R.G. and Frewer, L. (1998)
Consumer Attitudes and Decision-making with regardto Genetically Engineered Food Products: a Review ofthe Literature and a Presentation of Models for FutureResearch, working paper No. 52. Center for Market
Surveillance Research and Strategy for the Food
Sector, The Aarhus School of Business, Denmark.
Bucio, L.J., Vega, M.O., Garcia, A.G. and Estrella, H.L.
(2000) Enhanced phosphorus uptake in transgenic
tobacco plants that overproduce citrate. NatureBiotechnology 18, 450–453.
Cohen, L. (ed.) (1995) Quality Function Deployment.Addison-Wesley, New York.
Cook, J.D., Emptage, L.S., Miller, F.W., Rauch, S. and
Ruiz-Funes, J.-P.M. (1997) Food biotechnology: can
you afford to be left out? McKinsey Quarterly 3,
78–89.
Cooper, R.G. (1996) Overhauling the new product
process. Industrial Marketing Management 25,
465–482.
Crawford, C.M. (ed.) (1996) New Products Management,5th edn. Irwin/McGraw-Hill, Michigan.
Darf, P.J. (1990) Plant production: introduction. In:
Persley, G. (ed.) Agriculture Biotechnology:Opportunities for International Development.Biotechnology in Agriculture No. 2. CAB
International for The World Bank, International
Service For International Agricultural Research,
CAB International, Wallingford, UK.
The Economist (2000) Blech. The Economist 354, 75.
European Commission (1997) Eurobarometer 46.1. TheEuropeans and Modern Biotechnology. European
Commission Directorate General XII, Science
Research and Development, Office for Official
Publications, Luxembourg.
European Commission (1998) Looking at the BiotechnologyConsumer EUR 18492 EN. Directorate-General
Science, Research and Development, Office for
Official Publications, Luxembourg.
Frewer, L.J., Howard, C., Hedderley, D. and Shepherd, R.
(1997a) Consumer attitudes towards different food-
A Consumer-based Approach towards New Product Development 73

processing technologies used in cheese production:
the influence of consumer benefit. Food Quality andPreference 8(4), 271–280.
Frewer, L.J., Howard, C. and Shepherd, R. (1997b) Public
concerns in the United Kingdom about general and
specific applications of genetic engineering: risks,
benefit, and ethics. Science Technology and HumanValues 22(1), 98–124.
Fuller, G.W. (ed.) (1994) New Food Product Development.From Concept to Marketplace. CRC Press, Boca
Raton, Florida.
Galperin, M.Y. and Koonin, E.V. (2000) Who’s your
neighbor? New computational approaches for func-
tional genomics. Nature Biotechnology 18.
Gatignon, H. and Xuereb, J.-M. (1997) Strategic orienta-
tion of the firm and new product performance.
Journal of Marketing Research Feb, XXXIV, 77–90.
Goldberg, R. (1999) The business of agriceuticals. NatureBiotechnology 17, BV5–BV7.
Govers, C.P.M. (1996) What and how about quality func-
tion deployment (QFD). International Journal ofProduction Economics 46, 47, 575–585.
Griffin, A. and Hauser, J. (1993) The voice of the cus-
tomer. Marketing Science 12(1), 1–27.
Griffin, A. and Hauser, J. (1996) Integrating R&D and
marketing: a review and analysis of the literature.
Journal of Product Innovation Management 13,
191–215.
Grunert, K., Harmsen, H., Hartvig, H., Larsen, E. and
Sorensen, S.B. (1997) New areas in agricultural and
food marketing. In: Wierenga, B., van Tilburg, A.,
Grunert, K., Steenkamp, J.-B.E.M. and Wedel, M.
(eds) Agricultural Marketing and Consumer Behaviorin a Changing World. Kluwer Academic Publishers,
Boston, Massachusetts.
Hamstra, A.M. (1991) Biotechnology in Foodstuffs: Towardsa Model of Consumer Acceptance. The SWOKA
Institute, The Hague.
Hamstra, A.M. (1995) Consumer Acceptance Model forFood Biotechnology: Final Report. The SWOKA
Institute, The Hague.
Haseltine, W.A. (1998) The power of genomics to trans-
form the biotechnology industry. NatureBiotechnology 16 (Suppl.), 25–27.
Hauser, J.R. (1993) How Puritan-Bennet used the house
of quality. Sloan Management Review Spring, 61–70.
Hauser, J. and Clausing, D. (1998) The house of quality.
Harvard Business Review May–June, 63–73.
Hoban, J. (1997) Consumer acceptance of biotechnology:
an international perspective. Nature Biotechnology15, 232–234.
Hoban, J. (1999) Public perceptions and understanding of
agricultural biotechnology. Economic perspectives:
an electronic journal of the US Department of State.
www.usia.gov/journals/journals.html
Hodgson, J. (2000) Crystal gazing the new biotechnolo-
gies. Nature Biotechnology 18, 29–31.
ISAAA (2000) Global review of commercialised transgenic
crops. www.isaaa.org
Jarowski, B.J., Ajay, K. and Kohlli, A.K. (1993) Market
orientation: antecedents and consequences. Journalof Marketing 57(3), 53–79.
Johne, F.A. and Snelson, P.A. (1998) Success factors in
product innovation: a selective review of the litera-
ture. Journal of Product Innovation Management 5,
114–118.
Katz, F. (1999) Top product development trend in Europe.
Food Technology 53(1), 38–42.
Kaul, A. and Rao, V.R. (1995) Research for product posi-
tioning and design decisions: An integrative review.
International Journal of Research in Marketing,293–320.
Kohli, A.K., Ajay, K. and Jarowski, B.J. (1990) Market ori-
entation: the construct research propositions and
managerial implications. Journal of Marketing 54(1),
1–20.
Kuznesof, S., Gofton, L. and Ritson, L. (1997) ConsumerAcceptability of Biotechnology in Relation to FoodProducts, with Special Reference to Farmed Fish.European Communities, Office for Official
Publications of the European Communities,
Luxembourg.
McElroy, D. (1999) Moving agbiotech-downstream.
Nature Biotechnology 17, 1071–1074.
Mazur, B. (1995) Commercializing the products of plant
biotechnology. Trends in Biotechnology 13, 319–323.
Mazur, B. (1999) Technology issues in plant development.
Nature Biotechnology Supplement 17, BV9–BV10.
Menrad, K., Kochatzky, K., Maßfeller, S. and Strauß, E.
(1998) Communicating Genetic Engineering in theAgro-Food Sector to the Public, EUR 18358EN.
European Communities, Office for Official
Publications of the European Communities,
Luxembourg.
Millar, H. (1999) Consumer expectations and openness.
Nature Biotechnology Supplement 17, BV39–BV40.
Moenaert, R.K., Souder, W.E., De Meyer, A. and
Deschoolmeester, D. (1994) R&D-marketing inte-
gration mechanisms, communication flows and
innovation success. Journal of Product InnovationManagement 11, 31–45.
Nyström, H. (ed.) (1990) Technological Market Innovation.
John Wiley & Sons, Chichester, UK.
Persley, G.J. (ed.) (1992) Beyond Mendel’s Garden:Biotechnology in the Service of World Agriculture. CAB
International for the World Bank, Wallingford, UK.
Renkonski, M.A. (1997) Marketing strategies of biotech-
nology firms: implications for U.S. agriculture.
Journal of Agricultural and Applied Economics 29(1),
123–131.
Roller, S. and Harlander, S. (eds) (1998) GeneticModification in the Food Industry. Chapman & Hall,
London.
Römer, S., Fraser, P.D., Kiano, J.W., Shipton, C.A.,
74 N.M. Spetsidis and G. Schamel
Misawa, N., Schuch, W. and Bramley, P.M. (2000)
Elevation of the provitamin A content of transgenic
tomato plants. Nature Biotechnology 18, 666–669.
Saguy, S. and Moskowitz, H.R. (1999) Integrating the
consumer into new product development. FoodTechnology 53(8), 67–73.
Saviotti, P.P. (1998) Industrial structure and the dynamics
of knowledge generation in biotechnology. In:
Biotechnology and Competitive Advantage. Jacqueline
Senker, Bath.
Scott, G.M. (1998) The new age of new product develop-
ment: are we there yet? R&D Management 28(4)
225–236.
Sheehy, H., Legault, M. and Ireland, D. (1998)
Consumers and biotechnology: a synopsis of survey
and focus group research. Journal of Consumer Policy21, 359–385.
Sheth, J.N., Mittal, B. and Newman, B.I. (eds) (1999)
Customer Behavior: Consumer Behavior and Beyond.The Dryden Press, Dryden, Ontario.
Steenkamp, J.-B.E.M. (1997) Dynamic in consumer
behavior with respect to agricultural and food prod-
ucts. In: Wierenga, B., van Tilburg, A., Grunert, K.,
Steenkamp, J.-B.E.M. and Wedel, M. (eds)
Agricultural Marketing and Consumer Behavior in aChanging World. Kluwer Academic Publishers,
Boston, Massachusetts.
Temponi, C., Yen, J. and Tiao, A.W. (1999) House of
quality: a fuzzy logic-based requirements analysis.
European Journal of Operational Research 117,
340–354.
Ter Hofstede, F., Steenkamp, J.-B.E.M. and van Trijp,
J.C.M. (1996) Pan European Study of Vegetables and
Fruits, September. Unilever, The Netherlands.
Thomson, J.D. (1999) Shortcuts from gene sequence to
function. Nature Biotechnology 17, 1158–1159.
Unilever (1995) Unilever and Biotechnology; MergingScience and Consumer Benefits. Unilever Corporate
Relations, The Netherlands.
Urban, G.L, Hauser, J.R. (eds) (1993) Design andMarketing of New Products, 2nd edn. Prentice-Hall,
London.
van Trijp, H.J.C.M. (1999) Consumer Understanding as
Inspiration for Innovation, Nordic Conference,
Nordic Food Conference, Norway.
van Trijp, H.J.C.M. and Steenkamp, J.-B.E.M. (1998)
Consumer-oriented new product development: prin-
ciples and practice. In: Jongen, W.M.F. and
Meulenberg, M.T.G. (eds) Innovation of the FoodProduction Systems. Wageningen, 37–66.
van Vliet, R. (1998) Introduction. In: Senker, I. and van
Vliet, R. (eds) Biotechnology and CompetitiveAdvantage. Edward Elgar Publishing Ltd, USA.
Wheelwright, S.M. (1994) Commercializing biotech
products. Bio/Technology 12, 877–880.
Whitelaw, B. (1999) Towards designer milk. NatureBiotechnology 17, 135–136.
Wohl, J.B. (1998) Consumers decision-making and risk
perception regarding foods produced with biotech-
nology. Journal of Consumer Policy 21, 387–404.
Wymer, P. (ed.) (2000) The Application of GeneticallyModified Lactic Bacteria in Food Products in Europe,the reports of a workshop. Cambridge Biochemical
Consultants, Vlaardigen, The Netherlands.
Zechendorf, B. (1994) What the public thinks about
biotechnology. Bio/Technology 12, 870–875.
A Consumer-based Approach towards New Product Development 75

Appendix: Translation of Product Features derived with the help of Genetic Manipulation Technology in Attributes and Benefits.Examples related to Plant, Food and Dairy Production.
Table A1. Translation of product features derived from genetic engineering techniques, into attributes and benefits: examples related to plant production.
Biotechnological feature, Attribute derived by possibility How applied in product new feature Benefits
Implantation of genes Insertion of gene (Cry III) to make Colorado-resistant Beetle control Æ less chemical residues Æ environmentally friendly (P, C)potatoes to produce toxin to kill potatoes Beetle control Æ crop protection Æ fewer losses Æ cost reduction Colorado beetle and yield enhancement (F)
Isolation and implantation Isolation and implantation Starch-modified potatoes Increased carbohydrate content Æ more solid content in potatoes Æof genes of genes in potatoes to increase reduced cooking time Æ convenience (C)
solid content Increased solid content Æ better cooking performance Æ convenience (C)Increased carbohydrate content Æ low calories Æ prevent overweight Æhealth (C)No postharvest damage Æ reduce transport costs (F, R)
Implantation of toxic proteins Insecticide (borer) proteins from Insect-resistant cereals Crop protection Æ less damage Æ low cost Æ better product quality in Bt implanted in cereals in order marginal areas (F) to make them resistant to insects
Enzymes coded by gene parts Enzymes made herbicide-resistant Herbicide-resistant cereals Lower herbicide amount to plants Æ environmentally friendly (P, C)cereals by gene-coding Lower chemical residues to the plant Æ improve quality Æ more natural
product Æ health (C)Pre-emergence applications Æ prevent devastation Æ lower damage Æ lower costs Æ enhance yields Æ more efficient production (F)
Implantation of bacterial gene To moderate the carotenoid Increased production of Increased production of b-carotene Æ tomatoes with more provitamin A Æbiosynthesis provitamin A in tomatoes more nutrients Æ enhance health (C)
Modification of the tobacco To enhance phosphorus uptake Plants which utilize P is more available to the plant Æ less P is wasted Æ plants able to grow in genome phosphorus more difficult soil conditions Æ lower costs on fertilizers (F)
efficiently Less P wasted Æ less soil pollution (C)
Implantation of genes Seed storage protein ‘Beta Increased protein level rice Increased protein level Æ more nutritious rice (C)phaseolin’ implanted in rice
76N
.M. Spetsidis and G
. Schamel
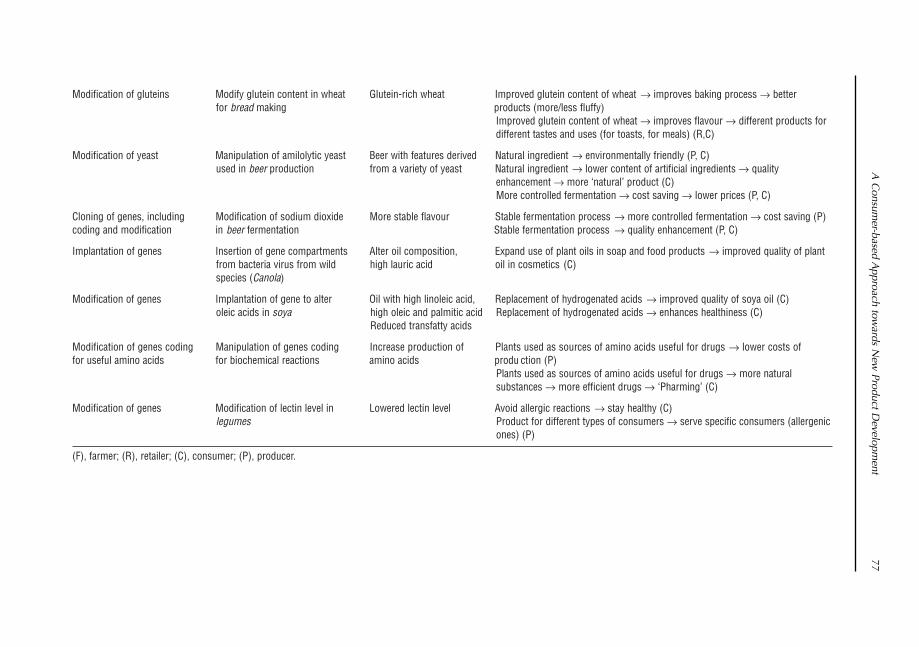
Modification of gluteins Modify glutein content in wheat Glutein-rich wheat Improved glutein content of wheat Æ improves baking process Æ better for bread making products (more/less fluffy)
Improved glutein content of wheat Æ improves flavour Æ different products fordifferent tastes and uses (for toasts, for meals) (R,C)
Modification of yeast Manipulation of amilolytic yeast Beer with features derived Natural ingredient Æ environmentally friendly (P, C)used in beer production from a variety of yeast Natural ingredient Æ lower content of artificial ingredients Æ quality
enhancement Æ more ‘natural’ product (C)More controlled fermentation Æ cost saving Æ lower prices (P, C)
Cloning of genes, including Modification of sodium dioxide More stable flavour Stable fermentation process Æ more controlled fermentation Æ cost saving (P)coding and modification in beer fermentation Stable fermentation process Æ quality enhancement (P, C)
Implantation of genes Insertion of gene compartments Alter oil composition, Expand use of plant oils in soap and food products Æ improved quality of plant from bacteria virus from wild high lauric acid oil in cosmetics (C)species (Canola)
Modification of genes Implantation of gene to alter Oil with high linoleic acid, Replacement of hydrogenated acids Æ improved quality of soya oil (C)oleic acids in soya high oleic and palmitic acid Replacement of hydrogenated acids Æ enhances healthiness (C)
Reduced transfatty acids
Modification of genes coding Manipulation of genes coding Increase production of Plants used as sources of amino acids useful for drugs Æ lower costs of for useful amino acids for biochemical reactions amino acids produ ction (P)
Plants used as sources of amino acids useful for drugs Æ more natural substances Æ more efficient drugs Æ ‘Pharming’ (C)
Modification of genes Modification of lectin level in Lowered lectin level Avoid allergic reactions Æ stay healthy (C)legumes Product for different types of consumers Æ serve specific consumers (allergenic
ones) (P)
(F), farmer; (R), retailer; (C), consumer; (P), producer.
A C
onsumer-based A
pproach towards N
ew Product D
evelopment
77

Table A2. Translation of product features, derived from genetic engineering techniques, into attributes and benefits: examples related to vegetables and fruits.
Biotechnology feature Attribute derived bypossibility How applied the new feature Benefits
Implantation of foreign agents Implantation of bacteria and virus Thicker skin tomatoes Enhanced process value Æ possibility to store longer Æ lower transport to alter pectin in tomatoes costs Æ lower losses (P, R)
Stable quality Æ reduced energy costs Æ reduced cost of paste (P) Æ lowerprices of paste (C)Prevent softening of skin Æ better cooking performance (C)Longer shelf-life Æ convenience (C, R)Improved flavour Æ superior taste (C)
Manipulation of genes Identification and modification of Delayed ripening tomatoes Longer (storage) shelf-life Æ convenience (R, C)TOM 41 gene in tomatoes Improved flavour Æ improved taste Æ improved cooking performance (C)
Resistant to postharvest pathogens Æ improved quality Æ lower product loses (F, P, R)
Selection of strains of potatoes Identification and implantation of Plants to produce Natural non-carbohydrate-containing sweetener Æ suitable for dietetic to produce extra amounts of relevant genes to host plants thaumatin products (diabetes) Æ promote health Æ avoid allergies (C)thaumatin (sweetener) Not only potatoes to produce Th. Æ expansion of this cultivation outside
Africa (P)
Manipulation of genes Modification of relative gene in Long-life strawberries Longer shelf-life Æ convenience (C, R) strawberries Longer storage life Æ fewer losses to the market (P, R)
(F), farmer; (R), retailer; (C), consumer; (P), producer.
78N
.M. Spetsidis and G
. Schamel
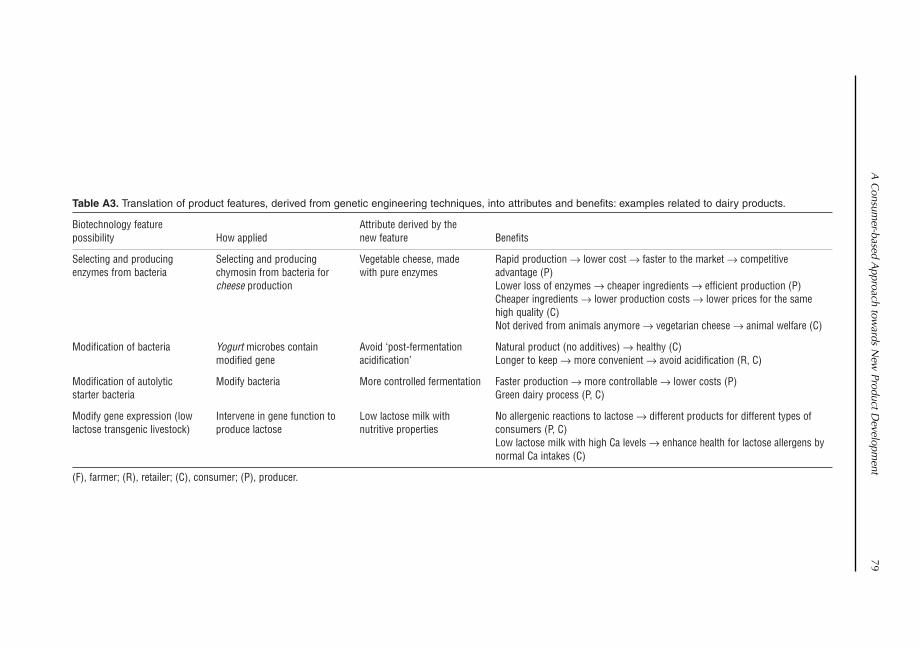
Table A3. Translation of product features, derived from genetic engineering techniques, into attributes and benefits: examples related to dairy products.
Biotechnology feature Attribute derived by thepossibility How applied new feature Benefits
Selecting and producing Selecting and producing Vegetable cheese, made Rapid production Æ lower cost Æ faster to the market Æ competitive enzymes from bacteria chymosin from bacteria for with pure enzymes advantage (P)
cheese production Lower loss of enzymes Æ cheaper ingredients Æ efficient production (P)Cheaper ingredients Æ lower production costs Æ lower prices for the same high quality (C)Not derived from animals anymore Æ vegetarian cheese Æ animal welfare (C)
Modification of bacteria Yogurt microbes contain Avoid ‘post-fermentation Natural product (no additives) Æ healthy (C) modified gene acidification’ Longer to keep Æ more convenient Æ avoid acidification (R, C)
Modification of autolytic Modify bacteria More controlled fermentation Faster production Æ more controllable Æ lower costs (P) starter bacteria Green dairy process (P, C)
Modify gene expression (low Intervene in gene function to Low lactose milk with No allergenic reactions to lactose Æ different products for different types of lactose transgenic livestock) produce lactose nutritive properties consumers (P, C)
Low lactose milk with high Ca levels Æ enhance health for lactose allergens bynormal Ca intakes (C)
(F), farmer; (R), retailer; (C), consumer; (P), producer.
A C
onsumer-based A
pproach towards N
ew Product D
evelopment
79

Introduction
The compound bovine somatotropin (bST) hasbeen commercially available to US dairy producerssince February 1994. Before being approved for sale,bST was subjected to years of investigation and test-ing. Given the large production response per cowthat most of these tests reported, bST was generallyprojected to be profitable for dairy farmers, withestimates often exceeding US$100 year–1 per cow(Butler, 1992), although some projected little or noprofit (Marion and Wills, 1990). Now that bST hasbeen used by US farmers for a number of years, it ispossible to estimate their actual production andprofit responses.
Bovine somatotropin is a hormone producedby the dairy cow that regulates milk production.The genetic material for this compound has beenisolated and is produced by recombinant biotech-nology. This recombinant-produced bovine soma-totropin can then be injected into the dairy cow toaugment her naturally produced levels of this hor-mone, enhancing milk production, but requiringadditional feed and other inputs to increase milkproduction. Monsanto (www.monsanto.com/dairy/) is currently the only US supplier of recombi-nant bST under the registered tradename POSI-LAC. As of 11 May 1999, Monsanto stated that13,000 dairy producers were using bST, and of thenearly 9 million dairy cows in the US, approximate-
ly 30% of the cows are in herds that are supple-mented with POSILAC.
Tauer and Knoblauch (1997) used data fromthe same 259 New York producers in 1993 and1994 to estimate the impact of bST on milk pro-duction per cow and return above variable cost percow. bST was not available in 1993, but one-third ofthese farmers used bST in 1994. The use of bST hada positive and statistically significant impact on aver-age production per cow (a = 0.01), but the profiteffect, although positive and large, was not statisti-cally different from zero (a = 0.14).
Stefanides and Tauer (1999) also analysed theproduction and profit effects using the same datasource, but included data from 1995, resulting in apanel data set of 211 farms. They corrected for self-selection bias by using the two-step Heckmanapproach, and estimated a probit adoption functionfor each year (Greene, 1997). They likewise found astatistically significant and positive effect on milkproduction per cow from the use of bST, but foundthat the impact of bST on profits was statisticallyzero. They suggest that farmers may still be learninghow to use bST profitably, or that such a large num-ber of farmers are using bST, including those gettinga low return, that the average farm is not making aprofit from its use.
Nonetheless, there may still be a subset offarmers earning a positive return from the use ofbST. These farmers may either have been the most
81
7 The Impact of Bovine Somatotropin onFarm Profits
Loren W. TauerCornell University, Ithaca, New York, USA
© CAB International 2002. Market Development for Genetically Modified Foods(eds V. Santaniello, R.E. Evenson and D. Zilberman)
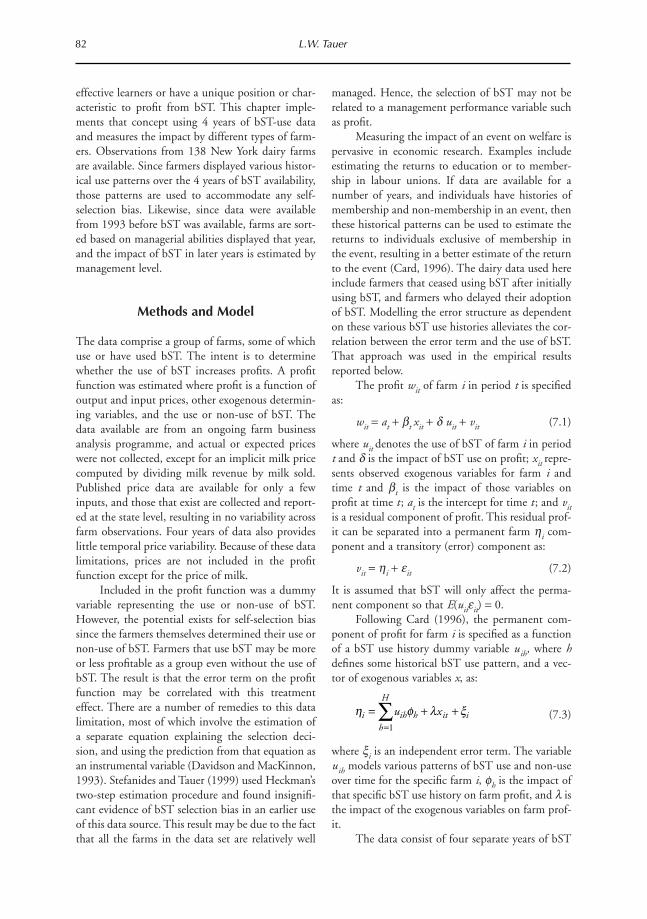
effective learners or have a unique position or char-acteristic to profit from bST. This chapter imple-ments that concept using 4 years of bST-use dataand measures the impact by different types of farm-ers. Observations from 138 New York dairy farmsare available. Since farmers displayed various histor-ical use patterns over the 4 years of bST availability,those patterns are used to accommodate any self-selection bias. Likewise, since data were availablefrom 1993 before bST was available, farms are sort-ed based on managerial abilities displayed that year,and the impact of bST in later years is estimated bymanagement level.
Methods and Model
The data comprise a group of farms, some of whichuse or have used bST. The intent is to determinewhether the use of bST increases profits. A profitfunction was estimated where profit is a function ofoutput and input prices, other exogenous determin-ing variables, and the use or non-use of bST. Thedata available are from an ongoing farm businessanalysis programme, and actual or expected priceswere not collected, except for an implicit milk pricecomputed by dividing milk revenue by milk sold.Published price data are available for only a fewinputs, and those that exist are collected and report-ed at the state level, resulting in no variability acrossfarm observations. Four years of data also provideslittle temporal price variability. Because of these datalimitations, prices are not included in the profitfunction except for the price of milk.
Included in the profit function was a dummyvariable representing the use or non-use of bST.However, the potential exists for self-selection biassince the farmers themselves determined their use ornon-use of bST. Farmers that use bST may be moreor less profitable as a group even without the use ofbST. The result is that the error term on the profitfunction may be correlated with this treatmenteffect. There are a number of remedies to this datalimitation, most of which involve the estimation ofa separate equation explaining the selection deci-sion, and using the prediction from that equation asan instrumental variable (Davidson and MacKinnon,1993). Stefanides and Tauer (1999) used Heckman’stwo-step estimation procedure and found insignifi-cant evidence of bST selection bias in an earlier useof this data source. This result may be due to the factthat all the farms in the data set are relatively well
managed. Hence, the selection of bST may not berelated to a management performance variable suchas profit.
Measuring the impact of an event on welfare ispervasive in economic research. Examples includeestimating the returns to education or to member-ship in labour unions. If data are available for anumber of years, and individuals have histories ofmembership and non-membership in an event, thenthese historical patterns can be used to estimate thereturns to individuals exclusive of membership inthe event, resulting in a better estimate of the returnto the event (Card, 1996). The dairy data used hereinclude farmers that ceased using bST after initiallyusing bST, and farmers who delayed their adoptionof bST. Modelling the error structure as dependenton these various bST use histories alleviates the cor-relation between the error term and the use of bST.That approach was used in the empirical resultsreported below.
The profit wit of farm i in period t is specifiedas:
wit = at + bt xit + d uit + vit (7.1)
where uit denotes the use of bST of farm i in periodt and d is the impact of bST use on profit; xit repre-sents observed exogenous variables for farm i andtime t and bt is the impact of those variables onprofit at time t ; at is the intercept for time t ; and vitis a residual component of profit. This residual prof-it can be separated into a permanent farm hi com-ponent and a transitory (error) component as:
vit = hi + eit (7.2)
It is assumed that bST will only affect the perma-nent component so that E(uiteit) = 0.
Following Card (1996), the permanent com-ponent of profit for farm i is specified as a functionof a bST use history dummy variable uih, where hdefines some historical bST use pattern, and a vec-tor of exogenous variables x, as:
(7.3)
where xi is an independent error term. The variableuih models various patterns of bST use and non-useover time for the specific farm i, fh is the impact ofthat specific bST use history on farm profit, and l isthe impact of the exogenous variables on farm prof-it.
The data consist of four separate years of bST
82 L.W. Tauer
h f l xi ih h it ih
H
u x= + +=
Â1
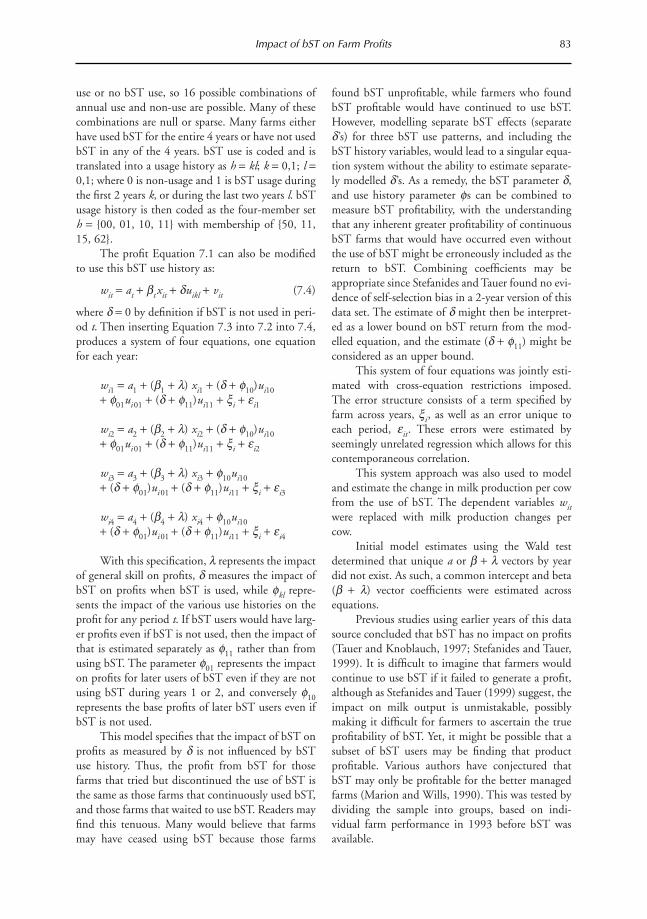
use or no bST use, so 16 possible combinations ofannual use and non-use are possible. Many of thesecombinations are null or sparse. Many farms eitherhave used bST for the entire 4 years or have not usedbST in any of the 4 years. bST use is coded and istranslated into a usage history as h = kl; k = 0,1; l =0,1; where 0 is non-usage and 1 is bST usage duringthe first 2 years k, or during the last two years l. bSTusage history is then coded as the four-member seth = {00, 01, 10, 11} with membership of {50, 11,15, 62}.
The profit Equation 7.1 can also be modifiedto use this bST use history as:
wit = at + bt xit + duikl + vit (7.4)
where d = 0 by definition if bST is not used in peri-od t. Then inserting Equation 7.3 into 7.2 into 7.4,produces a system of four equations, one equationfor each year:
wi1 = a1 + (b1 + l) xi1 + (d + f10)ui10
+ f01ui 01 + (d + f11)ui11 + xi + ei1
wi2 = a2 + (b2 + l) xi2 + (d + f10)ui10
+ f01ui 01 + (d + f11)ui11 + xi + ei2
wi3 = a3 + (b3 + l) xi3 + f10ui10
+ (d + f01)ui 01 + (d + f11)ui11 + xi + ei3
wi4 = a4 + (b4 + l) xi4 + f10ui10
+ (d + f01)ui 01 + (d + f11)ui11 + xi + ei4
With this specification, l represents the impactof general skill on profits, d measures the impact ofbST on profits when bST is used, while fkl repre-sents the impact of the various use histories on theprofit for any period t. If bST users would have larg-er profits even if bST is not used, then the impact ofthat is estimated separately as f11 rather than fromusing bST. The parameter f01 represents the impacton profits for later users of bST even if they are notusing bST during years 1 or 2, and conversely f10
represents the base profits of later bST users even ifbST is not used.
This model specifies that the impact of bST onprofits as measured by d is not influenced by bSTuse history. Thus, the profit from bST for thosefarms that tried but discontinued the use of bST isthe same as those farms that continuously used bST,and those farms that waited to use bST. Readers mayfind this tenuous. Many would believe that farmsmay have ceased using bST because those farms
found bST unprofitable, while farmers who foundbST profitable would have continued to use bST.However, modelling separate bST effects (separated’s) for three bST use patterns, and including thebST history variables, would lead to a singular equa-tion system without the ability to estimate separate-ly modelled d’s. As a remedy, the bST parameter d,and use history parameter fs can be combined tomeasure bST profitability, with the understandingthat any inherent greater profitability of continuousbST farms that would have occurred even withoutthe use of bST might be erroneously included as thereturn to bST. Combining coefficients may beappropriate since Stefanides and Tauer found no evi-dence of self-selection bias in a 2-year version of thisdata set. The estimate of d might then be interpret-ed as a lower bound on bST return from the mod-elled equation, and the estimate (d + f11) might beconsidered as an upper bound.
This system of four equations was jointly esti-mated with cross-equation restrictions imposed.The error structure consists of a term specified byfarm across years, xi, as well as an error unique toeach period, eit. These errors were estimated byseemingly unrelated regression which allows for thiscontemporaneous correlation.
This system approach was also used to modeland estimate the change in milk production per cowfrom the use of bST. The dependent variables witwere replaced with milk production changes percow.
Initial model estimates using the Wald testdetermined that unique a or b + l vectors by yeardid not exist. As such, a common intercept and beta(b + l) vector coefficients were estimated acrossequations.
Previous studies using earlier years of this datasource concluded that bST has no impact on profits(Tauer and Knoblauch, 1997; Stefanides and Tauer,1999). It is difficult to imagine that farmers wouldcontinue to use bST if it failed to generate a profit,although as Stefanides and Tauer (1999) suggest, theimpact on milk output is unmistakable, possiblymaking it difficult for farmers to ascertain the trueprofitability of bST. Yet, it might be possible that asubset of bST users may be finding that productprofitable. Various authors have conjectured thatbST may only be profitable for the better managedfarms (Marion and Wills, 1990). This was tested bydividing the sample into groups, based on indi-vidual farm performance in 1993 before bST wasavailable.
Impact of bST on Farm Profits 83

Data
The data were from the New York Dairy FarmBusiness Summary Program (Knoblauch andPutnam, 1998). This is a record collection andanalysis project primarily meant to assist dairy farm-ers in managing their operations. Farmers receive abusiness analysis of their farm and benchmark per-formance measures from combined participants.Farm analysis is done temporally if farmers partici-pate annually. For the 5-year period of 1993–1997,a total of 138 farms participated every year. Thisprovides the data set for the empirical analysis withdata from 1993 used to sort farms, and bST impactsmeasured with data from 1994 to 1997.
This is not a random sample. It represents apopulation of farmers that actively participate inagricultural extension and research programmes. Itwould be tenuous to make inferences for the gener-al population of dairy farms. The farms in this sam-ple are larger on average than New York dairy farmsand they experience higher levels of production percow. Yet, there is a significant amount of hetereo-geneity in the data. The smallest farm has only 29cows, while the largest has over 2000 cows. Theaverage number of cows is 165 (standard deviationof 236).
Variable specification is consistent with theannual Dairy Farm Business Summary (DFBS)Report (Knoblauch and Putnam, 1998). Productionper cow is the total milk sold for the year divided bythe reported average number of dairy cows. Short-run profit is measured as milk receipts minus theoperating costs of producing milk. Operating costincludes variable costs, and excludes fixed cost itemssuch as depreciation. If bST does increase farm rev-enue, farmers may use that additional revenue topurchase additional equipment not necessary forbST use, increasing computed depreciation, which
would mute the measured impact of bST on profits.To be included in this published data set, milkreceipts must constitute at least 90% of total farmreceipts, yet some culled cows, calves, and excessfeed were sold each year. Those receipt items weresubtracted from total operating costs to estimate theoperating costs of producing milk. This calculationassumes that the cost of producing products otherthan milk was equal to the value of those products.Although not necessarily true, detailed cost accountswere not collected by enterprise or receipt source.
Many of these farms are multiple owned oper-ations, mostly parent–child. This was coded as 1 ifmultiple owned, 0 otherwise. Since there are multi-ple operators, age and education of the first manag-er were used. Education was coded as 1 if more thana high school education, 0 otherwise. Age was meas-ured in years. Milking system was coded as a 1 ifparlour, 0 if stanchion. Milk price was computed asgross milk receipts divided by the quantity of milksold during the year. Finally, cows are the averagenumber of cows the farm reported for the year. Theaverage and standard deviation of these data arereported in Table 7.1.
As stated in the model section, farmers werecoded as either using bST or not using bST duringthe first 2 years and then the last 2 years of bSTavailability. The DFBS surveys for each of the 4years asked farmers to indicate their use of bST inone of five categories as (0) not used at all, (1)stopped using it during the year, (2) used on lessthan 25% of the herd, (3) used on 25–75% of theherd, or (4) used on more than 75% of the herd.Most responses over the period were in categories 0and 3. Very few farms indicated that they used it onmore than 75% of the herd, and if they did duringone of the years, the other years they typicallydropped back to using it on 25–75% of the herd.Likewise, few farms used it on less than 25% of the
84 L.W. Tauer
Table 7.1. Definition of variables.
Variables Definition Mean 1993 SD 1993
SRPCOW Short-run profit per cow US$603 US$325MILKCOW Milk production per cow (kg) 8577 1180COWS Average number of cows 165 236MILKPR Milk price per cwt US$13.20 US$0.52AGE Age of principal owner in years 46 10BUS_ORG Business organization, 1 if multiple owner 0.41 0.04EDUC Education, 1 if more than high school 0.54 0.04MILK_SYS Milking system, 1 if parlour 0.53 0.04
N = 138 observations.
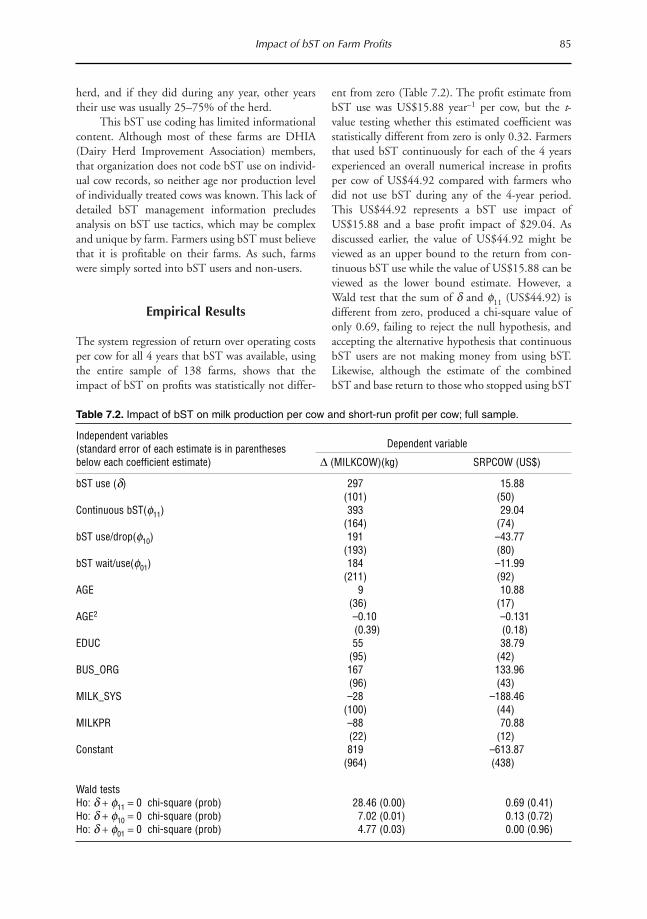
herd, and if they did during any year, other yearstheir use was usually 25–75% of the herd.
This bST use coding has limited informationalcontent. Although most of these farms are DHIA(Dairy Herd Improvement Association) members,that organization does not code bST use on individ-ual cow records, so neither age nor production levelof individually treated cows was known. This lack ofdetailed bST management information precludesanalysis on bST use tactics, which may be complexand unique by farm. Farmers using bST must believethat it is profitable on their farms. As such, farmswere simply sorted into bST users and non-users.
Empirical Results
The system regression of return over operating costsper cow for all 4 years that bST was available, usingthe entire sample of 138 farms, shows that theimpact of bST on profits was statistically not differ-
ent from zero (Table 7.2). The profit estimate frombST use was US$15.88 year–1 per cow, but the t-value testing whether this estimated coefficient wasstatistically different from zero is only 0.32. Farmersthat used bST continuously for each of the 4 yearsexperienced an overall numerical increase in profitsper cow of US$44.92 compared with farmers whodid not use bST during any of the 4-year period.This US$44.92 represents a bST use impact ofUS$15.88 and a base profit impact of $29.04. Asdiscussed earlier, the value of US$44.92 might beviewed as an upper bound to the return from con-tinuous bST use while the value of US$15.88 can beviewed as the lower bound estimate. However, aWald test that the sum of d and f11 (US$44.92) isdifferent from zero, produced a chi-square value ofonly 0.69, failing to reject the null hypothesis, andaccepting the alternative hypothesis that continuousbST users are not making money from using bST.Likewise, although the estimate of the combinedbST and base return to those who stopped using bST
Impact of bST on Farm Profits 85
Table 7.2. Impact of bST on milk production per cow and short-run profit per cow; full sample.
Independent variables(standard error of each estimate is in parentheses Dependent variable
below each coefficient estimate) D (MILKCOW)(kg) SRPCOW (US$)
bST use (d) 297 15.88(101) (50)
Continuous bST(f11) 393 29.04(164) (74)
bST use/drop(f10) 191 –43.77(193) (80)
bST wait/use(f01) 184 –11.99(211) (92)
AGE 9 10.88(36) (17)
AGE2 –0.10 –0.131(0.39) (0.18)
EDUC 55 38.79(95) (42)
BUS_ORG 167 133.96(96) (43)
MILK_SYS –28 –188.46(100) (44)
MILKPR –88 70.88(22) (12)
Constant 819 –613.87(964) (438)
Wald tests Ho: d + f11 = 0 chi-square (prob) 28.46 (0.00) 0.69 (0.41)Ho: d + f10 = 0 chi-square (prob) 7.02 (0.01) 0.13 (0.72)Ho: d + f01 = 0 chi-square (prob) 4.77 (0.03) 0.00 (0.96)

was a negative US$28, and the estimate of the com-bined bST and base return to the wait/use sequencewas a positive US$4, neither of these estimates wasstatistically different from zero by Wald tests.
Although bST does not appear to be profitableon average for the types of farmers this sample rep-resents, bST does increase milk output per cow.Knoblauch and Putnam (1998) report that DFBSfarms using bST increased milk sold per cow from9187 kg in 1993, before bST was available, to10,469 kg in 1997. In contrast, farms not using bSTsold 7905 kg per cow in 1993 and 7778 kg in 1997.This pattern suggests that the difference in milksales each year from the base year of 1993 ratherthan level values of milk sold per cow should bedefined as the regressand. The difference in milkproduced per cow from the base year of 1993 wasregressed on the same independent variables used inthe profit equation. The bST impact was estimatedto be 296 kg year–1, and with a t-value of 2.93, wasstatistically different from zero. This is the increasein the herd average and includes cows that may nothave been treated with bST at all during the period.Farmers that used bST continuously for each of the4 years experienced an increase in milk productionper cow of 689 kg year–1 compared with farmerswho did not use bST during any of the 4-year peri-od (Table 7.2). This 689 kg year–1 represents a bSTimpact of 296 kg year–1 and a base impact of 393 kgyear–1. Farms that used bST during the early part ofthe 4-year period, but discontinued during the lastpart of the 4-year period, experienced an overallresponse of 486 kg year–1, while farmers that waitedto use bST for the second half of the 4-year periodexperienced an overall response of 480 kg year–1.
These results support the earlier estimates ofTauer and Knoblauch (1997), and Stefanides andTauer (1999) that bST has a measurable and signif-icant impact on output per cow, but has no statisti-cally significant impact on profits per cow. Withmore experience, bST may spawn a larger milk out-put response, supporting the assertion that learninghas occurred, but that learning only vaguely appearsto translate into greater profits, since the bST usecoefficients on the profit equation have high relativestandard errors. Yet, some individual producersmight be making money from using bST. To identi-fy these farmers, the next section divides the sampleinto sub-samples based on various metrics used tomeasure management and performance amongdairy farmers, to determine if better managers aremaking money from the use of bST.
Empirical Results of Sub-samples
One measure of managerial performance is profit.Return above operating costs is the statistic used tomeasure the impact of bST on profits per cow, andis used to sort farms into one of three manageriallevels. Return above operating cost from 1993, theyear before bST was available, is used to sort the 138farms into three groups of 46 farms from lowest tothe highest return.
Since profit per cow is transient by year, withfew benchmarks for comparisons, two other proxiesfor management were used to sort the farms. Onemeasure is milk sold per cow. It is generallyacknowledged that better managed farms have high-er output per cow. It is also a variable that is easilymeasured and commonly collected. It does havelimitations. Production per cow may be low notonly because of poor feeding and managing of thecow, but also because of low genetic potential of theherd. Although the selection and use of inferiorgenetics might be viewed as the consequence of poormanagement, the herd might be optimally managedsubject to that genetic resource. This has implica-tions for measuring the impact of bST, since testresults have shown that even cows with mediocregenetics can respond to the use of bST if they are fedand managed optimally (Patton and Heald, 1992).Since bST is known to increase output per cow, the138 farms were sorted into three groups based onmilk per cow from the year 1993 when bST was notyet available. The group ranges were 5463–8153 kgper cow for the low group, 8159–9157 kg for themiddle group, and 9161–11,088 kg for the highgroup.
Although not a direct measure of management,many believe that larger farms on average are bettermanaged, or at least have the opportunity to benefitthe most from the use of bST. Although small farmsmay be able to provide more individual attention tocows, correct feeding is important to effectively usebST, and larger farms are more apt to have state-of-the-art feeding facilities. This has policy implica-tions since if larger farms benefit more from bST, ina competitive environment there will be additionalpressure on the ability of the small dairy farm to sur-vive (Tauer, 1992). Size as measured by the numberof dairy cows is also an easily measured and report-ed statistic. Here the farms were again separated intothree equal size groups of 46 farms based upon theaverage number of dairy cows during the year 1993.The groups’ ranges were 29–71 cows for the small
86 L.W. Tauer

farm, 71–139 cows for the medium farm, and 139to over 2000 cows for the large farm size, althoughmost of the large farms in the sample had fewer than250 cows.
The regression results, reported in Table 7.3 bysorting by profitability in 1993, show that the use ofbST has no statistical impact on profits per cowregardless of the previous (inherent) profitability ofthe farm. Although the low profit per cow farmsexperienced a positive numerical return to bST(US$49.47), and the use of bST on higher profit percow farms generated negative profits, the standarderrors on these estimates are so large that statistical-ly one might conclude that the effect is zero profitresponse across all profit levels. Combining the bSTimpact coefficient with the various bST use historycoefficients produces combined coefficients whichare also not statistically different from zero, as deter-mined by the individual Wald tests in Table 7.3,
except for possibly the high managed farms whichmake US$124 per cow using bST (a = 0.20).
The regression results from the sort based onmilk production per cow in 1993 exhibits an inter-esting pattern (Table 7.4). On the low productionper cow farms, bST use increases milk productionper cow by 419 kg year–1, statistically different fromzero. On the middle production per cow farms, bSTuse increases milk production per cow by 575 kgyear–1, again statistically different from zero. But onthe high production farms, bST use appears to haveno statistical impact on production per cow. Theseresults support previous experimental results thatlow producing cows respond to bST (Patton andHeald, 1992). If base production effects are foldedinto the bST impact coefficients, then Wald testsshow that all continuous bST users experience posi-tive output effects from bST use, even on high pro-duction farms. On low production farms, that is
Impact of bST on Farm Profits 87
Table 7.3. Impact of bST on short-run profit per cow; sample sorted by profitability.
Independent variables(standard error of each estimate is in Profit per cow (US$)
parentheses below each coefficient estimate) Low Middle High
bST use (d) 49.47 –27.13 –11.68(84) (73) (97)
Continuous bST(f11) –67.04 –8.56 135.43(114) (86) (137)
bST use/drop(f10) –17.49 –114.71 24.21(97) (83) (151)
bST wait/use(f01) 50.31 –48.78 27.77(123) (71) (231)
AGE 16.17 –7.47 –41.35(21) (25) (32)
AGE2 –0.21 0.05 0.41(0.22) (0.26) (0.32)
EDUC 84.17 73.6 40.58(59) (38) (76)
BUS_ORG 43.47 38.61 59.33(58) (47) (77)
MILK_SYS 21.21 –12.91 –252.23(68) (45) (76)
MILKPR 102.23 37.01 42.29(21) (15) (21)
Constant –1349 192 1193(594) (619) (785)
Wald tests Ho: d + f11 = 0 chi-square (prob) 0.06 (0.81) 0.58 (0.44) 1.67 (0.20)Ho: d + f10 = 0 chi-square (prob) 0.12 (0.73) 3.55 (0.06) 0.01 (0.93)Ho: d + f01 = 0 chi-square (prob) 0.64 (0.42) 0.95 (0.33) 0.01 (0.94)
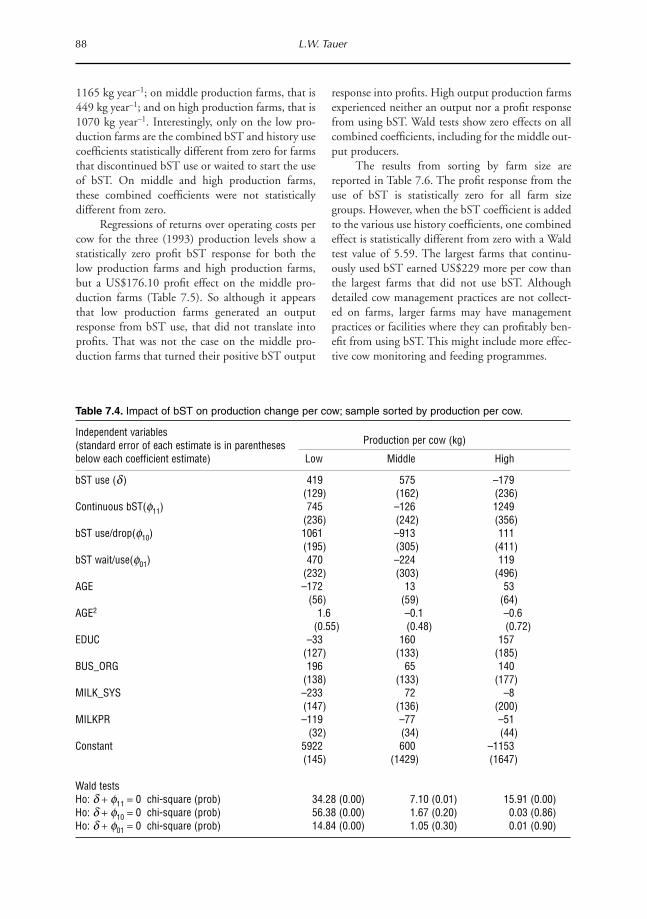
1165 kg year–1; on middle production farms, that is449 kg year–1; and on high production farms, that is1070 kg year–1. Interestingly, only on the low pro-duction farms are the combined bST and history usecoefficients statistically different from zero for farmsthat discontinued bST use or waited to start the useof bST. On middle and high production farms,these combined coefficients were not statisticallydifferent from zero.
Regressions of returns over operating costs percow for the three (1993) production levels show astatistically zero profit bST response for both thelow production farms and high production farms,but a US$176.10 profit effect on the middle pro-duction farms (Table 7.5). So although it appearsthat low production farms generated an outputresponse from bST use, that did not translate intoprofits. That was not the case on the middle pro-duction farms that turned their positive bST output
response into profits. High output production farmsexperienced neither an output nor a profit responsefrom using bST. Wald tests show zero effects on allcombined coefficients, including for the middle out-put producers.
The results from sorting by farm size arereported in Table 7.6. The profit response from theuse of bST is statistically zero for all farm sizegroups. However, when the bST coefficient is addedto the various use history coefficients, one combinedeffect is statistically different from zero with a Waldtest value of 5.59. The largest farms that continu-ously used bST earned US$229 more per cow thanthe largest farms that did not use bST. Althoughdetailed cow management practices are not collect-ed on farms, larger farms may have managementpractices or facilities where they can profitably ben-efit from using bST. This might include more effec-tive cow monitoring and feeding programmes.
88 L.W. Tauer
Table 7.4. Impact of bST on production change per cow; sample sorted by production per cow.
Independent variables(standard error of each estimate is in parentheses Production per cow (kg)
below each coefficient estimate) Low Middle High
bST use (d ) 419 575 –179(129) (162) (236)
Continuous bST(f11) 745 –126 1249(236) (242) (356)
bST use/drop(f10) 1061 –913 111(195) (305) (411)
bST wait/use(f01) 470 –224 119(232) (303) (496)
AGE –172 13 53(56) (59) (64)
AGE2 1.6 –0.1 –0.6(0.55) (0.48) (0.72)
EDUC –33 160 157(127) (133) (185)
BUS_ORG 196 65 140(138) (133) (177)
MILK_SYS –233 72 –8(147) (136) (200)
MILKPR –119 –77 –51(32) (34) (44)
Constant 5922 600 –1153(145) (1429) (1647)
Wald tests Ho: d + f11 = 0 chi-square (prob) 34.28 (0.00) 7.10 (0.01) 15.91 (0.00)Ho: d + f10 = 0 chi-square (prob) 56.38 (0.00) 1.67 (0.20) 0.03 (0.86)Ho: d + f01 = 0 chi-square (prob) 14.84 (0.00) 1.05 (0.30) 0.01 (0.90)
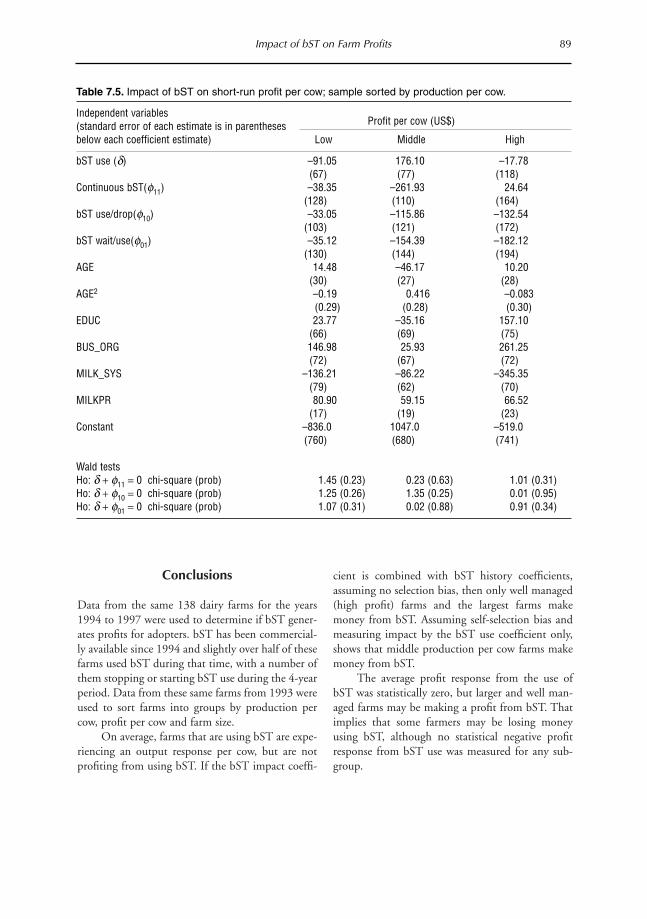
Conclusions
Data from the same 138 dairy farms for the years1994 to 1997 were used to determine if bST gener-ates profits for adopters. bST has been commercial-ly available since 1994 and slightly over half of thesefarms used bST during that time, with a number ofthem stopping or starting bST use during the 4-yearperiod. Data from these same farms from 1993 wereused to sort farms into groups by production percow, profit per cow and farm size.
On average, farms that are using bST are expe-riencing an output response per cow, but are notprofiting from using bST. If the bST impact coeffi-
cient is combined with bST history coefficients,assuming no selection bias, then only well managed(high profit) farms and the largest farms makemoney from bST. Assuming self-selection bias andmeasuring impact by the bST use coefficient only,shows that middle production per cow farms makemoney from bST.
The average profit response from the use ofbST was statistically zero, but larger and well man-aged farms may be making a profit from bST. Thatimplies that some farmers may be losing moneyusing bST, although no statistical negative profitresponse from bST use was measured for any sub-group.
Impact of bST on Farm Profits 89
Table 7.5. Impact of bST on short-run profit per cow; sample sorted by production per cow.
Independent variables(standard error of each estimate is in parentheses Profit per cow (US$)
below each coefficient estimate) Low Middle High
bST use (d) –91.05 176.10 –17.78(67) (77) (118)
Continuous bST(f11) –38.35 –261.93 24.64(128) (110) (164)
bST use/drop(f10) –33.05 –115.86 –132.54(103) (121) (172)
bST wait/use(f01) –35.12 –154.39 –182.12(130) (144) (194)
AGE 14.48 –46.17 10.20(30) (27) (28)
AGE2 –0.19 0.416 –0.083(0.29) (0.28) (0.30)
EDUC 23.77 –35.16 157.10(66) (69) (75)
BUS_ORG 146.98 25.93 261.25(72) (67) (72)
MILK_SYS –136.21 –86.22 –345.35(79) (62) (70)
MILKPR 80.90 59.15 66.52(17) (19) (23)
Constant –836.0 1047.0 –519.0(760) (680) (741)
Wald tests Ho: d + f11 = 0 chi-square (prob) 1.45 (0.23) 0.23 (0.63) 1.01 (0.31)Ho: d + f10 = 0 chi-square (prob) 1.25 (0.26) 1.35 (0.25) 0.01 (0.95)Ho: d + f01 = 0 chi-square (prob) 1.07 (0.31) 0.02 (0.88) 0.91 (0.34)

References
Butler, L.J. (1992) Economic evaluation of bST for
onfarm use. In: Hallberg, M.C. (ed.) BovineSomatotropin and Emerging Issues: an Assessment.Westview Press, Boulder, Colorado, pp. 145–171.
Card, D. (1996) The effect of unions on the structure of
wages: a longitudinal analysis. Econometrica 64,
957–979.
Davidson, J. and MacKinnon, J. (1993) Estimation andInference in Econometrics. Oxford University Press,
New York.
Greene, W. (1997) Econometric Analysis. Prentice Hall,
Englewood Cliffs, New Jersey.
Knoblauch, W.A. and Putnam, L.D. (1998) Dairy FarmManagement Business Summary, New York State,1997. R.B. 98–06. Department of Agricultural,
Managerial, and Resource Economics, Cornell
University, Ithaca, New York.
Marion, B.W. and Wills, R.L. (1990) A prospective assess-
ment of the impacts of bovine somatotropin: a case
study of Wisconsin. American Journal of AgriculturalEconomics 72, 326–336.
Patton, R.A. and Heald, C.W. (1992) Management of
bST-supplemented cows. In: Hallberg, M.C. (ed.)
Bovine Somatotropin and Emerging Issues: anAssessment. Westview Press, Boulder, Colorado, pp.
73–98.
Stefanides, Z. and Tauer, L.W. (1999) The empirical
impact of bovine somatotropin on a group of New
York dairy farms. American Journal of AgriculturalEconomics 81, 95–102.
Tauer, L.W. (1992) Impacts of bST on small versus large
dairy farms. In: Hallberg, M.C. (ed.) BovineSomatotropin and Emerging Issues: an Assessment.Westview Press, Boulder, Colorado, pp. 207–217.
Tauer, L.W. and Knoblauch, W.A. (1997) The empirical
impact of bST on New York dairy farms. Journal ofDairy Science 80, 1092–1097.
90 L.W. Tauer
Table 7.6. Impact of bST on short-run profit per cow; sample sorted by farm size (number of cows).
Independent variables(standard error of each estimate is in parentheses Farm size (cows)
below each coefficient estimate) Small Medium Large
bST use (d) –4.88 55.59 –77.64(98) (65) (118)
Continuous bST(f11) 77.93 –43.83 306.59(150) (115) (152)
bST use/drop(f10) 5.87 –101.21 387.29(147) (110) (230)
bST wait/use(f01) 61.82 –130.06 169.25(182) (143) (150)
AGE 3.09 –24.03 20.98(39) (30) (26)
AGE2 –0.09 0.22 –0.20(0.38) (0.30) (0.27)
EDUC 14.99 59.34 –3.24(83) (71) (65)
BUS_ORG 179.83 90.40 154.83(89) (73) (60)
MILK_SYS –223.66 –181.48 –23.50(116) (70) (107)
MILKPR 97.60 67.66 37.82(21) (20) (20)
Constant –711.0 279.0 –746.0(936) (820) (678)
Wald tests Ho: d + f11 = 0 chi-square (prob) 0.00 (0.99) 0.02 (0.90) 5.59 (0.02)Ho: d + f10 = 0 chi-square (prob) 0.41 (0.52) 0.02 (0.90) 2.00 (0.16)Ho: d + f01 = 0 chi-square (prob) 0.11 (0.74) 0.27 (0.60) 0.30 (0.58)
Introduction
Bovine somatotropin (bST) is a large, naturallyoccurring bovine peptide hormone involved ingrowth regulation and mobilization of body energystores. Although the exact mechanism by which bSTincreases milk yield is not fully understood, itsimpact on yields may be dramatic. A large, rapidlygrowing body of experimental results suggestsimmediate responses of 10–20% increases in yieldin dairy cows receiving bST (Cassell, 1992).
Prior to the introduction of bST in 1994, milkproduction in California had more than doubledfrom 1971 to 1991. According to Zepeda et al.(1991), much of the increase in production was dueto rising productivity per cow as a result of rapidadoption of improved management and productiontechnologies. Since the introduction of bST, animalscience studies have shown that the consistency offeeding and management practices has become evenmore important (Coppock, 1992; Shaver, 1998).These studies suggest that the use of bST requiresmore comprehensive diet formulation based ondetailed feed testing. According to Coppock (1992),those dairy producers who have a nutrition pro-gramme based on continuous and comprehensivefeed testing, with the intended nutrient profile con-
firmed in the final mixture, plus feeding systems,such as total mixed rations – which allow cows con-tinuous access to feed – have a much greater proba-bility of success when they adopt bST.
Using 1997 data for California dairy produc-ers, the purpose of this study is to address the fol-lowing questions:
1. Is the adoption of certain feed managementtechnologies an important explanatory variableinfluencing the adoption of bST?2. Of the dairy producers who no longer use bSTbut had adopted it in the past, were feed manage-ment technologies (or the lack thereof ) an impor-tant explanatory variable?3. Are the adoption of bST and feed managementtechnologies interrelated and, if so, how?
The chapter is divided as follows. The next sec-tion surveys the more recent literature on bST adop-tion. Then the main feed management technologiesused in the dairy are briefly discussed. The modelswe use to examine the bST adoption decision (bothcurrent and past) and the role of feed managementpractices in this decision are the subjects of a latersection. The data set is then described and in thefinal section the results are presented.
91
8 The Importance of Feed ManagementTechnologies in the Decision to Adopt Bovine
Somatotropin: an Application to CaliforniaDairy Producers
Irene Henriques1 and Leslie J. Butler21Schulich School of Business, York University, Toronto, Ontario, Canada; 2Departmentof Agricultural and Resource Economics, Social Science and Humanities, University
of California, Davis, California, USA
© CAB International 2002. Market Development for Genetically Modified Foods(eds V. Santaniello, R.E. Evenson and D. Zilberman)
Previous Research
Research on bST adoption can be divided into twogroups:1 ex ante and ex post. The ex ante research hasfocused on whether dairy producers will or will notadopt bST prior to its commercialization while expost research focuses on the decision to adopt oncethe technology has become commercially available.Stefanides and Tauer (1999) and Barham (1996) aretwo studies that have gathered ex ante and ex postsurvey data on bST (from New York dairy farmersand Wisconsin dairy farmers, respectively). InWisconsin and many parts of the USA and the restof the world,2 bST has been the focus of extensivepublic debate prior to its commercialization.Barham (1996) finds that although adoption levelsof bST in Wisconsin are strongly related to factorssuggested by conventional models, his survey dataand regression results show that bST adoption inWisconsin is strongly consistent with a politicized,constrained path.3
In the case of New York dairy farms where thecontroversy over bST was not as great as inWisconsin, Stefanides and Tauer (1999) estimatedbST adoption functions and measured the impact ofbST on milk output and profitability per cow. Theyfound that their results were consistent with previ-ous ex ante bST adoption studies and that the use ofbST significantly increases the milk output per cownet of other explanatory variables but that theimpact on profits was not significantly differentfrom zero.
No study, with the exception of Barham (1996),has controlled for the use of dairy feed managementpractices. The reason this may be important isbecause animal studies have noted that cows on bSTrequire more energy as their milk production increas-es (Coppock, 1992; Grant and Keown, 1996).Barham (1996) includes the use of total mixedrations (TMR) as an independent variable and findsthat TMR use increased the likelihood of being abST adopter but had no impact on the likelihood ofbeing a non-adopter or taking on a wait and seestance. While Barham (1996) does not specify thereason for including TMR in his analysis, his resultssupport our premise that feed management practicesshould be included in the analysis of bST adoption.
Administering bST to dairy cows has two dis-tinct effects on the lactation curve. First, there is animmediate increase in milk production causing thelactation curve to shift upwards a few days followingadministration, and second, use of bST increases thepersistency of lactation causing higher levels of milkproduction to be maintained for a longer period(Grant and Keown, 1996). The consequence of theseeffects is that the producer’s ability to keep sufficientamounts of a well-balanced ration available at alltimes is critical to the success or failure of bST use. Inother words, feed management practices may be animportant determinant of continued bST adoption.
Feed and ManagementPractices/Technologies
The consistency of feeding and management prac-tices is extremely important in dairy production.Before the commercialization of bST, much of theincrease in dairy productivity was due to rising pro-ductivity per cow as a result of rapid adoption ofimproved feeding and management technologies(Zepeda et al., 1991). Examples of important feedand management practices include total mixedrations, feed buffers and the use of computers in theoperation of the dairy farm.
TMR blend all feedstuffs (forage, grain, pro-tein and minerals) into one complete ration. Theadvantages of feeding TMR (Shaver, 1998) includeincreased milk production, use of low cost alterna-tive feeds, control of forage, lower incidence ofmetabolic and digestive disorders and reducedlabour inputs for feeding. Some disadvantages offeeding TMR include: (i) exclusion or difficultywith baled hay since this must be chopped beforebeing incorporated into a TMR; (ii) fixed equip-ment cost (mixer, silage conveyors), some modifica-tion of existing facilities may be necessary; and (iii)ration formulation is more demanding since errorsin formulation will affect many cows.
Feed or dietary buffers are compounds thatwere originally added to the diets of dairy cows toimprove milk fat content (West, 1998). The needfor feed buffers developed because of changes in theway dairy cows are fed. Buffers are used largely to
92 I. Henriques and L.J. Butler
1 See Stefanides and Tauer (1999) for an excellent discussion of ex ante research that has been undertaken to date.2 In fact, as of 15 January 1999, the Canadian government has banned the use of bST. 3 According to Barham (1996), marketing and regulatory actions were taken soon after bST’s commercial release,
which inevitably constrained farmer adoption choices.
offset acidic conditions produced by the relativelyhigh grain rations fed today. In the past when cowswere fed large quantities of forage and relativelysmall amounts of grains, buffers were not needed.However, genetically superior dairy cows capable ofhigh milk yield (West, 1998) and cows on bST(Grant and Keown, 1996) require increasing nutri-ent density (especially energy) in the diet which issupplied to a great extent by larger quantities ofgrains.
Computers are becoming an increasingly use-ful tool in the effective management of dairy opera-tions. Computers can be used to store productionrecords, store financial records, collect data in themilking parlour, computerize feeding and aid inmaking herd management decisions.
Model
Independently defined univariate logit or probitmodels are usually used to examine the adoptiondecision. In the case where technologies may be inter-related, estimating the impact of adoption for eachsub-group of adopters and non-adopters separatelycould lead to a ‘self-selection’ bias. This leads to biasedand inconsistent parameters of a single equationmodel because the same omitted variables may influ-ence the decisions for all interrelated components,leading to correlation in the error terms of equationsexplaining adoption decisions. Multiple technologychoices have also been analysed using multinomiallogit models (Caswell and Zilberman, 1985; Zepeda,1990), but these models require restrictive assump-tions such as the assumption of the independence ofirrelevant alternatives (Cramer, 1991).
In this chapter, we model the bST adoptiondecision in two ways. First, we estimate the adop-tion decision (current and past) using a univariateprobit model and include feed management tech-nologies as independent variables. The objectivehere is to see whether feed management practices areimportant determinants in the decision to bothadopt and continue to adopt bST.
The proposed model is a binary choice probitmodel. Using the latent regression framework, wespecify the following model.4
Ri* = Zi g + ui (8.1)
where Ri* is an unobserved index variable, Zi repre-sents explanatory variables, and ui is an error term.The observed dummy variable is the farmer’s deci-sion to adopt (Ri = 1) or not (Ri = 0), where Ri = 1if Ri* > 0 and Ri = 0 if Ri* ≤ 0. The error term isassumed to be normally distributed with zero meanand variance equal to one.
The second approach asks whether the threetechnologies are interrelated and, if so, how. A mul-tivariate probit model is estimated. Three probitequations reflecting the bST adoption decision, thefeed buffer adoption decision and the total mixedrations adoption decision are estimated simultane-ously using full information maximum likelihood(Greene, 1997). The multivariate probit model is adirect extension to M equations of the bivariate pro-bit model, that is,
Rim* = Zim* gm + uim , m = 1 ,…, M (8.2)
where Rim* is an unobserved index variable for equa-tion m, Zim represents explanatory variables forequation m, and uim is an error term for equation m.The observed dummy variable is the farmer’s deci-sion to adopt technology m (Rim = 1) or not (Rim =0), where Rim = 1 if Rim* > 0 and Rim = 0 if Rim* ≤0. The error terms are distributed as multivariatenormal with mean vector 0 and covariance matrix Vwith diagonal elements equal to 1.0. Each individ-ual equation is a standard probit model.
Data
The data for this study were collected through amail and telephone survey of 1000 randomly select-ed California dairy producers in 1997, which repre-sented 50% of the California dairy industry. Therewere 626 responses (107 via the telephone surveyand 519 via the mail survey).5 Survey participants
Feed Management Technologies in the Decision to Adopt bST 93
4 This assumes that we are not dealing with a sequential adoption model (Byerlee and Polanco, 1986; Khanna, 1999).In this case, dairy producers need not adopt any of these feed management practices before using bST and vice versa.Unlike site-specific crop management, which is a bundle or package of component technologies where the two keycomponents are diagnostic techniques (such as soil tests) and application techniques (such as variable rate tech-nology) (Khanna, 1999), feed management techniques are not a prerequisite for adopting bST. In other words, bSTadoption does not occur in a sequential or step-wise manner with respect to the adoption of total mixed rations, feedbuffers or use of computers.
5 Note that due to missing values, there were 388 usable responses for the bST adoption equation and 306 usableresponses for the producers who had adopted bST in the past.
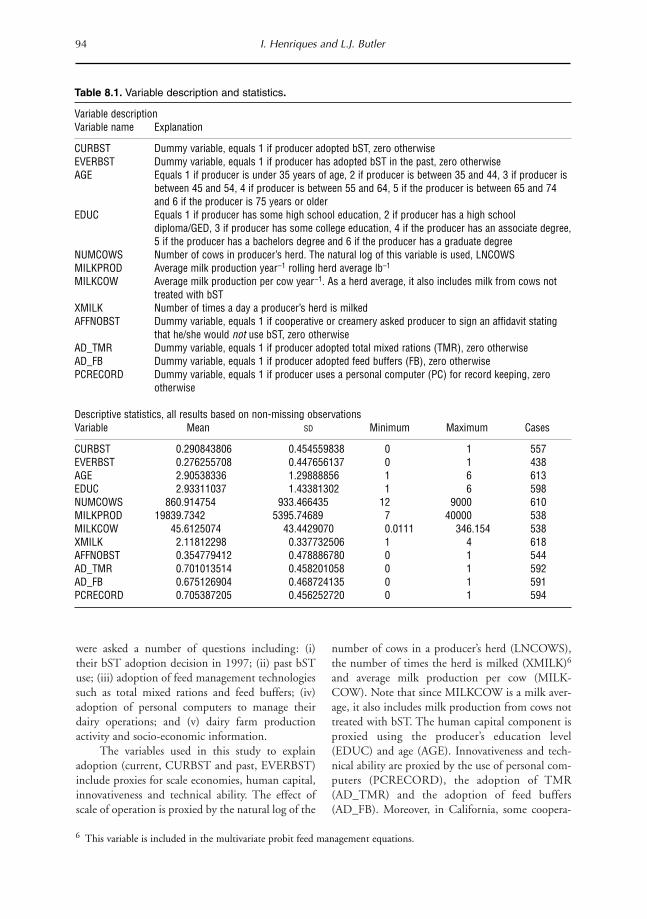
were asked a number of questions including: (i)their bST adoption decision in 1997; (ii) past bSTuse; (iii) adoption of feed management technologiessuch as total mixed rations and feed buffers; (iv)adoption of personal computers to manage theirdairy operations; and (v) dairy farm productionactivity and socio-economic information.
The variables used in this study to explainadoption (current, CURBST and past, EVERBST)include proxies for scale economies, human capital,innovativeness and technical ability. The effect ofscale of operation is proxied by the natural log of the
number of cows in a producer’s herd (LNCOWS),the number of times the herd is milked (XMILK)6
and average milk production per cow (MILK-COW). Note that since MILKCOW is a milk aver-age, it also includes milk production from cows nottreated with bST. The human capital component isproxied using the producer’s education level(EDUC) and age (AGE). Innovativeness and tech-nical ability are proxied by the use of personal com-puters (PCRECORD), the adoption of TMR(AD_TMR) and the adoption of feed buffers(AD_FB). Moreover, in California, some coopera-
94 I. Henriques and L.J. Butler
6 This variable is included in the multivariate probit feed management equations.
Table 8.1. Variable description and statistics.
Variable descriptionVariable name Explanation
CURBST Dummy variable, equals 1 if producer adopted bST, zero otherwiseEVERBST Dummy variable, equals 1 if producer has adopted bST in the past, zero otherwiseAGE Equals 1 if producer is under 35 years of age, 2 if producer is between 35 and 44, 3 if producer is
between 45 and 54, 4 if producer is between 55 and 64, 5 if the producer is between 65 and 74and 6 if the producer is 75 years or older
EDUC Equals 1 if producer has some high school education, 2 if producer has a high schooldiploma/GED, 3 if producer has some college education, 4 if the producer has an associate degree,5 if the producer has a bachelors degree and 6 if the producer has a graduate degree
NUMCOWS Number of cows in producer’s herd. The natural log of this variable is used, LNCOWSMILKPROD Average milk production year–1 rolling herd average lb–1
MILKCOW Average milk production per cow year–1. As a herd average, it also includes milk from cows nottreated with bST
XMILK Number of times a day a producer’s herd is milkedAFFNOBST Dummy variable, equals 1 if cooperative or creamery asked producer to sign an affidavit stating
that he/she would not use bST, zero otherwiseAD_TMR Dummy variable, equals 1 if producer adopted total mixed rations (TMR), zero otherwiseAD_FB Dummy variable, equals 1 if producer adopted feed buffers (FB), zero otherwisePCRECORD Dummy variable, equals 1 if producer uses a personal computer (PC) for record keeping, zero
otherwise
Descriptive statistics, all results based on non-missing observationsVariable Mean SD Minimum Maximum Cases
CURBST 0.290843806 0.454559838 0 1 557EVERBST 0.276255708 0.447656137 0 1 438AGE 2.90538336 1.29888856 1 6 613EDUC 2.93311037 1.43381302 1 6 598NUMCOWS 860.914754 933.466435 12 9000 610MILKPROD 19839.7342 5395.74689 7 40000 538MILKCOW 45.6125074 43.4429070 0.0111 346.154 538XMILK 2.11812298 0.337732506 1 4 618AFFNOBST 0.354779412 0.478886780 0 1 544AD_TMR 0.701013514 0.458201058 0 1 592AD_FB 0.675126904 0.468724135 0 1 591PCRECORD 0.705387205 0.456252720 0 1 594
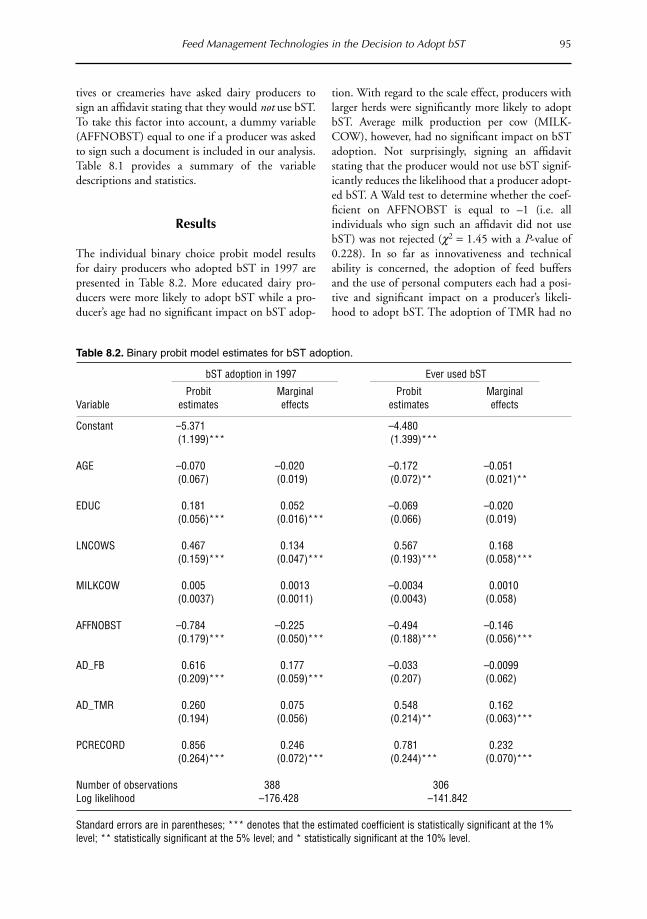
Feed Management Technologies in the Decision to Adopt bST 95
tives or creameries have asked dairy producers tosign an affidavit stating that they would not use bST.To take this factor into account, a dummy variable(AFFNOBST) equal to one if a producer was askedto sign such a document is included in our analysis.Table 8.1 provides a summary of the variabledescriptions and statistics.
Results
The individual binary choice probit model resultsfor dairy producers who adopted bST in 1997 arepresented in Table 8.2. More educated dairy pro-ducers were more likely to adopt bST while a pro-ducer’s age had no significant impact on bST adop-
tion. With regard to the scale effect, producers withlarger herds were significantly more likely to adoptbST. Average milk production per cow (MILK-COW), however, had no significant impact on bSTadoption. Not surprisingly, signing an affidavitstating that the producer would not use bST signif-icantly reduces the likelihood that a producer adopt-ed bST. A Wald test to determine whether the coef-ficient on AFFNOBST is equal to –1 (i.e. allindividuals who sign such an affidavit did not usebST) was not rejected (c2 = 1.45 with a P-value of0.228). In so far as innovativeness and technicalability is concerned, the adoption of feed buffersand the use of personal computers each had a posi-tive and significant impact on a producer’s likeli-hood to adopt bST. The adoption of TMR had no
Table 8.2. Binary probit model estimates for bST adoption.
bST adoption in 1997 Ever used bST
Probit Marginal Probit MarginalVariable estimates effects estimates effects
Constant –5.371 –4.480(1.199)*** (1.399)***
AGE –0.070 –0.020 –0.172 –0.051(0.067) (0.019) (0.072)** (0.021)**
EDUC 0.181 0.052 –0.069 –0.020(0.056)*** (0.016)*** (0.066) (0.019)
LNCOWS 0.467 0.134 0.567 0.168(0.159)*** (0.047)*** (0.193)*** (0.058)***
MILKCOW 0.005 0.0013 –0.0034 0.0010(0.0037) (0.0011) (0.0043) (0.058)
AFFNOBST –0.784 –0.225 –0.494 –0.146(0.179)*** (0.050)*** (0.188)*** (0.056)***
AD FB 0.616 0.177 –0.033 –0.0099(0.209)*** (0.059)*** (0.207) (0.062)
AD TMR 0.260 0.075 0.548 0.162(0.194) (0.056) (0.214)** (0.063)***
PCRECORD 0.856 0.246 0.781 0.232(0.264)*** (0.072)*** (0.244)*** (0.070)***
Number of observations 388 306Log likelihood –176.428 –141.842
Standard errors are in parentheses; *** denotes that the estimated coefficient is statistically significant at the 1%level; ** statistically significant at the 5% level; and * statistically significant at the 10% level.

96 I. Henriques and L.J. Butler
significant impact on the likelihood of adoptingbST.
Table 8.2 also presents the probit and margin-al effect estimates of producers who had adoptedbST in the past (and who are not using it in 1997).Older dairy producers were less likely to have everadopted bST while a producer’s education had nosignificant impact. With regard to the scale effect,producers with relatively larger herds were morelikely to ever have adopted bST. Not surprisingly,signing an affidavit stating that the producer willnot use bST significantly reduces the likelihood thata producer ever adopts bST. Again, a Wald test todetermine whether the coefficient on AFFNOBSTis equal to –1 was performed. In this case, however,
the hypothesis was rejected (c2 = 7.21 with a P-valueof 0.007) suggesting that although some producershad signed the affidavit, they continued using bST.In so far as innovativeness and technical ability isconcerned, TMR and the use of personal computerseach had a positive and significant impact on a pro-ducer’s likelihood to ever adopt bST. The adoptionof feed buffers, however, had no significant impacton a producer’s likelihood to ever adopt bST.
Since the second and third columns of Table8.2 estimate the likelihood of adoption in 1997 andthe following two columns estimate the likelihoodof previous adoption decisions (producers who areno longer using bST in 1997), we can comparethese columns to give us some idea of the reasons
Table 8.3. Multivariate probit model estimates of bST adoption,feed buffer adoption and TMR adoption.
Variable Coefficient Standard error P [|Z | > z]
Index function for CURBST (01)Constant –5.316 1.188 0.0000AGE –0.060 0.071 0.3974 EDUC 0.199 0.057 0.0005 LNCOWS 0.543 0.161 0.0008 MILKCOW 0.004 0.004 0.3067 AFFNOBST –0.768 0.183 0.0000 PCRECORD 0.918 0.289 0.0015
Index function for AD_FB (02)Constant –5.077 1.379 0.0002AGE 0.072 0.056 0.1964 EDUC 0.115 0.056 0.0382 LNCOWS 0.475 0.126 0.0002 MILKCOW 0.003 0.002 0.1896 XMILK 0.767 0.406 0.0588 PCRECORD 0.453 0.185 0.0145
Index function for AD_TMR (03)Constant –3.364 1.315 0.0105AGE –0.016 0.060 0.7873 EDUC 0.056 0.054 0.3030 LNCOWS 0.309 0.149 0.0388 MILKCOW –0.004 0.003 0.1741 XMILK 1.026 0.356 0.0040 PCRECORD –0.119 0.186 0.5224
Correlation coefficientsr (01,02) 0.321 0.112 0.0043r (01,03) 0.146 0.113 0.1973r (02,03) 0.376 0.092 0.0000
Number of observations 388Log likelihood function –579.8899

Feed Management Technologies in the Decision to Adopt bST 97
why previous adopters discontinued using bST. Todo so, we look at the factors that increase the likeli-hood of current adoption and ask whether thesehold for those producers who used bST in the past.Whereas higher education and the adoption of feedbuffers increased the likelihood of using bST in1997, such was not the case for past users of bST.The latter suggests that the lack of such importantdeterminants such as a higher education and the useof feed buffers may have led producers to discontin-ue using bST.
The second approach we take asks whether thethree technologies, bST adoption, feed buffer adop-tion and TMR adoption, are interrelated and, if so,how. A multivariate probit model is estimated inwhich three probit equations reflecting the bSTadoption decision, the feed buffer adoption decisionand the total mixed ration adoption decision areestimated simultaneously using full informationmaximum likelihood (Greene, 1997). These resultsare presented in Table 8.3.
The estimated parameters show that the nullhypothesis that the covariance parameter r is zero isrejected at the 1% level for two out of the three
covariance relationships: the relationship betweenbST adoption (CURBST) and feed buffer adoption(AD_FB) and the relationship between feed bufferadoption (AD_FB) and TMR adoption (AD_TMR). A positive value for r indicates that unob-served factors that influenced the adoption of bSTalso increased the likelihood of adopting feed buffers(r(01,02)) and the unobserved factors that influ-enced the adoption of TMR increased the likelihoodof adopting feed buffers (r(02,03)). The covarianceparameter between the adoption of TMR and bSTwas not significantly different from zero.
The bST equation results are similar to thosefound in our binary probit equation model. A dairyproducer’s education, herd size and use of a person-al computer each had positive and significant impacton the likelihood of adopting bST. The signing of ano bST affidavit had a negative influence. Turningto the feed buffer equation, the adoption of feedbuffers is positively influenced by herd size, educa-tion, the number of times the herd is milked and theuse of a personal computer. With respect to theTMR equation, the relative size of a producer’s herdand the number of times the herd is milked each
Table 8.4. Bivariate probit model estimates of bST adoption and feedbuffer adoption.
Variable Coefficient Standard error P [|Z | > z]
Index function for CURBST (01)Constant –5.477 1.201 0.0000AGE –0.058 0.072 0.4215EDUC 0.196 0.056 0.0005LNCOWS 0.530 0.161 0.0010MILKCOW 0.0051 0.004 0.2960AD_TMR 0.284 0.201 0.1566AFFNOBST –0.763 0.181 0.0000PCRECORD 0.926 0.281 0.0010
Index function for AD_FB (02)Constant –5.138 1.370 0.0002AGE 0.068 0.056 0.2227 EDUC 0.119 0.055 0.0312 LNCOWS 0.474 0.125 0.0002 MILKCOW 0.003 0.003 0.1866 XMILK 0.803 0.405 0.0475 PCRECORD 0.447 0.183 0.0148
Correlation coefficientr (01,02) 0.2687 0.117 0.0219
Number of observations 388Log likelihood function –381.5746
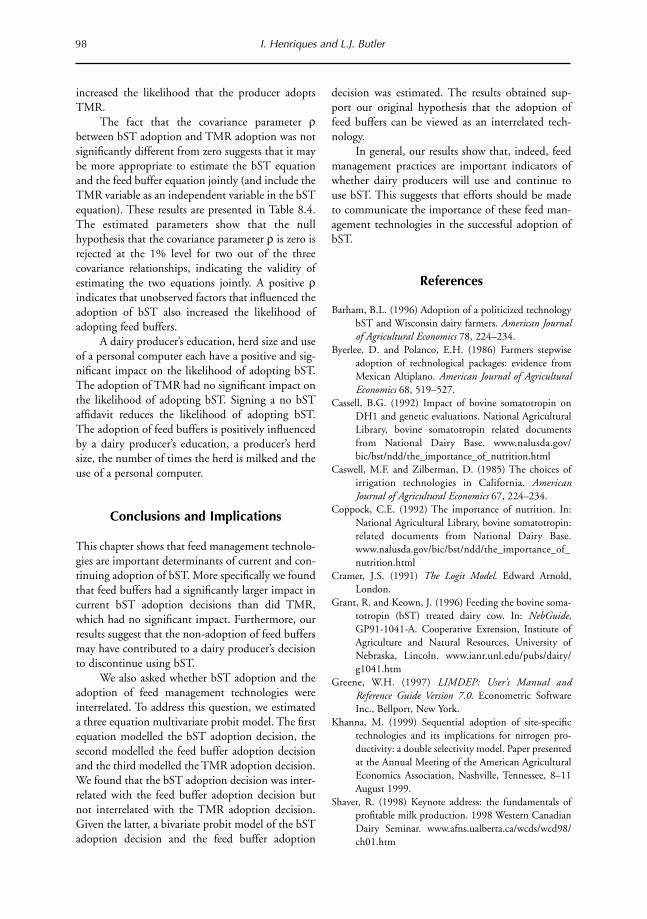
98 I. Henriques and L.J. Butler
increased the likelihood that the producer adoptsTMR.
The fact that the covariance parameter rbetween bST adoption and TMR adoption was notsignificantly different from zero suggests that it maybe more appropriate to estimate the bST equationand the feed buffer equation jointly (and include theTMR variable as an independent variable in the bSTequation). These results are presented in Table 8.4.The estimated parameters show that the nullhypothesis that the covariance parameter r is zero isrejected at the 1% level for two out of the threecovariance relationships, indicating the validity ofestimating the two equations jointly. A positive rindicates that unobserved factors that influenced theadoption of bST also increased the likelihood ofadopting feed buffers.
A dairy producer’s education, herd size and useof a personal computer each have a positive and sig-nificant impact on the likelihood of adopting bST.The adoption of TMR had no significant impact onthe likelihood of adopting bST. Signing a no bSTaffidavit reduces the likelihood of adopting bST.The adoption of feed buffers is positively influencedby a dairy producer’s education, a producer’s herdsize, the number of times the herd is milked and theuse of a personal computer.
Conclusions and Implications
This chapter shows that feed management technolo-gies are important determinants of current and con-tinuing adoption of bST. More specifically we foundthat feed buffers had a significantly larger impact incurrent bST adoption decisions than did TMR,which had no significant impact. Furthermore, ourresults suggest that the non-adoption of feed buffersmay have contributed to a dairy producer’s decisionto discontinue using bST.
We also asked whether bST adoption and theadoption of feed management technologies wereinterrelated. To address this question, we estimateda three equation multivariate probit model. The firstequation modelled the bST adoption decision, thesecond modelled the feed buffer adoption decisionand the third modelled the TMR adoption decision.We found that the bST adoption decision was inter-related with the feed buffer adoption decision butnot interrelated with the TMR adoption decision.Given the latter, a bivariate probit model of the bSTadoption decision and the feed buffer adoption
decision was estimated. The results obtained sup-port our original hypothesis that the adoption offeed buffers can be viewed as an interrelated tech-nology.
In general, our results show that, indeed, feedmanagement practices are important indicators ofwhether dairy producers will use and continue touse bST. This suggests that efforts should be madeto communicate the importance of these feed man-agement technologies in the successful adoption ofbST.
References
Barham, B.L. (1996) Adoption of a politicized technology
bST and Wisconsin dairy farmers. American Journalof Agricultural Economics 78, 224–234.
Byerlee, D. and Polanco, E.H. (1986) Farmers stepwise
adoption of technological packages: evidence from
Mexican Altiplano. American Journal of AgriculturalEconomics 68, 519–527.
Cassell, B.G. (1992) Impact of bovine somatotropin on
DH1 and genetic evaluations. National Agricultural
Library, bovine somatotropin related documents
from National Dairy Base. www.nalusda.gov/
bic/bst/ndd/the_importance_of_nutrition.html
Caswell, M.F. and Zilberman, D. (1985) The choices of
irrigation technologies in California. AmericanJournal of Agricultural Economics 67, 224–234.
Coppock, C.E. (1992) The importance of nutrition. In:
National Agricultural Library, bovine somatotropin:
related documents from National Dairy Base.
www.nalusda.gov/bic/bst/ndd/the_importance_of_
nutrition.html
Cramer, J.S. (1991) The Logit Model. Edward Arnold,
London.
Grant, R. and Keown, J. (1996) Feeding the bovine soma-
totropin (bST) treated dairy cow. In: NebGuide,GP91-1041-A. Cooperative Extension, Institute of
Agriculture and Natural Resources, University of
Nebraska, Lincoln. www.ianr.unl.edu/pubs/dairy/
g1041.htm
Greene, W.H. (1997) LIMDEP: User’s Manual andReference Guide Version 7.0. Econometric Software
Inc., Bellport, New York.
Khanna, M. (1999) Sequential adoption of site-specific
technologies and its implications for nitrogen pro-
ductivity: a double selectivity model. Paper presented
at the Annual Meeting of the American Agricultural
Economics Association, Nashville, Tennessee, 8–11
August 1999.
Shaver, R. (1998) Keynote address: the fundamentals of
profitable milk production. 1998 Western Canadian
Dairy Seminar. www.afns.ualberta.ca/wcds/wcd98/
ch01.htm

Feed Management Technologies in the Decision to Adopt bST 99
Stefanides, Z. and Tauer, L.W. (1999) The empirical
impact of bovine somatotropin on a group of New
York dairy farms. American Journal of AgriculturalEconomics 81, 95–102.
West, J.W. (1998) Buffers – what and when to use. 1998
Western Dairy Seminar. www.afns.ualberta.ca/wcds/
wcd98/ch05.htm
Zepeda, L. (1990) Adoption of capital versus management
intensive technologies. Canadian Journal ofAgricultural Economics 38, 457–469.
Zepeda, L., Butler, L.J. and Carter, H.O. (1991)
Simulating BST introduction in California for dairy
policy analysis. Western Journal of AgriculturalEconomics 16(2), 228–237.

Introduction
A large number of dairies in the USA, as well asdairies in 16 other countries, currently inject theircows with recombinant bovine somatotropin (rbST)to produce milk more efficiently. The use of rbSTwas controversial when it was first proposed and itsuse remains controversial even in the USA, where ithas been approved for use since February 1994 (e.g.McGuirk and Kaiser, 1991; Roush, 1991; Kronfeld,1993). Its use is more controversial in a number ofother countries, including Canada and theEuropean Union, where rbST use is still not per-mitted. Use of rbST was perhaps more controversialthan other biotechnologies because it was one of thefirst major technologies available for use to producehuman food. Moreover, milk – some say the mostperfect food – has a special emotional and diet rolefor many consumers. rbST use has been opposed onthe basis that it will: (i) endanger humans that con-sume the milk produced; (ii) harm cows which aretreated with it; and (iii) destabilize dairy industriesby dramatically increasing milk supply, decreasingthe milk price and causing special harm to poorerfarmers who may not find it profitable to adoptrbST. There is no scientific evidence that any ofthese fears is justified, though use of rbST is intend-
ed to reduce the cost of milk production and thusought to lower milk prices.
This chapter reviews the economics of rbST indeveloped and developing countries, at the farm andindustry-wide levels. It also discusses the importanceof attitudinal as opposed to economic factors regard-ing the adoption of rbST, the effect of rbST oninternational comparative advantage in milk pro-duction, and the lessons that the rbST experiencemay offer regarding the general use of agriculturalbiotechnology. I conclude that rbST appears to be afairly ‘mundane’ technology that does not appear tointroduce specific health risks to humans or animalsor economic risks to dairy sectors. When managedproperly, rbST provides a moderate once-and-for-allcost reduction on farms where it is utilized. It thusoffers a substantial aggregate long-run benefit toconsumers. rbST also rewards management skillsand higher quality feed, whether concentrate or pas-ture, and thus will probably shift comparativeadvantage slightly towards countries that possessthese in relative abundance.
Background
bST, a naturally produced hormone in cows, is a
101
9 The Potential Effect of Recombinant BovineSomatotropin on World Dairying
Lovell S. Jarvis1
Department of Agricultural and Resource Economics, University of California, Davis,California, USA, and The Giannini Foundation
© CAB International 2002. Market Development for Genetically Modified Foods(eds V. Santaniello, R.E. Evenson and D. Zilberman)
1 Lovell S. Jarvis is Associate Dean for Human Sciences, College of Agricultural and Environmental Sciences, andProfessor, Department of Agricultural and Resource Economics, University of California, Davis. This chapter drawson and extends information contained in Jarvis (1996).
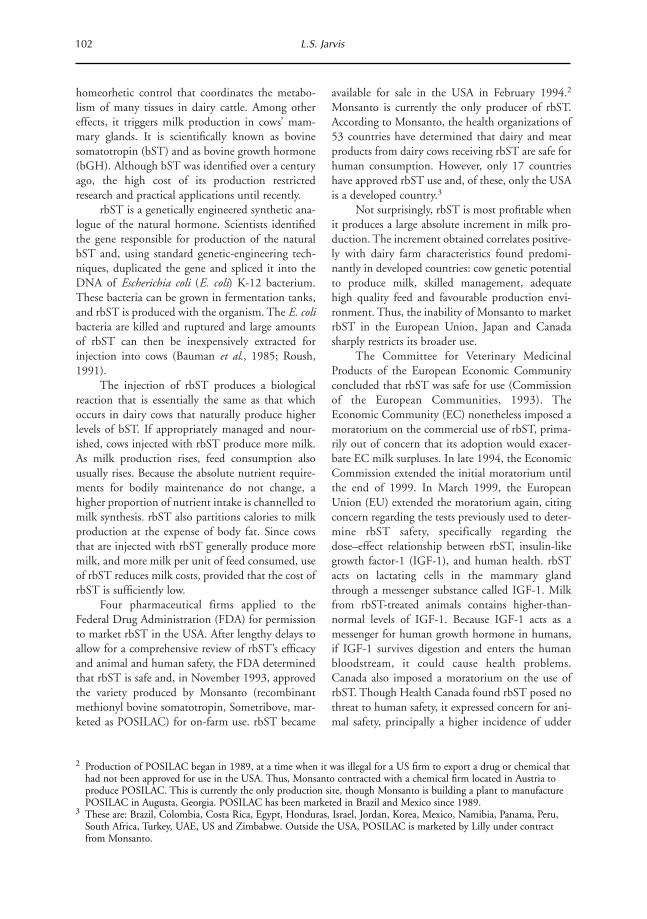
homeorhetic control that coordinates the metabo-lism of many tissues in dairy cattle. Among othereffects, it triggers milk production in cows’ mam-mary glands. It is scientifically known as bovinesomatotropin (bST) and as bovine growth hormone(bGH). Although bST was identified over a centuryago, the high cost of its production restrictedresearch and practical applications until recently.
rbST is a genetically engineered synthetic ana-logue of the natural hormone. Scientists identifiedthe gene responsible for production of the naturalbST and, using standard genetic-engineering tech-niques, duplicated the gene and spliced it into theDNA of Escherichia coli (E. coli) K-12 bacterium.These bacteria can be grown in fermentation tanks,and rbST is produced with the organism. The E. colibacteria are killed and ruptured and large amountsof rbST can then be inexpensively extracted forinjection into cows (Bauman et al., 1985; Roush,1991).
The injection of rbST produces a biologicalreaction that is essentially the same as that whichoccurs in dairy cows that naturally produce higherlevels of bST. If appropriately managed and nour-ished, cows injected with rbST produce more milk.As milk production rises, feed consumption alsousually rises. Because the absolute nutrient require-ments for bodily maintenance do not change, ahigher proportion of nutrient intake is channelled tomilk synthesis. rbST also partitions calories to milkproduction at the expense of body fat. Since cowsthat are injected with rbST generally produce moremilk, and more milk per unit of feed consumed, useof rbST reduces milk costs, provided that the cost ofrbST is sufficiently low.
Four pharmaceutical firms applied to theFederal Drug Administration (FDA) for permissionto market rbST in the USA. After lengthy delays toallow for a comprehensive review of rbST’s efficacyand animal and human safety, the FDA determinedthat rbST is safe and, in November 1993, approvedthe variety produced by Monsanto (recombinantmethionyl bovine somatotropin, Sometribove, mar-keted as POSILAC) for on-farm use. rbST became
available for sale in the USA in February 1994.2
Monsanto is currently the only producer of rbST.According to Monsanto, the health organizations of53 countries have determined that dairy and meatproducts from dairy cows receiving rbST are safe forhuman consumption. However, only 17 countrieshave approved rbST use and, of these, only the USAis a developed country.3
Not surprisingly, rbST is most profitable whenit produces a large absolute increment in milk pro-duction. The increment obtained correlates positive-ly with dairy farm characteristics found predomi-nantly in developed countries: cow genetic potentialto produce milk, skilled management, adequatehigh quality feed and favourable production envi-ronment. Thus, the inability of Monsanto to marketrbST in the European Union, Japan and Canadasharply restricts its broader use.
The Committee for Veterinary MedicinalProducts of the European Economic Communityconcluded that rbST was safe for use (Commissionof the European Communities, 1993). TheEconomic Community (EC) nonetheless imposed amoratorium on the commercial use of rbST, prima-rily out of concern that its adoption would exacer-bate EC milk surpluses. In late 1994, the EconomicCommission extended the initial moratorium untilthe end of 1999. In March 1999, the EuropeanUnion (EU) extended the moratorium again, citingconcern regarding the tests previously used to deter-mine rbST safety, specifically regarding thedose–effect relationship between rbST, insulin-likegrowth factor-1 (IGF-1), and human health. rbSTacts on lactating cells in the mammary glandthrough a messenger substance called IGF-1. Milkfrom rbST-treated animals contains higher-than-normal levels of IGF-1. Because IGF-1 acts as amessenger for human growth hormone in humans,if IGF-1 survives digestion and enters the humanbloodstream, it could cause health problems.Canada also imposed a moratorium on the use ofrbST. Though Health Canada found rbST posed nothreat to human safety, it expressed concern for ani-mal safety, principally a higher incidence of udder
102 L.S. Jarvis
2 Production of POSILAC began in 1989, at a time when it was illegal for a US firm to export a drug or chemical thathad not been approved for use in the USA. Thus, Monsanto contracted with a chemical firm located in Austria toproduce POSILAC. This is currently the only production site, though Monsanto is building a plant to manufacturePOSILAC in Augusta, Georgia. POSILAC has been marketed in Brazil and Mexico since 1989.
3 These are: Brazil, Colombia, Costa Rica, Egypt, Honduras, Israel, Jordan, Korea, Mexico, Namibia, Panama, Peru,South Africa, Turkey, UAE, US and Zimbabwe. Outside the USA, POSILAC is marketed by Lilly under contractfrom Monsanto.

infections, a shorter productive-life (burnout) andworsening reproductive parameters. Canada extend-ed its moratorium in January 1999, referencing thehuman health issue raised by the EU and continuedanimal health concerns.
The FDA recently examined and scientificallyrefuted the new arguments of the EU and Canada,indicating that the tests used include standard haz-ard assessment procedures that have been applied todetermine ‘the safety of vitamins, food additives anddrugs, including hormones, for over twenty-fiveyears’. The FDA asserts that the amount of IGF-1and truncated forms excreted in milk followingrbST treatment is ‘safe for all consumers, includinginfants’.4 The FDA has also rejected the claim thatrbST causes significant animal health problems.
Western Europe and Canada continue tooppose use of rbST on what appear to be mainlyeconomic considerations,5 though a general fear ofbiotechnology in Western Europe remains a majorconsideration as well. Although US farmers havebeen adopting rbST, many surveys indicate that aconsiderable number of farmers express unwilling-ness to use rbST. These farmers cite concerns similarto those expressed officially by the EU and Canada,that is, concern that their cows will be harmedand/or that consumers will be scared by rbST andthat milk consumption will drop (e.g. rbST surveysof California dairy industry carried out by L.J.(Bees) Butler, 1995). Some of these farmers aredoubtlessly influenced by the popular and scientificdebate, others by their perceptions followingobserved efforts to utilize rbST, and still others by afear of what appears to be ‘unnatural’. Despite theseconcerns, longer-term studies have found that cowsreceiving rbST evidence no particular stress, lack ofheat tolerance, health effects nor any significant gapin calving interval (e.g. Bauman, 1987; Chalupa etal., 1996; Bauman et al., 1999). Cows treated withrbST do evidence a higher level of udder infections,but no higher than untreated cows that yield equalamounts of milk, and all of these infections are cur-able with antibiotics. There is no evidence in the
USA that consumer demand has been affected bythe presence of rbST.6
Microeconomics of rbST Use and itsAdoption
Initial yield trials showed considerable variability ofmilk production response to rbST treatment. Forexample, at the 1989 meetings of the AmericanDairy Science Association and the American Societyof Animal Science, Bauman et al. (1989) reportedtrials in which rbST-related production increasesranged from 2.5 to 30%, or about 1.3 lb to 15.4 lbof milk day–1 of treatment. Herd management was acritical factor in determining response, but it wasthen believed that the absolute level of response waspositively correlated with initial animal milk yields.Surprisingly, subsequent analysis of on-farm rbSTuse suggests that the absolute magnitude of thepotential response to rbST in the US herd is largelyindependent of the pre-rbST level of production.That is, when properly managed, response is fairlyconstant at about 10–12 lb day–1 of treatment (W.Weiland, 1999, personal communication).7
Although genetic potential is a factor in rbSTresponse, animals within the US dairy herd are suf-ficiently similar that their rbST response is poten-tially similar. Thus, most of the observed variationin rbST response in US herds can be attributed todifferences in herd management. Poorly managedherds achieve a lower response than well-managedherds, with nutrition being the main limiting factor.
A recent study by Bauman et al. (1999) pro-vides further support for this view. The study utilizespanel data for 1990–1998 from several continuingsurveys of dairy herd productivity in Pennsylvaniaand New England. Using a list of rbST users andnon-users provided by Monsanto, the authors iden-tified 164 dairies that began using rbST betweenFebruary and June 1994, continued using rbSTthrough March 1998, had treated at least 50% oftheir cows, and used only Holstein cows. The
Potential Effect of rbST on World Dairying 103
4 FDA’s determination is supported by numerous scientific and regulatory bodies, including the Joint Food andAgricultural Organization/World Health Organization Expert Committee on Food Additives (JECFA).
5 Canada’s primary concern is that use of rbST will increase Canadian milk production and thereby jeopardizeCanada’s milk quota system.
6 Currently it is impossible to distinguish between bST and rbST in milk. Thus, promises or assertions are the onlymeans that brand-name products have to ensure consumers that their milk is rbST-free.
7 Since the response to rbST is small during the early stages of lactation, it is not profitable to administer rbST untilabout the 90th day of lactation. Thus, rbST has a smaller proportional effect on total output per lactation than ondaily output when rbST is being administered.

authors identified 170 control herds that also usedonly Holstein cows and that did not use rbST at anytime. The 340 herds contained more than 27,000cows in milk, generating over 2 million cow test dayrecords. Control herds were slightly smaller thanrbST herds and had lower total and per cow pro-duction both before and after rbST became avail-able. Adjusting for cow age, stage of pregnancy, stageof lactation, and months fresh, the authors deter-mined the annual average change in milk yields forrbST and control herds. Assuming that parametersother than rbST (e.g. weather, feed supply, farmereducation, milk price) affect the two sets of herds ina similar way, the authors attribute changes in thedifference in yields between rbST and control herdyields after 1994 to rbST. The data show that milkyields for rbST and control herds fell slightly in1990 and 1991, were constant in 1992 and 1993,and rose in all years 1994–1998. However, yields forrbST-using herds rise sharply in 1994 relative toyields of control herds. The yield gap widens slight-ly thereafter and then remains roughly constant withboth sets of herds manifesting continuing yieldgrowth (presumably from management improve-ments and adoption of duplication technologiesother than rbST). The data indicate that rbST useincreased milk yields by about 6 lb per cow milkedon test day. However, only about 65% of a herd’scows are eligible for treatment with rbST at anypoint in time;8 the data indicate that rbST increasedthe yields of treated cows by about 9.2 lb. Moreover,most farmers do not treat all their cattle.9 Assumingthat sampled farmers treated 80% of their cows,rbST treatment increased cow yields by 11.5 lbday–1 of treatment.10
If these results are fairly representative of
dairies that effectively manage rbST, how profitableis rbST? And how does profitability vary as theresponse varies? Calculations can be made easily.The change in the daily profit per cow from use ofrbST equals:
(9.1)
where p = daily profit per cow, PM = price of milk,M = milk output, Vi = the cost of input i (other thanrbST) and Xi = the quantity of input i. For simplic-ity, let R = the quantity of rbST used and CR = itstotal cost. There is no assumption that inputs arechosen optimally as these are likely to vary acrossfarms.
Rewriting, we get:
(9.2)
Monsanto sells POSILAC in a standard 14-dayprolonged-release dose for subcutaneous injection.Experimental trials indicated that milk productionresponds strongly to rising amounts of rbST over arange and then plateaus, making it relatively easy tochoose the profit-maximizing dose. However, somefarmers, feeling that the response is stronger with asomewhat larger dose, inject all cows every 10 or 11days. In general, farmers must provide a continuoushigh quality feed ration and other complementaryinputs as needed. A farmer’s ability to manage nutri-tion and other inputs, maintaining cow health andcomfort, strongly affects the milk incrementachieved.
Monsanto currently sells POSILAC forUS$5.80 per 14-day dose, or US$0.414 day–1.11
The price is increasingly discounted as a higher
104 L.S. Jarvis
8 Cows are treated for the last 215 days of their 305 day lactation, and a few cease treatment because of poor condi-tion or ill health.
9 Monsanto believes that the sample of effective rbST users in the Bauman et al. (1999) study treat about 80–85% oftheir cows. Though most rbST users decide not to treat some of their animals in the belief that they will notrespond well to rbST, animal scientists recommend that farmers treat all cows. Everett (1999, personal communica-tion) believes that the lack of response of individual animals is likely to be a result of management and says that it isdifficult to statistically separate management factors from genetic factors in the determination of milk yields forindividual animals with the data available.
10 The distribution of average herd response in this sample is symmetrical and the SE is small (R. Everett, 1999, per-sonal communication). The distribution of milk response to rbST within herds is fairly uniform and appears to beuncorrelated with observable cow characteristics. The survey data show no significant change between rbST-treatedand control herds in cow age, cow health, length of lactation or cow reproduction rates, and thus show no sign ofhealth or reproductive problems (W. Weiland, personal communication).
11 Monsanto sells POSILAC at a price that appears broadly consistent with an assumption of profit-maximizing behav-iour. The price is substantially above the cost of production, which is estimated at US$0.05 or less (Marion andWills, 1990). However, Monsanto markets POSILAC directly to farmers and provided considerable free technical assistance to adopting farmers during the first 3 years that POSILAC was marketed. It wanted to ensure that
Dp = - -ÂPMR
VXM
MR
Cii
M Rd
d
d
d
d
d
Dp = -ÊËÁ
ˆ¯
-ÂP VXM
MR
Cii
M Rd
d
d
d

proportion of a farmer’s herd is treated; the lowestdiscounted price is US$5.25 per 14-day dose. Thus,depending on whether cows are treated every 10 orevery 14 days, and on the discount obtained, thedaily cost of rbST ranges between US$0.38 and0.58. Marion and Wills (1990) estimated that mar-ginal feed costs are about US$0.0289 lb–1 of milkproduced for Wisconsin dairy herds and that othercosts like farm labour, power, veterinary services andmilk transport increased at US$0.0087 lb–1 of milkproduced. Adopting their estimates of variable costsassuming that the farm gate price of milk (whichvaries regionally) is US$11.50 per hundredweight(US$0.115 lb–1), each incremental lb of milk pro-duced yields the farmer US$0.0774, gross of thecost of rbST itself.12 See Table 9.1. Since each cow istreated for about 215 days during each lactation, theincrease in annual profit per cow rises rapidly.13
Although rbST appears to be a scale-neutral tech-nology in terms of its specific application, theabsolute incentive for adoption varies proportion-ately with herd size, assuming that management isscale neutral. In fact, US dairy herds vary greatly insize both within and across regions. For example,while Wisconsin herds average about 50 cows,California herds average more than 500 cows (Reed,1994). Similarly, within California, herds rangefrom 50 cows to 10,000 cows.
Farms having only 50 cows that achieve anincrement of about 11–12 lb per cow would appearto gain US$4000–5000 annually, a significant prof-it increment given the dairy’s size. However, if the
same farm achieves an increment of only 8 lb, andthen treats only 60% of its cows, the benefit is aboutUS$1000. Assuming rbST is sold at US$0.414 perdaily dose, a dairy farmer must achieve an averageincrement of 5.34 lb to break even. It appears thatmost producers should at least achieve this incre-ment, making adoption of rbST relatively low risk.Most farms must introduce changes in managementto manage rbST effectively. Some farmers may losemoney in the first several months following adop-tion. Subsequently, however, most adopters appearto achieve a significant economic benefit from adop-tion. When managed well, milk production increas-es in a predictable, consistent, significant manner.The data are increasingly clear that treating cowswith rbST creates no unusual animal health orreproductive problems. None the less, the likelygains to smaller dairies from adoption of rbST arerelatively small and not likely to be a panacea. Incontrast, a dairy with 2000 cows that treats 80% ofits cows and achieves an average increase of 12.5 lbper cow gains an estimated annual profit increase ofabout US$190,000.
It was widely expected that rbST would have adifferential effect on the profitability of differenttypes of dairy farms within the US (Boehlje et al.,1987; Fallert et al., 1987; Butler and Carter, 1988;Kaiser and Tauer, 1989). Considerable empiricalevidence on the adoption and use of new technolo-gies suggests a positive correlation between farm sizeand farmer education on the one hand, and the rate and extent of adoption of (profitable) new
Potential Effect of rbST on World Dairying 105
adopting farmers got good results and continued use, and Monsanto also wanted to better understand on-farm useand results. Monsanto still provides technical assistance, but at a lower level.
12 Marion and Wills (1990) first worked out a variant of this simple model. 13 As the response to rbST is not strong during the first 60 days of the lactation cycle, Monsanto recommends that
dairy farmers treat essentially all cows after the 60th day of lactation.
Table 9.1. Profit effect of treating cows with rbST, assuming different milk increments.
Annual profitDaily profit Annual profit increment per herd
Milk increment increment per cow increment per cow (assuming 100lb day–1 (dM/dR) (Dp) (US$) (215 Dp) (US$) cows treated) (US$)
5 (0.03) (6.45) 6457.5 0.17 36.55 3,655
10 0.36 77.40 7,74012.5 0.55 118.25 11,82515 0.75 160.13 16,013
Assumptions: PM = US$0.115 lb–1, CR = US$0.414, and ViXi = US$0.0376 lb–1 (the sum of input cost other than rbST).

technologies on the other, and it seems likely thatthe same will hold for adoption of rbST. Indeed,Saha et al. (1994) found that, ex ante, the willing-ness of Texas dairy producers to adopt rbST is posi-tively related to herd size and education. Klotz et al.(1995) found the same is true of dairy farmers inCalifornia. Given regional differences in farm sizeand farm productivity, rbST would seem likely todifferentially affect regional milk production as well.
Monsanto does not report sales figures for anyof its products. However, Monsanto reported in May1999, that 13,000 US dairy producers were usingrbST and that adopting farms have approximately30% of the 9 million dairy cows in the US herd.Although the data provided do not seem whollyinternally consistent, Monsanto claims that thenumber of adopters was growing at about 3600year–1 in 1996, 1997 and 1998, which suggests thatthe combined number of new adopters in the first 2years of diffusion, 1994 and 1995, was about2000–3000. There are 120,000 farms with ten ormore cows each in the USA, and about 45,000 farmswith 50 or more cows. Monsanto provides no infor-mation about the farm size distribution of adoptingfarmers but it is a reasonable guess that most verysmall producers are not potential users simplybecause the potential gains are not worth the effort.If valid, then approximately 25–30% of the farmswith more than 50 cows have adopted. Monsantoclaims that sales of rbST have been rising at about30% year–1 in the last 2 years and continued to do soin early 1999, a figure approximately consistent withthe rate of increase of new adopters. Thus, there is noevidence of a changing average herd size for adopters,nor that adopters have significantly changed the pro-portion of the herd treated over time.
Assuming that treated cows increase milk pro-duction by 10 lb day–1 and that each cow is treatedfor 215 treatment days per lactation (with roughlyone lactation year–1), rbST is increasing the yields oftreated cows by about 2150 lb year–1, or about 14%of the 15,000 lb US average yield. Assuming that70% of animals in adopting herds are currentlytreated, rbST use is increasing the output of treatedherds by about 10%. If these herds contain 30% of
the US dairy herd, rbST has increased US milk pro-duction by 3%, assuming no indirect effects on herdsize or the adoption of other technologies. Althoughthis is an important contribution to US milk pro-duction, the increase achieved thus far by use ofrbST is dwarfed by the impact of other technologiesthat have affected the US dairy sector during thesame period. Output per cow has been rising at arate of about 2% year–1 over the last several decadesand the data in Bauman et al. (1999) suggest thatthis rate of technological progress has been main-tained in the last 5 years on farms that have notadopted rbST. If so, rbST accounts for a muchsmaller part of the increment in cow milk yieldsthan have other technologies, in the aggregate. Thisfact bears emphasis. Numerous farmers and policyanalysts have expressed opposition to rbST on thegrounds that its use will sharply increase milk out-put, reduce milk prices and create economic havocin the dairy industry. However, these voices do notsuggest that other types of technical change shouldbe banned even though their aggregate effect is sub-stantially larger.
If rbST has contributed to an increase, even ifmodest, the milk price has probably been affected.What is likely to happen in the longer run? Howmuch will the price of milk fall in equilibrium if alldairies eventually adopt rbST? Following consider-able debate and a number of studies that predicted alarge price decline, Perrin (1991) used data fromFallert et al. (1987) and Marion and Wills (1990) toshow that the equilibrium price decline associatedwith rbST use should be modest. Although animalmilk yields increase by about 15%, costs alsoincrease so that the decline in the unit cost of pro-duction is fairly small. Using the available data,Perrin estimated unit cost savings of 0.5% and4.4%.14 Such small unit cost savings suggest littlepotential for rbST adoption to cause large-scale dis-ruption of the US milk market. A study by Stennes(1989), using a linear programming model, derivescomparable unit cost savings of about 6% fromrbST use in Canada.15
Adoption of rbST in other developed countriessuch as Canada, the EU, other Western European
106 L.S. Jarvis
14 Assuming application of rbST to herds averaging 20,000 lb of milk year–1, a 15% production response and a priceof US$12.50 per cwt. (cwt. is hundredweight), the reduction in unit costs achieved by using rbST rises to 6.9%.
15 Even a significant milk price decline should not reverse rbST adoption as its use yields US$37 in net incrementalrevenue per cow year–1 (versus no adoption) when the milk price has fallen to $9 cwt.–1, assuming an 11 lbresponse. Given the low cost of manufacturing rbST, a decline in the price of milk would surely lead manufacturersto reduce the price of rbST if needed.

countries and Japan depends principally on whetherthe use of rbST is permitted. If it is permitted, itseems difficult to imagine that it will not be used.However, dairies in these countries are generallysmaller than dairies in the US and, since the incen-tive to adopt is importantly related to the number ofcows milked, a slower rate of adoption can be pre-dicted in these countries. These countries will beable to observe the experience of the US with rbSTand to implement additional regulations regardingrbST use if such regulations are deemed useful. Tothe extent that milk prices fall significantly inresponse to rbST use, there will be pressures in othercountries to restrict the expansion of adoptingfarms, for example using farm quotas. Such regula-tions would further reduce the incentives foradoption.
rbST Use in Less Developed Countries
Although it appears that rbST will be adopted bymost larger dairy farmers in the US during the nextdecade and would also be adopted by many farmersin other developed countries if its use wereapproved, significant adoption is not likely to occurin developing countries even if the price of rbST issignificantly discounted there.
Dairy farmers in many developing countriesface a milk price similar to that found in developedcountries (Jarvis, 1996). Although the internationalprice of milk was sometimes as low as $0.055 lb–1
during the 1980s, domestic prices in developingcountries usually exceeded the international price bya significant margin due to domestic protection(Sere et al., 1990). However, most developing coun-tries are located in tropical regions with a relativelyunfavourable milk production environment includ-ing high temperature and humidity, low quality pas-tures and a high incidence of disease and parasites.The cattle populations in these regions are com-posed predominantly of Zebu (Bos indicus) breedsand their crosses. Such cattle display considerabletolerance of the climatic, nutritional and diseasechallenges present in these areas, but their geneticcapacity for milk production is limited even undermore favourable conditions. Not surprisingly, milkyields in less developed countries are usually signifi-cantly lower than those in the US, Canada andWestern Europe. The average annual yields in Africaand the Middle East are about 1100 lb, less thanone-tenth those achieved in the US and Canada.
Yields in Latin America and Asia are about 2200 lband 5500 lb, respectively. Although milk yields varyconsiderably across regions, the average yields arerepresentative of most herds in these areas.
High quality management, improved nutritionand timely veterinary care have been shown to becrucial to profitable application of rbST in the US.These inputs will be at least as important in devel-oping countries where the environmental challengeis greater, yet these inputs are scarce in developingcountries. Milk marketing and processing networksare underdeveloped and often unreliable in terms ofoffering a secure outlet for production. Markets aresegmented by unreliable and expensive transport.Production is highly seasonal, and additional outputof the sort that would be stimulated by rbST duringthe period of high production is often of much lessvalue.
Bos taurus dairy cattle in developed countrieshave milk yields ranging from 2000 to 10,000 kgyear–1 while B. indicus dairy cattle in developingcountries have milk yields ranging from about 500to 2500 kg year–1. Substitution of B. taurus for B.indicus cattle has been perceived as a means ofincreasing milk yields in developing countries.Many purebred dairy cattle were imported intodeveloping countries after the Second World War(Vaccaro, 1979; Jasiorowski et al., 1988). However,the efforts to introduce purebred B. taurus animalsinto most developing country regions proved disas-trous. B. taurus dairy cattle perform poorly in mostdeveloping country regions because there is aninherent incompatibility between these animals andthe developing country context into which they areplaced. Animals with the genetic potential to pro-duce high milk yields are genetically unsuited to theharsh environment, disease/parasite challenge andpoor nutrition available in developing countries(Vercoe and Frisch, 1980). Purebred B. taurus cattlesuffer high morbidity and mortality, have longercalving intervals, require more feed (and of highercost), and produce less milk than do local varieties.
Purebred B. taurus cows have been introducedsuccessfully in some, usually highland, regionswhere the environmental context is more similar tothat faced in developed countries. B. taurus cattle inless developed countries have also shown a signifi-cant response to rbST when the production condi-tions have been adequate, for example in Brazil(Fontes et al., 1997) and in Zimbabwe (Phipps etal., 1991). However, B. taurus herds account for asteadily declining share of milk production in the
Potential Effect of rbST on World Dairying 107
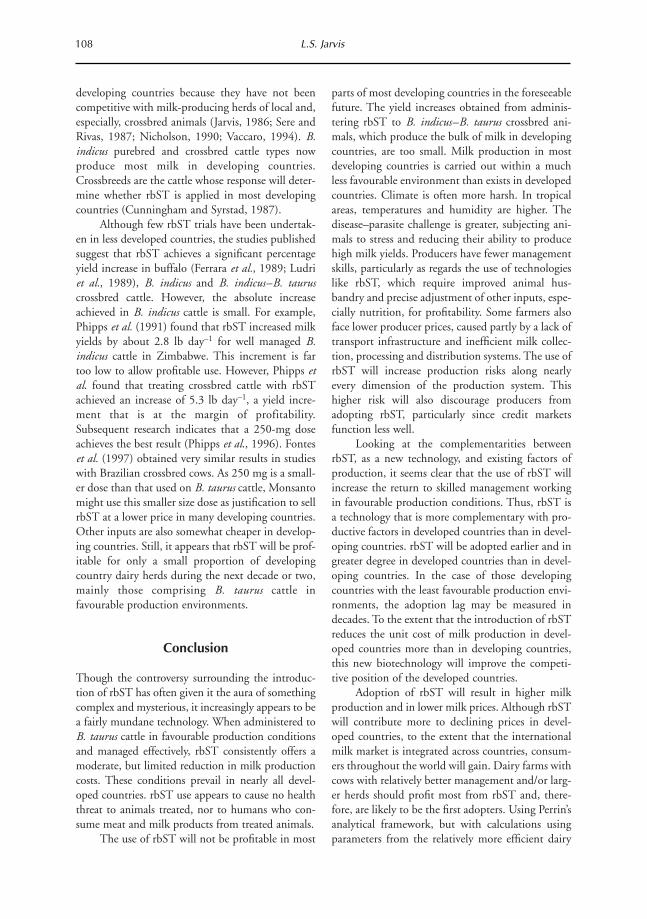
developing countries because they have not beencompetitive with milk-producing herds of local and,especially, crossbred animals (Jarvis, 1986; Sere andRivas, 1987; Nicholson, 1990; Vaccaro, 1994). B.indicus purebred and crossbred cattle types nowproduce most milk in developing countries.Crossbreeds are the cattle whose response will deter-mine whether rbST is applied in most developingcountries (Cunningham and Syrstad, 1987).
Although few rbST trials have been undertak-en in less developed countries, the studies publishedsuggest that rbST achieves a significant percentageyield increase in buffalo (Ferrara et al., 1989; Ludriet al., 1989), B. indicus and B. indicus–B. tauruscrossbred cattle. However, the absolute increaseachieved in B. indicus cattle is small. For example,Phipps et al. (1991) found that rbST increased milkyields by about 2.8 lb day–1 for well managed B.indicus cattle in Zimbabwe. This increment is fartoo low to allow profitable use. However, Phipps etal. found that treating crossbred cattle with rbSTachieved an increase of 5.3 lb day–1, a yield incre-ment that is at the margin of profitability.Subsequent research indicates that a 250-mg doseachieves the best result (Phipps et al., 1996). Fonteset al. (1997) obtained very similar results in studieswith Brazilian crossbred cows. As 250 mg is a small-er dose than that used on B. taurus cattle, Monsantomight use this smaller size dose as justification to sellrbST at a lower price in many developing countries.Other inputs are also somewhat cheaper in develop-ing countries. Still, it appears that rbST will be prof-itable for only a small proportion of developingcountry dairy herds during the next decade or two,mainly those comprising B. taurus cattle infavourable production environments.
Conclusion
Though the controversy surrounding the introduc-tion of rbST has often given it the aura of somethingcomplex and mysterious, it increasingly appears to bea fairly mundane technology. When administered toB. taurus cattle in favourable production conditionsand managed effectively, rbST consistently offers amoderate, but limited reduction in milk productioncosts. These conditions prevail in nearly all devel-oped countries. rbST use appears to cause no healththreat to animals treated, nor to humans who con-sume meat and milk products from treated animals.
The use of rbST will not be profitable in most
parts of most developing countries in the foreseeablefuture. The yield increases obtained from adminis-tering rbST to B. indicus–B. taurus crossbred ani-mals, which produce the bulk of milk in developingcountries, are too small. Milk production in mostdeveloping countries is carried out within a muchless favourable environment than exists in developedcountries. Climate is often more harsh. In tropicalareas, temperatures and humidity are higher. Thedisease–parasite challenge is greater, subjecting ani-mals to stress and reducing their ability to producehigh milk yields. Producers have fewer managementskills, particularly as regards the use of technologieslike rbST, which require improved animal hus-bandry and precise adjustment of other inputs, espe-cially nutrition, for profitability. Some farmers alsoface lower producer prices, caused partly by a lack oftransport infrastructure and inefficient milk collec-tion, processing and distribution systems. The use ofrbST will increase production risks along nearlyevery dimension of the production system. Thishigher risk will also discourage producers fromadopting rbST, particularly since credit marketsfunction less well.
Looking at the complementarities betweenrbST, as a new technology, and existing factors ofproduction, it seems clear that the use of rbST willincrease the return to skilled management workingin favourable production conditions. Thus, rbST isa technology that is more complementary with pro-ductive factors in developed countries than in devel-oping countries. rbST will be adopted earlier and ingreater degree in developed countries than in devel-oping countries. In the case of those developingcountries with the least favourable production envi-ronments, the adoption lag may be measured indecades. To the extent that the introduction of rbSTreduces the unit cost of milk production in devel-oped countries more than in developing countries,this new biotechnology will improve the competi-tive position of the developed countries.
Adoption of rbST will result in higher milkproduction and in lower milk prices. Although rbSTwill contribute more to declining prices in devel-oped countries, to the extent that the internationalmilk market is integrated across countries, consum-ers throughout the world will gain. Dairy farms withcows with relatively better management and/or larg-er herds should profit most from rbST and, there-fore, are likely to be the first adopters. Using Perrin’sanalytical framework, but with calculations usingparameters from the relatively more efficient dairy
108 L.S. Jarvis
firms who will increasingly dominate the dairyindustry, the unit cost of milk is estimated to declineby a maximum of about 5%. Given that the priceelasticity of demand in the US is low, milk con-sumption will increase by only about 2%, whichsuggests that unless sizeable quantities of milk canbe exported, production will increase little.Although adoption of rbST will improve the com-petitive advantage of developed countries, the effecton international markets is likely to be relativelysmall. Developed countries will not rely on the largemilk export subsidies to sell their surplus milk; giventhe moderate levels of protection that are still per-mitted in developing countries and consumers’ pref-erence for fluid milk, developing countries areunlikely to greatly increase milk imports.
If rbST is adopted, increasing milk yields, thenumber of dairy cows will decrease further, as well asthe number of dairy farms. Taken on that criterionalone, the use of rbST may not appear particularlysocially attractive. None the less, the total benefits ofadoption could amply exceed total costs, even if useof rbST is constrained to the USA. Some benefitswill occur to producers who can profitably adopt,particularly early in the diffusion process, but USconsumers will capture most benefits in the longrun. Assuming milk consumption of approximately70 Mt in the US, an eventual 5% reduction in thefarm level cost of production and constant process-ing and distribution margins, would translate into adecline of about $0.004 lb–1 at the consumer level.Consumer surplus, a crude approximation of thechange in consumer benefits, would increase byabout US$560 million annually. Monsanto will alsoprofit so long as its patents protect production ofrbST. Assuming that 5,000,000 cows, producing onaverage 28,000 lb year–1, are each treated with rbSTfor 215 days, and that Monsanto’s net operatingprofit is US$0.25 per dose, Monsanto would earnUS$216 million annually. If the use of rbST is even-tually adopted in other major developed countrymilk producing regions, the total annual benefits toconsumers (and Monsanto) might be roughly fivetimes as great as the estimate above. Although terri-bly crude, these estimates provide some magnitudeof the potential benefits from the rbST technology.
Canada and the countries making up theEconomic Union have delayed rbST use out of con-cern that it might produce such an increase in milkproduction as to sharply reduce market price, requir-ing painful adjustment among dairy farmers, and/orthat its use, directly or indirectly, poses a threat to
human health. However, if the US market absorbsrbST without a politically unacceptable disruption ofthe milk market and if use of rbST results in no majorhuman or animal health problems, it seems likely thatmost other developed nations will eventually approveadoption. Their delay in adoption offers some poten-tial for the USA to temporarily increase its compara-tive advantage in milk production. Some countriesmay continue to resist the introduction of rbST giventheir deeper aversion to the concept of biotechnology,but if their competitive position in the world milkmarket erodes there will be pressure for approval ofrbST use. Ironically, countries like Canada and thosein the EU probably face greater risk of economicdestabilization to their dairy sectors the longer theypostpone rbST. The longer rbST is used in the USA,the greater the amount of information availableregarding its profitability, safety and appropriatemanagement. This valuable information shouldincrease the profitability of adoption by producersand, thus, if and when use of rbST is approved, itshould be adopted more rapidly, with consequentpotential for greater economic disruption.
In the longer run, rbST use may be feasible ina wider range of developing countries. The extentdepends mainly on whether ongoing, broad-scalerural development leads to improved managementskills, nutrition, herd genetics, herd health and amarketing infrastructure. Improvements of this sortare precisely the developments that are needed toachieve significant gains in milk production even inthe absence of rbST. Moreover, milk production hasbeen rising at a faster rate in developing countriesthan in developed countries during the last twodecades (Jarvis, 1996). This rapid rate of increasehas been achieved by the adoption of ‘traditional’technologies borrowed largely from developedcountries. Continued adoption of such technologiesis highly suitable to these countries’ current resourceendowments and exploitation of this stock of ‘tradi-tional’ technologies offers great potential for thesecountries to achieve higher milk output at decliningcost. The existence of rbST ought not to distractdeveloping countries from this path. Indeed, sinceincorporation of these technologies is basic to beingable to make profitable use of rbST in the future, itshould enhance their importance and the emphasison bringing them about. Further, they may be ableto incorporate these traditional technologies suffi-ciently rapidly to reduce milk costs faster than devel-oped countries can do so via the adoption of newtechnologies like rbST.
Potential Effect of rbST on World Dairying 109
References
Bauman, D.E. (1987) Bovine somatotropin: the Cornell
experience. In: Proceedings of National InvitationalWorkshop on Bovine Somatotropin, 21–23 September1987. Westport Plaza, St Louis, Missouri, pp.
46–56.
Bauman, D.E., Eppard, J.E., DeGeeter, M.J. and Lanza,
G.M. (1985) Responses of high producing dairy
cows to long term treatment with pituitary soma-
totropin and recombined somatotropin. Journal ofDairy Science 68, 1352–1362.
Bauman, D.E., Hard, D.L., Crooker, B.A., Partridge,
M.S., Garrick, K., Sandles, L.D., Erb, H.N.,
Franson, S.E., Hartness, G.F. and Hintz, R.L. (1989)
Long term evaluation of a prolonged-release formu-
lation N-methionyl bovine somatotropin in lactating
dairy cows. Journal of Dairy Science 72, 642–651.
Bauman, D.E., Everett, R.W., Weiland, W. and Collier,
R.J. (1999) Production responses to bovine soma-
totropin in Northeast dairy herds. Journal of DairyScience 82, 2564–2573.
Boehlje, M., Cole, G. and English, B. (1987) Economic
impact of bovine somatotropin on the U.S. dairy
industry. In: Proceedings of National InvitationalWorkshop of Bovine Somatotropin, 21–23 September1987. Westport Plaza, St Louis, Missouri, pp.
167–176.
Butler, L.J. (1995) rBST and Industrial Dairying in the
Sunbelt. Paper presented at 1995 Annual Meeting
and Science Innovation Exposition of the American
Association for the Advancement of Science,
February 1995. American Association for the
Advancement of Science, Washington, DC.
Butler, L.J. and Carter, H.O. (1988) Potential impacts ofbovine somatotropin on the U.S. dairy industry: a WestCoast perspective, paper No. 88–4. Agricultural Issues
Center, University of California.
Chalupa, W., Vecchiarelli, B., Galligan, D.T., Ferguson,
J.D., et al. (1996) Responses of dairy cows supple-
mented with somatotropin during weeks 5 through
43 of lactation. Journal of Dairy Science 79, 800–812.
Commission of the European Communities (1993) FinalScientific Report of the Committee for VeterinaryMedicinal Products on the Application for MarketingAuthorization submitted by the Monsanto Company forSomatech, 500 mg Sometribove (Recombinant BovineSomatotropin) for Subcutaneous Injection. Com-
mission of the European Communities, Brussels, 27
January.
Cunningham, E.P. and Syrstad, O. (1987) CrossbreedingBos indicus and Bos taurus for Milk Production in theTropics. FAO Animal Production and Health Paper
68. FAO, Rome.
de Vaccaro, L. (1979) The performance of dairy cattle
breeds in tropical Latin America and programmes for
their improvement. In: Balaine, D.S. (ed.) Dairy
Cattle Breeding in the Humid Tropics. Haryana
Agricultural University, Hissar, India.
de Vaccaro, L. (1994) Technology for development in the
area of animal breeding. In: Anderson, J.R. (ed.)
Agricultural Technology: Policy Issues for theInternational Community. CAB International,
Wallingford, UK.
Fallert, R., McGuckin, T., Betts, C. and Bruner, B. (1987)
bST and the Dairy Industry: A National, Regional andFarm-level Analysis, Agricultural Economics Report
No. 579. US Department of Agriculture,
Washington, DC.
Ferrara, L., Di Liccia, A., Manniti, F., Piva, G.G., Masaero,
F., Fiorentini, L. and Litta, G. (1989) The effect of
somidobove (biosynthetic bovine somatotropin) on
the production and quality of milk of buffaloes
(Bubalus bubalis) raised in Italy. Asian-AustralasianJournal of Animal Sciences 2, 2–7.
Fontes, C., Jr, Meserole, V.K., Mattos, W., Barrow, R.P.,
Wu, Z. and Huber, J.T. (1997) Response of Brazilian
crossbred cows to varying doses of bovine somat-
ropin. Journal of Dairy Science 80, 3234–3240.
Jarvis, L.S. (1986) Livestock Development in Latin America.
World Bank, Washington, DC.
Jarvis, L.S. (1996) The Potential Effect of Two NewBiotechnologies on the World Dairy Industry. Westview
Press, Boulder, Colorado.
Jasiorowski, H.A., Stolman, M. and Reklewski, Z. (1988)
The International Friesian Strain Comparison Trial: AWorld Perspective. FAO, Rome.
Kaiser, H.M. and Tauer, L.W. (1989) Impact of bovine
somatotropin on U.S. dairy markets under alterna-
tive policy options. North Central Journal ofAgricultural Economics 11, 59–73.
Klotz, C., Saha, A. and Butler, R.J. (1995) The role of
information in technology adoption: the case of
rbST in the California dairy industry. Review ofAgricultural Economics 17, 287–298.
Kronfeld, D.S. (1993) Recombinant bovine growth hor-
mone: its efficacy, safety and impacts on herd health
management, economics, and public health. In:
Liebhardt, W.C. (ed.) The Dairy Debate:Consequences of Bovine Growth Hormone andRotational Grazing Technologies. University of
California Sustainable Agriculture Research and
Education Program, Davis, California.
Ludri, R.S., Upadhay, R.C., Singh, M., Guneratne, J.R.M.
and Basson, R.P. (1989) Milk production in lactating
buffalo receiving recombinantly produced bovine
somatotropin. Journal of Dairy Science 72,
2283–2287.
McGuirk, A.M. and Kaiser, H.M. (1991) bST and milk:
benefit or bane? Choices First Quarter, 20–26.
Marion, B.W. and Wills, R.L. (1990) A prospective assess-
ment of the impacts of bovine somatotropin: a case
study of Wisconsin. American Journal of AgriculturalEconomics 63, 685–699.
110 L.S. Jarvis

Nicholson, C.F. (1990) An optimization model of dual
purpose cattle production in the humid lowlands of
Venezuela. MS thesis, Cornell University, Ithaca,
New York.
Perrin, R.K. (1991) Ex-ante evaluation of experimental
technology. Working paper. Department of
Agricultural and Resource Economics, North
Carolina State University, October.
Perrin, R. (1997) The impact of technological change as a
competitive industry. Journal of Agricultural andResource Economics 22(2), 345–355.
Phipps, R.H., Weller, R.F., Craven, N. and Peel, C.J.
(1990) Use of prolonged-release bovine soma-
totropin for milk production in British friesian dairy
cows. Journal of Agricultural Science, Cambridge 115,
95–104.
Phipps, R.H., Madakadze, C., Mutsvangwa, T., Hard,
D.L. and de Kerchove, G. (1991) Use of bovine
somatotropin in the tropics: the effect of sometri-
bove on milk production of Box indicus dairy cross-
bred and Bos taurus cows in Zimbabwe. Journal ofAgricultural Science, Cambridge 117, 257–263.
Phipps, R.H., Hard, D.L. and Adriaens, F. (1996) Use of
bovine somatotropin in the tropics: the effect of
sometribove on milk production in Western, Eastern
and Southern Africa. Journal of Dairy Science 80,
504–510.
Reed, B. (1994) For wages and benefits, bigger dairies may
be better. California Agriculture 48, 9–13.
Roush, W. (1991) Who decides about biotech: the clash
over bovine growth hormone. Technology Review 14,
28–34.
Saha, A., Love, H.A. and Schwarb, R.B. (1994) Adoption
of emerging technologies under output uncertainty.
American Journal of Agricultural Economics 76,
836–846.
Sere, C. and Rivas, L. (1987) Dairy production in dual
purpose herds: evidence from tropical Latin America.
In: Pinstrup-Andersen, P. (ed.) Economics of DairyDevelopment in Selected Countries and PolicyImplications. Unpublished manuscript, proceedings
of International Food Policy Research Institute con-
ference by the same name, Copenhagen.
Sere, C., Li Pun, H.H. and Estrada, R.D. (1990) The
rationale of developing dairy production in the third
world. Proceedings of the XXIII International DairyCongress, Montreal, 8–12 October 1990. Vol. 1, pp.
146–157.
Stennes, B.K. (1989) Bovine somatotropin and the
Canadian dairy industry: an economic analysis. MS
thesis, University of British Columbia, Vancouver,
British Columbia.
Vercoe, J.E. and Frisch, J.E. (1980) Animal breeding and
genetics with particular reference to beef cattle in the
tropics. In: Verde, L.S. and Fernandez, A. (eds)
Proceedings of the IV World Conference on AnimalProduction. Argentine Association of Animal
Production, Buenos Aires, pp. 452–464.
Potential Effect of rbST on World Dairying 111
Introduction
Canola is a good example of how research and devel-opment can improve the comparative advantage ofan industry. In the late 1950s rapeseed was a veryminor crop in Canada that was used to make lubri-cant. By the 1980s, genetic, agronomic and process-ing research had transformed rapeseed into canola, anew crop that contained premium edible oil and aprotein meal used for livestock feed. In the 1990scanola became the dominant crop in the black soilzone of the prairies, and a large processing industryhad been built around it. In the past few yearsbiotechnology has been used to develop transgenicherbicide tolerant varieties and hybrid varieties thathave been widely adopted by Canadian producers.Throughout this 40-year period of development,research has been an important catalyst for growthin the industry.
The funding of canola research in Canada hasundergone many changes since its inception in themid-1950s, when Agriculture Canada began a pro-gramme to improve rapeseed processing methods.Over time research has shifted from a modest pub-lic research programme to a large research industrydominated by private sector participation. In 1970,83% of research spending was public investment.Ten years later, the percentage of public versus pri-vate research investment was 63% vs. 38% respec-tively. By 1997 the private sector’s share had grownto 80% of the total (Canola Research Survey, 1997).
This funding shift is evident in the registration ofnew varieties. Prior to 1973 all varieties were public,while in the 1990–1998 period 86% of the varietieswere private (Nagy and Furtan, 1977; Prairie PoolsInc., 1977–1992; Canola Council of Canada,1998). This large shift in emphasis from public toprivate research is due to the large increase in privatesector investment rather than a reduction in publicresearch.
The change in the private funding of researchhas coincided with a change in the ownership of theproperty rights for the research and, implicitly, whobenefits from the resulting returns to the invest-ment. In 1987, virtually all of the canola varietieswere open-pollinated and non-transgenic, and werenot protected by plant breeders’ rights until 1990.This meant that virtually all of the acreage wasgrown without a production agreement, giving pro-ducers the right to retain production for future seeduse and to sell non-registered seed to their neigh-bours. In contrast, by 1998, over half of the acreagewas planted to herbicide-tolerant (HT) varieties;producers were required to sign a technology agree-ment or to purchase a specific herbicide. An esti-mated 30% of the acreage was seeded to hybridvarieties (Canola Council of Canada, 1998) andmuch of the remaining acreage was seeded to vari-eties with plant breeders’ rights. These changes haveput plant breeders in a far better position to capturevalue from genetic innovation.
Previous research has shown very high rates of
113
10 Gains to Yield-increasing Research in theEvolving Canadian Canola Research Industry
Richard S. Gray, Stavroula Malla and Peter W.B. PhillipsDepartment of Agricultural Economics, University of Saskatchewan, Saskatoon,
Saskatchewan, Canada
© CAB International 2002. Market Development for Genetically Modified Foods(eds V. Santaniello, R.E. Evenson and D. Zilberman)
return for canola research. The evaluation of publicinvestment in canola research and development(R&D) was first published in 1978 by Nagy andFurtan. For the period 1960–1974 they calculatedthe internal rate of return (IRR) from improvedyield research to be 101%. Ulrich et al. (1987)updated the estimates of IRR in canola research forthe period 1951–1982 and calculated the IRR fromimproved yield research to be 51%. Ulrich andFurtan (1985) incorporated trade effects and foundthe estimated Canadian IRR from higher yieldingvarieties to be 50%. Despite the dramatic changes inthe industry since 1982, we could not find a morerecent comprehensive analysis.
There have also been some recent advances inthe estimation of the returns to research that haveyet to be applied to canola. Many studies have usedeconometrics to examine the effect of R&D invest-ment on agricultural productivity (e.g. Thirtle andBottomley, 1988; Huffman and Evenson, 1989,1992, 1993; Pardey and Craig, 1989; Leiby andAdams, 1991; Chavas and Cox, 1992; Alston andCarter, 1994; Evenson, 1996). Some of the morerecent econometric studies did not impose the shapeand length of adoption lag but applied statisticallybased transformation of the data and generally havefound lower rates of return (e.g. Akgüngör et al.,1996; Makki et al., 1996; Myers and Jayne, 1997).Alston et al. (1998) also explicitly dealt with theconcept of knowledge depreciation, which is notcommon in the agricultural R&D literature. Thesenew approaches will have relevance for estimatingthe IRR for canola research.
Given the dramatic changes that have recentlyoccurred in the canola industry, there is a need to re-examine the returns to research in the sector. In par-ticular, has the entrance of private industry, thechange in the property rights, the introduction ofbiotechnologies, and the changing role of the publicinstitutions resulted in a change in the benefits cre-ated? A contemporary evaluation of the situationwill be useful as a guide for further investment deci-sions in the canola industry. Furthermore, this eval-uation methodology may provide insights or raiseimportant questions for emerging biotechnologyresearch in other sectors.
The objective of this chapter is to estimate thereturns to yield-increasing Canadian canola researchover time as a means of examining whether thechanges in the canola research industry have affect-ed the returns to research. The chapter begins bypresenting a simple economic model to show how
changing property rights and government involve-ment can affect both the level and the return toresearch. This is followed by a description of theframework used to estimate the returns to research.The econometric model and the data used to esti-mate the relationship between research expenditureand yield over time are then presented. This is fol-lowed by a description of how the estimated param-eters are then applied historically to the canola mar-ket to estimate the return to research under differentscenarios. The chapter concludes with a discussionof the results, the implications for policy and theneed for further research.
An Economic Model to Examine theEffect on Property Rights and the Return
to Research
In the absence of enforceable property rights, manyof the products of research can be copied or repro-duced. This creates a ‘public good’ market failureresulting in underinvestment in research activities.As shown in Fig. 10.1, in the absence of completeproperty rights the private marginal benefit (MBp)that can be captured from the marketplace is lessthan the public or social benefits (MBs) of theresearch. A private research firm will equate themarginal cost (MC ) of doing research with the pri-vate demand (or private marginal benefit) for theresearch and produce a quantity of research Qp. Atthis amount of research the social marginal benefitof research is far greater than the marginal cost ofdoing research. In this case, the marketplace fails toproduce the socially optimal amount of research Qs,where the marginal cost of research is equal to mar-ginal social benefit. If the government provides aquantity of research Qg – Qp, this research creates asocial benefit equal to the additional area under thesocial benefit curve while incurring costs equal tothe much smaller area under the marginal costcurve. In this instance there is a high rate of returnto public research, which has been found in manyempirical studies. This illustration may characterizethe situation in canola research until the mid-1980sbefore the private sector played a major role.
Government has also addressed the incompleteset of property rights for research goods by provid-ing assistance to private firms doing research. Thisassistance has come in many forms. Research taxcredits have been used in many countries and inmany sectors to stimulate research. Recently, grants
114 R.S. Gray et al.
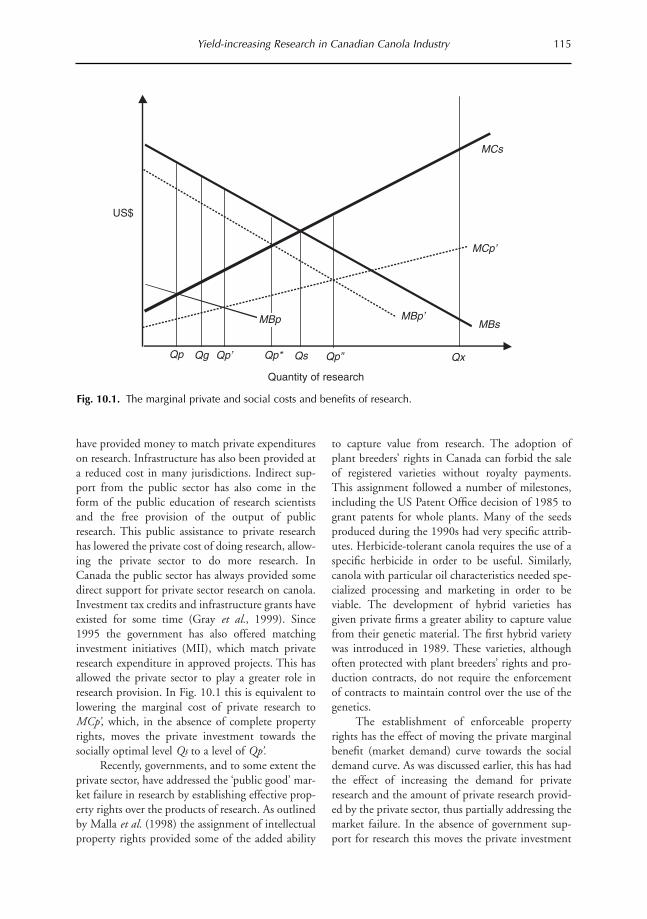
have provided money to match private expenditureson research. Infrastructure has also been provided ata reduced cost in many jurisdictions. Indirect sup-port from the public sector has also come in theform of the public education of research scientistsand the free provision of the output of publicresearch. This public assistance to private researchhas lowered the private cost of doing research, allow-ing the private sector to do more research. InCanada the public sector has always provided somedirect support for private sector research on canola.Investment tax credits and infrastructure grants haveexisted for some time (Gray et al., 1999). Since1995 the government has also offered matchinginvestment initiatives (MII), which match privateresearch expenditure in approved projects. This hasallowed the private sector to play a greater role inresearch provision. In Fig. 10.1 this is equivalent tolowering the marginal cost of private research toMCp’, which, in the absence of complete propertyrights, moves the private investment towards thesocially optimal level Qs to a level of Qp’.
Recently, governments, and to some extent theprivate sector, have addressed the ‘public good’ mar-ket failure in research by establishing effective prop-erty rights over the products of research. As outlinedby Malla et al. (1998) the assignment of intellectualproperty rights provided some of the added ability
to capture value from research. The adoption ofplant breeders’ rights in Canada can forbid the saleof registered varieties without royalty payments.This assignment followed a number of milestones,including the US Patent Office decision of 1985 togrant patents for whole plants. Many of the seedsproduced during the 1990s had very specific attrib-utes. Herbicide-tolerant canola requires the use of aspecific herbicide in order to be useful. Similarly,canola with particular oil characteristics needed spe-cialized processing and marketing in order to beviable. The development of hybrid varieties hasgiven private firms a greater ability to capture valuefrom their genetic material. The first hybrid varietywas introduced in 1989. These varieties, althoughoften protected with plant breeders’ rights and pro-duction contracts, do not require the enforcementof contracts to maintain control over the use of thegenetics.
The establishment of enforceable propertyrights has the effect of moving the private marginalbenefit (market demand) curve towards the socialdemand curve. As was discussed earlier, this has hadthe effect of increasing the demand for privateresearch and the amount of private research provid-ed by the private sector, thus partially addressing themarket failure. In the absence of government sup-port for research this moves the private investment
Yield-increasing Research in Canadian Canola Industry 115
Fig. 10.1. The marginal private and social costs and benefits of research.
Qp
MCp’
MBp
Qg Qp’ Qp* Qs Qp”
MBp’ MBs
MCs
Quantity of research
US$
Qx

from Qp to Qp* in Fig. 10.1. The establishment ofproperty rights changes the optimal role for govern-ment. If government provides support for privateresearch, once property rights are established thisfurther increases the private incentive to do research.If the property rights are nearly complete andresearch support is significant the private sector canprovide more research than is socially desirable, asrepresented by point Qp” in Fig. 10.1. Thus, bothcorrecting the public good failure and subsidizingresearch can result in excessive research.
A few final points apparent in Fig. 10.1 areworthy of note. The highest benefit-to-cost ratio,which will generate the highest IRR, will be at somelevel of research less than the social optimum. Thesocially optimal quantity of research occurs wherethe marginal social benefit is equal to the marginalsocial cost. At this point total net benefits of researchare maximized. Additional research beyond thispoint is socially wasteful, costing more on the mar-gin than what is produced. At these excessive levelsof research (anything less than the Qx in Fig. 10.1)the total benefits can still be greater than total costs,and the IRR can still be above market rates.Importantly, a positive overall return to research, oran IRR greater than market rates, does not implythat more research is socially desirable, rather, it sug-gests that the research programme taken as wholehas produced net benefits.
This simple economic model presented in Fig.10.1 illustrates several important concepts forresearch policy. The first is that in the absence ofenforceable property rights, the private sector willunderinvest in research, creating a role for govern-ment to address the research shortage. Second, theassignment of property rights to research productscan increase the amount of private investmenttowards the socially optimal amount. Third, ifenforceable property rights have been establishedthe subsidization of private research could lead tosocially wasteful overinvestment in research. Finally,an assessment of total research benefits or the rate ofreturn on total investment are not good indicatorsthat on the margin more research is socially desir-able.
Estimating the Returns to AgriculturalResearch
This section contains a brief description of the con-ceptual framework used to estimate the returns tocanola research.1 The process of creating new cropvarieties can be described in four phases, as shown inFig. 10.2. The first phase is the research phase,which involves effort over a number of years to cre-ate varieties with commercially desirable genetictraits. The second phase is the gestation phase,which is the period when potential varieties under-go private and public testing and multiplication,preparing the variety for potential registration andcommercial sale. In the adoption phase, after com-mercial release of the variety, the varieties are adopt-ed and grown by producers, contributing toincreased productivity. In the fourth phase, thesenew varieties become part of the germplasm andknowledge stock from which newer varieties are cre-ated. This fourth phase continues even after the par-ticular variety is no longer grown. Over time thecontribution to the knowledge stock depreciates aspests adapt themselves to the germplasm and newtechniques replace older ones (Alston et al., 1998).These four phases of crop variety development, andthe long lags between investment and output, havemade the estimation of returns to research difficultand a subject of considerable debate.
Estimating the Relationship betweenExpenditure and Yield Increase
The empirical procedure began by constructing ayield index of different canola varieties to the samebase variety (Torch = 100). The annual yield indexwas created from an average of the yield index forvarieties grown each year, weighted by the seededacreage. The data on the relative yield of differentvarieties, were obtained from various issues ofSaskatchewan Agriculture and Food, Varieties ofGrain Crops in Saskatchewan. These data are basedon the research station yield trials at a number oflocations across Saskatchewan, which were designedto measure varietal performance due to geneticcauses. The data on the percentage acreage of eachcanola variety were obtained from three sources. Thefirst source was a 1977 study by Nagy and Furtan,
116 R.S. Gray et al.
1A conceptual model for measuring these returns and many of the empirical issues that have to be dealt with areexplained in some detail in the book entitled Science Under Scarcity by Alston et al., 1997.
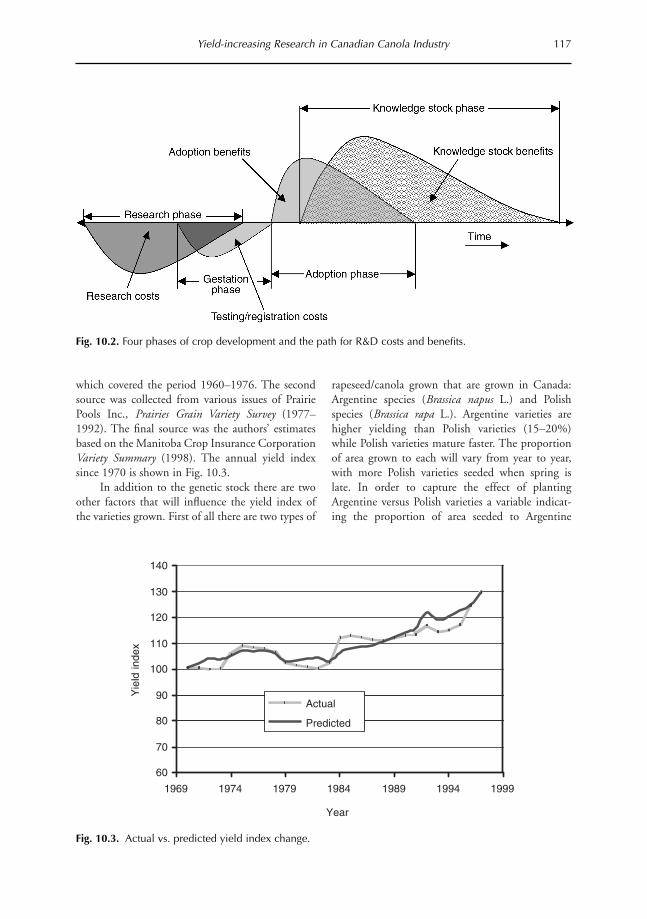
which covered the period 1960–1976. The secondsource was collected from various issues of PrairiePools Inc., Prairies Grain Variety Survey (1977–1992). The final source was the authors’ estimatesbased on the Manitoba Crop Insurance CorporationVariety Summary (1998). The annual yield indexsince 1970 is shown in Fig. 10.3.
In addition to the genetic stock there are twoother factors that will influence the yield index ofthe varieties grown. First of all there are two types of
rapeseed/canola grown that are grown in Canada:Argentine species (Brassica napus L.) and Polishspecies (Brassica rapa L.). Argentine varieties arehigher yielding than Polish varieties (15–20%)while Polish varieties mature faster. The proportionof area grown to each will vary from year to year,with more Polish varieties seeded when spring islate. In order to capture the effect of plantingArgentine versus Polish varieties a variable indicat-ing the proportion of area seeded to Argentine
Yield-increasing Research in Canadian Canola Industry 117
Fig. 10.2. Four phases of crop development and the path for R&D costs and benefits.
Fig. 10.3. Actual vs. predicted yield index change.
60
70
80
90
100
110
120
130
140
1969 1974 1979 1984 1989 1994 1999
Year
Yie
ld in
dex
Actual
Predicted

varieties is included in the regression. The otheryield factor that needs to be accounted for is theswitch from rapeseed to canola varieties. The selec-tion for low erucic acid and glucosinolate in canolaquality has been attained at the expense of seedyield. Figure 10.3 reveals the reduction in the annu-al weighed average yield index from 1978 to 1984when the changeover was made. This result is simi-lar to other findings, which have shown that thecombined yield of Argentine and Polish type canolavarieties decreased from the middle 1970s to thebeginning of the 1980s (e.g. Forhan, 1993; Malla,1996). To account for the yield effect of the conver-sion of rapeseed to canola, a variable was createdthat represents the percentage of total rapeseed/canola varieties seeded that were canola varieties.This variable is also included in the regression.
The total research expenditure per year was cal-culated by multiplying the total person-years invest-ed in the research by the total research cost, fixedand variable (Canola Research Survey, 1997), foreach year. A person-year is used to define either aprofessional person-year or a technical person-year,where a professional person-year corresponds to full-time annual work dedicated to professional researchand a technical person-year corresponds to full-timeannual work on technical research (as reported inthe Inventory of Canadian Agri-Food Research).
The data on canola research professional and tech-nical person-years were obtained from five sources:Canola Research Survey 1997–1998; Nagy andFurtan (1977); ISI (1997); ICAR (1998); andPhillips (1997). Where there were discrepancies inthe overlapping periods from the data source, theearlier estimates were indexed upwards to reflectlater estimates.2
An average adoption curve for canola varietieswas estimated rather than assuming a specific adop-tion lag structure. The individual adoption rate ofeach rapeseed/canola variety was calculated by divid-ing the acreage sown of each variety by the maxi-mum acreage sown of that variety for each year afterthe year of introduction. These adoption rates werethen averaged for all varieties and weighted to sumto one. The average adoption curve is reported inFig. 10.4.
The weighted average adoption rate of rape-seed/canola varieties was applied to the cost data tocreate a variable of the weighted lag research expen-diture. The adoption curve means that on averagethe acreage planted today to specific varieties is afunction of when in the past the varieties were intro-duced. The annual weighted yield index is thereforean average of the yield of varieties previously intro-duced weighted by the respective coefficients on theadoption curve. Mathematically,
118 R.S. Gray et al.
2 For more details on the data source and the calculation see Gray et al. (forthcoming).
Fig. 10.4. Average adoption curve for new canola varieties.
0
0.05
0.10
0.15
0.20
0.25
1 2 3 4 5 6 7 8Years after introduction
Pro
porti
on o
f acr
eage
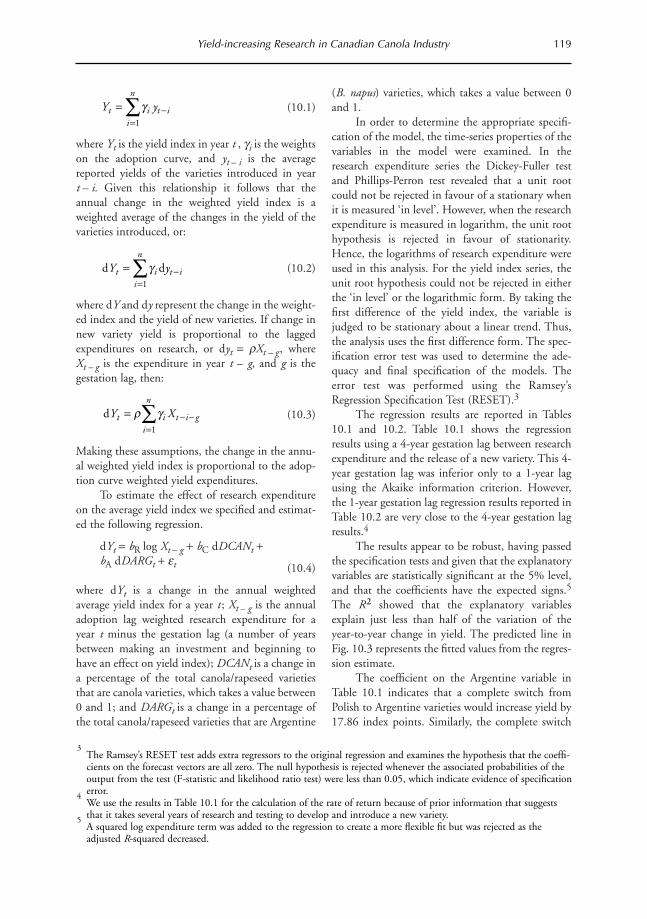
(10.1)
where Yt is the yield index in year t , gi is the weightson the adoption curve, and yt – i is the averagereported yields of the varieties introduced in yeart – i. Given this relationship it follows that theannual change in the weighted yield index is aweighted average of the changes in the yield of thevarieties introduced, or:
(10.2)
where dY and dy represent the change in the weight-ed index and the yield of new varieties. If change innew variety yield is proportional to the laggedexpenditures on research, or dyt = rXt – g , where Xt – g is the expenditure in year t – g, and g is thegestation lag, then:
(10.3)
Making these assumptions, the change in the annu-al weighted yield index is proportional to the adop-tion curve weighted yield expenditures.
To estimate the effect of research expenditureon the average yield index we specified and estimat-ed the following regression.
dYt = bR log Xt – g + bC dDCANt +bA dDARGt + et (10.4)
where dYt is a change in the annual weightedaverage yield index for a year t ; Xt – g is the annualadoption lag weighted research expenditure for ayear t minus the gestation lag (a number of yearsbetween making an investment and beginning tohave an effect on yield index); DCANt is a change ina percentage of the total canola/rapeseed varietiesthat are canola varieties, which takes a value between0 and 1; and DARGt is a change in a percentage ofthe total canola/rapeseed varieties that are Argentine
(B. napus) varieties, which takes a value between 0and 1.
In order to determine the appropriate specifi-cation of the model, the time-series properties of thevariables in the model were examined. In theresearch expenditure series the Dickey-Fuller testand Phillips-Perron test revealed that a unit rootcould not be rejected in favour of a stationary whenit is measured ‘in level’. However, when the researchexpenditure is measured in logarithm, the unit roothypothesis is rejected in favour of stationarity.Hence, the logarithms of research expenditure wereused in this analysis. For the yield index series, theunit root hypothesis could not be rejected in eitherthe ‘in level’ or the logarithmic form. By taking thefirst difference of the yield index, the variable isjudged to be stationary about a linear trend. Thus,the analysis uses the first difference form. The spec-ification error test was used to determine the ade-quacy and final specification of the models. Theerror test was performed using the Ramsey’sRegression Specification Test (RESET).3
The regression results are reported in Tables10.1 and 10.2. Table 10.1 shows the regressionresults using a 4-year gestation lag between researchexpenditure and the release of a new variety. This 4-year gestation lag was inferior only to a 1-year lagusing the Akaike information criterion. However,the 1-year gestation lag regression results reported inTable 10.2 are very close to the 4-year gestation lagresults.4
The results appear to be robust, having passedthe specification tests and given that the explanatoryvariables are statistically significant at the 5% level,and that the coefficients have the expected signs.5
The R2 showed that the explanatory variablesexplain just less than half of the variation of theyear-to-year change in yield. The predicted line inFig. 10.3 represents the fitted values from the regres-sion estimate.
The coefficient on the Argentine variable inTable 10.1 indicates that a complete switch fromPolish to Argentine varieties would increase yield by17.86 index points. Similarly, the complete switch
Yield-increasing Research in Canadian Canola Industry 119
3The Ramsey’s RESET test adds extra regressors to the original regression and examines the hypothesis that the coeffi-cients on the forecast vectors are all zero. The null hypothesis is rejected whenever the associated probabilities of theoutput from the test (F-statistic and likelihood ratio test) were less than 0.05, which indicate evidence of specificationerror.
4We use the results in Table 10.1 for the calculation of the rate of return because of prior information that suggeststhat it takes several years of research and testing to develop and introduce a new variety.
5A squared log expenditure term was added to the regression to create a more flexible fit but was rejected as theadjusted R-squared decreased.
Y yt i t ii
n
= -=
Âg1
d dY yt i t ii
n
= -=
Âg1
dY Xt i t i gi
n
= - -=
Âr g1
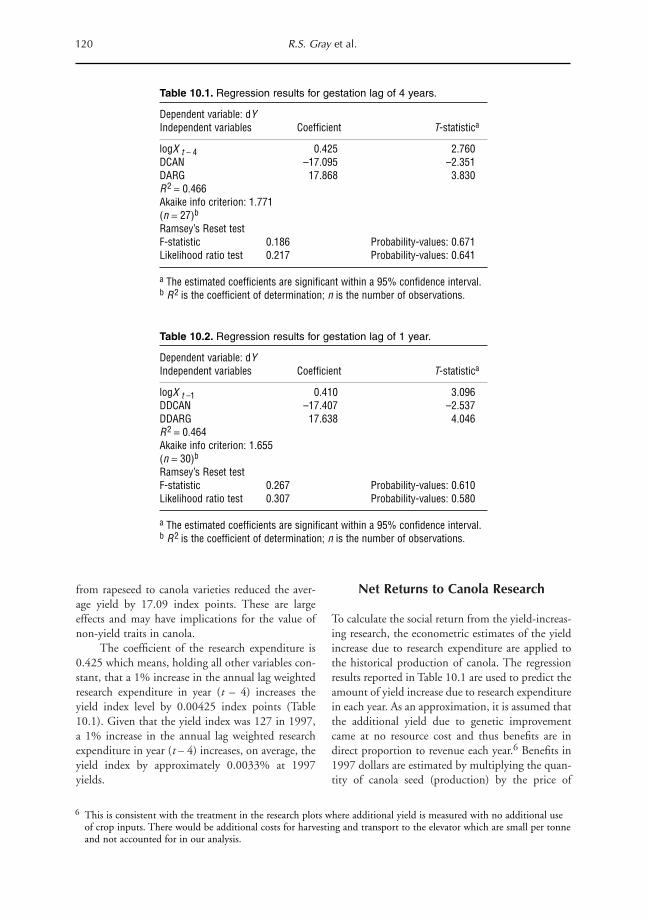
from rapeseed to canola varieties reduced the aver-age yield by 17.09 index points. These are largeeffects and may have implications for the value ofnon-yield traits in canola.
The coefficient of the research expenditure is0.425 which means, holding all other variables con-stant, that a 1% increase in the annual lag weightedresearch expenditure in year (t – 4) increases theyield index level by 0.00425 index points (Table10.1). Given that the yield index was 127 in 1997,a 1% increase in the annual lag weighted researchexpenditure in year (t – 4) increases, on average, theyield index by approximately 0.0033% at 1997yields.
Net Returns to Canola Research
To calculate the social return from the yield-increas-ing research, the econometric estimates of the yieldincrease due to research expenditure are applied tothe historical production of canola. The regressionresults reported in Table 10.1 are used to predict theamount of yield increase due to research expenditurein each year. As an approximation, it is assumed thatthe additional yield due to genetic improvementcame at no resource cost and thus benefits are indirect proportion to revenue each year.6 Benefits in1997 dollars are estimated by multiplying the quan-tity of canola seed (production) by the price of
120 R.S. Gray et al.
Table 10.1. Regression results for gestation lag of 4 years.
Dependent variable: dYIndependent variables Coefficient T-statistica
logX t – 4 0.425 2.760DCAN –17.095 –2.351DARG 17.868 3.830R2 = 0.466Akaike info criterion: 1.771(n = 27)b
Ramsey’s Reset testF-statistic 0.186 Probability-values: 0.671Likelihood ratio test 0.217 Probability-values: 0.641
a The estimated coefficients are significant within a 95% confidence interval.b R2 is the coefficient of determination; n is the number of observations.
Table 10.2. Regression results for gestation lag of 1 year.
Dependent variable: dYIndependent variables Coefficient T-statistica
logX t –1 0.410 3.096DDCAN –17.407 –2.537DDARG 17.638 4.046R2 = 0.464Akaike info criterion: 1.655(n = 30)b
Ramsey’s Reset testF-statistic 0.267 Probability-values: 0.610Likelihood ratio test 0.307 Probability-values: 0.580
a The estimated coefficients are significant within a 95% confidence interval.b R2 is the coefficient of determination; n is the number of observations.
6 This is consistent with the treatment in the research plots where additional yield is measured with no additional useof crop inputs. There would be additional costs for harvesting and transport to the elevator which are small per tonneand not accounted for in our analysis.

canola seed, and deflating by the consumer priceindex.7 The present values of research benefits areestimated by first calculating all future yield increas-es due to the yield increases in a particular year. Thisuses the notion that there is a stock of knowledgethat is subsequently built on. This calculation wasmade using various rates of depreciation. Thesefuture yield increases are then applied to the revenuein each future year to calculate the future benefits.For 1997 and beyond it was assumed that 1997 rev-enue would continue indefinitely. Once the futurestream of benefits is calculated this is then broughtback to the present value in the year of introductionusing a discount rate. The present value of costs for
varieties grown in year t is calculated from the pres-ent value in year t of the weighted expenditureslagged by the gestation period and the adoptioncurve. The net present value (NPV) of research iscalculated from the difference between the presentvalue of the benefits and the cost of the researchusing a number of depreciation and real discountrates.
The NPV results are reported in Table 10.3.What is most striking is that for each of the scenar-ios the NPV peaks in the 1980s and declines there-after. For instance, with 5% depreciation and a 6%real discount rate, the increase in the researchexpenditures resulted in an increase in net present
Yield-increasing Research in Canadian Canola Industry 121
7 The price of canola seed in Canada was obtained from Saskatchewan Agriculture and Food, Agricultural Statistics1997. The price of canola seed was the Saskatchewan farm price in Canadian dollars per metric tonne. The data forthe consumer price index (CPI) was obtained from Statistics Canada (1998a). Finally, the quantity of canola produc-tion was obtained from Statistics Canada (1998b).
Table 10.3. Net present value (US$ millions, 1997) under different scenarios.
Scenario A B C D E FDepreciation 0.01 0.05 0.01 0.05 0.01 0.05Real discount rate 0.03 0.03 0.06 0.06 0.09 0.09Year of yield change
1971 66.8 44.8 63.2 41.8 59.4 38.61972 71.2 48.2 67.1 44.8 62.9 41.21973 76.7 52.5 72.2 48.7 67.4 44.61974 80.4 55.1 75.3 50.7 69.9 46.01975 85.7 58.1 79.9 53.1 73.8 47.71976 92.3 61.6 85.9 56.1 79.0 50.01977 101.2 68.0 94.2 62.0 86.8 55.41978 104.4 69.7 97.1 63.3 89.2 56.31979 103.0 66.3 95.3 59.6 86.9 52.11980 295.4 107.8 198.0 86.8 153.7 71.01981 294.4 107.5 194.6 85.3 149.2 68.61982 297.4 110.2 194.6 86.6 147.7 69.01983 300.5 113.0 194.4 87.8 146.0 69.11984 302.3 112.8 191.8 85.8 141.4 65.81985 302.7 111.7 187.7 82.5 135.2 61.01986 304.5 112.7 185.2 81.3 130.5 58.21987 306.4 115.0 183.4 81.5 126.7 56.91988 305.1 115.7 179.1 80.3 121.0 54.21989 302.1 114.3 172.8 76.7 113.0 49.01990 303.6 116.4 169.9 76.0 107.8 46.41991 305.0 118.9 167.0 75.8 102.7 44.21992 305.5 120.6 162.8 74.4 96.1 40.61993 305.9 122.6 158.5 73.3 89.5 37.21994 300.0 118.0 147.5 65.1 75.8 26.61995 288.7 107.6 130.4 50.7 55.5 9.31996 277.6 97.5 113.2 36.2 35.0 –8.61997 268.9 90.8 99.1 25.1 17.8 –22.9

value from US$41 million in 1971 to a peak ofUS$88 million in 1983 which then began to declineas the increase in expenditures exceeded the growthin benefits. By 1997 the net present value of yieldincreases had declined to US$25 million.
Table 10.4 shows the estimated IRR for thechange in yield increases for the years 1970–1997,under different assumptions about deprecation ratesand lag structures. The first four columns show theIRR from the regression results from Table 10.1,with a 4-year gestation lag and 0%, 1%, 5% and10% depreciation rates, respectively. Not surprising-ly, the IRR declines as the deprecation rate increasesbecause the investment is not a durable. The last col-umn of Table 10.4 shows the IRR with a 1-year ges-tation period. As expected, this increases the IRRand illustrates once again that the IRR can be sensi-tive to assumptions about the gestation lag. What ismost striking in this table is the general decline inthe IRR as the level of investment has increased.
While the IRR was clearly excessive in the early1970s it had declined to market levels by the mid-1990s.
Given that many biotechnologies became pre-dominant during the 1980s the declining NPV andIRR provides little support to the notion thatbiotech has led to significant increases in the returnsto research. However, in 1997 about 35% of areawas sown to herbicide tolerant varieties and thus theresearch may have produced other benefits notmeasured as a yield increase. Yet, given the veryrecent introduction of herbicide tolerant varieties,this phenomenon does not explain the decline in theNPV prior to 1996.
The increase in the level of expenditures andthe declining IRR approaching market rates suggeststhat the assignment of property rights and matchinggrants has corrected the public good market failure.Further extrapolation of these rates of return wouldsuggest an over-investment in the sector resulting in
122 R.S. Gray et al.
Table 10.4. Estimated internal rate of return for yield increase (1967–1993).
Lag 4 year 4 year 4 year 4 year 1 yearDepreciation 0% 1% 5% 10% 5%Year of yield change
1971 0.398 0.382 0.324 0.260 0.4711972 0.384 0.369 0.313 0.252 0.4421973 0.371 0.356 0.303 0.245 0.4251974 0.350 0.336 0.285 0.228 0.4041975 0.336 0.322 0.271 0.215 0.3891976 0.328 0.313 0.261 0.205 0.3751977 0.327 0.312 0.261 0.208 0.3801978 0.318 0.304 0.253 0.201 0.3751979 0.304 0.289 0.236 0.180 0.3551980 0.366 0.343 0.262 0.182 0.3971981 0.353 0.331 0.253 0.174 0.3801982 0.344 0.323 0.248 0.172 0.3691983 0.333 0.314 0.243 0.170 0.3591984 0.319 0.301 0.232 0.159 0.3381985 0.304 0.286 0.218 0.145 0.3151986 0.290 0.272 0.208 0.137 0.2991987 0.276 0.260 0.200 0.134 0.2891988 0.263 0.248 0.192 0.130 0.2751989 0.247 0.233 0.181 0.121 0.2561990 0.235 0.222 0.173 0.118 0.2441991 0.223 0.211 0.167 0.117 0.2311992 0.210 0.199 0.159 0.113 0.2131993 0.198 0.188 0.153 0.112 0.1971994 0.179 0.170 0.137 0.100 0.1711995 0.152 0.145 0.114 0.079 0.1361996 0.126 0.119 0.092 0.060 0.1021997 0.105 0.099 0.075 0.047 0.076
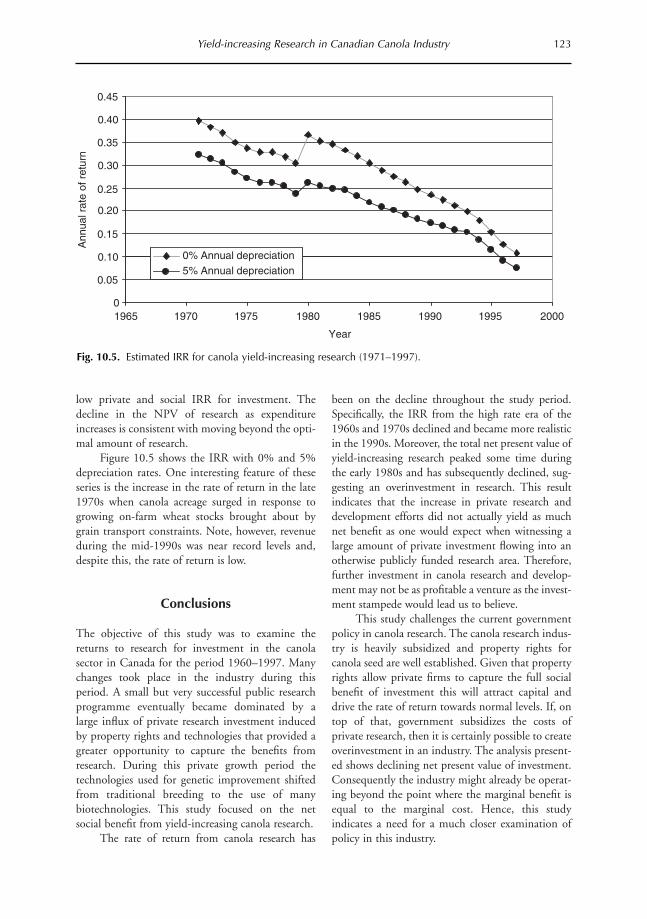
low private and social IRR for investment. Thedecline in the NPV of research as expenditureincreases is consistent with moving beyond the opti-mal amount of research.
Figure 10.5 shows the IRR with 0% and 5%depreciation rates. One interesting feature of theseseries is the increase in the rate of return in the late1970s when canola acreage surged in response togrowing on-farm wheat stocks brought about bygrain transport constraints. Note, however, revenueduring the mid-1990s was near record levels and,despite this, the rate of return is low.
Conclusions
The objective of this study was to examine thereturns to research for investment in the canolasector in Canada for the period 1960–1997. Manychanges took place in the industry during thisperiod. A small but very successful public researchprogramme eventually became dominated by alarge influx of private research investment inducedby property rights and technologies that provided agreater opportunity to capture the benefits fromresearch. During this private growth period thetechnologies used for genetic improvement shiftedfrom traditional breeding to the use of manybiotechnologies. This study focused on the netsocial benefit from yield-increasing canola research.
The rate of return from canola research has
been on the decline throughout the study period.Specifically, the IRR from the high rate era of the1960s and 1970s declined and became more realisticin the 1990s. Moreover, the total net present value ofyield-increasing research peaked some time duringthe early 1980s and has subsequently declined, sug-gesting an overinvestment in research. This resultindicates that the increase in private research anddevelopment efforts did not actually yield as muchnet benefit as one would expect when witnessing alarge amount of private investment flowing into anotherwise publicly funded research area. Therefore,further investment in canola research and develop-ment may not be as profitable a venture as the invest-ment stampede would lead us to believe.
This study challenges the current governmentpolicy in canola research. The canola research indus-try is heavily subsidized and property rights forcanola seed are well established. Given that propertyrights allow private firms to capture the full socialbenefit of investment this will attract capital anddrive the rate of return towards normal levels. If, ontop of that, government subsidizes the costs ofprivate research, then it is certainly possible to createoverinvestment in an industry. The analysis present-ed shows declining net present value of investment.Consequently the industry might already be operat-ing beyond the point where the marginal benefit isequal to the marginal cost. Hence, this studyindicates a need for a much closer examination ofpolicy in this industry.
Yield-increasing Research in Canadian Canola Industry 123
Fig. 10.5. Estimated IRR for canola yield-increasing research (1971–1997).
0
0.05
0.10
0.15
0.20
0.25
0.30
0.35
0.40
0.45
1965 1970 1975 1980 1985 1990 1995 2000
Year
0% Annual depreciation5% Annual depreciation
Ann
ual r
ate
of r
etur
n
The general result that biotechnology has yetto produce measurable high social returns in thecanola sector raises some very important questions.Clearly, genetic traits other than yield have econom-ic value; would the incorporation of these effectschange the general conclusion? If the net presentvalue has fallen, does the vintage of a crop, to a largeextent, dictate the rate of return to research? Is therea natural cycle to crop development, which has anincreasing and then a decreasing return to researchinvestment? If this is true, then should public invest-ment be targeted to crops on the basis of vintagerather than historic rates of return? A related ques-tion is: what has been happening to the rate of thereturn in other crops and in other sectors? Of par-ticular importance is whether the falling rate ofreturn in canola is the result of the assignment ofIPRs that have become general to all crops, or domarket failures continue to exist in other cropswhere hybrids and other physical reproductive bar-riers do not exist? Answering these will provide someimportant insights into the best policies to governthe rapidly expanding biotechnology industry.
References
Akgüngör, S., Makanda, D.W., Oehmke, J.F., Myers, R.J.
and Choe, Y.C. (1996) Dynamic analysis of Kenyan
wheat research and rate of return. Contributed paper
Proceedings from the Conference on Global AgriculturalPolicy for the Twenty-First Century, Melbourne,
Australia, 26–28 August 1996, pp. 333–366.
Alston, J.M. and Carter, H.O. (1994) Valuing California’sAgricultural Research and Extension, Publication No.
VR-1. University of California Agricultural Issues
Center, Davis, California.
Alston, J.M., Norton, G.W. and Pardey, P.G. (1997)
Science Under Scarcity: Principles and Practice forAgricultural Research Evaluation and Priority Setting.Cornell University Press, Ithaca, New York.
Alston, J.M., Craig, B.J. and Pardey, P.G. (1998) Dynamicsin the Creation and Depreciation of Knowledge, andthe Returns to Research, GPTD Discussion Paper No.
35 (August). International Food Policy Research
Institute, Washington, DC.
Canadian Food Inspection Agency (1998) CanadianVarieties. January 1, 1923 to June 24, 1998. Special
Tabulation from the Plant Health and Production
Division. www.inspection.gc.ca
Canola Council of Canada (1998) Canola growers’ manual.
www.canola-council.org/manual/canolafr.htm
Canola Research Survey (1997) College of Agriculture.
University of Saskatchewan.
Chavas, J.-P. and Cox, T.-L. (1992) A nonparametric
analysis of the effects of research on agricultural pro-
ductivity. American Journal of Agricultural Economics74, 583–591.
Evenson, R.E. (1996) Two blades of grass: research for
U.S. agriculture. In: Antle, J.M. and Sumner, D.A.
(eds) The Economics of Agriculture, Vol. 2, Papers inHonor of D. Gale Johnson. University of Chicago
Press, Chicago, Illinois, pp. 171–203.
Forhan, M. (1993) Canola breeding goes private. CanolaGuide, 28–31.
Gray, R., Malla, S. and Phillips, P. (1999) The public and
not-for-profit sectors in a biotechnology-based, pri-
vatizing world: the canola case. In: Lesser, W.H. (ed.)
Proceedings of NE-165 Conference, Transitions inAgbiotech: Economics of Strategy and Policy.
Huffman, W.E. and Evenson, R.E. (1989) Supply and
demand functions for multiproduct U.S. cash grain
farms: biases caused by research and other policies.
American Journal of Agricultural Economics 71,
761–773.
Huffman, W.E. and Evenson, R.E. (1992) Contributions
of public and private science and technology to U.S.
agricultural productivity. American Journal ofAgricultural Economics 74, 752–756.
Huffman, W.E. and Evenson, R.E. (1993) Science forAgriculture: a Long-Term Perspective. Iowa State
University Press, Ames, Iowa.
ICAR (Inventory of Canadian Agri-Food Research) (1998)
Special tabulation upon request.
ISI (Institute for Scientific Investigation) (1997) Citations
database, special tabulation of academic publications
based on key word search for canola. November
1997.
Leiby, J.D. and Adams, G.D. (1991) The returns to agri-
cultural research in Maine: the case of a small north-
eastern experiment station. Northeastern Journal ofAgricultural and Resource Economics 20, 1–14.
Makki, S.S., Tweeten, L.G. and Thraeu, C.S. (1996)
Returns to agricultural research: are we assessing
right? Contributed paper Proceedings from theConference on Global Agricultural Science Policy for theTwenty-First Century. Melbourne, Australia, 26–28
August 1996, pp. 89–114.
Malla, S. (1996) The distribution of the economic and
health benefits from canola research. MSc thesis.
University of Saskatchewan, Saskatoon,
Saskatchewan.
Malla, S., Gray, R. and Phillips, P.W.B. (1998) TheEvolution of Canola Research: an Example of Success.An interim report prepared for Agriculture
Development Fund, Saskatchewan Agriculture and
Food, Department of Agricultural Economics,
University of Saskatchewan, Saskatoon,
Saskatchewan.
Manitoba Crop Insurance Corporation (1998) VarietySummary, 1993–1997.
124 R.S. Gray et al.
Myers, R.J. and Jayne, T. (1997) Regime shifts and tech-
nology diffusion in crop yield growth paths with an
application to maize yields in Zimbabwe. AustralianJournal of Agricultural and Resource-Economics 41,
285–303.
Nagy, J.G. and Furtan, W.H. (1977) The Socio-EconomicCosts and Returns from Rapeseed Breeding in Canada.Department of Agricultural Economics, University
of Saskatchewan, Saskatoon, Saskatchewan.
Nagy, J.G. and Furtan, W.H. (1978) Economic costs and
returns from crop development research: the case of
rapeseed breeding in Canada. Canadian Journal ofAgricultural Economics 26, 1–14.
Pardey, P.G. and Craig, B. (1989) Causal relationships
between public sector agricultural research expendi-
tures and output. American Journal of AgriculturalEconomics 71, 9–19.
Phillips, P. (1997) Manual search of ISI Citations Index.
July.
Prairie Pools Inc. (1977–1992) Prairie Grain VarietySurvey. Various issues.
Ravenscraft, D. and Scherer, F.M. (1982) The lag structure
of returns to research and development. AppliedEconomics 14, 603–620.
Saskatchewan Agriculture and Food (1997) Agricultural
Statistics. Saskatchewan Agriculture and Food,
Regina, Saskatchewan.
Saskatchewan Agriculture and Food (Various issues)
Varieties of Grains Crops in Saskatchewan.Saskatchewan Agriculture and Food, Regina,
Saskatchewan.
Statistics Canada (1998a) Direct cansim time series: CPI
and all goods for Canada. www.datacenter.chass.
utoronto.ca:5680/cansim/cansim.html
Statistics Canada (1998b) Direct cansim time series:
canola – rapeseed/production, metric tonnes, canola
– Canada. www.datacenter.chass.utoronto.ca:5680/
cansim/cansim.html
Thirtle, C.G. and Bottomley, P. (1988) Is publicly funded
agricultural research excessive? Journal of AgriculturalEconomics 31, 99–111.
Ulrich, A.W. and Furtan, W.H. (1985) An investigation inthe rates of return from the Canadian Crop BreedingProgram. Report by Department of Agricultural
Economics, University of Saskatchewan, Saskatoon,
Saskatchewan.
Ulrich, A., Furtan, H. and Downey, K. (1987)
Biotechnology and Rapeseed Breeding: Some EconomicConsiderations. Science Council of Canada, Ottawa,
Ontario.
Yield-increasing Research in Canadian Canola Industry 125

American maize and soybean farmers have rapidlyadopted genetically modified (GM) seed with traitssuch as herbicide tolerance and pest resistance sincetheir introduction in 1996. By 1999, GM varietiesaccounted for 33% of commercial maize acreage inmajor states and 57% of commercial soybeanacreage (USDA, 2000). However, the future use ofGM crops is uncertain given the current controver-sy in Europe and Japan. Fernandez-Cornejo et al.(2000) suggest that the traditional methods to pre-dict adoption are insufficient given this marketuncertainty. In this chapter, we use results fromfocus groups and a pre-planting survey of Iowamaize–soybean farmers to examine individual farm-ers’ decisions to adopt GM crops.
GM crops carrying herbicide tolerant geneswere developed to survive specific broad spectrumherbicides, increasing the number of effective post-emergent herbicides available to farmers. The mostcommon herbicide-tolerant crops are RoundupReady (RR) crops which are resistant to glyphosate.Roundup Ready traits are commercially available forsoybeans, maize, canola and cotton. Liberty Link(LL) maize is another GM herbicide tolerant cropresistant to glufosinate-ammonium. The only insectresistant crops commercially available are Bt crops
containing a gene from a soil bacterium Bacillusthuringiensis. Bt maize produces a protein that istoxic to the European corn borer (ECB), a majormaize pest.
The decision to adopt a new technologydepends on the expected profitability of the innova-tion which is determined by the characteristics ofthe farmer, the farm, the innovation, the institu-tional setting of the farm, and the farmers’ beliefsabout the innovation (Kinnucan et al., 1990). Thereare several well-established links between the adop-tion decision and characteristics of the farmer andfarm. First, farmers who have more allocative abili-ty, which can be measured in part by human capitalmeasures such as schooling and experience, are morelikely to profit from an innovation (Welch, 1970;Kislev and Shchori-Bachrach, 1973; Huffman,1974; Feder et al., 1985). Second, farmers’ riskpreferences will affect both the adoption decisionand the extent of adoption. Farmers who are morerisk averse will be less likely to adopt a new, uncertaininnovation (Feder et al., 1985; Chavas and Holt,1990; Pope and Just, 1991). Last, farm size has beenshown to play a significant role in adoption (Lindner,1983; Feder et al., 1985; Feder and Slade, 1986).Larger farms are more likely to adopt an innovation
127
11 Determinants of GMO Use: a Survey ofIowa Maize–Soybean Farmers’ Acreage
Allocation1
Corinne Alexander,1 Jorge Fernandez-Cornejo2 and Rachael E. Goodhue1
1Department of Agricultural and Resource Economics, University of California, Davis,California, USA; 2Economic Research Service, USDA, Washington DC, USA
© CAB International 2002. Market Development for Genetically Modified Foods(eds V. Santaniello, R.E. Evenson and D. Zilberman)
1 The views expressed are those of the authors and do not necessarily correspond to the views or policies of the USDepartment of Agriculture.
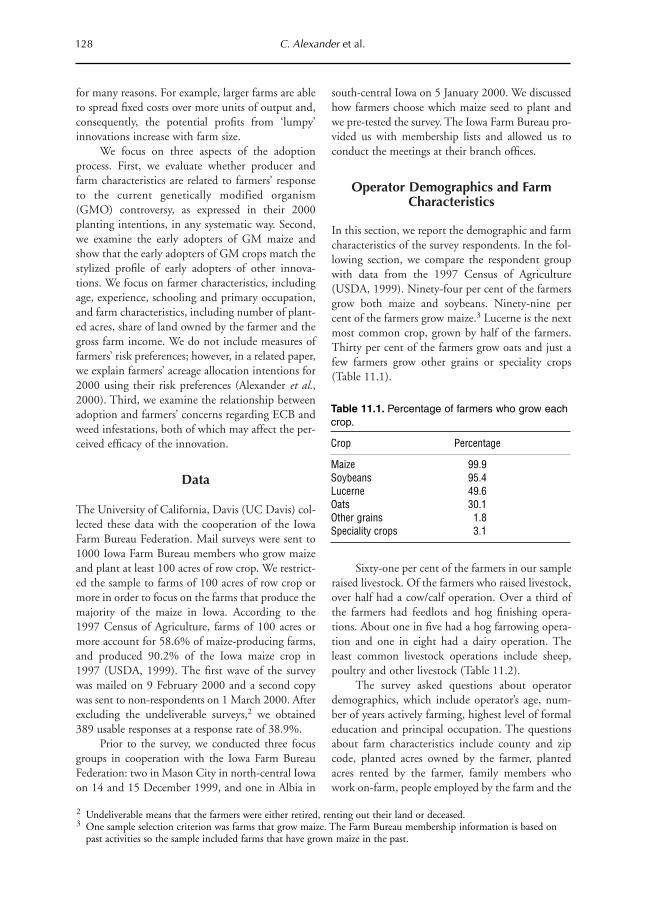
for many reasons. For example, larger farms are ableto spread fixed costs over more units of output and,consequently, the potential profits from ‘lumpy’innovations increase with farm size.
We focus on three aspects of the adoptionprocess. First, we evaluate whether producer andfarm characteristics are related to farmers’ responseto the current genetically modified organism(GMO) controversy, as expressed in their 2000planting intentions, in any systematic way. Second,we examine the early adopters of GM maize andshow that the early adopters of GM crops match thestylized profile of early adopters of other innova-tions. We focus on farmer characteristics, includingage, experience, schooling and primary occupation,and farm characteristics, including number of plant-ed acres, share of land owned by the farmer and thegross farm income. We do not include measures offarmers’ risk preferences; however, in a related paper,we explain farmers’ acreage allocation intentions for2000 using their risk preferences (Alexander et al.,2000). Third, we examine the relationship betweenadoption and farmers’ concerns regarding ECB andweed infestations, both of which may affect the per-ceived efficacy of the innovation.
Data
The University of California, Davis (UC Davis) col-lected these data with the cooperation of the IowaFarm Bureau Federation. Mail surveys were sent to1000 Iowa Farm Bureau members who grow maizeand plant at least 100 acres of row crop. We restrict-ed the sample to farms of 100 acres of row crop ormore in order to focus on the farms that produce themajority of the maize in Iowa. According to the1997 Census of Agriculture, farms of 100 acres ormore account for 58.6% of maize-producing farms,and produced 90.2% of the Iowa maize crop in1997 (USDA, 1999). The first wave of the surveywas mailed on 9 February 2000 and a second copywas sent to non-respondents on 1 March 2000. Afterexcluding the undeliverable surveys,2 we obtained389 usable responses at a response rate of 38.9%.
Prior to the survey, we conducted three focusgroups in cooperation with the Iowa Farm BureauFederation: two in Mason City in north-central Iowaon 14 and 15 December 1999, and one in Albia in
south-central Iowa on 5 January 2000. We discussedhow farmers choose which maize seed to plant andwe pre-tested the survey. The Iowa Farm Bureau pro-vided us with membership lists and allowed us toconduct the meetings at their branch offices.
Operator Demographics and FarmCharacteristics
In this section, we report the demographic and farmcharacteristics of the survey respondents. In the fol-lowing section, we compare the respondent groupwith data from the 1997 Census of Agriculture(USDA, 1999). Ninety-four per cent of the farmersgrow both maize and soybeans. Ninety-nine percent of the farmers grow maize.3 Lucerne is the nextmost common crop, grown by half of the farmers.Thirty per cent of the farmers grow oats and just afew farmers grow other grains or speciality crops(Table 11.1).
Sixty-one per cent of the farmers in our sampleraised livestock. Of the farmers who raised livestock,over half had a cow/calf operation. Over a third ofthe farmers had feedlots and hog finishing opera-tions. About one in five had a hog farrowing opera-tion and one in eight had a dairy operation. Theleast common livestock operations include sheep,poultry and other livestock (Table 11.2).
The survey asked questions about operatordemographics, which include operator’s age, num-ber of years actively farming, highest level of formaleducation and principal occupation. The questionsabout farm characteristics include county and zipcode, planted acres owned by the farmer, plantedacres rented by the farmer, family members whowork on-farm, people employed by the farm and the
128 C. Alexander et al.
2 Undeliverable means that the farmers were either retired, renting out their land or deceased.3 One sample selection criterion was farms that grow maize. The Farm Bureau membership information is based on
past activities so the sample included farms that have grown maize in the past.
Table 11.1. Percentage of farmers who grow eachcrop.
Crop Percentage
Maize 99.9Soybeans 95.4Lucerne 49.6Oats 30.1Other grains 1.8Speciality crops 3.1

total gross farm income (GFI) in 1999. Table 11.3presents selected descriptive statistics and Tables11.4 to 11.8 present more detailed information onoperator demographics and farm characteristics.
The average operator in the sample is 54-years-old and has been actively farming for 32 years.Eighty-four per cent of the operators in the samplesay that farming is their primary occupation. Theaverage farm size is 560 acres and the average opera-tor owns 52% of the land he or she farms. Themedian farmer holds a high school diploma.
GFI is used as a measure of farm size, in addi-tion to total acres, because it provides information
about activities such as hog finishing, which do notrequire many acres, but do require substantial man-agement effort and other inputs. The median farmerin our sample has a GFI of US$100,000–249,999.
There are several significant correlations betweenthe operator demographics and farm characteristics.4
The age of the operator and years of farming experi-ence are significantly and positively correlated. Theage of the operator and years of formal education aresignificantly and negatively correlated, indicating that
Determinants of GMO Use 129
4 We calculate the Pearson’s product-moment correlation and test the null hypothesis that the correlation is significant-ly different from zero with a t-test with n – 2 degrees of freedom.
Table 11.2. Percentage of livestock operators whoengaged in each activity.
Livestock operation Percentage
Hog finishing 35.1Hog farrowing 18.6Cow/calf 57.4Feedlot 37.6Dairy 12.0Sheep 5.4Poultry 2.9Other livestock 2.9
Table 11.3. Operator demographics andcharacteristics of their farms.
All farmers
Sample size 389Average age 54Average years’ experience 32Share farming primary occupation 84%Average acres farmed 560Average share land owned 52%
Table 11.5. Percentage of UC Davis farms in eachtotal gross farm income category in 1999.
Income category Percentage
Less than US$10,000 2.2US$10,000–19,999 6.0US$20,000–24,999 3.3US$25,000–39,999 5.7US$40,000–49,999 5.4US$50,000–99,999 15.4US$100,000–249,999 35.0US$250,000–499,999 19.8US$500,000 or more 7.3
Table 11.6. Percentage of farms in each sizecategory.
Acres UC Davis 1999 NASS 1997
1–49 0 18.350–179 15.4 27180–499 35.9 31.9500–999 35.4 16.31000 or more 13.0 7.5
Table 11.7. Percentage of farms in each totalgross farm income category.
Income category UC Davis 1999 NASS 1997
Less than $10,000 2.2 26US$10,000–49,000 20.3 24.2US$50,000–99,999 15.4 15.1US$100,000–249,999 35.0 21.1US$250,000 or more 27.1 13.6
Table 11.8. Operators by principal occupation.
UC Davis 1999 NASS 1997
Farming 84% 62%Other 16% 38% Table 11.4. Percentage of UC Davis respondents
and their highest level of formal education attained.
Education category Percentage
Grade school 3.4Some high school 2.4High school diploma 45.4Some college work 14.8Some vocational technical work 8.22-year community college degree 8.24-year college degree 12.4Some postgraduate work 2.9Postgraduate degree 2.4

younger farmers tend to have more schooling. Olderfarmers own a larger share of the land they farm thanyounger operators, but they also have smaller farms.Consistent with the negative correlation between ageand schooling, farmers with more education are sig-nificantly more likely to own a smaller share of theland they farm and to have larger farms.
Full-time farmers have significantly higher GFIsthan part-time farmers. Part-time farmers have signif-icantly more formal education than full-time farmers.There is no correlation between age and whether therespondent is a full-time or part-time farmer.
Younger, less experienced farmers are signifi-cantly more likely to have higher GFIs and to oper-ate larger farms. Farmers with a higher level of formaleducation have significantly higher GFIs. Again,these relationships are consistent with the significantnegative correlation between age and schooling.
Comparison with NASS Data
The differences between the UC Davis surveyrespondents and Iowa farmers as a whole can beexplained by two sampling decisions: the UC Davissample was based on Iowa Farm Bureau members,and farms that had at least 100 acres of row crop. Forthis reason, the farmers in the UC Davis survey tendto operate larger farms than Iowa farmers as a whole.According to the 1997 Census of Agriculture, 41.4%of Iowa maize producers farm less than 100 acres.These farmers were not sampled in the UC Davissurvey due to the minimum farm size requirement.However, producers that farm 100 acres or moregrew 90.2% of the 1997 Iowa maize crop (USDA,1999). Hence, farmers in the UC Davis survey rep-resent the majority of Iowa maize production.
Based on GFI, the average UC Davis surveyfarm is larger than the average Iowa farm, as expect-ed due to the minimum acreage requirement.Twenty-six per cent of Iowa farmers have a GFI ofless than US$10,000 compared with about 2% ofUC Davis respondents. Even more striking, 62% ofUC Davis farmers had a GFI of US$100,000 ormore compared with 34% of Iowa farmers.
A larger share of the farmers in the UC Davis
sample are full-time farmers than Iowa farmers as agroup. Eighty-four per cent of UC Davis surveyrespondents describe farming as their primary occu-pation compared with 62% of Iowa farmers. Sincefull-time farmers have larger farms than part-timefarmers, this difference is consistent with the largerfarms in the UC Davis sample.
Planting Intentions
There is a great deal of uncertainty about the futureuse of bio-engineered seed. Prior to planting in1999, European governments explicitly banned theimport of specific maize hybrids with stacked traits.GMO use in the food chain has become even morecontentious over the past year. There is a great dealof uncertainty regarding the European response, aswell as the response of consumers and regulators inJapan and the USA. To date, American consumers’reaction has been limited. However, several large USbased corporations including Frito Lay, Gerber andHeinz have committed to delivering non-GM foodproducts to their customers. Farmers are aware ofthe potential marketing difficulties that may emergeas a result of this uncertain demand. In interviewsand focus groups with farmers in December 1999and January 2000, Iowa grain farmers expressedconcern about planting GM crops due to marketingconsiderations. Producers cited three marketingconcerns: first, that their local grain elevator wouldrefuse all GM crops;5 second, that GM crops wouldface a price penalty; and third, that grain elevatorswould delay accepting GM grain for some indeter-minate period of time after harvest.
Based on farmers’ planting intentions for2000, we identify four groups of farmers: (i) a GMusers group which grew GM crops in 1999 and plansto continue growing GM crops in 2000; (ii) a con-ventional only group which did not grow GM cropsin 1999 and plans to grow only conventional cropsin 2000; (iii) a disadopters group which plans to dis-adopt GM crops in 2000; and (iv) a new adoptersgroup which plans to adopt GM crops for the firsttime in 2000.6 We apply these categories to pro-ducers’ acreage allocation responses to GM maize
130 C. Alexander et al.
5 Apparently in 1999 the neighbour of a focus group participant had to transport his grain an additional 25 milesbecause the nearest elevator refused all GM grain.
6 For GM maize, we define new adopters as farmers who did not plant GM maize in 1997, 1998 or 1999, but intendto plant GM maize in 2000. For soybeans, we only have data on acres planted in 1999 and intentions for 2000.Hence, we define adopters as farmers who did not plant GM soybeans in 1999, though they may have planted themin previous years.

and GM soybeans separately because their reactionsdiffer consistently for maize and soybeans. Over halfof the producers have the same planting intentionsfor both maize and soybeans, that is, they fall intothe same category for both crops. However, 15% ofproducers are GM users for soybeans and conven-tional only for maize. Another 8% who are GMusers for soybeans plan to disadopt GM maize in2000. Less than 5% of the producers are GM usersfor maize and disadopting GM soybeans. Overall forthe 2000 crop year, farmers are more likely to reduceacreage or disadopt GM maize than GM soybeans.In fact, many producers are planning to increasetheir GM soybean acreage.
Comparing the maize and soybeancategories
We find that the profile of farmers in each group isconsistent across maize and soybeans. The twolargest groups are GM users and conventional only.The GM users group is younger, less experienced,has more schooling, has a larger share of full-timefarmers and operates larger farms than the conven-tional only group.
The disadopters are demographically similar tothe GM users, but they tend to operate farms thatare smaller than those of the GM users. Disadoptersmay be more sensitive to the current market condi-tions than the GM users because of their smallerfarm size.
The new adopters are the smallest group.There are at least two potential explanations that areconsistent with this behaviour. First, the currentmarket uncertainty may cause potential adopters to
delay adoption. Indeed, one wonders why there areany adopters, given the market uncertainty. Onepossible explanation is that GM crops may be a sub-stitute for human capital.7 The new adopters havethe least amount of schooling of the four groups.Second, there may be few adopters because the dif-fusion of GM crops may be approaching the ceiling.The new adopters fit the profile of followers thatadopt innovations towards the end of the diffusionprocess; they have the least amount of schooling, areolder than GM users and disadopters, and operaterelatively small farms.
GM maize
With respect to maize, over half of the farmers areGM users and 27% are conventional only. Morefarmers decided to disadopt than adopt GM maize;15% are disadopters while only 3% are newadopters. The large number of disadopters is con-sistent with the increase in market uncertainty.Another factor affecting disadoption decisions maybe the lack of ECB infestation in Iowa in the 1998and 1999 seasons. In focus groups, many producersindicated that they were considering reducing theiruse of Bt maize due to the lack of realized returns inprevious seasons. In a later section, we discuss therelationship between adoption and concern regard-ing ECB infestation in more detail.
Conventional-only farmers were the oldest,with an average age of 58. They have the smallestaverage farm size of 380 acres. Consistent with thesmaller farm size, these farmers had generally lowerGFIs. Only 36% had a GFI of US$100,000 ormore. They are also more likely to be part-timefarmers (Table 11.9).
Determinants of GMO Use 131
7 In the focus groups and supplementary interviews, several farmers and one grain elevator manager said that herbicidetolerant crops and pest resistant crops are easier to manage. According to the grain elevator manager, Roundup Readysoybeans ‘make everyone good bean farmers’.
Table 11.9. Operator demographics and characteristics of their farms for each group.
GM maize in No GM maize in Disadopted GM Adopted GM1999 and 2000 1999 and 2000 maize in 2000 maize in 2000
Sample size 185 94 51 14Average age 52 58 51 55Average years’ experience 29 35 29 35Share farming primary occupation 87% 73% 94% 93%Average acres farmed 717 380 619 583Average share land owned 44% 62% 40% 58%
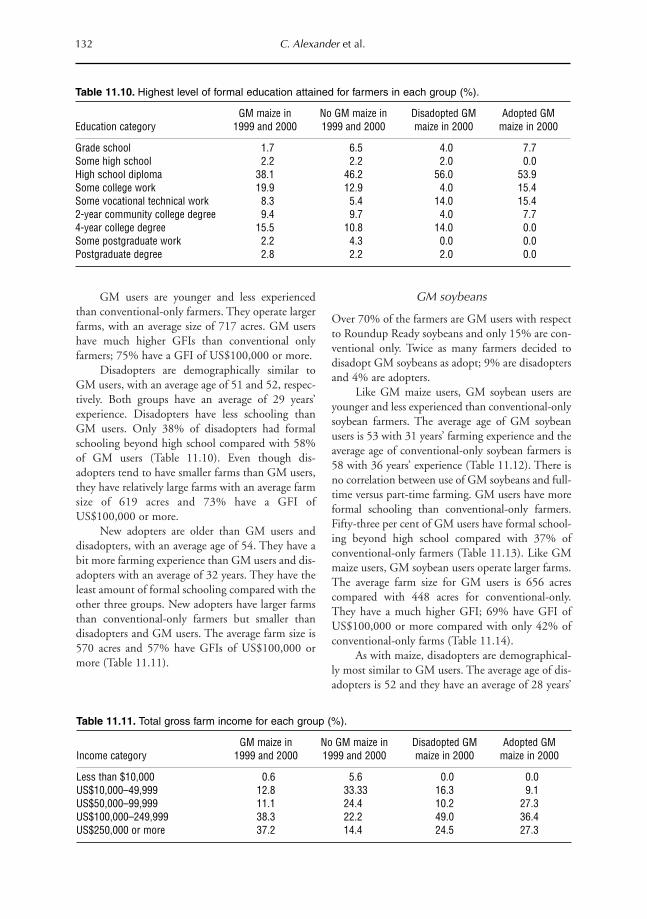
GM users are younger and less experiencedthan conventional-only farmers. They operate largerfarms, with an average size of 717 acres. GM usershave much higher GFIs than conventional onlyfarmers; 75% have a GFI of US$100,000 or more.
Disadopters are demographically similar toGM users, with an average age of 51 and 52, respec-tively. Both groups have an average of 29 years’experience. Disadopters have less schooling thanGM users. Only 38% of disadopters had formalschooling beyond high school compared with 58%of GM users (Table 11.10). Even though dis-adopters tend to have smaller farms than GM users,they have relatively large farms with an average farmsize of 619 acres and 73% have a GFI ofUS$100,000 or more.
New adopters are older than GM users anddisadopters, with an average age of 54. They have abit more farming experience than GM users and dis-adopters with an average of 32 years. They have theleast amount of formal schooling compared with theother three groups. New adopters have larger farmsthan conventional-only farmers but smaller thandisadopters and GM users. The average farm size is570 acres and 57% have GFIs of US$100,000 ormore (Table 11.11).
GM soybeans
Over 70% of the farmers are GM users with respectto Roundup Ready soybeans and only 15% are con-ventional only. Twice as many farmers decided todisadopt GM soybeans as adopt; 9% are disadoptersand 4% are adopters.
Like GM maize users, GM soybean users areyounger and less experienced than conventional-onlysoybean farmers. The average age of GM soybeanusers is 53 with 31 years’ farming experience and theaverage age of conventional-only soybean farmers is58 with 36 years’ experience (Table 11.12). There isno correlation between use of GM soybeans and full-time versus part-time farming. GM users have moreformal schooling than conventional-only farmers.Fifty-three per cent of GM users have formal school-ing beyond high school compared with 37% ofconventional-only farmers (Table 11.13). Like GMmaize users, GM soybean users operate larger farms.The average farm size for GM users is 656 acrescompared with 448 acres for conventional-only.They have a much higher GFI; 69% have GFI ofUS$100,000 or more compared with only 42% ofconventional-only farms (Table 11.14).
As with maize, disadopters are demographical-ly most similar to GM users. The average age of dis-adopters is 52 and they have an average of 28 years’
132 C. Alexander et al.
Table 11.10. Highest level of formal education attained for farmers in each group (%).
GM maize in No GM maize in Disadopted GM Adopted GMEducation category 1999 and 2000 1999 and 2000 maize in 2000 maize in 2000
Grade school 1.7 6.5 4.0 7.7Some high school 2.2 2.2 2.0 0.0High school diploma 38.1 46.2 56.0 53.9Some college work 19.9 12.9 4.0 15.4Some vocational technical work 8.3 5.4 14.0 15.42-year community college degree 9.4 9.7 4.0 7.74-year college degree 15.5 10.8 14.0 0.0Some postgraduate work 2.2 4.3 0.0 0.0Postgraduate degree 2.8 2.2 2.0 0.0
Table 11.11. Total gross farm income for each group (%).
GM maize in No GM maize in Disadopted GM Adopted GMIncome category 1999 and 2000 1999 and 2000 maize in 2000 maize in 2000
Less than $10,000 0.6 5.6 0.0 0.0US$10,000–49,999 12.8 33.33 16.3 9.1US$50,000–99,999 11.1 24.4 10.2 27.3US$100,000–249,999 38.3 22.2 49.0 36.4US$250,000 or more 37.2 14.4 24.5 27.3
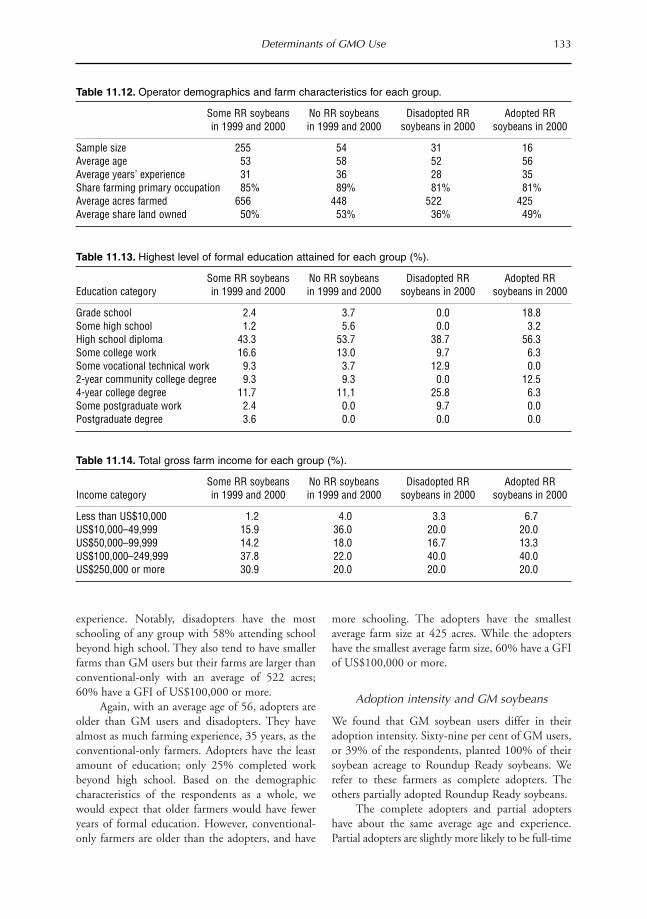
experience. Notably, disadopters have the mostschooling of any group with 58% attending schoolbeyond high school. They also tend to have smallerfarms than GM users but their farms are larger thanconventional-only with an average of 522 acres;60% have a GFI of US$100,000 or more.
Again, with an average age of 56, adopters areolder than GM users and disadopters. They havealmost as much farming experience, 35 years, as theconventional-only farmers. Adopters have the leastamount of education; only 25% completed workbeyond high school. Based on the demographiccharacteristics of the respondents as a whole, wewould expect that older farmers would have feweryears of formal education. However, conventional-only farmers are older than the adopters, and have
more schooling. The adopters have the smallestaverage farm size at 425 acres. While the adoptershave the smallest average farm size, 60% have a GFIof US$100,000 or more.
Adoption intensity and GM soybeans
We found that GM soybean users differ in theiradoption intensity. Sixty-nine per cent of GM users,or 39% of the respondents, planted 100% of theirsoybean acreage to Roundup Ready soybeans. Werefer to these farmers as complete adopters. Theothers partially adopted Roundup Ready soybeans.
The complete adopters and partial adoptershave about the same average age and experience.Partial adopters are slightly more likely to be full-time
Determinants of GMO Use 133
Table 11.12. Operator demographics and farm characteristics for each group.
Some RR soybeans No RR soybeans Disadopted RR Adopted RRin 1999 and 2000 in 1999 and 2000 soybeans in 2000 soybeans in 2000
Sample size 255 54 31 16Average age 53 58 52 56Average years’ experience 31 36 28 35Share farming primary occupation 85% 89% 81% 81%Average acres farmed 656 448 522 425Average share land owned 50% 53% 36% 49%
Table 11.13. Highest level of formal education attained for each group (%).
Some RR soybeans No RR soybeans Disadopted RR Adopted RREducation category in 1999 and 2000 in 1999 and 2000 soybeans in 2000 soybeans in 2000
Grade school 2.4 3.7 0.0 18.8Some high school 1.2 5.6 0.0 3.2High school diploma 43.3 53.7 38.7 56.3Some college work 16.6 13.0 9.7 6.3Some vocational technical work 9.3 3.7 12.9 0.02-year community college degree 9.3 9.3 0.0 12.54-year college degree 11.7 11.1 25.8 6.3Some postgraduate work 2.4 0.0 9.7 0.0Postgraduate degree 3.6 0.0 0.0 0.0
Table 11.14. Total gross farm income for each group (%).
Some RR soybeans No RR soybeans Disadopted RR Adopted RRIncome category in 1999 and 2000 in 1999 and 2000 soybeans in 2000 soybeans in 2000
Less than US$10,000 1.2 4.0 3.3 6.7US$10,000–49,999 15.9 36.0 20.0 20.0US$50,000–99,999 14.2 18.0 16.7 13.3US$100,000–249,999 37.8 22.0 40.0 40.0US$250,000 or more 30.9 20.0 20.0 20.0

farmers. The partial adopters have substantiallymore schooling than the complete adopters; 57% ofpartial adopters have progressed beyond high schoolcompared with 49% of complete adopters. Thepartial adopters also operate larger farms than thecomplete adopters; they farm an average of 740acres, and 78% have a GFI of US$100,000 or morecompared with complete adopters with an averageof 580 acres and 62% have a GFI of US$100,000 ormore (Tables 11.15–11.17).
Early Adopters of GM Maize
The adoption literature has identified some stylizedfacts about early adopters. First, larger farms tend toadopt new innovations earlier (Lindner, 1983; Federet al., 1985). One explanation for this empirical reg-ularity is that fixed costs of adoption, such as thecost of acquiring information about the innovation,are relatively smaller for larger farms (Feder andSlade, 1986). Second, farms with more humancapital, including formal schooling, experience andfarmer health, tend to adopt new innovations earlier(Kislev and Shchori-Bachrach, 1973; Huffman,
134 C. Alexander et al.
Table 11.15. Operator demographics, farm characteristics and adoption intensity ofGM soybeans.
100% RR soybeans Some RR soybeansin 1999 and 2000 in 1999 and 2000
Sample size 150 67Average age 53 54Average years’ experience 32 31Share farming primary occupation 83% 87%Average acres farmed 580 740Average share land owned 55% 47%
Table 11.16. Highest level of formal education attained and adoption intensity of GMsoybeans (%).
100% RR soybeans Some RR soybeansEducation category in 1999 and 2000 in 1999 and 2000
Grade school 3.5 1.5Some high school 0.7 3.0High school diploma 47.6 38.8Some college work 16.8 14.9Some vocational technical work 8.4 7.52-year community college degree 9.8 7.54-year college degree 8.4 17.9Some postgraduate work 2.1 1.5Postgraduate degree 2.8 7.5
Table 11.17. Total gross farm income and adoption intensity of GM soybeans (%).
100% RR soybeans Some RR soybeansIncome category in 1999 and 2000 in 1999 and 2000
Less than US$10,000 0.7 1.5US$10,000–49,999 21.0 7.7US$50,000–99,999 16.0 12.3US$100,000–249,999 32.9 43.1US$250,000 or more 29.4 35.4
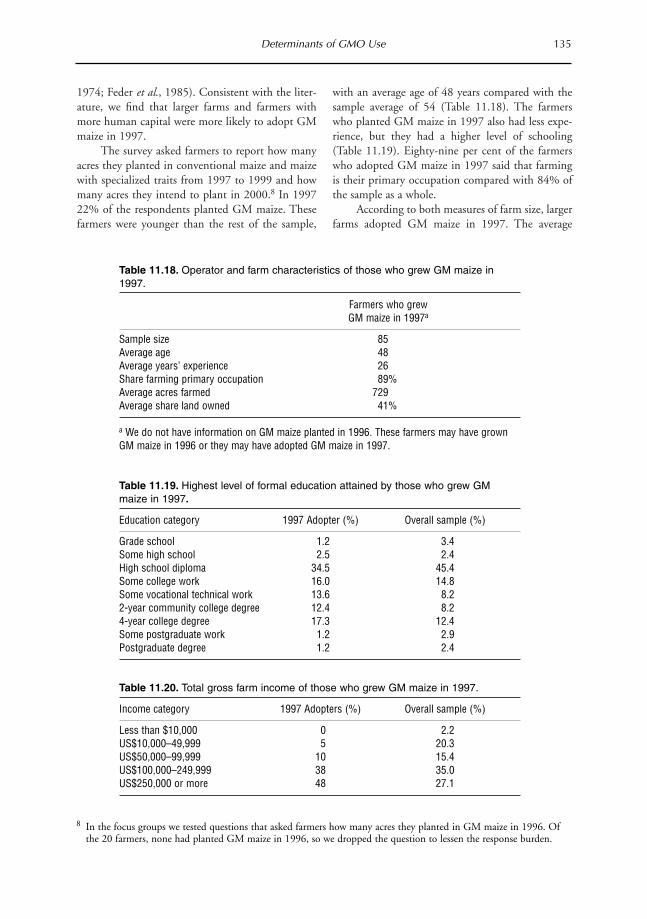
1974; Feder et al., 1985). Consistent with the liter-ature, we find that larger farms and farmers withmore human capital were more likely to adopt GMmaize in 1997.
The survey asked farmers to report how manyacres they planted in conventional maize and maizewith specialized traits from 1997 to 1999 and howmany acres they intend to plant in 2000.8 In 199722% of the respondents planted GM maize. Thesefarmers were younger than the rest of the sample,
with an average age of 48 years compared with thesample average of 54 (Table 11.18). The farmerswho planted GM maize in 1997 also had less expe-rience, but they had a higher level of schooling(Table 11.19). Eighty-nine per cent of the farmerswho adopted GM maize in 1997 said that farmingis their primary occupation compared with 84% ofthe sample as a whole.
According to both measures of farm size, largerfarms adopted GM maize in 1997. The average
Determinants of GMO Use 135
8 In the focus groups we tested questions that asked farmers how many acres they planted in GM maize in 1996. Ofthe 20 farmers, none had planted GM maize in 1996, so we dropped the question to lessen the response burden.
Table 11.18. Operator and farm characteristics of those who grew GM maize in1997.
Farmers who grewGM maize in 1997a
Sample size 85Average age 48Average years’ experience 26Share farming primary occupation 89%Average acres farmed 729Average share land owned 41%
a We do not have information on GM maize planted in 1996. These farmers may have grownGM maize in 1996 or they may have adopted GM maize in 1997.
Table 11.19. Highest level of formal education attained by those who grew GMmaize in 1997.
Education category 1997 Adopter (%) Overall sample (%)
Grade school 1.2 3.4Some high school 2.5 2.4High school diploma 34.5 45.4Some college work 16.0 14.8Some vocational technical work 13.6 8.22-year community college degree 12.4 8.24-year college degree 17.3 12.4Some postgraduate work 1.2 2.9Postgraduate degree 1.2 2.4
Table 11.20. Total gross farm income of those who grew GM maize in 1997.
Income category 1997 Adopters (%) Overall sample (%)
Less than $10,000 0 2.2US$10,000–49,999 5 20.3US$50,000–99,999 10 15.4US$100,000–249,999 38 35.0US$250,000 or more 48 27.1

number of acres farmed was 729, well above thesample average of 560 acres. Further, farmers whoadopted GM maize in 1997 had a larger GFI (Table11.20). On average these farmers owned 41% of theland they farmed compared with the sample averageof 52%, which reflects that younger farmers tend toown a smaller share of the land they operate.
About 30% of the farmers in our sampleadopted GM maize for the first time in 1998. Thesefarmers are demographically similar to the farmersin the whole sample, but they tend to operate largerfarms. For instance, the average age is 54 and thefarmers have an average of 33 years’ experience. The
level of formal schooling is comparable to the rest ofthe sample and 85% of the operators list farming astheir primary occupation.
By both measures of farm size, farmers whoadopted GM maize in 1998 tend to have largerfarms. They farmed an average of 702 acres com-pared with 560 for the sample average. The GFI forGM maize adopters was relatively higher; they weremore likely to have a GFI above US$100,000 thanthe overall sample. However, on average, theyowned a smaller share of the land they farm (Tables11.21–11.23).
136 C. Alexander et al.
Table 11.21. Operator and farm characteristics of those who adopted GM maize in 1998.
Farmers who adoptedGM maize in 1998a
Sample size 115Average age 54Average years’ experience 33Share farming primary occupation 85%Average acres farmed 702Average share land owned 46%
a We know these farmers did not grow GM maize in 1997 but they may have planted GM maize in 1996.
Table 11.22. Highest level of formal education attained by those who adopted GMmaize in 1998.
Education category 1998 Adopter (%) Overall sample (%)
Grade school 2.6 3.4Some high school 2.6 2.4High school diploma 42.6 45.4Some college work 19.1 14.8Some vocational technical work 7.0 8.22-year community college degree 7.0 8.24-year college degree 15.7 12.4Some postgraduate work 0.9 2.9Postgraduate degree 2.6 2.4
Table 11.23. Total gross farm income of those who adopted GM maize in 1998.
Income category 1998 Adopters (%) Overall sample (%)
Less than US$10,000 1 2.2US$10,000–49,999 18 20.3US$50,000–99,999 13 15.4US$100,000–249,999 42 35.0US$250,000 or more 26 27.1

Concerns that Affect Adoption of GMMaize
A producer’s decision to adopt a new innovationdepends on his or her subjective beliefs about its netbenefit, which depends on his or her beliefs aboutthe total potential benefits and about the efficacy ofthe new technology in capturing these potentialbenefits. For example, in order for farmers to per-ceive benefits from planting Bt maize, they mustfirst believe that the ECB can cause economicallysignificant yield loss, so there is substantial potentialbenefits from more effective ECB control. Secondly,the farmers must believe that Bt maize is a moreeconomically effective method of controlling ECBthan the alternatives. For the case of herbicide toler-ant crops, farmers must first believe that weed dam-age can cause economically significant yield loss andsecond that it is more cost effective to control weedswith the herbicide tolerant crops. In both cases,adoption is more likely for producers who view theproblem addressed by the GM variety as more sig-nificant. We would expect that farmers who are veryconcerned about yield loss from weeds or ECBwould be more likely to adopt herbicide tolerantcrops or Bt crops, respectively.
Relatively high producer concern about weedsor ECB can be ascribed to the following: (i) highlevels of expected pest pressure on the farm; (ii) highlevels of producer awareness of the pest pressure; or(iii) the producer is more risk averse and thereforemore likely to try to reduce the income varianceassociated with pest pressure, relative to others inthe sample. For the purposes of this analysis, we donot attempt to identify the sources of producers’concerns about pest pressure. Rather we focus onwhether their stated level of concern is correlatedwith their decision to plant GM crops.
In the survey we asked farmers to rate weedpressure in maize production and damage by theECB as a major concern, minor concern or not aconcern. We also asked farmers about the practicesthey use to control weeds on their maize fields andthe practices they use to estimate ECB populationson their maize fields. We find that producer concernabout damage from ECB is significantly and posi-tively correlated with adoption of Bt maize.However, producer concern about damage fromweed pressure on their farms is, at best, weakly cor-related with adoption of herbicide tolerant maizeand uncorrelated with herbicide tolerant soybeans.
Herbicide tolerant maize and weed pressure
When we pre-tested the survey in the focus groups,farmers had an interesting reaction to the questionon concern about weed pressure. They said theiranswer depended on whether or not they were usingherbicides; if they do not use herbicides, then weedpressure is a major concern but if they use herbicidesthen weed pressure is not a concern. Farmers alsocommented that they know which fields will havesevere weed pressure when they make their plantingdecisions: ‘If I use my herbicides and keep my fieldclean, I don’t have any yield loss from weeds. If Ididn’t use [herbicides], then I got problems.’
In the survey, producers who grow LibertyLink maize are significantly more likely to cite weedpressure as a major concern on their farm (Table11.24). However, there is no statistical correlationbetween producers who grow Roundup Readymaize and their concern about weed pressure indi-cating that other considerations affect the decisionto adopt Roundup Ready maize.
Table 11.24. Percentage of farmers who say weedpressure is a major concern on their farm.
Crop Percentage
Roundup Ready maize 69Liberty Link maize 84No herbicide tolerant maize 68
Farmers who say weed pressure is a major con-cern on their farm are more likely to employ certainweed control practices. In particular, they are morelikely to use mechanical cultivation, crop rotation,plant seed with fast seedling development, plantherbicide resistant seed and they are less likely todelay planting date (Table 11.25). About 70% offarmers use herbicides, regardless of their concernabout weed pressure.
Insect resistant maize and ECB pressure
In the focus group discussions, farmers commentedthat Bt maize is significantly more effective at con-trolling ECB than the alternative of applying chem-ical insecticides. ‘The only reason they sell Bt maizeis because it’s so hard to get a treatment and if it’sonly 80% accurate to start with, then you lessen that[because the plane doesn’t arrive before the ECBhave burrowed in the stalk].’ However, the farmers
Determinants of GMO Use 137

also said Bt maize was not profitable in 1998 and1999 because ECB pressure was very low. As a con-sequence, some of the focus group participants planto disadopt Bt maize because of the low payoff.Others will continue to plant Bt maize because theybelieve it is good insurance against the possibility ofhigh ECB pressure. ‘Of course, the Bt takes care ofthe corn borers and there haven’t been any for 2years. However, one of these days…’
In the survey, producers who say that damageby the ECB is a major concern for maize productionon their farm are significantly more likely to plantBt maize (Table 11.26). Forty-eight per cent of pro-ducers who plant Bt maize cite damage by ECB as amajor concern compared with only 17% of pro-ducers who do not plant Bt maize.
Table 11.26. Percentage of farmers who citedamage by the ECB as a major concern.
Crop Percentage
Bt maize 48No Bt maize 17
These same producers are significantly morelikely to measure ECB pressure on their farms. Sixtyper cent of producers who hire someone to scouttheir fields for ECB and 42% of those who scouttheir own fields cite damage by ECB as a major con-cern compared with 27% of those who do not hirescouts and 16% of those who do not scout their own
fields. Only 5% of producers who do not measureECB pressure cite ECB damage as a major concerncompared with 46% of those who do measure ECBpressure (Table 11.27).
Overall, farmers are better able to cope withweed pressure than ECB pressure. Farmers knowwhich fields will have severe weed pressure and theycannot predict ECB pressure. One farmer said,‘Mostly, you raise your own [weed] pressure the yearbefore. You know where it is. . . The insects jumpthe fence.’ In addition, farmers said that alternativeherbicides were effective at controlling weed pres-sure but it is difficult to effectively control ECB withinsecticides. This suggests that beliefs regarding thenet benefit of adoption encourages the adoption ofBt maize relative to the adoption of herbicide-toler-ant maize.
Conclusion
This chapter examined three aspects of adoption ofGM maize and soybeans by Iowa farmers. First, weexamined Iowa farmers’ planting intentions for2000 and identified four distinct groups. Second,we showed that the early adopters of GM maize fitthe stylized facts of early adopters. Third, we showedthat farmers who are more concerned about yielddamage to their maize crops from either weeds orinsects are more likely to adopt LL maize and Btmaize, respectively. These findings are based on a
138 C. Alexander et al.
Table 11.25. Percentage of farmers who say weed pressure is a major concernand weed control practices.
Uses this weed Does not usecontrol practice this practice
Mechanical cultivation 71 64Rotary hoeing 72 68Crop rotation 71 64Herbicides 69 71Seed with fast seedling development 82 67Herbicide resistant seed 79 66Delay planting date 62 70
Table 11.27. Percentage of farmers who scout fields and measure ECB pressure.
Uses this practice Does not use this practice
Hire someone to scout fields 60 27Scout own fields 42 16Do not measure ECB pressure 5 46

survey of Iowa Farm Bureau members who have atleast 100 acres and they may not reflect the repre-sentative maize–soybean farmer in the US.However, Iowa is an important state for maize andsoybean production. In 1998, Iowa was the numberone producer of both maize for grain and soybeansfor beans, producing 18% of the total US maizecrop and 18% of the total US soybean crop (Sandsand Holden, 1999).
References
Alexander, C., Fernandez-Cornejo, J. and Goodhue, R.E.
(2000) Effects of the GMO controversy on corn-
soybean farmers’ acreage allocation decisions.
Department of Agricultural and Resource Economics
Working Paper, University of California, Davis.
Chavas, J.-P. and Holt, M.T. (1990) Acreage decisions
under risk: the case of corn and soybeans. AmericanJournal of Agricultural Economics 72(3), 529–538.
Feder, G. and Slade, R. (1986) The acquisition of infor-
mation and the adoption of new technology.
American Journal of Agricultural Economics 66,
312–320.
Feder, G., Just, R.E. and Zilberman, D. (1985) Adoption
of agricultural innovations in developing countries: a
survey. Economic Development and Cultural Change,33, 255–298.
Fernandez-Cornejo, J., Alexander, C. and Goodhue, R.E.
(2000) Dynamic technology diffusion with disadop-
tion: the case of crop biotechnology. Department of
Agricultural and Resource Economics Working
Paper, University of California, Davis.
Huffman, W.E. (1974) Allocative efficiency: the role of
human capital. Quarterly Journal of Economics 91,
59–80.
Kinnucan, H., Hatch, U., Molnar, J.J. and Pendergrass, R.
(1990) Adoption and diffusion potentials for bovine
somatotropin in the southeast dairy industry. AuburnUniversity, Agricultural Experiment Station Bulletin605, February.
Kislev, Y. and Shchori-Bachrach, N. (1973) The process of
an innovation cycle. American Journal of AgriculturalEconomics 55, 28–37.
Lindner, R.K. (1983) Farm size and time lag to adoption
of a scale neutral innovation. Mimeograph.
University of Adelaide, Adelaide.
Pope, R.D. and Just, R.E. (1991) On testing the structure
of risk preferences in agricultural supply analysis.
American Journal of Agricultural Economics 73,
743–748.
Sands, J.K. and Holden, H.R. (1999) Iowa AgriculturalStatistics 1999. United States Department of
Agriculture and Iowa Farm Bureau, Des Moines,
Iowa.
United States Department of Agriculture (1999) 1997
Census of Agriculture. Technical Report 15,
National Agricultural Statistical Service.
US Department of Agriculture (2000) Prospective
plantings, technical report, National Agricultural
Statistical Service. www.usda.mannlib.cornell.edu/
reports/nassr/field/pcp-bbp/psp10300.txt
Welch, F. (1970) Education in production. Journal ofPolitical Economy 78, 35–59.
Determinants of GMO Use 139
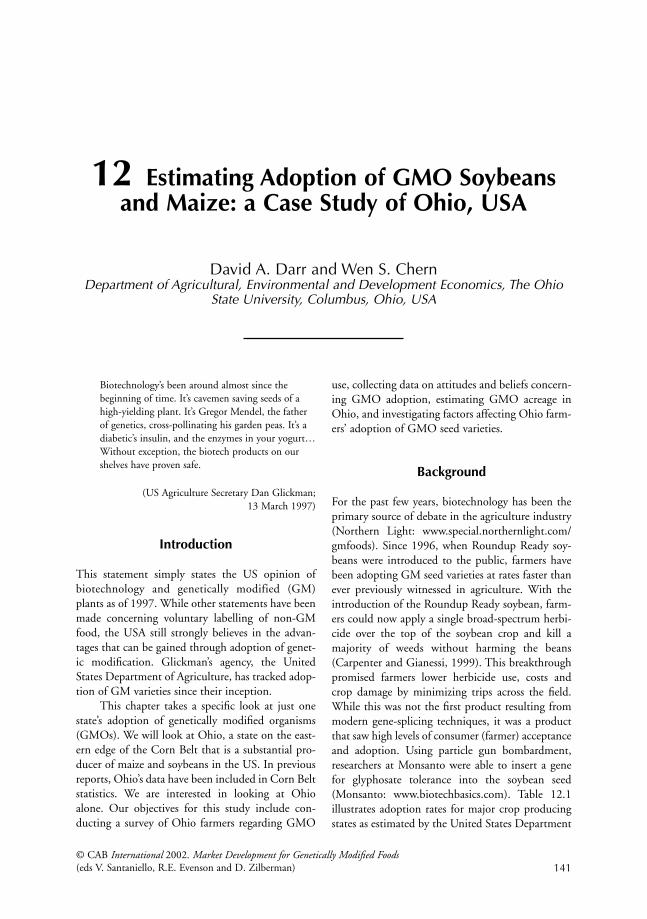
Biotechnology’s been around almost since the
beginning of time. It’s cavemen saving seeds of a
high-yielding plant. It’s Gregor Mendel, the father
of genetics, cross-pollinating his garden peas. It’s a
diabetic’s insulin, and the enzymes in your yogurt…
Without exception, the biotech products on our
shelves have proven safe.
(US Agriculture Secretary Dan Glickman;
13 March 1997)
Introduction
This statement simply states the US opinion ofbiotechnology and genetically modified (GM)plants as of 1997. While other statements have beenmade concerning voluntary labelling of non-GMfood, the USA still strongly believes in the advan-tages that can be gained through adoption of genet-ic modification. Glickman’s agency, the UnitedStates Department of Agriculture, has tracked adop-tion of GM varieties since their inception.
This chapter takes a specific look at just onestate’s adoption of genetically modified organisms(GMOs). We will look at Ohio, a state on the east-ern edge of the Corn Belt that is a substantial pro-ducer of maize and soybeans in the US. In previousreports, Ohio’s data have been included in Corn Beltstatistics. We are interested in looking at Ohioalone. Our objectives for this study include con-ducting a survey of Ohio farmers regarding GMO
use, collecting data on attitudes and beliefs concern-ing GMO adoption, estimating GMO acreage inOhio, and investigating factors affecting Ohio farm-ers’ adoption of GMO seed varieties.
Background
For the past few years, biotechnology has been theprimary source of debate in the agriculture industry(Northern Light: www.special.northernlight.com/gmfoods). Since 1996, when Roundup Ready soy-beans were introduced to the public, farmers havebeen adopting GM seed varieties at rates faster thanever previously witnessed in agriculture. With theintroduction of the Roundup Ready soybean, farm-ers could now apply a single broad-spectrum herbi-cide over the top of the soybean crop and kill amajority of weeds without harming the beans(Carpenter and Gianessi, 1999). This breakthroughpromised farmers lower herbicide use, costs andcrop damage by minimizing trips across the field.While this was not the first product resulting frommodern gene-splicing techniques, it was a productthat saw high levels of consumer (farmer) acceptanceand adoption. Using particle gun bombardment,researchers at Monsanto were able to insert a genefor glyphosate tolerance into the soybean seed(Monsanto: www.biotechbasics.com). Table 12.1illustrates adoption rates for major crop producingstates as estimated by the United States Department
141
12 Estimating Adoption of GMO Soybeansand Maize: a Case Study of Ohio, USA
David A. Darr and Wen S. ChernDepartment of Agricultural, Environmental and Development Economics, The Ohio
State University, Columbus, Ohio, USA
© CAB International 2002. Market Development for Genetically Modified Foods(eds V. Santaniello, R.E. Evenson and D. Zilberman)
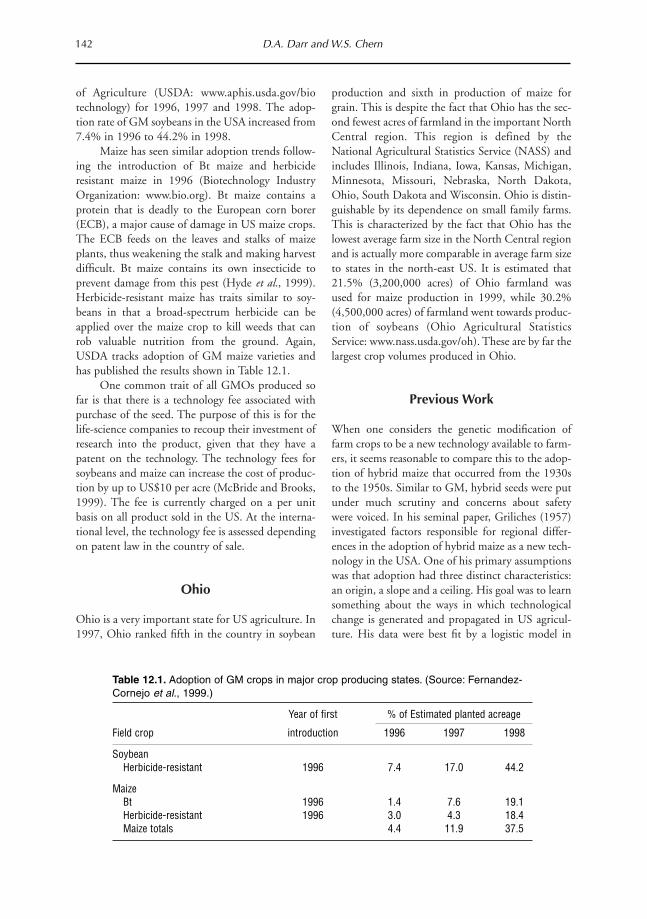
of Agriculture (USDA: www.aphis.usda.gov/biotechnology) for 1996, 1997 and 1998. The adop-tion rate of GM soybeans in the USA increased from7.4% in 1996 to 44.2% in 1998.
Maize has seen similar adoption trends follow-ing the introduction of Bt maize and herbicideresistant maize in 1996 (Biotechnology IndustryOrganization: www.bio.org). Bt maize contains aprotein that is deadly to the European corn borer(ECB), a major cause of damage in US maize crops.The ECB feeds on the leaves and stalks of maizeplants, thus weakening the stalk and making harvestdifficult. Bt maize contains its own insecticide toprevent damage from this pest (Hyde et al., 1999).Herbicide-resistant maize has traits similar to soy-beans in that a broad-spectrum herbicide can beapplied over the maize crop to kill weeds that canrob valuable nutrition from the ground. Again,USDA tracks adoption of GM maize varieties andhas published the results shown in Table 12.1.
One common trait of all GMOs produced sofar is that there is a technology fee associated withpurchase of the seed. The purpose of this is for thelife-science companies to recoup their investment ofresearch into the product, given that they have apatent on the technology. The technology fees forsoybeans and maize can increase the cost of produc-tion by up to US$10 per acre (McBride and Brooks,1999). The fee is currently charged on a per unitbasis on all product sold in the US. At the interna-tional level, the technology fee is assessed dependingon patent law in the country of sale.
Ohio
Ohio is a very important state for US agriculture. In1997, Ohio ranked fifth in the country in soybean
production and sixth in production of maize forgrain. This is despite the fact that Ohio has the sec-ond fewest acres of farmland in the important NorthCentral region. This region is defined by theNational Agricultural Statistics Service (NASS) andincludes Illinois, Indiana, Iowa, Kansas, Michigan,Minnesota, Missouri, Nebraska, North Dakota,Ohio, South Dakota and Wisconsin. Ohio is distin-guishable by its dependence on small family farms.This is characterized by the fact that Ohio has thelowest average farm size in the North Central regionand is actually more comparable in average farm sizeto states in the north-east US. It is estimated that21.5% (3,200,000 acres) of Ohio farmland was used for maize production in 1999, while 30.2%(4,500,000 acres) of farmland went towards produc-tion of soybeans (Ohio Agricultural StatisticsService: www.nass.usda.gov/oh). These are by far thelargest crop volumes produced in Ohio.
Previous Work
When one considers the genetic modification offarm crops to be a new technology available to farm-ers, it seems reasonable to compare this to the adop-tion of hybrid maize that occurred from the 1930sto the 1950s. Similar to GM, hybrid seeds were putunder much scrutiny and concerns about safetywere voiced. In his seminal paper, Griliches (1957)investigated factors responsible for regional differ-ences in the adoption of hybrid maize as a new tech-nology in the USA. One of his primary assumptionswas that adoption had three distinct characteristics:an origin, a slope and a ceiling. His goal was to learnsomething about the ways in which technologicalchange is generated and propagated in US agricul-ture. His data were best fit by a logistic model in
142 D.A. Darr and W.S. Chern
Table 12.1. Adoption of GM crops in major crop producing states. (Source: Fernandez-Cornejo et al., 1999.)
Year of first % of Estimated planted acreage
Field crop introduction 1996 1997 1998
SoybeanHerbicide-resistant 1996 7.4 17.0 44.2
MaizeBt 1996 1.4 7.6 19.1Herbicide-resistant 1996 3.0 4.3 18.4Maize totals 4.4 11.9 37.5
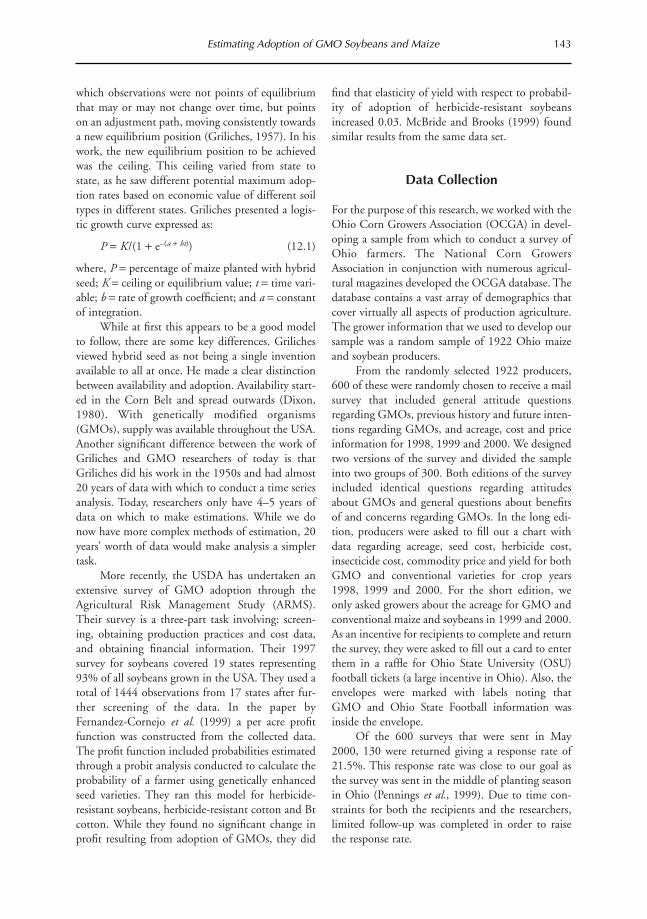
which observations were not points of equilibriumthat may or may not change over time, but pointson an adjustment path, moving consistently towardsa new equilibrium position (Griliches, 1957). In hiswork, the new equilibrium position to be achievedwas the ceiling. This ceiling varied from state tostate, as he saw different potential maximum adop-tion rates based on economic value of different soiltypes in different states. Griliches presented a logis-tic growth curve expressed as:
P = K /(1 + e–(a + bt)) (12.1)
where, P = percentage of maize planted with hybridseed; K = ceiling or equilibrium value; t = time vari-able; b = rate of growth coefficient; and a = constantof integration.
While at first this appears to be a good modelto follow, there are some key differences. Grilichesviewed hybrid seed as not being a single inventionavailable to all at once. He made a clear distinctionbetween availability and adoption. Availability start-ed in the Corn Belt and spread outwards (Dixon,1980). With genetically modified organisms(GMOs), supply was available throughout the USA.Another significant difference between the work ofGriliches and GMO researchers of today is thatGriliches did his work in the 1950s and had almost20 years of data with which to conduct a time seriesanalysis. Today, researchers only have 4–5 years ofdata on which to make estimations. While we donow have more complex methods of estimation, 20years’ worth of data would make analysis a simplertask.
More recently, the USDA has undertaken anextensive survey of GMO adoption through theAgricultural Risk Management Study (ARMS).Their survey is a three-part task involving: screen-ing, obtaining production practices and cost data,and obtaining financial information. Their 1997survey for soybeans covered 19 states representing93% of all soybeans grown in the USA. They used atotal of 1444 observations from 17 states after fur-ther screening of the data. In the paper byFernandez-Cornejo et al. (1999) a per acre profitfunction was constructed from the collected data.The profit function included probabilities estimatedthrough a probit analysis conducted to calculate theprobability of a farmer using genetically enhancedseed varieties. They ran this model for herbicide-resistant soybeans, herbicide-resistant cotton and Btcotton. While they found no significant change inprofit resulting from adoption of GMOs, they did
find that elasticity of yield with respect to probabil-ity of adoption of herbicide-resistant soybeansincreased 0.03. McBride and Brooks (1999) foundsimilar results from the same data set.
Data Collection
For the purpose of this research, we worked with theOhio Corn Growers Association (OCGA) in devel-oping a sample from which to conduct a survey ofOhio farmers. The National Corn GrowersAssociation in conjunction with numerous agricul-tural magazines developed the OCGA database. Thedatabase contains a vast array of demographics thatcover virtually all aspects of production agriculture.The grower information that we used to develop oursample was a random sample of 1922 Ohio maizeand soybean producers.
From the randomly selected 1922 producers,600 of these were randomly chosen to receive a mailsurvey that included general attitude questionsregarding GMOs, previous history and future inten-tions regarding GMOs, and acreage, cost and priceinformation for 1998, 1999 and 2000. We designedtwo versions of the survey and divided the sampleinto two groups of 300. Both editions of the surveyincluded identical questions regarding attitudesabout GMOs and general questions about benefitsof and concerns regarding GMOs. In the long edi-tion, producers were asked to fill out a chart withdata regarding acreage, seed cost, herbicide cost,insecticide cost, commodity price and yield for bothGMO and conventional varieties for crop years1998, 1999 and 2000. For the short edition, weonly asked growers about the acreage for GMO andconventional maize and soybeans in 1999 and 2000.As an incentive for recipients to complete and returnthe survey, they were asked to fill out a card to enterthem in a raffle for Ohio State University (OSU)football tickets (a large incentive in Ohio). Also, theenvelopes were marked with labels noting thatGMO and Ohio State Football information wasinside the envelope.
Of the 600 surveys that were sent in May2000, 130 were returned giving a response rate of21.5%. This response rate was close to our goal asthe survey was sent in the middle of planting seasonin Ohio (Pennings et al., 1999). Due to time con-straints for both the recipients and the researchers,limited follow-up was completed in order to raisethe response rate.
Estimating Adoption of GMO Soybeans and Maize 143
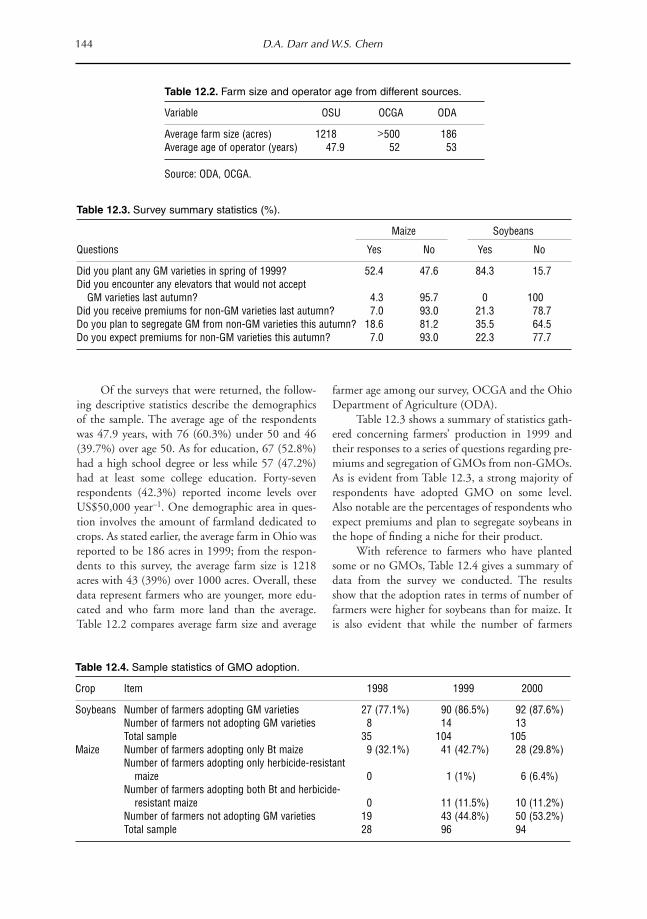
Of the surveys that were returned, the follow-ing descriptive statistics describe the demographicsof the sample. The average age of the respondentswas 47.9 years, with 76 (60.3%) under 50 and 46(39.7%) over age 50. As for education, 67 (52.8%)had a high school degree or less while 57 (47.2%)had at least some college education. Forty-sevenrespondents (42.3%) reported income levels overUS$50,000 year–1. One demographic area in ques-tion involves the amount of farmland dedicated tocrops. As stated earlier, the average farm in Ohio wasreported to be 186 acres in 1999; from the respon-dents to this survey, the average farm size is 1218acres with 43 (39%) over 1000 acres. Overall, thesedata represent farmers who are younger, more edu-cated and who farm more land than the average.Table 12.2 compares average farm size and average
farmer age among our survey, OCGA and the OhioDepartment of Agriculture (ODA).
Table 12.3 shows a summary of statistics gath-ered concerning farmers’ production in 1999 andtheir responses to a series of questions regarding pre-miums and segregation of GMOs from non-GMOs.As is evident from Table 12.3, a strong majority ofrespondents have adopted GMO on some level.Also notable are the percentages of respondents whoexpect premiums and plan to segregate soybeans inthe hope of finding a niche for their product.
With reference to farmers who have plantedsome or no GMOs, Table 12.4 gives a summary ofdata from the survey we conducted. The resultsshow that the adoption rates in terms of number offarmers were higher for soybeans than for maize. Itis also evident that while the number of farmers
144 D.A. Darr and W.S. Chern
Table 12.3. Survey summary statistics (%).
Maize Soybeans
Questions Yes No Yes No
Did you plant any GM varieties in spring of 1999? 52.4 47.6 84.3 15.7Did you encounter any elevators that would not accept
GM varieties last autumn? 4.3 95.7 0 100Did you receive premiums for non-GM varieties last autumn? 7.0 93.0 21.3 78.7Do you plan to segregate GM from non-GM varieties this autumn? 18.6 81.2 35.5 64.5Do you expect premiums for non-GM varieties this autumn? 7.0 93.0 22.3 77.7
Table 12.2. Farm size and operator age from different sources.
Variable OSU OCGA ODA
Average farm size (acres) 1218 >500 186Average age of operator (years) 47.9 52 53
Source: ODA, OCGA.
Table 12.4. Sample statistics of GMO adoption.
Crop Item 1998 1999 2000
Soybeans Number of farmers adopting GM varieties 27 (77.1%) 90 (86.5%) 92 (87.6%) Number of farmers not adopting GM varieties 8 14 13Total sample 35 104 105
Maize Number of farmers adopting only Bt maize 9 (32.1%) 41 (42.7%) 28 (29.8%)Number of farmers adopting only herbicide-resistant
maize 0 1 (1%) 6 (6.4%)Number of farmers adopting both Bt and herbicide-
resistant maize 0 11 (11.5%) 10 (11.2%)Number of farmers not adopting GM varieties 19 43 (44.8%) 50 (53.2%)Total sample 28 96 94

adopting GM soybeans and herbicide-resistantmaize have steadily increased, the number of farm-ers using Bt maize decreased in 2000.
Model
The model chosen for this study loosely follows pre-vious work by Fernandez-Cornejo et al. (1999).While they used a probit model to estimate proba-bilities of adoption and then developed a profitfunction as a result of the adoption probability, wewill use a Tobit model to estimate probability, num-ber and share of acres planted with GMOs. Thistype of model is a censored regression model as first
studied by Tobin in the 1950s. The Tobit model is atwo-stage model in which the result of the first stageregression is identical to that of probit.
Through the Tobit model, we were able to esti-mate acreage and share of acreage for herbicide-resistant soybeans, Bt maize and herbicide-resistantmaize for 1998, 1999 and 2000 planting seasons.Independent variables can be grouped into six cate-gories: cost and profitability, price risk, demograph-ics, safety, environmental and other. Within eachgroup, there are questions regarding producer atti-tudes, potential and realized benefits and concerns,previous planting history and future intentions.
Based on the frequency of response and dis-tribution of answers, questions that required the
Estimating Adoption of GMO Soybeans and Maize 145
Table 12.5. Variable description and expected signs for 2000 soybean acreage estimates.
Variable Description Expected sign
Cost andprofitability
COST2 Farmers are realizing cost savings by using GM varieties PositivePROF Higher profitability as an advantage PositiveTILL Less tillage as a benefit PositiveYIELD Yield increase as a benefit PositiveHERBCOST Decreased herbicide cost as a benefit PositiveWEEDCON Improved weed control as a benefit Positive
Price riskMKT Ability to market GMOs as a concern IndeterminateCNTRCT Percentage of grain that is contracted IndeterminatePREM99 Premiums received in 1999 Negative
DemographicsSOY99 GMO soybean planted in 1999 PositiveCORN99 GMO maize planted in 1999 PositiveINCM2 Income greater than US$100,000 year–1 IndeterminateEDU2 Education greater than high school PositiveNE Farm in north-east Ohio IndeterminateNW Farm in north-west Ohio IndeterminateOWNS Percentage of farm that is owned IndeterminateLVSK Livestock on farm Positive
SafetySCIE2 Scientists have not studied the long-term risks of eating GM foods NegativeBABY1 I would not be hesitant to feed babies with GM food Positive
EnvironmentalRESIS Resistant weeds as a concern NegativeHERBUSE Lower herbicide use as a benefit PositiveINSCTUSE Decreased insecticide use as a benefit Positive
OthersKNOW2 I consider myself knowledgeable about genetic modification IndeterminateWORM2 I would adopt maize resistant to root worms if it becomes available Positive
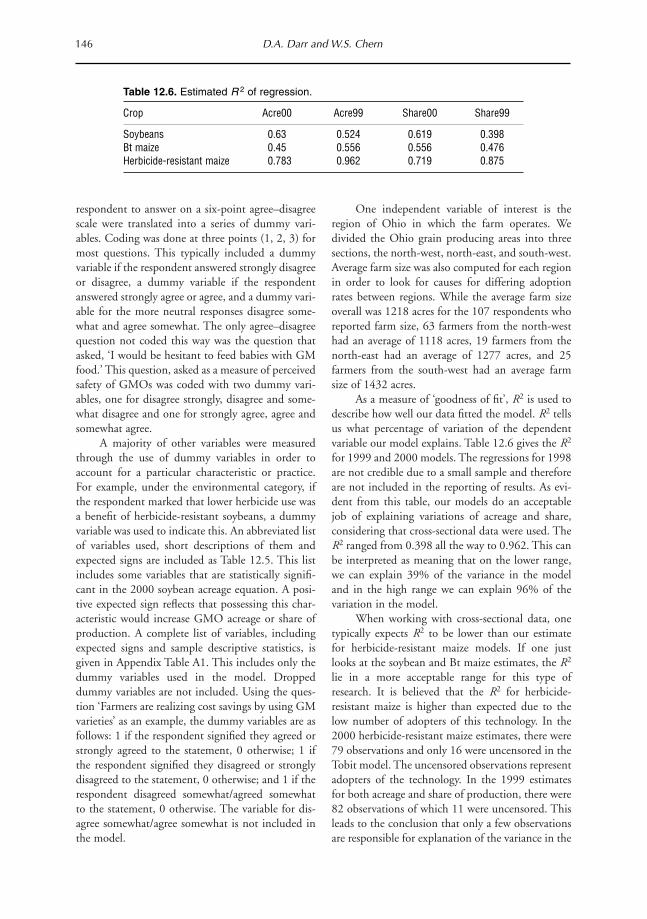
respondent to answer on a six-point agree–disagreescale were translated into a series of dummy vari-ables. Coding was done at three points (1, 2, 3) formost questions. This typically included a dummyvariable if the respondent answered strongly disagreeor disagree, a dummy variable if the respondentanswered strongly agree or agree, and a dummy vari-able for the more neutral responses disagree some-what and agree somewhat. The only agree–disagreequestion not coded this way was the question thatasked, ‘I would be hesitant to feed babies with GMfood.’ This question, asked as a measure of perceivedsafety of GMOs was coded with two dummy vari-ables, one for disagree strongly, disagree and some-what disagree and one for strongly agree, agree andsomewhat agree.
A majority of other variables were measuredthrough the use of dummy variables in order toaccount for a particular characteristic or practice.For example, under the environmental category, ifthe respondent marked that lower herbicide use wasa benefit of herbicide-resistant soybeans, a dummyvariable was used to indicate this. An abbreviated listof variables used, short descriptions of them andexpected signs are included as Table 12.5. This listincludes some variables that are statistically signifi-cant in the 2000 soybean acreage equation. A posi-tive expected sign reflects that possessing this char-acteristic would increase GMO acreage or share ofproduction. A complete list of variables, includingexpected signs and sample descriptive statistics, isgiven in Appendix Table A1. This includes only thedummy variables used in the model. Droppeddummy variables are not included. Using the ques-tion ‘Farmers are realizing cost savings by using GMvarieties’ as an example, the dummy variables are asfollows: 1 if the respondent signified they agreed orstrongly agreed to the statement, 0 otherwise; 1 ifthe respondent signified they disagreed or stronglydisagreed to the statement, 0 otherwise; and 1 if therespondent disagreed somewhat/agreed somewhatto the statement, 0 otherwise. The variable for dis-agree somewhat/agree somewhat is not included inthe model.
One independent variable of interest is theregion of Ohio in which the farm operates. Wedivided the Ohio grain producing areas into threesections, the north-west, north-east, and south-west.Average farm size was also computed for each regionin order to look for causes for differing adoptionrates between regions. While the average farm sizeoverall was 1218 acres for the 107 respondents whoreported farm size, 63 farmers from the north-westhad an average of 1118 acres, 19 farmers from thenorth-east had an average of 1277 acres, and 25farmers from the south-west had an average farmsize of 1432 acres.
As a measure of ‘goodness of fit’, R2 is used todescribe how well our data fitted the model. R2 tellsus what percentage of variation of the dependentvariable our model explains. Table 12.6 gives the R2
for 1999 and 2000 models. The regressions for 1998are not credible due to a small sample and thereforeare not included in the reporting of results. As evi-dent from this table, our models do an acceptablejob of explaining variations of acreage and share,considering that cross-sectional data were used. TheR2 ranged from 0.398 all the way to 0.962. This canbe interpreted as meaning that on the lower range,we can explain 39% of the variance in the modeland in the high range we can explain 96% of thevariation in the model.
When working with cross-sectional data, onetypically expects R2 to be lower than our estimatefor herbicide-resistant maize models. If one justlooks at the soybean and Bt maize estimates, the R2
lie in a more acceptable range for this type ofresearch. It is believed that the R2 for herbicide-resistant maize is higher than expected due to thelow number of adopters of this technology. In the2000 herbicide-resistant maize estimates, there were79 observations and only 16 were uncensored in theTobit model. The uncensored observations representadopters of the technology. In the 1999 estimatesfor both acreage and share of production, there were82 observations of which 11 were uncensored. Thisleads to the conclusion that only a few observationsare responsible for explanation of the variance in the
146 D.A. Darr and W.S. Chern
Table 12.6. Estimated R 2 of regression.
Crop Acre00 Acre99 Share00 Share99
Soybeans 0.63 0.524 0.619 0.398Bt maize 0.45 0.556 0.556 0.476Herbicide-resistant maize 0.783 0.962 0.719 0.875

model. If there are similarities in the uncensoredobservations, it will lead to a high proportion oferror explanation.
Soybeans
Estimates for soybean acreage and acreage sharewere run for 1998, 1999 and 2000. Over this timeperiod, the mean acreage of GM soybeans increased
from 209 acres in 1998 to 372.53 acres in 2000.Increases have also been seen in acreage share as themean value has risen from 0.41 to 0.66 this year.Table 12.7 gives data on average acres and share forall soybeans and maize. For this table, the maximumvalues were used as an indication of range. This ispossible because for all estimates, the lower boundwas zero.
The sample sizes for this table were obtainedfrom the regression results. For example, the GM
Estimating Adoption of GMO Soybeans and Maize 147
Table 12.7. Sample statistics of GM acreage and share of production.a
1998 1999 2000Sample Sample Sample
Crop Variable size Mean Max size Mean Max size Mean Max
GM soybeans Acreage 25 209 850 85 311 1200 83 372.5 3000Share 25 0.41 1.00 85 0.57 1.00 83 0.66 1.00
Bt maize Acreage 25 33.68 500 82 76.72 800 79 64.08 1600Share 25 0.10 1.00 82 0.17 1.00 79 0.15 1.00
Herbicide- Acreageb 82 16.64 700 79 29.83 800resistant maize Share 82 0.05 1.00 79 0.07 1.00
a Sample size refers to the number of observations used for regression analysis.b Blanks indicate data not available.
Table 12.8. Significant variables in soybean estimation.
Variables Acre00 Acre99 Share00 Share99
Cost and profitabilityCOST2 + + + +PROF + +YIELD +TILL +
Price riskCNTRCT –
DemographicsAGE
INCM1 + +INCM2 – –NE +CROPS + +
SafetyBABY1 +
EnvironmentalHERBUSE + +
OtherKNOW1 – – –WORM1 –WORM2 +
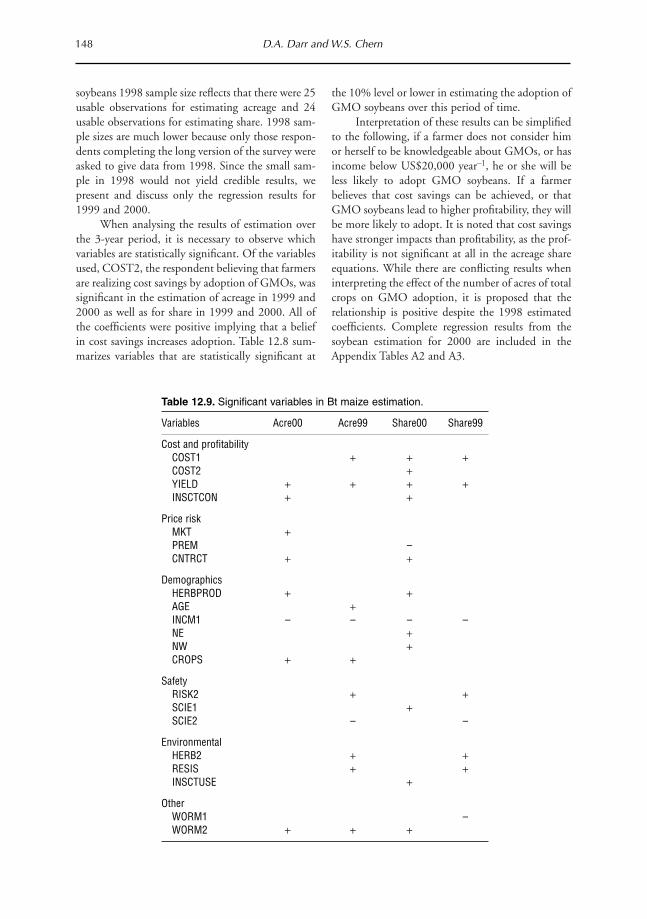
soybeans 1998 sample size reflects that there were 25usable observations for estimating acreage and 24usable observations for estimating share. 1998 sam-ple sizes are much lower because only those respon-dents completing the long version of the survey wereasked to give data from 1998. Since the small sam-ple in 1998 would not yield credible results, wepresent and discuss only the regression results for1999 and 2000.
When analysing the results of estimation overthe 3-year period, it is necessary to observe whichvariables are statistically significant. Of the variablesused, COST2, the respondent believing that farmersare realizing cost savings by adoption of GMOs, wassignificant in the estimation of acreage in 1999 and2000 as well as for share in 1999 and 2000. All ofthe coefficients were positive implying that a beliefin cost savings increases adoption. Table 12.8 sum-marizes variables that are statistically significant at
the 10% level or lower in estimating the adoption ofGMO soybeans over this period of time.
Interpretation of these results can be simplifiedto the following, if a farmer does not consider himor herself to be knowledgeable about GMOs, or hasincome below US$20,000 year–1, he or she will beless likely to adopt GMO soybeans. If a farmerbelieves that cost savings can be achieved, or thatGMO soybeans lead to higher profitability, they willbe more likely to adopt. It is noted that cost savingshave stronger impacts than profitability, as the prof-itability is not significant at all in the acreage shareequations. While there are conflicting results wheninterpreting the effect of the number of acres of totalcrops on GMO adoption, it is proposed that therelationship is positive despite the 1998 estimatedcoefficients. Complete regression results from thesoybean estimation for 2000 are included in theAppendix Tables A2 and A3.
148 D.A. Darr and W.S. Chern
Table 12.9. Significant variables in Bt maize estimation.
Variables Acre00 Acre99 Share00 Share99
Cost and profitabilityCOST1 + + +COST2 +YIELD + + + +INSCTCON + +
Price riskMKT +PREM –CNTRCT + +
DemographicsHERBPROD + +AGE +INCM1 – – – –NE +NW +CROPS + +
SafetyRISK2 + +SCIE1 +SCIE2 – –
EnvironmentalHERB2 + +RESIS + +INSCTUSE +
OtherWORM1 –WORM2 + + +

Bt Maize
Similar to GMO soybeans, estimates of Bt maizeadoption were obtained for 1999 and 2000, againusing both acreage number and share as dependentvariables (see Appendix Tables A2 and A3 for com-plete results). Unlike GMO soybeans, which haveseen steady growth in average acreage and share, Btmaize average acreage and share, in parenthesis,increased from 33.68 (0.10) to 76.72 (0.17) from1998 to 1999, but then decreased in 2000 to 64.08(0.15). While some of this decrease can be related todecreased expected infestation levels of the ECB, wewanted to investigate what factors also influencedthe farmers’ decision to adopt. When comparedwith GMO soybeans, it is possible to find morevariables that are significant across years (Table12.9).
Some key differences can be noted betweenfactors that affect adoption of Bt maize when com-pared with GMO soybeans (Table 12.8). Mostimportant of these is the significance of income.While for soybeans, income under US$20,000
(INCM1) was negatively related to GMO adoption,for Bt maize, income above US$100,000 (INCM2)was negatively related. This result implies that farm-ers with a very high income would not adopt asmuch Bt maize as those with lower income levels.Also of significance is the strong relationshipbetween adoption of Bt maize and the respondents’answer to the question, ‘I would adopt maize resist-ant to root worms [another maize pest] if it becomesavailable.’ There is a strong positive relationshipbetween the respondent agreeing to this questionand adopting Bt maize.
While not a significant variable, it is worthmentioning that the more grain that the farmer for-ward contracts, the more Bt maize he is estimated togrow. When the level of forward contracting is usedas a measure of risk, with high levels of contractingrepresenting a farmer being risk adverse, this sign isconsistent with theory. Bt maize is often looked at asan insurance policy for the farmer. In the case ofhigh levels of infestation, they are protected fromthe pest; if low infestation occurs, the technology feeis seen as the insurance premium. Therefore, the
Estimating Adoption of GMO Soybeans and Maize 149
Table 12.10. Significant variables in herbicide-resistant maizeestimation.
Variable Acre 00 Acre99 Share00 Share99
Profitability WEEDCON +
Price riskMKT +CNTRCT – – – –
DemographicsBTPROD + + +INCM1 –NE + +NW + +CROPS +
SafetyRISK1 –SCIE1 + +SCIE2 + +BABY1 +
Environmental HERB2 – –RESIS –
OtherKNOW1 – + +KNOW2 + +WORM2 + + +

more risk averse a farmer is, the more likely theyshould be to adopt Bt maize in cases where infesta-tion levels of the ECB are expected to be a problemfor the crop.
The results also show that cost savings were sig-nificant in Bt maize equations. Regarding this, it isimportant to mention that COST1 and COST2represent change in comparison with the droppedvariable, not necessarily a direct change in cost. Theprofitability variable was not significant at all. Thiscorresponds to similar results achieved by USDAresearchers (Fernandez-Cornejo et al., 1999). Theseresults imply that cost or profitability play lessimportant roles in the adoption of Bt maize than forGM soybeans.
Herbicide-resistant Maize
It is interesting to analyse similarities and differencesbetween adoption of herbicide-resistant maize andBt maize. As evident from Table 12.10, adoption ofherbicide-resistant maize has increased, but not atthe rate of either Bt maize or GMO soybeans, reach-ing only an average acreage of 29.83 and averageshare of 0.07 in our sample (see Appendix Tables A2and A3 for complete sets of regression results).
As is evident from Table 12.10, adoption ofherbicide-resistant maize is positively related to theadoption of Bt maize. The variable BTPROD meas-ures the relationship that Bt adoption has on herbi-cide-resistant adoption. The signs of HERB2,strongly agree or agree that GMOs lead to reducedherbicide and insecticide use, appear to contradictthe theory that reduced herbicide use would lead togreater adoption.
When compared with Bt maize, herbicide-resistant maize is similar in that adoption is posi-tively related to willingness to adopt root wormtolerant maize if it comes on to the market. Thisvariable was used to measure willingness to adopttechnologies that are still in development stages. Ofthe 124 respondents who answer this question, 77either agreed or strongly agreed that they wouldadopt root worm tolerant maize.
Being located in the north-east part of Ohio isanother variable that is significant for both Bt andherbicide-resistant maize in 2000. For this variable,NE, being located in this demographic area results
in higher adoption of both maize varieties. On theother hand, the level of forward contracting isinversely related to the amount of herbicide-resistant maize that is grown. This is in contrast tothe positive relationship that was seen with Btmaize. Again using forward contracting as a measureof willingness to accept risk, this distinction istheoretically correct. While adoption of Bt maizewas seen as a risk adverse decision, adoption ofherbicide-resistant maize can be viewed as risk seek-ing. Herbicide-resistant maize allows the farmer agreater level of convenience of pest control. They areable to use a broad-spectrum herbicide to rid thefield of pests. In this light, they are risk seeking inthe hope that the value of convenience is greaterthan the associated technology fee.
Conclusions
This chapter presents preliminary work being doneon GMO adoption in Ohio. Our objective is toanalyse factors that are significant in the estimationof GMO adoption. From the results presented, it isapparent that several factors are significant over timein estimating adoption. The work being conductedfor this project is very new. Attempts have beenmade to find other works that have attempted toestimate GMO adoption as a function of attitudes,perceptions and behaviours, but none has beenfound. Again, due to the fact that our research isongoing, the results should be regarded as prelimi-nary.
Our preliminary estimations have shown thatthere are consistent factors affecting adoption acrossyears for the same crops as well as across crops dur-ing the same year. It has also been found that whilethe adoption of GM soybeans and herbicide-resist-ant maize has continued to increase, the adoption ofBt maize decreased in 2000. Monsanto originallypredicted that the convenient GM seed would even-tually replace conventional soybeans. Questions forthe future on this topic will be primarily concernedwith attempting to predict adoption patterns in thefuture. In order to do this, another survey is beingproposed in January 2001 after the 2000 harvestseason. This edition would be sent to another 1000farmers in Ohio in order to gain an even betterunderstanding of what drives adoption of GMOs.
150 D.A. Darr and W.S. Chern
References
Carpenter, J. and Gianessi, L. (1999) Herbicide tolerant
soybeans: why growers are adopting Roundup Ready
varieties. Agbioforum 2(2), archived at: www.agbiofo-
rum.org
Dixon, R. (1980) Hybrid corn revisited. Econometrica48(6), 1451–1461.
Fernandez-Cornejo, J., Klotz-Ingram, C. and Jans, S.
(1999) Farm-level effects of adopting genetically
engineered crops in the U.S.A. Paper presented at the
International Consortium on Agricultural Biotech-nology Research. Rome, Italy, 17–19 June.
Griliches, Z. (1957) Hybrid corn: an exploration in the
economics of technological change. Econometrica25(4), 501–522.
Hyde, J., Martin, M.A., Preveckel, P.V. and Richard, C.
(1999) The economics of Bt corn: valuing protection
from the European corn borer. Review of AgriculturalEconomics 21(2), 442–454.
McBride, W.D. and Brooks, N. (1999) Survey evidence on
producer use and costs of genetically modified seed.
Paper presented at the International Consortium onAgricultural Biotechnology Research. Rome, Italy,
17–19 June.
Pennings, J.M.E., Irwin, S.H. and Good, D. (1999)
Surveying Farmers: a Research Note. AgMAS Project
Research Report 1999-04, October.
Estimating Adoption of GMO Soybeans and Maize 151

Appendix
Table A1. Variable description and signs for 2000 acreage estimates.
Soybeansa Maizeb
No. of No. of Variable Description respondents % respondents % Expected sign
Cost and profitabilityCOST1 Farmers are not realizing cost savings by using GM varieties 15 15 14 15 NegativeCOST2 Farmers are realizing cost savings by using GM varieties 49 48 40 44 PositivePREM99 Premiums received in 1999 24 23 6 7 NegativePROF Higher profitability as an advantage 37 36 n/a n/a PositiveHERBCOST Lower herbicide cost as a benefit 22 21c 13 14d PositiveWEEDCON Improved weed control as a benefit n/a n/a 36 40d PositiveYIELD Higher yield as a benefit 5 5c 27 30e PositiveTILL Less tillage as a benefit 8 8c n/a n/a PositiveINSCTCON Improved insect control as a benefit n/a n/a 20 22e Positive
Price riskMKT Ability to market GMO as a concern 69 67 55 60 NegativePREM Premiums for non-GMOs as a concern 30 29 25 27 NegativeCNTRCT Percentage of grain that is contracted n/a 20 n/a 20 Indeterminate
DemographicsSOY99 GMO soybean planted in 1999 90 87 n/a n/a PositiveCORN99 GMO maize planted in 1999 n/a n/a 51 56 PositiveBTPROD Bt maize planted n/a n/a 38 42 PositiveHERBPROD Herbicide-resistant maize planted n/a n/a 16 18 PositiveAGEf Age in years (48.50) n/a (48.50) n/a NegativeINCM1 Income less than US$20,000 year–1 11 11 19 21 IndeterminateINCM2 Income greater than US$100,000 year–1 12 12 13 14 IndeterminateEDU2 Education greater than high school 50 49 46 51 PositiveNE Farm in north-east Ohio 14 14 13 14 IndeterminateNW Farm in north-west Ohio 50 49 45 49 IndeterminateOWNSf Percentage of farm that is owned (0.29) (0.30) IndeterminateCROPSf Acres of land in crops (1176.00) (1267.00) IndeterminateLVSK Livestock on farm 51 50 46 51 Positive
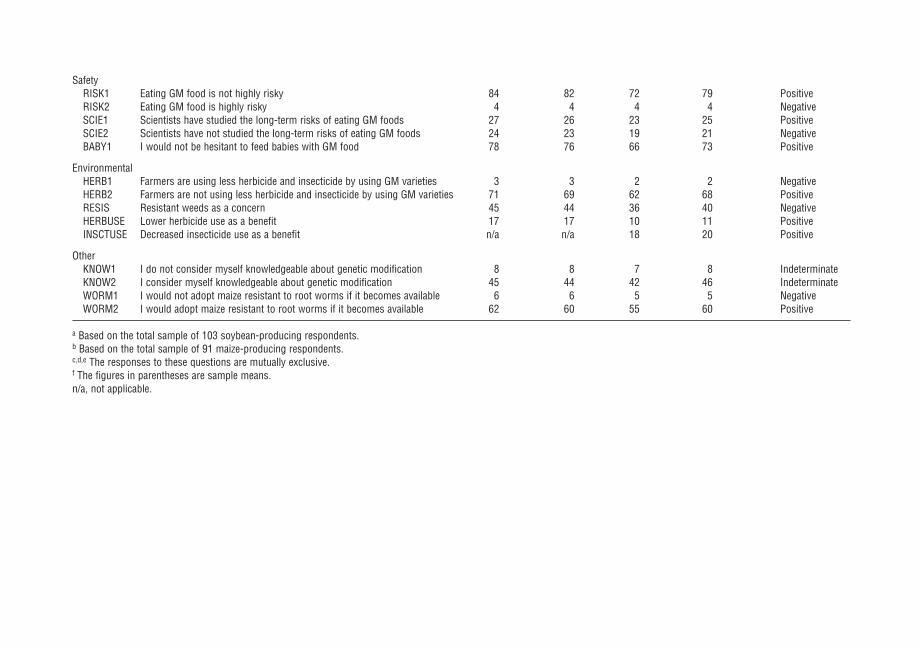
SafetyRISK1 Eating GM food is not highly risky 84 82 72 79 PositiveRISK2 Eating GM food is highly risky 4 4 4 4 NegativeSCIE1 Scientists have studied the long-term risks of eating GM foods 27 26 23 25 PositiveSCIE2 Scientists have not studied the long-term risks of eating GM foods 24 23 19 21 NegativeBABY1 I would not be hesitant to feed babies with GM food 78 76 66 73 Positive
EnvironmentalHERB1 Farmers are using less herbicide and insecticide by using GM varieties 3 3 2 2 NegativeHERB2 Farmers are not using less herbicide and insecticide by using GM varieties 71 69 62 68 PositiveRESIS Resistant weeds as a concern 45 44 36 40 NegativeHERBUSE Lower herbicide use as a benefit 17 17 10 11 PositiveINSCTUSE Decreased insecticide use as a benefit n/a n/a 18 20 Positive
OtherKNOW1 I do not consider myself knowledgeable about genetic modification 8 8 7 8 IndeterminateKNOW2 I consider myself knowledgeable about genetic modification 45 44 42 46 IndeterminateWORM1 I would not adopt maize resistant to root worms if it becomes available 6 6 5 5 NegativeWORM2 I would adopt maize resistant to root worms if it becomes available 62 60 55 60 Positive
a Based on the total sample of 103 soybean-producing respondents.b Based on the total sample of 91 maize-producing respondents.c,d,e The responses to these questions are mutually exclusive.f The figures in parentheses are sample means.n/a, not applicable.

Table A2. Variable description, expected signs, and estimated coefficients for 2000 acreage equations.
Estimated coefficientsa
Variable Description Expected sign Soybeans Bt maize Herbicide-resistant maize
Cost and profitabilityCOST1 Farmers are not realizing cost savings by using GM varieties Negative –216.98 239.23 –144.71COST2 Farmers are realizing cost savings by using GM varieties Positive 240.06 145.78 174.55PROF Higher profitability as an advantage Positive 106.5HERBCOST Lower herbicide cost as a benefit Positive 48.41 129.72YIELD Higher yield as a benefit Positive 34.12 418.48TILL Less tillage as a benefit Positive 130.93INSCTCON Improved insect control as a benefit Positive 368.34WEEDCON Improved weed control as a benefit Positive 195.47
Price riskMKT Ability to market GMO as a concern Negative –70.15 180.58 88.78PRE Premiums for non-GMOs as a concern Negative 12.34 –106.2 88.98CNTRCT Percentage of grain that is contracted Indeterminate –3.57 4.87 –17.4
DemographicsSOY99 GMO soybean planted in 1999 Positive 150.86CORN99 GMO maize planted in 1999 Positive 42.63 –8.998 7.74AGE Age in years Negative –0.6365 4.59 –2.23INCM1 Income less than US$20,000 year–1 Indeterminate 152.34 –368.68 –88INCM2 Income greater than US$100,000 year–1 Indeterminate –232.74 –212.93 –271.2EDU Education greater than high school Positive 90.86NE Farm in north-east Ohio Indeterminate 124.71 142.07 443.78NW Farm in north-west Ohio Indeterminate 51.43 152.56 132.66OWNS Percentage of farm that is owned Indeterminate –86.4 174.48 –70.38CROPS Acres of land in crops Indeterminate 0.1723 0.051 0.09LVSK Livestock on farm Positive 15.95 –13.49 –64.95
SafetyRISK1 Eating GM food is not highly risky Positive 116.61 9.75 97.56RISK2 Eating GM food is highly risky Negative 12.79 439.19 –1233.47SCIE1 Scientists have studied the long-term risks of eating GM foods Positive 21.32 18.85 –6.08SCIE2 Scientists have not studied the long-term risks of eating GM foods Negative 39.22 –7.8 –150.56BABY1 I would not be hesitant to feed babies with GM food Positive 145.29 90.54 –2.32

EnvironmentalHERB1 Farmers are not using less herbicide and insecticide by using GM varieties Negative 171.45 –1331.4 –571.31HERB2 Farmers are using less herbicide and insecticide by using GM varieties Positive –78.1 146.3 –285.06RESIS Resistant weeds as a concern Negative 7.79 –109.14 2.81HERBUSE Lower herbicide use as a benefit Positive 153.6 –1152.8INSCTUSE Decreased insecticide use as a benefit Positive 246.996
OtherKNOW1 I do not consider myself knowledgeable about genetic modification Indeterminate –238.7 125.61 –406.93KNOW2 I consider myself knowledgeable about genetic modification Indeterminate –57.8 –37.65 –18.93WORM1 I would not adopt maize resistant to root worms if it becomes available Negative –37.2 –1482.11 –834.74WORM2 I would adopt maize resistant to root worms if it becomes available Positive 36.71 283.37 122.45
a The coefficients in bold indicate that the variable is statisitically significant at the 10% level or lower.

Table A3. Variable description, expected signs, and estimated coefficients in 2000 share equations.
Estimated coefficientsa
Variable Description Expected sign Soybeans Bt maize Herbicide-resistant maize
Cost and profitabilityCOST1 Farmers are not realizing cost savings by using GM varieties Negative –0.175 0.7732 0.2239COST2 Farmers are realizing cost savings by using GM varieties Positive 0.4133 0.3504 –0.0169PROF Higher profitability as an advantage Positive 0.0554HERBCOST Lower herbicide cost as a benefit Positive 0.1142 0.143YIELD Higher yield as a benefit Positive 0.3247 0.7347TILL Less tillage as a benefit Positive 0.3147INSCTCON Improved insect control as a benefit Positive 0.7119WEEDCON Improved weed control as a benefit Positive 0.4151
Price riskMKT Ability to market GMO as a concern Negative 0.0084 0.1482 0.0108PRE Premiums for non-GMOs as a concern Negative –0.0729 –0.5106 0.355CNTRCT Percentage of grain that is contracted Indeterminate 0.001 0.0096 –0.0272
DemographicsSOY99 GMO soybean planted in 1999 Positive 0.027CORN99 GMO maize planted in 1999 Positive –0.0554 –0.0771 0.0689AGE Age in years Negative 0.0024 0.001 –0.0071INCM1 Income less than US$20,000 year–1 Indeterminate 0.2493 –0.4386 –0.0264INCM2 Income greater than US$100,000 year–1 Indeterminate –0.1599 –0.1905 –0.3271EDU Education greater than high school Positive 0.0139NE Farm in north-east Ohio Indeterminate 0.0681 0.3915 0.7687NW Farm in north-west Ohio Indeterminate –0.0718 0.4225 0.2988OWNS Percentage of farm that is owned Indeterminate –0.1413 0.4009 –0.3572CROPS Acres of land in crops Indeterminate –0.0000234 –2.13E-05 0.0000595LVSK Livestock on farm Positive 0.0735 0.007 0.0492
SafetyRISK1 Eating GM food is not highly risky Positive 0.1454 0.0292 0.271RISK2 Eating GM food is highly risky Negative 0.1666 0.5848 –2.7106SCIE1 Scientists have studied the long-term risks of eating GM foods Positive 0.0223 0.3601 0.02888SCIE2 Scientists have not studied the long-term risks of eating GM foods Negative –0.0142 0.2064 –0.2644BABY1 I would not be hesitant to feed babies with GM food Positive 0.1185 –0.1524 –0.2214

EnvironmentalHERB1 Farmers are not using less herbicide and insecticide by using GM varieties Negative –0.1061 –2.9229 –1.5481HERB2 Farmers are using less herbicide and insecticide by using GM varieties Positive –0.1243 0.3411 –0.1883RESIS Resistant weeds as a concern Negative 0.1021 –0.2122 0.0118HERBUSE Lower herbicide use as a benefit Positive 0.2156 –2.3138INSCTUSE Decreased insecticide use as a benefit Positive 0.5004
OtherKNOW1 I do not consider myself knowledgeable about genetic modification Indeterminate –0.1122 0.0609 –0.4248KNOW2 I consider myself knowledgeable about genetic modification Indeterminate 0.0417 –0.1007 0.056WORM1 I would not adopt maize resistant to root worms if it becomes available Negative –0.564 –3.2716 –1.9602WORM2 I would adopt maize resistant to root worms if it becomes available Positive 0.0903 0.3973 0.2379
aCoefficients in bold indicate that the variable is statistically significant at the 10% level or lower.

Introduction
Adoption of genetically modified (GM) crops hasrisen dramatically since their commercial introduc-tion in the mid-1990s. Cultivation is rapidlyexpanding, especially in the USA, Mexico,Argentina and China. The amount of land underGM crops totalled approximately 60 Mha in 2000.Europe accounts for less than 1% of this as theEuropean authorities have only given conditionalapproval to the new technology. The attitude of theEuropean regulatory authorities reflects widespreadpublic concern about the use of GM crops in foodproduction. The strength of feeling varies betweendifferent countries, but even among many peoplewho accept the value of GM technology for produc-ing new medical treatments there is uneasinessabout the ‘unnatural’ character of GM food.
However, with the increasing uptake of GMtechnology and the significant number of new GMdevelopments being prepared for the market place,GM crops are set to become a major influence oncompetitiveness through the entire food chain.Competition will be intensified, particularly interms of production cost and quality of the foodproducts. While the controversy and dispute overgranting approval to GM food in Europe means thatthere is very little current GM production inEurope, specific concern has been expressed aboutthe future competitiveness of European agriculture.
Some proponents claim that rapid acceptance andadoption of GM technology is necessary ifEuropean producers are to retain their share of theworld market.
The introduction of GM technology wouldtrigger changes and produce challenges for farmersas well as for the rest of the food chain. For a Finnishfarmer, this naturally gives rise to some questions:What are the possibilities/barriers for commercialintroduction of GM crops on Finnish farms? Whatare the economic impacts of GM technology? Howwill GM crops influence the profitability and inter-national competitiveness of Finnish agriculture?Who benefits from the new technology, and whofaces the disadvantages? What experiences havethere been in Finland? These questions form thebasis for this chapter, the purpose of which is toidentify the specific impact of GM technology onFinnish agriculture.
The information given in the chapter is basedon literature review, mostly from the USA, and dueto a lack of a sufficient domestic literature, on inter-views with key persons directly or indirectlyinvolved in Finnish production, trade or consump-tion of GM food.
The chapter is divided into three main parts.First, certain elements that determine the economiceffects resulting from the adoption and diffusion ofagricultural biotechnology are examined. This willinvolve tracing the key productivity gains delivered
159
13 Ex ante Economic Assessment of Adopting Genetically Engineered Crops in
Finland
Jyrki Niemi and Meri VirolainenAgrifood Research Finland, Economic Research (MTTL), Helsinki, Finland
© CAB International 2002. Market Development for Genetically Modified Foods(eds V. Santaniello, R.E. Evenson and D. Zilberman)
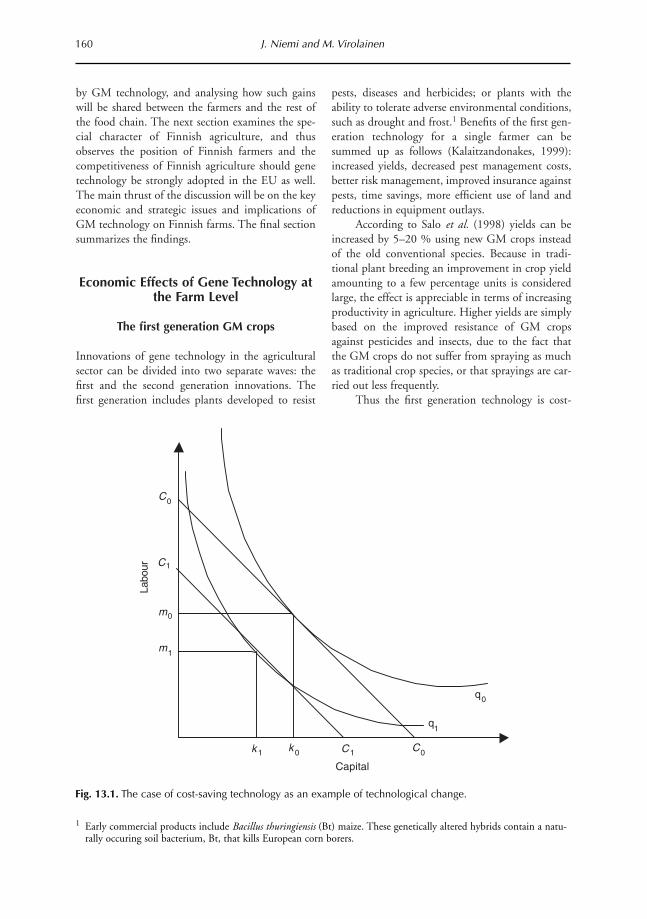
by GM technology, and analysing how such gainswill be shared between the farmers and the rest ofthe food chain. The next section examines the spe-cial character of Finnish agriculture, and thusobserves the position of Finnish farmers and thecompetitiveness of Finnish agriculture should genetechnology be strongly adopted in the EU as well.The main thrust of the discussion will be on the keyeconomic and strategic issues and implications ofGM technology on Finnish farms. The final sectionsummarizes the findings.
Economic Effects of Gene Technology atthe Farm Level
The first generation GM crops
Innovations of gene technology in the agriculturalsector can be divided into two separate waves: thefirst and the second generation innovations. Thefirst generation includes plants developed to resist
pests, diseases and herbicides; or plants with theability to tolerate adverse environmental conditions,such as drought and frost.1 Benefits of the first gen-eration technology for a single farmer can besummed up as follows (Kalaitzandonakes, 1999):increased yields, decreased pest management costs,better risk management, improved insurance againstpests, time savings, more efficient use of land andreductions in equipment outlays.
According to Salo et al. (1998) yields can beincreased by 5–20 % using new GM crops insteadof the old conventional species. Because in tradi-tional plant breeding an improvement in crop yieldamounting to a few percentage units is consideredlarge, the effect is appreciable in terms of increasingproductivity in agriculture. Higher yields are simplybased on the improved resistance of GM cropsagainst pesticides and insects, due to the fact thatthe GM crops do not suffer from spraying as muchas traditional crop species, or that sprayings are car-ried out less frequently.
Thus the first generation technology is cost-
160 J. Niemi and M. Virolainen
1 Early commercial products include Bacillus thuringiensis (Bt) maize. These genetically altered hybrids contain a natu-rally occuring soil bacterium, Bt, that kills European corn borers.
Fig. 13.1. The case of cost-saving technology as an example of technological change.
1q
0q
Capital
Labo
ur
0C
1C
0C1C
0m
1m
0k1k
reducing technology, which allows a producer tooffer a greater or equal quantity of commodities atlower price. Cost-saving technology reduces the pro-ducer’s unit production costs by increasing yields orreducing input costs. The first wave of biotech inno-vations, such as herbicide-tolerant cotton or soy-bean, can be easily classified as output-increasingtechnology and cost-saving technology. Figure 13.1illustrates the case of cost-saving technology. Outputq is assumed constant between time period 0 and 1(q0 = q1), when technological change reducing firmcost from C0 to C1 has taken place. The prices ofcapital and labour determine the slope of the iso-cost line. Factor-neutral technology implies that theneed for labour m and capital k diminishes by thesame proportion from m0 to m1 and from k0 to k1.
Many studies have analysed the agronomic andeconomic effects of adopting GM crops, especiallyin the USA (for example Culpepper and York, 1998;Marra et al., 1998; Klotz-Ingram et al., 1999;Traxler and Falck-Zepeda, 1999). Although cultiva-tion experiences of GM species have so far beenmostly positive, there have been some disappoint-ments. For example, herbicide-tolerant cotton wasassociated with significant increases in yields, butdisappointment was experienced in herbicide use,which did not decrease according to expectations.Cultivation tests with herbicide-tolerant soybeans,on the other hand, provided just the opposite result.The use of herbicides decreased significantly, but nomajor improvements in yields took place (USDA,1999). Klotz-Ingram et al. (1999) showed that thebenefits of GM crops depend largely on regional andyearly differences, including input costs (pesticideand insect costs, elite seeds used or not, etc.) andother production attributes.
The distribution of benefits from the new tech-nology is likely to be uneven. Based on the US expe-rience, the adoption of GM seeds has raised farmers’income in the short run, but revenues have vanishedin the long run. Kalaitzandonakes (1999) points outthat early adopters of new technology realizeincreased profits, but as more farmers adopt, theincrease in aggregate supply causes agriculturalprices to fall. The magnitude and speed of the sup-ply change will depend on the rate of adoption anddiffusion of the technology. Changes in consumerand producer benefits then depend on the extent towhich changes in price affect demand. If demand isfairly price-inelastic, then supply increases wouldresult in some increase in the quantity demanded,but a considerable drop in price. This is characteris-
tic of the demand for many crops. First wave GMtechnology is, therefore, not able to solve the prob-lem concerning inelastic demand of farm commodi-ties. The prices of farm commodities are likely tostay low and consumers will gain at the expense offarmers.
The process described above is known as the‘treadmill theory’ (Cochrane, 1965), describing hownew profitable and productive technological innova-tions are rapidly adopted by some farmers, leadinglater to wider adoption of new innovations andchronic surplus production and decreasing prices.Those who were slow to adopt or did not adoptwould lose. Hence, the new technology mightinvolve unhappy consequences for farmers. In theend, the impacts of the first stage GM technologyseem to have been negative for farmers.
The second generation GM crops
In the second wave, still at a development stage,gene technology will be improved to better meetcustomers’ needs. The second generation technolo-gy results in improvement in the attributes of thefood product. Some examples of potential secondgeneration products include crops with added valueoutput, such as improved flavour, texture, shelf-lifeand nutritional content, or improved process prop-erties for later processing stages. The quality-enhanced food products have the potential toincrease producer profits through increased demandfor the improved food (Caswell et al., 1994). Theseproducts can be sold at a higher price if consumersvalue the quality change. The higher prices may bean incentive to agricultural producers to adopt thesetechnologies even if production costs remainunchanged or increase. Up to the present only a fewvalue-added commodities have entered the markets,such as ‘golden rice’ developed for children sufferingfrom blindness and lack of vitamin A in the devel-oping world.
Determining the economic effects of secondgeneration crops can be more complex than in thefirst generation case. Speciality crops that containconsumer-desired traits must be separated from thecommodity supply chain in order to preserve theadded-value component. This could be accom-plished by either ‘crop segregation’ or ‘identitypreservation’ (IP). Effective segregation or IP –which begins at the farm level from isolated storageto different transport systems – requires that the
Economic Assessment of Adopting Genetically Engineered Crops 161

entire value-chain be coordinated in order to pre-serve the value trait in a food product until it reach-es the consumer, leading to more segmented com-modity markets.
Segmentation of a commodity market intospeciality sub-markets, and a residual commoditymarket, should, in turn, result in higher total mar-ket value. In addition to creating value, such seg-mented markets are less vulnerable to the techno-logical treadmill phenomenon as demand istypically more elastic (Kalaitzandonakes, 1999). Theconfluence of strategies of the various players alongthe agro-food chain will determine how value fromGM technology will be distributed among them andthe way the chain will be restructured. To be viableplayers in the value-added chain, farmers have todevelop closer relationships along the entire chain.
As a result, the value-enhanced crops couldeventually change the entire scope of production inagriculture, moving it towards contract production,similar to that found in the arrangements for spe-ciality grains and oilseeds. An increased use of con-tractual arrangements leads to greater vertical inte-gration and coordination in the whole food chain(Caswell et al., 1994). Interdependence will replaceindependence. Both supply and demand factorsunderlie the trend towards vertical integration. Onthe demand side, the need for efficient consumerresponse is positioning agribusiness to serve con-sumers’ wants and needs more accurately. Forprocessors, integration ensures predictable supplyand consistent quality
For farmers, contracts are likely to offer premi-ums over average market prices for agricultural com-modities, greater access to new technology andinputs, and new sources of capital (Caswell et al.,1994). The enhanced value of the GM product willnot, however, automatically jump into the farmers’wallet, without extra efforts. GM technology alsodemands new skills from farmers who have tochange their traditional production patterns.Contracts may erode a tradition of farmer inde-pendence in production decisions and management.Farmers are expected to plant, grow, harvest, storeand deliver according to the specific needs of end-users in food manufacturing, the livestock sectorand even the pharmaceutical industry (Riley andHoffman, 1999).
Despite the extra efforts caused by higherrequirements for a value-enhanced GM commodity,production of a value-added crop may turn out tobe a profitable business for farmers. For growing
tailored traits, farmers can earn premiums on eachkilogram produced. Value-enhanced GM com-modities include the same properties as luxury com-modities, that is more elasticity of demand. Thismay be a key for farmers to gain from new biologi-cal innovations and produce premium commoditiesinstead of bulk commodities; eluding the vicious cir-cle of producing more and more at a lower price. Therelative negotiating position of individual farmers ineach supply chain will determine their share of value-added from second generation agro-biotechnology.
Risks of gene technology for farmers: whogains?
There is no doubt that gene technology is able togenerate concrete productivity gains at the farmlevel, in the form of cost reductions, higher yieldsand improved risk management. However, the newtechnology also introduces new risks. Uncertaintiesexist because there is only short-term experience oftheir large-scale cultivation. Firstly, some authors areconcerned that over the long term, harmful envi-ronmental effects – such as the evolution of resistantinsect populations – in the case of certain plantscould reduce the benefits derived from the charac-teristics bestowed by the transferred gene.
Another well-known risk, often referred to byopponents of biotechnology, is the potential for toogreat a role for big corporations, jeopardizing farm-ers’ independent role in the food chain (Hayenga,1998). In the ‘darkest scenario’ farmers will losetheir independence, innovation firms extract all ofthe economic benefits generated by their products,and vertical integration will lead to unlimited powerfor multinational companies. The ability of theinput sector to receive the largest part of economicbenefits is, however, a contradictory issue. Are theyable to abuse their monopoly position in the mar-ket? According to some recent studies, there is nostraightforward answer to this.
Bijman and Enzing (1995) showed that adopt-ing biotechnology in the Dutch potato food chainraised significantly potato processing firms’ impor-tance in the chain. Processing companies becamelarger and fewer, because biotechnological researchis costly and risky, leading to the search foreconomies of scale. Traxler and Falck-Zepeda(1999), on the other hand, demonstrated in theirstudy carried out in the USA that firms in the inputsector (innovators) receive only a fragment of the
162 J. Niemi and M. Virolainen
total profit, because they have to offer a clear incen-tive for farmers to adopt the cultivation of GMseeds. In fact, the innovators’ share of total profitseemed relatively modest and a significant share ofthe benefits was transferred to the other parts of thefood chain.
Traxler and Falck-Zepeda (1999) were, howev-er, quick to point out that it is very difficult to iden-tify the monopoly profits in empirical work becauseof the difficulty in estimating marginal productioncosts, making it a quite difficult task to untangle theexact proportions in which benefits from an innova-tion are shared.
One crucial issue concerning the position offarmers in the chain is the number of contract part-ners. The adoption of the first wave technologyinvolves a risk for farmers if there is only a limitednumber of firms in the agricultural input market, asin Finland. The new technology is not expected togenerate changes that would raise the number ofplayers in the input sector. In fact, at present themovement is exactly the opposite, with the increas-ing consolidation and concentration of the agricul-tural input market.
The introduction of second wave technologycomplicates the picture as it generates market seg-mentation, new niche markets and so on, leading togreater vertical coordination. None the less, itshould be kept in mind that a highly vertically inte-grated system will not automatically raise the farm-ers’ position in the food chain. If a single farmer hasonly a limited number of contract partners and con-ditions are weak, contract farming may turn againstfarmers. In addition, there is the risk that new actorsmay appear in the food chain who try to obtain apart of the economic value added. New members inthe chain could reduce the farmers’ share of the totalgains.
Interestingly, the majority of the GM expertsin Finland have argued forcefully that it is veryunlikely that an ‘exploitation’ system would takeplace (Virolainen and Niemi, 2000). Vertical coor-dination is based on an idea of creating and sharingthe extra value of a value-enhanced commodity. It is,however, recognized that farmers may lose theirindependence if contract farming is implementedwithout farmers’ collective negotiation organizationto ensure their share of value-added commodities.
Finally, Hillyer (1999) has pointed out that thesecond stage technology involves other risks forfarmers that are difficult to control. The secondwave products face several challenges on their way
from laboratory to consumers, including a risk of‘empty promises’ if new inventions cannot be con-cretized. Costs of segregating are an unknownelement, such as large-scale building of new ware-houses. Kalaitzandonakes (1999) asserts that theadoption and acceptance of second stage commodi-ties by consumers will be even slower than the firstgeneration commodities, creating a remarkable riskas well.
An additional obstacle for the adoption of GMfarming in Europe is the Common AgriculturalPolicy (CAP) of the EU. Oversupply has been amajor concern for European policy makers from thelate 1970s. There is no doubt that more productiveGM plants would lose their attractiveness in the eyesof the EU if it should increase the excess supply andtherefore diminish farmers’ revenues and increasethe need for export subsidies.
Challenges Faced by Finnish Agricultureover GM Technology
On the basis of in-depth interviews with leadingactors in the Finnish agro-food and agro-biotech-nology firms, Virolainen and Niemi (2000) con-cluded that the EU will eventually approve the newtechnology. Hence, in the future GM food willappear on the Finnish markets, and this will funda-mentally affect the agro-food industry. The adventof GM crops is expected to trigger structuralchanges in the entire agricultural industry, dramati-cally changing the ways farmers produce and markettheir products. For policy makers interested inassessing the economic effects of adopting the newtechnology, it is important to identify the specificmarket conditions of the agro-food industry inquestion. Therefore, the effects of GM technologymust be considered in terms of competitivenessprior to adoption, and the ability of the industry toadjust to the new technology.
The competitiveness of Finnish agriculture isweakened chiefly through the unfavourable climaticconditions and predominantly small-scale farmstructure. Although Finnish livestock farms rankamong the most productive in Europe and increas-ing farm size could cut down production costs, thepoor cost-effectiveness of plant production consti-tutes a permanent disadvantage. Cost comparisonsindicate that unit costs in grain production arenotably higher in Finland than in the other EUcountries. The productivity of plant production is
Economic Assessment of Adopting Genetically Engineered Crops 163
poor primarily due to the geographic location. Thisis most clearly visible in the low yield level withrespect to the amount of production inputs used.Finnish farmers have to use crop species providingonly a medium yield level, because higher yieldingelite seeds cannot be adjusted to the demanding cli-mate of Finland.
Overall, the development of productivity inFinnish agriculture has been much slower than inthe leading agricultural countries in NorthernEurope. In the first few years in the EU the growthin productivity was probably slowed down by thecosts due to increasing the unit size (i.e. adjustmentcosts), but growth accelerated as a result of the rapidstructural development in agriculture. In the pastcouple of years there have been indications thatgrowth in productivity might be somewhat morerapid compared with the long-term average.However, it is obvious that the difference in pro-ductivity between Finland and the rest of the EUhas not been essentially reduced during Finland’sfirst years as an EU member (Myyrä and Pietola,1999).
In many cases, GM crops would probablyincrease the productivity of Finnish agriculture.According to some Finnish GM experts (for exam-ple E. Pehu, personal communication, 19 January2000; K. Raininko, personal communication, 10January 2000) agronomic gains from gene technol-ogy might be even greater for countries like Finland,suffering from difficult circumstances, than coun-tries with more favourable farming conditions. Inthese ‘optimistic scenarios’ Finland will benefit con-siderably from the new biotech innovations, likeimproved resistance to temporary cold periods andimproved ability to adjust to lower temperatures, forexample in the early spring.
Naturally, the possibility of applying higheryielding crop species sounds very attractive, if inven-tions can be concretized. One important gain is thepossibility of maintaining the crop yield on a suffi-cient level through improved pest and insect man-agement. Field trials in Finland have been under-taken in connection with, for example, transgenicsugarbeets, indicating an approximately 2–5%larger crop. Of course, the cost of sugarbeet seedswould be higher. At the same time, pesticide costswould decrease by 60–75%, however. According toRaininko (personal communication, 2000), farmerscould earn an additional FIM 600 ha–1 (10% ofgross returns) using transgenic sugarbeets.
On the other hand, concerns have been raised
as to whether large farms in good agriculturalregions can make better use of the GM technologyand reduce their unit production costs more thanthe small Finnish farms in remote areas. In fact, it isdifficult to conceive that the difference in produc-tivity between Finland and the leading agriculturalcountries in northern Europe, which exists due tonatural disadvantage, could be essentially reducedwith the help of GM technology. For example, Saloet al. (1998) have suggested that the benefits derivedfrom GM crops in Finland could be somewhatlower than elsewhere, since disease, weed and pestproblems are less serious than they are in countriesfurther south.
Although GM crops may improve productivi-ty in Finnish agriculture and production costs couldbe cut by the use of GM crops, the yield constraintsof crop farming are expected to remain an essentialdisadvantage. This disadvantage could leave smallFinnish farms less competitive and eventually forcethem out of the market. An important issue in thiscontext is whether farm size/location is related to theability to use the new technology more efficiently(Caswell et al., 1994). The present literature suggeststhat there seems to be little empirical support for theview that GM technology is particularly well suitedfor large farms. However, if the information costsassociated with adoption are high, then ‘informa-tion bias’ may exist, where large farms find it easierto adopt new technology, since they can spread thefixed cost of adoption over a greater level of produc-tion (Kinnucan et al., 1990).
Some concern has been expressed about thecosts of R&D efforts to develop GM crop varietiesthat would provide real productivity gains forFinnish farmers. Many of the crop varieties grown inFinland have been traditionally bred there, owing tothe fact that the large global corporations do not setout to develop varieties intended for Finland’s bore-al climate and small markets. These varieties have tobe developed either as a result of domestic R&Dwork, or by purchasing genes and GM plants fromforeign companies for use in domestic plant breed-ing (Salo et al., 1998).
The capability of adjusting to the biotech com-petition facing Finnish agriculture varies a great dealin different production lines. According to Salo et al.(1998) there are certain Finnish conventional cropswhose competitive ability is low if GM species enterthe markets. Expanding imports of GM rape andGM barley will be a real threat for the cultivation ofconventional barley and oilseed crops in Finland. In
164 J. Niemi and M. Virolainen

particular, imported GM rape, including an optimalGM modification for the processing of oil, couldjeopardize domestic oilseed production. For yearsFinnish barley has been successfully used as rawmaterial for the Finnish brewing industry. Barleypurchases may, however, be targeted abroad insteadof domestic GM-free raw material due to cost sav-ings obtained (Virolainen and Niemi, 2000).
Conclusions
The cultivation of GM crops is going to increase inthe near future and the EU will eventually take partin this development. However, the rate and direc-tion of this development and the use of new tech-nology depend on a multitude of factors, includingEU policies, consumer demand, and advances in sci-ence. There is little doubt, drawing on the literature,that the adoption of GM technology will alter thefarmer’s position in the food chain, creating newthreats as well as new options. The first wave ofbiotechnology is expected to provide tangible pro-ductivity gains at the farm level, such as higheryields, lower pest management costs and greatercropping practice flexibility. The second wave tech-nology promises to enhance the value of crops fromthe farmer to the consumer.
However, at this point it remains relativelyuncertain what specific impact GM technology willhave on Finnish agriculture, and on rural Finland ingeneral, for that matter. On the one hand, there areexpectations that farmers will benefit from increasedprofits for their GM crops. Among other things, thenew technology promises to deal better with theproblematic climatic conditions of Finland with anoption to choose higher yielding crop species. Onthe other hand, concerns have been raised as towhether large farms in the leading agricultural coun-tries in northern Europe can make better use of theGM technology and reduce their unit productioncosts more than the small Finnish farms in remoteareas. In a large, sparsely populated country withfew alternative sources of income, this could be athreat to the viability of certain regions. The rela-tionship between new technology and farmsize/location may, therefore, determine the structureof rural communities and who wins and loses fromtechnological change.
Because both the efficacy and the price of GMproducts are still unknown, it is difficult to makeany quantitative assessment of the economic impact.
However, it is evident that the introduction of GMcrops would reinforce vertical integration in theFinnish food chain. GM varieties will only be grownunder the approval of the customer (trading firm,processing company, retailer or consumer).Approval will only be given if the GM variety holdsan evident qualitative improvement compared withnon-modified varieties. The need for approvalstrengthens the integration between different stagesof the product chain. Farmers must become morespecialized and need to work more closely togetherif they are to maintain their share of the market. Infuture they must also become much better informedand react more flexibly to market changes.
The evolution of EU regulations concerningfood safety and environmental protection will natu-rally have a significant influence on the type of GMtechnology innovations that are applied by farmers.Ultimately, the success of the new technology will bedecided in the market place by a wider set of con-sumer interests. Concerns about the nature of gen-etic engineering and risks to human health have ledretailers to consider carefully their response to theprevalence of products which might contain geneti-cally modified organisms. The uncertainty of con-sumer reactions is the largest impediment to assess-ing the future potential of GM technology inFinnish agriculture.
References
Bijman, J. and Enzing, C. (1995) Biotechnology andVertical Co-ordination in the Agrofood Chain. A CaseStudy of the Dutch Potato Chain, Science and Public
Policy 22. Beech Tree Publishing, Guildford, UK,
pp. 391–398.
Caswell, M., Fuglie, K. and Klotz, C. (1994) AgriculturalBiotechnology: an Economic Perspective, Agricultural
Economic Report 687. Economic Research Service,
United States Department of Agriculture,
Washington, DC.
Cochrane, W. (1965) The City Man’s Guide to the FarmProblem. University of Minnesota Press,
Minneapolis, Minnesota.
Culpepper, A.S. and York, A.C. (1998) Weed management
in glyphosate-tolerant cotton. Journal of CottonScience 4, 174–185.
Hayenga, M. (1998) Structural change in the biotech seed
and chemical industrial complex. AgBioForum 1,
43–55. www.agbioforum.org
Hillyer, G. (1999) Biotechnology offers U.S. farmers
promises and problems. AgBioForum 2, 99–102.
www.agbioforum.org/vol2no2/hillyer.html
Economic Assessment of Adopting Genetically Engineered Crops 165
Kalaitzandonakes, N. (1999) A farm level perspective on
agrobiotechnology: how much value and for whom?
AgBioForum 2, 61–64. www.agbioforum.org
Kinnucan, H., Upton, H., Molnar, J. and Venkateswaran
(1990) Scale neutrality of bovine somatotropin: ex-
ante evidence from Southeast. Southeastern Journalof Agricultural Economics 1–12.
Klotz-Ingram, C., Jnas, S., Fernandez-Cornejo, J. and
McBride, W. (1999) Farm-level production effects
related to the adoption of genetically modified cot-
ton for pest management. AgBioForum 2, 73–84.
www.agbioforum.org
Marra, M., Carlson, G. and Hubbell, B. (1998) Economic
impacts of the first crop biotechnologies. www.
ag-econ.ncsu.edu/faculty/marra/firstcrop/img001.gif
Myyrä, S. and Pietola, K. (1999) Tuottavuuskehitys
Suomen maataloudessa vuosina 1987–97. [Abstract:
total factor productivity in Finnish agriculture in
1987–1997]. Research report 234, Agricultural
Economics Research Institute, Helsinki.
Riley, P. and Hoffman, L. (1999) Value-enhanced crops:
Biotechnology’s next stage. Agricultural OutlookMarch, s. 18–23.
Salo, A., Kauppinen, V. and Rask, M. (1998)
Loppuraportti kasvitekniikasta: Kasvigeenitekniikka
ravinnontuotannossa. [Abstract: plant gene technol-
ogy in food production]. Publication 1998/4,
Committee for the future, Parliament of Finland,
Helsinki.
Traxler, G. and Falck-Zepeda, J. (1999) The distribution
of benefits from the introduction of transgenic
cotton varieties. AgBioForum 2, 94–98. www.
agbioforum.org/vol2no2/traxler.html
USDA (1999) Impacts of adopting genetically engineeredcrops in the U.S. – preliminary results. www.econ.
ag.gov/whatsnew/issues/gmo
Virolainen, M. and Niemi, J. (2000) Geenitekniikan ja
muuntogeenisen ruuan taloudelliset vaikutukset
Suomen elintarvikeketjussa. [Abstract: economic
effects of genetic engineering and genetically modi-
fied food in the Finnish food sector], Working papers
7/2000, Agricultural Economics Research Institute,
Helsinki.
166 J. Niemi and M. Virolainen

Introduction
The chapter analyses the potential effects of biotech-nology innovations in agriculture, referring to thecase of the processed tomato sector in southernItaly. To date, there are no commercially availablebiotechnology products, but the spreading life-science revolution will soon offer new opportunitiesin this sector. After a brief presentation of the cur-rent competitive position of the examined industry,the analysis of biotechnological impact is carried outin two stages.
Primarily, an analysis of the potential demandfor biotechnologies is conducted, stemming fromthe results obtained in a wide study on the demandfor innovation by farmers in southern Italy.Moreover, perception and acceptance of biotech-nologies by different operators along the tomato‘filiera’, are investigated through focused inter-views.
In the second stage, by drawing on the currentresearch effort and comparing the potential innova-tion with expressed needs on the demand side, theeconomic impact of biotechnologies is described,taking into account the complex institutional prob-lems affecting the sector. At this stage the analysis is
limited to a qualitative basis and does not face theenvironmental and ethical problems related togenetically modified (GM) food.
In the concluding section, the results are con-nected to the current discussion on genetically mod-ified organism (GMO) regulatory policies, demon-strating that in some weak institutional frameworks,like in southern Italy and in developing countries,the social control of risks and benefits associated tothe new technologies is very hard to achieve, regard-less of the chosen policy instrument.
The Italian Processed Tomato Sector
Italy is the second largest world producer ofprocessed tomato and supplies about 50% of theEuropean Union (EU) total demand. The process-ing industry is concentrated in two regions, one incentral Italy (Emilia) and the other in southern Italy(Campania). As opposed to Emilia, Campania ischaracterized by the three following elements: (i)agricultural production is located out of the regionand is concentrated in Puglia, which is nearby; (ii)firms are small, (while Emilia accounts for 15% and32% of total domestic firms and production,
167
14 Biotechnology, Farm Management andLocal Agricultural Development1
Maria Teresa Gorgitano and Valeria SodanoDepartment of Agricultural Economics, University of Naples – Federico II,
Portici, Italy
© CAB International 2002. Market Development for Genetically Modified Foods(eds V. Santaniello, R.E. Evenson and D. Zilberman)
1 The chapter is the outcome of the work of the two authors with financial support from the MURST (Ministerodell’Università, della Ricerca Scientifica e Tecnologica) project ‘Innovative Pest Control Systems and QualityImprovement in Mediterranean Agricultural Area’. M.T. Gorgitano wrote the first half of the chapter (to ‘Survey atthe Farms’) and V. Sodano wrote the second half.

Campania supplies 50% of production with 60% offirms); and (iii) Campania is strongly specialized intraditional products, and is the world leader in thepeeled tomato, covering 80% of the total supply.
The tomato industry expanded quickly duringthe 1970s and 1980s, driven by the increasingdemand and by some important innovations, suchas: (i) the development of hybrids with enhancedyield and quality; (ii) the diffusion of picker andseeding machines; and (iii) the modernization of theprocessing plants.
During the 1990s, demand increased veryslowly and industry tried to keep the sector lively byintroducing new products, such as preparedflavoured sauces and spiced tomatoes, added to thetraditional ones (i.e. peeled tomato, concentratedsauce and pulp sauce).
The most important event by far to influencethe sector’s evolution during the last 20 years is theintroduction of an income support scheme by theEU (reg. 1152/78 and 2200/96), which grants sub-sidies to processors up to fixed quotas. To receive thesubsidies, processors must pay the farmer a price notlower than the target price annually set by theCommission. Moreover, processors are constrainedto make purchasing contracts with the farmers’ asso-ciations rather than with single farmers. The EUintervention allowed the sector to survive in a frame-work of very low competitiveness with respect to theworld market, where prices are about 40% lowerthan the domestic minimum guaranteed price.
To date, the sector lies in the maturity stage ofits life cycle. Profits are still positive, but the opera-tors are seriously concerned about negative signalsfrom price trends. The situation can quickly worsenif the EU decides to cut the support and this even-tuality negatively affects expectations and invest-ments among the operators.
Empirical Analysis of the InnovationDemand
The analysis of innovation demand in the southernItaly processed tomato sector was conductedthrough a field survey organized in two stages. In thefirst stage, we preliminarily explored innovationproblems by interviewing exponents of differentbodies acting in the ‘filiera’, such as processing firms,producer associations and regional agriculturaldevelopment services. In the second stage, westudied the relationships between farmers’ structural
and managerial characteristics and their need forinnovation. To this aim we developed a specifiedquestionnaire and submitted it to a large sample ofgrowers from Puglia and Campania, which sell tothe local processors.
The perception of innovation needs by theagriculture-related sectors
Processing firms
Processors are mainly interested in product innova-tion to achieve two goals: (i) to make use of plantmachinery throughout the year; and (ii) to diversifythe final product to match new consumers’ atti-tudes.
Firms selling through supermarket privatelabels are concerned with quality control and guar-antee. They also highlight the increasing demand ofretailers for tomatoes obtained by following inte-grated techniques of production.
Firms selling branded products generally focuson product differentiation in niche markets, such asregional or organic ones. Some people are attractedby functionally engineered food, such as tomatoeswith a higher concentration of antioxidants(lycopene and flavonoids), which are supposed toprevent cancer.
All of the companies are interested in innova-tions that raise the productivity of the cycle of trans-formation, through either an increase in the Brixdegree, or a very high resistance to peeling.
Biotechnologies are generally disregarded,firstly because of the current mistrust shown byEuropean consumers, secondly because the applica-tions that have been proposed up to now, have notresponded to the specific needs of firms operating inCampania.
Producer associations
Producer associations are made up of producercooperatives that are very heterogeneous in sizes andbehavior. The associations are predominantly fromthe Campania region, while cooperatives are equallydistributed between Campania and Puglia. The dis-tance of the associations’ management from farmersaccounts for the low interest they exhibit in agricul-tural innovation problems. Many managers of theassociations have a clear perception of the mosturgent technical problems, such as virus prevention.
168 M.T. Gorgitano and V. Sodano
Nevertheless, they tackle farmers’ needs in a verylazy way. Very few cooperatives provide technicalassistance for their members and more often the jobis given to technicians from the processing compa-nies. In the same way, even though there are manycooperatives that have joined in the request by thecompanies to have production obtained by integrat-ed techniques, their role is still limited to resolvingbureaucratic and administrative problems thatcome from the EU and do not extend to technicalassistance.
With regard to biotechnologies, the associa-tions’ most frequent statement is that the currentinformation on risk and opportunities is too low toallow a responsible judgement on the effectivenessof their introduction in the sector.
Public bodies for agricultural extension
The directors of public extension bodies in Pugliaand Campania are faced with diverse agriculturalproblems. Independent farmers have varyingamounts of capital and land, as well as diverse futureprospects. In Puglia, the cultivation of tomatoesdoes not pose any particular problems and the mainjob is to help farms with a high level of technicalefficiency to grow. The situation in Campania isquite different. Farms are generally quite small insize, and the cultivation of tomatoes was abruptlyreduced by the spread of viruses and then aggravat-ed by the competition from Puglia. Public extensiondeals with the problem by teaching farmers to oper-ate in market niches with more added value, forexample by instituting collective brands (DOP, IGP)for the valorization of regional products such as SanMarzano.
The position towards biotechnology is uncer-tain: moderately favourable if aimed at resolvingproblems associated with viruses, and negative ifdirected at increasing yield.
The survey at the farms
We used a questionnaire based on the following setsof questions: (i) general information about farmstructure and farmer; (ii) production processes; (iii)relationships within the cooperatives; (iv) coordina-tion with upstream and downstream related sectors;(v) innovation patterns; (vi) future perspectives; and(vii) GMO perception and acceptance.
Of the farms in the sample, 40% are located inPuglia (all outside Foggia) and 60% in Campania, inthe Nocerino-Sarnese area, the traditional territoryfor tomato cultivation. Farms in Puglia are large;20% of them cultivated an area larger than 100 ha.In contrast, in Campania small sizes prevail andmore than 80% of the farms do not extend to 2 ha.In Campania farmers crop 50% of their cultivatedarea to the tomato while in Puglia tomatoes consti-tute no more than 10% of the land.
Many direct questions were used in order toidentify the most serious problems faced while cul-tivating tomatoes. The answers given show that thechoice of and the quality of the propagation materi-al (plants and seeds), and other technical means donot represent a problem given that the processingfirms suggest the variety and the cooperatives pro-vide technical inputs.
The most frequently declared problems are:pest disease (80%), lack of manpower (50%), yieldreduction due to soil impoverishment (27%), har-vest timing according to delivery organization(20%) and irrigation (18.5%).
Moreover, 80% of farmers highlighted institu-tional and economic problems stemming from theregulation of the relationship with producerassociations and processors within the frameworkof the EU intervention. Problems arise from thestrong contractual power the intervention gives toprocessors and from the lack of loyalty andcompetence in the associations’ conduct. Negativeeffects are low prices and quality and excessivemarket risk.
In order to identify more precisely the farmers’potential demand for innovation, we analyse the dif-ferent weights they give to each one of the problemsdescribed above, their acceptance of GMOs and themotivations supporting these choices.
We performed a cluster analysis in order todivide the sample into homogeneous groups. Thisclassification was made in two steps. In the first one,through a principal component analysis, weobtained few variables (factors) after having identi-fied relationships among a larger set of interrelatedvariables (elementary variables). This analysis per-mits us to identify non-directly observable variables(factors) as linear combinations of the observed vari-ables (elementary variables). The goal is to reducethe number of variables while keeping the ability toexplain most of the observed variability and identi-fying (through the factors) the underlying dimen-sions that can be useful to explain the complex
Biotechnology, Farm Management and Local Agricultural Development 169

phenomena analysed.2 In the second step, they wereutilized as variables for a cluster analysis to obtainhomogeneous groups of farmers.3
The elementary variables we used are:
1. Mechanized degree of production process;2. Production methods enhancing quality;3. Share of tomato acreage; 4. Cropped area of farms; 5. Age of the farmer; 6. Initial year of tomato cultivation.
The results of the principal component analy-sis are shown in Table 14.1. Three factors have aneigenvalue greater than 1, and are responsible for78.5% of the total variation. The communalityrange of the elementary variable set is between 0.72and 0.84.4
The first factor explains more than 26.9% ofthe total variation. It identifies the mechanizationdegree of the tomato production process and thelevel of ‘quality’ in tomato production methods. Ahigh score for this factor identifies a farm that has ahigh degree of mechanization and uses integratedpest management techniques.
The second factor is responsible for more than26.3% of the total variation. It is defined by twovariables which enter the linear combination withopposite signs: share of tomato acreage and croppedfarm acreage, which identifies the different farmsize. A farm with a high score for this factor is a largefarm with only a small part of its land devoted totomato production.
The last factor considered (25.3% of the totalvariation) includes two elementary variables with a
170 M.T. Gorgitano and V. Sodano
2 The operational steps of the factor analysis have been: (i) to compute the correlation matrix for all elementary vari-ables; (ii) to extract the factors using the principal component analysis; and (iii) to perform an orthogonal rotation ofthe factors. After the correlation analysis, in order to verify whether the elementary variables are related to each other or not, andto what extent, we extracted factors. They are linear combinations of the elementary variables, so that any of theobserved variables is closely related to one or more factors when its weight in the linear combination (factor loading)in absolute value is large. Each factor is extracted by maximizing the explained variability, under the constraint ofbeing uncorrelated with the other factors. In this way, the hope is for the first few factors to be able to account forthe largest amount of total variance. In fact, to explain all of the variance in the sample, a number of factors equal tothe number of variables must be extracted. Each factor explains part of total variance, and altogether account for totalvariance. In order to reduce the factor number, we sorted the factors according to the percentage of explained vari-ance, and selected only those factors which explain more variance than a single variable on average, by selecting thefactors with an associated eigenvalue greater than 1. Finally the factors were rotated (using the Varimax method) totransform them into other factors that are easier to interpret.
3 The method applied for joining clusters is the Ward’s method, and the distance among cases was computed with thesquared Euclidean distance index.
4 The communality of a variable is the proportion of variance explained by the factors equal to the sum of the squareof the factor loading of the variable (the proportion of variance accounted for by each factor).
Table 14.1. Factor loading of elementary variables,a explained variance andcommunality.
Factor 1 Factor 2 Factor 3% of the variance 26.94 26.30 25.30
Cumulated variance 26.94 53.24 78.54
Variables Communality
X1 0.78 0.89X2 0.77 0.83X3 0.84 –0.87X4 0.79 0.82X5 0.72 –0.91X6 0.81 0.80
aCoefficients lower than 0.30 in absolute value are dropped.X1: Mechanized production process degree; X2: Processes enhancing quality; X3: Share of tomato acreage; X4: Cropped farm area; X5: Age of the farmer; X6: Initial year of tomato cultivation.
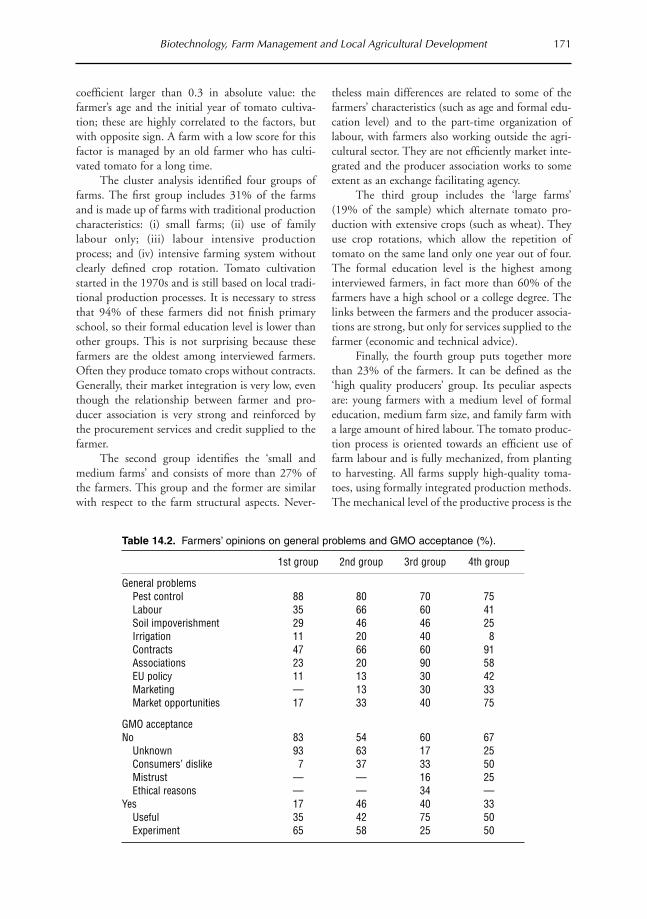
coefficient larger than 0.3 in absolute value: thefarmer’s age and the initial year of tomato cultiva-tion; these are highly correlated to the factors, butwith opposite sign. A farm with a low score for thisfactor is managed by an old farmer who has culti-vated tomato for a long time.
The cluster analysis identified four groups offarms. The first group includes 31% of the farmsand is made up of farms with traditional productioncharacteristics: (i) small farms; (ii) use of familylabour only; (iii) labour intensive productionprocess; and (iv) intensive farming system withoutclearly defined crop rotation. Tomato cultivationstarted in the 1970s and is still based on local tradi-tional production processes. It is necessary to stressthat 94% of these farmers did not finish primaryschool, so their formal education level is lower thanother groups. This is not surprising because thesefarmers are the oldest among interviewed farmers.Often they produce tomato crops without contracts.Generally, their market integration is very low, eventhough the relationship between farmer and pro-ducer association is very strong and reinforced bythe procurement services and credit supplied to thefarmer.
The second group identifies the ‘small andmedium farms’ and consists of more than 27% ofthe farmers. This group and the former are similarwith respect to the farm structural aspects. Never-
theless main differences are related to some of thefarmers’ characteristics (such as age and formal edu-cation level) and to the part-time organization oflabour, with farmers also working outside the agri-cultural sector. They are not efficiently market inte-grated and the producer association works to someextent as an exchange facilitating agency.
The third group includes the ‘large farms’(19% of the sample) which alternate tomato pro-duction with extensive crops (such as wheat). Theyuse crop rotations, which allow the repetition oftomato on the same land only one year out of four.The formal education level is the highest amonginterviewed farmers, in fact more than 60% of thefarmers have a high school or a college degree. Thelinks between the farmers and the producer associa-tions are strong, but only for services supplied to thefarmer (economic and technical advice).
Finally, the fourth group puts together morethan 23% of the farmers. It can be defined as the‘high quality producers’ group. Its peculiar aspectsare: young farmers with a medium level of formaleducation, medium farm size, and family farm witha large amount of hired labour. The tomato produc-tion process is oriented towards an efficient use offarm labour and is fully mechanized, from plantingto harvesting. All farms supply high-quality toma-toes, using formally integrated production methods.The mechanical level of the productive process is the
Biotechnology, Farm Management and Local Agricultural Development 171
Table 14.2. Farmers’ opinions on general problems and GMO acceptance (%).
1st group 2nd group 3rd group 4th group
General problemsPest control 88 80 70 75Labour 35 66 60 41Soil impoverishment 29 46 46 25Irrigation 11 20 40 8Contracts 47 66 60 91Associations 23 20 90 58EU policy 11 13 30 42Marketing — 13 30 33Market opportunities 17 33 40 75
GMO acceptanceNo 83 54 60 67
Unknown 93 63 17 25Consumers’ dislike 7 37 33 50Mistrust — — 16 25Ethical reasons — — 34 —
Yes 17 46 40 33Useful 35 42 75 50Experiment 65 58 25 50

highest. Relationships with producer association arevery strong because the latter provide farmers withall kinds of extension, including credit, managerial,technical and marketing services.
In Table 14.2, we present the farmers’ opinionson technical and economic problems and their incli-nation to make use of GMOS. The farms in the firstgroup (traditional producers) perceive the pest con-trol problem as the most important and identify thestrong contractual position of the industry as themain cause of their economic problems. Most ofthem (83%) are not interested in GMOs, eitherbecause they do not have enough information(93%), or because they do not believe in marketopportunities (7%). Among the farmers who wouldmake use (17%), 65% are interested in preliminaryexperiments, and 35% trust the effectiveness of thenew technologies.
The farmers in the second group (small andmedium farms) declare three important technicalproblems (labour organization, decreasing yield andviruses) and many among them (66%) complainabout the strong power of processors. About 54%dislike GMOs (lack of information, 63%; no mar-ket opportunities, 37%), while among those infavour, 58% would like to experiment and 42%believe in the effectiveness.
The farmers in the third group (large farms) donot suffer from technical problems, while they areparticularly aware of the institutional distortionsinduced by the EU intervention. Most (90%) holdthe producer associations responsible for low pricesand marketing inefficiencies. Biotechnologies aregenerally disagreed with (60%), not only because ofthe lack of information (17%) and of market oppor-tunities (33%), but also because of ethical principles(34%). Farmers who like GMOs are mostly con-vinced (75%) that the new technologies could havelarge positive economic effects.
The farmers in the fourth group are muchmore worried about institutional problems. Theycriticize the behavior of producer associations (58%)and above all the contractual power of processors(91%). They also express the need for a wide reformof the EU policy. The interest in GMOs is quite lim-ited and 67% of those interviewed would notemploy it, mainly (50%) because of marketingproblems. The favourable farmers would experimentwith GMOs (50%) and believe in the potentialsuccess.
Biotechnology Research in the ProcessedTomato Sector
At present there are only a few commercial trans-genic tomatoes, those with the fruit ripening altered,which have had a discrete diffusion in the US freshmarket since the beginning of the 1990s. We cansuppose that in a few years new products will beavailable. Transitions in the life science industry(Enriquez and Goldberg, 2000) accelerate the intro-duction of GMOs into as much of the market aspossible and this is proved by the large number ofexperimental fields present in the EU. In Italy toma-to is the second product (by number of experiments)in the list of EU deliberate field trials (EuropeanCommission–JRC, 1999) and it is in first place forthe variety of transgenic characteristics tested. The30 trials included in the Commission’s complete listof allowed field trials (see Appendix) are dividedamong the following seven trait innovations (num-bers in brackets refer to the number of experimentsper group):
• glufosinate tolerance (2);• Bt-derived insect resistance(1);• improvement of processing quality (6);• increased yield (3);• virus resistance (13);• drought resistance (1); • others (4).
The analysis of the groups which carry on thetrials gives rise to the following remarks.
1. The research is mainly supported by the publicsector. This could positively affect the distributionof potential benefits and environmental risk control,but could compromise the commercial success ofthe eventual new products. 2. Multinational life-science companies are scarcelyinvolved and this may be a result of two issues: (i)tomato is not yet considered a commercially inter-esting market; and (ii) Italy does not provide enoughresearch facilities.3. Seed companies are much more interested in thesector. This is because the strong direct relationshipwith local customers they have had over the past 20years created major market opportunities while alsogiving them the possibility of exploiting the organi-zational economies created by the existing commer-cial network.4. The processing industry does not seem to be sofascinated by biotechnologies, in part because of the
172 M.T. Gorgitano and V. Sodano

low consumer acceptance in the EU market (that isthe main market for the sector) and in part becausecurrent innovative strategies focus on different aimssuch as regional and organic production, qualitycontrol and distribution organization. Moreover,biotechnological research requires strong financialand knowledge resources while the tomato industryis a traditional sector with a low strategic and eco-nomic effort in R&D. Manufacturers could developinnovative projects only by making agreements withbiotech companies interested in speciality and localmarkets, like start-up related to the public researchnetwork, but these are just the kind of firms that arenot found in the weak socio-economic environmentof southern Italy.
The Potential Effects of PrivateBiotechnology Innovations in the
Southern Italy Tomato Sector
The economic effects of biotechnology innovationsin agriculture are generally evaluated looking at theuser’s improvement in technological efficiency(McBride and Brooks, 2000) and at the welfareeffects. In the case of a cost reducing innovation,assuming no negative external factors, the welfareeffect is measured by the change in Marshallian sur-plus plus the monopoly profit captured by the dis-coverer of the innovation through the IPR protec-tion (Moschini and Lapan, 1999; Falck-Zepeda etal., 2000). While these approaches correctly capturethe main effects for standardized commodities, theyhardly address problems stemming from biotech-nologies in speciality and processed agriculturalproducts. When more than one sector operates inthe marketing channel for the transgenic product, itis difficult to estimate the final effect on the con-sumer, and to evaluate the distribution of the pro-ducer’s surplus among the different vertically relatedsectors. Monopsonistic practices in the primarymarket can lead to the exploitation of the grower’sbenefits of innovation from the processing industry,likewise monopolistic power in the final market canlower the consumer’s surplus. The analysis frame-work is even more complicated when vertical coor-dination is not achieved through the market but
through contractual agreements, and when compet-itive strategies are based both on cost advantage andon differentiation.
We try to evaluate the potential effects ofbiotechnologies in the processed tomato sector byconsidering the strategic and organizational implica-tions of the innovations. The analysis is strictly qual-itative because of the lack of both available data andof a formal model that is able to capture the com-plexity of the suggested scenarios. Considering fivemain vertical stages in the tomato sub-sector(biotech industry, plant nurseries, growers, proces-sors and retail distribution) we analyse the effects ofthe innovations with respect to the following threeissues: (i) the vertical distribution of cost and bene-fits; (ii) the competitiveness of southern production;and (iii) the evolution of structures and strategieswithin the sector. Innovations are grouped into twocategories: growing improvements and processingimprovements.
Growing improvement innovations
The current research focuses on two characteristics,yield increase and virus resistance. A higher produc-tivity, although technologically more efficient, couldlead to economic losses for the growers. In the actu-al situation with the EU support, crop abundance,instead of pulling the sector towards lower con-sumer prices and agricultural modernization (by theexit of marginal farmers), could worsen the contrac-tual weakness of growers. As we have already seen,the producer associations do not try to plan produc-tion to respect community goals and quotas but tryto depress the market to permit the maximumopportunistic exploitation from the processors.When an innovation is introduced, the growersshould pay the technology fee and should accept aprice lower than the guaranteed one.5 Also, con-sumers probably would not see any advantagesbecause the final price is imposed by the retailersaccording to their own cost structures and strate-gies.6 Furthermore, extra profits reached by thegreater market power on the procurement side coulddistract the industry from carrying out optimalinterventions in product differentiation and quality
Biotechnology, Farm Management and Local Agricultural Development 173
5 As we will discuss in the next section, legally processors should pay the guaranteed prices but in the system there existmany informal and quite illegal ways by which the industry and the association set a different price.
6 As in most processed food, the agricultural component’s share of the total cost is very low and there is a low down-ward price transmission elasticity along the marketing channel.
control. Therefore the results could be: gains for theinnovation suppliers and for processors; losses forthe growers and maybe for the consumers whowould pay for the total organizational efficiencyloss. Moreover, the competitive strength of thesouthern ‘distretto’ could be worsened, because of anaggravation of the institutional problems affectingthe sector and the loss of the actual southern com-petitive advantages.
In the case of virus-resistant plants, in the cur-rent situation with little disease loss, the effectscould be compared with those of the previous case.Higher protection from virus would raise productiv-ity. The only additional effect would be the lowercultural risk, but under the hypothesis of risk-adverse growers this would not lead to relevant eco-nomic effects. Obviously in the case of a wide dis-ease diffusion as happened in Campania during the1980s, the innovation would be positive for all thecomponents of the ‘filiera’, simply avoiding an eco-nomic disaster. Nevertheless, this dramatic scenariois very unlikely even without biotechnologies,because we need only a few correct agronomic prac-tices, such as the use of certified seed and good croprotation, to prevent it.
Processing improvement innovations
We must distinguish the case in which the innova-tion is introduced by the biotech industry from thecase in which it is introduced by some processingfirm.
In the first case, if the innovation produces costand quality advantages we can suppose it will soonspread over the whole processing industry, causingan increase in competitiveness and a consumers’surplus improvement (either through a lower price,or through higher quality assurance and variety).The processor’s ability to exploit some of the bene-fits will depend on its relative market power. Surelythe main benefits will occur for the discoverers andthe downward suppliers of the innovation, such asthe plant nursery. The main cost will be borne bygrowers, who will pay the technology fee and willlose strategic autonomy within the ‘filiera’.
In the second case (innovation stemming fromprocessing firm research activity), the effect could bea less competitive sector due to the competitiveadvantages achieved by the innovating firms.Probably before imitation effects are produced, con-sumers could lose with regard to the price but gain
in product differentiation either in the horizontal orin the vertical dimension. The gains from thetechnology fee will be shared between inventors(processors) and suppliers (the seed industry andplant nurseries) according to the specific contractsthat the parties will be able to design and enforce.Growers will have to accept higher cost; neverthelessthe increased strategic role of procurement activitieswill probably lead processors to a cooperative rela-tionship with the farmers. In certain cases it couldhappen that industry would be forced to transferpart of the innovation gains to the growers to givethem the incentives to cultivate the transgenicproduct.
Biotechnologies, Local Development and Institutional Problems in Southern
Italy
One interesting result from the empirical researchwas that the farmer’s basic need is to improve verti-cal coordination, with the aim of lowering price riskand balancing the buyer’s contractual power.
This result demonstrates that even though ithas been working for more than 20 years, the EUintervention did not achieve the following twogoals:
1. Assuring farmers about production placementand price (paying the subsidy to processors shouldassure placement; moreover constraining the receiptof the subsidy to the payment of the target priceshould assure price);2. Promoting collaborative relationships betweenfarmers (the obligation to make contracts throughthe producers association should help to achieve thisgoal) to improve production planning and the farm-ers contractual position.
What really happens in the southern Italianregions we examined is that EU rules only are for-mally enforced, while exchanges are regulated byinformal and implicit contracts, as the followingfarmers’ statements demonstrate:
1. Price is set at the end of the harvest, according tothe supply volumes.2. Processors use different ways to pay a price lowerthan the legal one. They can declare lower weightsand quality for delivered production, or impose highrates on loans informally granted to farmers (withthe producer associations acting like brokers).
174 M.T. Gorgitano and V. Sodano

3. Payment timing and procedures are definedaccording to informal agreements that aim at maxi-mizing brokers’ (i.e. producer association) margins.
These informal exchange mechanisms, some-times quite illegal, are enforced by the behaviour ofthe associations which act as agents of processorsinstead of the formal principal (the farmers). Thisdistortion in incentives can be explained noting thatpresent directors of the associations were previouslydealers and have been keeping the same economicbehaviour over time. Moreover it is a fact that theEU intervention gave them a strong monopsonisticpower towards farmers.
Here we find most of the institutional prob-lems that negatively affect southern Italy’s develop-ment.7 The presence of informal relationshipsbetween processors and associations, enforced bytraditional social conventions, to some extent con-stitutes a form of social capital (according to theColeman’s definition). The exploitation of this socialcapital allows both parties to reach personal advan-tages by the implementation of opportunisticbehaviours that damage the farmers and the publicoperator. Surplus stemming from these behavioursdeviates the system from efficiency. Competition isno more based on the achievement of competitiveadvantages through managerial efforts, but on theexploitation of social capital in an opportunisticway. These kinds of institutional problems can affectbiotechnology innovations in the processed tomatosector.
The weakness of the legal system hampersinvestments by life-science companies, especiallythose made jointly with local bodies. Conversely, itcan give rise to incentives for unfair behaviour, likea low level of risk control in field trials or the oppor-tunistic exploitation of local biological resources.
The contractual handicap moves the agricul-tural sector from efficient innovative patterns,increasing the risk of adopting biotech innovationswhen more suitable competing technologies couldbe implemented.
Finally the described vertical coordinationforms, which lead to unfair conduct, could nega-tively affect any effort of the public sector to ade-
quately inform and assure consumers about the use(or the non-use) and the risk of GMOs.
Summary and Conclusions
The empirical investigation into the possible devel-opment of biotechnologies in the processing tomatosector in southern Italy gave rise to three mainfindings.
1. To date, the demand for GM products is verylow in the sector either because of the lack of infor-mation or because of the need for alternative inno-vations. Growers look for organizational innova-tions that are able to increase their contractualpower over the buyers. Processing firms pursueproduct innovations in niche markets like those fororganic and regional products, and judge GM prod-ucts to not be appealing enough for the consumers.2. The interest in biotechnologies is also limited onthe supply side. The life science companies are actu-ally more interested in standardized crops than inspeciality products like processed tomato. Publicbodies that could achieve research projects increas-ing welfare, seem to be too weak both on manageri-al and financial grounds. The processing industry,while having some interest in GM products withadded value output traits, does not invest enough inR&D activities.3. Given the actual competitive structure, the insti-tutions acting in the sector, and the local socio-eco-nomic peculiarities, biotechnological innovationswould positively affect mainly the innovators andthe operators owning the most market power alongthe ‘filiera’. Growers could even suffer from innova-tion leading to yield increase because of the depress-ing market effects along with the payment of thetechnology fee. The most negative effect could occurin Puglia, where the agricultural competitive advan-tage is actually based on the natural higher produc-tivity the region exhibits.
The results suggest some discussion about twoimportant issues. The first topic, for which theavailable literature is very scant, concerns the evalu-
Biotechnology, Farm Management and Local Agricultural Development 175
7 In the 1980s many studies explained the underdevelopment in southern Italy from an institutional perspective. Someof them widely made use of Coleman’s concept of social capital (Putnam, 1993; Fukuyama, 1995), classifying thesouthern regions among those with a low social capital and a strong family’s cultural rule. Some critics (Mutti, 1994;Bagnasco, 1999) underlined that it is not the ‘quantity’ of the social capital, but its ‘quality’, that seriously hampersthe development. This interpretation is consistent with some theoretical studies (Mutti, 1998; Piselli, 1999; Trigilia,1999) which attempt to make the concept of social capital better fit development problems.
ation of the relationships between the food systemorganizational structure and the innovative patternsin one or more vertically related stages. Some exam-ples are given by the recent radical innovations inthe food retail sector that led to revolutionary man-agement concepts like ECR (efficient consumerresponse) or CM (category management) and dra-matically changed the competitive framework in thebackward vertically related sector (Lanciotti, 1999;Senauer and Kinsey, 1999).
In the case of the processed tomato sector, weargued that different vertical coordination forms cangive different incentives to biotechnology innova-tion and strongly influence the distribution ofderived costs and benefits among the componentsalong the ‘filiera’.
When vertical coordination is achieved byinformal and implicit contracts rather than marketor formal contracts, the effects on innovating activ-ity are even more difficult to understand. To explorethis issue we need to improve the traditional effi-ciency-based theory (like the theory of contracts orthe transaction cost economy) using analytical toolsbetter able to tackle problems, such as the powerand evolution based incentives or the social embed-dedness of economic activity. Some analyticalframeworks successfully used in local developmentstudies such as the New Economic Sociology stem-ming from Granovetter or the New SociologicalInstitutionalism (Rizza, 1999), have also recentlybeen recommended for the food system verticalcoordination analysis (Boon, 1999; Galizzi andVenturini, 1999).
The second issue is related to the EU regulato-ry options about the use of biotechnology in agri-culture. The mandatory labelling option and theprecautionary principle accepted in risk assessmentand management, is irreconcilably opposite to theUSA, which instead recognizes zero-risk for GMOs(until science-based proof of dangerousness isacquired) and allows voluntary labelling of productsthat do not use GMOs (Caswell, 2000).
Even if people who are really worried about thenegative environmental impact of GMOs would behappy to believe that EU policy is driven by theJonas’ ethical ‘responsibility principle’ (Jonas,1990), it is quite clear that EU policy is principallyinfluenced by economic and political consensusconsiderations. Consensus is related to the recentinterest of public opinion in food safety problems.Economic considerations refer to the EU aim ofprotecting domestic production, specialized in spe-
ciality and regional products, from the new trans-genic products, for which the USA has strong com-petitive advantages.
The results on the potential effects of biotech-nologies in the southern Italy tomato sector allowfor at least two critiques of the EU position. Firstly,the presence of numerous field trials, in spite of thelow interest in biotechnology emerging from inter-views, demonstrates that, in time, biotechnologieswill widely affect world agriculture. Then the prob-lem is no longer to ban or to label GMO productsbut to responsibly and successfully participate in thelife science revolution. Only if all the components ofthe food system are involved in the discovery and inthe introduction of innovations, will it be possibleto have an effective risk monitoring of the newtechnologies. The best aims of the public sectorshould then be research support and the promotionof collaborative relationships among different bodiesinvolved in biotechnologies.
Secondly, the research demonstrates that insome weak institutional frameworks (like we high-lighted in southern Italy) differences between volun-tary and mandatory rules are rather more theoreticalthan practical. When there are no market incentivesto guarantee the effectiveness of the voluntaryapproach, and when the mandatory rules cannot beenforced by an efficient legal system, both theapproaches will fail to reach their objectives(Segerson, 1999). In southern Italy and in manyunderdeveloped countries with similar institutionalproblems (Shiva, 1993), public intervention shouldaim at improving human and social capital, by pro-moting knowledge and trust.
References
ANICAV (1999) Rapporto sull’industria italiana delle con-serve di pomodoro. ANICAV, Napoli.
Bagnasco, A. (1999) Teoria del capitale sociale e political
economy comparata. Stato e Mercato 57, 351–372.
Boon, A. (1999) Capabilities, transaction costs, and verti-
cal co-ordination in the food system. In: Galizzi, G.
and Venturini, L. (eds) Vertical Relationships and Co-ordination in the Food System. Physica-Verlag, New
York.
Caswell, J.A. (2000) An evaluation of risk analysis as
applied to agricultural biotechnology (with a case
study of GMO labeling). Agribusiness 16(1),
115–123.
Coleman, J.S. (1990) Foundation of Social Theory. Harvard
University Press, Cambridge, Massachusetts.
176 M.T. Gorgitano and V. Sodano

Enriquez, J. and Goldberg, R.A. (2000) Transforming life,
transforming business: the life-science revolution.
Harvard Business Review 4, 96–104.
EU Commission-JRC (1999) Field trials, Italy. www.
foodjrc.it
Falck-Zepeda, J.B., Traxler, G. and Nelson, R.G. (2000)
Rent creation and distribution from biotechnology
innovations: the case of Bt cotton and herbicide-tol-
erant soybean in1997. Agribusiness 1(16), 21–32.
Fonte, M., Salvioni, C. and D’Ercole, E. (2000) L’analisi
economica delle biotecnologie applicate all’agri-
coltura. La Questione Agraria 1, 54–74.
Fukuyama, F. (1995) Trust. The Free Press, New York.
Galizzi, G. and Venturini, L. (1999) Towards a theory of
successful vertical cooperation in the food system. In:
Galizzi, G. and Venturini, L. (eds) VerticalRelationships and Co-ordination in the Food System.
Physica-Verlag, New York.
INEA (2000) Le Proposte di Riforma del Sostegno alPomodoro da Industria e Agli Agrumi Destinati allaTrasformazione. INEA, Roma.
Jonas, H. (1990) Il principio responsabilità. Einaudi,
Torino.
Lanciotti, C. (1999) Supply chain integration, category
management and the Italian food retail sector. In:
Galizzi, G. and Venturini, L. (eds) VerticalRelationships and Co-ordination in the Food System.
Physica-Verlag, New York.
McBride, W.D. and Brooks, N. (2000) Survey evidence on
producer use and costs of genetically modified seed.
Agribusiness 16(1), 6–20.
Moschini, G. and Lapan, H. (1999) Intellectual property
rights and the welfare effects of agricultural R&D.
In: Galizzi, G. and Venturini, L. (eds) VerticalRelationships and Co-ordination in the Food System.
Physica-Verlag, New York.
Mutti, A. (1994) I sentieri dello sviluppo. Rassegna italianadi sociologia 73, 109–120.
Mutti, A. (1998) Capitale sociale e sviluppo. il Mulino,
Bologna.
Pelt, J.-M. (2000) L’orto di Frankestein. Feltrinelli, Milano.
Piselli, F. (1999) Capitale sociale: un concetto situazionale
e dinamico. Stato e Mercato 57, 395–417.
Putnam, R. (1993) Making Democracy Work. Princeton
University Press, Princeton, New Jersey.
Rizza, R. (1999) Le istituzioni tra economia e sociologia.
Sociologia del Lavoro 73, 119–143.
Segerson, K. (1999). Mandatory versus voluntary
approaches to food safety. Agribusiness 1(16), 53–70.
Senauer, B. and Kinsey, J. (1999) The efficient consumer
response initiative: implications for vertical relation-
ships throughout the U.S. food system. In: Galizzi,
G. and Venturini, L. (eds) Vertical Relationships andCo-ordination in the Food System. Physica-Verlag,
New York.
Shiva, V. (1993) Monoculture of the Mind. Perspectives onBiodiversity and Biotechnology. Zed Books, London.
Trigilia, C. (1999) Capitale sociale e sviluppo locale. Statoe Mercato 57, 419–440.
Biotechnology, Farm Management and Local Agricultural Development 177
Appendix
Italy: Field trials (EU Commission-JRC) (source: www.food.jrc.it/gmo).
• Tryptophan-2-monoxygenase synthesis (Istituto Sperimentale per l’Orticoltura)• Virus resistance (tomato spotted wilt virus) (Istituto Sperimentale per l’Orticoltura)• Tryptophan-2-monoxygenase synthesis (Istituto Sperimentale per l’Orticoltura; Section of Montanaso
Lombardo)• Virus resistance (cucumber mosaic virus) (Istituto Sperimentale per la Patologia Vegetale; Monsanto
Europe)• Virus resistance (cucumber mosaic virus) (Istituto Sperimentale per la Patologia Vegetale; Peto Italiana
s.r.l.)• Virus resistance (cucumber mosaic virus); Virus resistance (potato virus y) (Istituto Sperimentale per la
Patologia Vegetale; Key Gene)• Virus resistance (cucumber mosaic virus) (Istituto Sperimentale per la Patologia Vegetale di Roma)• Ac/Ds two components transposon system; Gene tagging; Glufosinate tolerance (Metapontum Agrobios
s.c.a.r.l.)• Ac/Ds two components transposon system; Glufosinate tolerance (Metapontum Agrobios s.c.a.r.l.)• Virus resistance (cucumber mosaic virus) (Metapontum Agrobios s.c.a.r.l.)• Downregulation of pectin esterase; Improvement of processing quality (Peto Italiana s.r.l.)• Improvement of processing quality; Polygalacturonase synthesis (Peto Italiana s.r.l.)• Improvement of processing quality; Polygalacturonase synthesis (Peto Italiana s.r.l.; Stazione
Sperimentale per l’Industria delle Conserve Alimentari; Zeneca Plant Science)• Virus resistance (cucumber mosaic virus) (Peto Italiana s.r.l.)• Virus resistance (cucumber mosaic virus) (S&G Sementi s.p.a.)• Drought tolerance; Levan sucrase synthesis (Sementi Nunhems s.r.l.)• Increased cell wall thickness; Pyrophosphate synthesis (Sementi Nunhems s.r.l.)• Increased yield; Kinase synthesis (Sementi Nunhems s.r.l.)• Increased yield; Sucrose transporter protein synthesis (Sementi Nunhems s.r.l.)• Virus resistance (cucumber mosaic virus) (Sementi Nunhems s.r.l.)• Virus resistance (cucumber mosaic virus) (SME Ricerche s.c.p.a)• Bt-derived insect resistance (SME Ricerche s.c.p.a)• Downregulation of pectin esterase; Improvement of processing quality (Peto Italiana s.r.l.) • Improvement of processing quality; Polygalacturonase synthesis (Stazione Sperimentale per l’Industria
delle Conserve Alimentari)• Improvement of processing quality; Polygalacturonase synthesis (Stazione Sperimentale per l’Industria
delle Conserve Alimentari; Zeneca Plant Science)• Virus resistance (cucumber mosaic virus) (Tecnogen s.c.p.a.)• Osmotic synthesis; Pathogenesis related proteins synthesis (Università degli Studi della Tuscia;
Dipartimento di Produzione Vegetale)• Virus resistance (tomato yellow leaf curl virus) (Vilmorin Italia)• Virus resistance (tomato yellow leaf curl virus) (Vilmorin SA)
178 M.T. Gorgitano and V. Sodano
The on-going genetically modified (GM) food andgenetically modified organism (GMO) controversythreaten to destroy the near-term market for ag-biotech food and inputs and alter greatly the netsocial benefits that are potentially attainable fromagricultural biotechnology. For example, consider:
1. In February 2000 Greenpeace filed a lawsuitchallenging the US Environmental ProtectionAgency’s decision to allow the release of GM insectresistant (Bt) crops. In their news release they stated‘The EPA should stop [GE] polluters before theenvironment is threatened’ (Greenpeace, 2000a).2. During the week of 23 March 2000 Greenpeacejoined over 50 other organizations in a petition tothe US Food and Drug Administration (FDA) call-ing on the agency to remove genetically engineered(GE) foods from the market because it failed torequire safety testing or labelling (Greenpeace,2000b).3. In 1998, the European Union set out to updateCouncil Directive 90/220 covering the deliberate
release of GMOs. In the spring of 2000, the EUdecided not to approve any more releases until thedirective is revised.4. During 1999, more than 50% of the cropbiotech field experiments in the UK were disruptedby anti-GMO activists.
Nettleton (1999) states that the anti-biotechactivists have achieved a masterful feat in communi-cation, subverting the purpose of biotechnology,whipping up public alarm and feeding politicalagendas to protect agricultural markets.
Advances in science enable new technologiesand advances in technology increase the demand forscience. Advancing science and technology areuncertain and costly activities (Holmstrom, 1989;Huffman and Evenson, 1993; Huffman and Just,2000). Although some new technologies have bene-fited society greatly, much uncertainty surroundsmost new technologies. For example, little accurateinformation or knowledge exists about the attrib-utes, including effects, of new ag-biotechnologies,
179
15 Public Acceptance of and Benefits fromAgricultural Biotechnology: a Key Role for
Verifiable Information
Wallace E. Huffman1* and Abebayehu Tegene2*1Department of Economics, Iowa State University, Ames, Iowa, USA; 2Resource
Economic Division, ERS, USDA, Washington, DC, USA
© CAB International 2002. Market Development for Genetically Modified Foods(eds V. Santaniello, R.E. Evenson and D. Zilberman)
* The authors are Professor of Economics, Iowa State University, and Economist, Resource Economics Division, ERS,USDA, respectively. Matt Rousu provided research assistance, and the Economic Research Service (cooperativeagreement no. 43-3AEL-8-80125) and Iowa Agriculture and Home Economics Experiment Station providedfinancial support. Views presented in this chapter are the authors’ and do not represent ERS or the USDA. Journalpaper number J-19000 of the Iowa Agriculture and Home Economics Experiment Station, Ames, Iowa, Project3077, supported by Hatch Act and State of Iowa funds.

and some of the knowledge/information that doesexist is public information and some private.1
Additional research can be undertaken to increasethe knowledge about the beneficial and harmfuleffects of new technologies, some of which willreduce the uncertainty over future irreversible catas-trophes. Advances in communication and informa-tion networks make possible rapid worldwide dis-semination of public scientific discoveries and otherinformation.
Private information is the source of asymmet-ric information, and it leads to an informationaladvantage to the party possessing the information.In two party interactions with one party possessingprivate information, the informed party can beexpected to exercise their informational advantagewhenever they can expect to gain from it, and theother party loses. When experienced parties developintuition about situations potentially leading toopportunistic behaviour of others, asymmetricinformation can destroy trade/exchange betweenparties where the potential gains fromtrade/exchange are large.
The objective of this chapter is to examine thewelfare effects of information from communication(by interested parties) on the decisions of producersof agricultural products and potential users ofbiotechnical inputs and on consumers of agro-biotechnical products. Interested parties are consid-ered to be private biotechnical companies whoseprofits depend positively on sales of GM inputs toagricultural producers and ‘environmental groups’whose utility depends positively on the quantity andquality of environmental stocks. The ag-biotechcompanies provide or distribute information prima-rily in advertising, news releases, informationalbrochures and web sites, personal contacts anddemonstrations. The environmental groups provideor distribute information primarily in news releases,informational web sites and demonstrations. Finalconsumers of agricultural products and agriculturalproducers that might use GM inputs are assumed to
be approximately ‘neutral parties’ in this communi-cation process, but they face important decisionsrelating to their own welfare.2 We acknowledge thatother possibly more trusted sources of informationexist for producers and consumers, and the chapterfocuses on the importance of these sources to gooddecision making.3 We will show that verifiable infor-mation plays a central role in socially good decisionmaking and that an independent agency shouldstore and make freely available verified information.This agency might also engage in research needed torefute or confirm claims made by interested partiesand others.
The Model
Many decision makers must or choose to rely oninformation provided by individuals or groups whoare affected by their decisions. Furthermore, thesedecision makers may not know the alternativesavailable and have no control over the informationprovided to them by interested parties. These inter-ested parties may manipulate by distorting or con-cealing information. For example, farmers rely oninformation, including advertising, provided/dis-tributed by biotech companies about the expectedperformance of new biotech inputs, which is quiteselective. These firms are constrained somewhat byan interest in repeat sales, but their communicationmay not reflect accurately all known impacts.Consumers rely on information and advertising dis-tributed by food companies and environmentalgroups which seem likely to be tinged with self-interest. For example, communications byGreenpeace and Friends of the Earth opposing GMfoods may exaggerate the potential harm to the envi-ronment and distract from other important issues.
Greenpeace, Friends of the Earth and otherenvironmental groups are interest groups.Individuals self-select into these groups because of acommon interest or goal focused on the environ-
180 W.E. Huffman and A. Tegene
1 See Frey (2000) for a discussion of some of the prospects and problems associated with the use of biotechnology inplant breeding.
2 Hoban (1997, 1999) shows that food safety concerns from biotechnology are rated relatively low by consumers in theUSA, Western Europe and Japan, relative to microbial contamination, pesticide residuals and antibiotics or hormones.
3 Although Hoban (1996) reported that ag-biotech companies and activist groups are not ranked high by US con-sumers as a trusted information source, this does not mean that they never use any of the information in decisionmaking. In The Netherlands, a survey of the general public showed that environmental and consumer organizationswere seen as the most reliable sources of information on biotechnology (Heijs and Midden, 1996). In the UK,Martin and Tait (1992) found that in a local community reaction to a GMO release, the public chose to support theperspective provided by Greenpeace.

ment, and achieving the group’s goal is a publicgood to its members. Hence, free-riding by onemember on the efforts of other members is a majororganizational problem (Olson, 1965; Sandler,1992; Cornes and Sandler, 1996: 324–326). Each ofthese groups has resources – largely members’ timeand financial contributions – and their impact isaffected by organizational efficiency. By choosingrelatively narrow objectives, these groups reducecoordination and decision making costs over organ-izations that have diverse goals. Advances in com-munication and information technologies havegreatly reduced organizational costs of interestgroups and have undoubtedly increased their pro-ductivity. They are now able to construct low costweb sites for displaying their objectives, news releas-es, short articles and other information. For exam-ple, the web site of Friends of the Earth has beenused to display the locations or addresses of large-scale plantings of GMO crops in England (Friendsof the Earth, 2000). These groups can also use e-mail to rapidly distribute communications amongmembers, for example dealing with demonstrations,and others, such as letters opposing GMO use andpolicies.4
In our model, the two interested parties pro-vide information in the form of communicationsattempting to affect agricultural producers’ and con-sumers’ decisions. The communications are signalswhich reflect the self-interest and private informa-tion of each party. Communication is cheap becauseit requires little action on the part of the sender, andnew information technologies, such as e-mail andweb sites, have reduced its cost and greatly increasedthe swiftness of delivery. There remains some mod-est fixed cost of preparing a communication, but themarginal cost of distributing it has become approxi-mately zero (Shapiro and Varian, 1999: 19–51).Misinformation can be as easily distributed as usefulinformation. Computer viruses, like ‘I Love You’,are one example of misinformation which can besent swiftly around the world and clog the informa-tion network. In particular, the new informationtechnology has greatly expanded the possibility ofindividuals communicating with others whom theydo not know personally and from whom they mayhave greatly different norms and values. Hence, newproblems with assessing the quality of information
obtained from web sites and e-mail have arisen(World Bank, 1999: 72–81). Because signallingwith communications is so cheap, one possible out-come is that they degrade the quality of informationto the point that communications from interestedparties are ignored.
Although the marginal cost of distributinginformation is approximately zero, it remains costlyfor decision makers to interpret this information,especially contradictory information. Consumersand agricultural producers, however, differ in thelong-term consequences of using bad information.Consumers maximize utility subject to a resourceconstraint. When they fail to use objective informa-tion in decision making, their utility or well-beingdecreases, but this does not generally cause them toexit the economy (except when the consequence isdeath). Producers on the other hand can bedescribed as long-run profit maximizers. If they donot use good information, their profits are reduced.If they become negative over the long term, mostlikely they will be forced to exit the industry. Thus,there is selectivity operating among farmers that isgenerally different from that of consumers. For con-sumers and producers, the ability to process infor-mation and make good decisions is a valuable skillin the sense that it can be welfare or profit increas-ing, and this ability seems most likely to be relatedto their years of schooling and accumulated experi-ence as decision makers (Huffman, 2002). Givensome outlay on information, a decision makermight choose to rely on only one interested party inmaking their decisions, or they might choose to relyon several interested parties possessing differentpoints of view. There are potential costs and benefitsof each of these actions.
Although Milgrom and Roberts (1986) haveshown that it is possible for a decision maker tomake fully informed decisions when the decisionmaker relies on one interested party for information,the necessary conditions seem quite restrictive andare unlikely to be fulfilled. For example, the inter-ested party’s preferences must be known to the deci-sion maker, the information must be freely verifi-able, the decision maker must know the factorsabout which the interested party has information tobe able to detect situations in which information isbeing withheld, and the decision maker must be
Public Acceptance of and Benefits from Agricultural Biotechnology 181
4 Furthermore, advances in communication and information technologies may have facilitated coalition formationamong interest groups wishing to oppose ag-biotechnology for whatever reason (see Greenpeace, 2000b and the com-ment by Nettleton, 1999).

able to draw the appropriate inference when infor-mation is withheld (i.e. he or she must be a sophis-ticated, sceptical decision maker). These aredemanding, but perhaps not impossible attributesfor successful agricultural producers to possess, butthey seem to exceed the attributes of most con-sumers of food. The implication is that for agricul-tural producers (or consumers) to rely only on infor-mation provided/disseminated by biotech supplyfirms or environmental groups is unlikely to lead tofully informed decisions. Hence, good reasons existfor society to be sceptical of claims made by both thesuppliers of ag-biotech inputs and the environmen-tal interest groups.
Adding (having or allowing) competitionamong interested parties in providing informationgreatly reduces the restrictions or assumptions nec-essary for good decision making. The interested par-ties must be able to convey their information to thedecision maker, and the decision maker must listento all interested parties who want to convey infor-mation, that is, there must be an opportunity for thedifferent interests to come out. Ag-biotech firms,environmental groups and other interested partiesseem likely to differ in their ability and effectivenessin conveying information that they have. This abili-ty might be associated, among other things, withtraining, communication skills, personalities, orga-nizational objective/philosophy and informationtechnologies.5 Rapid advances in communicationand information technologies are widely availabletoday, and with the dramatic fall in the cost of send-ing messages and storing information through newnetworks (Shapiro and Varian, 1999; World Bank,1999), accessibility to technologies seems minimallyconstrained by capital or credit. Biotech companiesare primarily private companies interested in long-term profits associated with the sales of their prod-ucts and the value of the company, and the infor-mation that they distribute can be expected to beconsistent with this long-term objective and to beconstrained by it. Environmental groups are pursu-ing non-monetary goals which seem likely to be lessconstraining on their actions and possibly on theobjectivity of the information they distribute.
However, the decision makers can now beunsophisticated, having little or no idea of availableoptions, of issues bearing on the decision or prefer-ences of the interested parties. He or she must, how-ever, be able to process the information that he orshe receives, and the information must be verifiable.Under these conditions, fully informed decisions arepossible. The implication is that agricultural pro-ducers and consumers can make better decisionswhen they use information from diverse and possi-bly interested parties, provided the information isverifiable.
Much information being distributed these daysabout ag-biotechnology, however, is not currentlyverifiable. First, biotechnology is advancing rapidlyso many effects and impacts of new products areunknown. Second, a coalition of anti-biotechnologyinterests has been formed to slow the acceptance ofag-biotechnology. These groups have raised newquestions about both the short-term and the long-term effects on health and the environment of usingag-biotechnology and consuming GM foods. Third,some of the activities of the anti-biotech groupsseem to be focused on disrupting the experimentsthat might lead to important and useful advances inthe stock of knowledge about ag-biotechnology.
When information is not verifiable, the relia-bility of information provided by an interested party(or parties) depends on the congruity between theobjectives of the decision maker and those of theinterested party (parties). When objectives diverge,decision making is difficult, and these complexproblems have been the topic of optimal incentiveschemes in principal-agent or agency theory litera-ture (e.g. see Holmstrom, 1979; Holmstrom andMilgrom, 1987; Gibbons, 1998). These models are,however, well suited only to decision problems withfew, e.g. two, players.
When information is not verifiable, communi-cations by interested parties might lead to undulyrestrictive public policies being adopted (e.g. ban-ning GM food production or imports) or it mightdegrade the information content to the extent thatsophisticated decision makers ignore it.6 This will,however, be generally welfare reducing relative to
182 W.E. Huffman and A. Tegene
5 In dealings with strangers of unknown credibility and no binding contract, reputation based on providing accurateand reliable information is valuable. See Sobel (1985) for one perspective on how a concern about credibility can beexpected to affect the quality of information provided to a decision maker over time.
6 The 4-year moratorium on processing patent applications on transgenic plants and animals by the European PatentOffice, which ended in December 1999 with a decision by the enlarged board of appeals, seems to have been amatter of interpretation of European Union directives and not of verifiable information (Scheermeier and Dickson,2000).
fully informed decision making. For example, socialcost-reducing inputs for crop production might notbe used by farmers, or socially beneficial GM foodsmight not be consumed.7 More generally, long-termdelays in adopting GM technologies because of thetime required to verify or refute claims by the envi-ronmental groups about ag-biotechnical productswill reduce the expected social and private payoff toR&D in this area. This has implications for wherethe private sector places its future R&D investments(Frey, 2000), meeting future food needs and for eco-nomic growth.
When a large number of decision makers canuse or need the same verified information, researchto produce this information produces a public good,which may be of great social value. The knowledgeonce produced is non-rival, that is, use by one deci-sion maker does not affect the quantity or qualityavailable to others, and it is not (or may not be) eco-nomically feasible to exclude users. Because theopportunity cost of an added user of the informa-tion is zero and each user’s valuation of the informa-tion is private information, private decisions willlead to under provision unless some organizationaldevice is used to internalize externalities associatedwith free-riding. The price system is of no (or little)aid in extracting information on the social value ofverified information or a system to manage it.
Institutionalizing a Verified InformationSystem
An ideal verified information system for ag-biotech-nology must provide a mechanism for disclosing pri-vate information (i.e. information or knowledgethat exists but is not available to everyone), establisha process for refuting or confirming claims of inter-ested parties, and advance the stock of knowledgeabout short- and long-term effects of biotech-nology.8 The size of the problem is large because ag-biotechnology is a global intergenerational public
good. Biotech knowledge is non-rival and non-excludable on a global basis, although particulartechniques and products have been converted intoimpure public goods through the institution ofpatenting and international patent agreements.Furthermore, the impacts (benefits and hazards) aremulti-generational – in terms of both potential ben-efits and hazards.
Although most of the currently available ag-biotechnologies have been developed for large-scaleagriculture and high income consumers, the poten-tial exists for ag-biotechnology to help low incomecountries to meet future food needs (Serageldin,1999; National Research Council, 2000) and manyof the low income countries want access to or tohave the opportunity to use ag-biotechnology tohelp meet their future food needs (OECD, 2000).Hence, reliable information on ag-biotechnology isa public good with potentially large global value.
Because new ag-biotechnology has the poten-tial to produce benefits and realize hazards over thelong term, it has an intergenerational dimension.This means that sequencing of generations becomesimportant in setting policies and determining bene-fits; that is, both equity and efficiency dimensionsare important. The current generation has a ‘first-mover’ advantage because it can choose an agenda orpathway that best serves its own purposes, eventhough these purposes may be at odds with latergenerations (Sandler, 1997). This is an especiallyimportant issue for actions that are irreversible; forexample, reducing the earth’s biodiversity, and forsome transfers of genes across unrelated species. Far-sighted decisions can be promoted by includingindividuals/representatives distributed over wide ageand standard of living ranges in decision making onag-biotech policy and by evaluating costs and bene-fits of biotechnology in real terms without discount-ing.9
Some mechanisms for revealing private infor-mation lead to better decisions than others. When aproduct’s ‘quality’ is at issue, ‘untruthful’ advertising
Public Acceptance of and Benefits from Agricultural Biotechnology 183
7 As an indication of benefits from agricultural biotechnology, Falck-Zepada et al. (2000a) estimate the first-yearworldwide economic surplus from the introduction of Bt cotton in the USA was US$240 million. The economicsurplus to herbicide tolerant soybeans is larger (see Moschini et al., 1999; Falck-Zepeda et al., 2000b). In the surpluscomputations, biotech inputs are treated as having neutral effects on human health and the environment. See Alstonet al. (1995) for more information on methods of social cost-benefit analysis dealing with research.
8 Avery et al. (2000) are concerned with a much narrower issue. They propose a computerized market for the collec-tion and distribution of subjective evaluations of a product of uncertain quality purchased by consumers.
9 Discounting seems to be a questionable practice for social cost–benefit analysis that spans several generations becausewith discounting at any positive rate, the current weight to a distant generation’s disaster is very small (and frequentlynegligible). See Sandler (1997: 62–69).

tends to lead to a breakdown in the market for thegood and no trade occurs because of adverse selec-tion; for example Akerlof ’s ‘market for lemons’(Akerlof, 1970; Molho, 1997: 19–26). With ‘truth-ful’ advertising, monitored effectively by an inde-pendent body, good market performance isobtained. Privately provided information on theroute to reputation building and repeat sales is lesseffective for simple ‘quality’ issues (Molho, 1997:52–53), and it can be expected to be quite deficientin the biotech area where the scientific issues arefrequently complex, the quality dimensions are fre-quently changing and the stock of knowledge issteadily advancing.
Private information is best revealed publiclythrough an independent agency which has theauthority and responsibility to independently verifyinformation from interested parties. An independ-ent agency can go about making objective assess-ments of information and claims made by interestedparties and others. These assessments and evalua-tions are costly to make because they use scarceresources, but once verified the information is a purepublic good. New information and communicationtechnologies have greatly reduced the cost of storingand rapidly transferring this information and great-ly increased the potential accessibility to a globalscale.
Advances in the stock of knowledge are impor-tant to a successful information verification system.It expands the topics, issues or dimensions of theknowledge base on which verification can be made.The primary contributors to this activity seem like-ly to be scientists employed by commercially inde-pendent institutions and funded primarily by thepublic sector, that is, scientists in ‘open universities’and possibly government agencies. An open univer-sity is one where the direction and funding ofresearch is not driven primarily by commercial inter-ests or any other narrow interest group and wherehigh scientific-control standards are in place (David,2000; Huffman and Just, 2000). Universities wherethe research agenda and/or funding has been cap-tured by a single interest group, or one or more largeprivate companies (e.g. a life science company), doesnot meet this criterion. Also, if the direction of theresearch programme of a government agency is driv-en heavily by commercial considerations or has lowscientific-control standards, it will not meet the cri-terion of open and objective science either. For sci-entific discoveries to be highly supportive of the
information verification system, they must originatefrom an institutional process that signals opennessand objectiveness to disinterested parties.
Good research requires considerable time toundertake and to verify itself. When the frontiers ofbiological and related sciences are advancing rapidly,a significant period may exist where considerablescientific uncertainty exists about outcomes, effects,impacts or the quality of the information (see, e.g.Frey, 2000: 61–79). Interested parties may attemptto exploit this information lag which can be to thedetriment of producers and consumers of agricul-tural products and to society generally. An efficient-ly functioning knowledge generation and verifica-tion system can, however, shorten this lag. By doingso, it creates an environment where interested par-ties have a strong incentive to reveal voluntarilymore (rather than less) of the private informationthat they possess and where verified information isfreely available and easily accessible. The coopera-tion of interested parties is achievable primarilybecause sophisticated decision makers would infereven worse outcomes (Milgrom and Roberts, 1986).
No supernational body is likely to be created toprovide verifiable information which is a global pub-lic good. Nations have been unwilling to empowersuch bodies with the authority to collect taxes forsuch purposes (Sandler, 1997). For an individualcountry to provide the good, the social benefitsmust exceed the costs. The greater public goodnature of verified information created by advancesin information technologies means savings for somecountries whose decision makers free-ride and weak-er incentives for any one country to undertake theverification activity. Only one good biotech verifi-able information system is needed; or given one sys-tem, the marginal product of another system is zero.In the public economics literature, this has some-times been labelled as ‘best shot’ technology of pub-lic good supply aggregation (Sandler, 1998).Thinking about a global coordination game acrosscountries for provision of verifiable information,only one country needs to act. The country whichhas the largest expected net social benefit fromaction, or largest stake, can be expected to provide abiotech verifiable information system. This seemslikely to be a country with a strong research system,a large ag-biotech industry, a technically advancedlarge-scale agriculture, large population, high priceof time (for acquiring and evaluating information)and high income.
184 W.E. Huffman and A. Tegene
Trust in Public Institutions
Because a verifiable biotechnology information sys-tem must be financed by public tax collections, itmost likely will be operated by one or more govern-ment agencies.10 For this institutional framework tobe successful, it must have the trust of the public.Currently agencies of national governments dealingwith similar issues in Western developed countriesvary in the amount of trust or confidence that thepublic places in information that they provide.
In the USA, public trust is high, but inWestern European countries public trust is low.Gaskell et al. (1999) reports on a survey of the USpublic showing a high level of trust in informationdealing with the safety of biotechnology provided bythe USDA and FDA. Also, Hoban (1997) reportson a 1994 survey of the US public where respon-dents were asked to rank 15 different sources ofinformation on agricultural biotechnology for trust-worthiness. The National Institutes of Health andFood and Drug Administration ranked very high:second and third.11 (The USDA and EPA were notincluded in the reported rankings.)
For Europe, Gaskell et al. (1999) report on asurvey of the public in 17 European countries show-ing low trust in national public bodies ‘to tell thetruth about GM crops grown in fields’. Europeangovernments have accumulated a bad record withthe general public on food safety issues because oftheir past experiences dealing with governments thatmishandled information on UK BSE meat anddioxin contamination of dairy and poultry productsin Belgium and The Netherlands. Decision makingby producers and consumers is made more difficult
when government agencies cannot be trusted as averifiable information source.
Current public information systems in place inthe USA and Europe dealing with information onagricultural biotechnology are primarily focused onregulation for environmental and health safety andsecondarily focused on proving information to con-sumers through labelling. In the USA, the regula-tion of biotechnology products is through theCoordinated Framework established in 1986(National Research Council, 2000a) which tiestogether the US Department of Agriculture(USDA), Food and Drug Administration (FDA)and Environmental Protection Agency (EPA). Theframework is based on the principle that techniquesof biotechnology are not inherently risky and thatbiotechnology should not be regulated as a process,but rather that the products of biotechnologyshould be regulated in the same way as products ofother technologies. Responsibility and jurisdictionover transgenetic products were assigned as follows:(i) plants came under the jurisdiction of the FederalPlant Pest Act (FPPA) administered by the USDA;(ii) food and feed under the Federal Food, Drug,and Cosmetic Act (FFDCA) administered by theFDA; and (iii) microorganisms and substances usedfor pest control under the jurisdiction of the FederalInsecticide, Fungicide, and Rodenticide Act(FIFRA) and part of FFDCA administered by theEPA. As new biotech products have been developed,environmental and consumer groups have expressedconcerns that EPA rules do not adequately cover allthe relevant risk issues (e.g. oral toxicity, potentialfor allergenicity) and the USDA should examinemore thoroughly for risks of new plants outcrossing
Public Acceptance of and Benefits from Agricultural Biotechnology 185
10 The exchange of information and clearing house mechanism under the 1993 Convention on Biological Diversityhave a somewhat different focus. The 1992 Convention on Biological Diversity has as objectives the conservation ofbiological diversity, the sustainable use of its components and the fair and equitable sharing of the benefits arisingout of the utilization of genetic resources. The Convention went into effect in December 1993 with 168 signingcountries (the USA being absent). Article 17 requires that members facilitate the exchange of information relevantto the conservation and sustainable use of biodiversity, including results from technical, scientific and social researchand other information. Article 18 requires the establishment of a clearing house mechanism to promote andfacilitate technical and scientific cooperation (Convention on Biological Diversity, 1992;www.biodiv.org/chm/conv/cbd_text_e.html). Both of these articles are to facilitate access to and exchange of infor-mation on biodiversity around the world, especially information needed to implement provisions of theConvention. Although the exchange of information and clearing house activities facilitate voluntary sharing ofinformation on biodiversity, they are not actively involved in quality control or verification. The Cartagena Protocolon Biosafety was adopted in January 2000 to address environmental (but not food safety) impacts of bio-engineeredproducts that cross international borders. The Protocol establishes an Internet-based Biosafety Clearing-House tohelp member countries exchange scientific, technical, environmental and legal information about living modifiedorganisms.
11 However, in 1999, US environmental activists and some consumer groups intensely criticized and demonstratedagainst the FDA’s GM food policies (Macilwain, 1999).
with wild relatives to produce unusually hardyweeds or adversely affect biodiversity (NationalResearch Council, 2000a).
Labelling for GMO content has not beenadopted in the USA, but indirectly information willbe provided in a new USDA standard for ‘organicfood’ labelling (Golan et al., 2000). For crops, thestandard means that the use of genetic engineering,irradiation and sewage sludge in the production orprocessing stages is prohibited. Although all organicfarmers and handlers would be expected to abide bythe standard, it remains to be seen whether the stan-dard can be effectively enforced.
For countries in the European Union (EU), theEU has established polices as directives to membernations on environmental legislation. The EUDirective on the Contained Use of GeneticallyModified Organisms (Directive 90/219/EEC) andon Deliberate Release (Directive 90/220/EEC)attempt to establish a system for controlling the useof GM organisms (European Commission, 2000).The directives were modelled after the EU’s chemi-cal notification directives. Since these EU directivesare not implemented uniformly across membercountries and no central monitoring authorityexists, the system is somewhat loosely controlled.
Directive 90/219/EEC provides common rulesthroughout the EU for the use of GM microorgan-isms in research laboratories and industrial facilitiesand provides appropriate measures to protecthuman health and the environment from any risksarising from activities using GM microorganisms.The Directive outlines appropriate procedures forrisk management. Microorganisms and activitiesusing them are to be classified by their potential forrisk and to containment and control measures. Eachcountry must designate ‘competent authorities’ toreceive information from commercial companiesand research institutes. These authorities mustorganize inspection and other control measures.They must also examine the conformity of notifica-tions received with the requirements of the direc-tives. Effective risk management is expected, and itmeans that a careful risk assessment of contained usemust be made, the appropriate level of containmentmust be exercised and suitable preventive measuresmust be taken (European Commission, 2000).
Directive 90/220/EEC covers deliberate releaseof GM organisms into the environment for research
and development purposes and the placement onthe market of products containing GMOs. Thedirective takes a preventive approach, emphasizingprior assessment and approval. The main elementsare: (i) an environmental risk assessment must becarried out before any experimental or commercialreleases of GMOs into the environment; (ii) norelease can be carried out without the consent of thecompetent authority; (iii) an approval procedure bya nation’s competent authorities should limit exper-imental releases to at most 90 days; and (iv) EUCommunity approval is required for commercialreleases of GMOs (European Commission, 2000).
The latter procedure has been implemented asfollows (Maurer and Harl, 2000). On receipt of thenotification, the competent authority in a membercountry has 90 days to either forward the notifica-tion dossier to the European Commission with afavourable opinion or inform the notifier that theproposed commercial release does not fulfil therequirements of the directive. After receiving a noti-fication dossier, the Commission immediately for-wards it to the competent authorities of all othermember states. If no objection is raised by the com-petent authorities of these states within 60 days afterthe commission forwards the notification, the com-petent authority that first received the notificationissues a written consent to the applicant and informsthe other member countries and the Commission ofthe consent. When member countries do not reachagreement on a notification, the Commission drawson relevant scientific committees for informationand opinions. After weighing this information, theCommission makes a decision which is binding onall EU members.12 Individual countries are alsourged to have effective penalties for improper releaseof GMOs, but none has been established.
Public confidence in EU GMO policies hasbeen undermined by recent information that unap-proved GMOs have been sold in some EU countriesand planted by farmers; for example, oilseed rape inseveral countries and cotton in Greece and Spain(Greenpeace, 2000c,d). The establishment of gov-ernmental policies that are unenforceable or weaklyenforced does not build public confidence or trustin government. Directive 90/220/EEC is currentlyunder revision.
GMO labelling was adopted by the EuropeanCommission in 1997. It requires each member
186 W.E. Huffman and A. Tegene
12 For a company attempting to obtain commercial approval for selling GMOs, this is a relatively complicated andtime consuming procedure in comparison to having one central EU agency make a decision.
country to enact a law requiring labelling of all newproducts containing GM organisms approved underDirective 90/220/EEC (i.e. where there are safetyreasons). Under this policy, a GMO is defined as ‘anorganism in which the genetic material has beenaltered in a way that does not occur naturally bymating and/or natural recombination’. Also, mix-tures with non-GMOs would indicate the possibili-ty that GMOs may be present.
The EU’s labelling policy has been controver-sial. First, proven safety risk evidence is generallylacking. Second, the scientific meaning of ‘none’ hasbeen controversial in an era where rapid advances inscientific instrumentation has made it possible todetect ever smaller units, and accidental physicalmixing of GMO and non-GMO commodities caneasily occur. Third, the requirements for restaurantsand caterers is so low as to be virtually useless tointerested consumers.
Conclusions
This chapter has addressed the economics of infor-mation as it affects the acceptance of and benefitsfrom agricultural biotechnology. We have shownthat the producers and consumers can make gooddecisions on acceptance and use of GM products ifthere is freely accessible, verifiable information andcompetition in the provision of information byinterested parties. However, when information isnot verifiable and decision makers must rely oninterested parties, achieving good decisions is muchmore difficult. Ag-biotech companies, environmen-tal groups and others seem likely to have intereststhat diverge from those of consumers and producersand to use private information strategically, especial-ly when the supply of new GM products is advanc-ing rapidly. Furthermore, rapid advances in com-munication and information technologies havegreatly reduced the cost and increased the speedwith which information can be distributed. The pri-vate information that these groups have can causethe market for GM products in one way or anotherto collapse. This may be at considerable loss in socialwelfare.
We have argued that the services provided byan institutionalized information verification system
operated by an independent body would be a mech-anism for producing good public information serv-ices that would have large social value. This institu-tion would reveal private information, establish aprocess for refuting or confirming claims of interest-ed parties and advance the stock of knowledge onshort- and long-term effects of biotechnology.Advances in the stock of knowledge are importantto a successful information verification systembecause it can expand the topics, issues or dimen-sions of the knowledge base on which verificationcan be made. The primary contributors to this activ-ity seem likely to be scientists employed by com-mercially independent institutions, funded primari-ly by the public sector and working to meetscholarly and scientific standards.
The relevant categories of information wouldcover topics consistent with a broad range of incomeand intergenerational interests. To obtain and main-tain public trust, it must be ‘consumer driven’ andbroader than pure scientific issues, although theywould be one important component. It would,however, include scholarly presented and summa-rized information on ethical, social, economic, envi-ronmental, food safety, scientific and trade issuesdealing with GMOs.
Verified information is costly to produce, butonce provided, it has international public goodattributes. We have argued that the advances ininformation and communication technologies haveincreased the free-rider problem by weakening theincentives for any one country to undertake suchactivities. We suggest that the provision will mostlikely be by some large country that stands current-ly to receive a significant share of the net social ben-efits from a verifiable information system for ag-biotechnology.
Currently, public institutions dealing with reg-ulating GMOs and labelling in the USA have rela-tively high public trust but none fulfils our concep-tual view of a verifiable information system. Publicbodies in Europe are experiencing low public trustas an information source, and this is undoubtedlymaking good decision making more difficult. Aneffective information system dealing with biotech-nology must be managed well in order to providelarge social benefits.
Public Acceptance of and Benefits from Agricultural Biotechnology 187

References
Akerlof, G. (1970) The market for lemons: quality uncer-
tainty and the market mechanism. Quarterly Journalof Economics 84, 488–500.
Alston, J.M., Norton, G.W. and Pardey, P.G. (1995)
Science Under Scarcity: Principles and Practice forAgricultural Research Evaluation and Priority Setting.
Cornell University Press, Ithaca, New York.
Avery, C., Resnick, P. and Zeckhauser, R. (2000) The mar-
ket for evaluations. American Economic Review 89,
564–584.
Convention on Biological Diversity (1993) User’s guide to
the clearing house mechanism. www.biodiv.org/
chm/userguide/CHM_User_Guide.html
Cornes, R.C. and Sandler, T. (1996) The Theory ofExternalities, Public Goods and Club Goods, 2nd edn.
Cambridge University Press, New York.
David, P.A. (2000) The political economy of public sci-
ence. In: Smith, H.H. (ed.) The Regulation of Scienceand Technology. Macmillan, London.
European Commission (2000) Guidelines to theApproximation of European Union EnvironmentalLegislation. Part 2G. Chemicals and GeneticallyModified Organisms. European Commission, Brussels.
Falck-Zepeda, J.B., Traxler, G. and Nelson, R.G. (2000a)
Surplus distribution from the introduction of a
biotechnology innovation. American Journal ofAgricultural Economics 82, 360–369.
Falck-Zepeda, J.B., Traxler, G. and Nelson, R.G. (2000b)
Rent creation and distribution from biotechnology
innovations: the cause of Bt cotton and herbicide-
tolerant soybeans in 1997. Agribusiness.Frey, K.J. (2000) National Plant Breeding Study-IV. Future
Priorities for Plant Breeding. Special Report 102, Iowa
State University, Iowa Agri. Home Econ. Experiment
Station.
Friends of the Earth (2000) Genetically engineered food:
farm scale trial locations. Friends of the Earth, GM
sites. www.foe.co.uk/camps/foodbio/sites/index.
html
Gaskell, G., Bauer, M.W., Durant, J. and Allum, N.C.
(1999) Worlds apart? The reception of genetically
modified foods in Europe and the U.S. Science 285,
384–387.
Gibbons, R. (1998) Incentives in organizations. Journal ofEconomic Perspective 12, 115–132.
Golan, E., Kuckler, F. and Mitchell, L. (2000) Economics of Food Labeling. US Department of Agriculture,
Agricultural Economics Report No. 793.
Greenpeace (2000a) EPA responds to Greenpeace lawsuit
defends rubber stamping of bud science?’
Greenpeace USA Media Center, 20 April.
Greenpeace (2000b) Kellogg’s tiger targeted in action con-
demning use of Franken Food. Greenpeace USA
Media Center, 23 May.
Greenpeace (2000c) Illegal GE crops found in several
European countries: Greenpeace calls for urgent
action to prevent further imports. Greenpeace Genetic
Engineering Highlights, 19 May. www.greenpeace.
org/-geneng/highlights/gmo/00_5_19.html
Greenpeace (2000d) Greenpeace and farmer decontami-
nate oil seed rape field in Germany. Greenpeace
Genetic Engineering Press Release, 29 May.
www.greenpeace.org/pressreleases/geneng/2000may
29.html
Heijs, W.J.M. and Midden, C.J.H. (1996) Biotechnology.Attitudes and Influencing Factors: Fourth Survey.Eindhoven University of Technology, Department
of Philosophy and Social Science, Eindhoven,
Netherlands.
Hoban, T.J. (1997) Consumer acceptance of biotechnolo-
gy: an international perspective. Nature Biotechnology15, 232–234.
Hoban, T.J. (1999) Consumer acceptance of biotech-
nology in the U.S. and Japan. Food Technology 53,
50–53.
Holmstrom, B. (1979) Moral hazard and observability.
Bell Journal of Economics 10, 74–91.
Holmstrom, B. (1989) Agency costs and innovation.
Journal of Economic Behaviour and Organization 12,
305–327.
Holmstrom, B. and Milgrom, P. (1987) Aggregation and
linearity in the provision of intertemporal incentives.
Econometrica 55, 303–328.
Huffman, W.E. (2002) Human capital: education and
agriculture. In: Gardner, B.L. and Rausser, G.E.
(eds) Handbook for Agricultural Economics, Vol. 1.
Elsevier Science, Amsterdam (in press). (Also, Iowa
State University, Dept. Economics Staff Paper No.
222, August 1999.)
Huffman, W.E. and Evenson, R.E. (1993) Science forAgriculture: a Long Term Perspective. Iowa State
University Press, Ames, Iowa.
Huffman, W.E. and Just, R.E. (2000) Setting efficient
incentives for agricultural research: lessons from
principal-agent theory. American Journal ofAgricultural Economics 82, 828–841.
Macilwain, C. (1999) U.S. Food-safety body hears protests
over genetically modified food. Nature 402, 571.
Martin, S. and Tait, J. (1992) Release of GeneticallyModified Organisms: Public Attitudes andUnderstanding. The Open University, Centre for
Technology Strategy, London.
Maurer, M.T. and Harl, N. (2000) Obtaining Approval toMarket GMOs in the European Union. Working
paper, Iowa State University, Department of
Economics.
Milgrom, P. and Roberts, J. (1986) Relying on the infor-
mation of interested parties. RAND Journal ofEconomics 17, 18–32.
Molho, I. (1997) The Economics of Information. Blackwell,
Malden, Massachusetts.
188 W.E. Huffman and A. Tegene

Moschini, G., Lapan, H. and Sobolevsky, A. (1999)
Roundup Ready Soybeans and Welfare Effects in theSoybean Complex. Staff working paper No. 324, Iowa
State University, Department of Economics.
National Research Council (2000a) Transgenic Plants andWorld Agriculture. National Academy Press,
Washington, DC.
National Research Council (2000b) Committee on
Genetically Modified Pest-Protected Plants.
Genetically Modified Pest-Protected Plants: Science andRegulation. National Academy Press, Washington,
DC.
Nettleton, J.A. (1999) The Frankenfood myth. FoodTechnology 53, 20.
OECD (2000) Rapporteurs’ Summary: GM food safety:
facts, uncertainties, and assessment. From OECDEdinburgh Conference on the Scientific and HealthAspects of GM Foods, 28 February–1 March.
Olson, M. (1965) The Logic of Collective Action. Harvard
University Press, Cambridge, Massachusetts.
Sandler, T. (1992) Collective Action. The University of
Michigan Press, Ann Arbor, Michigan.
Sandler, T. (1997) Global Challenges: an Approach toEnvironmental, Political, and Economic Problems.Cambridge University Press, New York.
Sandler, T. (1998) Global and regional public goods: A
prognosis for collective action. Fiscal Studies 19,
221–247.
Scheermeier, Q. and Dickson, D. (2000) Europe lifts
patent embargo on transgenic plants and animals
Nature 403, 3.
Serageldin, I. (1999) Biotechnology and food security in
the 21st century. Science 285, 387–389.
Shapiro, C. and Varian, H.R. (1999) Information Rules: aStrategic Guide to the Network Economy. Harvard
Business School Press, Boston, Massachusetts.
Sobel, J. (1985) A theory of credibility. Review of EconomicStudies 52, 557–573.
World Bank (1999) Knowledge for Development. World
Development Report 1998/99. Oxford University
Press, New York.
Public Acceptance of and Benefits from Agricultural Biotechnology 189
Introduction
This chapter outlines some of the economic, regula-tory and social costs of incomplete information.Incomplete scientific experiments have contributedto government regulations and standards thatimpose possibly excessive costs on biotechnologyfirms, producers and consumers. Classical economictheory posits that markets operate with perfectinformation; however, it is readily apparent that themarketplace for genetically modified (GM) agrifoodproducts has an abundance of imperfect informa-tion. Concerns that have risen regarding GM prod-ucts have had a global impact on government poli-cy. This chapter offers an examination of the actualpolicy changes resulting from two incomplete andcontentious research results.
Starting in the summer of 1998, biotechnolo-gy came under attack regarding the safety of the GMagrifood products that the industry was producing.This attack started with the public announcementby Dr Arpad Pusztai that GM agrifood productscould be harmful to human health. Critics ofbiotechnology immediately began to advance thisresearch as evidence that the long-term implicationsof biotechnology are not known and that restric-tions should be immediately placed on further
biotechnology developments. The speculativenature of Dr Pusztai’s announcement resulted in alarge, public backlash against the biotechnologyindustry that is still being felt today. The pressure onthe biotechnology industry increased in the springof 1999 with the announcement by Dr John Loseythat GM Bacillus thuringiensis (Bt) maize was harm-ful to monarch butterfly larvae. The media present-ed this as evidence that multinational corporationsare irresponsibly producing products that can unin-tentionally kill valued insects, such as the monarchbutterfly. As in the first case, this research was flawedand subsequent research contradicted all of DrLosey’s claims. The damage, however, was alreadydone. Many consumers now believe that biotech-nology kills butterflies and the cost to the biotechindustry to inform and educate society as to the factswill be enormous.
In each case, consumer concerns forced gov-ernments to respond. In the UK, the relevant regu-latory agencies, which did not enjoy great publicconfidence, responded with mandatory labellingthat imposes significant monetary and opportunitycosts on consumers and the economy. Additionally,it is not clear that the policy prescription can ade-quately address consumer concerns. In the USA, incontrast, the Environmental Protection Agency
191
16 Science and Regulation:Assessing the Impacts of Incomplete
Institutions and Information in the GlobalAgricultural Biotechnology Industry
Stuart Smyth and Peter W.B. PhillipsDepartment of Agricultural Economics, University of Saskatchewan, Saskatoon,
Saskatchewan, Canada
© CAB International 2002. Market Development for Genetically Modified Foods(eds V. Santaniello, R.E. Evenson and D. Zilberman)

(EPA), which is a well established, relatively credibleand respected institution, responded to the concernsabout the monarch butterflies, but in a more meas-ured way that appears to have minimized the costsrelative to the benefits.
This chapter investigates the role of imperfectinformation and institutions in biotechnology mar-kets. The following section describes the back-ground and consumer attitudes towards GM prod-ucts. The third section outlines the theoreticalapproach used to conduct the analysis. The fourthsection presents the scientific experiments, the sci-entific community’s reaction, the government regu-lations and standards that resulted from two scien-tific experiments and some of the costs that havedeveloped. The final sections provide a short analy-sis of the developments using the model followed bysome conclusions.
Background
Molecular genetics has revolutionized the agrifoodbusiness, converting the industry from a largely sup-ply push, evolutionary system towards a demand-pull, engineered system. Biotechnology innovationsentered global agrifood markets in 1995 with theintroduction of recombinant bovine somatotropin(rbST) and herbicide-tolerant maize, cotton, canolaand soybean varieties. Since then the rate of newproduct introductions has risen sharply, with morethan 13 crops already transformed by more than 40traits. James (1999) estimates that in 1999 GMcrops were being produced in 12 countries and thatmore than 40 new varieties involving input and out-put traits are in the R&D pipeline and will probablybe ready for commercialization before 2005. Giventhe potential for stacking both input and outputtraits, the potential permutations and combinationsleading to new products are enormous.
A large number of consumers are or may beconsuming these products. Maize, soybeans andcanola are extensively traded throughout the worldand their processed elements are essential ingredi-ents incorporated into an estimated 60% of theprocessed foods on grocery store shelves. Consumerattitudes and preferences about GM products varywidely both within and between key markets,reflecting the differing views about human health,environmental safety and product quality. Peoplewith different experiences and interests have widelydifferent perspectives on these products. The
Economist/Angus Reid World Poll (1999) revealedthat consumers in Germany and the UK were themost aware of GM foods (95% and 94%) while USconsumers were least aware (66%). Related to that,82% of German consumers and 67% of UK con-sumers but only 57% of US consumers would beless likely to buy GM labelled products, while 5% ofGerman, 25% of UK and 37% of US consumerswere indifferent to GM elements in foods. The restof the countries surveyed (Australia, Canada, Franceand Japan) fell in the middle.
These differing consumer attitudes are both areflection of and reflected in national regulatory sys-tems. Parallel to the introduction of these new prod-ucts, government regulatory systems in key produc-ing and consuming regions began to diverge. Canadaand the US adopted regulatory standards andprocesses that relatively efficiently reviewed theobjective, science-based risks of the products andapproved products for environmental release, feeduse and human consumption (Isaac and Phillips,1999). In contrast, regulatory failures in theEuropean agrifood system heightened concernsabout biotechnology based agrifood products anddestroyed confidence in existing regulatory authori-ties, forcing the European Union (EU) to develop anew, purpose-built regulatory structure for biotech-nology products. Initially this system appeared tohave the potential to deliver decisions consistent withNorth America, but no new products have beenapproved since October 1998 and none is likely to beapproved until recently proposed revisions to the EUsystem are approved, now expected in 2002.
Against this backdrop, two new studies werereleased in 1998 and 1999 that suggested agricul-tural biotechnology might have significantly higherrisks than previously anticipated. The UK and USsystems responded significantly differently, partlybased on the degree of public confidence in the reg-ulators. This was not the first time the regulatorysystems have been challenged. There are numerousinstances in the USA and Europe (and other coun-tries as well) where safety systems have failed. In theUSA there have been a number of environmentalfailures, including the Three Mile Island nuclearaccident of 1979, the environmental damage thatresulted from long-term use of DDT and the pollu-tion problem surrounding the ‘Love Canal’. InEurope there have been numerous food safety fail-ures, including the scare surrounding the use of hor-mones in livestock production in Italy in the 1970s,the presence of listeria in unpasteurized cheese, the
192 S. Smyth and P.W.B. Phillips
evidence of antifreeze in certain types of wine in the1980s, and the BSE disaster of the 1990s. The long-term impacts of these failures of risk analysis systemshave differed between Europe and the USA.
The result in Europe is that the general publicdoes not trust the institutions responsible for foodsafety. This lowered trust has developed over timedue to previous food safety concerns and culminat-ed with the bovine spongiform encephalopathy(BSE) problem. At the time, in the early stages ofthe BSE problem the British government and scien-tists told consumers that the beef was safe to eat andthere were no concerns regarding linkages to humanillnesses. As more information became available itbecame clear that there were linkages to human ill-nesses and consumers were advised not to eat beef,which only served to discredit the ability of the foodsafety institutes in the eyes of consumers. Europeanshave developed a risk aversion when faced with thechoice of consuming products that are safe wherethere is minimal factual information. The low levelof trust that Europeans have in their food safetyinstitutions forced the EU to legislate a tolerancelevel of 1% in an attempt to prevent GM agrifoodproducts from entering Europe. In the UK the levelof trust is even lower than that of other Europeannations and public pressure surrounding GM foodsforced the British government to enact regulationsthat forced the food industry to label all ingredientsas GM if they contained greater than 1% GM con-tent.
The general populace in the USA has higherlevels of trust in the institutions responsible for pub-lic safety. This level of trust has been fostered by theactions that followed from the above-mentionedfailures. Following the Three Mile Island accident,regulations and standards were thoroughly reviewedand revised to ensure an even greater level of safety.Much of this was conducted in the public domain,which allowed those concerned to witness that theinstitutions were responding in a prudent manner tothe concerns of the nation. The result of this is thatthe American public believes that their food safetyinstitutions have the ability to ensure that productsin the marketplace are safe and that there is minimalrisk to consumers when they purchase these prod-ucts. Even so, when concern about the impact of Btmaize on non-target organisms developed in 1999,the US Government responded by strengtheningthe standards regarding planting of Bt maize. Whilethe new rules are arguably somewhat beyond whatmight be needed to manage the risks, the incremen-
tal costs were controlled. The American publicresponded favourably to these new standards due tothe high level of trust that they have in their institu-tions.
This chapter discusses the institutional chal-lenges, their responses and the different financialand opportunity costs of the two regulatoryresponses.
The Theory of Risk and Markets
Economic theory has tended to ignore many of theissues related to product quality. The Marshalliandemand curve is usually specified as a function ofincome and the product price, occasionally supple-mented with cross price elasticities for substitutesand complements. Tastes and preferences, which arefundamental factors in determining demand, areoften assumed to be homogeneous and/or static.
Product quality is often ignored or assumed tobe reflected in price and income elasticities. Qualityof new products is especially problematic.Irrespective of the fundamental features of any newproducts, all new products almost by definitionincorporate experiential and credence elements(Tirole, 1988). Trust is a vital element in creatingand managing markets for those products.
Firms are often not able to create, by them-selves, the conditions of trust that generate thesocially optimal quantities of goods and servicesproduced and consumed. Publicly managed riskanalysis systems are vital to creating that trust. Vanden Daele et al. (1997) identifies three types of riskthat affect the safety of product and consumer per-ceptions of those risks:
• Probabilistic risks involve those theoreticallygrounded and empirically demonstrated risksrelated to the product or its technology. Themethods and much of the evidence is available inpeer-reviewed journals or public records.
• Hypothetical risks, in contrast, involve thosepossibilities that are grounded in accepted theo-ry but lack empirical experience or evidence thatcan establish probabilities. Most of these can beidentified in academic literature.
• Speculative risks, in contrast to the other twoareas, have neither established theory nor experi-ence to back them up. Those speculative risksthat have much basis can often be found inworking papers or other developing literature.
Science and Regulation 193

Beyond that, almost any correlations can bemade to show the potential for risk, irrespectiveof whether there is any theoretical basis for thepossibility.
New products can raise concerns about all threetypes of risk. Effective risk analysis systems encom-pass elements that work to assess, manage and com-municate the risks to consumers and citizens:
• Risk assessment, which involves an ex ante eval-uation of risks and benefits of GM foods, is usu-ally based on an objective examination of the sci-ence on a case by case basis.
• Risk management, which involves the humansystem of rules and procedures, is designed tocontain products during the research and com-mercialization phase and undertake post-releasemonitoring and surveillance.
• Risk communication, which involves dissemina-tion of information and messages in an effort tonarrow the gap between actual risks and the per-ceptions of risk.
As one might imagine, most risk analysis sys-tems should be able to effectively handle risk assess-ment, which is relatively mechanistic and shouldalso be able to handle risk management. Risk com-munication, however, is extremely complex forissues such as GM foods because of the wide array ofspeculative issues that science cannot adequatelyrespond to. In the absence of complete certaintyabout, or at least significant experience in, a newtechnology or product, risk analysis systems mustinherently be based on trust. In turn, trust is instilledas a result of reactions to risk assessments that arecarried out by institutions. Trust grows as risk man-agement procedures address public concerns.Finally, trust is firmly embedded in the public viathe success of the risk communication process thatdevelops over time. Strong institutions are crucialfor successful and trustworthy food safety systems.
Frequently when food safety institutionsattempt to deal with risk they adopt the approach ofrisk elimination, which results in costly, unnecessaryregulations and/or standards. There will always berisk associated with everything individuals do. Thekey is to lower the level of risk until it is within anindividual’s comfort zone. This is the case whendealing with food safety. The utmost care is taken toensure that products on store shelves are as safe aspossible; however, there is still a minimum level ofrisk that must be faced when purchasing food.
Traditional risk assessment theory suggests thatrisk is a combined measurement of the length ofexposure multiplied by the level of adverse effects ofthe agent to other organisms, or hazard. This can beexpressed in the following formula:
risk = hazard ¥ exposure
If the time of exposure is brief (fractions of a second)and the level of hazard is a high dosage, the level ofrisk would be low or minimal. Science has used thisformula to evaluate whether initial research findingsshould proceed or be halted. If the assessment wasconducted and the level of risk was determined to behigh, then government agencies would not approvethe technology or product for release. Experts willnaturally have a different view about the level of riskassociated with a new product or technology fromthat of the public. As a result, experts are often con-fused by consumer reactions to new products andtechnologies.
Sandman (1994) has argued that regulatorsshould instead use the following formula for under-standing consumer perceptions of risk:
risk = hazard ¥ outrage
Sandman believes the old formula underestimatedthe actual level of risk because it ignored outrage.Public concern is focused on whether the risk isacceptable rather than on the scientific perceivedlevel of public risk. This has important implicationsfor risk communication, as food safety institutionsmust address consumer outrage in their response tothe risk assessment.
Craven and Johnson (1999), in writing aboutfood scares, discuss the new approach that risk com-municators must take when faced with consumerconcerns.
The science of risk communication is still relatively
new, though valid and effective precepts have been
clearly defined. Mitigating a hazard itself does not
mitigate the outrage about the hazard. To defuse a
scare, outrage must be addressed, that is, the
public’s particular concerns must be addressed and
dealt with in a way responsive to their emotional
needs regarding the issue.(Craven and Johnson, 1999)
The difficulty for risk communicators is to deter-mine which scares, whether they are food related ornot, will provoke an outrage response from con-sumers. It is clear that those responsible for riskcommunication in the biotech industry and foodsafety institutions were not anticipating the con-
194 S. Smyth and P.W.B. Phillips

sumer outrage that developed in the UK and Europeover the introduction of GM agrifood products.
Snow (1997, cited in Craven and Johnson,1999) suggests four critical elements necessary inany approach for risk communicators when dealingwith consumer outrage. First, the communicationsmust be open and fully disclose the threat andissues. Second, the communicator must acknowl-edge responsibility for the issue. Third, the commu-nicator must be courteous (even if the publicresponse is angry and impolite). Fourth, the com-municator must demonstrate compassion, byrespectfully recognizing and addressing people’sfears and apprehensions.
This chapter examines the US and UK regula-tory responses to a changed view of risk resultingfrom incomplete, speculative science. The reason forthe failure of British and European food safety sys-tems to respond to consumer fears over GM foodsbecomes clearer when compared with these fourapproaches: the British and European food safetyinstitutions acted in the complete opposite manner,as is described above. Had these food safety institu-tions been better risk communicators, it might nothave been necessary to implement the costlylabelling regulations described below. In contrast,the US risk communicators responded more to theoutrage than the hazard, effectively lowering the costof maintaining trust in the products and theregulator.
Hypothetical and Speculative Scienceand Risk Analysis
An extensive set of standards and regulations gov-erns the food sector nationally and internationally,but the rules for biotechnology-based products arestill evolving. The incomplete institutional structurefor managing risks of new products has been unableto effectively handle new, often incomplete scientif-ic information. Recently the biotechnology commu-nity had its foundation shaken by the release ofscientific data claiming that biotechnology may beproducing products that are not as safe as thebiotech industry was claiming. The research on ratsfed GM potatoes and monarch larvae resulted innew regulations and standards for biotechnology.
Regulations and standards that affect biotech-nology have been implemented by several nationalgovernments. These regulations and standards havebeen implemented based on the results of often-
incomplete scientific research. The focus of this por-tion of the chapter will be to examine the impactsthat have resulted from Dr Pusztai’s rat/GM potatoresearch and Dr Losey’s monarch butterfly larvae/Btmaize pollen research. Neither of these scientificresearch papers was peer reviewed prior to beingpublicly released and both created media sensations.This carried over to consumer concerns, whichresulted in governments developing and implement-ing regulations and standards that were designed toshow consumers that domestic governments weredoing something to address the potential problemsbeing caused by biotechnology. The resulting regu-lations and standards were implemented based onincomplete information.
Dr Pusztai’s GM potato research
The Scottish Office of Agriculture, Environmentand Fisheries Department (SOAEFD) commis-sioned the Rowett Research Institute in Scotland tostudy the effects of two specific strains of transgenicpotatoes. The principal investigator was Dr Pusztai,who was on a 3-year research grant at the Institute.The potatoes had been engineered to producelectins that are toxic to insects that feed on potatoes.The research was conducted by feeding GM pota-toes and non-GM potatoes to different groups ofrats. The study comprised four experiments: (i) acontrol group fed raw potatoes for 10 days; (ii) agroup fed raw GM potatoes for 10 days; (iii) a groupfed cooked GM potatoes for 10 days; and (iv) agroup fed raw and cooked GM potatoes for 110days. Each experiment group had five or six rats andat the end of each experiment the rats were killedand their organs were weighed and examined for dif-ferences.
After the organs had been weighed and exam-ined, Dr Pusztai concluded that he ‘is of the opinionthat the existing data fully support our suggestionthat the consumption by rats of transgenic pota-toes… has significant effects on organ development,body metabolism and immune function’ (SOAEFD,1998). He went on to say that in all four experi-ments, the rats fed raw and cooked GM potatoesexperienced ‘major and in most instances highly sig-nificant changes in the weights of some or most oftheir vital organs’. The vital organs that he refers toare the liver, spleen and thymus. Dr Pusztai con-cludes by saying that GM potatoes are not substan-tial equivalents to conventional potatoes.
Science and Regulation 195
In August 1998, Dr Pusztai appeared on aBritish television programme and stated that theconsumption of GM potatoes caused rats to grow ata slower rate and impaired their immune system.Three days later the Rowett Institute suspendedhim, prohibited him from accessing any of his dataand requested that he not speak publicly about hisexperiments. The Rowett Institute set up an auditcommittee to provide a detailed analysis of DrPusztai’s experiments and this committee reportedin October 1998. The report stated that the geneticmodification ‘did not have any deleterious effects onthe growth of rats in three short-term and one long-term feeding experiments even when added at 100-times the concentration expressed in the tubers ofthe transgenic products’ (Nuffield Council onBioethics, 1999). In February 1999, Dr Pusztaiattended a media conference at the Houses ofParliament in London that was organized by Friendsof the Earth. At this news conference, Dr Pusztaiclaimed it was not the lectin gene that had beentransformed that caused the damage but rather theviral promoter that was used. By making this claim,Dr Pusztai effectively condemned GM foods due tothe fact that most genetic transformations use viralpromoters. In May 1999, the UK’s Royal Societyreleased their analysis of Dr Pusztai’s experiment,which found no evidence linking the consumptionof GMO-potatoes in rats to harmful effects. For thenext few months the debate between both sides onthis issue was carried out in the British newspapers,with the main complaint being that the paper hadnever been peer reviewed.
In October 1999, The Lancet, a well respectedscientific journal, announced that it would publishDr Pusztai’s research. The Lancet had the paper peerreviewed by six scientific experts, who all found ‘thestudy to be defective in design, execution and inter-pretation (Independent, 1999)’. A majority of the sixreviewers, which is twice the usual number ofreviewers, recommended that Dr Pusztai’s researchnot be published. The Lancet overruled all of thisadvice and decided to publish the results of theexperiments in the 16 October 1999 edition.
The scientific reaction
Those who have had the opportunity to review DrPusztai’s experiments have determined that theexperiments were so poorly conducted that it wasvirtually impossible to make any factually based
conclusions. ‘In these control experiments the moststriking result was how poor a diet raw potatoes wasfor the animals … the animals fed raw potatoes didnot gain any weight. They seemed actually to beclose to starvation’ (Braun, 1999, personal commu-nication). It was discovered by one of the reviewersthat Dr Pusztai started the long-term experimentwith raw potatoes and when they began to showsigns of starvation, he switched to boiled potatoes.This switch meant that the results of the long-termtrial are inconclusive in terms of revealing useful sci-entific data. Additionally it was revealed that thepotatoes Dr Pusztai was working with were neverintended to be used as a table potato, rather theywere developed for research purposes. The researchwas part of standard toxicology tests that are rou-tinely conducted when developing new varieties.
In the course of its audit of Dr Pusztai’s exper-iments, the Rowett Institute found that when hespoke on TV in August 1998 and said that GMpotatoes lowered the responsiveness of rat’s immunesystems, the reality was the relevant experiments hadnot yet been concluded. In fact, when the vitalorgans were examined, it was found that in all exper-iments but one, the weights were actually well with-in the standard deviation range for those organs.One expert that analysed the research states in hisoverview that:
there are no significant differences in growth rate
and organ weights which could reasonably be
attributed to feeding transgenic potatoes to the rats.
No two experiments in the series were done in the
same way, so a detailed comparison of the reliability
of the data is impossible or at least very difficult.
(Braun, 1999, personal communication)
The Royal Society in the UK reviewed theexperiments and concluded that they were so poorlystructured, executed and analysed that no conclu-sions could be drawn. This review expanded on thepoor nutritional value of potatoes by stating that the‘GM potatoes used contained almost 20 per centless protein than unmodified potatoes, and rats inthe long-term feeding study were given additionalprotein to avoid starvation’ (Nature, 1999). In addi-tion to this they point out that the results of onepotato study cannot be imposed on to other GMagrifood products. Each individual GM agrifoodproduct needs to be examined and analysed on itsown merits.
The final reaction, and indeed possibly thelargest, was the outrage expressed when The Lancet
196 S. Smyth and P.W.B. Phillips

decided to reject the advice of its peer review com-mittee and publish Dr Pusztai’s research. Highlyrespected research scientists in the UK openly con-demned this and questioned the value of peer reviewif journal editors decide to publish material based onconsumer interest. Typically the peer review processis an anonymous one that allows experts to makecritical, unbiased assessments of experiments.Professor John Pickett, one of the peer reviewers forThe Lancet, was so infuriated by what the journal’seditors did that he broke with anonymity and pub-licly stated that ‘[i]t is a very sad day when a verydistinguished journal of this kind sees fit to goagainst senior reviewers’ (Independent, 1999).
Resulting government regulations
The media coverage this research received encour-aged consumers to reject biotechnology. Due to theearlier government and scientific fiasco regardingmad cow disease and British beef, many consumershave lost confidence in what government and scien-tists tell them about food safety. When Greenpeaceand Friends of the Earth used Dr Pusztai’s researchto proclaim that all GM agrifood products areunsafe to eat, they generated a huge consumer back-lash against GM foods and biotechnology in gener-al. In an attempt to calm a nervous public, theBritish Government announced that it wouldrequire mandatory labelling of all products regard-ing GM content. The British Government did thisat the same time as Prime Minister Tony Blair, sen-ior cabinet members and government officials werepublicly advocating the safety of GM foods.
The British regulation requires all food prod-ucts that contain more than 1% GM content to belabelled, including all restaurant meals, and there arefinancial penalties for non-compliance (Phillips andFoster, 2000). The result of this legislation hasforced many British supermarkets to drop productsthat do not comply, thus reducing product availabil-ity to consumers. The products that can prove thereis no GM content are labelled as such but con-sumers pay between 10 and 15% more for theseproducts (BBC Online Network, 30/10/99:www.news2.thls.bbc.co.uk). The early indication ofthis legislation is that consumers have fewer foodchoices at a higher cost.
The incomplete information that flowed fromDr Pusztai’s experiments in part contributed to thecreation of mandatory labelling regulations. The
unfortunate aspect of this legislation is that it notonly negatively affects British consumers but alsorestricts the ability of other nations to export prod-ucts to the UK. Both Canadian and American firmshave lost British market access because the ability tosegregate to the level of less than a 1% GM tolerancelevel is not presently available. In this instance, DrPusztai’s decision to circumvent the traditional peerreview process and use the media to release his find-ings has truly had global implications.
The financial and economic cost of theregulations
There are two approaches to estimating the impactof the UK labelling system. In the first instance, onecan look at the financial costs of running the system.Alternatively, one can look at the opportunity costof the new rules.
When the British Government enacted its leg-islation that forced labelling on the food industry,the policy was developed quickly to address con-sumer fears and as a result, very little thought wasgiven to the financial cost of implementation. TheMinistry of Agriculture, Fisheries and Food (MAFF)was responsible for the labelling legislation and itstated that the
majority of businesses affected by the new
Regulations will already be labelling food under EC
Regulation 1139/98. The additional cost, for
reprinting menus etc. is unlikely to be any higher
than similar costs incurred in respect of the
implementation of EC Regulation 1139/98, which
was estimated at £1M–£2M. (UK MAFF, 2000)
The British Hospitality Association (BHA) hascalculated the cost of reprinting menus to be as highas £80 million. One small business expects thatannual costs for keeping information up to datecould reach £50,000 and larger firms are expectingannual update costs of £2 million. The BHA report-ed that MAFF officials were surprised to discoverhow high the costs would actually be and furthersurprised to learn that the costs would be passed onto consumers.
Testing for compliance became the responsibil-ity of individual counties or boroughs. On 1 April2000 the Food Standards Agency (FSA) became theaccountable institution for food safety. Previously,this was the responsibility of MAFF. Due to the lowlevel of trust in MAFF, a new institution had to beestablished to deal with the issue of labelling GM
Science and Regulation 197
agrifood products. Each county or borough has theresponsibility to fund its own Standards Office. Theresult of this is that the level of testing and enforce-ment of the new labelling regulations is directlylinked to the amount of funding that a local bor-ough is able to allocate to its Standards Office.Boroughs that do not have adequate financialresources to fully staff a Standards Office may facethe situation where the Standards Office conductsno tests and is only capable of minimal regulationenforcement.
The principle reason for this is the cost of con-ducting tests on processed food products. At presentin the UK, the cost is £117 per test. It takes on aver-age 25 days to obtain results from the test and thetest is only capable of determining whether there is,or is not, GM material. This is problematic as the1% tolerance level will allow some GM content andwhen a business is notified that there is GM materi-al in its processed food, the immediate question isabout the level of GM content. One borough,Reading, conducted 52 sample tests between 1January 1999 and June 2000 and found that about10% of samples did not meet the requirements ofthe UK regulations. While each borough has thepower to take legal action for non-compliance, whatis happening is that a due diligence process is initi-ated to try to determine the source of GM materialand what GM material is specifically involved. Todate at the Reading Standards Office, no legal actionhas been taken and it is viewed as a measure of lastresort.
In the UK there is clearly a political issue and alabelling issue surrounding GM agrifood products.The FSA has been established to enforce thelabelling issue. While the regulations that are spelledout by legislation are very clear, enforcing them isbecoming very difficult. Due to the limitedresources some boroughs have devoted to this area,it may take as long as 5 years to investigate com-plaints. Because each borough is required to fundthe Standards Office, some have made this a verylow priority.
From an economic perspective, the new ruleshave replaced one economically inefficient systemwith another economically inefficient system.Economic theory clearly shows that if consumers arenot given a choice to express their preference, utili-ty (consumer surplus) is reduced. So, from that per-spective, the fact that labelling systems provide achoice to consumers who do not want to consumeGM foods improves their welfare. In the UK system,
however, the labelling rules have effectively drivenout GM foods from the market. Given that 25% ofUK consumers are indifferent to GM elements intheir food, forcing them to consume (probablyhigher priced) non-GM foods similarly reduces theirwelfare.
Essentially, in spite of the best of intentions,the poorly constructed labelling rules in the UKhave produced an expensive and suboptimal marketsituation, with virtually all GM foods excluded fromthe market.
Dr Losey’s Bt maize pollen research
Dr Losey, a researcher in the Department ofEntomology at Cornell University, New York,conducted a study in 1998 to determine the effectsof Bt maize pollen on monarch butterfly larvae.Monarchs lay their eggs on milkweed leaves, whichcan grow near maize fields. The study comprisedthree larvae feeding scenarios: milkweed leaves withno pollen, milkweed leaves with conventional maizepollen and milkweed leaves with Bt maize pollen. Aspatula was used to place the pollen on the leavesand they were dusted until they visually resembledpollen densities in the wild. The larvae were allowedto feed for 4 days at which time the survival rate andlarva weights were recorded. After 4 days, the sur-vival rate for the larvae on the Bt maize leaves was56% compared with 100% for the other twogroups. This led Dr Losey to state that ‘[b]ecausethere was no mortality on leaves dusted withuntransformed pollen, all of the mortality on leavesdusted with Bt pollen seems to be due to the effectsof the Bt toxin’ (Losey, 1999). Additionally, the sur-viving Bt larvae had weight gains that were less thanhalf those of the larvae fed on the milkweed leaveswith no pollen. Dr Losey concluded that:
…plants transformed with genetic material
from…Bt are generally thought to have negligible
impact on non-target organisms [monarch larve],
Bt corn plants might represent a risk because most
hybrids express the Bt toxin in pollen, and corn
pollen is dispersed over at least 60 meters by wind.
Corn pollen is deposited on other plants near corn
fields and can be ingested by the non-target
organisms that consume these plants. (Losey, 1999)
This research was published in the scientificjournal Nature, on 20 May 1999. This article wasnot peer reviewed prior to being published, in con-
198 S. Smyth and P.W.B. Phillips

travention of the norm. At the time the article waspublicly released, Dr Losey expressed caution aboutany definite conclusions resulting from the study.He believed that further studies needed to be con-ducted before any conclusive statements could beissued.
The scientific reaction
The scientific reaction to this research was swift andoverwhelmingly negative. Other entomologistshighlighted flaws and inconsistencies. What resultedwere numerous studies in the summer of 1999 thatset out to test the validity of Dr Losey’s initial find-ings. The major critiques are summarized below.
1. Dr Losey stated that pollen could drift up to 60m. This was based on research done in 1972. Withnew varieties being released for over 25 years, theweight of pollen has increased to the point that mostpollen only drifts 2–3 m. One study documentedthat 90% of the pollen landed with 16 feet of thefield perimeter (Chicago Tribune, 1999).2. Mark Sears at the University of Guelph conduct-ed lab experiments and determined there were meas-urable toxic effects on larvae at pollen densitiesgreater than 100 grains of pollen cm–2. When milk-weed plants were examined near maize fields, thoseat a distance of 1 m from the field were found tohave 28 grains of pollen cm–2 and at 5 m the meas-urable level of pollen dropped to zero (Sears andStanley-Horn, 2000). 3. Farmers spray for weeds, including milkweed,before monarchs lay eggs. This would effectivelycontrol milkweed in the maize field and, dependingon the drift of the spray, for a short distance aroundthe edge of the field.1
4. Dr Losey used pollen from the Bt maize varietythat happened to have the highest level of Bt in thepollen, which makes up a very small percentage ofthe maize acreage grown in North Dakota, which islargely outside the monarch range (Downey, 1999).5. Dr Losey suggests that usually larvae hatch andpollen shed occur over coinciding dates. Researchersin Nebraska found that 95% of the pollen hadspread before the commencement of the larvaehatch (St Louis Post-Dispatch, 1999).6. An Iowa State University researcher noted thatmonarchs typically prefer to lay their eggs on milk-
weed plants that are in the open and on plants thatrange in size from 3 inches to 18 inches in height.Plants of this size would rarely be found growingwithin maize fields, rather they would typically growin ditches and fencelines (Rice, 1999).
These follow-up studies found that there wasan extremely small correlation between the mortali-ty of monarch butterfly larvae and toxic effects fromBt maize pollen. Had Dr Losey allowed for a peerreview of his 1998 findings, a great deal of incom-plete information about the effects of Bt maizewould not have been disseminated.
Resulting government regulations
Dr Losey’s article in Nature touched off a firestormof criticisms from opponents of biotechnology.News magazines such as Science News screamed theheadline ‘Bt-Corn pollen can kill monarchs’ (22May 1999). Jeremy Rifkin, head of the Washingtonbased Foundation for Economic Trends, called foran outright ban on the release of any new GM cropvarieties until the potential environmental impactswere more fully known. The National CornGrowers Association received letters from schoolchildren demanding that the mean farmers stopkilling butterflies (Scientific American, 1999).Concern quickly developed among the Americanpublic, leading the Environmental ProtectionAgency (EPA) to issue new standards for producersintending to grow Bt maize.
The incomplete information generated by DrLosey’s research contributed to the EPA developingand implementing mandatory planting restrictionsfor Bt maize. The new measures for insect resistancemanagement that applied to Bt maize growers forthe 2000 crop year were:
1. Required to plant a minimum structured refugeof at least 20% non-Bt maize;2. Required in areas where Bt maize and cotton aregrown to ensure a structured refuge of 50% non-Btmaize;3. Expected to closely monitor fields to detect anypotential resistance;4. Required to communicate voluntary measuresthat will protect non-target insects, particularly themonarch butterfly; and
Science and Regulation 199
1 Letter from Jeffery Stein, Director of Regulatory and Government Affairs, Novartis Seeds, Inc. to Dr Losey, 3 May1999.

5. Outright restriction in planting Bt maize insome geographic locations (EPA web site, 2000).
These new rules were initially viewed as bur-densome by many in the industry and many in themaize industry speculated that the rules could causesome maize producers to reduce their acreage of Btmaize. Subsequent scientific research conducted inthe summer of 1999 suggests that the risk tomonarch butterflies could have been managed by Btmaize producers maintaining a 50-foot summerfal-low strip around the edge of the field. This wouldensure that no milkweed plants could grow close tothe maize field and that virtually all of the pollenwould not drift beyond this refuge distance.
Economic and financial cost of theregulations
The higher level of trust in the American institu-tions responsible for food and environmental safetymeant that the concern that developed from Losey’sresearch could be addressed through existing institu-tions. The EPA increased the standards pertaining torefuge requirement for producers wanting to plantBt maize. When these increased requirements wereannounced in December 1999, there was concernexpressed by the maize industry that there would belower levels of Bt maize planted. Even by March2000, the industry believed that Bt maize plantingwould be down by as much as 15% over the previ-ous year. The most recent information shows thatoverall maize planting is up by 3% and Bt maizeplanting (Table 16.1) is down slightly, which is gen-erally attributed to the natural cycle of the Europeancorn borer. The fact that Bt maize production is rel-atively stable following these new standards wouldindicate that they closely mirror what the industrywas actually practising.
The question that arises from recently releasedresearch is, are the new standards an over-reaction?Shelton et al. (2000) examined the issue of manag-ing insect resistance in Bt-engineered plants andfound that using a 20% refuge, which is allowedunder the rules to be sprayed with the usual array ofchemicals, reduces the resistance capabilities of thepest. If producers do not want to sacrifice such alarge amount of their field to pest damage theywould be better to move to the option of having a4% refuge that is not sprayed.
Within an individual field or farm, treating the
refuge with a highly effective insecticide may dilute
the abundance of susceptible alleles to such an
extent that the refuge is rendered ineffective unless
there is substantial immigration of susceptible
alleles from wild hosts or from surrounding non-Bt
crops. On the other hand, growers may be reluctant
to sacrifice a large number of refuge plants to
insects just to maintain susceptible alleles. An
alternative to the strategy of having a 20% refuge
that can be sprayed (the requirement for cotton
[and Bt corn] is the EPA-approved strategy … of
having a 4% refuge that remains unsprayed.
(Shelton et al., 2000)
It is possible to estimate the economic impactof the formal regulations and Shelton’s alternative.Bt maize has been adopted because it reduces thenumber of insecticide applications and increasesyields; restricting its use causes losses. Gianessi andCarpenter (1999) document that Pioneer datashows that Bt maize yields were 17 bushel acre–1
higher than non-Bt maize in 1997 (35,000 compar-isons) and 7 bushel acre–1 higher in 1998 (64,713comparisons). While Gianessi and Carpenter calcu-lated that average yield increases were much lower(they averaged the Pioneer results with other studies,which had as few as 84 observations), we have useda 2-year average of the Pioneer data, which providesa 2-year average increase of 12 bushel acre–1. Table16.2 illustrates what the losses may be with asprayable 20% and sprayable 50% refuge. The priceof maize (US$1.83 bushel–1) was selected on 11 July2000. The table also includes losses at non-sprayable4% refuge for illustration purposes.
When the costs are summed using the 50/20refuge requirement, they reach over US$72 million.While that seems high, it is significantly less thanthe opportunity cost of one of the alternatives,which was to ban the crop (which was the effect ofthe labelling laws in the UK). Gianessi andCarpenter estimate that Bt maize generated US$230
200 S. Smyth and P.W.B. Phillips
Table 16.1. Percentage of all GM maize and Btmaize varieties.
All biotech Insect resistantYear varieties (Bt) only
1998 26 181999 30 25 (top 7 states only)2000 25 18
Source: USDA: www.usda.mannlib.cornell.edu/reports/nassr/field/pcp-bba/acrg0600.txt; and Gianessi and Carpenter,1999.

million total gross benefits to farmers in 1997 and1998. While the net benefit was only US$46 million(low incidence of European corn borer in 1998resulted in a small net loss), some of the US$184million of farmer costs was profit to the owners ofthe technology and should be counted as net socialgains (Moschini and Lapan, 1997). That said, thenew regulations are more restrictive than may benecessary to achieve their objectives. The 50/4refuge costs are only US$27 million but under thecurrent mandatory regulations, that option cannotbe pursued.
Analysis
Food safety systems must be able to handle multiplerisks and uncertainties that occur at multiple stagesin the food system, including probabilistic, hypo-thetical and speculative risks. The food risk analysissystem must handle those risks through assessment,management and communications. The nationaland international regulatory systems for biotechnol-ogy based agrifood products is incomplete (especial-ly the risk management and communications ele-ments) and therefore is unable to handlehypothetical and speculative risks.
Returning to the earlier model that presented astructure for disentangling the debate about safetyof GM foods, we can use it to demonstrate what has
occurred with the incomplete information resultingfrom Dr Pusztai’s and Dr Losey’s research (Table16.3). These experiments can be said to have pro-duced speculative and hypothetical risks. Dr Pusztaispeculated that consumption of GM potatoes couldhave harmful health effects, and he suggested thisclaim be applied to all other varieties of GM agri-food products. There is no theory that allows forclaims against one food variety to be applied toother varieties without supportive research; there-fore, his claims are speculative. Dr Losey’s findingswere hypothetical as they were only laboratoryexperiments and field trials needed to be conductedto validate his findings. There certainly was theorythat suggests that Bt maize could hurt non-targetorganisms, so his claims were hypothetical.
This model documents how the approachtaken by British institutions differed from theapproach of US institutions when faced with similarproblems. Due to the complete lack of trust in pre-vious British food safety institutions, an entirelynew institution had to be created to establish trustwith consumers. In the USA a high level of trustalready existed in food and environmental safetyagencies, and as a result existing institutions wereable to satisfactorily deal with public concerns. Thekey when dealing with incomplete information is tohave strong institutions with existing structures thathave a proven capability of successfully addressingrapidly evolving crises.
Science and Regulation 201
Table 16.2. Comparison of refuge costs.
50% Refuge 20% Refuge 4% Refuge
% total Bt maize crop 10% 90% 90%Acres of non-Bt refuge 715,000 2,574,000 514,000Yield loss (12 bushel acre–1) 8.58M bushel 30.89M bushel 6.18M bushelValue of loss at US$1.83 bushel–1 US$15.7 million US$56.53 million US$11.31 million
Table 16.3. Institutional incorporation of speculative and hypothetical risks.
Speculative risks of incompleteLevel of risk information on GM potatoes Hypothetical risks of incomplete information on Bt maize
Risk assessment Research showed reduced immune Research showed that Bt maize pollen had toxic effects systems and lower organ weights on monarch larvae
Risk management European Union implements a EPA increases the refuge requirements for spring 20001% tolerance level for raw and planting of Bt maizeprocessed foodstuffs
Risk communication Newly created British Food Publication of findings from numerous field experimentsStandards Agency responsible conducted in 1999for labelling
In the UK where the food safety network col-lapsed due to the BSE problem, an entire new foodsafety institution has had to be created to establishcredibility in the minds of consumers regarding GMagrifood products. So far consumers view this insti-tution as credible, at least partly due to the labellinglegislation that was implemented. However, whilethis legislation is capable of clearly defining theprocess that needs to be followed, it is difficult toenforce. As the costs of labelling and providinginformation to consumers are passed on to con-sumers, there will be a threshold in terms of risingfood prices beyond which consumers may begin toreact adversely. Whether this adverse reaction will beenough to threaten the continuation of the newfood safety institution is yet to be seen.
By comparison, in the USA, where a strongenvironmental safety institution existed, the prob-lems that developed due to incomplete informationwere more readily assimilated into the existing insti-tutional framework. The average American con-sumer appears to have accepted the EPA’s actions asproper and reassuring. Consumers have continuedto purchase GM agrifood products and do not facenew price increases because of the change in Btmaize planting standards.
In the UK consumers expressed outrage whenthe safety of their food was questioned by newresearch. Consumers in America did not expressconcerns at anywhere near the level of thoseexpressed in the UK. This can be attributed at leastpartly to the high level of trust that is present in theUS food safety system.
Conclusions
While the incomplete information that developedfrom these two experiments was not entirely respon-sible for the resulting regulatory changes, the studiesdid contribute to concern and acted as catalysts foraction. Had the unexpected media sensation thatwas created by this research not developed, it isquestionable whether the new standards and regula-tions would have been implemented at the levels ortimes chosen. The research created a global media
phenomenom, which forced food and environmen-tal safety agencies to develop and implement actionplans that did not consider all of the potential neg-ative economic impacts. This was clearly the case inthe UK where the British Government forced itslabelling legislation into law to appease concernedconsumers.
The absence of strong institutions to supportfood safety systems can lead to consumer outrage.British and European consumers have lost confi-dence in their food safety systems in the wake of theBSE problem, with the result that the BritishGovernment over-reacted with labelling legislationand tolerance levels in order to re-establish confi-dence in the minds of consumers. Reassurances bygovernment and scientists were largely ineffectiveand in fact may have been viewed as offensive bythose concerned given the claims that governmentand scientists made during the BSE debate. Theincomplete information that resulted from DrPusztai’s potato research is an example of institu-tional failure that led to an adverse effect on con-sumers.
The American food and environmental safetysystem faced crisis situations in the past and, as aresult of this, their risk communication process hascreated a high level of trust among consumers.When faced with the incomplete information thatresulted from Dr Losey’s research the EPA respond-ed thoughtfully through a strong institution and asa result there were limited effects on consumers andthe economy. The EPA had previously allowedrefuge requirements to be voluntary, but due to DrLosey’s research and other research regarding insectsdeveloping resistance to Bt, the refuge requirementswere increased and became mandatory. The trust inthis institution by the American public meant thatunnecessarily restrictive standards were not createdthereby increasing food costs for consumers.
In short, institutions matter, especially whendealing with new products that exhibit experientialor credence features. The stronger the institution,the greater its capability to deal with incompleteinformation and the lower the cost of inappropriateconsumer and regulatory responses.
202 S. Smyth and P. W. B. Phillips
References
Chicago Tribune (1999) Monarch butterfly so far not
imperiled: gene-altered corn gets an early ok in stud-
ies. Chicago Tribune 2 November, p. 4.
Craven, B. and Johnson, C. (1999) Politics, policy, poi-
soning and food scares. In: Morris, J. and Bate, R.
(eds) Fearing Food: Risk, Health and Environment.Butterworth-Heinemann, Oxford.
Downey, K. (1999) Comments on the Environmental
Benefits and Sustainable Agriculture through
Biotechnology Symposium. Agriculture Canada,
Washington, DC, 10–11 November.
The Economist/Angus Reid World Poll (1999) In: TheGlobe & Mail, ‘Canadians wary of genetically altered
food’, 15 January 2000.
EPA (Environmental Protection Agency) (2000) Press
release, 14 January 2000, Bt Corn Insect Resistance
Management Announced for 2000 Growing Season.
www.epa.gov/pesticides/biopesticides
Ewens, S. and Pusztai, A. (1999) Health risks of genetical-
ly modified foods. The Lancet 354, 684.
Gianessi, L. and Carpenter, J. (1999) AgriculturalBiotechnology: Insect Control Benefits. National
Center for Food and Agricultural Policy,
Washington, DC.
Independent (1999) Scientists revolt at publication of
‘flawed’ GM study. The Independent, 10 October.
Isaac, G. and Phillips, P. (1999) Market access and market
acceptance for agricultural biotechnology products.
Paper presented to the ICABR Conference on The
Shape of the Coming Agricultural Biotechnology
Transformation: Strategic Investment and Policy
Approaches from an Economic Perspective, Rome,
17–19 June.
James, C. (1999) Transgenic crops worldwide: current sit-
uation and future outlook. Paper presented at the
Conference Agricultural Biotechnology in DevelopingCountries: Towards Optimizing the Benefits for thePoor, organized by ZEF and ISAAA in collaboration
with AgrEvo and DSE in Bonn, 15–16 November
1999. www.zef.de/zef_englisch/f_veranstalt_biotech.
htm
Losey, J. (1999) Transgenic pollen harms monarch larvae.
Nature 399(6733), 214. www.nature.com
Moschini, G. and Lapan, H. (1997) Intellectual property
rights and the welfare effects of agricultural R&D.
American Journal of Agricultural Economics 79,
1229–1242.
Nature (1999) UK debates public’s role in science advice.
Nature 399(6733), 188.
Nuffield Council on Bioethics (1999) Genetically ModifiedCrops: The Ethical and Social Issues. Latimer Trend &
Company, London.
Phillips, P. and Foster, H. (2000) Labeling for GM Foods:Theory and Practice. Paper presented to the 4th
ICABR Conference on the economics of agriculture
biotechnology. Ravello, Italy, 24–28 August 2000.
Rice, M. (1999) Monarchs and Bt corn: Questions and
answers. 14 June. www.ipm.iastate.edu/ipm/icm/
1999/6-14-1999/monarchbt-html
Sandman, P.M. (1994) Mass media and environmental
risk: seven principles. In: Morris, J. and Babe, R.
(eds) Fearing Food: Risk, Health and Environment.Butterworth-Heinemann, Oxford.
Science News (1999) Bt-corn pollen can kill monarchs.
15(5), 324.
Scientific American (1999) The butterfly effect. 281(2),
28–29.
SOAEFD (Scottish Office of Agriculture, Environment
and Fisheries Department) Flexible Fund Project
(1998) Report of project coordinator on data pro-
duced at the Rowett Research Institute.
www.rri.sari.ac.uk/gmo/ajp.htm
Sears, M. and Stanley-Horn, D. (2000) Impact of Bt corn
pollen on monarch butterfly populations. In:
Fairbairn, C., Scoles, G. and McHughen, A. (eds)
The Biosafety of Genetically Modified Organisms.University Extension Press, Saskatoon, Saskatchewan.
Shelton, A., Tang, J., Roush, R., Metz, T. and Earle, E.
(2000) Field tests on managing resistance to Bt-engi-
neered plants. Nature Biotechnology 18(3), 339–342.
St Louis Post-Dispatch (1999) Scientists discount threat to
butterfly from altered corn. St Louis Post-Dispatch, 2
November, p. A5.
Tirole, J. (1988) The Theory of Industrial Organization.
MIT Press, Cambridge, Massachusetts, p. 106.
UK Ministry of Agriculture, Fisheries and Food (2000)
The Genetically Modified and Novel Foods (Labelling)(England) Regulations 2000.
van den Daele, W., Puhler, A. and Sukopp, H. (1997)
Transgenic Herbicide-resistant Crops: A ParticipatoryTechnology Assessment. Summary report for the
Federal Ministry for Research and Technology.
Wissenschaftszentrum Berlin fur Sozialforschung,
Berlin.
Science and Regulation 203

Problem Setting
Changing demographics in Western societies haveled to an increasingly urbanized population farremoved from food production and distributionrealities. The agrifood industry has continued toimprove the overall quality and safety of food atboth the production and the processing levels (e.g.pasteurization of milk, juices, cheeses and so on)though risks still exist from pathogens, toxins andother contaminants in the food supply. Despiteimprovements, and a food supply that is safer thanever, consumers are increasingly aware of food safetyas an issue. A 1999 survey of five countries –Canada, the USA, Japan, China and Germany –based on a sample size of 1000 respondents in eachcountry, found that the number one food issue forconsumers was food safety (Environics International,2000). On average (across all five countries) 46% ofrespondents were most concerned about food safety,followed by nutrition (22%), food quality (12%),price (8%) and shortages (7%). In terms of specificfood safety concerns, on average 88% of consumers
were very or somewhat concerned about pollution(where food is produced) and chemical pesticides,followed by bacterial contamination (84%).Overall, the least concern (69%) was expressedabout genetically modified (GM) foods. Recent sur-veys of European and US consumers by the FoodMarketing Institute (FMI) (Bruhn, 1997) andHoban (unpublished) indicate that the most impor-tant food safety concern for consumers in bothregions is food borne pathogens.1 Among Americanrespondents, 77% are concerned about microbialcontamination; 66% about pesticide residues; 66%about product tampering; and 42% about antibioticand hormone residues. Only 15% of US respon-dents are concerned about foods derived frombiotechnology (see Fig. 17.1). European consumersare more concerned about food safety issues in gen-eral: 85% of respondents were concerned aboutmicrobial contamination. A greater percentage ofrespondents are concerned about biotechnologyproducts as well (see Fig. 17.1).
Increased attention on microbial contamina-tion is well placed. Each year, food borne pathogens
205
17 Quantifying Scientific RiskCommunications of Agrobiotechnology
Leonie A. Marks,1 Siân Mooney2 and Nicholas Kalaitzandonakes11Economics and Management of Agrobiotechnology Center, Department of
Agricultural Economics, University of Missouri-Columbia, Columbia, Missouri, USA;2Department of Agricultural Economics, Montana State University, Bozeman,
Montana, USA
© CAB International 2002. Market Development for Genetically Modified Foods(eds V. Santaniello, R.E. Evenson and D. Zilberman)
1 Survey instruments vary by type of question asked, time period and geographical location. Hence, the difference (as apercentage of respondents) between the Environics International (2000), FMI (Bruhn, 1997) and Hoban (unpub-lished) studies. Nevertheless, these surveys indicate that microbial contamination and pesticide residues are of mostconcern to consumers in each country and region, and that GMFs have been found to be of least concern over time.
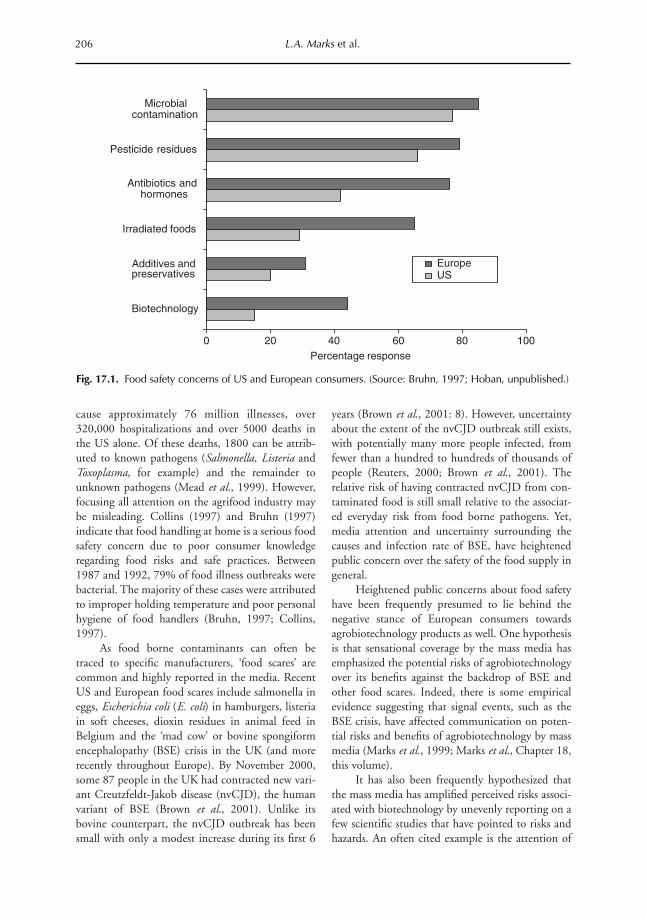
cause approximately 76 million illnesses, over320,000 hospitalizations and over 5000 deaths inthe US alone. Of these deaths, 1800 can be attrib-uted to known pathogens (Salmonella, Listeria andToxoplasma, for example) and the remainder tounknown pathogens (Mead et al., 1999). However,focusing all attention on the agrifood industry maybe misleading. Collins (1997) and Bruhn (1997)indicate that food handling at home is a serious foodsafety concern due to poor consumer knowledgeregarding food risks and safe practices. Between1987 and 1992, 79% of food illness outbreaks werebacterial. The majority of these cases were attributedto improper holding temperature and poor personalhygiene of food handlers (Bruhn, 1997; Collins,1997).
As food borne contaminants can often betraced to specific manufacturers, ‘food scares’ arecommon and highly reported in the media. RecentUS and European food scares include salmonella ineggs, Escherichia coli (E. coli) in hamburgers, listeriain soft cheeses, dioxin residues in animal feed inBelgium and the ‘mad cow’ or bovine spongiformencephalopathy (BSE) crisis in the UK (and morerecently throughout Europe). By November 2000,some 87 people in the UK had contracted new vari-ant Creutzfeldt-Jakob disease (nvCJD), the humanvariant of BSE (Brown et al., 2001). Unlike itsbovine counterpart, the nvCJD outbreak has beensmall with only a modest increase during its first 6
years (Brown et al., 2001: 8). However, uncertaintyabout the extent of the nvCJD outbreak still exists,with potentially many more people infected, fromfewer than a hundred to hundreds of thousands ofpeople (Reuters, 2000; Brown et al., 2001). Therelative risk of having contracted nvCJD from con-taminated food is still small relative to the associat-ed everyday risk from food borne pathogens. Yet,media attention and uncertainty surrounding thecauses and infection rate of BSE, have heightenedpublic concern over the safety of the food supply ingeneral.
Heightened public concerns about food safetyhave been frequently presumed to lie behind thenegative stance of European consumers towardsagrobiotechnology products as well. One hypothesisis that sensational coverage by the mass media hasemphasized the potential risks of agrobiotechnologyover its benefits against the backdrop of BSE andother food scares. Indeed, there is some empiricalevidence suggesting that signal events, such as theBSE crisis, have affected communication on poten-tial risks and benefits of agrobiotechnology by massmedia (Marks et al., 1999; Marks et al., Chapter 18,this volume).
It has also been frequently hypothesized thatthe mass media has amplified perceived risks associ-ated with biotechnology by unevenly reporting on afew scientific studies that have pointed to risks andhazards. An often cited example is the attention of
206 L.A. Marks et al.
Fig. 17.1. Food safety concerns of US and European consumers. (Source: Bruhn, 1997; Hoban, unpublished.)
0 20 40 60 80 100
Biotechnology
Additives andpreservatives
Irradiated foods
Antibiotics andhormones
Pesticide residues
Microbialcontamination
Percentage response
EuropeUS
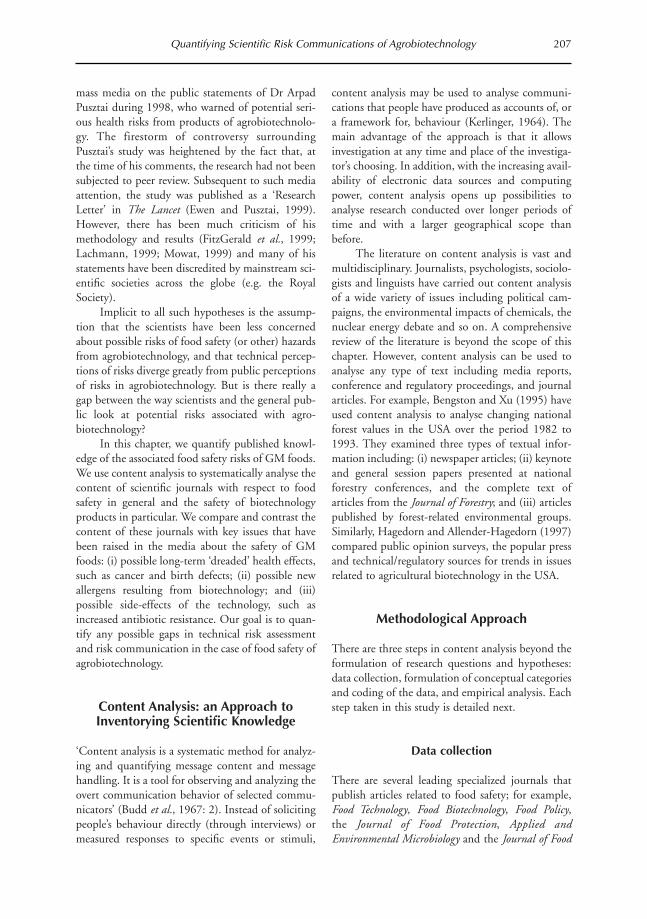
mass media on the public statements of Dr ArpadPusztai during 1998, who warned of potential seri-ous health risks from products of agrobiotechnolo-gy. The firestorm of controversy surroundingPusztai’s study was heightened by the fact that, atthe time of his comments, the research had not beensubjected to peer review. Subsequent to such mediaattention, the study was published as a ‘ResearchLetter’ in The Lancet (Ewen and Pusztai, 1999).However, there has been much criticism of hismethodology and results (FitzGerald et al., 1999;Lachmann, 1999; Mowat, 1999) and many of hisstatements have been discredited by mainstream sci-entific societies across the globe (e.g. the RoyalSociety).
Implicit to all such hypotheses is the assump-tion that the scientists have been less concernedabout possible risks of food safety (or other) hazardsfrom agrobiotechnology, and that technical percep-tions of risks diverge greatly from public perceptionsof risks in agrobiotechnology. But is there really agap between the way scientists and the general pub-lic look at potential risks associated with agro-biotechnology?
In this chapter, we quantify published knowl-edge of the associated food safety risks of GM foods.We use content analysis to systematically analyse thecontent of scientific journals with respect to foodsafety in general and the safety of biotechnologyproducts in particular. We compare and contrast thecontent of these journals with key issues that havebeen raised in the media about the safety of GMfoods: (i) possible long-term ‘dreaded’ health effects,such as cancer and birth defects; (ii) possible newallergens resulting from biotechnology; and (iii)possible side-effects of the technology, such asincreased antibiotic resistance. Our goal is to quan-tify any possible gaps in technical risk assessmentand risk communication in the case of food safety ofagrobiotechnology.
Content Analysis: an Approach toInventorying Scientific Knowledge
‘Content analysis is a systematic method for analyz-ing and quantifying message content and messagehandling. It is a tool for observing and analyzing theovert communication behavior of selected commu-nicators’ (Budd et al., 1967: 2). Instead of solicitingpeople’s behaviour directly (through interviews) ormeasured responses to specific events or stimuli,
content analysis may be used to analyse communi-cations that people have produced as accounts of, ora framework for, behaviour (Kerlinger, 1964). Themain advantage of the approach is that it allowsinvestigation at any time and place of the investiga-tor’s choosing. In addition, with the increasing avail-ability of electronic data sources and computingpower, content analysis opens up possibilities toanalyse research conducted over longer periods oftime and with a larger geographical scope thanbefore.
The literature on content analysis is vast andmultidisciplinary. Journalists, psychologists, sociolo-gists and linguists have carried out content analysisof a wide variety of issues including political cam-paigns, the environmental impacts of chemicals, thenuclear energy debate and so on. A comprehensivereview of the literature is beyond the scope of thischapter. However, content analysis can be used toanalyse any type of text including media reports,conference and regulatory proceedings, and journalarticles. For example, Bengston and Xu (1995) haveused content analysis to analyse changing nationalforest values in the USA over the period 1982 to1993. They examined three types of textual infor-mation including: (i) newspaper articles; (ii) keynoteand general session papers presented at nationalforestry conferences, and the complete text ofarticles from the Journal of Forestry; and (iii) articlespublished by forest-related environmental groups.Similarly, Hagedorn and Allender-Hagedorn (1997)compared public opinion surveys, the popular pressand technical/regulatory sources for trends in issuesrelated to agricultural biotechnology in the USA.
Methodological Approach
There are three steps in content analysis beyond theformulation of research questions and hypotheses:data collection, formulation of conceptual categoriesand coding of the data, and empirical analysis. Eachstep taken in this study is detailed next.
Data collection
There are several leading specialized journals thatpublish articles related to food safety; for example,Food Technology, Food Biotechnology, Food Policy, the Journal of Food Protection, Applied andEnvironmental Microbiology and the Journal of Food
Quantifying Scientific Risk Communications of Agrobiotechnology 207

Science among others. In addition, non-specializedjournals, such as Science and Nature also addressissues related to new technologies, such as biotech-nology. We analyse research reported in two leadingscientific journals; namely, the Journal of FoodProtection and Science.
The Journal of Food Protection was analysed asit is the most widely read of the specialized foodjournals and considered a leading journal in its field(D. Holt, personal communication, 19 April 2000).The Journal of Food Protection is published monthlybeginning with the January issue by theInternational Association of Milk, Food andEnvironmental Sanitarians.
Science was analysed as it is the world’s largestcirculation general scientific publication. In addi-tion, the initial source for many science news storiesis a breaking journal article published in an elite sci-entific journal, such as Science. Our analysis shouldtherefore reveal the body of evidence about the safe-ty of GM foods readily available to the media inScience. Science is published weekly by the AmericanAssociation for the Advancement of Science. Twovery different kinds of editorial material are pub-lished: the most important news of the week inscience and in science policy, and a selection ofscientific papers reporting the most significantbreakthroughs in global research. The front of themagazine is written by a team of science journalistswho translate the latest developments in science intoclear, non-technical language for the general public,media and other scientists.
Our period of analysis is 1990 to 1999. Thisperiod coincides with many European food crises(e.g. BSE) and emerging food safety issues in theUS, including detection of food borne pathogensand allergens, food irradiation, chemical residuesand the emergence of antibiotic resistant bacteria inthe food supply.
All articles in the Journal of Food Protectionrelate to food or food safety issues. Therefore, everyarticle in a given issue was analysed. In the case ofScience, however, a broad range of science-relatedtopics are covered. Therefore, a list of keywords wasused to identify articles related to key content cate-gories. For example, words or word phrases such asbiotechnology, food biotechnology, food safety,BSE, microbial contaminants and so on, were usedto identify the subset of articles analysed.
Categorization and coding of data
The most important step in content analysis is theidentification and categorization of the variablesunder study. Categories, such as subject matter ordirection categories, serve the same function as vari-ables in content analysis. As Budd et al. (1967)argue, ‘no content is better than its categories’.Variables (categories) must be defined through anoperational definition or set of definitions. In addi-tion, these categories must be exhaustive and mutu-ally exclusive.
In this study, several contextual categories weredefined to mirror public food safety concerns.Articles were categorized if they related to contami-nation of foods from pathogens (including listeria,E. coli, salmonella and vomitoxin), chemicalresidues (as a separate sub-category of food contam-inants), food allergens, irradiation, and antibioticresidues and hormones. In addition, articles werecategorized on the basis of ‘risk analysis’ where riskanalysis was broadly defined to include any mentionof the words ‘risk’ or ‘health hazard’. Hence, thiscategory over-reports the actual level of risk analysisundertaken or discussed by scientists. A ‘dreadedeffects’ category was also developed followingSlovic’s conception of such risks. This categoryincluded such words as ‘deaths’, ‘mortality’, ‘long-term effects’, ‘birth defects’ and so on. The purposeof this category was to quickly identify articles thatmight indicate possible dreaded effects of food haz-ards. This category, along with the ‘risk analysis’ cat-egory was particularly important for cross-checkingof biotechnology-related articles.
A large sub-category of articles identified acrossboth journals was biotechnology-related articles.Biotechnology tools and methods were broadlydefined to include both basic (e.g. general assaytechniques) and the more sophisticated techniques,such as genetic engineering, genetic modification,use and identification of DNA, ELISA, PCR, use ofbacteriophages such as T4 and M13, and so on. Thissub-category of articles was then cross-tabulatedwith the food safety categories using semantic-basedsoftware to identify how food safety issues inbiotechnology are viewed and addressed by the sci-entific community.
208 L.A. Marks et al.
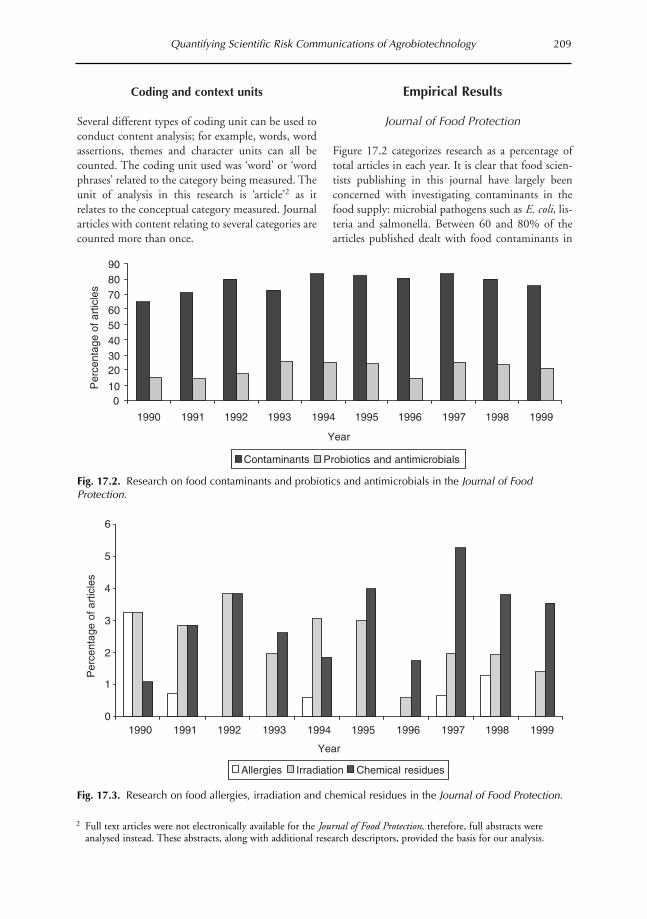
Coding and context units
Several different types of coding unit can be used toconduct content analysis; for example, words, wordassertions, themes and character units can all becounted. The coding unit used was ‘word’ or ‘wordphrases’ related to the category being measured. Theunit of analysis in this research is ‘article’2 as itrelates to the conceptual category measured. Journalarticles with content relating to several categories arecounted more than once.
Empirical Results
Journal of Food Protection
Figure 17.2 categorizes research as a percentage oftotal articles in each year. It is clear that food scien-tists publishing in this journal have largely beenconcerned with investigating contaminants in thefood supply: microbial pathogens such as E. coli, lis-teria and salmonella. Between 60 and 80% of thearticles published dealt with food contaminants in
Quantifying Scientific Risk Communications of Agrobiotechnology 209
Fig. 17.2. Research on food contaminants and probiotics and antimicrobials in the Journal of FoodProtection.
010
2030405060708090
1990 1991 1992 1993 1994 1995 1996 1997 1998 1999
Per
cent
age
of a
rtic
les
Contaminants Probiotics and antimicrobials
Year
Fig. 17.3. Research on food allergies, irradiation and chemical residues in the Journal of Food Protection.
0
1
2
3
4
5
6
1990 1991 1992 1993 1994 1995 1996 1997 1998 1999
Per
cent
age
of a
rtic
les
Year
Allergies Irradiation Chemical residues
2 Full text articles were not electronically available for the Journal of Food Protection, therefore, full abstracts wereanalysed instead. These abstracts, along with additional research descriptors, provided the basis for our analysis.
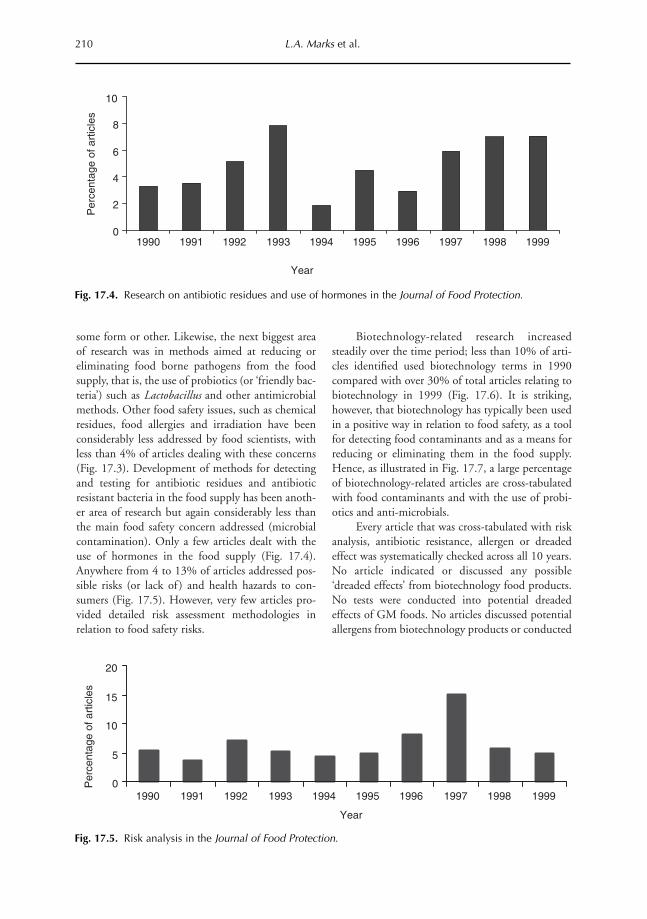
some form or other. Likewise, the next biggest areaof research was in methods aimed at reducing oreliminating food borne pathogens from the foodsupply, that is, the use of probiotics (or ‘friendly bac-teria’) such as Lactobacillus and other antimicrobialmethods. Other food safety issues, such as chemicalresidues, food allergies and irradiation have beenconsiderably less addressed by food scientists, withless than 4% of articles dealing with these concerns(Fig. 17.3). Development of methods for detectingand testing for antibiotic residues and antibioticresistant bacteria in the food supply has been anoth-er area of research but again considerably less thanthe main food safety concern addressed (microbialcontamination). Only a few articles dealt with theuse of hormones in the food supply (Fig. 17.4).Anywhere from 4 to 13% of articles addressed pos-sible risks (or lack of ) and health hazards to con-sumers (Fig. 17.5). However, very few articles pro-vided detailed risk assessment methodologies inrelation to food safety risks.
Biotechnology-related research increasedsteadily over the time period; less than 10% of arti-cles identified used biotechnology terms in 1990compared with over 30% of total articles relating tobiotechnology in 1999 (Fig. 17.6). It is striking,however, that biotechnology has typically been usedin a positive way in relation to food safety, as a toolfor detecting food contaminants and as a means forreducing or eliminating them in the food supply.Hence, as illustrated in Fig. 17.7, a large percentageof biotechnology-related articles are cross-tabulatedwith food contaminants and with the use of probi-otics and anti-microbials.
Every article that was cross-tabulated with riskanalysis, antibiotic resistance, allergen or dreadedeffect was systematically checked across all 10 years.No article indicated or discussed any possible‘dreaded effects’ from biotechnology food products.No tests were conducted into potential dreadedeffects of GM foods. No articles discussed potentialallergens from biotechnology products or conducted
210 L.A. Marks et al.
Fig. 17.4. Research on antibiotic residues and use of hormones in the Journal of Food Protection.
0
2
4
6
8
10
1990 1991 1992 1993 1994 1995 1996 1997 1998 1999
Per
cent
age
of a
rtic
les
Year
Fig. 17.5. Risk analysis in the Journal of Food Protection.
0
5
10
15
20
1990 1991 1992 1993 1994 1995 1996 1997 1998 1999
Year
Per
cent
age
of a
rtic
les

any tests for potential allergens. The number ofresearch articles on food allergens was extremely lowand this related to known allergens, such as milkresidues in non-related foods. One article usedELISA to detect whey proteins in food processing.In terms of antibiotic resistance, biotechnology wastypically used as a tool or indicator for the presenceof resistant bacteria. No article studied the use ofantibiotic resistance marker genes as a food safetyissue. Again, PCR and ELISA techniques were usedto test for specific strains of resistant bacteria.
In terms of risks and risk assessment, no articledealt with food safety risks of GM foods. One arti-cle discussed the possibility of using GM bacteri-ocins (probiotics) to combat listeria contaminationand suggested that, while promising, such GMorganisms (GMOs) would have to clear regulatoryhurdles because of possible risks. One article inves-tigated enterococci isolated from dairy products ashaving useful biotechnological traits but that therewas no conclusion on whether they posed a threat inthemselves as food borne pathogens.
Quantifying Scientific Risk Communications of Agrobiotechnology 211
Fig. 17.6. Biotechnology-related research in the Journal of Food Protection.
Fig. 17.7. Cross-tabulation of biotechnology-related articles in the Journal of Food Protection.
05
10
15
202530
3540
45
1990 1991 1992 1993 1994 1995 1996 1997 1998 1999
Per
cent
age
of a
rtic
les
Year
0
1
2
3
4
5
6
7
8
9
10
1990 1991 1992 1993 1994 1995 1996 1997 1998 1999
Per
cent
age
of b
iote
ch a
rtic
les
Methods for detecting food contaminants Probiotics and antimicrobials Risk analysis
Year

Science
Figure 17.8 details coverage in Science of biotech-nology in general and agrifood biotechnology arti-cles in particular. Coverage is expressed as a totalnumber of articles, rather than as a percentage, as
the total number of articles was very large in anygiven year.3 Overall, less than 10% of articles dealtwith biotechnology in general and less than 1% ofarticles related to agrifood biotechnology.Interestingly, risk analysis in relation to generalbiotechnology articles has received quite a lot of cov-
212 L.A. Marks et al.
Fig. 17.8. Total articles related to biotechnology and food biotechnology in Science.
0
50
100
150
200
250
300
350
1990 1991 1992 1993 1994 1995 1996 1997 1998 1999
Num
ber
of a
rtic
les
Agrifood biotechnology Biotechnology
Year
Fig. 17.9. Coverage of risk analysis in biotechnology-related articles in Science.
0
10
20
30
40
50
60
70
80
90
100
1990 1991 1992 1993 1994 1995 1996 1997 1998 1999
Num
ber
of a
rtic
les
Year
3 As Science is published weekly, over 1664 articles were published during 1990. By 1999, the number of articles hadsteadily increased to 2467.

erage, along with antibiotic resistance (Figs 17.9 and17.10). As already indicated, such risk analysis isbroadly defined and is likely to overstate the actuallevel of risk assessment undertaken or discussed byscientists. In addition, such coverage includesbiosafety as well as health safety issues.
In order to identify the body of research on thefood safety of biotechnology, only research articleswere analyzed on the basis of the food safety cate-gories identified previously. Editorials, opinionpieces, book reviews and short articles by journalists
were excluded from the analysis. Scientific commen-tary articles, that is articles discussing scientificresearch conducted by other researchers, wereincluded. These articles could be literature reviewsof scientific work or studies.
A small number of research articles per yearcross-tabulated with agrifood biotechnology andfood contaminants, chemical residues, risk analysisand antibiotic residues/hormones. Hence, a smallfraction of the agrifood biotechnology coverage inScience provided scientific research articles that
Quantifying Scientific Risk Communications of Agrobiotechnology 213
0
10
20
30
40
50
1990 1991 1992 1993 1994 1995 1996 1997 1998 1999
Num
ber
of a
rtic
les
Food allergies Antibiotic resistance Chemical residues
Year
Fig. 17.10. Coverage of food allergies, antibiotic resistance and chemical residues in biotechnology-relatedarticles in Science.
Fig. 17.11. Scientific research of food safety issues of biotechnology in Science.
0
1
2
3
1990 1991 1992 1993 1994 1995 1996 1997 1998 1999
Num
ber o
f art
icle
s
Food allergens Risk analysis Chemical residues
Food contaminants Antibiotic residues and hormones
Year

addressed many of the food safety issues raised bythe public. Figure 17.11 indicates the level of scien-tific coverage of each food safety category. For exam-ple, only one article addressed food allergies in rela-tion to ag-biotechnology food products. This articlediscussed the possibility of allergenicity as novel pro-teins are inserted into food products. This article didnot test specific proteins but suggested which pro-teins might need testing and which might not.
Several research articles did cross-tabulate withagrifood biotechnology on the basis of risk analysisover the 10 year period; however, most of these arti-cles were indirectly related to food safety. For exam-ple, one article referred to consumer perception ofrisk in opinion polls; another article related to therisk of inheritance of prion diseases; and biotechnol-ogy was used as a method to detect prions (withtransgenic mice). No scientists, based on our analy-ses, reported testing GM foods for possible healthrisks or finding potential health risks.
Concluding Comments and Implications
From our initial results, there appears to be a gap inthe perceptions of food safety risks and benefits ofagrobiotechnology between food scientists andreporters. Typical public concerns about the foodsafety of products of agrobiotechnology have notbeen a primary focus of scientific studies. Similarly,biotechnology has often been considered by scien-tists as a means of reducing other food risks (e.g.microbial contamination). These benefits are gener-ally under-reported through mass media.
Lack of studies testing the food safety of agro-biotechnology products does not imply that foodsafety is not an issue. It is possible that scientistsconsider testing for food safety ‘mundane’ work thatis best left to organizations pursuing commercializa-tion and regulators. Our results indicate that food(and other) scientists have not put forward hypothe-ses of major food safety risks in the case of agrifoodbiotechnology. And, they have not seemed overlyconcerned with testing the risks for which hypothe-ses have been advanced.
These results suggest a possible gap betweenthe scientific perception of risk of agrifood biotech-nology and that of the general public. The emphasisof mass media on the potential food safety risks ofagrobiotechnology suggests a communication prob-lem for the scientific community and the biotech-nology industry. Under-reporting of potential bene-fits of biotechnology in food safety hazards indicates
a similar communication gap. Irrespectively, toensure public confidence, studies testing the foodsafety of agrobiotechnology products must be sub-jected to a rigorous peer-reviewed process and mustbe placed in the public domain.
Recent regulatory developments seem promis-ing in this respect. In May 2000, the ClintonAdministration outlined several steps needed to pro-vide the public with more information about thescience-based regulation and food safety testing ofGM foods (The White House, 2000). In particular,the US Food and Drug Administration (FDA) pro-posed a rule mandating that developers of bioengi-neered foods and animal feeds notify the agencywhen they intend to market such products (USDepartment of Health and Human Services[DHHS]/US Food and Drug Administration[FDA], 2000). Up until this point, the notificationprocess had been voluntarily adhered to. The FDAhas proposed that all submitted data or information,and the agency’s conclusions, be made available tothe public. This proposed rule has subsequentlybeen published in the Federal Register(DHHS/FDA, 2001). Such data could be exemptfrom public disclosure at the request of the notifierunder established exemptions as provided in theFreedom of Information Act (FOIA) (DHHS/FDA,2001: 4714). However, in the view of the FDA,much of the data or information provided is unlike-ly to constitute a trade secret or be confidential.More publicly available information would go someway to providing food safety test data to the generalpublic. However, this information is not publiclyaccessible at this time.
In addition, the previous administration pro-posed that the US Department of Agriculture(USDA), the Environmental Protection Agency(EPA) and the FDA support an expanded pro-gramme of competitively awarded, independentpeer-reviewed research focusing on current andfuture safety issues related to GM foods (The WhiteHouse, 2000). Based on our initial results, suchresearch is needed to further place food safety stud-ies within the public domain.
Finally, a word of caution. Our results shouldbe considered suggestive and not conclusive. Morejournals must be analysed for content, as second-tierjournals may have published research that is differ-ent from that analysed here. Likewise, medical jour-nals such as The Lancet and the Journal of theAmerican Medical Association, warrant further sys-tematic investigation.
214 L.A. Marks et al.
References
Bengston, D.N. and Xu, Z. (1995) Changing NationalForest Values: A Content Analysis, Research Paper NC,
323. United States Department of Agriculture,
Forest Service, North Central Forest Experiment
Station, St Paul, Minnesota.
Brown, P., Will, R.G., Bradley, R., Asher, D.M. and
Detwiler, L. (2001) Bovine spongiform
encephalopathy and variant Creutzfeldt-Jakob dis-
ease: background, evolution, and current concerns.
Emerging Infectious Disease 7(1), 1–17.
www.cdc.gov/ncidod/EID/vol7no1/brown.htm
Bruhn, C.M. (1997) Consumer concerns: motivating to
action. Emerging Infectious Diseases 3(4), 511–515.
www.cdc.gov/ncidod/eid/vol3no4/bruhn.htm
Budd, R.W., Thorp, R.K. and Donohew, L. (1967)
Content Analysis of Communications. Macmillan
Company, New York.
Collins, J.E. (1997) Impact of changing consumer
lifestyles on the emergence/reemergence of food-
borne pathogens. Emerging Infectious Diseases 3(4),
471–479.
Environics International (2000) Food issues monitor.
www.environicsinternational.com
Ewen, S.W.B. and Pusztai, A. (1999) Effects of diets con-
taining genetically modified potatoes expressing
Galanthus nivalis lectin on rat small intestine. TheLancet 354(9187), 1353–1354.
Fitzgerald, A.J., Goodlad, R.A. and Wright, N.A. (1999)
Correspondence: GM food debate. The Lancet 354,
1725.
Hagedorn, C. and Allender-Hagedorn, S. (1997) Issues in
agricultural and environmental biotechnology: iden-
tifying and comparing biotechnology issues from
public opinion surveys, the popular press and tech-
nical/regulatory sources. Public Understanding ofScience 6, 233–245.
Kerlinger, F.N. (1964) Foundations of Behavioral Research.
Holt, Rinehart and Winston, New York.
Lachmann, P. (1999) Correspondence: GM food debate.
The Lancet 354, 1725.
Marks, L.A., Kalaitzandonakes, N. and Zakharova, L.
(1999) Public opinion of agbiotech in the US and
UK: a content analysis approach. Paper presented at
the American Agricultural Economics Association
(AAEA) National Meetings, Nashville, Tennessee.
www.agecon.lib.umn.edu/cgi-bin/pdf_view.pl?
paperid=1495
Mead, P.S., Slutaker, L., Dietz, V., McCraig, L.F., Bresee,
J.S., Shapiro, C., Griffin, P.M. and Tauxe, R.V.
(1999) Food related illness and death in the United
States. Emerging Infectious Diseases 5(5), 607–625.
www.cdc.gov/ncidod/eid/vol5no5/mead.htm
Mowat, A. (1999) Correspondence: GM food debate. TheLancet 354, 1725.
Reuters (2000) Human mad cow cases rising, Reuters
Report. www.msnbc.com/news/441480.asp
United States Department of Health and Human Services
(DHHS)/Food and Drug Administration (FDA)
(2000) FDA to strengthen pre-market review ofbioengineered foods, press release No. P00-10.
DHHS/FDA, Washington, DC. www.cfsan.fda.gov/
~lrd/hhbioen2.html
United States Department of Health and Human Services
(DHHS)/Food and Drug Administration (FDA)
(2001) Premarket notice concerning bioengineered
foods. Federal Register 66(12), 4706–4738.
The White House (2000) Clinton administration agencies
announce food and agricultural biotechnology initia-
tives: strengthening science-based regulation and
consumer access to information, press release, 3 May.
www.cfsan.fda.gov/~lrd/whbio53.html
Quantifying Scientific Risk Communications of Agrobiotechnology 215
Introduction
The story is well known. After decades of researchand development (R&D) agricultural biotechnolo-gy products hit the US market in 1995 and 1996.Commercialization and adoption of transgeniccrops in the USA was rapid, yet equally swift wasrejection of the technology by many consumers inEurope and elsewhere. Many factors have beenhypothesized to drive this consumer response:
• A refusal of consumers to accept any risk in theface of no perceived direct benefit.
• An alleged lack of trust in food regulatory agen-cies in Europe and elsewhere.
• The unfortunate coincidence of the commercial-ization of genetically modified (GM) foods withthe bovine spongiform encephalopathy (BSE)(‘mad cow’) crisis.
• Protectionist interests on the part of Europeangovernments to prohibit trade in biotech crops.
• An unyielding attitude by the USA and corpo-rate entities championing the technology towardslabelling and the consumers’ ‘right to know’.
• Anti-American sentiment.• Sensational coverage by the mass media.
In this chapter, we focus on the last hypothesis andwe analyse media coverage of agrifood biotech-
nology. A vast amount of research has investigatedthe role of the media in amplifying risks well beyondwhat is implied by ‘actual or objective’ scientific risk.In the case of agrobiotechnology, it has been shownthat key events do indeed have a significant impacton the level of coverage and the way risks and bene-fits are communicated (Marks et al., 1999).
Media represent fora where public debates onagrobiotechnology have taken place for many years.They, of course, have not only been reflective of theongoing public debates but they have also had a rolein shaping them. While they are not a singular influ-ence, they have been shown to play a role in the risk(and benefit) perception of biotechnology that thepublic holds (Bauer et al., 1998). A recent survey ofUS consumers (Schulz et al., 2000) indicates thatUS consumer awareness of GM foods has comefrom traditional media such as television, magazinesand newspapers.
In this chapter, we analyse mass media cover-age of agrobiotechnology in a risk communicationframework using content analysis (see Wimmer andDominick, 1987). We analyse coverage in US andUK newspapers over the period 1990 to 1999. USpapers include the Wall Street Journal, WashingtonPost and USA Today. UK papers include the DailyTelegraph and The Times. In particular, we examinehow environmental and food safety risks and
217
18 Time Series Analysis of Risk Frames inMedia Communication of Agrobiotechnology
Leonie A. Marks,1 Nicholas Kalaitzandonakes,1 Kevin Allison2 andLudmila Zakharova1
1Economics and Management of Agrobiotechnology Center, Department ofAgricultural Economics, University of Missouri-Columbia, Columbia, Missouri, USA;
2John F. Kennedy School of Government, Harvard Business School, HarvardUniversity, Cambridge, Massachusetts, USA
© CAB International 2002. Market Development for Genetically Modified Foods(eds V. Santaniello, R.E. Evenson and D. Zilberman)

benefits have been communicated through themedia on the two sides of the Atlantic.
Risk communication and risk perception arekey elements of the ongoing public debate on agro-biotechnology and allow insights into attitudes andbehaviour of the general public. If policy makers,educators and scientists are to effectively communi-cate the risks and benefits of agrobiotechnology tothe public, an understanding of how different mediaand reporters handle risk frames is important. Thischapter contributes in that direction.
Risk Perception
Like all technologies and, indeed, all human action,biotechnology is associated with risks, both knownand unknown. The study of risk, encompassing thefields of risk assessment, perception and communi-cation, has developed over the past several decadesin response to the challenges posed by an increas-ingly technologically oriented society (Covello,1983; Kates and Kasperson, 1983; Slovic, 1987).Technologies such as nuclear weapons and chemi-cals are capable of affecting the Earth and its inhab-itants on a global scale, resulting in a public interestin accurate assessment and communication of thelevel of risk posed by such technologies. Such haz-ards have the potential to cause catastrophic andlong-term damage to human health and to the envi-ronment, yet possess difficult-to-assess degrees ofrisk. Their most harmful consequences, such as thehealth risks of nuclear fallout or the greenhouseeffect, are rare and most often delayed in their man-ifestation, making them difficult to assess statistical-ly. Moreover, the tremendous impact of such conse-quences leaves no possibility for a trial-and-errorapproach to risk management (Slovic, 1987).
The difficulties of statistical risk assessment areconfounded by the existence of a substantial gapbetween the expert and public perception of risks.How the public forms perceptions of technologicalrisk has been an area of considerable investigation(Slovic 1987, 1993, 1997; Krimsky and Plough,1988; National Research Council, 1989). One con-clusion is that public perceptions can be influencedby both expert opinion leaders and the mass mediaamong other factors.
A substantial body of work has been dedicatedto the psychological aspects of risk perception,uncovering a set of mental strategies or rules that allpeople use to simplify risk problems. Two of these
rules, known as heuristics, are particularly impor-tant (Covello, 1983). The first heuristic is that of‘information availability’ or the tendency to believethat an event or action occurs more frequently ifinstances are easy to imagine or recall. If the overalllevel of media coverage of the risks of a technologyincreases, then, this may increase the perceived like-lihood of those risks becoming manifest. The secondimportant heuristic is ‘representativeness’, or thetendency to assign comparable risk characteristicsand degrees to activities or events that are roughlysimilar, such as nuclear power and nuclear war.Representativeness is the basis for the assertion thatexposure to information about the risks of technolo-gies will increase the perceived riskiness of the tech-nology itself.
Studies by Slovic (1987) and Slovic et al.(1985) have shown that perceived risk is both quan-tifiable and predictable. Fitting different types ofrisks into a quantitative framework can reveal whichrisks are perceived in similar ways to one another.Most risks can be grouped in terms of two main fac-tors. First, the degree to which the risk is a ‘dread’risk: its consequences are catastrophic, uncontrol-lable, potentially fatal, not equitable in their distri-bution, pose high risk to future generations, are noteasily reduced and are involuntarily imposed.Second, the degree to which the risk is an unknownrisk: it is not observable, not evident to thoseexposed, its effects are delayed and not definitivelyknown to science. These two broad categories pro-vide the framework for a quantitative model of riskperception (see Fig. 18.1).
In a study based on this model, both nucleartechnologies and DNA technologies, includingagrobiotechnology, score high in both the dread riskand unknown risk factors, indicating that the risksassociated with these technologies are perceived insimilar ways (Slovic et al., 1985; Slovic, 1987).According to the heuristic principle of representa-tiveness mentioned above, exposure to informationabout risks associated with nuclear power will influ-ence the perceived risks of agrobiotechnology, andvice versa. It has been shown that unfortunate eventsor accidents involving technologies that score highin both the dread and the unknown categories areparticularly likely to produce broad social, politicaland policy consequences. That is, people are morelikely to consider higher order impacts when dealingwith these high-scoring risks, such as ethical andmoral or environmental factors or threats to futuregenerations that are not usually accounted for by
218 L.A. Marks et al.
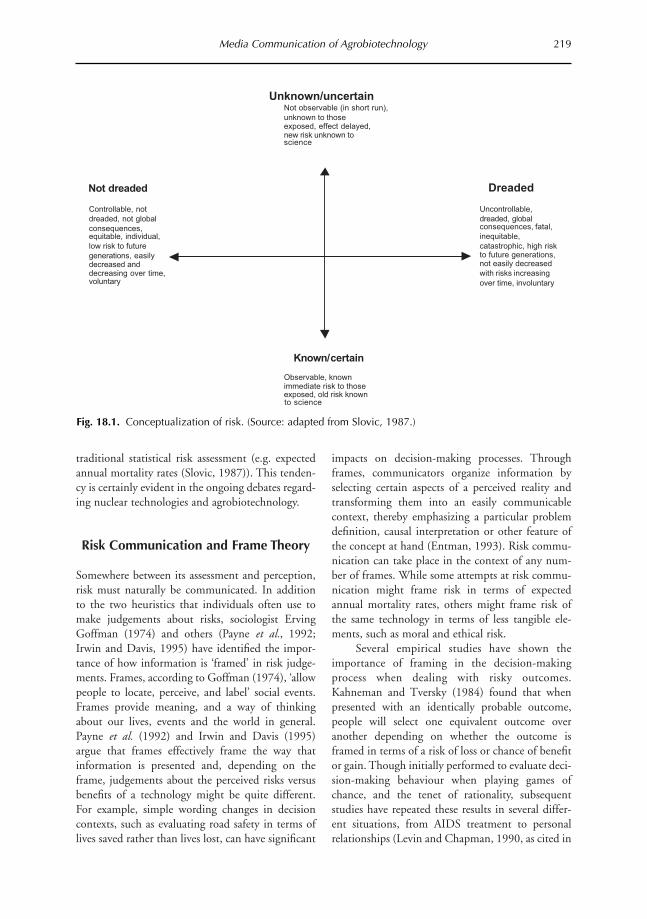
traditional statistical risk assessment (e.g. expectedannual mortality rates (Slovic, 1987)). This tenden-cy is certainly evident in the ongoing debates regard-ing nuclear technologies and agrobiotechnology.
Risk Communication and Frame Theory
Somewhere between its assessment and perception,risk must naturally be communicated. In additionto the two heuristics that individuals often use tomake judgements about risks, sociologist ErvingGoffman (1974) and others (Payne et al., 1992;Irwin and Davis, 1995) have identified the impor-tance of how information is ‘framed’ in risk judge-ments. Frames, according to Goffman (1974), ‘allowpeople to locate, perceive, and label’ social events.Frames provide meaning, and a way of thinkingabout our lives, events and the world in general.Payne et al. (1992) and Irwin and Davis (1995)argue that frames effectively frame the way thatinformation is presented and, depending on theframe, judgements about the perceived risks versusbenefits of a technology might be quite different.For example, simple wording changes in decisioncontexts, such as evaluating road safety in terms oflives saved rather than lives lost, can have significant
impacts on decision-making processes. Throughframes, communicators organize information byselecting certain aspects of a perceived reality andtransforming them into an easily communicablecontext, thereby emphasizing a particular problemdefinition, causal interpretation or other feature ofthe concept at hand (Entman, 1993). Risk commu-nication can take place in the context of any num-ber of frames. While some attempts at risk commu-nication might frame risk in terms of expectedannual mortality rates, others might frame risk ofthe same technology in terms of less tangible ele-ments, such as moral and ethical risk.
Several empirical studies have shown theimportance of framing in the decision-makingprocess when dealing with risky outcomes.Kahneman and Tversky (1984) found that whenpresented with an identically probable outcome,people will select one equivalent outcome overanother depending on whether the outcome isframed in terms of a risk of loss or chance of benefitor gain. Though initially performed to evaluate deci-sion-making behaviour when playing games ofchance, and the tenet of rationality, subsequentstudies have repeated these results in several differ-ent situations, from AIDS treatment to personalrelationships (Levin and Chapman, 1990, as cited in
Media Communication of Agrobiotechnology 219
Fig. 18.1. Conceptualization of risk. (Source: adapted from Slovic, 1987.)
Controllable, not
dreaded, not global
consequences, equitable, individual,
low risk to future
generations, easily decreased and decreasing over time, voluntary
Uncontrollable,
dreaded, global consequences, fatal,
inequitable,
catastrophic, high risk to future generations, not easily decreased
with risks increasing
over time, involuntary
Dreaded
Unknown/uncertain
Not observable (in short run),
unknown to those exposed, effect delayed, new risk unknown to science
Observable, known immediate risk to those exposed, old risk known to science
Not dreaded
Known/certain

Boon and Griffin, 1996). These studies imply thatthe framing of risks over time may affect opinionformation, to the extent that opinion is formed by aseries of decision-making events over an extendedperiod of time. As Slovic (1997) writes, ‘We nowknow that every form of presenting risk informationis a frame that has a strong influence on the decisionmaker.’
The Media’s Role in Framing Risk
The fact that risk frames can have such a pro-nounced impact on the decision-making processmeans that those responsible for providing informa-tion may influence perceptions and behaviour(Slovic et al., 1984). In some countries (the US forexample) the news media can serve as a primarysource of risk information to the general public(Schulz et al., 2000) in addition to the more trustedsources (i.e. the US Food and Drug Administration(FDA), the Environmental Protection Agency(EPA), American Medical Association). Even incountries such as the UK, where the media takes alesser role to other more trusted sources of informa-tion (doctors, nutritionists, consumer advocacygroups), the media is still found to play a role.
As frames, news stories offer the public defini-tions of social reality. In framing risk, the newsmedia may define the agenda of public concernabout a given technology, although there has beenconsiderable debate about the role of the media inthe formation of public opinion. Lang and Lang(1966: 468) observed that ‘the mass media forceattention to certain issues … They are constantlypresenting objects suggesting what individuals inthe mass should think about, know about, have feel-ings about.’ The agenda-setting function of themedia has been succinctly summed up by Cohen(1963: 13) who noted the press ‘may not be success-ful … in telling people what to think, but is stun-ningly successful in telling people what to thinkabout’.
Tuchman (1978) has pioneered the concept ofa ‘story frame’, the application of Goffman’s frametheory to the mass media. In reporting a story, jour-nalists turn an occurrence into a newsworthy event,a newsworthy event into a story, which is then com-municated to the public. Journalists and editorsadjust frames according to their own understanding,their ideologies, styles and practical limitations suchas deadlines and space (Best, 1990, 1991). Writing
on science and technology can thus emphasize sci-entific facts, their sociopolitical implications, envi-ronmental risks, human health concerns and so on(Hornig, 1990).
News, like all public documents, is a con-structed reality, assembling facts and informationwithin a narrative structure, or frame, that serves tocommunicate an event or story to the reader(Tuchman, 1976). Through frames, media highlightcertain points of view and marginalize or ignore oth-ers, defining occurrences and explaining how theyare to be understood (Hornig, 1993). Science sto-ries, for example, can emphasize scientific facts anddiscoveries, or their sociopolitical implications(Horning, 1990). A technology’s potential risk tothe environment can be highlighted, while itspotential economic benefits are ignored, or viceversa, depending on the story frame. Analysis ofhow the media has framed the different risks andbenefits of biotechnology can be systematically con-ducted using media content analysis. What followsis a brief outline of content analysis before a discus-sion of our methodological approach and results.
Media Content Analysis
‘Content analysis is a systematic method for analyz-ing and quantifying message content and messagehandling. It is a tool for observing and analyzing theovert communication behaviour of selected commu-nicators’ (Budd et al., 1967: 2). Instead of solicitingpeople’s behaviour directly (through interviews), ormeasuring response to specific events or stimuli,content analysis may be used to analyse communi-cations that people have produced as accounts ofbehaviour (Kerlinger, 1964).
The main advantage of the approach is that itallows the investigator to observe public messages atany time and place of the investigator’s choosing. Inaddition, with the increasing availability of electron-ic data sources and computing power, contentanalysis opens up possibilities to analyse trends overlonger periods of time and with a larger geographi-cal scope than before.
The main disadvantage to content analysis isthe possibility of inter-coder bias if text is manuallycoded. Second, data collection, coding and analysisof the data are very tedious and time-consuming.Inter-coder reliability and manual coding can bereduced or eliminated by computer processing oftext. If manual coding is needed, inter-coder bias
220 L.A. Marks et al.

can be reduced or eliminated through careful con-struction of the coding categories and coder training(Budd et al., 1967; Risse et al., 1998). However,data collection is still time-consuming, even withnew electronic databases.
Methodological Approach
We use Slovic’s model of risk perception to analysebiosafety and food safety frames in reporting of agri-cultural biotechnology in UK and US newspapers.The period of coverage is from 1990 to 1999.
Sampling technique
A comprehensive database of all articles related toagricultural and food applications of biotechnology,published in the selected media, was developedbased on an exhaustive list of keywords. Both ani-mal and plant biotechnology applications areincluded in the population of articles. Electronicdata sources were searched, resulting in a compre-hensive electronic database of articles.
Figure 18.2 details coverage of agrobiotechnol-ogy by newspaper for the period of coverage1990–1999. All newspapers have trended upwardsover time; however, coverage of agricultural biotech-nology issues has increased dramatically in UKnewspapers since 1998, reflecting the intense debate
that has taken place about the technology in theUK.
Categorization and coding of data
The most important step in content analysis is theidentification and categorization of the variablesunder study. Categories, such as subject matter ordirection categories, serve the same function as vari-ables in content analysis. As Budd et al. (1967)argue, ‘no content analysis is better than its cate-gories’. Variables (categories) must be definedthrough an operational definition or set of defini-tions. These definitions should allow for systematicobservation that implies reliability and repeatability.In addition, these categories must be exhaustive andmutually exclusive.
In this research, two coding categories weredeveloped across the food safety and biosafetyframes; namely, associated ‘benefits’ and ‘catastroph-ic and memorable events’ in reporting of the tech-nology. It is well documented in the decision andpsychometric literature that individuals are willingto trade-off potential benefits versus risks of differ-ing technologies. Tolerance of even very minor risksmay be small if individuals perceive no benefits asso-ciated with the risk (Frewer, 1999). On the otherhand, very high benefits accruing to the risk-bearerscan mitigate relatively high associated risks (Slovic,1987).
Media Communication of Agrobiotechnology 221
Fig. 18.2. Coverage of agrobiotechnology by paper, 1990–1999.
0
50
100
150
200
250
1990 1991 1992 1993 1994 1995 1996 1997 1998 1999
Art
icle
s
Washington Post Wall Street Journal USA Today
Daily Telegraph The Times
Year

Coding and Context Units
Several different types of coding unit can be used toconduct content analysis, for example, words, asser-tions, themes and character units can all be counted.Words and phrases were used in this study becausecoding can be done electronically and word count-ing is objective. The contextual unit was words‘before’ and ‘after’ the word or phrase included ineach category. Hence, key-word-in-context (KWIC)analysis was used. Words or word phrases wereincluded in categorical dictionaries that served tomeasure the degree of reporting on a specific bene-fit/risk frame. The dictionary capturing health andrelated benefits of GM foods included phrases suchas ‘enhanced flavour’, ‘food-fortification’, ‘abundantfood supply’, ‘cheaper food’, ‘cleaner food’ and soon. Catastrophic and memorable events related tohealth safety included the ‘Alar scare’, the ‘mad cowdisaster’, the ‘BGH scare’, the ‘dioxin scare’, the‘Jack-in-the-Box scare’ and so on. Biosafety benefitsincluded phrases such as ‘chemical free pesticides’,‘cut pesticide use’, ‘eliminate the need for chemicals’,
‘reduce cultivation of the land’, ‘reduce soil erosion’and so on. Catastrophic and memorable eventslinked to biosafety included ‘Chernobyl’, ‘DDT’,‘Bhopal’, the ‘Exxon Valdez’, ‘Three Mile Island’,‘Times Beach’, the ‘Monarch Butterfly’, the extinc-tion of the ‘Dodo’ and so on.
Empirical Results
Food benefits and safety risks
Table 18.1 shows frequencies of words related tofood safety by category and paper for the entire timeperiod 1990–1999. Some general observations canbe made about the frequencies in Table 18.1. First,the overall frequency of words is small as the objec-tive but restraining coding dictionary limits thenumber of countable words. Furthermore, foodsafety is just one of several frames reported by themedia. When a much broader categorization of con-tent is used (such as unfavourable or favourable con-tent) then frequencies are much higher (see Marks etal., 1999). Despite the low frequency of reporting,the categorical variables provide a good indicator ofoverall coverage. Second, overall reporting of foodbenefits from biotechnology exceeds reporting offood risks for all papers except the Daily Telegraph.Reporting in The Times and the Daily Telegraph hasregularly linked agrobiotechnology to memorablefood safety lapses. Hence, this is quantitative evi-dence that the UK media has indeed reported moreheavily on the food safety risks associated withbiotechnology over its potential benefits.
222 L.A. Marks et al.
Table 18.1. Frequency of words by frame(1990–1999).
National daily GM-food Catastrophic andnewspaper benefits memorable events
The Times 312 210Daily Telegraph 161 263Washington Post 181 45USA Today 89 18Wall Street Journal 233 43
Fig. 18.3. Coverage of food safety risks (catastrophic and memorable events) in the UK.
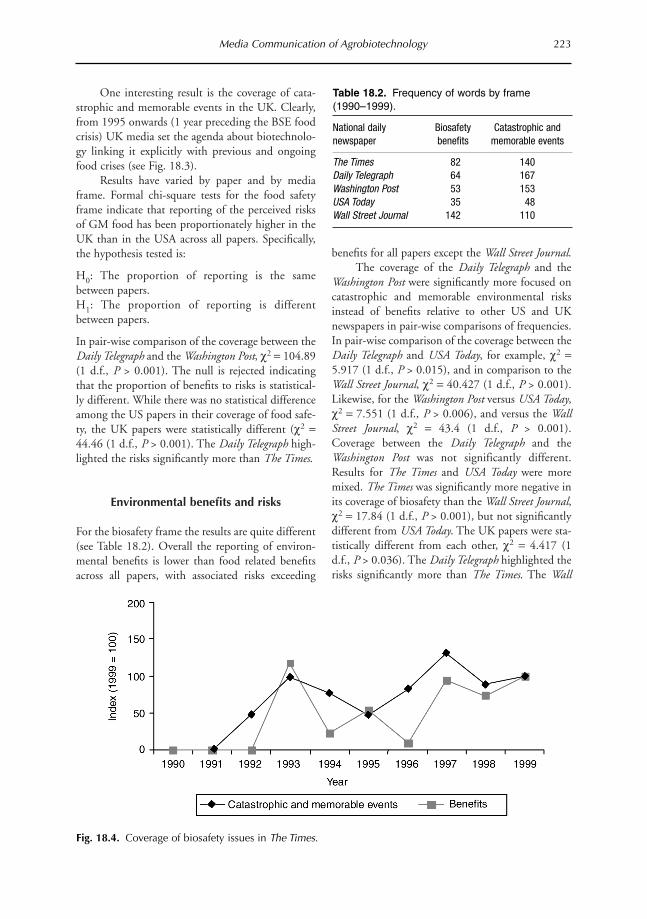
One interesting result is the coverage of cata-strophic and memorable events in the UK. Clearly,from 1995 onwards (1 year preceding the BSE foodcrisis) UK media set the agenda about biotechnolo-gy linking it explicitly with previous and ongoingfood crises (see Fig. 18.3).
Results have varied by paper and by mediaframe. Formal chi-square tests for the food safetyframe indicate that reporting of the perceived risksof GM food has been proportionately higher in theUK than in the USA across all papers. Specifically,the hypothesis tested is:
H0: The proportion of reporting is the samebetween papers.H1: The proportion of reporting is differentbetween papers.
In pair-wise comparison of the coverage between theDaily Telegraph and the Washington Post, c2 = 104.89(1 d.f., P > 0.001). The null is rejected indicatingthat the proportion of benefits to risks is statistical-ly different. While there was no statistical differenceamong the US papers in their coverage of food safe-ty, the UK papers were statistically different (c2 =44.46 (1 d.f., P > 0.001). The Daily Telegraph high-lighted the risks significantly more than The Times.
Environmental benefits and risks
For the biosafety frame the results are quite different(see Table 18.2). Overall the reporting of environ-mental benefits is lower than food related benefitsacross all papers, with associated risks exceeding
benefits for all papers except the Wall Street Journal.The coverage of the Daily Telegraph and the
Washington Post were significantly more focused oncatastrophic and memorable environmental risksinstead of benefits relative to other US and UKnewspapers in pair-wise comparisons of frequencies.In pair-wise comparison of the coverage between theDaily Telegraph and USA Today, for example, c2 =5.917 (1 d.f., P > 0.015), and in comparison to theWall Street Journal, c2 = 40.427 (1 d.f., P > 0.001).Likewise, for the Washington Post versus USA Today,c2 = 7.551 (1 d.f., P > 0.006), and versus the WallStreet Journal, c2 = 43.4 (1 d.f., P > 0.001).Coverage between the Daily Telegraph and theWashington Post was not significantly different.Results for The Times and USA Today were moremixed. The Times was significantly more negative inits coverage of biosafety than the Wall Street Journal,c2 = 17.84 (1 d.f., P > 0.001), but not significantlydifferent from USA Today. The UK papers were sta-tistically different from each other, c2 = 4.417 (1d.f., P > 0.036). The Daily Telegraph highlighted therisks significantly more than The Times. The Wall
Media Communication of Agrobiotechnology 223
Table 18.2. Frequency of words by frame (1990–1999).
National daily Biosafety Catastrophic andnewspaper benefits memorable events
The Times 82 140Daily Telegraph 64 167Washington Post 53 153USA Today 35 48Wall Street Journal 142 110
Fig. 18.4. Coverage of biosafety issues in The Times.
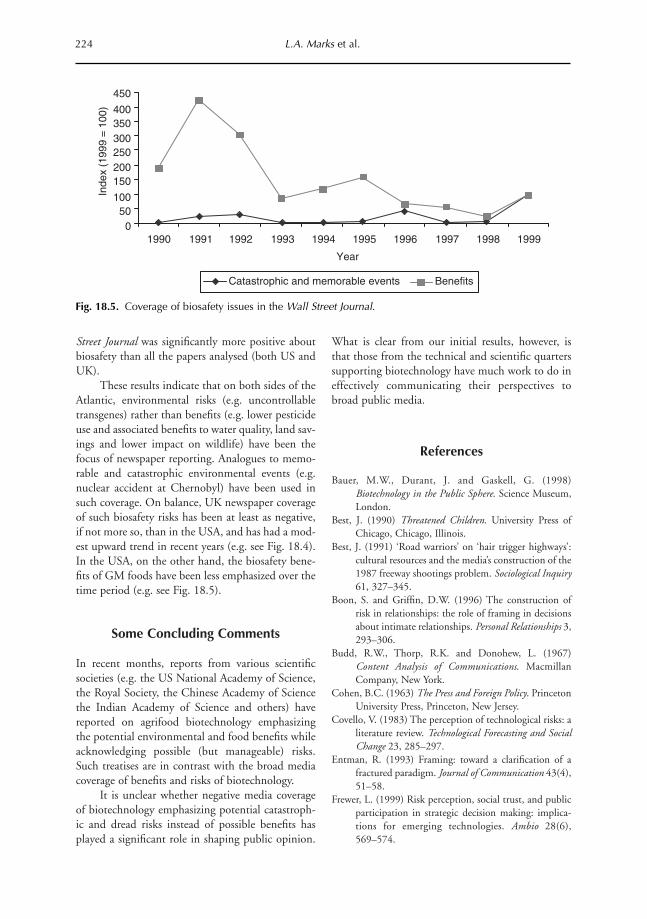
Street Journal was significantly more positive aboutbiosafety than all the papers analysed (both US andUK).
These results indicate that on both sides of theAtlantic, environmental risks (e.g. uncontrollabletransgenes) rather than benefits (e.g. lower pesticideuse and associated benefits to water quality, land sav-ings and lower impact on wildlife) have been thefocus of newspaper reporting. Analogues to memo-rable and catastrophic environmental events (e.g.nuclear accident at Chernobyl) have been used insuch coverage. On balance, UK newspaper coverageof such biosafety risks has been at least as negative,if not more so, than in the USA, and has had a mod-est upward trend in recent years (e.g. see Fig. 18.4).In the USA, on the other hand, the biosafety bene-fits of GM foods have been less emphasized over thetime period (e.g. see Fig. 18.5).
Some Concluding Comments
In recent months, reports from various scientificsocieties (e.g. the US National Academy of Science,the Royal Society, the Chinese Academy of Sciencethe Indian Academy of Science and others) havereported on agrifood biotechnology emphasizingthe potential environmental and food benefits whileacknowledging possible (but manageable) risks.Such treatises are in contrast with the broad mediacoverage of benefits and risks of biotechnology.
It is unclear whether negative media coverageof biotechnology emphasizing potential catastroph-ic and dread risks instead of possible benefits hasplayed a significant role in shaping public opinion.
What is clear from our initial results, however, isthat those from the technical and scientific quarterssupporting biotechnology have much work to do ineffectively communicating their perspectives tobroad public media.
References
Bauer, M.W., Durant, J. and Gaskell, G. (1998)
Biotechnology in the Public Sphere. Science Museum,
London.
Best, J. (1990) Threatened Children. University Press of
Chicago, Chicago, Illinois.
Best, J. (1991) ‘Road warriors’ on ‘hair trigger highways’:
cultural resources and the media’s construction of the
1987 freeway shootings problem. Sociological Inquiry61, 327–345.
Boon, S. and Griffin, D.W. (1996) The construction of
risk in relationships: the role of framing in decisions
about intimate relationships. Personal Relationships 3,
293–306.
Budd, R.W., Thorp, R.K. and Donohew, L. (1967)
Content Analysis of Communications. Macmillan
Company, New York.
Cohen, B.C. (1963) The Press and Foreign Policy. Princeton
University Press, Princeton, New Jersey.
Covello, V. (1983) The perception of technological risks: a
literature review. Technological Forecasting and SocialChange 23, 285–297.
Entman, R. (1993) Framing: toward a clarification of a
fractured paradigm. Journal of Communication 43(4),
51–58.
Frewer, L. (1999) Risk perception, social trust, and public
participation in strategic decision making: implica-
tions for emerging technologies. Ambio 28(6),
569–574.
224 L.A. Marks et al.
Fig. 18.5. Coverage of biosafety issues in the Wall Street Journal.
0
50 100
150 200 250 300 350 400
450
1990 1991 1992 1993 1994 1995 1996 1997 1998 1999
Inde
x (1
999
= 1
00)
Catastrophic and memorable events Benefits
Year
Goffman, E. (1974) Frame Analysis. Harper & Row, New
York.
Hornig, S. (1990) Science stories: risk, power, and per-
ceived emphasis. Journalism Quarterly 67(4),
767–776.
Hornig, S. (1993) Reading risk: public response to print
media accounts of technological risk. PublicUnderstanding of Science 2, 95–109.
Irwin, J.R. and Davis, J.H. (1995) Choice/matching pref-
erence reversals in groups: consensus processes and
justification-based reasoning. OrganizationalBehaviour and Human Decision Processes 64(3),
325–339.
Kahneman, D. and Tversky, A. (1984) Choices, values,
and frames. American Psychologist 39(4), 341–350.
Kates, R. and Kasperson, J. (1983) Comparative risk
analysis of technological hazards (A Review).
Proceedings of the National Academy of Science, USA80, 7027–7038.
Kerlinger, F.N. (1964) Foundations of Behavioral Research.
Holt, Rinehart and Winston, New York.
Krimsky, S. and Plough, A. (1988) The release of geneti-
cally engineered organisms into the environment: the
case of ice minus. In: Environmental Hazards:Communicating Risks as a Social Process. Auburn
House Publishing Company, Dover, Massachusetts.
Lang, K. and Lang, G.E. (1966) The mass media and vot-
ing. In: Berelson, B. and Janowitz, M. (eds), Readerin Public Opinion and Communication, 2nd edn.
Free Press, New York.
Levin, I. and Chapman, D. (1990) Risk taking, frame of
reference, and characterization of victim groups in
AIDS treatment decisions. Journal of ExperimentalSocial Psychology 26, 421–434.
Marks, L.A., Kalaitzandonakes, N. and Zakharova, L.
(1999) Public opinion of agrobiotechnology in the
US and Europe: a content analysis approach. Paper
presented at the 1999 American Agricultural
Economics Association (AAEA) Annual Meetings,
Nashville, Tennessee. www.agecon.lib.umn.edu/cgi-
bin/pdf_view.pl?paperid=1495
National Research Council (1989) Improving RiskCommunication from the National Research Council.National Academy Press, Washington, DC.
Payne, J.W., Bettman, J.R. and Johnson, E.J. (1992)
Behavorial decision research: a constructive process-
ing perspective. Annual Review of Psychology 43,
87–131.
Risse, D., Lacy, F. and Fico, F. (1998) Analyzing MediaMessages: Using Quantitative Content Analysis inResearch. Erlbaum, Mahawaha, New Jersey.
Schulz, S., Burkink, T. and Marquardt, R. (2000)
Consumer opinions toward the use of food made
with genetically modified (GM) ingredients. Paper
presented at the International Food and Agribusiness
Management Association (IAMA) 2000 Agribusiness
Forum, Chicago, Illinois. www.agecon.tamu.edu/
iama/2000Congress/Forum%20%20Final%20
PAPERS/Area%2011/Schulz_Steven.PDF
Slovic, P. (1987) Perceptions of risk. Science 236, 280–285.
Slovic, P. (1993) Perceived risk, trust, and democracy. RiskAnalysis 13(6), 675–682.
Slovic, P. (1997) Trust, emotions, sex, politics, and science.
In: Bazerman, M., Messick, D., Tenbrunsel, A. and
Wade-Benzoni, K. (eds) Environment, Ethics, andBehavior. The New Lexington Press, San Francisco,
California.
Slovic, P., Fischoff, B. and Lichtenstein, S. (1984)
Behavioral decision theory perspectives on risk and
safety. Acta Psychologica 56, 183–203.
Slovic, P., Fischoff, B. and Lichtenstein, S. (1985)
Characterizing perceived risk. In: Kates, R.,
Hohenernser, C. and Kasperson, J. (eds) PerilousProgress: Managing the Hazards of Technology.
Westview Press, Boulder, Colorado, pp. 91–125.
Tuchman, G. (1976) Telling stories. Journal ofCommunication 26(4), 93–97.
Tuchman, G. (1978) Making News: a Study in theConstruction of Reality. Collier MacMillan, London.
Wimmer, R.D. and Dominick, J.R. (1987) Mass MediaResearch: an Introduction, 2nd edn. Wadsworth
Publishing Company, Belmont, California.
Media Communication of Agrobiotechnology 225

Introduction
The development of crops tolerant to the herbicideglyphosate (Roundup) began in the early 1980s. Thefirst generation of glyphosate tolerant soybeans wasgrown in a greenhouse during the winter of1990–1991, the seeds of which were then planted infield tests during the summer of 1991 (Padgette etal., 1996a). Approvals for commercialization ofglyphosate tolerant soybeans were granted by FDAand USDA in 1994 and by EPA in 1995. Glyphosatetolerant soybeans, commonly known as ‘RoundupReady’ soybeans, were first made available for plant-ing by US farmers in 1996.
Glyphosate tolerant soybean varieties havebeen widely adopted by US growers. Figure 19.1shows adoption of glyphosate tolerant soybeanssince 1996 in the USA. By 2000, growers planted54% of US soybean acreage to glyphosate tolerantsoybeans (USDA NASS, 2000a).
Glyphosate controls weeds by inhibiting theenzyme 5-enolpyruvylshikimate-3-phosphate syn-thase (EPSPS), which catalyses the synthesis ofamino acids essential for survival of plants and bac-teria. EPSPS is present in plants, bacteria and fungi,but not animals, as animals do not make their ownaromatic amino acids but rather receive them fromplant, microbial or animal-derived foods.
Several bacteria exhibit tolerance to glyphosate.A glyphosate tolerant EPSPS from the soil bacterium
Agrobacterium sp. strain CP4 was isolated and intro-duced into the genome of a soybean cultivar usingthe particle acceleration method. DNA is coated onto microscopic gold particles, which are then acceler-ated and penetrate target plant cells. Resulting cellsare then incubated to produce shoots, which willeventually grow into mature plants. Successfullytransformed plants are selected that exhibit unalteredagronomic traits from the parent line.
Soybean is the second largest crop in the USAafter maize, planted on 30 million hectares in 2000(USDA NASS, 2000a). Area planted to soybean hasexpanded in recent years owing to several factors.Improved yields through variety improvements,adoption of moisture-saving no-till practices, strongsoybean prices relative to other crops, and elimina-tion of acreage reduction programmes are all factorsthat have contributed to expanded plantings. Totalsoybean crop value in 1999 was US$13,000 million(USDA ERS, 1999).
Soybean acreage is centred on the Midwesternstates, though 30 states have significant acreageplanted to soybeans each year. Illinois and Iowa eachplant over 4 million hectares of soybeans. Othermajor soybean states include Minnesota, Indiana,Missouri and Ohio.
The USA is the largest producer of soybeans inthe world, growing nearly half of the total worldsoybean crop. Other major producing countriesinclude Brazil, China and Argentina. The USA
227
19 Case Study in Benefits and Risks ofAgricultural Biotechnology: Roundup Ready
Soybeans
Janet E. Carpenter and Leonard P. GianessiNational Center for Food and Agricultural Policy, Washington, DC, USA
© CAB International 2002. Market Development for Genetically Modified Foods(eds V. Santaniello, R.E. Evenson and D. Zilberman)
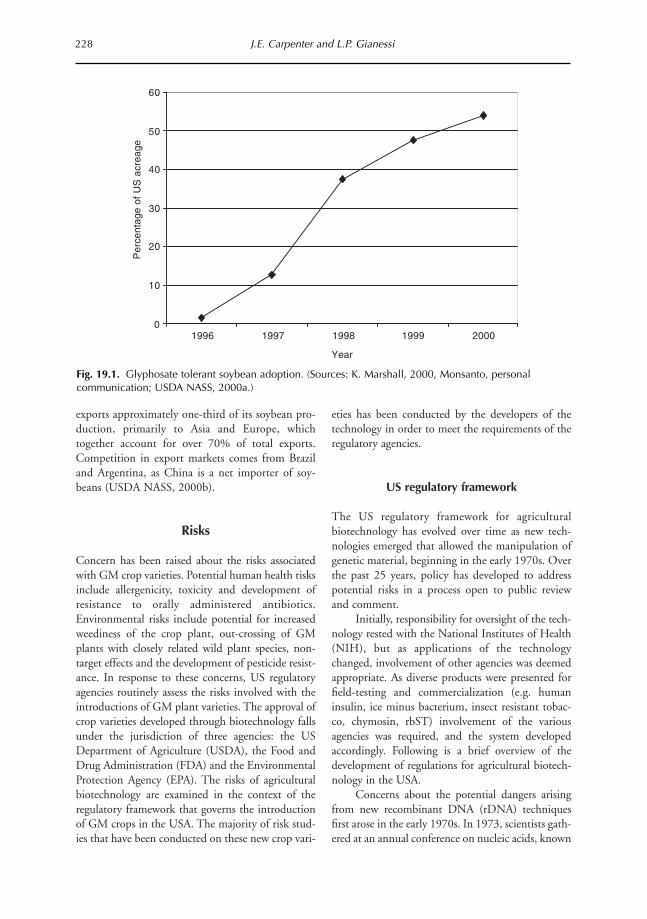
exports approximately one-third of its soybean pro-duction, primarily to Asia and Europe, whichtogether account for over 70% of total exports.Competition in export markets comes from Braziland Argentina, as China is a net importer of soy-beans (USDA NASS, 2000b).
Risks
Concern has been raised about the risks associatedwith GM crop varieties. Potential human health risksinclude allergenicity, toxicity and development ofresistance to orally administered antibiotics.Environmental risks include potential for increasedweediness of the crop plant, out-crossing of GMplants with closely related wild plant species, non-target effects and the development of pesticide resist-ance. In response to these concerns, US regulatoryagencies routinely assess the risks involved with theintroductions of GM plant varieties. The approval ofcrop varieties developed through biotechnology fallsunder the jurisdiction of three agencies: the USDepartment of Agriculture (USDA), the Food andDrug Administration (FDA) and the EnvironmentalProtection Agency (EPA). The risks of agriculturalbiotechnology are examined in the context of theregulatory framework that governs the introductionof GM crops in the USA. The majority of risk stud-ies that have been conducted on these new crop vari-
eties has been conducted by the developers of thetechnology in order to meet the requirements of theregulatory agencies.
US regulatory framework
The US regulatory framework for agriculturalbiotechnology has evolved over time as new tech-nologies emerged that allowed the manipulation ofgenetic material, beginning in the early 1970s. Overthe past 25 years, policy has developed to addresspotential risks in a process open to public reviewand comment.
Initially, responsibility for oversight of the tech-nology rested with the National Institutes of Health(NIH), but as applications of the technologychanged, involvement of other agencies was deemedappropriate. As diverse products were presented forfield-testing and commercialization (e.g. humaninsulin, ice minus bacterium, insect resistant tobac-co, chymosin, rbST) involvement of the variousagencies was required, and the system developedaccordingly. Following is a brief overview of thedevelopment of regulations for agricultural biotech-nology in the USA.
Concerns about the potential dangers arisingfrom new recombinant DNA (rDNA) techniquesfirst arose in the early 1970s. In 1973, scientists gath-ered at an annual conference on nucleic acids, known
228 J.E. Carpenter and L.P. Gianessi
Fig. 19.1. Glyphosate tolerant soybean adoption. (Sources: K. Marshall, 2000, Monsanto, personalcommunication; USDA NASS, 2000a.)
0
10
20
30
40
50
60
1996 1997 1998 1999 2000
Per
cent
age
of U
S a
crea
ge
Year

as the Gordon Conference, heard descriptions ofexperiments where DNA molecules from diversesources were joined. By the end of the conference,many attendees had voiced reservations about theethical and moral problems as well as the safety issuesthat might arise from the technology. The conferenceattendees voted that a letter should be sent to theNational Academy of Sciences pointing out that aproblem had been raised meriting investigation(Goodfield, 1977). It was also decided to go publicwith the issue, by publishing their letter in Science on21 September 1973 (Singer and Soll, 1973). Theletter noted that although no hazards had yet beenestablished, ‘prudence suggests that the potentialhazards be seriously considered’, and suggested thatthe Academies establish a study committee on thesubject to recommend specific actions or guidelinesas appropriate.
The National Academy of Sciences quicklyconvened a committee in 1974, publishing the rec-ommendations in Science in July of that year (Berg etal., 1974). The committee recommended that threetypes of experiments be deferred until the potentialhazards were better evaluated or until adequatemethods were developed for preventing the spread ofbiologically active recombinant DNA molecules:constructing replicating plasmids that would intro-duce either antibiotic resistance or bacterial poisonsinto bacterial strains; linking DNA from likely can-cer-causing viruses to bacterial plasmids; and thelinking of fragments of animal DNA to bacterialplasmid DNA or bacteriophage DNA. The commit-tee also suggested that the director of NIH establishan advisory committee to develop an experimentalprogramme to evaluate the hazards, develop proce-dures that would minimize the spread of such mole-cules within populations and devise guidelines to befollowed by investigators. They also called for aninternational meeting of scientists to further discussappropriate ways to deal with the potential biohaz-ards of recombinant DNA molecules.
The Asilomar Conference was held in 1975,convening nearly 140 international scientists to‘review scientific progress in research on recombinantDNA molecules and to discuss appropriate ways todeal with the potential biohazards involved’ (Berg etal., 1975). The recommendations of the conferenceconsolidated and extended those of the NationalAcademy of Sciences Committee.
The Recombinant Molecules AdvisoryCommittee (RAC) of the NIH began meeting assoon as the Asilomar Conference ended, working on
research safety issues of experimental facilities andpersonnel, as well as of the proposed experimentsthemselves. In February 1976, the director of NIHcalled a public hearing in response to increased pub-lic interest in the subject. Four months later, in June1976, NIH published its final guidelines for labora-tories conducting recombinant experiments underfederal grants (Goodfield, 1977).
As a standing committee, the RAC meets peri-odically to address and incorporate emerging scien-tific understanding of the potential risks involvedwith rDNA technologies. By 1983, experience withrDNA had allayed many fears, and NIH guidelineshad been successively weakened to allow experimentsthat had been delayed awaiting better understandingof the associated risks. NIH had become comfortablewith the vast majority of ongoing basic and biomed-ical research (Thompson, 1987). Risk assessmentwork helped to assure the scientific community andthe public that many rDNA experiments were not ashazardous as originally believed (Korwek, 1997).
Although the NIH Guidelines govern only fed-erally funded research, private industry and tradeassociations generally abide by the Guidelines aswell. Through institutional biosafety committees,private industry reviews risk and ethical concerns ofprospective research areas, referring any questions tothe RAC for advice and consultation. It is believedthat individuals and institutions that are not requiredto follow the NIH Guidelines do so for legal liabili-ty concerns. A 1987 General Accounting Officereport found that private companies appeared to fol-low the Guidelines more closely than public sectororganizations (Korwek, 1997).
The landscape of risk issues changed in theearly 1980s as genetic engineering was to move outof the laboratory and into agricultural fields with thedevelopment of ‘ice minus’, a genetically altered bac-terium intended for use on a variety of crops toreduce the risk of freezing. The regulation of a prod-uct that was to be purposely introduced into theenvironment presented quite a different set of issuesfrom those involved with laboratory experimenta-tion, the risks of which were controlled primarily bycontaining engineered materials and insuring againstintroduction into the environment.
Originally proposed in 1983, field testing of‘ice minus’ was delayed through a series of legal chal-lenges for 4 years. During this time, the authority ofNIH over field tests was questioned, and EPA,USDA and FDA were proposed as the appropriatebodies for regulating in this area. The lack of coordi-
Case Study in Benefits and Risks of Agricultural Biotechnology 229
nation and uncertainty about oversight of biotech-nology led to the formation of an interagency work-ing group under the White House Cabinet Councilon Natural Resources and the Environment. Theworking group was composed of approximately 13member agencies, as an interagency effort to reviewregulatory requirements for conventional technolo-gies, to clarify regulatory requirements for new prod-ucts and to determine whether current regulatoryrequirements were adequate. Initial results of theworking group were published for public commentin the Federal Register in 1984 (OSTP, 1984). TheOffice of Science and Technology Policy (OSTP)published its final notice of how each agency wouldregulate biotechnology applications in 1986, in thepolicy that would become commonly known as the‘Coordinated Framework’ (OSTP, 1986). In thisnotice, existing laws were deemed adequate to over-see modern biotechnology applications. The noticealso set forth which regulatory bodies were designat-ed as the lead agency where the possibility of dupli-cation of oversight existed (Korwek, 1997). USDA isthe lead agency for plants grown to produce food orfeed crops, while the food or feed itself is subject toregulation by FDA. EPA would primarily handlepesticide microorganisms. Notably, the initial policyof EPA addressed microbial pesticides, but did notaddress the regulation of pesticidal plants, which hadnot yet been developed at that point.
EPA, USDA and FDA each issued statementsoutlining their regulatory policy, which were incorpo-rated into the Coordinated Framework. A commontheme in the policies of all three agencies is the con-cept of product- not process-based risk assessment,based on the conclusion that the risks associated withthe introduction of rDNA-engineered organisms arethe same as those associated with introductions ofunmodified organisms and those modified by othermethods. This concept was supported by threereports, issued by the National Academy of Sciencesand the National Research Council.
The first report was published in 1987, entitledIntroduction of Recombinant DNA-engineeredOrganisms into the Environment: Key Issues, whichconcluded that the risks associated with the intro-duction of genetically engineered organisms werethe same as those associated with introductions ofunmodified organisms and those modified by othermethods. In 1989, the National Research Council(NRC) issued Field Testing Genetically ModifiedOrganisms: Framework for Decisions, which morespecifically addressed the scientific foundation for
regulatory decisions governing the release of geneti-cally engineered microorganisms and plants into theenvironment. The 1989 report further supportedthe concept of the product not process-based stan-dard for oversight put forth in the 1987 study. In2000, the NRC released a report entitled GeneticallyModified Pest-protected Plants: Science andRegulation, the purpose of which was primarily toevaluate the EPA’s regulatory system for pesticidalplants. In the 2000 report, the committee was criti-cal of EPA’s policy of exemptions for plant varietiesproduced using particular methods.
The scope of regulation was the subject of areview prepared by the White House Council onCompetitiveness, published in 1990 for public com-ment in the Federal Register. This document exclud-ed from regulation organisms developed by tradi-tional techniques, though the document did notpropose any rules. The Council later published fourprinciples of regulatory review for biotechnology anda report on national biotechnology policy. Thesepublications, along with the final scope document,published in 1992, articulated a risk-based approachto regulation.
USDA
The USDA Animal and Plant Health InspectionService (APHIS) is responsible for protecting USagriculture from pests and diseases. Under theFederal Plant Pest Act, USDA retains the authorityto regulate plant pests and other articles to preventdirect or indirect injury, disease, or damage to plants,plant products and crops. In 1987, USDA publishedregulations that finalized the rule that was proposedunder the Coordinated Framework (USDA APHIS,1987). The requirements extended regulationsimposed by APHIS for non-genetically engineeredorganisms or products which are plant pests or couldharbour plant pests. APHIS promulgated these newregulations because it deemed that the existing regu-lations did not provide any way to determinewhether or not a genetically engineered organism orproduct would fall under existing regulations ofplant pests. The rule specifically notes that APHIS isnot treating genetically engineered organisms andproducts differently from non-genetically engineeredorganisms. These regulations were amended in 1993and 1997 (USDA APHIS, 1993a, 1997).
The regulations provide the rationale for deter-mining whether a genetically engineered organism or
230 J.E. Carpenter and L.P. Gianessi

product would be considered a ‘regulated article’,that is one with plant pest characteristics, and alsocalls for additional data for making a determinationon the plant pest status of certain genetically engi-neered organisms or products. A genetically engi-neered organism is deemed a regulated article eitherif the donor organism, recipient organism or vectoragent used in engineering the organism is listed inthe regulation and is also a plant pest, is unclassified,or if APHIS has reason to believe that the genetical-ly engineered organism presents a plant pest risk.This criterion for determining whether a particularmodified plant is subject to regulation by APHIS wascriticized in the recent National Research Councilreport, which noted that some pest-protected plantvarieties did not fall under its scope given the defini-tion of regulated article (NRC, 2000).
APHIS is responsible for approving introduc-tions of GM crops at two stages: for field trials andfor full market release. Prior to conducting fieldtrials, it is necessary to either obtain a permit ornotify APHIS. The notification option was estab-lished in 1993 for certain regulated articles withwhich the department is familiar, provided that theintroduction is conducted in accordance with estab-lished requirements and standards (USDA APHIS,1993a).
APHIS regulations also provide for a petitionprocess for the determination of non-regulated sta-tus, which allows the unregulated movement andrelease of the product. In the petition for non-regu-lated status, applicants must ‘describe known andpotential differences from the unmodified recipientorganism that would substantiate that the regulatedarticle is unlikely to pose a greater plant pest riskthan the unmodified organism from which it wasderived’ (USDA APHIS, 1993a).
Environmental assessments are prepared forfield tests, and for petitions for non-regulated status.These assessments detail the nature of the geneticmodification and assess the potential for environ-mental impacts from the introduction of the cropvarieties into the environment. When a product isapproved for full release, a Determination of Non-regulated Status is published in the Federal Register.
Lack of plant pest risk may be concluded whenthere is evidence that the plant under consideration:(i) exhibits no plant pathogenic properties; (ii) is nomore likely to become a weed than its non-engi-neered parental varieties; (iii) is unlikely to increasethe weediness potential for any other cultivated plantor native wild species with which the organism can
interbreed; (iv) does not cause damage to processedagricultural commodities; and (v) is unlikely to harmother organisms, such as bees, that are beneficial toagriculture.
APHIS received a petition from Monsanto on15 September 1993, seeking a determination fromAPHIS that glyphosate-tolerant soybean (GTS) line40-3-2 and its progeny do not present a plant pestrisk and are therefore not regulated articles (Re et al.,1993). On 6 December 1993, APHIS announcedreceipt of the Monsanto petition in the FederalRegister, stating that the petition was available forpublic review (USDA APHIS, 1993b).
APHIS received 33 comments on theMonsanto petition. With one exception, the com-ments were favourable to the petition. The oneunfavourable comment stated that USDA shouldnot approve the Monsanto petition or any otherpetition until the federal government has revised itsoversight programme for transgenic crops at thecommercialization stage, including establishment ofstandardized assessment and data collection schemesfor consideration of risks of transgenic crops toecosystems in the USA and worldwide, with partic-ular attention to centres of diversity for food andfibre crops. The commenter also expressed the viewthat development of herbicide-tolerant crops shouldnot be encouraged because they increase farmers’dependence on chemical herbicides (USDA APHIS,1994b).
The Roundup Ready gene contained in GTSline 40-3-2 is a single insert of DNA comprising theenhanced 35S promoter derived from cauli-flower mosaic virus, the chloroplast transit peptidecoding sequence from Petunia hybrida fused tothe 5-enolpyruvylshikimate-3-phosphate synthase(EPSPS) gene derived from Agrobacterium sp. strainCP4, and the nopaline synthase 3’ terminator fromAgrobacterium tumefaciens.
GTS line 40-3-2 has been considered a ‘regu-lated article’ because it contains components fromorganisms that are known plant pathogens: the bac-terium A. tumefaciens and cauliflower mosaic virus.Field testing of GTS line 40-3-2 had been conduct-ed with APHIS approval since 1991. Monsanto sub-mitted its petition after the completion of field testsof GTS line 40-3-2 under nine APHIS permits.These permitted field tests took place at approxi-mately 54 sites in 19 states and Puerto Rico.Additional trials were conducted in the USA andPuerto Rico under permit and notification duringthe 1993 growing season. All field trials were per-
Case Study in Benefits and Risks of Agricultural Biotechnology 231
formed under conditions of physical and reproduc-tive confinement.
The Monsanto petition describes the genetical-ly engineered soybean plants and provides informa-tion relevant to determining whether glyphosate tol-erant soybean plants are more likely thanconventional varieties to become a plant pest. Thepetition addresses potential environmental conse-quences of unregulated release of glyphosate tolerantsoybean varieties, including the development ofglyphosate tolerant weeds, enhanced weediness,effects on non-target organisms, impacts of humanand animal exposure, indirect effects on other agri-cultural products and the potential for outcrossing.Reports from field trials are included with observa-tions of yields, plant growth, outcrossing, survivaland gene expression gathered during field tests ofglyphosate tolerant varieties compared with conven-tional varieties. Examples of the monitoring formsused by investigators who conducted the experi-ments are also included in the petition. In addition,letters from six land grant university weed scientistsare included addressing the potential for develop-ment of weed resistance to glyphosate, weed popula-tion shifts and the overwintering of glyphosate toler-ant soybeans, which were issues of concern toUSDA.
APHIS granted the petition in May 1994, issu-ing a Finding of No Significant Impact. This conclu-sion was based on the nature of the genetic modifi-cation, the fact that soybean has no weedy relativeswith which it can interbreed in the USA and its ter-ritories and the fact that this modification will notincrease the weediness of the soybeans or negativelyeffect any non-target organisms, including benefi-cials (USDA APHIS, 1994b).
Weediness
Soybean (Glycine max) possesses few of the charac-teristics of plants that are notably successful weeds.G. max cv. 5403, the cultivar which was GM, is notconsidered to be a weed, and glyphosate tolerance isnot expected to confer any additional weedy charac-teristics. Standard texts and lists of weeds give noindication that cultivated soybean is regarded as aweed anywhere (USDA APHIS, 1994a).Overwintering of soybeans is rare due a lack ofinnate dormancy. A lack of dormancy is selected forin commercial soybean seeds, so soybean seeds ger-minate quickly. Any seed that might remain in a field
after harvest is likely to germinate, emerge and bekilled by frost or field preparation for the followingcrop. Very few volunteers were observed in field test-ing. The number of seeds produced, germinationcharacteristics, final stands, overwintering capabilityand disease or insect susceptibility were all found tobe similar for the tested glyphosate tolerant linecompared with conventional varieties. These find-ings were based on yield data and observations ofgermination, stand counts and disease or insect sus-ceptibility. Further, increased weediness of theglyphosate tolerant soybean plant compared withconventional varieties would have to be due to selec-tion pressure in association with glyphosate use. Thiswas judged not to be an issue since glyphosate is notapplied to the soybean for control of the soybeanitself, but rather for controlling weeds in the field(USDA APHIS, 1994a).
Outcrossing
The genus Glycine is divided into two subgenera,Glycine and Soja. The first consists of 12 wild peren-nial species that are primarily distributed inAustralia, South Pacific Islands, Philippines andTaiwan. The subgenus Soja consists of three annualspecies from Asia, Glycine max, Glycine soja andGlycine gracilis. The first species is the cultivated soy-bean, the second species is the wild form of the soy-bean and the third species is referred to as the ‘weedy’form of the soybean.
Cultivated soybean is sexually compatible onlywith members of the genus Glycine. Cultivated soy-bean is the only member of the genus Glycine thatgrows in the USA and its territories and is sexuallycompatible with cultivated soybean, with the excep-tion of specialized research collections. However,some members of the wild perennial species of sub-genus Glycine may be found in US territories in thePacific. There are no known reports of successful nat-ural hybridization between the cultivated soybeanand the wild perennial species.
The wild annual species, G. soja, is found inChina, Taiwan, Japan, Korea and the former USSR.Natural hybridizations between G. soja and cultivat-ed soybean occurs. G. soja is not native to NorthAmerica and occurs only in research plots. There areno reports of its escape or dispersal from researchplots. G. soja has never been found as a weed or nat-uralized in the USA. Thus, the possibility of genetransfer is very low within the USA.
232 J.E. Carpenter and L.P. Gianessi

Even if non-agricultural land containing anywild Glycine populations were near sites of commer-cial soybean production, it is highly unlikely thatpollen from GTS line 40-3-2 would fertilize the wildrelative, because soybeans are almost completely self-pollinated. The anthers mature in the bud and shedtheir pollen directly on to the stigma of the sameflower, thus ensuring a high degree of self-pollina-tion. Cross-pollination is generally very low and var-ious studies have shown it to be from 0.03 to 3.62%.Honeybees are responsible for the occasional cross-pollination.
The limited potential for cross-pollination isevident in certified seed regulations for Foundationseeds, the most stringent category in the CertifiedSeed Regulations, which permit zero distancebetween different soybean cultivars in the field.
Non-target effects
Glyphosate tolerant soybeans were judged to have nodetrimental effects on non-target organisms. EPSPSenzymes are present in plants and microorganismsand are therefore normally found in food and feed.No effects on non-target organisms were expected.The glyphosate tolerant EPSPS that was introducedinto soybeans is not known to have any toxic prop-erties. Field observations revealed no negative effectson non-target organisms including insects, birds orother species that frequent soybean fields (USDAAPHIS, 1994a).
Weed resistance
Although the development of herbicide resistantweeds is not specifically considered by USDA in theapproval process, Monsanto’s petition to USDA pro-vided information addressing this possibility.Glyphosate is considered to be a herbicide with a lowrisk for the development of weed resistance. Majorfactors which can contribute to the development ofresistant weeds include: a single target site and a spe-cific mode of action, broad spectrum of activity, longresidual activity, and frequent applications withoutrotation to other herbicides or cultural control prac-tices. Glyphosate essentially has no residual activityin the soil and is relatively quickly broken down bymicroorganisms in the soil. Also, there is no otherherbicide on the market today that has the samemode of action as glyphosate. Glyphosate has beenwidely used for over 20 years, as a pre-plant burn-
down, directed, spot or postharvest treatments.However, some have questioned the impression of‘invincibility’ of glyphosate to the development ofresistance (Gressel, 1996). Resistant weed popula-tions have been reported in Malaysia and Australia(Sindel, 1996; Doll, 1999).
Plant pest risk
APHIS also assessed the possibility that glyphosatetolerant soybeans would pose a plant pest risk due tothe presence of pathogen-derived sequences. Neitherof the gene sequences from A. tumefaciens or the cau-liflower mosaic virus cause any plant or animal dis-ease, is the source of pathogenicity in its host orencodes any polypeptide. No crown gall, the diseasecaused by A. tumefaciens, or cauliflower mosaic virusdisease were observed in any glyphosate tolerant soy-bean plants during greenhouse or field studies.
Yields
Further information was submitted by Monsanto on19 November 1993, to address a slight yield reduc-tion observed at three of seven sites in initial yieldtrials.
EPA
The EPA assesses the safety of pesticides, both chem-ical and those that are produced biologically. Underthe authority of the Federal Insecticide, Fungicideand Rodenticide Act (FIFRA), EPA regulates the dis-tribution, sale, use and testing of plants and microbesproducing pesticidal substances. Under the FederalFood, Drug and Cosmetics Act (FFDCA), EPA setstolerance limits, maximum allowable residue con-centrations, for substances used as pesticides on andin food and feed, or establishes an exemption fromthe requirement of a tolerance. The EPA also estab-lishes tolerances for residues of herbicides used onnovel herbicide-tolerant crops.
The goal of FIFRA is to register pesticides thatdo not have unreasonable adverse effects on humanhealth or the environment and have benefits out-weighing risks. Unreasonable adverse effects on theenvironment are defined as any unreasonable risk to‘man or the environment, taking into account theeconomic, social, and environmental costs and bene-fits of the use of any pesticide’ (Korwek, 1997).
Case Study in Benefits and Risks of Agricultural Biotechnology 233
Any substance that is considered a pesticideunder FIFRA is automatically subject to regulationunder FFDCA if used on a food or feed crop (Nelsonand Abramson, 1999). Until recently, EPA’s decisionmaking under FFDCA also involved a balancing ofrisks and benefits; however, only dietary risks tohumans and other animals were considered, asopposed to FIFRA which also takes into accountenvironmental risks (US EPA, 1994). Since passageof the Food Quality Protection Act in 1996,Congress has required EPA to apply a safety-onlystandard when examining the potential dietary risksassociated with pesticide residues that may be foundin food (Nelson and Abramson, 1999).
Early policy statements of EPA were focused onthe regulation of GM microbial pesticides. A 1984statement of interim policy required notificationprior to small-scale field tests involving certainmicrobial pesticides, including those that had beengenetically altered, in order to determine whether anexperimental use permit (EUP) would be requiredfor testing (US EPA, 1984). In 1986, as part of theCoordinated Framework, EPA published its state-ment of policy pertaining to regulating microbialpesticides under FIFRA, which sought to definewhich microbial products would be subject to reviewunder FIFRA as well as the nature of the review(OSTP, 1986). In a 1989 Notice, EPA requestedcomments on the regulatory approach to microbialpesticides articulated in the 1986 policy statement(US EPA, 1989). A proposed rule was published byEPA in 1993, based on the 1984 interim policy andthe 1986 proposed policy, addressing the require-ments for small-scale field testing of microbial pesti-cides, as regards notification and EUPs (US EPA,1993).
It was not until 1994 that the agency began topublish policy applicable to GM organisms otherthan microbial pesticides and products. That year,EPA published a proposed policy for ‘plant pesti-cides’ to be regulated under FIFRA and FFDCA.The 1994 proposed policy annunciated the agency’sintent to regulate the pesticidal substances in plants,but not the plants themselves, leaving the regulationof the plants to USDA. This stance followed from anearlier policy by EPA to exempt from regulationunder FIFRA all biological control agents, except forcertain microorganisms, which has been interpretedto include plants (US EPA, 1994).
Several exemptions were proposed in the 1994statement. First, plant pesticides derived throughconventional breeding methods were granted a
generic exemption from registration under FIFRA.Further, EPA proposed to exempt from regulationunder FIFRA plant pesticides that are derived fromsexually compatible plants. Viral coat proteins werealso proposed to be exempt under FIFRA. Three cat-egories of exemptions from tolerance setting underFFDCA were also proposed: plant pesticides thatwould not result in new dietary exposures, nucleicacids in plants and coat proteins from plant viruses.With these exemptions, the agency intended to reg-ulate those plant pesticides that have the greatestpotential for adverse effects, on the environment oron health (US EPA, 1994).
A recent report by the National Academy ofSciences addressed the issue of the exemptions pro-posed by EPA. Though the committee agreed thatconventionally bred plants should be exempt forpractical reasons based on historical safe use and ben-efits of these crops, the committee questioned thescientific basis used by EPA for this exemption.Regarding the exemption for plant pesticides derivedfrom sexually compatible plants, the committeequestioned the categorical nature of the exemption,while noting that exemptions for certain sexuallycompatible transgenic plant pesticides would beappropriate. The committee agreed that viral coatproteins should be exempt from regulation underFFDCA, but questioned the exemption underFIFRA due to concerns about potential outcrossingwith weedy relatives (NRC, 2000).
The 1994 proposed policy also describes therisk issues with which the regulations are concerned.The following environmental risk issues are consid-ered for both field testing and sale or distribution ofa plant pesticide: increasing the ability of the modi-fied plant to survive outside cultivation through theintroduction of a specific trait; gene capture andexpression of the introduced trait by a wild or weedyrelative; potential for a trait conferring a selectiveadvantage to a plant in a natural plant communitywith the result of increasing the ‘weediness’ of thatspecies; environmental fate of the pesticidal sub-stance, the dosage to soils after plant senescence andincorporation into the soil, rate of degradation ordissipation and transport in the environment. A fur-ther issue is whether or not the pesticidal substanceis either exuded or volatilized from the plant duringthe growing season, resulting in a continuous appli-cation to the environment (US EPA, 1994).
Under FFDCA, EPA maintains jurisdictionover food safety issues related to the plant pesticide.Food safety issues related to compositional changes
234 J.E. Carpenter and L.P. Gianessi
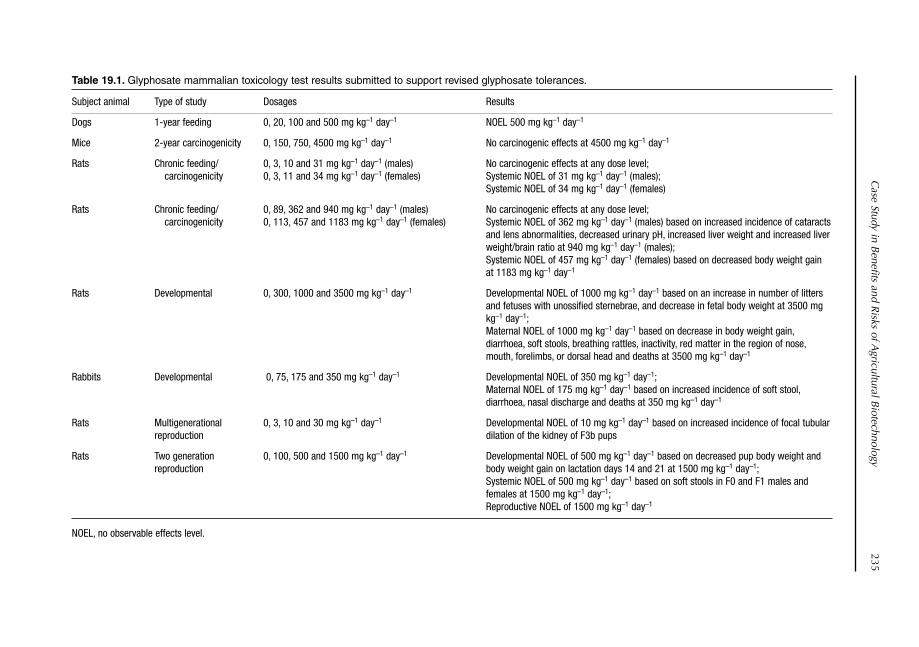
Table 19.1. Glyphosate mammalian toxicology test results submitted to support revised glyphosate tolerances.
Subject animal Type of study Dosages Results
Dogs 1-year feeding 0, 20, 100 and 500 mg kg–1 day–1 NOEL 500 mg kg–1 day–1
Mice 2-year carcinogenicity 0, 150, 750, 4500 mg kg–1 day–1 No carcinogenic effects at 4500 mg kg–1 day–1
Rats Chronic feeding/ 0, 3, 10 and 31 mg kg–1 day–1 (males) No carcinogenic effects at any dose level;carcinogenicity 0, 3, 11 and 34 mg kg–1 day–1 (females) Systemic NOEL of 31 mg kg–1 day–1 (males);
Systemic NOEL of 34 mg kg–1 day–1 (females)
Rats Chronic feeding/ 0, 89, 362 and 940 mg kg–1 day–1 (males) No carcinogenic effects at any dose level;carcinogenicity 0, 113, 457 and 1183 mg kg–1 day–1 (females) Systemic NOEL of 362 mg kg–1 day–1 (males) based on increased incidence of cataracts
and lens abnormalities, decreased urinary pH, increased liver weight and increased liverweight/brain ratio at 940 mg kg–1 day–1 (males);Systemic NOEL of 457 mg kg–1 day–1 (females) based on decreased body weight gain at 1183 mg kg–1 day–1
Rats Developmental 0, 300, 1000 and 3500 mg kg–1 day–1 Developmental NOEL of 1000 mg kg–1 day–1 based on an increase in number of litters and fetuses with unossified sternebrae, and decrease in fetal body weight at 3500 mg kg–1 day–1;Maternal NOEL of 1000 mg kg–1 day–1 based on decrease in body weight gain,diarrhoea, soft stools, breathing rattles, inactivity, red matter in the region of nose,mouth, forelimbs, or dorsal head and deaths at 3500 mg kg–1 day–1
Rabbits Developmental 0, 75, 175 and 350 mg kg–1 day–1 Developmental NOEL of 350 mg kg–1 day–1;Maternal NOEL of 175 mg kg–1 day–1 based on increased incidence of soft stool,diarrhoea, nasal discharge and deaths at 350 mg kg–1 day–1
Rats Multigenerational 0, 3, 10 and 30 mg kg–1 day–1 Developmental NOEL of 10 mg kg–1 day–1 based on increased incidence of focal tubular reproduction dilation of the kidney of F3b pups
Rats Two generation 0, 100, 500 and 1500 mg kg–1 day–1 Developmental NOEL of 500 mg kg–1 day–1 based on decreased pup body weight and reproduction body weight gain on lactation days 14 and 21 at 1500 mg kg–1 day–1;
Systemic NOEL of 500 mg kg–1 day–1 based on soft stools in F0 and F1 males andfemales at 1500 mg kg–1 day–1; Reproductive NOEL of 1500 mg kg–1 day–1
NOEL, no observable effects level.
Case Study in B
enefits and Risks of A
gricultural Biotechnology
235
236 J. E. Carpenter and L. P. Gianessi
in the plant itself are under FDA jurisdiction.Environmental issues related to the plant itself areregulated by USDA APHIS, as mentioned above.
Crops that have been genetically modified to beherbicide tolerant do not face regulation underFIFRA, as the plants contain no pesticidal substance.EPA must grant any changes in tolerances forresidues that might be needed to accommodatealtered use patterns for in-season applications of theherbicide. Further, EPA must approve the modifica-tion of the label for the herbicide to allow for in-sea-son use of the herbicide over the growing crops,which would not have been allowed previously.
In April 1996, EPA established new tolerancesand feed additive regulations for the residues ofglyphosate on several commodities for several enduses, in response to a number of petitions submittedby Monsanto. The revised tolerances were based ondata submitted from several toxicological studies, assummarized in Table 19.1. In addition to those stud-ies listed in Table 19.1, several acute toxicology stud-ies were submitted that placed technical gradeglyphosate in Toxicity Categories III and IV. Allmutagenicity tests were negative. The carcinogenicpotential of glyphosate has been judged to belong inGroup E, evidence of non-carcinogenicity forhumans, based on the lack of convincing carcino-genicity evidence in adequate studies in two animalspecies (US EPA, 1996). Revised tolerances forglyphosate are provided in Table 19.2. EPA approveda change in the label for Roundup to allow use ofRoundup over the top of growing soybean plants in1995. Since this change did not affect the registra-tion of Roundup, this approval was not published inthe Federal Register (Korwek, 1997).
Table 19.2. Glyphosate tolerances in soybeans(p.p.m.). (Source: EPA, 1996.)
Revised tolerance
Soybeans 20Soybeans, grain 20Soybeans, aspirated grain fractions 50Soybeans, forage 100Soybeans, hay 200
FDA
FDA regulates foods and food ingredients, includinganimal feed and feed additives, under the FFDCA.The agency’s authority to regulate the safety of food
is generally exercised under two sections of the Act.Section 402(a)(1) applies to unintended occurrencesof unsafe levels of toxicants in food. This section isthe agency’s primary legal tool for regulating the safe-ty of whole foods, placing liability for food safety onthe producer of a new food, and it is under this sec-tion that new plant varieties, including those pro-duced using conventional techniques, have histori-cally been regulated. Under this section, the agencyretains the authority to remove a food from com-mercialization if it is found to be unsafe. However,under this section, there is no requirement for safetytesting prior to commercialization. Section 409 ofthe Act applies to food additives, or intentionalchanges in the composition of foods. Under this sec-tion, premarket approval is required unless the foodadditive is generally recognized as safe (GRAS), or isa pesticide and therefore regulated by the EPA. TheGRAS exception allows many ingredients derivedfrom natural sources (e.g. salt, pepper, spices) andsome chemical additives (some sweeteners, preserva-tives, artificial flavours) to be marketed withouthaving been formally reviewed by FDA (US FDA,1992).
In its 1986 statement, as part of theCoordinated Framework, FDA announced its inten-tion to apply the existing regulatory framework togenetically engineered plant varieties. In that state-ment, FDA clearly states its intention to base its reg-ulation of food on rational and scientific evaluationof the product, not on the process used to developthe product (US OSTP, 1986).
Further refinements to FDA policy were madein 1992 as the agency issued its policy statementestablishing the regulatory framework under whichFDA currently operates with regard to foods devel-oped using biotechnology (US FDA, 1992). Underthe 1992 policy, regulation of genetically engineeredvarieties under the food additive provisions ofFFDCA which would require premarket review areinterpreted to apply to the transferred genetic mate-rial and the intended expression product. The intro-duced genetic material itself is considered to beGRAS, as nucleic acids are present in the cells ofevery living organism. Expression products, such asproteins, carbohydrates, fat or oil, would onlyrequire premarket review if they differ significantlyin structure, function or composition from a sub-stance found currently in food, or sufficient safetyissues are raised.
Several scientific issues are highlighted in the1992 statement, including unintended effects,
known toxicants, nutrients, new substances, aller-genicity and antibiotic resistance selectable markers.These issues are the focus of FDA regulation of newplant varieties.
FDA has been particularly attuned to thepotential of new plant varieties to cause allergies. Theagency’s principal concern is the possibility that anallergy-causing protein would be transferred fromone food plant to another, making the recipient plantcause an allergic response in those allergic to thedonor plant. In the case where a protein is derivedfrom a commonly allergenic source, it is possible totest the new variety for allergenic responses in indi-viduals known to be sensitive to the donor plant. Forproteins that are derived from non-food sources, test-ing for potential allergenicity is less straightforward.
In April 1994, FDA, EPA and USDA hosted ascientific conference on allergenicity in transgenicfood crops. Attendees concluded that methods areavailable to assess allergenic potential for proteinsthat are derived from sources to which consumershave reacted and for which serum is available, but itmay be useful to establish a serum bank. There are nodirect methods to assess potential allergenicity of pro-teins from sources that are not known to producefood allergy. Some assurance can be provided to min-imize the possibility that a new protein will cause anallergic reaction by evaluating its similarity with char-acteristics of known food allergens. However, this isan area where more research has been called for. TheNational Academy of Sciences recommended thatpriority be given to developing improved methodsfor identifying potential allergens (NRC, 2000).
FDA is also concerned with the use of anti-biotic resistance marker genes in transgenic plantsand the risk of reducing the effectiveness of anti-biotics in humans and animals (FDA, 1998). Thekanamycin resistance marker gene is commonlyused in transgenic plants. Calgene, the developer ofthe FlavrSavr® tomato, the first transgenic crop tobe approved by FDA, requested that FDA subjectthe kanamycin resistance gene to evaluation underfood additive regulations. At the time, FDA con-vened a Food Advisory Committee to considerCalgene’s petition. The committee considered bothdirect risks of allergenicity and toxicity and theeffects on the efficacy of antibiotics.
The 1992 policy statement includes a sectionon guidance to the industry for foods derived fromnew plant varieties, which describes scientific consid-erations for the evaluation of the safety and nutri-tional aspects of new plant varieties. The guidance
section of the statement includes decision trees toassist developers in determining whether their prod-uct would be subject to regulation as a food additiveor if consultation with FDA is necessary to deter-mine the regulatory status of the product. Informalconsultation with the agency has been standard prac-tice for the food industry, and FDA expects thatdevelopers of genetically engineered varieties wouldcontinue this practice (US FDA, 1992).
One controversial aspect of the FDA policy isthat no premarket review has been required for thesecrops. Consultations have been technically volun-tary, though the agency knows of no product that hasbeen commercialized without prior consultationwith the agency. However, in 2000, consultationswith the agency became mandatory (US FDA,2000).
The most controversial aspect of FDA’s policyhas been the decision that foods developed usingrDNA technology would not require labelling (FDA,1993). This decision was based on the judgementthat these products do not differ in any significantway from their conventional counterparts solely dueto the process through which they were developed. Itshould be noted that labelling is required for geneti-cally engineered foods that contain genetic materialfrom foods that are commonly allergenic, unless itcan be demonstrated that the allergenic property hasnot been transferred to the new plant variety.Further, plant varieties that have altered nutritionalcharacteristics, such as modified oil content, wouldalso require labelling.
Monsanto began the consultation process withFDA in June 1993. In accordance with the consulta-tion guidelines, data describing the crop that wasbeing transformed, the introduced genetic material,the identity and function of the expression product,comparison of composition of GM and convention-al soybeans was included, as well as data and infor-mation addressing potential allergenicity and toxici-ty issues.
The safety evaluation can be broken down intotwo categories, unintended effects and intendedeffects, in accordance with the statutory structure,which regulates these effects differently, requiringpremarket review only for intended effects under sec-tion 409.
Unintended effects
In order to address the possibility of the geneticmodification having unintended effects on the crop,
Case Study in Benefits and Risks of Agricultural Biotechnology 237

studies were performed to assess the composition ofthe GM soybeans compared with conventional soy-beans. In addition, wholesomeness studies were per-formed to evaluate any differences in feeding charac-teristics of GM soybean feed and conventional feed.
In the compositional analysis, evaluations wereperformed on seed, toasted meal, defatted meal(flour), protein isolate, protein concentrate, crudelecithin and refined, bleached, deodorized oil.Differences in seed composition were seen to be anindication that differences in other products wouldbe found. Other products were chosen as they repre-sent the various uses of soybeans. Toasted meal iswidely used in animal feed. Defatted meal, proteinisolate and protein concentrate are commonly usedin food, as are lecithin and soybean oil. For seeds, theparameters compared were: protein, fat, fibre, ash,carbohydrate, amino acids, fatty acids, soybean seedproteins, trypsin inhibitor, lectin and isoflavones.Significant differences in fat, ash and carbohydratewere observed in one study, while no significant dif-ferences in these parameters were observed in similarstudies conducted the next year. Protein, fat, fibre,ash and carbohydrate content were measured fordefatted toasted meal, defatted non-toasted meal,protein isolate and protein concentrate, and no sig-nificant differences were found for these valuesbetween GM soybeans and conventional soybeans.Antinutrient content (trypsin inhibitor and urease,
phytate, stachyose, raffinose, lectins, isoflavones) wasmeasured in toasted meal and, apart from lectin con-centrations which were below detection limits, nosignificant differences were found. Fatty acid compo-sition was measured for soybean oil and no signifi-cant differences were found. The composition ofcrude lecithin was also compared, with no significantdifferences found.
Animal feeding studies were performed usingrats, broiler chickens, dairy cattle, catfish and bob-white quail. Two separate rat studies were performed,using processed and unprocessed meal. The studyusing processed meal was intended to address mam-malian health issues, while the unprocessed meal wasintended to address risks to wild animals that mightfeed on unharvested beans in the field. Broilers wereincluded due to the prevalent use of processed soy-beans in broiler operations. Similarly, dairy cattlewere fed raw soybeans to reflect the widespread useof soybeans in cattle feed. Catfish were fed processedmeal as this composes a great portion of feed used inaquaculture. Finally, bobwhite quail were fedunprocessed soybeans in order to address potentialrisks to birds that might feed on soybeans in the field.These studies were not designed as toxicology tests,but rather were undertaken to determine whetherthere were any differences in wholesomeness, or theability to support growth and well-being. Table 19.3summarizes the setup of the animal studies that were
238 J.E. Carpenter and L.P. Gianessi
Table 19.3. Animal studies submitted to FDA on glyphosate tolerant soybeans.
Animal Feed Duration of study Parameters measured
Rats Processed soybean meal 4 weeks Mortality; body weight; cumulative body weightgain; organ weight; food consumption
Rats Unprocessed soybean meal 4 weeks Mortality; body weight; cumulative body weightgain; organ weight; food consumption
Broiler chickens Processed soybean meal 6 weeks Body weight; body weight gain; feed intake;feed/gain; liveability
Dairy cows Raw soybeans 4 weeks Milk production; fat-corrected milk*; milkcomposition; dry matter; net energy intakes; body weight changes; dry matter digestibility;nitrogen balance; volatile fatty acids in rumen;rumen nitrogen
Catfish Processed soybeans 10 weeks Feed efficiency; percentage weight gain; survival;food consumption*; body composition; moisture,protein, fat and ash in fillets
Bobwhite quail Raw soybean meal 5 days Mortality; body weight gain; food consumption
* Statistical differences found between animals fed conventional soybean product and GM soybean product.
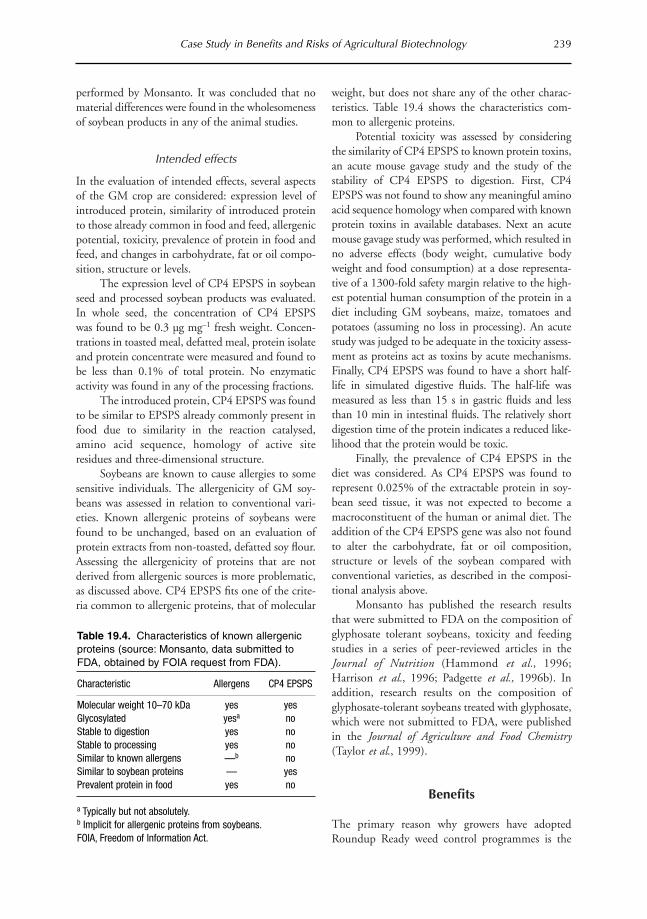
performed by Monsanto. It was concluded that nomaterial differences were found in the wholesomenessof soybean products in any of the animal studies.
Intended effects
In the evaluation of intended effects, several aspectsof the GM crop are considered: expression level ofintroduced protein, similarity of introduced proteinto those already common in food and feed, allergenicpotential, toxicity, prevalence of protein in food andfeed, and changes in carbohydrate, fat or oil compo-sition, structure or levels.
The expression level of CP4 EPSPS in soybeanseed and processed soybean products was evaluated.In whole seed, the concentration of CP4 EPSPSwas found to be 0.3 µg mg–1 fresh weight. Concen-trations in toasted meal, defatted meal, protein isolateand protein concentrate were measured and found tobe less than 0.1% of total protein. No enzymaticactivity was found in any of the processing fractions.
The introduced protein, CP4 EPSPS was foundto be similar to EPSPS already commonly present infood due to similarity in the reaction catalysed,amino acid sequence, homology of active siteresidues and three-dimensional structure.
Soybeans are known to cause allergies to somesensitive individuals. The allergenicity of GM soy-beans was assessed in relation to conventional vari-eties. Known allergenic proteins of soybeans werefound to be unchanged, based on an evaluation ofprotein extracts from non-toasted, defatted soy flour.Assessing the allergenicity of proteins that are notderived from allergenic sources is more problematic,as discussed above. CP4 EPSPS fits one of the crite-ria common to allergenic proteins, that of molecular
weight, but does not share any of the other charac-teristics. Table 19.4 shows the characteristics com-mon to allergenic proteins.
Potential toxicity was assessed by consideringthe similarity of CP4 EPSPS to known protein toxins,an acute mouse gavage study and the study of thestability of CP4 EPSPS to digestion. First, CP4EPSPS was not found to show any meaningful aminoacid sequence homology when compared with knownprotein toxins in available databases. Next an acutemouse gavage study was performed, which resulted inno adverse effects (body weight, cumulative bodyweight and food consumption) at a dose representa-tive of a 1300-fold safety margin relative to the high-est potential human consumption of the protein in adiet including GM soybeans, maize, tomatoes andpotatoes (assuming no loss in processing). An acutestudy was judged to be adequate in the toxicity assess-ment as proteins act as toxins by acute mechanisms.Finally, CP4 EPSPS was found to have a short half-life in simulated digestive fluids. The half-life wasmeasured as less than 15 s in gastric fluids and lessthan 10 min in intestinal fluids. The relatively shortdigestion time of the protein indicates a reduced like-lihood that the protein would be toxic.
Finally, the prevalence of CP4 EPSPS in thediet was considered. As CP4 EPSPS was found torepresent 0.025% of the extractable protein in soy-bean seed tissue, it was not expected to become amacroconstituent of the human or animal diet. Theaddition of the CP4 EPSPS gene was also not foundto alter the carbohydrate, fat or oil composition,structure or levels of the soybean compared withconventional varieties, as described in the composi-tional analysis above.
Monsanto has published the research resultsthat were submitted to FDA on the composition ofglyphosate tolerant soybeans, toxicity and feedingstudies in a series of peer-reviewed articles in theJournal of Nutrition (Hammond et al., 1996;Harrison et al., 1996; Padgette et al., 1996b). Inaddition, research results on the composition ofglyphosate-tolerant soybeans treated with glyphosate,which were not submitted to FDA, were publishedin the Journal of Agriculture and Food Chemistry(Taylor et al., 1999).
Benefits
The primary reason why growers have adoptedRoundup Ready weed control programmes is the
Case Study in Benefits and Risks of Agricultural Biotechnology 239
Table 19.4. Characteristics of known allergenicproteins (source: Monsanto, data submitted toFDA, obtained by FOIA request from FDA).
Characteristic Allergens CP4 EPSPS
Molecular weight 10–70 kDa yes yesGlycosylated yesa noStable to digestion yes noStable to processing yes noSimilar to known allergens —b noSimilar to soybean proteins — yesPrevalent protein in food yes no
a Typically but not absolutely.b Implicit for allergenic proteins from soybeans.FOIA, Freedom of Information Act.

simplicity of a weed control programme that relieson one herbicide to control a broad spectrum ofweeds without crop injury or crop rotation restric-tions. Before the introduction of Roundup Readysoybean varieties, growers would choose betweenmany herbicides, often applying three or moreactive ingredients, some of which would cause dam-age to the growing soybean plants, or cause harm tomaize crops that commonly follow soybeans(Gianessi and Carpenter, 2000).
Roundup is a highly effective broad spectrumherbicide that controls both broadleaf and grassweeds. Each year, state extension services releaseweed control guides for field crops including soy-beans. The guides provide information on the effica-cy of available herbicide treatments on specific weedspecies, as well as ratings of crop safety. In theMichigan State University weed control guide, inwhich 182 treatments are rated on 24 different weedspecies, Roundup used over Roundup Ready soy-beans received 23 good or excellent ratings. In addi-tion, the Roundup treatment is rated with a minimalrisk of crop injury. The next best available treatmentwith similar crop safety received 16 good or excellentratings (Kells and Renner, 1999).
Growers also have more flexibility in timingherbicide treatments with the Roundup Ready sys-tem. Maximum weed heights at which Roundup iseffective on most weed species are higher than otheravailable herbicides. This allows growers to treat laterif needed and still get effective weed control. Further,some commonly used soybean herbicides may causeinjury to rotation crops. Because of this potential forinjury to crops following soybeans, rotation restric-tions are specified on the labels of these herbicides.For instance, sugarbeets may not be planted for 40months after a field is treated with imazethapyr, acommonly used soybean herbicide.
Potential impacts of adopting Roundup Readyweed control programmes include changes in costs,yields and pesticide use. Roundup Ready pro-grammes were introduced to be price competitive
with existing conventional programmes. The intro-duction of competitively priced Roundup Readyprogrammes resulted in manufacturers of otherproducts dropping their prices, in some cases by40%. This resulted in an estimated US$216 millioncost savings for soybean growers in 1999 comparedwith 1995, the year before Roundup Ready varietieswere introduced, including the technology fee paidby growers who planted Roundup Ready varieties.Table 19.5 shows estimated soybean weed controlprogramme costs for 1995, 1998 and 1999.
The impact on yields is less clear (Carpenterand Gianessi, 1999). Survey data on which to base acomparison of yields from Roundup Ready fieldswith conventional fields are scarce. Two areas ofresearch assist in understanding the consequences ofthe adoption of Roundup Ready varieties on yield.The first is weed control research, comparing weedcontrol strategies. The second type of research is vari-ety trials, where the yield potential of conventionaland Roundup Ready varieties have been compared.
In weed control trials, weed control pro-grammes are compared in terms of efficacy againstparticular weed species and resulting yields. Thepurpose of these types of studies is to determineoptimal herbicide application rates and timing toachieve control of various weeds. In general, thesetests are conducted using a single variety. Recently,researchers have chosen to use Roundup Ready vari-eties in order to include Roundup treatments intheir studies. Yield differences in these studies aredue to more effective weed control and from avoid-ing crop injury. However, since only one variety isused in each study, the yield potential of the varietyis not directly considered. It is difficult to generalizeabout the results from the weed control studies,although there seems to be no resounding yieldadvantage or disadvantage in the Roundup Readysystems compared with conventional programmes(Breitenbach and Hoverstad, 1998).
Variety trials are conducted by state universitiesto assess the characteristics of the varieties that will beavailable to growers the following year. The trialsassess yield, maturity, lodging, protein and oil con-tent, and resistance to pathogens and soybean cystnematode and are generally maintained weed free, inorder to eliminate competition from weeds as a fac-tor influencing yield. Based on a compilation of vari-ety trials from several states, it appears that availableRoundup Ready varieties generally yield lower thanconventional varieties (Minor, 1998; Oplinger et al.,2000).
240 J.E. Carpenter and L.P. Gianessi
Table 19.5. Soybean weed control costs (US$millions).
1995 1998 1999
Herbicide expenditures 1865 1482 1441Technology fee 0 160 208Net weed control costs 1865 1642 1649
Calculated assuming herbicide expenditures in 13 statesrepresent 80% of US total.
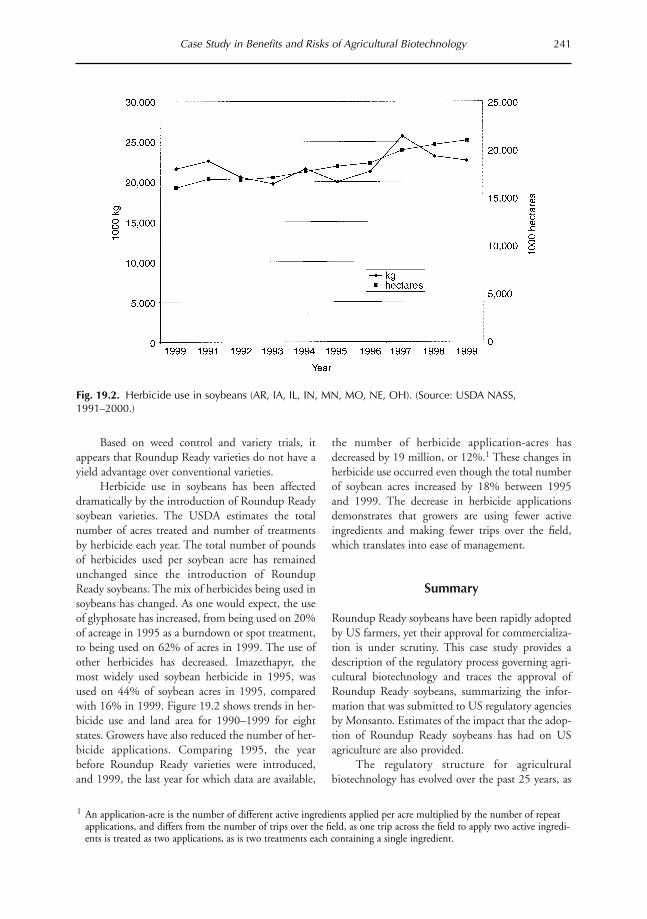
Based on weed control and variety trials, itappears that Roundup Ready varieties do not have ayield advantage over conventional varieties.
Herbicide use in soybeans has been affecteddramatically by the introduction of Roundup Readysoybean varieties. The USDA estimates the totalnumber of acres treated and number of treatmentsby herbicide each year. The total number of poundsof herbicides used per soybean acre has remainedunchanged since the introduction of RoundupReady soybeans. The mix of herbicides being used insoybeans has changed. As one would expect, the useof glyphosate has increased, from being used on 20%of acreage in 1995 as a burndown or spot treatment,to being used on 62% of acres in 1999. The use ofother herbicides has decreased. Imazethapyr, themost widely used soybean herbicide in 1995, wasused on 44% of soybean acres in 1995, comparedwith 16% in 1999. Figure 19.2 shows trends in her-bicide use and land area for 1990–1999 for eightstates. Growers have also reduced the number of her-bicide applications. Comparing 1995, the yearbefore Roundup Ready varieties were introduced,and 1999, the last year for which data are available,
the number of herbicide application-acres hasdecreased by 19 million, or 12%.1 These changes inherbicide use occurred even though the total numberof soybean acres increased by 18% between 1995and 1999. The decrease in herbicide applicationsdemonstrates that growers are using fewer activeingredients and making fewer trips over the field,which translates into ease of management.
Summary
Roundup Ready soybeans have been rapidly adoptedby US farmers, yet their approval for commercializa-tion is under scrutiny. This case study provides adescription of the regulatory process governing agri-cultural biotechnology and traces the approval ofRoundup Ready soybeans, summarizing the infor-mation that was submitted to US regulatory agenciesby Monsanto. Estimates of the impact that the adop-tion of Roundup Ready soybeans has had on USagriculture are also provided.
The regulatory structure for agriculturalbiotechnology has evolved over the past 25 years, as
Case Study in Benefits and Risks of Agricultural Biotechnology 241
1 An application-acre is the number of different active ingredients applied per acre multiplied by the number of repeatapplications, and differs from the number of trips over the field, as one trip across the field to apply two active ingredi-ents is treated as two applications, as is two treatments each containing a single ingredient.
Fig. 19.2. Herbicide use in soybeans (AR, IA, IL, IN, MN, MO, NE, OH). (Source: USDA NASS,1991–2000.)
technology allowing for genetic modification devel-oped. The system continues to evolve as new and dif-ferent applications of the technology emerge. Indeed,the most recent report of the National ResearchCouncil recommended that any new rules for regu-lating GM plants be flexible to reflect improvementsin scientific understanding (NRC, 2000).
In reviewing the studies that were conducted onthe safety of Roundup Ready soybeans, no indicationof greater health or environmental risks were foundcompared with conventional varieties. The benefitsof the introduction of Roundup Ready soybeansinclude a cost savings of US$216 million in annualweed control and 19 million fewer soybean herbicideapplications per year.
References
Berg, P., Baltimore, D., Boyer, H.W., Cohen, S.N., Davis,
R.W., Hogness, D.S., Nathans, D., Roblin, R.,
Watson, J.D., Weissman, S. and Zinder, N.D. (1974)
Potential biohazards of recombinant DNA molecules.
Science 185, 303.
Berg, P., Baltimore, D., Brenner, S., Roblin, R.O. III and
Singer, M.F. (1975) Asilomar conference on recombi-
nant DNA molecules. Science 188, 991.
Breitenbach, F. and Hoverstad, T. (1998) Roundup Ready
soybeans. Crop News, University of Minnesota 4(29),
162–163.
Carpenter, J. and Gianessi, L. (1999) Herbicide tolerant
soybeans: why growers are adopting Roundup Ready
varieties. AgBioForum, 2(2). www.agbioforum.org
Doll, J. (1999) Glyphosate resistance in another plant.
University of Wisconsin, Wisconsin Crop ManagerNewsletter December.
Gianessi, L.P. and Carpenter, J.E. (2000) AgriculturalBiotechnology: Weed Control Benefits of HerbicideTolerant Transgenic Soybeans. National Center for
Food and Agricultural Policy, Washington, DC.
Goodfield, J. (1977) Playing God: Genetic Engineering andthe Manipulation of Life. Random House, New York.
Gressel, J. (1996) Fewer constraints than proclaimed to the
evolution of glyphosate-resistant weeds. Resistant PestManagement 8(2), 2–5.
Hammond, B.G., Vicini, J.O., Hartnell, G.F., Naylor,
M.W., Knight, C.D., Robinson, E.H., Fuchs, R.L.
and Padgette, S.R. (1996) The feeding value of soy-
beans fed to rats, chickens, catfish and dairy cattle is
not altered by genetic incorporation of glyphosate tol-
erance. Journal of Nutrition 126, 717–727.
Harrison, L.A., Bailey, M.R., Naylor, M.W., Ream, J.E.,
Hammond, B.G., Nida, D.L., Burnette, B.L.,
Nickson, T.E., Mitsky, T.A., Taylor, M.L., Fuchs,
R.L. and Padgette, S.R. (1996) The expressed protein
in glyphosate-tolerant soybean, 5-enolypyruvylshiki-
mate-3-phosphate synthase from Agrobacterium sp.
strain CP4, is rapidly digested in vitro and is not toxic
to acutely gavaged mice. Journal of Nutrition 126,
728–740.
Kells, J.J. and Renner, K.A. (1999) Weed Control Guide forField Crops. Extension Bulletin E-434, Michigan
State University, East Lansing, Michigan.
Korwek, E.L. (1997) 1997 United States BiotechnologyRegulations Handbook, Volume 1. FDLI, Washington,
DC.
Minor, H. (1998) Performance of GMO’s vs. traditional
varieties: a southern perspective. 28th Soybean and53rd Corn/Sorghum Seed Research Conferences,Chicago, Illinois, 9–10 December.
National Research Council (2000) Genetically ModifiedPest-protected Plants: Science and Regulation. National
Academy Press, Washington, DC.
Nelson, D.T. and Abramson, S.H. (1999) High-tech crops:
emerging legal issues. ACCA Docket, no. 6, 34–56.
OSTP (Office of Science and Technology Policy) (1984)
Proposal for a Coordinated Framework for Regulation ofBiotechnology. 49 Fed. Reg. 50,856.
OSTP (Office of Science and Technology Policy) (1986)
Coordinated Framework for Regulation ofBiotechnology; Announcement of Policy and Notice forPublic Comment. 51 Fed. Reg. 23,302.
Oplinger, E.S., Martinka, M.J. and Schmitz, K.A. (2000)
Performance of Transgenetic Soybeans – Northern U.S.,Proceedings of the 28th Soybean Seed Research
Conference, American Seed Trade Association,
Washington, DC.
Padgette, S.R., Re, D.B., Barry, G.F., Eichholtz, D.E.,
Delannay, X., Fuchs, R.L., Kishore, G.M. and Fraley,
R.T. (1996a) New weed control opportunities: devel-
opment of soybeans with a Roundup Ready gene. In:
Duke, S.O. (ed.) Herbicide Resistant Crops, CRC
Press, Boca Raton, Florida, pp. 53–84.
Padgette, S.R., Taylor, N.B., Nida, D.L., Bailey, M.R.,
MacDonald, J., Holden, L.R. and Fuchs, R.L.
(1996b) The composition of glyphosate-tolerant
soybean seeds is equivalent to that of conventional
soybeans. Journal of Nutrition 126, 702–716.
Re, D.B., Padgette, S.R., Palmer, R., Delannay, X., Kolacz,
K., Nida, D., Peschke, V., Derting, C., Rogers, S.,
Edwards, J., Barry, G. and Biest, N. (1993) Petition
for determination of nonregulated status: soybeans
with a Roundup Ready gene. Monsanto, St Louis,
Missouri.
Sindel, B. (1996) Glyphosate resistance discovered in annu-
al ryegrass. Resistant Pest Management, Winter,
702–716.
Singer, M. and Soll, D. (1973) Guidelines for DNA hybrid
molecules. Science 181, 1114.
Taylor, N.B., Fuchs, R.L., MacDonald, J., Shariff, A.R. and
Padgette, S.R. (1999) Compositional analysis of
glyphosate-tolerant soybeans treated with glyphosate.
242 J.E. Carpenter and L.P. Gianessi
Journal of Agriculture and Food Chemistry 47,
4469–4473.
Thompson, P.B. (1987) Agricultural Biotechnology and theRhetoric of Risk: Some Conceptual Issues, Discussion
Paper FAP87-01. National Center for Food and
Agricultural Policy, Resources for the Future,
Washington, DC.
USDA Animal and Plant Health Inspection Service (1987)
Introduction of Organisms and Products Altered orProduced Through Genetic Engineering Which are PlantPests or Which There is Reason to Believe Are Plant Pests.52 Fed. Reg. 22,892.
USDA Animal and Plant Health Inspection Service
(1993a) Genetically Engineered Organisms andProducts; Notification Procedures for the Introduction ofCertain Regulated Articles; and Petition forNonregulated Status. 58 Fed. Reg. 17,044.
USDA Animal and Plant Health Inspection Service
(1993b) Monsanto Co.: Receipt of Petition forDetermination of Nonregulated Status of GeneticallyEngineered Soybean Line. 58 Fed. Reg. 64,287.
USDA Animal and Plant Health Inspection Service
(1994a) APHIS-USDA Petition 93-258-01 forDetermination of Nonregulated Status for Glyphosate-Tolerant Soybean Line 40-3-2: EnvironmentalAssessment and Finding of No Significant Impact.
USDA Animal and Plant Health Inspection Service
(1994b) Response to Monsanto Petition P93-258-01 forDetermination of Nonregulated Status for GlyphosateTolerant Soybean Line 40-3-2.
USDA Animal and Plant Health Inspection Service (1997)
Genetically Engineered Organisms and Products;Simplification of Requirements and Procedures forGenetically Engineered Organisms. 62 Fed. Reg.
23,945.
USDA Economic Research Service (1999) Oil CropsSituation and Outlook.
USDA National Agricultural Statistics Service (2000a)
Acreage.USDA National Agricultural Statistics Service (2000b)
Agricultural Statistics.USDA National Agricultural Statistics Service
(1991–2000) Agricultural Chemical Usage: Field CropsSummary.
US Environmental Protection Agency (1984) MicrobialPesticides; Interim Policy on Small Scale Field Testing.49 Fed. Reg. 40,659.
US Environmental Protection Agency (1989) MicrobialPesticides; Request for Comment on RegulatoryApproach. 54 Fed. Reg. 7,026.
US Environmental Protection Agency (1993) MicrobialPesticides; Experimental Use Permits and Notifications.58 Fed. Reg. 5,878.
US Environmental Protection Agency (1994) ProposedPolicy; Plant-Pesticides Subject to the Federal Insecticide,Fungicide, and Rodenticide Act and the Federal Food,Drug, and Cosmetic Act. 59 Fed. Reg. 60,496.
US Environmental Protection Agency (1996) PesticideTolerances for Glyphosate. 61 Fed. Reg. 15,192.
US Food and Drug Administration (1992) Statement ofPolicy: Foods Derived From New Plant Varieties. 57
Fed. Reg. 22,984.
US Food and Drug Administration (1993) Food Labeling;Foods Derived From New Plant Varieties. 58 Fed. Reg.
25,837.
US Food and Drug Administration (1998) Guidance forIndustry: Use of Antibiotic Resistance Marker Genes inTransgenic Plants: Draft Guidance. 4 September.
US Food and Drug Administration (2000) FDA toStrengthen Pre-market Review of Bioengineered Foods.May 3.
Case Study in Benefits and Risks of Agricultural Biotechnology 243

Introduction
Genetically modified foodstuffs entered the globalfood system in the early 1990s and are now in awide selection of raw and processed foods. TheCanadian Food Inspection Agency (CFIA) has indi-cated that processed foods could contain up to 70%genetically modified (GM) ingredients if GM oilsare measured. By the end of 1999 more than 40genetic modifications related to 13 different cropswere approved. Twelve countries produced at leastone GM crop and, to varying degrees, these cropswere available to other countries through interna-tional trade (James, 1999). A number of countrieshave also approved release of one or more varieties ofGM fish (e.g. salmon), active ingredients (e.g. brew-ers’ yeast and chymosin), drugs (e.g. recombinantbovine somatotropin) and vaccines for animals.
Since 1998, consumers have become increas-ingly concerned about the safety of GM foods.While extensive risk assessments have been under-taken and most countries and firms have developedsome level of risk management systems, communi-cation of the risks has lagged so much that manyconsumers are demanding mandatory labelling sys-tems. Consumers argue that labelling will allowthem to make their own choices about GM foods.The regulators, as well as distributors and other rep-resentatives of the supply chain recognize their rolein developing efficient policies to deal with con-sumer concern about GM foods.
Our survey shows that 18 countries plus theEuropean Union (EU), 29 manufacturers, 21 retail-ers and six restaurant chains around the world hadsignalled intentions to adopt voluntary or mandato-ry labels for GM foods or to eradicate GM ingredi-ents by February 2000. The survey also illustratesthat to date there has not been any convergencetowards common standards. Rather, coverage, toler-ances, conformity measures and implementationdates vary among firms and states.
In this chapter we examine the theory, practiceand implications of GM food labelling systems thathave emerged to date. The next section offers a shortoutline of the background of GM foods to therecent rise in demand for labelling. There follows asummary of the theory and literature on labellingfor GM foods and a description of the survey meth-ods used to identify labelling policies and practices.The following section sets out the results of the sur-vey and a summary of private and public labellingpolicies. The final section discusses possible effectsof the proposed labelling requirements on interna-tional food trade.
Background and Circumstances
Genetically modified foods entered the food chainin the early 1990s, with the commercialization of avariety of modified industrial ingredients (e.g. chy-mosin and brewers’ yeast). Beginning in 1995 a
245
20 Labelling for GM Foods: Theory andPractice
Peter W.B. Phillips and Heather McNeillDepartment of Agricultural Economics, University of Saskatchewan, Saskatoon,
Saskatchewan, Canada
© CAB International 2002. Market Development for Genetically Modified Foods(eds V. Santaniello, R.E. Evenson and D. Zilberman)
wide variety of modified plants was introduced in aselection of countries and then exported to manyconsumer markets around the world.
Also in 1995, the UK beef industry and UKregulators learned that there could be a causal linkbetween a new variant Creutzfeldt-Jakob disease(nvCJD) in humans and bovine spongiformencephalopathy (BSE). BSE had been endemic inUK cattle herds since the mid-1980s. Although theUK and European Union (EU) food safety regula-tors responded by tightening rules for producingand exporting UK cattle, their response often laggedbehind private policies. The regulatory systemappeared unprepared and therefore incompetent indeveloping public policy.
A number of events converged in 1998 whichheightened awareness of GM foods and contributedto consumer concerns about food safety. Mostnotably, Arpad Pusztai of the Rowett ResearchInstitute in Aberdeen reported on a BBC televisionshow that research he had done with Stanley Ewenindicated that diets containing GM potatoesexpressing the lectin Galanthus nivalis agglutinin(GNA) had variable effects on different parts of therat gastrointestinal tract. This result was misleadingbecause it was lab research; the GM potato had notbeen evaluated by the regulatory system and there-fore had not been released into the food system. Asa result, the public viewed the regulatory board asless credible. This was the first scientific result thatquestioned the safety of GM foods. UK and EUregulators were not prepared to confront publicconcerns.1 The UK Government responded bydeveloping national labelling which came into forcein March 1999.
Also in 1998, Iceland Foods, a high-street foodretailer, announced that it would remove GM ingre-dients from its own-label products. Greenpeace UK,Friends of the Earth and a wide range of publicinterest groups supported this move. The issue waspicked up by British tabloids and became the sub-ject of a vigorous circulation battle (Marks, 1999).
Although many of the triggers for a change inconsumer attitudes occurred in the UK, the con-cerns quickly spread through Europe, into NorthAmerica and to other importing countries. Bunglingof the BSE problem by UK regulators was shortlyfollowed by food safety scares across Europe (e.g.
dioxin contaminated feed products, tainted cheeses,‘bad’ CO2 in Coca Cola) which regulators wereeither unwilling or unable to handle efficiently.These events caused many consumers to questionthe domestic and international regulations for GMfoods. For many consumers, the regulators’ answerswere not satisfactory. During the late 1990s inEurope the regulations were more open to politicalinfluences. Consequently, the regulations could beaffected by consumer groups and were usually ten-tative responses. In contrast, the North Americansystem was science based and did not provide anopportunity for public influence. Outside Europeand North America, there was limited effective reg-ulatory capacity (Isaac and Phillips, 1999).
Given the extensive trade in GM foods andfood products, many consumers are uncertain aboutwhat they are consuming. Many consumers want tohave a choice about what they consume. TheOrganization for Economic Cooperation andDevelopment (OECD) (1999) recently completed asurvey in key markets that asked consumers whetherthey wanted labels. UK consumers were 94% infavour, EU consumers were 74% in favour andAustralian and New Zealand consumers responded91% in favour of labels. Depending on how thequestion was asked, consumers in Canada were83–99% in support and consumers in the USA were45–93% in support of labels.
A review of recent customer surveys byEnvironics Research Group (2001) showed thatbetween 1998 and 2000, anywhere from 72 to 98%of Canadians think that companies should beordered to label their products.
A recent survey by Angus Reid and TheEconomist, shown in Table 20.1, reported thatbetween 57 and 82% of consumers in the EU andNorth America would be less likely to buy GMlabelled products if labels were used. In contrast,only 5–37% of consumers would be more likely tobuy food labelled as ‘genetically modified’. A furthersurvey by Angus Reid (1999) in Canada reportedthat 66% of Canadians would pay more to haveGM content labelled; 79% of those would be will-ing to pay 5% more, 48% would pay 10% more and20% would pay 20% or more.
The consumer polls indicate that there is avariety of consumer concerns and awareness about
246 P.W.B. Phillips and H. McNeill
1 When the authors subsequently submitted it for peer review, they chose to withdraw some of their conclusions, andthe key scientific societies in the UK and elsewhere have challenged both the methodology and the results of thestudy. Nevertheless, the public largely believes that GM products are unsafe.
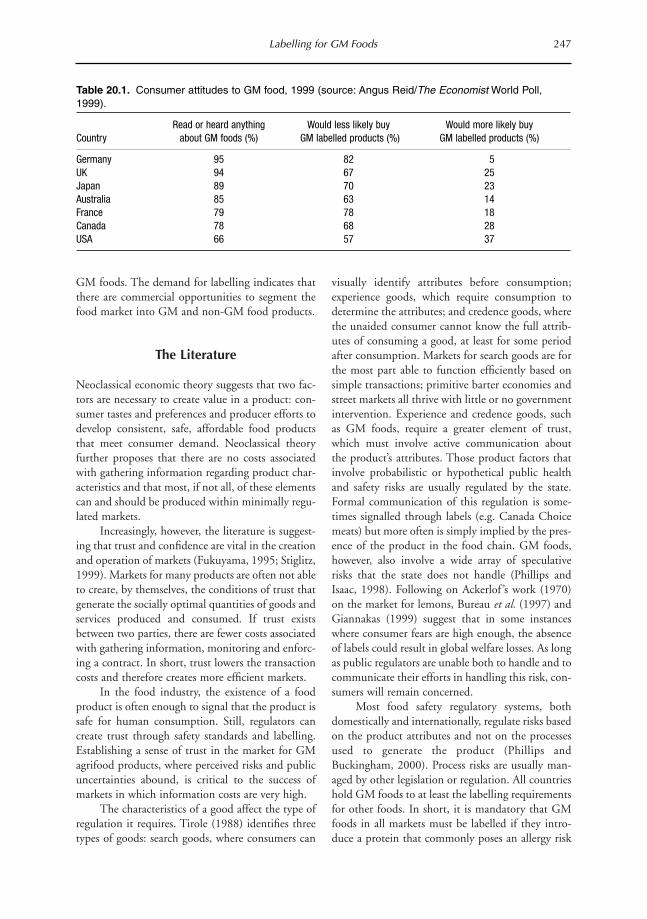
GM foods. The demand for labelling indicates thatthere are commercial opportunities to segment thefood market into GM and non-GM food products.
The Literature
Neoclassical economic theory suggests that two fac-tors are necessary to create value in a product: con-sumer tastes and preferences and producer efforts todevelop consistent, safe, affordable food productsthat meet consumer demand. Neoclassical theoryfurther proposes that there are no costs associatedwith gathering information regarding product char-acteristics and that most, if not all, of these elementscan and should be produced within minimally regu-lated markets.
Increasingly, however, the literature is suggest-ing that trust and confidence are vital in the creationand operation of markets (Fukuyama, 1995; Stiglitz,1999). Markets for many products are often not ableto create, by themselves, the conditions of trust thatgenerate the socially optimal quantities of goods andservices produced and consumed. If trust existsbetween two parties, there are fewer costs associatedwith gathering information, monitoring and enforc-ing a contract. In short, trust lowers the transactioncosts and therefore creates more efficient markets.
In the food industry, the existence of a foodproduct is often enough to signal that the product issafe for human consumption. Still, regulators cancreate trust through safety standards and labelling.Establishing a sense of trust in the market for GMagrifood products, where perceived risks and publicuncertainties abound, is critical to the success ofmarkets in which information costs are very high.
The characteristics of a good affect the type ofregulation it requires. Tirole (1988) identifies threetypes of goods: search goods, where consumers can
visually identify attributes before consumption;experience goods, which require consumption todetermine the attributes; and credence goods, wherethe unaided consumer cannot know the full attrib-utes of consuming a good, at least for some periodafter consumption. Markets for search goods are forthe most part able to function efficiently based onsimple transactions; primitive barter economies andstreet markets all thrive with little or no governmentintervention. Experience and credence goods, suchas GM foods, require a greater element of trust,which must involve active communication aboutthe product’s attributes. Those product factors thatinvolve probabilistic or hypothetical public healthand safety risks are usually regulated by the state.Formal communication of this regulation is some-times signalled through labels (e.g. Canada Choicemeats) but more often is simply implied by the pres-ence of the product in the food chain. GM foods,however, also involve a wide array of speculativerisks that the state does not handle (Phillips andIsaac, 1998). Following on Ackerlof ’s work (1970)on the market for lemons, Bureau et al. (1997) andGiannakas (1999) suggest that in some instanceswhere consumer fears are high enough, the absenceof labels could result in global welfare losses. As longas public regulators are unable both to handle and tocommunicate their efforts in handling this risk, con-sumers will remain concerned.
Most food safety regulatory systems, bothdomestically and internationally, regulate risks basedon the product attributes and not on the processesused to generate the product (Phillips andBuckingham, 2000). Process risks are usually man-aged by other legislation or regulation. All countrieshold GM foods to at least the labelling requirementsfor other foods. In short, it is mandatory that GMfoods in all markets must be labelled if they intro-duce a protein that commonly poses an allergy risk
Labelling for GM Foods 247
Table 20.1. Consumer attitudes to GM food, 1999 (source: Angus Reid/The Economist World Poll,1999).
Read or heard anything Would less likely buy Would more likely buyCountry about GM foods (%) GM labelled products (%) GM labelled products (%)
Germany 95 82 5UK 94 67 25Japan 89 70 23Australia 85 63 14France 79 78 18Canada 78 68 28USA 66 57 37
or the nutritional content differs from the norm forthat food (Nenon, 1999). Most national regulatorysystems assume that speculative risks are simply con-sumer preferences and not risks requiring mandatedlabelling. As with many rules, however, there is anexception, which makes the rule. In the 1970s allgovernments agreed to require labelling for irradiat-ed food, and enshrined the agreement in the CodexAlimentarius. One result of that was that the supplychain did not adopt irradiation because of consumerfears. This experience at least partly explains pro-ducers’ and exporters’ concerns about mandatorylabelling of GM elements in foods.
Caswell (1998) argues that labelling is anessential element in an efficient market because itoffers consumers full information. Labels help tomatch producers that use different technologieswith consumers who want to buy products with spe-cific process attributes. Mandatory labelling wouldoperate similarly to the irradiation labelling whilevoluntary labelling would probably operate in a sim-ilar way to other labelling systems that signal a widevariety of ‘non-risky’ processes that consumers pre-fer, such as ‘green’ status, organics, kosher, halal andethically produced foods. She suggests that eithervoluntary or mandatory labelling will do the job,but that mandatory labelling would be more costlyas the entire market would need to be segregatedand labelled, rather than only the portion of pro-duction and consumption that valued specificprocess traits. Assuming that the minority prefer-ence would be segregated, Table 20.1 suggests thatat most 43% of any single market (the US marketthat is indifferent to GM foods) and at a minimum18% (the German market that is indifferent to GMfoods) would need to be segregated. Caswell con-cludes ‘governments are likely to prefer voluntary ormandatory approaches based on their perceptions ofwhat proportion of their citizens want informationabout the technology’. Caswell suggests that publicdemand for information regarding new technologywill influence a government’s decision to pursuevoluntary or mandatory labelling.
This chapter examines the practice of labellingas it is used both by governments and by privatefirms.
The Data
The authors undertook a search of various Internetsources between 20 December 1999 and 8 February
2000, in order to identify countries or firms thathave adopted or have announced plans to adopteither voluntary or mandatory labelling for GMfoods or food products. The search focused primari-ly on two main Internet sources: Agnet, an Internetarchive of news and journal briefs produced byresearchers at the Agri-Food Risk Management andCommunications Project at the University ofGuelph (www.plant.uoguelph.ca/ risk comm/news-today/today.html#Agnet) and the Financial Times ofLondon (www.ft.com/). Additional searches wereundertaken of the OECD BioTrack Online (www.oecd.org/ehs/country.htm) and The Economist(www.economist.com/). The authors acknowledgethat these sources may offer incomplete data.
The State of Labelling for GM Foods
The objective of the survey was to describe labellingregulations designed for food products containing(or perceived to contain) GM organisms. The surveysummarized the labelling requirements of 19 coun-tries plus the EU, 29 food manufacturers, 21 fooddistributors/retailers and six restaurant chains. Thesurvey reveals that states and the food industry haveadopted a variety of GM labelling regulations. Theregulations differ in terms of administration of theregulation, the degree to which the regulation affectsfood production and the date that the regulationwas or will be effective.
National legislation
At a national level, labelling regulations can be cate-gorized as voluntary, mandatory or mandatory onlyabove some tolerance level. Under a voluntarylabelling scheme GM-free foods will be positivelylabelled. Table 20.2 presents the status of nationalrules for labelling GM foods.
Voluntary labelling has been adopted byCanada, the USA and Argentina. Canada and theUSA have initiated efforts to assist industry to devel-op standards and implement consistent and crediblevoluntary labelling systems. In September 1999 theCanadian Government announced it would supportefforts by the Canadian Council of GroceryDistributors (CCGD) and the Canadian GeneralStandards Board (CGSB) to develop a Canadianstandard for the voluntary labelling of GM foods.The CGSB set up a committee supported by food
248 P.W.B. Phillips and H. McNeill
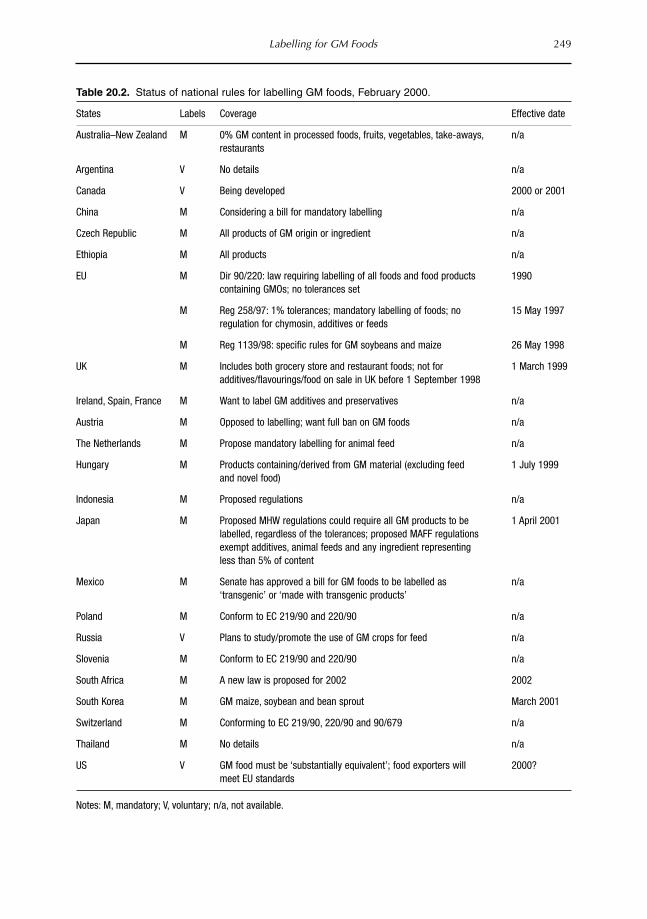
Labelling for GM Foods 249
Table 20.2. Status of national rules for labelling GM foods, February 2000.
States Labels Coverage Effective date
Australia–New Zealand M 0% GM content in processed foods, fruits, vegetables, take-aways, n/arestaurants
Argentina V No details n/a
Canada V Being developed 2000 or 2001
China M Considering a bill for mandatory labelling n/a
Czech Republic M All products of GM origin or ingredient n/a
Ethiopia M All products n/a
EU M Dir 90/220: law requiring labelling of all foods and food products 1990containing GMOs; no tolerances set
M Reg 258/97: 1% tolerances; mandatory labelling of foods; no 15 May 1997 regulation for chymosin, additives or feeds
M Reg 1139/98: specific rules for GM soybeans and maize 26 May 1998
UK M Includes both grocery store and restaurant foods; not for 1 March 1999additives/flavourings/food on sale in UK before 1 September 1998
Ireland, Spain, France M Want to label GM additives and preservatives n/a
Austria M Opposed to labelling; want full ban on GM foods n/a
The Netherlands M Propose mandatory labelling for animal feed n/a
Hungary M Products containing/derived from GM material (excluding feed 1 July 1999and novel food)
Indonesia M Proposed regulations n/a
Japan M Proposed MHW regulations could require all GM products to be 1 April 2001labelled, regardless of the tolerances; proposed MAFF regulations exempt additives, animal feeds and any ingredient representing less than 5% of content
Mexico M Senate has approved a bill for GM foods to be labelled as n/a‘transgenic’ or ‘made with transgenic products’
Poland M Conform to EC 219/90 and 220/90 n/a
Russia V Plans to study/promote the use of GM crops for feed n/a
Slovenia M Conform to EC 219/90 and 220/90 n/a
South Africa M A new law is proposed for 2002 2002
South Korea M GM maize, soybean and bean sprout March 2001
Switzerland M Conforming to EC 219/90, 220/90 and 90/679 n/a
Thailand M No details n/a
US V GM food must be ‘substantially equivalent’; food exporters will 2000?meet EU standards
Notes: M, mandatory; V, voluntary; n/a, not available.
industry, producer and consumer interests, whichwas scheduled to report recommendations in 2000.Agreement proved difficult to attain, because thecommittee works on consensus, and is still someway away (The Western Producer, 2000b).
In the USA, the USDA announced inSeptember 1999 an independent scientific review ofits biotechnology regulatory system. Public meet-ings in December 1999 highlighted public concernsabout the lack of labels. In response, the industry isworking with the government to develop a volun-tary labelling system. Meanwhile, in November1999 the ‘GE Right to Know Act’ which would rulefor mandatory labelling was introduced to Congressand by February 2000 had the support of 48 con-gressional members (equal to about 10% of the vot-ing members). One recent development has beenthe increase in local efforts to impose new labellingrules. As of May 2000, altogether 16 US states hadintroduced bills that would require labelling for GMfoods (Niiler, 2000).
At the other extreme, 15 countries, includingthe EU and its member states, have adopted orannounced plans to implement mandatory labellingsystems. As of May 2000, the EU and Japan hadrevealed the structure of their labelling rules. TheUK was the only country that had implementedlabelling rules (mainly Directive 258/97). A numberof countries have proposed mandatory labelling. Forexample, Hungary, Poland and Switzerland haveindicated that they are following or will adhere tothe EU standards. Still, there is no available evidencethat these countries have developed domestic sys-tems to manage those regulations. China, the CzechRepublic and Thailand have also announced dead-lines for implementing mandatory labelling regula-tions for GM foods, but none of them has indicatedwhen their system might be operating. At least threecountries have announced definite dates to imple-ment mandatory labelling systems. Japan and SouthKorea plan to implement labelling regulations byspring 2001 while South Africa announced itintends to implement its labelling regulations by2002.
Although many countries have announcedplans to implement mandatory labelling, only a fewof them have developed their proposals sufficientlyto be able to identify the tolerance level for GMcontent that will trigger mandatory labelling. Fourmerit some discussion.
In the EU, a number of directives set theframework for labelling systems in member states.
Dir 90/220, the environmental regulation (in par-ticular Annex III), sets the basic legal framework forlabelling in the EU, mandating that products thatcontain GM elements should be labelled; theDirective did not, however, set tolerances. In thefirst instance, this Directive required labelling ofGM varieties in the seed guides. The EU NovelFoods Regulation 258/97 then set the 1% tolerancelevel for foods. Because GM varieties of maize andsoybeans were already released before Reg 258/97was adopted, the EU passed Reg 1138/98 to explic-itly require regulations for those two varieties. Noneof these directives or regulations requires labellingfor GM additives, flavourings or active ingredients.Furthermore, although animal feed must belabelled, the meat produced using those feeds doesnot require labels under current rules. Finally, EUregulators have ruled that processed edible oils fromGM maize, soybeans and canola will not requirelabels, as they do not contain any novel proteins. Allof the novel traits are left in the meal, which if con-sumed by humans must be labelled. Given the prac-tice of subsidiarity in the EU, Union Directives andRegulations do not come into effect until memberstates enact those provisions in their national laws. Anumber of EU member states have indicated inten-tions to go beyond the EU base, extending labellingrequirements to additives and preservatives.
So far, the UK is the only EU member state toenact national legislation to activate the EU rules.As of March 1999 all foods, additives and flavour-ings that entered the market after 1 September 1998that contain more than 1% GM content requirelabels. In April 2000 the new Food Safety Agencyextended that provision to all GM foods, additivesand flavourings, including those on the marketbefore 1998. The UK also requires that all restau-rant meals involving GM foods are labelled. In sup-port of these rules, the UK has adopted a range offinancial penalties for mislabelling of product. Onefeature that could complicate the UK regulatory sys-tem is the recent devolution of legislative authorityto the Welsh Assembly and Scottish Parliament.Wales has already attempted to exert some influenceover UK regulation of GM foods by proposing toreject approval of a GM maize variety that had beenapproved in England. In this case, if the Welsh deci-sion had stood, the variety would not have beencommercialized in the UK. By extension, the devo-lution of authority to the regional assemblies couldlead to some inconsistencies across the UK.
Japan has proposed a set of mandatory
250 P.W.B. Phillips and H. McNeill

labelling regulations to be effective on 1 April 2001.Two agencies have offered rules that will affect howGM products are marketed. The Ministry of Healthand Welfare (MHW) has developed regulations thatwill require all GM food products and food addi-tives to be assessed for safety. To date, MHW hasapproved 29 GM crops and 6 GM food additives assafe to enter Japan. Furthermore, MHW requiresthat food products made from the safety-approvedcrops and additives must be labelled. As of April2001, no GM food is authorized for marketing inJapan without having secured the required safetyassessments by the MHW.
In contrast, the Ministry of Agriculture, Foodand Fisheries (MAFF) has proposed regulations thatwill require labelling for 24 proscribed food prod-ucts (no food additives are included). MAFF regula-tions would require labels for rDNA ingredientsonly if the ingredient is one of the top three foodingredients by weight and composes at least 5% ofthe total weight of the product. Labelling would notbe required on packages less than 30 cm2. In sup-port of MAFF regulations, Japan will requireimporters to label as GM all bulk shipments withmore than 5% GM content. Between 1 and 5% tol-erances, products would have to be labelled ‘maycontain’. Shipments containing less than 1% GMmaterial would not require any labelling.
It is not clear whether both the MHW andMAFF rules will be in effect. MHW requires all GMfood products and additives to be labelled whileMAFF requires the specified 24 food products (nofood additives included) to be labelled. UnderMAFF regulations, Japan could allow unlabelledproducts with up to 5% GM content. Alternatively,MHW would require labelling of products witheven a trace of GM material. It is too early to tellhow the system will actually operate; however, theMHW is expected to follow MAFF legislation.
Australia and New Zealand, via the jointAustralia–New Zealand Food Standards Council,have announced plans to introduce mandatorylabelling for any food, processed food, fruit, veg-etable, take-away or restaurant meals that have anydetectable amount of GM content. In effect, theirtolerance is 0%.
Although these tolerance levels provide somepotential for consumer choice, there is no consisten-cy or consensus among national governments overthe level or enforceability of tolerance levels.Furthermore, it is not clear exactly what the labelwill say. There are a variety of messages that could be
used, offering a variety of information and connota-tions (e.g. ‘GM ingredients’, ‘Warning: containsGM ingredients’ or a symbol indicating the presenceof GM products). Several EU and Japanese firmshave taken the initiative to label products with lessthan 1% GM content as ‘GM free’ or ‘non-GM’.
Labelling policy is being administered by awide variety of governmental bodies. For example,in Argentina and Japan the Agriculture Ministry isin charge, while in South Korea it is the Ministry ofForeign Affairs. In Canada the Canadian FoodInspection Agency and Health Canada are bothinvolved. In the USA, the FDA is responsible. Inthe UK, the Department of the Environment,Transport and the Regions enforces the labellingrequirement for GM foods, while the FSA remainsresponsible for developing and communicating therules and standards. These different locations forresponsibility also affect the orientation and proce-dures used to evaluate options and manage theprocess.
Application of the rules also varies widely.Many of the proposed labelling rules tend to focuson consumption of soybeans and maize, whichtogether accounted for more than 80% of the glob-al GM acreage in 1999. The other two main GMcrops are cotton, which is not ingested by humans,and canola, the oil of which is deemed GM free andthe meal which is not ingested directly by humans.Meanwhile, only Australia, New Zealand and theUK have proposed labelling regulations for take-aways and restaurants. Furthermore, only the UKhas rules in place to require labelling of GM materi-al in food additives (e.g. chymosin in cheese,lecithin and artificial flavours). Most countries (e.g.Canada and the EU) already regulate additivesthrough other laws and already have extensivelabelling requirements for those elements. For exam-ple, in Canada the Food and Drug Act regulates theuse of additives. However, the EU recentlyannounced that it would pursue labelling require-ments for additives with detectable GM protein.Finally, no country has yet required meats fed onGM feeds to be labelled, although the EU has men-tioned the need for such regulations. Scientific evi-dence (The Western Producer, 2000a) so far does notshow any transmission of GM elements between thefeed and the animals. Furthermore, initial resultsfrom consumer surveys tend to suggest that so farconsumers have few concerns about GM feeds.
Finally, a number of countries have expressedinterest in or concern about GM foods but have yet
Labelling for GM Foods 251

to announce whether they will impose labellingrules. Brazil, Turkey, Ethiopia and Singapore are allin the undecided camp while Russia has recentlystarted to study and promote GM crops for feed,but has not stated whether GM products forhumans should be labelled or consumed.
Private industry labelling systems
Private companies in many cases have not waited fornational legislation to clarify the requirements forGM food labels. Following Iceland Foods’ decisionin 1998 to make their own-label products GM freeand to market them as such, a wide array of retail-ers, processors, restaurateurs and wholesalers havefollowed suit (Table 20.3).
Several firms in the EU, particularly in the UK,have initiated private labelling. Legislation at boththe EU level and at the member state level has sig-nalled to producers the direction the industry isgoing. Rather than wait for the final dust to settle,however, private firms have in many cases actedbefore the legislation has been promulgated. Themain catalyst can probably be traced to the UK. Allfoods in the UK have had to be labelled since March1999. Given that many European food processorshave integrated their operations on a continentalbasis, it is next to impossible to produce GM-freefoods for the UK and GM foods for the rest ofEurope. Those companies with significant marketshares in the UK have a clear incentive to make theirentire EU production GM free (Bredahl, 1999).Several UK firms have endorsed more stringentlabelling rules than required by national law. Forexample, Marks & Spencer has announced it willtolerate less than 0.1% GM content in own-labelproducts; otherwise products will not be sold.Marks & Spencer also has a line of ‘GM free’ meatand eggs. The predominance of UK firms with strictprivate regulations is related to the extensive regula-tions the UK has adopted, including greater scopefor labelling and hefty fines (£5000) if GM contentsare found in an unlabelled product.
EU retailers have also responded aggressively.Even though EC Reg 258/97 does not operate yet inmany of the EU member states, seven largeEuropean supermarket chains have joined forces toeliminate GM ingredients in their own-label prod-ucts. The consortia initially included Carrefour(France), Delhaize (Belgium), Marks & Spencer(UK), Migros (Switzerland), Sainsbury’s (UK),
SuperQuinn (Ireland) and Tesco (UK). In addition,Effelunga in Italy, Edeka Association on the conti-nent and UK retailers Somerfield, Tesco, Waitrose,Iceland Foods and Northern Foods, and many UKwholesalers claim that their own-label products donot contain GM materials. When Carrefour,France’s largest supermarket and the world’s thirdlargest retailer, decided to remove GM ingredientsfrom its own-brand products, it discovered that 516of its 1783 own-label products contained GM ingre-dients. They replaced GM ingredients with non-GM substitutes in 286 of the products; for 221products where alternative ingredients were notavailable, Carrefour offers a guarantee of origin andhas demanded that its suppliers guarantee and provetheir products do not contain GM ingredients. Nineproduct lines were discontinued because it wasimpossible to guarantee their GM-free status (Ram’sHorn, 1999).
Although national legislation has inducedmany private labelling requirements, there are sever-al food retailers that have pursued labelling policieswithout national encouragement. For example,Woolworth’s (South Africa) and Park N’Shop(China and Hong Kong) have announced they willeliminate all own-brand products with GM ingredi-ents (or find substitutes) from their shelves. Whilethe Grocery Manufacturers of America stronglyoppose mandatory labelling, three US-based retail-ers have announced intentions to go GM free. Twoorganic and natural-food stores – Whole Foods MktInc. and Wild Oats Mkts Inc. – have been joined byGenuardi’s Family Markets in Philadelphia. Threechains – Loblaws in Canada and Pick n Pay andCheckers (Shoprite) in South Africa – have indicat-ed that they will not remove GM products fromtheir shelves nor will they make their own labelproducts GM free.
The action by large grocery chains and thepending labelling rules under EU legislation hasprompted at least 23 manufacturers and foodprocessors to remove all products with GM contentor replace GM with non-GM ingredients in theirproduct lines (Table 20.4). In addition, five proces-sors have signalled that they do not want GM wheator durum (which is not expected in the market until2003) while only one processor (in Japan) has said itdoes not want to segregate and label GM products.While a few processors have announced that theywill make all of their products worldwide GM free(e.g. Gerber, FritoLay, Seagram), most of the proces-sors have targeted to remove GM traits from only
252 P.W.B. Phillips and H. McNeill
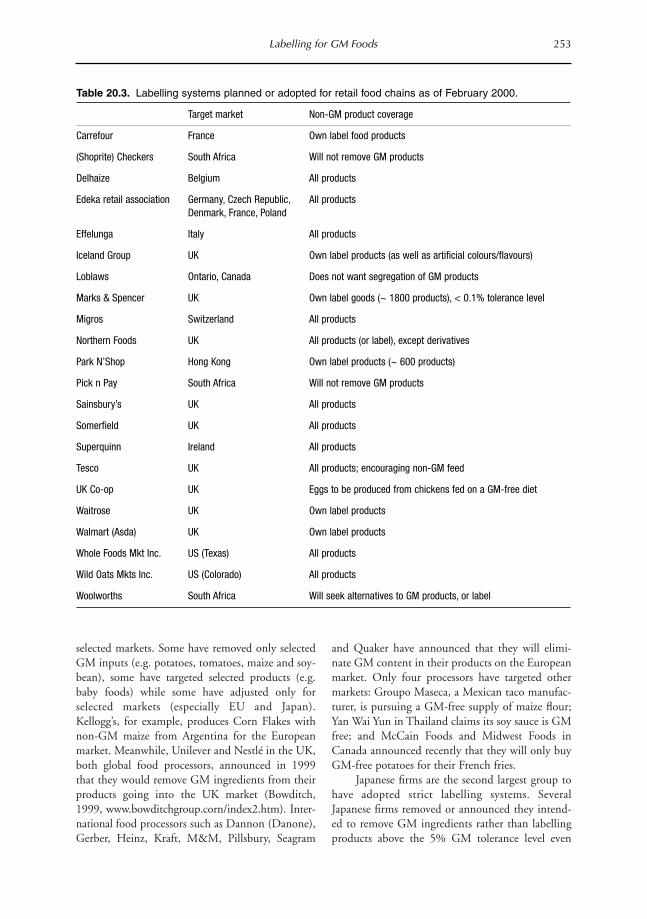
selected markets. Some have removed only selectedGM inputs (e.g. potatoes, tomatoes, maize and soy-bean), some have targeted selected products (e.g.baby foods) while some have adjusted only forselected markets (especially EU and Japan).Kellogg’s, for example, produces Corn Flakes withnon-GM maize from Argentina for the Europeanmarket. Meanwhile, Unilever and Nestlé in the UK,both global food processors, announced in 1999that they would remove GM ingredients from theirproducts going into the UK market (Bowditch,1999, www.bowditchgroup.corn/index2.htm). Inter-national food processors such as Dannon (Danone),Gerber, Heinz, Kraft, M&M, Pillsbury, Seagram
and Quaker have announced that they will elimi-nate GM content in their products on the Europeanmarket. Only four processors have targeted othermarkets: Groupo Maseca, a Mexican taco manufac-turer, is pursuing a GM-free supply of maize flour;Yan Wai Yun in Thailand claims its soy sauce is GMfree; and McCain Foods and Midwest Foods inCanada announced recently that they will only buyGM-free potatoes for their French fries.
Japanese firms are the second largest group tohave adopted strict labelling systems. SeveralJapanese firms removed or announced they intend-ed to remove GM ingredients rather than labellingproducts above the 5% GM tolerance level even
Labelling for GM Foods 253
Table 20.3. Labelling systems planned or adopted for retail food chains as of February 2000.
Target market Non-GM product coverage
Carrefour France Own label food products
(Shoprite) Checkers South Africa Will not remove GM products
Delhaize Belgium All products
Edeka retail association Germany, Czech Republic, All products Denmark, France, Poland
Effelunga Italy All products
Iceland Group UK Own label products (as well as artificial colours/flavours)
Loblaws Ontario, Canada Does not want segregation of GM products
Marks & Spencer UK Own label goods (~ 1800 products), < 0.1% tolerance level
Migros Switzerland All products
Northern Foods UK All products (or label), except derivatives
Park N’Shop Hong Kong Own label products (~ 600 products)
Pick n Pay South Africa Will not remove GM products
Sainsbury’s UK All products
Somerfield UK All products
Superquinn Ireland All products
Tesco UK All products; encouraging non-GM feed
UK Co-op UK Eggs to be produced from chickens fed on a GM-free diet
Waitrose UK Own label products
Walmart (Asda) UK Own label products
Whole Foods Mkt Inc. US (Texas) All products
Wild Oats Mkts Inc. US (Colorado) All products
Woolworths South Africa Will seek alternatives to GM products, or label
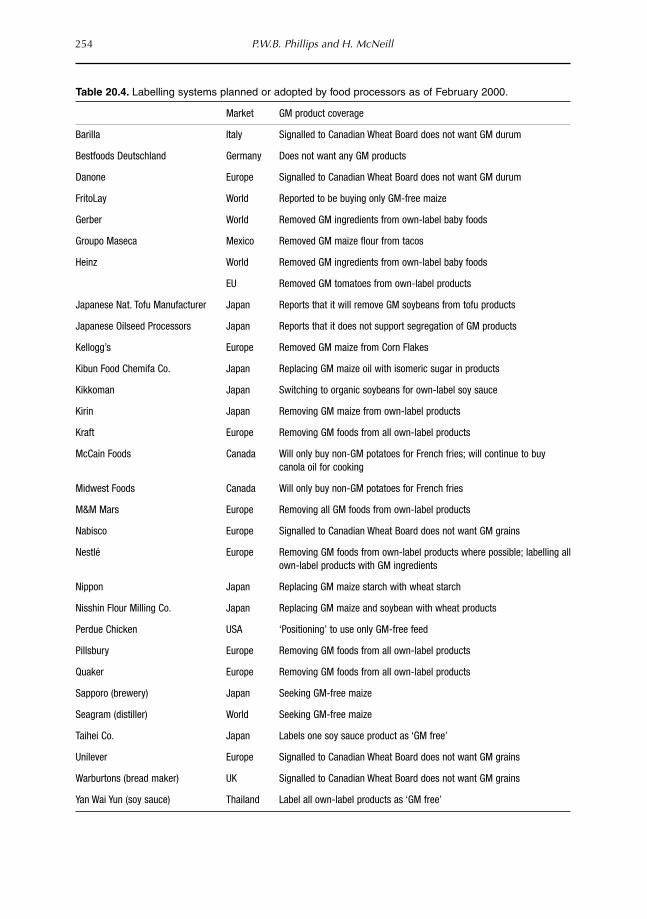
254 P.W.B. Phillips and H. McNeill
Table 20.4. Labelling systems planned or adopted by food processors as of February 2000.
Market GM product coverage
Barilla Italy Signalled to Canadian Wheat Board does not want GM durum
Bestfoods Deutschland Germany Does not want any GM products
Danone Europe Signalled to Canadian Wheat Board does not want GM durum
FritoLay World Reported to be buying only GM-free maize
Gerber World Removed GM ingredients from own-label baby foods
Groupo Maseca Mexico Removed GM maize flour from tacos
Heinz World Removed GM ingredients from own-label baby foods
EU Removed GM tomatoes from own-label products
Japanese Nat. Tofu Manufacturer Japan Reports that it will remove GM soybeans from tofu products
Japanese Oilseed Processors Japan Reports that it does not support segregation of GM products
Kellogg’s Europe Removed GM maize from Corn Flakes
Kibun Food Chemifa Co. Japan Replacing GM maize oil with isomeric sugar in products
Kikkoman Japan Switching to organic soybeans for own-label soy sauce
Kirin Japan Removing GM maize from own-label products
Kraft Europe Removing GM foods from all own-label products
McCain Foods Canada Will only buy non-GM potatoes for French fries; will continue to buycanola oil for cooking
Midwest Foods Canada Will only buy non-GM potatoes for French fries
M&M Mars Europe Removing all GM foods from own-label products
Nabisco Europe Signalled to Canadian Wheat Board does not want GM grains
Nestlé Europe Removing GM foods from own-label products where possible; labelling allown-label products with GM ingredients
Nippon Japan Replacing GM maize starch with wheat starch
Nisshin Flour Milling Co. Japan Replacing GM maize and soybean with wheat products
Perdue Chicken USA ‘Positioning’ to use only GM-free feed
Pillsbury Europe Removing GM foods from all own-label products
Quaker Europe Removing GM foods from all own-label products
Sapporo (brewery) Japan Seeking GM-free maize
Seagram (distiller) World Seeking GM-free maize
Taihei Co. Japan Labels one soy sauce product as ‘GM free’
Unilever Europe Signalled to Canadian Wheat Board does not want GM grains
Warburtons (bread maker) UK Signalled to Canadian Wheat Board does not want GM grains
Yan Wai Yun (soy sauce) Thailand Label all own-label products as ‘GM free’

before the law came into effect on 1 April 2001. Forexample, the Japanese National Tofu ManufacturersAssociation and soy sauce producers Kikkoman andTaihei Co. have announced that they will use onlynon-GM soybeans in food production. Japanesebreweries Kirin and Sapporo have stopped usingtransgenic maize in their products. Nippon (foodprocessor), Kibun Food Chemifa Co. (food proces-sor) and Nisshin Co. (flour mill) have announcedthat they will replace maize products with wheatproducts.
Several firms have made prospective state-ments, warning their suppliers that they will notaccept GM inputs. For example, food manufactur-ers such as Danone, Unilever and Warburtons haveannounced that they will eliminate GM ingredientsfrom their products and have warned the CanadianWheat Board (CWB), in particular, that they willnot accept GM wheat. Barilla, an Italian pastamaker, has also warned the CWB not to supply GMdurum. These statements demonstrate the firms’intentions, as no wheat, barley or durum is yet pro-duced by GM means. They have already had someeffect, as Agriculture and Agri-food Canada decidedin the face of rising consumer opposition to GMproducts to stop research efforts to develop trans-genic, herbicide tolerant durum (Calamai, 2000).
So far there has been only limited interest byprocessors in extending GM labelling to animals.While there has been some debate in the EU andUSA, so far there appears to be only one processor(Perdue Chicken, one of the largest poultry produc-ers in the USA) and one retail chain (UK Co-op)that was ‘positioning’ to use only GMO-free feed. InFrance, Carrefour and Cana-Caval, an agriculturalcooperative, have removed GM ingredients from thepet food they make and sell (Caplan, 2000).
Finally, a number of international fast-foodchains, responding in the first instance to UKlabelling laws that require GM foods in restaurantmeals to be labelled, have acted to remove GM
foods from their system. Burger King, Domino’sPizza, McDonald’s, Wagamama and Wimpy in theUK claim to be producing food with GM contentbelow the EU tolerance levels while Burger King inthe USA announced late in 1999 that it would actto ensure its French fries were produced using GM-free potatoes (Table 20.5).
There appear to be two reasons for firms toadopt labelling policies or to eradicate products withGM ingredients. Some firms claim to have takenthis route because of ethical views about GM ingre-dients or about the consumer’s right to know. Themajority of firms have adopted policies that willmaximize their profits. Iceland Foods, for instance,gained market share in the UK retail industry andsaw strong profit growth after it declared it wasremoving all products with GM content. It is likelythat the consortium of EU retailers that respondedto Iceland’s policy and announced their own GMpolicies were trying to increase their market share.Other retailers followed with their own GM policiesto remain competitive. Once part of the market haddeclared itself to be GM free, the risk of being iso-lated rose. The same could be said of many of theprocessors and food chains. Companies in those sec-tors have been slow, and somewhat hesitant, toadopt GM labels or GM-free status. In spite ofstrongly held private views, very few firms have pub-licly opposed labelling or removing GM elementsfrom their products.
Early in 2000 a consortium of 30 US invest-ment groups sent proxy resolutions to 19 well-known restaurant, food, grocery and seed compa-nies. The consortium planned to use this proxy tohave a debate about the use of GM foods (USAToday, 2000). Resolutions involving Quaker Oats,Coca-Cola Co. and PepsiCo were rejected (TheWestern Producer, 2000b). It is too early to saywhether this shareholder activism will force UScompanies to engage more fully in the GM debate.
Labelling for GM Foods 255
Table 20.5. Labelling systems implemented by restaurant chains.
Target market Non-GM product coverage
Burger King (USA) USA PotatoesBurger King (UK) UK All ingredients and possibly derivativesDomino’s Pizza (UK) UK All ingredients and possibly derivativesMcDonald’s (UK) UK All ingredients and possibly derivativesWagamama UK All products and additivesWimpy (UK) UK All ingredients and possibly derivatives

Conformity measures and costs
While labels may improve consumer information,they can only do so if the seller actually delivers theproduct promised. Carrefour’s experience showsthat a wide range of products may actually containGM ingredients. Once the ingredients have beenidentified, it has so far been relatively easy to securesupplies of GM-free ingredients from markets notyet using GM seeds. However, as GM technologyspreads it will become more difficult to find suppliesthat one can confidently state are GM free. The teststo determine if products are GM free are costly andslow, with the result that few tests can realistically beundertaken.
Stave and Durandetta (2000) identify two gen-eral techniques of evaluating the GM content ofcrops or foods. One technique is based on a poly-merase chain reaction (PCR) that detects the pres-ence of transgenes or their proteins but they cannotestablish their levels in samples. A second techniqueuses immunoassays ELISA to detect novel proteinsin crops and processed foods. The ELISA techniquecan determine whether the novel protein is above orbelow a particular threshold. At a 2% threshold, oneform of the ELISA test was identified as being 99%confident that samples identified as below thethreshold were correct and that samples measured asbeing over the threshold had at least 0.85% GMcontent. The within laboratory repeatability was ±7% and the reproducibility between laboratories was ± 10%.
The PCR test requires sophisticated laboratoryequipment, costs anywhere from US$400 to 700per sample, and routinely takes 3–10 days to com-plete. Current ELISA methods require only 1–4hours and cost approximately US$40–70 per test.Work is underway on a new form of the immunoas-say test that would use an immunochromatographicstrip. This test could cost less than US$10 and becompleted in the field in 5–10 min.
Because the current testing methods are unreli-able and costly, several firms have established identi-ty preserved production and marketing systems(with feedback loops and continuous improvementthrough Hazard Analysis Critical Control Points(HACCP)-style programmes) to secure GM-freevarieties. Even with these systems, it will be difficultto deliver truly GM-free product. In Canada, forinstance, pedigreed seed varietal purity standards,which are established by the Association of OfficialSeed Certifying Agencies (AOSCA) and referenced
in the regulations of the Canadian Seed Growers’Association (CSGA), permit up to 0.5% of othervarieties. Hence, a 1% threshold for mandatorylabelling for GM foods in or from Canada couldalready have 0.5% of the GM level due to tolerancesin the seed variety, if that seed was produced inCanada.
Some companies are relying on their suppliersto secure and provide adequate non-GM inputs. In1999, for example, Archer Daniels Midland(ADM), a major grain wholesaler, informed US pro-ducers that it would be segregating GM from non-GM corn. ADM indicated that it might not buyGM varieties in the 2000 crop year. Early in 2000,ADM reported that only 5% of sales (by volume)from July to December 1999 demanded GM-freeproducts. As a result, ADM softened its policy, indi-cating it would continue to buy both GM and GM-free crops.
Somewhat hesitantly the grain marketing sys-tem is adapting to demands from its export markets.There are a number of examples in Canada whereproducers in the canola industry have for limitedperiods adopted identity preserved production andmarketing systems (IPPMs) for GM and non-GMnovel trait varieties (Phillips and Smyth, 1999;Smyth and Phillips, 2002). There are several suc-cessful IPPMs in the USA as well. For example,Dupont’s Optimum Quality Grain (OQG) is segre-gated through the supply chain by a series of con-tracts. ADM, ConAgra, and Consolidated Grainand Barge manage the logistics of the export mar-keting system for OQG. Similarly, several Japanesefirms make private contracts with US producers forspecific types of soybean. One example is the rela-tionship between Clarkson Grain (USA) andNisshin Shokai. Clarkson Grain has a contract toproduce GM-free soybeans primarily for Japanesesoy food manufacturers. The Illinois CropImprovement Association tests the soybeans to meeta 99.5% GM-free standard.
The USA, the single largest grain and oilseedexporter in the world, also announced in January2000 that it would establish a new export policy toensure that exports from the USA meet the rules ofimport markets. The policy is yet to come intoeffect. At the same time, many of the biotechnologyand seed companies (e.g. Monsanto and Aventis)have agreed to work with importing nations and thegrain trade to ensure that their products conform tonational regulations (e.g. EC 90/220 and Japaneselabelling laws) and processor requirements. For
256 P.W.B. Phillips and H. McNeill

example, in early 2000, Monsanto provided, free ofcharge, genetic information to facilitate tests todetect their NewLeaf TM GM potatoes. This assistedCanadian potato producers to sort their seed stockwhich allowed them to plant crops that will meetMcCain Foods and Midwest Foods specificationsfor GM-free potatoes.
There are few estimates of what an effectivelabelling and segregation system might cost. Oneestimate suggests that a temporary, voluntary, IPPMsystem for GM canola in Canada during1995–1996 cost an average 13–15% of farm gateprice to establish and manage (Phillips and Smyth,1999). In Australia and New Zealand, industrycompliance with the proposed labelling law was esti-mated to cost A$3 billion (approximately 6% ofturnover) in the first year of operation of the stan-dard and around 3% of turnover in subsequentyears. The study concluded that the food industrycould not absorb these cost increases and that pricesfor major ingredients could rise by around 10–15%.The increase in the price of ingredients could trans-late into retail price rises of 0.5–15% for processedfoods, depending on the proportion of the retail costrepresented by the raw material (KPMG, 1999).
Implications
Labelling regulations could have significant impactson production and trade flows. Table 20.6 shows thenumber of total importing countries and the per-centage of them that either now have or have
announced intentions to introduce mandatorylabelling systems. For example, countries withmandatory labelling import 77% of the canolaexports. Flax is exported to 74 countries, 87% ofwhich is destined for countries that currently requirelabelling. This table assumes that Argentina,Canada, the USA and Russia require voluntarylabelling.
The USA, Argentina and Canada are three keyproducers and exporters of GM foods. Together,these three countries produced 99% of total GMfoods in 1999. Table 20.7 shows that in 1999, over50% of Canadian exports of agricultural commodi-ties went to countries that propose to set up volun-tary or mandatory labelling laws. The only excep-tion was durum exports, of which only 31% went tocountries currently requiring or proposing labelling.
The quantity of imports to countries that haveproposed mandatory labelling indicates that forgo-ing those export markets with labelling rules will notbe a realistic option. It will be very difficult andexpensive for exporters to conform to the labellingrules of each importer. Indeed, the variety oflabelling for GM foods in the world marketplaceposes serious threats to the international trade sys-tem. Inconsistent policies cause uncertainty andtherefore threaten investment in agriculturalbiotechnology applications.
One way to manage the changes that are need-ed will be through international negotiation (seePhillips, 2002). The current option being pursuedwould be to negotiate a common set of labellingrules at Codex Alimentarius that could help to
Labelling for GM Foods 257
Table 20.6. International trade related to countries with labelling policies (source: FAO, 2000).
% of total imports % of total importsTotal global imports Total number of into countries with into countries with
Commodities (thousand tonnes) countries importing mandatory labelling voluntary labelling
Canola 14,750 133 77 16Flax 665 74 87 3Maize 74,437 168 62 3Melon 55 13 15 0Papaya 114 56 22 45Potato 10,706 177 70 12Rice 6,832 95 32 2Soybeans 81,752 173 75 2Squash 525 32 56 41Sugarbeet 169 26 80 0.3Tobacco 3,019 196 51 19Tomato 4,813 140 55 29
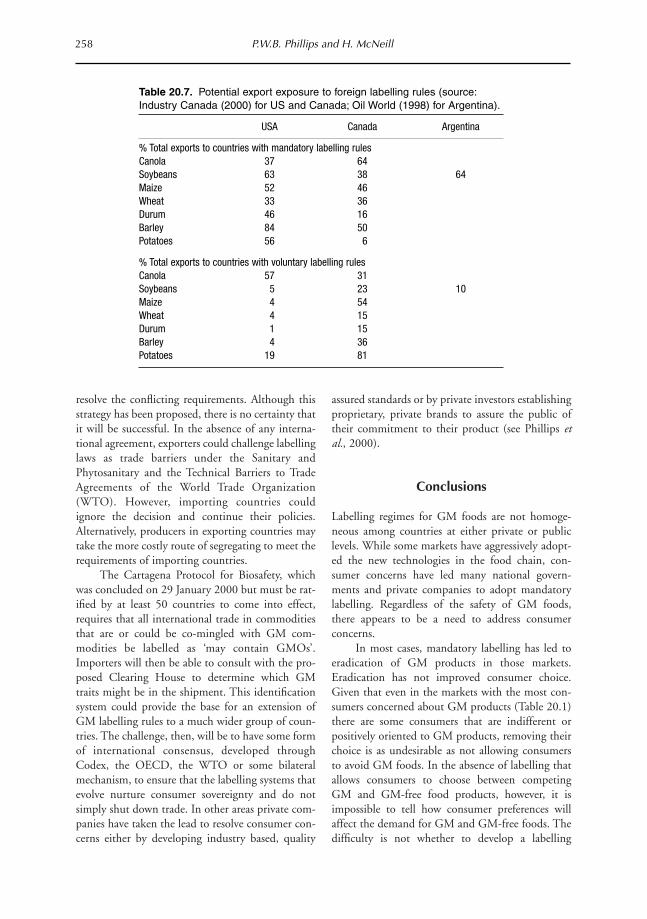
resolve the conflicting requirements. Although thisstrategy has been proposed, there is no certainty thatit will be successful. In the absence of any interna-tional agreement, exporters could challenge labellinglaws as trade barriers under the Sanitary andPhytosanitary and the Technical Barriers to TradeAgreements of the World Trade Organization(WTO). However, importing countries couldignore the decision and continue their policies.Alternatively, producers in exporting countries maytake the more costly route of segregating to meet therequirements of importing countries.
The Cartagena Protocol for Biosafety, whichwas concluded on 29 January 2000 but must be rat-ified by at least 50 countries to come into effect,requires that all international trade in commoditiesthat are or could be co-mingled with GM com-modities be labelled as ‘may contain GMOs’.Importers will then be able to consult with the pro-posed Clearing House to determine which GMtraits might be in the shipment. This identificationsystem could provide the base for an extension ofGM labelling rules to a much wider group of coun-tries. The challenge, then, will be to have some formof international consensus, developed throughCodex, the OECD, the WTO or some bilateralmechanism, to ensure that the labelling systems thatevolve nurture consumer sovereignty and do notsimply shut down trade. In other areas private com-panies have taken the lead to resolve consumer con-cerns either by developing industry based, quality
assured standards or by private investors establishingproprietary, private brands to assure the public oftheir commitment to their product (see Phillips etal., 2000).
Conclusions
Labelling regimes for GM foods are not homoge-neous among countries at either private or publiclevels. While some markets have aggressively adopt-ed the new technologies in the food chain, con-sumer concerns have led many national govern-ments and private companies to adopt mandatorylabelling. Regardless of the safety of GM foods,there appears to be a need to address consumerconcerns.
In most cases, mandatory labelling has led toeradication of GM products in those markets.Eradication has not improved consumer choice.Given that even in the markets with the most con-sumers concerned about GM products (Table 20.1)there are some consumers that are indifferent orpositively oriented to GM products, removing theirchoice is as undesirable as not allowing consumersto avoid GM foods. In the absence of labelling thatallows consumers to choose between competingGM and GM-free food products, however, it isimpossible to tell how consumer preferences willaffect the demand for GM and GM-free foods. Thedifficulty is not whether to develop a labelling
258 P.W.B. Phillips and H. McNeill
Table 20.7. Potential export exposure to foreign labelling rules (source:Industry Canada (2000) for US and Canada; Oil World (1998) for Argentina).
USA Canada Argentina
% Total exports to countries with mandatory labelling rulesCanola 37 64Soybeans 63 38 64Maize 52 46Wheat 33 36Durum 46 16Barley 84 50Potatoes 56 6
% Total exports to countries with voluntary labelling rulesCanola 57 31Soybeans 5 23 10Maize 4 54Wheat 4 15Durum 1 15Barley 4 36Potatoes 19 81

system for GM foods but rather how to develop asystem that provides real consumer choice.
It is unclear from this survey whether privatelabelling systems will harmonize standards acrossproducts and markets (perhaps establishing andadopting International Standards Organization(ISO) or Good Manufacturing Practices (GMP)quality assurances) or whether member states, indi-vidually or collectively through one or more of theinternational institutions, will negotiate a settle-ment. There are precedents for both approaches inother areas. In fact, many of the current sanitary andphytosanitary standards that are enshrined in theCodex system or the international plant or animalprotection conventions started as private industrystandards and then were adopted as internationalstandards through negotiation.
References
Ackerlof, G. (1970) The market for lemons: quality, uncer-
tainty and the market mechanism. Quarterly Journalof Economics 84, 488–500.
Angus Reid Group Inc. (1999) Biotechnology in Foods:Executive Highlights Report. Prepared for Ontario
Agri-Food Technologies, December. Angus Reid
Group Inc., Ottowa.
Angus Reid Group Inc. and The Economist (1999) World
Poll. www.ccu-cuc.ca/en/polls/data/angus.html
Bredahl, M. (1999) Supply, demand and greed.
Presentation to the Missouri Agricultural ExtensionStation Research Expo IX Panel Discussion onBiotechnology, Columbia, Missouri, 20 October.
University of Missouri, Columbia.
Bureau, J.-C., Marette, S. and Schiavina, A. (1997) Trade,
labels and consumer information: the case of
hormone-treated beef. Contributed Paper, XXIIConference of IAAE, Sacramento, August. Inter-
national Association of Agricultural Economists,
Sacramento, California.
Calamai, P. (2000) Ottawa gives up on splicing genes into
pasta ingredient: durum decision is partly due to
consumer outcry. Toronto Star 19 April, A6.
Caplan, A. (2000) Are Genetically Modified Foods Fit for aDog? Breaking Bioethics: Not in France. www.
med.upenn.edu/bioethics/breaking/25May00.html
Caswell, J. (1998) Should use of genetically modified
organisms be labeled? AgBioForum 1(1). www.agbio-
forum.missouri.edu/
Environics Research Group (2001) Secondary Analysis of
Public Opinion Research Regarding Genetically
Modified Food and Related Biotechnology Issues.
Report commissioned for the Canadian Biotechnology
Advisory Committee, 6 June. www.cbac.gc.ca/english/
Food and Agriculture Organization (FAO) (2000)
FAOSTAT: Agriculture data. www.apps.fao.org/
cgi-bin/nph-db.pl?subset=agriculture
Fukuyama, F. (1995) Trust: the Social Virtues and theCreation of Prosperity. Penguin Books, London.
Giannakas, K. (1999) Enforcement issues in GMO segre-
gation systems. Paper presented to the Economics ofQuality Control in Agriculture Conference, Saskatoon,
3 December. University of Saskatchewan, Saskatoon.
Industry Canada (2000) Strategis: Imports and exports
by product. www.strategis.ic.gc.ca/sc_mrkti/tdst/
engdoc/tr_homep.html
Isaac, G. and Phillips, P.W.B. (1999) Market access and
market acceptance for agricultural biotechnology
products. Paper presented to the ICABR Conferenceon The Shape of the Coming Agricultural BiotechnologyTransformation: Strategic Investments and PolicyApproaches from an Economic Perspective, Rome,
17–19 June. International Consortium on
Agricultural Biotechnology Research, University of
Rome, Tor Vergata.
James, C. (1999) Transgenic crops worldwide: Current sit-
uation and future outlook. Paper presented at the
Conference on Agricultural Biotechnology inDeveloping Countries: Towards Optimizing the Benefitsfor the Poor organised by ZEF and ISAAA in collab-
oration with AgrEvo and DSE, Bonn, 15–16
November 1999. ZEF, Bonn. www.zef.de/zef_
englisch/f_veranstalt_biotech.htm
KPMG (1999) Report on the Compliance Costs FacingIndustry and Government Regulators in Relation toLabelling Genetically Modified Foods. Report commis-
sioned by the Australia New Zealand Food Standards
Council, Canberra, October. www.anzfa.gov.au/
documents/gen24_99.asp
Marks, L. (1999) Media content analysis for biotech-
nology. Presentation to the Missouri AgriculturalExtension Station Research Expo IX Panel Discussionon Biotechnology, Columbia, Missouri, 20 October.
University of Missouri, Columbia.
Nenon, S. (1999) The USDA perspective on labeling. In:
McGaughey, B. and Redick, T. (eds) Liability andLabeling of Genetically Modified Organisms. Council
for Agricultural Science and Technology, Ames,
Iowa. www.cast-science.org/0002abab.htm
Niiler, E. (2000) Local efforts to enforce GM food labeling
are thwarted. Nature Biotechnology 18(6), 590.
OECD (1999) Modern Biotechnology and AgriculturalMarkets: a Discussion of Selected Issues and the Impacton Supply and Market. AGR/CA/APM/CFS/
MD*(2000)2. OECD, Paris.
Oil World (1998) Oil World 15 January 1999. ISTA
Mielke GmbH, Germany.
Phillips, P. (2002) International trade in genetically-
modified agri-food products. In: Moss, C. et al. (eds)
Agricultural Globalization, Trade and theEnvironment. Kluwer, Dordrecht.
Labelling for GM Foods 259

Phillips, P. and Buckingham, D. (2001) Agricultural
biotechnology, the environment and international
trade regulation: your place or mine. In:
Michelmann, M. et al. (eds), Globalization and NewAgricultural Trade Rules in the 21st Century. Lynne
Rienner Publishers.
Phillips, P. and Isaac, G. (1998) GMO labeling: threat or
opportunity. AgBioForum 1(1). www.agbioforum.
missouri.edu/
Phillips, P.W.B. and Smyth, S. (2000) Managing the value
of new-trait varieties in the canola supply chain in
Canada. Proceedings of the 4th Wageningen SupplyChain Conference, May. Wageningen Agricultural
University, The Netherlands.
Phillips, P. and Smyth, S. (2002) Competitors co-operat-
ing: establishing a supply chain to manage genetical-
ly modified canola. Special issue of the InternationalFood and Agribusiness Management Review.
Phillips, P., Porter, T. and Henry, O. (2000) Standards in
Emerging Biodiverse Industries: Western CanadianAgri-food Interests in the Canadian Standards Strategy.Western Economic Diversification, Saskatoon.
Ram’s Horn (1999) GE-free in France. Ram’s Horn 167, 7.
Stave, J. and Durandetta, D. (2000) GM crop testing
grows amid controversy. Today’s Chemist at Work,
9(6), 32–33, 37.
Stiglitz, J. (1999) Wither reform? Ten years of the transition.
In: Annual World Bank Conference on DevelopmentEconomics, 28–30 April. The World Bank,
Washington, DC.
Tirole, J. (1988) The Theory of Industrial Organization.MIT Press, Cambridge, Massachusetts, p. 106.
USA Today (2000) Firms face battle over altered food. USAToday, 14 February.
The Western Producer (2000a) Tests show no GMO residue
in animals. The Western Producer, 10 February, p. 25.
The Western Producer (2000b) Quaker rejects ban on
GMOs. The Western Producer, 25 May, p. 60.
260 P.W.B. Phillips and H. McNeill
Introduction
Adoption of biotechnology in the production ofmaize, soybeans and cotton by US producers hasgrown rapidly since its commercialization in 1996.In 1999, the proportion of total acreage in majorproducing states planted to biotech crops reached33% for maize, 57% for soybeans and 55% forupland cotton (USDA, 2000).1 In 2000, whilebiotech soybeans and cotton remained popular withfarmers in major producing states, accounting formore than one-half of acreage for both crops, USfarmers cut back the share of acreage planted tobiotech maize to 25%. In 2001, herbicide-tolerantsoybeans became even more popular with US farm-ers, reaching an adoption rate of 68% (USDA,2001). Biotech cotton also gained popularity, reach-ing an adoption rate of almost 70% of all cottonareas, and the share of biotech maize in actual plant-ings increased slightly to 26%.
The adoption momentum for biotech maizehas slackened since 2000. Factors that affect farmers’net returns – such as whether yield-increasingpotential offsets the higher cost for biotech seed, andwhether observed infestation levels of certain targetpests indicate likely savings on pesticide costs – playa major role in producers’ decisions regarding theadoption of biotech crops versus conventional vari-
eties. Uncertain market prospects for biotechcrops triggered by potentially widening interestin food labelling regulations in various countries,and possible shifts in consumer preferences towardsnon-biotech foods might also contribute to thecutback.
Although the decline in 2000 biotech maizeplantings in part reflects an overall market uncer-tainty for biotech crops, market demand for non-biotech maize is currently very limited, accountingfor only 1–2% of 1999 US maize production (Lin etal., 2000). Similarly, market demand for non-biotech soybeans is also small, accounting for about2–3% of US soybean production. Segregation formeeting these non-biotech demands is largely limit-ed to Japan, the EU (where less than 1% of USmaize exports is shipped, see Fig. 21.1) and a hand-ful of domestic food manufacturers that recentlydecided to use only non-biotech ingredients.
The purpose of this chapter is to develop a sce-nario analysis under which the costs of segregationfor non-biotech maize and soybeans are estimatedfor grain handlers, from country elevators to subter-minals and export elevators. It is important to notethat these cost estimates do not take into accountany additional costs that could be associated withsegregation at the farm level and shipment expensebeyond export elevators.
261
21 Estimating the Costs of Segregation forNon-biotech Maize and Soybeans
William W. LinERS, USDA, Washington, DC, USA
© CAB International 2002. Market Development for Genetically Modified Foods(eds V. Santaniello, R.E. Evenson and D. Zilberman)
1 Herbicide-tolerant varieties include those developed using both biotechnology and conventional breeding techniques.The adoption rate is expressed in terms of the percentage of harvested acres.
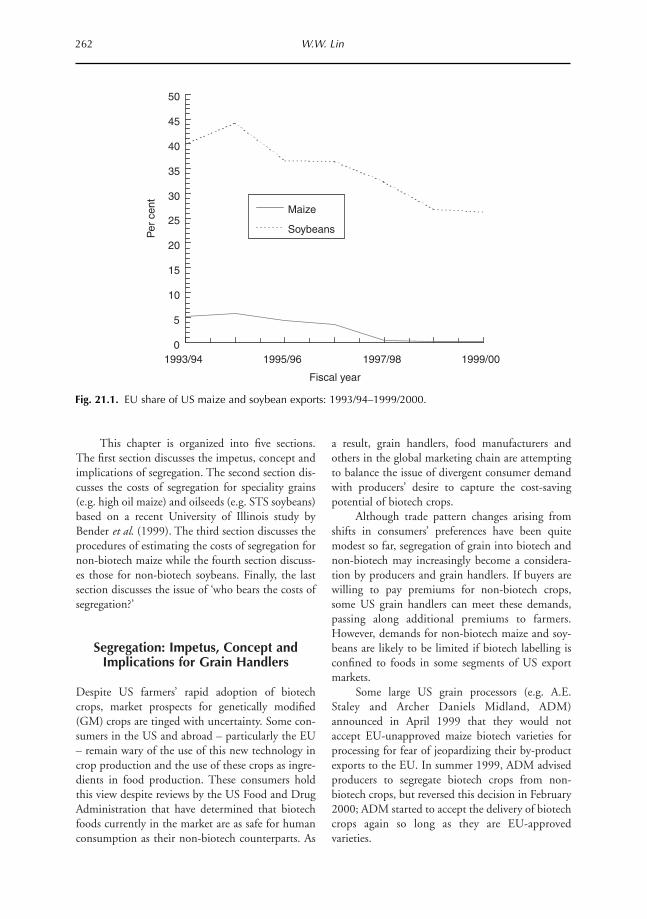
This chapter is organized into five sections.The first section discusses the impetus, concept andimplications of segregation. The second section dis-cusses the costs of segregation for speciality grains(e.g. high oil maize) and oilseeds (e.g. STS soybeans)based on a recent University of Illinois study byBender et al. (1999). The third section discusses theprocedures of estimating the costs of segregation fornon-biotech maize while the fourth section discuss-es those for non-biotech soybeans. Finally, the lastsection discusses the issue of ‘who bears the costs ofsegregation?’
Segregation: Impetus, Concept andImplications for Grain Handlers
Despite US farmers’ rapid adoption of biotechcrops, market prospects for genetically modified(GM) crops are tinged with uncertainty. Some con-sumers in the US and abroad – particularly the EU– remain wary of the use of this new technology incrop production and the use of these crops as ingre-dients in food production. These consumers holdthis view despite reviews by the US Food and DrugAdministration that have determined that biotechfoods currently in the market are as safe for humanconsumption as their non-biotech counterparts. As
a result, grain handlers, food manufacturers andothers in the global marketing chain are attemptingto balance the issue of divergent consumer demandwith producers’ desire to capture the cost-savingpotential of biotech crops.
Although trade pattern changes arising fromshifts in consumers’ preferences have been quitemodest so far, segregation of grain into biotech andnon-biotech may increasingly become a considera-tion by producers and grain handlers. If buyers arewilling to pay premiums for non-biotech crops,some US grain handlers can meet these demands,passing along additional premiums to farmers.However, demands for non-biotech maize and soy-beans are likely to be limited if biotech labelling isconfined to foods in some segments of US exportmarkets.
Some large US grain processors (e.g. A.E.Staley and Archer Daniels Midland, ADM)announced in April 1999 that they would notaccept EU-unapproved maize biotech varieties forprocessing for fear of jeopardizing their by-productexports to the EU. In summer 1999, ADM advisedproducers to segregate biotech crops from non-biotech crops, but reversed this decision in February2000; ADM started to accept the delivery of biotechcrops again so long as they are EU-approvedvarieties.
262 W.W. Lin
Fig. 21.1. EU share of US maize and soybean exports: 1993/94–1999/2000.
0
5
10
15
20
25
30
35
40
45
50
1993/94 1995/96 1997/98 1999/00
Fiscal year
Per
cen
t
Maize
Soybeans

In addition, some countries have begun torequire that foods containing biotech ingredients belabelled. The EU has implemented its labellingregulations for foods since mid-2000 and is cur-rently drafting feed labelling regulations. Japanimplemented its mandatory labelling policy for bio-engineered foods in April 2001 and South Koreastarted implementing its own in mid-2001.Australia, New Zealand and China are among othercountries adopting mandatory labelling policies forbioengineered foods. Potentially widening interestin food labelling regulation could be an impetus formore farmers and grain handlers to assess theirability to segregate or begin to take steps necessaryto segregate.
Over the last few years, a few food manufac-turers decided to end the use of biotech crops intheir operations. In July 1999, the Gerber andHeinz companies announced that their baby foodprocessing facilities would immediately stop usingbiotech ingredients. In January 2000, Bestfoods,Inc. decided to end its use of biotech ingredients inmanufactured foods destined for the EU, in order toavoid the biotech labelling requirement. Recently,Frito-Lay Inc. announced that it would cease usingbiotech maize in its snack food manufacturing.
Segregation requires that crops be kept separateto avoid commingling during planting, harvesting,loading and unloading, storage and transport. Thissupply chain system thus requires cleaning of equip-ment such as combines and augers, as well as trans-port and storage facilities. Such a handling processmay not involve containerized shipment, but testingto check for the presence of biotech contentthroughout the marketing system is critical.
Identity preservation (IP) is a more stringent(and expensive) handling process and requires thatstrict separation, typically involving containerizedshipping, is maintained at all times. IP, which is nota focus of this chapter, is often used for marketingcommodities like food-grade maize and soybeans.Testing for biotech vs. non-biotech status typicallyoccurs just before containerization. IP lessens theneed for additional testing as control of the com-modity changes hands, and it lowers liability andrisk of biotech and non-biotech commingling forgrowers and handlers. This handling process mightbe required to meet a stringent threshold level ofbiotech content, such as the 1% required under EUlabelling regulations. However, no IP system canguarantee 100% purity.
Because of limited demand for non-biotech
maize and soybeans and the expense of maintainingseparate storage facilities, only a small to modestpercentage of grain elevators have attempted tosegregate and market non-biotech products. InSeptember 1999, Sparks Companies conducted asurvey of 100 Midwestern grain elevators and foundthat 11% were differentiating for non-biotech maizeand 8% for non-biotech soybeans. Of the surveyedelevators, only 1% offered producer premiums fornon-biotech maize and 3% offered producer premi-ums for non-biotech soybeans. The premium variedwidely, depending on the elevator’s location and theintended consumer market for the product.According to other industry sources, common non-biotech price premiums in 2000 ranged fromUS$0.05 to 0.10 bushel–1 for non-biotech maizeand US$0.10 to 0.15 bushel–1 for non-biotech soy-beans. The lower end of the premium range reflectsless strict tolerance levels (i.e. more biotech content)and vice versa. In February 2000, the Farm ProgressCompany’s survey of 1200 US elevators indicatedthat 24% planned to segregate maize and 20%planned to segregate soybeans in autumn 2000.Elevators were probably anticipating food labellingregulations in countries other than the EU. A morerecent survey conducted by the American CornGrowers Foundation in autumn 2000 suggests ahigher level of potential segregation. The surveypolled 1107 grain elevators in nine states and foundthat 30.5% were either requiring or suggesting seg-regation at their elevator facilities.
Effective segregation, which begins at the farmlevel, is particularly difficult for maize because ofcross-pollination. In addition, farmers are requiredto clean combines during harvesting and may findthemselves in need of expanding on-farm storagefacilities for segregating grains into biotech and non-biotech varieties. A straw poll of 400 US farmersconducted by Reuters in January 2000 found that15% of farmers had made or were planning to makethe necessary investments to handle or segregatenon-biotech crops in the autumn.
Elevators must also develop stricter controlover handling procedures in order to maintain seg-regation. A key problem is that segregation is likelyto slow the rate of turnover in high-volume businessand delays can be a serious problem during peakharvest periods (Lin et al., 2000). A study ofCanadian grain segregation suggested that storingsegregated grains, in addition to the base-gradegrain, leads to a reduction in capacity turnover atterminal elevators by more than 15% (McKeague et
Costs of Segregation for Non-biotech Maize and Soybeans 263
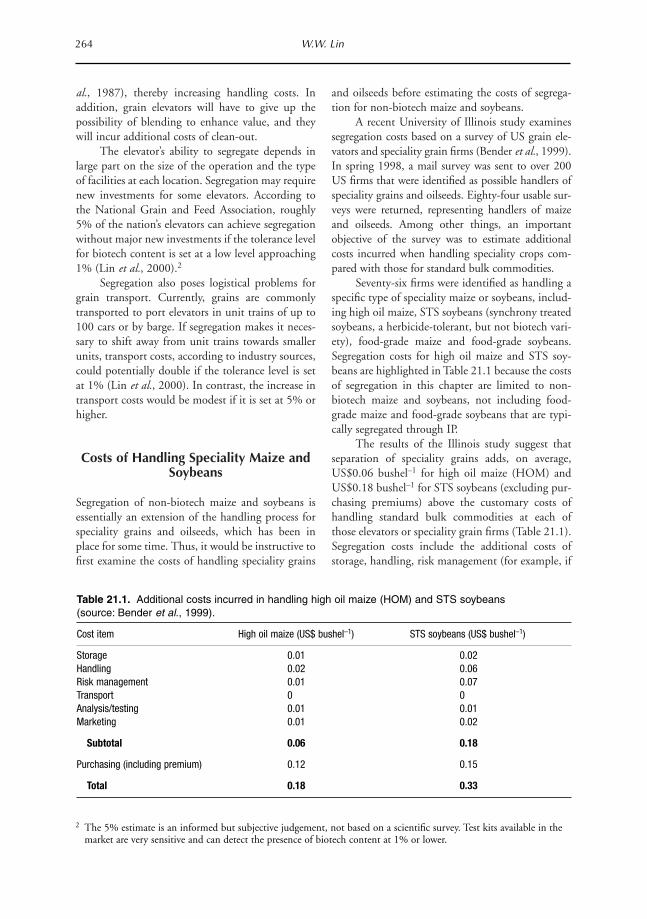
al., 1987), thereby increasing handling costs. Inaddition, grain elevators will have to give up thepossibility of blending to enhance value, and theywill incur additional costs of clean-out.
The elevator’s ability to segregate depends inlarge part on the size of the operation and the typeof facilities at each location. Segregation may requirenew investments for some elevators. According tothe National Grain and Feed Association, roughly5% of the nation’s elevators can achieve segregationwithout major new investments if the tolerance levelfor biotech content is set at a low level approaching1% (Lin et al., 2000).2
Segregation also poses logistical problems forgrain transport. Currently, grains are commonlytransported to port elevators in unit trains of up to100 cars or by barge. If segregation makes it neces-sary to shift away from unit trains towards smallerunits, transport costs, according to industry sources,could potentially double if the tolerance level is setat 1% (Lin et al., 2000). In contrast, the increase intransport costs would be modest if it is set at 5% orhigher.
Costs of Handling Speciality Maize andSoybeans
Segregation of non-biotech maize and soybeans isessentially an extension of the handling process forspeciality grains and oilseeds, which has been inplace for some time. Thus, it would be instructive tofirst examine the costs of handling speciality grains
and oilseeds before estimating the costs of segrega-tion for non-biotech maize and soybeans.
A recent University of Illinois study examinessegregation costs based on a survey of US grain ele-vators and speciality grain firms (Bender et al., 1999).In spring 1998, a mail survey was sent to over 200US firms that were identified as possible handlers ofspeciality grains and oilseeds. Eighty-four usable sur-veys were returned, representing handlers of maizeand oilseeds. Among other things, an importantobjective of the survey was to estimate additionalcosts incurred when handling speciality crops com-pared with those for standard bulk commodities.
Seventy-six firms were identified as handling aspecific type of speciality maize or soybeans, includ-ing high oil maize, STS soybeans (synchrony treatedsoybeans, a herbicide-tolerant, but not biotech vari-ety), food-grade maize and food-grade soybeans.Segregation costs for high oil maize and STS soy-beans are highlighted in Table 21.1 because the costsof segregation in this chapter are limited to non-biotech maize and soybeans, not including food-grade maize and food-grade soybeans that are typi-cally segregated through IP.
The results of the Illinois study suggest thatseparation of speciality grains adds, on average,US$0.06 bushel–1 for high oil maize (HOM) andUS$0.18 bushel–1 for STS soybeans (excluding pur-chasing premiums) above the customary costs ofhandling standard bulk commodities at each ofthose elevators or speciality grain firms (Table 21.1).Segregation costs include the additional costs ofstorage, handling, risk management (for example, if
264 W.W. Lin
Table 21.1. Additional costs incurred in handling high oil maize (HOM) and STS soybeans (source: Bender et al., 1999).
Cost item High oil maize (US$ bushel–1) STS soybeans (US$ bushel–1)
Storage 0.01 0.02Handling 0.02 0.06Risk management 0.01 0.07Transport 0 0Analysis/testing 0.01 0.01Marketing 0.01 0.02
Subtotal 0.06 0.18
Purchasing (including premium) 0.12 0.15
Total 0.18 0.33
2 The 5% estimate is an informed but subjective judgement, not based on a scientific survey. Test kits available in themarket are very sensitive and can detect the presence of biotech content at 1% or lower.

quality is not as high as specified in the contract),analysis and testing, and marketing (expenses associ-ated with negotiating contract terms). Minimum oilcontent specified in the contract generally rangesfrom 6 to 8% (7%, on average) for high oil maize.In contrast, quality for STS soybeans is controlledby preserving the variety; growers are required toplant only the STS variety developed by DuPontand grain handlers are to prevent STS soybeansfrom being commingled with other varieties.
How do these additional costs of handlingHOM or STS soybeans differ from empirical evi-dence available in the literature? A recent economicengineering study at the Kansas State Universityfound that the costs of segregating wheat into dif-ferent end-use quality mixes for country elevatorsthat operate at 60–70% of receiving capacity averageabout US$0.0191 to 0.0199 bushel–1 if the elevatorhas three pits and two bucket elevator legs(Herrman et al., 1999). The average cost of segrega-tion increases to US$0.0237–0.0261 bushel–1 if theelevator has two pits and two bucket elevator legs,and to US$0.0528–0.0530 bushel–1 if the elevatorhas two pits and one bucket elevator leg. In 1994,Hurburgh reported that the costs of testing and seg-regating soybeans was US$0.02–0.03 bushel–1, alsobased on an economic engineering study. Thus, theaverage additional cost of handling HOM (2 centsbushel–1) reported by the Illinois study appears to bein line with empirical evidence in the literaturebased on the economic engineering analysis, espe-cially if the elevator has multiple pits and two buck-et elevator legs.
The Illinois study shows a higher additionalcost of handling STS soybeans than the 2–3 centsbushel–1 cost of segregation reported by Hurburgh,in part because of the specific need for preservingthe identity of STS soybeans by variety and possiblybecause of the small sample size (10). A more recentIllinois study (Good et al., 2000) that confines thesurvey to elevators and speciality grain firms only inIllinois found that the additional cost of handlingSTS soybeans averages 3.48 cents bushel–1, downfrom 6.0 cents bushel–1 obtained earlier by Bender,et al. (1999). This latest Illinois study had a samplesize of 65.
Costs of Segregating Non-biotech Maize
The costs of segregating speciality grains (e.g.HOM) can be modified or adjusted to estimate the
costs of segregation for non-biotech maize or soy-beans because segregating non-biotech grains isessentially an extension of the segregation processfor speciality grains. This section develops a scenarioanalysis under which each of the cost items in theIllinois study was examined at three points along themarketing chain – country elevator, subterminalsand export elevator – to determine approximate seg-regation costs for non-biotech maize. Although thecosts of segregation vary significantly among the sur-veyed elevators, results indicate that, across all eleva-tors surveyed, costs for segregating non-biotechmaize could be higher than for HOM because ofhigher costs of testing and handling.
Although the estimated costs are not small,they do not imply that disarray would occur in thegrain marketing system if non-biotech maize werehandled on a larger scale. If non-biotech maizeremains a niche market, many elevators may chooseto accept bulk grain and not attempt to segregate.This would be particularly true for those elevatorshandling maize and soybeans destined for domesticfeed use.
Not all elevators that choose to distinguishbetween biotech and non-biotech would bear thecosts identically. Some elevators currently handleniche market crops at relatively low cost, particular-ly if they are equipped with multiple pits and havebin space configured to facilitate segregation (Lin etal., 2000). In addition, specialization across elevators(some handling biotech, others non-biotech) wouldalso result in much lower added costs to the handlingsystem. This specialization may lead to a cluster ofnon-biotech crop production. Further, adjustmentsin the grain marketing system would work to lowercosts as economies of scale in handling are realizedand new testing procedures are developed.
The cost estimates in this chapter, whichshould be taken as rough estimates given the limit-ed data currently available, indicate that, on averageacross the 76 surveyed elevators, segregation couldadd about US$0.22 bushel–1 (excluding premium toproducers), or 12% of the average farm price formaize, to costs of handling non-biotech maize fromcountry elevator to export elevator (Fig. 21.2).These estimates reflect costs at these elevators andmay not represent costs incurred by any one elevatoror other elevators in general. In addition, these costestimates do not take into account any additionalcosts that could be associated with segregation at thefarm level and shipment expenses beyond exportelevators to foreign markets.
Costs of Segregation for Non-biotech Maize and Soybeans 265

These cost estimates reflect a scenario analysisunder the following assumptions: (i) risk manage-ment cost is not greater for non-biotech maize thanfor HOM (i.e. assuming a high tolerance level –generally around 5% – for biotech content); (ii)two-tier segregation is needed at the local elevator toguard against commingling (some elevators havealready adopted this practice); and (iii) a multipletrait ELISA test kit will be introduced to detectbiotech content for Roundup Ready and LibertyLink maize varieties.
In developing this scenario, two importantadjustments to the Illinois cost estimates are made.First, the cost estimate for maize at the countryelevator is adjusted to reflect a two-tier segregationrequirement: to segregate biotech from non-biotechvarieties, and to separate biotech varieties approvedfor shipment to the EU from EU-unapproved vari-eties (which reportedly account for less than 5% ofUS maize acreage). This two-tier segregation is nec-essary because most country elevators lack completeknowledge about the destination of maize ship-ments. For shipments to domestic markets, two-tiersegregation might be necessary because some proces-sors (such as ADM and A.E. Staley) accept only EU-approved maize varieties. Similarly, for shipments tothe EU, no commingling with EU-unapproved vari-eties is permitted. To the extent that producerschannel their maize to market outlets that acceptEU-unapproved varieties (such as domestic feed-lots), handling costs at local elevators could belower.
Adjusting for two-tier segregation is estimatedto increase handling costs for non-biotech maize atcountry elevators to $0.03 bushel–1, higher than theUS$0.02 bushel–1 reported in the Illinois study.Biotech segregation imposed no additional handlingcost above the US$0.02 bushel–1, incurred at sub-terminals and export elevators for segregating spe-ciality maize, because operators know the destina-tion of grain shipments at those facilities. Thus,additional handling costs for segregating non-biotech maize from country elevator to subtermi-nals, and then to export elevators add an average ofUS$0.07 (0.03 + 0.02 + 0.02) bushel–1 above non-segregated maize as shown in Table 21.2, slightlyhigher than that for HOM (US$0.06 bushel–1).Also, segregation could cause the loss in potentialsavings that an exporter can now realize by blendingat export points and shifting cargoes and customersbecause of vessel delays and other factors – a flexi-bility afforded by bulk commodity marketing.
The adjustment for testing costs reflects thehigher cost of testing for biotech content, which ismore complicated than testing for physical charac-teristics, such as oil content, for HOM. Grain han-dlers commonly use two testing methods: the DNA-based PCR and the protein-based ELISA. PCRtakes 2–10 days at a cost of US$200–450 pertest, higher than most country elevators canafford because of the small volume per truck load,which typically is around 900 bushels. In contrast,an on-site ELISA microwell test takes 2 h and costsup to US$10 per test. A faster and simpler ELISA
266 W.W. Lin
Fig. 21.2. Segregation costs for non-biotech maize and soybeans.
0
5
10
15
20
25
Non-GM maize Non-GM soybeans (STS)
US
$/bu
-1
Storage (bottom) Handling Risk management
Analysis/testing Marketing (top)
Non-GM soybeans (HOM)

dipstick test to provide a ‘yes–no’ result takes 5–10min and costs just US$3.50 per test. At a 99%purity level, a typical ELISA test uses a sample of50–60 kernels out of close to 900 bushels in a truckload. However, reliability of test results at this puri-ty level becomes more of a concern; inconsistentresults may occur from different tests of the same lotof grain. A smaller sample size (40–50 kernels)would be used for testing at a 95% purity level. Theadditional cost of testing for biotech content usingELISA test kits is estimated at US$0.01 bushel–1 forone specific new trait (e.g. Bt maize) at countryelevators. However, since current ELISA testingmethods require a separate test for detection of eachunique trait, several tests may be required to deter-mine if a truck load of maize is free of biotech mate-rial. The analysis in this chapter assumes four sepa-rate ELISA tests for five biotech maize varieties atcountry elevators: three Bt varieties, plus LibertyLink and Roundup Ready.3 While biotech contentin the three Bt varieties can be detected technicallyin one test, multiple tests (usually two) are a com-mon practice adopted by local elevators. Thisincreases the cost of analysis and testing for non-biotech maize to US$0.04 bushel–1 at country ele-vators, up from the US$0.01 bushel–1 reported forHOM in the Illinois study.
At subterminals and export elevators, PCRtesting is more common than ELISA because it isvery sensitive and can be used to detect the presenceof several gene modifications in one set of tests.However, PCR tests are generally conducted incommercial labs. It becomes more economical with
the larger volume of grain being handled, remainingjust US$0.01 bushel–1 as estimated by the Illinoisstudy. A typical sample size for testing is about 80 lbof grain in a river subterminal, which handles about50,000–55,000 bushels of grain in a barge.
Thus, the costs of testing/analysis add, on aver-age, about US$0.06 bushel–1 for segregating non-biotech maize, from country elevators to export ele-vators. This doubles the US$0.03 bushel–1 costs oftesting and analysis for HOM throughout the mar-keting system as reported in the Illinois study.
Risk management costs for segregating graininto biotech and non-biotech conceivably could begreater than for handling HOM, because producersface significantly different risks. For example, a 1%lower oil content might reduce price premiums paidto HOM producers. However, 1% biotech contentin a grain shipment could cause rejection, which hasmuch more serious consequences for grainexporters. Because there is no way to quantify thisextra cost, it is assumed that the risk managementcost is the same as for HOM in the Illinois study,$0.01 bushel–1 or $0.03 from country elevator toexport elevator.
Marketing costs for segregating non-biotechmaize basically are the same as those for HOM(US$0.03 bushel–1) across the three elevator points.Similarly, storage costs require no adjustment,remaining at US$0.03 bushel–1 across the typicalgrain marketing channel.
In considering segregation costs from produc-tion to marketing, this analysis excludes premiumsto producers because the gain to producers offsets
Costs of Segregation for Non-biotech Maize and Soybeans 267
3 In autumn 2000, ELISA test kits available in the market focus on detecting the presence of biotech content in Btvarieties. However, a private firm plans to introduce new multiple-trait test kits in autumn of 2000, which, if realized,can extend the test to Roundup Ready and Liberty Link maize varieties.
Table 21.2. Segregation costs for non-biotech maize and soybeans from country elevator to exportelevator (source: adapted from Bender et al., 1999).
Non-biotech maize Non-biotech soybeans(HOM segregation) HOM segregation STS segregation
Cost item (US$ bushel–1) (US$ bushel–1) (US$ bushel–1)
Storage 0.03 0.03 0.06Handling 0.07 0.06 0.18Risk management 0.03 0.03 0.21Transport 0.00 0.00 0.00Analysis/testing 0.06 0.03 0.03Marketing 0.03 0.03 0.06
Total 0.22 0.18 0.54
the loss to country elevators. Thus, if segregation isviewed from the entire production and marketingsystem, not strictly from the grain handlers’ per-spective, premiums for non-biotech maize paid bycountry elevators are gains to producers. Accordingto industry sources, the common range for purchas-ing premiums currently offered by a few elevators in2000 was US$0.05–0.10 bushel–1 for non-biotechmaize and US$0.10–0.15 bushel–1 for non-biotechsoybeans.
Some US grain handlers are already segregatinggrain for certain export markets. For example, somegrain companies are segregating non-biotech maizefor food use (e.g. maize starch) in Japan, althoughwithout guaranteeing to meet a specific tolerancelevel for biotech material. Patterning maize segrega-tion after handling procedures for HOM can usual-ly meet the non-biotech requirements of Japanesebuyers. To avoid commingling in shipments, grainhandlers may also contract with producers to plantonly non-biotech maize varieties and require adop-tion of specific production and harvesting practices.
How well do the estimates of the costs of seg-regation match with market reality? A credibilitycheck of these cost estimates is to first deduct theaverage cost of segregation estimated from this study(US$0.22 bushel–1) along with additional oceanfreight expenses from price premiums foreign buyersare willing to pay for non-biotech maize, and thendetermine if the residual matches with price premi-ums offered to producers in the marketplace.According to a Japanese grain trading house, buyersin Japan in 2000 were willing to pay premiums fornon-biotech maize, ranging from 40 to 50 centsbushel–1. If Japanese buyers typically purchase a vol-ume of 2000 t non-biotech maize for manufacturingniche products, instead of the entire cargo, thenocean freight expenses would be about US$0.13bushel–1 higher than bulk commodity shipments.The residual after the deduction would averageabout US$0.10 bushel–1 if the mid-point ofUS$0.45 bushel–1 is taken as the average price pre-mium for non-biotech maize. Because the US grainmarketing system is very competitive, the fact thatthe US$0.10 bushel–1 residual matches fairly wellwith the price premiums being offered to producers(US$0.05–0.10 bushel–1) for non-biotech maize in2000 suggests that our cost estimates are in the ball-park.
Costs of Segregating Non-biotechSoybeans
This section extends the scenario analysis to esti-mating the costs of segregating non-biotech soy-beans. Two separate scenarios are examined: (i) seg-regating non-biotech soybeans by patterning afterthe handling process for STS soybeans; and (ii) seg-regating non-biotech soybeans by following the han-dling process used for HOM.
The cost estimates indicated that, on averageacross the 76 surveyed elevators, segregation couldadd about US$0.54 bushel–1 (excluding premium toproducers), or 12% of the average farm price forsoybeans, to marketing costs of non-biotech soy-beans from country elevators to export elevatorsunder the STS segregation scenario (Fig. 21.2). Incontrast, the cost estimates become smaller – anaverage of US$0.18 bushel–1, or about 4% of theaverage soybean farm price – if segregation followsthe same handling process used for HOM.
STS segregation
Two-tier segregation, which is necessary for segre-gating non-biotech maize, is not needed for segre-gating non-biotech soybeans because RoundupReady soybeans is the only variety commerciallygrown currently in the US and that variety is EU-approved. As a result, the costs of handling remainat US$0.06 bushel–1 for each elevator point, orUS$0.18 bushel–1 across the US grain handling sys-tem. However, the latest Illinois study (Good et al.,2000) suggests that in Illinois, additional costs ofhandling add 3.48 cents bushel–1 for each elevatorpoint, or US$0.10 bushel–1 from country elevatorsto export elevators, which is lower than the averagecost nationwide reported in Bender et al. (1999).
Similarly, there is no complication in estimat-ing the costs of testing biotech content for soybeansbecause Roundup Ready is the only variety of herbi-cide tolerant biotech soybeans. The costs of testingremain at US$0.01 bushel–1 at each of the elevatorpoints, or US$0.03 from country elevators to exportelevators. Additional costs of testing for biotechcontent in soybeans are lower in Illinois, 0.24 centsbushel–1 for each elevator point or US$0.01bushel–1 across the three elevator points.
Additional costs of risk management, assumedto be identical to those for segregating STS soy-beans, would average about US$0.07 bushel–1 for
268 W.W. Lin
each elevator point, or US$0.21 bushel–1 through-out the grain handling system. However, risk man-agement costs are lower in Illinois, US$0.04bushel–1 for each elevator point or US$0.12bushel–1 across the three elevator points (Good etal., 2000).
Overall, segregation costs for non-biotech soy-beans would add US$0.54 bushel–1 to US grainhandlers if segregation is patterned after STS soy-beans. For grain handlers in Illinois, however, thecosts of segregation are lower – adding US$0.35bushel–1 to marketing costs – in part because ofhigher efficiency in grain handling in Illinois than inother states.
HOM segregation
The costs of segregation for non-biotech soybeanscan be substantially reduced if segregation is pat-terned after the handling process for HOM insteadof the more rigorous STS segregation.
HOM segregation allows grain handlers toseparate handling of non-biotech soybeans by fol-lowing the process used for HOM segregation,where the focus is to meet minimum oil contentspecified in the contract, generally ranging from 6 to8%. Some US grain handlers are already segregatingnon-biotech soybeans through this handlingprocess, as was discussed earlier.
Table 21.2 shows that the costs of segregationfor non-biotech soybeans add, on average, $0.18bushel–1 for US grain handlers from country eleva-tors to export elevators. The costs of segregationusing this approach would be even lower for grainhandlers in Illinois – about US$0.15 bushel–1 –from country elevators to export elevators.
Who Bears the Cost?
At the core of debates over the issues of segregationis the central question: ‘Who bears the cost of segre-gation?’ Some analysts take the position that in thelong run, consumers would have to pay premiumsfor non-biotech crops. However, this is not support-ed by what we know about buyers from the EU; ingeneral, European buyers are not willing to and cur-rently do not pay premiums for non-biotech bulkgrain shipments. As a result, other than a few niche,non-biotech products that receive premiums,European buyers purchase mostly non-segregated
products. Overall, grain is being segregated primari-ly for Japan and other Asian markets.
In this section, we have identified four factorsthat can affect the distribution of the costs of segre-gation: (i) demand price elasticity of the commodi-ty; (ii) competitive structure of the food industry;(iii) the proportion of ingredient in the value of thefinal product; and (iv) alternative sourcing of supply.The nature of their effects on the cost distribution isdiscussed below.
Demand price elasticity of the commodityplays a role in affecting the distribution of the costsof segregation. If the commodity is more priceinelastic, either because of strong consumer prefer-ence for non-biotech crops, a lack of substitutes, orbecause of the nature of the commodity’s marketdemand, then suppliers are in a better position topass on the costs of segregation to consumers. Anexample is Japanese buyers’ willingness to pay heftypremiums for food-grade soybeans, especially organ-ic, food-grade soybeans. Japanese buyers have astrong preference for clear hilum, food-grade soy-beans. Also, they regard soybeans from Brazil andArgentina, which have reddish tint, to be inferior inmaking tofu. If there is little or no substitute for theproduct, suppliers can more readily pass on the costsof segregation in the form of higher prices to con-sumers without incurring revenue losses.
Competitive structure of the industry plays animportant role in affecting the distribution of thecosts of segregation. If the grain handling industryand food chain are not highly competitive, thengrain handlers, food manufacturers and retailers arein a better position to pass on the costs of segrega-tion forward to consumers in the form of higherretail prices or backward to farmers in the form oflower farm prices.
The proportion of ingredient in the value ofthe final product also plays a role in determining thecost distribution. If the segregated commodity onlyaccounts for a small proportion of the value of thefinal product, food manufacturers and retailers canmore readily pass on the costs to consumers.
Finally, alternative sourcing of supply hasproved to be an important factor in affecting thecost distribution. An example is the switching bySpain and Portugal to non-US sources for theirmaize since 1998, resulting from the moratorium onapproving new biotech maize varieties in the EUregulatory approval process. Because of the availabil-ity of non-US sources of supply, buyers in thesecountries were less inclined to pay premiums for
Costs of Segregation for Non-biotech Maize and Soybeans 269

non-biotech maize. Thus, if US grain handlers hadelected to segregate maize into biotech and non-biotech varieties, they would have incurred the costsof segregation and probably absorbed a good part ofthe costs.
Conclusions
There is a continuum of segregation for separatingnon-biotech from biotech maize and soybeans.Therefore, there is no one single cost estimate torepresent the entire spectrum. A segregation processmight be less rigorous and less costly, but it may alsobring about lower price premiums. The tolerancelevel for biotech content plays a critical role inaffecting the segregation process and the resultantcosts of segregation at all points in the grain han-dling and distribution system.
The cost estimates in this chapter are meant toindicate general magnitudes and are likely to changeas adjustments occur in the marketing system forspecialized commodities and if the volume of segre-gated commodities expands and the grain handlingindustry realizes economies of scale. Also, the costsof segregation vary significantly among surveyed ele-vators, in part due to the small sample size in theearlier Illinois study. A comprehensive survey with alarger sample size of elevators and speciality grainfirms would be useful in firming up the cost esti-mates.
In addition, the costs associated with segrega-tion and the need to reduce risks of comminglingmight entice producers to bypass country elevatorsand sell their non-biotech crops directly to subter-minals or processors. This might lead to more con-centration of the grain handling industry.
This study focuses on estimating the costs ofsegregation for non-biotech maize and soybeans.Further research into the core issue ‘who bears thecost?’ would be very helpful in anticipating eco-nomic consequences of grain segregation intobiotech and non-biotech varieties.
References
Agriculture and Agri-Food Canada (1998) An Overview ofGrain Segregation Issues, Policy Development and
Program Services, November 1998.
Bender, K., Hill, L., Wenzel, B. and Hornbaker, R. (1999)
Alternative Market Channels for Specialty Corn andSoybeans, AE-4726, Dept. of Agri. and Con. Econ.,
University of Illinois.
Good, D., Bender, K. and Hill, L. (2000) Marketing ofSpecialty Corn and Soybean Crops, AE-4733, Dept. of
Agri. and Con. Econ., University of Illinois.
Herrman, T., Boland, M. and Heishman, A. (1999)
Economic feasibility of wheat segregation at country
elevators. In: The 2nd Annual National WheatIndustry Research Forum Proceedings, Nashville,
Tennessee, 4–5 February.
Hurburgh, C. (1994) Identification and segregation of
high-value soybeans at a country elevator. Journal ofAmerican Oil Chemistry Society 71(10), 1073–1078.
Lin, W., Chambers, W. and Harwood, J. (2000)
Biotechnology: U.S. grain handlers look ahead.
Agricultural Outlook, AGO-270, April 2000, 29–34.
McKeague, D., Lerohl, M. and Hawkins, M. (1987) The
Canadian grain grading system and operational
efficiency within the Vancouver grain terminals.Agribusiness 3(1), 19–42.
US Department of Agriculture (2000) Acreage. CrPr 2–5,
NASS, 30 June.
US Department of Agriculture (2001) Acreage. CrPr 2–5,
NASS, 29 June.
270 W.W. Lin
Introduction
No new bioengineered food or agricultural productshave been approved for use in the European Unionsince October 1998 and five member countries havebanned the sale of previously approved products(European Commission, 2000). The de facto mora-torium in Europe has sent tremors through the mar-ket for agricultural biotechnology products. In1999, several major food producers and agriculturalcommodity companies announced they would nolonger purchase transgenic agricultural products.The rapid expansion in US acreage planted withtransgenic crop varieties also slowed significantly in2000. Stock prices of agricultural biotechnologycompanies have declined sharply since 1998 andseveral of the major life science companies have pro-ceeded with plans to divest their agriculturalbiotechnology divisions.1
In the USA, the Food and Drug Admin-istration (FDA) has steadfastly maintained the posi-tion that transgenic food products do not pose risks
to human health that are qualitatively different fromfoods produced from traditional agricultural com-modities. As a result, the FDA has not, until recently,required special regulatory treatment of bioengi-neered food products. The US Department ofAgriculture (USDA) and Environmental ProtectionAgency (EPA) have required more extensive evalua-tion of the environmental impacts of bioengineeredagricultural products. But the highly publicizedreports of the effects of Bt maize on monarch but-terflies and the recent controversy over the use intaco shells of a variety of transgenic maize notapproved for human consumption indicates thatUSDA and EPA regulatory processes have not elim-inated the possibility of unfortunate post-approvalsurprises.2
In May 2000, the FDA announced it wouldbegin requiring companies to notify the agency oftheir intent to market food products developedusing genetic engineering. Most companies hadalready been providing the FDA with pre-marketnotification of new products as well as information
271
22 Endogenous Demand and OptimalProduct Regulation: the Case of Agricultural
Biotechnology
Anthony ArtusoDepartment of Agricultural Food and Resource Economics, Cook College, Rutgers
University, New Brunswick, New Jersey, USA
© CAB International 2002. Market Development for Genetically Modified Foods(eds V. Santaniello, R.E. Evenson and D. Zilberman)
1 Pharmacia and Upjohn, which recently acquired Monsanto, has announced its intention to spin-off Monsanto’sagricultural units. Novartis and Astra-Zeneca have recently completed the divestiture and merger of their agriculturaloperations.
2 There is some evidence that the effects on butterflies of pollen from Bt maize was an issue that received evaluation inthe regulatory review process. Nevertheless, the media treated the initial reports of potential harm to monarch butter-flies as new information, and regulatory agencies were not able to provide an immediate response that satisfied publicconcerns.

about their assessments of the safety of these prod-ucts. The policy change simply makes this priornotification mandatory. The new policy will alsorequire the FDA to issue a letter to the companyregarding the regulatory status of the product. Boththe company’s submitted data and the FDA’s analy-sis would be made available to the public throughthe FDA’s web site.
The FDA’s new policy was apparently prompt-ed by growing public concern rather than anychange in the agency’s estimation of the risks of bio-engineered food products. At the announcementof the proposed regulatory change, FDA Commis-sioner, Dr Jane Henney, stated that all bioengi-neered foods sold in the USA are as safe as their non-bioengineered counterparts (Genetic EngineeringNews, 2000). Nevertheless, the director of the FDA’sOffice of Premarket Approval in the Center for FoodSafety and Applied Nutrition, acknowledged grow-ing public concerns regarding bioengineered foodproducts and indicated that the FDA had a responsi-bility to ensure that consumers continue to trust thesafety of the US food system (Dutton, 2000).
When consumers face high costs and/or timedelays in gathering information, product regulationcan increase social welfare even if it adds significant-ly to production costs (Antle, 1996; Stiglitz, 2000).Economic analyses of food safety regulation havegenerally focused on compliance costs and the ben-efits of reducing food induced illnesses (Roberts etal., 1996; Antle, 1999). Larson and Knudson(1991) examined the effects of alternative regulato-ry policy instruments on investment in agriculturalbiotechnology. However, their analysis did notexamine the effects of changes in regulatory policyon demand for or net benefits of transgenic cropvarieties. The recent developments in the market fortransgenic agricultural products suggests the needfor more detailed analysis of the interaction betweenregulatory policy, consumer risk perceptions andmarket expansion.
If consumer purchasing patterns are influencedby regulatory requirements, then regulatory policyformulation must take into account the demandaltering effects of alternative policies. The welfareeffects of regulations that influence consumerdemand may be magnified over time if demand isalso a function of prior sales. Vettas (2000) hasshown that when demand is an increasing functionof prior sales, private investment in a competitivemarket may be lower than optimal and, if expecteddemand is below a critical threshold, a potentially
profitable market may not open at all due to theinability of initial entrants to benefit from theirmarket expanding investment. In this chapter, Iexamine the implications for regulation of trans-genic agricultural products when consumer accept-ance and the rate of product innovation are affectedby the stringency of regulatory requirements.
A Simple Model of Regulation GivenEndogenous Demand
To permit comparative analysis of regulatory poli-cies when demand is endogenous, I will adoptMarschack’s (1978) production function frameworkand assume that changes in demand for transgenicfood products reflect changes in consumer under-standing about how best to maximize their welfaregiven fixed preferences for safe, healthy and envi-ronmentally benign food. This assumption leavesopen the important issue of what information isavailable to consumers, while avoiding philosophicalproblems associated with welfare analysis when con-sumer preferences are changing (Pollack, 1970;Hammond, 1976; Grout, 1982).
Assume that demand is influenced by con-sumer perceptions of the safety, health and environ-mental effects of transgenic food and agriculturalproducts. Past sales of transgenic agricultural prod-ucts increase consumer confidence and futuredemand, while studies indicating the potential foradverse health and environmental effects decreasedemand. Agricultural biotechnology firms areassumed to respond to these demand shifts by intro-ducing new products and/or withdrawing existingones.
More specifically, let Pt indicate the expectednumber of transgenic food and agricultural productson the market in year t. It is assumed that farmerand consumer experience with transgenic productsincreases demand, which results in the introductionof new products to the market at an annual rate ofg. In addition, the number of products on the mar-ket declines by a factor, d, multiplied by the numberof approved products which are the subject of stud-ies showing potentially adverse health or environ-mental effects. The consumer response factor d canbe interpreted as a reputational spillover. It is thenumber of products for which demand declinesbelow the breakeven point for each product report-ed to have potentially detrimental health or environ-mental effects.
272 A. Artuso

If p is the annual probability that a transgenicproduct will be the subject of reports of potentialharm, then the expected number of products on themarket at the end of year 1 is given by:
P1 = P0(1 + g – pd ) (22.1)
subject to (1 + g > pd )
and the expected number of products in year t is:
Pt = P0(1 + g – pd )t (22.2)
Let B represent the expected annual benefits result-ing from the sale of a transgenic agricultural prod-uct. This would include profits earned by the inno-vating firm, changes in net farm income resultingfrom adoption of these products and changes inconsumer surplus prior to taking into accounthealth or environmental damages.3 Let D indicatethe expected real damages caused by any productthat has been reported to have potentially harmfuleffects.4 If c is the annualized cost of regulatory com-pliance for transgenic products, then annual netbenefits, (nt ), derived from transgenic products are:
nt = Pt (B – pD – c) (22.3)
for B > pD + c else nt = 0
which after substituting for Pt yields
nt = P0(B – pD – c) (1 + g – pd )t (22.4)
Given a discount rate r, the present value of the netbenefit stream is:
(22.5)
which reduces to:
[go to top of next column]
(22.6)
s.t. r + pd > g
Equation 22.6 indicates that regulatory agenciesseeking to maximize net benefits from transgenicfood and agricultural products would need to takeinto account the effects of regulation on productioncosts and health and environmental damages as wellas the more complex interaction between public riskperceptions and demand. Even if bioengineeredproducts cause no harm to human health or theenvironment (i.e. D fi 0), reports of potentiallyadverse impacts can result in welfare losses due totheir demand-reducing effects.5 The welfare effect ofconsumer reactions to perceived risks is captured bythe third term in the denominator of Equation 22.6,which can be seen to have the same effect on thepresent value of net benefits as an increase in the dis-count rate.
If the stringency of regulation is represented bys, the regulator’s problem can be defined as follows:
(22.7)
s.t. r + pd > g and B > pD + c for some s
More stringent regulatory requirements would beanticipated to increase c, the cost of regulatory com-pliance for transgenic products, and reduce p, theprobability that an approved product will be report-ed to have negative health and environmentaleffects. In addition, increases in c can be assumed toreduce g, the rate at which new products are intro-duced. Given these relationships, the first derivativeof V with respect to s yields:
Endogenous Demand and Optimal Product Regulation 273
3 Moschini and Lapan (1997) present a conceptual model for estimating these benefits when innovations are protectedby intellectual property rights. Falck-Zepeda et al. (2000a, b) and Moschini et al. (2000) provide empirical estimatesof the magnitude and distribution of these benefits for transgenic cotton and soybean varieties.
4 D could be further disaggregated into the probability that a product reported to have potentially harmful effectsactually causes real damages and the expected magnitude of these damages.
5 If documented damages from bioengineered products remain small or non-existent, consumers would becomeincreasingly sceptical of reports of potential problems. But it could take a number of years before consumers signifi-cantly revise their prior expectations.
V P B pD cg pd
rt
t
= ++
ÊËÁ
ˆ¯
=
•
 0
1
1
1( – – )
–
Max =
sV P
B pD c
r g pd0
( – – )
( – )+
∂∂
=
∂∂
∂∂
ÊËÁ
ˆ¯
+ ∂∂
+ ∂∂
ÊËÁ
ˆ¯
+Vs
ps
Dcs
P r g pd B pD c Pgs
ps
d
r g pd
–– ( – ) – ( – – ) –
( – )
0 0
2
V P
B pD cr g pd
=+0
( – – )
( – )
(22.8)
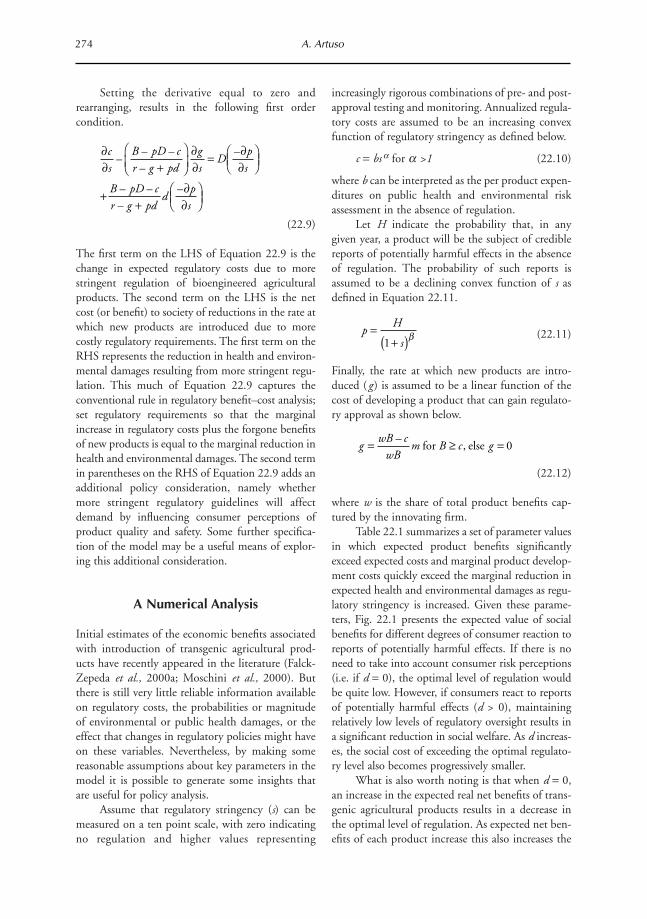
Setting the derivative equal to zero andrearranging, results in the following first ordercondition.
(22.9)
The first term on the LHS of Equation 22.9 is thechange in expected regulatory costs due to morestringent regulation of bioengineered agriculturalproducts. The second term on the LHS is the netcost (or benefit) to society of reductions in the rate atwhich new products are introduced due to morecostly regulatory requirements. The first term on theRHS represents the reduction in health and environ-mental damages resulting from more stringent regu-lation. This much of Equation 22.9 captures theconventional rule in regulatory benefit–cost analysis;set regulatory requirements so that the marginalincrease in regulatory costs plus the forgone benefitsof new products is equal to the marginal reduction inhealth and environmental damages. The second termin parentheses on the RHS of Equation 22.9 adds anadditional policy consideration, namely whethermore stringent regulatory guidelines will affectdemand by influencing consumer perceptions ofproduct quality and safety. Some further specifica-tion of the model may be a useful means of explor-ing this additional consideration.
A Numerical Analysis
Initial estimates of the economic benefits associatedwith introduction of transgenic agricultural prod-ucts have recently appeared in the literature (Falck-Zepeda et al., 2000a; Moschini et al., 2000). Butthere is still very little reliable information availableon regulatory costs, the probabilities or magnitudeof environmental or public health damages, or theeffect that changes in regulatory policies might haveon these variables. Nevertheless, by making somereasonable assumptions about key parameters in themodel it is possible to generate some insights thatare useful for policy analysis.
Assume that regulatory stringency (s) can bemeasured on a ten point scale, with zero indicatingno regulation and higher values representing
increasingly rigorous combinations of pre- and post-approval testing and monitoring. Annualized regula-tory costs are assumed to be an increasing convexfunction of regulatory stringency as defined below.
c = bs a for a >1 (22.10)
where b can be interpreted as the per product expen-ditures on public health and environmental riskassessment in the absence of regulation.
Let H indicate the probability that, in anygiven year, a product will be the subject of crediblereports of potentially harmful effects in the absenceof regulation. The probability of such reports isassumed to be a declining convex function of s asdefined in Equation 22.11.
(22.11)
Finally, the rate at which new products are intro-duced (g ) is assumed to be a linear function of thecost of developing a product that can gain regulato-ry approval as shown below.
(22.12)
where w is the share of total product benefits cap-tured by the innovating firm.
Table 22.1 summarizes a set of parameter valuesin which expected product benefits significantlyexceed expected costs and marginal product develop-ment costs quickly exceed the marginal reduction inexpected health and environmental damages as regu-latory stringency is increased. Given these parame-ters, Fig. 22.1 presents the expected value of socialbenefits for different degrees of consumer reaction toreports of potentially harmful effects. If there is noneed to take into account consumer risk perceptions(i.e. if d = 0), the optimal level of regulation wouldbe quite low. However, if consumers react to reportsof potentially harmful effects (d > 0), maintainingrelatively low levels of regulatory oversight results ina significant reduction in social welfare. As d increas-es, the social cost of exceeding the optimal regulato-ry level also becomes progressively smaller.
What is also worth noting is that when d = 0,an increase in the expected real net benefits of trans-genic agricultural products results in a decrease inthe optimal level of regulation. As expected net ben-efits of each product increase this also increases the
274 A. Artuso
∂∂ +
ÊËÁ
ˆ¯
∂∂
= ∂∂
ÊËÁ
ˆ¯
++
∂∂
ÊËÁ
ˆ¯
cs
B pD cr g pd
gs
Dps
B pD cr g pd
dps
–– –
–
–
– –
–
–
pH
s=
+( )1b
g
wB cwB
m B c g= ≥ =–,for else 0
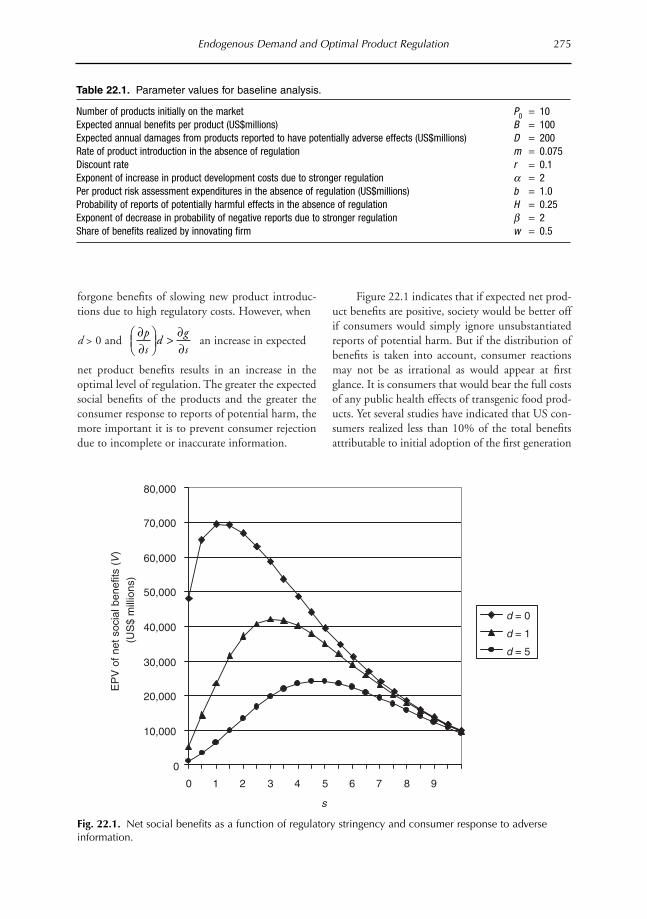
forgone benefits of slowing new product introduc-tions due to high regulatory costs. However, when
d > 0 and an increase in expected
net product benefits results in an increase in theoptimal level of regulation. The greater the expectedsocial benefits of the products and the greater theconsumer response to reports of potential harm, themore important it is to prevent consumer rejectiondue to incomplete or inaccurate information.
Figure 22.1 indicates that if expected net prod-uct benefits are positive, society would be better offif consumers would simply ignore unsubstantiatedreports of potential harm. But if the distribution ofbenefits is taken into account, consumer reactionsmay not be as irrational as would appear at firstglance. It is consumers that would bear the full costsof any public health effects of transgenic food prod-ucts. Yet several studies have indicated that US con-sumers realized less than 10% of the total benefitsattributable to initial adoption of the first generation
Endogenous Demand and Optimal Product Regulation 275
Table 22.1. Parameter values for baseline analysis.
Number of products initially on the market P0 = 10Expected annual benefits per product (US$millions) B = 100Expected annual damages from products reported to have potentially adverse effects (US$millions) D = 200Rate of product introduction in the absence of regulation m = 0.075Discount rate r = 0.1Exponent of increase in product development costs due to stronger regulation a = 2Per product risk assessment expenditures in the absence of regulation (US$millions) b = 1.0Probability of reports of potentially harmful effects in the absence of regulation H = 0.25Exponent of decrease in probability of negative reports due to stronger regulation b = 2Share of benefits realized by innovating firm w = 0.5
Fig. 22.1. Net social benefits as a function of regulatory stringency and consumer response to adverseinformation.
0
10,000
20,000
30,000
40,000
50,000
60,000
70,000
80,000
0 1 2 3 4 5 6 7 8 9
s
EP
V o
f ne
t so
cial
ben
efits
(V
)(U
S$
mill
ions
)
d = 0
d = 1
d = 5
∂∂
ÊËÁ
ˆ¯
> ∂∂
ps
dgs

of transgenic crop varieties (Falck-Zepeda et al.,2000a, b).6 Faced with relatively small benefits andfrequent reports of potential risks, lack of consumersupport for these products is understandable.
Policy Implications
Taking into account the demand effects of con-sumer risk perceptions provides an economic ration-ale for increased product regulation beyond whatmight be justified by purely scientific risk assess-ments. This depends, of course, on the cost effec-tiveness of regulation as a means of maintainingconsumer confidence. The model presented hereindicates that if consumers are sensitive to adverseinformation, and regulatory policy changes willreduce the frequency of credible reports of potentialharm with relatively little increase in product devel-opment costs, the social benefits of implementingthese policy changes could be substantial.
The recently proposed changes in FDAregulatory policy towards transgenic food productscan be interpreted as an effort to reduce consumerconcerns with little or no increase in productdevelopment costs. It remains to be seen how effec-tive the new policy will be. The commitment by theFDA to provide a written response to pre-marketnotifications, and to make any information con-tained in the notification and the FDA’s responsepublicly available, should provide added incentivesto ensure that health and safety claims can bedefended from potential challenges. Nevertheless,the proposed regulatory changes do not requireindustry to undertake any new testing or evaluationprocesses and may therefore not be sufficient toensure consumers of the safety of transgenic foodproducts.
The analysis presented above also indicates thatit may be in the interest of the US to encourage,rather than oppose, comparatively stronger regulato-ry controls in Europe. European consumers havedemonstrated a greater sensitivity than theirAmerican counterparts to reports of potentially neg-ative health and environmental effects of transgenicfood products. If stronger regulations are effective inreducing the frequency of reports of potential prob-lems, or the attention that European consumers give
to these reports, agricultural biotechnology compa-nies and US farmers producing transgenic com-modities stand to benefit.
These policy implications are only strength-ened if stochastic aspects of the model and potentialfeedback effects are taken into account. For a givenlevel of regulatory stringency, the number of reportsof potential harm in any given year is defined by abinomial distribution with mean of pPt –1 and stan-dard deviation of �[pPt –1 (1 – p)]. The occurrenceof consecutive years in which a relatively high num-ber of products are the subject of credible reports ofpotential harm could cause a sharp and long-termdecline in the size of the market, particularly if themagnitude of consumer reactions is an increasingfunction of the frequency of such reports. If demanddrops below a critical threshold, the market couldeven disappear entirely, requiring some demand-enhancing intervention to reopen. It could beargued that this has already occurred in Europe andgovernment officials are now searching for ways torestore consumer confidence.
The model also provides a novel perspective onthe political economy of product regulation. In mar-kets where demand is influenced by prior sales andperceptions of health and environmental risks, pub-lic and industry perspectives on optimal regulationmay converge. If Bp represents private revenues fromtransgenic food and agricultural products, then theexpected present value of net benefits to industry are
(22.13)
Figure 22.2 compares net private and social benefitsas a function of increasing levels of regulation, usingthe parameter assumptions defined in Table 22.1.When consumers are (or are perceived to be) unre-sponsive to reports of adverse effects (d = 0), indus-try would prefer no regulation at all, while regula-tors acting in the public interest would prefer ahigher level of regulation. This is the traditionalview presented in the political economy literature.However, as illustrated in Fig. 22.2, if consumers areeven moderately responsive to adverse information(d = 1), then both regulators and industry shouldprefer a significantly higher level of regulatorycontrol, due to their shared interest in avoiding
276 A. Artuso
6 These first generation products were designed to reduce farm input costs and crop losses. Consumer benefits consist-ed largely of modest decreases in commodity prices.
V P
B c
r g pdpp=
( )+( )0
–
–

consumer rejection of profitable and socially bene-ficial products.7
Whether convergence of policy positionsextends to environmental and consumer advocacygroups, depends largely on the perceived effective-ness of regulatory policy changes. If new, purport-edly stronger, regulations are viewed as resulting inonly a modest reduction in expected damages, con-sumer and environmental groups may prefer the sta-tus quo. The preceding discussion of welfare com-parisons when consumer preferences are changingprovides some insight into this apparently paradox-ical response. Many groups concerned about thehealth and environmental effects of transgenic cropsfear that consolidation in the agricultural inputindustry will make it increasingly difficult for farm-ers to switch back to conventional varieties oncethey have become reliant on transgenic seed. If reg-ulatory policy changes are perceived as increasingconsumer confidence, but are perceived to have lit-tle or no effect on the probability of real damages,these changes might be viewed as equivalent to pro-moting the use of harmful, addictive substances.
Consequently, some environmental and consumergroups may continue to oppose any regulatorychanges short of an outright ban on transgenic agri-cultural products.
Conclusions
The model developed in this chapter provides aneconomic rationale for increased product regulationin response to consumer perceptions of risk, evenwhen these perceptions are perceived by experts tobe unfounded. The model also indicates that recog-nition of the endogeneity of demand and consumerrisk perceptions should promote convergence in thepolicy positions of regulatory agencies and industry.Recent developments in the market for transgenicagricultural products were used as a basis for illus-trating the policy applications of the model.However, the analytical results can also be applied toother products and services for which it is difficultfor consumers to determine safety or efficacy.
Endogenous Demand and Optimal Product Regulation 277
7 This result holds as long as expected benefits significantly exceed expected costs at the optimal level of regulatorystringency.
Fig. 22.2. Social vs. private benefits as a function of consumer response to reports of potential harm.

References
Antle, J. (1996) Efficient food safety regulation in the food
manufacturing sector. American Journal ofAgricultural Economics 78, 1242–1247.
Antle, J. (1999) Benefits and costs of food safety regula-
tion. Food Policy 24, 605–623.
Dutton, G. (2000) FDA’s proposals for GM foods gener-
ally accepted. Genetic Engineering News 20(11), 1,
47, 64, 75.
European Commission (2000) Commission takes initia-
tive to restore confidence in GMO approval process.
Press release, European Commission, Health and
Consumer Protection Directorate General, Brussels.
www.europa.eu.int/comm/dgs/health_consumer/
library/press/press62_en.html
Falck-Zepeda, J.B., Traxler, G. and Nelson, R.G. (2000a)
Surplus distribution from the introduction of a
biotechnology innovation. American Journal ofAgricultural Economics 82(2), 360–369.
Falck-Zepeda, J.B., Traxler, G. and Nelson, R.G. (2000b)
Rent creation and distribution from biotechnology
innovations: the case of Bt cotton and herbicide-
tolerant soybeans in 1997. Agribusiness 16(1),
21–32.
Genetic Engineering News (2000) Overseeing biotech
foods. Genetic Engineering News 20(10), 1.
Grout, P.A. (1982) Welfare economics of decision making
with changing preferences. The Review of EconomicStudies 49, 83–90.
Hammond, P.J. (1976) Changing tastes and coherent
dynamic choice. The Review of Economic Studies 43,
159–173.
Larson, B.A. and Knudson, M.K. (1991) Public regulation
of agricultural biotechnology field tests: implications
of alternative approaches. American Journal ofAgricultural Economics 73(4), 1074–1082.
Marschack, T.A. (1978) On the study of taste changing
policies. The American Economic Review 68,
368–391.
Moschini, G. and Lapan, H. (1997) Intellectual property
rights and the welfare effects of agricultural R&D.
American Journal of Agricultural Economics 79(4),
1229–1242.
Moschini, G., Lapan, H. and Sobolevsky, A. (2000)
Roundup Ready soybeans and welfare effects in the
soybean complex. Agribusiness 16(1), 33–55.
Pollack, R. (1970) Habit formation and dynamic demand
functions. Journal of Political Economy 78(1970),
745–763.
Roberts, T., Buzby, C.J. and Ollinger, M. (1996) Using
benefit and cost information to evaluate a food safe-
ty regulation: HACCP for meat and poultry.
American Journal of Agricultural Economics 78,
1297–1301.
Stiglitz, J.E. (2000) Imperfect information in the product
market. In: Schmalensee, R. and Willigs, R.D. (eds)
Handbook of Industrial Organization, Vol. 1. Elsevier
Science, Amsterdam.Vettas, N. (2000) Investment dynamics in markets with
endogenous demand. Journal of Industrial Economics48(2000), 189–203.
278 A. Artuso

The agriceutical (formerly called ‘life science’)industry has been founded on the premise thatgenetic engineering can be used to create plants andanimals with characteristics that are healthier andenvironmentally friendly. Goldberg and Enriquez(2000) suggest that boundaries between food, healthcare, chemical and pharmaceutical companies arebecoming blurred, and that the current food andagribusiness system will become an agriceuticalindustry. Thus far, the impact of agriceutical com-panies has been mixed. A large number of mergers,acquisitions and joint ventures have occurredamong various firms in these industries. By June2000, there were a number of firms that consideredthemselves agriceutical companies or had agriceuti-cal segments among their various businesses.
A recent book by Smithers and Wright (2000)argues that stocks are vastly overpriced relative to theactual value of their assets. Using Tobin’s q (ratio ofa firm’s market value to its assets), the authors reportthat average q is above 2 for publicly reportedstocks. This suggests that investors recognize thatmany firms possess intangible assets such as brandvalue, intellectual property rights and goodwill,which are not reflected in their balance sheets. Theresearch and development needed to discover andcreate agriceutical products is enormous. Public andprivate investments are needed to discover andextend the benefits of agriceutical products to coun-tries with lower incomes per capita and/or at-riskpopulations. Although firms may possess intangible
assets, implementing a successful strategy to usethose assets profitably is required for private invest-ment. Information on how agriceutical firms are val-ued currently can be useful to policy makers con-templating various public sector investments.
The objective of this study was to determinethe value of q for pharmaceutical and chemical firmswho operate in the consumer health, crop protectionand animal health industries. Tobin’s (1969) defini-tion of q is used: the ratio of a firm’s market value toits book value. A brief discussion of firm strategy isprovided. Then, background information is present-ed for the firms included in the study. Finally, a dis-cussion of q and its estimation is provided.
Agriceutical Firm Strategy
Agriceutical is a popular word to describe productscreated through the use of biology and biotechnolo-gy that are beneficial to consumers and the environ-ment. For example, various components of feed andfood grains (e.g. maize, soybeans, wheat) can beused to replace many types of petroleum by-prod-ucts found in common household cleaners, whichwould enable manufacturers to replace the poisonsymbol on these labels with a biomass symbol.These by-products have little value (the price ofpetroleum is the main value in a barrel of crude oil)but also have little or no other use and would prob-ably have environmental costs of disposal. In con-
279
23 Tobin’s q and the Value of AgriceuticalFirms
Michael BolandDepartment of Agricultural Economics, Kansas State University, Manhattan, Kansas,
USA
© CAB International 2002. Market Development for Genetically Modified Foods(eds V. Santaniello, R.E. Evenson and D. Zilberman)
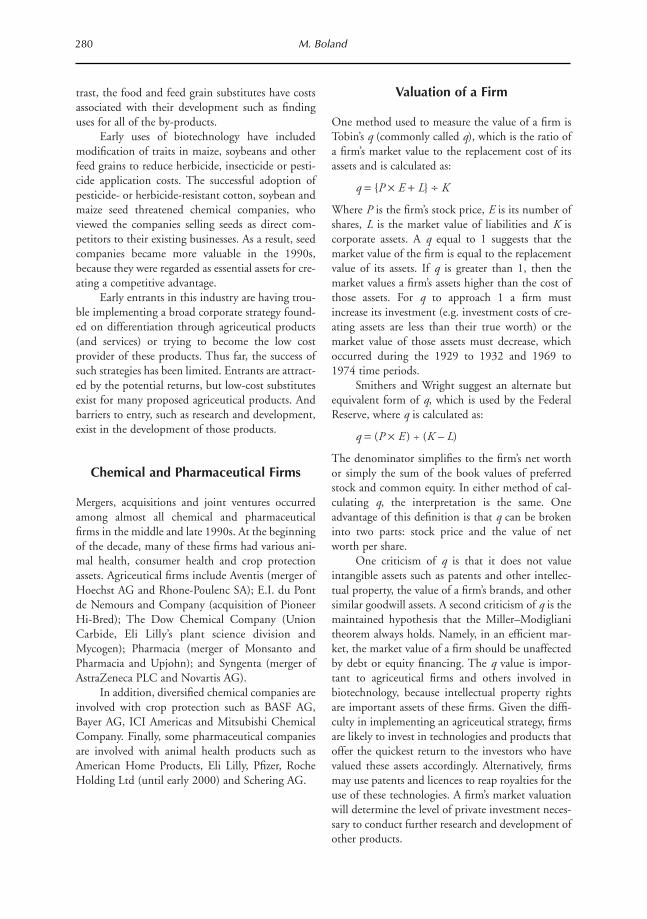
trast, the food and feed grain substitutes have costsassociated with their development such as findinguses for all of the by-products.
Early uses of biotechnology have includedmodification of traits in maize, soybeans and otherfeed grains to reduce herbicide, insecticide or pesti-cide application costs. The successful adoption ofpesticide- or herbicide-resistant cotton, soybean andmaize seed threatened chemical companies, whoviewed the companies selling seeds as direct com-petitors to their existing businesses. As a result, seedcompanies became more valuable in the 1990s,because they were regarded as essential assets for cre-ating a competitive advantage.
Early entrants in this industry are having trou-ble implementing a broad corporate strategy found-ed on differentiation through agriceutical products(and services) or trying to become the low costprovider of these products. Thus far, the success ofsuch strategies has been limited. Entrants are attract-ed by the potential returns, but low-cost substitutesexist for many proposed agriceutical products. Andbarriers to entry, such as research and development,exist in the development of those products.
Chemical and Pharmaceutical Firms
Mergers, acquisitions and joint ventures occurredamong almost all chemical and pharmaceuticalfirms in the middle and late 1990s. At the beginningof the decade, many of these firms had various ani-mal health, consumer health and crop protectionassets. Agriceutical firms include Aventis (merger ofHoechst AG and Rhone-Poulenc SA); E.I. du Pontde Nemours and Company (acquisition of PioneerHi-Bred); The Dow Chemical Company (UnionCarbide, Eli Lilly’s plant science division andMycogen); Pharmacia (merger of Monsanto andPharmacia and Upjohn); and Syngenta (merger ofAstraZeneca PLC and Novartis AG).
In addition, diversified chemical companies areinvolved with crop protection such as BASF AG,Bayer AG, ICI Americas and Mitsubishi ChemicalCompany. Finally, some pharmaceutical companiesare involved with animal health products such asAmerican Home Products, Eli Lilly, Pfizer, RocheHolding Ltd (until early 2000) and Schering AG.
Valuation of a Firm
One method used to measure the value of a firm isTobin’s q (commonly called q), which is the ratio ofa firm’s market value to the replacement cost of itsassets and is calculated as:
q = {P ¥ E + L} ∏ K
Where P is the firm’s stock price, E is its number ofshares, L is the market value of liabilities and K iscorporate assets. A q equal to 1 suggests that themarket value of the firm is equal to the replacementvalue of its assets. If q is greater than 1, then themarket values a firm’s assets higher than the cost ofthose assets. For q to approach 1 a firm mustincrease its investment (e.g. investment costs of cre-ating assets are less than their true worth) or themarket value of those assets must decrease, whichoccurred during the 1929 to 1932 and 1969 to1974 time periods.
Smithers and Wright suggest an alternate butequivalent form of q, which is used by the FederalReserve, where q is calculated as:
q = (P ¥ E ) ÷ (K – L)
The denominator simplifies to the firm’s net worthor simply the sum of the book values of preferredstock and common equity. In either method of cal-culating q, the interpretation is the same. Oneadvantage of this definition is that q can be brokeninto two parts: stock price and the value of networth per share.
One criticism of q is that it does not valueintangible assets such as patents and other intellec-tual property, the value of a firm’s brands, and othersimilar goodwill assets. A second criticism of q is themaintained hypothesis that the Miller–Modiglianitheorem always holds. Namely, in an efficient mar-ket, the market value of a firm should be unaffectedby debt or equity financing. The q value is impor-tant to agriceutical firms and others involved inbiotechnology, because intellectual property rightsare important assets of these firms. Given the diffi-culty in implementing an agriceutical strategy, firmsare likely to invest in technologies and products thatoffer the quickest return to the investors who havevalued these assets accordingly. Alternatively, firmsmay use patents and licences to reap royalties for theuse of these technologies. A firm’s market valuationwill determine the level of private investment neces-sary to conduct further research and development ofother products.
280 M. Boland
Data to Calculate q
The methodology of Lindenberg and Ross (1981)and Smirlock et al. (1984) was used to estimateTobin’s q for each of the chemical and pharmaceuti-cal firms listed earlier. Data for the year ending 31December as reported by Standard & Poor’sCOMPUSTAT© database were used in this analysis.
To determine the numerator of q (P and E ),the market value of the firm was determined for thelast day of each year. COMPUSTAT© reports theamount of debt maturing in various years (2, 3, 4 or5 years). Corporate bonds were assumed to have theindustrial average yield as reported in Moody’sComposite average. Debt was valued each year bycalculating the price of the remaining debt at thecurrent yield as reported by Moody’s. Other liabili-ties were recorded at their book values. Deferredtaxes were not used. Common equity was recordedusing the value provided by COMPUSTAT© at 31December of each year, which was the product ofthe number of shares outstanding and the stockprice. Preferred stock was recorded at its book value.
To determine the denominator of q (K and L),the replacement value of assets was determined onthe last day of each quarter ending in April, Augustand December. If quarterly data were not available,then calendar year data were used. Assets were divid-ed into three categories: plant and equipment,inventory and other. Plant and equipment were val-ued by determining an acquisition schedule. Thevalue of plant and equipment during the first year ofdata was assumed to be its book value. A 10-year
depreciable life was assumed, and the book valuewas reduced by 10% (standard depreciation) eachyear and then adjusted to its new market value bymultiplying by the GDP price deflator for that year.Changes in assets (sales or purchases) were added atbook value. Inventory was adjusted according towhether the firm used FIFO or LIFE (COMPUSTAT
reports this figure for each firm). Book values wereused for other inventory and other assets.
Results
Table 23.1 reports the average value of q and itsrange over the time period for various seed, chemi-cal and pharmaceutical companies. Note that phar-maceutical firms have the highest q over the decade,which is not surprising. Freberg’s (2000) analysis of112 food and agribusiness firms in 16 differentStandard Industrial Classification codes found thatthe pharmaceutical industry had the highest returnson equity and on investment and had less variabili-ty in returns relative to the average over the 1980 to1998 time period. The intangible assets of seedcompanies also were valued at more than two timestheir book value by investors. Similarly, investorsvalued the intangible assets of the agriceutical firmshigher than their book value.
The results suggest that these firms have under-valued various intangible assets (assuming the mar-ket valuation is correct), which is not surprisingbecause they often have great difficulty valuing suchassets. Investors have even greater difficulty, because
Tobin’s q and the Value of Agriceutical Firms 281
Table 23.1. Estimates of q for selected pharmaceutical and chemicalfirms, various years.
Firm Average q Range
Delta and Pine Landa 3.32 1.55 to 7.11Pioneer Hi-Bred Internationala 1.99 1.15 to 3.19AstraZenecab 2.70 0.68 to 5.27Aventisc 1.06 0.78 to 1.43The Dow Chemical Companya 1.43 1.15 to 1.88E.I. du Pont de Nemours and Companya 1.89 1.21 to 2.90Novartis AGa 2.98 1.91 to 2.78Pharmaciaa 1.78 1.21 to 3.34American Home Productsa 2.97 1.61 to 4.84Eli Lillya 3.88 1.61 to 6.68Pfizera 3.31 1.91 to 8.37
a1990 to 1999.b1996 to 1999.c1997 to 1999.

the future is so uncertain with the current contro-versy over genetically enhanced food and feedgrains. No one knows exactly how the market foragriceutical products will evolve.
Finally, some of these intangible assets have yetto achieve their full economic benefits. Economiesof scale are needed in research and development inorder to realize their full value. However, pharma-ceutical and chemical firms have used an enormousamount of resources to finance the mergers andacquisitions to achieve these economies of scale.
Summary
Chemical and pharmaceutical firms recently haveinvested tremendous resources to achieve theeconomies of scale needed to carry out research onagriceutical products. Although the long-run futurefor these companies is probably positive, the publicmay perceive in the short run that these firms will beunable to achieve all that has been promised. Privateand public investments will be needed to enable thefull benefits of biotechnology to be shared by allconsumers.
References
Freberg, C. (2000) Competition, strategy, and profitability
in food and agribusiness industries. MS thesis,
Department of Agricultural Economics, Kansas State
University, Manhattan, Kansas.
Goldberg, R.A. and Enriquez, J. (2000) Transforming life,
transforming business: the life-science revolution.
Harvard Business Review March–April, 96–104.
Lindenberg, E.B. and Ross, S.A. (1981) Tobin’s q and
industrial organization. Journal of Business 54, 1–32.
Smirlock, M., Gilligan, T.W. and Marshall, W.J. (1984)
Tobin’s q and the structure-performance relationship.
American Economic Review 74, 1051–1060.
Smithers, A. and Wright, S. (2000) Valuing Wall Street:Protecting Wealth in Turbulent Markets. McGraw-
Hill, New York.
Standard & Poor’s COMPUSTAT© (2000) McGraw-Hill
Companies, Englewood, Colorado.
Tobin, J.A. (1969) General equilibrium approach to mon-
etary theory. Journal of Money, Credit, and Banking1(1), 15–29.
282 M. Boland
Introduction
In the pharmaceuticals industry, the biotechnologyrevolution has produced a core of large companies,often looking to consolidate, with a large andvibrant fringe of dedicated biotechnology firms(DBFs). These DBFs form the middle groundbetween the large firms and universities and otherresearch groups. The industry is characterized byalliances between these three groups, which isbelieved to enhance the level of innovation withinthe industry. The agro-food biotechnology sectorhas likewise seen consolidation among the down-stream ‘life science’ companies and the developmentof alliances between these and agro-food DBFs anduniversities and other public sector research organi-zations. It has furthermore seen substantial consoli-dation in the seed industry and the (vertical) inte-gration of independent seed companies, at leastAmerican ones, into the life science companies.When conceived, the life science companies wereargued to be taking advantage of synergies inbiotechnology research between pharmaceutical andagro-food applications, but recently Monsanto hascombined with Upjohn and spun off its agro-fooddivision, as have AstraZeneca and Novartis in spin-ning off their agribusiness divisions to formSyngenta. This suggests that at the downstream levelthe expected synergies between agro-food and phar-
maceuticals research have not emerged, though thecontinued presence within agro-food life-sciencecompanies of seeds, crop protection chemicals and,in some cases, animal health products, suggestssome synergies in the delivery of inputs to farmers:‘plant biotechnology did deliver synergy betweenSeeds and Crop Protection, but as our experiencegrew, so did the realisation that the synergiesbetween Agribusiness and our other activities wouldremain marginal’ (Novartis Operational Review,1999: 2).
The focus of plant biotechnology has so fardelivered mainly input traits, though the next gen-eration of products is expected to emphasize outputtraits, targeted at end product attributes desired byfood manufacturers (e.g. processing quality) andconsumers (e.g. taste, safety and health). Withrespect to health, such products will be in competi-tion with a fast-growing high-tech sector of the foodindustry, functional foods. This area is beginning toshow the development of alliances between tradi-tional food and pharmaceutical companies such asthose between Quaker and Novartis, and Raisol andJohnson and Johnson.
There has been tentative media speculationabout firms wishing to integrate vertically throughthe full food chain, producing high tech seeds, sell-ing them through identity preserved vertical supplychannels involving primary processing (e.g. the
283
24 The Structure of the European Agro-foodBiotechnology Industry: Are Strategic Alliances
Here to Stay?
W. Bruce Traill and Christopher E. DuffieldDepartment of Agricultural and Food Economics,The University of Reading,
Reading, UK
© CAB International 2002. Market Development for Genetically Modified Foods(eds V. Santaniello, R.E. Evenson and D. Zilberman)
alliance between Monsanto and Cargill giving theformer access to the latter’s grain elevators and pri-mary processing supply channels) and, potentially,finished food manufacturers. The Wall Street Journal(27 May 1998) refers to Monsanto and DuPont‘racing to build “dirt-to-dinner” biotechnologypipelines’ (p. B1) and ‘DuPont hopes to be able totake orders for a new type of crop from food com-panies such as Nestlé SA or ConAgra Inc., create itin the laboratory, contract with farmers to growmillions of acres and process it into a food ingredi-ent’ (p. B1). Food retailers, often thought nowadaysto be the food chain channel captains (particularlyin Europe), have not yet entered the fray, except toban genetically modified (GM) products from theirshelves.
The present structure of the agro-food biotech-nology industry may be portrayed as a large numberof DBFs primarily owned and located in Americaconnected via a series of alliances to life science firmswhich are either American owned (Monsanto,DuPont, Dow) or European (Novartis/AstraZeneca,Aventis). Whatever their origins, these firms operateon a global scale. To date the forward linkages tofood manufacturing are minimal. The food manu-facturing giants with a global presence and a highdegree of research intensity are predominantlyEuropean (Unilever and Nestlé), though researchand production activities are globally located.
A number of questions emerge: what will bethe future vertical structure of the agro-food indus-tries under the influence of agricultural biotech-nologies and a host of other pressures for structuralchange? Who will own the industry and where willit be located? From a European perspective, do thecombined disadvantages of a low number of DBFs,strict regulation and consumer antagonism margin-alize the European agro-food system and leave itproducing expensive, unhealthy food targeted solelyat the (isolated) home market?
Regretably this chapter does not provideanswers to all of these questions. Indeed, it is moreof a question raising than answering chapter and inthis sense represents work in progress (or just begin-ning). The main focus of the chapter is on the‘make or buy’ nature of the upstream relationshipsbetween life science and seed companies and DBFs.At this stage the research does no more than exposesome of the theoretical predictions of the econom-ics and business strategy literatures to statementsappearing in the annual reports of the life sciencecompanies. Based on these, the conclusions section
speculates on some of the broader issues raisedabove.
The theories of market structure consideredhere are: transaction cost economics, which indi-cates a move towards vertical integration (Pisano,1991); a real option model (Lavoie and Sheldon,2000a, b), again suggesting only a transitory role foralliances; complementary assets, which suggestshorizontal and vertical consolidation (Graff et al.,1999); and dynamic capabilities, which suggeststhat the continuation of alliances is to be expected inboth the short and the long runs (Teece et al., 1997).
Transaction Cost Economics
Transaction cost economics (TCE) is most com-monly used to explain/predict the boundaries of afirm. It argues that the market may not be the idealmechanism for some economic transactions due tothe transaction costs of using the price mechanism.The firm is viewed as a suppression of the pricemechanism to reduce the costs of the many transac-tions required in order to provide even the simplestof goods. TCE is concerned with static efficiency(Teece and Pisano, 1994) and examines whether thefirm should ‘make’ (internally) or ‘buy’ (externally)each of the constituent products or stages of pro-duction. In the TCE framework, internal and exter-nal resources are substitutes and these are utilizedaccording to their relative cost efficiency. Gulati etal. (2000) state that ‘the transaction cost perspectivestresses the efficiency benefits from reducing thegovernance cost of a transaction’ (p. 204).
Thus TCE treats the development by firms ofinternal competences as a substitute for outsourcingand alliances are temporary and unstable, steppingstones to integration (Pisano, 1991; Williamson,1995). The biotechnology industry exhibits manycharacteristics that favour make rather than buywith respect to R&D:
• Much biotechnology research is characterized byasset specificity, exposing the DBF to ex postsmall number bargaining.
• The case of high technology industries is com-plicated by bounded rationality; the firm pur-chasing R&D or technology may be unable toacquire the information needed in order todecide a suitable price. It is difficult to specifythe characteristics of the good or it may be thatthis requires full disclosure, which then removes
284 W.B. Traill and C.E. Duffield
the need for purchase. Geroski described this asthe ‘difficulties that buyers have in trying tovalue an innovation, and that sellers have inhelping them without giving away crucialsecrets’ (1992: 139). This raises the possibility ofopportunistic action on both sides, and againintegration is considered to be the solution. Inbiotechnology, however, there may be less scopefor opportunism than sometimes envisaged inTCE. The limited number of players in the fieldand the strong links in the scientific communitymay act as a deterrent (Dietrich, 1994).
• From the large company perspective, it is diffi-cult to define contracts effectively because it isdifficult to define precisely the performance andoutput of DBFs.
• High technology industries are characterized bytacit knowledge, knowledge that is acquired butcannot be easily transferred as it resides eitherwithin firms’ human capital or can be part offirms’ traditions or routines. The existence oftacit knowledge makes it even harder for the firmto accurately determine what it is purchasingand to contract in order to accurately specify itsintentions. This added problem in contractingwill lead to increased cost of governance for thetransaction. The difficulty of transferring tacitknowledge across firm boundaries, especially inthe absence of complete trust also increases therelative efficiency of vertical integration.
• Appropriability of research output is also a con-cern given the imperfect protection afforded bypatents (Pisano, 1991).
These various risks and uncertainties are all exacer-bated in an international setting. They suggest overtime the integration of DBFs into the R&D activi-ties of the life science companies. Note that theseTCE predictions derive from a static efficiency max-imization/cost minimization view of the world.
Real Options
Lavoie and Sheldon (2000a) use a real optionsmodel to explain the differences in relative R&Dlevels of US and European firms. They suggest thatit is differences in the external environment, that iscapital availability and the regulatory regime, whichalter the firms’ actions and therefore their compara-tive advantage. The R&D process is lengthy andcostly, with the time period and cost unknowable ex
ante. The costs incurred are paid up front and areconsidered at least partially irreversible. The partial-ly random nature of returns to R&D investmentfavours American companies which have access tolarger capital supplies than European firms. The USfirms, given the additional capital, can invest moreover a shorter time period, reducing the likelihoodof the project suffering from unforeseen delays. Theregulatory environment is also seen as morefavourable in the USA, lowering the risk of invest-ment in R&D. The capital market is also thought tofavour early entry by DBFs; the large multinationalsmonitor DBF performance with a view to deter-mining whether to exercise an option to invest later,either internally or by acquisition (Lavoie andSheldon, 2000b).
Lavoie and Sheldon suggest a European catch-up following the lagged entry of life science multi-nationals and growth in the European DBF sector.Based only on what is written in the preliminaryabstract Lavoie and Sheldon (2000b), we are unsurewhether this prediction arises from an easing of thecapital constraint on investment as the profitabilityof the industry becomes more evident over time; aneasing of the regulatory environment in Europe; oran increasing globalization of the industry due tothe growing presence of the life science multi-national enterprises (MNEs), resulting in the grow-ing irrelevance of the home country’s regulatoryenvironment or the location of DBFs. In any case,the model appears to predict the consolidation overtime of R&D within MNEs, an outcome in linewith TCE.
Complementary Assets
Graff et al. (1999), using a complementary assetsmodel, also predict consolidation of agro-foodbiotechnology research. They list three importantcategories of assets in the development of new plantvarieties by genetic transformation:
1. Process technologies for plant transformation.2. Genetically coded traits and enhancements.3. Elite germplasm.
Each of these assets is subject to economies of scaleand, pair-wise, each is complementary to the others(i.e. there are synergies between them). If this is thecase then the industry will slowly consolidate untilthere are only a few large integrated life science com-panies. These firms will span the whole spectrum of
Structure of the European Agro-Food Biotechnology Industry 285
industries for which biotechnology is an enablingtechnology: pharmaceuticals, chemicals, agricultureand food. DuPont is a prime example of this type oflarge, integrated firm using biotechnology to pro-duce goods from food to man-made fibres. Themultinationals will swallow the smaller DBFs andthen enter a process of mergers in order to furtherconsolidate the industry. Artuso (1999) indicatesthat this is already the case in the pharmaceuticalindustry.
The model is similar in nature to TCE in thesense that it is static efficiency that determines theoptimal size and scope of the firm.
Dynamic Capabilities
The literature on dynamic capabilities provides arationale for the existence and persistence of the net-works observed so far in biotechnology. Like thecomplementary assets model, this model has its ori-gins in the ‘resource-based theory of the firm’(Barney, 1996). Firms are viewed as bundles ofresources/competences/capabilities, which may bevaluable if they are rare and hard to imitate, the lat-ter condition applying particularly to intangibleassets such as tacit knowledge and firm culture,which are often path dependent. ‘The accumulationof know-how is viewed as an incremental and path-dependent process with the firm’s overall knowledgebase and hence capabilities being the evolutionaryoutcome of the nature and pattern of its experiences’(Anon., 2000: 3).
Within biotechnology, pharmaceutical and lifescience companies have competences in testing, reg-ulation, manufacture and marketing, all subject toeconomies of scale and beyond the reach of DBFswho rarely bring products to market (Anon., 2000).DBFs, often created by entrepreneurial academicsusing risk capital have expertise in specific areas ofbiotechnology.
In industries characterised by rapid technological
change such as biotechnology, it is unlikely that any
firm’s internal knowledge base is adequate …
collaboration with external actors who possess
complementary skills becomes an attractive
proposition, perhaps an imperative one.
(Anon., 2000: 9)
Large firms continue to invest in their knowledgebase in order to assimilate external knowledge andmake better informed investments, but they form
alliances with DBFs with specific competences.Given the dynamic nature and uncertainty overfuture competence needs, alliances are less risky thanoutright assimilation of DBFs by MNEs so long asthe technological base of the industry remainsdynamic.
Forward thinking firms wanting to competelook for partners with the competences/knowledgethey lack in order to open up their range of options.Coombs and Tomlinson state, ‘the most innovativefirms are characterised by a sharp awareness of thegaps that may exist in their capabilities’ (1998: 24)and so these are the most likely to seek out partnerswith complementary competences. Gutterman(1997) states ‘an innovative firm need not have theinternal capacity to independently perform all of thesteps’ (p. 100). The firm is no longer viewed as astand-alone entity but as part of a network of firmsinvolved in symbiotic competition, with strategicalliances being used to ‘extend their own pool ofresources and capabilities’ (Pena et al., 1999: 3).
In biotechnology and other high technologyindustries these networks of companies are thoughtto be especially important for innovation. This issummed up by Arora and Gambardella (1990):‘The locus of innovation should be thought of as a“network” of inter-organizational relations’ (p. 374).The networks are viewed as increasing the output ofR&D (Bartholomew, 1997; Padmore and Gibson,1998) and of competitiveness overall (Bureth et al.,1999).
Cohen and Levinthal’s idea of absorptivecapacity is part of this and also provides an insightinto the pattern of innovation in the biotechnologyindustry. They state ‘most innovations result fromborrowing rather than invention’ (Cohen andLevinthal, 1990: 128) and that this use of externalsources of knowledge and ideas is vital. Padmore etal. (1998: 622) argue that ‘Internal R&D capacityhas increased, both to meet the increased demandfor step innovation, and to increase the firms capac-ity to absorb external innovation’. This an exampleof how important many studies view this (Llerenaand Matt, 1999). Internal R&D has even beendescribed as an entry ticket or currency for enteringinto network agreements (Powell et al., 1996).
The DBFs and the universities and other not-for-profit research establishments fit into this viewof the industry structure by filling in the gaps of thelarger firms’ competences. The biotechnology indus-try is very closely linked to the basic research under-taken by these research centres and the pace of that
286 W.B. Traill and C.E. Duffield

research requires the larger firms to keep a carefulwatch on developments in these centres. Indeed‘technological innovation … relies heavily on thescientific discoveries made by non-profit institu-tions’ (Malo and Geuna, 1999: 15). The DBFs,often set up by academics to exploit their IPRs(Oehmke et al., 2000), are a vital link between theseresearch centres and the large firms (Sharp andSenker, 1999).
Anon. (2000) uses the North CarolinaBiotechnology Center ‘Actions Database’ on inter-national alliances to suggest that, for biotechnologyas a whole, two-thirds of international transactionswere organized through collaborative modes andthat this share remained constant over 12 years (to1992), supporting the dynamic capabilities viewthat the threat of technological obsolescence resultsin firms’ reluctance to commit to vertical integra-tion. The data are for all biotechnology, meaningthat they are dominated by the pharmaceuticals sec-tor and it is unclear whether the picture is the samefor the agro-food sector.
Research Questions
The four theories presented above predict differingstructures for the agro-food biotechnology industry.
1. Transaction cost economics: predicts that theindustry will vertically integrate in order to over-come the inherent costs and problems of effectivetransaction governance.2. Real options theory: predicts that the industrywill show an initial burst of DBF set-ups followedby the entry of multinationals, some of which willenter by a process of acquisition. This model doesnot predict the persistence of alliances.3. Graff et al.’s theory of complementary intellectu-al assets: predicts the consolidation and vertical inte-gration of the industry over time as firms attempt toachieve economies of scale and to make use of com-plementary assets.4. Dynamic capabilities: predicts that alliances willbe a permanent feature of the industry, at least solong as it is in a period of rapid technologicalchange, as each firm sits within a web of changinglinkages, allowing each to gain from the others’competences.
Review of Life Science Firms’ ResearchStrategies
At this early stage in the research we are unable totest the above model predictions scientifically.Rather we obtain an impression of what the life sci-ence firms themselves believe as suggested withintheir annual reports and also some press reports.
The statements support the accepted wisdomthat horizontal consolidation is taking place withinboth the seed and life science companies and thatthe two are becoming vertically integrated.
The global market for vegetable and flower seeds
has become much more concentrated over the last
10 years.
Several companies have joined larger groups,
mainly seed groups in the case of vegetables, unlike
what has been happening in field seeds, where it
was mainly agro-chemists and agro-industrialists
who were doing the take-over.
(Vilmorin, Clause and Cie Annual Report,
1998/1999: 30)
The Novartis Operational Review 1999 agrees say-ing ‘crop protection companies have acquired manyformerly independent seed companies in order togain access to germplasm, technological expertiseand seed distribution networks that are necessary toproduce genetically enhanced crops’ (p. 5). Thisstatement could be viewed as providing backing foreither the complementary assets or transaction costsviewpoints. Notably, Graff et al.’s (1999) statements‘the more varieties into which a given gene can beincorporated, the higher the value of owning apatent on the gene’ and ‘the more genes that can beadded to a plant as extra enhancements (stacking),the higher the value of the base variety’ are persua-sive in this respect, though given the regulatory andconsumer acceptance environments in Europe, theconsolidation of the seed industry in that continentmust be based on a very long-run perspective.
Further evidence of vertical integration can befound, again in the Vilmorin, Clause and CieAnnual Report 1998/1999 (p. 42), suggesting thatdealing with problems in managing the value chainleads to vertical integration:
The increasing complexity of managing these
products, which are the result of more and more
sophisticated research, means that total integration
of the whole supply chain is necessary – research,
production, factory processing and distribution –
which ensure the ultimate goal: quality.
Structure of the European Agro-Food Biotechnology Industry 287

This statement seems to back up the central argu-ments of the transaction cost economics school ofthought.
The majority of comments, however, refer tothe importance of alliances for R&D, either as ameans of entry (as predicted by the real options the-ory), or as a permanent feature of the industry. TheFinancial Times Mastering Strategy Series notes that
Monsanto, the life sciences powerhouse, is an
excellent example of an organisation that has used
an alliance network to spearhead the transformation
from an old-line chemicals concern to the cutting-
edge of biotechnology, and then to cope with the
recent rapid technological convergence in the life
sciences (p. 4).
The use of alliances is echoed by Novartis in theirOperational Review 1999 (p. 5)
An industry-wide web of collaborations has been
established to improve the productivity of R&D
investments as the leading companies seek access to
the full range of new platform technologies from
niche companies at the forefront of their particular
technology areas
and in the Bayer Annual Report 1999, ‘We arebuilding a position at the leading edge of technolo-gy through a network of research alliances’ (p. 13)and
key technologies like genomics, bioinformatics,
combinatorial chemistry and high-throughput
screening are indispensable in crop protection
research too. We are utilising these technologies
intensively by way of cooperation agreements with
leading research companies (p. 25).
The importance of alliances are also stressed by:Vilmorin, Clause and Cie, Annual Report 1998/9‘the firm must … multiply partnerships to remain atthe forefront of high-speed scientific progress’ (p. 3);‘BASF has established two research joint venturesand begun cooperating with partners in plantbiotechnology’ (BASF, 1999: 41); ‘to achieve newproduct breakthroughs, we will continue to invest innew technologies and leverage our strengths bycooperating with innovative, cutting edge biotechcompanies’ (Aventis, Brief Annual Report, 1999: 9);‘R&D expenditure increased to $297m; the increasewas largely associated new collaborations in biotech-nology research’ (AstraZeneca Annual Report, 1999:41); ‘In R&D, close collaboration with externalpartners is essential’ (DSM Annual Report, 1999:12).
While these statements do not exclusivelyrelate to agro-food biotech, nor do they prove thatcollaboration is a permanent rather than transitorystate, they are suggestive of this. The view is partial-ly supported by Ernst & Young (2000) showing thatin Europe for the 4 years from 1996 to 1999, thebiotech industry (dominated, it is true, by pharma-ceuticals) saw strategic alliances and joint venturesdouble in number from 123 to 261 whereas mergersand acquisitions increased only from 40 to 46.Incidentally, the majority of the alliances made byEuropean firms were with American DBFs andpharmaceutical companies. Ernst & Young (1999)also make the point that, in earmarking up to 30%of its R&D budget to external collaborations,
companies must ensure that sufficient discovery
capability remains in-house to enable them to make
value judgements on what is on offer while
ensuring that they do not become overly reliant on
external organisations at critical stages of the R&D
process.
Also that ‘consolidation in biotech goes on all thetime – it’s just not enough to offset the formation ofnew companies’ (p. 25).
While collaboration is seen as necessary to thelarge life science companies, it is the lifeblood of theDBF: Diversa corporation saw ‘the increase in rev-enues [688%] resulted from several agreementssigned in 1999’ (Agra Food Biotech, 2000: 20).These ‘collaborations include Novartis AgribusinessBiotechnology Research, Inc. for new seed productsto enhance crop production and provide improvedperformance and quality and output traits, andDow Chemical company to develop novel enzymes’(Agra Food Biotech, 2000). Of Genzyme Trans-genics corporation’s first quarter revenues ofUS$18.9 million, US$3.6 million came from trans-genic collaborations (Agra Food Biotech, 2000).
It is not only the agro-chemical and life sciencecompanies which are creating alliances in this field;Unilever’s Annual Review 1999 says that‘Collaboration with external agencies is an integralpart of our research’ (p. 19). Nestlé’s booklet‘Research and development at the dawn of the 21stcentury’ states
The whole of the Nestlé R&D system benefits from
co-operation with leading and reputed research
institutions and universities on the international
scene and on all continents who contribute their
skills in highly specific areas of science and
technology. Even as big a company as Nestlé cannot
perform all the tasks in-house (p. 8).
288 W.B. Traill and C.E. Duffield
Conclusions
The limited evidence presented in this chapter tendsto support the dynamic capabilities view of theworld, suggesting that so long as the agro-foodbiotechnology industry remains dependent on highlevels of R&D expenditure and continues to drawon a diverse and unpredictably changing range ofhighly specialized scientific disciplines, alliancesbetween DBFs, universities and life science compa-nies will continue. The major seed companies,though, have already been integrated into the lifescience firms, in Europe as well as the USA; syner-gies (complementary capabilities) being a likelyexplanation, though it would be unwise to rule outcompletely market power as a motive. The questionof location (and the related question of internation-al competitiveness) has not been directly addressed.On the one hand, it is clear that life science firms arecreating alliances and joint ventures with what theyperceive to be the firms with the best skills wherev-er they are located globally. On the other hand, per-sonal discussions with those in life science firmsresponsible for managing joint ventures suggest thatthey see advantages in proximity and, all else beingequal, would prefer local partners. If so, this wouldsuggest that the creation of an environment attrac-tive to vibrant DBFs and public sector researchwould create conditions favouring the nearby loca-tion of life science companies’ R&D facilities (andlikewise, the existence of life science R&D facilitiescould be one factor encouraging the establishmentof local DBFs). Another open question is the extentto which adaptation to local environmental condi-tions requires some sort of local genetic researchcapability (in the same way that food manufacturersadapt products to local consumer preferences). If so,this more applied and standard research is likely totake place internally to the large seed manufacturers(within the life science companies) as it will notrequire the specialist skills of the DBFs. Finally,there is no evidence at this stage concerning the pos-sible further vertical integration of the food chain toinclude the high-tech end of food manufacturing.Being more sensitive to final consumer demand, wewould anticipate that such firms will be reluctant (atleast in Europe) to form partnerships, but over thelonger term it is a possible development we willwatch with interest.
References
Agra Food Biotech (2000) No. 29. Agra Europe (London)
Ltd, London.
Anon. (2000) The international organisation of the
biotechnology industry. Paper submitted to
International Business Review.Arora, A. and Gambardella, A. (1990) Complementarity
and external linkages: the strategies of the large firms
in biotechnology. Journal of Industrial Economics38(4), 361–379.
Artuso, A. (1999) Life science industries: comparative
analysis of structure, performance and regulatory
policy in the agricultural, biotechnology and phar-
maceutical sectors. Paper prepared for the ICABR
Conference on The Shape of the Coming AgriculturalBiotechnology Transformation: Strategic Investmentand Policy Approaches from an Economic Perspective.University of Rome Tor Vergata, Italy, 17–19 June
1999.AstraZeneca Annual Report (1999) AstraZeneca.
Aventis Brief Annual Report (1999) Aventis.
Barney, J.B. (1996) Gaining and Sustaining CompetitiveAdvantage. Addison-Wesley, Reading, Massachusetts.
Bartholomew, S. (1997) National systems of biotechnolo-
gy innovation: complex interdependence in the glob-
al system. Journal of International Business Studies2nd Qtr, 241–266.
BASF (1999) Facts and Figures. BASF.
Bayer Annual Report (1999) Bayer.
Bureth, A., Wolff, S. and Zantei, A. (1999) Co-operative
learning and the evolution of inter-firm agreements
in the European electronics industry. In:
Gambardella, A. and Malbera, F. (eds) TheOrganization of Economic Innovation in Europe.Cambridge University Press, Cambridge.
Cohen, W.M. and Levinthal, D.A. (1990) Absorptive
capacity: a new perspective on learning and innova-
tion. Administrative Science Quarterly 35, 128–152.Coombs, R. and Tomlinson, M. (1998) Patterns in UK
company innovation styles: new evidence from CBI
innovation trends survey. CRIC Discussion Paper, 7.
CRIC, The University of Manchester, Manchester.
Dietrich, M. (1994) Transaction Cost Economics andBeyond: Towards a New Economics of the Firm.Routledge, London.
DSM Annual Report (1999) DSM.
Ernst & Young (1999) 13th Biotechnology Industry AnnualReport. Ernst & Young International, London.
Ernst & Young (2000) European Life Sciences SeventhAnnual Report. Ernst & Young International,
London.
Financial Times Mastering Strategy Series (undated) TheFinancial Times.
Geroski, P.A. (1992) Vertical relations between firms and
industrial policy. The Economic Journal 102,
138–147.
Structure of the European Agro-Food Biotechnology Industry 289

Graff, G.D., Rausser, G.C. and Small, A.A. (1999)
Agricultural biotechnology’s complementary intel-
lectual assets. Paper prepared for the ICABR
Conference on Shape of the Coming AgriculturalBiotechnology Transformation: Strategic Investmentand Policy Approaches from an Economic Perspective.University of Rome Tor Vergata, Italy, 17–19 June
1999.
Gulati, R., Nohria, N. and Zaheer, A. (2000) Strategic
networks. Strategic Management Journal March,
203–215.
Gutterman, A. (1997) Innovation and Competition Policy.Kluwer Law International, London.
Lavoie, B.F. and Sheldon, I.M. (2000a) The source of
comparative advantage in the biotechnology indus-
try: a real options approach. Agribusiness: anInternational Journal 16(1), 56–67.
Lavoie, B.F and Sheldon, I.M. (2000b) Market structure
in biotechnology: implications for long run compar-
ative advantage. Paper presented to 4th ICABR
Conference, on The Economics of Biotechnology,Ravello, Italy, 24–28 August 2000.
Llerena, P. and Matt, M. (1999) Inter-organizational col-
laboration: the theories and their policy implications.
In: Gambardella, A. and Malbera, F. (eds) TheOrganization of Economic Innovation in Europe.Cambridge University Press, Cambridge.
Malo, S. and Geuna, A. (1999) Science–technology link-
ages in an emerging research platform: the case of
combinatorial chemistry and biology. SPRUElectronic Working Paper Series Paper, 37. The
University of Sussex, Brighton.
Nestlé (undated) Research and development at the dawn ofthe 21st century. Nestlé.
Novartis Operational Review (1999) Novartis.
Oehmke, J.F., Weatherspoon, D.D., Wolf, C.A., Naseem,
A., Maredia, M. and Hightower, A. (2000) Is agri-
cultural research still a public good? Agribusiness: anInternational Journal 16(1), 68–81.
Padmore, T. and Gibson, H. (1998) Modelling systems of
innovation 2: a framework for industrial cluster
analysis in regions. Research Policy 26(2nd Qtr),
625–641.
Padmore, T., Schuetze, H. and Gibson, H. (1998)
Modelling systems of innovation: an enterprise-cen-
tered view. Research Policy 26(2nd Qtr), 605–624.
Pena, I., Boehje, M. and Akridge, J. (1999) Collaborative
agreements in the ag-biotechnology industry: the
importance of transaction costs and investment.
Strategy paper prepared for the ICABR Conference
on Shape of the Coming Agricultural BiotechnologyTransformation: Strategic Investment and PolicyApproaches from an Economic Perspective. University
of Rome Tor Vergata, Italy, 17–19 June 1999.
Pisano, G. (1991) The governance of innovation: vertical
integration and collaborative arrangements in the
biotechnology industry. Research Policy 20, 237–249.
Powell, W.W., Koput, K.W. and Smith-Doerr, L. (1996)
Inter-organizational collaboration and the locus of
innovation: networks of learning in biotechnology.
Administrative Science Quarterly 41, 116–145.
Sharp, M. and Senker, J. (1999) European biotechnology:
learning and catching up. In: Gambardella, A. and
Malbera, F. (eds) The Organization of EconomicInnovation in Europe. Cambridge University Press,
Cambridge.
Teece, D.J. and Pisano, G. (1994) The dynamic capabili-
ties of firms: an introduction. Journal of EconomicBehaviour and Organization 3, 451–489.
Teece, D.J., Pisano, G. and Shuen, A. (1997) Firm capa-
bilities, resources and strategy. CCC Working Paper908. Center for Research in Management, University
of California at Berkley.
Unilever’s Annual Review (1999) Unilever.
Vilmorin, Clause and Cie Annual Report (1998/1999)
Vilmorin, Clause and Cie.
Wall Street Journal (1998) 27 May.
Williamson, O.E. (1995) Hierarchies, markets and power
in the economy: an economic perspective. Industrialand Corporate Change 4(1), 21–49.
290 W.B. Traill and C.E. Duffield

Introduction
In a recent paper, Lavoie and Sheldon (2000)advance the hypothesis that observed US compara-tive advantage in biotechnology can be explained bysources of heterogeneity within the biotechnologyR&D investment process. Using a real optionsapproach, they illustrate how international differ-ences in the per-period rate of investment and levelof domestic regulatory uncertainty could be suffi-cient to explain the emergence of US biotechnologyfirms as world leaders in the industry.
Specialization in high technology implies thatdomestic firms should enjoy excess returns.However, the accumulation of rents stemming frominnovative activity could be diminished by thegrowing presence of foreign-based multinationals inthe domestic industry. In particular, foreign multi-nationals can enter into alliances with or evenacquire established domestic start-ups and, there-fore, obtain access to proprietary knowledge stocksgenerated from ongoing domestic R&D. The cur-rent and future rents embodied in these knowledgestocks can, therefore, be partially or fully appropri-ated by overseas entities.
Recent dynamics in the biotechnology indus-try suggest that this process may be underway. Sharp(1996: 2–3) observes,
European multinationals are penetrating and
exploiting American capabilities in biotechnology
… The large European-based multinationals in
chemicals and pharmaceuticals, in pursuit of the
necessary knowledge and skills in biotechnology,
have through arrangements of one sort or another
widely penetrated the American knowledge base.
Recent examples of this process include: aUS$45 million deal between Hoechst ScheringAgrEvo and Gene Logic to discover genes useful forcrop protection and improvement products; anagreement between Hoffman-LaRoche andAgouron to develop anti-cancer drugs; and theestablishment of a 5-year R&D collaborationbetween BASF AG and Mitotix.
In this chapter, the possible reasons for andimplications of foreign-based multinational activityin the US biotechnology industry are considered. Inparticular, a two-tiered industry structure forbiotechnology is posited, consisting of start-ups,which pioneered the industry, and multinationals,which are relatively late entrants. Sources of hetero-geneity within the biotechnology R&D process ledto US start-ups emerging as world leaders inbiotechnology. Although many of these start-ups areyet to be profitable, they have accumulated valuableassets in the form of proprietary knowledge stocksoriginating from ongoing R&D projects. By eitherforming alliances with or acquiring American start-
291
25 Market Structure in Biotechnology:Implications for Long-run Comparative
Advantage
Brian F. Lavoie and Ian M. SheldonDepartment of Agricultural, Environmental and Development Economics,
The Ohio State University, Columbus, Ohio, USA
© CAB International 2002. Market Development for Genetically Modified Foods(eds V. Santaniello, R.E. Evenson and D. Zilberman)

ups, European multinationals can gain access toknowledge stocks arising from US R&D and, hence,establish a claim on the future excess returns thesestocks may produce.
In the next section, a characterization of indus-try dynamics in a biotechnology sector populated bystart-ups and multinationals is developed. Thisallows an examination of how late entry byEuropean multinationals could result in a re-alloca-tion of ownership rights to potential excess returnsfrom innovation embodied in proprietary USknowledge stocks. In the third section, the entrydecision of start-ups and multinational firms isexamined in more detail, then some of the implica-tions of this characterization are illustrated usingcomputer simulation. Specifically, the modelincludes the possibility that multinational firms mayacquire R&D undertaken by domestic start-ups.Finally, policy and trade implications stemmingfrom European penetration of the US biotechnolo-gy industry are discussed.
A Characterization of Industry Dynamicsin Biotechnology
The basic premise of Lavoie and Sheldon is thattraditional explanations for the pattern of special-ization in high technology industries are poorindicators, a priori, of the eventual emergence ofUS firms as world leaders in biotechnology. Thispoint can be illustrated by considering Grossmanand Helpman’s (1991) model, where comparativeadvantage in high technology industries arises fromone of two sources: relative factor endowments orinitial knowledge stocks. These elements have animpact on innovation by creating asymmetries inthe cost of R&D. If firms in all countries begin withidentical knowledge stocks, and knowledgespillovers from R&D are international in scope, atraditional Heckscher-Ohlin result is predicted: rel-ative factor endowments determine the pattern ofspecialization. The country that is relatively abun-dant in the factor used intensively in R&D, and inhigh technology production, emerges as the leaderin high technology industries. Alternatively, ifrelative factor endowments are similar across coun-tries, the pattern of trade can still be fixed if onecountry begins with a larger knowledge stock thanits rivals. This country enjoys a ‘head start’ in inno-vation in the form of lower R&D costs, and ifknowledge spillovers from R&D are restricted to
be national in scope, its lead is perpetuated overtime.
Neither source of heterogeneity seems especial-ly appealing as an explanation for US comparativeadvantage in biotechnology. The convergence ofindustrialized countries since 1945 in terms of tra-ditional sources of comparative advantage has beenwell documented. Furthermore, there is no indica-tion that the USA enjoyed any form of advantage ininitial knowledge stocks as the biotechnology indus-try began to develop in the late-1970s. Initialknowledge stocks probably took the form of basicscientific research, much of which occurred outsidethe USA, and was readily available internationally inscientific journals.
As an alternative, Lavoie and Sheldon developa real options framework to explain US comparativeadvantage in biotechnology. They formulate a firm’sdecision to invest in biotechnology R&D as analo-gous to holding a financial option; that is the right,but not the obligation, to invest in an R&D pro-gramme. Comparative advantage is then a questionof option management: what incentives caused USbiotechnology firms to exercise their options toinvest earlier than European firms? Lavoie andSheldon find that the presence of international dif-ferences in the form of a higher US per-period rateof investment and a less uncertain US regulatoryenvironment yield the result that US biotechnologyfirms, on average, exercise their options sooner.Consequently, they initiate more R&D projects,begin investment sooner, innovate more rapidly,persevere longer in the face of mounting R&D costsand successfully complete more projects thanEuropean firms.
Typically, it is assumed that a country special-izing in a high technology sector will enjoy excessrents associated with innovation. Indeed, public pol-icy has often stressed the need to promote high tech-nology industries for this very reason (Krugman,1984). However, recent history of the biotechnolo-gy industry suggests that this assumption may betoo simplistic. The industry is currently undergoinga period of consolidation, in which multinationalcorporations have acquired or formed alliances withmany of the smaller start-up companies who pio-neered the industry. It is significant to note thatmany of these alliances and acquisitions have beentransatlantic in nature, in particular, Europeanmultinationals operating in the US biotechnologyindustry.
Given these conditions, it can be hypothesized
292 B.F. Lavoie and I.M. Sheldon
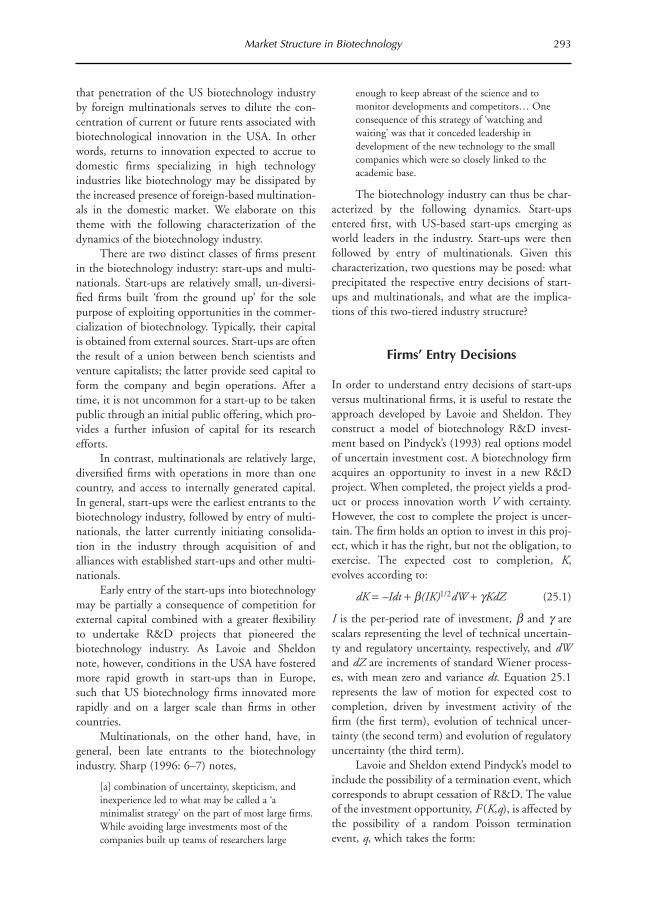
that penetration of the US biotechnology industryby foreign multinationals serves to dilute the con-centration of current or future rents associated withbiotechnological innovation in the USA. In otherwords, returns to innovation expected to accrue todomestic firms specializing in high technologyindustries like biotechnology may be dissipated bythe increased presence of foreign-based multination-als in the domestic market. We elaborate on thistheme with the following characterization of thedynamics of the biotechnology industry.
There are two distinct classes of firms presentin the biotechnology industry: start-ups and multi-nationals. Start-ups are relatively small, un-diversi-fied firms built ‘from the ground up’ for the solepurpose of exploiting opportunities in the commer-cialization of biotechnology. Typically, their capitalis obtained from external sources. Start-ups are oftenthe result of a union between bench scientists andventure capitalists; the latter provide seed capital toform the company and begin operations. After atime, it is not uncommon for a start-up to be takenpublic through an initial public offering, which pro-vides a further infusion of capital for its researchefforts.
In contrast, multinationals are relatively large,diversified firms with operations in more than onecountry, and access to internally generated capital.In general, start-ups were the earliest entrants to thebiotechnology industry, followed by entry of multi-nationals, the latter currently initiating consolida-tion in the industry through acquisition of andalliances with established start-ups and other multi-nationals.
Early entry of the start-ups into biotechnologymay be partially a consequence of competition forexternal capital combined with a greater flexibilityto undertake R&D projects that pioneered thebiotechnology industry. As Lavoie and Sheldonnote, however, conditions in the USA have fosteredmore rapid growth in start-ups than in Europe, such that US biotechnology firms innovated morerapidly and on a larger scale than firms in othercountries.
Multinationals, on the other hand, have, ingeneral, been late entrants to the biotechnologyindustry. Sharp (1996: 6–7) notes,
[a] combination of uncertainty, skepticism, and
inexperience led to what may be called a ‘a
minimalist strategy’ on the part of most large firms.
While avoiding large investments most of the
companies built up teams of researchers large
enough to keep abreast of the science and to
monitor developments and competitors… One
consequence of this strategy of ‘watching and
waiting’ was that it conceded leadership in
development of the new technology to the small
companies which were so closely linked to the
academic base.
The biotechnology industry can thus be char-acterized by the following dynamics. Start-upsentered first, with US-based start-ups emerging asworld leaders in the industry. Start-ups were thenfollowed by entry of multinationals. Given thischaracterization, two questions may be posed: whatprecipitated the respective entry decisions of start-ups and multinationals, and what are the implica-tions of this two-tiered industry structure?
Firms’ Entry Decisions
In order to understand entry decisions of start-upsversus multinational firms, it is useful to restate theapproach developed by Lavoie and Sheldon. Theyconstruct a model of biotechnology R&D invest-ment based on Pindyck’s (1993) real options modelof uncertain investment cost. A biotechnology firmacquires an opportunity to invest in a new R&Dproject. When completed, the project yields a prod-uct or process innovation worth V with certainty.However, the cost to complete the project is uncer-tain. The firm holds an option to invest in this proj-ect, which it has the right, but not the obligation, toexercise. The expected cost to completion, K,evolves according to:
dK = –Idt + b(IK)1/2dW + gKdZ (25.1)
I is the per-period rate of investment, b and g arescalars representing the level of technical uncertain-ty and regulatory uncertainty, respectively, and dWand dZ are increments of standard Wiener process-es, with mean zero and variance dt. Equation 25.1represents the law of motion for expected cost tocompletion, driven by investment activity of thefirm (the first term), evolution of technical uncer-tainty (the second term) and evolution of regulatoryuncertainty (the third term).
Lavoie and Sheldon extend Pindyck’s model toinclude the possibility of a termination event, whichcorresponds to abrupt cessation of R&D. The valueof the investment opportunity, F (K,q), is affected bythe possibility of a random Poisson terminationevent, q, which takes the form:
Market Structure in Biotechnology 293
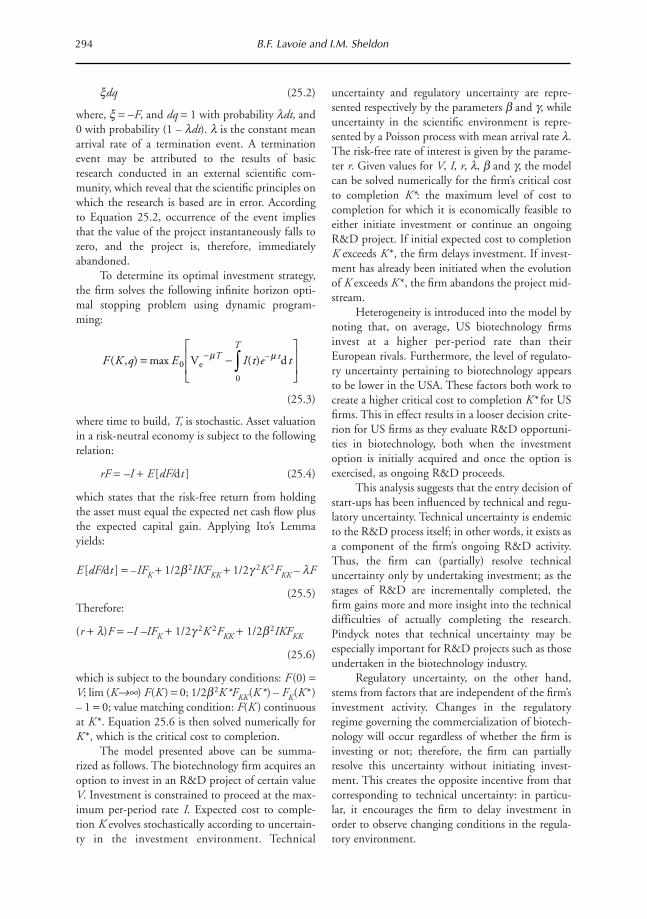
xdq (25.2)
where, x = –F, and dq = 1 with probability ldt, and0 with probability (1 – ldt). l is the constant meanarrival rate of a termination event. A terminationevent may be attributed to the results of basicresearch conducted in an external scientific com-munity, which reveal that the scientific principles onwhich the research is based are in error. According to Equation 25.2, occurrence of the event impliesthat the value of the project instantaneously falls tozero, and the project is, therefore, immediatelyabandoned.
To determine its optimal investment strategy,the firm solves the following infinite horizon opti-mal stopping problem using dynamic program-ming:
(25.3)
where time to build, T, is stochastic. Asset valuationin a risk-neutral economy is subject to the followingrelation:
rF = –I + E [dF/dt ] (25.4)
which states that the risk-free return from holdingthe asset must equal the expected net cash flow plusthe expected capital gain. Applying Ito’s Lemmayields:
E [dF/dt ] = –IFK + 1/2b 2IKFKK + 1/2g 2K 2FKK – lF
(25.5)Therefore:
(r + l)F = –I –IFK + 1/2g 2K 2FKK + 1/2b 2IKFKK
(25.6)
which is subject to the boundary conditions: F (0) =V; lim (KÆ•) F(K ) = 0; 1/2b 2K*FKK(K*) – FK(K *)– 1 = 0; value matching condition: F(K ) continuousat K *. Equation 25.6 is then solved numerically forK *, which is the critical cost to completion.
The model presented above can be summa-rized as follows. The biotechnology firm acquires anoption to invest in an R&D project of certain valueV. Investment is constrained to proceed at the max-imum per-period rate I. Expected cost to comple-tion K evolves stochastically according to uncertain-ty in the investment environment. Technical
uncertainty and regulatory uncertainty are repre-sented respectively by the parameters b and g, whileuncertainty in the scientific environment is repre-sented by a Poisson process with mean arrival rate l.The risk-free rate of interest is given by the parame-ter r. Given values for V, I, r, l, b and g, the modelcan be solved numerically for the firm’s critical costto completion K*: the maximum level of cost tocompletion for which it is economically feasible toeither initiate investment or continue an ongoingR&D project. If initial expected cost to completionK exceeds K *, the firm delays investment. If invest-ment has already been initiated when the evolutionof K exceeds K *, the firm abandons the project mid-stream.
Heterogeneity is introduced into the model bynoting that, on average, US biotechnology firmsinvest at a higher per-period rate than theirEuropean rivals. Furthermore, the level of regulato-ry uncertainty pertaining to biotechnology appearsto be lower in the USA. These factors both work tocreate a higher critical cost to completion K* for USfirms. This in effect results in a looser decision crite-rion for US firms as they evaluate R&D opportuni-ties in biotechnology, both when the investmentoption is initially acquired and once the option isexercised, as ongoing R&D proceeds.
This analysis suggests that the entry decision ofstart-ups has been influenced by technical and regu-latory uncertainty. Technical uncertainty is endemicto the R&D process itself; in other words, it exists asa component of the firm’s ongoing R&D activity.Thus, the firm can (partially) resolve technicaluncertainty only by undertaking investment; as thestages of R&D are incrementally completed, thefirm gains more and more insight into the technicaldifficulties of actually completing the research.Pindyck notes that technical uncertainty may beespecially important for R&D projects such as thoseundertaken in the biotechnology industry.
Regulatory uncertainty, on the other hand,stems from factors that are independent of the firm’sinvestment activity. Changes in the regulatoryregime governing the commercialization of biotech-nology will occur regardless of whether the firm isinvesting or not; therefore, the firm can partiallyresolve this uncertainty without initiating invest-ment. This creates the opposite incentive from thatcorresponding to technical uncertainty: in particu-lar, it encourages the firm to delay investment inorder to observe changing conditions in the regula-tory environment.
294 B.F. Lavoie and I.M. Sheldon
F K q E I t e tT tT
( , ) max ( ) –= -È
Î
ÍÍ
˘
˚
˙˙
- Ú0
0
V dem m

The evolution of expected cost to completion,expressed in Equation 25.1, indicates that the tech-nical uncertainty term b is not independent of I, therate of investment, while the regulatory uncertaintyterm g is independent of I. A rise in b, ceterisparibus, increases a firm’s incentive to initiate invest-ment. This would be manifested in a higher criticalcost to completion, K*. Alternatively, a higher g,ceteris paribus, encourages a firm to delay invest-ment, in other words, lowers K*.
Can the uncertainty pertaining to biotechnol-ogy R&D also be used to explain the disparity ininvestment behaviour observed between start-upsand multinationals? It is possible that inter-firm dif-ferences in technical uncertainty may drive the differ-ence in investment strategies adopted by start-upsand multinationals. In particular, we posit a scenariowhereby the accumulation of proprietary knowledgestocks on the part of early entrants into the industry,start-ups, can be at least partially utilized by lateentrants, the multinationals, to contribute towardsthe resolution of technical uncertainty.
It was noted earlier that start-ups began withthe same baseline ‘knowledge stock’: informationpublished in the scientific literature. However, asR&D programmes commence, and projects aregradually completed, research results and experi-ences accumulate. These results and experiences areclosely guarded proprietary assets of firms that pro-duce them. Thus, conduct of R&D is synonymouswith the creation of the type of proprietary knowl-edge stocks to which Grossman and Helpman referin their model of endogenous innovation. The valueof a firm, especially in a relatively young industrysuch as biotechnology, is often heavily based on thecreation of these proprietary knowledge stocks, inthat they serve as an indicator of the firm’s futureability to successfully commercialize valuablebiotechnology products. These knowledge stocksalso contribute towards resolving, at least partially,technical uncertainty faced by firms undertakingbiotechnology R&D.
What precipitated the multinationals’ decisionto delay entry? In comparing different types offirms, rather than identical firms across countries,technical, rather than regulatory uncertainty mayhave been the source of heterogeneity responsiblefor asymmetric investment strategies exhibited bythe two types of firm. Inter-firm differences in tech-nical uncertainty can be manifested in two ways.First, the level of technical uncertainty, b, may havebeen lower for multinationals than for start-ups,
ceteris paribus. This explanation might make sense ifthe level of scientific talent were greater in multina-tional corporation research laboratories relative tothat available to start-ups. However, the evidencecontradicts this hypothesis: start-ups have been typ-ically formed around the talents of university scien-tists working on the cutting edge of biotechnologyresearch. Indeed, large corporations have had trou-ble attracting these scientists to work in their ownlaboratories.
A more plausible explanation is that technicaluncertainty has been relatively similar for both typesof firms, but the way in which it has been manifest-ed is different. In the formulation of the start-ups’investment decision, it was noted that technicaluncertainty could only be resolved by actuallyundertaking investment. This creates an incentive tocommence investment right away. Regulatoryuncertainty, however, evolves independently of thefirm’s investment activity, and creates an incentive todelay. On balance, technical uncertainty has beenthe stronger factor and start-ups have tended toinvest early, under extremely uncertain conditionsand with little or no cash flow.
In the case of multinationals, it may be thattechnical uncertainty has been at least partiallyresolvable without actually undertaking investment,that is when I = 0. Some technical uncertainty maystill exist that can only be resolved by actually com-mencing investment, but the remainder can beobserved through monitoring the performance ofstart-ups; the ‘watch and wait’ strategy noted bySharp. This implies that in comparing multination-als and start-ups, b has been lower and g has beenhigher for the former than for the latter, where inter-pretation of g is expanded to include not only regu-latory uncertainty, but also any form of uncertaintyindependent of the firm’s investment level. This inturn would create more incentive, represented by alower K*, for the multinationals to delay entry inorder to obtain more information contributingtowards partial resolution of the uncertainty stem-ming from sources independent of the firm’s R&Dactivity. As a consequence, multinationals would belate entrants to the industry in comparison withstart-ups.
Given this scenario, one question remains: whyshould technical uncertainty assume a differentstructure for multinationals than for start-ups? Theanswer pertains to the knowledge stocks developedby start-ups during early stages of the industry. Inparticular, the multinationals possess an option that
Market Structure in Biotechnology 295

start-ups probably do not: the ability to tap into theknowledge base established by start-ups engaged inongoing R&D.
To see how this process may unfold, a heuristicformulation of the multinationals’ entry decisioncan be developed. In the early stages of the industry,multinationals, in addition to start-ups, acquiredoptions to invest in biotechnology R&D. Bothtypes of firm faced an R&D investment structuresimilar to that formulated by Lavoie and Sheldon.However, there was one significant differencebetween the types of firms. Multinationals, beingrelatively well funded compared with start-ups,could afford to ‘watch and wait’, observing condi-tions in the investment environment, including theperformance of start-ups. Most start-ups were notprofitable, so it is unlikely that multinationals usedprofitability as the performance metric; rather, theymonitored developments in start-ups’ ongoingR&D, or equivalently, the accumulation of propri-etary knowledge stocks. Multinationals were able toaccess these stocks over time in an incremental fash-ion, perhaps by hiring experienced talent away fromstart-ups, or by purchasing the partially completedR&D of insolvent start-ups. This option is not like-ly to have been available to most start-ups, whosefunds are almost entirely consumed in maintenanceof ongoing R&D programmes. These inroads intothe knowledge stocks of start-ups assists in resolvingsome technical uncertainty surrounding commer-cialization of biotechnology, without engaging in afull-scale commitment to a biotechnology R&Dprogramme.
If expected cost to completion eventually fallsbelow the critical value pertaining to multinationals,which is lower than that corresponding to start-ups,the multinational will exercise its investment optionand invest directly in biotechnology R&D, throughin-house research programmes, and often throughstrategic alliances with or acquisition of establishedstart-ups. In the case of alliance or acquisition, themultinational obtains full access to the proprietaryknowledge stock of the start-up.
The industry dynamics of biotechnology cannow be considered in the context of this descriptionof the start-ups’ and multinational’s investmentdecisions. In the industry’s earliest stages, technicaluncertainty was the dominant form of uncertaintysurrounding biotechnology R&D. As such, itencouraged start-ups to exercise their option toinvest early, and engage in large-scale investments inthe face of no significant cash flow. In this environ-
ment, the sources of comparative advantagefavoured the USA, as US firms invested at a higherper-period rate and were governed by a less uncer-tain regulatory environment. In engaging in thisearly investment, start-ups began to accumulatevaluable proprietary knowledge stocks, stemmingfrom ongoing research. These knowledge stocksserved to reduce technical uncertainty as the com-mercialization of biotechnology proceeded.
Multinationals, on the other hand, delayedexercising their option to invest, since the R&Dinvestment structure facing them was slightly differ-ent from that of the start-ups. In particular, techni-cal uncertainty was at least partially resolvable with-out actually undertaking direct investment, throughthe expediency of access to the knowledge stocksestablished by start-ups engaged in ongoing R&D.This implies that the critical cost to completion hasbeen lower for multinationals relative to start-upsand, thus, the incentive to exercise the option toinvest has been less.
Multinationals entering the industry often doso by either forming alliances with or acquiringestablished start-ups. In doing so, they obtain directaccess to the knowledge stocks that these firms havedeveloped over time. It seems likely that the selec-tion of which start-ups to form strategic allianceswith or to acquire will be based on the pattern ofspecialization established in the industry throughthe R&D activity of the start-ups. In particular, it ishypothesized that multinationals will be more likelyto invest in start-ups located in the country holdingthe comparative advantage in biotechnology R&Dand production. Two explanations can be used tojustify this behaviour. First, since the USA hasestablished a comparative advantage, investmentconditions must be more favourable in that countrythan elsewhere. Second, the fact that US firms areworld leaders in the industry suggest that the knowl-edge stocks they have accumulated exceed, on aver-age, those of their European counterparts.Therefore, it may be expected that multinationalpenetration of the American biotechnology industrywill be greater than that observed in the Europeanindustry.
Implications for Rent Distribution
In this section, an illustration is offered of howacquisition and alliance activity of foreign-basedmultinationals can reduce the concentration of
296 B.F. Lavoie and I.M. Sheldon
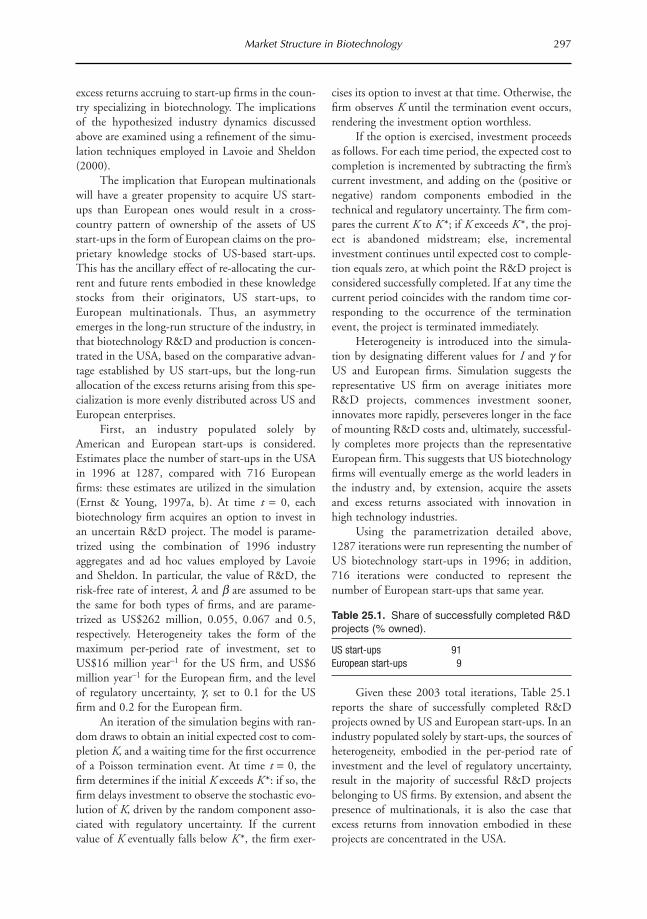
excess returns accruing to start-up firms in the coun-try specializing in biotechnology. The implicationsof the hypothesized industry dynamics discussedabove are examined using a refinement of the simu-lation techniques employed in Lavoie and Sheldon(2000).
The implication that European multinationalswill have a greater propensity to acquire US start-ups than European ones would result in a cross-country pattern of ownership of the assets of USstart-ups in the form of European claims on the pro-prietary knowledge stocks of US-based start-ups.This has the ancillary effect of re-allocating the cur-rent and future rents embodied in these knowledgestocks from their originators, US start-ups, toEuropean multinationals. Thus, an asymmetryemerges in the long-run structure of the industry, inthat biotechnology R&D and production is concen-trated in the USA, based on the comparative advan-tage established by US start-ups, but the long-runallocation of the excess returns arising from this spe-cialization is more evenly distributed across US andEuropean enterprises.
First, an industry populated solely byAmerican and European start-ups is considered.Estimates place the number of start-ups in the USAin 1996 at 1287, compared with 716 Europeanfirms: these estimates are utilized in the simulation(Ernst & Young, 1997a, b). At time t = 0, eachbiotechnology firm acquires an option to invest inan uncertain R&D project. The model is parame-trized using the combination of 1996 industryaggregates and ad hoc values employed by Lavoieand Sheldon. In particular, the value of R&D, therisk-free rate of interest, l and b are assumed to bethe same for both types of firms, and are parame-trized as US$262 million, 0.055, 0.067 and 0.5,respectively. Heterogeneity takes the form of themaximum per-period rate of investment, set toUS$16 million year–1 for the US firm, and US$6million year–1 for the European firm, and the levelof regulatory uncertainty, g, set to 0.1 for the USfirm and 0.2 for the European firm.
An iteration of the simulation begins with ran-dom draws to obtain an initial expected cost to com-pletion K, and a waiting time for the first occurrenceof a Poisson termination event. At time t = 0, thefirm determines if the initial K exceeds K *: if so, thefirm delays investment to observe the stochastic evo-lution of K, driven by the random component asso-ciated with regulatory uncertainty. If the currentvalue of K eventually falls below K *, the firm exer-
cises its option to invest at that time. Otherwise, thefirm observes K until the termination event occurs,rendering the investment option worthless.
If the option is exercised, investment proceedsas follows. For each time period, the expected cost tocompletion is incremented by subtracting the firm’scurrent investment, and adding on the (positive ornegative) random components embodied in thetechnical and regulatory uncertainty. The firm com-pares the current K to K *; if K exceeds K *, the proj-ect is abandoned midstream; else, incrementalinvestment continues until expected cost to comple-tion equals zero, at which point the R&D project isconsidered successfully completed. If at any time thecurrent period coincides with the random time cor-responding to the occurrence of the terminationevent, the project is terminated immediately.
Heterogeneity is introduced into the simula-tion by designating different values for I and g forUS and European firms. Simulation suggests therepresentative US firm on average initiates moreR&D projects, commences investment sooner,innovates more rapidly, perseveres longer in the faceof mounting R&D costs and, ultimately, successful-ly completes more projects than the representativeEuropean firm. This suggests that US biotechnologyfirms will eventually emerge as the world leaders inthe industry and, by extension, acquire the assetsand excess returns associated with innovation inhigh technology industries.
Using the parametrization detailed above,1287 iterations were run representing the number ofUS biotechnology start-ups in 1996; in addition,716 iterations were conducted to represent thenumber of European start-ups that same year.
Table 25.1. Share of successfully completed R&Dprojects (% owned).
US start-ups 91European start-ups 9
Given these 2003 total iterations, Table 25.1reports the share of successfully completed R&Dprojects owned by US and European start-ups. In anindustry populated solely by start-ups, the sources ofheterogeneity, embodied in the per-period rate ofinvestment and the level of regulatory uncertainty,result in the majority of successful R&D projectsbelonging to US firms. By extension, and absent thepresence of multinationals, it is also the case thatexcess returns from innovation embodied in theseprojects are concentrated in the USA.
Market Structure in Biotechnology 297

Multinationals are introduced into the analysisin the form of a random process representing multi-national penetration of the biotechnology industry.This process is intended to be suggestive of theoption management problem underlying the multi-nationals’ entry decision. A function f (t) is definedto characterize the probability at time t that a start-up’s R&D will be acquired by a multinational,where f (t) = 1/[(gF/gD)rt+1], defined on the inter-val [0, 1]. In this equation, gF and gD are the levelsof regulatory uncertainty in the foreign and domes-tic biotechnology industries, and r is a constantscalar set to 0.001. The function f (t) equals one attime t = 0, and converges to zero in the limit as tgoes to infinity. This function is used to characterizethe probability that a multinational acquires theR&D of a start-up. At the commencement of eachiteration, a random draw u is made from the uni-form distribution, on the range [0,1]. For each timeperiod t, u is compared with the contemporaneouslevel of f (t). If u > f (t), then the R&D is acquiredby a multinational; else, the start-up continues toretain ownership. Note that the probability of amultinational acquiring the R&D increases with t,corresponding to the idea that the value of ongoingR&D increases over time, as proprietary knowledgestocks develop and mature.
The ratio (gF/gD) is positively correlated withf (t). In other words, an increase in the level of reg-ulatory uncertainty in the foreign industry, or adecrease in the level of uncertainty in the domesticindustry, increases the probability that a domesticstart-up’s R&D will be acquired by a multinational.This is because, ceteris paribus, a multinationalwould prefer to minimize the risk associated with itsinvestment by operating in a relatively certain regu-latory environment.
If the random process determines that a start-up’s R&D is acquired by a multinational, a secondrandom draw, uu, from the uniform distributiondetermines the geographical origins of the purchas-er. For simplicity, it is assumed that US andEuropean multinationals are equally likely to pur-chase ongoing start-up R&D. Therefore, if uu > 0.5,
the multinational is considered US-based; else, themultinational is considered European-based.
It is assumed that multinationals do not per-form R&D internally, and that the potential formultinational acquisition does not enter the start-upinvestment decision process. Given this characteri-zation of the activity of multinationals, the simula-tions for US and European biotechnology firms arere-run, with the added refinement of the possibilityof multinational acquisition.
The results in Table 25.2 show that introduc-tion of multinationals into the industry has theeffect of transferring control of a portion of the suc-cessful R&D projects to multinationals: approxi-mately 60% of the projects are owned by the start-ups who originated them, while the remaining 40%have been acquired by multinationals. The penetra-tion of multinationals into the market, however, isnot symmetric across countries. In Table 25.3, thelevel of multinational penetration in the US andEuropean industries is reported.
Table 25.3. Level of multinational penetration (%).
US industry 42European industry 26
Penetration of the US biotechnology industryby multinationals is greater than that of theEuropean industry, brought about by the higherlevel of regulatory uncertainty associated with thelatter; in other words, multinationals are more like-ly to acquire the R&D of US-based start-ups thantheir European counterparts. This result is madesharper by examining cross-country ownership ofbiotechnology assets (Table 25.4).
Table 25.4. Cross-country multinational penetration (%).
R&D originated by US start-up, owned by European multinational 19
R&D originated by European start-up, ownedby US multinational 10
These results suggest that concentration in theUSA of assets and returns generated from successfulR&D projects has been diluted compared with thecase of a start-ups-only industry, as control of R&Dshifts from US start-ups to European-based multi-nationals. Thus, despite US comparative advantagein biotechnology, European entities control a sub-stantial portion of the market. Specifically, US firms,
298 B.F. Lavoie and I.M. Sheldon
Table 25.2. Share of successfully completed R&Dprojects (% owned).
USA European
Start-ups 51 9Multinationals 21 19

start-ups and multinationals, control 72% of theR&D, while European firms control the remaining28%. This can be compared with the benchmarkstart-ups-only case, where US firms controlled over90% of R&D. This re-allocation of returns is, iron-ically, the result of one of the very sources of hetero-geneity that established US comparative advantagein the first place.
To sharpen understanding of the effect of reg-ulatory uncertainty on multinationals’ decisions toacquire ongoing start-up research, a comparativestatic analysis is undertaken in the form of increas-ing the level of European regulatory uncertainty to0.5.
Table 25.5. Share of successfully completed R&Dprojects (% owned).
US European
Start-ups 34 15Multinationals 24 27
As shown in Table 25.5, re-running the simu-lations with this change in place has the effect of fur-ther reducing the share of the industry controlled byUS start-ups, from 51 to 34%, and simultaneouslyincreasing the share held by multinationals.Multinational penetration of the US and Europeanindustries is reported in Table 25.6.
Table 25.6. Level of multinational penetration (%)
US industry 60European industry 7
The increase in the level of regulatory uncer-tainty in the European industry has the effect ofincreasing the presence of multinationals in the USmarket from 42 to 60% while, at the same time,reducing penetration of the European market from26 to 7%. This point is corroborated through anexamination of the cross-country ownership ofbiotechnology R&D (Table 25.7).
Table 25.7. Cross-country multinational penetra-tion (% owned).
R&D originated by US start-up, ownedby European multinational 32
R&D originated by European start-up, ownedby US multinational 5
The presence of European-based multination-als grows from 19 to 32%, indicating a significant
transfer of assets and returns from US entities toEuropean ones. Specifically, US firms now controlonly 58% of the global industry, while the Europeanshare has climbed to 42%. As regulatory uncertain-ty increases in Europe relative to the USA, start-upsin the USA become correspondingly more attractiverelative to European start-ups as acquisition targetsfor multinationals. The implication is that as theEuropean Union continues to tighten its regulatoryregime governing biotechnology, this translates intoa higher value of g for the European industry. As theresults above suggest, a higher European g has thedual effect of increasing both multinational penetra-tion of the US industry, and also the number ofalliances and acquisitions effected betweenEuropean multinationals and US-based start-ups.
Implications for Trade Equilibrium andPolicy
The presence of European multinationals in the USbiotechnology industry raises an interesting policyissue. As the regulatory environment in theEuropean Union toughens, the alliance and acquisi-tion activity of European multinationals in the USbiotechnology industry should increase. Thisimplies that even as the European Union restrictsbiotechnology activity within its own sphere ofinfluence, it still enjoys the fruits of biotechnologyin the form of European multinationals’ claims onthe excess returns from innovation embodied in theproprietary knowledge stocks originating fromAmerican start-ups. This suggests the followingquestion: should the US impose policies to protectownership of its biotechnology assets in response toEurope’s tightening of its regulatory restrictions and,if so, what form should these policies take?
Another issue is the long-term trade equilibri-um that will emerge in biotechnology. It might beexpected that, given the favourable R&D condi-tions, firms located in the USA will continue to spe-cialize in biotechnology R&D and production.These firms will be either independent start-ups,start-ups in R&D alliances with multinationals, orstart-ups that are wholly or partially owned bymultinationals. This pattern of specialization sug-gests that in the long run, the USA will be a netexporter of biotechnology products. However, therents commonly associated with high technologyproduction will not be entirely captured by USenterprises: rather, a portion will be appropriated by
Market Structure in Biotechnology 299

foreign-based multinationals, in the form of intra-firm transfers from US subsidiaries or profits sharedwith US partners.
It is interesting to note that in the food andagricultural sector, two trading patterns could arise.In the first, the USA exports ‘intermediate’ biotech-nology products in the form of genetically modified(GM) seeds, which embody the proprietary R&D,and subsequently imports the ‘finished’ product inthe form of food containing GM ingredients derivedfrom the seeds. In this case, the rents from innova-tion accruing to US entrepreneurs are dissipated ontwo levels: first, through capture of rents broughtabout by European multinationals’ penetration ofthe US biotechnology industry and, second,through capture of rents generated in the final con-sumer market in the form of premiums command-ed by differentiated goods, specifically, geneticallyengineered ‘designer’ foods.
In the second case, the USA exports either agri-cultural commodities and/or finished food productsthat embody the proprietary R&D. In this case, therents from innovation accruing to US entrepreneursare dissipated on two levels: first, through capture ofrents brought about by European multinationals’penetration of the US biotechnology industry and,second, through the extent to which Europeanmultinational firms have also acquired the ability todeliver biotechnology via either acquisition oralliance with US seed and food processing firms.
References
Ernst & Young (1997a) Biotech 97: The Eleventh IndustryAnnual Report. Ernst & Young LLP, Palo Alto,
California.
Ernst & Young (1997b) European Biotech 97: a NewEconomy: the Fourth Annual Ernst & Young Report onthe European Biotechnology Industry. Ernst & Young
LLP, Stuttgart, Germany.
Grossman, G.M. and Helpman, E. (1991) Innovation andGrowth in the Global Economy. MIT Press,
Cambridge, Massachusetts.
Krugman, P.R. (1984) Import protection as export pro-
motion: international competition in presence of oli-
gopoly and economies of scale. In: Kierzkowski, H.
(ed.) Monopolistic Competition and InternationalTrade. Oxford University Press, Oxford.
Lavoie, B.F. and Sheldon, I.M. (2000) The source of com-
parative advantage in the biotechnology industry: a
real options approach. Agribusiness – an InternationalJournal 16, 56–67.
Pindyck, R. (1993) Investments of uncertain cost. Journalof Financial Economics 34, 53–76.
Sharp, M. (1996) The science of nations: European multi-
nationals and American biotechnology, STEEPDiscussion Paper No. 28. Science Policy Research
Unit, University of Sussex, Brighton. www.
sussex.ac.uk/spru/docs/steepdps/28/steep28.txt
300 B.F. Lavoie and I.M. Sheldon
Background
Ag-biotech offers important challenges to supplychain management. The success of the affected sup-ply chains in developing solutions will significantlyaffect the pace at which ag-biotech will evolve inmarket economies. Public debate and opinionresearch has made it clear that consumers have pref-erences over numerous aspects or characteristics ofthe technology of origin (Weaver et al., 1992).Because these characteristics are often difficult toquantify, they are uncertain for the consumer, forc-ing choices to be made on the basis of subjectivebeliefs and assessments of reputation of particularagents as well as of aggregates such as industries, sec-tors and science itself. Science has long made it pos-sible to alter the private and quasi-public goodaspects of private goods to change their consump-tion characteristics in response to consumer prefer-ences (Weaver, 1993). In the food chain, science hasa long record of altering what is available for humanconsumption including flavour and cosmetics, butalso shelf-life, reduction in undesirable food bornecontent (e.g. calories or components such as fat orsugar) or desirable characteristics (e.g. non-digestible fibre) (see Weaver et al., 1992; Weaver,1995). These possibilities offer important opportu-nities for industry to redefine technologies andproducts to enhance social welfare. However, theyalso introduce complications into traditional mar-
kets that are organized to procure, process and deliv-er goods derived from homogeneous commodities.
This chapter considers economic performanceof a supply chain that incorporates supply frombiotechnological processes that alter quality charac-teristics of products. The chapter establishes subop-timal performance results occur when either con-sumers or producers differentiate across products bytechnology of origin. Institutional solutions forimproving performance of the supply chain throughgrading, labelling or contracting are considered.Two interests are considered that may differentiateag-biotech products: (i) consumer preferences; and(ii) technology suppliers. In either case, product dif-ferentiation will define opportunities for supplychain management. While biotech can produce pos-itively valued characteristics, the technology itself orcharacteristics it produces may be negatively valuedby consumers. For example, ag-biotech productsmay be viewed as being of lower quality, in fact asbeing polluted or contaminated. The presence ofresidues or contaminants in any one supplier’s mar-ketings may result in consumer rejection of theproduct or discounting of its value. For technologysuppliers, ag-biotech may offer potential for pro-ductivity and quality enhancement. However, whereconsumers hold preferences for the technology oforigin of products, biotech products may not finddemand and willingness to pay at all levels of thesupply chain. This generates an economic externality
301
26 Biotechnology in the Supply Chain:Managing a Product Differentiating
Technology
Robert D. Weaver and Taeho KimPennsylvania State University, University Park, Pennsylvania, USA
© CAB International 2002. Market Development for Genetically Modified Foods(eds V. Santaniello, R.E. Evenson and D. Zilberman)

across all agents in the supply chain and createsincentives for self-regulation that alters supply chainperformance. Supply chain management activelyfeeds back to the supply chain’s performance depend-ing on whether bilateral or multilateral contracts areused and depending on the transparency of thosecontracts. Recent experience in international com-modity markets for genetically modified organism(GMO) or ag-biotech products provides an impor-tant case for analysis of the current state of opportu-nity for improved supply chain management.
This chapter will assess the extent of currentopportunity for enhanced food supply chain per-formance through a spectrum of alternatives forenhanced coordination to establish value for prod-ucts that are differentiated by technology of origin.
Managing Biotechnology in the SupplyChain
Product differentiation through ag-biotechnology
To consider the implications of biotechnology, andto retain a manageable scope for this chapter, wesuppose that the supply chain consists of producersof primary inputs such as crop or livestock productsand processors that transform those primary inputsto produce consumer products.
Suppose the i th producer produces a privategood output yi that has a continuously variable qual-ity characteristic, qi. This characteristic may be givena wide range of interpretations relevant to biotech-nological issues. At one extreme, it could measurethe quantity of a physical characteristic such as anundesirable residue or the presence of geneticallymodified (GM) genes. At an alternative extreme, itcould measure the quantity of a desirable compo-nent (stereo-isomer fats or sugars that are notdigestible and so have no nutritional effects).
A further feature of products that involvesquality is the technology of origin. This might beeither positively or negatively valued by the con-sumer; for example indicating use of growth hor-mones, use of specific types of labour (child, disad-vantaged) or the use of a particular technology forwhich consumers hold specific preferences (e.g. lab-oratory based genetic modification or cell culturepropagation). To allow for this, we suppose the exis-tence of a technology of origin label binary indicator.We further suppose the existence of a sufficient
variety of technologies of origin that allows defini-tion of a scalar continuous indicator interpretable asa quality characteristic that reflects the productiontechnology’s characteristic that is valued in the sup-ply chain or by consumers.
Hereafter, we drop the subscript i for conven-ience when it is not necessary. Primary productionoccurs through application of a vector of variableinputs, x, as well as a vector of quality related inputs,z. These would include inputs that effect changes inthe quality, q. Suppose production involves two sep-arate processes: y (x, z|q, e ) that results in privategood output quantity (y ), and one that results in aprivate good quality, defined by q (x, z|q, e ). Here,we define q as a continuous variable indicating aproducer type and suppose that the productivity ofboth quantity and quality are conditional on thistype; e is defined as a stochastic event.
To allow for consideration of standards, wesuppose the producer does not face a perfectly elas-tic demand curve allowing sale of all production at aconstant price. Instead, we allow for some produc-tion to be excluded from the market or dumped. Wedefine a dumping function as D(x, z, q | e) (Chong,1996; Carpentier and Weaver, 1997). Dumping isconditional on a quality standard, q, defined eitherby regulators or implicitly defined by processor orconsumer demand as a minimum quality attributethat must be achieved as a condition of marketing.The disposal of product is not necessarily free (i.e.the technology may exhibit weak disposability in y),however, to proceed we assume it to be so.Generalization is straightforward. We suppose thisfunction satisfies D(x, z, q = 0|e) = 0, D(x = 0, z, q|e) = 0, ∂D / ∂ q > 0, ∂D / ∂z £ 0, ∂ 2D / ∂ q ∂z < 0,∂ 2 D / ∂z 2 < 0. Based on this notation, it is clearthat the technology can result in product differenti-ation by q. Whether this occurs depends on proces-sor or consumer valuation of q.
We suppose producers attempt to maximizeprofits based on a market price, P, as well as a possi-ble incentive or differential for quality, l. We definethe most general form of profits earned from pro-duction activities as:
p = P y~ + l q – C (q (x, z | q, e), y (x, z |q, e), D(x, z, q | e))
where
y~ = y (x, z |q, e) (1 – D(x, z, q | e))
Together, the market price and the qualityincentive define a producer differentiated ‘settle-
302 R.D. Weaver and T. Kim
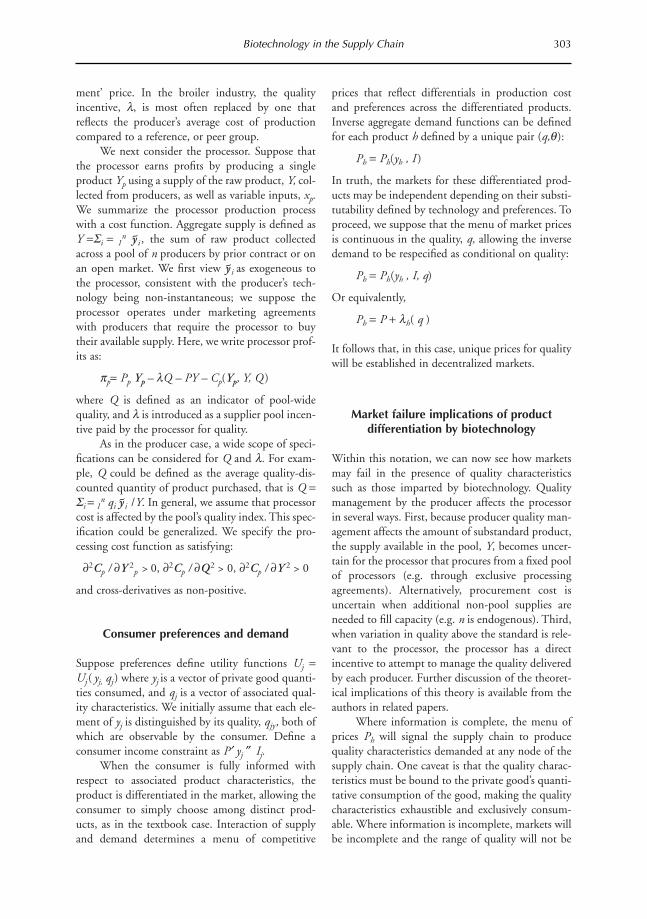
ment’ price. In the broiler industry, the qualityincentive, l, is most often replaced by one thatreflects the producer’s average cost of productioncompared to a reference, or peer group.
We next consider the processor. Suppose thatthe processor earns profits by producing a singleproduct Yp using a supply of the raw product, Y, col-lected from producers, as well as variable inputs, xp.We summarize the processor production processwith a cost function. Aggregate supply is defined asY =Si = 1
n y~i , the sum of raw product collectedacross a pool of n producers by prior contract or onan open market. We first view y~i as exogeneous tothe processor, consistent with the producer’s tech-nology being non-instantaneous; we suppose theprocessor operates under marketing agreementswith producers that require the processor to buytheir available supply. Here, we write processor prof-its as:
pp= Pp Yp – lQ – PY – Cp(Yp, Y, Q )
where Q is defined as an indicator of pool-widequality, and l is introduced as a supplier pool incen-tive paid by the processor for quality.
As in the producer case, a wide scope of speci-fications can be considered for Q and l. For exam-ple, Q could be defined as the average quality-dis-counted quantity of product purchased, that is Q =Si = 1
n qi y~i /Y. In general, we assume that processorcost is affected by the pool’s quality index. This spec-ification could be generalized. We specify the pro-cessing cost function as satisfying:
∂2Cp / ∂Y 2p > 0, ∂2Cp / ∂Q2 > 0, ∂2Cp / ∂Y 2 > 0
and cross-derivatives as non-positive.
Consumer preferences and demand
Suppose preferences define utility functions Uj =Uj ( yj, qj ) where yj is a vector of private good quanti-ties consumed, and qj is a vector of associated qual-ity characteristics. We initially assume that each ele-ment of yj is distinguished by its quality, qjy, both ofwhich are observable by the consumer. Define aconsumer income constraint as P¢ yj ≤ Ij.
When the consumer is fully informed withrespect to associated product characteristics, theproduct is differentiated in the market, allowing theconsumer to simply choose among distinct prod-ucts, as in the textbook case. Interaction of supplyand demand determines a menu of competitive
prices that reflect differentials in production costand preferences across the differentiated products.Inverse aggregate demand functions can be definedfor each product h defined by a unique pair (q,q ):
Ph = Ph(yh , I )
In truth, the markets for these differentiated prod-ucts may be independent depending on their substi-tutability defined by technology and preferences. Toproceed, we suppose that the menu of market pricesis continuous in the quality, q, allowing the inversedemand to be respecified as conditional on quality:
Ph = Ph(yh , I, q)
Or equivalently,
Ph = P + lh( q )
It follows that, in this case, unique prices for qualitywill be established in decentralized markets.
Market failure implications of productdifferentiation by biotechnology
Within this notation, we can now see how marketsmay fail in the presence of quality characteristicssuch as those imparted by biotechnology. Qualitymanagement by the producer affects the processorin several ways. First, because producer quality man-agement affects the amount of substandard product,the supply available in the pool, Y, becomes uncer-tain for the processor that procures from a fixed poolof processors (e.g. through exclusive processingagreements). Alternatively, procurement cost isuncertain when additional non-pool supplies areneeded to fill capacity (e.g. n is endogenous). Third,when variation in quality above the standard is rele-vant to the processor, the processor has a directincentive to attempt to manage the quality deliveredby each producer. Further discussion of the theoret-ical implications of this theory is available from theauthors in related papers.
Where information is complete, the menu ofprices Ph will signal the supply chain to producequality characteristics demanded at any node of thesupply chain. One caveat is that the quality charac-teristics must be bound to the private good’s quanti-tative consumption of the good, making the qualitycharacteristics exhaustible and exclusively consum-able. Where information is incomplete, markets willbe incomplete and the range of quality will not be
Biotechnology in the Supply Chain 303

priced. Suppose some markets are simply non-exis-tent. For example, consider the case of a biotech-related quality characteristic q for which consumershold preferences. In the absence of a market, it isclear the supply chain will achieve neither optimalprofits for the supply chain nor quality supply thatoptimizes social welfare. This situation would clear-ly arrive when quality, q, is not observable. In thiscase, no market could exist for the quality character-istic, and it would not be priced by competitivemarkets.
In either case, product differentiation willdefine opportunities for supply chain management.For consumers, ag-biotech products may be viewedas being of lower quality, in fact as being polluted orcontaminated, or as adding a margin of positivevalue due to changes in their characteristics.
Labelling
Within this context, the potential role of labellingmust be addressed. From the perspective of theabove notation, it is clear that where the search andinformation costs for identification of quality char-acteristics are high, labelling will generate improvedsupply chain performance by establishing a basis forproduct differentiation and market pricing of prod-uct characteristics. Further, labelling in itself pro-vides an important basis for reduction of search andinformation costs when labelling is backed up withproduct performance liability or warranties. Even inthe case where consumers hold preferences that mayhave no merit based on the product’s direct con-sumption performance – as has arisen with respectto technology characteristics – labelling may besupportable on the basis of private economics. Thatis, the supply will emerge to satisfy demand at aprice that covers average costs. Mandating oflabelling is an issue that goes beyond the scope ofthis chapter; however, where products are qualitydifferentiated and the search and information costsare high, private economics would be expected togenerate demand for labelling that could finance itssupply. Products that are not labelled would beshunned by consumers valuing quality characteris-tics that could be found labelled elsewhere in themarket.
A role for standards?
The possibility that standards could be imposed inproduct markets affected by biotech supply isimportant to consider given expressions of con-sumer preferences and concerns already on record.The economics of the use of standards followsdirectly the arguments concerning standards foundin the environmental economics and ag marketingliterature (see, e.g. Halloway, 1998). In the lattercase, grades and standards have been argued to facil-itate the liquidity of markets in products with a highdegree of quality variation.
More recently, while admitting this role ofgrades and standards, Weaver and Kim (1999)demonstrated that grades and standards leave inplace substantial incentives for supply chain man-agement of quality. While grades or standards defineone limit of the range of possible quality, they donot resolve the level of quality. Where quality is val-ued, both producers and processors are left withincentives to find better means of managing qualitydemanded by consumers. One solution for thesupply chain is to vertically integrate.
Contracting as a Solution
To consider alternatives for supply chain coordina-tion when products are differentiated by qualityrelated to biotechnology, we evaluate the profitsattainable by producers, processors and for the sup-ply chain in aggregate under a series of scenarios inwhich the above theoretical model is parametrized(details available from the author). Consideration ofgrades and standards is nearly trivial within thisnotation and is highlighted only in passing. Instead,focus is placed on use of contracts between produc-ers and processors.
To do so, we use standard neoclassical shapesfor the underlying functions and ensure that theSpence–Mirlees conditions are satisfied. In eachcase, we use computational methods to numericallysolve the optimization problem given different levelsof the quality incentive. For the contract designcases, we numerically solve for the optimal incentivewhen producers are considered homogeneous andfor the nonlinear menu of incentives when produc-ers are heterogeneous. Results are reported graphi-cally in Fig. 26.1 and discussed below.
304 R.D. Weaver and T. Kim
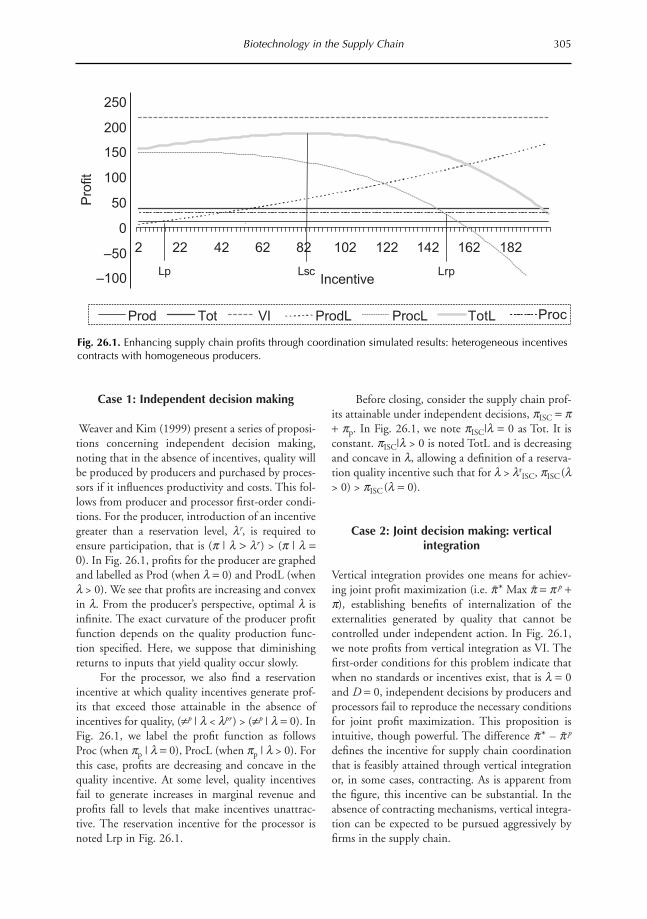
Case 1: Independent decision making
Weaver and Kim (1999) present a series of proposi-tions concerning independent decision making,noting that in the absence of incentives, quality willbe produced by producers and purchased by proces-sors if it influences productivity and costs. This fol-lows from producer and processor first-order condi-tions. For the producer, introduction of an incentivegreater than a reservation level, lr, is required toensure participation, that is (p | l > lr ) > (p | l =0). In Fig. 26.1, profits for the producer are graphedand labelled as Prod (when l = 0) and ProdL (whenl > 0). We see that profits are increasing and convexin l. From the producer’s perspective, optimal l isinfinite. The exact curvature of the producer profitfunction depends on the quality production func-tion specified. Here, we suppose that diminishingreturns to inputs that yield quality occur slowly.
For the processor, we also find a reservationincentive at which quality incentives generate prof-its that exceed those attainable in the absence ofincentives for quality, (πp | l < lpr ) > (πp | l = 0). InFig. 26.1, we label the profit function as followsProc (when pp | l = 0), ProcL (when pp | l > 0). Forthis case, profits are decreasing and concave in thequality incentive. At some level, quality incentivesfail to generate increases in marginal revenue andprofits fall to levels that make incentives unattrac-tive. The reservation incentive for the processor isnoted Lrp in Fig. 26.1.
Before closing, consider the supply chain prof-its attainable under independent decisions, pISC = p+ pp. In Fig. 26.1, we note pISC|l = 0 as Tot. It isconstant. pISC|l > 0 is noted TotL and is decreasingand concave in l, allowing a definition of a reserva-tion quality incentive such that for l > lr
ISC, pISC(l> 0) > pISC(l = 0).
Case 2: Joint decision making: verticalintegration
Vertical integration provides one means for achiev-ing joint profit maximization (i.e. p* Max p = p p +p), establishing benefits of internalization of theexternalities generated by quality that cannot becontrolled under independent action. In Fig. 26.1,we note profits from vertical integration as VI. Thefirst-order conditions for this problem indicate thatwhen no standards or incentives exist, that is l = 0and D = 0, independent decisions by producers andprocessors fail to reproduce the necessary conditionsfor joint profit maximization. This proposition isintuitive, though powerful. The difference p* – p p
defines the incentive for supply chain coordinationthat is feasibly attained through vertical integrationor, in some cases, contracting. As is apparent fromthe figure, this incentive can be substantial. In theabsence of contracting mechanisms, vertical integra-tion can be expected to be pursued aggressively byfirms in the supply chain.
Biotechnology in the Supply Chain 305
–100
–50
0
50
100
150
200
250
2 22 42 62 82 102 122 142 162 182
Incentive
Pro
fit
Prod Tot VI ProdL ProcL TotL Proc
Lp LrpLsc
Fig. 26.1. Enhancing supply chain profits through coordination simulated results: heterogeneous incentivescontracts with homogeneous producers.

In Fig. 26.1, we can now analyse the incentivesfor contracting or vertical integration. We see thatsupply chain profits attainable under vertical inte-gration p* (VI) cannot be attained by independentunits. In the absence of incentive, the supply chainwill generate pISC(l = 0) (Tot), leaving in place anincentive for vertical integration VI*= p* (VI) –pISC(l = 0). Even when incentives are introduced,pISC(l > 0) (TotL) may approach p* (VI), althoughit will not attain that level of profits. We define theincentive for vertical integration when the alterna-tive is use of incentives as VIL* = p* (VI) – pISC
(l > 0). Importantly, Fig. 26.1 clarifies that, evenwhen contract-based incentives are introduced, anincentive for vertical integration remains in place,though our results indicate that in general VIL* <VI*.
Implications of incentives for quality
A standard result in externality management litera-ture is that there exists an incentive that can induceindependent agents to replicate the joint profit max-imum. We find the same type of result here. Thishighlights that while such an incentive, say lg,exists, lg will not typically maximize social welfarein our supply chain case since its determinationwould have ignored consumer interest in the level ofquality. This result echoes a similar result associatedwith externality taxes or subsidies. A further prob-lem with such incentives is that their uniformityrenders them inefficient; for example paying a rentto producers who would produce quality even in theabsence of incentives or given smaller incentives.
The idea of a contract for performance
From the specification above, we see that a naturalincentive exists for producers and processors tocommunicate their interests and coordinate themacross the supply chain. In a market setting, in theabsence of grades and standards, where quality isobservable at low cost, products will be differentiat-ed by quality and quality will be priced creating anincentive to better manage quality. Where quality isunobservable at reasonable cost, further incentivesexist for the processor to determine the quality levelfrom the producer. In each case, these opportunitiescan be exploited through contracting. The potentialfor contracting is next illustrated by examples. To
design a contract that is feasible, it must offerincreased profits to both the agency and the agents.Incentives under the contract must induce theagents to participate. Intuitively, this will requirethat under the contract incentives, the agent earns asmuch profit as might be available in the absence ofthe contract incentives. We define the reservationprofit for producers as p r
i = pi (l = 0), and forprocessors as, p r
p = pp(l = 0).
Processor as agency under full information(symmetry): heterogeneous incentives
contracts across homogeneous producers
The contract design problem can be written as:
l, Yp Max pp = PYp – lQ – PY –Cp(Yp , Y, Q )
subject to p c > p r, where p c = Max p = P (1 – D )y+ l q – C (q , y ).
Not surprisingly, given that the quality incen-tive is selected to maximize processor profits, it willnot typically maximize social welfare. To considerthe results from this case, first note that from theprocessor perspective, the optimal incentive in theabsence of contracting would be l = lp* that solves:Max pp = PYp – lQ – PY – Cp(Yp , Y, Q ). In Fig.26.1, this is close to zero though in general it mightbe any positive number depending on the curvatureof ProcL. The difference p p(l > 0) – p p(l = 0) =ProcL – Proc defines a strong incentive for the proces-sor to contract, if vertical integration is not feasible.
As an agency, the processor is not free to set l= lp*. Instead, in the absence of market power overthe producers, the agency must set l = lp
c such thatp c > p r. That is, such that profits for the producerunder the contract’s l exceed or equal the producer’sreservation profits. Based on this constraint, wedefine the reservation quality incentive for the pro-ducer lr (noted as Lp in Fig 26.1.) where lr solvesp (lr ) = pr (l = 0). Similarly, we define the reserva-tion incentive for the processor, lpr (noted Lrp inFig. 26.1), as the solution of p p (lpr ) = p p (l = 0).Given the parametrization illustrated in Fig. 26.1,the optimal contract incentive when the processor isthe agency will be: lc
p (Lp) = lr. This results in pro-ducer profits equal to those attainable withoutincentives and processor profits of about 150, seeTable 26.1.
To consider incentives for contracting for qual-ity in the supply chain, consider first the case where
306 R.D. Weaver and T. Kim

no incentive exists. In Fig. 26.1, p (l = 0) = Prod <p (l > lr ) = ProdL; pp (l = 0) = Proc < pp (l < lpr )= ProcL; and pISC (l = 0) = Tot < psc(lr < l < lpr )= TotL < p* = VI. Thus, a strong incentive for con-tracting by both producers and processors will nor-mally exist depending on the technologies faced. Tooptimize supply chain profits (TOTL), l* = LSC.
Producer agency: homogeneous producers
The importance of bargaining power can beexplored within this framework. Suppose the agentsform a pool of size n and establish agency over theprocessor. In this case, the contract design problemunder full information would be:
Choose l, q, y to solve p pool = Max S p i =S[P (1 – Di )yi + li qi – C (qi , yi )].
To simplify for this exposition, we suppose all pro-ducers are identical allowing summations to bereplaced by a scalar n. To emphasize the condition-ality of contracting incentives on the particularparametrization of the problem, note we couldparametrize the problem such that no incentivesexist for producer pool agency. Instead, we explorethe case where incentives exist. In this case, the con-dition for the contract to be of interest to both theproducer pool and the processor must be designedto maximize p pool subject to:
p pool(lpool) > np (l = 0) and p p > p rp
Expressed in terms of reservation quality incentives,this amounts to lpool > lr and lpool = < lr
p , or interms of Fig. 26.1, Lr < Lpool < Lrp.
Given the technologies assumed in the simula-tion behind Fig. 26.1 we find the optimal contractincentive lpool = lr
p. At this incentive level, theprocessor reservation profit is met, rendering profitjust equal to that available in the absence of con-tracting. For supply chain profits, psc
pool = p pool
(lrp ) + pp (lr
p ).
Processor as agency: heterogeneousincentives contracts across heterogeneous
producers
In this case, the optimization problem is the same asthat in case where the processor has agency and usesheterogeneous incentives contracts across homoge-neous producers. However, in this case, producersare not homogeneous. It follows that the processorfinds the optimal contract specifications to varyacross producers’ varying reservation profit levels.That is, each producer has the same profit (see Fig.26.2) although each is presented with differentincentives. Figure 26.3 presents the schedule of opti-mal incentive for each producer type. When pro-ducers hold agency, incentives do not vary with type(flat line). When processors hold agency, incentivesare decreasing with type. Further, incentives are iden-tical under information asymmetry and symmetry
Biotechnology in the Supply Chain 307
Table 26.1. Summary of profit outcomes.
Result
Case Agency Agent [l*] [p producer] [pp processor] pC = (pA + pB)
1 Processor Producer 10.238 10.178 149.976 160.1542 Producer Processor 151.063 114.531 26.285 140.8163 Processor Producer pool 10.238 10.178 149.928a 160.106
(homogeneous)4 Processor Producer pool 28.3662 1946.5048b 149.9882
(heterogeneous)5 Producer pool Processor 396.683 481.820b 26.285 508.105
(homogeneous)6 Producer pool Processor 69.9599 4779.7718b 139.9163
(heterogeneous)7 Independent 0.000 10.178 26.285 36.4638 Independent (sum) 84.000 57.386 129.080 184.4679 Vertical integration 0.0000 n/a n/a 216.643
a Increased processing volume generates increased profits.b Summation of all producers’ profit.n/a, not available.

308 R.D. Weaver and T. Kim
Fig. 26.2. Producer agency: homogeneous producers pool or heterogeneous producers.
0
20
40
60
80
100
120
140
160
180
200
2 102 202 302 402Lambda
Pro
fit
ProcL Proc Prod Tot ProdL
Fig. 26.3. Incentives vs. type.
0.0
20.0
40.0
60.0
80.0
100.0
120.0
140.0
160.0
0.36 0.56 0.78 0.98 1.18 1.38 1.58 1.78 1.98
Type
Ince
ntive
(L
am
bd
a)
Processor agency under full info. Producer agency under full info.
Processor agency info. asym

(Fig. 26.4). In these results, we assume bilateral con-tracting between each producer and the processor.Processor profits under processor agency under bothfull and asymmetric information are slightly increas-ing with producer type (Fig. 26.5). Under produceragency, processor profits are constant. These resultsmean that if the processor can work with producerswith high quality ability, greater profit can beearned.
Producer pool as agency: heterogeneousincentives contracts across heterogeneous
producers
In this case, it is intuitive that the processor’s profitand the optimal incentive be fixed to the processor’sreservation profit and the associated incentive. Eachproducer attains different profit depending on type(see Fig. 26.6). Producer profits are shown to beincreasing in producer type.
Biotechnology in the Supply Chain 309
Fig. 26.4. Processor’s profits.
–10.0
10.0
30.0
50.0
70.0
90.0
110.0
130.0
150.0
0.36 0.56 0.78 0.98 1.18 1.38 1.58 1.78 1.98
Type
Pro
fit
Processor agency under full info. Producer agency under full info.
Processor agency under info. asym
Fig. 26.5. Processor’s profits under processor agency.
148.8
149.0
149.2
149.4
149.6
149.8
150.0
150.2
0.36 0.56 0.78 0.98 1.18 1.38 1.58 1.78 1.98
Type
Pro
fit
Full info. Info. asym

Processor as agency: homogeneous incentivecontracts across heterogeneous producers
Here, the processor has only one contract to beenforced for all types of producers. Since producer’sprofit is increasing in producer type, an incentivethat guarantees the reservation profit for the lowest
type of producer becomes the optimal incentive andeach producer attains different profit levels based onthis optimal incentive. In contrast to the heteroge-neous incentives contract case, Fig. 26.7 showsresults for a homogeneous incentive offered acrossheterogeneous producers. Producer’s profit is alsoincreasing in producer type.
310 R.D. Weaver and T. Kim
Fig. 26.6. Producer’s profits.
0.0
50.0
100.0
150.0
200.0
250.0
300.0
350.0
0.36 0.56 0.78 0.98 1.18 1.38 1.58 1.78 1.98
Type
Pro
fit
Processor agency under full info. Producer agency under full info.
Processor agency under info. asym
Fig. 26.7. Producer’s profits in homo lambda.
0.0
20.0
40.0
60.0
80.0
100.0
120.0
0.36 0.56 0.78 0.98 1.18 1.38 1.58 1.78 1.98
Type
Pro
fit
Processor agency under full info. Producer agency under full info.
Processor agency under info. asym.

Producer pool as agency: homogeneousincentive contracts across heterogeneous
producers
In this case, the objective function for the agency isthe summation of profits for producers and the con-straint is that the processor profit is at least equal tothe reservation profit. Figure 26.8 shows the curva-ture of the summation of producers’ profits andprocessor’s profit against incentive, the sum of prof-its of all producers increase until around 70 anddecrease after 70. We see the result that when theprice (incentive) is relatively small, the sum of pro-ducer profits increases as the incentive increases.When price is relatively high, the sum decreases (seeFig. 26.8). This result is intuitive from the perspec-tive of demand–supply theory. Suppose that theincentive (price) for a specific level of qualityincreases. Producers will make an effort to increasetheir quality in order to get more profit. However,processors can try to reduce the higher quality inorder to reduce the cost burden. If the price-qualityelasticity of demand (processor) is greater than thatof supply, then the profits of high type producerswill be decreased as incentives increase. Therefore,the optimal incentive is determined at around 70,processor’s profit is the profit around 70, and pro-ducer’s profit is increasing in type.
Processor as agency: information asymmetrycase
Under the information asymmetry case, the produc-er agency case has the same results as under the fullinformation case because agency has full informa-tion. So, only the processor agency case is consid-ered. The model is as follows:
Max l,xp EpP =
¥ g (q)dq
subject to
p*i (l) = Py (xi*,zi*) + liq (xi*,zi* | qi,e) –C (xi*, zi* | e) ≥ RA, "i,Py (xi, zi ) + liq (xi, zi | qi , e ) – C (xi, zi | e) ≥Py (xi, zi ) + liq (xi, zi | qj , e ) – C (xi, zi | e),"i , j ≠ i
The second constraint guarantees that incentives areconsistent with truth telling by the agents. That is,when each producer reveals its type truly it will havemaximal profit. The objective function is the expec-tation of processor profit function taken over pro-ducer type.
As seen in Fig. 26.3, the optimal incentives arethe same as under the full information case becausethe optimal incentive is determined in the con-straints of producers’ profit under both cases.However, the profits in both cases are different (Fig.26.5). The slope of profits under the full informa-
Biotechnology in the Supply Chain 311
Fig. 26.8. Total profits for processor and producers.
P Y Q PY C Y Y Qp p p p– ( ) – – ( , , ( ))l q q[ ]ÚQ
0
500
1000
1500
2000
1 17 33 49 65 81 97 113 129 145
Lambda
Pro
fit
Processor’s profit Sum of producers’ profitTotal profit of processor and producers

tion case is greater than that under the informationasymmetry case because the latter is an expectedvalue. We can regard the difference in profitsbetween full information and asymmetry as the pre-mium for full information. For the truth telling con-straints, if a producer tells its type higher than itstrue type it will have less incentive than the incen-tive that guarantees its reservation profit. Therefore,a producer will not have an incentive to report atype value that exceeds its true type. Similarly, if aproducer reports a type value that is smaller than itstrue type, profit will be increased above its reserva-tion profit; however, since the processor can exam-ine the quality of its product as a signal of type,enforcement by the processor will preclude this pos-sibility. We proceed with the assumption that pro-ducers do not report type values smaller than thetrue value.
Conclusions
In conclusion, it is of interest to assess the reasonswhy opportunities for supply chain management ofbiotechnology are not fully exploited. What can begained by contracting? In brief, we find that incen-tives for vertical integration are strong and offer sup-ply chain profits that may substantially exceed thoseavailable from independent decisions in the absenceof incentives for quality. Depending on the specificparametrization of the problem, strong incentivesmay exist for both producers and processors to con-tract. Whether processor or producer pools contractdepends on the parametrization of the problem. Weestablish that whether supply chain contracting willmaximize social welfare depends on its ability toreplicate the vertical integration solution. Thisdepends on whether pISC Æ pVI for some l.
Grades and standards as mechanisms for man-aging quality are inherently slow and clumsy. Worse,they fail to provide incentives for private sector ledinnovation to enhance quality in new directions.Within this context, grades and standards can leavein place strong incentives for firms along the supplychain to vertically integrate, as a strategy for assuringquality is supplied as needed.
While labelling is supportable on the privateeconomics of consumer willingness to pay for relat-ed costs to find differentiated products, labellingmay not be suitable for biotechnology-related qual-ity characteristics. First, it may be difficult, if not
impossible, to define labels that express characteris-tics of interest to consumers which at the same timeare defensible. Second, quality characteristics maybe too costly to quantify in markets where unla-belled products also exist.
This chapter demonstrates the potential bene-fits of several supply chain management strategiesthat use contracting to manage quality productivityof the supply chain. The framework presented hasbroad applicability for assessing opportunities formanaging price, quantity and quality uncertainty insupply chains. Within the applied setting of manag-ing the dairy supply chain’s production of antibioticresidues, the implications of contracting solutionsare illustrated. The benefits of improved qualitymanagement noted include expansion of industrialdemand for commodities as well enhancing and sta-bilizing prices and farm producer/supplier incomesin the long term.
References
Carpentier, A. and Weaver, R.D. (1997) Damage control
productivity: why econometrics matters. AmericanJournal of Agricultural Economics 79, 47–61.
Chong, P.S. (1996) Modeling total quality management
economics. Total Quality Management 7(4),
433–440.
Halloway, G.H. (1998) Contractual arrangements at the
farm gate. In: Royer, J.S. and Rogers, R.T. (eds) TheIndustrialization of Agriculture: Vertical Coordinationin the U.S. Food System. Ashgate Publishing,
Aldershot, pp. 115–132.
Kim, K.C. and Weaver, R.D. (1995) Biodiversity andLandscapes. Cambridge University Press, Cambridge.
Weaver, R.D. (1993) U.S. Agricultural Research: StrategicChallenges and Options. Agricultural Research
Institute, Bethesda, Maryland.
Weaver, R.D. (1995) Mitigation, product substitution,
and consumer valuation of undesirable foodborne
effects. In: Caswell, J. (ed.) Valuing Food Safety andNutrition. Westview Press, Boulder, Colorado, pp.
51–68.
Weaver, R.D. and Kim, T. (1999) Supply chain contract-
ing for quality: TQM based mechanisms. Working
paper presented at The Economics of Quality Controlin Agriculture, The University of Saskatchewan,
Saskatoon, Canada, 2–4 December 1999.
Weaver, R.D., Evans, J. and Luloff, A.E. (1992) Pesticide
use in tomato production: consumer concerns and
willingness-to-pay. Agribusiness 8(2), 131–142.
312 R.D. Weaver and T. Kim

Activism against GMF 179, 182Adoption of GM technology by farmers 118–119,
131–136, 161, 227–228Agricultural Risk Management Study (USDA)
143factors influencing adoption 95–98, 127,
137–138, 148–150, 152–157, 171, 172probit analysis 93, 95–98risks 162–163Tobit model 145–147
Affect in consumers 44–45Agriceutical companies 279–283Allergenicity 77, 78, 79, 209, 210–211, 213, 237,
239Alliances, strategic 283–289, 296Animals (GM) 43Antibiotics, resistance to 213, 237APHIS (Animal and Plant Health Inspection
Service, USDA) 230–233Asset specificity 284Assets, value 281–282, 294Associations of producers see Producer associations
Bacillus thuringiensis maize see Maize, Bt maizeBacteria (GM) 68, 77, 79, 229–230, 234Bargaining power 307Bayer 288Behavioural intentions 40, 44–45Belgium 40–46Benefits of GM crops 7–8, 44, 70–71, 76–79,
173–174, 183 n8, 222–224, 239–241,274–276
Biotechnologycontribution to food safety 210–211current status 67–68, 192economic effects 173–175newspaper coverage 221in product development 66, 70–71
Biotechnology companies 283–289Bos indicus 107–108Bos taurus 107–108Bovine growth hormone see Bovine somatotropin,
recombinant (bST)Bovine somatotropin, recombinant (bST)
adoption by farmers 92–98, 103–108benefits to consumers 109controversy 101, 102–103and feed management practice 92–98hazard assessment 102–103impact on milk prices and production 81,
86–88, 92, 103–109impact on profits 81, 85–90, 92, 104–109moratoria in Europe and Canada 102–103,
109probit analysis of adoption 93, 95–98use in underdeveloped countries 107–109use in USA 84–91, 93–98, 103–107user profiles 84–85, 95–98
Bovine spongiform encephalopathy (BSE) 193, 206Branded vs. generic products 43–46, 52bST see Bovine somatotropin, recombinant
(bST)Bt maize see Maize, Bt maizeBuffalo 108Butterflies, monarch butterfly 198–199
313
Index
The following short forms are used in the index: GM, genetically modified or genetic modification; GMF,genetically modified food; GMO, genetically modified organism.Page references in italics refer to tables or illustrations, while references to notes are in the form 183 n8,where 183 indicates the page number, and n8 the number of the relevant note.

Canada 39, 102–103, 109, 113–114, 192Canola 13–18, 20, 21, 113–124Cartagena Protocol on Biosafety 258Cattle
feed management 92–98response to bovine somatotropin 87–88
Cereals (GM) 76, 77Certainty, lack of see UncertaintyChemical companies 279–283Codex Alimentarius 248, 258Common Agricultural Policy (EU) 163Competitiveness 66, 159, 163–165, 174, 175,
176, 269Complementary assets model 285–286, 289Compliance testing 197–198, 256, 266–267, 268Computers in dairy farming 93, 95Consolidation 285–287Consumer surplus 22–23, 109, 198Consumer surveys see Surveys, consumersConsumers
attitudes to GMF 42–46, 57–58, 71–72,192, 246–247, 301–302
acceptance 2, 16, 17, 22–23Belgium 40–46Canada 39Europe 39, 49–53, 71–72Ireland 25–37Japan 39opposition 7–8, 39, 49–51, 159, 255USA 25–37, 39, 56–60
concerns about food safety 193, 205–206concerns about GM technology 42–43,
57–58, 69–70, 71–72, 101, 272identification of needs 64, 66, 69–70knowledge about GMF 25, 28, 29, 31–33,
36, 44, 50, 72preferences 303purchase of GMF 30, 34–37, 40, 44–46,
51–52trust in authorities 44, 50, 185, 193,
201–202, 246, 247willingness to pay 51–52, 55–60, 269
Contamination of food 205–206, 209–210Content analysis 207–209, 220–222Contract design 306–307Contracting 304–312Contracts 162, 163, 174–175Controversy about GMOs 130, 179, 191Convenience 70Convention on Biological Diversity 185 n11Coordinated Framework (US) 185, 230Corn see Maize (GM and conventional)
Cost-effectiveness 161Cotton (GM) 261Cows see CattleCreutzfeldt-Jakob disease see Bovine spongiform
encephalopathy (BSE)Crops (GM) 67, 70
creation of new varieties 116, 117, 192first generation 9, 160–161second generation 8, 52, 161–162see also Adoption of GM technology by
farmersCross-pollination 232–233
Dairy farming 81–90, 91–98, 101–109Dairy products (GM) 79Decisions 293–296, 305–306Demand, endogenous 272–277Dietary buffers (cattle) 92–93, 98Differentiation of products 302–303Dumping 302Dynamic capabilities model 286–287, 289
Econometrics 10–18, 82–83, 114, 118–120,272–277
Elasticity of supply and demand 11–12, 15, 23,109, 162, 269, 302, 311
ELISA (enzyme-linked immunosorbent assay)256, 266–267
Endogenous demand 272–277Entry decisions 293–296Environment see Risks, environmentalEPA (US Environmental Protection Agency)
191–192, 199–200, 214, 233–236Eurobarometer 44Europe 39, 49–53, 71–72, 163, 185
entry into US biotechnology 291–300strategic alliances 283–289
European corn borer 137–138, 142European Union 109, 176, 179, 186–187,
192–193, 250moratorium on GM products 102–103, 271
Exemption from regulation 234Exports, segregation of approved varieties 266
Factor analysis 169–172Failure, market 303–304Farmers
adoption of GM technology see adoption ofGM technology by farmers
314 Index

demographics 128–134, 144–145problems 169, 171, 172, 174–175
Farmingcosts 14–15, 59–60, 104–105, 160–161dairy 81–90, 91–98, 101–109farm size 164
FDA (US Food and Drug Administration) 214,236–239, 271–272
Feed buffers (cattle) 92–93, 98Feed management in dairy farming 92–98Field trials 178, 231–232Finland 163–165Food safety 205–214, 222–224, 236–239
see also Consumers, concerns about foodsafety; Risks
Food Standards Agency (UK) 197–198Frame theory 219–220Friends of the Earth 181Functional foods 8, 52–53, 66–68, 168, 283
Genetic manipulation technology see BiotechnologyGenomics 67Glyphosate 235, 236
tolerance in plants see Roundup Ready; Soya(GM)
GM content testing see Compliance testingGrain handlers, implications of crop segregation
262–264Greenpeace 179Growth hormone, bovine see Bovine somatotropin,
recombinant (bST)
Healthconsumer concerns 42–43, 51, 57–58, 69effects of GMOs 8, 195–197recombinant bovine somatotropin 102–103
Herbicides, resistance to 14-15, 76, 127, 137,142, 161, 231, 236
Heuristics 218, 296Hicks neutral effect 14, 17House of Quality (HoQ) 65, 66Hybrid maize 142–143
‘Ice minus’ bacterium 229Identity preserved production and marketing
(IPPM) 9, 161–162, 256–257costs 11, 15, 17–18, 59–60, 257
Incentives 115–116, 306 Industry, attitudes to GM technology 172–173
Informationin decision making 181–183distortion and manipulation 180incomplete scientific information 191–192,
195–199, 202provision 181–184, 214, 219–220public vs. private information 180, 183–184risk communication 194, 219–224verified and non-verifiable information
182–184Information asymmetry 311–312Information bias 164Innovations 168–169, 173–175, 284–285Insects, resistance of 200Intellectual property rights 113–116Internal rate of return (IRR) 114, 116, 122–123Internet 181Investment for research 113–116, 292–295, 297IPPM see Identity preserved production and
marketingIreland 25–37Italy 167–178
Japan 39, 251, 269Journal of Food Protection 208, 209–211
Knowledge stocks 285, 292, 295–296KWIC (key word in context) analysis 222
Labels for products 9, 25, 72, 186, 237, 263, 304implications for trade 257–258industry initiatives 252–257mandatory 29, 30, 34, 37, 58, 186–187,
191, 197, 202, 248national legislation 248–252reading by consumers 28, 33, 36
Lactic acid bacteria (GM) 68Lancet, The 196–197Legumes (GM) 77Liberty Link 127, 137Losey, Dr John 191, 198–199
Maize (GM and conventional)Bt maize 137–138, 142, 149–150, 198–201demographics of growers in Iowa 128–133demographics of growers in Ohio 143–145herbicide-resistant maize 150hybrid maize 142–143
Index 315

Maize (GM and conventional) continuedmarket for GM maize 261, 262pest and weed pressure in cultivation 137–138segregation of non-GM grains 265–268
Management 86–88, 105, 108Market failure 303–304Market penetration 11, 53, 192Market shares, GM vs. non-GM 15, 16–18Marketing 65–66, 130, 162Mass media 28, 29, 50, 196, 202, 206–207, 214,
217, 220Microbial contamination of food see
Contamination of foodMilk production 81, 86–88, 92, 103–109Miller–Modigliani theorem 280Monarch butterfly 198–199Monsanto 81, 102, 109, 141, 231, 237, 271 n1,
288Multinational companies 162, 285, 291–300
National Academy of Sciences (USA) 229Nature 198–199Nestlé 288Net present value (NPV) 121–123New product development (NPD) 63–66NIH (US National Institutes of Health) 228–229Non-profit institutions 286–287Novartis 287, 288Nutraceuticals see Functional foodsnvCJD see Bovine spongiform encephalopathy
(BSE)
Ohio 142Opportunism 175, 285Opposition to GMF 1, 8, 55–56, 179, 246,
252–255see also Consumers, attitudes to GMF,
oppositionOrganic foods 27, 33, 36, 56Outcrossing 232–233Outrage, as element of risk assessment 194–195
Patents 115Pathogens in food 205–206PCR (polymerase chain reaction) test 256,
266–267Peer review 195, 196–197, 198Perceptions of GMF 29–30, 31, 43–44, 50–51,
57–59, 70–72, 197, 199, 301
Performance, managerial 86–88Pesticides 233–236Pests, resistance to 76, 127, 137–138, 142Pharmaceutical companies 279–283Phosphorus uptake 76Plants, transgenic see Crops (GM)POSILAC see Bovine somatotropin, recombinant
(bST)Potatoes (GM) 76, 78, 195–197Prices of GMF vs. non-GMF 10–11, 50, 51–52,
55, 263, 267–268Private sector 113–116Probiotics 211Probit analysis of adoption 93, 95–98Producer associations 168–169, 173, 175Product differentiation 302–303Production
benefits of GMF 70–71, 76–79, 160–161contracts 162, 174–175marginal costs 12, 163
Productivity 164, 168, 173Products
attributes and characteristics 69, 76–79branded vs. generic 43–46, 52labelling see Labels for productsnew product development (NPD) 63–66,
70–71Profitability 8, 84–90, 104–108, 109, 296,
306–312Profits, mathematical models 82–83, 104Property rights 113–116Psychology of perceived risk 218–219Public extension bodies 169‘Public good’ market failure 114–115Public sector 114Purchase of GMF see Consumers, purchase of
GMFPurchase processes 40Pusztai, Dr Arpad 191, 195–197, 207, 246
Quality enhanced GM crops see GM crops, secondgeneration
Quality function deployment (QFD) 65–66Quality management 303–304
Rape-seed see CanolaReal options model 285, 293–294Refuge requirements 199–200Regulations 52, 102–103, 176, 185–187, 192,
199–201, 228–230, 247–248
316 Index

costs and implications 197–198, 200–201labelling see Labels for productsresponse to risk perception 272–277
Relative factor endowments 292Release of GMOs 186Rent distribution 296–300Research and development (R&D) 65–66,
113–114, 164, 172–173, 284–289,291–300
costs and benefits 115, 116, 118–124investment 113–116, 292–293need for university independence 184
Resistance see Antibiotics, resistance to; Herbicides,resistance to; Insects, resistance of; Pests,resistance to; Weeds, resistance of
Rice (GM) 76Rights of breeders 113–114Risks
analysis and assessment 193–195, 209–214,228
environmental 222–224, 234for farmers 162–163frame theory 219–220of GMF 43–44, 51, 55, 69–70, 71–73,
195–202information 194, 219–224management 186, 192–193, 267, 268–269of new product development 64perceptual differences 214, 218–219policy implications of perceived risk 276–277psychology 218–219quantitative model of risk perception
218–219of recombinant DNA techniques 228–230speculative and hypothetical risks 201, 247see also Food safety
Roundup Ready™ crops 15, 127, 137soya see Soya (GM)
Rowett Institute 195–197
Safety of GMF see Risks, of GMFScience 208, 212–214Science, consumer perceptions 27Scientists, concern about GMOs 8, 228–229Seed companies 281, 287, 289Segregation of non-GM maize and soya,
implications for grain handlers 262–270Somatotropin, bovine see Bovine somatotropin,
recombinant (bST)Sometribove see Bovine somatotropin, recombinant
(bST)
Soya (GM) 77, 141–142, 147–148, 238, 261allergenicity 239animal studies 238–240benefits 239–241creation 227, 231demographics of growers 132–134, 144–145field trials 231–232market 261, 262outcrossing 232–233risks 233, 239
Segregation of non-GM soya 264–265, 268–269weediness 231–232
Spence-Mirlees conditions 304Standards 304Start-ups (companies) 291–300Strategic alliances 283–289, 296Strawberries (GM) 78Subsidies 168, 174Supply and demand 15, 17–18Supply chain management 301–312Surveys
consumers 25–37, 40–46, 56–60, 205,246–247
farmers 84–85, 93–95, 128, 143–145,169–172
Symbiotic competition 286
Technology as source of fear 43Technology fees 15, 17, 142Tobin’s q 280–282Tobit model 145–147Tomatoes (conventional and GM) 68, 76, 78,
237demand for GM products 175demographics of growers in Italy 171–172Italian processing industry 167–168problems of cultivation 169, 171, 172research and innovation 172–175
Total mixed rations (TMR, cattle feed) 92, 95, 98Trade equilibrium 299–300Transaction cost economics 284–285Transgenic plants see Crops (GM)Treadmill theory 161Trials 178, 231–232, 240Trust see Consumers, trust in authorities
Uncertainty 194, 201, 294–295, 298–299Underdeveloped countries 107–109United Kingdom 195–198, 201–202, 222–224,
250–251, 252
Index 317

United States 185–186, 198–202, 222–224, 285adoption of bovine somatotropin 84–90,
93–98, 103–107adoption of GM crops by farmers 128–132,
141–150consumer attitudes 25–37, 39, 56–60European entry into biotech industry
291–300regulations 102–103, 185, 199–200,
228–230 see also EPA; FDA; NIH; USDAsoya production 227–228
USDA (US Department of Agriculture) 142, 143,214, 230–233, 250
Valueof companies 280–282of innovations 284–285
Vertical integration 163, 173, 174, 176, 283–284,287–288, 305–306
Viruses, resistance to 174
Weed control trials 240Weed pressure 137Weediness 231–232Weeds, resistance of 233Welfare
effects of GM crops 18, 20, 21, 173–174effects of information 180–187effects of regulations 276–277
Willingness to pay see Consumers, willingness topay
Yeasts (GM) 77Yield index 116–123
Zebu (cattle) 107
318 Index