Genetically Modified Rice, Yields, and Pesticides: Assessing Farm‐Level Productivity Effects in...
37
September 2006 Genetically Modified Rice, Yields and Pesticides: Assessing Farm-level Productivity and Health Effects in China Jikun Huang, 1* Ruifa Hu, 1 , Scott Rozelle 2 and Carl Pray 3 1. Center for Chinese Agricultural Policy, Institute of Geographical Sciences and Natural Resource Research, Chinese Academy of Sciences, Jia 11, Datun Road, Beijing 100101, China 2. Shorenstein Asia-Pacific Research Center, Freeman Spogli Institute for International Studies, Stanford University 3. Department of Agricultural, Food, and Resource Economics, Rutgers University * To whom correspondence should be addressed: Name: Jikun Huang Address: Center for Chinese Agricultural Policy Chinese Academy of Sciences Jia 11, Datun Road, Anwai, Beijing 100101 Tel: (86)-10-64889833 Fax: (86)-10-64856533 Email: [email protected] Authors’ note: The authors acknowledge the support of the National Science Foundation of China (Grants: 70333001, 70021001 and 70325003) and technical inputs from Qifa Zhang and Zhen Zhu and their colleagues who developed the GM rice in China.
Transcript of Genetically Modified Rice, Yields, and Pesticides: Assessing Farm‐Level Productivity Effects in...

September 2006
Genetically Modified Rice, Yields and Pesticides:
Assessing Farm-level Productivity and Health Effects in China
Jikun Huang,1* Ruifa Hu,1, Scott Rozelle2 and Carl Pray3
1. Center for Chinese Agricultural Policy, Institute of Geographical Sciences and Natural Resource Research, Chinese Academy of Sciences, Jia 11, Datun Road, Beijing 100101, China 2. Shorenstein Asia-Pacific Research Center, Freeman Spogli Institute for International Studies, Stanford University 3. Department of Agricultural, Food, and Resource Economics, Rutgers University
* To whom correspondence should be addressed:
Name: Jikun Huang
Address: Center for Chinese Agricultural Policy
Chinese Academy of Sciences
Jia 11, Datun Road, Anwai, Beijing 100101
Tel: (86)-10-64889833
Fax: (86)-10-64856533
Email: [email protected]
Authors’ note: The authors acknowledge the support of the National Science Foundation of China (Grants: 70333001, 70021001 and 70325003) and technical inputs from Qifa Zhang and Zhen Zhu and their colleagues who developed the GM rice in China.
Genetically Modified Rice, Yields and Pesticides:
Assessing Farm-level Productivity and Health Effects in China
Abstract
Although genetically modified crops are being grown on increasing larger areas
in both developed and developing countries, with few minor exceptions, there has been
almost no country that has commercialized a genetically modified major food crop.
One reason may be that is unclear how the commercialization of genetically modified
crops will help poor, small farmers. The objective of this paper is to report on the
results of an economic analysis that uses three years of data from a series of quasi-
experimental areas in China’s GM rice program that were carried out in the fields of
small and relative poor producers in two provinces in China. The paper attempts to
answer two key questions: Does GM rice help reduce pesticides in the fields of farmers?
Do the new varieties of GM rice increase the yields of farmers? Based on the results,
the paper shows that the use of GM rice by farmers in pre-production trials allows
farmers to reduce pesticide use and labor input, increase yields and improve their health.
The paper concludes by arguing that the commercialization of GM rice in China could
have consequences that exceed the direct impacts on China’s farmers and could be a key
step in breaking the world’s current plant biotechnology logjam.
Keywords: Biotechnology, Rice, Productivity, Health, China
JEL Codes: Q12; Q16; O33
1
Genetically Modified Rice, Yields and Pesticides:
Assessing Farm-level Productivity and Health Effects in China
One of the early promises by the supporters of agricultural biotechnology was
that this set of research tools could make a major contribution to the reduction of world
hunger. It is now 25 years since some of those early promises were made and a decade
since genetically modified (GM) crops were first grown commercially, but the only
substantial way that biotechnology has contributed to the well-being of the hungry is
through higher incomes from the production of GM cotton (Huang et al., 2002). Only a
small set of countries have extended GM food crops and most of these in a relatively
minor way (James, 2004; 2005). Now China is on the threshold of starting to fulfill the
promise of more food for the poor through the introduction of rice varieties that can
resist important insect pests and disease. This paper presents the first evidence from the
fields of farmers in the economic literature on whether GM rice can really start to
deliver on its promise or whether this is another set of unfounded promises from the
supporters of biotechnology.
Although the contribution of agricultural technology to the expansion of rice
output and income growth in China and other developing countries during the past 40
years are substantial and well documented (Lin 1994, Barker et al., 1985, Evenson et al.,
1996), there is still a need in the future for both rapid rises in agricultural productivity
and ways to reduce some of the adverse consequences of modern agricultural practices
(Borlaug, 2000; Byerlee et al., 2000). From a nation facing widespread famine in the
1940s and 1950s, Green Revolution varieties, investments in water control and the
2
intensification of chemical input use in China raised food production to levels that no
one would have dared predict (Stone, 1988). Past success, however, does not guarantee
abundant food and profitability in the coming decades. Rosegrant et al. (2001) estimate
that China’s cereal production must continue to rise by about 40 percent to satisfy most
of the demand of the nation’s population by 2020. With most available cultivated land
already in use, the future growth of output in China, as elsewhere in the developing
world, will have to rely on rising yields (Pingali et al., 1997; Jin et al., 2002). There
also have been negative consequences associated with the use of conventional varieties.
For example, the high levels of pesticide use (China is the largest pesticide user in the
world), especially in the case of rice (rice farmers use more than 40% of all pesticides
that are used on the nation’s field crops excluding vegetable and fruits), have led to a
case in which the health of tens of millions of farmers are being adversely affected,
costing the nation millions in lost labor days, billions of yuan in increased health costs
and an immeasurable amount in suffering (Pray et al., 2001; Huang et al., 2001).
While most scientists believe that agricultural biotechnology can provide new
sources of productivity growth and address some of the negative effects of conventional
agronomic techniques for producers of rice and other basic food crops in China and
other developing countries, at present they are primarily used for industrial crops like
cotton and grain for animal feed such as yellow maize and soybeans (James, 2005). In
the late 1980s and 1990s government research in many developing nations often funded
by the Rockefeller Foundation began ambitious rice biotech research programs to
develop new rice varieties that would increase yields and nutrition, reduce input use and
make the rice plant (as well as those of other food crops) more tolerant to both biotic
and abiotic stresses (Evenson et al., 1996). This research led to a major increase in

3
knowledge about the rice plant and rice genetics and the development of conventional
and genetically modified (GM) rice varieties that could help producers in developing
countries. New conventional varieties with resistance to bacterial leaf blight developed
through molecular aided selection are now available to farmers in Indonesia and China.
Scientists in China, India and Costa Rica are conducting field trials for new GM
varieties of insect and disease resistant rice; there are reports that GM rice has been
commercialized in Iran (James, 2005). However, due to government indecision,
evolving biosafety regulatory systems, consumer resistance, and trade concerns no
major GM rice varieties have been approved for commercial use anywhere in the
developing world.
The difficulties of commercializing GM rice appear to be affecting the amount
and direction of public and private biotech research also. According to interviews that
one of our coauthors has been conducting in developing countries outside of China over
the past several years, it has been noted that government scientists in India are faced
with increasing difficulty in finding locations for the trials of GM rice, and because of
increasing costs due to the need to protect the fields from anti-biotech organizations,
many research organizations are pulling back from trying to develop GM varieties and
simply publishing their research results or working on industrial crops like cotton where
GM varieties can be commercialized. The private sector also is cutting back because
consumer resistance to GM products and because of the rising cost of commercializing
new products. For example, Monsanto in the United States discontinued work on rice
in the late 1990s and other companies such as Syngenta and Bayer have sharply cut
back on their rice research programs in recent years.

4
As a result, except for in a number of relatively minor locations, no GM rice has
been commercialized anywhere in the world (except for small areas in Iran) and little is
in the pipeline in most countries. In fact, with the exception of Bt white maize in South
Africa, where Bt white maize is primarily being grown by large, relatively wealthy
farmers (James, 2004), there are few cases in which GM staple food crops are being
grown. Even in China, a country that initially aggressively commercialized Bt cotton
and invested heavily into research on GM food crops, policy makers have not allowed
the commercialization of any major food crops despite the fact GM crops have been in
experimental trials since 1999.
In addition to the actions of small but vocal urban consumer groups that have
actively discouraged the commercialization of GM food crops, one reason that
commercialization has not proceeded, especially in developing countries such as China
that are less pressured by anti-GM activist organizations, is that there has been little
independent evidence on whether GM food crops would really improve the income and
well-being of farmers, especially those who are poor. Often regulators and policy
makers have to take the word of the government scientists and companies who
developed and are promoting these GM products.
The objective of this study is to report on the results of an economic analysis
that uses three years of data from key experiments in China’s GM rice program that
were carried out in the fields of small and relative poor producers in two sites in China.
The paper attempts to answer two questions: Does GM rice help reduce pesticides in
the fields of farmers? Do the new varieties of GM rice increase the yields of farmers?
Based on the results, the paper shows that the use of GM rice by farmers in pre-
production trials allows farmers to reduce pesticide use and labor inputs, increase yields
5
and improve the health of farmers. The paper concludes by arguing that the
commercialization of GM rice in China could have consequences that exceed the direct
impacts on China’s farmers and could be a key step in breaking the world’s current
plant biotechnology logjam.
China’s GM Rice Research Program
China’s modern biotechnology program, begun in the 1980s, has grown into the
largest initiative in the developing world (Huang et al., 2002). A recent survey by the
authors of agricultural biotechnology research investment in 2004 shows that the
government’s spending on agricultural biotechnology (including plants, animals and
microorganisms) reached RMB 1.647 billion, which is equivalent to US $199 million at
current exchange rates and US $954 million in purchasing power parity terms (Table 1,
column 1). Between the mid-1980s and 2000, annual plant biotechnology spending also
rose fast, more than doubling each five years for the first 15 years (column 2). Between
2000 and 2003, plant biotechnology investment continued to accelerate, more than
doubling during the three-year period.
Although the success of GM cotton in China initially attracted the attention of
research administrators that allocated cotton scientists nearly 15 percent of national
plant biotechnology research expenditures (despite the fact that the crop accounts for
only about five percent of China’s sown area), rice scientists also have been provided
with increasing financial resources (Table 1, column 3). In the late 1980s each year rice
scientists were provided with US $2 to 3 million (at the official exchange rates). By
2003, rice scientists were allocated nearly US $24 million (or $115 in PPP), accounting
for nearly 20 percent of plant biotechnology spending (which in the case of rice is
6
almost its sown area share). Although estimates of world spending on rice
biotechnology are not available, given the low priority accorded by funding agencies to
rice in nations with the largest biotechnology programs (such as the US and the UK), it
is almost a certainty that China’s public investment into rice biotechnology exceeds that
of any other nation.
China’s rice biotechnology research program has generated a wide array of new
technologies that are at all stages of the research and development process. In China the
Ministry of Agriculture must grant a company or research institute a permit before any
GM plant can be commercialized. Before such a permit is granted, however, China’s
bio-saftey procedures require transgenics crops to pass through three phases of trials:
field trials (equivalent to small-scale, contained trials in the US); environmental release
trials (equivalent to controlled farmer-field trials in the US) and pre-production trials
(larger-scale, farmer-field trials—that are not controlled by the scientist). Pre-
production trials are not required in the US.
Many types of transgenic rice varieties and hybrids have reached and passed the
field trial and environmental release trial phases of China’s bio-safety testing since the
late 1990s. Transgenic Bt rice varieties that are resistant to rice stemborer and leaf
roller were approved for environmental release trials in 1997 and 1998 (Zhang et. al,
1999). In experimental fields in Wuhan in 1999 Bt hybrid Xianyou 63 yielded 28.9
percent more than non hybrid Xianyou 63 in the presence of natural attacks of leaf roller
and natural and induced attacks of yellow stem borer; pesticides were not applied to
either variety (Tu et al., 2000a). Other scientists introduced the CPTi gene into rice
creating rice varieties with another type of resistance to rice stemborer and this product
was approved for environmental release trials in 1999 (NCBED, 2000). Transgenic rice
7
with Xa21 and Xa7 genes for resistance to bacterial blight were approved for
environmental release trials since 1997 (NCBED, 2000). Trials of the IRRI variety
IR72 transformed to express the Xa21 gene in 1998 and 1999 were shown in
experimental fields to give a high-level of protection against bacterial blight outbreaks
(Tu et al., 2000b). Interviews also found that although environmental release trials have
not begun, field trials have been underway since 1998 for transgenic plants with
herbicide tolerance (using the Bar gene) as well as varieties expressing drought and
salinity tolerance in rice.
Of all of the work being done in field and environmental release trials, four
transgenic rice hybrids, which have been engineered to be resistant to major pests in
China, have advanced to the final stage of field trials, the pre-production trials stage.
Two insect resistant hybrids—GM Xianyou 63 and Kemingdao—contain the stemborer-
resistant Bt genes. According to experimental trial data, the Bt varieties are resistant to
three stemborers in China—Tryporyza incertulas Walker, Chilo suppressalis Walker
and Cnaphalocrocis medinalis Guenee (Zhu et al., 2003). The hybrid GM II Youming
86 contains the CPTi gene which provides resistance to six pests, the same pests that are
targets of varieties containing Bt plus Sesamia inferens Walker, Parndra guttata
Bremeret Grey and Pelopidas mathias Fabricius. MOA reports that in 2000 and 2001
stemborers affected between 68 to 75 percent of China’s rice area (MOA, 2002). Given
that China’s rice area is nearly 30 million hectares, this means that the main pests
targeted by China’s experimental GM rice varieties (that are currently in pre-production
trials) affect more than 20 million hectares annually, nearly 13% of the world’s total
rice sown area. A fourth hybrid contains the Xa21 genes that provide resistance to

8
bacterial blight, one of the most prevalent diseases in rice production areas in central
China (Zhu et al., 2003).
According to the scientists that have been working to develop the new GM rice
technologies, several varieties have had successful agronomic, environmental release
but to date have not been approved for commercial use (Zhu et al., 2003). It is claimed
approval has been held up by pressure from environmental and trade interest groups in
China and by those that do not want to see China bear the risk of being the first large
nation to commercialize a major GM food crop.
In place of commercialization, after a new GM variety passes the environmental
release stage of the bio-safety testing process, the variety must pass through pre-
production trials. Preproduction trials are a relatively new phase of testing that is
required for GM food crops before approval for commercialization can be given.
According to China’s bio-safety regulations, the total area for each pre-production trial
should be more than 30 mu but not exceed 1000 mu, or 66.7 hectares (MOA, 2005).
Pre-production trials are allowed to be carried out in no more than 2 provinces in which
the environmental release trails were conducted. When the preproduction trials are
carried out in the fields of farmers, the trials are largely unsupervised; farmers are given
the seed and, except for periodic monitoring, scientists do not intervene in the
cultivation process.
Over time the number of villages with Bt rice pre-production trials has grown.
For example, according to our contacts in Hubei province, the number of villages in
which farmers cultivated GM Xianyou 63 (which were developed by scientists from
Central China Agricultural University—CCAU), rose from 4 in 2002 to 7 in 2003 and
to 11 in 2004 (Table 2). Because the location of the counties and villages sometimes

9
change over time (especially between 2003 and 2004), in total we visited 15
preproduction trials villages located in 6 counties in Hubei between 2002 and 2004.
The pre-production trials for GM II-Youming 86 developed by the Chinese Academy of
Sciences and the Fujian Academy of Agricultural Sciences were initially only being
conducted by technicians in 4 rice experimental stations; 3 of the stations were in Fujian
province and 1 was in Hubei province. In 2002 and 2003 scientists carried out pre-
production trials for GM II-Youming 86 in 1 village in Fujian province (Shixi Village in
Shunchang County—Table 2). In 2004, the trials expanded into 1 additional village
(Nanhui Village in Taining County). In total, then, pre-production trials between 2002
and 2004 for GM Xianyou 63 and GM II Youming 86 were being carried out in 17
villages located in 8 counties (Table 2, bottom rows) and 4 experiment station locations
(Table 2, footnote). In this study only GM rice plots (as well as non-GM rice plots—
which are used as controls) that are cultivated by individual farmers that live in villages
outside experiment stations are analyzed. Before collecting data we confirmed by in-
depth interviews with local leaders and farmers that farmers in these areas are only
provided seed and are cultivating GM rice without the assistance of breeders or their
staffs. In contrast, we did not conduct surveys in experiment stations since rice plots in
the pre-production trials in the experiment stations are being cultivated by farmer-cum-
technicians working under the direction of the scientists.
Data
Our three-year survey was conducted in 2002 to 2004 by enumeration teams
trained and led by the authors and was designed to collect information allowing the
comparison of the performance of GM rice and non-GM rice under field conditions.
10
The total number of observations from the three years of survey work includes 320 rice
producing households—73 in 2002; 104 in 2003; 143 in 2004. These households were
randomly chosen by the authors from the population of all of the farmers in the pre-
production village (whether they were included in the Bt rice experiment or not).
According to the protocol of the pre-production trials, households in the sample were
randomly assigned to be in the project. Although this occurred in some villages, it is
unclear whether the random assignment was carried out strictly in all villages.
Therefore, in our analysis we compare the nature of Bt and non-Bt rice households in
order to understand if the characteristics of Bt rice producing households differ from
those of non-Bt rice producing households.
In addition, we also designed the survey so that the enumerators, using standard,
sit-down interviewing techniques relying on producer recall of inputs and outputs (for
the current year), collected information at the plot level in order to be able to distinguish
production practices (including level of inputs) that are used on plots with both GM and
non-GM rice. Given the focus on insect-resistant varieties, respondents were asked
detailed questions about the total amount of pesticides used on each plot, the value of
the pesticide and the number of sprayings. In total, the survey obtained data from 584
rice production plots, 211 plots planted with GM rice and 373 plots planted with non-
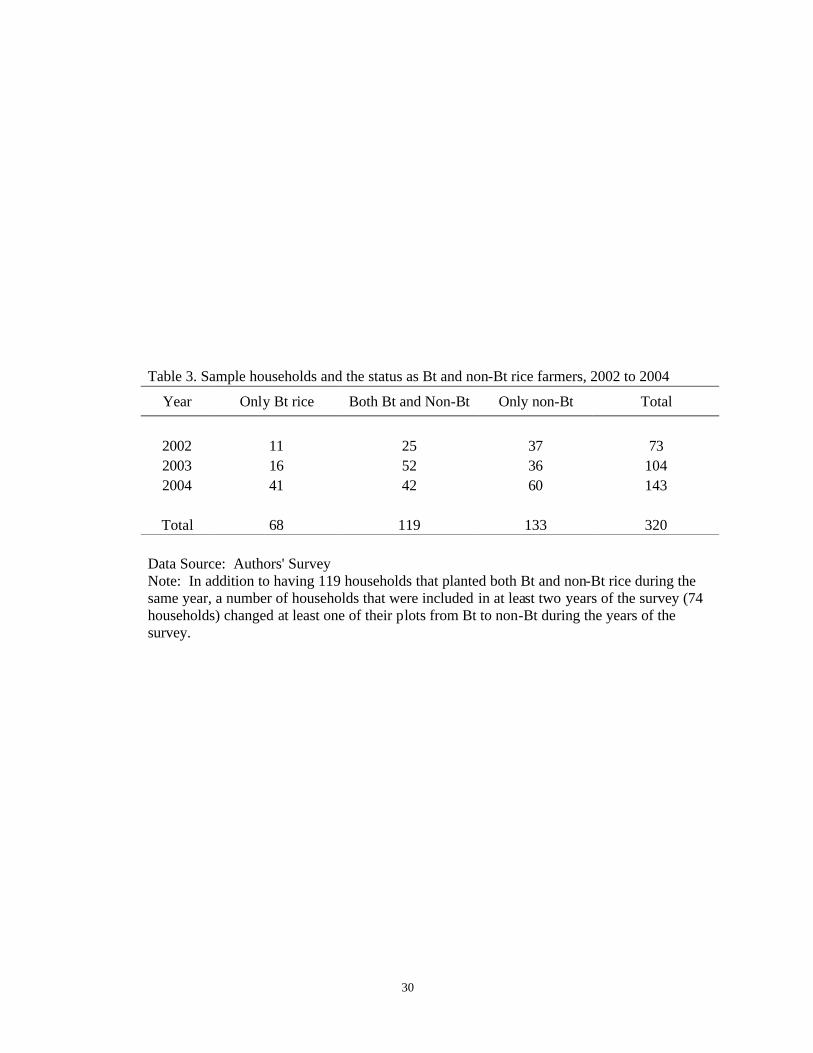
GM-rice. Among the 73 households in the 2002 survey, 37 planted non-GM rice only,
25 planted both GM and non-GM rice varieties and 11 planted GM rice only. In 2003,
of the 104 households, 36 planted non-GM rice only, 52 planted both GM and non-GM
rice varieties and 16 planted GM rice only. In 2004, of the 143 households, 60 planted
non-GM rice only, 42 planted both GM and non-GM rice varieties and 41 planted GM
rice only (Table 3). Therefore, in total during the three years of the study, we have 119
11
household-level observations (25+52+42) in which the household cultivated both GM
and non-GM plots during a single year.
In addition, there was also variation over time among the sample households in
their status as a household the cultivated Bt rice or not. Among the total 213 different
households that were interviewed, there were 41 households that were in the survey for
two years and 33 households that were in the survey all three years. Of these, 35
households at some point during the survey switched the status of at least one plot from
GM rice to non-GM rice (or vice versa). Since the survey also was designed to track
plots of farmers over time, in the sample we have 107 households that have at some
point of time in the survey produced both GM and non-GM rice (in some cases it was
producing one Bt plot and one non-Bt plot during a single year; in other cases it was
producing Bt on one plot during one year and producing non-Bt on the plot during the
next).
Besides collecting detailed, plot-specific information on inputs and outputs, the
survey also contained a number of questions focused on understanding the economic
and health effects of using insect-resistant rice varieties. Farmers recounted the prices
paid for all inputs and the prices that they received for their output. All of the
transactions, except for the provision of the seed to the farmers, were conducted on free
markets with no assistance from the research team or local government officials. These
data are used mainly to calculate whether or not there were any productivity effects
associated with the adoption of GM rice within the sample households.
The high incidence of pesticide-related illness in households in developing
countries, including China also created an interest in tracking the health effects of GM
rice adoption (Antle and Pingali, 1994; Huang et al. 2001). To assess the effects in this
12
study’s sample, enumerators asked households two questions about how the use of
pesticides affected their health or well being during the time or immediately after the
time in which they were applying pesticides. Specifically, the questionnaire first asked
the farmers: “During or after spraying for pesticides on your farm, did you suffer from
any of the following symptoms: headaches, nausea, skin irrigation, digestive
discomfort or other problems?” If the respondent answered “yes,” a second question
was asked: “After beginning to feel poorly, did you take any one of the following
actions: 1.) visit a doctor; 2.) go home and recover at home; 3.) take some other explicit
action to mitigate the symptom.” If the respondent answered affirmatively to both of
the two questions, it was recorded as a case of pesticide-generated illness.
GM Rice Adoption and Pesticide Use
Data from the surveys demonstrate that, as designed, the study is examining
producers of GM and non-GM rice that are operating in similar environments. This is
important since there might be a question about how the farmers within villages were
selected (although, as stated above, by protocol they are supposed to be randomly
assigned). In particular, the nature of rice farms, the characteristics of rice producers
and the market prices faced by households using GM rice and non-GM rice are nearly
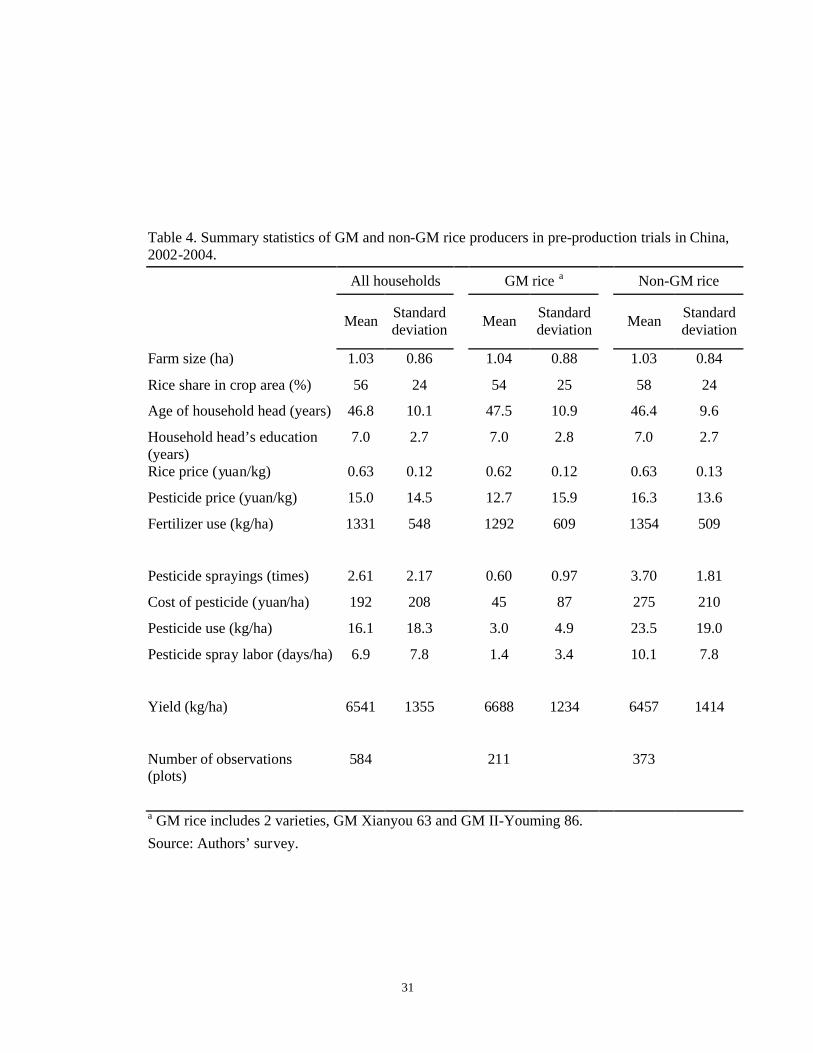
identical (Table 4). Descriptive data show that there is no statistical difference between
the size of the farm (on average 1.03 hectares per household—1.03 for GM rice
households; and 1.04 for non-GM rice households), the mix of rice and other crops (54
percent rice in GM rice households; 58 in non-GM rice households) and the age and
education level of the household head (measured as years of educational attainment) for
GM rice and non-GM rice producers (rows 1 to 4). The prices paid for pesticides and

13
the price received for their output also did not differ significantly (rows 5 and 6).
Although the point estimate of the level of fertilizer used on GM rice (1292 kg/hectare)
is lower than that for non-GM rice (1354 kg/hectare), the difference is statistically
insignificant.
In contrast, there are large differences between GM rice and non-GM rice
production in the use of pesticides (Table 4, rows 8 to 11). GM rice farmers apply
pesticide less than one time per season (0.6 times) compared to 3.7 times per season by
non-GM rice farmers (a level which is statistically significant). On a per hectare basis,
the pesticide use in value terms in non-GM rice production (275 yuan/hectare) is more
than six times higher than GM rice (45 yuan/hectare). The quantity in physical terms
differs by nearly eight times (3 kg/hectare for GM rice farmers compared to 23.5
kg/hectare for non-GM rice farmers). Because of the reduction of pesticide use, GM
rice farmers were able to reduce their labor allocation to pesticide spraying significantly,
expending only 1.4 days/hectares for the production of GM rice versus 10.1
days/hectare for non-GM rice. Interestingly, although the pattern of pesticide reduction
for those that adopt GM rice is similar to the reductions in the case of those that adopt
Bt cotton (that is there is a significant drop in the number of sprayings, the quantity of
pesticides uses, the cost of spraying and the labor used in pest control—see Huang et al.,
2003), there is one important difference. While Bt cotton producers all continue to
apply pesticides to control for a number of non-targeted pest, in the case of 62 percent
of the sample GM rice plots, farmers did not apply pesticides at all (that is, their
quantity in physical terms; value of expenditure; and time allocated to pesticide
spraying was zero).
Multivariate Approach to Estimating Pesticide Demand and Yield Effects (Approach 1— Village Effects)
14
Because other factors might affect pesticide use when comparing GM rice and
non-GM rice producers from sample survey data, multivariate analysis is needed to
determine the net impact of the adoption of GM varieties on farm-level pesticide
demand. To estimate a demand function for pesticide by China’s rice farmers in our
sample areas, the following farmer pesticide adoption model is proposed:
(1) Pesticide Use= f (Pest Pressure Perception, Pesticide Price, Producer and Farm Characteristics; Weather Effects; Other Plot-specific Effects; Year Effects; Village Effects; and GM Rice Effects).
In implementing this model (that has been used elsewhere in the analysis of pesticide
demand inside and outside of China—e.g., Pingali and Carlson, 1985; Huang et al.,
2003), the data from the survey are used to create variables to use in the empirical
estimation of equation (1). The dependent variable for the multivariate analysis in this
paper is the quantity of pesticides used per season (although substantively identical
results are generated when using either the number of sprayings per season or the value
of pesticide use). The pest pressure perception variable is created by asking the farmers
about the percentage loss that they believe would have occurred had they not sprayed in
non-GM rice. The price of pesticides, included in the analysis as yuan per kilogram, is
measured as the unit value price of pesticide purchased by the farmer and is calculated
for each household by dividing the value of their pesticide purchases by the quantity
that they purchased. To hold constant the producer and farm characteristics, the
regression model includes the age (in years) and education (in years of education
attained) of the household head, whether or not a household head is a village leader (1 if
yes; 0 if no) and the size of the farm (in hectares). Weather effects are controlled for by
including a Natural Disaster Dummy, which is equal to one if the farmer reported that
his/her rice plot was affected by either drought or flood (or some other disaster) during
15
the season. We also control for other plot-specific characteristics, including the size of
the plot (measured in hectares) and a subjective measure of each plot’s quality, which
was solicited by asking each farmer if the plot was “high,” “medium” or “poor” quality.
Year effects are controlled for by including two year dummies (2003 and 2004 Year
Dummy) that is equal to one for 2003/2004 and zero for 2002.
Importantly, the net effect of GM rice varieties on pesticide use, the main goal
of the analysis, is measured by including a single dummy variable (GM Rice) which
equals 1 if the farmer used either GM Xianyou-63 or GM II-Youming 86. In an
alternative specification (not shown), the use of GM rice is measured by including two
GM variety-specific dummy variables (GM Xianyou 63 and GM II-Youming 86) and
two non-GM variety dummy variables (conventional Xianyou 63 and II-Youming 86).
We do not report the of the regression analysis that uses by variety dummy variables,
but, in general, they produce the same results. We do, however, include two interaction
variables (GM Rice x 2003 Year Dummy and GM Rice x 2004 Year Dummy) in order
to analyze if the effect of GM rice on pesticide use changes over time.
In the version of the regression analysis that is based on equation (1), while
pesticide use, pest pressure perception, pesticide price, other plot-specific characteristics
and the GM dummy variables are measured at the plot level (and the other control
variables are measured at the household level), we control for all unobserved village
effects by adding a set of Village Dummy variables, one for each of the villages in the
sample (with one of the Hubei province villages dropped as the base village). Implicitly
when we specify the model this way, we are assuming the GM and non-GM rice
farmers were randomly assigned within the village (as intended by the pre-production
trial’s original design). Because practice may have diverged from theory, the
16
assumption is relaxed below in the next section.
Measuring the Effect of GM Rice on Yields
In addition to the effect of GM rice on pesticide use, we also are interested in
understanding the effects on production. The descriptive data in Table 4 (row 12) show
that there is a marginal net increase in yields for users of GM rice (6657 kg/hecatare)
compared to non-GM rice users (6440 kg/hectare), a gain of 3.3 percent. In the
descriptive results, however, the difference is not significant. Because we are
aggregating across a large number of households that are producing in large number of
preproduction trial villages, there may be other effects that are confounding the
difference between GM and non-GM rice.
To measure the net effect of GM rice on yields, we specify a second equation
(also from Lichtenberg and Zilberman, 1986; Huang et al., 2003):
(2) Yields= f (Producer and Farm Characteristics; Input Use, including Pesticide Use; Weather Effects; Other Plot-specific Effects; Year
Effects; Village Effects; and GM Rice Effects).
where the specification of equation (2) is the same as equation (1) except for several
elements. First, we replace the dependent variable, pesticide use, with yields, which are
measured at the plot level (in kilograms/hectare). In addition, we include plot-specific
levels of input use as additional control variables. Since it is likely that the coefficient
on the pesticide use variable is affected by endogeneity bias when estimating equation
(2), instead of actual pesticide use, we use predicted pesticide use. The exclusion of
Pest Pressure Perception and Pesticide Price from equation (2) means that we are
identifying the effect of pesticide on yields through the inclusion of these two
17
instrumental variables in equation (1). As in equation (1), we include village effects
and assume that within villages the GM rice plots were randomly assigned.
GM Rice, Pesticide Use and Yields—the Multivariate Results with Village Effects
The results of the pesticide use equation demonstrate that the model generally
performed well in explaining pesticide use (Table 5, column 1). The model has a
relatively high explanatory power, with adjusted R-square values that are between 0.42
and 0.52, levels that are reasonable for cross-sectional household data (bottom row).
Most of the signs of the estimated coefficients of the control variables (i.e., those
variable included in addition to the GM Rice dummy variables) are as expected. For
example, when farmers perceive pest pressures are high, they apply higher levels of
pesticides, other things equal (column 1, row 2). Likewise, higher pesticide prices lead
to lower pesticide use (row 3).
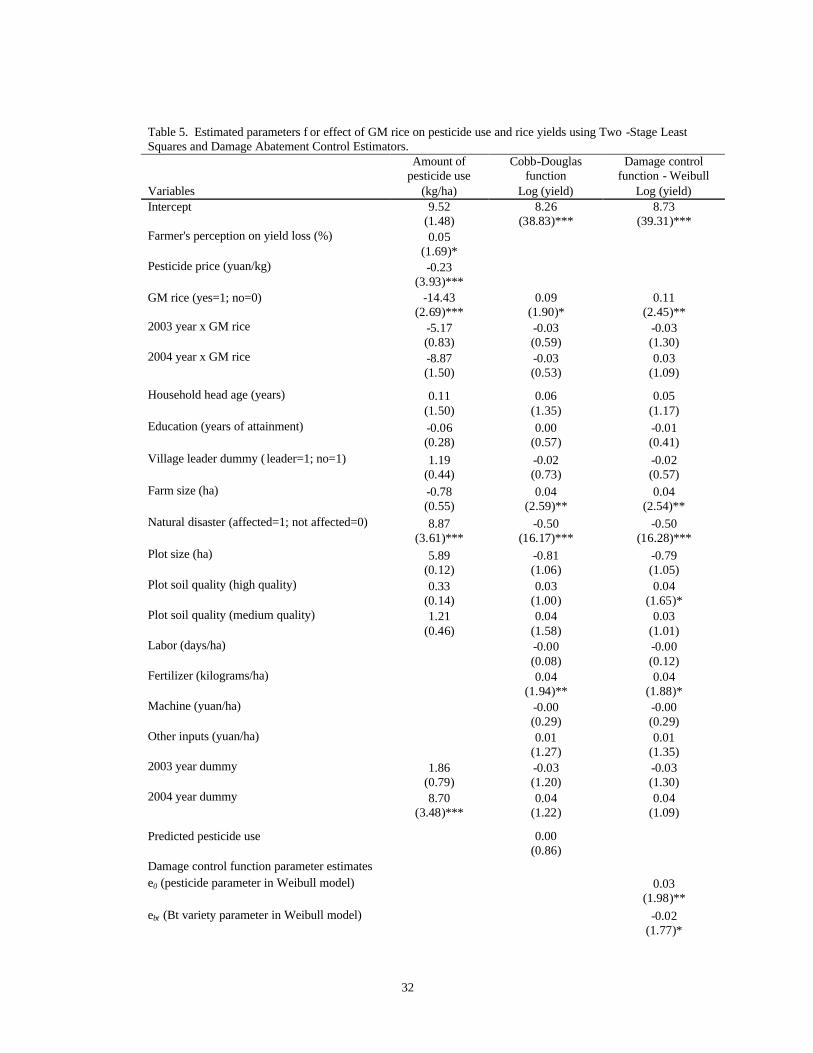
Most importantly, the regression analysis illustrates the importance of GM rice
varieties in reducing pesticide use (Table 5, column 1, rows 4 to 6). The negative and
highly significant coefficient on the GM rice variable means that GM rice farmers
sharply reduced pesticide use in 2002 when compared to non-GM rice farmers. Ceteris
paribus, GM rice use allowed farmers to reduce pesticide use by 14.43 kilograms per
hectare in 2002 (column 1, row 4). Given that the mean pesticide use of non-GM rice
producers is 23.5 kilograms per hectare (as seen in Table 4, column 3, row 10), the
adoption of GM rice in the first year of the preproduction trials was associated with a 61
percent reduction of pesticide use. When examining the impact of the specific varieties
(GM Xianyou 63 and GM II-Yuoming 86—results not shown) in both cases the fall in
pesticide use is similar. Interestingly, in subsequent years of the survey (2003 and 2004)
there seems to be a slight tendency for GM rice farmers to further reduce their pesticide
18
use (as shown by the negative signs on the interaction terms—rows 5 and 6), although
the coefficients are statistically insignificant from zero.
Beyond the pesticide-reducing effects, we also are interested in measuring the
effects of GM rice on yields. Because we do not know the precise functional form, we
specify the yield equation (equation 2) two ways: a.) in log form (i.e., including the log
of yield as the dependent variable in equation 2); and b.) using a damage control
functional form, a form suggested by Lichtenberg and Zilberman (1986). The damage
control functional form may be more appropriate in our analysis, since it perhaps is
more correct to model pesticide use as a way of reducing damage from pests rather than
as a way to increase yields directly.
Regardless of the functional form, however, from our analysis that controls for
village-level effects, we can show that the adoption of GM rice in the preproduction
sample villages increases yields, ceteris paribus (Table 5, rows 4 to 6). When using the
log of yields as the dependent variable and controlling for village effects (column 2), the
adoption of GM rice increases yields by 9 percent. When using the damage control
functional form (column 3), the adoption of GM rice increases yields by 11 percent.
The yield gains are statistically consistent across the sample years (2002 to 2004—as
seen from the insignificant signs on the interaction terms in rows 5 and 6). Hence, in
terms of production, in the preproduction trial villages, when we assume that farmers
within villages are randomly selected to cultivate GM rice, there is a win-win outcome
in production: GM rice producers not only reduce pesticide use, they also achieve
higher yields.
Multivariate Approach to Estimating Pesticide Demand and Yield Effects (Approach 2—Household Effects)
19
While the results from the preceding analysis suggest that GM rice is a win-win
proposition on the production side, such a finding, in part, may arise because the sample
selection by the scientists in the preproduction trial villages was not random. For
example, despite the appeals of scientists, it could be that because better farmers within
the preproduction trial villages were more aggressive in their efforts to be signed up for
the program, part of the effect that we are measuring is due to management bias and not
because of the effectiveness of GM rice. In order to control for the unobservables that
could be affecting the results, in this section we redo the analysis for pesticide demand
and rice yields and include a set of household dummy variables for any household in the
sample that at some time during the study cultivated at least one plot of GM rice and at
least one plot of non-GM rice (henceforth, the household fixed effects model).
Specified this way, we are able to purge all household-specific unobservables (and
above) and in essence look at the results of the experiment of how much pesticide use
and yields differ among two or more plots of same farmer.1
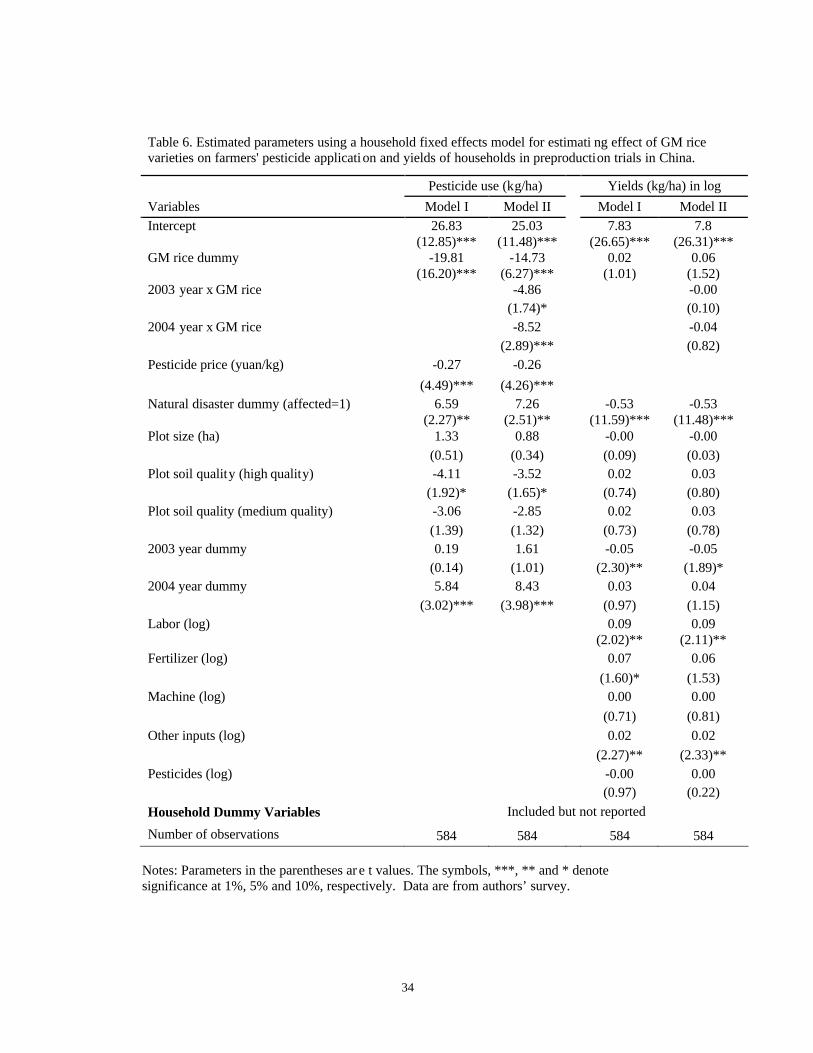
According to the results from the household fixed effects models, although the
impact of GM rice on pesticide use and yields changes somewhat (when compared to
the results reported in Table 5, the results using village fixed effects), in general, the
nature of the results are the same (Table 6). The average within household, between
plot, effect on pesticide use is -19.81 (column 1, row 2). This means that when a
household cultivates both GM rice and non-GM rice, on average, the use of pesticide on
the GM rice plots falls by nearly 20 kg/hectare, a reduction of nearly 85 percent. When
1 While is the possibility that GM rice plots were systematically placed on plots were different from those that were used for non -GM rice, we were assured by the design of the program that the plots were randomly assigned. To confirm that there is no bias in the selection of plots , we ran a regression of plot characteristi cs on the GM Rice dummy variable (GM Rice dummy = a0 + a1*X plot characteristics + e) and
20
allowing pesticide reduction effects by year, the results show that the reduction in
pesticide falls progressively year by year (column 2, rows 2 to 4). In 2004 farmers
producing GM rice actually reduced pesticide use by 8.52 kilograms per hectare more
than in 2002 (row 4). Since pesticide use rose to 26.93 kilograms per hectare for non-
GM rice in 2004, this means that by 2004 GM rice farmers were able to reduce their
pesticide use by 86 percent ((14.73+8.52)/26.93). Although we do not know the exact
mechanism, the results are consistent with the fact that as farmers have begun to
become familiar with GM rice technology, they appear to be learning that they can use
less pesticides.
In contrast, the results of the yield equations from the household fixed-effects
model differ somewhat from those when only village effects are controlled for.
Although the coefficients on the GM rice variables are positive, they are not
significantly different from zero (Table 6, columns 3 and 4). Therefore, as seen by the
comparisons between the village fixed effects approach and household fixed effects
approach, there appears to have been some selection bias when it comes to identifying
the effect of GM rice on yields. Importantly, regardless of the approach, GM rice
adoption leads to large reductions in pesticide use; yields, at the very least, do not
diminish.
Assuming the GM rice would be equally effective across large parts of China
(those areas affected by stemborers, in particular), the simultaneous rises in output and
reductions of inputs mean that GM rice varieties would lead to absolute rises in
productivity. In fact, the potential gains to China’s economy could be large. Even after
considering general equilibrium effects (e.g., the price of rice would fall when rice
discovered that the R -square coefficient was less than 0.01 and that none of the coefficients were
21
became more profitable and area expanded), Huang et al. (2004) show that the annual
gain to China’s economy would be US $4.2 billion if GM rice would be fully adopted in
the future.
Health Effects
In the same way that research on Bt cotton adoption showed that the
productivity effects of Bt cotton were supplemented by positive health effects (Hossain
et al., 2004), according to the analysis based on the survey data, similar effects occur
within the sample households. Among the sample farmers, if a sample farmer used all
GM varieties (and did not cultivate non-GM rice varieties), there was not one case of
the farmer being affected adversely pesticide use in any year of the sample—2002, 2003
or 2004 (Table 7). Of those that used both GM and non-GM plots, the health of 7.7
percent of households in 2002, 10.9 percent of households in 2003 and 8.3 percent of
household in 2004 reported being affected adversely by pesticide use; none, however,
reported being affected after working on the GM plot. Of those that used only non-GM
varieties, the health of 8.3 percent households in 2002, 3 percent in 2003 and 5 percent
in 2004 were affected adversely. Although the study did not examine the effect on
drinking water quality, interviews of farmers showed that many believe that if pesticide
use were reduced due to the adoption of GM rice, the quality of the local sources of
drinking water would improve.
Conclusion: The Future of GM Rice in China
significant.

22
Although China is still struggling with issues of biosafety and considering the
issues of international and domestic acceptance, many competing factors are putting
pressures on policy makers to decide whether they should approve commercializing GM
rice or not and the results in this study provide evidence that should encourage
commercialization. The nation has already invested several billion US dollars in
biotechnology research and the development of a stock of GM technologies. Many of
the new events have already been through several years of environmental release and
pre-production trials. As competitive pressures inside China build in the agricultural
sector due to the nation’s accession to the World Trade Organization in 2001, and as
leaders search for ways to increase rural incomes, there will be a continuing demand by
producers for productivity-enhancing technology. The past success in developing
technologies and high rates of return suggest that products from China’s plant
biotechnology industry could be an effective way to both increase competitiveness
internationally and increase rural incomes domestically. The analysis in this paper
shows that in pre-production trial sites the costs of those farmers that adopt insect-
resistant GM rice fall and their yields either rise or at least do not fall. Hence, the paper
provides evidence that GM rice does improve productivity significantly. Given that the
farmers in the sample are small and relatively poor (the average per capita income of the
households in the sample is less than 3 dollars per day), leaders concerned with
agricultural productivity and farmer income should be expected to seriously consider
commercializing GM rice.
The implications of the commercialization of GM rice, should China decide to
so, could far exceed the effect on its own producers and consumer. Paarlberg (2003)
suggests that if China were to commercialize a major crop, such as rice, it is possible

23
that it would set off a chain reaction in the world. For example, if China were to
commercialize rice, it possibly would clear the way for the extension of GM wheat,
maize and other crops inside China. If China proceeded in this direction, this could
encourage the large grain producing nations, such as Canada, the US and Australia, to
continue to expand their programs in GM wheat and other crops, since China is a likely
target for their exports in the future. In addition, the commercialization of rice and
other crops may induce other developing countries, such as India or Vietnam, to expand
their plant biotechnology programs. On the one hand other developing countries might
follow China in an effort to remain competitive. On the other hand, with a clear
precedent, other leaders might be willing to adopt GM food crops to increase the
income of their farmers as well as to improve their health. It is in this very real sense
that the future of GM rice in China may have an important influence on the future of
GM crops in the world.
24
References
Antle, J. M., P. L. Pingali. Pesticides, farmer health and productivity: A Philippine case
study. American Journal of Agricultural Economics 76, 418-30(1994).
Borlaug, N.E. The green revolution revised and the road ahead. Special 30th
Anniversary Lecture. The Norwegian Nobel Institute, Oslo, September 8, 2000.
Byerlee, D., Heisey, P. & Pingali, P. L. in Food Needs of the Developing World in the
Early Twenty First Century 207–250 (Pontifical Academy of Sciences, Vatican City,
2000).
Barker, R., Herdt, R.W & Rose, B. Rice Economy of Asia (Resources For the Future,
Inc., Washington DC and International Rice Research Institute, Las Banos, Laguna,
Philippines, 1985).
Evenson, R.E., R.W. Herdt and M. Hossain. Rice Research in Asia: Progress and
Priorities. CAB International. Wallingford. 1996.
Hossain, F., C. E. Pray, Y. Lu, J. Huang, C. Fan, R. Hu. GM cotton and farmer’s health
in China: an econometric analysis of the relationship between pesticide poisoning
and GM cotton use in China. International Journal of Occupational and
Environmental Health. Vol.10(2004) pp 307-314.
Huang, J., F. Qiao, L. Zhang, S. Rozelle, Farm Pesticide, Rice Production, and the
environment, EEPSEA Research Report 2001-RR3. IDRC, Singapore.
25
Huang, J., R. Hu , H. van Meijl, F.van Tongeren. Biotechnology Boosts to Crop
Productivity in China: Trade and Welfare Implications, Journal of Development
Economics, Vol.75(2004):27-54.
Huang, J., R. Hu, C. Pray, F. Qiao, S. Rozelle. Biotechnology as an Alternative to
Chemical Pesticides: A Case Study of Bt Cotton in China, Agricultural Economics,
29(2003) 55-67.
Huang, J., S. D. Rozelle, C. E. Pray, Q. Wang. Plant Biotechnology in China, Science,
Vol. 295, 25 January 2002: 674-677.
Lichtenberg, E., and D. Zilberman. The Econometrics of Damage Control: Why
Specification Matters. American Journal of Agricultural Economics 68(1986):261-
73.
James, Clive. Global Status of Commercialized Biotech/GM Crops:2005. ISAAA Briefs
32. 2005. Ithaca, NY.
James, Clive. Global Status of Commercialized Biotech/GM Crops:2004. ISAAA Briefs
34. 2004. Ithaca, NY.
Jin, J. Huang, R. Hu. S. D. Rozelle. The creation and spread of technology and total
factor productivity in China. American Journal of Agricultural Economics,
84(4)(November 2002): 916-930.
Lin, J.. Impact of hybrid rice on input demand and productivity, Agricultural Economics
Vol 10, No. 2, 165-178, April 1994.
26
MOA [Ministry of Agriculture], 2002. Agricultural Yearbook of China, 2002. China’s
Agricultural Press, Beijing.
MOA [Ministry of Agriculture], 2005. The Office of Agricultural Transgenic Biosafety
Management. Collection of Laws and Regulations on Agricultural Transgenic
Biosafety Management, China’s Agricultural Press, Beijing.
NCBED (National Centre of Biological Engineering Development). The Research
Progress in Biotechnology. Biological Engineering Progress, Vol. 20, Special Issue,
2000.
Paarlberg, R.. Reinvigorating Genetically Modified Crops, Issues In Science and
Technology, Spring 2003. [www.issues.org/issues/19.3/paarlberg.htm]
Pingali, P. L. and G. A. Carlson. 1985. Human capital, adjustments in subjective
probabilities, and the demand for pest controls. American Journal of Agricultural
Economics 67, 853-861.
Pingali, P.L., M. Hossein, R.V. Gerpacio. Asian Rice Bowls, CAB International,
Wallingford, England, 1997.
Pray, C., Ma, D.M., Huang, J.K. and Qiao, F.B. 2001, Impact of Bt cotton in China,
World Development, vol. 29, pp. 813– 25.
Rosegrant, M. W., M. S. Paisner, S. Meijer, J. Witcover. 2001. Global Food Projections
to 2020. International Food Policy Research Institute. Washington D.C.
27
Stone, B.. 1988. Developments in Agricultural Technology. China Quarterly 116
(December): 100-124.
Tu, J., G. Zhang, K. Datta, C. Xu, Y. He, Q. Zhang, G.S. Khush, and S.K.Datta. (2000a)
Field performance of transgenic elite commercial hybrid rice expressing Bacillus
thuringiensis •-endotoxin. Nature Biotechnology. Vol.18, 1101-1104.
Tu, J., K. Datta, G.S. Khush, Q. Zhang, and S.K.Datta. (2000b) Field performance of
Xa21 transgenic indica rice (Oryza sativa L.) IR72. Theor Appl Genet. 101:15-20.
Zhang, X., J. Liu, Q. Zhao. 1999. Transfer of High Lysine-rich Gene into Maize by
Microprojectile Bombardment and Detection of Transgenic Plants. Journal of
Agricultural Biotechnology, 7 : 363-367.
Zhu, Zhen, Jikun Huang, Ruifa Hu. (2003). The GM Rice Research and the Impacts of
Commercialization in China. Report Bio-technology to the National Development
and Reform Commission, NDRC, Beijing, pp. 206-218

28
Table 1. Public research expenditures on agricultural biotechnology in China, 1986 to 2003.
Year
Total a
Plant
Rice
(million yuan, RMB, in real 2003 prices) 1986 89 51 8
1990 204 118 16 1995 273 157 26 2000 861 450 72 2003
1647
996
195
(million US dollars)
2003 (at official exchange rates) b 199 120 24
2003 (converted at PPP terms) c
953
574 115
a Total agricultural biotechnology spending includes spending on animals, plants and microorganisms. b The official RMB-US dollar exchange rate in 2003 was 8.277. c The conversion rate of RMB to the purchasing power parity (PPP) in 2003 is calculated by dividing RMB by the official RMB-US dollar exchange rate (8.277) and multiplying 4.787.
Source: Authors’ surv ey.

29
Table 2. Distribution of sample counties and villages hosted Bt rice pre-production
trials in China.
Year Number of counties and county names
Number of village and village names
Hubei province (GM Xianyou 63) 2002 3 4
Xiantao Qianqiao
Jiangxia Laowuye, Tangtu
Jingmen Xinglong
2003 5 7
Xiantao Qianqiao
Jiangxia Laowuye, Tangtu
Jingmen Xinglong
Xiangyang Huangci, Jiawan
Huangpi Xiangjazui
2004 5 11
Xiantao Qianqiao
Jiangxia Laowuye, Tangtu, Huashanwu
Jingmen Donggou
Xiangyang Quanshuiyian, Baiyun, Qinglong, Xuwan
Xiaochang Qingshui, Ergong
Fujian (GM II Youming 86) 2002 Shunchang Shixi 2003 Shunchang Shixi 2004 Shunchang Shixi 2004 Taining Nanhui
Total 8 17
Hubei 5 15 Fujian 3 2
Note: The total number of counties and villages are less than the sum of the villages from each year because the experiment teams kept some villages for more than one year during the sample period; others were added and others were dropped. The pre-production trials of GM II Youming 86 were also conducted in 4 experiment stations (three experiment stations located in Fujian, and another located in Hubei) . Observations from the experiment stations were not included in our sample as the farming operations were not operated by individual households.
30
Table 3. Sample households and the status as Bt and non-Bt rice farmers, 2002 to 2004
Year Only Bt rice Both Bt and Non-Bt Only non-Bt Total
2002 11 25 37 73 2003 16 52 36 104 2004 41 42 60 143
Total 68 119 133 320
Data Source: Authors' Survey Note: In addition to having 119 households that planted both Bt and non-Bt rice during the same year, a number of households that were included in at least two years of the survey (74 households) changed at least one of their plots from Bt to non-Bt during the years of the survey.
31
Table 4. Summary statistics of GM and non-GM rice producers in pre-production trials in China, 2002-2004.
All households GM rice a Non-GM rice
Mean Standard
deviation Mean Standard
deviation Mean Standard
deviation
Farm size (ha) 1.03 0.86 1.04 0.88 1.03 0.84
Rice share in crop area (%) 56 24 54 25 58 24
Age of household head (years) 46.8 10.1 47.5 10.9 46.4 9.6
Household head’s education (years)
7.0 2.7 7.0 2.8 7.0 2.7
Rice price (yuan/kg) 0.63 0.12 0.62 0.12 0.63 0.13
Pesticide price (yuan/kg) 15.0 14.5 12.7 15.9 16.3 13.6
Fertilizer use (kg/ha) 1331 548 1292 609 1354 509
Pesticide sprayings (times) 2.61 2.17 0.60 0.97 3.70 1.81
Cost of pesticide (yuan/ha) 192 208 45 87 275 210
Pesticide use (kg/ha) 16.1 18.3 3.0 4.9 23.5 19.0
Pesticide spray labor (days/ha) 6.9 7.8 1.4 3.4 10.1 7.8
Yield (kg/ha) 6541 1355 6688 1234 6457 1414
Number of observations (plots)
584 211 373 a GM rice includes 2 varieties, GM Xianyou 63 and GM II-Youming 86. Source: Authors’ survey.
32
Table 5. Estimated parameters f or effect of GM rice on pesticide use and rice yields using Two -Stage Least Squares and Damage Abatement Control Estimators.
Amount of pesticide use
Cobb-Douglas function
Damage control function - Weibull
Variables (kg/ha) Log (yield) Log (yield) Intercept 9.52 8.26 8.73 (1.48) (38.83)*** (39.31)*** Farmer's perception on yield loss (%) 0.05 (1.69)* Pesticide price (yuan/kg) -0.23 (3.93)*** GM rice (yes=1; no=0) -14.43 0.09 0.11 (2.69)*** (1.90)* (2.45)** 2003 year x GM rice -5.17 -0.03 -0.03 (0.83) (0.59) (1.30) 2004 year x GM rice -8.87 -0.03 0.03 (1.50) (0.53) (1.09)
Household head age (years) 0.11 0.06 0.05 (1.50) (1.35) (1.17) Education (years of attainment) -0.06 0.00 -0.01 (0.28) (0.57) (0.41) Village leader dummy ( leader=1; no=1) 1.19 -0.02 -0.02 (0.44) (0.73) (0.57) Farm size (ha) -0.78 0.04 0.04 (0.55) (2.59)** (2.54)** Natural disaster (affected=1; not affected=0) 8.87 -0.50 -0.50 (3.61)*** (16.17)*** (16.28)*** Plot size (ha) 5.89 -0.81 -0.79 (0.12) (1.06) (1.05) Plot soil quality (high quality) 0.33 0.03 0.04 (0.14) (1.00) (1.65)* Plot soil quality (medium quality) 1.21 0.04 0.03 (0.46) (1.58) (1.01) Labor (days/ha) -0.00 -0.00 (0.08) (0.12) Fertilizer (kilograms/ha) 0.04 0.04 (1.94)** (1.88)* Machine (yuan/ha) -0.00 -0.00 (0.29) (0.29) Other inputs (yuan/ha) 0.01 0.01 (1.27) (1.35) 2003 year dummy 1.86 -0.03 -0.03 (0.79) (1.20) (1.30) 2004 year dummy 8.70 0.04 0.04 (3.48)*** (1.22) (1.09)
Predicted pesticide use 0.00 (0.86) Damage control function parameter estimates e0 (pesticide parameter in Weibull model) 0.03 (1.98)** ebt (Bt variety parameter in Weibull model) -0.02 (1.77)*

33
R-square 0.52 0.42 0.42 Number of observation 584 584 584 Notes: The figures in the parentheses are t values. The symbols, ***, ** and * denote significance at 1%, 5% and 10%, respectively. The model includes 17 village dummy variables to control for village -specific effects, but the estimated coefficients are not included for brevity.
34
Table 6. Estimated parameters using a household fixed effects model for estimati ng effect of GM rice varieties on farmers' pesticide application and yields of households in preproduction trials in China.
Pesticide use (kg/ha) Yields (kg/ha) in log Variables Model I Model II Model I Model II
26.83 25.03 7.83 7.8 Intercept (12.85)*** (11.48)*** (26.65)*** (26.31)***
-19.81 -14.73 0.02 0.06 GM rice dummy (16.20)*** (6.27)*** (1.01) (1.52)
-4.86 -0.00 2003 year x GM rice (1.74)* (0.10) -8.52 -0.04 2004 year x GM rice (2.89)*** (0.82)
-0.27 -0.26 Pesticide price (yuan/kg) (4.49)*** (4.26)***
6.59 7.26 -0.53 -0.53 Natural disaster dummy (affected=1) (2.27)** (2.51)** (11.59)*** (11.48)***
1.33 0.88 -0.00 -0.00 Plot size (ha) (0.51) (0.34) (0.09) (0.03) -4.11 -3.52 0.02 0.03 Plot soil quality (high quality)
(1.92)* (1.65)* (0.74) (0.80) -3.06 -2.85 0.02 0.03 Plot soil quality (medium quality) (1.39) (1.32) (0.73) (0.78) 0.19 1.61 -0.05 -0.05 2003 year dummy
(0.14) (1.01) (2.30)** (1.89)* 5.84 8.43 0.03 0.04 2004 year dummy
(3.02)*** (3.98)*** (0.97) (1.15) 0.09 0.09 Labor (log) (2.02)** (2.11)** 0.07 0.06 Fertilizer (log) (1.60)* (1.53) 0.00 0.00 Machine (log) (0.71) (0.81) 0.02 0.02 Other inputs (log) (2.27)** (2.33)** -0.00 0.00 Pesticides (log) (0.97) (0.22)
Household Dummy Variables Included but not reported
Number of observations 584 584 584 584 Notes: Parameters in the parentheses ar e t values. The symbols, ***, ** and * denote significance at 1%, 5% and 10%, respectively. Data are from authors’ survey.

35
Table 7. The effect of GM rice use on the health effects of farmers in sample pre-production village sites in China, 2002 and 2003.
Planted both GM and non-GM rice Planted GM rice
only GM plot Non-GM Plot
Planted non-GM rice only
2002 0 0 7.7 8.3
2003 0 0 10.9 3.0
2004 0 0 8.3 5.0
Source: Authors’ survey.