
Review Article Oxidative Stress and Metabolic Syndrome: Cause or Consequence of Alzheimer's Disease
Upload
khangminh22Category
view
4download
0
Page 1/20
Oxidative Stress Induction By Pesticides May Cause Lung Cancer IncidenceGholamreza Asadikaram
Kerman University of Medical SciencesHossein Pourghdamyari
Kerman University of Medical SciencesMoslem Abolhassani ( [email protected] )
Kerman University of Medical SciencesMojtaba Abbasi-Jorjandi
Kerman University of Medical SciencesSanaz Faramarz
Kerman University of Medical SciencesFatemeh Youse�
Kerman University of Medical SciencesFouzieh Salimi
Kerman University of Medical SciencesReza Malekpour Afshar
Kerman University of Medical SciencesParisa Asadikaram
Shiraz University of Medical SciencesMohsen Sha�epour
Kerman University of Medical Sciences
Research Article
Keywords: Acetylcholinesterase, Lung Cancer, Organochlorine, Organophosphorous Oxidative stress
Posted Date: January 3rd, 2022
DOI: https://doi.org/10.21203/rs.3.rs-1204945/v1
License: This work is licensed under a Creative Commons Attribution 4.0 International License. Read Full License

Page 2/20
Abstract
Background and aims:Pesticides are nowadays known as one of the most important causes of human disorders worldwide. The aim of the present study was to investigate the roleof organochlorine pesticides (OCPs) and organophosphorus pesticides (OPPs) in the development of lung cancer.
MethodsWe determined the levels of seven derived OCP residues (α-HCH, β-HCH, γ-HCH, 2,4 DDT, 4,4 DDT, 2,4 DDE, and 4,4 DDE) and enzymatic antioxidant biomarkersincluding paraoxonase-1 (PON-1), erythrocyte's acetylcholinesterase (AChE), glutathione peroxidase (GPx), superoxide dismutase (SOD), catalase (CAT), andnon-enzymatic antioxidant biomarkers including total antioxidant capacity (TAC), protein carbonyl (PC), malondialdehyde (MDA), and nitric oxide (NO) in theblood samples of 51 lung cancer patients and 51 healthy subjects as controls. Furthermore, the effects of OPP exposure on the development of lung cancerand oxidative stress (OS) are indirectly assessed by measuring AChE and PON-1 enzyme activities.
ResultsThe average values of all the measured OCPs were signi�cantly higher in lung cancer patients when compared with healthy control subjects. AChE, PON-1,GPx, and CAT activity levels as well as the amounts of PC, MDA, and NO were higher in patients with lung cancer than in the control subjects, while TAC valueswere lower in the patients. Moreover, our data showed a signi�cant association between OCP concentrations and OS parameters.
ConclusionThe results suggest that OCPs and OPPs may have a role in lung cancer incidence in southeastern Iran, and at least one of the mechanisms by which OCPsand OPPs may contribute to increasing the development of lung cancer in the studied area is through OS generation.
IntroductionIn the world’s population, one of the most common cancers is lung cancer, which is the prominent reason for mortality (Basumallik & Agarwal, 2019). It haseven been reported that lung cancer in comparison to breast cancer may cause more deaths in women (Siddiqui & Siddiqui, 2019; Siegel et al., 2016). Basedon yearly epidemiological studies, over 200,000 new cases of lung cancer were recently diagnosed in the United States (Basumallik & Agarwal, 2019;Rybarczyk-Kasiuchnicz & Ramlau, 2018). Indeed, the number of patients with lung cancer will increase exponentially without urgent action. In other words, thisdisease is transforming into a major health problem (Mao et al., 2016). Despite recent advances in cancer diagnosis and treatment (Mardani et al., 2019;Mirzaei et al., 2018), this illness is still one of the major challenges in medical science (Tahmasebi-Birgani et al., 2019). Thus, to combat cancer as a seriousdisease, the best strategy is control and prevention (Cramb et al., 2015). Notably, the etiology and pathophysiology of lung cancer are not fully elucidated.Therefore, identifying risk factors for lung cancer is critical in preventing and controlling the disease. However, in recent years, accumulated evidence hasshown that environmental and lifestyle factors contribute to the development of lung cancer. These factors include tobacco smoking (Miranda-Filho et al.,2019), family history (Cannon-Albright et al., 2019), sex (Boice Jr et al., 2019), obesity (Yang et al., 2013), alcohol (Wei et al., 2018), and environmentalchemicals (Luo et al., 2011).
Moreover, it has been proven that there is a direct relationship between exposure to pesticides and cancer. In this regard, investigators have found thatpesticides, as environmental chemicals, increase the vulnerability to cancer. Pesticides have been widely used in various �elds, especially in agriculture toeliminate insects, weeds, and fungi in order to improve agricultural products in terms of quality and quantity (Jayaraj et al., 2016).
A growing interest has been recently attracted to the main groups of pesticides including organochlorines (OCPs) and organophosphates (OPPs) as riskfactors for cancer (Martin et al., 2018; Peppers, 2019). Our previous studies have shown that OCPs and OPPs, as new environmental risk factors, canpredispose individuals to cancers such as breast (Paydar et al., 2019), bladder (Mortazavi et al., 2019b), and colorectal cancer (Abolhassani et al., 2019).
DDT and its derivatives, hexachlorocyclohexane (HCH) and chlorinated cyclodiene, are three members of the OCP family that have a long half-life and are hardto break down in the environment and foods (Paydar et al., 2019; Pirsaheb et al., 2015). Due to their high accumulation and persistence in the body, the use ofOCP family pesticides has been banned since the 1980s (He et al., 2017; Paydar et al., 2019). Moreover, it has been proven that OCP accumulation in theanimal and human body for a long time can induce oxidative stress (OS), which leads to oxidant-antioxidant imbalance as well as disruption of cellularsignaling (Bhardwaj et al., 2018; Singh et al., 2016). Previous studies have shown that OS is closely related to numerous diseases such as cancer,cardiovascular diseases, and diabetes (Abolhassani et al., 2019; Lima et al., 2019; Moohebati et al., 2011).
OPPs are volatile pesticides that contain phosphorus in their structure (Deng et al., 2015). A remarkable number of studies have demonstrated that OPPs areable to decrease acetylcholinesterase (AChE) activity through binding to the enzyme active site and phosphorylating it. Therefore, OPPs can exert perniciousand pervasive in�uences on the cholinergic system (Rui et al., 2018; Valdez et al., 2019). Due to the volatility of these compounds, it is di�cult to measurethem directly. Accordingly, the evaluation of AChE activity in red blood cells (RBCs) is broadly used to assess exposure to OPPs and OCPs (Majidi et al., 2018).
Since Kerman Province is the leading agricultural hub of southeastern Iran, there is an increasing concern about myriad potential biological activities and theside effects of these extensively used pesticides (Hadian et al., 2019; Rezaeigolestani & Hashemi, 2018). Moreover, in previous studies, we have shown a high

Page 3/20
degree of contamination by OCPs and OPPs in cancer patients (Abolhassani et al., 2019; Mortazavi et al., 2019b; Paydar et al., 2019) in Kerman Province.
The aim of this study was to evaluate the serum OCP levels (including α-HCH, β-HCH, γ-HCH, 2,4 DDE, 4,4 DDE, 2,4 DDT, and 4,4 DDT) in lung cancer andhealthy subjects in southeastern Iran to assess whether lung cancer risk can be related to serum OCP and OPP levels. To this end, we also investigated theeffects of OPPs and OCPs on OS status in lung cancer and healthy subjects via the evaluation and comparison of non-enzymatic antioxidants, including nitricoxide (NO), malondialdehyde (MDA), and protein carbonyl (PC), and antioxidant enzyme activities, including catalase (CAT), superoxide dismutase (SOD), andglutathione peroxidase (GPx) activities, along with the activity of paraoxonase-1 (PON-1) and AChE in the lung cancer patients and control subjects.
Materials And Methods
Samples and data collectionThe current case-control study was conducted on 51 patients newly diagnosed with lung cancer in Afzalipoor Hospital of Kerman University of MedicalSciences, Kerman, Iran (July 2017-May 2019). The control group included 51 healthy individuals with no evidence of any disease. The diagnosis of lungcancer was established by a lung imaging �uorescence endoscope device and whole-body positron emission tomographic imaging.
All of the participants (male and female) in this study were newly diagnosed. In addition, none of them had a history of chronic and autoimmune diseases,alcohol consumption, or hormone therapy, and they were not using any vitamin and iron supplementations. All participants signed a written consent form andthe patient’s refusal to participate in the study was one of the exclusion criteria. Moreover, patients who had a history of exposure to ionizing radiation or thosewho were consuming vitamin and iron supplementations were excluded from the study.
The participants in the control group had no history of cancer or acute and chronic diseases based on clinical records, lung imaging �uorescence endoscopy,and whole-body positron emission tomographic imaging. Moreover, they were not taking antioxidant supplements, smoking, or consuming alcohol. In thepresent study, patients were matched to controls based on smoking. The Declaration of Helsinki was used as the cornerstone document for instructing theethical standards to physicians and participants. The research was approved by the ethics board of Kerman University of Medical Sciences (Code No:IR.KMU.REC.1398.335).
A questionnaire was used to collect the demographic data. First, 10 mL of venous blood was collected from the participants. Then 0.5 mL of the blood samplewas transferred to EDTA tubes (to measure AChE) and the remnants were transferred to tubes without anti-coagulation substances. Next, the serum wasseparated via centrifugation (10 min at 3000 rpm). The serum samples were transmitted to a sterile sample tube holder and were kept at −70°C until furtheranalysis.
Biochemical parametersTotal cholesterol (TC), triglyceride (TG), and high-density lipoprotein-cholesterol (HDL-C) serum levels were measured by standard kits (Pars Azmoon, Tehran,Iran) using an autoanalyzer (Selectra-XL, Vital Science; Netherlands) in a standard laboratory setting. The levels of low-density lipoprotein-cholesterol (LDL-C)were determined by the Friedewald equation (Friedewald et al., 1972).
Measurement of erythrocyte AChE activityHyamine 1622, acetylcholine iodide, and 5, 5-dithio-bis-2-nitrobenzoic acid (DTNB) were obtained from Sigma (Saint Louis, MO, USA). Ellman’s modi�edprocedure was used to calculate AChE activity in the erythrocytes of all samples (Worek et al., 1999) as described elsewhere (Abolhassani et al., 2019;Mortazavi et al., 2019a; Paydar et al., 2018). First, 6 mL of distilled water was used to dilute 100 µL of erythrocytes which were washed by normal saline. Next,the reaction buffer (containing 0.28 mmol DTNB, 3.2 mmol acetylcholine iodide, and 20 µM quinidine sulfate) was used to incubate 100 µL of the dilutedsample at 37°C for 10 min. Finally, to stop the reaction, 1 mL of Hyamine 1622 was added to the solution. 5-thio-2-nitrobenzoic acid (with maximumabsorbance at 440 nm) was the product of the reaction between thiocholine and the chromophore DTNB (Worek et al., 1999).
Assessment of the arylesterase activity of PON-1Phenylacetate (a substrate of arylesterase activity) was purchased from Sigma Chemical Co. (Saint Louis, MO, USA). Serum arylesterase activity of PON-1was calculated based on the procedure suggested by Bobin-Dubigeon et al. (2012) as described elsewhere (Abolhassani et al., 2019; Mortazavi et al., 2019b;Paydar et al., 2018). First, the rate of phenylacetate hydrolysis was assessed in order to determine arylesterase activity. Afterward, the substrate (2 mMphenylacetate), 2 mM CaCl2 (Merck, Darmstadt, Germany), and 10 µL of serum in 100 mM Tris-HCl (Merck, Darmstadt, Germany) (pH = 8.0) were used toprepare the reaction mixture. The incubation process of the mixture was performed for 3 min at 37°C. Finally, the level of phenylacetate hydrolysis wasevaluated at 270 nm.
Measurement of MDAMDA is a compound that can be evaluated as a lipid peroxidation index. The thiobarbituric acid (TBA) assay is used for evaluating this substance asdescribed elsewhere (Abolhassani et al., 2019; Mortazavi et al., 2019b; Paydar et al., 2018). In the presence of the trichloroacetic acid (TCA)-TBA-hydrochloricacid (HCL) reagent, MDA reacts with TBA and produces a pink color. To perform the assay, 200 µL of the solution buffer was added to 100 µL of serum andthe absorbance was measured at 535 nm (Buege & Aust, 1978).
Total antioxidant capacity (TAC) assayThe procedure suggested by Benzie and Strain (1996) was used to evaluate the ferric-reducing ability of plasma (FRAP) (Benzie & Strain, 1996). Plasma iscapable of reducing ferric tripyridyltriazine (Fe III–TPTZ) complex to an intense blue-colored ferrous (Fe II) form at low pH. The maximum absorbance of this
Page 4/20
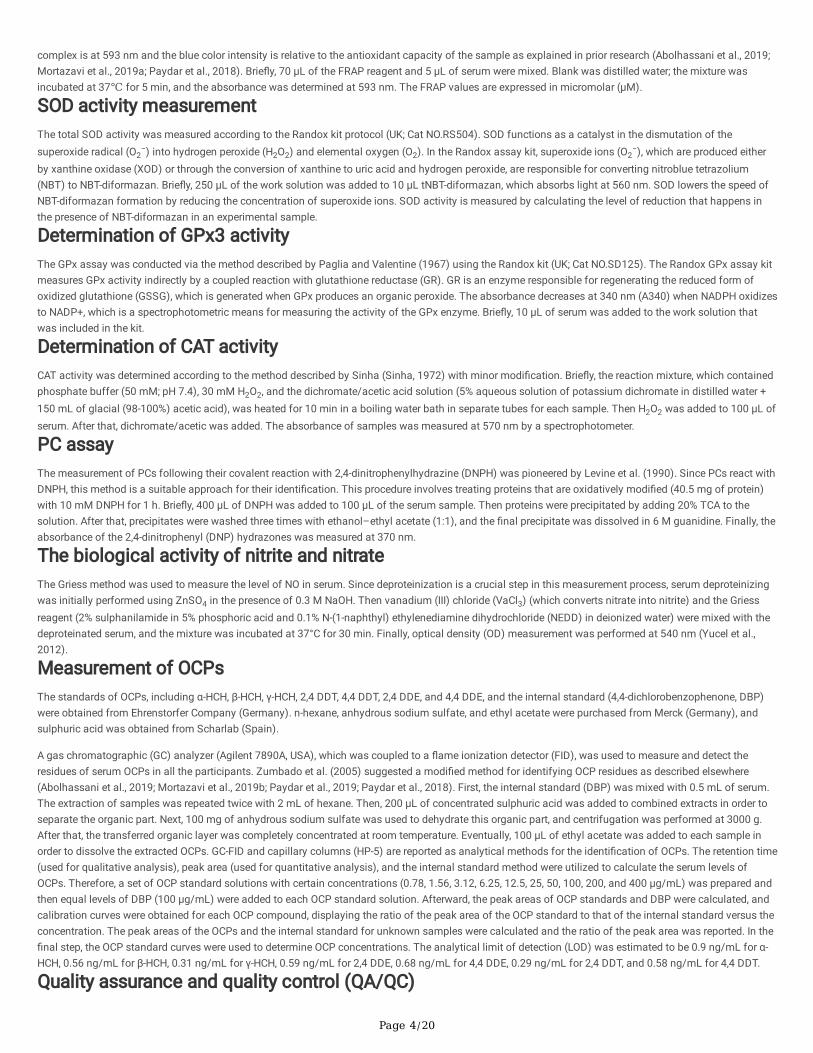
complex is at 593 nm and the blue color intensity is relative to the antioxidant capacity of the sample as explained in prior research (Abolhassani et al., 2019;Mortazavi et al., 2019a; Paydar et al., 2018). Brie�y, 70 µL of the FRAP reagent and 5 µL of serum were mixed. Blank was distilled water; the mixture wasincubated at 37℃ for 5 min, and the absorbance was determined at 593 nm. The FRAP values are expressed in micromolar (µM).
SOD activity measurementThe total SOD activity was measured according to the Randox kit protocol (UK; Cat NO.RS504). SOD functions as a catalyst in the dismutation of thesuperoxide radical (O2
−) into hydrogen peroxide (H2O2) and elemental oxygen (O2). In the Randox assay kit, superoxide ions (O2−), which are produced either
by xanthine oxidase (XOD) or through the conversion of xanthine to uric acid and hydrogen peroxide, are responsible for converting nitroblue tetrazolium(NBT) to NBT-diformazan. Brie�y, 250 µL of the work solution was added to 10 µL tNBT-diformazan, which absorbs light at 560 nm. SOD lowers the speed ofNBT-diformazan formation by reducing the concentration of superoxide ions. SOD activity is measured by calculating the level of reduction that happens inthe presence of NBT-diformazan in an experimental sample.
Determination of GPx3 activityThe GPx assay was conducted via the method described by Paglia and Valentine (1967) using the Randox kit (UK; Cat NO.SD125). The Randox GPx assay kitmeasures GPx activity indirectly by a coupled reaction with glutathione reductase (GR). GR is an enzyme responsible for regenerating the reduced form ofoxidized glutathione (GSSG), which is generated when GPx produces an organic peroxide. The absorbance decreases at 340 nm (A340) when NADPH oxidizesto NADP+, which is a spectrophotometric means for measuring the activity of the GPx enzyme. Brie�y, 10 µL of serum was added to the work solution thatwas included in the kit.
Determination of CAT activityCAT activity was determined according to the method described by Sinha (Sinha, 1972) with minor modi�cation. Brie�y, the reaction mixture, which containedphosphate buffer (50 mM; pH 7.4), 30 mM H2O2, and the dichromate/acetic acid solution (5% aqueous solution of potassium dichromate in distilled water +150 mL of glacial (98-100%) acetic acid), was heated for 10 min in a boiling water bath in separate tubes for each sample. Then H2O2 was added to 100 µL ofserum. After that, dichromate/acetic was added. The absorbance of samples was measured at 570 nm by a spectrophotometer.
PC assayThe measurement of PCs following their covalent reaction with 2,4-dinitrophenylhydrazine (DNPH) was pioneered by Levine et al. (1990). Since PCs react withDNPH, this method is a suitable approach for their identi�cation. This procedure involves treating proteins that are oxidatively modi�ed (40.5 mg of protein)with 10 mM DNPH for 1 h. Brie�y, 400 µL of DNPH was added to 100 µL of the serum sample. Then proteins were precipitated by adding 20% TCA to thesolution. After that, precipitates were washed three times with ethanol–ethyl acetate (1:1), and the �nal precipitate was dissolved in 6 M guanidine. Finally, theabsorbance of the 2,4-dinitrophenyl (DNP) hydrazones was measured at 370 nm.
The biological activity of nitrite and nitrateThe Griess method was used to measure the level of NO in serum. Since deproteinization is a crucial step in this measurement process, serum deproteinizingwas initially performed using ZnSO4 in the presence of 0.3 M NaOH. Then vanadium (III) chloride (VaCl3) (which converts nitrate into nitrite) and the Griessreagent (2% sulphanilamide in 5% phosphoric acid and 0.1% N-(1-naphthyl) ethylenediamine dihydrochloride (NEDD) in deionized water) were mixed with thedeproteinated serum, and the mixture was incubated at 37°C for 30 min. Finally, optical density (OD) measurement was performed at 540 nm (Yucel et al.,2012).
Measurement of OCPsThe standards of OCPs, including α-HCH, β-HCH, γ-HCH, 2,4 DDT, 4,4 DDT, 2,4 DDE, and 4,4 DDE, and the internal standard (4,4-dichlorobenzophenone, DBP)were obtained from Ehrenstorfer Company (Germany). n-hexane, anhydrous sodium sulfate, and ethyl acetate were purchased from Merck (Germany), andsulphuric acid was obtained from Scharlab (Spain).
A gas chromatographic (GC) analyzer (Agilent 7890A, USA), which was coupled to a �ame ionization detector (FID), was used to measure and detect theresidues of serum OCPs in all the participants. Zumbado et al. (2005) suggested a modi�ed method for identifying OCP residues as described elsewhere(Abolhassani et al., 2019; Mortazavi et al., 2019b; Paydar et al., 2019; Paydar et al., 2018). First, the internal standard (DBP) was mixed with 0.5 mL of serum.The extraction of samples was repeated twice with 2 mL of hexane. Then, 200 µL of concentrated sulphuric acid was added to combined extracts in order toseparate the organic part. Next, 100 mg of anhydrous sodium sulfate was used to dehydrate this organic part, and centrifugation was performed at 3000 g.After that, the transferred organic layer was completely concentrated at room temperature. Eventually, 100 µL of ethyl acetate was added to each sample inorder to dissolve the extracted OCPs. GC-FID and capillary columns (HP-5) are reported as analytical methods for the identi�cation of OCPs. The retention time(used for qualitative analysis), peak area (used for quantitative analysis), and the internal standard method were utilized to calculate the serum levels ofOCPs. Therefore, a set of OCP standard solutions with certain concentrations (0.78, 1.56, 3.12, 6.25, 12.5, 25, 50, 100, 200, and 400 µg/mL) was prepared andthen equal levels of DBP (100 µg/mL) were added to each OCP standard solution. Afterward, the peak areas of OCP standards and DBP were calculated, andcalibration curves were obtained for each OCP compound, displaying the ratio of the peak area of the OCP standard to that of the internal standard versus theconcentration. The peak areas of the OCPs and the internal standard for unknown samples were calculated and the ratio of the peak area was reported. In the�nal step, the OCP standard curves were used to determine OCP concentrations. The analytical limit of detection (LOD) was estimated to be 0.9 ng/mL for α-HCH, 0.56 ng/mL for β-HCH, 0.31 ng/mL for γ-HCH, 0.59 ng/mL for 2,4 DDE, 0.68 ng/mL for 4,4 DDE, 0.29 ng/mL for 2,4 DDT, and 0.58 ng/mL for 4,4 DDT.
Quality assurance and quality control (QA/QC)

Page 5/20
QA/QC was maintained to ensure the accurate quanti�cation of OCPs. All the samples were analyzed in triplicate, as well as �eld blanks and equipmentblanks. All the reported analytical results are the average of three values so that method performance can be evaluated. In this regard, a set of pesticidestandard solutions with known concentrations (0.05, 0.1, 0.5, 0.75, 1, 2, 4, 8, 16, 25, 50, 100 µg/L) were spiked in the pooled sample, and the calibration curveswere obtained. Procedure blanks were prepared using ethyl acetate and routinely analyzed to check for inlet, column, and detector contamination duringextraction and injection processes, examine the cross-contamination, and monitor the background contamination of the instrument.
Statistical analysisMean ± standard error of the mean (SEM) are used to represent all continuous variable data and numbers (percentages) are used to represent categoricalvariables. The Kolmogorov-Smirnov test was used to assess data distribution. One-way ANOVA or Kruskal-Wallis with post-hoc Tukey and Mann-Whitney Utests, as well as the chi-square test, were used to analyze the differences between the groups. Pearson and Spearman’s rho correlation coe�cients wereemployed to manifest the correlations between continuous variables. In the present study, linear regression was carried out to determine the effects of OCPs(as independent variables) on OS development (as a dependent variable). The associations between continuous OCP concentrations and OS parameters in allplasma samples were explored using multivariable linear regression models. The associations between lung cancer development and OCPs were evaluated bythe continuous logistic regression model based on adjustments for body mass index (BMI) and total lipids. The present study assessed exposure as acategorical variable, by classifying each OCP as quartiles of exposure in the study population. For each OCP, we determined the odds ratios (OR) for lungcancer, comparing each quartile with quartile 1. SPSS software version 22.0 for Windows (SPSS Inc., Chicago, IL) was applied for the statistical analyses. P-values < 0.05 were considered statistically signi�cant. All measurements for the studied pesticides were detected above the LOD. The measurement of LODwas based on the standard deviation of the regression line and the slope of the calibration curve. Moreover, we used both wet-weight concentrations adjustedfor serum cholesterol and TG and lipid-standardized concentrations by dividing wet-weight concentrations by total lipids. Total lipids were calculated using thefollowing formula: Total lipids (mg/dL) = 2.27 × total cholesterol + TG + 62.3 (Phillips et al., 1989). In addition to the individual OCPs, we calculated the molarsums (mmol/L) of DDT and its metabolites (2,4 DDT and 4,4 DDT), PHCHs (α-HCH, β-HCH, γ-HCH), and DDE (2,4 DDE and 4,4 DDE) using a previouslyreported method (Kobrosly et al., 2014).
Results
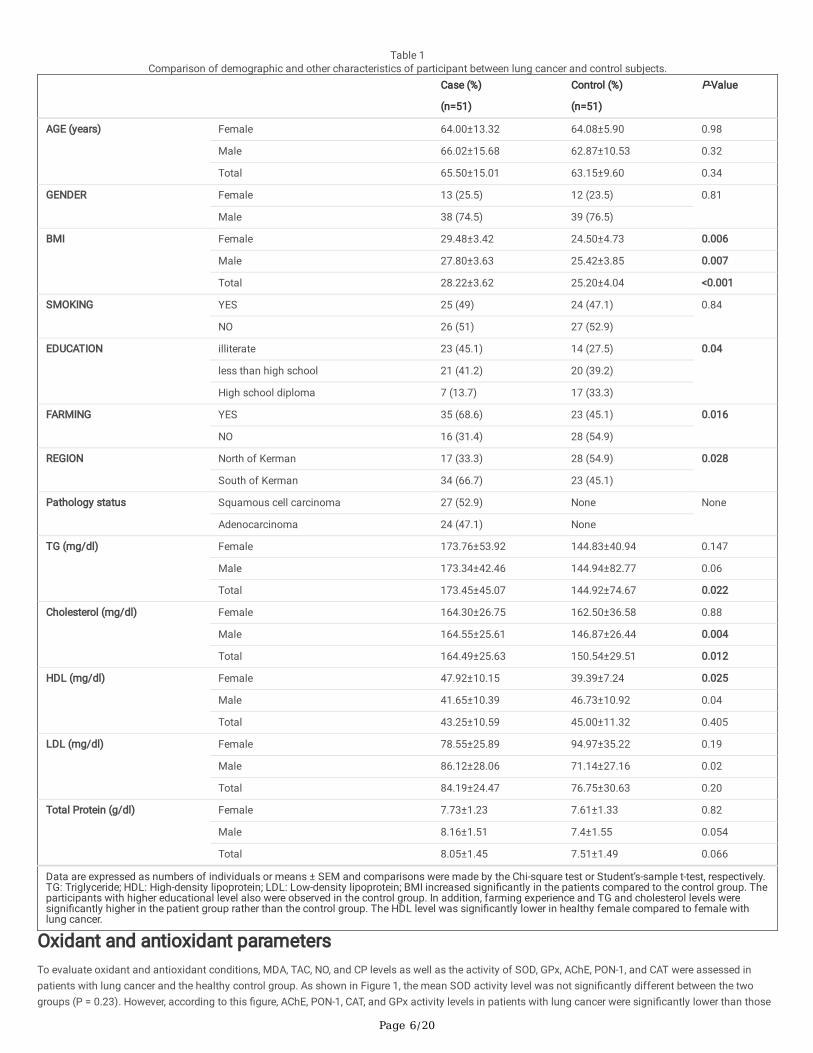
Demographic variables and clinical characteristicsThe current case-control study was performed at Afzalipoor Hospital, Kerman, Iran, from February 2018 to September 2019. The study included 51 patientswith pathologically con�rmed lung cancer and 51 healthy individuals as the case and control groups, respectively. Notably, the two groups were matched interms of age and gender. The mean age of the participants was 65.50 ± 15.01 years for the lung cancer group and 63.15 ± 9.60 years for the control group,which did not differ signi�cantly. In the lung cancer group, there were 38 male subjects (74.5%) and 13 female subjects (25.5%). There were 39 male subjects(76.5%) and 12 female subjects (23.5%) in the control group. Sociodemographic variables and clinical features of the study participants are shown in Table 1.About 49% of the participants were current smokers; 51.02% (25 out of 51) of the lung cancer patients and 48.98% (24 out of 51) of the control patients werecurrently smoking. A total of 58 individuals were active in the agricultural sector (farming), including 35 (60.34%) subjects with lung cancer and 23 (39.66%)subjects in the control group. As shown in Table 1, BMI (P = 0.001), education (P = 0.04), farming (P = 0.016), living region (P = 0.028), TG levels (P = 0.022),and cholesterol levels (P = 0.012) in patients with lung cancer indicated signi�cant differences compared to the control group. Other sociodemographicvariables and clinical characteristics, such as smoking, HDL-C, LDL-C, and total protein, did not show any signi�cant differences between patients with lungcancer and the control group. In addition, clinical and sociodemographic parameters were separately compared between men and women in the two groups(Table 1).
Page 6/20
Table 1Comparison of demographic and other characteristics of participant between lung cancer and control subjects.
Case (%)
(n=51)
Control (%)
(n=51)
P-Value
AGE (years) Female 64.00±13.32 64.08±5.90 0.98
Male 66.02±15.68 62.87±10.53 0.32
Total 65.50±15.01 63.15±9.60 0.34
GENDER Female 13 (25.5) 12 (23.5) 0.81
Male 38 (74.5) 39 (76.5)
BMI Female 29.48±3.42 24.50±4.73 0.006
Male 27.80±3.63 25.42±3.85 0.007
Total 28.22±3.62 25.20±4.04 <0.001
SMOKING YES 25 (49) 24 (47.1) 0.84
NO 26 (51) 27 (52.9)
EDUCATION illiterate 23 (45.1) 14 (27.5) 0.04
less than high school 21 (41.2) 20 (39.2)
High school diploma 7 (13.7) 17 (33.3)
FARMING YES 35 (68.6) 23 (45.1) 0.016
NO 16 (31.4) 28 (54.9)
REGION North of Kerman 17 (33.3) 28 (54.9) 0.028
South of Kerman 34 (66.7) 23 (45.1)
Pathology status Squamous cell carcinoma 27 (52.9) None None
Adenocarcinoma 24 (47.1) None
TG (mg/dl) Female 173.76±53.92 144.83±40.94 0.147
Male 173.34±42.46 144.94±82.77 0.06
Total 173.45±45.07 144.92±74.67 0.022
Cholesterol (mg/dl) Female 164.30±26.75 162.50±36.58 0.88
Male 164.55±25.61 146.87±26.44 0.004
Total 164.49±25.63 150.54±29.51 0.012
HDL (mg/dl) Female 47.92±10.15 39.39±7.24 0.025
Male 41.65±10.39 46.73±10.92 0.04
Total 43.25±10.59 45.00±11.32 0.405
LDL (mg/dl) Female 78.55±25.89 94.97±35.22 0.19
Male 86.12±28.06 71.14±27.16 0.02
Total 84.19±24.47 76.75±30.63 0.20
Total Protein (g/dl) Female 7.73±1.23 7.61±1.33 0.82
Male 8.16±1.51 7.4±1.55 0.054
Total 8.05±1.45 7.51±1.49 0.066
Data are expressed as numbers of individuals or means ± SEM and comparisons were made by the Chi-square test or Student’s-sample t-test, respectively.TG: Triglyceride; HDL: High-density lipoprotein; LDL: Low-density lipoprotein; BMI increased signi�cantly in the patients compared to the control group. Theparticipants with higher educational level also were observed in the control group. In addition, farming experience and TG and cholesterol levels weresigni�cantly higher in the patient group rather than the control group. The HDL level was signi�cantly lower in healthy female compared to female withlung cancer.
Oxidant and antioxidant parametersTo evaluate oxidant and antioxidant conditions, MDA, TAC, NO, and CP levels as well as the activity of SOD, GPx, AChE, PON-1, and CAT were assessed inpatients with lung cancer and the healthy control group. As shown in Figure 1, the mean SOD activity level was not signi�cantly different between the twogroups (P = 0.23). However, according to this �gure, AChE, PON-1, CAT, and GPx activity levels in patients with lung cancer were signi�cantly lower than those

Page 7/20
in the control subjects (P < 0.001, P < 0.001, P = 0.001, and P < 0.005, respectively). Similarly, the results showed a signi�cant decrease in TAC values inpatients with lung cancer compared to healthy control subjects (P < 0.001). Moreover, Figure 1 shows the comparison of oxidant and antioxidant parametersbetween men and women in the two groups separately. As observed, the mean GPx activity level was not signi�cantly different between the femaleparticipants of the two groups (P = 0.28). In addition, Figure 1 indicates that the mean PC, MDA, and NO concentrations were statistically higher in lung cancerpatients compared to the healthy controls (P < 0.001 for the three comparisons).
OCPsGas chromatography was used to measure the level of seven OCP derivatives including 2,4 DDE, 2,4 DDT, 4,4 DDT, 4,4 DDE, α-HCH, β-HCH, and γ-HCH inpatients with lung cancer and healthy controls. As shown in Table 2, the mean levels of all OCPs were signi�cantly higher in patients with lung cancer incomparison with healthy control subjects (P < 0.001 for all comparisons). Table 2 also compares the summation of HCH, DDE, and DDT subtypes as well asthe summation of all OCP concentrations between men, women, and all the subjects of both groups separately.

Page 8/20
Table 2The OCPs (ng/ml and ng/g lipid) levels in lung cancer and controls.
Groups
Parameters
LOD(ng/ml)
Measured Above LODNumber (%)
Case (51) Median
(Min-Max)
Control (51) Median
(Min-Max)
P-value
Mean ± SEM (ng/ml) Mean ± SEM (ng/ml)(ng/glipid)
α-HCH(ng/ml)
Male
Female
Total
0.90 92 (90.19) (1.34±0.34)(37.35±2.94)
(2.28±0.18)(22.37±5.90)
(2.04±0.17)(33.53±2.78)
2.44 (0.01-4.05)
1.12 (0.01-3.36)
2.36 (0.01-4.05)
(0.88±0.12) (20.48±1.94)
(1.03±0.49) (15.21±2.26)
(1.00±0.06) (19.24±1.60)
1.14 (0.01-2.10)
1.01 (0.01-1.45)
1.04 (0.01-2.10)
<0.001
β-HCH(ng/ml)
Male
Female
Total
0.56 90 (88.23) (1.59±0.42)(46.42±3.82)
(2.79±0.19)(25.11±6.93)
(2.47±0.19)(40.99±3.56)
2.96 (0.01-6.19)
1.01 (0.01-3.49)
2.89 (0.01-6.19)
(0.58±0.1) (16.732±1.34)
(0.86±0.05) (9.78±1.58)
(0.79±0.05) (15.10±1.16)
0.96 (0.01-1.31)
0.45 (0.01-1.04)
0.93 (0.01-1.31)
<0.001
γ-HCH(ng/ml)
Male
Female
Total
0.31 87 (85.29) (1.11±0.36)(34.97±2.64)
(2.14±0.15)(18.19±5.91)
(1.88±0.16)(30.69±2.65)
2.22 (0.01-4.50)
0.02 (0.01-3.62)
2.14 (0.01-4.50)
(0.52±0.12) (18.25±1.58)
(0.93±0.06) (8.44±1.91)
(0.84±0.06) (15.94±1.41)
1.13 (0.01-1.47)
0.30 (0.01-1.23)
0.96 (0.01-1.47)
<0.001
HCH
Male
Female
Total
(2.84 ± 0.94)(40.83±2.72)
(1.37 ± 1.26)(22.58±5.84)
(2.20 ± 1.13)(36.18±2.72)
2.65 (0.01-4.33)
0.7 (0.01-2.99)
2.60 (0.01-4.33)
(0.97 ± 0.05)(19.07±1.49)
(0.68 ± 0.08)(11.49±1.24)
(0.90 ± 0.05)(17.29±1.25)
1.07 (0.05-1.48)
0.70 (0.2-1.11)
0.97 (0.05-1.48)
2,4-DDE(ng/ml)
Male
Female
Total
0.59 89 (87.25) (2.77 ± 0.24)(46.72±4.85)
(1.77 ± 0.36)(28.56±5.62)
(2.51 ± 0.21)(42.09±4.02)
2.73 (0.01-8.52)
2.03 (0.01-4.42)
2.58 (0.01-8.52)
(1.20 ± 0.11)(22.68±2.36)
(0.90 ± 0.18)(15.79±3.66)
(1.18 ± 0.08)(21.06±2.02)
1.23 (0.01-2.89)
0.92 (0.01-2.01)
1.12 (0.01-2.89)
<0.001
4,4-DDE(ng/ml)
Male
Female
Total
0.68 84 (82.35) (4.02 ± 0.23)(65.36±3.87)
(1.70 ± 0.53)(27.91±8.71)
(3.43 ± 0.26)(55.81±4.27)
4.54 (0.44-6.75)
0.74 (0.01-4.63)
4.24 (0.01-6.75)
(1.28 ± 0.08)(24.92±2.07)
(0.87 ± 0.18)(14.36±2.77)
(1.18 ± 0.08)(22.44±1.81)
1.45 (0.01-2.11)
0.81 (0.01-1.74)
1.42 (0.01-2.11)
<0.001
DDE
Male
Female
Total
(2.33 ± 0.63)(38.54±1.99)
(1.19 ± 0.75)(19.41±3.51)
(2.04 ± 0.82)(33.66±2.08)
2.41 (0.01-4.33)
1.09 (0.01-2.44)
2.31 (2.31-4.33)
(0.85 ± 0.05)(16.37±1.18)
(0.61 ± 0.1) (10.37±1.64)
(0.79 ± 0.04)(14.95±1.04)
0.92 (0.01-1.40)
0.69 (0.01-1.10)
0.87 (0.01-1.40)
Data are expressed as means ± SEM and comparisons were made by using the one-way ANOVA. There were signi�cantly higher levels of α-, β- and γ-HCH,2, 4-DDE, 2, 4-DDT and 4, 4-DDT pesticides in lung cancer as compared to the control group (P<0.001).
α-HCH: α–Hexachlorocyclohexane; β-HCH: β-Hexachlorocyclohexane; γ-HCH: γ-Hexachlorocyclohexane; 2,4-DDE: 2,4-Dichlorodiphenyldichloroethylene; 4,4-DDE: 4,4-Dichlorodiphenyldichloroethylene; 2,4-DDT: 2,4-Dichlorodiphenyltrichloroethane; 4,4-DDT: 4,4-Dichlorodiphenyltrichloroethane.

Page 9/20
Groups
Parameters
LOD(ng/ml)
Measured Above LODNumber (%)
Case (51) Median
(Min-Max)
Control (51) Median
(Min-Max)
P-value
Mean ± SEM (ng/ml) Mean ± SEM (ng/ml)(ng/glipid)
2,4-DDT(ng/ml)
Male
Female
Total
0.29 90 (88.23) (3.51 ± 0.16)(58.12±3.05)
(2.22 ± 0.49)(36.30±8.35)
(3.18 ± 0.19)(52.56±3.35)
3.87 (0.02-4.74)
2.02 (0.01-4.45
3.76 (0.01-4.74)
(1.34 ± 0.07)(26.08±1.83)
(1.11 ± 0.13)(19.02±2.23)
(1.29 ± 0.06)(24.42±1.54)
1.45 (0.01-1.93)
1.28 (0.01-1.64)
1.43 (0.01-1.93)
<0.001
4,4-DDT(ng/ml)
Male
Female
Total
0.60 86 (84.31) (4.82 ± 0.24)(80.10±5.06)
(3.50 ± 0.84)(56.43±13.29)
(4.49 ± 0.28)(74.07±5.20)
4.77 (0.02-9.38)
4.50 (0.01-6.68)
4.56 (0.01-9.38)
(1.61 ± 0.10)(31.27±2.31)
(1.51 ± 0.18)(25.44±2.49)
(1.59 ± 0.08)(29.89±1.88)
1.54 (0.01-2.97)
1.71 (0.64-2.34)
1.58 (0.01-2.97)
<0.001
DDT
Male
Female
Total
(2.87 ± 0.57)(47.53±2.16)
(1.97 ± 1.48)(31.89±6.74)
(2.64 ± 0.96)(43.54±2.50)
2.90 (0.64-4.47)
2.53 (0.01-3.60)
2.88 (0.01-4.47)
(1.01 ± 0.05)(15.72±1.29)
(0.90 ± 0.10)(15.29±1.51)
(0.99 ± 0.04)(18.67±1.07)
1.06 (0.15-1.56)
1.01 (0.22-1.29)
1.06 (0.15-1.56)
OCPs
Male
Female
Total
(7.69 ± 1.83)(126.90±6.05)
(4.53 ± 3.16)(73.89±14.60)
(6.88 ± 2.6)(113.39±6.62)
7.97 (1.65-11.87)
5.10 (0.62-8.05)
7.80 (0.62-11.87)
(2.84 ± 0.14)(55.16±3.59)
(2.20 ± 0.26)(37.16±3.75)
(2.69 ± 0.12)(50.93±3.06)
3.07 (0.21-3.90)
2.39 (0.51-3.34)
2.89 (0.21-3.90)
Data are expressed as means ± SEM and comparisons were made by using the one-way ANOVA. There were signi�cantly higher levels of α-, β- and γ-HCH,2, 4-DDE, 2, 4-DDT and 4, 4-DDT pesticides in lung cancer as compared to the control group (P<0.001).
α-HCH: α–Hexachlorocyclohexane; β-HCH: β-Hexachlorocyclohexane; γ-HCH: γ-Hexachlorocyclohexane; 2,4-DDE: 2,4-Dichlorodiphenyldichloroethylene; 4,4-DDE: 4,4-Dichlorodiphenyldichloroethylene; 2,4-DDT: 2,4-Dichlorodiphenyltrichloroethane; 4,4-DDT: 4,4-Dichlorodiphenyltrichloroethane.
The scatter dot plot was employed to more clearly depict the distribution of OCPs in patients with lung cancer and healthy control subjects (Figure 2). It isapparent from this plot that the distribution of all the OCPs in patients with lung cancer was signi�cantly higher than the healthy controls.
Correlation analysisSpearman correlation was applied to evaluate the association of the sociodemographic variables and oxidant and antioxidant parameters with OCP levels inpatients with lung cancer (Table 3 and Table 4).

Page 10/20
Table 3Overall correlation among studied parameters of OCPs exposed subjects.
AChE PON1 MDA TAC NO PC SOD3 GPx3 CAT Age BMI α-HCH β-HCH γ-HCH 2,D
AChE 1.0 0.085 -0.222 0.217 -0.280* -0.165 -0.285* 0.220 0.254 0.041 -0.346* -0.276 -0.204 -0.283* -0
PON1 - 1.0 -0.202 0.164 -0.168 -0.185 0.088 0.281* 0.305* 0.116 -0.202 -0.181 -0.320* -0.348* -0
MDA - - 1.0 0.135 0.230 0.287* 0.105 -0.246 -0.314* 0.083 0.297* 0.088 0.268 0.095 0
TAC - - - 1.0 .004 -0.164 -0.026 0.223 0.288* 0.296* -0.142 -0.310* -0.394** -0.412** -0
NO - - - - 1.0 0.396** 0.073 -0.115 -0.129 -0.074 0.324* -0.007 0.305* 0.194 0
PC - - - - - 1.0 0.052 -0.003 -0.165 -0.047 0.441** 0.158 0.261 0.327* 0
SOD3 - - - - - - 1.0 -0.271 0.035 0.126 -0.045 0.020 0.082 0.173 -0
GPx3 - - - - - - - 1.0 0.196 0.070 -0.022 -0.065 -0.337* -0.294* -0
CAT - - - - - - - - 1.0 -0.061 -0.439** -0.086 -0.261 -0.335* -0
Age - - - - - - - - - 1.0 -0.053 -0.214 -0.336* -0.009 -0
BMI - - - - - - - - - - 1.0 0.187 0.280* 0.251 0
α-HCH
- - - - - - - - - - - 1.0 0.544** 0.333* -0
β-HCH
- - - - - - - - - - - - 1.0 0.668** 0
γ-HCH
- - - - - - - - - - - - - 1.0 0
2,4DDE
- - - - - - - - - - - - - - 1
4,4DDE
- - - - - - - - - - - - - - -
2,4DDT
- - - - - - - - - - - - - - -
4,4DDT
- - - - - - - - - - - - - - -
*. Spearman correlation is signi�cant at the 0.05 level (2-tailed).
**. Spearman correlation is signi�cant at the 0.01 level (2-tailed).
Eta co-e�cient was used nominal variables.
AChE: Acetylcholinesterase; PON1: Paraoxonase1; MDA: Malondialdehyde; TAC: Total antioxidant capacity. NO: Nitric oxide; PC: Protein carbonyl; SOD3: Supeperoxidase3; CAT: Catalase; α-HCH: α-Hexachlorocyclohexane; β-HCH: β-Hexachlorocyclohexane; γ-HCH: γ-Hexachlorocyclohexane; 2,4-DDE: 2,4-DichlorodipheDichlorodiphenyldichloroethylene; 2,4-DDT: 2,4-Dichlorodiphenyltrichloroethane; 4,4-DDT: 4,4-Dichlorodiphenyltrichloroethane.

Page 11/20
Table 4Associations of OCPs with oxidative stress
α-HCH β-HCH γ-HCH 2,4 DDE 4,4 DDE 2,
Slope 95% CI P-value
Slope 95% CI P-value
Slope 95% CI P-value
Slope 95% CI P-value
Slope 95% CI P-value
S
AChE -0.26 -0.66-0.01
0.05 -0.34 -0.65--0.08
0.01 -0.32 -0.76--0.07
0.01 -0.18 -0.45-0.09
0.19 -0.34 -0.48--0.06
0.01 -0
PON1 -0.17 -3.3-0.78
0.22 -0.47 -4.61--1.39
<0.001 -0.49 -5.67--1.88
<0.001 -0.28 -3.23--0.02
0.04 -0.51 -3.6--1.27
<0.001 -0
MDA 0.11 -0.16-0.38
0.42 0.36 0.07-0.53
0.009 0.14 -0.14-0.43
0.3 0.42 0.12-0.53
0.002 0.02 -0.16-0.19
0.88 0.
TAC -0.31 -45.49--2.95
0.026 -0.40 -45.88--9.98
0.003 -0.42 -56.39--13.92
0.002 0.03 -16.07-19.9
0.83 -0.50 -38.15--12.8
<0.001 -0
NO -0.01 -0.82-0.73
0.90 0.22 -0.12-1.21
0.10 0.14 -0.39-1.23
0.30 0.32 0.10-1.29
0.022 0.10 -0.32-0.69
0.46 0.
PC 0.07 -0.19-0.33
0.58 0.32 0.03-0.48
0.022 0.36 0.09-0.61
0.008 0.35 0.06-0.46
0.011 0.24 -0.02-0.31
0.08 0.
SOD3 -0.07 -4.07-2.39
0.60 0.03 -2.55-3.14
0.83 0.04 -2.91-3.89
0.77 -0.11 -3.58-1.59
0.44 -0.06 -2.59-1.63
0.64 -0
GPx3 -0.01 -2.62-2.35
0.91 -0.22 -3.88-0.38
0.10 -0.33 -5.48--0.54
0.018 -0.03 -2.23-1.79
0.81 -0.17 -2.60-0.60
0.21 -0
CAT -0.17 -17.53-3.95
0.21 -0.31 -19.46--1.23
0.027 -0.38 -25.82--4.62
0.006 -0.13 -12.82-4.57
0.34 -0.37 -15.83--2.57
0.007 -0
AChE activity was inversely signi�cantly associated with α-HCH, β-HCH, 4,4-DDE, 2,4 DDT, and 4,4 DDT. PON1 activity was inversely signi�cantly associated wDDT. MDA was positivity signi�cantly associated with β-HCH, 2,4 DDE, and 4,4 DDT. TAC was inversely signi�cantly associated with α-HCH, β-HCH, γ-HCH, 4,4signi�cantly associated with 2,4 DDE and 2,4 DDT. PC was positivity signi�cantly related to β-HCH, γ-HCH, 2,4 DDE, and 4,4 DDT. GPx3 activity was inversely activity was inversely signi�cantly associated with β-HCH, γ-HCH, 4,4-DDE, 2,4 DDT, and 4,4 DDT.
a CI: con�dence interval; Adjusted for BMI and total lipids.
Table 3 presents the overall correlations between the studied parameters. As indicated by the results, AChE activity was negatively correlated with NO levels (r= -0.280; p < 0.05), SOD3 activity (r = -0.285; P < 0.05), and BMI (r = -0.346; P < 0.05). In addition, PON-1 had a signi�cant positive correlation with GPx3 activitylevel (r = 0.281, P < 0.05) and CAT activity level (r = 0.305; P < 0.05). Moreover, MDA levels showed a signi�cant positive association with PC levels (r = 0.287; P< 0.05) and BMI (r = 0.297; P < 0.01), and a negative correlation with CAT activity (r = -0.314; P < 0.05). TAC had a signi�cant positive relationship with CATactivity (r = 0.288; P < 0.05) and age (r = 0.296; P < 0.05). NO was positively correlated with PC (r = 0.396; P < 0.01) and BMI (r = 0.324; P < 0.05). Furthermore,a negative signi�cant correlation was seen between CAT activity and BMI (r = -0.439; P < 0.01).
In addition, the results indicated that γ-HCH (r = -0.283; P < 0.05), 4,4 DDE (r = -0.325; P < 0.05), 2,4 DDT (r = -0.303; P < 0.05), and 4,4 DDT (r = -0.459; P < 0.01)were negatively correlated with AChE activity. However, β-HCH (r = -0.320; P < 0.05), γ-HCH (r = -0.348; P < 0.05), 2,4 DDE (r = -0.325; P < 0.05), 4,4 DDE (r =-0.394; P < 0.01), and 2,4 DDT (r = -0.385; P < 0.01) had a negative correlation with PON-1 activity. Furthermore, 2,4 DDE (r = 0.327; P < 0.05) and 4,4 DDT (r =0.461; P < 0.01) exhibited a positive signi�cant association with MDA levels. Moreover, TAC had a signi�cant negative correlation with α-HCH (r = -0.310; P <0.05), β-HCH (r = -0.394; P < 0.01), γ-HCH (r = -0.412; P < 0.01), 4,4 DDE (r = -0.437; P < 0.01), and 2,4 DDT (r = -0.434; P < 0.01). Data also showed that the NOlevel had a direct signi�cant relationship with β-HCH (r = 0.305; P < 0.05), 2,4 DDE (r = 0.280; P < 0.05), and 4,4 DDT (r = 0.516; P < 0.01). It was observed thatthe PC level was positively correlated with γ-HCH (r = 0.327; P < 0.05), 2,4 DDE (r = 0.351; P < 0.05), and 4,4 DDT (r = 0.512; P < 0.01). The GPx3 activity levelhad a signi�cant negative relation with β-HCH (r = -0.437; P < 0.01) and γ-HCH (r = -0.437; P < 0.01). Moreover, γ-HCH (r = -0.335; P < 0.05), 4,4 DDE (r = -0.288;P < 0.05), and 4,4 DDT (r = -0.461; P < 0.01) had a signi�cant negative correlation with the CAT activity level. Finally, age was shown to be negativelyassociated with β-HCH (r = -0.336; P < 0.05) and 2,4 DDT (r = -0.388; P < 0.01).
Table 4 demonstrates the correlation of oxidant and antioxidant parameters with OCP levels. Data showed a negative signi�cant association between 4,4 DDEand AChE activity (P = 0.011). The results also indicated that NO and PC levels had a positive correlation with 2,4 DDT (P = 043) and 4,4 DDT (P = 0.003),respectively. However, MDA, TAC, PON-1, SOD, GPx, and CAT activity levels did not show any correlation with the measured OCP levels (P > 0.05).
To assess the effects of pesticide exposure on OS parameters, a linear regression analysis was used (Table 4). AChE activity showed a signi�cant inverserelationship with α-HCH (β = -0.26, P = 0.05), β-HCH (β = -0.34, P = 0.01), γ-HCH (β = -0.32, P = 0.01), 4,4 DDE (β = -0.34, P = 0.01), 2,4 DDT (β = -0.44, P = 0.001),and 4,4 DDT (β = -0.63, P = 0.001). The regression results also showed that the PON-1 activity had an inverse signi�cant association with β-HCH (β = -0.47, P <0.001), γ-HCH (β = -0.49, P < 0.001), 2,4 DDE (β = -0.28, P = 0.04), 4,4-DDE (β = -0.51, P < 0.001), 2,4 DDT (β = -0.34, P = 0.01), and 4,4 DDT (β = -0.38, P =0.005). TAC activity showed an inverse signi�cant relationship with α-HCH (β = -0.31, P < 0.026), β-HCH (β = -0.40, P < 0.003), γ-HCH (β = -0.42, P = 0.002), 4,4DDE (β = -0.50, P < 0.001), 2,4 DDT (β = -0.47, P < 0.001), and 4,4 DDT (β = -0.32, P = 0.022). Moreover, NO had a signi�cant relationship with 2,4 DDE (β = 0.32,P = 0.022) and 4,4 DDT (β = 0.51, P = 0.001). GPx3 activity was shown to have an inverse relationship with γ-HCH (β = -0.33, P = 0.018) and 4,4 DDT (β = -0.29,P = 0.036). CAT activity also had an inverse relationship with β-HCH (β = -0.31, P = 0.027), γ-HCH (β = -0.38, P = 0.006), 4,4 DDE (β = -0.37, P = 0.007), 2,4 DDT(β = -0.37, P = 0.007), and 4,4 DDT (β = -0.59, P < 0.001).

Page 12/20
MDA level had a positive signi�cant association with β-HCH (β = 0.36, P = 0.009), 2,4 DDE (β = 0.42, P = 0.002), and 4,4 DDT (β = 0.59, P < 0.001). In addition,PC was positively associated with β-HCH (β = 0.32, P = 0.022), γ-HCH (β = 0.36, P = 0.008), 2,4 DDE (β = 0.35, P = 0.011), and 4,4-DDT (β = 0.50, P < 0.001).SOD3 activity had no signi�cant association with OCPs.
Logistic regression analysis revealed that higher levels of OCPs were linked to an increased risk of lung cancer (Table 5). Moreover, analyses were adjusted forpotential confounding factors, which included BMI, TG, and cholesterol. Lung cancer was associated with α-HCH (multivariable-adjusted OR = 3.19, 95% CI:1.77-5.75, P < 0.001), β-HCH (OR = 5.68, 95% CI: 2.71-11.90, P < 0.001), γ-HCH (OR = 5.64, 95% CI: 2.55-12.47, P < 0.001), 2, 4 DDE (OR = 6.40, 95% CI: 2.93-13.94, P < 0.001), 4,4 DDE (OR = 3.80, 95% CI: 2.11-6.86, P < 0.001), 2, 4 DDT (OR = 5.13, 95% CI: 2.58-10.17, P < 0.001), and 4, 4 DDT (OR = 3.72, 95% CI: 2.71-6.39, P < 0.001).

Page 13/20
Table 5Association between lung cancer incidence and OCPs by quartiles.
Crude Adjusted
B OR CI-95% P-value B OR CI-95% P-value
α-HCH
Q1(≤0.92)
Q2(0.93-1.30)
Q3(1.31-2.36)
Q4(>2.36)
p for trend
0.27
Ref
0.97
1.04
1.68
1.31
2.64
2.85
5.40
19 – 1.44
0.94-7.40
0.92-8.80
1.58-18.39
<0.001
0.064
0.068
0.007
1.16
Ref
1.63
0.94
1.72
3.19
5.12
2.56
5.59
1.77-5.75
1.39-18.74
0.67-9.79
1.31-23.80
<0.001
0.014
0.16
0.02
β-HCH
Q1(≤0.57)
Q2(0.58-1.08)
Q3(1.09-2.91)
Q4(>2.91)
p for trend
0.43
Ref 0.51 1.53
1.80
1.53
1.66
4.64
6.07
1.31 – 1.79
0.51-5.39
1.46-14.76
1.96-18.72
<0.001
0.39
0.009
0.002
1.73
Ref
1.38
2.97
2.76
5.68
3.97
19.50
15.87
2.71-11.90
0.81-19.53
3.25-116.8
3.45-72.94
<0.001
0.,08
0.001
<0.001
γ-HCH
Q1(≤0.35)
Q2(0.36-1.22)
Q3(1.23-2.14)
Q4(>2.14)
p for trend
0.44
Ref
-0.39
0.56
1.86
1.56
0.67
1.75
6.44
1.31 – 1.79
0.22-2.01
0.52-5.84
1.99-20.79
<0.001
0.47
0.36
0.002
1.73
Ref
-0.54
0.07
1.99
5.64
0.57
1.07
7.36
2.55-12.47
0.15-2.21
0.26-4.40
1.85-29.17
<0.001
0.42
0.91
0.005
2,4-DDE
Q1(≤0.95)
Q2(0.96-1.72)
Q3(1.73-2.62)
Q4(>2.62)
p for trend
0.18
Ref
0.73
1.27
1.55
1.21
2.07
3.56
4.74
1.13 – 1.28
0.69-6.22
1.13-11.16
1.56-14.36
<0.001
0.19
0.02
0.006
1.85
Ref
1.50
2.14
2.27
6.40
4.52
8.51
9.76
2.93-13.94
1.13-17.98
1.87-38.74
2.31-41.24
<0.001
0.03
0.006
0.002
4,4-DDE
Q1(≤0.86)
Q2(0.87-1.62)
Q3(1.63-4.27)
Q4(>4.27)
p for trend
0.64
Ref
0.05
1.26
1.99
1.91
1.05
3.54
7.34
1.48 – 2.45
0.32-3.41
1.09-11.46
2.29-23.57
<0.001
0.92
0.03
0.001
1.33
Ref
0.79
1.95
2.54
3.80
2.22
7.04
12.74
2.11-6.86
0.55-8.96
1.54-32.14
2.71-59.88
<0.001
0.26
0.012
0.001
2,4-DDT
Q1(≤1.36)
Q2(1.37-1.64)
Q3(1.65-3.77)
Q4(>3.77)
p for trend
0.15
Ref
0.49
1.56
1.60
1.16
1.63
4.76
5.00
1.07 – 1.27
0.57-4.66
1.54-14.64
1.43-17.45
<0.001
0.35
0.006
0.012
1.63
Ref
0.59
1.64
1.97
5.13
1.82
5.16
7.20
2.58-10.17
0.51-6.48
1.36-19.57
1.53-33.81
<0.001
0.35
0.016
0.012
The estimation of the associations between lung cancer development and OCPs was performed by the continuous logistic regression model. a Adjustedfor BMI and total lipids. Q: Quartile. Q was adjusted with age. OR: Odds ratio.

Page 14/20
Crude Adjusted
4,4-DDT
Q1(≤1.42)
Q2(1.43-2.33)
Q3(2.34-4.61)
Q4(>4.61)
p for trend
0.21
Ref
0.03
1.20
2.00
1.24
1.03
3.33
7.40
1.11 – 1.38
0.31-3.42
1.08-10.23
2.22-24.70
<0.001
0.95
0.03
0.001
1.31
Ref
0.55
1.22
1.86
3.72
1.75
3.40
6.44
2.17-6.39
0.42-7.27
0.93-12.42
1.62-25.57
<0.001
0.44
0.064
0.008
The estimation of the associations between lung cancer development and OCPs was performed by the continuous logistic regression model. a Adjustedfor BMI and total lipids. Q: Quartile. Q was adjusted with age. OR: Odds ratio.
DiscussionLung cancer is one of the major health issues worldwide. Although the primary etiology of lung cancer development has not been elucidated completely, it iswidely accepted that multiple risk factors including genetic and environmental factors are linked to its development (Luo et al., 2011). Recently, pesticideexposure has been considered a new cancer risk factor (Abolhassani et al., 2019; Mortazavi et al., 2019b; Paydar et al., 2019). The present study was designedto compare the levels of OCPs, OPPs, and OS components between patients with lung cancer and healthy subjects.
The most remarkable �nding of the present work was that the mean serum levels of the seven studied OCPs in patients with lung cancer were signi�cantlyhigher than in the healthy subjects (Table 2 and Figure 2). These results were consistent with those of other studies that showed OCP serum concentrations inpatients with cancer were higher than in the healthy subjects (Attaullah et al., 2018; Verma et al., 2018; Wielsøe et al., 2017). Hence, it seems that there is asigni�cant association between the serum levels of OCPs and cancer incidence.
Due to the tendency of OCPs for accumulation in the body fat masses, the lipid pro�le and BMI can be considered two main confounding factors in OCPmeasurement (Paydar et al., 2019; Pelletier et al., 2002). However, the results of this study showed signi�cant differences in the lipid pro�le and BMI betweenpatients with lung cancer and healthy subjects (Table 1). Therefore, logistic regression analysis was performed by adjusting for BMI, TG, and cholesterol.These factors increased the risk of lung cancer, according to the �ndings.
To evaluate OPP exposure levels, determining the AChE activity is the standard method (Majidi et al., 2018; Moon et al., 2015). In the present study, asigni�cant decrease in AChE activity was observed in patients with lung cancer compared to the healthy subjects (Figure 1). Consistent with our results,several studies showed that AChE activity was reduced in lung cancer patients (Xi et al., 2015). The participation of AChE in the apoptosis process, as anunconventional function of this enzyme, has been con�rmed in previous studies (Jiang & Zhang, 2008). In this context, it has been reported that the down-regulation of AChE by small interfering ribonucleic acids (siRNAs) could inhibit the apoptosis process (Park et al., 2004). Thus, the decrease of AChE activitymay lead to tumor development by inhibiting the apoptosis process (Shehadeh Mashour et al., 2012).
However, the results showed signi�cant differences in oxidant and antioxidant criteria between the two groups, except for SOD activity. MDA, NO, and PC levelswere signi�cantly higher in patients with lung cancer compared to healthy subjects while PON-1, GPx, and CAT activity levels and TAC levels were signi�cantlylower in lung cancer patients compared to healthy controls.
There were no signi�cant differences in total protein concentrations between patients with lung cancer and healthy individuals (Table 1). Our data showed asigni�cant increase in PC levels in patients with lung cancer compared with healthy subjects (Figure 1). PC is an important sign of protein oxidative damages.This result is supported by previous studies which indicated that protein damages and protein dysfunction were linked to cancer development (McAdam et al.,2016). As shown in Table 1, the lipid pro�le (HDL-C and LDL-C) in patients with lung cancer did not show any signi�cant differences compared to healthysubjects, while TG and cholesterol serum levels showed signi�cant differences between the two groups. Therefore, logistic regression analysis was performed,by adjusting for BMI, TG, and cholesterol, to eliminate the effects of confounding factors. A signi�cant increase in MDA concentration level was observed inpatients with lung cancer compared to the control group (Figure 1, Table 3). Since MDA can be considered a parameter of lipid damage, it has been reportedthat MDA concentration is clearly higher in cancer patients compared to healthy controls (Abolhassani et al., 2019; Gönenç et al., 2001; Mortazavi et al.,2019b). Due to the high level of OCPs and the evidence of OPP exposure in patients with lung cancer, we concluded that the main reason for the high levels ofMDA is the evaluated pesticides.
On the other hand, our results showed that enzymatic (GPx, CAT, AChE, and PON-1) and non-enzymatic (TAC) antioxidant factors were signi�cantly lower incancer patients compared to healthy subjects (Figure 1). The �ndings observed in this study mirror those of our previous studies, which indicated a signi�cantreduction in antioxidant parameters such as GPx, CAT, AChE, PON-1, and TAC in cancer patients compared with healthy individuals (Abolhassani et al., 2019;Mortazavi et al., 2019b; Paydar et al., 2019). However, according to the results, exposure to OCPs and OPPs led to redox imbalance, which might consequentlylead to lung cancer development.

Page 15/20
Although the current study is based on a small sample of participants, the �ndings suggest that serum levels of the studied pesticides and the redox conditionhave a major role in promoting lung cancer. However, future research needs to more closely examine the links between serum levels of pesticides and redoxcondition and lung cancer development.
ConclusionThe most important �nding of the present study was that the mean serum levels of the seven studied OCPs, which are illegal, were signi�cantly higher inpatients with lung cancer than in the healthy subjects. On the other hand, AChE and PON-1 activity, which are important indices for OPP exposure, weresigni�cantly lower in lung cancer patients compared with healthy individuals. Furthermore, antioxidant parameters such as GPx, CAT, and TAC were lower andMDA, as the �nal product of lipid peroxidation, was higher in cancer patients when compared with the healthy group. Therefore, based on the obtained results,it may be concluded that exposure to OCPs and OPPs led to the development of advanced oxidation processes and redox imbalance, resulting in lung cancerdevelopment.
DeclarationsEthics approval and consent to participate
This research followed the principles of the amended Helsinki Declaration (2013) which is a statement of ethical concepts to supply guidance to physiciansand participants in human-involved medical studies and con�rmed by the Ethics Committee of Kerman University of Medical Sciences, Kerman, Iran(IR.KMU.REC. 1398.335). All participants have consciously signed the consent form.
Authors’ Contribution: Moslem Abolhassani and Gholamreza Asadikaram conceived the study and designed the survey and provided continuous guidancethroughout the study and interpreted the data. Mojtaba Abbasi-Jorjandi, Sanaz Faramarz and Fatemeh Youse� collected samples. Moslem Abolhassani andFouzieh Salimi performed all experiments, oversaw data collection and analysis, and drafted the manuscript. Hossein Pourghdamyari, Reza Malekpour Afshar,Parisa Asadikaram, and Mohsen Sha�epour helped the survey and analyzed data. All authors have participated in the revisions of the manuscript and haveapproved the �nal version.
Acknowledgement
As a sign of gratitude for their cooperation, we would like to thank subjects participating in this study.
Declaration of interest
The authors declare no con�ict of interest.
Data availability:
The datasets used during the current study are available from the corresponding author on reasonable request.
Funding:
The present project supported by a grant provided by the Kerman University of Medical sciences (project number: 96001011).
Consent for publication
All participants agree to publish this article.
References1. Abolhassani M, Asadikaram G, Paydar P, Fallah H, Aghaee-Afshar M, Moazed V, Akbari H, Moghaddam SD, Moradi A (2019) Organochlorine and
organophosphorous pesticides may induce colorectal cancer; A case-control study. Ecotoxicol Environ Saf 178:168–177
2. Attaullah M, Yousuf MJ, Shaukat S, Anjum SI, Ansari MJ, Buneri ID, Tahir M, Amin M, Ahmad N, Khan SU (2018) Serum organochlorine pesticides residuesand risk of cancer: A case-control study. Saudi Journal of Biological Sciences 25:1284–1290
3. Basumallik N, Agarwal M (2019) Cancer, Lung Small Cell (Oat Cell), StatPearls [Internet]. StatPearls Publishing
4. Benzie IF, Strain JJ (1996) The ferric reducing ability of plasma (FRAP) as a measure of “antioxidant power”: the FRAP assay. Anal Biochem 239:70–76
5. Bhardwaj JK, Mittal M, Saraf P, Kumari P (2018) : Pesticides induced oxidative stress and female infertility: a review.Toxin Reviews,1–13
�. Bobin-Dubigeon C, Jaffré I, Joalland M-P, Classe J-M, Campone M, Hervé M, Bard J-M (2012) Paraoxonase 1 (PON1) as a marker of short term death inbreast cancer recurrence. Clin Biochem 45:1503–1505
7. Boice JD Jr, Ellis ED, Golden AP, Zablotska LB, Mumma MT, Cohen SS (2019) : Sex-speci�c lung cancer risk among radiation workers in the million-personstudy and patients TB-Fluoroscopy.International journal of radiation biology,1–12
�. Buege JA, Aust SD (1978) [30] Microsomal lipid peroxidation, Methods in enzymology. Elsevier, pp 302–310
9. Cannon-Albright LA, Carr SR, Akerley W (2019) Population-based Relative Risks for Lung Cancer Based on Complete Family History of Lung Cancer.Journal of Thoracic Oncology

Page 16/20
10. Cramb SM, Baade PD, White NM, Ryan LM, Mengersen KL (2015) Inferring lung cancer risk factor patterns through joint Bayesian spatio-temporalanalysis. Cancer Epidemiol 39:430–439
11. Deng S, Chen Y, Wang D, Shi T, Wu X, Ma X, Li X, Hua R, Tang X, Li QX (2015) Rapid biodegradation of organophosphorus pesticides byStenotrophomonas sp. G1. J Hazard Mater 297:17–24
12. Friedewald WT, Levy RI, Fredrickson DS (1972) Estimation of the concentration of low-density lipoprotein cholesterol in plasma, without use of thepreparative ultracentrifuge. Clin Chem 18:499–502
13. Gönenç A, Özkan Y, Torun M, Şimşek B (2001) Plasma malondialdehyde (MDA) levels in breast and lung cancer patients. J Clin Pharm Ther 26:141–144
14. Hadian Z, Eslamizad S, Yazdanpanah H (2019) Pesticide residues analysis in Iranian fruits and vegetables by Gas Chromatography-Mass Spectrometry.Iranian Journal of Pharmaceutical Research 18:275–285
15. He T-T, Zuo A-J, Wang J-G, Zhao P (2017) Organochlorine pesticides accumulation and breast cancer: A hospital-based case–control study. TumorBiology 39:1010428317699114
1�. Jayaraj R, Megha P, Sreedev P (2016) Organochlorine pesticides, their toxic effects on living organisms and their fate in the environment. Interdisciplinarytoxicology 9:90–100
17. Jiang H, Zhang XJ (2008) Acetylcholinesterase and apoptosis: a novel perspective for an old enzyme. FEBS J 275:612–617
1�. Kobrosly RW, Evans S, Miodovnik A, Barrett ES, Thurston SW, Calafat AM, Swan SH (2014) Prenatal phthalate exposures and neurobehavioraldevelopment scores in boys and girls at 6–10 years of age. Environ Health Perspect 122:521–528
19. Levine RL, Garland D, Oliver CN, Amici A, Climent I, Lenz A-G, Ahn B-W, Shaltiel S, Stadtman ER (1990) [49] Determination of carbonyl content in oxidativelymodi�ed proteins. Methods Enzymol 186:464–478
20. Lima JE, Xavier DJ, Sakamoto-Hojo ET (2019) : Oxidative Stress, DNA Damage and Repair Pathways in Patients with Type 2 Diabetes Mellitus, Type 2Diabetes. IntechOpen
21. Luo J, Hendryx M, Ducatman A (2011) : Association between six environmental chemicals and lung cancer incidence in the United States. Journal ofenvironmental and public health 2011
22. Majidi M, Delirrad M, Mohammadi AB, Naja� MN, Nekoueifard S, Alizadeh A, Dadpour B (2018) : Cholinesterase Level in Erythrocyte or Serum: Which isMore Predictive of the Clinical Outcome in Patients with Acute Organophosphate Poisoning?Age (years)27, 42.2
23. Mao Y, Yang D, He J, Krasna MJ (2016) Epidemiology of lung cancer. Surgical Oncology Clinics 25:439–445
24. Mardani R, Jafari Najaf Abadi MH, Motieian M, Taghizadeh-Boroujeni S, Bayat A, Farsinezhad A, Gheibi Hayat SM, Motieian M, Pourghadamyari H (2019)MicroRNA in leukemia: Tumor suppressors and oncogenes with prognostic potential. J Cell Physiol 234:8465–8486
25. Martin FL, Martinez EZ, Stopper H, Garcia SB, Uyemura SA, Kannen V (2018) Increased exposure to pesticides and colon cancer: Early evidence in Brazil.Chemosphere 209:623–631
2�. McAdam E, Brem R, Karran P (2016) Oxidative stress–induced protein damage inhibits DNA repair and determines mutation risk and therapeutic e�cacy.Mol Cancer Res 14:612–622
27. Miranda-Filho A, Piñeros M, Bray F (2019) The descriptive epidemiology of lung cancer and tobacco control: a global overview 2018. salud pública deméxico 61:219–229
2�. Mirzaei HR, Pourghadamyari H, Rahmati M, Mohammadi A, Nahand JS, Rezaei A, Mirzaei H, Hadjati J (2018) Gene-knocked out chimeric antigen receptor(CAR) T cells: tuning up for the next generation cancer immunotherapy. Cancer Lett 423:95–104
29. Moohebati M, Falsoleiman H, Dehghani M, Fazlinezhad A, Daloee MH, Esmaeili H, Parizadeh SMR, Tavallaie S, Rahsepar AA, Paydar R (2011) Serumin�ammatory and immune marker response after bare-metal or drug-eluting stent implantation following percutaneous coronary intervention. Angiology62:184–190
30. Moon J, Chun B, Lee S (2015) Variable response of cholinesterase activities following human exposure to different types of organophosphates. Hum ExpToxicol 34:698–706
31. Mortazavi N, Asadikaram G, Ebadzadeh MR, Kamalati A, Pakmanesh H, Dadgar R, Moazed V, Paydar P, Fallah H, Abolhassani M (2019a) Organochlorineand organophosphorus pesticides and bladder cancer: A case-control study. J Cell Biochem 120:14847–14859
32. Mortazavi N, Asadikaram G, Ebadzadeh MR, Kamalati A, Pakmanesh H, Dadgar R, Moazed V, Paydar P, Fallah H, Abolhassani M (2019b) Organochlorineand organophosphorus pesticides and bladder cancer: A case-control study. Journal of cellular biochemistry
33. Paglia DE, Valentine WN (1967) Studies on the quantitative and qualitative characterization of erythrocyte glutathione peroxidase. J Lab Clin Med70:158–169
34. Park SE, Kim ND, Yoo YH (2004) Acetylcholinesterase plays a pivotal role in apoptosome formation. Cancer Res 64:2652–2655
35. Paydar P, Asadikaram G, Zeynali Nejad H, Moazed V, Poursayedi B, Nematollahi MH, Akbari H, Abolhassani M, Khosravi Shadmani F (2018) : The role ofacetylcholinesterase, paraoxonase, and oxidative stress in breast tumors.International Journal of Cancer Management11
3�. Paydar P, Asadikaram G, Fallah H, Nejad HZ, Akbari H, Abolhassani M, Moazed V, Khazaeli P, Heidari MR (2019) : Serum levels of OrganochlorinePesticides and Breast Cancer Risk in Iranian Women.Archives of environmental contamination and toxicology,1–10
37. Pelletier C, Després J-P, Tremblay A (2002) Plasma organochlorine concentrations in endurance athletes and obese individuals. Med Sci Sports Exerc34:1971–1975
3�. Peppers SB (2019) :Can Pesticides Cause Prostate Cancer? Prostate
39. Phillips R, Zeleznik J, Dunn G, Quisenberry V (1989) Mechanism of water entry into simulated macropores. Soil Sci Soc Am J 53:1629–1635

Page 17/20
40. Pirsaheb M, Limoee M, Namdari F, Khamutian R (2015) Organochlorine pesticides residue in breast milk: a systematic review. Medical journal of theIslamic Republic of Iran 29:228
41. Rezaeigolestani M, Hashemi M (2018) A Review of Pesticide Residues in Agricultural and Food Products of Iran. Journal of Nutrition, Fasting and Health6:1–6
42. Rui Y, Wu X, Ma B, Xu Y (2018) Immobilization of acetylcholinesterase on functionalized SBA-15 mesoporous molecular sieve for detection oforganophosphorus and carbamate pesticide. Chin Chem Lett 29:1387–1390
43. Rybarczyk-Kasiuchnicz A, Ramlau R (2018) Current views on molecularly targeted therapy for lung cancer–a review of literature from the last �ve years.Kardiochirurgia i Torakochirurgia Polska= Polish Journal of Cardio-Thoracic Surgery 15:119
44. Shehadeh Mashour R, Heinrich R, Garzozi HJ, Perlman I (2012) Acetylcholinesterase (AChE) is an important link in the apoptotic pathway induced byhyperglycemia in Y79 retinoblastoma cell line. Front Mol Neurosci 5:69
45. Siddiqui F, Siddiqui AH (2019) : Cancer, Lung, StatPearls [Internet]. StatPearls Publishing
4�. Siegel RL, Miller KD, Jemal A (2016) Cancer statistics, 2016. Cancer J Clin 66:7–30
47. Singh Z, Kaur J, Kaur R, Hundal SS (2016) Toxic effects of organochlorine pesticides: a review. Am J Biosci 4:11–18
4�. Sinha AK (1972) Colorimetric assay of catalase. Anal Biochem 47:389–394
49. Tahmasebi-Birgani MJ, Teimoori A, Ghadiri A, Mansoury‐Asl H, Danyaei A, Khanbabaei H (2019) Fractionated radiotherapy might induce epithelial‐mesenchymal transition and radioresistance in a cellular context manner. J Cell Biochem 120:8601–8610
50. Valdez CA, Nicholas AB, Malfatti MA, Enright HA, Bennion BJ, Carpenter TS, Hok S, leong Lao H, Nguyen TH (2019) Compounds for central reactivation oforganophosphorus-based compound-inhibited acetylcholinesterase and/or inactivation of organophosphorus-based acetylcholinesterase inhibitors andrelated compositions methods and systems for making and using them. Google Patents
51. Verma H, Sharma T, Gupta S, Banerjee B (2018) CYP1A1 expression and organochlorine pesticides level in the etiology of bladder cancer in North Indianpopulation. Hum Exp Toxicol 37:817–826
52. Wei L, Li N, Wang G, Su K, Li F, Chang S, Tan F, Lyu Z, Feng X, Li X (2018) Alcohol consumption and the risk of lung cancer in males: a prospective cohortstudy. Zhonghua liu xing bing xue za zhi=. Zhonghua liuxingbingxue zazhi 39:909
53. Wielsøe M, Kern P, Bonefeld-Jørgensen EC (2017) Serum levels of environmental pollutants is a risk factor for breast cancer in Inuit: a case control study.Environ Health 16:56
54. Worek F, Mast U, Kiderlen D, Diepold C, Eyer P (1999) Improved determination of acetylcholinesterase activity in human whole blood. Clin Chim Acta288:73–90
55. Xi HJ, Wu RP, Liu JJ, Zhang LJ, Li ZS (2015) Role of acetylcholinesterase in lung cancer. Thoracic cancer 6:390–398
5�. Yang Y, Dong J, Sun K, Zhao L, Zhao F, Wang L, Jiao Y (2013) Obesity and incidence of lung cancer: a meta-analysis. Int J Cancer 132:1162–1169
57. Yucel AA, Gulen S, Dincer S, Yucel AE, Yetkin GI (2012) Comparison of two different applications of the Griess method for nitric oxide measurement. J ExpIntegr Med 2:1
Figures

Page 18/20
Figure 1
The charts display information about some OS factors in lung cancer and healthy subjects. (a) AChE activity was signi�cantly decreased in the patient groupscompared to the control group. (b) Decreased PON1 arylesterase activity in the patient group than the control subject. (c) The levels of TAC (µM) of lungcancer were signi�cantly decreased in comparison to the healthy control. (d) With respect to the SOD3 bar chart, the SOD3 activity in the patient group was notdifferent from the control group. (e) The mean serum activity of GPx3 decreased in the lung cancer than the control group excluding female. (f) CAT activitywas signi�cantly lower in the patient group rather than the control one. (g) The levels of MDA (µM/ml) in lung cancer were signi�cantly increased incomparison to the healthy control. (h) The levels of NO (μmol/L) of lung cancer were signi�cantly increased in comparison to the healthy control. (i) The levelsof protein carbonyl (nmol/mg protein) of lung cancer were signi�cantly increased in comparison to healthy control.

Page 19/20
Figure 2
(a) Chromatogram curve sample of OCPs in lung cancer patient based on retention time. (b) Chromatogram curve sample of OCPs in healthy individual basedon retention time. (c) A scatter chart gives information about serum levels of OCPs in lung cancer compared to the control group. The levels of α-, β- and γ-HCH, 2,4-DDE, 4,4-DDE, 2,4-DDT, and 4,4-DDT were signi�cantly higher in the lung cancer group as compared to the control group.

Page 20/20
Figure 3
Adjusted regression coe�cients (β [95% con�dence interval]) for a change in OS parameters associated with increasing quartiles of ∑OCP in lung cancer. (a)There was in 3rd, and 4th quartile a signi�cant decrease of AChE (b) lnPON1 had a signi�cant decrease in the 3rd and 4th quartile (c) SOD3 had no asigni�cant difference when compared to the baseline (d) GPx3 had a signi�cant decrease in the 3rd and 4th quartile (e) lnCAT had a signi�cant decrease inthe 3rd and 4th quartile (f) lnTAC had a signi�cant decrease in the 3rd and 4th quartile (g) No signi�cant difference was observed for MDA (h) There was inthe 3rd and 4th quartile a signi�cant increase of NO (i) PC had a signi�cant increase in the 3rd and 4th quartile.
AChE: Acetylcholinesterase; PON1: Paraoxonase1; MDA: Malondialdehyde; SOD3: Superoxide dismutase3; GPx3: Glutathione peroxidase; CAT: Catalase; TAC:Total antioxidant capacity. NO: Nitric oxide; PC: Protein carbonyl.
Copyright © 2022 FDOKUMEN