Supporting Information to Predicting sorption of pesticides and ...
21
S1 Supporting Information to 466 467 Predicting sorption of pesticides and other multifunctional organic 468 chemicals to soil organic carbon 469 470 Guido Bronner* (1,2), Kai-Uwe Goss* (2) 471 (1) Institute for Biogeochemistry and Pollutant Dynamics (IBP), Swiss Federal Institute of 472 Technology (ETH) Zurich, Universitätstrasse 16, CH-8092 Zurich, Switzerland 473 (2) Helmholtz Centre for Environmental Research UFZ, Permoserstr. 15, 04318 Leipzig, 474 Germany, phone: +49 341 235 1411 (also current address) 475 *corresponding authors: [email protected] , [email protected] 476 477 478 Content 479 SI-1 Correlation between log K oc und log K ow for non-polar and polar sorbates 480 SI-3 Physicochemical properties of the sorbates for the calibration data set 481 SI-2 Detailed procedure of the batch experiments. 482 SI-4 Physicochemical properties and experimental log K OC of sorbates for the 483 validation data set 484 SI-5 Cross correlation of the sorbate descriptors for the calibration data set. 485 SI-6 Properties of Pahokee Peat 486 SI-7 Theoretical Evaluation of the Equilibrium Assumption. 487 SI-8 Equilibration time of the batch sorption experiments. 488 SI-9 Long-term stability of the column packing in the dynamic experiments. 489 SI-10 Comparison of the experimental log K oc determined with the batch and the 490 column sorption experiments. 491 SI-11 Background sorption in the column sorption system. 492 SI-12 Performance of pp-LFER predictions for log K oc from the literature for the 493 calibration data set of this work. 494 Page 19 of 39 ACS Paragon Plus Environment Submitted to Environmental Science & Technology 1 2 3 4 5 6 7 8 9 10 11 12 13 14 15 16 17 18 19 20 21 22 23 24 25 26 27 28 29 30 31 32 33 34 35 36 37 38 39 40 41 42 43 44 45 46 47 48 49 50 51 52 53 54 55 56 57 58 59 60
-
Upload
khangminh22 -
Category
Documents
-
view
3 -
download
0
Transcript of Supporting Information to Predicting sorption of pesticides and ...
S1
Supporting Information to 466
467
Predicting sorption of pesticides and other multifunctional organic 468
chemicals to soil organic carbon 469
470
Guido Bronner* (1,2), Kai-Uwe Goss* (2) 471
(1) Institute for Biogeochemistry and Pollutant Dynamics (IBP), Swiss Federal Institute of 472
Technology (ETH) Zurich, Universitätstrasse 16, CH-8092 Zurich, Switzerland 473
(2) Helmholtz Centre for Environmental Research UFZ, Permoserstr. 15, 04318 Leipzig, 474
Germany, phone: +49 341 235 1411 (also current address) 475
*corresponding authors: [email protected], [email protected] 476
477
478
Content 479
SI-1 Correlation between log Koc und log Kow for non-polar and polar sorbates 480
SI-3 Physicochemical properties of the sorbates for the calibration data set 481
SI-2 Detailed procedure of the batch experiments. 482
SI-4 Physicochemical properties and experimental log KOC of sorbates for the 483
validation data set 484
SI-5 Cross correlation of the sorbate descriptors for the calibration data set. 485
SI-6 Properties of Pahokee Peat 486
SI-7 Theoretical Evaluation of the Equilibrium Assumption. 487
SI-8 Equilibration time of the batch sorption experiments. 488
SI-9 Long-term stability of the column packing in the dynamic experiments. 489
SI-10 Comparison of the experimental log Koc determined with the batch and the 490
column sorption experiments. 491
SI-11 Background sorption in the column sorption system. 492
SI-12 Performance of pp-LFER predictions for log Koc from the literature for the 493
calibration data set of this work. 494
Page 19 of 39
ACS Paragon Plus Environment
Submitted to Environmental Science & Technology
123456789101112131415161718192021222324252627282930313233343536373839404142434445464748495051525354555657585960
S2
List of tables 495
496
Tab. SI– 1: Physicochemical properties of sorbates for the calibration data set. 497
Tab. SI– 2: Physicochemical properties experimental log KOC of sorbates for the validation 498
data set 499
Tab. SI– 3: Correlation between each single descriptor and the combination of the remaining 500
descriptors for both types of equation (cross correlation). 501
Tab. SI– 4: Properties of Pahokee Peat bulk material; * material dried at 60°C in vacuum 502
Tab. SI– 5: Diffusion coefficients of the sorbate into the sorbent particles that would allow to 503
obtain more than 80% of the equilibrium sorption for the given combination of 504
sorbent particle diameter and equilibration time (based on calculations for 505
spherical diffusion) 506
Tab. SI– 6: Background sorption in the column sorption system (HPLC system) 507
Tab. SI– 7: comparison of the fitted pp-LFER system coefficients for SOM/water partitioning 508
from the different literatures and from this work. 509
Tab. SI– 8: comparison of range of the compound descriptors of the calibration compounds 510
used to derive the pp-LFER equation for SOM/water partitioning in the literature 511
and in this work. 512
513
514
515
List of figures 516
517
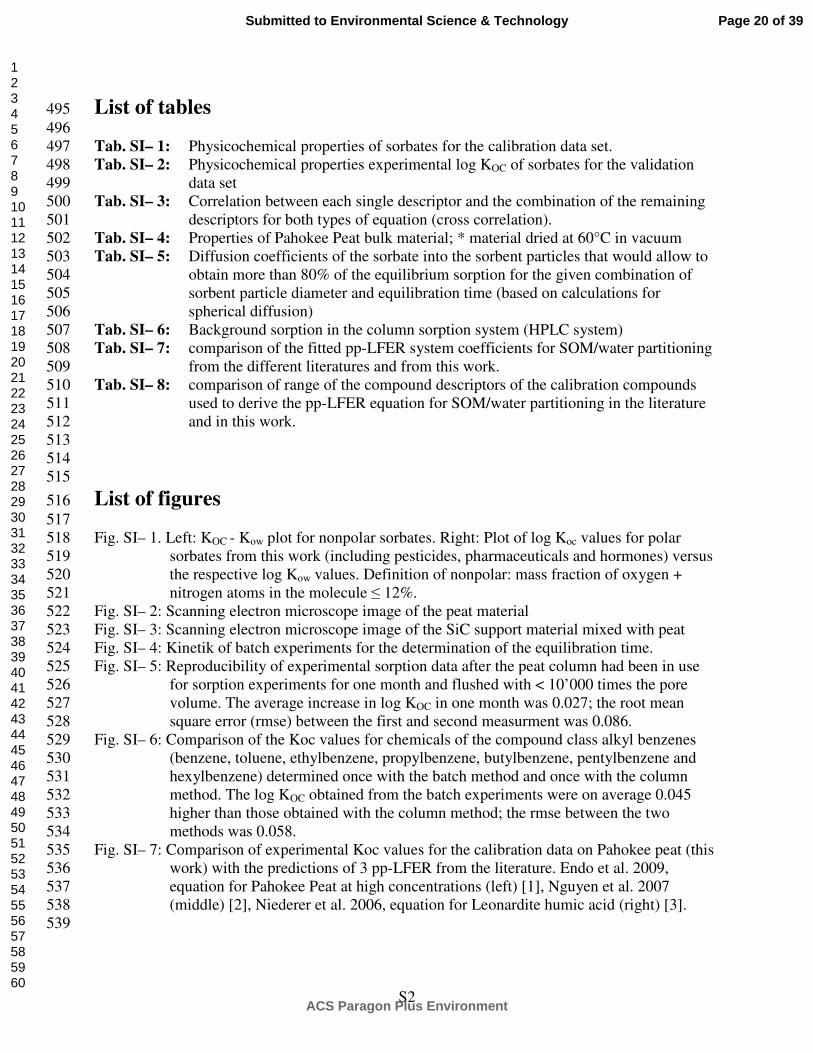
Fig. SI– 1. Left: KOC - Kow plot for nonpolar sorbates. Right: Plot of log Koc values for polar 518
sorbates from this work (including pesticides, pharmaceuticals and hormones) versus 519
the respective log Kow values. Definition of nonpolar: mass fraction of oxygen + 520
nitrogen atoms in the molecule ≤ 12%. 521
Fig. SI– 2: Scanning electron microscope image of the peat material 522
Fig. SI– 3: Scanning electron microscope image of the SiC support material mixed with peat 523
Fig. SI– 4: Kinetik of batch experiments for the determination of the equilibration time. 524
Fig. SI– 5: Reproducibility of experimental sorption data after the peat column had been in use 525
for sorption experiments for one month and flushed with < 10’000 times the pore 526
volume. The average increase in log KOC in one month was 0.027; the root mean 527
square error (rmse) between the first and second measurment was 0.086. 528
Fig. SI– 6: Comparison of the Koc values for chemicals of the compound class alkyl benzenes 529
(benzene, toluene, ethylbenzene, propylbenzene, butylbenzene, pentylbenzene and 530
hexylbenzene) determined once with the batch method and once with the column 531
method. The log KOC obtained from the batch experiments were on average 0.045 532
higher than those obtained with the column method; the rmse between the two 533
methods was 0.058. 534
Fig. SI– 7: Comparison of experimental Koc values for the calibration data on Pahokee peat (this 535
work) with the predictions of 3 pp-LFER from the literature. Endo et al. 2009, 536
equation for Pahokee Peat at high concentrations (left) [1], Nguyen et al. 2007 537
(middle) [2], Niederer et al. 2006, equation for Leonardite humic acid (right) [3]. 538
539
Page 20 of 39
ACS Paragon Plus Environment
Submitted to Environmental Science & Technology
123456789101112131415161718192021222324252627282930313233343536373839404142434445464748495051525354555657585960

S3
SI-1 Correlation between log Koc und log Kow for non-polar and 540
polar sorbates 541
542
543
0
1
2
3
4
5
6
7
8
0 1 2 3 4 5 6 7 8
exp. log Kow (Lw/Lo)
exp
. lo
g K
oc (
L/k
g)
this work N = 47
Nguyen et al.2007 N = 54
Karickhoff model(1981)
0
1
2
3
4
5
6
0 1 2 3 4 5 6
exp. log Kow (Lw/Lo)
exp
. lo
g K
oc (
L/k
g)
this work
N = 91
Karickhoff model
(1981)
544 Fig. SI– 1. Left: KOC - Kow plot for nonpolar sorbates. Right: Plot of log Koc values for polar sorbates from this work 545 (including pesticides, pharmaceuticals and hormones) versus the respective log Kow values. Definition of nonpolar: 546 mass fraction of oxygen + nitrogen atoms in the molecule ≤ 12%. 547 548
549
Page 21 of 39
ACS Paragon Plus Environment
Submitted to Environmental Science & Technology
123456789101112131415161718192021222324252627282930313233343536373839404142434445464748495051525354555657585960

S4
SI-2 Detailed procedure of the batch experiments and chemical used. 550
For aliphatic compounds that are UV inactive thus not measurable by our column system, batch-551
experiments in at least duplicate were carried out. The coarse Pahokee Peat was pulverized with a 552
planetary mill (®pulverisette 5, FritschGmbH, Idar-Oberstein, Germany) for 40 minutes and then 553
sieved into 3 different fractions. Then, 0.02-0.7 g of the fraction 77-125 µm were added into a 554
10- or 20-ml vial and was dispersed in 5 ml of an aqueous solution containing 5 mM CaCl2 and 555
200 mg/l NaN3. A methanolic stock solution (10 µL) containing a mix of solutes of the same 556
compound class was added and the vial was immediately closed with a crimp cap and a silicon 557
septum lined with aluminum to prevent loss of solute. Stock solutions were prepared to meet the 558
following requirements: 1) the sum of the concentrations (in mol/L) in the water should not 559
exceed the solubility of the solute with the lowest solubility, 2) the sum of the sorbed 560
concentrations should be as near as possible to 5 mmol/kg OC and 3) the concentrations in the gas 561
phase have to be high enough to be quantified. Reference vials containing 5 ml aqueous solution 562
and 10 µl of a 10- to 100-fold dilution of the original methanolic stock solution were prepared for 563
each solute mix. For equilibration the vials were put on a horizontal shaker in the darkness for 3.5 564
days at a temperature of 25±2ºC. A separate experiment showed that the measured KOC did not 565
significantly change after two days Fig. SI– 4. The gas phase of the vials was measured by 566
headspace sampling coupled with GC-FID analysis. The evaluation of Koc values was based on 567
mass balance and concentration ratio between the vial with the peat and the reference vial. Due to 568
the anticipated non-linearity of sorption isotherms it was necessary to relate the sorption data of 569
all sorbates to one fixed reference concentration. Here, this reference concentration was chosen as 570
5 mmol/kg OC. Hence, our data that were measured in a range of 0.1 to 50 mmol/kg OC were 571
converted to 5 mmol/kg OC. This conversion was done based on the work of Endo et al. 2008 [1]. 572
573
Reference SI-2 574
[1] Endo, S.; Grathwohl, P.; Haderlein, S. B.; Schmidt, T. C. Environ. Sci. Technol. 2008, 42, 575
5897-5903. 576
577
578
Page 22 of 39
ACS Paragon Plus Environment
Submitted to Environmental Science & Technology
123456789101112131415161718192021222324252627282930313233343536373839404142434445464748495051525354555657585960
S5
Chemicals. The chemicals were purchased from Sigma-Aldrich, Alfa-Aesar or Dr. Ehrenstorfer 579
GmbH and their purity was at least 97%; methanol (Lichrosolv quality) was purchased from 580
Merck. All solutes were either first dissolved in methanol (exception: PAHs were dissolved in 581
acetonitrile) and then diluted in 5 mM CaCl2 aqueous solution in order to keep the methanol 582
concentration below 1% (V/V) to avoid cosolvent effects (acetonitrile not exceeding 0.1%), or 583
directly dissolved in the same aqueous solution as used for the sorption experiments. 584
Page 23 of 39
ACS Paragon Plus Environment
Submitted to Environmental Science & Technology
123456789101112131415161718192021222324252627282930313233343536373839404142434445464748495051525354555657585960

S6
SI-3 Physicochemical properties of the sorbates for the calibration 585
data set 586
587
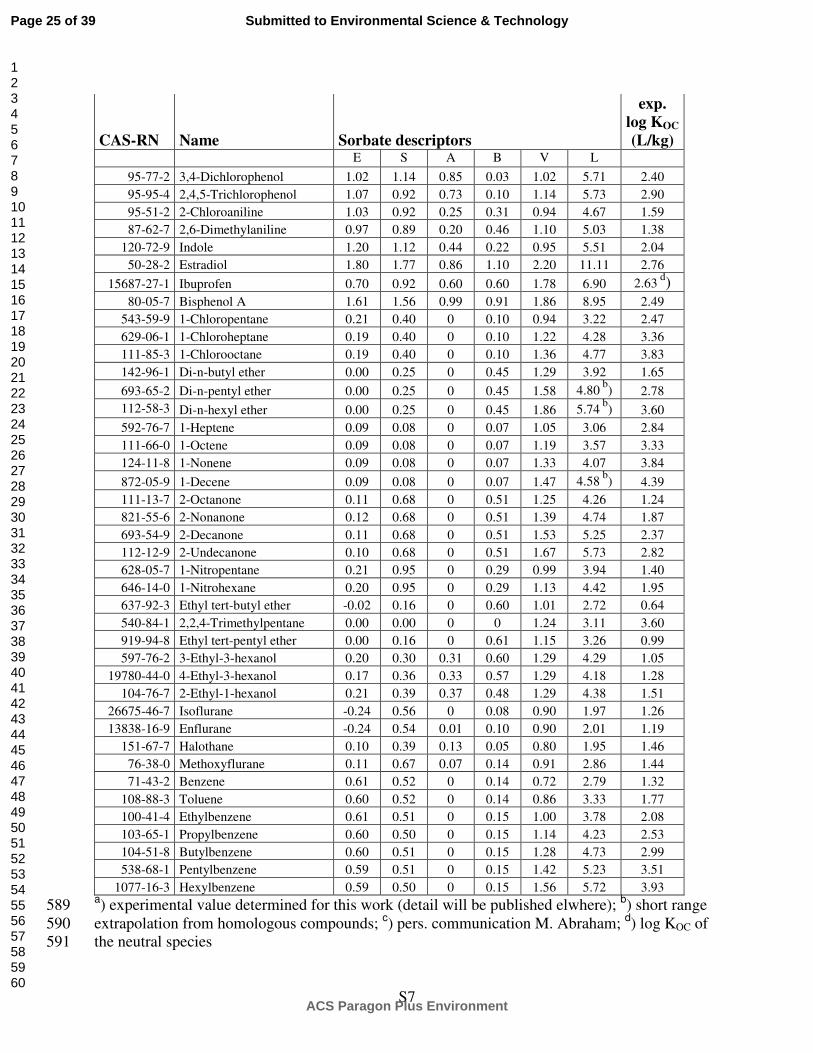
Tab. SI– 1: Physicochemical properties of sorbates for the calibration data set. 588
CAS-RN Name Sorbate descriptors
exp.
log KOC
(L/kg)
E S A B V L
91-20-3 Naphthalene 1.34 0.92 0 0.20 1.09 5.16 2.48
573-98-8 1,2-Dimethylnaphthalene 1.43 0.92 0 0.20 1.37 6.44a) 3.64
83-32-9 Acenaphthene 1.60 1.04 0 0.20 1.26 6.47 3.22
86-73-7 Fluorene 1.59 1.03 0 0.20 1.36 6.92 3.63
85-01-8 Phenanthrene 2.06 1.29 0 0.29 1.45 7.63 4.26
110-83-8 Cyclohexene 0.40 0.20 0 0.10 0.80 3.02 1.84
591-49-1 1-Methylcyclohexene 0.39 0.20 0 0.10 0.94 3.48 2.08
108-90-7 Chlorobenzene 0.72 0.65 0 0.07 0.84 3.66 2.08
106-46-7 1,4-Dichlorobenzene 0.83 0.75 0 0.02 0.96 4.44 2.88
120-82-1 1,2,4-Trichlorobenzene 0.98 0.81 0 0 1.08 5.25 2.95
634-66-2 1,2,3,4-Tetrachlorobenzene 1.18 0.92 0 0 1.21 6.17 3.51
93-55-0 Propiophenone 0.80 0.95 0 0.51 1.15 4.97 1.99
1009-14-9 Pentanophenone 0.80 0.95 0 0.50 1.44 5.90 2.32
1671-75-6 Heptanophenone 0.72 0.95 0 0.50 1.72 6.88 3.16
91-23-6 2-Nitroanisole 0.73 1.47 0.22 0.30 1.09 5.60 1.89
555-03-3 3-Nitroanisole 0.87 1.20 0.14 0.25 1.09 5.59 2.11
100-17-4 4-Nitroanisole 0.97 1.21 0 0.24 1.09 5.85 2.28
88-73-3 2-Chloronitrobenzene 1.02 1.25 0.08 0.24 1.01 5.24 2.08
629-37-8 1-Nitrooctane 0.19 0.95 0 0.29 1.41
5.43
b) 2.47
98-95-3 Nitrobenzene 0.87 1.11 0 0.28 0.89 4.56 1.90
88-72-2 2-Nitrotoluene 0.87 1.11 0 0.28 1.03 4.88 1.82
121-14-2 2,4-Dinitrotoluene 1.18 1.27 0.07 0.51 1.21 6.27 2.23
118-96-7 2,4,6-Trinitrotoluene 1.40 1.70 0.13 0.59 1.38 7.03 1.92
100-66-3 Anisole 0.71 0.75 0 0.29 0.92 3.89 1.46
271-89-6 Benzofuran 0.89 0.83 0 0.15 0.91 4.36 2.04
4265-25-2 2-Methylbenzofuran 0.95 0.83 0 0.15 1.05 4.68 b
) 2.37
132-64-9 Dibenzofuran 1.41 1.02 0 0.17 1.27 6.72 3.51
110-02-1 Thiophene 0.69 0.56 0 0.15 0.64 2.82 1.33
93-58-3 Methyl benzoate 0.73 0.85 0 0.46 1.07 4.70 1.55
93-89-0 Ethyl benzoate 0.69 0.85 0 0.46 1.21 5.20 1.92
84-66-2 Diethyl phthalate 0.73 1.40 0 0.88 1.71 6.79 1.53
131-16-8 Di-n-propyl phthalate 0.71 1.40 0 0.88 1.99 7.70 a) 2.01
84-74-2 Di-n-butyl phthalate 0.67 1.40 0 0.88 2.27 8.60 a) 3.20
131-18-0 Di-n-pentyl phthalate 0.68 1.40 0 0.88 2.56 9.52 a) 3.73
91-15-6 1,2-Dicyanobenzene 0.71 1.95 0 0.27 1.29 5.64 c) 1.69
90-15-3 1-Naphthol 1.52 1.05 0.61 0.37 1.14 6.13 2.36
95-57-8 2-Chlorophenol 0.85 0.88 0.32 0.31 0.90 4.18 1.85
106-48-9 4-Chlorophenol 0.92 1.08 0.67 0.20 0.90 4.78 1.94
Page 24 of 39
ACS Paragon Plus Environment
Submitted to Environmental Science & Technology
123456789101112131415161718192021222324252627282930313233343536373839404142434445464748495051525354555657585960
S7
CAS-RN Name Sorbate descriptors
exp.
log KOC
(L/kg)
E S A B V L
95-77-2 3,4-Dichlorophenol 1.02 1.14 0.85 0.03 1.02 5.71 2.40
95-95-4 2,4,5-Trichlorophenol 1.07 0.92 0.73 0.10 1.14 5.73 2.90
95-51-2 2-Chloroaniline 1.03 0.92 0.25 0.31 0.94 4.67 1.59
87-62-7 2,6-Dimethylaniline 0.97 0.89 0.20 0.46 1.10 5.03 1.38
120-72-9 Indole 1.20 1.12 0.44 0.22 0.95 5.51 2.04
50-28-2 Estradiol 1.80 1.77 0.86 1.10 2.20 11.11 2.76
15687-27-1 Ibuprofen 0.70 0.92 0.60 0.60 1.78 6.90 2.63 d)
80-05-7 Bisphenol A 1.61 1.56 0.99 0.91 1.86 8.95 2.49
543-59-9 1-Chloropentane 0.21 0.40 0 0.10 0.94 3.22 2.47
629-06-1 1-Chloroheptane 0.19 0.40 0 0.10 1.22 4.28 3.36
111-85-3 1-Chlorooctane 0.19 0.40 0 0.10 1.36 4.77 3.83
142-96-1 Di-n-butyl ether 0.00 0.25 0 0.45 1.29 3.92 1.65
693-65-2 Di-n-pentyl ether 0.00 0.25 0 0.45 1.58 4.80 b
) 2.78
112-58-3 Di-n-hexyl ether 0.00 0.25 0 0.45 1.86 5.74 b
) 3.60
592-76-7 1-Heptene 0.09 0.08 0 0.07 1.05 3.06 2.84
111-66-0 1-Octene 0.09 0.08 0 0.07 1.19 3.57 3.33
124-11-8 1-Nonene 0.09 0.08 0 0.07 1.33 4.07 3.84
872-05-9 1-Decene 0.09 0.08 0 0.07 1.47 4.58 b
) 4.39
111-13-7 2-Octanone 0.11 0.68 0 0.51 1.25 4.26 1.24
821-55-6 2-Nonanone 0.12 0.68 0 0.51 1.39 4.74 1.87
693-54-9 2-Decanone 0.11 0.68 0 0.51 1.53 5.25 2.37
112-12-9 2-Undecanone 0.10 0.68 0 0.51 1.67 5.73 2.82
628-05-7 1-Nitropentane 0.21 0.95 0 0.29 0.99 3.94 1.40
646-14-0 1-Nitrohexane 0.20 0.95 0 0.29 1.13 4.42 1.95
637-92-3 Ethyl tert-butyl ether -0.02 0.16 0 0.60 1.01 2.72 0.64
540-84-1 2,2,4-Trimethylpentane 0.00 0.00 0 0 1.24 3.11 3.60
919-94-8 Ethyl tert-pentyl ether 0.00 0.16 0 0.61 1.15 3.26 0.99
597-76-2 3-Ethyl-3-hexanol 0.20 0.30 0.31 0.60 1.29 4.29 1.05
19780-44-0 4-Ethyl-3-hexanol 0.17 0.36 0.33 0.57 1.29 4.18 1.28
104-76-7 2-Ethyl-1-hexanol 0.21 0.39 0.37 0.48 1.29 4.38 1.51
26675-46-7 Isoflurane -0.24 0.56 0 0.08 0.90 1.97 1.26
13838-16-9 Enflurane -0.24 0.54 0.01 0.10 0.90 2.01 1.19
151-67-7 Halothane 0.10 0.39 0.13 0.05 0.80 1.95 1.46
76-38-0 Methoxyflurane 0.11 0.67 0.07 0.14 0.91 2.86 1.44
71-43-2 Benzene 0.61 0.52 0 0.14 0.72 2.79 1.32
108-88-3 Toluene 0.60 0.52 0 0.14 0.86 3.33 1.77
100-41-4 Ethylbenzene 0.61 0.51 0 0.15 1.00 3.78 2.08
103-65-1 Propylbenzene 0.60 0.50 0 0.15 1.14 4.23 2.53
104-51-8 Butylbenzene 0.60 0.51 0 0.15 1.28 4.73 2.99
538-68-1 Pentylbenzene 0.59 0.51 0 0.15 1.42 5.23 3.51
1077-16-3 Hexylbenzene 0.59 0.50 0 0.15 1.56 5.72 3.93 a) experimental value determined for this work (detail will be published elwhere);
b) short range 589
extrapolation from homologous compounds; c) pers. communication M. Abraham;
d) log KOC of 590
the neutral species 591
Page 25 of 39
ACS Paragon Plus Environment
Submitted to Environmental Science & Technology
123456789101112131415161718192021222324252627282930313233343536373839404142434445464748495051525354555657585960

S8
592
Page 26 of 39
ACS Paragon Plus Environment
Submitted to Environmental Science & Technology
123456789101112131415161718192021222324252627282930313233343536373839404142434445464748495051525354555657585960

S9
References SI-3: source sorbate descriptors 593
Abraham, M. H. (1993). "Hydrogen Bonding XXVII. Solvation Parameters for Functionally 594
Substituted Aromatic Compounds and Heterocyclic Compounds, from Gas-Liquid 595
Chromatographic Data." J. Chromatogr. 644: 95-139. 596
Abraham, M. H. and W. E. Acree (2004). "Correlation and prediction of partition coefficients 597
between the gas phase and water, and the solvents dodecane and undecane." New Journal 598
Of Chemistry 28(12): 1538-1543. 599
Abraham, M. H., J. Andonian-Haftvan, et al. (1994). "Hydrogen Bonding. Part 34. The Factors 600
that Influence the Solubility of Gases and Vapours in Water at 298 K, and a New Method 601
for its Determination." J. Chem. Soc. Perkin Trans. 2(7): 1777-1791. 602
Abraham, M. H., H. S. Chadha, et al. (1994). "Hydrogen Bonding. 32. An Analysis of Water-603
Octanol and Water-Alkane Partitioning and the ∆log P Parameter of Seiler." J. Pharm. 604
Sci. 83: 1085-1100. 605
Abraham, M. H., A. Ibrahim, et al. (2006). "A data base for partition of volatile organic 606
compounds and drugs from blood/plasma/serum to brain, and an LFER analysis of the 607
data." Journal Of Pharmaceutical Sciences 95(10): 2091-2100. 608
Gunatilleka, A. D. and C. F. Poole (2000). "Models for Estimating the Non-Specific Toxicity of 609
Organic Compounds in Short Term Bioassays." Analyst 125: 127-132. 610
Sprunger, L. M., W. E. Acree, et al. (2008). "Mathematical correlations for gas-to-olive oil, gas-611
to-saline solution, and saline solution-to-olive oil partition coefficients based on the Goss 612
modified Abraham model." Qsar & Combinatorial Science 27(7): 890-900. 613
Torres-Lapasio, J. R., M. C. Garcia-Alvarez-Coque, et al. (2004). "Analysis of a solute polarity 614
parameter in reversed-phase liquid chromatography on a linear solvation relationship 615
basis." Anal. Chim. Acta 515(1): 209-227. 616
Tülp, H. C., K.-U. Goss, et al. (2008). "Experimental determination of LSER parameters for a set 617
of 76 diverse pesticides and pharmaceuticals." Environ. Sci. Technol. 42: 2034-2040. 618
Zissimos, A. M., M. H. Abraham, et al. (2002). "Calculation of Abraham Descriptors from 619
Experimental Data from Seven HPLC Systems; Evaluation of Different Methods of 620
Calculation." J. Chem. Soc. Perkin Trans. 2: 2001-2010. 621
622
Page 27 of 39
ACS Paragon Plus Environment
Submitted to Environmental Science & Technology
123456789101112131415161718192021222324252627282930313233343536373839404142434445464748495051525354555657585960

S10
SI-4 Physicochemical properties and experimental log KOC of 623
sorbates for the validation data set 624
625
Tab. SI– 2: Physicochemical properties experimental log KOC of sorbates for the validation data 626
set 627 CAS-RN Name log KOC sorbate descriptors
(L/kg) E S A B V L
exp. ACD-Lab derived based on eq. 2 exp
15972-60-8 Alachlor 1.84 1.17 1.24 0.04 1.04 2.140 8.41
1912-24-9 Atrazine 1.82 1.51 1.28 -0.01 0.96 1.620 7.34
131860-33-8 Azoxystrobin 2.44 2.59 2.06 0.16 1.81 2.917 n.a.
741-58-2 Bensulide 3.47 1.64 1.56 0.53 1.47 2.873 n.a.
314-40-9 Bromacil 1.40 1.03 1.08 0.87 0.83 1.631 8.18
298-46-4 Carbamazepine 2.29 2.15 2.00 0.42 0.90 1.811 9.40
63-25-2 Carbaryl 2.31 1.00 1.30 0.46 0.75 1.541 7.81
10605-21-7 Carbendazim 2.96 2.00 1.67 0.56 0.50 1.361 n.a.
510-15-6 Chlorobenzilate 3.26 1.72 0.65 0.09 1.36 2.266 9.74
1897-45-6 Chlorothalonil 2.96 1.64 2.20 -0.25 0.44 1.515 7.65
210880-92-5 Clothianidin 2.05 2.21 2.21 0.86 0.75 1.576 9.50
21725-46-2 Cyanazine 1.76 1.73 1.60 0.27 1.04 1.774 8.29
57966-95-7 Cymoxanil 1.22 0.95 1.93 0.57 0.73 1.455 n.a.
94361-06-5 Cyproconazole 2.30 2.25 1.18 0.35 1.17 2.162 9.55
6190-65-4 Desethylatrazine 1.56 1.50 1.07 0.37 0.88 1.338 6.67
333-41-5 Diazinon 2.46 1.04 0.81 0.06 1.18 2.306 8.00
1085-98-9 Dichlofluanid 1.75 2.43 1.28 0.05 1.07 2.046 8.35
87674-68-8 Dimethenamid 1.75 1.27 1.25 0.02 1.18 2.065 8.22
88-85-7 Dinoseb 0.90 0.17 0.35 1.95 1.687 7.76
330-54-1 Diuron 2.56 1.50 1.59 0.50 0.63 1.599 n.a.
115-29-7 Endosulfan 2.89 2.44 0.82 0.41 0.96 2.082 9.38
26225-79-6 Ethofumesate 1.84 1.20 1.63 0.14 1.02 2.051 8.29
55-38-9 Fenthion 3.44 1.36 1.70 -0.01 0.70 1.988 8.49
79622-59-6 Fluazinam 1.95 1.60 0.44 1.28 1.45 2.364 10.01
103361-09-7 Flumioxazin 2.29 2.61 2.31 -0.04 1.33 2.416 12.00
85509-19-9 Flusilazole 3.02 1.47 1.68 0.34 0.88 2.274 9.33
98886-44-3 Fosthiazate 1.27 1.14 1.32 0.30 1.19 2.091 8.66
72963-72-5 Imiprothrin 2.18 1.65 1.40 0.21 1.37 2.463 9.81
28159-98-0 Irgarol 2.73 1.52 1.55 -0.23 0.97 1.975 8.74
34123-59-6 Isoproturon 1.65 1.20 1.54 0.39 0.88 1.777 n.a.
41394-05-2 Metamitron 1.99 1.89 1.79 0.30 0.94 1.500 8.64
67129-08-2 Metazachlor 1.69 1.62 1.34 0.16 1.24 2.087 8.78
950-37-8 Methidathion 2.16 2.07 1.87 -0.01 0.85 1.889 8.76
51218-45-2 Metolachlor 1.87 1.15 0.95 0.09 1.35 2.281 8.86
19937-59-8 Metoxuron 2.04 1.33 1.80 0.49 0.80 1.676 n.a.
21087-64-9 Metribuzin 1.48 1.61 1.13 0.32 0.86 1.620 7.64
150-68-5 Monuron 2.06 1.36 1.52 0.48 0.71 1.477 n.a.
15299-99-7 Napropamide 2.70 1.51 1.34 0.07 1.18 2.246 9.36
1836-75-5 Nitrofen 3.98 1.78 1.28 -0.30 0.85 1.802 9.25
26530-20-1 Octhilinone 2.75 0.89 1.82 0.10 0.58 1.786 7.88
Page 28 of 39
ACS Paragon Plus Environment
Submitted to Environmental Science & Technology
123456789101112131415161718192021222324252627282930313233343536373839404142434445464748495051525354555657585960
S11
CAS-RN Name log KOC sorbate descriptors
(L/kg) E S A B V L
exp. ACD-Lab derived based on eq. 2 exp
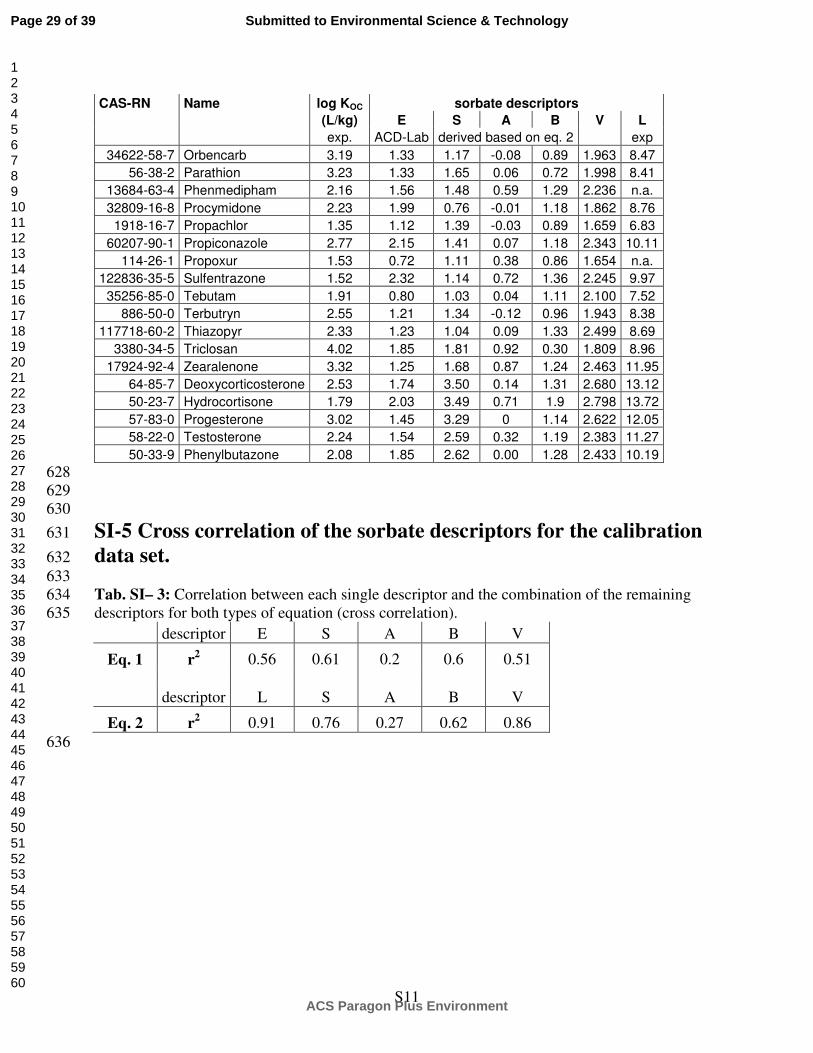
34622-58-7 Orbencarb 3.19 1.33 1.17 -0.08 0.89 1.963 8.47
56-38-2 Parathion 3.23 1.33 1.65 0.06 0.72 1.998 8.41
13684-63-4 Phenmedipham 2.16 1.56 1.48 0.59 1.29 2.236 n.a.
32809-16-8 Procymidone 2.23 1.99 0.76 -0.01 1.18 1.862 8.76
1918-16-7 Propachlor 1.35 1.12 1.39 -0.03 0.89 1.659 6.83
60207-90-1 Propiconazole 2.77 2.15 1.41 0.07 1.18 2.343 10.11
114-26-1 Propoxur 1.53 0.72 1.11 0.38 0.86 1.654 n.a.
122836-35-5 Sulfentrazone 1.52 2.32 1.14 0.72 1.36 2.245 9.97
35256-85-0 Tebutam 1.91 0.80 1.03 0.04 1.11 2.100 7.52
886-50-0 Terbutryn 2.55 1.21 1.34 -0.12 0.96 1.943 8.38
117718-60-2 Thiazopyr 2.33 1.23 1.04 0.09 1.33 2.499 8.69
3380-34-5 Triclosan 4.02 1.85 1.81 0.92 0.30 1.809 8.96
17924-92-4 Zearalenone 3.32 1.25 1.68 0.87 1.24 2.463 11.95
64-85-7 Deoxycorticosterone 2.53 1.74 3.50 0.14 1.31 2.680 13.12
50-23-7 Hydrocortisone 1.79 2.03 3.49 0.71 1.9 2.798 13.72
57-83-0 Progesterone 3.02 1.45 3.29 0 1.14 2.622 12.05
58-22-0 Testosterone 2.24 1.54 2.59 0.32 1.19 2.383 11.27
50-33-9 Phenylbutazone 2.08 1.85 2.62 0.00 1.28 2.433 10.19
628
629
630
SI-5 Cross correlation of the sorbate descriptors for the calibration 631
data set. 632
633
Tab. SI– 3: Correlation between each single descriptor and the combination of the remaining 634
descriptors for both types of equation (cross correlation). 635
descriptor E S A B V
Eq. 1 r2 0.56 0.61 0.2 0.6 0.51
descriptor L S A B V
Eq. 2 r2 0.91 0.76 0.27 0.62 0.86
636
Page 29 of 39
ACS Paragon Plus Environment
Submitted to Environmental Science & Technology
123456789101112131415161718192021222324252627282930313233343536373839404142434445464748495051525354555657585960

S12
SI-6 Properties of Pahokee Peat 637
638
Pahokee Peat, was obtained from the International Humic Substances Society (IHSS) and 639
its properties are shown in Tab.SI-4. 640
641
642
Tab. SI– 4: Properties of Pahokee Peat bulk material; * material dried at 60°C in vacuum 643
soil organic
matter Identity IHSS
rel. amount in
bulk material
rel. amount
in dry
material * relative amount in ash free sample
H2O Ash C H O N S P
% (w/w) % (w/w) --------------------% (w/w)--------------------
Pahokee Peat II
bulk material PPII 2S103P 6.2 12.7 46.9 3.9 30.3 3.42 0.58 --
644 Source: Elemental analyses by Huffman Laboratories, Wheat Ridge, CO, USA; Isotopic analyses by Soil 645 Biochemistry Laboratory, Dept. of Soil, Water, and Climate, University of Minnesota, St. Paul, MN, USA 646 H2O content is the %(w/w) of H2O in the air-equilibrated sample (a function of relative humidity). 647 Ash is the %(w/w) of inorganic residue in a dry sample. 648 C, H, O, N, S, and P are the elemental composition in %(w/w) of a dry, ash-free sample. 649 The data for bulk source materials are reported on an as-stored basis, except that %H and %O are corrected for 650 water content. 651 nd means that an item was not determined. 652
653
654
655 656 Fig. SI– 2: Scanning electron microscope image of the peat material 657 658
659
660
Page 30 of 39
ACS Paragon Plus Environment
Submitted to Environmental Science & Technology
123456789101112131415161718192021222324252627282930313233343536373839404142434445464748495051525354555657585960
S13
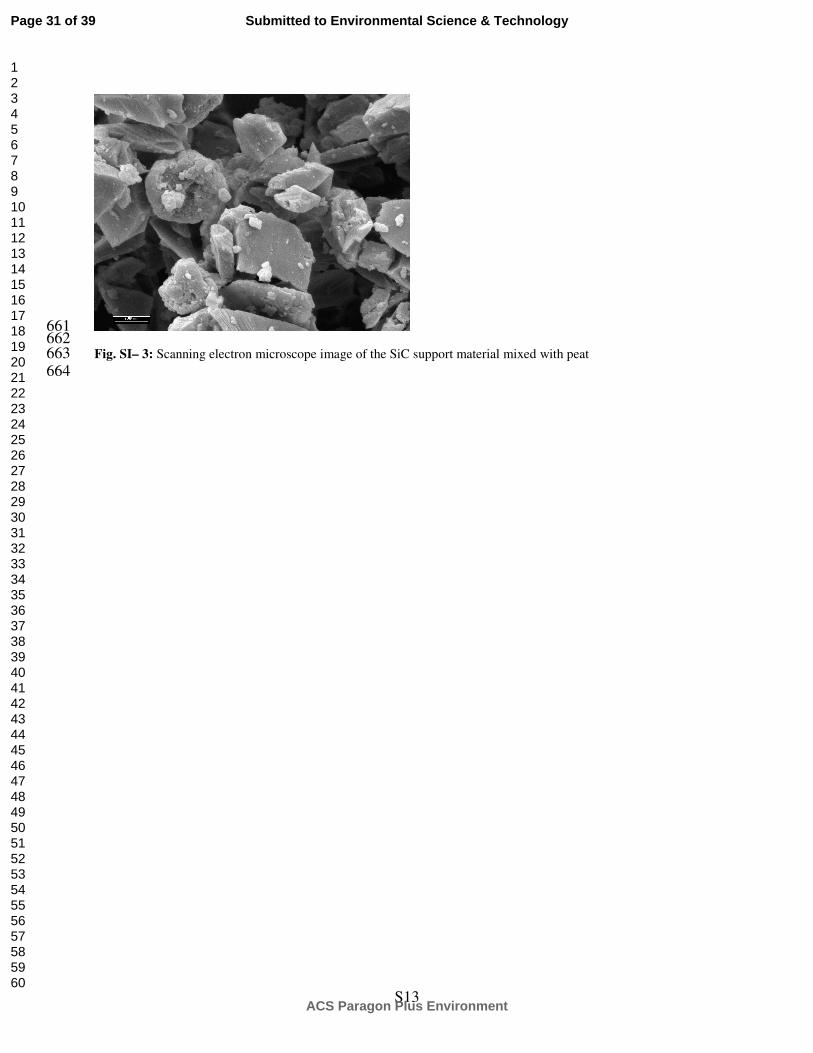
661 662 Fig. SI– 3: Scanning electron microscope image of the SiC support material mixed with peat 663 664
Page 31 of 39
ACS Paragon Plus Environment
Submitted to Environmental Science & Technology
123456789101112131415161718192021222324252627282930313233343536373839404142434445464748495051525354555657585960

S14
SI-7 Theoretical Evaluation of the Equilibrium Assumption. 665
666
Realisation of a sorption equilibrium in the experimental system is a fundamental prerequisite for 667
the correct determination of sorption coefficients. The kinetically limiting step is diffusion of the 668
sorbate into the sorbent whereas diffusion through the aqueous phase is comparatively fast. The 669
time that is required for attaining equilibrium increases with decreasing diffusion coefficients and 670
it increases non-linearly with the diffusion path length. Hence, much smaller equilibration times 671
are needed if the sorbent is supplied in the form of thin films or particles where the maximal 672
diffusion path lengths are small. Gas chromatography nicely illustrates this effect: a sorbent film 673
thickness of 1 µm or less allows for a linear gas phase velocity of more than 30 m/min without 674
violating the equilibrium requirement. Therefore, considerable effort was spent to reduce the 675
particle size of our sorbents as much as possible. For Pahokee Peat we ended up with particles 676
smaller than 20 µm. The sorption kinetics of a typical particle of 12 µm diameter can be 677
calculated by using the appropriate equation for spherical diffusion [1]. If the sorption kinetics 678
model is combined with a convective-dispersive transport model (AQUASIM 2.0, [2] one can 679
calculate how small the diffusion coefficients into the sorbent can be without violating our 680
equilibrium assumption. The calculations revealed that the diffusion coefficient into spherical 681
sorbents of 12 µm diameter may be as small as 10-11
cm2/sec for the typical linear flow velocity 682
that was applied in our experiments (2.4 cm/min corresponding to a volume flow of 0.05 ml/min) 683
without violating our equilibrium assumption. As a comparison we note that diffusion 684
coefficients typically observed in peat are in the order of 10-9
cm2/sec [3,4]. These conditions can 685
be compared with those of batch sorption experiments that usually last between 2 and 30 days 686
and that use particle sizes in the range of 100 and 2000 µm diameter. Table 3 gives the diffusion 687
coefficients that would still allow to achieve more than 80% of the equilibrium sorption for the 688
given equilibration time and particle diameter in those batch experiments. 689
690
Page 32 of 39
ACS Paragon Plus Environment
Submitted to Environmental Science & Technology
123456789101112131415161718192021222324252627282930313233343536373839404142434445464748495051525354555657585960

S15
Tab. SI– 5: Diffusion coefficients of the sorbate into the sorbent particles that would allow to 691
obtain more than 80% of the equilibrium sorption for the given combination of sorbent particle 692
diameter and equilibration time (based on calculations for spherical diffusion) 693
particle diameter
(µm)
equilibration time
(days)
2 7 30
100 2E-11 cm2/sec 5E-12 cm
2/sec 1.5E-12 cm
2/sec
300 2E-10 cm2/sec 5E-11 cm
2/sec 1.5E-11 cm
2/sec
1000 2E- 9 cm2/sec 5E-10 cm
2/sec 1.5E-10 cm
2/sec
694
This comparison suggests that the conditions in our flow-through experiment allowed slower 695
sorption processes to come into equilibrium than most batch experiments do. 696
697
References SI-7 698
[1] Schwarzenbach, R. P.; Gschwend, P. M.; Imboden, D. M. Environmental Organic 699
Chemistry; 2. ed.; John Wiley & Sons: Hoboken, 2003. 700
[2] Reichert, P.; 2.0 ed.; Swiss Federal Institute of Environmental Science and Technology 701
(EAWAG): Dübendorf, 1998; p Computer Program for the Identification and Simulation 702
of Aquatic Systems. 703
[3] Piatt, J. J.; Brusseau, M. L. Environ. Sci. Technol. 1998, 32, 1604-1608. 704
[2] Chang, M.-L.; Wu, S.-C.; Chen, C.-Y. Environ. Sci. Technol. 1997, 31, 2307-2312. 705
706
707
Page 33 of 39
ACS Paragon Plus Environment
Submitted to Environmental Science & Technology
123456789101112131415161718192021222324252627282930313233343536373839404142434445464748495051525354555657585960
S16
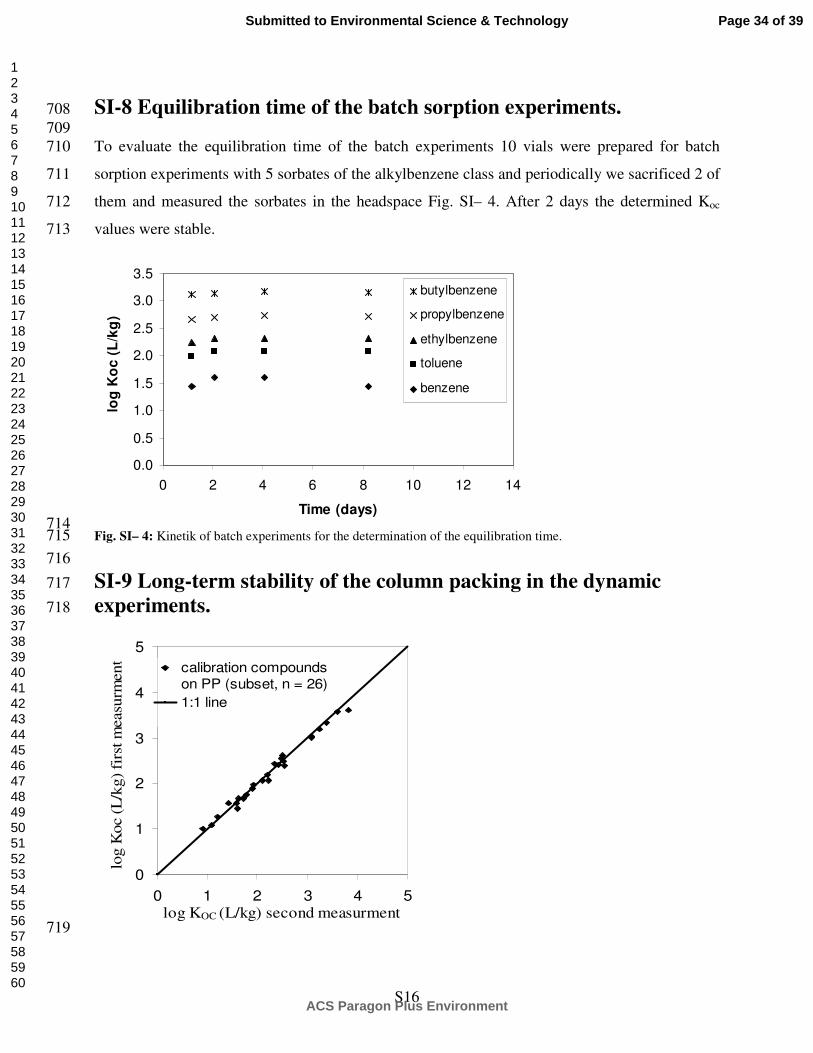
SI-8 Equilibration time of the batch sorption experiments. 708
709
To evaluate the equilibration time of the batch experiments 10 vials were prepared for batch 710
sorption experiments with 5 sorbates of the alkylbenzene class and periodically we sacrificed 2 of 711
them and measured the sorbates in the headspace Fig. SI– 4. After 2 days the determined Koc 712
values were stable. 713
0.0
0.5
1.0
1.5
2.0
2.5
3.0
3.5
0 2 4 6 8 10 12 14
Time (days)
log
Ko
c (
L/k
g)
butylbenzene
propylbenzene
ethylbenzene
toluene
benzene
714 Fig. SI– 4: Kinetik of batch experiments for the determination of the equilibration time. 715
716
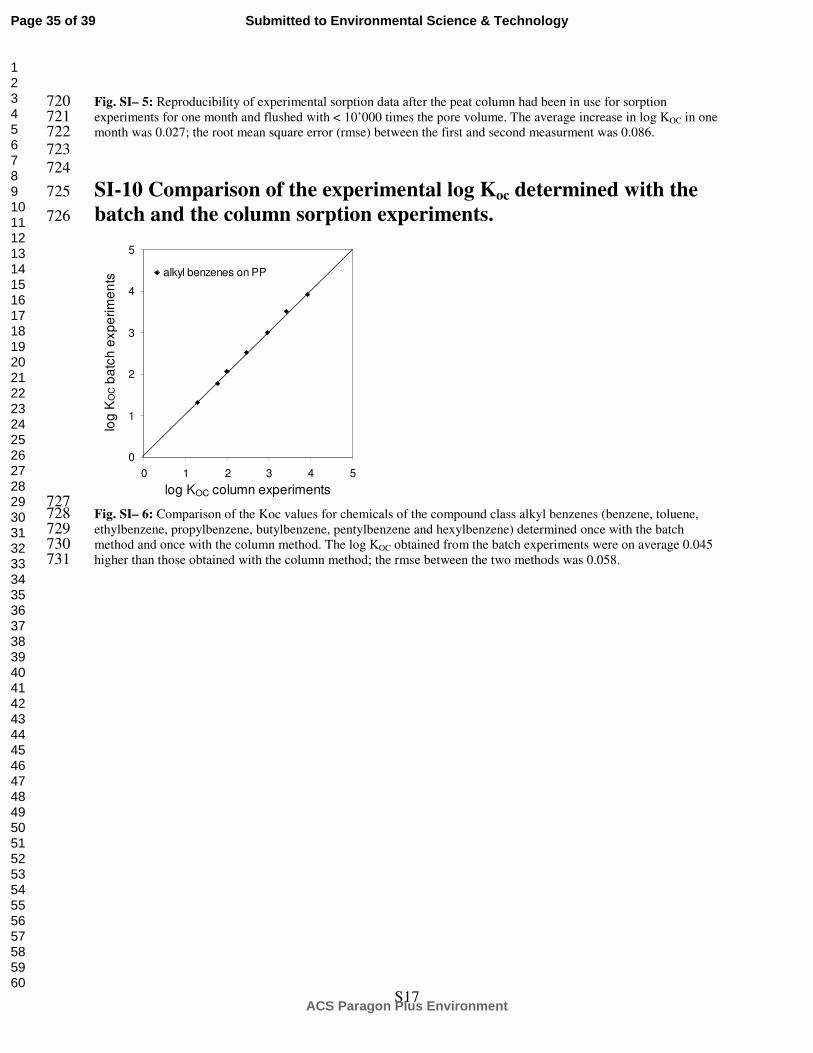
SI-9 Long-term stability of the column packing in the dynamic 717
experiments. 718
0
1
2
3
4
5
0 1 2 3 4 5log KOC (L/kg) second measurment
log K
oc (
L/k
g)
firs
t m
easu
rment.. calibration compounds
on PP (subset, n = 26)
1:1 line
719
Page 34 of 39
ACS Paragon Plus Environment
Submitted to Environmental Science & Technology
123456789101112131415161718192021222324252627282930313233343536373839404142434445464748495051525354555657585960
S17
Fig. SI– 5: Reproducibility of experimental sorption data after the peat column had been in use for sorption 720 experiments for one month and flushed with < 10’000 times the pore volume. The average increase in log KOC in one 721 month was 0.027; the root mean square error (rmse) between the first and second measurment was 0.086. 722 723
724
SI-10 Comparison of the experimental log Koc determined with the 725
batch and the column sorption experiments. 726
0
1
2
3
4
5
0 1 2 3 4 5
log KOC column experiments
log
KO
C b
atc
h e
xp
erim
en
ts
alkyl benzenes on PP
727 Fig. SI– 6: Comparison of the Koc values for chemicals of the compound class alkyl benzenes (benzene, toluene, 728 ethylbenzene, propylbenzene, butylbenzene, pentylbenzene and hexylbenzene) determined once with the batch 729 method and once with the column method. The log KOC obtained from the batch experiments were on average 0.045 730 higher than those obtained with the column method; the rmse between the two methods was 0.058. 731
Page 35 of 39
ACS Paragon Plus Environment
Submitted to Environmental Science & Technology
123456789101112131415161718192021222324252627282930313233343536373839404142434445464748495051525354555657585960
S18
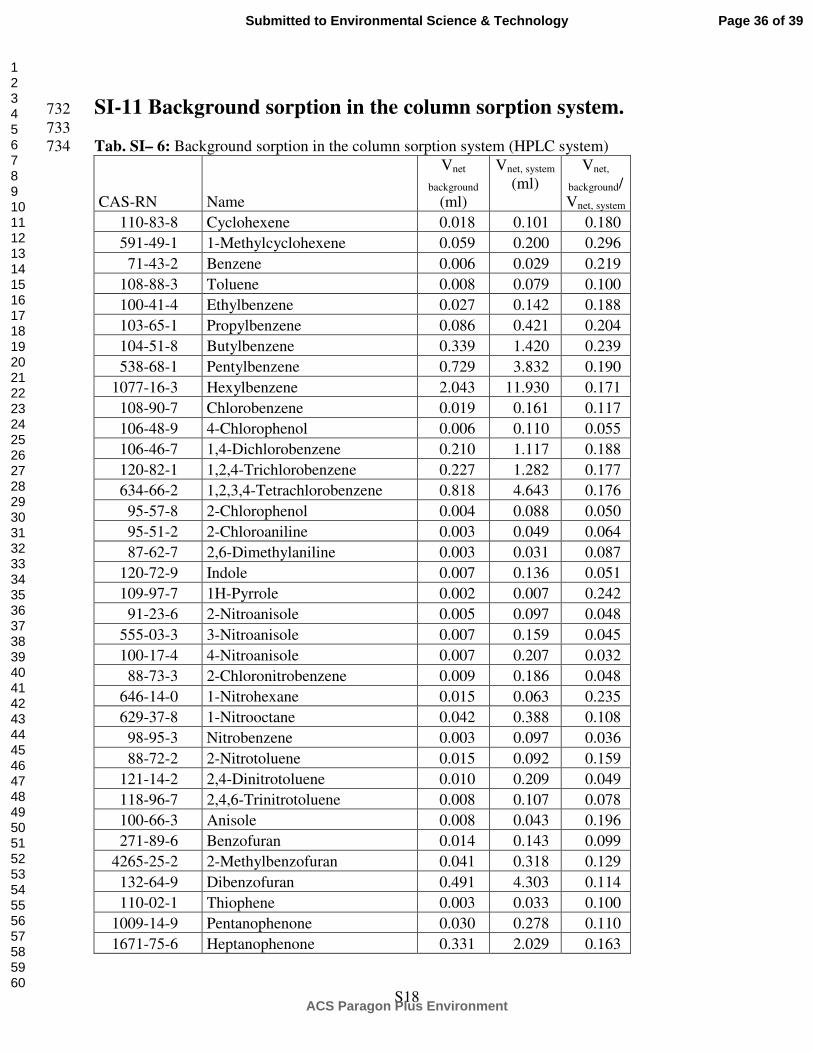
SI-11 Background sorption in the column sorption system. 732
733
Tab. SI– 6: Background sorption in the column sorption system (HPLC system) 734
CAS-RN Name
Vnet
background
(ml)
Vnet, system
(ml)
Vnet,
background/
Vnet, system
110-83-8 Cyclohexene 0.018 0.101 0.180
591-49-1 1-Methylcyclohexene 0.059 0.200 0.296
71-43-2 Benzene 0.006 0.029 0.219
108-88-3 Toluene 0.008 0.079 0.100
100-41-4 Ethylbenzene 0.027 0.142 0.188
103-65-1 Propylbenzene 0.086 0.421 0.204
104-51-8 Butylbenzene 0.339 1.420 0.239
538-68-1 Pentylbenzene 0.729 3.832 0.190
1077-16-3 Hexylbenzene 2.043 11.930 0.171
108-90-7 Chlorobenzene 0.019 0.161 0.117
106-48-9 4-Chlorophenol 0.006 0.110 0.055
106-46-7 1,4-Dichlorobenzene 0.210 1.117 0.188
120-82-1 1,2,4-Trichlorobenzene 0.227 1.282 0.177
634-66-2 1,2,3,4-Tetrachlorobenzene 0.818 4.643 0.176
95-57-8 2-Chlorophenol 0.004 0.088 0.050
95-51-2 2-Chloroaniline 0.003 0.049 0.064
87-62-7 2,6-Dimethylaniline 0.003 0.031 0.087
120-72-9 Indole 0.007 0.136 0.051
109-97-7 1H-Pyrrole 0.002 0.007 0.242
91-23-6 2-Nitroanisole 0.005 0.097 0.048
555-03-3 3-Nitroanisole 0.007 0.159 0.045
100-17-4 4-Nitroanisole 0.007 0.207 0.032
88-73-3 2-Chloronitrobenzene 0.009 0.186 0.048
646-14-0 1-Nitrohexane 0.015 0.063 0.235
629-37-8 1-Nitrooctane 0.042 0.388 0.108
98-95-3 Nitrobenzene 0.003 0.097 0.036
88-72-2 2-Nitrotoluene 0.015 0.092 0.159
121-14-2 2,4-Dinitrotoluene 0.010 0.209 0.049
118-96-7 2,4,6-Trinitrotoluene 0.008 0.107 0.078
100-66-3 Anisole 0.008 0.043 0.196
271-89-6 Benzofuran 0.014 0.143 0.099
4265-25-2 2-Methylbenzofuran 0.041 0.318 0.129
132-64-9 Dibenzofuran 0.491 4.303 0.114
110-02-1 Thiophene 0.003 0.033 0.100
1009-14-9 Pentanophenone 0.030 0.278 0.110
1671-75-6 Heptanophenone 0.331 2.029 0.163
Page 36 of 39
ACS Paragon Plus Environment
Submitted to Environmental Science & Technology
123456789101112131415161718192021222324252627282930313233343536373839404142434445464748495051525354555657585960

S19
CAS-RN Name
Vnet
background
(ml)
Vnet, system
(ml)
Vnet,
background/
Vnet, system
93-58-3 Methyl benzoate 0.005 0.047 0.106
93-89-0 Ethyl benzoate 0.009 0.108 0.085
136-60-7 Butyl benzoate 0.076 0.282 0.269
84-66-2 Diethyl phthalate 0.007 0.047 0.140
131-16-8 Di-n-propyl phthalate 0.036 0.157 0.230
84-74-2 Di-n-butyl phthalate 0.325 2.194 0.148
131-18-0 Di-n-pentyl phthalate 3.062 9.391 0.326
91-15-6 1,2-Dicyanobenzene 0.002 0.060 0.034
91-20-3 Naphthalene 0.069 0.429 0.161
573-98-8 1,2-Dimethylnaphthalene 0.504 5.704 0.088
83-32-9 Acenaphthene 0.352 2.303 0.153
86-73-7 Fluorene 0.604 5.634 0.107
85-01-8 Phenanthrene 1.817 23.490 0.077
90-15-3 1-Naphthol 0.027 0.301 0.091
64-85-7 Deoxycorticosterone 0.056 0.454 0.123
50-28-2 Estradiol 0.064 0.744 0.086
50-23-7 Hydrocortisone 0.011 0.084 0.126
58-22-0 Testosterone 0.078 0.286 0.273
57-83-0 Progesterone 0.186 1.420 0.131
80-05-7 Bisphenol A 0.067 0.432 0.155
100-02-7 4-Nitrophenol 0.008 0.275 0.028
95-77-2 3,4-Dichlorophenol 0.035 0.330 0.108
95-95-4 2,4,5-Trichlorophenol 0.135 1.088 0.124
735
Page 37 of 39
ACS Paragon Plus Environment
Submitted to Environmental Science & Technology
123456789101112131415161718192021222324252627282930313233343536373839404142434445464748495051525354555657585960

S20
SI-12 Performance of pp-LFER predictions for log Koc from the 736
literature for the calibration data set of this work. 737
738
739
740 Fig. SI– 7: Comparison of experimental Koc values for the calibration data on Pahokee peat (this work) with the 741 predictions of 3 pp-LFER from the literature. Endo et al. 2009, equation for Pahokee Peat at high concentrations 742 (left) [1], Nguyen et al. 2007 (middle) [2], Niederer et al. 2006, equation for Leonardite humic acid (right) [3]. 743 744
745
746
Tab. SI– 7: comparison of the fitted pp-LFER system coefficients for SOM/water partitioning 747
from the different literatures and from this work. 748
749
l v b a s e c R2 SE n
Poole et Poole 1996 [4] 2.09 -2.27 -0.31 0 0.74 0.21 0.98 0.25 131
SE 0.1 0.11 0.09 0.04 0.09
Thanh et al. 2005 [2] 2.28 -1.98 0.15 -0.72 1.1 0.14 0.98 0.26 74
SE 0.14 0.14 0.15 0.14 0.10 0.10
Endo et al. 2009 [1]
(at low conc.) 3.71 -3.94 -0.1 1.27 0.31 -1.04 0.91 0.34 51
SE 0.22 0.35 0.25 0.29 0.2 0.24
Endo et al. 2009 [1]
(at high conc.) 3.51 -3.83 0.02 0.19 0.43 -0.82 0.90 0.35 51
SE 0.22 0.35 0.25 0.29 0.21 0.24
this work (Eq. 1) 2.99 -3.44 -0.21 -0.61 0.81 -0.29 0.92 0.25 79
SE 0.11 0.18 0.14 0.11 0.08 0.12
this work (Eq. 2) 0.54 1.20 -3.34 -0.42 -0.98 0.02 0.929 0.24 79
SE 0.05 0.20 0.1 0.14 0.13 0.12
SE: standard error 750
751
752
Page 38 of 39
ACS Paragon Plus Environment
Submitted to Environmental Science & Technology
123456789101112131415161718192021222324252627282930313233343536373839404142434445464748495051525354555657585960

S21
Tab. SI– 8: comparison of range of the compound descriptors of the calibration compounds used 753
to derive the pp-LFER equation for SOM/water partitioning in the literature and in this work. 754
755
V B A S E
Poole et Poole 1996 [4] min 0.47 0.00 0.00 0.34 0.20
max 1.95 0.88 1.10 2.17 4.00
range 1.48 0.88 1.10 1.83 3.80
Thanh et al. 2005 [2] min 0.71 0.00 0.00 0.40 0.37
max 2.30 1.05 0.97 1.90 2.85
range 1.59 1.05 0.97 1.50 2.48
Endo et al. 2009 [1] min 0.49 0.00 0.00 0.00 0.00
max 1.58 0.60 0.73 1.59 2.38
range 1.09 0.60 0.73 1.59 2.38
this work min 0.64 0.00 0.00 0.00 -0.24
max 2.56 1.10 0.99 1.95 2.06
range 1.91 1.10 0.99 1.95 2.29
756
757
758
759
References SI-12 760
[1] Endo, S.; Grathwohl, P.; Haderlein, S. B.; Schmidt, T. C. Environmental Science & 761
Technology 2009, 43, 3094-3100. 762
[2] Nguyen, T. H.; Goss, K.-U.; Ball, W. P. Environ. Sci Technol. 2005, 39, 913-924. 763
[3] Niederer, C.; Goss, K.-U.; Schwarzenbach, R. P. Environ. Sci Technol. 2006, 40, 5374-764
5379. 765
[4] Poole, S. K.; Poole, C. F. Analytical Communications 1996, 33, 417-419. 766
767
768
Page 39 of 39
ACS Paragon Plus Environment
Submitted to Environmental Science & Technology
123456789101112131415161718192021222324252627282930313233343536373839404142434445464748495051525354555657585960