Field Scale DNAPLs Transport Under Nonequilibrium Sorption Conditions
18
Journal of Environmental Science and Health Part A, 41:273–290, 2006 Copyright C Taylor & Francis Group, LLC ISSN: 1093-4529 (Print); 1532-4117 (Online) DOI: 10.1080/10934520500423097 Field Scale DNAPLs Transport Under Nonequilibrium Sorption Conditions Ashraf A. Ahmed 1 and Daoyi Chen 2 1 School of Mechanical, Aerospace, and Civil Engineering, The University of Manchester, Manchester M60 1QD, United Kingdom 2 Department of Engineering, The University of Liverpool, Liverpool, L69 3BX, United Kingdom The purpose of this work is to study the desorption of dense nonaqueous phase liquids (DNAPLs), TCE in particular, from solid particles in field scale heterogeneous aquifers upon their remediation. A computer program, capable of simulating the fate and trans- port of NAPLs in porous media, has been developed to work under nonequilibrium sorption conditions. The model has been applied to a field scale site at Hill Air Force Base, Utah, which has been contaminated by DNAPLs. The simulated domain was 155 ft (47.25 m) long, 60 ft (18.29 m) wide, and 15.5 ft (4.72 m) thick. This thickness represents only the saturated zone of the aquifer. Changes in permeability, grain size distribution, and sorptive properties throughout the site have been incorporated into the model. Im- mediately after the aquifer cleanup, the DNAPL concentration in the aqueous phase was assumed to be zero, and this was considered the start-off time for the simulation. Results show that, with an increase in time, the TCE diffused out of the solid particles, forming a plume. The rate of contaminant diffusion was observed to be very fast at the start, followed by a very slow stage, with a number of years required for substantial desorption of the contaminant from the solid particles. There were local variations in contaminant concentration in the fluid phase across the site due to aquifer heterogene- ity. A comparison between numerical results and water samples taken from the site after the end of the cleanup operation is also presented. Key Words: Nonaqueous phase liquids; Intraparticle diffusion; Sorption kinetics; Contaminant transport. INTRODUCTION Sorption experiments carried out in the laboratory are normally conducted on soil specimens ranging from a few grams in batch experiments to a few tens Received June 16, 2005. Address correspondence to Daoyi Chen, Department of Engineering, The University of Liverpool, Liverpool, L69 3BX, UK; E-mail: daoyi [email protected] 273
Transcript of Field Scale DNAPLs Transport Under Nonequilibrium Sorption Conditions
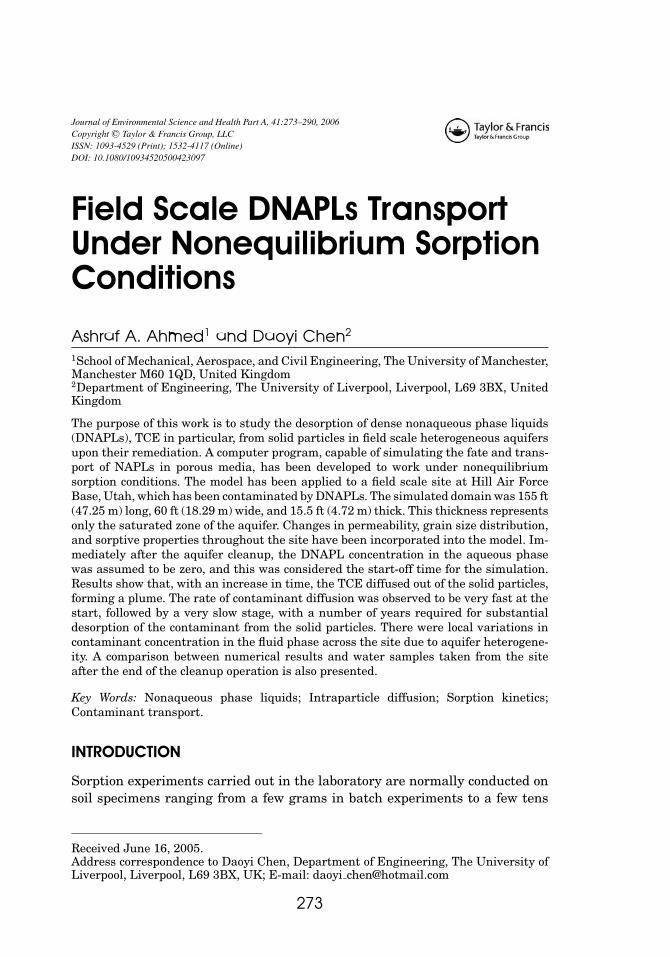
Journal of Environmental Science and Health Part A, 41:273–290, 2006Copyright C© Taylor & Francis Group, LLCISSN: 1093-4529 (Print); 1532-4117 (Online)DOI: 10.1080/10934520500423097
Field Scale DNAPLs TransportUnder Nonequilibrium SorptionConditions
Ashraf A. Ahmed1 and Daoyi Chen2
1School of Mechanical, Aerospace, and Civil Engineering, The University of Manchester,Manchester M60 1QD, United Kingdom2Department of Engineering, The University of Liverpool, Liverpool, L69 3BX, UnitedKingdom
The purpose of this work is to study the desorption of dense nonaqueous phase liquids(DNAPLs), TCE in particular, from solid particles in field scale heterogeneous aquifersupon their remediation. A computer program, capable of simulating the fate and trans-port of NAPLs in porous media, has been developed to work under nonequilibriumsorption conditions. The model has been applied to a field scale site at Hill Air ForceBase, Utah, which has been contaminated by DNAPLs. The simulated domain was 155 ft(47.25 m) long, 60 ft (18.29 m) wide, and 15.5 ft (4.72 m) thick. This thickness representsonly the saturated zone of the aquifer. Changes in permeability, grain size distribution,and sorptive properties throughout the site have been incorporated into the model. Im-mediately after the aquifer cleanup, the DNAPL concentration in the aqueous phasewas assumed to be zero, and this was considered the start-off time for the simulation.Results show that, with an increase in time, the TCE diffused out of the solid particles,forming a plume. The rate of contaminant diffusion was observed to be very fast at thestart, followed by a very slow stage, with a number of years required for substantialdesorption of the contaminant from the solid particles. There were local variations incontaminant concentration in the fluid phase across the site due to aquifer heterogene-ity. A comparison between numerical results and water samples taken from the siteafter the end of the cleanup operation is also presented.
Key Words: Nonaqueous phase liquids; Intraparticle diffusion; Sorption kinetics;Contaminant transport.
INTRODUCTION
Sorption experiments carried out in the laboratory are normally conducted onsoil specimens ranging from a few grams in batch experiments to a few tens
Received June 16, 2005.Address correspondence to Daoyi Chen, Department of Engineering, The University ofLiverpool, Liverpool, L69 3BX, UK; E-mail: daoyi [email protected]
273

274 Ahmed and Chen
of grams in column experiments. As a consequence, the heterogeneity encoun-tered in the field scale sites would not be reflected in these sorption experi-ments. While a tremendous volume of research exists which examines the fateand transport of organic chemicals in porous media, field scale problems havereceived little attention. This, in general, is attributable to the facts of high costand the need for numerous data to analyse a field scale site.
Sorption is always viewed as a diffusion rate-limited process.[1,2] The size ofparticles is a very important factor in the diffusion model as will be seen in thenext section. Many studies suggest the particle radius as the path-length forcontaminants to transfer from the mobile to the immobile region.[1,3] The factthat particle size varies locally within the same field site suggests an expectedlarge variation in sorption rate towards attaining equilibrium.
It is not only particle size variations across the field sites that can alter sorp-tion properties from one location to another. Examples of other parameters existthat can affect the nonequilibrium sorption process: the rate of contaminant dif-fusion into and from solid particles, sorption isotherm parameters (distributioncoefficient Kd in the case of linear sorption or Freundlich parameters Kfr and nin the case of non-linear sorption), and porosity which will in turn change thesolid/water ratio. These parameters will vary greatly from one point to anotherthroughout the site.
The main objective of this research is to study the sorption nonequilib-rium process at field scale. At present, many computer models that simulatefield scale problems are based on the assumption of local sorption equilibrium.In addition, sorption is also assumed to be linear in many of these models.Moreover, the media is sometimes assumed to be homogeneous. The reasonsfor the adoption of these assumptions are mainly to simplify the computationsand to reduce computational efforts. As reported by many investigators,[1,3,4−10]
the sorption equilibrium assumption has been proved to be incorrect in manycases. Also it is common that the association of contaminant solutes to solidparticles within the subsurface environment deviates from linearity.[11] A fur-ther complication is that, the real field sites are inevitably heterogeneous. Thisleads to a conclusion that, results obtained from computer models based onthese simplified assumptions will not be accurate under many field conditions.Consequently, there is a compelling need to develop computer codes that canmodel the phenomena of sorption kinetics combined with nonlinear sorption,which can be applied at field scale. Since such codes are going to be used forfield scale simulations, other transport and fate processes have to be taken intoconsideration.
A readily available software package UTCHEM has been originally devel-oped by University of Texas with an equilibrium sorption assumption. In thepresent study, a nonequilibrium sorption model has been built and then mergedwith UTCHEM to simulate NAPL fate and transport in the subsurface undernonequilibrium sorption conditions. This enabled the prediction of contaminant

Desorption of DNAPLs 275
diffusion from the solid particles following the site cleanup, a feature whichwas not incorporated in the original UTCHEM but has been developed in thepresent study. Also by adding the nonequilibrium sorption kinetics model toUTCHEM, both solid-phase and fluid-phase concentrations can be monitoredmore accurately after the contaminant spills to the subsurface environment.In the following sections, the development of the nonequilibrium model and itsmerging with UTCHEM will be presented first. The description of the field siteand the presentation of simulation results will follow. Comparisons betweennumerical results and results from the field are also presented. Finally, aftersome discussions, conclusions are drawn.
MODEL DEVELOPMENT
Intraparticle Pore Diffusion ModelMany models have been suggested in order to interpret the nonequi-
librium transfer of organic chemicals from the aqueous phase to the solidparticles’ phase, and vice versa. Some investigators have used first order ornon-linear mass transfer expressions.[12−14] Others have interpreted slow sorp-tion/desorption as diffusion from the mobile to immobile region.[1,3,4,6−10,15] TheDiffusion model has been reported to give more accurate results than those ob-tained from the first-order mass transfer model.[2,5,16] In fact a diffusion mech-anism is implicitly implemented in mass transfer models or two-site modelsalthough these models use first order expressions for simplicity.[17]
In the diffusion model, the solute diffusion from the bulk fluid into intra-particle region can be described with Fick’s second law expressed in sphericalcoordinates:[18]
∂S∂t
= De
[∂2S∂r2
+ 2r
∂S∂r
](1)
Where S is the pore water solute concentration [ML−3] or [MM−1] varying asa function of radial distance r [cm] from the centre of the natural aggregateparticles, t is the time [sec], and De [cm2/sec] is the effective diffusivity. Theboundary condition at a particle’s surface will be as follows:[4]
S = KfrCn (2)
In which C is the bulk solute concentration [ML−3], and Kfr[cm3/g] and n [−]are isotherm parameters. Equation (1) assumes particles to be homogeneousand have a spherical shape. This equation is normally solved either using ananalytical solution or any numerical method. In the numerical model appliedhere, the finite difference method is used. Both explicit, implicit, and Crank–Nicholson schemes are adopted. The explicit form of Eq. (1) can be written as

276 Ahmed and Chen
follows:
Sk+1j − Sk
j
�t= De
[ Skj+1 − 2Sk
j + Skj−1
(�r)2+ 2
r
Skj+1 − Sk
j−1
2�r
](3)
After rearranging and setting r = j�r, where j is the number of points in theradial direction of particle, gives:
Sk+1j = De
�t�r2
[(1 + 1
j
)Sk
j+1 − 2Skj +
(1 − 1
j
)Sk
j−1
]+ Sk
j (4)
Where �t is the time step increment. The value of De�t�r2 < 0.50 should be
verified to avoid any numerical instability. In the implicit form, Eq. (1) canbe written as follows:
Sk+1j − Sk
j
�t= De
[ Sk+1j+1 − 2Sk+1
j + Sk+1j−1
(�r)2+ 2
r
Sk+1j+1 − Sk+1
j−1
2�r
](5)
After rearranging and setting r = j�r, gives:
− De�t�r2
Sk+1j+1
[1 + 1
j
]+ Sk+1
j
[2
De�t�r2
+ 1]
+ De�t�r2
Sk+1j−1
[−1 + 1
j
]= Sk
j (6)
The explicit and implicit finite difference schemes can be averaged to yield theCrank–Nicholson scheme. Thus:
Sk+1j − Sk
j
�t= 1
2De
[ Sk+1j+1 − 2Sk+1
j + Sk+1j−1
(�r)2+ 2
r
Sk+1j+1 − Sk+1
j−1
2�r
]
+ 12
De
[ Skj+1 − 2Sk
j + Skj−1
(�r)2+ 2
r
Skj+1 − Sk
j−1
2�r
](7)
After rearranging it gives:
− De�t2�r2
Sk+1j+1
[1 + 1
j
]+ Sk+1
j
[De�t�r2
+ 1]
+ De�t2�r2
Sk+1j−1
[−1 + 1
j
]
= De�t2�r2
Skj+1
[1 + 1
j
]+ Sk
j
[− De�t
�r2+ 1
]+ De�t
2�r2Sk
j−1
[1 − 1
j
](8)
In the case of the implicit and Crank–Nicholson schemes, a system of equa-tions is obtained with the sorbed phase concentration as the only unknown atdifferent nodes. The Thomas Algorithm is used to solve these equations.[19] Theabove equations have been implemented by building a computer program usingthe FORTRAN 90. A complete description of the model and its validation andapplications can be found in Ahmed and Chen.[9]

Desorption of DNAPLs 277
Merging the Model with UTCHEMMany computer models were available to simulate Nonaqueous Phase Liq-
uids fate and transport in porous media. Three of these models, which are NAPLSIMULATOR,[20] UTCHEM,[21] and EPACMOW[22] were reviewed, in order toverify the underlying assumptions upon which each model was developed, andthe suitability for applying it to field-scale problems. A detailed review of thesecomputer codes is presented in Ahmed.[15] A common feature among the threemodels is that they are based on equilibrium sorption assumption.
UTCHEM is employed in this study due to its capability to simulate three-dimensional problems. UTCHEM is a three-dimensional finite difference modelfor multiphase flow and transport in porous media. Most of physical, chem-ical and biological processes, important in describing the fate and transportof NAPLs in contaminated aquifers, have been taken into consideration. Themodel can simulate multiple organic NAPL phases; the dissolution and/or mo-bilisation of NAPLs by nondilute remedial fluids; chemical and microbiologicaltransformations; changes in fluid properties as a site is remediated.[23] A fulldescription of the model can be found in Delshad et al.[21]
Because the original UTCHEM is based on the equilibrium sorption as-sumption, a number of developments are needed to tackle sorption kineticsproblems. In order to achieve this, the computer code developed by Ahmed andChen[9] as shown before, was merged with UTCHEM. This was achieved byadding four subprograms and calling them from the main file of UTCHEM.The user has the option to do the field simulation based on the equilibriumsorption calculations, or to do it based on sorption kinetics calculations. Threeof the new four subprograms added to UTCHEM are the calculations of thesorption kinetics of organic pollutants using the three different finite differ-ence schemes; implicit, explicit, and Crank-Nicholson. The fourth one setsthe sorption-intent initial conditions at the start-off time zero. The resul-tant code, UTCHEM-MANSK, has the capability to simulate NAPLs flow andtransport in porous media with an assumption that the sorption/desorptionof the dissolved species of NAPLs to/from the soil particles is nonequilibrium.It is able to take the grain size distribution into consideration. After incor-porating the diffusion model, contaminant concentration distribution withineach particle size throughout the site can be obtained at any time throughthe course of the simulation. Such contaminant concentration distributionshould also be given input as the initial conditions at the beginning of thesimulation.
The sorption kinetics related parameters, which are needed to runUTCHEM-MANSK are: density of solid particles, field porosity, grain size dis-tribution, sorption isotherm parameters (Kd in case of linear sorption or Kfr, andn in case of the nonlinear sorption model), the initial contaminant concentra-tion associated with solid phase for all particle sizes, and the effective diffusion

278 Ahmed and Chen
coefficient (obtained by conducting batch experiments on the soil samples fromthe field).
Hill AFB Site History and DescriptionThe field site subject to investigation here is the Hill Air Force Base, Oper-
able Unit 2, (Hill AFB OU2), situated in the north-central Utah, USA. The HillAFB has been known as a major contaminated field site. Records indicate thatthe AFB OU2 site was used from 1967 to 1975 to dispose of unknown quanti-ties of chlorinated organic solvents from degreasing operations. These DNAPLs,primarily trichloroethene (TCE), were placed into at least two unlined disposaltrenches underlain by an alluvial aquifer. This shallow, unconfined aquifer com-prises a heterogeneous mixture of sand and gravel and is contained in a buriedpaleochannel eroded into thick clay deposits. The Alpine Formation underneaththe channel is of the order of a hundred meters thick and bounds the aquiferbelow and to the east and west, which forms a very effective aquiclude for theaquifer. The aquifer is in a narrow channel with a north to south trend. It isalso believed that in the early 1940s, plating tank bottoms were disposed ofat this site.[24] From October 1993 to June 1994, approximately 87,000 litresof pure phase DNAPL and over 3,800,000 litres of contaminated groundwaterwere recovered from the OU2 area.[25] Groundwater flow is towards the north-east, and varies in direction and magnitude seasonally. The site was sweptout using surfactant in November 2001 in order to clean it from the DNAPLscontamination.
Data Input to the CodeThe field dimensions were 155 ft (47.25 m) in length, 60 ft (18.29 m) in width,
and 15.5 ft (4.72 m) thick. The thickness here represents only the saturatedzone of the aquifer. The mesh used, as shown in Figure 1, was 42 blocks in thelength direction, 20 blocks in the width direction, and 24 blocks vertically inthe direction of aquifer depth. The trench-like configuration of the aquifer wassimulated by specifying low permeability and porosity boundaries on the sidesand bottom of the aquifer.
Only borehole samples of 4 different locations in the field were available,and hence the soil properties and other parameters needed for the code areknown only at these boreholes. The method of natural neighbour was appliedfor the purpose of interpolation. Therefore, the soil permeability, distributioncoefficient Kd, intraparticle diffusion coefficient, and the solid phase concentra-tion of TCE have been interpolated throughout the site based on their valuesat the boreholes. Likewise, the grain size distribution was interpolated basedon its values at different boreholes that are shown in Figure 2. Therefore eachgrid point has its different grain size distribution from others. The value of

Desorption of DNAPLs 279
Figure 1: Model grid and well pattern, Panel one.

280 Ahmed and Chen
Figure 2: Grain size distribution of different boreholes at Hill AFB, OU2.
aquifer porosity was taken to be constant, 0.25, for the entire site. The initialsaturation was taken as unity for water and zero for oil throughout the entiresite. Table 1 shows the values of the different parameters used as an input tothe computer code.
Table 1: Parameters values used in the computer model.
Parameter Value
NAPL density (g/cm3) 1.36NAPL dynamic viscosity (cP) 0.89Distribution coefficient (cm3/g) Variable throughout the sitea
(Ranges from 3.4 to 4.8)Molecular diffusion coefficient of water 9.6 × 10⁻⁶b
(cm2/s)Longitudinal dispersivity of water (m) 0.03c
Transverse dispersivity of water (m) 0.01c
Intrinsic permeability (10−3µm2) Variable throughout the site(Ranges from 1.0 × 10⁻⁸ to 9.5 × 10⁴)
Porosity 0.25Interfacial tension between NAPL 4.786
and water (dynes/cm)Particle density (g/cm3) 2.71d
Effective diffusivity (cm2/s) 2.77 × 10⁻¹²e
Initial solid phase concentration (mg/kg) Variable throughout the site f
(Ranges from 0.0 to 30)aAhmed et al.[27]bGrathwohl[29]cBrown et al.[30]dAhmed et al.[27]eAhmed et al.[27]f Ahmed et al.[27]

Desorption of DNAPLs 281
Desorption Kinetics Experiments of the Hill AFB SoilBatch experiments have been conducted in the present study to obtain the
rate of contaminant diffusion from solid particles to aqueous phase. The tech-nique is similar to Pavlostathis and Jaglal.[26] In brief, about 3.6 g of contam-inated soil was placed in an 18 ml vials. The vials were then completely filledwith organic-free distilled water to get zero headspace in order to minimize con-taminant volatilisation. Following that, they were properly capped with Teflonfaced silicone septa, again to minimize volatilisation or any losses. The vialswere shaken manually to allow soil to disperse in the whole vial’s space suchthat it mixes well with water. Thereafter, the vials were left on a vibrating ta-ble at room temperature of 20◦C to allow desorption to take effect. Water waschanged daily. To do so, vials were centrifuged first at 3000 rpm (1240 g) for30 minutes to allow the soil particles to settle down at the base of the vials.The supernatant water was then taken out, kept in another vial and storedat 4◦C for further investigation. Vials that contained the contaminated soilwere refilled with organic-free distilled water. A control vial filled with VOCwas prepared to check the losses (losses due to adsorption to the vial walls orvolatilisation). Results and Discussion of the experimental work and its resultsare presented in Ahmed et al.[27] The experimental results have been matchedwith the numerical results obtained from the code developed by Ahmed andChen,[9] in order to get the value of the effective diffusivity. This value wasused as an input for the simulation presented here. Figure 3 shows the match
Figure 3: Experimental and numerical modelling of TCE & PCE through desorption from soilsample taken from borehole U2-228.

282 Ahmed and Chen
between numerical and experimental desorption behaviour for TCE and PCEat one of the boreholes in the site.
NUMERICAL RESULTS
Solid Phase ConcentrationFigure 4 is a 3-D view showing the solid phase concentration at the start
of the simulation. The layers from y = 21.25 to y = 60.0 ft have been removedin order to show the higher values of solid phase concentration that reside inthe core. The solid phase concentration is as measured in the laboratory byconducting tests on the soil samples taken at different boreholes from the site.The concentrations for the remainder of nodes were obtained by interpolation,employing the natural neighbours scheme. The highest measured TCE concen-tration in the solid phase, as can be seen in Figure 4, was 30 mg/kg soil (basedon air-dry soil).
As pointed out earlier, the start-off time for simulation, is when the surfac-tant injection into the site was concluded. The site is assumed to be clean, i.e.,the aqueous phase TCE concentration is assumed to be zero. Figures 5 showsthe solid phase concentrations after 5 days of desorption. It is clear that the rateof desorption is very high at the start of the process. Figure 5 shows that themaximum solid phase concentration has declined from 30 mg/kg at time zero toabout 18 mg/kg after 5 days. This means that about 40% of contaminant thatwas initially associated with the solid particles has transferred to the aqueous
Figure 4: Solid phase concentration of TCE at the start of simulations. (This view depictsonly from Y = 0 to Y = 21.25 ft to show high concentration values.)

Desorption of DNAPLs 283
Figure 5: Solid phase concentration of TCE after 5 days desorption. (This view depicts onlyfrom Y = 0 to Y = 21.25 ft to show high concentration values.)
phase after 5 days. Figure 6 shows the variation of solid phase concentration ofTCE with time at one borehole, U2-228 (Fig. 1). The TCE concentration declinesvery fast in the early days as is clear from the gradient of the curve during thistime. After 20 days from the end of surfactant injection into the site, the solidphase concentration was reduced from 30 mg/kg to 12 mg/kg. In other words,about 60% of TCE was diffused out of the solid particles to the aqueous phase
Figure 6: Variation of TCE Concentration in Soil with time through desorpion at BoreholeU2-228.

284 Ahmed and Chen
in 20 days. This leads to the conclusion that after cleanup of DNAPL contam-inated aquifers using any remediation method (surfactant injection was usedhere), another round of sweeping up surfactant is recommended to capture thecontaminants that may move from the solid particles into the groundwater.
Between the time of t = 20 days and 100 days, the rate of solid phase TCEconcentration change significantly reduced. The rate of contaminant diffusionfrom intraparticle pores to the aqueous phase started to become slower. As canbe seen in Figure 6, the maximum TCE concentration declined from 12 mg/kgat t = 20 days to 9 mg/kg at t = 50 days, and then to 6 mg/kg after 100 days.Expressing that as a percentage relative to the original TCE concentration, thepercent of contaminant release from the solid particles would be 60%, 70%, and80% after 5, 20, 50, and 100 days respectively.
After 300 days from the end of cleaning up the site, the concentrationdeclined to 4 mg/kg, which indicates that the total contaminant release hasreached 86.6% of the initial concentration at time zero. Less than 7% of thecontaminant was released between the time 100 and 300 days. It appears that,following the first days when the rate of contaminant release from solid par-ticles was very high, the desorption process entered a second stage where therelease was very slow. This implies that the site may need a number of yearsfor all the contaminant to diffuse out of the solid particles.
This last point needs further research. The numerical simulations of thefield presented herein show that following the first few days of fast desorption,a second stage of slow desorption, which may take years, will occur if the siteis to be entirely cleaned. In reality things may not go exactly in that way. Thedesorption experiments carried out on contaminated soil samples taken fromthe same site,[27] showed that after the first few weeks, contaminants becamepersistent to desorption. The rate of desorption after the first few weeks hasbecome slower than expected in the present numerical results. Because thecontaminants were very volatile, the experiments were short-lived. Yet, pre-liminary results suggested not all contaminant might be totally removed fromthe solid particles. A part of the contaminants appeared to resist desorption, orat least needs exceedingly very long time to release from solid particles. Thisagrees with Enell et al.,[28] who observed that polycyclic aromatic hydrocarbonsin aged soils have low availability and will not be released to a great extent onlyby leaching with water. The persistence here may be attributable to the fact thatcontaminants in the Hill AFB were released to the subsurface long time ago.The contamination of the site goes back to 1940s.
Aqueous Phase ConcentrationFigures 7a and 7b are 3-D views showing the TCE concentration in the
aqueous phase 5 days after ending the cleanup operation in the site. This con-centration is due only to desorption of TCE from the solid particles. It is clear

Desorption of DNAPLs 285
Figure 7: Aqueous phase concentration of TCE after 5 days desorption. (a) This viewdepicts only from Y = 0.0 to Y = 21.25 ft to show high concentration values; and (b) this viewdepicts only from Z = 13.0 to Z = 15.5 ft to show high concentration values.
in Figure 7 that many locations still have very high concentrations that extendalong most of the aquifer thickness as can be seen in Figure 7a. In Figure 7b, itcan be seen that large amount of contaminant was released in the bottom of thesand channel. This may be because prior to the site cleanup, the DNAPL wasaccumulated in the bed of the channel above the clay layer in high saturations.

286 Ahmed and Chen
Figure 8: Variation of TCE Concentration in water with time through desorption at BoreholeU2-228.
Figure 7 suggests that the site is far from an acceptable level of cleanupbased on the maximum TCE concentration allowed in drinking water (5 µg/L asspecified by US EPA). After 5 days, the aqueous phase concentrations increasedto about 97 mg/L at some locations, i.e. about 2.0 × 10⁴ times more than isallowed. Fortunately, this TCE being released due to desorption is mainly inthe dissolved phase, which makes it easy to be captured. Even a pump and treatmethod could be used with some success in this case because all the TCE is inaqueous phase.
Figure 8 shows the variation of aqueous phase concentration of TCE withtime at one borehole, U2-228. In the first 20 days, the concentration increasedvery quickly. A slower change occurs in a transition stage (t = 20 to 100 days),in which the concentration only increases from 143.5 mg/L to 190.4 mg/L. Af-ter 100 days, the concentration has increased at some locations to 190.4 mg/L.Beyond 100 days, the curve is nearly flat and the TCE aqueous phase concen-tration gradually increases to its maximum level.
Comparison with Field ObservationsBy taking water samples, the TCE aqueous phase concentration was mon-
itored at two wells for nearly one year after the surfactant injection was con-cluded at the site. The samples were subsequently analysed at the Intera lab-oratory in Austin, Texas. Figure 9 presents the comparison between the TCEconcentration obtained from field samples, which were taken from wells U2-076 and U2-095 (Fig. 1 for their locations), and the results obtained from thenumerical simulations. Because the contaminated water samples taken fromthe two wells were not associated to specific depths, the numerical results pre-sented averaged the concentrations over the depth of the well. This has beendone to facilitate the comparison between both values.

Desorption of DNAPLs 287
Figure 9: Variation of TCE Concentration in water with time through desorption.Comparison between numerical results and field observations (a) at Borehole U2-076 and(b) at Borehole U2-095.
In Figure 9a, from t = 0 to about 180 days at the early stage, although thenumerical results are higher than the field results, the two curves increase inparallel with nearly the same slope. Beyond 180 days, the numerical value tendsto be flatter while the field value still increases. The difference between bothresults is because the heterogeneity of the site has not been ideally reflected inthe simulations since a simple interpolation method was adopted. In Figure 9b,there is a good agreement between both results at 6 and 8 months time. Afterabout 8 months, it is very interesting to note that the same phenomena similarto Figure 9a occurs: the numerical value tends to be flatter while the field valuestill increases. This is possibly attributable to an age factor. The persistenceof contaminants here may be attributable to the fact that contaminants in theHill AFB were released to the subsurface long time ago. The contaminantsmight have been trapped in remote micropores of the soil organic matter. Insome cases, contaminants might not diffuse out of the micropores as discussedby Enell et al.,[28] who observed that polycyclic aromatic hydrocarbons in agedsoils have low availability and will not be expunged easily by leaching withwater.

288 Ahmed and Chen
Nevertheless, in general, the field observations suggest that the UTCHEM-MANSK has successfully provided a preliminary picture about the site after thecleanup process, which might be used as a guide for planning a site-remediation.From the practical application point of view, the prediction and field monitor-ing lead to a conclusion that after a cleanup of DNAPL contaminated aquifers,another round of sweeping up surfactant is recommended to capture the con-taminants that may move from the solid particles into the groundwater. Fromthe analysis, it would appear that this could be done as early as just a few weeksafter the completion of the previous round.
SUMMARY AND CONCLUSIONS
The University of Texas computer code UTCHEM, used for simulating NAPLflow and Transport in Porous Media, which was originally based on equilibriumsorption, has been extended to work under nonequilibrium sorption conditions.This facilitated the simulation of field scale sites taking into account the con-taminants that may diffuse from the soil particles following a site cleanup op-eration. The model was then applied to a contaminated site at Hill Air ForceBase, Utah. The site has been contaminated with DNAPLs, mostly TCE, forover 30 years. Only recently, the site was cleaned up by sweeping with surfac-tants. Results showed the aqueous phase contaminant concentration, due todesorption, increased dramatically in the first few days following the aquifercleanup. After 5 days, the aqueous phase TCE concentration was found to riseup to about 97.3 mg/L in some locations. This fast rise of concentration contin-ued as time increased until it reached about 143.5 mg/L at t = 20 days. After20 days, the rate of diffusion of TCE was observed to become slower. Over thetime from 20 to 100 days, the concentration was observed to increase from 143.5to 190.4 mg/L. Beyond t = 100 days, the change in aqueous phase concentrationwas observed to become increasingly slow.
A limitation of the present model is that it assumes the aqueous concentra-tion is uniform at the particles surface that might not be the case in field sites.Also, a further investigation is needed to account for the diffusion limited masstransfer in the macropores. A current investigation by the authors is the im-plementation of stochastic method to better account for the field heterogeneity.
ACKNOWLEDGEMENT
A.A. Ahmed’s PhD study was supported by an Overseas Research Studentship(ORS), and a research grant (GR/N03112) from the Engineering and PhysicalScience Research Council (EPSRC) in the UK. The authors are grateful for thekind assistance from Dr Jon Ginn in collecting the soil samples from the site,and Kyle Gorder for the data he provided. Special thanks are also due to JohnEwing and Charles Holbert.

Desorption of DNAPLs 289
REFERENCES
1. Wu, S.; Gschwend, P.M. Sorption kinetics of hydrophobic Organic Compounds toNatural Sediments and Soils. Environ. Sci. Technol. 1986, 20, 717–725.
2. Pignatello, J.J.; Xing, B. Mechanisms of Slow Sorption of Organic Chemicals to Nat-ural Particles. Environ. Sci. Technol. 1996, 30, 1–11.
3. Ball, W.P.; Roberts, P.V. Long-term sorption of halogenated organic chemicals byaquifer material: 2. Intraparticle diffusion. Environ. Sci. Technol. 1991, 25, 1237–1249.
4. Wu, S.; Gschwend, P.M. Numerical modeling of sorption kinetics of organic com-pounds to soil and sediment particles. Water Resour. Res. 1988, 24, 1373–1383.
5. Brusseau, M.L.; Roa, P.S.C. Sorption non-ideality during organic contaminanttransport in porous media. Critical Reviews in Environmental Control 1989, 19, 33–99.
6. Grathwohl, P.; Reinhard, M. Desorption of trichloroethylene in aquifer material:Rate limitation at the grain scale. Environ. Sci. Technol. 1993, 27, 2360–2366.
7. Farrell, J.; Reinhard, M. Desorption of halogenated organics from model solids, sed-iments, and soil under unsaturated conditions: 2. Kinetics. Environ. Sci. Technol. 1994,28, 63–72.
8. Rugner, H.; Kleineidam, S.; Grathwohl, P. Long-term sorption kinetics of phenan-threne in aquifer materials. Environ. Sci. Technol. 1999, 33, 1645–1651.
9. Ahmed, A.A.; Chen, D. Effects of contamination age on phenanthrene desorptionfrom aquifers. J. Environ. Sci. Health A., In press.
10. Kleineidam, S.; Rugner, H.; Grathwohl, P. Desorption kinetics of phenanthrene inaquifer material lacks hysteresis. Environ. Sci. Technol. 2004, 38, 4169–4175.
11. Karickhoff, S.W. Semi-empirical estimation of sorption of hydrophobic pollutantson natural sediments and soils. Chemosphere 1981, 10, 833–846.
12. Srivastava, R.; Brusseau, M.L. Non-ideal transport of reactive solutes in heteroge-neous porous media: 1. Numerical model development and moments analysis. J. Contam.Hydrol. 1996, 24, 117–143.
13. Bouchard, D.C. Sorption kinetics of PAHs in methanol-water systems. J. Contam.Hydrol. 1998, 34, 107–120.
14. Cornelissen, G.; Van Zuilen, H.; Van Noort, P.C.M. Particle size dependence of slowdesorption of in-situ PAHs from sediments. Chemosphere 1999, 38, 2369–2380.
15. Ahmed, A.A. Nonequilbrium desorption of nonaqueous phase liquids: investigationat microscopic and macroscopic scales. PhD Thesis 2003, The University of Manchester.
16. Rijnaarts, H.H.M.; Bachmann, A.; Jumelet, J.C.; Zehnder, A.J.B. Effect of des-orption and intraparticle mass transfer on the aerobic biomineralization of α-hexachlorocyclohexane in a contaminated calcareous soil. Environ. Sci. Technol. 1990,24, 1349–1354.
17. Pignatello, J.J. Slowly reversible sorption of aliphatic halocarbons in soils. II. Mech-anistic aspects. Environ. Toxicol. Chem. 1990, 9, 1117–1126.
18. Crank, J. The Mathematics of Diffusion. Oxford University Press, New York,1975.
19. Chapra, S. Numerical Methods for Engineers: With Software and ProgrammingApplications. McGraw-Hill Education, Europe, 2002.

290 Ahmed and Chen
20. Guarnaccia, J.F.; Pinder, G.F.; Fishman, M. NAPL SIMULATOR documentation,EPA 600 R-97/102 1997 〈http://www.epa.gov/ada /napl sim.html〉 (accessed January2000).
21. Delshad, M.; Pope, G.A.; Sepehrnoori, K.A Compositional simulator for modelingsurfactant enhanced aquifer remediation, 1. Formulation. J. Contam. Hydrol. 1996, 23,303–327.
22. Panday, S.; Wu, Y.S.; Huyakorn, P.S.; Wade, S.C.; Saleem, Z.A. A composite numer-ical model for assessing subsurface transport of oily wastes and chemical constituents.J. Contam. Hydrol. 1997, 25, 39–62.
23. Pope, G.A.; Sepehrnoori, K.; Sharma, M.M.; McKinney, D.C.; Speitel Jr., G.E.;Jackson, R. E. Three-Dimensional NAPL Fate and Transport Model, UTCHEM Manual1999, University of Texas at Austin.
24. Dwarakanath, V. Characterization and remediation of aquifers contaminated bynonaqueous Phase Liquids Using Partitioning Tracers and Surfactants. PhD Thesis1997, University of Texas at Austin.
25. Oalman, T.; Godard, S.T.; Pope, G.A.; Jin, M.; Kirchner, K. DNAPL flow behaviourin a contaminated aquifer: Evaluation of field data. GWMR 1995, 15, 125–137.
26. Pavlostathis, S.G.; Jagial, K. Desorptive behaviour of tricholoroethylene in contam-inated soil. Environ. Sci. Technol. 1991, 25(2), 274–279.
27. Ahmed, A.A.; Chen, D.; Ren, J. Dense nonaqueous phase liquids persistence todesorption from contaminated soils and sediments. Second International Conference onRemediation of Contaminated Sediments, Venice, Italy; September 30–October 3, 2003.
28. Enell, A.; Reichenberg, F.; Warfvinge, P.; Ewald, G. A column method for deter-mination of leaching of polycyclic aromatic hydrocarbons from aged contaminated soil.Chemosphere 2004, 54, 707–715.
29. Grathwohl, P. Diffusion in natural porous media: Contaminant transport, sorp-tion/desorption, and Dissolution Kinetics. Kluwer Academic Publishers, USA, 1998.
30. Brown, C.L.; Pope, G.A.; Abriola, L.M.; Sepehrnoori, K. Simulation of surfactant-enhanced aquifer remediation. Water Resour. Res. 1994, 30, 2959–2977.