Sorption isotherms of corn—Study of mathematical models
14
ELSEVIER hmal of Food Engineering 29 (1996) 115-128 Copyright 8 1996 Elsevier Science Limited Printed in Great Britain. All rights reserved 0260-8774/96/$15.00+0.00 0260-8774(95)00031-3 Sorption Isotherms of Corn-Study of Mathematical Models G. Boente,a3c H. H. L. Gonzhlez,a*c E. Martinez,a M. L. Pollio”-b & S. L. Resnik,apb “Universidad de Buenos Aires, Buenos Aires, Argentina bComisi6n de Investigaciones Cientificas de la Provincia de Buenos Aires, Buenos Aires, Argentina ‘Consejo National de Investigaciones Cientificas y Tknicas, Buenos Aires, Argentina (Received 13 September 1994; accepted 22 May 1995) ABSTBACT In this paper statistical methodology is used to determine similar groups of Argentine maize varietiesand to model the behaviour of the moisture content as a function of the water activity.Different equations proposed in the literature are studied and a common mathematical model is obtained for all varieties whatever the adequacy criteria considered. The use of the goodness of fit criteria is also discussed. Copyright 0 1996 Ekevier Science Limited. INTRODUCTION In order to establish humidity bounds to inhibit microbial growth and mycotoxin production during storage, the knowledge of water sorption isotherms of grains and seeds is essential. Among the cereals, maize is one of most widely distributed among the world and is the principal cereal produced in Argentina with annual production of about 744 million tons (Bolsa de Cereales de Buenos Aires, 1990). The kind of maize harvested in Argentina belongs to the so-called flint, but in several provinces of the Argentinian northwest, autoctone varieties are produced. Those varieties form the basis of the diet of local populations. Therefore, determining their sorption isotherms will assist in preventing damage caused by microbial growth during storage and protect the health of those populations. The most common procedure used to preserve quality in stored grains and seeds is reducing the water activity (a~) to a level low enough to inhibit microbial growth. Nevertheless, the control parameter widely used is the moisture content (m.c.) and thus knowledge of the relationship between both is necessary. In addition, it is useful to establish differences or similarities in water sorption characteristics of the most important maize varieties. 115
-
Upload
independent -
Category
Documents
-
view
1 -
download
0
Transcript of Sorption isotherms of corn—Study of mathematical models

ELSEVIER
hmal of Food Engineering 29 (1996) 115-128 Copyright 8 1996 Elsevier Science Limited
Printed in Great Britain. All rights reserved 0260-8774/96/$15.00+0.00
0260-8774(95)00031-3
Sorption Isotherms of Corn-Study of Mathematical Models
G. Boente,a3c H. H. L. Gonzhlez,a*c E. Martinez,a M. L. Pollio”-b & S. L. Resnik,apb
“Universidad de Buenos Aires, Buenos Aires, Argentina bComisi6n de Investigaciones Cientificas de la Provincia de Buenos Aires, Buenos Aires,
Argentina ‘Consejo National de Investigaciones Cientificas y Tknicas, Buenos Aires, Argentina
(Received 13 September 1994; accepted 22 May 1995)
ABSTBACT
In this paper statistical methodology is used to determine similar groups of Argentine maize varieties and to model the behaviour of the moisture content as a function of the water activity. Different equations proposed in the literature are studied and a common mathematical model is obtained for all varieties whatever the adequacy criteria considered. The use of the goodness of fit criteria is also discussed. Copyright 0 1996 Ekevier Science Limited.
INTRODUCTION
In order to establish humidity bounds to inhibit microbial growth and mycotoxin production during storage, the knowledge of water sorption isotherms of grains and seeds is essential.
Among the cereals, maize is one of most widely distributed among the world and is the principal cereal produced in Argentina with annual production of about 744 million tons (Bolsa de Cereales de Buenos Aires, 1990). The kind of maize harvested in Argentina belongs to the so-called flint, but in several provinces of the Argentinian northwest, autoctone varieties are produced. Those varieties form the basis of the diet of local populations. Therefore, determining their sorption isotherms will assist in preventing damage caused by microbial growth during storage and protect the health of those populations. The most common procedure used to preserve quality in stored grains and seeds is reducing the water activity (a~) to a level low enough to inhibit microbial growth. Nevertheless, the control parameter widely used is the moisture content (m.c.) and thus knowledge of the relationship between both is necessary.
In addition, it is useful to establish differences or similarities in water sorption characteristics of the most important maize varieties.
115
116 G. Boente et al.
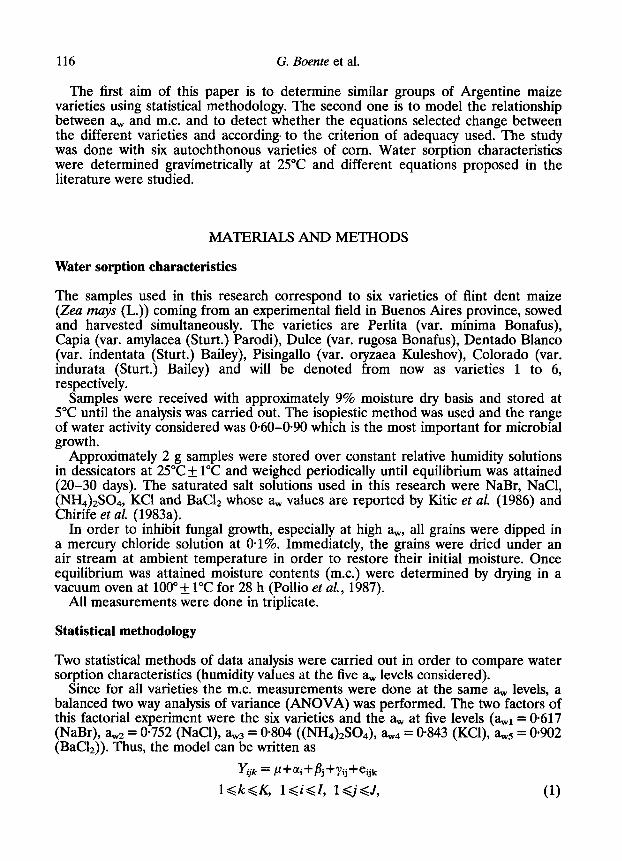
The first aim of this paper is to determine similar groups of Argentine maize varieties using statistical methodology. The second one is to model the relationship between a, and m.c. and to detect whether the equations selected change between the different varieties and according to the criterion of adequacy used. The study was done with six autochthonous varieties of corn. Water sorption characteristics were determined gravimetrically at 25°C and different equations proposed in the literature were studied.
MATERIALS AND METHODS
Water sorption characteristics
The samples used in this research correspond to six varieties of flint dent maize (Zea mays (L.)) coming from an experimental field in Buenos Aires province, sowed and harvested simultaneously. The varieties are Perlita (var. minima Bonafus), Capia (var. amylacea (Sturt.) Parodi), Dulce (var. rugosa Bonafus), Dentado Blanc0 (var. indentata (Sturt.) Bailey), Pisingallo (var. oryzaea Kuleshov), Colorado (var. indurata (Sturt.) Bailey) and will be denoted from now as varieties 1 to 6, respectively.
Samples were received with approximately 9% moisture dry basis and stored at 5°C until the analysis was carried out. The isopiestic method was used and the range of water activity considered was 0.60-0.90 which is the most important for microbial growth.
Approximately 2 g samples were stored over constant relative humidity solutions in dessicators at 25”Cf 1°C and weighed periodically until equilibrium was attained (20-30 days). The saturated salt solutions used in this research were NaBr, NaCl, (NII&S04, KC1 and BaCl* whose a, values are reported by Kitic et al. (1986) and Chirife et al. (1983a).
In order to inhibit fungal growth, especially at high a,, all grains were dipped in a mercury chloride solution at 0.1%. Immediately, the grains were dried under an air stream at ambient temperature in order to restore their initial moisture. Once equilibrium was attained moisture contents (m.c.) were determined by drying in a vacuum oven at 100” + 1°C for 28 h (Pollio et al, 1987).
All measurements were done in triplicate.
Statistical methodology
Two statistical methods of data analysis were carried out in order to compare water sorption characteristics (humidity values at the five a, levels considered).
Since for all varieties the m.c. measurements were done at the same a, levels, a balanced two way analysis of variance (ANOVA) was performed. The two factors of this factorial experiment were the six varieties and the a, at five levels (a,,,i = O-617 (NaBr), awz = 0.752 (NaCl), aw3 = O-804 ((NH&S04), a,.,4 = 0.843 (KCl), a,.,5 = 0902 (BaCl,)). Thus, the model can be written as
Y+ = /l+ai+pj+Yij+eijk
l<k<K, l<iQ, l<j<J, (1)

Sorption isotherm of corn 117
where K is the number of replicates for each variety at each a, level (K = 3), Z is the number of varieties (Z = 6) and .Z is the number of a,,, levels (.Z= 5) at which observations were made without taking into account its value. On the other hand Yvk is the observed m.c. and e# is the measurement error of the kth experimental unit of the ith variety at the jth a, level. The true common mean is denoted by p, ai is the true ith variety effect, fij is the expected effect at the jth a, level and yij is the interaction effect between the ith variety and the jth a, level. It is assumed that
jl ai = jil Bj = jl Yij = i Yij = 0 j=l
The observed values can be eventually transformed in order to obtain for the predicted residuals &ijk a better behaviour according to the assumptions of the model (symmetry, homogeneous variances or normality).
In this paper, differences between varieties must be obtained, i.e. the aim is to test the assumption HA: ai = 0 <i <I. Before treating this problem, the existence of the interaction should be tested, i.e. the hypothesis HAB: yii = 0 1 <i <I, 1 <j Q.Z. If ZZ& is rejected then for m.c. a, interacts (or has a different effect) for the 6 varieties considered. In this setting, HA has no sense because it does not indicate the lack of differences between varieties and therefore only analysis performed at each a,., level can be done.
The main assumption underlying model (1) is that the measurement errors are independent, identically distributed with zero location parameter and homogeneous and constant scale parameter. An additional hypothesis is a normal or Gaussian distribution of the errors.
Under normality, the tests to be performed are the usual test statistics in analysis of variance models based on square sums of residuals which led to F statistics (Bender et al., 1982).
This test assumes that the scale error is constant and is highly sensitive to failures of this assumption. Several authors, such as Box & Cox (1964) and Brown (1975) suggest transformations in order to solve this problem. Welsch (1937) has also proposed a modified F statistic which performs better in the presence of heterocedastic errors.
As mentioned above, different equations (more than 70) for water sorption isotherms were proposed in the literature (Chirife & Iglesias, 1978; Boquet et al., 1978; 1979; 1980; Chirife et aZ., 1983b; Schar & Riiegg, 1985; Van der Berg & Bruin, 1978). We have studied the goodness of fit of 19 equations selected among them. Due to the number of a, levels considered, only equations having 3 or less parameters were used. Equations which, for example, contain constants whose values were not recorded during the experiment or which were not applied to food products were discarded.
The selected equations are described below and some equivalences not found in the literature are mentioned. In all of them M denotes the m.c., we give the original equation and the equivalent form we have used in order to model m.c. or a function of the m.c:, as a function of the a,.
Bradley (1936) equation: ln( l/a,) = kZklM or M = a +bln( - lna,)
Cake (Van der Berg & Bruin, 1978) equation: In M = a+ba, or M = exp (a+ba,)

118 G. Boente et al.
Chen (1971) equation: a,., = exp[k+a’ exp(b’M)] or M = a+b In( -In ~+c)
Day & Nelson (1965) equation: 1 --a, = exp(-a1Tb1Mu2Tb,) where T is the temperature. In this experiment, temperature was constant thus the equation reduces to
1 -a, = exp( -a’@‘) or M = exp[a +bln( - ln( 1 - aW))]
which is the Henderson equation.
Hailwood & Horrobin (1946) equation: A+B&+Ca’, = a,lM or M = l/[a+ba,+cl/a,]
which is equivalent to the GAB equation.
Halsey (1948) equation: a, = exp( -a’/@‘) or M = exp[a +bln( - lnaW)]
Harkins & Jura (1944) equation: Ina,., = B -Afti or
M = &(a+b In a,,,)
Kuhn (1964) equation: M = a+b(lPna,)
Linear equation: M = a +ba,+.
Mizrahi (Mizrahi et al., 1970) equation: a, = (a’+M)l(b’+M) or M=a[a,J(l-a,.,)]+b(l-a,)-’
Oswin (1946) equation: M = a’[aJ(l - aW)lb’ or M = exp(a +bZn[a,/(l -aw)])
Smith (1947) equation: M = a + bZn(1 - a,.,)
Dole (1948) equation: M = a[a,J(l - aW)]
Freundlich (1926) equation: M = arawbr or M = exp(a + blna,.,
Chirife et al. (1983b) equation: ln(a’/a,) = b’M-“’ or M = exp[a + bln(c - lnaW)]
white and Eiring (Van der Berg & Bruin, 1978) equation: M= ll(a + ba,)
Haynes (1961) equation: lna, = a’ + b’M+c’p
M = a+,66
Young& Nelson (1967) equation: M=a(B+a)+c$ where
(j= a, h+(l -a,,Jb
4 = a,0
hv a= -
b-(b-l)a,+b-1 -!f-h( b-(bbl)aw)-(b+l)ln(l-a,+,)
M=a* a,.,(l-b) b2
aW+(l-h)b+b-1 -ln(l-(l-t)&)-

Sorption isotherms of corn 119
@+I) In (1-Q +c- a 1 w
+(;*ILJb Polynomial equation: M = a + ba, + c&*.
In order to evaluate the goodness of fit, three criteria can be used:
the mean square of the deviations
S = i E*i/ll i=l
the mean relative percentage deviation in modulus (Boquet et al, 1978)
P = i I&i I/Mi X 100/n i=l
the mean relative error (Schar & Rtiegg, 1985)
E = i$1 c*i/M*i x 100/n
RESULTS AND DISCUSSION
In this section, test statistics to validate the assumption of the model and the usual analysis of variance based on the F-statistic (Scheffe, 1959) are carried out and discussed. Also, a model for water isotherm is fitted for each variety.
As was already pointed out, the procedures previously mentioned to perform a data analysis rely on the assumption that error variance is constant. Unfortunately, they are highly sensitive to departures from this hypothesis. To check the adequacy of the supposition, the Cochran test and the Levene test were used to detect heterocedasticity. Both were significant at the 5% level when performed with all the data. This troublesome behaviour is mainly due to cells with zero variance. If we delete these cells the appropriate test to detect heterocedasticity is not significant at the 5% level (Table 1).
Since some observations were declared as outliers after the analysis of variance for a two-way layout design was performed, a new analysis was done after removing them. However, new outliers appeared after this second analysis and some empty cells result when deleting them. However, Shapiro Wilk’s statistic does not reject normality even when using all the observations. In Table 2 we give the value of the statistic, which in this case, results in a conservative test. When transforming the data in order to stabilize variance with the transformations l/x and In x the assumption of normality is violated @ < 0.001).
The usual F-test applied to the actual data rejects the hypothesis of null interactions at the 1% level (Table 1). The same result was achieved by reordering the different levels of a, in order to decrease interactions. In Table 3 those interactions which are significantly different from zero at the 1% level are indicated.

120 G. Boente et al.
TABLE 1 Analysis of Variance
Source Sum of squares
DF Mean square
F value Tail probability
a, Variety Interaction Error Levene’s test for
equal variances Cochran’s test for
equal variances After removing cells
with cero variances Cochran’s test for
equal variances Barlett Box test for
equal variances
1092.9255 72.3271 15.2873 2.9219 27,62
4 273.2314 14.4654 5797.65 306.94 o*ooOO 0~0000
20 O-7644 16.22 o-0000 62 0.0471
2.37 0.0027
2, 30 0.21172 o-03
2, 28
27,973
0.21172 0.045
973 l-23841 0.187
Since we were not able to find homogeneous groups within varieties with an overall significance level as was expected, we concentrated in treating each level of a,.
Simultaneous tests at the 1% level were performed at each level of a,., to check if m.c. was constant along the varieties, but the hypothesis was rejected. Tables 4a-e summarize such results. Table 5 exhibits underlined together the varieties whose difference was not significant for each of the levels of a,.,. Mean values and standard deviations for each of the varieties are also given there.
TABLE 2 Shapiro Wilks Statistic
Statistic p-value Anomalous data
AI1 data 0.9572 0.18 6 After removing outliers 0.9752 o-51 Transformation l/x 0.7700 0.00 6
TABLE 3 Estimates of the Interaction Significantly Different from 0
I 2 3 4 5 6
;
* * * * *
:
* * * *
5 * * * *
Sorption isotherms of corn 121
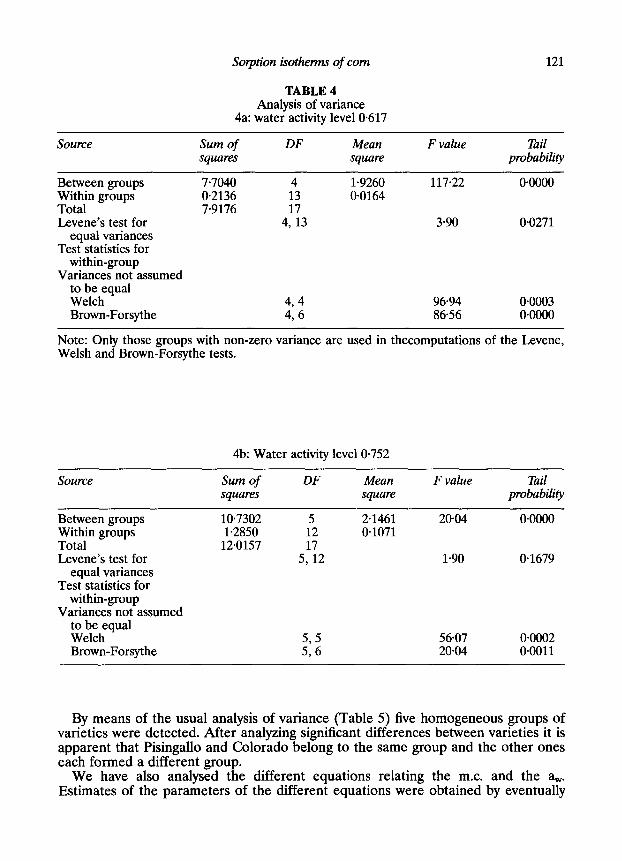
TABLE 4 Analysis of variance
4a: water activity level 0.617
Source Sum of DF Mean F value Tail squares square probability
Between groups 7.7040 4 1.9260 117.22 o*ooOO Within groups O-2136 13 O-0164 Total 7.9176 17 Levene’s test for 4, 13 3.90 0,0271
equal variances Test statistics for
within-group Variances not assumed
to be equal Welch 4,4 96.94 O-0003 Brown-Forsythe 476 8656 O*OOOO
Note: Only those groups with non-zero variance are used in thecomputations of the Levene, Welsh and Brown-Forsythe tests.
Source
4b: Water activity level O-752
Sum of DF Mean squares square
F value Tail probability
Between groups Within groups
Total Levene’s test for equal variances
Test statistics for within-group
Variances not assumed to be equal Welch Brown-Forsythe
10.7302 5 2.1461 20-04 0~0000 l-2850 12 o-1071
12.0157 5,112 l-90 0.1679
56.07 O-0002 20.04 0.0011
By means of the usual analysis of variance (Table 5) five homogeneous groups of varieties were detected. After analyzing significant differences between varieties it is apparent that Pisingallo and Colorado belong to the same group and the other ones each formed a different group.
We have also analysed the different equations relating the m.c. and the a,.,. Estimates of the parameters of the different equations were obtained by eventually

122 G. Boente et al.
4cz Water activity level 0804
Source Sum of squares
DF Mean square
F value Tail probability
Between groups Within groups Total Levene’s test for
equal variances Test statistics for
within-group Variances not assumed
to be equal
Welch Brown-Forsythe
11.7761 5 2.3552 77.08 O*OOOO 0.3667 12 0.0306 12-1428
5,‘:2 1.92 o-1642
126.34 77.08 ;:=
4d: Water activity level 0.843
Source Sum of DF Mean F value Tail squares square probability
Between groups 12.5274 4 5.3818 90.67 O+KlOO Within groups 0.7717 13 0.0594 Total 22.2990 Levene’s test for 4,‘:, 2.69 0.0786
equal variances Test statistics for
within-group Variances not assumed
to be equal Welch 495 52.45 0.0003 Brown-Forsythe 425 66.95 o*oQo2
Note: Only those groups with non-zero variance are used in thecomputations of the Levene, Welsh and Brown-Forsythe tests.
fitting a nonlinear model for each variety. In Fig. 1 we have plotted, for instance, the absolute standardized residuals of fitting the Hailwood and Horrobin equation to variety 1. Since the absolute value of the residuals didn’t suggest a trend, the S goodness of fit criterion was used to select the equation. Both P and E should be used only when the residuals’ scale changes with the moisture content in a linear way.
We note that in all cases, except in Dole’s equation, the value of S obtained validates the model, i.e. does not exceed the 2 percentile at the O-05 level.
Sorption isotherms of corn 123
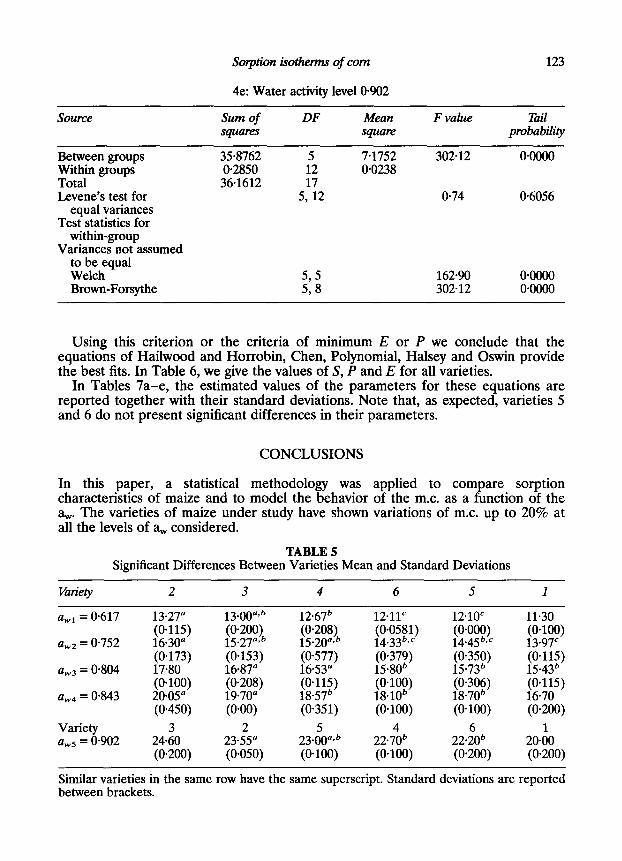
4e: Water activity level O-902
Source Sum of sqlulres
DF Mean square
F value Tail probability
Between groups Within groups
Total Levene’s test for equal variances
Test statistics for within-group
Variances not assumed to be equal Welch Brown-Forsythe
35.8762 5 7.1752 302.12 O-0000 0.2850 12 0.0238
36.1612 5,112 o-74 0.6056
16290 O@XlO 302.12 0.0000
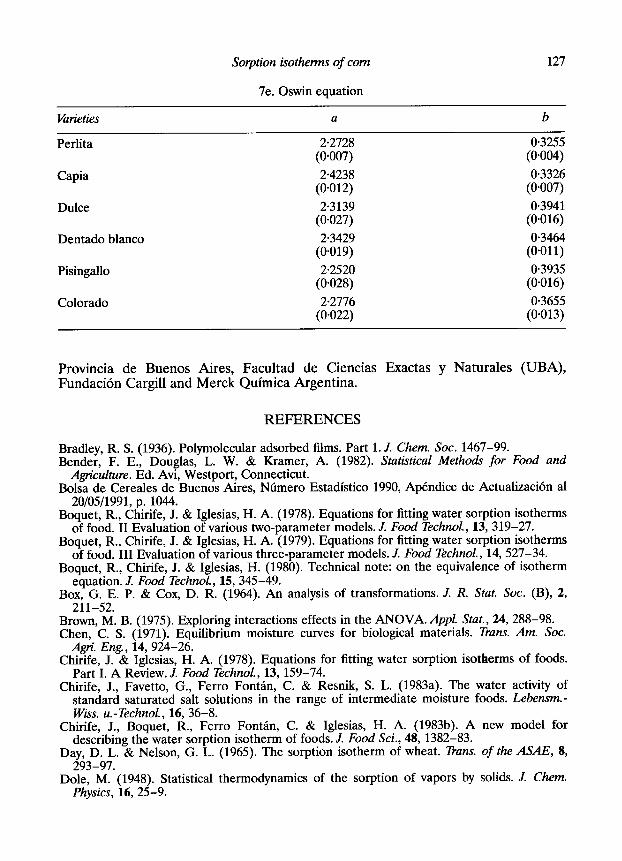
Using this criterion or the criteria of minimum E or P we conclude that the equations of Hailwood and Horrobin, Chen, Polynomial, Halsey and Oswin provide the best fits. In Table 6, we give the values of S, P and E for all varieties.
In Tables 7a-e, the estimated values of the parameters for these equations are reported together with their standard deviations. Note that, as expected, varieties 5 and 6 do not present significant differences in their parameters.
CONCLUSIONS
In this paper, a statistical methodology was applied to compare sorption characteristics of maize and to model the behavior of the m.c. as a function of the a,,,. The varieties of maize under study have shown variations of m.c. up to 20% at all the levels of a,., considered.
TABLE 5 Significant Differences Between Varieties Mean and Standard Deviations
Variety
a,l = 0.617
a,,,* = O-752
aw3 = 0.804
13.27”
a ,,u, = 0.843
Variety aw5 = O-902 24.:0
(O-200)
13*00”~* 12.67’
16.87”
23-k’ (O-050)
5 23.00npb (0.100)
12.11”
{;:;;Z)
(0.379) 15.80’ 1’;‘;;:)
(0:lOO)
22.& (0.100)
6 22*20* (0.200)
Similar varieties in the same row have the same superscript. Standard deviations are reported between brackets.

124 G. Boente et al.
std. residual
1
t *
0.5
I
x
m
x
m
;Ic 0 I I 1 I I I I 1 I I ,
10 11 12 13 14 15 16 17 19 19 20 21 22
m.c.
Fig. 1. Standardized residuals vs m.c. Hailwood & Horrobin - variety Perlita.
TABLE 6 Values of the Goodness of Fit Statistics for Different Varieties
Equation Perlita Capi42 Dulce Dentado Pisingallo Colorado blanco
Hailwood & Horrobin S 0.03 O-06 0.06 0.08 0.12 0.05 : 0.83 0.01 0.02 1.02 0.02 1.23 0.03 1.46 0.05 1.58 0.02 1.15
Chen S 0.02 0.07 0.18 0.09 0.22 0.11 : 0.71 0.006 0.02 1.007 2.18 0.06 0.04 1.42 2.41 0.08 0.04 1.70
Polynomial : 0.05 0.07 0.09 0.13 0.14 0.07 1.13 1.16 1.45 1.81 1.61 1.25
E 0.02 0.02 0.03 0.05 0.06 0.03
Halsey : 0.03 0.08 0.23 0.11 0.22 0.12 0.92 l-10 2.55 1.72 1.94
E 0.01 0.02 0.10 0.04 ::?I 0.06
Oswin S 0.02 0.07 0.32 0.15 0.29 0.18 P 0.72 l+IO6 3.02 2.11 3.06 2.34 E 0.007 0.02 0.14 0.06 0.14 0.09

Sorption isotherms of corn 125
TABLE 7 Estimated parameters
(the number between brackets is the standard deviation of the estimate) 7a. Hailwood & Horrobin equation
Kwieties
Perlita
Capia
Dulce
Dentado blanco
Pisingallo
Colorado
a
0.2849 (0.028)
0.2569 (0.030)
0.4932 (O-033)
0.4024 (O-041)
0.4856 (0.053)
0.4703 (O-033)
b
- 0.2088 (0.018)
-0.1882 (0.019)
- 0.3500 (0.021)
- 0.2852 (O-026)
- 0.3473 (0.034)
- 0.3331 (0.021)
c
-O+I418 (0.011)
- 0.040 (0.012)
-0.1236 (O-013)
-0.0911 (0.016)
-0.1163 (0.020)
-0.1126 (0.013)
7b. Chen equation
Kwieties
Perlita
Capia
Dulce
Dentado blanco
Pisingallo
Colorado
a
7.6726 (O-173)
8.8128 (O-361)
8.7909 (0.507)
8.9749 (O-379)
7.9987 (0.575)
8.4133 (O-402)
b
- 4.4791 (0.196)
- 5.3945 (0.412)
- 4.3600 (0.381)
-4.1136 (0.316)
- 4.3287 (0.456)
- 4.0099 (0.322)
c
- 0.0392 (0.006)
- 0.0386 (0.011)
- 0.0768 (0.006)
- 0.0678 (0.007)
- 0.0723 (0.008)
-0.0714 (0.006)
The varieties of groups not detected as significantly different (Pisingallo, Colorado) may be kept together, allowing an optimal storage. Also a common mathematical model was obtained for all varieties whatever the goodness of fit criteria used, even if in our setting the adequacy criterium to be used is the mean square of the deviations.

126 G. Boente et al.
7~. Polynomial equation
Huieties
Perlita
Capia
Duke
Dentado blanco
Pisingallo
Colorado
a b
37.6669 - 92,2385 (4.190) (11.249)
485190 - 120.5912 (4.827) (12.960)
87.6283 - 230,9399 (5.653) (15.177)
62.5619 - 159.4834 (6.847) (18.381)
77.8045 - 205.0445 (6.890) (18.497)
69.8628 - 181.0749 (4.865) (13.061)
C
80.3552 (7447)
102.9394 (8.580)
178.4213 (lOM8)
127.6005 (12.170)
159.8804 (12.246)
142.0459 (8647)
7d. Halsey equation
Kvieties a b
Perlita 2.1744 (0.010)
Capia 2.3235 (0.015)
Dulce 2.1945 (0.027)
Dentado blanco 2.2374 (0.019)
Pisingallo 2.1331 (O-028)
Colorado 2.1666 (0.021)
-0.3631 (0.006)
- 0.3708 (0.008)
- 0.4398 (O-015)
- 0.3869 (0.011)
- 0.4390 (O-016)
- 0.4081 (0.012)
In a general problem the pattern of residuals should be studied in order to select the goodness of fit criteria.
ACKNOWLEDGEMENTS
The authors acknowledge financial support from Consejo National de Investigaciones Cientificas y Tecnicas, Comision de Investigaciones Cienticas de la
Sorption isothemzs of corn
7e. Oswin equation
127
tirieties a b
Perlita
Capia
2.2728 (0.007)
24238 (0.012)
Dulce 2.3139 (O-027)
Dentado blanco 2.3429 (0.019)
Pisingallo 2.2520 (0.028)
Colorado 2.2776 (O-022)
0.3255 (0.004)
0.3326 (0.007)
0.3941 (0.016)
0.3464 (0.011)
0.3935 (0.016)
0.3655 (0.013)
Provincia de Buenos Aires, Facultad de Ciencias Exactas y Naturales (UBA), Fundacion Cargill and Merck Quimica Argentina.
REFERENCES
Bradley, R. S. (1936). Polymolecular adsorbed films. Part 1. J. Chem. Sot. 1467-99. Bender, F. E., Douglas, L. W. & Kramer, A. (1982). Statistical Methods for Food and
Agriculture. Ed. Avi, Westport, Connecticut. Bolsa de Cereales de Buenos Aires, Numero Estadfstico 1990, Apendice de Actualization al
20/05/1991, p. 1044. Boquet, R., Chirife, J. & Iglesias, H. A. (1978). Equations for fitting water sorption isotherms
of food. II Evaluation of various two-oarameter models. J. Food Technol., 13, 319-27. Boquet, R., Chirife, J. & Iglesias, H. A.jl979). Equations for fitting water sorption isotherms
of food. III Evaluation of various three-parameter models. J. Food Technol., 14, 527-34. Boquet, R., Chirife, J. & Iglesias, H. (1980). Technical note: on the equivalence of isotherm
equation. J. Food Technol., 15, 345-49. Box, G. E. P. & Cox, D. R. (1964). An analysis of transformations. J. R. Stat. Sot. (B), 2,
211-52. Brown, M. B. (1975). Exploring interactions effects in the ANOVA. Appl. Stat., 24, 288-98. Chen, C. S. (1971). Equilibrium moisture curves for biological materials. Trans. Am. Sot.
Agri. Eng., 14,924-26. Chirife, J. & Iglesias, H. A. (1978). Equations for fitting water sorption isotherms of foods.
Part I. A Review. J. Food Technol., 13, 159-74. Chirife, J., Favetto, G., Ferro Fontan, C. & Resnik, S. L. (1983a). The water activity of
standard saturated salt solutions in the range of intermediate moisture foods. Lebensm.- Wiss. u.-Technol., 16, 36-8.
Chirife, J., Boquet, R., Ferro Fontan, C. & Iglesias, H. A. (1983b). A new model for describing the water sorption isotherm of foods. J. Food Sci., 48, 1382-83.
Day, D. L. & Nelson, G. L. (1965). The sorption isotherm of wheat. Trans. of the ASAE, 8, 293-97.
Dole, M. (1948). Statistical thermodynamics of the sorption of vapors by solids. J. Chem. Physics, 16, 25-9.

128 G. Boente et al.
Freundlich, H. (1926). Colloid and Capillary Chemistry. Methuem and Co., London. Hailwood, A. J. & Horrobin, S. (1946). Absorption of water by polymers: analysis in terms of
a simple model. Trans. Far Sot., 42B, 84-9. Halsey, G. (1948). Physical adsorption of non-uniform surfaces. J. Chem. Physics, 16, 931-37. Harkins, W. D. & Jura, G. (1944). Surface of solids XIII. A vapor method for the
determination of the area of a solid without assumption of a molecular area, and the areas occupied by nitrogen and other molecules on the surface of a solid. J. Am. Chem. Sot., 66, 1366-73.
Haynes, B. C. (1961). Vapor pressure determination of seed hygroscopicity. US. Dept. Agr Tech. Bull., 1229, l-20.
Kitic, D., Favetto, G. J., Chirife, J. & Resnik, S. L. (1986). Measurement of water activity in the intermediate moisture range with the Novasina Thermoconstanter humidity meter. Lebensm.- Wiss. u.-Technol., 19, 297-301.
Kuhn, I. (1964). A new theoretical analysis of adsorption phenomena. Introductory part: the characteristics expression of the main regular types of adsorption isotherms by a single simple equation. J. Colloid Sci., 10, 685-98.
Mizrahi, S., Labuza, T. P. & Karel, M. (1970). Computer-aided prediction of extent of browning in dehydrated cabbage. J. Food Sci., 35,799-802.
Oswin, C. R. (1946). The kinetics of package life. III The isotherm. J. Chem. Ind. (London), 64,419-21.
Pollio, M. L., Gonzalez, H. H. L. & Resnik, S. L. (1987). Estudio de diversos metodos de &$$na&n de humedad para cereales y oleaginosas. An. Asoc. Quim. Arg., 75(2),
SchL, W: & Rtiegg, M. (1985). The evaluation of G.A.B. Constants from water vapour sorption data. Lebensm.-Wiss.u.-Technol., 18, 225-29.
Scheffe, H. (1959). The Analysis of Ktriance. Wiley, New York. Smith, S. E. (1947). The sorption of water by High Polymers. J. Am. Chem. Sot., 69, 646-51. Van der Berg, C. & Bruin, S. (1978). Water activity: influences on food quality. Ed. J. A.
Troller & J. Christian. Academic Press, New York. Welsch, B. L. (1937). The significance of the difference between two means when the
population variances are unequal. Biometrika, 29, 350-62. Young, J. H. & Nelson, G. L. (1967). Research of hysteresis between sorption and
desorption isotherms of wheat. Trans. ASAE, 756-61.