Adsorption isotherms and Sips models of nitrogen, methane ...
14
Adsorption isotherms and Sips models of nitrogen, methane, ethane, and propane on commercial activated carbons and polyvinylidene chloride Nir Tzabar 1 • H. J. M. ter Brake 1 Received: 25 December 2015 / Revised: 23 March 2016 / Accepted: 9 May 2016 / Published online: 21 May 2016 Ó The Author(s) 2016. This article is published with open access at Springerlink.com Abstract In this paper we present the measured isotherms of nitrogen, methane, ethane, and propane on three car- bons: Norit RB2, Chemviron AP 4-60, and highly activated Saran. The measurements are taken at temperatures between 300 and 400 K, in 20 K steps. The measured data is fitted to the Sips adsorption model, where the Sips parameters are determined by a linearization method. The Sips parameters are further adjusted to realize a logic dependence on temperature and the parameter character- istics are discussed. Subsequently, the Sips model is modified to incorporate the temperature dependence. Including the temperature dependence results in a slightly higher error relative to the experimental results (typically 10 % as compared to 6 %). The immediate research pro- duct is a convenient expression for every adsorbate-ad- sorbent system which is discussed in this paper, for calculating the adsorption concentration as a function of temperature and pressure. A more general research product is a better understanding of the Sips parameter character- istics that should help in developing future adsorbents on demand. Keywords Adsorption Isotherm Sips Nitrogen Hydrocarbon Nomenclature a Sips adsorption affinity parameter, 1 bar -1 C Adsorption concentration, mg adsorbate g adsorbent -1 C 0 Sips saturated adsorption concentration, mg adsorbate g adsorbent -1 m Mass, g n Sips heterogeneity parameter N Number of measured points p Pressure, bar T Temperature, K V Volume, m 3 Subscripts amb Ambient s Adsorbent Abbreviations and acronyms Dev Deviation JT Joule–Thomson 1 Introduction Adsorption isotherm data is crucial input in the design of sorption compressors. These compressors can establish a pressurized gas flow by the cyclic adsorption and desorp- tion of a working gas at a sorber (Prasad et al. 1996; Banker et al. 2004; Lu et al. 2006). These sorption com- pressors are thermally driven and operate without moving parts; meaning they are highly reliable, long life, and vibration free. They are suitable for driving Joule–Thom- son (JT) cryogenic coolers. Cooling to about 80 K is usu- ally obtained with nitrogen, whereas higher cooling temperatures can be obtained with other fluids, among which methane, ethane, and propane. The development of a sorption compressor for any working fluid relies on the adsorption isotherms at wide ranges of temperatures and pressures. These isotherms usually are not available in the & Nir Tzabar [email protected] 1 Energy, Materials and Systems, Faculty of Science and Technology, University of Twente, 7500 Enschede, AE, The Netherlands 123 Adsorption (2016) 22:901–914 DOI 10.1007/s10450-016-9794-9 brought to you by CORE View metadata, citation and similar papers at core.ac.uk provided by Springer - Publisher Connector
-
Upload
khangminh22 -
Category
Documents
-
view
3 -
download
0
Transcript of Adsorption isotherms and Sips models of nitrogen, methane ...

Adsorption isotherms and Sips models of nitrogen, methane,ethane, and propane on commercial activated carbonsand polyvinylidene chloride
Nir Tzabar1 • H. J. M. ter Brake1
Received: 25 December 2015 / Revised: 23 March 2016 / Accepted: 9 May 2016 / Published online: 21 May 2016
� The Author(s) 2016. This article is published with open access at Springerlink.com
Abstract In this paper we present the measured isotherms
of nitrogen, methane, ethane, and propane on three car-
bons: Norit RB2, Chemviron AP 4-60, and highly activated
Saran. The measurements are taken at temperatures
between 300 and 400 K, in 20 K steps. The measured data
is fitted to the Sips adsorption model, where the Sips
parameters are determined by a linearization method. The
Sips parameters are further adjusted to realize a logic
dependence on temperature and the parameter character-
istics are discussed. Subsequently, the Sips model is
modified to incorporate the temperature dependence.
Including the temperature dependence results in a slightly
higher error relative to the experimental results (typically
10 % as compared to 6 %). The immediate research pro-
duct is a convenient expression for every adsorbate-ad-
sorbent system which is discussed in this paper, for
calculating the adsorption concentration as a function of
temperature and pressure. A more general research product
is a better understanding of the Sips parameter character-
istics that should help in developing future adsorbents on
demand.
Keywords Adsorption � Isotherm � Sips � Nitrogen �Hydrocarbon
Nomenclature
a Sips adsorption affinity parameter, 1 bar-1
C Adsorption concentration, mgadsorbate gadsorbent-1
C0 Sips saturated adsorption concentration, mgadsorbategadsorbent-1
m Mass, g
n Sips heterogeneity parameter
N Number of measured points
p Pressure, bar
T Temperature, K
V Volume, m3
Subscripts
amb Ambient
s Adsorbent
Abbreviations and acronyms
Dev Deviation
JT Joule–Thomson
1 Introduction
Adsorption isotherm data is crucial input in the design of
sorption compressors. These compressors can establish a
pressurized gas flow by the cyclic adsorption and desorp-
tion of a working gas at a sorber (Prasad et al. 1996;
Banker et al. 2004; Lu et al. 2006). These sorption com-
pressors are thermally driven and operate without moving
parts; meaning they are highly reliable, long life, and
vibration free. They are suitable for driving Joule–Thom-
son (JT) cryogenic coolers. Cooling to about 80 K is usu-
ally obtained with nitrogen, whereas higher cooling
temperatures can be obtained with other fluids, among
which methane, ethane, and propane. The development of a
sorption compressor for any working fluid relies on the
adsorption isotherms at wide ranges of temperatures and
pressures. These isotherms usually are not available in the
& Nir Tzabar
1 Energy, Materials and Systems, Faculty of Science and
Technology, University of Twente, 7500 Enschede, AE, The
Netherlands
123
Adsorption (2016) 22:901–914
DOI 10.1007/s10450-016-9794-9
brought to you by COREView metadata, citation and similar papers at core.ac.uk
provided by Springer - Publisher Connector
literature and the measurements are done by the compres-
sor developer (Prasad et al. 1996; Saha et al. 2012). In the
present work we have performed adsorption measurements
of nitrogen, methane, ethane, and propane on three adsor-
bents: Norit, Chemviron, and Saran. The experimental
results are fitted to the Sips model (Sips 1948) which is a
combined form of the Langmuir and Freundlich models
and is suitable for describing heterogeneous adsorption
systems at a wide range of pressures (Foo and Hameed
2010; Casas et al. 2012). In the current research the Sips
parameters are derived by linearizing the experimental
data, as was suggested by Wang et al. (2008).
The adsorption characteristics of the four gases on the
three adsorbents are discussed, and the Sips model is
described in detail. The Sips model is further modified to
incorporate the temperature dependence (Tzabar and
Grossman 2011; Park et al. 2014). The modified form
allows for a direct calculation of the adsorption concen-
tration as a function of the temperature and pressure at the
expense of a slight reduction in accuracy.
2 Method of study
2.1 Experimental measurements of adsorption
isotherms
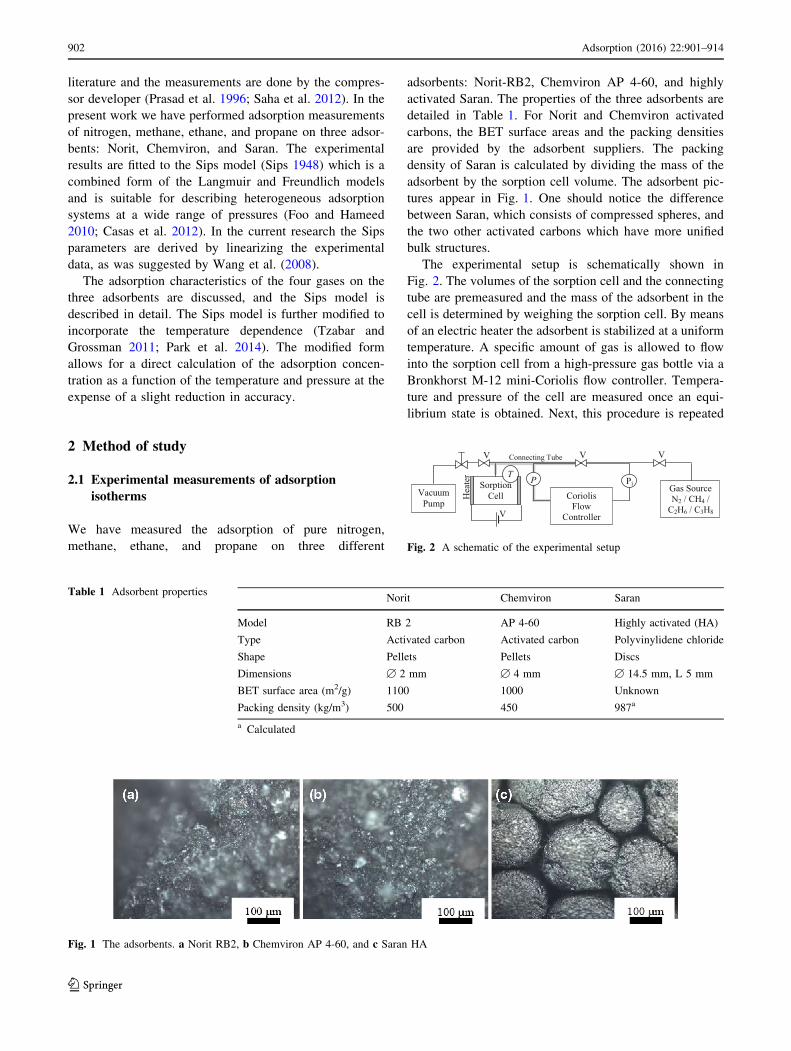
We have measured the adsorption of pure nitrogen,
methane, ethane, and propane on three different
adsorbents: Norit-RB2, Chemviron AP 4-60, and highly
activated Saran. The properties of the three adsorbents are
detailed in Table 1. For Norit and Chemviron activated
carbons, the BET surface areas and the packing densities
are provided by the adsorbent suppliers. The packing
density of Saran is calculated by dividing the mass of the
adsorbent by the sorption cell volume. The adsorbent pic-
tures appear in Fig. 1. One should notice the difference
between Saran, which consists of compressed spheres, and
the two other activated carbons which have more unified
bulk structures.
The experimental setup is schematically shown in
Fig. 2. The volumes of the sorption cell and the connecting
tube are premeasured and the mass of the adsorbent in the
cell is determined by weighing the sorption cell. By means
of an electric heater the adsorbent is stabilized at a uniform
temperature. A specific amount of gas is allowed to flow
into the sorption cell from a high-pressure gas bottle via a
Bronkhorst M-12 mini-Coriolis flow controller. Tempera-
ture and pressure of the cell are measured once an equi-
librium state is obtained. Next, this procedure is repeated
Table 1 Adsorbent propertiesNorit Chemviron Saran
Model RB 2 AP 4-60 Highly activated (HA)
Type Activated carbon Activated carbon Polyvinylidene chloride
Shape Pellets Pellets Discs
Dimensions [ 2 mm [ 4 mm [ 14.5 mm, L 5 mm
BET surface area (m2/g) 1100 1000 Unknown
Packing density (kg/m3) 500 450 987a
a Calculated
Fig. 1 The adsorbents. a Norit RB2, b Chemviron AP 4-60, and c Saran HA
Connecting Tube
Gas SourceN2 / CH4 /
C2H6 / C3H8
Vacuum Pump
Sorption Cell
T
V
Hea
ter
Coriolis Flow
Controller
PiP
V V V
Fig. 2 A schematic of the experimental setup
902 Adsorption (2016) 22:901–914
123

so that at one temperature the amounts of gas adsorbed and
corresponding pressures can be recorded. This is repeated
at temperatures between 300 and 400 K in steps of 20 K,
except for the system of methane—Saran where the max-
imum temperature is 380 K. In order to evaluate the
adsorbed amount of the gas we need to correct for the void
volume of the sorption cell and the connecting tube.
The adsorption concentration, C, is calculated as
follows:
C ¼ 1
ms
r _mdt � Vvoidcell � q p; Tð Þ � Vtube � q p; Tambð Þ� �
ð1Þ
where _m is the gas mass flow into the cell, integrated over
the time that the valve which introduces the fluid to the
sorption cell is open. ms is the mass of the adsorbent,
Vvoid cell is the void volume in the sorption cell, Vtube is the
volume of the connecting tube, q is the density of the fluid,
Tamb is the ambient temperature, and T, p are the measured
sorption cell temperature and pressure, respectively. The
volume of the sorption cell for Chemviron and Norit is
18.6 cc and for Saran is 9.1 cc. In the present study we
consider Vvoid cell as the void volume around the adsorbent,
not including the pore volumes. That makes the adsorption
concentration, C, the known absolute adsorption (Gumma
and Talu 2010).
The accuracies of the measured void volumes in the cell
and the connecting tube are±2.5 and ±0.1 %, respectively.
The accuracy of the adsorbent mass is ±0.3 % and the
accuracy of the mass flow rate is estimated as ±2 %. The
accuracy of the pressure measurement is ±0.1 % and for
the temperature is ±1.5 %. As a consequence, the accuracy
of the measured adsorption concentration, C, is about
±8 %. The accuracy of the method was verified by addi-
tional arbitrary ‘‘direct measurements’’ where we intro-
duced a given amount of fluid to the sorption cell, rather
than in steps (were the inaccuracies are accumulated). We
repeated this for several gases at a few temperatures and
pressures.
2.2 Sips adsorption model
The measured adsorption results of the pure gases were
fitted to the adsorption model of Sips:
C
C0
¼ apð Þ1n
1þ apð Þ1n
ð2Þ
Where p is the pressure in bar, C0 is the saturated
adsorption concentration, a is the adsorption affinity, and
n is a dimensionless parameter that qualitatively charac-
terizes the heterogeneity of the adsorbate-adsorbent sys-
tem. The Sips isotherm is a combined form of Langmuir
and Freundlich models deduced for predicting the
adsorption in heterogeneous systems and circumventing
the limitation of the rising adsorbate concentration asso-
ciated with the Freundlich isotherm. At low adsorbate
concentrations it reduces to the Freundlich isotherm;
whereas at high concentrations it predicts a monolayer
adsorption in a similar manner as the Langmuir isotherm.
Therefore, the Sips isotherm shall be used to describe
only monolayer adsorption systems. It is evident that
multi-layer adsorption may occur at high pressures for the
systems we study. Therefore, the Sips model is used to
describe the adsorption at the pressure range of interest,
and the C0 parameter shall not be considered as the
ultimate saturation adsorption.
In order to obtain the three parameters directly out of the
experimental results, Eq. (2) is expressed in linear form as:
lnC
C0 � C
� �¼ 1
nln pð Þ þ ln a
1n
� �ð3Þ
C0 is iteratively found to obtain a linear relation between
ln(p) and ln(C/(C0-C)), next n is determined by the slope
and then a by the intersect point. This procedure is made
for every adsorption isotherm, thus, the parameters are
determined as a function of the temperature.
2.3 Modified Sips adsorption model
In order to have a single expression for covering the entire
temperature range and to further allow extrapolations in
temperature and pressure, the Sips model is modified.
According to our experience, the parameters C0 and n in
the Sips model are assumed to linearly depend on tem-
perature, whereas a is assumed to have an exponential
dependence:
C
CAT þ CB
¼ aAexp aBTð Þp½ �1
nATþnB
1þ aAexp aBTð Þp½ �1
nATþnB
ð4Þ
Here CA, CB, aA, aB, nA, and nB are fitting parameters,
the pressure, p, is expressed in bar and the temperature, T,
in K.
2.4 Deviation calculations
A deviation parameter, Dev, is defined for evaluating the
agreement between the experimental and calculated iso-
therm results:
Dev ¼ 1
N
XN
i¼1
Ccalculated � Cmeasuredj jCmeasured
ð5Þ
where N is the number of measured points at a given
temperature.
Adsorption (2016) 22:901–914 903
123
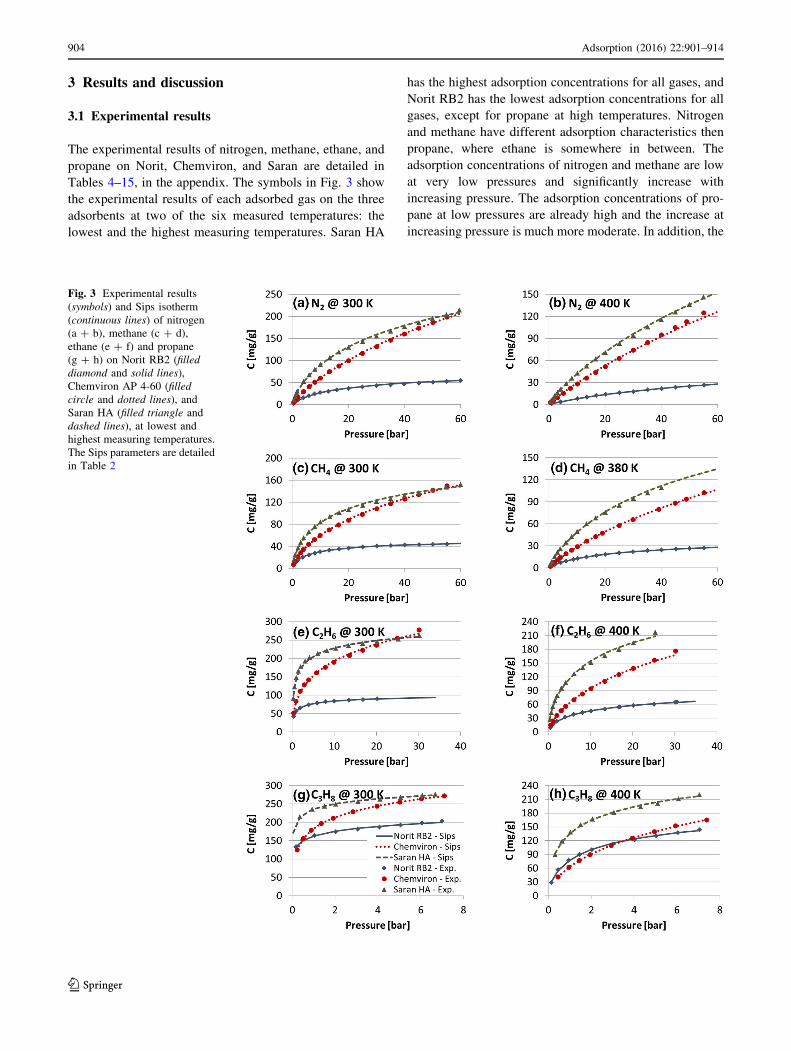
3 Results and discussion
3.1 Experimental results
The experimental results of nitrogen, methane, ethane, and
propane on Norit, Chemviron, and Saran are detailed in
Tables 4–15, in the appendix. The symbols in Fig. 3 show
the experimental results of each adsorbed gas on the three
adsorbents at two of the six measured temperatures: the
lowest and the highest measuring temperatures. Saran HA
has the highest adsorption concentrations for all gases, and
Norit RB2 has the lowest adsorption concentrations for all
gases, except for propane at high temperatures. Nitrogen
and methane have different adsorption characteristics then
propane, where ethane is somewhere in between. The
adsorption concentrations of nitrogen and methane are low
at very low pressures and significantly increase with
increasing pressure. The adsorption concentrations of pro-
pane at low pressures are already high and the increase at
increasing pressure is much more moderate. In addition, the
Fig. 3 Experimental results
(symbols) and Sips isotherm
(continuous lines) of nitrogen
(a ? b), methane (c ? d),
ethane (e ? f) and propane
(g ? h) on Norit RB2 (filled
diamond and solid lines),
Chemviron AP 4-60 (filled
circle and dotted lines), and
Saran HA (filled triangle and
dashed lines), at lowest and
highest measuring temperatures.
The Sips parameters are detailed
in Table 2
904 Adsorption (2016) 22:901–914
123

differences in propane adsorption concentrations among the
three adsorbent are smaller than for the other gases.
3.2 Sips isotherms
The Sips parameters in Eq. (2) were derived by fitting them
to the measured isotherms according to the procedure
described in Sect. 2.2. Due to the limited accuracy of the
measurements (±8 %), the Sips parameters show quite
some scatter when plotted as functions of temperature.
Also determining the Sips parameters using a non-linear
regression procedure in the three-dimensional space of C0,
a, and n results in a similar scattering of the results.
Therefore, we use the linearization method as expressed in
Eq. (3) to relate a and n to C0. As discussed in Sect. 2.2,
the value of n is determined from the slop in Eq. (3) and
a from the intersect. This reduces the problem to a single
optimization parameter: C0. The adjustment of C0 to obtain
a more realistic dependence on temperature (more mono-
tonous) also yields a more realistic behavior of a and n as a
function of temperature. Here, the deviation parameter Dev
as defined by Eq. (5) was used as the optimization
parameter. The resulting Sips parameters are listed in
Table 2.
Figure 4 shows the Sips parameters (presented in
Table 2) of each gas on the three different adsorbents, as a
function of temperature. Nitrogen, methane, and ethane
show qualitatively similar characteristics where propane
shows a different behavior which leads to the conclusion
that the adsorption characteristics of propane are different,
probably according to its molecule size.
Figure 4 also shows that the dimensionless n parameter,
which qualitatively characterizes the heterogeneity of the
adsorbate-adsorbent system, is constantly decreasing with
temperature and seems to depend on adsorbate rather than
on adsorbent. Figure 5 compares the Sips parameters of
each adsorbent for nitrogen, methane, and ethane, as a
function of temperature. Propane is not considered in
Fig. 5 since, as discussed earlier, it has different trends and
adding its results to the figure disturbs analyzing the other
gas results. In each graph of C0 and n in Figs. 4 and 5 the
curves show similar qualitative characteristics (e.g. all have
Table 2 Sips parameters,
which have realistic correlations
with the temperature
T (K) Nitrogen Methane Ethane Propane
C0 n a C0 n a C0 n a C0 n a
Norit RB2
300 80 1.219 0.043 55 1.372 0.132 109 2.060 1.228 550 6.333 0.004
320 83 1.155 0.029 52 1.332 0.086 100 1.795 0.687 435 4.713 0.040
340 78 1.142 0.024 50 1.296 0.059 97 1.709 0.386 310 3.080 0.341
360 78 1.177 0.016 47 1.286 0.044 99 1.648 0.219 274 2.422 0.385
380 75 1.191 0.013 45 1.262 0.032 99 1.582 0.119 250 2.065 0.350
400 75 1.120 0.009 41 1.173 0.027 99 1.475 0.082 220 1.623 0.377
Chemviron AP 4-60
300 600 1.153 0.008 360 1.383 0.011 670 2.230 0.013 480 2.641 0.279
320 620 1.135 0.006 360 1.282 0.009 650 2.067 0.011 480 2.248 0.188
340 640 1.112 0.005 370 1.248 0.007 600 1.844 0.012 480 2.084 0.114
360 660 1.072 0.005 370 1.163 0.007 520 1.592 0.016 480 1.898 0.079
380 680 1.106 0.004 380 1.150 0.006 500 1.463 0.015 500 1.722 0.056
400 700 1.111 0.003 380 1.071 0.005 470 1.425 0.014 480 1.616 0.048
Saran HA
300 390 1.319 0.020 220 1.448 0.048 330 2.220 0.606 400 4.640 5.425
320 440 1.270 0.014 250 1.406 0.027 350 2.175 0.307 390 3.905 3.088
340 530 1.182 0.008 260 1.332 0.024 360 2.028 0.140 380 3.170 0.752
360 580 1.159 0.006 290 1.301 0.016 370 1.809 0.112 350 2.580 0.847
380 570 1.204 0.005 280 1.211 0.015 370 1.705 0.077 350 2.302 0.519
400 600 1.186 0.005 370 1.579 0.059 340 2.001 0.443
C0 in (mg/g), n is dimensionless, and a in (1/bar)
Adsorption (2016) 22:901–914 905
123

Fig. 5 Sips parameters
(Table 2) for Norit RB2 (a–c),Chemviron AP 4-60 (d–f), andSaran HA (g–i) with nitrogen
(solid lines), methane (dotted
lines), and ethane (dashed
lines), as a function of
temperature
Fig. 4 Sips parameters
(Table 2) for nitrogen (a–c),methane (d–f), ethane (g–i), andpropane (j–l) on Norit RB2
(solid lines), Chemviron AP
4-60 (dashed dotted lines), and
Saran HA (dashed lines), as a
function of temperature
906 Adsorption (2016) 22:901–914
123

a linear dependency on temperature). Fig. 5a, d, and g
suggest that C0 is more intensively influenced by the
adsorbent, rather than by the adsorbate. That means that it
is possible to increase the amount of adsorbed gas by
adjusting the adsorbent parameters. It is not possible to
state which component, the adsorbent or the adsorbate,
affects the parameter a the most. It is clear that in most
cases the parameter a exponentially decreases with
increasing temperature.
3.3 Modified Sips isotherms
The modified Sips parameters in Eq. (4) are derived from
the trend lines presented in Figs. 4 and 5. The resulting
modified Sips model parameters are given in Table 3.
Covering all data, Figs. 6a, b, and c summarize the devi-
ations of the Sips and the modified Sips models for Norit,
Chemviron, and Saran, respectively.
The deviations of the Sips model are\0.06, and in most
of the cases are lower than 0.02. The deviations of the
modified Sips model are typically below 0.1. The some-
what larger deviation in the modified Sips model is the
price we have to pay for a model that covers the whole
range of pressures and temperatures as compared to the
basic Sips model covering single isotherm data. The
modified Sips parameters that are presented in Table 3 also
show the difference between the adsorption characteristics
of propane as compared to nitrogen, methane, and ethane.
However, despite the difference in adsorption characteris-
tics, the Sips model appears to be a valid model for
describing the propane isotherms, and in this respect shows
similar accuracy as in the case of the other three
adsorbates.
4 Conclusions
The adsorption of nitrogen, methane, ethane, and propane
on Norit RB2, Chemviron AP 4-60, and Saran HA is
reported. Isotherm measurements were conducted between
300 and 400 K, at pressures up to 80 bar (8 MPa), when
possible. A linearization method has been used to deter-
mine the Sips adsorption parameters out of the experi-
mental data, which were further adjusted to comply with
Table 3 Modified Sips
parametersCA CB nA nB aA aB
Norit RB2
Nitrogen -0.0700 102.67 -0.0005 1.3446 2.6126 -0.0140
Methane -0.1343 95.333 -0.0017 1.8960 14.491 -0.0160
Ethane -0.0729 126.00 -0.0052 3.5252 4760.8 -0.0280
Propane -3.2014 1460.3 -0.0459 19.448 5.00E-08 0.0417
Chemviron
Nitrogen 1 300.00 -0.0005 1.2818 0.1160 -0.0090
Methane 0.2286 290.00 -0.0029 2.2355 0.0879 -0.0070
Ethane -2.1857 1333.3 -0.0087 4.8159 0.0065 0.0021
Propane 0 480.00 -0.0098 5.4771 62.380 -0.0180
Saran HA
Nitrogen 2.1286 -226.67 -0.0013 1.6632 1.5256 -0.015
Methane 0.8 -12 -0.0029 2.3257 2.9101 -0.014
Ethane 0.4 216.67 -0.0068 4.307 500.88 -0.023
Propane -0.6284 587.7 -0.0265 12.377 4995.8 -0.024
CA in (mg/g/K), CB in (mg/g), aA in (1/bar), aB in (1/K), nA in (1/T), and nB is dimensionless
Adsorption (2016) 22:901–914 907
123

predefined temperature dependences. The dimensionless
n parameter seems to be adsorbate dependent, whereas C0
is more strongly affected by the adsorbent. The a parameter
depends both on the adsorbent and the adsorbate in a
similar manner.
Whereas the Sips parameters of nitrogen, methane, and
ethane have similar trends, propane shows a different
adsorption behavior. Nevertheless, the deviations of the
Sips and the modified Sips models of propane are similar
to these of nitrogen, methane, and ethane. The modified
Sips model that is presented in shows a reasonable
practical deviation of \10 %, in most cases. This model
allows to calculate the adsorption in a direct convenient
manner that improves numerical simulations of adsorption
processes and cycles. We currently use the modified Sips
model in the design of sorption compressors that are
developed for refrigeration systems. More generally, a
better understanding of the Sips parameter characteristics
is reached for future adsorbent developments. For exam-
ple, it is evident that Saran shows the highest adsorption
concentrations for all adsorbates, despite its Sips param-
eters are similar to these of the other adsorbents.
Moreover, Saran adsorbs more than Chemviron even
though Chemviron has higher saturated adsorption
concentrations.
Acknowledgments This work is supported by NanoNextNL, a micro
and nanotechnology consortium of the government of the Netherlands
and 130 partners.
Open Access This article is distributed under the terms of the
Creative Commons Attribution 4.0 International License (http://crea
tivecommons.org/licenses/by/4.0/), which permits unrestricted use,
distribution, and reproduction in any medium, provided you give
appropriate credit to the original author(s) and the source, provide a
link to the Creative Commons license, and indicate if changes were
made.
Appendix—experimental isotherms
See Tables 4, 5, 6, 7, 8, 9, 10, 11, 12, 13, 14, and 15.Fig. 6 Deviations of the Sips (symbols) and modified Sips (contin-
uous lines) models from the experimental results, calculated by
Eq. (5), as a function of temperature, for a Norit RB2, b Chemviron
AP 4-60, and c Saran HA
Table 4 Nitrogen/Norit RB2 isotherms
300 K 320 K 340 K 360 K 380 K 400 K
p (bar) C (mg/g) p (bar) C (mg/g) p (bar) C (mg/g) p (bar) C (mg/g) p (bar) C (mg/g) p (bar) C (mg/g)
0.48 2.99 0.21 0.96 0.52 1.57 0.52 1.25 0.55 1.11 1.09 1.20
1.03 5.80 2.06 6.89 1.06 2.76 1.05 2.17 1.06 1.88 4.09 3.83
1.99 9.83 5.02 13.38 2.08 5.47 2.07 4.33 2.08 3.53 10.12 8.27
3.94 15.76 8.07 18.52 4.06 9.28 4.08 7.42 4.10 5.67 13.44 10.22
908 Adsorption (2016) 22:901–914
123

Table 4 continued
300 K 320 K 340 K 360 K 380 K 400 K
p (bar) C (mg/g) p (bar) C (mg/g) p (bar) C (mg/g) p (bar) C (mg/g) p (bar) C (mg/g) p (bar) C (mg/g)
5.94 20.38 13.94 25.84 6.10 12.36 6.08 9.67 6.13 7.65 16.80 12.29
7.98 24.14 20.03 31.33 8.06 14.89 8.09 11.78 8.13 9.45 20.17 13.92
7.95 24.14 25.07 35.08 10.02 17.16 10.10 13.69 10.12 11.42 25.16 16.07
9.98 27.18 30.07 38.27 13.35 20.61 13.76 16.86 13.40 13.64 30.07 17.78
12.88 30.28 35.00 41.39 16.74 23.85 16.74 19.28 16.76 16.55 35.11 19.97
15.96 33.25 40.12 43.72 20.05 26.62 20.03 21.27 20.13 18.33 40.14 21.83
20.01 36.51 45.05 45.82 25.08 29.79 25.07 24.13 25.05 20.78 45.14 23.54
24.92 40.31 50.06 47.76 30.03 32.79 30.06 27.05 30.08 23.36 50.09 24.78
30.03 42.73 49.75 48.42 35.06 35.45 35.07 29.17 35.06 25.37 55.14 26.29
35.02 44.61 55.05 49.81 40.06 38.01 40.08 31.55 40.07 26.54 60.13 27.86
39.90 46.92 57.59 51.07 45.06 40.00 45.08 33.69 45.07 28.17 65.05 30.02
45.08 49.07 60.11 51.63 50.04 42.00 50.02 35.04 50.15 30.13
50.09 50.93 65.07 52.67 55.03 43.25 55.08 36.72 55.04 31.20
55.01 52.67 70.01 53.92 60.06 44.92 60.14 38.16 60.11 32.81
59.95 54.92 75.09 55.02 65.06 45.92 65.16 39.38 65.22 33.97
65.01 56.24 80.11 56.14 70.14 47.42 70.12 40.61 70.08 35.35
70.02 57.78 79.83 56.46 75.01 48.51 75.15 41.96 75.04 36.57
74.82 59.64 80.04 49.29 80.09 43.09 80.14 37.70
79.94 61.22
Table 5 Methane/Norit RB2 isotherms
300 K 320 K 340 K 360 K 380 K 400 K
p (bar) C (mg/g) p (bar) C (mg/g) p (bar) C (mg/g) p (bar) C (mg/g) p (bar) C (mg/g) p (bar) C (mg/g)
0.39 5.85 0.44 4.11 0.48 2.95 0.50 2.46 0.59 1.96 0.71 1.45
0.90 9.63 1.06 7.29 1.11 5.36 1.06 3.89 1.07 2.83 2.08 3.19
1.86 14.40 1.95 10.72 2.03 7.96 2.08 6.22 2.12 4.61 4.04 5.26
3.75 20.32 3.98 15.91 3.99 12.34 4.05 9.57 4.10 7.21 6.10 7.11
5.93 24.74 5.97 19.50 5.97 15.45 6.05 12.18 6.04 9.33 8.15 8.79
8.00 27.69 7.97 22.30 8.03 17.83 8.05 14.34 8.60 11.80 10.06 10.03
9.97 30.22 10.03 24.49 10.00 20.03 10.12 16.22 10.24 12.97 13.30 12.06
13.20 33.02 13.32 27.37 13.36 22.74 13.33 18.65 13.38 15.17 16.72 13.75
16.75 35.36 16.75 29.70 16.62 24.80 16.72 20.77 16.79 17.10 20.07 15.48
20.04 36.99 20.04 31.37 20.04 26.67 20.11 22.50 20.09 18.56 24.99 17.35
25.04 38.97 25.12 33.54 25.01 28.72 25.08 24.53 25.01 20.49 30.44 18.90
30.08 40.47 30.03 35.05 30.03 30.43 30.06 26.22 29.97 22.27 35.08 20.14
35.15 41.73 35.15 36.49 35.04 31.83 35.06 27.61 35.13 23.61 40.14 21.76
40.08 42.57 40.20 37.65 40.14 33.16 40.10 28.83 40.09 24.76 45.01 22.60
45.19 43.45 45.02 38.31 45.10 34.10 45.13 29.85 45.22 25.72 50.10 23.62
50.06 43.90 50.13 39.15 50.06 34.97 50.17 30.74 50.17 26.70 55.07 24.38
55.13 44.45 55.11 39.71 55.17 35.76 55.14 31.50 55.19 27.50 60.03 25.02
60.12 45.48 60.10 40.22 60.11 36.32 60.20 32.00 60.18 28.16 65.16 25.82
65.14 45.76 65.02 40.51 65.03 36.77 65.07 32.61 65.08 28.65 70.14 25.55
70.06 45.85 70.08 40.93 70.21 37.16 70.02 33.04 70.17 29.35 75.08 25.94
75.55 46.15 75.08 41.19 75.07 37.60 75.17 33.65 75.11 29.79 80.10 26.50
80.23 46.07 80.17 42.12 80.14 38.08 80.17 34.04 80.05 30.27
Adsorption (2016) 22:901–914 909
123

Table 6 Ethane/Norit RB2 isotherms
300 K 320 K 340 K 360 K 380 K 400 K
p (bar) C (mg/g) p (bar) C (mg/g) p (bar) C (mg/g) p (bar) C (mg/g) p (bar) C (mg/g) p (bar) C (mg/g)
0.35 42.81 0.34 30.53 0.36 22.81 0.40 18.26 0.44 12.97 0.46 9.35
0.33 42.81 0.94 44.12 0.96 34.71 1.00 27.91 1.01 20.63 1.05 15.96
0.93 57.01 1.91 54.43 1.92 44.43 1.99 37.66 1.99 29.29 2.02 23.13
1.89 65.98 3.85 63.27 3.83 54.16 3.91 47.16 3.95 38.73 3.94 32.20
3.88 73.88 5.92 68.37 3.73 54.52 3.82 47.16 5.98 44.78 5.96 38.27
5.96 78.27 8.03 71.38 5.99 60.50 6.00 53.77 8.02 48.68 8.05 42.59
7.93 82.63 10.08 74.88 5.89 60.50 7.98 57.69 10.08 51.96 10.05 45.89
10.01 84.39 10.06 74.88 8.07 64.06 10.10 60.60 13.37 55.66 13.33 50.01
13.43 86.40 13.40 77.71 10.05 66.53 13.34 65.37 16.82 59.54 16.72 54.09
16.78 88.13 16.83 79.20 10.09 66.65 16.81 67.74 20.13 61.85 16.92 54.32
20.12 90.30 20.13 80.68 13.38 70.46 20.15 69.99 25.04 65.34 20.13 57.76
25.06 105.2 25.09 83.59 16.83 72.26 25.05 73.47 30.07 69.23 25.08 60.59
30.04 120.7 30.07 100.3 20.11 73.97 30.06 89.41 30.35 69.61 30.10 64.95
34.01 139.5 35.11 122.6 25.11 76.76 34.96 110.5 34.98 89.95 30.52 65.29
30.04 92.23 34.79 84.12
34.05 109.62
Table 7 Propane/Norit RB2 isotherms
300 K 320 K 340 K 360 K 380 K 400 K
p (bar) C (mg/g) p (bar) C (mg/g) p (bar) C (mg/g) p (bar) C (mg/g) p (bar) C (mg/g) p (bar) C (mg/g)
0.19 133.26 0.25 118.23 0.20 89.83 0.21 69.95 0.24 56.84 0.13 29.03
0.18 133.26 0.46 131.75 0.19 89.83 0.48 92.56 0.45 73.51 0.45 56.87
0.48 151.59 1.12 149.64 0.43 110.25 0.98 111.83 1.00 95.26 0.93 77.12
1.04 164.04 2.04 161.13 1.01 130.45 1.96 129.09 1.98 113.91 1.45 90.51
2.03 174.40 3.15 169.20 1.98 145.37 3.02 139.84 3.25 127.56 2.03 100.55
3.06 181.24 4.12 175.11 3.05 154.42 4.15 148.54 4.05 134.28 3.00 112.66
4.07 187.27 5.08 180.47 4.07 161.69 5.06 154.85 5.04 141.21 4.02 122.38
5.07 192.78 6.08 185.57 5.06 167.64 6.05 160.67 6.06 147.60 5.03 130.31
6.07 198.01 7.06 190.56 6.09 173.33 7.07 166.67 7.04 153.58 6.05 137.31
7.00 203.00 7.00 178.44 7.05 144.23
Table 8 Nitrogen/Chemviron AP 4-60 isotherms
300 K 320 K 340 K 360 K 380 K 400 K
p (bar) C (mg/g) p (bar) C (mg/g) p (bar) C (mg/g) p (bar) C (mg/g) p (bar) C (mg/g) p (bar) C (mg/g)
0.50 4.63 0.52 4.25 0.53 3.43 0.52 2.57 0.54 2.74 0.56 2.85
1.07 9.59 1.02 6.90 1.03 5.55 1.03 4.45 1.04 4.43 1.56 5.38
2.06 17.03 2.03 12.75 2.03 10.45 2.05 8.62 2.05 7.79 3.07 9.46
4.03 29.55 4.03 22.91 4.04 18.93 4.06 15.95 4.06 14.35 5.09 15.17
6.02 40.74 6.05 32.47 6.07 26.94 6.06 22.90 6.08 20.74 7.56 21.89
8.03 50.94 8.06 41.41 8.11 34.64 8.08 29.89 8.06 26.80 10.09 27.96
10.01 60.16 10.07 49.38 10.11 41.59 10.06 36.47 10.12 33.08 13.34 36.17
13.32 74.59 13.34 61.81 13.38 52.72 13.37 46.71 13.41 42.09 16.65 43.84
910 Adsorption (2016) 22:901–914
123

Table 8 continued
300 K 320 K 340 K 360 K 380 K 400 K
p (bar) C (mg/g) p (bar) C (mg/g) p (bar) C (mg/g) p (bar) C (mg/g) p (bar) C (mg/g) p (bar) C (mg/g)
16.64 87.26 16.70 73.33 16.70 63.13 16.69 56.38 16.72 51.21 20.07 51.69
20.02 99.56 20.09 84.53 20.11 73.36 20.05 65.43 20.09 59.85 25.06 62.81
25.00 115.97 25.12 99.95 25.08 87.22 25.08 78.63 25.12 72.19 30.07 73.86
30.07 131.58 29.13 111.63 30.10 100.67 30.08 91.38 30.12 83.94 35.08 84.38
35.07 146.12 35.07 127.60 35.04 113.29 35.08 103.67 35.03 95.16 40.10 94.87
40.04 159.86 40.07 140.61 40.07 125.71 40.10 115.50 40.06 106.36 45.04 104.82
45.05 173.25 45.04 153.00 45.05 137.31 45.10 127.03 49.05 112.89
50.05 186.10 50.05 165.08 50.06 148.88 50.11 138.11 55.10 124.66
55.09 198.42 55.04 176.84 55.07 160.26 55.06 148.80 60.06 135.87
60.06 212.06 60.08 190.11 60.06 172.99 60.06 161.25
Table 9 Methane/Chemviron AP 4-60 isotherms
300 K 320 K 340 K 360 K 380 K 400 K
p (bar) C (mg/g) p (bar) C (mg/g) p (bar) C (mg/g) p (bar) C (mg/g) p (bar) C (mg/g) p (bar) C (mg/g)
0.49 7.56 0.51 5.17 0.53 4.15 0.53 2.77 0.53 2.36 1.13 3.12
0.99 13.07 1.04 9.14 1.04 7.31 1.04 5.05 1.04 4.26 2.08 5.49
1.99 21.48 2.01 15.49 2.03 12.40 2.05 9.16 2.04 7.92 4.09 10.45
2.97 28.32 3.02 21.04 3.02 16.84 3.04 12.99 3.07 11.14 6.06 14.87
3.97 34.33 4.06 26.27 4.02 21.03 4.05 16.54 4.07 14.02 8.07 19.23
5.87 43.60 5.98 34.42 5.98 28.32 6.01 22.55 6.05 19.27 10.08 23.31
7.90 52.05 8.02 41.60 8.04 34.65 8.03 28.32 8.06 24.21 13.35 29.58
9.94 59.71 10.03 48.23 10.05 40.52 10.04 33.59 10.09 29.07 16.65 35.42
13.19 69.90 13.30 57.69 13.29 49.03 13.28 41.35 13.51 36.45 20.10 41.36
16.52 79.04 16.65 66.21 16.59 56.98 16.66 48.68 16.61 42.59 25.08 49.33
20.00 87.44 20.01 74.03 20.03 64.36 20.02 55.58 19.08 47.47 30.05 56.98
24.93 98.22 25.00 84.42 25.00 73.89 25.06 64.85 25.00 57.58 35.05 64.33
30.07 108.05 30.01 93.95 29.99 83.36 30.07 73.54 30.00 65.79 40.09 71.52
35.03 117.17 35.07 103.19 35.07 91.95 35.10 81.90 39.15 79.63 45.11 78.50
40.06 125.80 40.06 111.85 40.09 100.11 40.00 89.64 45.03 87.94 50.07 85.11
45.04 133.83 45.07 120.04 45.09 108.03 45.14 97.62 49.04 93.75 55.16 91.91
50.09 141.86 50.06 127.93 50.09 115.66 50.04 104.66 55.15 102.42 60.08 98.15
55.09 149.67 55.10 135.71 55.07 122.94 55.08 112.05 60.19 109.41
60.15 157.33 60.09 143.06 60.50 130.71 60.07 118.98
Table 10 Ethane/Chemviron AP 4-60 isotherms
300 K 320 K 340 K 360 K 380 K 400 K
p (bar) C (mg/g) p (bar) C (mg/g) p (bar) C (mg/g) p (bar) C (mg/g) p (bar) C (mg/g) p (bar) C (mg/g)
0.32 51.14 0.96 65.60 0.45 30.55 0.50 23.40 0.49 16.44 0.52 15.16
0.89 83.21 1.95 89.99 0.93 46.68 1.01 36.37 1.03 27.53 1.04 23.61
1.83 110.19 2.92 106.30 1.49 60.18 2.00 54.61 2.01 42.23 2.01 35.91
2.83 128.00 3.94 119.48 2.02 70.49 3.01 68.15 3.06 54.77 3.02 46.31
3.87 141.98 5.18 131.92 2.96 85.35 4.02 79.60 4.04 64.50 4.03 55.53
Adsorption (2016) 22:901–914 911
123

Table 10 continued
300 K 320 K 340 K 360 K 380 K 400 K
p (bar) C (mg/g) p (bar) C (mg/g) p (bar) C (mg/g) p (bar) C (mg/g) p (bar) C (mg/g) p (bar) C (mg/g)
5.80 160.64 7.87 151.90 4.05 98.10 5.95 96.92 5.99 80.69 6.02 70.08
7.87 176.20 10.06 165.31 5.95 115.87 8.04 111.69 8.04 94.04 8.03 82.80
9.95 189.49 13.33 182.22 8.02 130.43 10.04 123.71 10.08 106.14 10.07 94.20
13.59 208.40 16.66 197.13 10.03 143.10 13.32 140.24 13.35 122.40 13.37 110.19
16.71 222.44 20.06 211.30 13.29 159.66 16.68 155.02 16.71 136.88 16.73 124.57
20.03 235.98 25.06 230.93 20.10 168.82 20.06 150.33 20.14 138.05
25.01 255.10 30.18 251.99 25.11 187.44 25.10 169.49 25.13 156.53
30.13 277.89 30.16 207.66 30.18 189.35 30.15 175.97
Table 11 Propane/Chemviron AP 4-60 isotherms
300 K 320 K 340 K 360 K 380 K 400 K
p (bar) C (mg/g) p (bar) C (mg/g) p (bar) C (mg/g) p (bar) C (mg/g) p (bar) C (mg/g) p (bar) C (mg/g)
0.23 125.13 0.34 111.67 0.42 91.54 0.44 69.63 0.44 51.95 0.45 40.80
0.52 156.22 0.65 136.48 0.97 124.59 0.98 98.98 0.92 76.86 0.95 62.11
0.89 178.33 0.97 153.23 1.47 142.35 1.39 115.16 1.41 94.00 1.43 76.99
1.36 196.45 1.39 168.78 2.05 157.51 2.06 132.94 1.96 108.82 1.94 89.70
1.92 211.02 1.97 184.45 3.00 176.28 3.03 151.84 2.97 129.46 2.93 109.27
2.84 228.76 2.98 204.54 4.00 193.04 4.01 167.88 3.99 146.38 3.93 125.48
3.97 244.21 3.97 221.15 5.02 207.82 5.01 182.00 5.02 160.79 4.95 139.72
5.04 255.10 4.98 235.96 6.87 230.83 6.03 194.97 6.03 173.94 5.94 152.35
6.04 263.62 5.98 249.08 7.01 207.33 7.03 185.93 7.38 165.27
7.10 271.99 6.81 259.79
Table 12 Nitrogen/Saran HA isotherms
300 K 320 K 340 K 360 K 380 K 400 K
p (bar) C (mg/g) p (bar) C (mg/g) p (bar) C (mg/g) p (bar) C (mg/g) p (bar) C (mg/g) p (bar) C (mg/g)
0.52 5.30 0.52 3.99 0.60 2.01 0.53 2.73 0.53 2.22 0.57 1.96
1.03 9.32 1.01 6.76 1.03 3.74 1.07 4.55 1.05 3.62 1.06 3.10
1.53 12.96 2.05 11.87 1.55 6.13 3.17 8.65 2.07 6.25 1.56 4.58
1.77 14.94 3.06 16.31 2.07 8.09 4.07 11.08 3.08 8.80 2.10 5.85
4.03 25.59 4.05 20.75 3.07 11.63 6.06 15.82 4.07 11.17 3.05 7.91
6.02 32.78 6.05 27.18 4.06 14.88 8.11 20.28 6.08 15.32 4.08 10.10
8.02 38.93 8.04 32.64 6.06 20.33 10.13 24.40 8.09 19.06 6.10 13.81
10.01 44.28 10.07 37.74 8.06 25.24 13.37 30.34 10.10 22.56 8.08 17.43
13.36 51.65 13.38 44.71 10.04 29.62 16.70 35.43 13.35 27.87 10.10 20.85
16.66 57.78 16.66 50.52 13.41 35.98 20.12 40.48 16.68 32.67 13.41 25.47
20.01 62.89 20.02 56.19 16.70 41.71 25.10 46.88 20.07 37.38 16.66 29.99
25.05 69.47 25.07 63.32 20.05 46.83 30.18 53.12 25.06 43.72 20.10 34.43
30.05 75.26 30.05 69.46 25.06 53.52 35.11 58.55 30.20 49.73 25.09 40.34
35.06 80.71 35.13 75.13 30.05 59.62 39.96 64.21 35.18 54.93 30.03 45.49
40.03 85.55 40.11 79.97 35.05 65.40 45.12 69.42 40.09 59.93 35.17 51.15
45.04 90.06 45.06 84.60 40.00 70.59 50.05 73.91 45.11 64.89 39.97 56.32
912 Adsorption (2016) 22:901–914
123

Table 12 continued
300 K 320 K 340 K 360 K 380 K 400 K
p (bar) C (mg/g) p (bar) C (mg/g) p (bar) C (mg/g) p (bar) C (mg/g) p (bar) C (mg/g) p (bar) C (mg/g)
49.93 94.60 50.00 88.98 45.00 75.70 55.00 78.48 49.88 69.52 45.02 61.08
54.96 98.85 55.04 93.54 49.97 80.90 59.46 84.60 55.06 74.32 50.05 66.16
59.56 104.16 59.51 99.14 54.90 85.43 59.74 80.56 55.01 70.94
59.80 91.52 59.60 76.99
Table 13 Methane/Saran HA isotherms
300 K 320 K 340 K 360 K 380 K
p (bar) C (mg/g) p (bar) C (mg/g) p (bar) C (mg/g) p (bar) C (mg/g) p (bar) C (mg/g)
0.55 7.54 0.53 5.20 0.54 4.38 0.54 3.59 0.58 2.53
1.04 11.97 1.07 8.99 1.05 7.40 1.06 5.81 1.08 4.36
2.02 18.09 2.04 14.25 2.07 11.97 2.08 9.42 2.06 7.50
3.03 23.02 3.05 18.56 3.06 15.83 3.06 12.88 3.07 10.27
4.03 26.83 4.05 22.10 4.07 19.17 4.04 16.09 4.07 12.76
6.00 32.38 6.05 27.39 6.06 24.39 6.07 20.84 6.06 16.91
8.02 37.02 8.05 31.53 8.05 28.73 8.06 24.87 8.06 20.70
10.04 40.73 10.02 35.08 10.07 32.44 10.07 28.29 10.04 24.10
13.36 45.40 13.45 39.86 13.39 37.17 13.41 33.06 13.39 29.14
16.75 49.02 16.61 43.44 16.65 40.94 16.69 37.42 16.64 32.94
20.05 52.05 20.04 46.87 20.05 44.82 20.09 41.08 20.12 36.80
25.05 55.60 25.06 50.91 25.03 49.29 25.04 45.58 25.06 41.38
30.06 58.79 30.04 54.61 30.06 53.42 29.97 50.16 30.10 45.77
35.07 61.58 34.99 58.06 35.04 57.08 35.10 54.21 35.10 49.45
40.04 64.15 40.02 60.95 40.04 60.55 39.97 57.82 40.06 53.01
45.02 66.67 45.03 64.14 45.04 63.94 44.99 61.31 45.02 56.43
49.98 69.05 49.95 67.28 50.00 66.98 50.10 64.57 50.05 59.87
54.85 71.45 54.71 70.57 54.96 70.48 54.88 68.44 54.95 63.71
59.91 73.96 60.69 74.33 60.03 74.12 60.04 72.03 59.89 67.45
Table 14 Ethane/Saran HA isotherms
300 K 320 K 340 K 360 K 380 K 400 K
p (bar) C (mg/g) p (bar) C (mg/g) p (bar) C (mg/g) p (bar) C (mg/g) p (bar) C (mg/g) p (bar) C (mg/g)
0.26 44.38 0.29 39.59 0.30 28.11 0.29 22.18 0.32 17.17 0.32 12.67
0.53 59.50 0.62 54.06 0.62 40.09 0.65 34.29 0.63 26.07 0.68 20.67
0.96 71.94 1.02 63.94 0.99 49.32 1.05 42.97 1.04 33.98 1.05 26.79
1.47 80.42 1.42 70.70 1.47 56.86 1.48 50.05 1.49 40.62 1.52 33.02
2.02 86.32 2.02 77.13 2.01 62.82 2.02 56.47 2.03 46.78 2.08 38.59
3.04 93.34 2.99 84.57 3.02 70.66 3.01 64.91 3.02 55.18 3.07 46.34
4.10 98.05 4.03 90.45 4.05 76.21 4.05 71.33 4.05 61.41 4.06 52.31
6.09 103.53 6.08 96.78 6.03 83.24 6.09 79.53 6.05 69.71 6.11 61.34
8.22 107.39 8.16 101.24 8.10 88.56 8.05 85.45 8.07 76.03 8.10 67.83
10.36 110.67 10.19 104.78 10.12 92.63 10.09 90.56 10.07 81.14 10.07 73.17
Adsorption (2016) 22:901–914 913
123

References
Banker, N.D., Srinivasan, K., Prasad, M.: Performance analysis of
activated carbon? HFC-134a adsorption coolers. Carbon 42,117–127 (2004)
Casas, N., Schell, J., Pini, R., Mazzotti, M.: Fixed bed adsorption of
CO2/H2 mixtures on activated carbon: experiments and model-
ing. Adsorption 18, 143–161 (2012)
Foo, K.Y., Hameed, B.H.: Insights into the modeling of adsorption
isotherm systems. Chem. Eng. J. 156, 2–10 (2010)
Gumma, S., Talu, O.: Net adsorption: a thermodynamic framework
for supercritical gas adsorption and storage in porous solids.
Langmuir 26, 17013–17023 (2010)
Lu, Z.S., Wang, R.Z., Wang, L.W., Chen, C.J.: Performance analysis
of an adsorption refrigerator using activated carbon in a
compound adsorbent. Carbon 44, 747–752 (2006)
Park, Y., Moon, D.K., Kim, Y.H., Ahn, H., Lee, C.H.: Adsorption
isotherms of CO2, CO, N2, CH4, Ar and H2 on activated carbon
and zeolite LiX up to 1.0 MPa. Adsorption 20, 631–647 (2014)
Prasad, M., Akkimardi, B.S., Rastogi, S.C., Rao, R.R., Srinivasam,
K.: Adsorption characteristics of the charcoal-nitrogen system at
79–320 K and pressures to 5 MPa. Carbon 34, 1401–1406 (1996)Saha, B.B., El-Sharkawy, I.I., Thrope, R., Critoph, R.E.: Accurate
adsorption isotherms of R134a onto activated carbons for
cooling and freezing applications. Int. J. Refrig 35, 499–505(2012)
Sips, R.: On the structure of a catalyst surface. J. Chem. Phys. 16,490–495 (1948)
Tzabar, N., Grossman, G.: Nitrogen, methane, and ethane sorption on
activated carbon. Cryogenics 51, 499–508 (2011)
Wang, X.S., Tang, Y.P., Tao, S.R.: Removal of Cr(VI) from aqueous
solutions by the nonliving biomass of alligator weed: kinetics
and equilibrium. Adsorption 14, 823–830 (2008)
Table 14 continued
300 K 320 K 340 K 360 K 380 K 400 K
p (bar) C (mg/g) p (bar) C (mg/g) p (bar) C (mg/g) p (bar) C (mg/g) p (bar) C (mg/g) p (bar) C (mg/g)
13.37 113.88 13.45 108.96 13.35 98.04 13.43 97.18 13.35 87.93 13.36 80.68
16.70 116.62 16.81 113.34 16.64 102.78 19.66 107.61 16.76 94.25 16.70 87.24
20.16 119.45 20.17 118.10 20.08 108.14 25.06 117.83 20.08 100.51 20.13 94.00
25.16 122.68 25.12 125.18 25.10 117.62 30.24 130.50 25.28 111.02 25.34 105.11
30.16 127.08 30.20 136.07 30.07 125.12 30.18 120.54
Table 15 Propane/Saran HA isotherms
300 K 340 K 360 K 380 K 400 K
p (bar) C (mg/g) p (bar) C (mg/g) p (bar) C (mg/g) p (bar) C (mg/g) p (bar) C (mg/g)
0.36 104.39 0.25 67.16 0.25 58.78 0.30 51.11 0.31 43.53
0.93 114.26 0.56 80.80 0.57 74.11 0.60 64.59 0.63 57.54
1.51 118.19 0.96 88.77 1.01 83.28 1.01 74.04 1.02 67.33
2.04 120.79 1.53 94.68 1.49 89.62 1.51 81.13 1.50 75.10
3.07 124.33 2.05 98.41 2.04 93.95 2.07 86.39 2.05 80.91
4.10 127.36 3.05 103.04 3.04 99.26 3.06 92.52 3.06 87.98
5.06 129.78 4.27 107.39 4.08 103.33 4.10 97.23 4.30 94.02
6.08 132.44 5.08 110.42 5.08 107.27 5.08 101.43 5.10 97.82
6.69 134.25 6.07 113.79 6.08 110.88 6.09 105.55 6.08 102.32
7.09 117.39 7.07 114.61 7.09 109.54 7.04 106.61
8.05 121.62 8.04 119.41 8.05 114.28 8.08 112.53
914 Adsorption (2016) 22:901–914
123