Carbon Limits Methane Emissions from LNG Best Practices
54
3 Methane emissions from LNG Best practices from liquefaction to gasification
-
Upload
khangminh22 -
Category
Documents
-
view
0 -
download
0
Transcript of Carbon Limits Methane Emissions from LNG Best Practices

3
Methane emissions from LNG Best practices from liquefaction to gasification

LNG best practice 2
This report was prepared by Carbon Limits AS. Project title: Methane emissions from LNG
Client: Clean Air Task Force Project leader: Stephanie Saunier Project members: Mehak Jilani
Peter Føllesdal Brown Report title: [Report title] Finalized: [Finalized]
Øvre Vollgate 9 NO-0158 Oslo Norway carbonlimits.no Registration/VAT no.: NO 988 457 930
Carbon Limits works with public authorities, private companies, finance institutions and non-governmental organizations to reduce emissions of greenhouse gases from a range of sectors. Our team supports clients in the identification, development and financing of projects that mitigate climate change and generate economic value, in addition to providing advice in the design and implementation of climate and energy policies and regulations.

LNG best practice 3
Table of Contents 1. Introduction .......................................................................................................................................... 4
1.1 LNG supply and demand ............................................................................................................... 4 1.2 The LNG chain ............................................................................................................................... 7
Liquefaction ...................................................................................................................................... 8 LNG export and import terminals ..................................................................................................... 9 LNG carriers ................................................................................................................................... 10 The small-scale LNG value chain .................................................................................................. 10
1.3 Root causes of methane emissions in the LNG chain ................................................................. 11 Leaks .............................................................................................................................................. 12 Boil-off gas generation ................................................................................................................... 12 Emissions from incomplete combustion in energy production ....................................................... 12 Gas freeing and depressurization .................................................................................................. 14
2. Emission sources and best practices ................................................................................................ 17 2.1 Leaks from cryogenic pumps, flanges, connectors, and valve fittings ......................................... 19
Leaks – best available technology and practices ........................................................................... 19 2.2 Gas freeing (and leaks) from connection hoses and points ......................................................... 23
Small-scale LNG trucks .................................................................................................................. 26 Loading LNG to tanker trucks ........................................................................................................ 26 Unloading of tanker trucks ............................................................................................................. 27 LNG bunkering of ships .................................................................................................................. 27 LNG refueling of heavy-duty vehicles ............................................................................................ 29
2.3 Venting of boil-off gas and pressure management ...................................................................... 31 2.4 Incomplete combustion from energy generation .......................................................................... 40
Best practices for incomplete combustion of energy ...................................................................... 41 2.5 Incomplete combustion from flaring of natural gas ...................................................................... 43
Flare gas mitigation and flare gas recovery ................................................................................... 44 2.6 Maintenance and irregular emission sources .............................................................................. 46
Maintenance and irregular – best available technology/practices .................................................. 48 Operations – best available technology and practices ................................................................... 50
3. Discussion ......................................................................................................................................... 53

LNG best practice 4
1. Introduction
Natural gas emits considerably less CO2 than oil or coal when burned. However, natural gas is primarily methane, which is over 80 times more powerful than CO2 as a climate forcer within a 20-year time horizon. Natural gas’ climate credentials vis-à-vis other fuels therefore depend crucially on minimizing methane leaks throughout its supply chain.
An increasing amount of natural gas is liquified, to enable its transport over long distances not served by pipelines. In 2019, the amount of traded LNG increased by over 10% and represented nearly 40% of internationally traded gas.
The LNG stage adds emissions to those already occurring at other segments of the natural-gas supply chain, i.e., from production, processing, and pipeline transport until the gas reaches the liquefaction plant. After regasification, further emissions occur from additional pipeline transportation until end use. The life-cycle emissions of a particular shipment of LNG will therefore depend on practices employed elsewhere along the gas supply chain, as well as the length of the non-LNG portion of the chain.
This report focuses on the LNG segments of the natural-gas supply chain. Some of the emission sources in the LNG segments are similar to those in other segments of the gas chain, such as fugitives and incomplete combustion, while others are unique to LNG, such as those related to the management of boil-off gas.
There is currently very limited documentation available on the magnitude of methane emissions along the LNG chain and the best practices available to reduce them. This study aims to document what is known, based on a literature review and interviews with practitioners, including technology providers, industry associations, and facilities operators. The report is aimed at helping policy makers, the gas industry and climate advocates better understand the technologies and practices currently in use, as well as where to focus future improvements.
1.1 LNG supply and demand
Most natural gas is transported by pipeline. Where pipeline transport is not possible, such as across oceans, gas may be shipped in the form of liquefied natural gas (LNG). Liquifying gas reduces its volume and pressure so that it may be more easily stored and transported. Natural gas is converted into LNG by cooling it to -162 degrees Celsius, a process that reduces its volume by a factor of 600. Increased density allows transportation over long distances in specialized vessels. At its destination, LNG is typically re-gasified and integrated into local transmission and distribution systems, or used by dedicated customers such as combined heat and power plants. LNG may also be used directly as fuel in certain vehicles and ships.
According to the International Energy Agency (IEA), global natural gas production was 4,088 Bcm in 2019, up 3.3% from the previous year. Approximately 1,200 Bcm was traded internationally, and 38.1% of this was in the form of LNG. In 2019, the increase in traded LNG (65.6 Bcm) was greater than the increase in gas traded overall that year (55.5 Bcm), implying a decrease in pipeline volumes to the benefit of LNG.
Demand for LNG has been rising steadily in recent years, primarily due to demand from power generation in Asia. Currently the main LNG importers are China, Japan and Korea, though European imports are increasingly important. The main exporters are Australia, Qatar, and the United States, with significant volumes also coming from Russia, Malaysia, Nigeria and Trinidad. Figure 1 shows the main LNG trade routes and volumes in 2019.

LNG best practice 5
Figure 1 - Global LNG trade routes. Image Source: https://webstore.iea.org/download/direct/4034
Figure 2 and 3 show historical imports and exports for 2010 and 2017, as well as projections for 2027. However, the projections were made prior to the global Covid-19 pandemic, the impacts of which began to be felt in 2020. The effect of the pandemic on LNG demand and trade is uncertain. The 2020 edition of the IEA’s World Energy Outlook expected a Covid-related drop in economic activity to lead to a 3% fall in world gas demand for that year. Nevertheless, LNG deliveries in 2020 appear to have been at least at the level of 2019.1
1 https://www.bloomberg.com/news/articles/2020-12-31/lng-is-back-on-path-to-global-dominance-after-pandemic-pause

LNG best practice 6
Figure 2 - LNG exporting countries
Figure 3 - LNG importing countries
Image Source (for both): IEA (2018), Market Report Series: Gas 2018, https://www.iea.org/gas2018/
The IEA’s baseline scenario, “Stated Policies”, assumes that Covid-19 is brought under control during 2021. It projects a 14% rise in world gas demand (from 2019 levels) by 2030, led by consumption growth in South and East Asia. On the other hand, the IEA’s “Delayed Recovery Scenario” assumes demand for natural gas is strongly curtailed by weaker demand from power and industry, cutting into LNG demand, at least in the near term.
Existing LNG liquefaction capacity is about 427 million tons (approximately 580 Bcm) per annum. After a slowdown in capacity additions for several years, investment decisions were taken for an additional 29 Bcm of capacity in 2018, followed by another 96 Bcm in 2019. Prior to the pandemic, the IEA had expected decisions on a further 150 Bcm of capacity by 2024. A fall in demand under the Delayed

LNG best practice 7
Recovery Scenario could significantly lower the need for many of the additional projects. Even if LNG volumes fall, however, LNG is likely to remain a significant and growing share of world gas movements for decades to come – while scrutiny of the gas industry’s contribution to global methane emissions is only likely to intensify.
1.2 The LNG chain
The supply chain for natural gas includes production, processing (to remove impurities), and long-distance transmission by pipeline. It also may include storage in underground facilities and distribution by pipelines to homes and small consumers.
The full supply chain for LNG includes most if not all of these “conventional” segments in addition to segments particular to LNG: liquefaction, loading, shipping, unloading, and regasification.
This report focuses on the segments of the supply chain unique to LNG. It also covers small-scale distribution up to the filling or bunkering of LNG as fuel for specialized heavy trucks and ships.
The main emission sources that LNG segments share with the “conventional” segments of the gas supply chain include unintended fugitive leaks from wear and tear on equipment and connections, venting included in the design of some equipment and processes, venting for safety purposes, and incomplete combustion.
However, LNG poses some additional challenges. The most important of these is the management of boil-off gas (BOG). Over time, LNG is gradually and continuously warmed, and a portion of the liquid boils off and becomes vapor. This vapor is either routed out of the storage tank or contained under pressure. If not carefully designed with sufficient boil-off gas management, every LNG storage tank has a potential for methane release.
In addition, whereas natural gas pipeline networks are designed to be closed and integrated systems, the LNG value chain is, by its nature, a series of separate systems which connect and disconnect as LNG is transferred and transported. Every transfer poses a risk of emissions, e.g., from leaks, purging of transfer lines, and/or the disconnection process.
Furthermore, this series of different systems, involving storage tanks, vessels, and vehicles periodically needs to be emptied and warmed up for maintenance or for extended periods without load. Safely freeing the tanks for natural gas in the form of liquid or vapor involves first purging them with inert gas, primarily nitrogen. The mixture of natural gas and nitrogen is not easily combusted, and represents potential emissions to the atmosphere if not handled in a proper way. When entering into service again, the same tanks must be cooled down, a step which is primarily done with LNG, generating excess amounts of boil-off gas which also must be handled.
This section describes the main technical processes in the different segments of the LNG supply chain, noting the main emission sources at each segment, as well as the best practices used to address them. Section 0 describes each of the best practices in detail, arranged by emission source type.
The LNG value chain can be divided into liquefaction and export, LNG tanker transport, and finally import and regasification.

LNG best practice 8
Figure 4 - The LNG value chain
Liquefaction
Natural gas arrives by pipeline at a liquefaction facility, where it is cooled in order to condense it to form LNG. Most liquefaction plants are located near ports, so that the LNG later can be easily loaded onto special ships. Since the liquefaction process is very energy-intensive, the cooling process adds to the carbon footprint of the gas even before methane emissions are taken into account.
Mixed Refrigeration is the most common liquefaction technology, and is illustrated in Figure 5. Feed gas enters a cryogenic heat exchanger, where it passes by a mixed refrigerant (consisting of hydrocarbons) that cools the natural gas to the desired temperature (-162 °C), forming LNG. Warm mixed refrigerant flows through a cycle, gets compressed and recondensed, and flows back to the cryogenic heat exchanger to cool the feed gas.
Figure 5: Liquefaction process diagram2
The main determinants of methane emissions are facility design and operational procedures. Methane emissions in the liquefaction process can come from:
• fugitive leaks from equipment wear and tear; • venting incorporated into equipment design; • venting of methane for pressure control or emergency purpose; • Incomplete combustion of excess or off-specification gas in flare stacks, incinerators and other
process heat generators; and • Incomplete combustion of fuel for generating power for equipment.
2 He, T., Karimi, I. A., & Ju, Y. (2018). Review on the design and optimization of natural gas liquefaction processes for onshore and offshore applications. Chemical Engineering Research and Design, 89-114.
LiquefactionLNG
export terminal
Loading Transport OffloadingLNG
import terminal
Regasification
Ballast transport
LNG Tanker LNG import and regasificationLNG – Large scale production
PipelineNaturalgas
KEY
LNG
Empty Transport
Natural gas

LNG best practice 9
A well-designed facility can liquefy LNG with very low methane emissions, down towards 25 g CH4 per metric ton of LNG liquefied.3 However, methane emissions can be much higher, dependent on technologies and practices used at the liquefaction facilities.
LNG export and import terminals
After the liquefaction process, LNG is ready to be stored in well-insulated cryogenic tanks before being loaded onto ships. Export terminals are designed for loading of large LNG carriers, and in addition to the storage tanks, contain equipment such as pumps, compressors, flare stacks and marine loading arms.
In cases where the export terminals are adjacent to liquefaction facilities, the LNG can be sent directly to the export terminal storage tank. At some facilities, LNG is transported from the liquefaction facility to the terminal by several kilometers of pipeline.
LNG import terminals are designed to receive LNG from the LNG carriers, using similar equipment to the export terminals. One major difference is that import terminals generally also are used for regasification of the LNG, using vaporizing equipment to deliver gas to pipelines.
Once LNG reaches an import terminal, liquid natural gas is pressurized and regasified to be injected into pipelines or other transport modalities for delivery to end users. Figure 6 illustrates the regasification process at an import terminal. After unloading, the LNG is stored in tanks. Prior to delivery to the gas grid, the LNG goes through a vaporization unit and is usually odorized (for safety).
Figure 6: Regasification of LNG at an LNG import terminal4
From a methane mitigation perspective, the emission sources and many of the best practices are similar for export and import terminals. As in liquefaction facilities, the main determinants of methane emissions are facility design and operational procedures. Facilities can be designed to achieve very low emissions during normal operations and can strive towards low emissions during maintenance. However, without emphasis on emissions during the design phase, emissions can remain substantial.
The main sources of methane emissions from LNG export/import terminals are:
• Fugitive leaks from equipment, and from loading arms;
3 The example is based on the Sabine Pass LNG facility in the United States, which reported emissions of methane of 618 tons in 2019, and 24.6 million tons of LNG production. (Source: EPA Facility Level Information on Greenhouse Gases Tool https://ghgdata.epa.gov/ghg) 4 http://broadleaf.com.au/work/risks-and-treatments-for-an-lng-regasification-facility/

LNG best practice 10
• Venting of methane (blowdown) from LNG storage tanks and equipment for pressure control or emergency purposes (through pressure relief valves and vent stacks);
• Venting of methane during cooling process of equipment at the terminal; • Incomplete combustion of fuel (such as natural gas) from power generating equipment; and • Incomplete combustion of boil-off-gas (during operations) and blowdown gas
(maintenance/emergency shutdown) from flare systems.
Marcogaz, the technical association of the European natural gas industry, performed a survey of methane emissions from LNG terminals in Europe in 2015. The survey was based on emission date from operators of 20 LNG facilities, of which 9 were considered representative. The survey estimated average emissions from these LNG terminals to be 0.12 g CH4/Nm3 of vapor sendout (165 g CH4/ metric ton of LNG).5 From the survey, 83% of methane emissions were fugitive leaks, followed by vents (6%), pneumatic emissions (6%) and incomplete combustion emissions (5%).
LNG carriers
Over 600 LNG tanker ships are currently in operation, the vast majority between 70 000 and 150 000 deadweight tons6. The main transport routes for LNG (over 10 MT) are between Australia and China, Australia and Japan and, Qatar and South Korea, with typical voyages ranging from a few days to over a month. Methane emissions can happen during transport and maintenance of LNG carriers. Currently, no research has been published for which methane emissions from LNG carriers were measured. Measurement campaigns are planned to be performed in 2021 as part of the project “LNG transport: Measuring and Minimizing Methane Emissions”, by The Queen Mary University of London and SLR International.
The main sources of methane emissions from LNG transport via LNG carriers are:
• Incomplete combustion in engines, generators and turbines; • Venting of methane from LNG storage tanks and equipment for pressure control or emergency
purposes (through pressure relief valves and vent stacks); and • Fugitive leaks from equipment and component wear and tear.
The small-scale LNG value chain
LNG is increasingly being used for small-scale applications, including as fuel in ships and heavy road vehicles, and as a source of natural gas in areas without pipeline infrastructure. The small-scale LNG value chain involves transport of LNG on trucks or ships for delivery to relatively small storage tanks, filling stations, or the bunkering of ships with LNG as fuel.
Tanker trucks are widely used for transporting LNG between large and small-scale storage facilities, filling stations for vehicles, bunkering facilities for ships, and delivery to industrial end-users. The capacity of LNG trucks varies from 35 to 56 m³ for conventional trucks and up to 80 m³ for a truck/trailer combination. ISO tank containers with a capacity of 21 m³ (20” container) or 45 m³ (40” container)7 can also be used (standards developed through the International Standards Organization).
With 175 ships and ferries currently using LNG as their main fuel source, and an additional 232 under order,8 LNG is increasingly becoming an alternative fuel in the maritime sector. Methane emissions can arise at different stages while the ship is in operation, and while bunkering fuel. Small-scale ships can also
5 Marcogaz. (2018). Survey Methane Emissions for LNG Terminals in Europe. Brussels: Marcogaz. 6 GIIGNL. (2020). The LNG Industry: GIIGNL Annual Report. GIIGNL. 7 EMSA guidance on LNG bunkering http://emsa.europa.eu/hns-pollution/items.html?cid=280&id=3207 8 https://www.tu.no/artikler/verdens-storste-lng-drevne-containerskip-bunkret-i-rotterdam/502930?key=og2lQdZ2

LNG best practice 11
be used for distribution, receiving LNG from tankers and large-scale storage facilities, for delivery to small-scale storage and for bunkering ships.
Methane emissions in the small-scale LNG supply chain can come from:
• Venting of transfer equipment, such as hoses; • Venting of tanks, to manage boil-off gas; • Leaks from equipment; and • Venting due to maintenance.
Figure 7 - Activities in the small-scale LNG chain
A study of methane emissions9 found that emissions were associated with LNG delivery from tanker truck transfer, boil-off from storage tanks, and the refueling process. The researchers estimated that the transfer process to storage tanks in filling stations represented 1280 g CH4/t LNG, venting of storage tank boil-off represented 1000 g CH4/t LNG, and filling of vehicles (including venting, leaks and boil-off) represented 2200 g CH4/ t LNG.
1.3 Root causes of methane emissions in the LNG chain
The root causes of methane emissions in the LNG value chain are: leaks, gas freeing processes, boil-off gas, power production, and excess gas.
9 Clark, Nigel et al. Pump-to-Wheels Methane Emissions from the Heavy-Duty Transportation Sector, Environ. Sci. Technol. 2017, 51, 2, 968–976
LNG filling stations
Loading Storage
Offloading
Re-gasification
LNG small scale storage
LNG ship bunkering
LNG trucks
Bunkering
Loading Transport Offloading
Return transport
KEY
LNG
Empty/vapor return
Storage Filling LNG vehicle
Ship
Loading
Ship
Truck, ship
Pipeline

LNG best practice 12
Leaks
Leaks are usually caused by ordinary wear in sealed joints such as flange gaskets, screwed connections, valve-stem packing, and poorly seated valves. Leaks can also come from the wall of a pressurized vessel or pipeline as a result of corrosion or damage.10 In LNG facilities, very low temperatures and temperature fluctuations can put strain on joints and equipment, resulting in small leakages which may accumulate to become significant over time.11
Boil-off gas generation
Even with well-insulated storage tanks, ambient heat will warm LNG over time, causing boil-off gas. This boil-off gas has 600 times more volume than liquified gas, and must either be routed out of the storage tank or, in the case of pressurized tanks, contained under pressure. However, even pressurized tanks have a maximum allowed operating pressure, and continuous generation of boil-off gas must eventually be managed or released.
Every step of LNG transfer along the supply chain also increases boil-off gas generation, when warm transfer equipment comes into contact with the LNG.
Emissions from incomplete combustion in energy production
Liquefaction is an energy-intensive process, which commonly use natural gas for power production. Due to incomplete combustion in turbines and engines, some methane will be emitted unburned. Depending on the power generation equipment, these emissions can range from relatively small to quite substantial, as discussed under section 1.8 below.
One method of managing boil-off gas from LNG storage tanks is by combustion in engines, e.g. on LNG carrier vessels. While this results in utilization of the boil-off gas and high levels of destruction, the remaining methane in the exhaust gas can be a significant emission source in many types of engines.
10 https://methaneguidingprinciples.org/wp-content/uploads/2019/11/Reducing-Methane-Emissions-Equipment-Leaks-Guide.pdf 11 PIPEOTECH. (n.d.). DeltaV-Seal solved permanent leakage at processing plant. Retrieved from https://www.pipeotech.com/industries/oil-and-gas/deltav-seal-solved-permanent-leakage-problems-at-process-plant

LNG best practice 13
Figure 9 - GHG intensity for LNG facilities surveyed12
12 https://www2.gov.bc.ca/assets/gov/environment/climate-change/ind/lng/lng_emissions_benchmarking_-_march_2013.pdf
Emissions from energy usage associated with LNG
As energy generation may be a large source of methane emissions in the liquefaction process, the emissions of CO2 are much higher in this segment than those of methane.
A study of LNG liquefaction facilities in Qatar, Norway, Australia and the United States, published in 2013, benchmarked the GHG intensities of each facility per ton of LNG produced. The survey of energy consumption indicated that the refrigeration step is the most energy intensive, representing 450-500 kWh of energy for each ton of LNG produced. The emissions associated with the different processes were estimated, illustrated in the figure below.
Figure 8 – Typical GHG emission allocation from a natural gas powered LNG facility (DelphiGroup, 2013)
Normalizing the emissions intensity for a gas stream containing 1.5% CO2, the benchmarking found that the emissions ranged between 260 and 490 g CO2/kg LNG. A facility which used electricity from the grid (with an emission factor of 200 g/kWh) would have a GHG intensity of 170 g CO2/kg LNG.

LNG best practice 14
Gas freeing and depressurization
Another root cause of emissions is the gas-freeing process, where equipment, pipelines, and storage tanks are purged of natural gas. Every transfer of LNG has a risk of emissions. Transfers contribute both to additional boil-off gas (from cooling down transfer equipment), and risk emissions to the atmosphere. Transfer involves using equipment which must be connected and cooled down, often requiring purging with inert gas both before and after the transfer process. This purging process is done for safety reasons, to avoid a hazardous mix of oxygen and hydrocarbons. The LNG supply chain, with sequential transfers between storage tanks, and vessels or vehicles, uses transfer equipment where purging may be necessary after each use. The purging process, if not performed carefully, risks venting mixes of nitrogen and methane to the atmosphere.
It is also often necessary to free equipment and storage tanks of hydrocarbon gas when performing maintenance at facilities and on vessels. While flaring is commonly used in facilities, in some cases this involves venting the methane to the atmosphere.
1.4 Estimates of emissions in the LNG value chain
A 2019 study13 performed by the National Energy Technology Laboratory in the United States investigated life-cycle GHG emissions from U.S. LNG exports. With calculations based on the most likely routes for production, transport, and usage, the study estimated that methane emissions would account for 9%14 percent of a cradle-to-delivery GHG footprint of an LNG export. Based on emission factors, the study estimated that methane emissions from the LNG-specific value chain would be 4000-5000 g per ton of LNG throughput, and that upstream emissions would be 7000 g per ton of LNG throughput. Liquefaction was the part of the value chain with the highest relative methane emissions, followed by LNG carrier transport. Regasification represented only methane emissions of 90 g per ton of LNG throughput.
However, emissions from specific LNG facilities are extremely variable and estimating emissions from LNG is difficult without performing measurements on an actual facility. The Environmental Protection Agency has published multiple memorandums15 on methodologies for estimating emissions from LNG. After analyzing emission reports from LNG import, export, and storage facilities, the EPA found no clear relationship between activity data (e.g. number of components or throughput) and emissions data. While the reasons for this are unclear16, the reported data show a large variation in methane emissions not only between facilities, but also in the distribution of emissions between sources. While flares dominate the “normal” emission source in facilities, engine exhaust, compressors and equipment leaks are also large contributors. However, the largest emission source appears to be irregular venting from blowdowns, which represents over 80% of emissions in estimates. Flaring also appears to be highly irregular.
It is therefore difficult to precisely estimate the effect of implementing best practices. As an indication, the upper bounds of emissions from the different parts of the value chain have been estimated in Figure 10. Based on reporting data from large facilities in the United States and Europe, industry estimates,
13 S. Roman-White, S. Rai, J. Littlefield, G. Cooney, T. J. Skone, "Life Cycle Greenhouse Gas Perspective on Exporting Liquefied Natural Gas from the United States: 2019 Update," National Energy Technology Laboratory, Pittsburgh, September 12, 2019. 14 Using GWP100 15 Inventory of U.S. Greenhouse Gas Emissions and Sinks 1990-2017: Updates Under Consideration for Liquefied Natural Gas Segment Emissions (epa.gov)
https://www.epa.gov/sites/production/files/2019-04/documents/2019_ghgi_update_-_lng_2019-04-09.pdf 16 While changes in reporting schemes, changes in estimation methodology and reporting error could contribute to the large variation in estimated emissions, it could also be explained by differences in equipment and practices between facilities.

LNG best practice 15
academic reports, and engineering estimates, a range of emissions levels has been collected on the different sources and the different parts of the value chain.
Figure 10 - Upper bounds of CH4 emissions in the LNG value chain
It is important to note that the upper ranges are estimates of high-emitting practices, to illustrate the emission reduction potential of best practices. The upper ranges are not estimates of average emissions through the LNG value chain.
The upper ranges of methane emissions from liquefaction facilities have been inferred from reported emissions from facilities in both the United States and in Europe. This data shows high variability, both in size and distribution. Flaring17 and leaks are the largest contributors, while methane emissions from electricity generation18 may also be significant.
17 Based on reported data from one facility (Freeport LNG 2019) 18 Based on reported data from one facility (Melkøya 2019)
Liquefaction and export
Value chain
Leaks from cryogenic pumps,
flanges, connectors, valves fittings
Incomplete combustion in
energy generation
Venting of boil-off gas and pressure
management
Incomplete combustion from
flaring
Gas freeing (and leaks) from
connection hoses and points
Maintenance and irregular emissions
150 g CH4/t LNGDependent on
components and LDAR practices
Import and regasification LNG carriers Small-scale LNGLoading/offloading
Best practicesDependent on
components and LDAR practices
100 g CH4/t LNGDependent on
components and LDAR practices
140 g CH4/t LNGDependent on
components and LDAR practices
Best practices
Less than 10 g CH4/t LNG.
Dependent on practices
Best practices800 g CH4/t LNG
Dependent on transfer equipment.
Best practices
10 g CH4/ t LNGDependent on equipment and
practices
Best practices
1500 g CH4/t LNGDependent on
BOG management technology
1100 g CH4/t LNGDependent on
BOG management/ transfer equipment.
4 g CH4/ t LNGDependent on equipment and
practices
12 g CH4/ t LNG Dependent on
energy generationBest practices
195 g CH4/ t LNGDependent on
engine and BOG management.
Best practices
32 g CH4/ t LNGDependent on
electricity generation
45 g CH4/ t LNGDependent on vapor recovery
equipment
Best practices Best practices Best practices155 g CH4/ t LNG
Dependent on equipment
Not estimated Best practices Not estimated Not estimatedNot estimated
Sour
ces
KEYCH4 emissions below 10 g/t LNG throughput
CH4 emissions between 10g and 100g / t LNG throughput
CH4 emissions above 100g/ t LNG throughput
LNG best practice 16
For import and regasification facilities, the data is based on the European Gas Association (Marcogaz), and reported emissions from the United States.19 Fugitive emissions are the dominating source of normal emissions, based on a survey of EU import facilities20.
For the loading and offloading process, engineering estimates of the potential for emissions from the purging process can be performed based on the internal diameters and pressures of the of LNG loading arms. Simplified estimates21 indicate that even the upper ranges of potential emissions are relatively small when compared to the throughput volume.
Very little information has been found on fugitive emissions from LNG carriers, and this is an area where more research is needed. The main emissions are likely to be related to management of boil-off gas. Utilization of boil-off gas as a secondary fuel in marine engines is a common management method, but some methane is not combusted. Over long voyages this methane slip can be significant.22 Furthermore, boil-off gas may be vented to the atmosphere when an LNG carrier is not at full cruise, i.e. ramping up and ramping down during navigation.23
The upper ranges of the small-scale LNG value chain can be substantial if best practices are not implemented. The upper ranges are based on measurement and estimation in peer-reviewed academic papers.24
19 Facility Level Information on GreenHouse gases Tool https://ghgdata.epa.gov/ 20 Marcogaz. (2018). Survey Methane Emissions for LNG Terminals in Europe. Brussels: Marcogaz. 21 Calculations based on assumptions of 4 x 20 inch loading lines, 100 meter length, and full venting of gas after transfer. 22 Upper range estimate based on 0.15% daily boil-off rate, 30 days of voyage, and emission factor from combustion of 4 g/GJ of fuel. 23 Upper range based on 0.15% daily boiloff rate, one day of full venting per load. 24 Clark (2016)

LNG best practice 17
Emission sources and best practices
This section provides an overview of best-practice solutions for addressing methane emissions in the LNG supply chain. Solutions are presented by emission source. Most emission sources may be found in more
than one segment of the supply chain, as indicated by
Figure 11. The main solutions for addressing particular sources at particular segments in the chain are listed in the shaded boxes of the table. The degree of shading in a box indicates the potential severity of the particular emission source at that particular point in the value chain. In many cases, a solution will be relevant for a given source no matter where it occurs across the supply chain.
Figure 11 - Emission sources and best practices in the LNG value chain
Many potential emission sources (and associated mitigation options) along the LNG value chain are similar to very well-documented potential emission sources from other segments of the natural gas value chain. These potential emission sources are not described in detail in this report but are briefly summarized in Table 1 below, along with references to additional sources of information:
KEYSmall emission reduction expected
Medium emission reductions expected
Large emission reduction expected
Liquefaction and export
Value chain
Leaks from cryogenic pumps,
flanges, connectors, valves fittings
Incomplete combustion in
energy generation
Venting of boil-off gas and pressure
management
Incomplete combustion from
flaring
Gas freeing (and leaks) from
connection hoses and points
Maintenance and irregular emissions
LDAR, no-leak valves
Import and regasification LNG carriers Small-scale LNGLoading/offloading
Best practices LDAR, no-leak valves LDARLDAR, no-leak
valves
Best practices Dry-disconnect couplings Best practices
Dry-disconnect couplings, vapor return, cryogenic pump and PBU
Best practices
Reliquefaction, utilization Best practices Reliquefaction
Reliquefaction, nitrogen chilling,
CNG-filling
Reliquefaction, utilization
Methane optimized combustion,
catalytic conversion
Best practices
Methane optimized combustion,
catalytic conversion
Best practices
Methane optimized combustion,
catalytic conversion
Improve flaring efficiency, flare gas recovery, reduce boil-off to flare
Best practices Best practices Best practicesImprove flaring
efficiency, flare gas recovery
Gas recovery solutions Best practices Gas freeing
servicesGas freeing
services
Optimized precooling, gas
recovery solutions
Sour
ces
KEYSmall emission reduction expected
Medium emission reductions expected
Large emission reduction expected

LNG best practice 18
Emission source Mitigation option More information 25
Leaks (un-intended emissions)
Leak detection and repair programs and directed inspection and maintenance programs
Reduce the number of flanges/connectors
26 27 28
Centrifugal compressor seals
Dry seal compression
Re-route the vent gas to minimize emissions
29 30
Reciprocating compressor rod packing
Regular replacement of rod packing
Re-route the vent gas to minimize emissions
31 32
Compressor gas starter
Switch to electric motor starter
Minimize the number of start and stops
Re-route the vent gas to minimize emissions
33 34
Natural gas driven pumps
Use electrically driven pumps 35
Natural gas driven controllers
Use zero emission controllers 36 37
Table 1 - Common emission sources
25 Non-exhaustive 26 https://www.ccacoalition.org/en/resources/technical-guidance-document-number-2-fugitive-component-and-equipment-leaks 27 https://methaneguidingprinciples.org/best-practice-guides/equipment-leaks/ 28 https://methaneguidingprinciples.org/best-practice-guides/operational-repairs/ 29 https://methaneguidingprinciples.org/best-practice-guides/venting/ 30 https://www.ccacoalition.org/en/resources/technical-guidance-document-number-3-centrifugal-compressors-%E2%80%9Cwet%E2%80%9D-oil-seals 31 https://www.ccacoalition.org/en/resources/technical-guidance-document-number-4-reciprocating-compressors-rod-sealpacking-vents 32 https://methaneguidingprinciples.org/best-practice-guides/venting/ 33 https://methaneguidingprinciples.org/best-practice-guides/venting/ 34 https://methaneguidingprinciples.org/best-practice-guides/engineering-design-and-construction/ 35 https://www.ccacoalition.org/en/resources/technical-guidance-document-number-1-natural-gas-driven-pneumatic-controllers-and-pumps 36 https://www.carbonlimits.no/project/zero-emission-technologies-pneumatic-controllers-in-usa/ 37 https://www.ccacoalition.org/en/resources/technical-guidance-document-number-1-natural-gas-driven-pneumatic-controllers-and-pumps

LNG best practice 19
1.5 Leaks from cryogenic pumps, flanges, connectors, and valve fittings
Leaks from equipment and components can make up a large percentage of total methane emissions from a facility. Leaks are common in all stages of the LNG value chain, from liquefaction to small-scale distribution and use.
Methane leaks are commonly detected in equipment such as pumps, compressors and pneumatic devices. Cryogenic pumps and compressors can leak methane over time due to wear and tear or improper installation of equipment at the site. Pumps leak methane, normally at the drive shaft seal, while compressors leak around the gaskets, compressor flanges and valves after experiencing temperature and pressure fluctuations.38
In addition to compressors and pumps, pneumatic devices are one of the largest emitters of methane during operation. These devices are powered by natural gas pressure and are used when electrical power is not available on site. Pneumatic controllers are used to monitor and control levels, temperatures and pressures in the facility, by opening and closing valves and venting natural gas continuously or intermittently to regulate pressure within the system.39
Pumps and compressors are also typically connected to pipelines through flanges. Pipeline flanges/connectors and fittings are common in all parts of the LNG value chain and are often sources of methane leaks due to gasket failure and loose bolts. Loose flanged connections continuously leak a small amount (molecular level) during the operational phase of a facility. Extreme temperature conditions can lead to further deterioration and increase leakage.40
In a liquefaction plant and in other parts of the supply chain, different kind of valves can be found for different purposes, such as cryogenic isolation valves, process control valves and compressor anti-surge valves.41 There are two main types of cryogenic valve leakages: internal leakage and external leakage. Internal leakage is due to the deformation at low temperatures of seal support,42 while external leakage is due to failure of the connection with the pipeline. Such valves often leak due to deterioration (Matosec, 2018).
Leaks – best available technology and practices
Implementation of a comprehensive Leak Detection and Repair (LDAR) program and DI&M43
38 Climate and Clean Air Coalition . (2017). CCAC O&G Methane Partnership- Technical Guidance Document Number 2: Fugitive component and equipment leaks. CCAC. 39 Methane Guiding Principles. (2019). Reducing Methane Emissions: Best Practice Guide - Equipment Leaks. 40 Climate and Clean Air Coalition . (2017). CCAC O&G Methane Partnership- Technical Guidance Document Number 2: Fugitive component and equipment leaks. CCAC. 41 Matosec, M. (2018). LNG: Significant opportunities for cryogenic valve. 42 Cooling of natural gas changes the volume of the valve and causes warping deformation of the seal surface 43 “Subsets of the LDAR programs are ‘smart LDAR’ programs or directed inspection and maintenance (DI&M) programs, where only a focused group of equipment types or components are inspected. For example, the program might be designed to only inspect types of equipment known to give rise to significant leaks, or designed to perform only limited repairs, such as those considered to be cost-effective” source: Reducing Methane Emissions:Best Practice Guide Equipment Leaks – Methane Guiding principle – 2019
Liquefaction
Value chain
Leaks from cryogenic pumps,
flanges, connectors, valves fittings
LDAR, no-leak valves
Export/import terminals LNG carriers Small-scale LNGLoading/offloading
Best practices LDAR, no-leak valves LDARLDAR, no-leak
valves

LNG best practice 20
Leak Detection and Repair Programs are key for reducing unintentional methane leaks. LDAR is used to describe the processes and systems by which an emission source is identified, prioritized and repaired.44 All natural gas installations in general (including LNG facilities in all parts of the supply chain) should be systematically and regularly surveyed to identify potential emissions points and address them. Methane leakages from e.g., pumps, flanges, connectors and valves can be detected (and ideally quantified) using a range of mature and recent technologies. Processes and technologies to successfully identify leaks from natural gas value chains have been documented in a number of reports45 over the past few years. The following few paragraphs focus on a few examples of specificities for repairs in LNG facilities.
Selection of the valves: A number of companies offer valves specifically designed to minimize the risk of leaks in extreme cold conditions: For example, ValvTechnologies manufactures cryogenic valves that are designed for extreme temperatures and to prevent leakage.46 Likewise, Habonim, a manufacturing company of industrial valves and actuators, has a catalogue of cryogenic valves designed to be leak proof and applicable for the LNG industry.47 Thermal insulation of cryogenic valves, e.g., a vacuum-jacketed cryogenic valve encased fully within an outer steel jacket, can also be considered for preventing freezing of the upper packing, which can make the valve inoperable, and to prevent two-phase flow, which could result from heat being transferred to the liquid passing through the valve.48 Flanges torque: One of the best practices to reduce methane leakage from flanges/gaskets at liquefaction facilities is to ensure that the flanges are connected with the correct torque value (as documented by the manufacturer), and that proper installation methods are used. If there is a need for re-torquing of bolted flanges, it is important to perform the re-torquing at ambient temperatures.49 Sealant material: Sealant material is an important factor in reducing methane leakage from flanges. Typical elastomer-based sealant materials can become hard and brittle when operations are carried out at temperatures below -73 °C, which could result in cracks in gasket material. It is therefore important to select a sealant material which could withstand extreme temperatures such as flexible graphite and polytetrefluoroehtylene (PTFE).50 Gasket sealing solutions: There are several gasket sealing solutions to reduce or prevent flange leaks. These are capable of operating in extreme temperatures and offer a gas-tight solution for flanges.
44 IPIECA. (2018). Methane Glossary. London: IPIECA. 45 Examples include: https://methaneguidingprinciples.org/wp-content/uploads/2019/11/Reducing-Methane-Emissions-Equipment-Leaks-Guide.pdf
https://www.ccacoalition.org/en/resources/technical-guidance-document-number-2-fugitive-component-and-equipment-leaks 46 ValvTechnologies. (2016, September). Cryogenic Valves for LNG Service. Retrieved from http://www.valv.com/ebrochures/ 47 Habonim. Cryogenic Valves. Retrieved from Habonim: Industrial Valves and Actuators: https://www.habonim.com/ 48 Redenbarger, P. (2016, June). A Cryogenic Valve Primer. Retrieved from Cryogenic Society of Ameria, Inc: https://cryogenicsociety.org/35088/news/a_cryogenic_valve_primer/ 49 Norton, C., & Frisard, R. (2018, July). Sealing for Extreme Cold: Best Practices for Static Seals. Pump and systems, pp. 66-68. 50 Norton, C., & Frisard, R. (2018, July). Sealing for Extreme Cold: Best Practices for Static Seals. Pump and systems, pp. 66-68.
LNG best practice 21
Flange washers: Use of flange washers which are able to maintain sufficient bolt tension and gasket stresses in extreme temperature and pressure conditions can eliminate the need for re-torquing the bolts on flanges and increase the elasticity of bolting system.51
Table 2 - LDAR
51 Solon Manufacturing Inc. (n.d.). Flange Washers Reduce Fugitive Emissions in LNG Applications. Retrieved from Solon Manufacturing: https://www.solonmfg.com/case-studies/lng
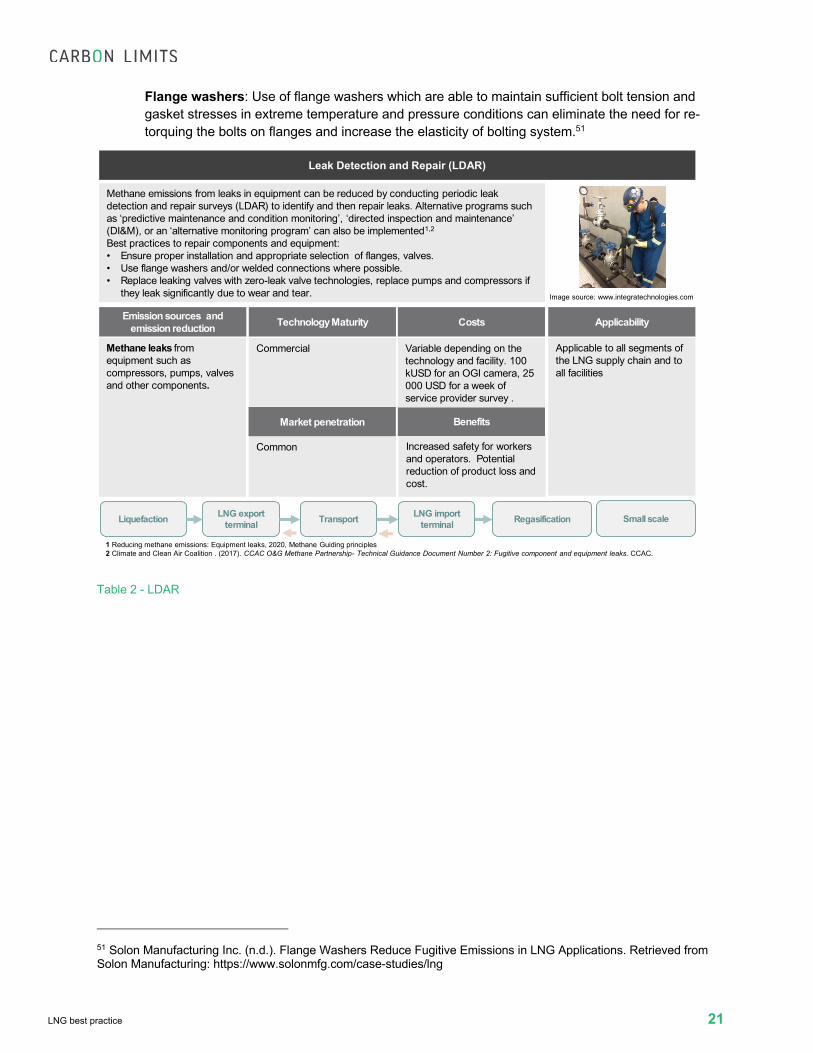
Leak Detection and Repair (LDAR)
Technology Maturity
Commercial
Benefits
Methane emissions from leaks in equipment can be reduced by conducting periodic leak detection and repair surveys (LDAR) to identify and then repair leaks. Alternative programs such as ‘predictive maintenance and condition monitoring’, ‘directed inspection and maintenance’ (DI&M), or an ‘alternative monitoring program’ can also be implemented1,2
Best practices to repair components and equipment:• Ensure proper installation and appropriate selection of flanges, valves. • Use flange washers and/or welded connections where possible.• Replace leaking valves with zero-leak valve technologies, replace pumps and compressors if
they leak significantly due to wear and tear.
Increased safety for workers and operators. Potential reduction of product loss and cost.
Applicability
Market penetration
Common
Applicable to all segments of the LNG supply chain and to all facilities
Emission sources and emission reduction
Methane leaks from equipment such as compressors, pumps, valves and other components.
Liquefaction LNG export terminal Transport LNG import
terminal Regasification Small scale
Image source: www.integratechnologies.com
1 Reducing methane emissions: Equipment leaks, 2020, Methane Guiding principles2 Climate and Clean Air Coalition . (2017). CCAC O&G Methane Partnership- Technical Guidance Document Number 2: Fugitive component and equipment leaks. CCAC.
Costs
Variable depending on the technology and facility. 100 kUSD for an OGI camera, 25 000 USD for a week of service provider survey .

LNG best practice 22
Table 3 - Low emission valves
Low emission valves
Technology Maturity
Commercial
Benefits
Different types of valves are used throughout the LNG facility. Valves can emit methane due to normal wear and tear, as part of normal operation or due to valve failure. Valves can be changed to low emission or zero emission valves, if they are needed. If possible, some valves can be eliminated from the system if it is reviewed as not necessary to maintain safety at LNG facility. Pressure relief valves can be replaced to ‘zero emission’ PRVs or a burst plate can be added as an alternative for pressure relief.
• Maintenance costs reduction
Applicability
Image source: valv.com
Market penetration
Medium
• ‘Zero emission valves’ can be retrofitted into existing LNG facility.
Emission sources and emission reduction
Leaks- from valves and PRVs during operation. • This can be eliminated by
nearly 100 % by replacing leaking valves regularly or by using zero emissions valve technologies.
Liquefaction LNG export terminal Transport LNG import
terminal Regasification Small scale
Costs
Dependent on size and type.

LNG best practice 23
1.6 Gas freeing (and leaks) from connection hoses and points
The LNG value chain involves a series of transfer steps. At a minimum, it involves transfer from export terminals to LNG carriers, and from LNG carriers to import terminals. In the case of small-scale LNG, several more transfers are necessary – from import terminals to LNG tanker trucks, and from tanker trucks to filling stations, small scale storage tanks, or to ships for use as fuel.
While the scale of each transfer can range widely, the transfer steps are quite similar in each. The steps and possible emissions from them are described in Table 4, below.
Stage Steps performed Possible emissions Connection and inerting of hoses:
The loading hose is connected between the source tank and the receiving tank. A vapor return hose may also be connected between the two tanks for the transfer of boil-off vapor. Depending on the design of the hose, it may be necessary to purge it with inert gases to remove oxygen before transfer of LNG starts.
Low risk of emissions
Cool-down with LNG Vapor:
Once a secure connection is established, the inert gases are purged with LNG vapor and the loading hose is cooled.
If the connection is not tight, there is a potential for methane leakage. The mix of methane and inert gas may be vented to the atmosphere during the purging process.
Start of transfer:
After the transfer lines are cooled down, the transfer process can begin. If the pressure in the source tank is lower than in the receiving tank, the differential can be overcome by a) a cryogenic pump, b) reducing the pressure in the receiving tank (e.g., via a vapor return hose), and/or c) increasing the pressure in the source tank (e.g., with a pressure buildup unit)
In certain cases, (i.e. in the the absence of necessary equipment) reducing pressure in the receiving tank requires venting to the atmosphere.

LNG best practice 24
Top-up:
The receiving tank volume must be monitored carefully while filling. Each tank has a maximum allowed load. If the tank is overfilled, LNG must be returned to the LNG facility’s source tank.
During a manual level check, small quantities of LNG are released through the vent line. If overfilled, there is a risk of venting due to overpressure.
Stop of transfer and draining of transfer lines:
When loading is stopped, the transfer lines will be filled with liquid LNG. Once transfer stops, these lines are heated up by ambient heat and the LNG begins to boil, increasing pressure and forcing the remaining liquid and gas into the tank.
If liquid remains in the transfer lines, there is risk of emissions during purging or disconnection
Inerting and disconnection of transfer lines:
Depending on the design of the hose, it may be necessary to purge it with inert gases to remove the methane before disconnection. Once the lines are drained of liquid, they are purged with nitrogen to remove methane vapor. The lines are then disconnected.
There is a risk of emissions of a mix of methane and inert gas if this is vented to the atmosphere during the purging process.
Table 4 - The LNG transfer process in general
Emission risks are associated with the inerting and disconnection processes. When cooling down the lines before starting the transfer, the inert gases are displaced by methane, temporarily mixing gases. There is a potential for methane release if this mixture of inert gas and methane is vented to the atmosphere. After transfer, displacement of LNG vapor with nitrogen leaves a mix of methane and nitrogen with a similar potential for emissions to atmosphere.
The natural gas/nitrogen mixture can be either compressed back to the source tank or the receiving tank, or consumed in a gas combustion unit, if available, instead of being vented to the atmosphere. There is also a risk of leaks from the connection hose, if it is not tightly sealed.
Best practices for LNG transfer (whole value chain)
Before transfer starts, the transferring parties should agree on procedures. In particular, this includes how to properly dispose of the mixtures of natural gas and nitrogen from purging.
Both the source tank and the receiving tank must operate within a specified maximum pressure and should be closely monitored during transfer. If the pressure exceeds this level, the pressure release valve will open to vent methane vapor to the atmosphere. Multiple conditions could lead to methane emissions through the pressure release valve: The pressure increase from the cooldown process could exceed the maximum tank pressure and trigger the pressure-release valve. If the receiving tank is not sufficiently cold, filling it with new LNG will cause a high rate of vapor return, increasing the tank pressure.
A newer development is the increased use of dry-disconnect couplings for LNG transfer, allowing connections to be made quickly and securely. Shut-off mechanisms on dry disconnect couplings can eliminate emissions and the danger of methane spillage after the loading and offloading procedure has been completed.
If dry-disconnect couplings are not used, gas measurement should be performed before the transfer hose is disconnected.
Draining of the hoses should be ensured by avoiding U-shapes in the hose where LNG can remain. (Exterior ice caps on the hose can indicate remaining liquid.)

LNG best practice 25
Table 5 - Dry disconnect couplings
Dry-disconnect couplings
Technology Maturity
Commercial
Costs
Cryogenic dry-disconnect couplings are used to connect transfer pipelines and hoses with the transfer systems on tanks, vehicles, and ships. These consist of a tank unit with a spring-loaded poppet and a hose unit or coupler with a valve driven by an internal cam. The coupling process consists of aligning the rollers on the coupler with the notches on the adapter and then rotate. This locks the coupling together, creates a seal, and opens the internal valves for flow.
The shut-off mechanism on both sides seals liquids and gas behind the valve, eliminating emissions and the danger of spillage. This allows for, in certain cases, disconnection of hoses while containing methane - bypassing the inerting process.
Reduces time and complexity of connection and disconnection. Reduces costs for nitrogen purging
Applicability
Image source: manntek.se
Market penetration
Commonly used.
• Applicable to loading and unloading operations in large-scale and small-scale LNG.
• Requires standardization of connections at both filling stations and vehicles/vessels.
Emission sources and emission reduction
Leaks – if connection hoses are not tight.Vents – the couplings can eliminate the need for inertingand purging of methane/nitrogen mixUp to 85 % less spillage/leaks.
Liquefaction LNG export terminal Transport LNG import
terminal Regasification Small scale
EMSA guidance document: http://emsa.europa.eu/about/financial-regulations/download/5104/3207/23.html
Benefits
Dependent on diameterFrom USD 2000 to USD 20,000
Dry-breakaway couplings
Technology Maturity
Commercial
Benefits
During bunkering operations, there is a risk that ship movement or other external stress damages the transfer lines resulting in possible hazardous leaks. Dry break-away couplings are designed to safely separate at predetermined points in the transfer lines. This coupling is similar to dry-disconnect couplings, to the exception of a closure mechanism which automatically seals liquids and gas behind valves on both sides of the breakaway, eliminating emissions and the danger of spillage.
Increases safety in emergency events. For ship bunkering, required in accordance with IGF code.
Applicability
Image source: manntek.se
Market penetration
Commonly used for ship bunkering.
• Applicable to loading and unloading operations at LNG terminals (large scale and small scale) during ship bunkering and truck loading/offloading.
Emission sources and emission reduction
Leaks – from transfer line failures.
Liquefaction LNG export terminal Transport LNG import
terminal Regasification Small scale
EMSA guidance document: http://emsa.europa.eu/about/financial-regulations/download/5104/3207/23.html
Costs
Dependent on diameterUSD 4,000 (2“) -24,000 (6”)
LNG best practice 26
Table 6 - Dry-breakaway couplings
Small-scale LNG trucks
LNG transport by truck is a common method for small-scale distribution of LNG to vessels, to filling stations for trucks using LNG as fuel, or to small LNG storage tanks which provide natural gas to end consumers. There are two major concerns relating to such transfers: the transferring equipment and pressure management during transfer.
Researchers52 monitored six bulk fuel delivery offloads to a facility that employed the most recent refueling technology, a design that did not require the venting of refueling lines after completion of the offload. When everything worked properly and the delivery driver followed all of the directions exactly as requested by site personnel, this new design required venting of only about 1 cubic foot of LNG (about 11.1 kg) of methane. When compared to the amount of LNG delivered to the station (14 650 kg on average), this represented 0.08% of delivered LNG. However, one of the six deliveries did not follow standard procedure, and the operator vented an additional amount of methane, estimated at 50.4 kg, equivalent to 0.38% of the delivered amount
Loading LNG to tanker trucks
The loading process involves driving the truck to an LNG storage facility with a dedicated truck loading bay. Under normal filling procedures, the tank will be in a cool state, retaining some LNG from the previous load, as well as some related boil-off gas. The pressure of the tank will depend on time since the last offloading, as well as the transfer technique.
The tanker is normally connected to the LNG facility with two hoses – one for LNG supply and another for vapor return.
After the transfer lines are cooled down, the transfer process can begin. LNG is normally pumped into the tanker, but loading can also be conducted without a pump, based instead on the static pressure of the liquid column in the LNG supply tank. Since tanker trucks operate under pressure, when filling from LNG facilities under atmospheric pressure, the over-pressure must either be relieved, or the pump must overcome the pressure differential. The vapor return hose relieves the vapor pressure in the truck’s tank, allowing for more efficient transfer of LNG. The returned boil-off gas is then handled in the LNG-facility. Once the LNG transfer starts, the received LNG is cooler than the LNG already in the tank. This leads to condensation of the boil-off gas and reduces the pressure in the receiving tank.
Each tank has a maximum allowed load, which exceeds the volume which is possible to load. The volume must be monitored carefully while filling. If the tank is overfilled, LNG must be returned to the LNG facility’s source tank.
There are multiple ways of measuring the filling status of the tank. However, in some cases the indications used may be imprecise, creating uncertainty. One method involves manually opening venting lines on the tanker truck, which are connected with pipes to dedicated openings inside the tank representing certain fill thresholds (e.g., 85% and 90%). This manual system is used by opening a vent valve, and based on the sound, identifying whether the phase at the measuring point is liquid or gaseous. If the sound is identified to be gaseous, the step is repeated. If the sound identifies liquid, this means the fill level is higher than the threshold.
When loading is stopped, the transfer lines will be filled with liquid LNG. Once the transferring stops, these lines are heated up by ambient heat and the LNG begins to boil, increasing pressure and forcing the remaining liquid and gas into the tanker truck.
52 Clark, Nigel et al. Pump-to-Wheels Methane Emissions from the Heavy-Duty Transportation Sector, Environ. Sci. Technol. 2017, 51, 2, 968–976

LNG best practice 27
Once the lines are drained of liquid, they are purged with nitrogen to remove methane vapor. The lines are then disconnected.
Unloading of tanker trucks
Tanker trucks can deliver LNG to distributed storage tanks, LNG filling stations for heavy duty vehicles, and to ships for use as fuel. The unloading process from tanker trucks is similar to the loading process. However, there are some differences, depending on the tanker truck’s equipment, and the design of the receiving tank:
a) Truck unloading can be based on a submerged pump, and/or pressure build-up in the source tank. b) Transfer can be done with or without vapor return hoses from the receiving tank.
Since tanker trucks are typically unloading to receiving tanks under pressure, this pressure differential must be overcome for LNG to flow. This can be done either by actively building up pressure in the source tank, by using a pump, or a combination of the two. The most common method is to increase pressure in the source tank by using a pressure build-up unit, which heats a portion of LNG and returns it in gaseous form to the top of the source tank. Pressure build-up can also be done through connection to an external nitrogen tank or a natural gas pipeline, if available. A disadvantage of using pressure build-up alone is that this increases pressure in both the source tank and the receiving tank, thereby decreasing holding time before boil-off gas must be managed. Higher pressure increases the risk of venting in both tanks.
Submerged pumps can also be used for transfer, allowing the pressure differential to be overcome without increasing pressure. As the LNG is pumped from the source tank, the pressure decreases. If the pressure decreases too quickly, however, there is a risk that LNG evaporation in the suction line will damage the pump. This operation can therefore be more time-consuming.
The filling sequence is highly dependent on temperature and pressure on both source and recipient tanks. When transferring to a pressurized LNG tank, the recipient tank pressure may gradually decrease due to vapor condensation from contact with the new (cold) LNG load. Alternatively, it may increase because of excessive boil-off gas generation along the transfer pipeline. If the recipient tank is close to its maximum allowable working pressure, this excess pressure must be relieved before transfer starts, either through a vapor recovery line to the source tank, or through venting to the atmosphere. Vapor recovery lines may have the added benefit of reducing transfer time.
LNG bunkering of ships
LNG bunkering53 involves transferring LNG from a source tank to a ship’s fuel tank. While tanker trucks are most commonly used for bunkering vessels, onshore bunkering facilities or bunkering vessels can also be used. The international code of safety for ships using gases or other low-flashpoint fuels (IGF code MSC.391(95)), has an explicit provision that the bunkering system shall be arranged so that no gas is discharged to the atmosphere during filling of storage tanks. This requires careful design of equipment and procedures, as there is a risk of emissions during the different steps of bunkering.
There are many possible configurations for the ship bunkering process, each of which may have implications for emissions. Emissions can happen as a result of leaks in the equipment, vents, and through pressure-release valves. The bunkering process commonly involves LNG being brought to the port area by truck, each of which typically will be able to deliver approximately 25 tons of LNG. In many cases, multiple truckloads are necessary for bunkering, and solutions exist for offloading in series and in parallel. The LNG truck is connected to the receiving ship on the quay, using a flexible hose.
53 This section covers the bunkering (fueling) process only. Ship operations using LNG as fuel are outside the scope of this report.

LNG best practice 28
The bunkering process involves multiple steps, similar to the offloading process described in Table 4 above, and with similar risks of emissions. In addition, ship bunkering involves a higher risk of transfer line failure, for example due to ship movement. For smaller transfers with capacities range of around 50-200 m3/h, and where the receiving tank is pressurized tank (type C), a vapor-return hose will generally not be needed.54
According to the IGF code (section 8.5.5), the bunkering pipes shall be free of gas when not engaged in bunkering, unless the consequences of not freeing the lines of gas are evaluated and approved. The usage of dry-disconnect couplings could potentially forego the need for inerting the bunker lines. Since these couplings automatically close at disconnection, they can be connected and disconnected with methane vapor remaining in the hoses. This allows for a bunkering procedure where the risk of methane emissions is reduced.
Table 7 - Vapor return line
54 EMSA Guidance on LNG Bunkering to Port Authorities, https://safety4sea.com/wp-content/uploads/2018/02/EMSA-Guidance-on-LNG-Bunkering-to-Port-Authorities-and-Administrations-2018_02.pdf
Installing a Vapor return line (VRL)
Technology Maturity
Commercial
Benefits
In pressurized storage tanks such as LNG filling stations, boil-off gas can be contained in the tank until it reaches the maximum allowable pressure and is released to the atmosphere. Since boil-off gas is continuously generated, the filling station eventually will reach this level if left unmanaged. Vapor return lines allow for transfer of vapor from the receiving tank to the source tank.
Without a VRL, if the pressure difference between the source and receiver tanks exceeds the maximum pump’s discharge head, the tank-to-tank transfer fails to operate. This could require venting to the atmosphere before transfer starts.
Allows for faster transfer of LNG. BOG is transferred to the source tank for use/management upstream.
Applicability
Image source: Sharafian (2019)
Market penetration
Common
Applicable in all types of transfer.
VRL is not needed if receiving vessel has a BOG management system onboard and if the vessel can cope with vapor pressure created by BOG.
Emission sources and emission reduction
Venting of over-pressure in the receiving tank: 90%+ of this emission source
Liquefaction LNG export terminal Transport LNG import
terminal Regasification Small scale
https://www.nebimak.com/vapor-recovery.htmlLNG bunkering possibilities: https://www.onthemosway.eu/wp-content/uploads/2015/07/LNG-as-fuel.compressed.pdf
Costs
Modest – depends on configuration, length of hose, new or retrofit.

LNG best practice 29
Table 8 - Truck cryogenic pump and PBU
LNG refueling of heavy-duty vehicles
LNG filling stations for vehicles are generally small, standalone facilities for servicing heavy-duty vehicles such as trucks. There are over 2500 LNG filling stations in China55, 350 in Europe56, and 115 filling stations in the United States, places where LNG is increasingly becoming a fuel alternative for heavy-duty road transport. Some facilities deliver only LNG to vehicles, while others can deliver both LNG and compressed natural gas (CNG). Of the 115 LNG stations currently in operation in the United States, 47 LNG stations can provide both LNG and CNG for vehicles.57
Filling stations are most commonly filled with LNG transferred from tanker trucks. The LNG is stored in well-insulated tanks and transferred to fuel tanks in vehicles through dedicated receptacles.
The pressure of a vehicle’s onboard storage tank must be low before filling. If the tank pressure has sufficient margin below the maximum allowed pressure, and the filling station has sufficient discharge pressure at the pump, filling of cold LNG will condense the boil-off gas and reduce the pressure in the tank. However, if the vehicle tank pressure is above this threshold, the pressure must be relieved before filling can start.
Venting is one method used to release tank pressure before filling. Researchers58 estimated the amount of methane released to the atmosphere from 10 observed venting episodes at LNG filling stations by drivers. From tank level and pressure data collected for each observation, they calculated that the average
55 https://www.gti.energy/wp-content/uploads/2019/10/22-LNG19-03April2019-Yuan-Yuan-paper.pdf 56 https://www.ngva.eu/stations-map/ 57 Data from https://afdc.energy.gov/, as of December 2020 58 Clark, Nigel et al. Pump-to-Wheels Methane Emissions from the Heavy-Duty Transportation Sector, Environ. Sci. Technol. 2017, 51, 2, 968–976
Costs
Approximately USD 8000 for a cryogenic pump.
Truck cryogenic pump and pressure buildup unit (PBU)
Technology Maturity
Commercial
Benefits
A challenge when transferring LNG is pressure management in both the source tank and the receiving tank. High pressure leads to shorter holding times before boil-off gas pressure must be relieved and perhaps vented. A study by Sharafian et. al (2019) reviewed different types of transfer equipment between tanker trucks and storage tanks. Based on modelling the process, LNG transfer from a tanker truck to a storage tank could cause methane emissions up to 104 g/kg LNG in a worst-case scenario. By modelling and comparing six different transfer solutions, the study concluded that using a cryogenic pump and a controlled pressure buildup unit was the best method to reduce risk of methane venting, both in the source tank and in the receiving tank.
Reduced transfer time.Reduced pressure in both tanks, with benefits for boil-off gas management
Applicability
Image source: cryostar.com
Market penetration
No information.
• Applicable to all cryogenic tanker trucks
Emission sources and emission reduction
Vents- over-pressure in the source tank and the receiving tank
Using PBU/pump combination can reduce methane emissions from 104 g/kgLNG.
Liquefaction LNG export terminal Transport LNG import
terminal Regasification Small scale
Sharafian, A., Blomerus, P., & Merida, W. (2019). Liquefied natural gas tanker truck-to-tank transfer for on-road transportation. Applied Thermal Engineering, 114313. doi:10.1016/j.applthermaleng.2019.114313www.cryostar.com

LNG best practice 30
estimated vent mass was 5.0 kg per event. The average mass of fuel delivered to the vehicle tanks during a fueling event was 118.5 kg. Fuel- specific methane emissions therefore were estimated to be 4.2% for vehicles that were manually vented.
Alternatively, LNG filling stations can be installed with vapor return lines, where boil-off is returned to the filling station, either routed through the fill receptacle or through a separate vapor return line. The boil-off gas is then mixed with that produced by the filling station and managed with the BOG system in place.
The same group of researchers also measured emissions from refueling events of heavy vehicles. The average measured emissions from the fueling nozzle was 10.26 g methane per fueling event (after excluding a fueling event with a minimum of 330 g). Excluding the outlier event, the minimum and maximum measurements from the nozzle were 0.12 g and 59.06 g of methane, respectively.
Table 9 -Vapor return from LNG vehicles to filling station.
Vapor return from LNG vehicles to filling station
Technology Maturity
Commercial
Benefits
Before filling a vehicle with LNG in its fuel tank, the fuel tank pressure must be below a certain threshold.
Pressure can be relieved either by venting to the atmosphere, or by transferring the methane gas back to the filling station before (or during refueling).
Vapor return lines allow boil-off gas in the vehicle’s LNG tank to be transferred to the filling station, where it is managed with the station’s boil-off gas.
• Faster filling times.• Conservation of fuel if
boil-off gas management is in place.
Applicability
Image source: https://www.dvgw.de/
Market penetration
Sharafian (2016) reviewed station designs: 28% allow vapor return while filling, 17% of designs allow vapor return before filling, 55% have no capacity for vapor return.
• LNG filling stations• LNG fueled vehicles
Emission sources and emission reduction
Vents- Boil-off gas from vehicles due to over-pressure.• Up to 4.2% of LNG can be
lost from vehicle venting. The emission reduction depends highly on the vehicle equipment.
Liquefaction LNG export terminal Transport LNG import
terminal Regasification Small scale
Sharafian, A., Blomerus, P., Herrera, O., Merida, W., & Talebian, H. (2016). A review of liquefied natural gas refueling station designs. Renewable and Sustainable Energy Reviews. doi:10.1016/j.rser.2016.11.186.
Costs
Dependent on local configuration, and whether the same hose is used.

LNG best practice 31
1.7 Venting of boil-off gas and pressure management
Even though LNG is stored in well-insulated tanks throughout the value chain, ambient heat will warm it over time and create boil-off gas. Since the gas has up to 600 times the volume of the liquid, it must be either routed out of the tank or contained under pressure. Even in pressurized tanks, however, this boil-off gas eventually must be managed in some way, or the gas must be vented.
Boil-off gas in liquefaction, export and import terminals
Filling a warm cargo tank leads to initial evaporation and generation of boil-of gas. As the storage tank is filled, the generated gas is recovered at the jetty terminal and may in some cases be flared.59
During offloading from an LNG carrier to an import terminal, once LNG starts to flow, it will evaporate to form boil-off gas. This is sent to the import terminal for management, depending on facility infrastructure and BOG management practices.
Capturing BOG from LNG terminal storage tanks and during loading and offloading process. Boil-off gas generated inside LNG storage tanks at the terminals, is generally not vented to the atmosphere, but managed in another manner. Similarly boil-off gas that is formed during loading and offloading LNG carriers can be routed through vapor lines to the import/export facilities. While flaring the boil-off gas is an option, a best practice is to utilize the excess gas as much as possible. This could be done by re-routing vent gas to the nearest power generation facility and can be used to generate electricity through equipment such as gas-driven turbines and engines.60 While utilization of vent gas for powering the facilities may not reduce the combustion emissions from flaring of that same gas directly, it can reduce the need for fuel that would normally be used by power generating equipment and hence reduce overall methane emissions indirectly. Typically BOG compressors can be used to compress the gas and export the gas to use it as fuel, use it as make-up gas for the storage tank61 or convert it to product that can be sold such as CNG. An alternative
59 A well known example is Qatar Gas Jetty Boil-off-gas (JBOG) recover project in Ras Laffan. Before the project, around 100 MMscf per day59 was being flared. Assuming 98 % flare combustion efficiency, 2 % of 100 MMscfd was not combusted, is equivalent to 56640 m3 per day of methane emissions. Around 38 tonnes of methane emissions per day from flaring of JBOG could have been occurring (approximately 14 thousand tonnes of methane emissions from flare stacks).59 60 Methane Guiding Principles. (2019). Reducing Methane Emissions: Best Practice Guide - Equipment Leaks 61 To maintain stable pressure and equilibrium inside the storage tank, a certain amount of BOG must remain in the tank.
Liquefaction
Value chain
Venting of boil-off gas and pressure
management
Export/import terminals LNG carriers Small-scale LNGLoading/offloading
Reliquefaction, energy utilization Best practices Reliquefaction
Reliquefaction, nitrogen chilling,
CNG-filling
Reliquefaction, energy utilization

LNG best practice 32
option is to capture BOG from the tanks and re-liquefy through mini refrigeration system and return it back into the storage tank. Another option could be to use of a mini-LNG facility which offers compression and/or liquefaction of vent gas and routing it back to the main line heading towards the LNG storage facility.62 Similarly, flare gas consisting of mainly methane, can be directed to a natural gas compressor station where it can be converted to compressed natural gas (CNG) and be sold as fuel for trucks, buses and cars.
LNG carriers
LNG carriers are designed to transport LNG at low temperatures and rely primarily on tank insulation to preserve the load in liquid form. However, even with very high levels of insulation, some boil-off is unavoidable. Boil-off gas is generated inside LNG carrier cargo tanks for the following reasons: heat ingress, liquid motion, cooling-down of tanks, loading and unloading, and decrease in cargo tank pressure. Typical boil-off rates in LNG carriers are 0.15%63,64 (but can also be lower) of LNG load per day, but this can vary between the design of the tanks and equipment. For a carrier with 70 000 tons of LNG, this boil-off rate represents 105 tons per day.
This boil-off gas must be managed underway. The main transport routes for LNG (over 10 MT) are between Australia and China, Australia and Japan and, Qatar and South Korea, with typical voyages ranging from a few days up to over a month. Boil-off can be managed in multiple ways: by injecting the gas into the ships engines or generators for consumption as fuel, by reliquefying using on-board liquefaction equipment, or by venting to the atmosphere.
Venting of boil-off gas
If sufficient mitigation measures for boil-off gas are not in place, venting will be necessary to avoid over-pressure in cargo tanks. Where combustion of gas in engines and generators are the main mitigation measure, operations at slow speeds with lower engine loads may be insufficient to manage the boil-off generation, increasing the likelihood of venting.
Onboard boil-off gas management
During LNG transport, the boil-off gas that is generated inside cargo tanks can be managed in a number of ways. The gas can be reliquefied and sent back to LNG cargo tanks using an onboard reliquefaction unit. Since it is an energy intensive process, the ship needs to provide enough power to run the pumps and liquefaction facility. Alternatively, boil-off gas can be directed towards the ship’s engines or generators and used as fuel and the gas can be directed towards onboard power generating equipment.
62 IEA. (2020). Methane Tracker 2020. Retrieved from IEA: https://www.iea.org/reports/methane-tracker-2020 63 https://www.wartsila.com/encyclopedia/term/boil-off-rate. 64 https://safety4sea.com/wilhelmsen-sets-new-standard-for-boil-off-rate/

LNG best practice 33
Table 10 - Vapor recovery units
Vapor Recovery Units (VRU)
Technology Maturity
Commercial
Benefits
Storage tanks’ thermal relief valves, vent valves and drain valves can be connected to route small volumes of gas to a low pressure closed system. Examples of low-pressure systems is a low-pressure gas pipeline, compressor suction or onsite fuel system.A vapor recovery unit attached to storage tanks can be used to compress small volumes of boil-off gas for further use or to redirect it back into the storage tank.
Recovered boil-off gas can be sold as valuable product for facility.VRUs reduce air pollution emissions therefore assisting facilities meet their emission limit.
Applicability
Image source: hy-bon.com
Market penetration
Medium
• Applicable to new facilities and existing facilities.
Emission sources and emission reduction
Vents- venting of BOG from storage tanks to maintain pressure.• Venting can be eliminated
by 95-100 %
Incomplete combustion-Flaring of BOG from storage tanks to maintain pressure.• Flaring can be eliminated
by 95-100 %
Liquefaction LNG export terminal Transport LNG import
terminal Regasification Small scale
Information on VRUs: https://hy-bon.com/blog/faq-about-vapor-recovery-unitsMethane Guiding Principles. (2019). Reducing Methane Emissions: Best Practice Guide- Flaring.
Costs
Typical range 100-700k USD. Depends on variability of gas supply and pressure outlet.

LNG best practice 34
Table 11 - Mini liquefaction unit
Boil-off gas from small-scale LNG operations
Small scale storage tanks are used in filling stations for heavy-duty vehicles, as stand-alone storage facilities for LNG distribution, or as recipient tanks which provide LNG for vaporization and use in an industrial facility or gas distribution network. Pressurized storage tanks store the LNG at pressures higher than atmospheric pressure. Boil-off gas generation is an important consideration in the small-scale value chain. As time passes, ambient heat warms the LNG even in well-insulated tanks, with typical boil-off rates at 0.1-0.5% per day. In addition, boil-off gas is generated every time LNG is transferred. Boil-off gas can be contained in pressurized tanks, but only up to their designed pressure limits, the maximum allowable pressure. Above that level, methane will be released to the atmosphere through pressure release valves.
One research paper65 showed that a 15,000 gal capacity LNG station with a 1,000 gal LNG/day dispensing during a 4-hr window remained under the maximum allowable pressure of 1.3 MPa (175 psig), whereas the same capacity station with a 500 gal LNG/ day dispensing during a 2-hr window reached the maximum allowable pressure within 15 days, thereby requiring venting or other boil-off gas management.
The pressure in an LNG tank steadily rises with boil-off gas, while it drops with each filling of cold LNG. A study66 estimated venting from two operating LNG refueling stations. Based on the pressure measurements on the two stations, over a three-week period, one of the stations had an estimated
65 Powars(2010),citedinSharafian,A.,Blomerus,P.,Herrera,O.,Merida,W.,&Talebian,H.(2016).Areviewofliquefiednaturalgasrefuelingstationdesigns.RenewableandSustainableEnergyReviews.doi:10.1016/j.rser.2016.11.186.66 Hailer, John T., "LNG Station Analysis for the Prediction of Pressure Rise and Vented Emissions" (2015). Graduate Theses, Dissertations, and Problem Reports. 5735
Boil-off gas management through reliquefication
Technology Maturity
Commercial
Benefits
If an LNG storage tank has little throughput, management of boil-off gas will be necessary to avoid venting. Micro-liquefaction units can re-liquefy the boil-off gas and return LNG to the storage tank for usage. These will actively cool the boil-off gases using a compressor, a refrigerant circuit, heat exchangers and electrical power.
• No loss of LNG fuel.
Applicability
Image source: wartsila.com
Market penetration
Sharafian (2016) reviewed LNG filling station designs by analyzing patents. Of the designs, 28% had boil-off gas management through cooling or reliquefaction.
• LNG filling stations• LNG storage tanks
Emission sources and emission reduction
Vents-Venting due to over-pressure • 100 % emission reduction
Liquefaction LNG export terminal Transport LNG import
terminal Regasification Small scale
Sharafian, A., Blomerus, P., Herrera, O., Merida, W., & Talebian, H. (2016). A review of liquefied natural gas refueling station designs. Renewable and Sustainable Energy Reviews. doi:10.1016/j.rser.2016.11.186.www.cryostar.com. https://lngbc.eu/system/files/deliverable_attachments/LNG%20BC%20D3%2010%20-%20Design%20solutions%20to%20minimize%20Boil-off.pdf
Costs
Estimated to 250 000 USD for smallest installations.

LNG best practice 35
methane emissions in an interval of 0.1-1.5% of LNG delivered, while the other had emissions in an interval of 0.9-5.3% of LNG delivered. Halier also found that boil-off gas returned from vehicles through the vapor return lines contributed to sudden pressure rise in the LNG storage tank and to activation of the pressure relief valves. This emphasizes the need for BOG management technologies.
Best practices for small scale LNG
For a small-scale value chain with least possible emissions, LNG should be transported as efficiently as possible and stored in highly insulated tanks (see Table 12). A steady influx of cold LNG contributes to reduced boil-off gas. In addition to providing fuel to the end users, each delivery of LNG contributes to reducing the temperature in the receiving tank. When filling by spraying cold LNG from the top of the tank, vapor condensates and tank pressure is reduced.
A steady delivery of LNG can also contribute to boil-off gas management in another way. By using vapor return lines when transferring LNG (see Table 7, page 28), excess pressure can be transferred from the LNG receiving tank to the source than before or during transfer. This allows boil-off gas to move its way up the value chain again, e.g. from a vehicle to a filling station or from a filling station via tanker truck to a LNG storage facility.
Importantly, to avoid venting of boil-off gas entirely, it is not enough to rely on an efficient value chain. The value chain is dependent on a sufficient number of end users who use LNG, to allow for frequent enough delivery of cold LNG. Other boil-off gas management solutions are therefore necessary. Different technologies exist to manage boil-off gas in small scale LNG:
• Compression of boil-off gas and delivery to natural gas pipelines, end-use customers, CNG vehicles or electricity production (see Error! Reference source not found., Table 13, Table 15).
• Reliquefaction using powered reliquefaction equipment or cooling with liquid nitrogen (Table 14, Error! Reference source not found.).

LNG best practice 36
High insulation solutions
Technology Maturity
Commercial
Benefits
Vacuum filled insulation is the best available technology in order to reduce convective heat transfer between the layers of storage tanks (land-based and shore-based), semi-trailers and cryogenic pipelines. To reduce radiative heat transfer, the annular space between the layers of tanks is typically filled with absorptive material.
One study found up to 9 times longer holding times without venting in storage tanks with proper vacuum insulation, compared to single-walled tanks insulated with polyurethane. The high insulation solutions have low boil-off gas formation rates, and tank/pipeline pressure can more easily be maintained below the pressure level for opening of pressure safety valves.
• Boil-off gas generation rate can be reduced.
• Prevents over-pressure of tanks and pipelines
Applicability
Image source: cryolor.com
Market penetration
High
• Vacuum insulation is preferred for LNG storage tanks below 240 m3.
• Applicable to new built tanks and pipelines.
Emission sources and emission reduction
Vents- Venting of storage tanks or tanker trucks due to overpressure: nearly 100%
Combustion-related- Flaring of boil-off gas from tanks and pipelines to maintain pressure: nearly 100%.
Liquefaction LNG export terminal Transport LNG import
terminal Regasification Small scale
LNG trailer information: www.cryolor.comLNG storage solutions : https://www.wartsila.com/insights/article/creating-optimal-lng-storage-solutionshttps://www.roechling-industrial.com/characteristics/cryogenic-insulation-materialsSharafian et al. (2016) Performance analysis of liquefied natural gas storage tanks in refueling stations, Journal of Natural Gas Science and Engineering
Costs
Dependent on insulation solution and tank size.

LNG best practice 37
Table 12 - High insulation solutions
Table 13 - CNG as boil-off management
CNG fuel as boil-off gas management
Technology Maturity
Commercial
Benefits
LNG filling stations for heavy duty vehicles can be designed to also provide compressed natural gas to light- and medium duty CNG-vehicles. LCNG stations deliver CNG by heating LNG by using a vaporizer and a high-pressure pump to compress the gas, and a storage tank to store CNG for fueling vehicles.
From an emissions perspective, LCNG stations allow for management of boil-off gas generated in the filling station, as well as boil-off gas received from LNG vehicles. Instead of managing over-pressure by venting or alternative methods, the excess boil-off gas is compressed and added to the CNG buffer tank at the station.
Lower capital costs and operational costs compared to a dedicated CNG station.
Applicability
Image source: Sharafian et al., (2016)
Market penetration
Sharafian (2016) reviewed LNG filling station designs. Of the studied designs, 28% could deliver LNG and CNG.
• LNG filling stations
• Requires a sufficient potential customer base of CNG vehicles, in addition to LNG vehicles.
• Requires proximity and access to a natural gas distribution pipeline
Emission sources and emission reduction
Vents- Boil-off gas from filling stations due to over-pressure: • Assuming sufficient
demand for CNG, emissions from over-pressure under normal operations would be eliminated.
Liquefaction LNG export terminal Transport LNG import
terminal Regasification Small scale
Sharafian, A., Blomerus, P., Herrera, O., Merida, W., & Talebian, H. (2016). A review of liquefied natural gas refueling station designs. Renewable and Sustainable Energy Reviews. doi:10.1016/j.rser.2016.11.186.A study of the cost breakdown can be found at: https://lngbc.eu/system/files/deliverable_attachments/LNG_BC_D%203%208%20Cost%20analysis%20of%20LNG%20refuelling%20stations.pdf
Costs
Depends on capacity. Adding CNG to a 60m3 LNG station estimated to 400,000 EUR.

LNG best practice 38
Table 14 - Boil-off gas management through cooling
Boil-off gas management through cooling
Technology Maturity
Commercial
Benefits
If an LNG storage tank has little throughput, management of boil-off gas will be necessary to avoid venting. Liquid nitrogen can be used to manage boil-off gas. Liquid nitrogen has a boiling point of -196°C and can therefore cool the gas phase of LNG with spirals inside the storage tank. The main components are a cryogenic tank for liquid nitrogen, a pump and a heat exchanger. It is important to note that the cost of liquid nitrogen can be non-negligible (up to 1 kg N2 for 1 kg of LNG).
• No loss of LNG fuel..
Applicability
Image source: cryostar.com
Market penetration
Sharafian (2016) reviewed LNG filling station designs by analyzing patents. 28% of designs had boil-off gas management through cooling or reliquefaction.
• LNG filling stations• LNG storage tanks
Emission sources and emission reduction
Vents-Venting due to over-pressure
100 % emission reduction
Liquefaction LNG export terminal Transport LNG import
terminal Regasification Small scale
Sharafian, A., Blomerus, P., Herrera, O., Merida, W., & Talebian, H. (2016). A review of liquefied natural gas refueling station designs. Renewable and Sustainable Energy Reviews. doi:10.1016/j.rser.2016.11.186.www.cryostar.com.
Costs
Boil-off-gas to gas grid
Technology Maturity
Commercial
Benefits
Another way of managing boil-off gas from a storage tank or LNG filling station is to feed it into a natural gas distribution pipeline for usage. This may require heating of the gas to control the temperature, and odorization.
The solution is only applicable if there is a gas grid at proximity which is willing to accept boil-off gas, and public gas grids are less likely to be applicable. Local, private grids may be more willing to accept boil-off gas, but this requires sufficient flow.
Low-cost solution for managing boil-off gas.
Applicability
Image source: Methane Guiding Principles
Market penetration
Used in certain applications
Storage tanks and filling stationsRequires access to natural gas distribution pipeline.Some pressure difference is necessary to have a proper flow. The pressure in the grid should be lower than the set point for BOG-venting to that grid, or else a compressor would be needed.
Emission sources and emission reduction
Vents- Boil-off gas from storage tanks and filling stations: 100% reduction in this source of emissions
Liquefaction LNG export terminal Transport LNG import
terminal Regasification Small scale
Methane Guiding Principles (2020). Transmissions, Storage, LNG Terminals and Distribution.
Costs
Variable, depends on distance and specifications of the grid.

LNG best practice 39
Table 15 - Boil-off gas to gas grid

LNG best practice 40
1.8 Incomplete combustion from energy generation
While methane emissions from energy generation are generally very low, production of LNG is an energy-intensive process. A large share of the emissions from liquefaction are potentially therefore related to energy generation and incomplete combustion. Incomplete combustion from energy generation can also occur in other parts of the value chain, but primarily67 in transport of LNG in carrier ships, where boil-off gas can be routed to the engines or generators as a secondary fuel.
Liquefaction Liquefying methane requires significant amounts of power to drive heat exchangers, compressors and pumps. Typical power usage is the range of 250 – 400 kWh per ton of LNG produced depending on the type of liquefaction technologies used.68. While some facilities may use electricity from the grid to operate facility equipment, large LNG facilities have high power demands and require high security of supply. Since they also have access to significant gas streams, it may be more profitable to build a dedicated power plant, rather than expand the electricity grid capacity. Both combined-cycle power plants as well as combined heat and power plants are used in LNG liquefaction. While CO2 is the primary greenhouse gas in the exhaust stream from these power plants, small amounts of methane are also emitted. In some cases, this may be the largest source of methane from the liquefaction process.69 In cases of low-temperature combustion or periods of incomplete combustion (e.g. start-up and shut-down of process drivers), methane emissions increase in power generating.70 A power plant for liquefaction using gas-driven turbines compresses air resulting in an increase in temperature. Fuel such as natural gas will combust with oxygen in the heated air to generate high-temperature flow which is then used turn the shaft of turbine in order to drive equipment such as compressors.70 The exhaust gas stream of turbines consists of CO2, CH4 and other particulates which escape to the atmosphere.71 While emission factors for gas turbines can vary, an emission factor of 4 g
67 Note that small scale use of LNG, such as fuel in ships and trucks also have methane emissions from incomplete combustion. These emissions are outside the scope of this report. 68 The power consumption of different liquefaction technologies can be found in:
Pospíšil, J., Charvát, P., Arsenyeva, O., Klimeš, L., Špiláček, M., & Klemeš, J. J. (2019). Energy demand of liquefaction and regasification of natural gas and the potential of LNG for operative thermal energy storage. Renewable and Sustainable Energy Reviews, 99, 1–15. doi:10.1016/j.rser.2018.09.027 69 For example, at the Melkøya facility in 2018, 38% of methane emissions came from power production, 31% came from flaring, 18% from leaks and 13% from vents. 70 EPA. (2009). AP 42, Fifth Edition, Volume I Chapter 3: Stationary Internal Combustion Sources. EPA 71 Siemens. (2017). How does a gas power plant work. Retrieved from Zero CO2: http://www.zeroco2.no/capture/sources-of-co2/stationary-point-sources-of-co2#fossil-fuel-power-plants
Liquefaction
Value chain
Incomplete combustion in
energy generation
Export/import terminals LNG carriers Small-scale LNGLoading/offloading
Methane optimized combustion,
catalytic conversion
Best practices
Methane optimized combustion,
catalytic conversion
Best practices
Methane optimized combustion,
catalytic conversion

LNG best practice 41
methane per GJ of fuel72 could result in methane emissions of 12 g per metric ton of LNG liquefied.73 Lower emission factors and higher efficiency would reduce emissions. In comparison, methane emissions in the exhaust stream of gas engines are be vastly higher than in gas turbines, leading to a significant increase in emissions.74 Gas engines emit higher amounts of methane due to incomplete combustion during operation, in addition to excess emissions during starting, stopping and ignition failure. Incomplete combustion of fuel in a lean-burn spark ignited gas engine results in methane emissions of about 350 g of methane per GJ of fuel.72 LNG carriers
One common method of managing boil-off gas is to route it to the ship engines for use as a secondary fuel. However, this contributes to methane emissions through incomplete combustion in ship engines. A commonly used estimate for methane emissions is 87 g per GJ of LNG combusted75, which is equivalent to about 4.8 kg methane per ton of boil-off gas managed this way. With over 100 tons of boil-off per day, the emissions from incomplete combustion can be substantial. In addition, this management method is also dependent on the engine load. Under certain conditions with lower loads, the engines may not be able to combust the full amount of boil-off gas and may require venting. Engine manufacturers have developed and are in the process of developing engines with optimized designs to ensure lower methane emissions. A summary of this mitigation measure can be found in Table 16Error! Reference source not found..
Best practices for incomplete combustion from energy generation
Catalytic conversion of methane from exhaust gas of gas-driven turbines and engines
One way to deal with methane in exhaust gas of power generating equipment is through catalytic oxidation using Palladium-based or Rhodium-based catalysts. Rhodium-based catalyst have experimentally been shown to have promising results compared to Palladium-based catalysts due to high vulnerability to catalyst poisoning of the latter. These catalysts can be inhibited in the presence of H2O (5 – 15 vol%) and SO2 (~1 ppm). A study76 reported that Rhodium-based catalyst offers great potential for high methane conversion at practically achievable conditions and in presence of inhibitors such as H2O and SO2. At 500°
C and presence of 1 ppm SO2 and 5 vol% of H2O, 79% methane conversion is achievable using Rhodium-based catalyst in the exhaust. A summary of this mitigation measure can be seen in Table 17, which is applicable across the whole value chain where gas-driven power generating equipment are present.
72 Marcogaz and GIE. (2019). Potential ways the gas industry can contribute to the reduction of methane emissions. 73 Assuming 400 kWh electricity per ton of liquefied LNG, and a conversion efficiency of 40%. 74 UNECE. (2019). Best Practice Guidance for Effective Methane Management in the Oil and Gas Sector: Monitoring, Reporting and Verification (MRV) and Mitigation. Geneva: United Nations. 75 https://www.api.org/~/media/files/ehs/climate-change/api-lng-ghg-emissions-guidelines-05-2015.pdf?la=en 76 Christensen, J. M., Zhang, Y., Glarborg, P., Johansen, K., Andersson, M. P., Torp, T. K., & Jensen, A. D. (2020). A Rhodium-Based Methane Oxidation Catalyst with High Tolerance to H2O and SO2. Americal Chemical Society: Catalysis, 1821-1827

LNG best practice 42
Table 16 - Methane optimizing engines
Optimizing combustion in engines
Technology Maturity
Commercial
Benefits
Methane emissions from incomplete combustion in engines and gas turbines is a known issue which is prevalent amongst engines/turbines that have low fuel-air ratio (low engine loads) and are usually operating according to Otto combustion process. Several technology providers are continuously optimizing the engine design to reduce this source of emissions. Options to reduce this emission source includes: • Engine exhaust recycling structure placed close to the engine for the purpose of increasing
engine combustion efficiency. • Optimized engine design to reduce crevice spaces and cool areas where unburnt methane
can escape from combustion.
Operating costs can be lowered by reducing fuel loss.
Applicability
Market penetration
No information
•Equipment for engines to reduce methane emissionsare being designed to be retrofittable to existing engines.
Emission sources and emission reduction
Incomplete combustion from LNG carrier engines and power generating equipment –• Emission reduction is
variable - 50% reduction in methane emissionsaccording to one source.
Liquefaction LNG export terminal Transport LNG import
terminal Regasification Small scale
Image source: www.Wingd.com
S.Ushakov, D.Stenersen & P.M.Einang, (2019), Methane slip from gas fuelled ships: a comprehensive summary based on measurement data, Journal of Marine Science and Technology, 1308-1325https://www.wingd.com/en/technology-innovation/engine-technology/x-df-dual-fuel-design/x-df2-0-technology/More on low methane slip engine and retrofitting: technical-paper.pdf (man-es.com)https://www.wartsila.com/media/news/06-04-2020-cutting-greenhouse-gas-emissions-from-lng-engines
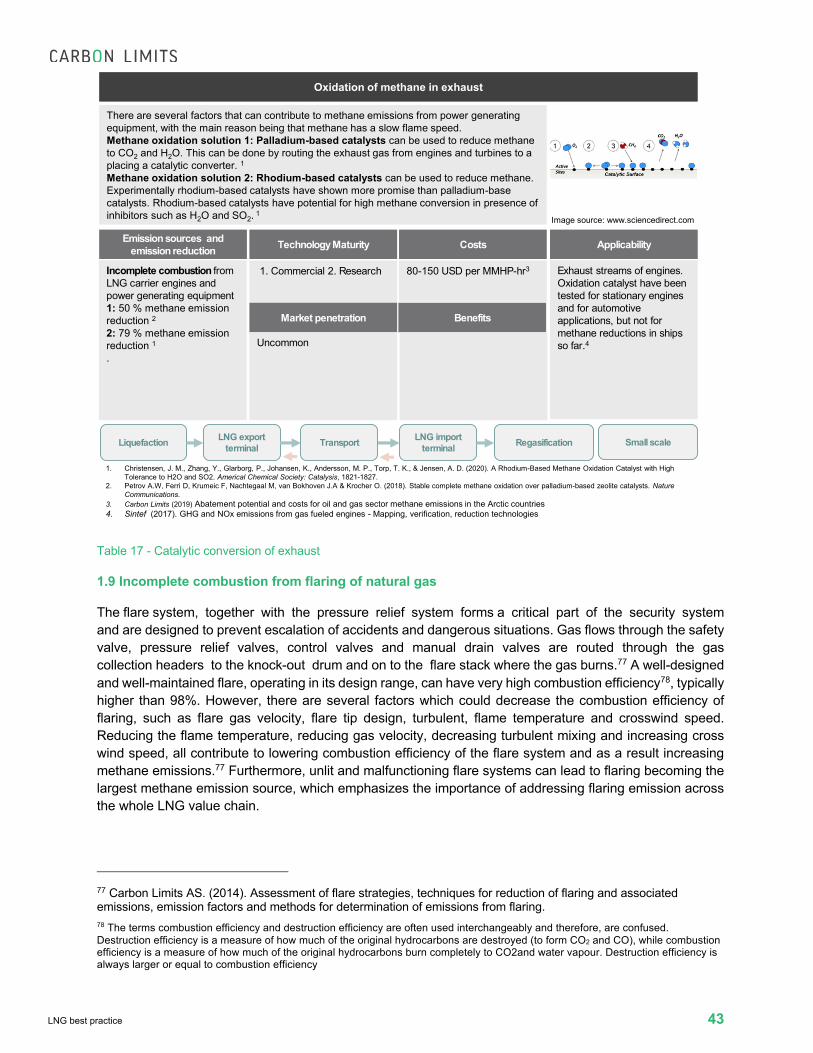
LNG best practice 43
Table 17 - Catalytic conversion of exhaust
1.9 Incomplete combustion from flaring of natural gas
The flare system, together with the pressure relief system forms a critical part of the security system and are designed to prevent escalation of accidents and dangerous situations. Gas flows through the safety valve, pressure relief valves, control valves and manual drain valves are routed through the gas collection headers to the knock-out drum and on to the flare stack where the gas burns.77 A well-designed and well-maintained flare, operating in its design range, can have very high combustion efficiency78, typically higher than 98%. However, there are several factors which could decrease the combustion efficiency of flaring, such as flare gas velocity, flare tip design, turbulent, flame temperature and crosswind speed. Reducing the flame temperature, reducing gas velocity, decreasing turbulent mixing and increasing cross wind speed, all contribute to lowering combustion efficiency of the flare system and as a result increasing methane emissions.77 Furthermore, unlit and malfunctioning flare systems can lead to flaring becoming the largest methane emission source, which emphasizes the importance of addressing flaring emission across the whole LNG value chain.
77 Carbon Limits AS. (2014). Assessment of flare strategies, techniques for reduction of flaring and associated emissions, emission factors and methods for determination of emissions from flaring. 78 The terms combustion efficiency and destruction efficiency are often used interchangeably and therefore, are confused. Destruction efficiency is a measure of how much of the original hydrocarbons are destroyed (to form CO2 and CO), while combustion efficiency is a measure of how much of the original hydrocarbons burn completely to CO2and water vapour. Destruction efficiency is always larger or equal to combustion efficiency
Oxidation of methane in exhaust
Technology Maturity
1. Commercial 2. Research
Benefits
There are several factors that can contribute to methane emissions from power generating equipment, with the main reason being that methane has a slow flame speed. Methane oxidation solution 1: Palladium-based catalysts can be used to reduce methane to CO2 and H2O. This can be done by routing the exhaust gas from engines and turbines to a placing a catalytic converter. 1Methane oxidation solution 2: Rhodium-based catalysts can be used to reduce methane. Experimentally rhodium-based catalysts have shown more promise than palladium-base catalysts. Rhodium-based catalysts have potential for high methane conversion in presence of inhibitors such as H2O and SO2. 1
Applicability
Market penetration
Uncommon
Exhaust streams of engines. Oxidation catalyst have been tested for stationary engines and for automotive applications, but not for methane reductions in ships so far.4
Emission sources and emission reduction
Incomplete combustion from LNG carrier engines and power generating equipment 1: 50 % methane emission reduction 22: 79 % methane emission reduction 1.
Liquefaction LNG export terminal Transport LNG import
terminal Regasification Small scale
Image source: www.sciencedirect.com
1. Christensen, J. M., Zhang, Y., Glarborg, P., Johansen, K., Andersson, M. P., Torp, T. K., & Jensen, A. D. (2020). A Rhodium-Based Methane Oxidation Catalyst with High Tolerance to H2O and SO2. Americal Chemical Society: Catalysis, 1821-1827.
2. Petrov A.W, Ferri D, Krumeic F, Nachtegaal M, van Bokhoven J.A & Krocher O. (2018). Stable complete methane oxidation over palladium-based zeolite catalysts. Nature Communications.
3. Carbon Limits (2019) Abatement potential and costs for oil and gas sector methane emissions in the Arctic countries4. Sintef (2017). GHG and NOx emissions from gas fueled engines - Mapping, verification, reduction technologies
Costs
80-150 USD per MMHP-hr3

LNG best practice 44
There may be several reasons for flaring during liquefaction facility operations. Primarily, flaring occurs to manage the pressure in equipment and tanks in the facility in cases of emergency shutdown or scheduled maintenance. From a brief analysis of 89 air emissions reports from 4 LNG processing facilities in the US, 38%79 of the reports documented that the main reason for flaring was excess natural gas reaching the facility, more than the facility capacity. Another common reason was sudden equipment failure such as compressors or valves, where the gas stream is routed to the flare system in order to prevent pressure build-up in the pipelines.
Flare gas mitigation and flare gas recovery
The strategies to manage and minimize the volume of flared gas in LNG facilities depends heavily on the root causes of the gas being flared, with most of the flaring being typically intermittent. A detailed analysis of the different gas flows (cause, frequency, volume, composition, pressure) to the flare provides as solid foundation to identify mitigation options. Flare Gas Recovery (FGR)80 is the process of recovering the waste gases that would normally be flared, so they can be used either as fuel gas (for heat or electricity production) or as a feedstock.
Improving flare combustion efficiency In cases where flare gas cannot be recovered and utilized, then the best practice is to improve the combustion efficiency of flaring. This is done by optimizing the design of the flare system.81 Due to irregularities in operations and the need for pressure release, flares typically operate over a wide range of operating conditions; from maximal flare rates to very low gas volumes consisting of only purge gas. Flare technology vendors have developed new technologies (including closed flares, staged flares etc..) to flare gas in a safe manner, and do so as environmentally friendly as possible. The design of the flare needs to be site specific and depends on the gas composition and the range of volume and pressure of the gas flow.77
79 Independent analysis of four Texas-based gas processing facilities air emissions report from Texas Commission on Environmental Quality database: Reports of Air Emission Events - Texas Commission on Environmental Quality - www.tceq.texas.gov 80 https://www.zeeco.com/vapor/vapor-flare-gas-recovery 81 Methane Guiding Principles. (2019). Reducing Methane Emissions: Best Practice Guide - Flaring
Liquefaction
Value chain
Incomplete combustion from
flaring
Export/import terminals LNG carriers Small-scale LNGLoading/offloading
Improve flaring efficiency, flare gas recovery, reduce boil-off to flare
Best practicesImprove flaring
efficiency, flare gas recovery

LNG best practice 45
Table 18 - Flare gas recovery
Table 19 - Improve flare gas efficiency
Flare gas recovery systems (FGRS)
Technology Maturity
Commercial
Benefits
Flare Gas Recovery Systems (FGRS) aim at recovering normally flared gases and deliver them back into the facility so they can be processed or re-used as fuel gas. FGRS includes the following processes: Isolating the flare header, Removing liquids, Compressing gases up to a defined pressure level, Cooling recovered gases (if required)
The recovered gas can be used as a fuel for (i) electricity production, (ii) heat production (thermal oxidizer with heat recovery),or can be captured and compressed to (iii) form CNG or (iv) reliquefied to LNG using an onshore mini-LNG facility and put back into the system.
Fuel saving or Additional revenue from the additional gas stream
Applicability
Market penetration
No information
The applicability depends on (i) the existence of an outlet for the recovered gas and (ii) the facility layout.
Emission sources and emission reduction
Up to 100 % reduction of flare gas and vent gas
Liquefaction LNG export terminal Transport LNG import
terminal Regasification Small scale
Image source: Zeeco
Costs
Variable, with common range USD 250k-7 M. Varies with pressure, volume, and site.
Improve gas flare efficiency
Technology Maturity
Commercial
Benefits
Each flare system is selected and designed for a particular application based on a set of criteria including technical criteria, safety criteria, (local) environmental criteria, and costs criteria. Flaresdesign can be categorized in four broad groups: non-assisted raised LP flares, Non assisted raised HP flares, assisted raised flares, and flares at ground level. More information: https://www.carbonlimits.no/wp-content/uploads/2015/06/Assessment-of-flare-strategies-techniques-for-reduction-of-flaring-and-associated-emissions-emission.pdfFigure 8 provides a simplified decision tree for flare selection Table 11 provides a simplified overview of the different flare designs
Reduces emissions of other pollutants (NOx, particulates and BC). Noise, appearance are also affected.
Applicability
Market penetration
Common
Variable
Emission sources and emission reduction
Variable. There is however limited quantitative documentation on the efficiency improvement of different flare designs
Liquefaction LNG export terminal Transport LNG import
terminal Regasification Small scale
Image source: Zeeco
Costs
Cost increase of 20-200% compared to pipe flares. Dependent on volume, pressure and variability of gas volume.

LNG best practice 46
1.10 Maintenance and irregular emission sources
In addition to methane emissions from normal operations, there are several situations where emissions can increase. Often, this is due to excess gas volumes which must be managed during start up, emergency shut-downs, routine- and non-routine maintenance of the facilities. Flaring of gases is common, mainly for safety reasons to ensure natural gas (mainly methane) is not vented directly to the atmosphere and to ensure the safety of individuals carrying out maintenance inspection of the facilities. Also, for certain types of maintenance, the equipment must be freed of gas entirely, which often involves venting to the atmosphere.
Excess gas from start-up of liquefaction facilities
When a liquefaction facility starts production after construction or maintenance, it requires cooling down of equipment to liquefaction temperatures. This cooling down process is associated with generation of significant amounts of boil-off gas, which is commonly flared.
The cold box, where the natural gas is liquefied, is the heart of the liquefaction process. During precooling of liquefaction equipment, including the cold box, clean, dry feed gas (methane) is cooled in propane chillers up to -30 °C.82 Followed by mixture of cold feed gas with warmer feed gas, the mixture enters the cold box from the bottom and flows to the top (shell side of the cold box). The feed gas exits through the shell side vent valve to flare. The final cooldown step initially involves flow of mixed refrigerant (MR) mainly consisting of methane. The mixed refrigerant composition is adjusted by adding ethane and propane gas flow to increase refrigeration of the process.
82 Sabram, T. M., Chen, D., & Dunn, J. P. (2019). Less in more: Flare minimization during cooldown. Shanghai: Air Products and Chemicals, Inc
Liquefaction
Value chain
Maintenance and irregular emissions
Export/import terminals LNG carriers Small-scale LNGLoading/offloading
Gas recovery solutions Best practices Gas freeing
services, flaringGas freeing
services, flaring
Optimized precooling, gas
recovery solutions

LNG best practice 47
Figure 12 - Precooling process of a cold box for AP-C3MR Liquefaction technology (Sabram, Chen, & Dunn, 2019)
The possible emission sources during start-up is the flaring of feed gas (primarily methane) from cold box vent lines. This would be the same case for liquefaction plant commissioning after maintenance shutdown. However, during the operational phase of liquefaction facilities, components such as water or CO2 can freeze across control valves or in the cold box, resulting in the need for defrosting the equipment during maintenance. Feed gas (primary consisting of methane) is passed through the exchanger and other liquefaction equipment to defrost the equipment and it is routed towards the flare.
Gas blowdown from pipelines, equipment and processing facilities Gas blowdown is a process of depressurizing gas that has accumulated in facility equipment, and the gas is usually routed to the flare. It is generally carried in order to carry out maintenance, testing or other activities. Moreover, in emergency situations such as a fire incident or equipment failure, blowdown of the facility is necessary to avoid escalation of danger. Blowdown is carried out by isolating the section of equipment or pipeline which needs to be blown down using isolation valves, followed by opening of blowdown valve to release natural gas for depressurization.83 The amount of methane released by blowdown of pipeline depends on the diameter of the pipe, the pressure of natural gas in the pipe and the length of the pipeline which needs to be blown down. More methane would be released in a blowdown process if the diameter of pipeline is large and/or the pipeline section that needs to be blown down is long (resulting in high pressure which needs to be reduced).84 The amount of methane released from other equipment such as compressors will vary.85
83 Sutton, I. (2015). Chapter 3- Energy control procedures. In Plant Design and Operations (pp. 46-90) 84 M.J Bradley & Associates LLC. (2016). Pipeline Blowdown Emissions and Mitigation Options. 85 UNECE. (2019). Best Practice Guidance for Effective Methane Management in the Oil and Gas Sector: Monitoring, Reporting and Verification (MRV) and Mitigation. Geneva: United Nations.

LNG best practice 48
During emergency shutdowns caused by terminal power trip or equipment failure or scheduled maintenance, terminal facilities can be partially or fully blown down for safety reasons. Instead of venting, it is a better practice to use flares and incinerators to combust methane. However, flaring combustion efficiency varies with environmental conditions and methane slip from flare stacks can become significant in cases where flare system malfunctions.
LNG storage tank blowdown for maintenance inspection at LNG import and export terminals
Methane emissions from LNG storage tanks are usually very low due to piping connections being welded rather than flanged and LNG being stored at near atmospheric pressure reducing the drive for leaks to occur. In extreme upset conditions, LNG storage tanks may be vented. In addition to that, storage tanks can be emptied for inspection. By removing residing liquid inside the tank, the tank is purged with nitrogen to remove any leftover vapors. The mixture of inert gas and natural gas can be vented.
Maintenance on LNG carriers
Although dry-dock maintenance is performed infrequently, typically once every four to five years, the vented methane emissions from dry-dock procedure can be significant. Potentially, the entire remaining volume of the tanks can be emitted.
During dry-dock maintenance, equipment can be blown down resulting in vented emissions from compressors, pumps, storage tanks and pipes. Before dry-docking, all cargo liquids are removed from the tanks. The tanks are then warmed up by circulation of heated LNG vapor which is introduced through filling lines from the bottom of the cargo tank and from the top of the tank through vapor line. Residual LNG inside tanks and equipment are gasified. The generated vapor is then vented to the atmosphere until the tanks and equipment meet dockyard requirements. LNG vapor is displaced and vented using inert gas in a process of gas freeing the cargo tanks to reduce methane content to less than 1.5 %86.
Maintenance of tanker trucks and storage tanks
Tanker truck maintenance and inspection can generally be performed without need for gas-freeing, since inspection of the tanks can be performed externally. However, there may be instances where the tanks must be free of hydrocarbons, requiring inerting and purging of methane. Potentially, this could involve venting of the entire volume of the tank, at a given pressure, to the atmosphere.
As in other tank types, LNG tanker trucks must be cooled down before they can be filled with methane. This cooldown process is typically done by filling the tank carefully, cooling by boiling off the LNG, creating significant amounts of boil-off gas which must be managed or vented.
Maintenance and irregular – best available technology/practices
Optimization of liquefaction facility start-up
Automation of cooldown processes of the main cryogenic heat exchanger (cold box) with minimum human intervention can result in consistency in operation to approach an optimum cooldown rate while keeping within the operational guidelines. This program eliminates the need for the operator to determine and control the flow rates of refrigerants and refrigerant component addition, feed gas flow rate required and refrigerant compressor operating points. Thus, reducing the volume of LNG used to cool the MCHE to the right
86 http://www.liquefiedgascarrier.com/drydocking.html

LNG best practice 49
temperature. Automating cooldown processes of the facility equipment can result in a large reduction in time to cooldown the cold box which in turn results in reduction in flaring volume (Sabram, Chen, & Dunn, 2019). Technology providers such as Air Products have automatic cooldown program available for optimizing cooling process of MCHE. See Table 20 for more information on optimization of start-up of liquefaction facilities.
Table 20 - Optimization of liquefaction start-up
Routing excess gas to flaring alternatives
Although it is much better to flare gas than to directly vent to the atmosphere, the combustion efficiency of flare stacks can vary due to external factors mentioned previously in this document. Depending on how frequently the routine maintenance of a facility is scheduled or how often the plant undergoes emergency shutdown due to equipment failure, based on previous plant emissions data, facilities can invest in alternatives which reduce the need for flaring.
To avoid flaring as much as possible, excess gas can be re-routed to the nearest power generation facility and can be used to generate electricity through equipment such as gas-driven turbines and engines (Methane Guiding Principles, 2019). Depending on the frequency of start-up of the facility and the volumes of LNG used to cool down the facility, it could be reasonable to invest in small infrastructure containing storage tanks for fuel to be used by power generating equipment as back-up. This measure is also only applicable for facilities that have power generating equipment nearby which are driven by fuel instead of electricity grid.
Another best practice can be to use a mini-compressor facility nearby which offers compression of captured warm LNG and route it back to the main line heading towards an LNG storage facility.87 This is applicable
87 IEA. (2020). Methane Tracker 2020. Retrieved from IEA: https://www.iea.org/reports/methane-tracker-2020
Optimization of the Liquefaction Main Cryogenic Heat Exchanger (MCHE)
Technology Maturity
Commercial
Benefits
During the commissioning/start up, the pre-cooling of liquefaction facility equipment is performed using cool LNG. The LNG thus used is warmed up and vaporized LNG is commonly flared.
A program (for example Air Products (AP) Auto-cool program) can be implemented to automatically cool down the main cryogenic heat exchanger (MCHE) or also known as cold box, without the need of manually adjusting several process variables. The program finds an optimum levels of process variables to reduce the use refrigerant to cool the MCHE and therefore reduce flaring.
• Quicker cooldown for start-up.
Applicability
Image source: Air Products UK
Market penetration
Uncommon
• Can be customized for new or existing liquefaction plants.
Emission sources and emission reduction
Incomplete combustion related- flaring of warm LNG during cooling process when starting-up liquefaction plant.• 50 % reduction in flare
gas volume.
Liquefaction LNG export terminal Transport LNG import
terminal Regasification Small scale
https://www.airproducts.co.uk/services/automated-mche-cooldown-ap-autocool.
Costs
Design of the facility, new or retrofit.
LNG best practice 50
for small to medium volumes of gas. Since the flaring of warm LNG due to cooling of liquefaction facilities will occur infrequently, investing in mini-liquefaction or vapor recovery unit might not be needed. See Table 18, page 45, to read a summary on possible gas recovery solutions for various volumes and frequency of flare gas at a facility.
Gas blowdown capture and utilization
Instead of venting or flaring methane that needs to be blown down from equipment and structures at a liquefaction facility, the best practice is to capture the gas needs to be vented to the atmosphere and route it to an onsite compression unit. The gas can be compressed to become CNG which can be utilized on site by transport vehicles, or the gas can be compressed and liquefied via a mini-LNG facility on site and stored in the LNG storage tanks.87 If natural gas which needs to be blown down cannot be recovered for onsite utilization or for conversion to CNG or LNG, then it is recommended to install portable or permanent flares depending on the volume of natural gas needed to be vented before maintenance, or the type of equipment that is needed to be blown down. 87,88
Blowdown gas recovery solutions
To avoid venting significant amounts of natural gas from pipeline at LNG terminals before maintenance work is performed, a compressor can be connected to the pipeline, which can be used to lower the pressure. By isolating sections of natural gas/LNG pipeline, methane emissions from blowdown can be reduced by 50 %. 89
Instead of venting or flaring methane that needs to be blown down from equipment and structures at a terminals, the best practice is to capture the gas needs to be vented to the atmosphere and route it to an onsite compression unit. The gas can be compressed to become CNG which can be utilized on site by transport vehicles, or the gas can be compressed and liquefied through refrigeration process on site and stored in the LNG storage tanks.87
Reduce the need for pipeline blowdown before maintenance
To avoid venting significant amounts of natural gas from pipeline before maintenance work is performed at the facility, a compressor can be connected to the pipeline, which can be used to lower the pressure in the pipeline. Downstream compressors can continue to operate after the upstream valves are closed, isolating sections of natural gas/LNG pipeline, leading to the possibility of reducing methane emissions from blowdown by 50 % and possibly even higher.89
Operations – best available technology and practices
Handling emissions from dry-dock maintenance
Vaporized LNG can be captured from cargo tanks and equipment before dry-docking and during the dry-docking procedure, instead of venting to the atmosphere. LNG vapors from warming up cargo tanks can then be routed to shore to a mobile vapor recovery unit. Recovered natural gas can be used as fuel for nearby power generating equipment or reliquefied to form LNG and stored in a small storage tank. A
88 Climate and Clean Air Coalition . (2017). CCAC O&G Methane Partnership- Technical Guidance Document Number 2: Fugitive component and equipment leaks. CCAC. 89 M.J Bradley & Associates LLC. (2016). Pipeline Blowdown Emissions and Mitigation Options

LNG best practice 51
summary of these possible mitigation measures for handling dry-dock methane emissions can be found in Table 21.
Rerouting emissions from dry-dock maintenance
Technology Maturity
Commercial
Benefits
For maintenance at an LNG terminal or service yard: It is important to capture vaporized LNG from equipment (from LNG tanker) by rerouting the gas from vent lines to shore where it passes through a vapor recovery unit (consisting of a scrubber and compressor). Recovered gas can be flared on land or sold as valuable product.
Recovered valuable product can be put back into the system or be used for different purpose such as fuel for power generating equipment or sold to third parties.
Applicability
Market penetration
No information
• This solution is applicable only during ship maintenance which is usually occurring once in a period of 5 years.
Emission sources and emission reduction
Vents- venting of LNG vapors during gas-freeing of equipment as part of maintenance. • Emission reduction can be
up to 100%Incomplete combustion-flaring BOG which forms in tanker storage tank during loading and transport • Emissions reduction can
be up to 100%
Liquefaction LNG export terminal Transport LNG import
terminal Regasification Small scale
Image source: www.edgelng.com
https://www.wartsila.com/marine/build/gas-solutions/liquefaction-bog-reliquefaction/wartsila-bog-reliquefactionhttps://edgelng.com/our-process/
Costs
Dependent on location and availability of infrastructure.

LNG best practice 52
Table 21 - Rerouting emissions from dry-dock maintenance
Table 22 - Gas freeing and cooldown services
Gas freeing and cooldown services
Technology Maturity
Commercial
Benefits
Periodically, LNG tanks of trucks may be required to be freed of all hydrocarbons, and inertedwith nitrogen. This could be related to maintenance, transport or extended periods without operations. A challenge arises when the nitrogen content of the storage tank increases, while there is still a mix of methane. Some facilities, such as import terminals, can provide inerting services and handle the methane vapor without emissions to atmosphere.
When entering into service and starting filling, cooldown is required. This can lead to excessive boil-off gas generation. Some facilities offer cooldown services for LNG tanker trucks.
Applicability
Image source: enventcorporation.com
Market penetration
No information available
• Applicable to all tanker trucks.
• Requires a terminal with equipment to manage methane and nitrogen mix.
Emission sources and emission reduction
Vents- Venting of tanker trucks when gas-freeing: nearly 100%
Excess boil-off gas generation during cooldown : nearly 100%
Liquefaction LNG export terminal Transport LNG import
terminal Regasification Small scale
Costs
Not available
Portable flaring unit
Technology Maturity
Commercial
Benefits
In certain cases, such as before maintenance of storage tanks or vehicles, it may not be possible to deliver vapor to a facility for management. Portable flaring units may be used as an alternative to venting. The mobile flare must be placed safely, can typically be deployed for small volumes of gas over a short period of time, usually less than two hours.
Mobile flare units are available in various sizes and capacities.
• Safe handling of the vent emissions.
Applicability
Image source: Methane Guiding Principles
Market penetration
Uncommon
• Maintenance of tanker trucks
• Maintenance of storage tanks (onshore and marine based)
• Maintenance of filling stations
Emission sources and emission reduction
Vents- Venting emissions from maintenance.• Emission reduction is
typically 95%+ assuming a high combustion efficiency of the gas flare
Liquefaction LNG export terminal Transport LNG import
terminal Regasification Small scale
Methane Guiding Principles. (2019). Reducing Methane Emissions: Best Practice Guide- Flaring.
Costs
Variable, dependent on size and type. Very modest for the smallest.

LNG best practice 53
Table 23 - Portable flaring unit
2. Discussion
As discussed in section 2, methane emissions are caused by a multitude of conditions. The majority of these causes can be managed. Through application of best practices, it is possible to achieve an LNG value chain with relatively small methane emissions. With little available research on methane emissions from, and the extent of best practices in, the LNG value chain, it is difficult to estimate the effect of implementing best practices throughout the value chain. The available data, however, points to the likely large sources of emissions in each stage.
In the large-scale LNG value chain (defined here as the value chain from liquefaction to regasification), the stages with highest methane emissions are likely to be the liquefaction and LNG carrier transport. In the liquefaction stage, a major source of methane emissions are incomplete combustion from energy generation and from flaring. Emissions from LNG carriers can come from incomplete combustion and venting of boil-off gas. Furthermore, a substantial contribution can come from leaks, throughout the value chain.
When considering the value chain for small scale LNG (defined as below 10,000 m3), it becomes apparent that emissions from small scale usage can be significantly higher in terms of share of throughput. Mostly, this is due to venting of over pressure, which can be largely avoided using best practices of operations and equipment.

LNG best practice 54
When examining the emission sources, leaks can contribute to a large share of methane emissions from the small-scale LNG value chain. At the same time, the diffuse nature of leaks makes them difficult to quantify without close inspection of each facility. Leak detection and repair is the principal method of addressing these leaks, and should be practiced throughout the LNG value chain.
Emissions related to the LNG transfer process originate primarily from gas freeing of transfer equipment after usage, and leakage from connectors. In large-scale LNG operations, large volumes of LNG are transferred during each operation, and the relative potential for emissions from the transfer process are smaller than in the small-scale LNG value chain. Small scale LNG transfers involve much lower volumes and a higher number of transfers. Since operating procedures are likely more stringent in large facilities, and these also have boil-off gas management solutions, it is likely that the LNG transfer process results in less emissions in large-scale facilities than in small scale.
Venting of boil-off gas during normal operations can be significant in the transport of LNG using carriers and in the small-scale LNG value chain when not managed properly. Managing these emissions requires investment in equipment. In the small-scale LNG value chain, this requires nitrogen chilling or reliquefaction of storage tanks, or some type of utilization of the boil-off gas (either through CNG filling stations, delivery to a gas grid or combustion for energy production).
Incomplete combustion of methane can also represent a large source of emissions. From a methane emissions perspective, gas turbines have significantly lower methane emissions than engines. While engine manufacturers are working towards optimizing engines to allow for higher destruction of methane, this would require engine replacements or retrofitting, with significant investment costs.
While flaring is a much preferred option to venting methane, a small share of the gas is not combusted. Flares can represent a significant emission source in import and export facilities. Flaring is an undesirable activity both from a commercial and an environmental point of view.
Irregular events may represent a non negligeable cause of methane emissions. While there are some best practices which can reduce irregular emissions, it is not apparent that there is a dominant procedure or technology which can reduce the causes of these emissions substantially. A high industrial emphasis on investigating and reporting these events, and sharing knowledge on prevention, is perhaps the best practice to avoid these large emissions as much as possible.
The review performed has however demonstrated that existing and mature technologies and practices have been deployed for all the steps of the LNG value chains and that all the potential sources of emissions identified can technically be addressed, with potentially very low emission across the value chain. Given the distinct nature of the LNG processes, mitigation should focus both on the variable and intermittent emission sources. Transparent and robust monitoring and reporting of the emissions are an essential element in ensuring the credibility of LNG as a transitional fuel.