LNG Floating Regasification Unit (FRU) Side-by-Side Mooring ...
10
1 Copyright © 2005 by ASME LNG FLOATING REGASIFICATION UNIT (FRU) SIDE-BY-SIDE MOORING ANALYSIS Wei Ye, Yong Luo, Jack Pollack SBM-IMODCO, 1255 Enclave Parkway, Houston, Texas 77077, USA Phone: 281-8486000, Fax: 281-8486100, Email: [email protected] ABSTRACT This paper presents a newly developed Floating Regasification Unit (FRU) concept for LNG import in the US Golf of Mexico (GOM) region. The FRU can be converted from a Suezmax tanker and has a turret mooring system. One of the key technologies of the FRU concept is the Side-By-Side (SBS) mooring between the FRU and the LNG Carrier (LNGC) for offloading. The mooring lines and pneumatic fenders between the two vessels should be able to restrain the relative motions to ensure the safe transfer of LNG. Advanced hydrodynamics modeling techniques have been applied, which include full hydrodynamic interactions between the FRU and the LNGC with full QTFs considering the shallow water effect. The anchor legs are modeled as dynamically, fully coupled to the turret and the FRU. The feasibility of the FRU concept is established for LNG import in the GOM, with a variety of workable water depths ranging from 40 meters to more than 100 meters with an up- time exceeding 98%. Analysis results demonstrate the significance of hydrodynamic interactions between the two vessels in close proximity arrangement. INTRODUCTION The rapidly increasing US demands for natural gas and dwindling domestic supplies call for the import of liquefied natural gas (LNG). Numerous LNG import projects in North America are underway, and more are being planned. In general, there are two types of LNG terminals: onshore and offshore. As of today, all LNG terminals have been built onshore. Recently, however, there is more and more public opposition to this type of LNG terminals due to security concerns and pollution, and industry has turned the attention to the development of offshore LNG terminals. So far, two types of offshore LNG terminals have been proposed: Gravity Base Structure (GBS) and Floating (Storage) Regasification Unit (F(S)RU). Depending on project-specific conditions, overall the F(S)RU has been shown to have economical advantages over the GBS (Ref. 1). Energy Bridge, The first floating LNG terminal, will be fully operable in 2005. Figure 1. Artistic Rendering of FRU and LNG Carrier Lately, SBM-IMODCO (SBMI) developed a Floating Regasification Unit (FRU) as an LNG import terminal (Figure 1). The FRU can be converted from a Suezmax tanker and has a turret anchoring system. This concept provides the most cost effective solution to the offshore LNG import. Reference 2 proposes to utilize the salt cavern formations as the storage facility, receiving and depositing natural gas from FRU, and providing a logistical link between the natural gas, petrochemical and refining industries. Salt Cavern storage is much more secure than surface storage tanks and the operations occur largely unseen and unnoticed by the public because of their underground nature. The FRU is quite promising for Salt Cavern storage as it uses technology proven with Floating Production Storage and Offload (FPSO) systems that have been Proceedings of OMAE2005 24th International Conference on Offshore Mechanics and Arctic Engineering (OMAE 2005) June 12-17, 2005, Halkidiki, Greece OMAE2005-67117 Downloaded From: https://proceedings.asmedigitalcollection.asme.org on 07/01/2019 Terms of Use: http://www.asme.org/about-asme/terms-of-use
-
Upload
khangminh22 -
Category
Documents
-
view
2 -
download
0
Transcript of LNG Floating Regasification Unit (FRU) Side-by-Side Mooring ...

Downloaded From: https://proce
LNG FLOATING REGASIFICATION UNIT (FRU) SIDE-BY-SIDE MOORING ANALYSIS
Wei Ye, Yong Luo, Jack Pollack SBM-IMODCO, 1255 Enclave Parkway, Houston, Texas 77077, USA
Phone: 281-8486000, Fax: 281-8486100, Email: [email protected]
Proceedings of OMAE200524th International Conference on Offshore Mechanics and Arctic Engineering (OMAE 2005)
June 12-17, 2005, Halkidiki, Greece
OMAE2005-67117
ABSTRACT This paper presents a newly developed Floating
Regasification Unit (FRU) concept for LNG import in the US Golf of Mexico (GOM) region. The FRU can be converted from a Suezmax tanker and has a turret mooring system. One of the key technologies of the FRU concept is the Side-By-Side (SBS) mooring between the FRU and the LNG Carrier (LNGC) for offloading. The mooring lines and pneumatic fenders between the two vessels should be able to restrain the relative motions to ensure the safe transfer of LNG. Advanced hydrodynamics modeling techniques have been applied, which include full hydrodynamic interactions between the FRU and the LNGC with full QTFs considering the shallow water effect. The anchor legs are modeled as dynamically, fully coupled to the turret and the FRU.
The feasibility of the FRU concept is established for LNG import in the GOM, with a variety of workable water depths ranging from 40 meters to more than 100 meters with an up-time exceeding 98%. Analysis results demonstrate the significance of hydrodynamic interactions between the two vessels in close proximity arrangement.
INTRODUCTION The rapidly increasing US demands for natural gas and
dwindling domestic supplies call for the import of liquefied natural gas (LNG). Numerous LNG import projects in North America are underway, and more are being planned. In general, there are two types of LNG terminals: onshore and offshore. As of today, all LNG terminals have been built onshore. Recently, however, there is more and more public opposition to this type of LNG terminals due to security concerns and pollution, and industry has turned the attention to the development of offshore LNG terminals. So far, two types of offshore LNG terminals have been proposed: Gravity Base Structure (GBS) and Floating (Storage) Regasification Unit (F(S)RU). Depending on
edings.asmedigitalcollection.asme.org on 07/01/2019 Terms of Us
project-specific conditions, overall the F(S)RU has been shown to have economical advantages over the GBS (Ref. 1). Energy Bridge, The first floating LNG terminal, will be fully operable in 2005.
Figure 1. Artistic Rendering of FRU and LNG Carrier Lately, SBM-IMODCO (SBMI) developed a Floating
Regasification Unit (FRU) as an LNG import terminal (Figure 1). The FRU can be converted from a Suezmax tanker and has a turret anchoring system. This concept provides the most cost effective solution to the offshore LNG import. Reference 2 proposes to utilize the salt cavern formations as the storage facility, receiving and depositing natural gas from FRU, and providing a logistical link between the natural gas, petrochemical and refining industries. Salt Cavern storage is much more secure than surface storage tanks and the operations occur largely unseen and unnoticed by the public because of their underground nature. The FRU is quite promising for Salt Cavern storage as it uses technology proven with Floating Production Storage and Offload (FPSO) systems that have been
1 Copyright © 2005 by ASME
e: http://www.asme.org/about-asme/terms-of-use
Down
successfully used in cost-effective production of offshore hydrocarbons.
One of the key technologies of the FRU concept is the Side-By-Side mooring between the FRU and the LNGC, as it must keep the relative excursions within the limits imposed by the LNG loading arms for cargo transfer. The hydrodynamic interactions between the two closely moored vessels play an important role in the SBS mooring design. In addition, the anchoring system needs to be designed to survive the extreme condition with the stand-alone FRU.
Huijsmans (Ref. 3) studied the diffraction and radiation waves of two side-by-side moored vessels. The conclusion is that the hydrodynamic interactions must be accounted for, and sufficient number of panels must be used in order to overcome the inaccuracy due to the linear diffraction wave theory. The use of a higher order integration scheme such as Gauss Quadrature on the wave part of the Green’s function is mandatory. Buchner (Ref. 4) compared the numerical simulations of a LNG FPSO and a LNG Carrier moored side-by-side with the model test results. Rigid free-surface lid was used to suppress numerical anomalies, which caused unrealistically high second-order drift loads resulting from standard linear diffraction wave theory. It was concluded that the numerical model is capable of predicting the motion and mooring loads of two side-by-side moored vessels.
This paper presents the side-by-side mooring and hydrodynamic analysis of a LNGC moored to a FRU. The hydrodynamic interactions between two closed moored vessels were studied. The numerical anomalies were overcome by eliminating the resonant wave frequencies, which caused unrealistically high wave loads.
The Side-by-Side mooring system was designed and a numerical model of the mooring lines and pneumatic fenders that restrain the relative motions of the vessels was prepared. Numerical analyses have been conducted, which predict the relative motions and maximum forces occurring in the SBS mooring lines and fenders as well as in the FRU turret mooring system. The paper concludes that, using the advanced hydrodynamics modeling techniques and with the help of model test results, the SBS mooring can be accurately modeled to predict the uptime of the offloading operation.
FRU SYSTEM DESIGN The LNG Floating Regasification Unit (FRU) project is a
conceptual design study executed by SBM-IMODCO (SBMI) on behalf of the CGI Salt Cavern LNG Joint Industry Project (JIP). The FRU utilizes the ship shaped floating structure and is turret moored to the ocean floor to allow the vessel to weathervane to align itself with the predominant direction of the environmental loads.
The FRU will receive LNG via side-by-side offloading from a shuttle LNGC. The transfer of LNG from the LNGC to the FRU can be achieved via FMC LNG Offloading Arms. The received LNG will be re-gasified and then sent out to the salt cavern for storage and the gas grid for the consumer market. Gas will be exported via flexible risers and subsea flowlines to salt caverns and existing onshore infrastructure.
The LNG transfer can only be safely conducted with the loading arms within certain relative motion envelopes. The mooring lines, which are normally made up of steel wire ropes
loaded From: https://proceedings.asmedigitalcollection.asme.org on 07/01/2019 Terms of Use
with nylon tails, and the fenders between the two vessels should be able to restrain the relative motions between the loading arm on the FRU and the manifold on the LNG Carrier. At the same time, the maximum mooring line tension and fender reaction force need to be kept below the design allowables. In addition, the anchor chains should be adequately designed to survive the extreme condition in the FRU in a stand-alone survival condition.
The berthing analysis was separately conducted and is outside the scope of this paper.
Environmental Criteria The water depth for the proposed site is 300 ft (91.44 m),
which is chosen according to a possible Salt Cavern location in the GOM. The sensitivity study on water depth as shallow as 40m has been performed to demonstrate that the FRU concept is feasible to other Salt Cavern sites in different water depths.
The targeted survival and operating condition is the 100-year return hurricane and 1-year return winter storm conditions respectively, which are listed in Table 1 below. Due to the lack of field-specific data, the environment is assumed omni-directional and the worst combination of the wind, wave and current directions is considered. For the survival condition, the sensitivity study on wave peak period (Tp) is performed to check the robustness of the designed system. For the operating condition, a range of wave heights and wave period are analyzed to define the operation envelope.
Table 1. Environmental Conditions Storm 100-year Return
Hurricane 1-year Return Winter Storm
Wave Direction omni-direction omni-direction Sig. Wave Height (m) 9.6 2.5 Peak period (s) 13.0 7.0 Max. Wave Height (m) 16.8 -- Max. Wave Period (s) 12.0 -- Spectrum JONSWAP
(γ = 3.0) JONSWAP
(γ = 2.0) Associated Wind Speed (m/s, 1 hr avrg, at10 m) 29.5 16.0
Wind Spectrum API API Wind Speed (m/s) 53 19.2 Associated Current (m/s) 1.0 0.6
FRU A typical Suezmax tanker is selected for conversion to the
FRU. Main particulars are presented in Table 2 below. The internal turret is selected to accommodate a large number of risers (4 × 16-inch). Nine (9) chain-wire-chain anchoring legs are grouped in three (3) bundles with each bundle 120 degrees apart. Within each bundle, each leg is 5 degrees apart. Anchoring leg properties are presented in Table 3.
2 Copyright © 2005 by ASME
: http://www.asme.org/about-asme/terms-of-use

Down
Table 2. FRU Principals
Length overall, LOA 269.0 m Length btw perpendiculars, LBP 258.0 m Breadth, B 45.0 m Depth 24.0 m Distance Turret – APP (Internal) 214.0 m Draught, T 12.0 m Displacement, D 117,704 m3 Waterplane Area, Aw 10,330 m2 LCG (ref to APP) 142.1 m KG (ref to Keel level) 14.0 m Roll Radius of Gyration, Rxx 16.1 m Pitch Radius of Gyration, Ryy 64.5 m Yaw Radius of Gyration, Rzz 64.5 m Wind Area (frontal) 2116 m2 Wind Area (side) 8233 m2 GMT 5.6 m
Table 3. Mooring Leg Properties Length 120 m Type R4 Studless Chain Diameter 137 mm 1
MBL (after 20 years) 17009 (15778) kN Length 650 m Type Sheathed SS Wire Rope Diameter 130 mm 2
MBL 15921 kN Length 430 m Type R4 Studless Chain Diameter 137 mm 3
MBL (after 20 years) 17009 (15778) kN Total Leg Length 1200 m
Figure 2. FMC Chiksan Marine Load Arms (Courtesy of FMC Technology)
loaded From: https://proceedings.asmedigitalcollection.asme.org on 07/01/2019 Terms of
The FMC Chiksan, Double Counterweighted Marine
Loading Arms are used are proposed for LNG offloading (Figure 2). It consists of three (3) 16” x 70'-0" DCMA”S” type, fully powered marine loading arms constructed of stainless steel construction for LNG service and One (1) 16” x 70'-0" DCMA”S” for Nitrogen (NG) service. One loading arm is intended for Boil Off Gas return from the FRU to the carrier. A single loading arm is to be designated as common spare, although it will normally be used to accelerate the offloading operation.
The offloading arm has the following particulars and maximum allowable relative motions between the loading arm and the manifold (Table 4).
Table 4. FMC Chiksan Marine Load Arms
Type of Arm DCMA”S” Nominal Diameter 0.4064 m (16”) Length of Arm Assembly 21.336 m (70’) Height of Base Riser 8.5 m Hydraulically Operated Yes 304 L Stainless steel construction according to enclosed material specification
Vertical Displacement ± 2.0 m Horizontal ± 1.7 m Velocity ± 1.0 m/s Acceleration ± 0.5 m/s2
Allowable Relative Motion btw Load Arm and Manifold Horizontal Slow Drifting ± 4.0 m
LNG Carrier A typical 138,000 m3 is selected for this concept study.
The main particulars are listed below.
Table 5. LNG Carrier Principals Length overall, LOA 290.0 m Length btw perpendiculars, LBP 274.0 m Breadth, B 44.2 m Depth 25.0 m Draught, T 11.0 m Displacement, D 97,641 m3 Waterplane Area, Aw 10,130 m2 LCG (ref to APP) 135.4 m KG (ref to Keel level) 16.3 m Roll Radius of Gyration, Rxx 15.1 m Pitch Radius of Gyration, Ryy 68.5 m Yaw Radius of Gyration, Rzz 68.5 m Wind Area (frontal) 1450 m2 Wind Area (side) 6065 m2 GMT 4.8 m
Mooring Lines and Fenders The standard sixteen (16) mooring lines on the LNGC
were adopted, including six (6) head lines, four (4) spring lines and six (6) stern lines.
The mooring line is made up of a section of steel wire rope and nylon tail line. The length of 20 m is selected for the nylon tail line to achieve the desired elasticity. The pretension of 150
3 Copyright © 2005 by ASME
Use: http://www.asme.org/about-asme/terms-of-use
Dow
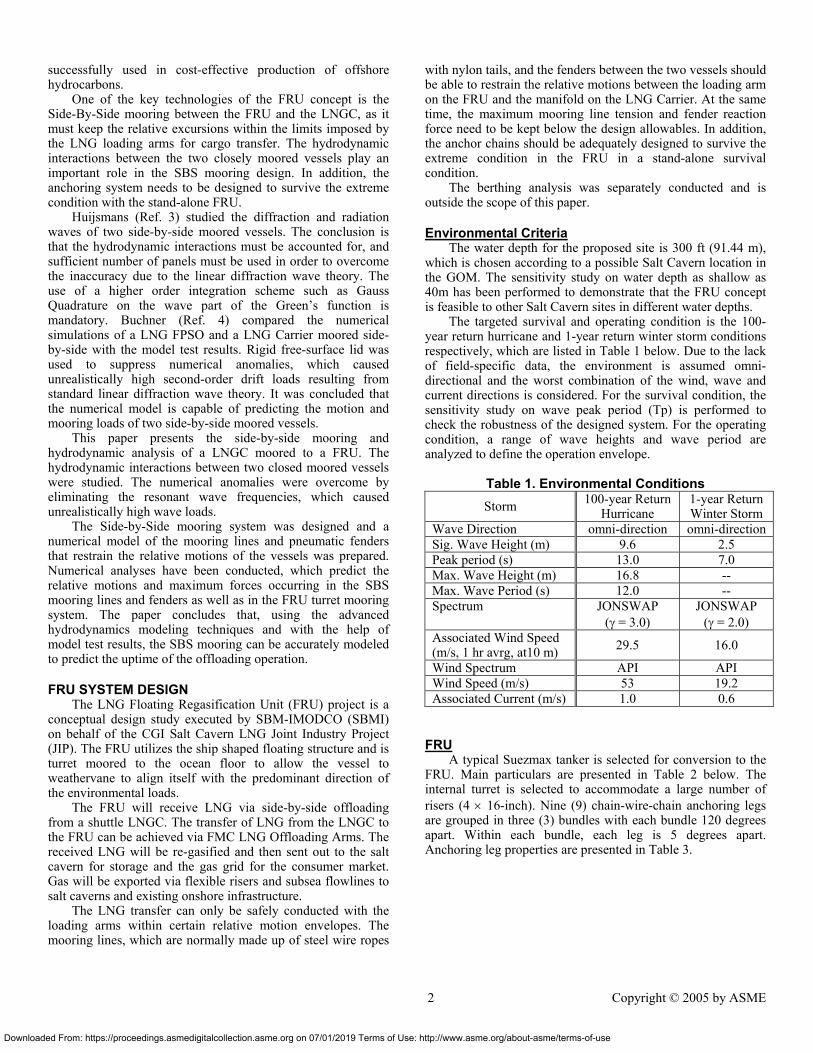
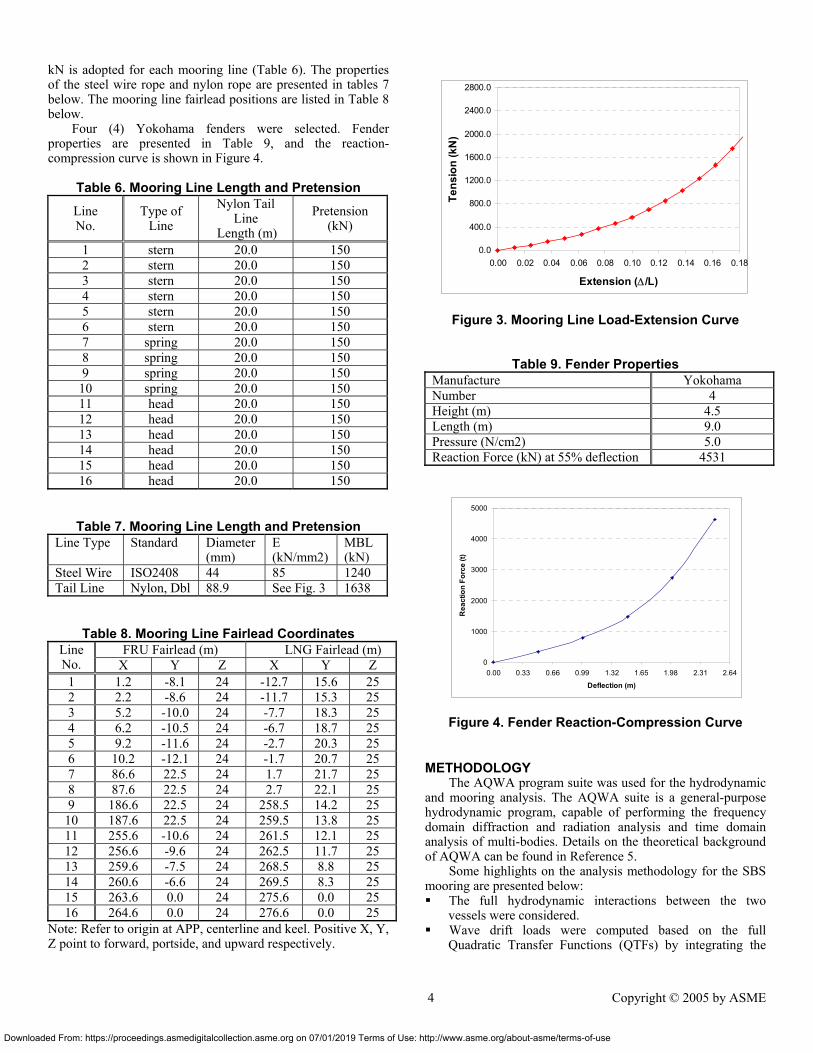
kN is adopted for each mooring line (Table 6). The properties of the steel wire rope and nylon rope are presented in tables 7 below. The mooring line fairlead positions are listed in Table 8 below.
Four (4) Yokohama fenders were selected. Fender properties are presented in Table 9, and the reaction-compression curve is shown in Figure 4.
Table 6. Mooring Line Length and Pretension
Line No.
Type of Line
Nylon Tail Line
Length (m)
Pretension (kN)
1 stern 20.0 150 2 stern 20.0 150 3 stern 20.0 150 4 stern 20.0 150 5 stern 20.0 150 6 stern 20.0 150 7 spring 20.0 150 8 spring 20.0 150 9 spring 20.0 150
10 spring 20.0 150 11 head 20.0 150 12 head 20.0 150 13 head 20.0 150 14 head 20.0 150 15 head 20.0 150 16 head 20.0 150
Table 7. Mooring Line Length and Pretension
Line Type Standard Diameter (mm)
E (kN/mm2)
MBL (kN)
Steel Wire ISO2408 44 85 1240 Tail Line Nylon, Dbl 88.9 See Fig. 3 1638
Table 8. Mooring Line Fairlead Coordinates FRU Fairlead (m) LNG Fairlead (m) Line
No. X Y Z X Y Z 1 1.2 -8.1 24 -12.7 15.6 25 2 2.2 -8.6 24 -11.7 15.3 25 3 5.2 -10.0 24 -7.7 18.3 25 4 6.2 -10.5 24 -6.7 18.7 25 5 9.2 -11.6 24 -2.7 20.3 25 6 10.2 -12.1 24 -1.7 20.7 25 7 86.6 22.5 24 1.7 21.7 25 8 87.6 22.5 24 2.7 22.1 25 9 186.6 22.5 24 258.5 14.2 25
10 187.6 22.5 24 259.5 13.8 25 11 255.6 -10.6 24 261.5 12.1 25 12 256.6 -9.6 24 262.5 11.7 25 13 259.6 -7.5 24 268.5 8.8 25 14 260.6 -6.6 24 269.5 8.3 25 15 263.6 0.0 24 275.6 0.0 25 16 264.6 0.0 24 276.6 0.0 25
Note: Refer to origin at APP, centerline and keel. Positive X, Y, Z point to forward, portside, and upward respectively.
nloaded From: https://proceedings.asmedigitalcollection.asme.org on 07/01/2019 Terms of Use
0.0
400.0
800.0
1200.0
1600.0
2000.0
2400.0
2800.0
0.00 0.02 0.04 0.06 0.08 0.10 0.12 0.14 0.16 0.18
Extension (∆/L)
Tens
ion
(kN
)
Figure 3. Mooring Line Load-Extension Curve
Table 9. Fender Properties Manufacture Yokohama Number 4 Height (m) 4.5 Length (m) 9.0 Pressure (N/cm2) 5.0 Reaction Force (kN) at 55% deflection 4531
0
1000
2000
3000
4000
5000
0.00 0.33 0.66 0.99 1.32 1.65 1.98 2.31 2.64
Deflection (m)
Rea
ctio
n Fo
rce
(t)
Figure 4. Fender Reaction-Compression Curve
METHODOLOGY The AQWA program suite was used for the hydrodynamic
and mooring analysis. The AQWA suite is a general-purpose hydrodynamic program, capable of performing the frequency domain diffraction and radiation analysis and time domain analysis of multi-bodies. Details on the theoretical background of AQWA can be found in Reference 5.
Some highlights on the analysis methodology for the SBS mooring are presented below: The full hydrodynamic interactions between the two
vessels were considered. Wave drift loads were computed based on the full
Quadratic Transfer Functions (QTFs) by integrating the
4 Copyright © 2005 by ASME
: http://www.asme.org/about-asme/terms-of-use

Down
pressure over the wetted surface of each body (near-field solution).
The anchoring legs were modeled as dynamically by taking into account the inertia and drag forces of the chains and steel wire ropes, and therefore the motions of FRU were fully coupled with the anchoring legs.
Since the mooring lines were modeled as dynamic cables, the mooring damping contribution to system slow drift damping was automatically accounted for. Therefore no additional artificial mooring damping needs to be added. This is important to the mooring force calculation as the tanker slow drift motion is resonant responses and the system damping plays an important role in predicting the tanker offset and consequently the mooring line tension. This fully coupled analysis method is more accurate than the non-coupled approach assuming linear damping.
The internal turret on the FRU was modeled as an articulation to allow the vessel to freely rotate along the turret axis while constraining the translational displacements and two rotations perpendicular to the turret axis.
The mooring lines linking to two vessels were modeled as massless nonlinear springs based on a five-parameter polynomial. The fenders were modeled as nonlinear springs also based on a five-parameter polynomial. The fender element’s one end was attached to the FRU starboard side and the other end was free to contact the LNGC portside. The reaction force was determined by the relative distance between the FRU and LNG vessel. The friction force between the fender and the two vessels was taken into account, while the damping effect was ignored.
Current and wind force and moment coefficients were calculated based on the OCIMF databases, and the additions on wind area due to the equipments on the FRU and the LNG containers on the LNGC were considered. The shielding effects on the current and wind forces between the two vessels were ignored to maintain a certain amount of conservatism..
The current velocity was assumed to be steady. The wind was simulated by an API wind spectrum based on the 1-hour average wind speed at 10 m above MSL. The 100-year and 1-year return storm waves are assumed to be of a JONSWAP spectrum, with the parameter γ of 3.0 and 2.0 respectively.
Four (4) percent of critical damping on the roll motion was added for the FRU under the survival condition (100-year return hurricane) to account for the damping due to vortex shedding and fluid viscosity. Under the operating condition, 2 percent of critical damping was added for the FRU and 1.5 percent for the LNGC.
Yaw-rate drag damping was calculated based on OCIMF. The radiation forces from added mass and added damping
on vessels in the time domain were calculated using the Convolution Integral.
loaded From: https://proceedings.asmedigitalcollection.asme.org on 07/01/2019 Terms of U
Figure 5. FRU and LNGC Model The AQWA model of the FRU and the LNGC with
anchoring legs, mooring lines and fenders is illustrated in Figure 5.
For two vessels moored in a close proximity, the handling of the hydrodynamic interactions is the most critical part to the success of the SBS mooring analysis. With the standard linear diffraction and radiation wave theory, the hydrodynamic interactions yield unrealistic high standing waves between the two bodies at certain wave periods, which lead to unrealistically high hydrodynamic loads in the transverse direction. Figure 6 shows the surface elevation contour around the two vessels, under the unit amplitude incident wave, and Figure 7 presents the variation of the surface elevation to the wave frequency at a fixed location near the vessel bow. Figure 7 clearly demonstrates the resonant wave phenomenon (standing waves) at certain wave frequencies, which leads to the resonant first order and second order wave loads at or near these wave frequencies (Figure 8 & 9). However, model experiments (Ref. 1 & 2) and field observations proved that this type of resonant fluid flow does not exist in reality. It is simply impossible to generate such high waves within the narrow gap without reaching the point of breaking. The over-prediction of waves and loads is due to the negligence of fluid viscosity and rotation in the linear wave theory.
Reference 1 & 2 utilized the Rigid Lid approach by imposing a non-penetration surface condition on the gap between the vessels to suppress the unrealistic standing waves. Comparisons with the model test data proved that the Rigid Lid approach is successful in predicting the wave loads. An alternative method is to impose Elastic Lid instead of the rigid one. Of course the stiffness of the Elastic Lid needs to be calibrated with the model test data. In this paper, the authors adopted a different approach: that is to smooth out the wave loads by eliminating the resonant frequencies and the wave loads at these frequencies are interpolated from adjacent frequencies, similar to the handling of irregular frequency. Comparisons with the model test data (Ref. 1 & 2) confirm that this method is equivalent to the Rigid Lid approach.
Stern lines Head lines
Fender
FRU
LNGC
Anchor Leg
Spring lines
5 Copyright © 2005 by ASME
se: http://www.asme.org/about-asme/terms-of-use

Downlo
Figure 6. Wave Contour under Unit Amplitude Incident Wave
0
1
2
3
4
5
6
7
0 0.2 0.4 0.6 0.8 1 1.2 1.4 1.6
Wave Frequency (rad/s)
Surf
ace
Elev
atio
n (m
/m)
Figure 7. Surface Elevation near Vessel Bow
Figure 8. First Order Wave Forces
aded From: https://proceedings.asmedigitalcollection.asme.org on 07/01/2019 Terms of U
Figure 9. Mean Second Order Wave Forces None of the above mentioned methods are perfect as they
are still based on the linear wave theory with limited modifications. The fluid field in the gap is strongly affected by the nonlinearity due to viscosity, rotation and breaking wave limit. A method based on the Computational Fluid Dynamics (CFD) may be able to fully simulate the fluid flows within the gap.
ANALYSIS RESULTS
Extreme Condition The following combinations of wind, wave and current
directions were analyzed: Wind, wave and current collinear; DNV cross condition: wind 30 degrees from wave,
current 45 degrees from wave. From the screening analysis, it is concluded that the wave
direction of 75 degrees from head-on is the most critical condition (Figure 10).
The analysis results are presented below. The Maximum anchor chain tension is 718.6 tonnes, which yields a factor of safety (FOS) of 2.24 and meets the minimum design requirement of 1.67 for the survival condition.
The sensitivity analysis on the wave peak period of the 100-year return hurricane demonstrates that the wave peak period has limited effect on the maximum mooring loads.
Figure 10. Environment Loads Directions
Wave, 75degWind
Current
6 Copyright © 2005 by ASME
se: http://www.asme.org/about-asme/terms-of-use
D
Table 10. Maximum Mooring Loads, 100-year
Hurricane (Hs=9.6m, Tp=13.0 s)
Random SeedMax Mooring Line Tension
(tonne)
Max Anchor Load (tonne)
Max Mooring Line Tension
(tonne)
Max Anchor Load (tonne)
1 531.7 503.6 642.2 605.42 572.2 548.4 644.4 608.83 627.8 594.6 825.0 776.44 723.0 703.1 793.1 775.65 505.5 479.9 829.9 795.56 641.3 616.9 660.9 638.87 583.2 554.3 549.9 524.68 646.7 623.1 539.2 507.69 710.9 690.1 742.4 701.310 762.5 743.5 565.5 541.0
Most Probable Max. 630.5 605.7 679.2 647.5
Note:The soil friction force is not considered when calculating anchor loads.
Collinear (wind, wave, current inline with mooring lines)
Oblique (wave 75deg from head-on, wind 30deg from wind, current 45 deg from
wave)
Table 11. Maximum Mooring Loads, 100-year Hurricane (Hs=9.6m, Tp=11.5 s)
Random SeedMax Mooring Line Tension
(tonne)
Max Anchor Load (tonne)
Max Mooring Line Tension
(tonne)
Max Anchor Load (tonne)
1 932.5 901.9 709.4 682.22 551.5 521.0 507.5 481.93 739.9 705.8 861.0 831.24 684.0 654.1 665.0 636.15 553.0 521.3 603.1 574.66 595.0 564.1 565.9 537.07 670.3 647.1 563.1 531.28 577.8 551.0 623.0 584.99 637.2 605.9 635.0 603.2
10 518.1 488.0 557.6 525.1Most Probable
Max. 645.9 616.0 629.1 598.7
Note:The soil friction force is not considered when calculating anchor loads.
Collinear (wind, wave, current inline with mooring lines)
Oblique (wave 75deg from head-on, wind 30deg from wind, current 45 deg from
wave)
Table 12. Maximum Mooring Loads, 100-year Hurricane (Hs=9.6m, Tp=14.5 s)
Random SeedMax Mooring Line Tension
(tonne)
Max Anchor Load (tonne)
Max Mooring Line Tension
(tonne)
Max Anchor Load (tonne)
1 938.8 917.7 752.6 730.42 675.0 653.3 748.5 726.93 663.6 641.0 869.1 847.94 646.0 627.6 703.0 683.25 565.6 541.7 666.1 632.16 749.2 728.2 587.6 547.87 644.0 620.8 512.7 491.48 972.6 953.9 627.9 607.89 677.2 656.3 645.5 624.0
10 654.2 633.5 643.8 610.7Most Probable
Max. 718.6 697.4 675.7 650.2
Note:The soil friction force is not considered when calculating anchor loads.
Collinear (wind, wave, current inline with mooring lines)
Oblique (wave 75deg from head-on, wind 30deg from wind, current 45 deg from
wave)
ownloaded From: https://proceedings.asmedigitalcollection.asme.org on 07/01/2019 Terms of U
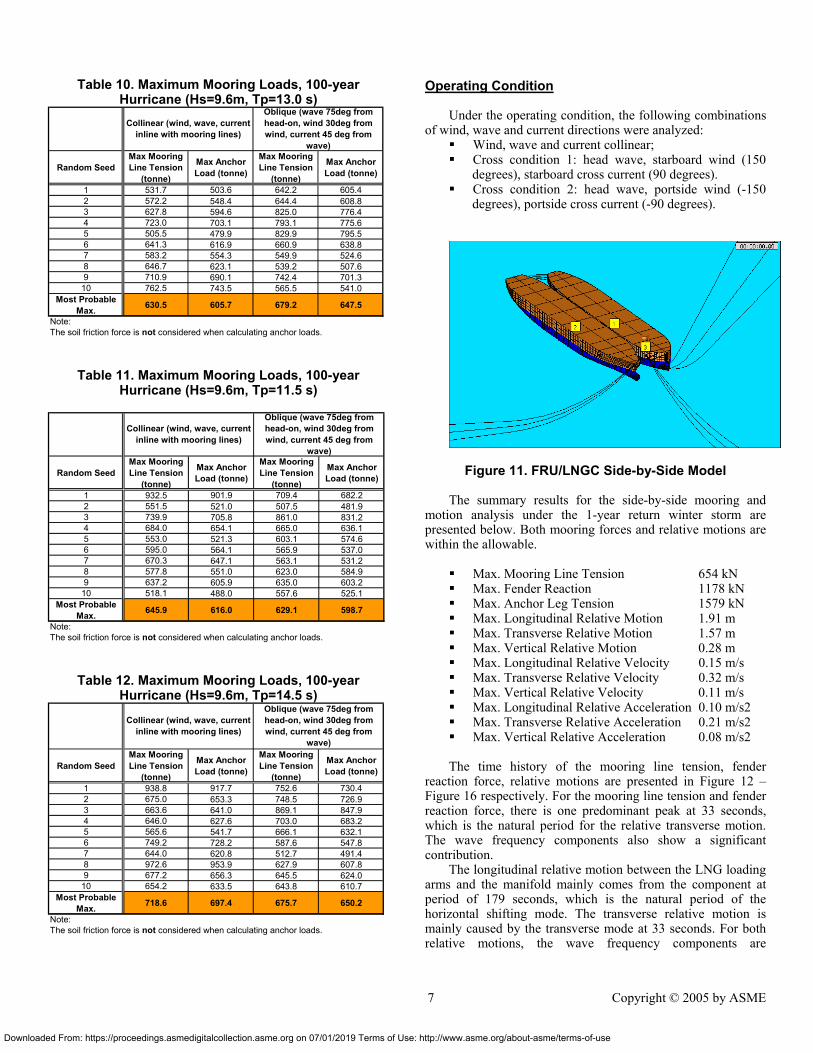
Operating Condition Under the operating condition, the following combinations
of wind, wave and current directions were analyzed: Wind, wave and current collinear; Cross condition 1: head wave, starboard wind (150
degrees), starboard cross current (90 degrees). Cross condition 2: head wave, portside wind (-150
degrees), portside cross current (-90 degrees).
Figure 11. FRU/LNGC Side-by-Side Model The summary results for the side-by-side mooring and
motion analysis under the 1-year return winter storm are presented below. Both mooring forces and relative motions are within the allowable.
Max. Mooring Line Tension 654 kN Max. Fender Reaction 1178 kN Max. Anchor Leg Tension 1579 kN Max. Longitudinal Relative Motion 1.91 m Max. Transverse Relative Motion 1.57 m Max. Vertical Relative Motion 0.28 m Max. Longitudinal Relative Velocity 0.15 m/s Max. Transverse Relative Velocity 0.32 m/s Max. Vertical Relative Velocity 0.11 m/s Max. Longitudinal Relative Acceleration 0.10 m/s2 Max. Transverse Relative Acceleration 0.21 m/s2 Max. Vertical Relative Acceleration 0.08 m/s2
The time history of the mooring line tension, fender
reaction force, relative motions are presented in Figure 12 – Figure 16 respectively. For the mooring line tension and fender reaction force, there is one predominant peak at 33 seconds, which is the natural period for the relative transverse motion. The wave frequency components also show a significant contribution.
The longitudinal relative motion between the LNG loading arms and the manifold mainly comes from the component at period of 179 seconds, which is the natural period of the horizontal shifting mode. The transverse relative motion is mainly caused by the transverse mode at 33 seconds. For both relative motions, the wave frequency components are
7 Copyright © 2005 by ASME
se: http://www.asme.org/about-asme/terms-of-use

Dow
insignificant. The relative vertical motion is mainly caused by the roll natural mode at 16 seconds and wave frequency heave motions.
Figure 12. Mooring Line Tension
Figure 13. Fender Reaction Force
Figure 14. Relative Motion - Longitudinal
33 seconds
19 seconds 7 seconds
33 seconds
19 seconds 7 seconds
179 seconds
33 seconds
nloaded From: https://proceedings.asmedigitalcollection.asme.org on 07/01/2019 Terms of U
Figure 15. Relative Motion - Transverse
Figure 16. Relative Motion – Vertical The side-by-side mooring and motion analysis has been
performed for a range of seastates with Hs from 0.5 m to 4.0 m and Tp from 6.0 seconds to 11.0 seconds to establish the operation envelope.
From the analysis results, the conclusion can be drawn that the maximum mooring line tension is the most critical factor to decide the operation envelope. For the different combinations of wind, wave and current direction, the operation envelopes are presented in Table 13 - Table 15, respectively.
It is noted that the above results are based on the hydrodynamics analysis only without considering the berthing and other practical constraints of the offloading operation.
Based on the above operating envelope, the uptime in the GOM region is calculated to be 98%.
Table 13. Operating Envelope: Wind, wave and
current collinear 4.0 2577 3359 3603 1357 1215 11463.5 1288 1593 1492 1026 871 7803.0 840 856 1027 700 664 6482.5 645 654 726 563 485 5322.0 429 476 443 468 374 4321.5 330 319 327 339 283 3451.0 234 251 253 250 229 2680.5 221 218 219 224 219 227
6.0 7.0 8.0 9.0 10.0 11.0Tp (s)
Max. Mooring Line Tension (kN)
Hs (m)
33 seconds
16 seconds 7 seconds
8 Copyright © 2005 by ASME
se: http://www.asme.org/about-asme/terms-of-use
Down
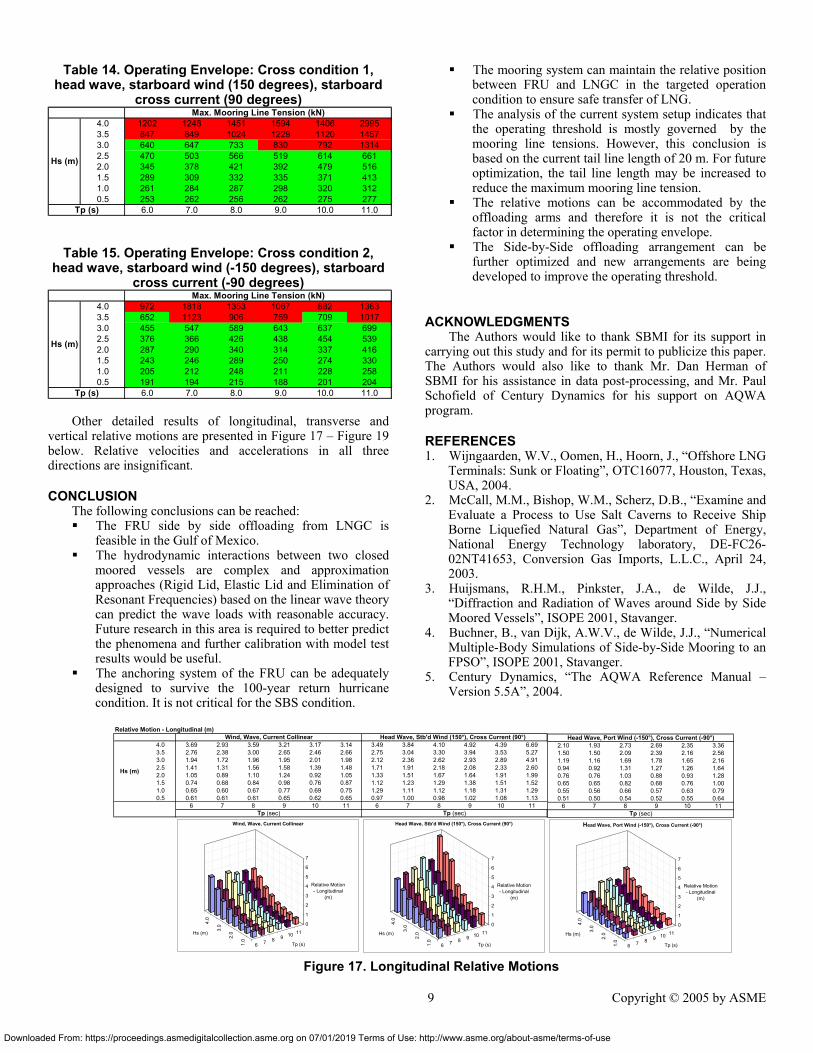
Table 14. Operating Envelope: Cross condition 1,
head wave, starboard wind (150 degrees), starboard cross current (90 degrees)
4.0 1202 1248 1451 1594 1406 29953.5 847 849 1024 1229 1120 14573.0 640 647 733 830 792 13142.5 470 503 566 519 614 6612.0 345 378 421 392 479 5161.5 289 309 332 335 371 4131.0 261 284 287 298 320 3120.5 253 262 256 262 275 277
6.0 7.0 8.0 9.0 10.0 11.0
Max. Mooring Line Tension (kN)
Hs (m)
Tp (s)
Table 15. Operating Envelope: Cross condition 2, head wave, starboard wind (-150 degrees), starboard
cross current (-90 degrees) 4.0 972 1818 1353 1067 882 13633.5 652 1123 906 759 709 10173.0 455 547 589 643 637 6992.5 376 366 426 438 454 5392.0 287 290 340 314 337 4161.5 243 246 289 250 274 3301.0 205 212 248 211 228 2580.5 191 194 215 188 201 204
6.0 7.0 8.0 9.0 10.0 11.0Tp (s)
Max. Mooring Line Tension (kN)
Hs (m)
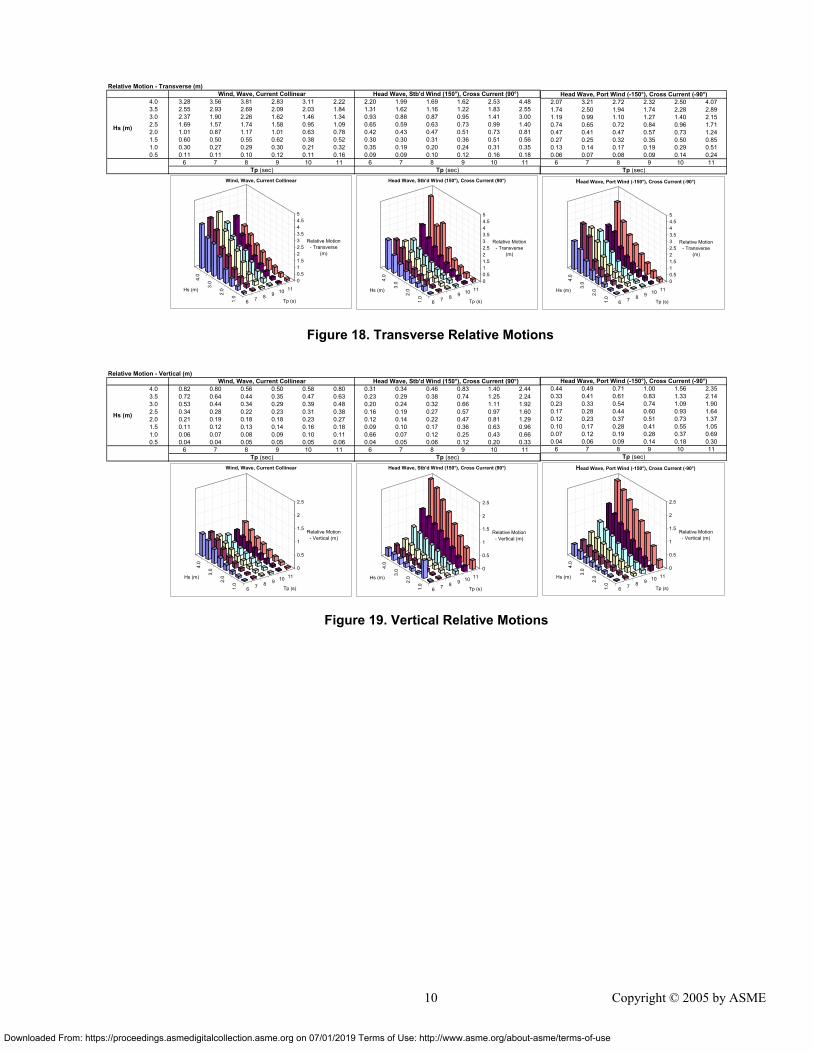
Other detailed results of longitudinal, transverse and
vertical relative motions are presented in Figure 17 – Figure 19 below. Relative velocities and accelerations in all three directions are insignificant.
CONCLUSION The following conclusions can be reached: The FRU side by side offloading from LNGC is
feasible in the Gulf of Mexico. The hydrodynamic interactions between two closed
moored vessels are complex and approximation approaches (Rigid Lid, Elastic Lid and Elimination of Resonant Frequencies) based on the linear wave theory can predict the wave loads with reasonable accuracy. Future research in this area is required to better predict the phenomena and further calibration with model test results would be useful.
The anchoring system of the FRU can be adequately designed to survive the 100-year return hurricane condition. It is not critical for the SBS condition.
loaded From: https://proceedings.asmedigitalcollection.asme.org on 07/01/2019 Terms of Us
The mooring system can maintain the relative position between FRU and LNGC in the targeted operation condition to ensure safe transfer of LNG.
The analysis of the current system setup indicates that the operating threshold is mostly governed by the mooring line tensions. However, this conclusion is based on the current tail line length of 20 m. For future optimization, the tail line length may be increased to reduce the maximum mooring line tension.
The relative motions can be accommodated by the offloading arms and therefore it is not the critical factor in determining the operating envelope.
The Side-by-Side offloading arrangement can be further optimized and new arrangements are being developed to improve the operating threshold.
ACKNOWLEDGMENTS The Authors would like to thank SBMI for its support in
carrying out this study and for its permit to publicize this paper. The Authors would also like to thank Mr. Dan Herman of SBMI for his assistance in data post-processing, and Mr. Paul Schofield of Century Dynamics for his support on AQWA program.
REFERENCES 1. Wijngaarden, W.V., Oomen, H., Hoorn, J., “Offshore LNG
Terminals: Sunk or Floating”, OTC16077, Houston, Texas, USA, 2004.
2. McCall, M.M., Bishop, W.M., Scherz, D.B., “Examine and Evaluate a Process to Use Salt Caverns to Receive Ship Borne Liquefied Natural Gas”, Department of Energy, National Energy Technology laboratory, DE-FC26-02NT41653, Conversion Gas Imports, L.L.C., April 24, 2003.
3. Huijsmans, R.H.M., Pinkster, J.A., de Wilde, J.J., “Diffraction and Radiation of Waves around Side by Side Moored Vessels”, ISOPE 2001, Stavanger.
4. Buchner, B., van Dijk, A.W.V., de Wilde, J.J., “Numerical Multiple-Body Simulations of Side-by-Side Mooring to an FPSO”, ISOPE 2001, Stavanger.
5. Century Dynamics, “The AQWA Reference Manual – Version 5.5A”, 2004.
Relative Motion - Longitudinal (m)
4.0 3.69 2.93 3.59 3.21 3.17 3.14 3.49 3.84 4.10 4.92 4.39 6.693.5 2.76 2.38 3.00 2.65 2.46 2.66 2.75 3.04 3.30 3.94 3.53 5.273.0 1.94 1.72 1.96 1.95 2.01 1.98 2.12 2.36 2.62 2.93 2.89 4.912.5 1.41 1.31 1.56 1.58 1.39 1.48 1.71 1.91 2.18 2.08 2.33 2.602.0 1.05 0.89 1.10 1.24 0.92 1.05 1.33 1.51 1.67 1.64 1.91 1.991.5 0.74 0.68 0.84 0.98 0.76 0.87 1.12 1.23 1.29 1.38 1.51 1.521.0 0.65 0.60 0.67 0.77 0.69 0.75 1.29 1.11 1.12 1.18 1.31 1.290.5 0.61 0.61 0.61 0.65 0.62 0.65 0.97 1.00 0.98 1.02 1.08 1.13
6 7 8 9 10 11 6 7 8 9 10 11Tp (sec) Tp (sec)
Wind, Wave, Current Collinear Head Wave, Stb'd Wind (150°), Cross Current (90°)
Hs (m)
4.0
3.0
2.0
1.0
6 7 8 9 10 11
0
1
2
3
4
5
6
7
Relative Motion - Longitudinal
(m)
Hs (m)
Tp (s)
Wind, Wave, Current Collinear
4.0
3.0
2.0
1.0
6 7 8 9 10 110
1
2
3
4
5
6
7
Relative Motion - Longitudinal
(m)
Hs (m)
Tp (s)
Head Wave, Stb'd Wind (150°), Cross Current (90°)
2.10 1.93 2.73 2.69 2.35 3.361.50 1.50 2.09 2.39 2.16 2.561.19 1.16 1.69 1.78 1.65 2.160.94 0.92 1.31 1.27 1.26 1.640.76 0.76 1.03 0.88 0.93 1.280.65 0.65 0.82 0.68 0.76 1.000.55 0.56 0.66 0.57 0.63 0.790.51 0.50 0.54 0.52 0.55 0.64
6 7 8 9 10 11Tp (sec)
Head Wave, Port Wind (-150°), Cross Current (-90°)
4.0
3.0
2.0
1.0
6 7 8 9 10 110
1
2
3
4
5
6
7
Relative Motion - Longitudinal
(m)
Hs (m)
Tp (s)
Head Wave, Port Wind (-150°), Cross Current (-90°)
Figure 17. Longitudinal Relative Motions
9 Copyright © 2005 by ASME
e: http://www.asme.org/about-asme/terms-of-use
Download
Relative Motion - Transverse (m)
4.0 3.28 3.56 3.81 2.83 3.11 2.22 2.20 1.99 1.69 1.62 2.53 4.483.5 2.55 2.93 2.69 2.09 2.03 1.84 1.31 1.62 1.16 1.22 1.83 2.553.0 2.37 1.90 2.26 1.62 1.46 1.34 0.93 0.88 0.87 0.95 1.41 3.002.5 1.69 1.57 1.74 1.58 0.95 1.09 0.65 0.59 0.63 0.73 0.99 1.402.0 1.01 0.87 1.17 1.01 0.63 0.78 0.42 0.43 0.47 0.51 0.73 0.811.5 0.60 0.50 0.55 0.62 0.38 0.52 0.30 0.30 0.31 0.36 0.51 0.561.0 0.30 0.27 0.29 0.30 0.21 0.32 0.35 0.19 0.20 0.24 0.31 0.350.5 0.11 0.11 0.10 0.12 0.11 0.16 0.09 0.09 0.10 0.12 0.16 0.18
6 7 8 9 10 11 6 7 8 9 10 11
Wind, Wave, Current Collinear Head Wave, Stb'd Wind (150°), Cross Current (90°)
Tp (sec) Tp (sec)
Hs (m)
4.0
3.0
2.0
1.0
6 7 8 9 10 11
00.511.522.533.544.55
Relative Motion - Transverse
(m)
Hs (m)
Tp (s)
Wind, Wave, Current Collinear
4.0
3.0
2.0
1.0
6 7 8 9 10 11
00.511.522.533.544.55
Relative Motion - Transverse
(m)
Hs (m)
Tp (s)
Head Wave, Stb'd Wind (150°), Cross Current (90°)
2.07 3.21 2.72 2.32 2.50 4.071.74 2.50 1.94 1.74 2.28 2.891.19 0.99 1.10 1.27 1.40 2.150.74 0.65 0.72 0.84 0.96 1.710.47 0.41 0.47 0.57 0.73 1.240.27 0.25 0.32 0.35 0.50 0.850.13 0.14 0.17 0.19 0.29 0.510.06 0.07 0.08 0.09 0.14 0.24
6 7 8 9 10 11
Head Wave, Port Wind (-150°), Cross Current (-90°)
Tp (sec)
4.0
3.0
2.0
1.0
6 7 8 9 10 11
00.511.522.533.544.55
Relative Motion - Transverse
(m)
Hs (m)
Tp (s)
Head Wave, Port Wind (-150°), Cross Current (-90°)
Figure 18. Transverse Relative Motions
Relative Motion - Vertical (m)
4.0 0.82 0.80 0.56 0.50 0.58 0.80 0.31 0.34 0.46 0.83 1.40 2.443.5 0.72 0.64 0.44 0.35 0.47 0.63 0.23 0.29 0.38 0.74 1.25 2.243.0 0.53 0.44 0.34 0.29 0.39 0.48 0.20 0.24 0.32 0.66 1.11 1.922.5 0.34 0.28 0.22 0.23 0.31 0.38 0.16 0.19 0.27 0.57 0.97 1.602.0 0.21 0.19 0.18 0.18 0.23 0.27 0.12 0.14 0.22 0.47 0.81 1.291.5 0.11 0.12 0.13 0.14 0.16 0.18 0.09 0.10 0.17 0.36 0.63 0.961.0 0.06 0.07 0.08 0.09 0.10 0.11 0.66 0.07 0.12 0.25 0.43 0.660.5 0.04 0.04 0.05 0.05 0.05 0.06 0.04 0.05 0.06 0.12 0.20 0.33
6 7 8 9 10 11 6 7 8 9 10 11Tp (sec) Tp (sec)
Wind, Wave, Current Collinear Head Wave, Stb'd Wind (150°), Cross Current (90°)
Hs (m)
4.0
3.0
2.0
1.0
6 7 8 9 10 11
0
0.5
1
1.5
2
2.5
Relative Motion - Vertical (m)
Hs (m)
Tp (s)
Wind, Wave, Current Collinear
4.0
3.0
2.0
1.0
6 7 8 9 10 110
0.5
1
1.5
2
2.5
Relative Motion - Vertical (m)
Hs (m)
Tp (s)
Head Wave, Stb'd Wind (150°), Cross Current (90°)
0.44 0.49 0.71 1.00 1.56 2.350.33 0.41 0.61 0.83 1.33 2.140.23 0.33 0.54 0.74 1.09 1.900.17 0.28 0.44 0.60 0.93 1.640.12 0.23 0.37 0.51 0.73 1.370.10 0.17 0.28 0.41 0.55 1.050.07 0.12 0.19 0.28 0.37 0.690.04 0.06 0.09 0.14 0.18 0.30
6 7 8 9 10 11Tp (sec)
Head Wave, Port Wind (-150°), Cross Current (-90°)
4.0
3.0
2.0
1.0
6 7 8 9 10 110
0.5
1
1.5
2
2.5
Relative Motion - Vertical (m)
Hs (m)
Tp (s)
Head Wave, Port Wind (-150°), Cross Current (-90°)
Figure 19. Vertical Relative Motions
10 Copyright © 2005 by ASME
ed From: https://proceedings.asmedigitalcollection.asme.org on 07/01/2019 Terms of Use: http://www.asme.org/about-asme/terms-of-use