Experimental Investigation of the Mooring System of a Wave ...
31
Journal of Marine Science and Engineering Article Experimental Investigation of the Mooring System of a Wave Energy Converter in Operating and Extreme Wave Conditions Sergej Antonello Sirigu 1, * , Mauro Bonfanti 1 , Ermina Begovic 2 , Carlo Bertorello 2 , Panagiotis Dafnakis 1 , Giuseppe Giorgi 1 , Giovanni Bracco 1 and Giuliana Mattiazzo 1 1 Department of Mechanical and Aerospace Engineering, Polytechnic of Turin, C.so Duca degli Abruzzi, 24, 10129 Turin, Italy; [email protected] (M.B.); [email protected] (P.D.); [email protected] (G.G.); [email protected] (G.B.); [email protected] (G.M.) 2 Department of Industrial Engineering, University of Naples Federico II, Via Claudio, 21, 80125 Naples, Italy; [email protected] (E.B.); [email protected] (C.B.) * Correspondence: [email protected] Received: 13 February 2020; Accepted: 4 March 2020; Published: 7 March 2020 Abstract: A proper design of the mooring systems for Wave Energy Converters (WECs) requires an accurate investigation of both operating and extreme wave conditions. A careful analysis of these systems is required to design a mooring configuration that ensures station keeping, reliability, maintainability, and low costs, without affecting the WEC dynamics. In this context, an experimental campaign on a 1:20 scaled prototype of the ISWEC (Inertial Sea Wave Energy Converter), focusing on the influence of the mooring layout on loads in extreme wave conditions, is presented and discussed. Two mooring configurations composed of multiple slack catenaries with sub-surface buoys, with or without clump-weights, have been designed and investigated experimentally. Tests in regular, irregular, and extreme waves for a moored model of the ISWEC device have been performed at the University of Naples Federico II. The aim is to identify a mooring solution that could guarantee both correct operation of the device and load carrying in extreme sea conditions. Pitch motion and loads in the rotational joint have been considered as indicators of the device hydrodynamic behavior and mooring configuration impact on the WEC. Keywords: mooring system; wave energy converter; experimental campaign; floating WEC mooring design; operating conditions; extreme conditions 1. Introduction Although mooring technologies employed for Wave Energy Converters are based on the offshore Oil&Gas industry experience and solutions [1], the marine energy sector presents specific requirements and several additional challenges [2]. Each wave energy device requires a specific design study for the mooring system, which is influenced by its energy extraction method, determining the most suitable solution [3]. As highlighted in [4,5], wave energy converters are commonly designed and studied by numerical models previously used in the offshore engineering industry. As stated by [6], the main advantages of the numerical simulations over the experimental tests of real WEC prototypes are the significant costs and time reduction during the conceptual design stage. However, there is a drawback in accuracy of the computationally cheap numerical methods due to the assumption of linear phenomena, assuming small amplitude of the dynamic response of floater in low steepness waves, static wetted surface, and linearized free surface boundary conditions. In this regard, when developing a WEC, it is fundamental to rely on experimental analyses, theoretical studies, and experience obtained from real prototype function in the open sea. In particular, the mooring system is considered a vital J. Mar. Sci. Eng. 2020, 8, 180; doi:10.3390/jmse8030180 www.mdpi.com/journal/jmse
-
Upload
khangminh22 -
Category
Documents
-
view
0 -
download
0
Transcript of Experimental Investigation of the Mooring System of a Wave ...
Journal of
Marine Science and Engineering
Article
Experimental Investigation of the Mooring System ofa Wave Energy Converter in Operating and ExtremeWave Conditions
Sergej Antonello Sirigu 1,* , Mauro Bonfanti 1 , Ermina Begovic 2 , Carlo Bertorello 2 ,Panagiotis Dafnakis 1 , Giuseppe Giorgi 1 , Giovanni Bracco 1 and Giuliana Mattiazzo 1
1 Department of Mechanical and Aerospace Engineering, Polytechnic of Turin, C.so Duca degli Abruzzi, 24,10129 Turin, Italy; [email protected] (M.B.); [email protected] (P.D.);[email protected] (G.G.); [email protected] (G.B.); [email protected] (G.M.)
2 Department of Industrial Engineering, University of Naples Federico II, Via Claudio, 21, 80125 Naples, Italy;[email protected] (E.B.); [email protected] (C.B.)
* Correspondence: [email protected]
Received: 13 February 2020; Accepted: 4 March 2020; Published: 7 March 2020�����������������
Abstract: A proper design of the mooring systems for Wave Energy Converters (WECs) requiresan accurate investigation of both operating and extreme wave conditions. A careful analysis ofthese systems is required to design a mooring configuration that ensures station keeping, reliability,maintainability, and low costs, without affecting the WEC dynamics. In this context, an experimentalcampaign on a 1:20 scaled prototype of the ISWEC (Inertial Sea Wave Energy Converter), focusing onthe influence of the mooring layout on loads in extreme wave conditions, is presented and discussed.Two mooring configurations composed of multiple slack catenaries with sub-surface buoys, withor without clump-weights, have been designed and investigated experimentally. Tests in regular,irregular, and extreme waves for a moored model of the ISWEC device have been performed at theUniversity of Naples Federico II. The aim is to identify a mooring solution that could guarantee bothcorrect operation of the device and load carrying in extreme sea conditions. Pitch motion and loadsin the rotational joint have been considered as indicators of the device hydrodynamic behavior andmooring configuration impact on the WEC.
Keywords: mooring system; wave energy converter; experimental campaign; floating WEC mooringdesign; operating conditions; extreme conditions
1. Introduction
Although mooring technologies employed for Wave Energy Converters are based on the offshoreOil&Gas industry experience and solutions [1], the marine energy sector presents specific requirementsand several additional challenges [2]. Each wave energy device requires a specific design study for themooring system, which is influenced by its energy extraction method, determining the most suitablesolution [3]. As highlighted in [4,5], wave energy converters are commonly designed and studiedby numerical models previously used in the offshore engineering industry. As stated by [6], themain advantages of the numerical simulations over the experimental tests of real WEC prototypesare the significant costs and time reduction during the conceptual design stage. However, there is adrawback in accuracy of the computationally cheap numerical methods due to the assumption of linearphenomena, assuming small amplitude of the dynamic response of floater in low steepness waves,static wetted surface, and linearized free surface boundary conditions. In this regard, when developinga WEC, it is fundamental to rely on experimental analyses, theoretical studies, and experience obtainedfrom real prototype function in the open sea. In particular, the mooring system is considered a vital
J. Mar. Sci. Eng. 2020, 8, 180; doi:10.3390/jmse8030180 www.mdpi.com/journal/jmse
J. Mar. Sci. Eng. 2020, 8, 180 2 of 31
part of a WEC design because it influences the dynamics of the device and accounts for a significantproportion of the project’s overall capital cost [7].
The design phase and survivability analyses of a WEC crucially require accurate numericalmodeling, in synergy with the experimental investigation of the hydrodynamic loads acting on thedevice [8]. In [9], the experimental results of a 1:20 model scale of oscillating water column (OWC),installed as a prototype in Galway Bay, are reported. The device was tested with three differentmooring chain lengths in regular and irregular waves, corresponding to the accidental limit state(ALS) and to extreme conditions. The authors reported that the stiff mooring configuration (theshortest chain length) might be preferable for both the limitation of the drift and of the force onthe chain/rope in the severe wave conditions. An experimental investigation on the behavior of ataut-mooring system of a floating WEC can be found in [10]. The mooring system was designedso that its extension was insufficient to fully accommodate the waves under consideration, hencegenerating extreme loads in the mooring line and anchor. Such extreme loads, generated by focusedwave, represent a worst-case scenario, which such experiments purported to investigate. Importantconclusions of this work are that the wave steepness has only a minor effect on the magnitude of theinitial snatch loads; on the other hand, for a dynamically responding floating body, mooring loads aredependent on the displacement history. Furthermore, a single focused wave cannot be used to obtainan accurate assessment of extreme mooring loads. An experimental study of the benefits and theimpacts that different mooring concepts might have on point absorbers can be found in [11]. Authorstested three different configurations: (i) compact (small seabed footprint) configuration consisting ofa synthetic cable and a floater; (ii) a compact configuration composed of a synthetic cable, a floaterand a clump-weight in a zig–zag geometry; and (iii) a catenary, as the industry standard solution. Inparticular, the configuration with a floater and a clump weight had a slightly worse performance thanthe one with only the floater, as far as power extraction is concerned. However, configuration (ii) wasthe best at keeping the cables under tension while minimizing the dynamic tension. Moreover, theconfiguration with a floater and a clump-weight had the smallest impact on the natural period of thepitch mode of motion. An experimental research on a 1:25 scaled floating OWC WEC model can befound in [12]. Two types of mooring materials were considered: an iron chain and a nylon rope havebeen used, investigating their influence on the tension in mooring lines. Authors concluded that thesoft nylon rope can introduce significantly larger surge motion; for the iron chain configuration, noshock loads were observed in the tested wave conditions.
In this paper, the experimental testing campaign of the 1:20 model scale of ISWEC (InertialSea Wave Energy Converter) prototype and its specifically designed mooring layout is presented.ISWEC is a floating device developed in Polytechnic of Turin, Italy. The device converts the energyof the incoming wave through a gyroscopic unit working in resonant conditions with the sea state.The power extraction performance is directly linked to the pitch motion of the floater [13]. In thisregard, the design of the ISWEC mooring system should not affect the pitching motion in operationalconditions, and it has to guarantee the station keeping in extreme wave conditions. This paper focuseson the design of two mooring configurations and the experimental investigation of their influenceon the hydrodynamic performances of the ISWEC device. A slack mooring layout based on chainlines is presented, and the effect of introducing clump weights on the mooring lines is evaluated. Theproposed mooring systems were designed to have lower mooring loads impact during the operationalsea state conditions and to guarantee the survivability of the device in extreme sea state conditions.
Although slack mooring systems with submerged buoys and clump weights are common in thetraditional ocean engineering field, wave energy applications require a different design in order towithstand extreme loads while guaranteeing efficient operation and power absorption. Slack mooringsfor wave energy applications are mainly used for axisymmetric buoys working as point absorbers,extracting energy from the heave motion, such as [8,14]. However, thanks to their geometricalsymmetry and working principle, such devices are insensitive to the wave direction. The consequenceon the mooring system design is that lines are directly attached to the buoy. Conversely, the ISWEC

J. Mar. Sci. Eng. 2020, 8, 180 3 of 31
belongs to the class of pitching platforms and needs to self-align to the main wave direction in order toguarantee efficient operation. However, examples of pitching floating platform WECs are scarce [15,16],compared to more common technologies [17–19]. Therefore, this paper provides a valuable descriptionof a technological solution for passive weathervaning that also guarantees limited influence on theimportant dynamics for power extraction of a WEC of the pitching platform class. An experimentalcampaign in regular, irregular, and extreme wave conditions was performed in the towing tank of theDepartment of Industrial Engineering at University of Naples Federico II, Italy. Pitch motion and loadsin the rotational joint have been analyzed as the indicators of the device’s hydrodynamic behavior andmooring configuration effect on the WEC.
2. Mooring Solutions for Floating WECs
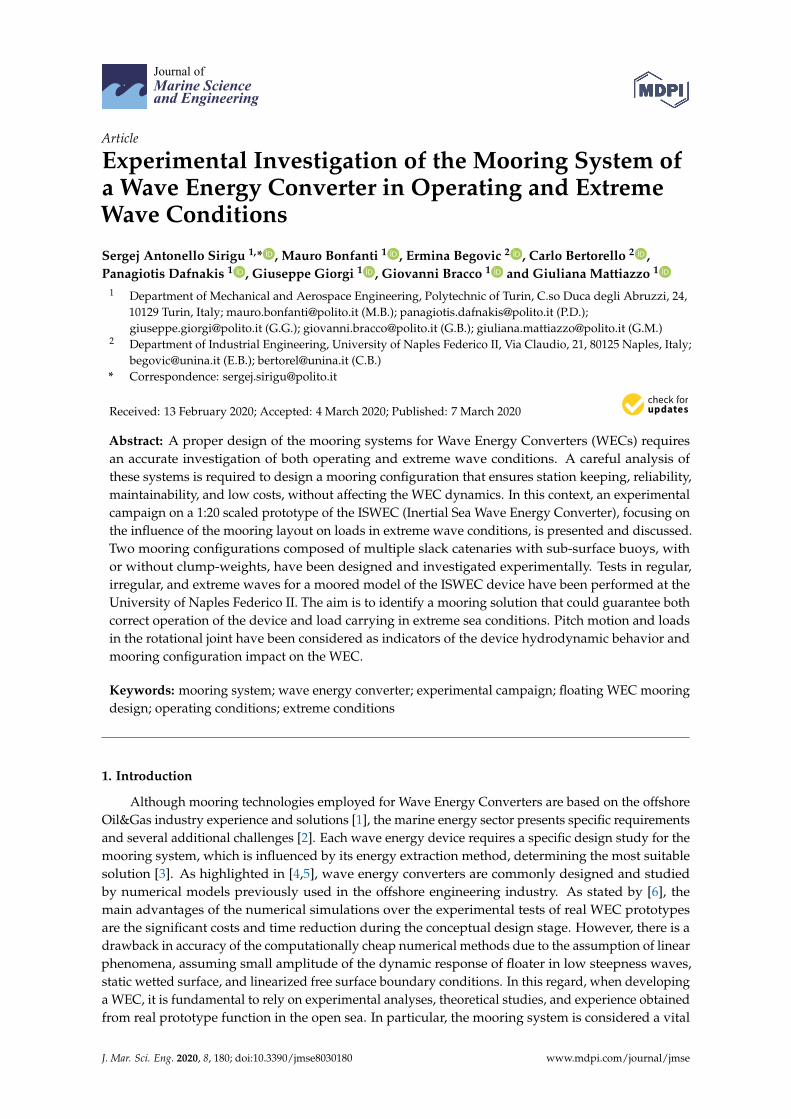
Mooring systems are constituted by different components, generally composed of anchors,mooring lines, buoys, clump-weights, and connectors. A first distinction can be made betweenslack and taut mooring systems. On the one hand, slack-moored configurations are typically basedon catenary dispositions and mainly rely on the gravity force of the mooring lines to provide thenecessary horizontal and vertical restoring forces. On the other hand, the restoring capabilities of tautlines, usually composed of either steel wire or synthetic ropes, are based on the axial stiffness of thelines and need to be pre-tensioned before their operation. Taut mooring systems, although having theadvantage of a small footprint, determine a high stiffness that is likely to affect negatively the motionof wave energy devices [20,21]. Furthermore, they require very expensive foundations, as verticallyloaded piled anchors [22]. The main mooring system configurations suitable for floating WECs arereported in Figure 1 [23–26]:
• Single Catenary (a): It is the simplest and least expensive configuration. It belongs to the singlepoint mooring systems and its geometry provides a high compliance, resulting in possible largemotions of the device and weather-vaning. The horizontal restoring force is provided only bythe weight of the chain. The high footprint and compliance are not suitable for arrays of WECsbecause collisions may occur. Moreover, no redundancy is present in the case of failure.
• Multi-catenary: this configuration allows the sharing of loads among different lines. Redundancyis provided and allowed motions are reduced by the geometry of the system. However, morecomponents are present, resulting in increased costs.
• CALM: In the Catenary Anchor Leg Mooring, a buoy is introduced close to the surface, minimizingthe influence on the vertical motions of the WEC. The upward force exerted by the buoyancyincreases the restoring capabilities of the system. This system guarantees larger motions withrespect to the multi-catenary, reducing the impedance and the damping related to the mooring.The device can weathervane around the buoy, but, on the other hand, being at the water surface,the buoy is subjected to current and wind loading. Likewise, in the multi-catenary system, morecomponents are present, resulting in higher costs.
• Lazy-wave: In this case, the buoy is submerged, and a clump-weight is introduced. This solutionprovides lower horizontal loads with respect to the CALM system because no taut lines arepresent. The geometric compliance of the system is thus increased.
Different combinations of the presented configurations can be used for the final design of amooring system, depending on the specific device of interest.
J. Mar. Sci. Eng. 2020, 8, 180 4 of 31
Figure 1. Mooring configurations: (a) catenary; (b) multi-catenary; (c) CALM; (d) lazy-wave.
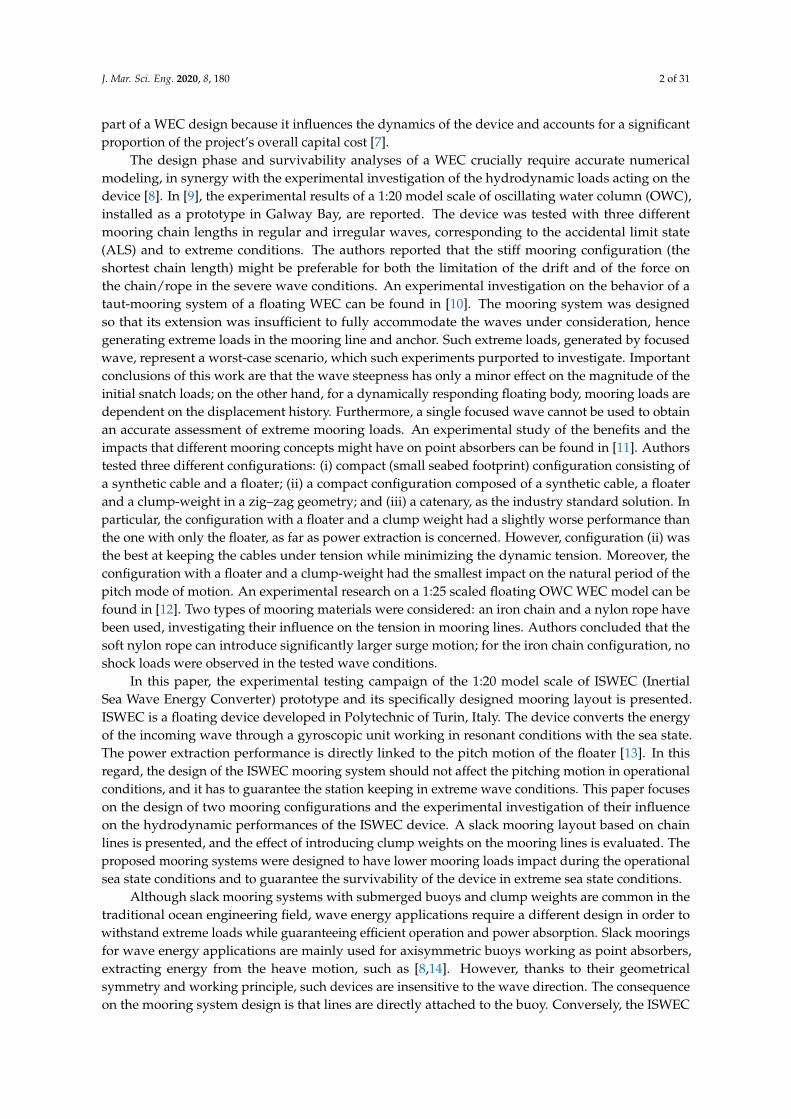
3. ISWEC Device
The first idea of the ISWEC (Inertial Sea Wave Energy Converter) device dates back to the 2006and has been developed at the Polytechnic of Turin, following different stages from virtual modeling toexperimental tests on scale models, as described in [27]. ISWEC is a fully-enclosed floating gyroscopicWEC, especially designed for the Mediterranean Sea [28–31]. The device presented in this paper is the1 Degree-of-Freedom (DoF) ISWEC, a directional device brought from concept to full scale prototypingin Pantelleria in August 2015 [32]. This floating device is considered as a case study for the analysis ofthe mooring system presented in this work.
3.1. ISWEC Device
ISWEC is a floating wave energy converter designed to exploit wave energy through thegyroscopic effect of a flywheel [33]. The gyroscopic power take-off (PTO) system is enclosed ina sealed hull [34], retained by slack mooring lines anchored on the seabed. A schematic representationof the device concept is shown in Figure 2. The pitching motion of the floater δ induces a precessionoscillation ε of the gyroscope. Extraction of energy from the system is achieved by damping theprecession of the gyroscope. The PTO is an electrical torque generator connected to the gyroscopesupport frame through a gearbox with a gear ratio 1/10. The maximum energy extraction rate isobtained by properly tuning the flywheel spinning speed with the incoming sea state and controllingthe PTO torque [35].
The 3D representation of the deployed device is shown in Figure 2, highlighting the relevantsubsystems: the Floater, Ballasts in order to tune the natural frequency of the device with respect to areference/base sea state, and two Gyroscopes. The gyroscope is composed of a spinning Flywheel,driven by the Flywheel motor and supported by a Support structure that allow the flywheel to rotatearound both the vertical axis (z1) and the precession axis (ε). The power extraction is performed by anElectrical generator coupled with the precession axis of the gyroscope.
The derivation of the dynamic model equations for the complete system (hydrodynamics of thehull and PTO equations) is not in the scope of this work and details can be found in [36]. Furthermore,an accurate description of the internal components of the full-scale device and a more detaileddiscussion on the hull design can be found in [37].

J. Mar. Sci. Eng. 2020, 8, 180 5 of 31
Figure 2. ISWEC full-scale configuration and internal components (left); ISWEC gyroscope (right).
3.2. ISWEC Mooring System
Based on the ISWEC working principle, the mooring system must guarantee the followingrequirements:
• Station keeping: the device must be maintained within the specified devoted area.• Electrical cable safeguard: the motion of the device must avoid tension loads in the electrical
transmission cable.• Compliance: to sustain the environmental loads on the device, the mooring lines and the anchors
must comply with the classification and regulations imposed by ruling authorities.• Passive behavior: the mooring system must minimize the disturbance on the device motion
appointed to the power conversion chain (i.e., pitch motion). On the contrary, the horizontalmotions need to be constrained, limiting the device drift to ensure station keeping.
• Weathervaning: the ISWEC device should always orientate towards the incident wave, to exploitits pitch motion.: the area dedicated to a single device should be minimized, easing a futureinstallation in an array configuration.
• Reduced maintenance: when possible, the use of high durability component is preferred, tominimize maintenance operations over the service life.
• Redundancy: a degree of redundancy is desirable, according to an appropriate cost analysis.
Referring to the different mooring configurations suitable for floating WECs described Section 2,the attention is focused on slack mooring solutions because the ISWEC device of interest has a PTOenclosed in the floater and active moorings are not suitable. Moreover, the mooring forces shouldnot interfere with the pitching motion in operation conditions, since the pitch amplitude of motion isproportional to the harvested power.
The ISWEC mooring system is a slack catenary type—Single Anchor Leg Mooring (SALM)composed of multiple mooring lines. In order to guarantee the weather-vaning of the device in respectto the wave direction, a proper center of rotation of the system needs to be designed. Moreover,the ISWEC has to be connected to the electrical grid with a power transmission connection. The electriccable must move together with the hull, both to avoid the interference between the cable and themooring lines and to guarantee the correct operation. In this regard, an electrical slip ring andmechanical swivel have been chosen.
DNV standards [38] recommend multiple catenary lines, anchored to the bottom of the sea andconnected to the center of the circumference through a mechanical swivel that allows the rotation ofthe top of the system. The joint includes also an electric slip ring able to transmit power. The ISWEChull is connected to the swivel by means of two bridles that prevent the roll motion of the device.

J. Mar. Sci. Eng. 2020, 8, 180 6 of 31
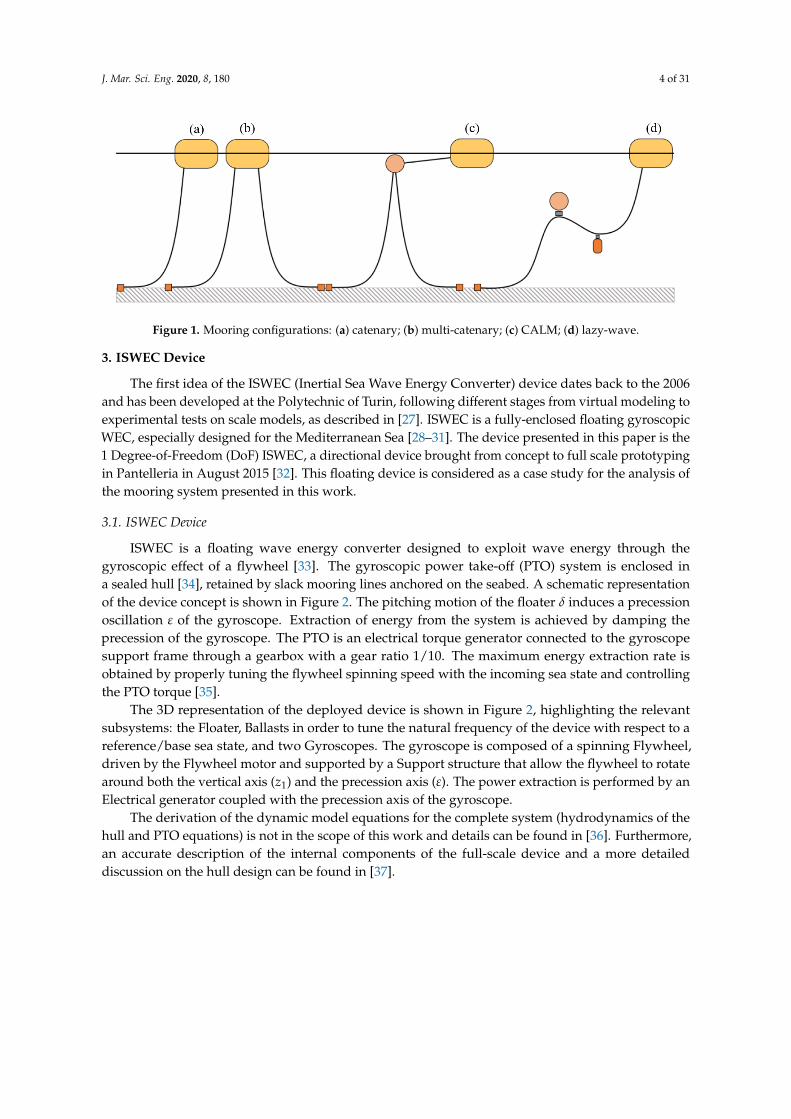
The mooring connection points are placed towards the bow, with respect to the center of gravity ofthe device, in order to guarantee a lever arm that stabilizes the device at yaw and guarantees thealignment. On each of the bottom catenary, a sub-surface buoy is installed to enhance the elastic recallof the system and avoid snatches. As shown in Figure 3, two different mooring systems are considered.The main difference between the configurations C1 and C2 is the existence of a clump weight in eachmooring line of layout C2. The purpose of the specific alteration is to increase the mooring stiffness.Figure 4 presents the top view of configuration C2.
The cable is connected to the hull deck by a waterproof connector and steered to the slip ring.At the bottom of the slip ring, the submarine cable is attached. The cable is then connected to the gridsubmarine cable with a second waterproof connector. The most critical component is the rotating joint,where both electrical and mechanical functions are integrated, which connects the upper and lowerparts of the mooring system. It follows that, for the ISWEC mooring system, the loads sustained by thejoint are of major concern.
Figure 3. ISWEC mooring layouts: (a) C1; (b) C2.
J. Mar. Sci. Eng. 2020, 8, 180 7 of 31
Figure 4. ISWEC mooring layout C2, top view.
4. ISWEC Moored Device Experimental Campaign
The first experimental campaign in regular waves have been performed on the free model [31,39].This work started from the known pitch Response Amplitude Operator (RAO) and evaluates theperformance of the ISWEC mooring configurations, in both operational and extreme wave conditions.The experimental campaign was performed in the towing tank of the University of Naples Federico II,Italy. Furthermore, the effect of the introduction of clump weights (to reduce the loads on the rotatingjoint) on the hydrodynamic performance of the device has been evaluated.
4.1. Experimental Setup
This section deals with a brief description of the experimental setup of the scaled prototype.A summary of the main characteristics of the device, mooring configurations, acquisition system, andthe test tank facility are reported.
The 1:20 ISWEC Physical Model
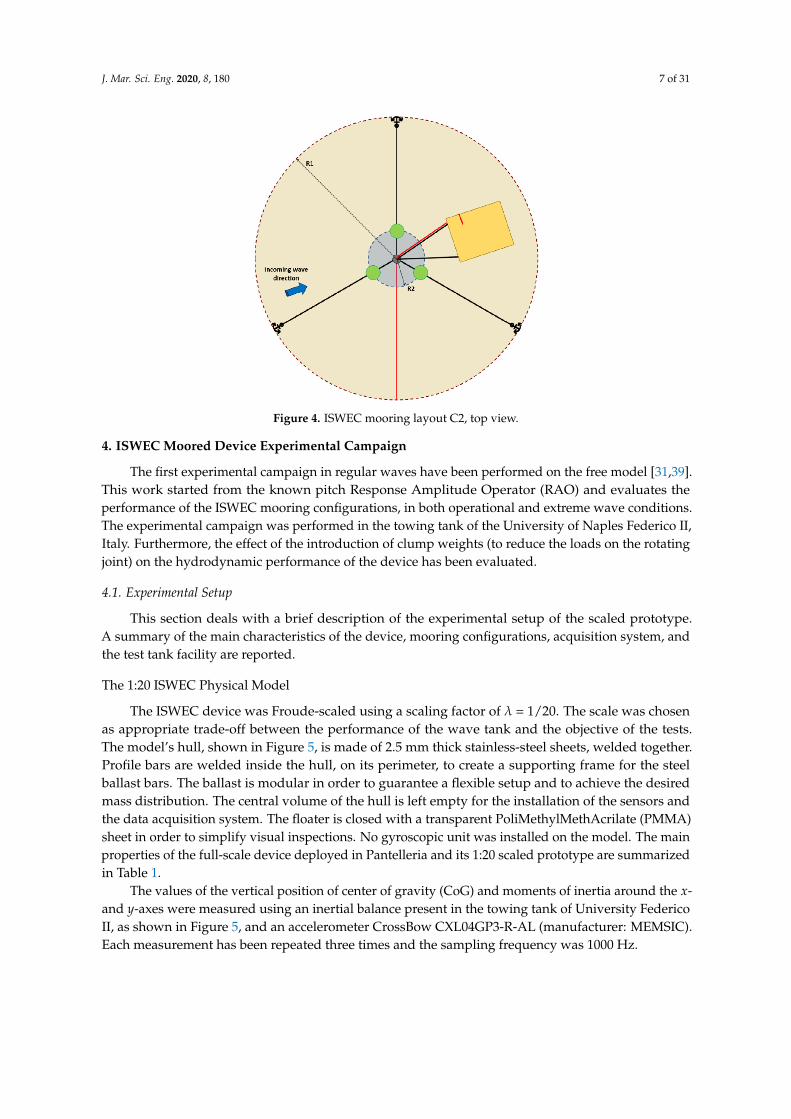
The ISWEC device was Froude-scaled using a scaling factor of λ = 1/20. The scale was chosenas appropriate trade-off between the performance of the wave tank and the objective of the tests.The model’s hull, shown in Figure 5, is made of 2.5 mm thick stainless-steel sheets, welded together.Profile bars are welded inside the hull, on its perimeter, to create a supporting frame for the steelballast bars. The ballast is modular in order to guarantee a flexible setup and to achieve the desiredmass distribution. The central volume of the hull is left empty for the installation of the sensors andthe data acquisition system. The floater is closed with a transparent PoliMethylMethAcrilate (PMMA)sheet in order to simplify visual inspections. No gyroscopic unit was installed on the model. The mainproperties of the full-scale device deployed in Pantelleria and its 1:20 scaled prototype are summarizedin Table 1.
The values of the vertical position of center of gravity (CoG) and moments of inertia around the x-and y-axes were measured using an inertial balance present in the towing tank of University FedericoII, as shown in Figure 5, and an accelerometer CrossBow CXL04GP3-R-AL (manufacturer: MEMSIC).Each measurement has been repeated three times and the sampling frequency was 1000 Hz.

J. Mar. Sci. Eng. 2020, 8, 180 8 of 31
Figure 5. ISWEC center of gravity and moments of inertia and measurement through the inertialbalance.
Table 1. ISWEC full-scale and scaled prototype properties.
Parameter Symbol Full Scale ModelScaled Model- ExperimentalTARGET Model
Length (m) L 15.3 0.767 0.767Beam (m) B 8 0.400 0.400Draft (m) T 3 0.150 0.150Height (m) D 4.5 0.225 0.225Mass (kg) M 288,090 35.13 35.16Vertical position of CoG from the bottom (m) VCG 2.43 0.122 0.120Roll moment of inertia (kgm2) Ixx 1,923,000 0.586 0.775Pitch moment of inertia (kgm2) Iyy 8,486,000 2.587 2.513Roll radi of inertia (m) rxx 2.584 0.129 0.149Pitch moment of inertia (kgm2) ryy 5.427 0.271 0.267
It can be noted that the obtained values for radius and moment of inertia in pitch were reproducedwithin 1.5% and 2.9% difference, respectively. The obtained values for the roll radius and momentof inertia, although reproduced within 7.2 and 15% difference, have been considered acceptable.The difference is mainly due to the position, weight, and dimensions of the measurement equipmentinstalled on board, which are necessary for data acquisition.
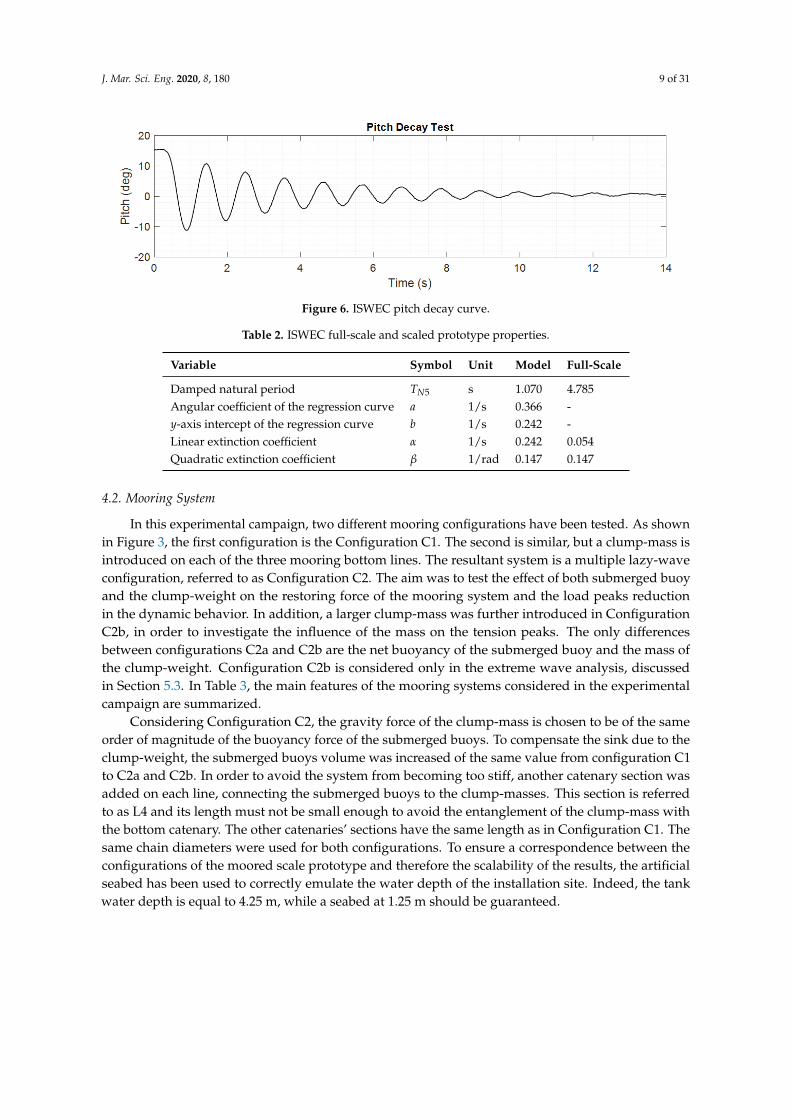
Free decay tests were conducted to identify the natural period in the pitch DoF. The objective isthe calculation of the damped natural frequency and the identification of linear and quadratic dampingof the model, via logarithmic decrease analysis. The methodology used in [40,41] has been chosen asthe most effective in this study. Pitch free decay tests were carried out on the free model applyingmanually an inclination angle with respect to the transverse or longitudinal axis of the hull. Afterreleasing the body, its dynamic response was recorded. Pitch decays have been repeated few times,covering a range of initial angles from 5 to 15 degrees. An example of free decay from 15 deg is shownin Figure 6. The complete set of results for pitch decay is reported in Table 2.
J. Mar. Sci. Eng. 2020, 8, 180 9 of 31
Figure 6. ISWEC pitch decay curve.
Table 2. ISWEC full-scale and scaled prototype properties.
Variable Symbol Unit Model Full-Scale
Damped natural period TN5 s 1.070 4.785Angular coefficient of the regression curve a 1/s 0.366 -y-axis intercept of the regression curve b 1/s 0.242 -Linear extinction coefficient α 1/s 0.242 0.054Quadratic extinction coefficient β 1/rad 0.147 0.147
4.2. Mooring System
In this experimental campaign, two different mooring configurations have been tested. As shownin Figure 3, the first configuration is the Configuration C1. The second is similar, but a clump-mass isintroduced on each of the three mooring bottom lines. The resultant system is a multiple lazy-waveconfiguration, referred to as Configuration C2. The aim was to test the effect of both submerged buoyand the clump-weight on the restoring force of the mooring system and the load peaks reductionin the dynamic behavior. In addition, a larger clump-mass was further introduced in ConfigurationC2b, in order to investigate the influence of the mass on the tension peaks. The only differencesbetween configurations C2a and C2b are the net buoyancy of the submerged buoy and the mass ofthe clump-weight. Configuration C2b is considered only in the extreme wave analysis, discussedin Section 5.3. In Table 3, the main features of the mooring systems considered in the experimentalcampaign are summarized.
Considering Configuration C2, the gravity force of the clump-mass is chosen to be of the sameorder of magnitude of the buoyancy force of the submerged buoys. To compensate the sink due to theclump-weight, the submerged buoys volume was increased of the same value from configuration C1to C2a and C2b. In order to avoid the system from becoming too stiff, another catenary section wasadded on each line, connecting the submerged buoys to the clump-masses. This section is referredto as L4 and its length must not be small enough to avoid the entanglement of the clump-mass withthe bottom catenary. The other catenaries’ sections have the same length as in Configuration C1. Thesame chain diameters were used for both configurations. To ensure a correspondence between theconfigurations of the moored scale prototype and therefore the scalability of the results, the artificialseabed has been used to correctly emulate the water depth of the installation site. Indeed, the tankwater depth is equal to 4.25 m, while a seabed at 1.25 m should be guaranteed.
J. Mar. Sci. Eng. 2020, 8, 180 10 of 31
Table 3. ISWEC mooring system properties, Configuration C1 and C2.
Configuration C1 Configuration C2a Configuration C2bFull-Scale Model Full-Scale Model Full-Scale Model
Property Units Geometry
Water depth m 25 1.25 25 1.25 25 1.25Anchors Positioning radius m 60 3 60 3 60 3L1 m 65 3.25 65 3.25 65 3.25L2 m 10 0.5 10 0.5 10 0.5L3 m 10 0.5 10 0.5 10 0.5L4 m - - 5 0.25 5 0.25
Property Units Chain properties for bottom mooring lines (L1, L2, and L4)
Nominal Diameter mm 60 3 60 3 60 3Mass per unit length kg/m 74.4 0.186 74.4 0.186 74.4 0.186Mass per unit length in water kg/m 68.8 0.172 68.8 0.172 68.8 0.172Proof Load N 1,940,103 243 1,940,103 243 1,940,103 243Breaking Load N 2,770,103 346 2,770,103 346 2,770,103 346
Property Units Chain properties for top mooring lines (L3)
Nominal Diameter mm 44 2.2 44 2.2 44 2.2Mass per unit length kg/m 36 0.09 36 0.09 36 0.09Mass per unit length in water kg/m 32 0.08 32 0.08 32 0.08Proof Load N 1,080,103 135 1,080,103 135 1,080,103 135Breaking Load N 1,540,103 193 1,540,103 193 1,540,103 193
Property Units Submerged buoy and clump mass properties
Net buoyancy kg 1512 0.189 3512 0.439 7042 0.878Clump mass kg - - 2000 0.25 4000 0.5
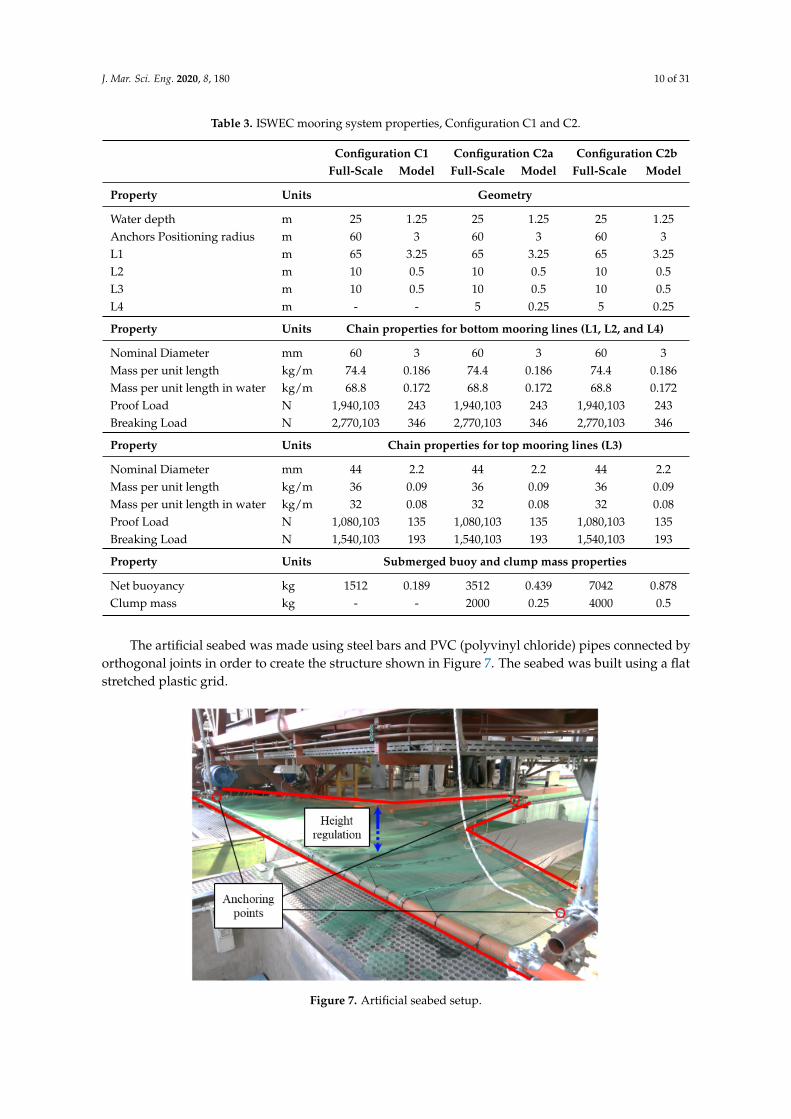
The artificial seabed was made using steel bars and PVC (polyvinyl chloride) pipes connected byorthogonal joints in order to create the structure shown in Figure 7. The seabed was built using a flatstretched plastic grid.
Figure 7. Artificial seabed setup.
J. Mar. Sci. Eng. 2020, 8, 180 11 of 31
Acquisition Systems and Data Management
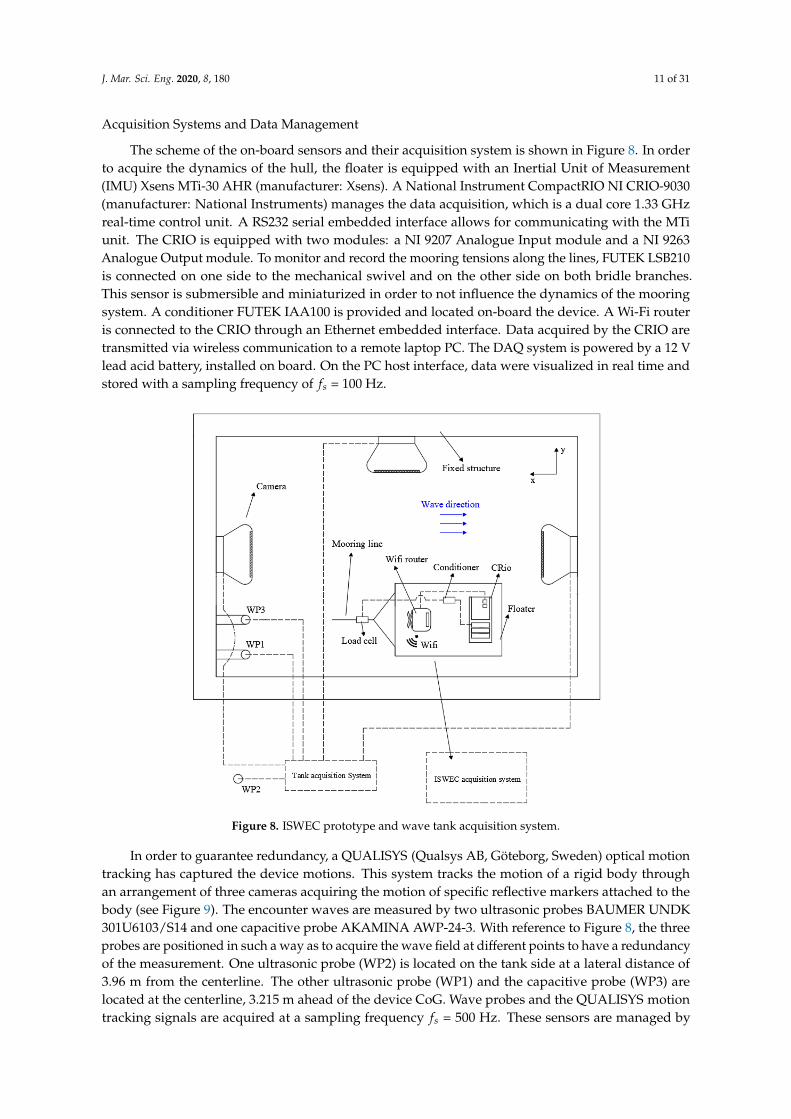
The scheme of the on-board sensors and their acquisition system is shown in Figure 8. In orderto acquire the dynamics of the hull, the floater is equipped with an Inertial Unit of Measurement(IMU) Xsens MTi-30 AHR (manufacturer: Xsens). A National Instrument CompactRIO NI CRIO-9030(manufacturer: National Instruments) manages the data acquisition, which is a dual core 1.33 GHzreal-time control unit. A RS232 serial embedded interface allows for communicating with the MTiunit. The CRIO is equipped with two modules: a NI 9207 Analogue Input module and a NI 9263Analogue Output module. To monitor and record the mooring tensions along the lines, FUTEK LSB210is connected on one side to the mechanical swivel and on the other side on both bridle branches.This sensor is submersible and miniaturized in order to not influence the dynamics of the mooringsystem. A conditioner FUTEK IAA100 is provided and located on-board the device. A Wi-Fi routeris connected to the CRIO through an Ethernet embedded interface. Data acquired by the CRIO aretransmitted via wireless communication to a remote laptop PC. The DAQ system is powered by a 12 Vlead acid battery, installed on board. On the PC host interface, data were visualized in real time andstored with a sampling frequency of fs = 100 Hz.
Figure 8. ISWEC prototype and wave tank acquisition system.
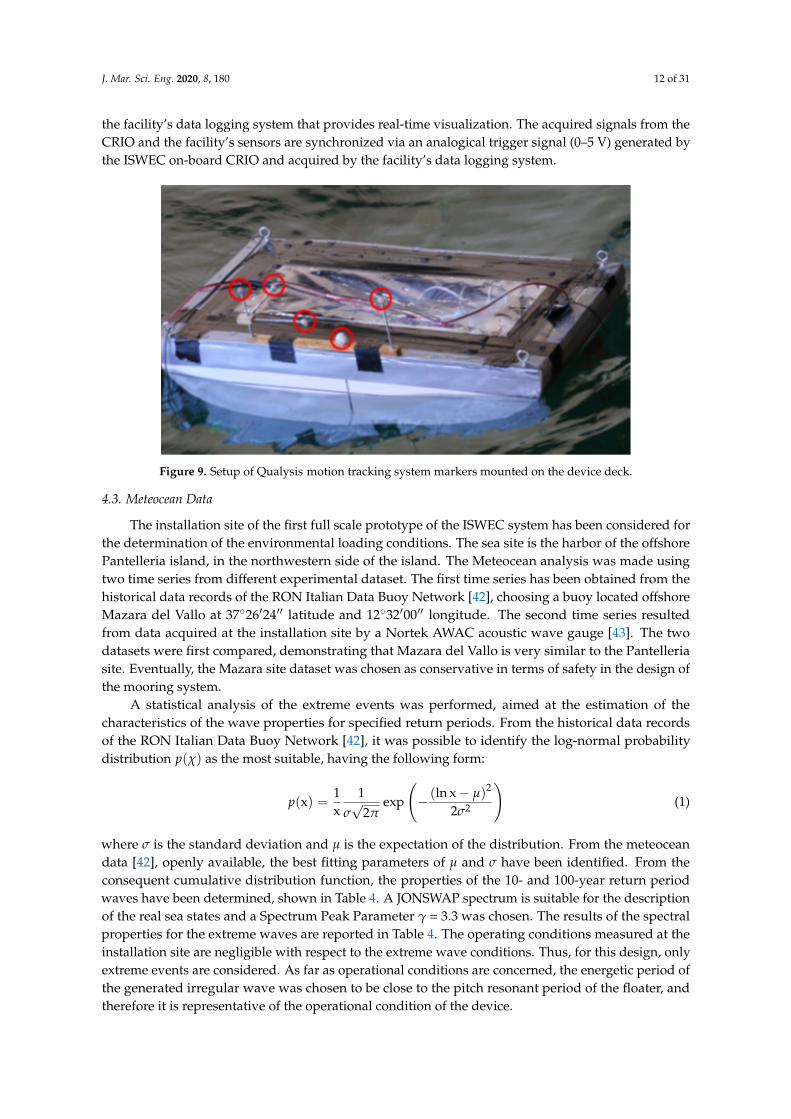
In order to guarantee redundancy, a QUALISYS (Qualsys AB, Göteborg, Sweden) optical motiontracking has captured the device motions. This system tracks the motion of a rigid body throughan arrangement of three cameras acquiring the motion of specific reflective markers attached to thebody (see Figure 9). The encounter waves are measured by two ultrasonic probes BAUMER UNDK301U6103/S14 and one capacitive probe AKAMINA AWP-24-3. With reference to Figure 8, the threeprobes are positioned in such a way as to acquire the wave field at different points to have a redundancyof the measurement. One ultrasonic probe (WP2) is located on the tank side at a lateral distance of3.96 m from the centerline. The other ultrasonic probe (WP1) and the capacitive probe (WP3) arelocated at the centerline, 3.215 m ahead of the device CoG. Wave probes and the QUALISYS motiontracking signals are acquired at a sampling frequency fs = 500 Hz. These sensors are managed by
J. Mar. Sci. Eng. 2020, 8, 180 12 of 31
the facility’s data logging system that provides real-time visualization. The acquired signals from theCRIO and the facility’s sensors are synchronized via an analogical trigger signal (0–5 V) generated bythe ISWEC on-board CRIO and acquired by the facility’s data logging system.
Figure 9. Setup of Qualysis motion tracking system markers mounted on the device deck.
4.3. Meteocean Data
The installation site of the first full scale prototype of the ISWEC system has been considered forthe determination of the environmental loading conditions. The sea site is the harbor of the offshorePantelleria island, in the northwestern side of the island. The Meteocean analysis was made usingtwo time series from different experimental dataset. The first time series has been obtained from thehistorical data records of the RON Italian Data Buoy Network [42], choosing a buoy located offshoreMazara del Vallo at 37◦26′24′′ latitude and 12◦32′00′′ longitude. The second time series resultedfrom data acquired at the installation site by a Nortek AWAC acoustic wave gauge [43]. The twodatasets were first compared, demonstrating that Mazara del Vallo is very similar to the Pantelleriasite. Eventually, the Mazara site dataset was chosen as conservative in terms of safety in the design ofthe mooring system.
A statistical analysis of the extreme events was performed, aimed at the estimation of thecharacteristics of the wave properties for specified return periods. From the historical data recordsof the RON Italian Data Buoy Network [42], it was possible to identify the log-normal probabilitydistribution p(χ) as the most suitable, having the following form:
p(x) =1x
1σ√
2πexp
(− (ln x− µ)2
2σ2
)(1)
where σ is the standard deviation and µ is the expectation of the distribution. From the meteoceandata [42], openly available, the best fitting parameters of µ and σ have been identified. From theconsequent cumulative distribution function, the properties of the 10- and 100-year return periodwaves have been determined, shown in Table 4. A JONSWAP spectrum is suitable for the descriptionof the real sea states and a Spectrum Peak Parameter γ = 3.3 was chosen. The results of the spectralproperties for the extreme waves are reported in Table 4. The operating conditions measured at theinstallation site are negligible with respect to the extreme wave conditions. Thus, for this design, onlyextreme events are considered. As far as operational conditions are concerned, the energetic period ofthe generated irregular wave was chosen to be close to the pitch resonant period of the floater, andtherefore it is representative of the operational condition of the device.
J. Mar. Sci. Eng. 2020, 8, 180 13 of 31
Table 4. Meteocean reference data.
Wave Name Hs (m) Tp (s) γ
Operational wave 2.20 5.41 3.310-year wave 5.00 8.70 3.3100-year wave 5.90 10.30 3.3
4.4. Experimental Tests
All the experimental tests were performed at the towing tank (136.74 m long, 9 m wide, and4.25 m deep) of the Department of Industrial Engineering of the University Federico II, Naples, Italy.The complete experimental campaign consists of (i) pull-out tests to identify the static characteristicsof the mooring system, (ii) regular and (iii) irregular waves analysis to compare the hydrodynamicperformances of the floater with the different mooring configurations, and (iv) extreme waves tests toassess the mooring loads in survival wave conditions. All tests were performed by scaling down thewaves according to Froude-scale, using a scale factor λ of 1/20, with reference to the meteocean data.All wave tests are performed with the artificial bottom and the model placed in the middle of the tankat 60 m from the wave maker.
Experimental results are also compared with predictions according to numerical models.The potential flow-based boundary element method software, ANSYS AQWA, has been used, whichprovides first-order hydrodynamic excitation force, radiation added mass and damping, hydrostaticstiffness, and first- and second-order drift forces. Most importantly, thanks to a built-in package,mooring systems and environmental loads can be included in the mathematical model [23].
4.4.1. Pull-Out Tests
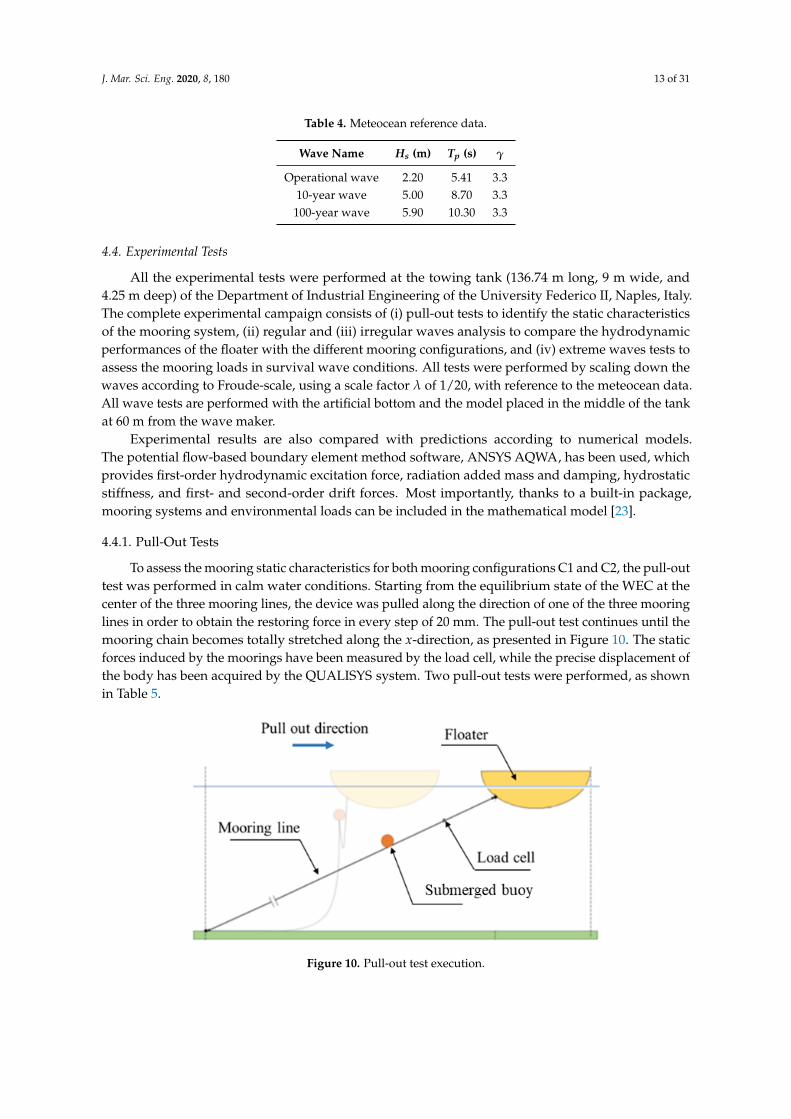
To assess the mooring static characteristics for both mooring configurations C1 and C2, the pull-outtest was performed in calm water conditions. Starting from the equilibrium state of the WEC at thecenter of the three mooring lines, the device was pulled along the direction of one of the three mooringlines in order to obtain the restoring force in every step of 20 mm. The pull-out test continues until themooring chain becomes totally stretched along the x-direction, as presented in Figure 10. The staticforces induced by the moorings have been measured by the load cell, while the precise displacement ofthe body has been acquired by the QUALISYS system. Two pull-out tests were performed, as shownin Table 5.
Figure 10. Pull-out test execution.
J. Mar. Sci. Eng. 2020, 8, 180 14 of 31
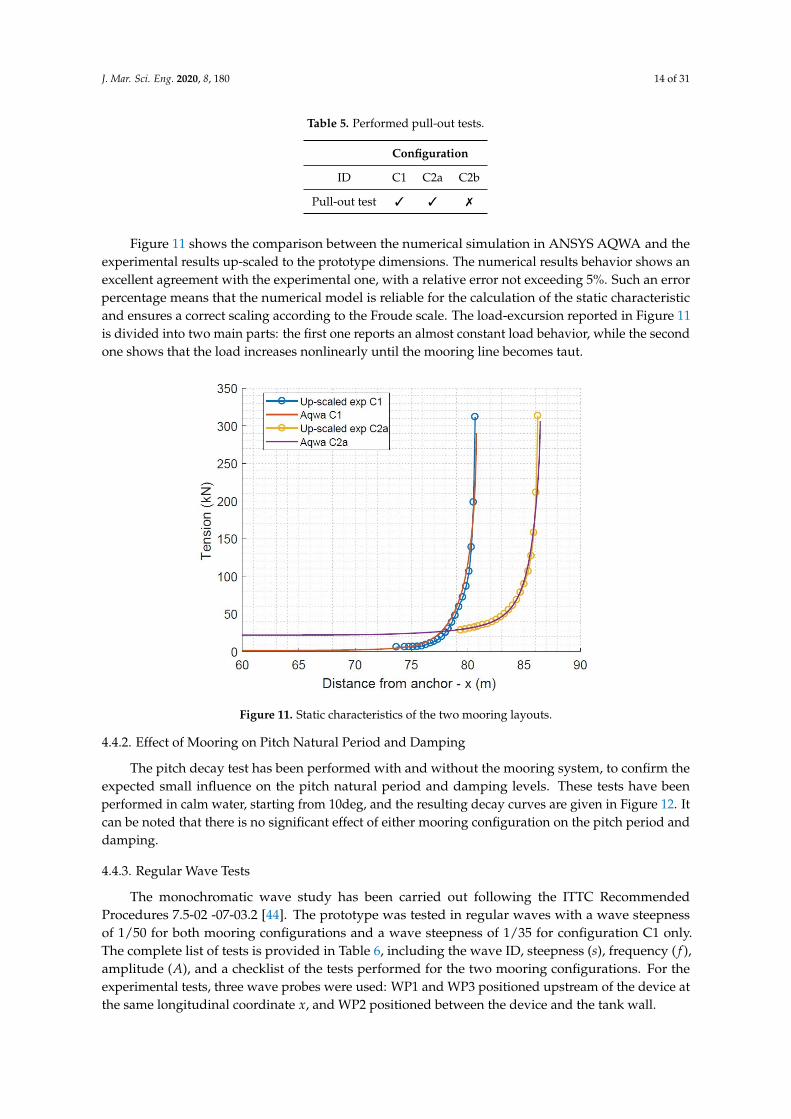
Table 5. Performed pull-out tests.
Configuration
ID C1 C2a C2b
Pull-out test 3 3 7
Figure 11 shows the comparison between the numerical simulation in ANSYS AQWA and theexperimental results up-scaled to the prototype dimensions. The numerical results behavior shows anexcellent agreement with the experimental one, with a relative error not exceeding 5%. Such an errorpercentage means that the numerical model is reliable for the calculation of the static characteristicand ensures a correct scaling according to the Froude scale. The load-excursion reported in Figure 11is divided into two main parts: the first one reports an almost constant load behavior, while the secondone shows that the load increases nonlinearly until the mooring line becomes taut.
Figure 11. Static characteristics of the two mooring layouts.
4.4.2. Effect of Mooring on Pitch Natural Period and Damping
The pitch decay test has been performed with and without the mooring system, to confirm theexpected small influence on the pitch natural period and damping levels. These tests have beenperformed in calm water, starting from 10deg, and the resulting decay curves are given in Figure 12. Itcan be noted that there is no significant effect of either mooring configuration on the pitch period anddamping.
4.4.3. Regular Wave Tests
The monochromatic wave study has been carried out following the ITTC RecommendedProcedures 7.5-02 -07-03.2 [44]. The prototype was tested in regular waves with a wave steepnessof 1/50 for both mooring configurations and a wave steepness of 1/35 for configuration C1 only.The complete list of tests is provided in Table 6, including the wave ID, steepness (s), frequency ( f ),amplitude (A), and a checklist of the tests performed for the two mooring configurations. For theexperimental tests, three wave probes were used: WP1 and WP3 positioned upstream of the device atthe same longitudinal coordinate x, and WP2 positioned between the device and the tank wall.

J. Mar. Sci. Eng. 2020, 8, 180 15 of 31
Figure 12. Pitch free decay experiments.
Table 6. Regular wave tests schedule.
Wave ID s f (Hz) A (mm) C1 C2a C2b
1a 1/50 1.250 10.00 3 3 7
2a 1/50 1.200 10.80 3 3 7
3a 1/50 1.118 12.50 3 3 7
4a 1/50 1.052 14.10 3 3 7
5a 1/50 0.994 15.80 3 3 7
6a 1/50 0.952 17.20 3 3 7
7a 1/50 0.894 19.50 3 3 7
8a 1/50 0.745 28.10 3 3 7
9a 1/50 0.639 38.20 3 3 7
10a 1/50 0.559 50.00 3 3 7
11a 1/50 0.497 63.20 3 7 7
12a 1/50 0.447 78.10 3 7 7
3b 1/35 1.198 17.83 3 7 7
5b 1/35 0.994 22.57 3 7 7
6b 1/35 0.952 24.59 3 7 7
7b 1/35 0.894 27.93 3 7 7
9b 1/35 0.639 54.63 3 7 7
4.4.4. Irregular Wave Tests
The irregular wave analysis has been performed according to the ITTC Recommended Procedures7.5-02 -07-03.14 [45]. The irregular wave was described by the JONSWAP spectrum and the energeticperiod of the generated irregular wave was chosen to be close to the pitch resonant period of the floater,and therefore it is representative of the operational condition of the device. The characteristics of thetested irregular wave are provided in Table 7.

J. Mar. Sci. Eng. 2020, 8, 180 16 of 31
Table 7. Irregular wave tests schedule.
Wave ID Hs Tp (s) γ C1 C2a C2b
Irr1 0.11 1.21 3.3 3 3 7
4.4.5. Extreme Wave Tests
According to the DNV (Det Norske Veritas Group) procedures for positioning mooring [38], twodifferent waves were considered to carry out the analyses of the mooring system in extreme waveconditions for the different mooring configurations: 100- and 10-year return period sea state for athree-hour storm. Concerning the 100-year return period wave, three wave records were tested, witheach wave record characterized by the same spectral properties and different random phases (seeds)between the spectrum frequency components. Three seeds have been used to build a statisticallyrelevant database for the mooring tensions analysis in extreme conditions. Furthermore, a 10-yearreturn period sea state was tested. A single wave record was tested in these conditions to optimize thetest schedule. Table 8 summarizes the tests carried out in extreme wave conditions.
Table 8. Extreme wave tests schedule.
Wave ID Hs Tp (s) γ Seed C1 C2a C2b
A10 0.250 1.950 3.3 1 3 3 3
A101 0.295 2.303 3.3 1 3 3 7
A102 0.295 2.303 3.3 2 3 3 7
A103 0.295 2.303 3.3 3 3 3 7
4.5. Uncertainty Analysis
Uncertainty analysis has been performed according to the ITTC (International Towing TankConference) Recommended Procedures 7.5-02-01-01 [46], based on the Type A and Type B uncertainty;for the towing tank at University Federico II, the detailed description of the uncertainty analysiscan be found in [47]. Type B uncertainty for the wave probes is 0.3/1000 mm and repeatability0.5/1000 mm. For the 95% confidence level, the total uncertainty is 1%. The Type B uncertainty relatedto measurement of model motions using an optical motion capture depends upon the setup of bothcameras and markers and varies through the measurement volume. Typical values for the translationmotions are 0.5/1000 mm, and up to 3% for the roll, pitch, and yaw motions.
5. Experimental Campaign Results
Three main outputs are analyzed: quantification of the hydrodynamic performances; operationalmooring loads, and statistical distribution of mooring loads in extreme wave conditions.
5.1. Regular Wave Results
The six DoF device motions have been measured along with mooring loads and wave profiles.For each test, at least a 30 s interval where all motions that reached a steady response have beenidentified. In such intervals, the following quantities are analyzed in the time-domain as peak-to-peak:wave amplitude, heave and pitch motion amplitude, and force in the mooring line; in the frequencydomain, results are computed by applying the Fast Fourier Transform (FFT) analysis.
The values of pitch and heave Response Amplitude Operator (RAO) were calculated to comparethe performance of the floater considering the two mooring configurations. Moreover, comparisonof the RAO obtained via numerical simulation and experimental testing can provide confidence inthe model and a preliminary validation [48]. The RAO evaluation was performed according to thefollowing equations:
RAO3 = η30/A, (2a)
J. Mar. Sci. Eng. 2020, 8, 180 17 of 31
RAO5 = η50/kA, (2b)
where η30 represents the heave motion amplitude, η50 the pitch motion amplitude, A the encounterwave amplitude, and k the wave number.
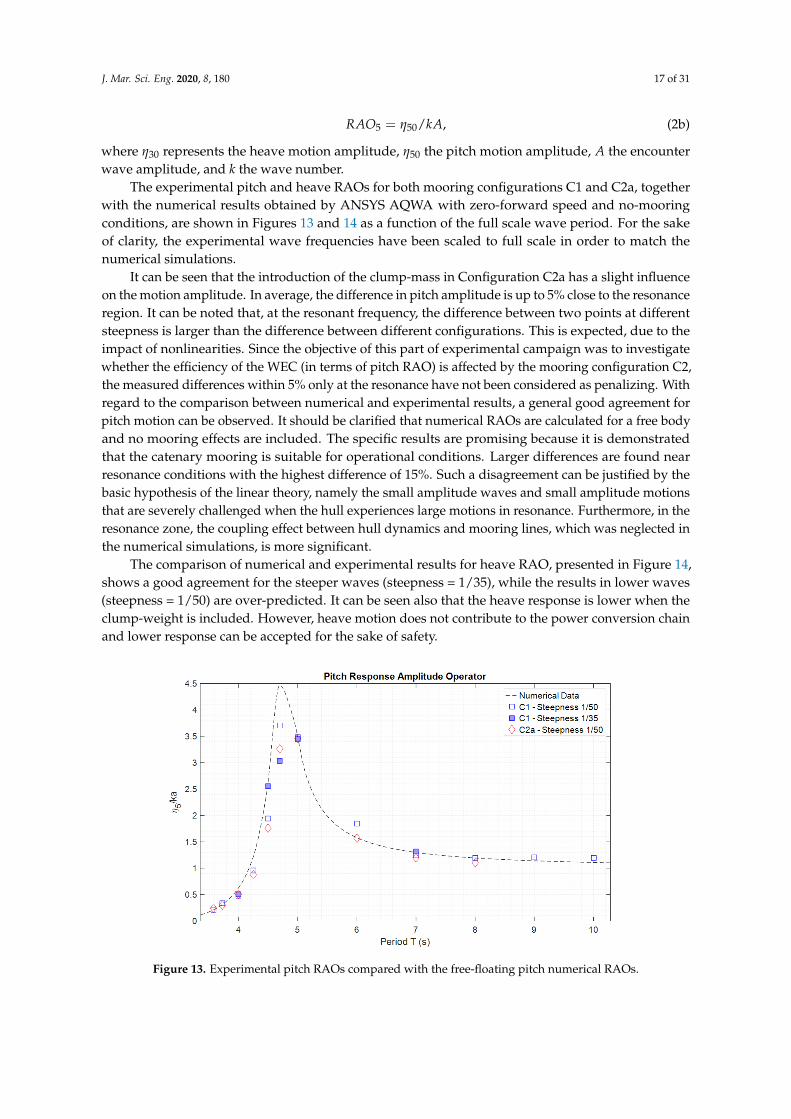
The experimental pitch and heave RAOs for both mooring configurations C1 and C2a, togetherwith the numerical results obtained by ANSYS AQWA with zero-forward speed and no-mooringconditions, are shown in Figures 13 and 14 as a function of the full scale wave period. For the sakeof clarity, the experimental wave frequencies have been scaled to full scale in order to match thenumerical simulations.
It can be seen that the introduction of the clump-mass in Configuration C2a has a slight influenceon the motion amplitude. In average, the difference in pitch amplitude is up to 5% close to the resonanceregion. It can be noted that, at the resonant frequency, the difference between two points at differentsteepness is larger than the difference between different configurations. This is expected, due to theimpact of nonlinearities. Since the objective of this part of experimental campaign was to investigatewhether the efficiency of the WEC (in terms of pitch RAO) is affected by the mooring configuration C2,the measured differences within 5% only at the resonance have not been considered as penalizing. Withregard to the comparison between numerical and experimental results, a general good agreement forpitch motion can be observed. It should be clarified that numerical RAOs are calculated for a free bodyand no mooring effects are included. The specific results are promising because it is demonstratedthat the catenary mooring is suitable for operational conditions. Larger differences are found nearresonance conditions with the highest difference of 15%. Such a disagreement can be justified by thebasic hypothesis of the linear theory, namely the small amplitude waves and small amplitude motionsthat are severely challenged when the hull experiences large motions in resonance. Furthermore, in theresonance zone, the coupling effect between hull dynamics and mooring lines, which was neglected inthe numerical simulations, is more significant.
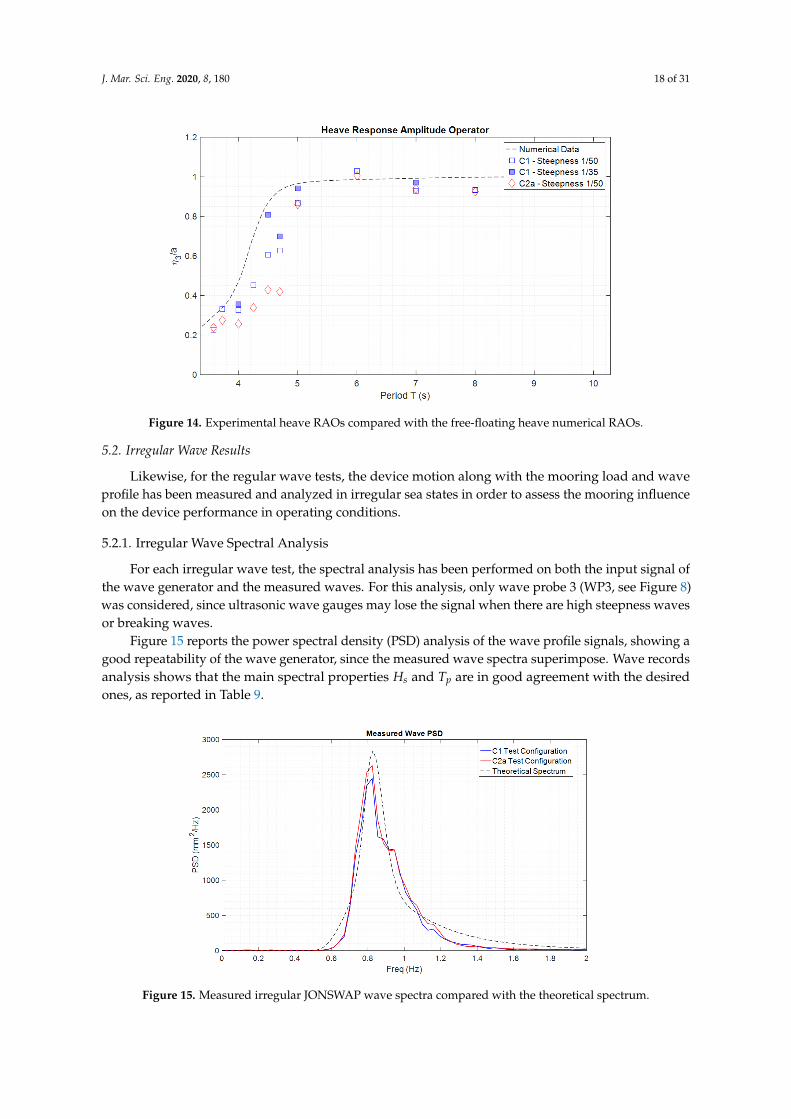
The comparison of numerical and experimental results for heave RAO, presented in Figure 14,shows a good agreement for the steeper waves (steepness = 1/35), while the results in lower waves(steepness = 1/50) are over-predicted. It can be seen also that the heave response is lower when theclump-weight is included. However, heave motion does not contribute to the power conversion chainand lower response can be accepted for the sake of safety.
Figure 13. Experimental pitch RAOs compared with the free-floating pitch numerical RAOs.
J. Mar. Sci. Eng. 2020, 8, 180 18 of 31
Figure 14. Experimental heave RAOs compared with the free-floating heave numerical RAOs.
5.2. Irregular Wave Results
Likewise, for the regular wave tests, the device motion along with the mooring load and waveprofile has been measured and analyzed in irregular sea states in order to assess the mooring influenceon the device performance in operating conditions.
5.2.1. Irregular Wave Spectral Analysis
For each irregular wave test, the spectral analysis has been performed on both the input signal ofthe wave generator and the measured waves. For this analysis, only wave probe 3 (WP3, see Figure 8)was considered, since ultrasonic wave gauges may lose the signal when there are high steepness wavesor breaking waves.
Figure 15 reports the power spectral density (PSD) analysis of the wave profile signals, showing agood repeatability of the wave generator, since the measured wave spectra superimpose. Wave recordsanalysis shows that the main spectral properties Hs and Tp are in good agreement with the desiredones, as reported in Table 9.
Figure 15. Measured irregular JONSWAP wave spectra compared with the theoretical spectrum.
J. Mar. Sci. Eng. 2020, 8, 180 19 of 31
Table 9. Irregular wave records spectral properties.
Wave ID Configuration Hs (m) Tp (s)
Operational wave Theoretical data 0.110 1.210Irr1 C1 0.101 1.210Irr1 C2a 0.104 1.210
5.2.2. Device Motion and Mooring Loads Analysis in Operational Wave Conditions
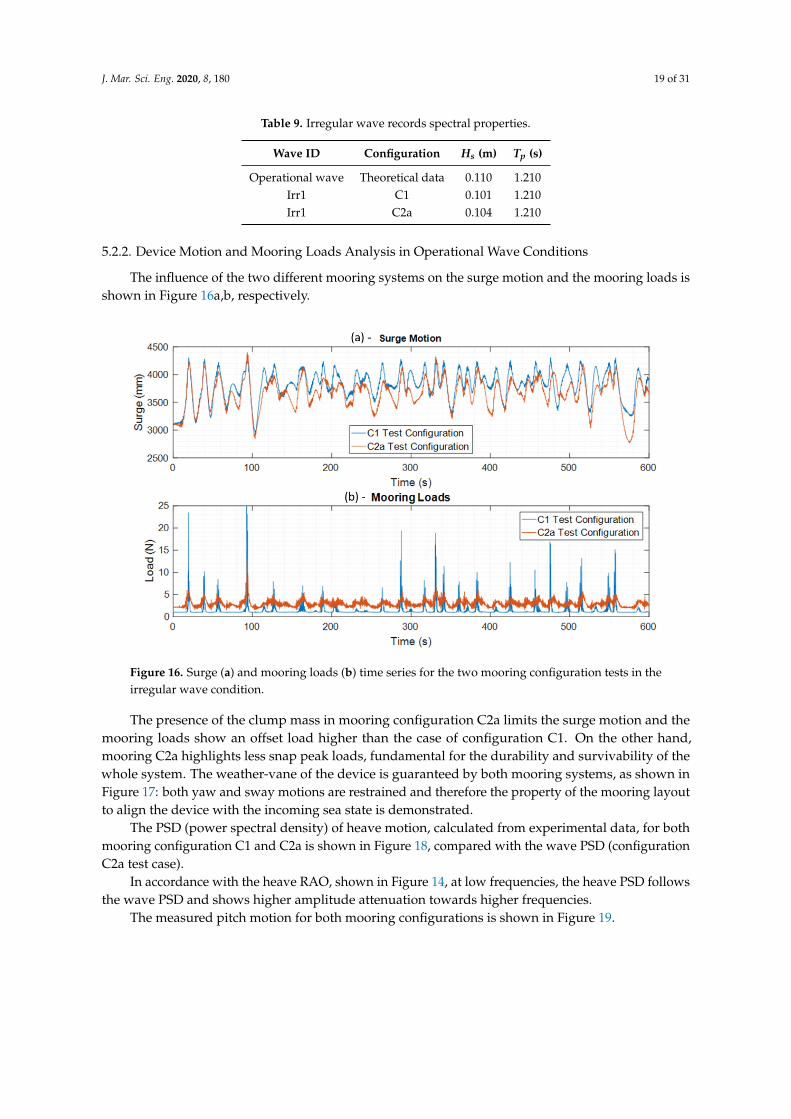
The influence of the two different mooring systems on the surge motion and the mooring loads isshown in Figure 16a,b, respectively.
Figure 16. Surge (a) and mooring loads (b) time series for the two mooring configuration tests in theirregular wave condition.
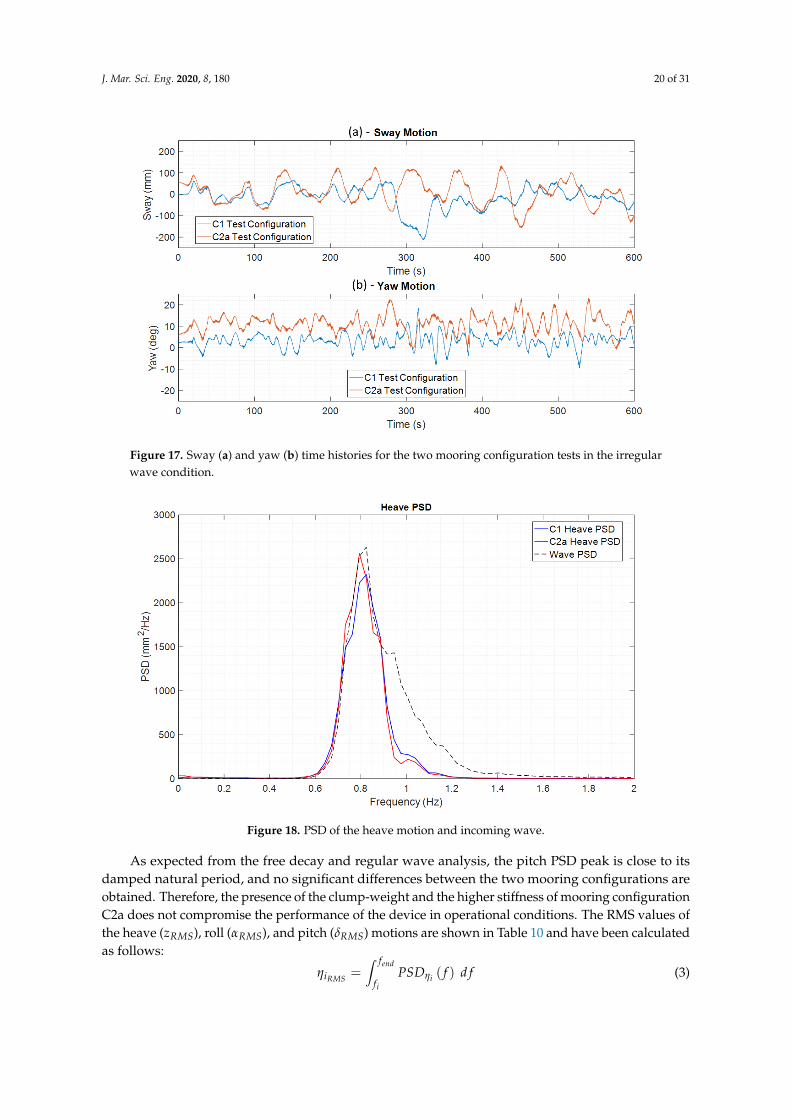
The presence of the clump mass in mooring configuration C2a limits the surge motion and themooring loads show an offset load higher than the case of configuration C1. On the other hand,mooring C2a highlights less snap peak loads, fundamental for the durability and survivability of thewhole system. The weather-vane of the device is guaranteed by both mooring systems, as shown inFigure 17: both yaw and sway motions are restrained and therefore the property of the mooring layoutto align the device with the incoming sea state is demonstrated.
The PSD (power spectral density) of heave motion, calculated from experimental data, for bothmooring configuration C1 and C2a is shown in Figure 18, compared with the wave PSD (configurationC2a test case).
In accordance with the heave RAO, shown in Figure 14, at low frequencies, the heave PSD followsthe wave PSD and shows higher amplitude attenuation towards higher frequencies.
The measured pitch motion for both mooring configurations is shown in Figure 19.
J. Mar. Sci. Eng. 2020, 8, 180 20 of 31
Figure 17. Sway (a) and yaw (b) time histories for the two mooring configuration tests in the irregularwave condition.
Figure 18. PSD of the heave motion and incoming wave.
As expected from the free decay and regular wave analysis, the pitch PSD peak is close to itsdamped natural period, and no significant differences between the two mooring configurations areobtained. Therefore, the presence of the clump-weight and the higher stiffness of mooring configurationC2a does not compromise the performance of the device in operational conditions. The RMS values ofthe heave (zRMS), roll (αRMS), and pitch (δRMS) motions are shown in Table 10 and have been calculatedas follows:
ηiRMS =∫ fend
fi
PSDηi ( f ) d f (3)

J. Mar. Sci. Eng. 2020, 8, 180 21 of 31
where ηiRMS is the Root Mean Square (RMS) value of the i-DoF, f is the frequency, and PSDηi is thePower Spectral Density of the i-DoF. The RMS pitch motion in the presence of C2a mooring layoutshows a decrease of 2.3% in operational sea state condition as shown in Table 10. This performancedecrease of performance is acceptable in view of the higher mooring stiffness and a reduction ofmooring peak loads. Moreover, the roll motion for both mooring configurations is restrained and thusthe floater stability in roll is demonstrated.
Figure 19. PSD of the pitch motion.
Table 10. RMS values of the floater motion in irregular wave.
Wave ID Configuration δRMS (deg) zRMS (m) αRMS (deg)
Irr1 C1 8.83 0.22 1.11Irr1 C2a 8.63 0.22 1.44
5.3. Extreme Waves Analysis
Configurations C1 and C2a have been tested in secular sea states, respectively without andwith the clump-weight on the mooring lines. On the 10-year return period wave, the attention wasfocused on the load reduction. In particular, a further modification of the mooring system was tested:a bigger clump-weight was introduced to investigate the influence of the mass on the tension peaks(Configuration C2b). In fact, as demonstrated in this section, the effect of the clump-weight is decisivefor the reduction of snaps and loads. Six sea-keeping tests were performed for the 100-year returnperiod sea states, and three sea-keeping tests for the 10-year return period wave.
5.3.1. Extreme Waves Spectral Analysis
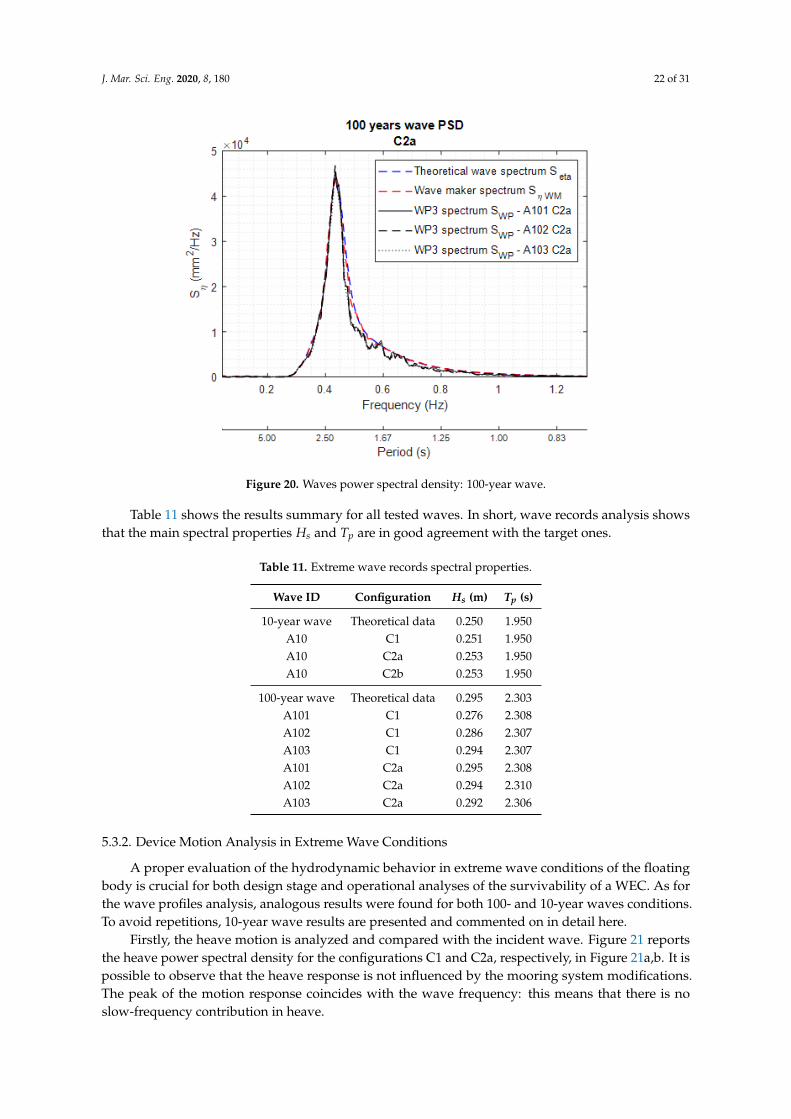
As far as the spectral analysis of the extreme sea states time records is concerned, the sameprocedure of the irregular waves has been considered. Figure 20 reports the spectral analysis for thewave profile signals of the 100-year return period incident wave tests. Again, this figure demonstratesa very good repeatability of the wave generator, the measured wave spectra being superimposed.To avoid redundancy of information, only the 100-year wave spectrum with the mooring configurationC2a wave has been reported.
J. Mar. Sci. Eng. 2020, 8, 180 22 of 31
Figure 20. Waves power spectral density: 100-year wave.
Table 11 shows the results summary for all tested waves. In short, wave records analysis showsthat the main spectral properties Hs and Tp are in good agreement with the target ones.
Table 11. Extreme wave records spectral properties.
Wave ID Configuration Hs (m) Tp (s)
10-year wave Theoretical data 0.250 1.950A10 C1 0.251 1.950A10 C2a 0.253 1.950A10 C2b 0.253 1.950
100-year wave Theoretical data 0.295 2.303A101 C1 0.276 2.308A102 C1 0.286 2.307A103 C1 0.294 2.307A101 C2a 0.295 2.308A102 C2a 0.294 2.310A103 C2a 0.292 2.306
5.3.2. Device Motion Analysis in Extreme Wave Conditions
A proper evaluation of the hydrodynamic behavior in extreme wave conditions of the floatingbody is crucial for both design stage and operational analyses of the survivability of a WEC. As forthe wave profiles analysis, analogous results were found for both 100- and 10-year waves conditions.To avoid repetitions, 10-year wave results are presented and commented on in detail here.
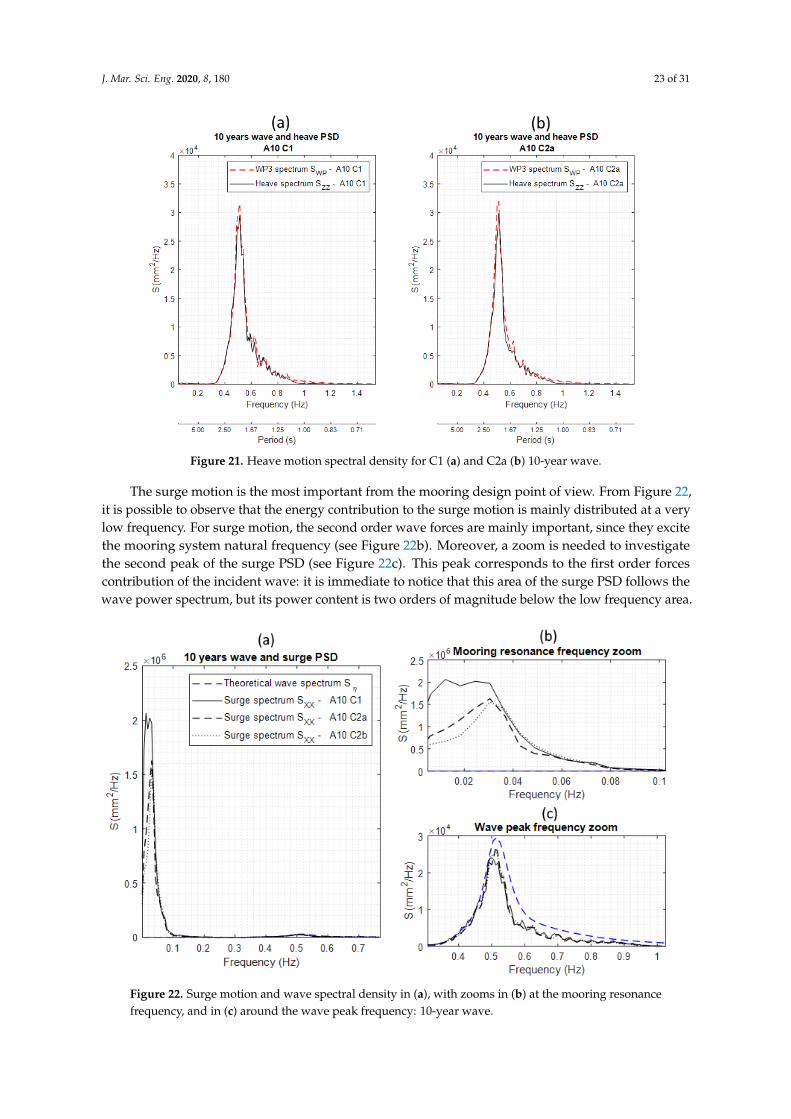
Firstly, the heave motion is analyzed and compared with the incident wave. Figure 21 reportsthe heave power spectral density for the configurations C1 and C2a, respectively, in Figure 21a,b. It ispossible to observe that the heave response is not influenced by the mooring system modifications.The peak of the motion response coincides with the wave frequency: this means that there is noslow-frequency contribution in heave.
J. Mar. Sci. Eng. 2020, 8, 180 23 of 31
Figure 21. Heave motion spectral density for C1 (a) and C2a (b) 10-year wave.
The surge motion is the most important from the mooring design point of view. From Figure 22,it is possible to observe that the energy contribution to the surge motion is mainly distributed at a verylow frequency. For surge motion, the second order wave forces are mainly important, since they excitethe mooring system natural frequency (see Figure 22b). Moreover, a zoom is needed to investigatethe second peak of the surge PSD (see Figure 22c). This peak corresponds to the first order forcescontribution of the incident wave: it is immediate to notice that this area of the surge PSD follows thewave power spectrum, but its power content is two orders of magnitude below the low frequency area.
Figure 22. Surge motion and wave spectral density in (a), with zooms in (b) at the mooring resonancefrequency, and in (c) around the wave peak frequency: 10-year wave.
J. Mar. Sci. Eng. 2020, 8, 180 24 of 31
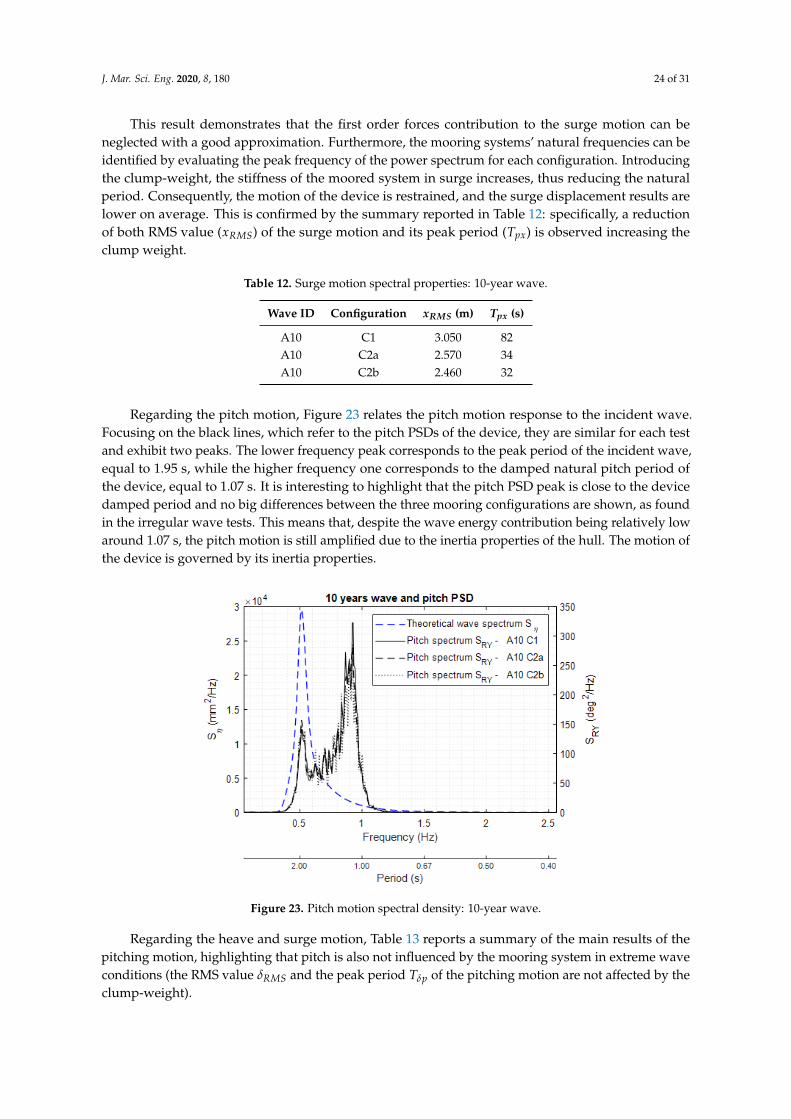
This result demonstrates that the first order forces contribution to the surge motion can beneglected with a good approximation. Furthermore, the mooring systems’ natural frequencies can beidentified by evaluating the peak frequency of the power spectrum for each configuration. Introducingthe clump-weight, the stiffness of the moored system in surge increases, thus reducing the naturalperiod. Consequently, the motion of the device is restrained, and the surge displacement results arelower on average. This is confirmed by the summary reported in Table 12: specifically, a reductionof both RMS value (xRMS) of the surge motion and its peak period (Tpx) is observed increasing theclump weight.
Table 12. Surge motion spectral properties: 10-year wave.
Wave ID Configuration xRMS (m) Tpx (s)
A10 C1 3.050 82A10 C2a 2.570 34A10 C2b 2.460 32
Regarding the pitch motion, Figure 23 relates the pitch motion response to the incident wave.Focusing on the black lines, which refer to the pitch PSDs of the device, they are similar for each testand exhibit two peaks. The lower frequency peak corresponds to the peak period of the incident wave,equal to 1.95 s, while the higher frequency one corresponds to the damped natural pitch period ofthe device, equal to 1.07 s. It is interesting to highlight that the pitch PSD peak is close to the devicedamped period and no big differences between the three mooring configurations are shown, as foundin the irregular wave tests. This means that, despite the wave energy contribution being relatively lowaround 1.07 s, the pitch motion is still amplified due to the inertia properties of the hull. The motion ofthe device is governed by its inertia properties.
Figure 23. Pitch motion spectral density: 10-year wave.
Regarding the heave and surge motion, Table 13 reports a summary of the main results of thepitching motion, highlighting that pitch is also not influenced by the mooring system in extreme waveconditions (the RMS value δRMS and the peak period Tδp of the pitching motion are not affected by theclump-weight).

J. Mar. Sci. Eng. 2020, 8, 180 25 of 31
Table 13. Pitch motion spectral properties: 10-year wave.
Wave ID Configuration δRMS (deg) Tδp (s)
A10 C1 8.30 1.078A10 C2a 8.23 1.085A10 C2b 8.09 1.085
From the motion spectral analysis, it is not possible to evaluate which mooring system has thebest performances. More precisely, all the tested configurations demonstrated good performances interms of the influence on the dynamics of the floater for high power sea states. On the other hand, thecritical design point in extreme wave condition is the evaluation of the survivability of the mooringsystem in terms of mechanical failures.
5.3.3. Mooring Loads Analysis in Extreme Wave Conditions
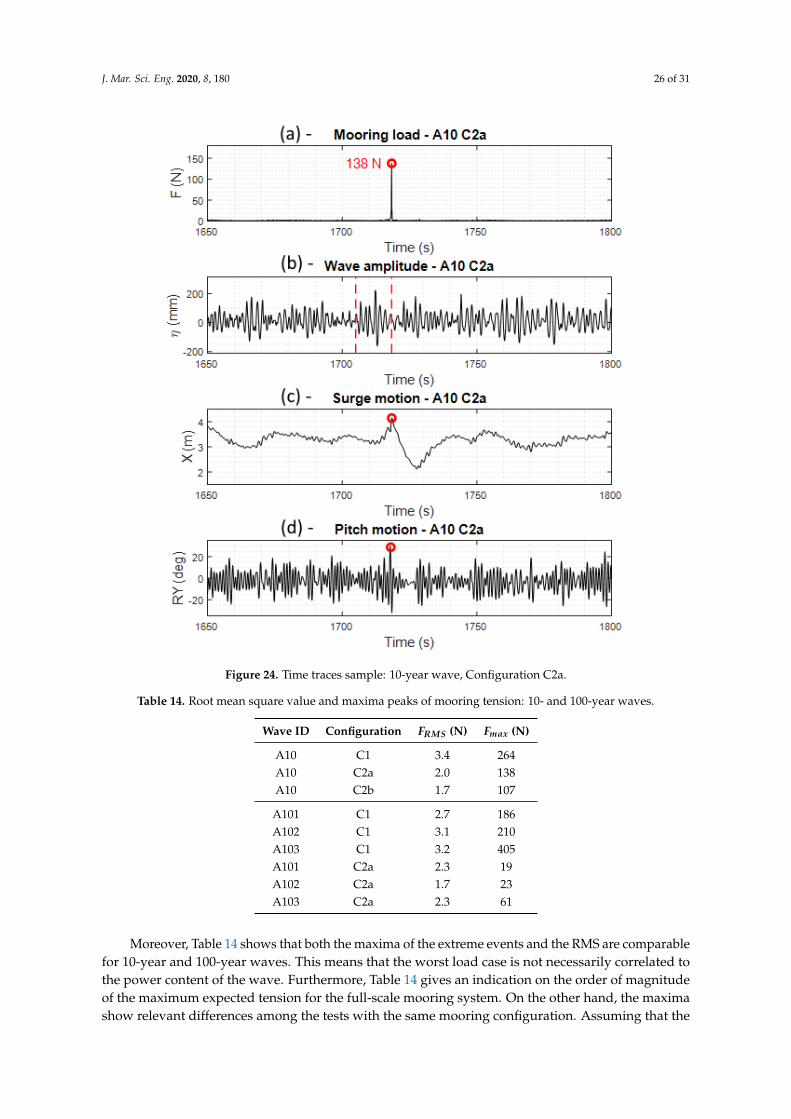
To quantify the loads and their statistical distribution for each mooring configuration, the signalof a load cell installed just after the swivel was acquired. Figure 24 shows a time trace window ofthe mooring load signal (Figure 24a), compared against the wave free surface elevation (Figure 24b),surge (Figure 24c), and pitch signal (Figure 24d), for Configuration C2a and the 10-year wave test.It is worth remarking that the pitch dynamics is governed by the damped natural frequency of thedevice. Furthermore, the surge motion also presents a lower frequency contribution due to the naturalfrequency of the mooring system. From the third subplot, it is possible to confirm that the lowfrequency excites the mooring lines. Mooring loads are characterized by a very low mean load, whichis mainly due to the catenary weight, and singular spikes of higher orders of magnitude.
The extreme event occurs when high amplitude displacements are recorded in the same instantsfor surge and pitch motions. The high amplitude displacements are a consequence of the drift loadsdue to the wave group that precedes the extreme event (noted by two vertical dashed lines in thesecond subplot). Unfortunately, it has not been possible to find a relation between the properties ofthe wave group and the occurrence of the extreme event. More precisely, it can be observed that thewave group does not look different from other windows of the time-series sample. Nevertheless, thecorrespondence of high amplitude displacement is observed only once. This is due to the combinationof several factors that cannot be controlled or separated in the dynamic evolution of the system. Theadverse combination of these motions leads to the full extension of the mooring lines. When the linereaches its maximum extension, the chain is completely lifted from the seabed and a snatch load occurs.Snaps are governed by the device drift and they can be identified as isolated events during the storm.To analyze such events, neither a time domain nor a spectral analysis is appropriate. Hence, a statisticalapproach is proposed here.
The statistical analysis is performed for the 100- and 10-year return period waves tests. The threetested configurations (C1, C2a, and C2b) are analyzed in order to identify the best solution for theISWEC mooring system. Table 14 tabulates the RMS value and maximum peak of tension for each testin extreme waves. From these results, it is possible to observe a clear improvement from configurationC1 to configuration C2a and then to Configuration C2b in terms of tension peaks’ reduction. Inmore detail, considering the 10-year wave, a reduction of the maximal peak value of almost 48%can be observed by employing the Configuration C2a instead of the Configuration C1. Moreover,by employing the Configurations C2b, a reduction of almost 60% can be reached. Analogous resultswere found for the 100-year wave: a considerable reduction of the maximal peak value of the mooringload can be obtained with the introduction of the clump weight. The same behavior is observed withdifferent seeds: this means that there is no evident influence of the random phase between frequencycomponents on different mooring configurations. Finally, note that, due to limited time available forexperimental testing in the wave tank, configuration C2b was tested only for the 10-year wave.
J. Mar. Sci. Eng. 2020, 8, 180 26 of 31
Figure 24. Time traces sample: 10-year wave, Configuration C2a.
Table 14. Root mean square value and maxima peaks of mooring tension: 10- and 100-year waves.
Wave ID Configuration FRMS (N) Fmax (N)
A10 C1 3.4 264A10 C2a 2.0 138A10 C2b 1.7 107
A101 C1 2.7 186A102 C1 3.1 210A103 C1 3.2 405A101 C2a 2.3 19A102 C2a 1.7 23A103 C2a 2.3 61
Moreover, Table 14 shows that both the maxima of the extreme events and the RMS are comparablefor 10-year and 100-year waves. This means that the worst load case is not necessarily correlated tothe power content of the wave. Furthermore, Table 14 gives an indication on the order of magnitudeof the maximum expected tension for the full-scale mooring system. On the other hand, the maximashow relevant differences among the tests with the same mooring configuration. Assuming that the
J. Mar. Sci. Eng. 2020, 8, 180 27 of 31
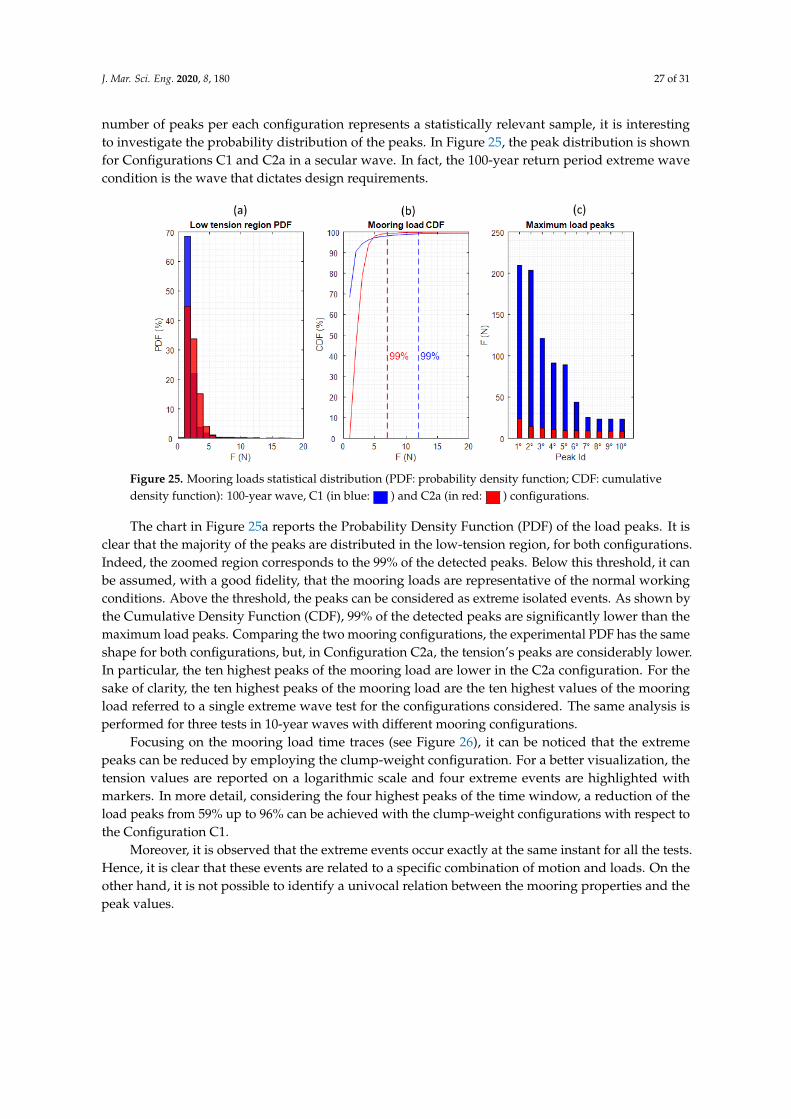
number of peaks per each configuration represents a statistically relevant sample, it is interestingto investigate the probability distribution of the peaks. In Figure 25, the peak distribution is shownfor Configurations C1 and C2a in a secular wave. In fact, the 100-year return period extreme wavecondition is the wave that dictates design requirements.
Figure 25. Mooring loads statistical distribution (PDF: probability density function; CDF: cumulativedensity function): 100-year wave, C1 (in blue: ) and C2a (in red: ) configurations.
The chart in Figure 25a reports the Probability Density Function (PDF) of the load peaks. It isclear that the majority of the peaks are distributed in the low-tension region, for both configurations.Indeed, the zoomed region corresponds to the 99% of the detected peaks. Below this threshold, it canbe assumed, with a good fidelity, that the mooring loads are representative of the normal workingconditions. Above the threshold, the peaks can be considered as extreme isolated events. As shown bythe Cumulative Density Function (CDF), 99% of the detected peaks are significantly lower than themaximum load peaks. Comparing the two mooring configurations, the experimental PDF has the sameshape for both configurations, but, in Configuration C2a, the tension’s peaks are considerably lower.In particular, the ten highest peaks of the mooring load are lower in the C2a configuration. For thesake of clarity, the ten highest peaks of the mooring load are the ten highest values of the mooringload referred to a single extreme wave test for the configurations considered. The same analysis isperformed for three tests in 10-year waves with different mooring configurations.
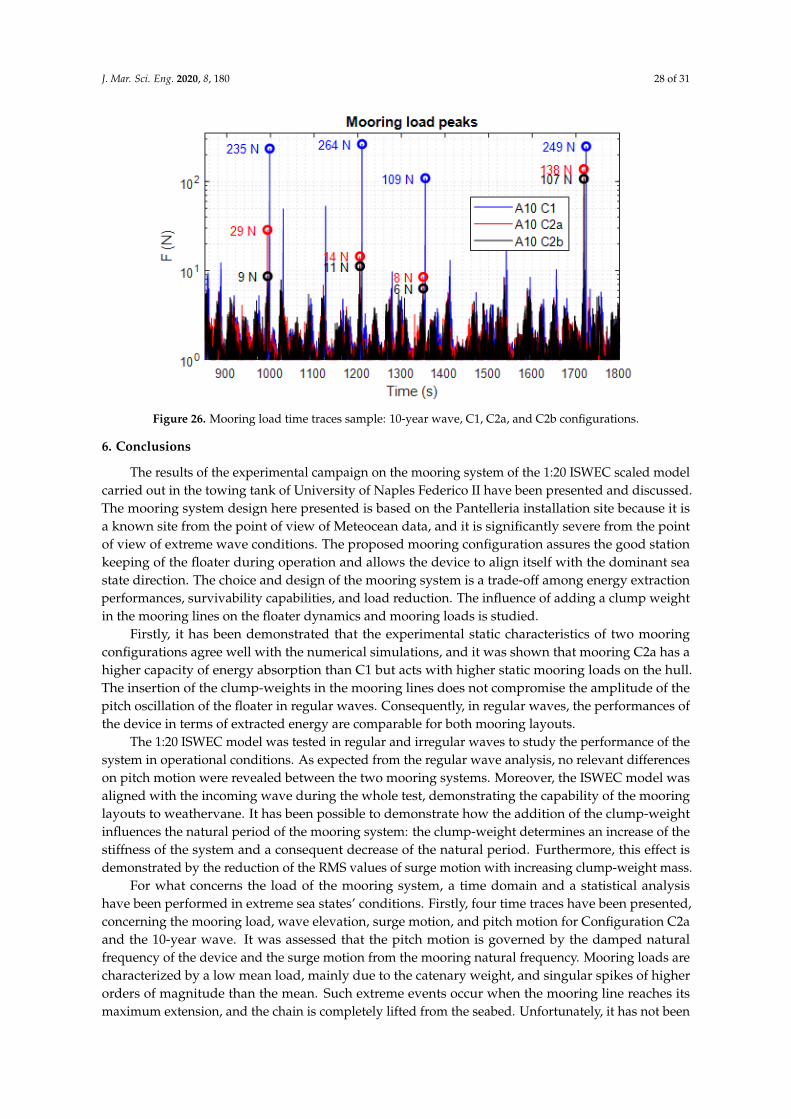
Focusing on the mooring load time traces (see Figure 26), it can be noticed that the extremepeaks can be reduced by employing the clump-weight configuration. For a better visualization, thetension values are reported on a logarithmic scale and four extreme events are highlighted withmarkers. In more detail, considering the four highest peaks of the time window, a reduction of theload peaks from 59% up to 96% can be achieved with the clump-weight configurations with respect tothe Configuration C1.
Moreover, it is observed that the extreme events occur exactly at the same instant for all the tests.Hence, it is clear that these events are related to a specific combination of motion and loads. On theother hand, it is not possible to identify a univocal relation between the mooring properties and thepeak values.
J. Mar. Sci. Eng. 2020, 8, 180 28 of 31
Figure 26. Mooring load time traces sample: 10-year wave, C1, C2a, and C2b configurations.
6. Conclusions
The results of the experimental campaign on the mooring system of the 1:20 ISWEC scaled modelcarried out in the towing tank of University of Naples Federico II have been presented and discussed.The mooring system design here presented is based on the Pantelleria installation site because it isa known site from the point of view of Meteocean data, and it is significantly severe from the pointof view of extreme wave conditions. The proposed mooring configuration assures the good stationkeeping of the floater during operation and allows the device to align itself with the dominant seastate direction. The choice and design of the mooring system is a trade-off among energy extractionperformances, survivability capabilities, and load reduction. The influence of adding a clump weightin the mooring lines on the floater dynamics and mooring loads is studied.
Firstly, it has been demonstrated that the experimental static characteristics of two mooringconfigurations agree well with the numerical simulations, and it was shown that mooring C2a has ahigher capacity of energy absorption than C1 but acts with higher static mooring loads on the hull.The insertion of the clump-weights in the mooring lines does not compromise the amplitude of thepitch oscillation of the floater in regular waves. Consequently, in regular waves, the performances ofthe device in terms of extracted energy are comparable for both mooring layouts.
The 1:20 ISWEC model was tested in regular and irregular waves to study the performance of thesystem in operational conditions. As expected from the regular wave analysis, no relevant differenceson pitch motion were revealed between the two mooring systems. Moreover, the ISWEC model wasaligned with the incoming wave during the whole test, demonstrating the capability of the mooringlayouts to weathervane. It has been possible to demonstrate how the addition of the clump-weightinfluences the natural period of the mooring system: the clump-weight determines an increase of thestiffness of the system and a consequent decrease of the natural period. Furthermore, this effect isdemonstrated by the reduction of the RMS values of surge motion with increasing clump-weight mass.
For what concerns the load of the mooring system, a time domain and a statistical analysishave been performed in extreme sea states’ conditions. Firstly, four time traces have been presented,concerning the mooring load, wave elevation, surge motion, and pitch motion for Configuration C2aand the 10-year wave. It was assessed that the pitch motion is governed by the damped naturalfrequency of the device and the surge motion from the mooring natural frequency. Mooring loads arecharacterized by a low mean load, mainly due to the catenary weight, and singular spikes of higherorders of magnitude than the mean. Such extreme events occur when the mooring line reaches itsmaximum extension, and the chain is completely lifted from the seabed. Unfortunately, it has not been

J. Mar. Sci. Eng. 2020, 8, 180 29 of 31
possible to find a correlation between the properties of the wave group, the device’s motion, and theoccurrence of the extreme event. More precise considerations regarding load peaks can be given by thestatistical approach proposed here. From the results, it is possible to demonstrate that the insertionof a clump-weight on the mooring line is a relevant improvement in the design, allowing a relevantreduction of the mooring loads. A relevant reduction of maximal peak values can be observed, fromalmost 48% up to 96% by employing the clump-weight solution. Moreover, the majority of the peaksare distributed in the low-tension region for both configurations. The low-tension region represents99% of the detected peaks and therefore it can be assumed with a good fidelity that these loads arerepresentative of the normal working conditions.
Author Contributions: Conceptualization, S.A.S., M.B., E.B., C.B., P.D., G.B., and G.M.; methodology, S.A.S., M.B.,E.B., C.B., P.D., G.B., and G.M.; software, S.A.S., M.B., and P.D.; validation, S.A.S., M.B., and P.D.; formal analysis,S.A.S., M.B., E.B., C.B., P.D., G.B., and G.M.; investigation, S.A.S., M.B., and P.D.; resources, S.A.S., M.B., E.B.,C.B., P.D., G.B., and G.M.; data curation, S.A.S., M.B., E.B., C.B., P.D., G.B., and G.M.; writing—original draftpreparation, S.A.S., M.B., and G.G.; writing—review and editing, S.A.S., M.B., and G.G.; visualization, S.A.S.,M.B., and G.G.; supervision, G.B., and G.M.; project administration, G.B. and G.M.; funding acquisition, G.B. andG.M. All authors have read and agreed to the published version of the manuscript.
Funding: This research has partially received funding from the European Research Executive Agency (REA)under the European Union’s Horizon 2020 research and innovation program under Grant No. 832140.
Conflicts of Interest: The authors declare no conflict of interest. The funders had no role in the design of thestudy; in the collection, analyses, or interpretation of data; in the writing of the manuscript, or in the decision topublish the results.
References
1. Barltrop, N. Floating Structures: A Guide for Design and Analysis; Oilfield Pubns Inc.: Houston, TX, USA, 1998.2. Paredes, G.M.; Bergdahl, L.; Palm, J.; Eskilsson, C.; Pinto, F.T. Station keeping design for floating wave
energy devices compared to floating offshore oil and gas platforms. In Proceedings of the 10th EuropeanWave and Tidal Energy Conference, Aalborg, Denmark, 2–5 September 2013.
3. Giorgi, G.; Ringwood, J.V. Articulating parametric resonance for an OWC spar buoy in regular and irregularwaves. J. Ocean Eng. Mar. Energy 2018, 4, 311–322. [CrossRef]
4. Gao, Z.; Bingham, H.B.; Ingram, D.; Kolios, A.; Karmakar, D.; Utsunomiya, T.; Catipovic, I.; Colicchio, G.;Miguel Rodrigues, J.; Adam, F.; et al. Committee V.4 Report: Offshore Renewable Energy, Vol. II; Kamisnski, M.L.,Rigo, P., Eds.; International Ship Offshore Structures Congress Press: Amsterdam, The Netherlands, 2018;pp. 193–277. [CrossRef]
5. Giorgi, G.; Ringwood, J.V. Analytical Formulation of Nonlinear Froude-Krylov Forces forSurging-Heaving-Pitching Point Absorbers. In Proceedings of the ASME 2018 37th International Conferenceon Ocean, Offshore and Arctic Engineering, Madrid, Spain, 17–22 June 2018.
6. Goggins, J.; Finnegan, W. Shape optimisation of floating wave energy converters for a specified wave energyspectrum. Renew. Energy 2014, 71, 208–220. [CrossRef]
7. Thomsen, J.B.; Ferri, F.; Kofoed, J.P. Assessment of Current State of Mooring Design in the Danish WaveEnergy Sector. In Proceedings of the 11th European Wave and Tidal Energy Conference, Nantes, France,6–11 September 2015; number 2015 in European Wave and Tidal Energy Conference Series.
8. Giorgi, G.; Gomes, R.P.F.; Bracco, G.; Mattiazzo, G. The Effect of Mooring Line Parameters in InducingParametric Resonance on the Spar-Buoy Oscillating Water Column Wave Energy Converter. J. Mar. Sci. Eng.2020, 8, 29. [CrossRef]
9. Sheng, W.; Lewis, T.; Alcorn, R.; Johaning, L.; Kirrane, P. Experimental Investigation of HydrodynamicCharacteristics of a Moored Floating WEC. In Proceedings of the 3rd International Conference on OceanEnergy, Bilbao, Spain, 6–8 October 2010; pp. 1–9.
10. Hann, M.; Greaves, D.; Raby, A. Snatch loading of a single taut moored floating wave energy converter dueto focussed wave groups. Ocean Eng. 2015, 96, 258–271. [CrossRef]
11. Paredes, G.M.; Palm, J.; Eskilsson, C.; Bergdahl, L.; Taveira-Pinto, F. Experimental investigation of mooringconfigurations for wave energy converters. Int. J. Mar. Energy 2016, 15, 56–67. [CrossRef]

J. Mar. Sci. Eng. 2020, 8, 180 30 of 31
12. Wu, M.; Stratigaki, V.; Verbrugghe, T.; Troch, P.; Altomare, C.; Crespo, A.; Kisacik, D.; Cappietti, L.;Dominguez, J.; Hall, M.; et al. Experimental study of motion and mooring behavior of a floating oscillatingwater column wave energy converter. In Proceedings of the 7th International Conference on PhysicalModelling in Coastal Science and Engineering (Coastlab’18), Santander, Spain, 22–26 May 2018; pp. 1–8.
13. Sirigu, S.A.; Bracco, G.; Bonfanti, M.; Dafnakis, P.; Mattiazzo, G. On-board sea state estimation methodvalidation based on measured floater motion. IFAC-PapersOnLine 2018, 51, 68–73. [CrossRef]
14. Tarrant, K.R.; Meskell, C. Investigation on parametrically excited motions of point absorbers in regularwaves. Ocean Eng. 2016, 111, 67–81. [CrossRef]
15. Clément, A.H.; Babarit, A.; Gilloteaux, J.C.; Josset, C.; Duclos, G. The SEAREV wave energy converter.In Proceedings of the 6th Wave and Tidal Energy Conference, Glasgow, UK, 29 August–2 September 2005.
16. Wello, O. website 2020. Available online: www.wello.eu (accessed on 1 January 2020).17. Falcão, A.F. Wave energy utilization: A review of the technologies. Renew. Sustain. Energy Rev. 2010,
14, 899–918. [CrossRef]18. Aderinto, T.; Li, H. Ocean Wave energy converters: Status and challenges. Energies 2018, 11, 1250. [CrossRef]19. Sheng, W. Wave energy conversion and hydrodynamics modeling technologies: A review. Renew. Sustain.
Energy Rev. 2019, 109, 482–498. [CrossRef]20. Karimirad, M.; Koushan, K.; Weller, S.; Hardwick, J.; Johanning, L. Applicability of offshore mooring and
foundation technologies for marine renewable energy (MRE) device arrays. In Renewable Energies Offshore;Guedes Soares, C., Ed.; CRC Press: Boca Raton, FL, USA, 2015; pp. 905–912.
21. Ricci, P.; Rico, A.; Boscolo, F.; Villate, J.L. Design, Modelling and Analysis of an Integrated Mooring Systemfor Wave Energy Arrays. In Proceedings of the 4th International Conference on Ocean Energy, Dublin,Ireland, 17–19 October 2012; pp. 1–6.
22. Bracco, G.; Cagninei, A.; Casassa, M.; Giorcelli, E.; Giorgi, G.; Mattiazzo, G.; Passione, B.; Poggi, D.;Raffero, M.; Vissio, G. Modeling and optimization of a Wave Energy Converter using ANSYS AQWA.In Innovabook 2015. Paper Anthology. Fluidodinamica, Meccanica, Elettromagnetismo; ANSYS User GroupMeeting 2014; Cobalto Casa Editrice: Bergamo, Italy, 2015; pp. 79–86.
23. Davidson, J.; Ringwood, J.V. Mathematical modeling of mooring systems for wave energyconverters—A review. Energies 2017, 10, 666. [CrossRef]
24. Harris, R.E.; Johanning, L.; Wolfram, J.; Frsa, M. Mooring systems for wave energy converters: A review ofdesign issues and choices. In Proceedings of the 3rd International Conference on Marine Renewable Energy,Blyth, UK, 7–9 July 2004; pp. 159–168.
25. Martinelli, L.; Ruol, P.; Cortellazzo, G. On mooring design of wave energy converters: The seabreathapplication. In Proceedings of the Coastal Engineering Conference, Santander, Spain, 1–6 July 2012; pp. 1–12.[CrossRef]
26. Zanuttigh, B.; Martinelli, L.; Castagnetti, M. Screening of Suitable Mooring Systems; Technical Report; AalborgUniversity: Aalborg, Denmark, 2011; doi:10.13140/RG.2.1.1386.7048. [CrossRef]
27. Cagninei, A.; Raffero, M.; Bracco, G.; Giorcelli, E.; Mattiazzo, G.; Poggi, D. Productivity analysis of the fullscale inertial sea wave energy converter prototype: A test case in Pantelleria Island. J. Renew. Sustain. Energy2015, 7, 061703. [CrossRef]
28. Bracco, G.; Casassa, M.; Giorcelli, E.; Giorgi, G.; Martini, M.; Mattiazzo, G.; Passione, B.; Raffero, M.; Vissio, G.Application of sub-optimal control techniques to a gyroscopic Wave Energy Converter. Renew. Energ. Offshore2014, 1, 265–269.
29. Bracco, G.; Giorcelli, E.; Mattiazzo, G.; Orlando, V.; Raffero, M. Hardware-In-the-Loop test rig for the ISWECwave energy system. Mechatronics 2015, 25, 11–17. [CrossRef]
30. Bracco, G.; Giorcelli, E.; Giorgi, G.; Mattiazzo, G.; Passione, B.; Raffero, M.; Vissio, G. Performance assessmentof the full scale ISWEC system. In Proceedings of the 2015 IEEE International Conference on IndustrialTechnology (ICIT), Seville, Spain, 17–19 March 2015; pp. 2499–2505. [CrossRef]
31. Sirigu, S.A.; Bonfanti, M.; Passione, B.; Begovic, E.; Bertorello, C.; Dafnakis, P.; Bracco, G.; Giorcelli, E.;Mattiazzo, G. Experimental investigation of the hydrodynamic performance of the ISWEC 1:20 scaled device.In Proceedings of the NAV International Conference on Ship and Shipping Research, Trieste, Italy, 20–22June 2018; Number 221499, pp. 551–560. [CrossRef]

J. Mar. Sci. Eng. 2020, 8, 180 31 of 31
32. Bonfanti, M.; Bracco, G.; Dafnakis, P.; Giorcelli, E.; Passione, B.; Pozzi, N.; Sirigu, S.; Mattiazzo, G. Applicationof a passive control technique to the ISWEC: Experimental tests on a 1:8 test rig. In Proceedings of the NAVInternational Conference on Ship and Shipping Research, Trieste, Italy, 20–22 June 2018; Number 221499,pp. 60–70. [CrossRef]
33. Pozzi, N.; Bonfanti, M.; Mattiazzo, G. Mathematical Modeling and Scaling of the Friction Losses of aMechanical Gyroscope. Int. J. Appl. Mech. 2018, 10, 1850024. [CrossRef]
34. Sirigu, A.S.; Gallizio, F.; Giorgi, G.; Bonfanti, M.; Bracco, G.; Mattiazzo, G. Numerical and ExperimentalIdentification of the Aerodynamic Power Losses of the ISWEC. J. Mar. Sci. Eng. 2020, 8, 49. [CrossRef]
35. Novo, R.; Bracco, G.; Sirigu, S.; Mattiazzo, G.; Merigaud, A.; Ringwood, J. Nonlinear simulation of a waveenergy converter with multiple degrees of freedom using a harmonic balance method. In Proceedingsof the International Conference on Offshore Mechanics and Arctic Engineering—OMAE, Madrid, Spain,17–22 June 2018; Volumn 10. [CrossRef]
36. Genuardi, L.; Bracco, G.; Sirigu, S.A.; Bonfanti, M.; Paduano, B.; Dafnakis, P.; Mattiazzo, G. An applicationof model predictive control logic to inertial sea wave energy converter. In Mechanisms and Machine Science;Springer: Berlin/Heidelberg, Germany, 2019; Volumn 73, pp. 3561–3571. [CrossRef]
37. Vissio, G.; Valério, D.; Bracco, G.; Beirão, P.; Pozzi, N.; Mattiazzo, G. ISWEC linear quadratic regulatoroscillating control. Renew. Energy 2017, 103, 372–382. [CrossRef]
38. DNV GL. OFFSHORE STANDARD DNV GL AS Position Mooring; Technical report, 2015. Available online:https://rules.dnvgl.com/docs/pdf/dnvgl/os/2015-07/DNVGL-OS-E301.pdf (accessed on 1 January 2020).
39. Pozzi, N.; Bracco, G.; Passione, B.; Sirigu Sergej, A.; Vissio, G.; Mattiazzo, G.; Sannino, G. Wave Tank Testingof a Pendulum Wave Energy Converter 1:12 Scale Model. Int. J. Appl. Mech. 2017, 9, 1750024. [CrossRef]
40. Begovic, E.; Bertorello, C.; Prpic Orsic, J. Roll Damping Coefficients Assessment and Comparison for RoundBilge and Hard Chine Hullforms. In Proceedings of the ASME 2013 32nd International Conference on Ocean,Offshore and Arctic Engineering, Nantes, France, 9–14 June 2013. [CrossRef]
41. Begovic, E.; Day, A.; Incecik, A. An experimental study of hull girder loads on an intact and damaged navalship. Ocean Eng. 2017, 133, 47–65. [CrossRef]
42. Bencivenga, M.; Nardone, G.; Ruggiero, F.; Calore, D. The Italian data buoy network (RON). WIT Trans.Eng. Sci. 2012, 74, 321–332. [CrossRef]
43. Venugopal, V.; Davey, T.; Smith, H.; Smith, G.; Holmes, B.; Barrett, S.; Prevosto, M.; Maisondieu, C.;Cavalieri, L.; Bertotti, L.; et al. EquiMar Project: Wave and Tidal Resource Characterisation; Technicalreport, 2011. Available online: https://archimer.ifremer.fr/doc/00250/36152/34706.pdf (accessed on1 January 2020).
44. ITTC. Recommended Procedures and Guidelines 7.5-02-07-03.2: Analysis Procedure for Regular WaveTests; Technical report, 2002. Available online: https://ittc.info/media/1323/75-02-07-032.pdf (accessed on1 January 2020).
45. ITTC. Recommended Procedures and Guidelines 7.5-02-07-03.14: Analysis Procedure od Model Tests inIrregular Waves; Technical report, 2017. Available online: https://www.ittc.info/media/8139/75-02-07-0314.pdf (accessed on 1 January 2020).
46. ITTC. Recommended Procedures and Guidelines 7.5-02-01-01: Guide to the Expression of Uncertainty inExperimental Hydrodynamics; Technical report, 2014. Available online: https://ittc.info/media/1217/75-02-02-01.pdf (accessed on 1 January 2020).
47. Begovic, E.; Bertorello, C.; Pennino, S. Experimental seakeeping assessment of a warped planing hull modelseries. Ocean Eng. 2014, 83, 1–15. [CrossRef]
48. Pozzi, N.; Bracco, G.; Passione, B.; Sirigu, S.A.; Mattiazzo, G. PeWEC: Experimental validation of wave toPTO numerical model. Ocean Eng. 2018, 167, 114–129. [CrossRef]
© 2020 by the authors. Licensee MDPI, Basel, Switzerland. This article is an open accessarticle distributed under the terms and conditions of the Creative Commons Attribution(CC BY) license (http://creativecommons.org/licenses/by/4.0/).