Improvement of Mooring Configurations in Geraldton Harbour
20
Article Improvement of Mooring Configurations in Geraldton Harbour Wim van der Molen 1, *, Doug Scott 1,† , David Taylor 2,† and Trevor Elliott 1,† Received: 5 October 2015; Accepted: 15 December 2015; Published: 24 December 2015 Academic Editor: Charitha Pattiaratchi 1 W.F. Baird & Associates Coastal Engineers Ltd., Ottawa, ON, K1V 0Y3, Canada; [email protected] (D.S.); [email protected] (T.E.) 2 Baird Australia Pty. Ltd., Level 14, 309 Kent St., Sydney, NSW, 2000, Australia; [email protected] * Correspondence: [email protected]; Tel.: +1-613-731-8900; Fax: +1-613-731-9778 † These authors contributed equally to this work. Abstract: Ports exposed to high energy long wave conditions can experience significantly reduced berth operability. Geraldton is perhaps one of the best known examples. Recent studies to mitigate the problems have concentrated on the reduction of the long waves by extending the breakwater. However, this is quite costly. Various countermeasures related to the mooring configuration are defined and analysed in this paper. The analysed alternatives are use of shore-based mooring lines, installation of softer fenders, a combination of these two, and deployment of Cavotec MoorMaster™ units. These alternatives were compared with the existing mooring configuration and with the option to extend the breakwater. The best improvement (50% increase of threshold long wave height inside the harbour) is reached by installing a combination of pneumatic fenders and constant tension winches set to 30 t, or nylon breast lines on a brake winch with a pretension of 25 t. In this way, the vessel is pulled into the fenders and fender friction prevents excessive surging of the ship along the berth. Keywords: long waves; moored ships; port engineering 1. Introduction Geraldton Harbour is located on the west coast of Australia, 370 km north from Perth, on the northern side of a headland that provides a natural protection against the prevailing swells from the southwest. The location and layout of the existing port with seven berths are shown in Figure 1. Berth 1/2 is essentially operated as one berth. The most occupied berths are Berth 3 (mainly grain export) and Berths 5 and 7 (iron ore export). Despite the relatively sheltered location, there have been issues in the port with broken mooring lines and excessive ship motions related to long-period waves in the port. Moreover, the operability of some of the berths has decreased after successive construction activities, particularly: ‚ the addition of Berth 6, ‚ the construction of the Batavia Coast Marina to the east of the port, ‚ the deepening of the entrance channel and port basin. Various metocean data collection studies have identified that the long waves are generated as swell wave groups travel over the wide and shallow reef directly to the north and northwest of the port [1–3]. The long waves refract on the outskirts of this reef and the side slopes of the channel and diffract around the western breakwater into the port. J. Mar. Sci. Eng. 2016, 4, 3; doi:10.3390/jmse4010003 www.mdpi.com/journal/jmse
-
Upload
khangminh22 -
Category
Documents
-
view
1 -
download
0
Transcript of Improvement of Mooring Configurations in Geraldton Harbour

Article
Improvement of Mooring Configurations inGeraldton HarbourWim van der Molen 1,*, Doug Scott 1,†, David Taylor 2,† and Trevor Elliott 1,†
Received: 5 October 2015; Accepted: 15 December 2015; Published: 24 December 2015Academic Editor: Charitha Pattiaratchi
1 W.F. Baird & Associates Coastal Engineers Ltd., Ottawa, ON, K1V 0Y3, Canada; [email protected] (D.S.);[email protected] (T.E.)
2 Baird Australia Pty. Ltd., Level 14, 309 Kent St., Sydney, NSW, 2000, Australia; [email protected]* Correspondence: [email protected]; Tel.: +1-613-731-8900; Fax: +1-613-731-9778† These authors contributed equally to this work.
Abstract: Ports exposed to high energy long wave conditions can experience significantly reducedberth operability. Geraldton is perhaps one of the best known examples. Recent studies to mitigatethe problems have concentrated on the reduction of the long waves by extending the breakwater.However, this is quite costly. Various countermeasures related to the mooring configuration aredefined and analysed in this paper. The analysed alternatives are use of shore-based mooring lines,installation of softer fenders, a combination of these two, and deployment of Cavotec MoorMaster™units. These alternatives were compared with the existing mooring configuration and with theoption to extend the breakwater. The best improvement (50% increase of threshold long wave heightinside the harbour) is reached by installing a combination of pneumatic fenders and constant tensionwinches set to 30 t, or nylon breast lines on a brake winch with a pretension of 25 t. In this way, thevessel is pulled into the fenders and fender friction prevents excessive surging of the ship alongthe berth.
Keywords: long waves; moored ships; port engineering
1. Introduction
Geraldton Harbour is located on the west coast of Australia, 370 km north from Perth, on thenorthern side of a headland that provides a natural protection against the prevailing swells from thesouthwest. The location and layout of the existing port with seven berths are shown in Figure 1. Berth1/2 is essentially operated as one berth. The most occupied berths are Berth 3 (mainly grain export)and Berths 5 and 7 (iron ore export). Despite the relatively sheltered location, there have been issuesin the port with broken mooring lines and excessive ship motions related to long-period waves inthe port. Moreover, the operability of some of the berths has decreased after successive constructionactivities, particularly:
‚ the addition of Berth 6,‚ the construction of the Batavia Coast Marina to the east of the port,‚ the deepening of the entrance channel and port basin.
Various metocean data collection studies have identified that the long waves are generated asswell wave groups travel over the wide and shallow reef directly to the north and northwest of theport [1–3]. The long waves refract on the outskirts of this reef and the side slopes of the channel anddiffract around the western breakwater into the port.
J. Mar. Sci. Eng. 2016, 4, 3; doi:10.3390/jmse4010003 www.mdpi.com/journal/jmse

J. Mar. Sci. Eng. 2016, 4, 3 2 of 20J. Mar. Sci. Eng. 2016, 4, 0000
2/20
Figure 1. Aerial photo of Geraldton (left; source Google Earth) and layout of the Geraldton Port
showing the commercial Berths N° 1 through 7 (right).
The most recent studies to mitigate the long wave problems in the port have concentrated on the
reduction of the long wave energy in the port. A 350 m extension of the Western Breakwater was
found to lead to approximately a 35% reduction of the long wave height in the port [4]. However, a
35% reduction of the long wave energy does not necessarily mean a 35% reduction of the response of
the moored vessels, as will be discussed in the this paper, because the lower frequency long waves
are reduced less than the higher frequency long wave component.
Other possible mitigation measures involve improvement of the mooring configuration, which
is the topic of this paper. Several modifications have been adopted in other ports around the world,
such as installation of winches on the berth [5,6], replacing stiff buckling fenders with soft pneumatic
fenders [7], or installation of alternative mooring systems such as the MoorMaster™ vacuum mooring
system [8] and the ShoreTension® hydraulic mooring system [9]. Shore‐based mooring lines were
adopted at Berth 1/2 in Geraldton and MoorMaster units were deployed at Berth 7 during the
construction of this berth. Neither of these solutions was permanent.
It is shown in this paper that alternative solutions are available that provide more improvement
than the originally tested shore‐based mooring lines, and that are more cost‐effective than
MoorMaster units. A combination of stronger and softer shore‐based mooring lines in combination
with softer fenders leads to a significant improvement of the response of the moored vessel and a
related reduction of the mooring line forces. The improvement is better than the improvement
resulting from a 350 m extension of the Western Breakwater.
The analysis and dynamic mooring simulations are focused on Berth 5, which is the berth with
the highest occupancy and the highest value cargo (iron ore). An assessment of the existing mooring
configuration at Berth 5 and possible mitigation measures to improve this are discussed in Section 2.
The methodology and the set‐up of the moored ship response modelling to verify the mitigation
measures are described in Sections 3 and 4, respectively. The results are provided and discussed in
Section 5 and the conclusions of the study are given in Section 6.
2. Assessment of the Mooring Configuration
2.1. Existing Mooring Configuration at Berth 5
Berth 5 is an iron ore loading berth. Vessels that are moored at this berth are mainly Panamax
vessels with a length over all between 190 m and 225 m. There is one conveyer belt shiploader that
can travel along the berth over a rail. A plan view of a ship moored at Berth 5 with a typical mooring
arrangement is shown in Figure 2.
Figure 1. Aerial photo of Geraldton (left; source Google Earth) and layout of the Geraldton Portshowing the commercial Berths N˝ 1 through 7 (right).
The most recent studies to mitigate the long wave problems in the port have concentrated onthe reduction of the long wave energy in the port. A 350 m extension of the Western Breakwater wasfound to lead to approximately a 35% reduction of the long wave height in the port [4]. However, a35% reduction of the long wave energy does not necessarily mean a 35% reduction of the response ofthe moored vessels, as will be discussed in the this paper, because the lower frequency long wavesare reduced less than the higher frequency long wave component.
Other possible mitigation measures involve improvement of the mooring configuration, whichis the topic of this paper. Several modifications have been adopted in other ports around the world,such as installation of winches on the berth [5,6], replacing stiff buckling fenders with soft pneumaticfenders [7], or installation of alternative mooring systems such as the MoorMaster™ vacuum mooringsystem [8] and the ShoreTensionr hydraulic mooring system [9]. Shore-based mooring lines wereadopted at Berth 1/2 in Geraldton and MoorMaster units were deployed at Berth 7 during theconstruction of this berth. Neither of these solutions was permanent.
It is shown in this paper that alternative solutions are available that provide more improvementthan the originally tested shore-based mooring lines, and that are more cost-effective thanMoorMaster units. A combination of stronger and softer shore-based mooring lines in combinationwith softer fenders leads to a significant improvement of the response of the moored vessel anda related reduction of the mooring line forces. The improvement is better than the improvementresulting from a 350 m extension of the Western Breakwater.
The analysis and dynamic mooring simulations are focused on Berth 5, which is the berth withthe highest occupancy and the highest value cargo (iron ore). An assessment of the existing mooringconfiguration at Berth 5 and possible mitigation measures to improve this are discussed in Section 2.The methodology and the set-up of the moored ship response modelling to verify the mitigationmeasures are described in Sections 3 and 4 respectively. The results are provided and discussed inSection 5 and the conclusions of the study are given in Section 6.
2. Assessment of the Mooring Configuration
2.1. Existing Mooring Configuration at Berth 5
Berth 5 is an iron ore loading berth. Vessels that are moored at this berth are mainly Panamaxvessels with a length over all between 190 m and 225 m. There is one conveyer belt shiploader thatcan travel along the berth over a rail. A plan view of a ship moored at Berth 5 with a typical mooringarrangement is shown in Figure 2.

J. Mar. Sci. Eng. 2016, 4, 3 3 of 20J. Mar. Sci. Eng. 2016, 4, 0000
3/20
Figure 2. Panamax bulk carrier moored at Berth 5 with a typical mooring layout (mooring lines
highlighted in yellow; spring lines and outer bow/stern lines are double; source: Google Earth).
There are five breasting dolphins with Supercone fenders. For a regular mooring layout the
centre three fenders are within the parallel sides of the vessel (so touch the hull). The aftmost fender
never touches. The forwardmost fender may touch depending on the length of the ship, bow shape,
and exact position of the ship along the berth.
The fact that only three fenders may touch the hull is considered suboptimal, because the ship
is more free to yaw and the fenders can be overloaded when the vessel sways and yaws significantly
due to long wave action in the port.
Ships of this size usually carry 14 mooring lines, generally polypropylene, polyester or a
composite of these two, which all have similar load‐elongation characteristics. These lines are easy to
handle, but may be weak due to abrasion and bad maintenance. This is often an important cause of
breakage of mooring lines. Moreover, a chain reaction of multiple line failures can happen after one
bad line breaks and other lines have to take the extra load.
The mooring layout at Berth 5 is 3‐2‐2 for the number of bow/stern lines, breast lines and spring
lines on either side of the ship. This is shown in Figure 2, although the spring lines are not very clear
in the picture. The two bollards to the south of the berth are used for the stern lines and aft breast
lines. The bollards on top of the breasting dolphins are used for the spring lines. A bollard just to the
north of the conveyer belt is used for the forward breast lines and a bollard on the quay side of Berth 6
is used for the bow lines.
All lines, except the spring lines are long, which means that they cannot easily break when the
ship makes small surge or sway motions. The spring lines are shorter, but appear to have less
pretension to reduce the risk of line breakage. Higher pretension is required in the breast lines to pull
the ship against the fenders.
In summary, the mooring layout is considered fairly optimal. The placement of breasting
dolphins may not be optimal, but is costly to improve. Therefore, it is recommended to assess other
options than changing the presently adopted mooring layout to reduce the risk of mooring line
failures at Berth 5.
2.2. Possible Mitigation Measures to Improve the Mooring Configuration
There are several options available to improve the mooring conditions of a vessel at berth. There are
in general two ways to achieve this:
1. Reducing mooring loads by softening the mooring system;
2. Reducing the response of the ship by constraining it more.
The first approach is generally applied at offshore berths in large seas or swells. Conventional buoy
moorings and single point moorings are very soft allowing the ship to move freely. At offshore jetties
the mooring dolphins are placed far away from the berthing line and often soft fenders are used to
allow larger movements of the ship.
Figure 2. Panamax bulk carrier moored at Berth 5 with a typical mooring layout (mooring lineshighlighted in yellow; spring lines and outer bow/stern lines are double; source: Google Earth).
There are five breasting dolphins with Supercone fenders. For a regular mooring layout thecentre three fenders are within the parallel sides of the vessel (so touch the hull). The aftmost fendernever touches. The forwardmost fender may touch depending on the length of the ship, bow shape,and exact position of the ship along the berth.
The fact that only three fenders may touch the hull is considered suboptimal, because the shipis more free to yaw and the fenders can be overloaded when the vessel sways and yaws significantlydue to long wave action in the port.
Ships of this size usually carry 14 mooring lines, generally polypropylene, polyester or acomposite of these two, which all have similar load-elongation characteristics. These lines are easy tohandle, but may be weak due to abrasion and bad maintenance. This is often an important cause ofbreakage of mooring lines. Moreover, a chain reaction of multiple line failures can happen after onebad line breaks and other lines have to take the extra load.
The mooring layout at Berth 5 is 3-2-2 for the number of bow/stern lines, breast lines and springlines on either side of the ship. This is shown in Figure 2, although the spring lines are not very clearin the picture. The two bollards to the south of the berth are used for the stern lines and aft breastlines. The bollards on top of the breasting dolphins are used for the spring lines. A bollard just tothe north of the conveyer belt is used for the forward breast lines and a bollard on the quay side ofBerth 6 is used for the bow lines.
All lines, except the spring lines are long, which means that they cannot easily break whenthe ship makes small surge or sway motions. The spring lines are shorter, but appear to have lesspretension to reduce the risk of line breakage. Higher pretension is required in the breast lines to pullthe ship against the fenders.
In summary, the mooring layout is considered fairly optimal. The placement of breastingdolphins may not be optimal, but is costly to improve. Therefore, it is recommended to assessother options than changing the presently adopted mooring layout to reduce the risk of mooringline failures at Berth 5.
2.2. Possible Mitigation Measures to Improve the Mooring Configuration
There are several options available to improve the mooring conditions of a vessel at berth. Thereare in general two ways to achieve this:
1. Reducing mooring loads by softening the mooring system;2. Reducing the response of the ship by constraining it more.
The first approach is generally applied at offshore berths in large seas or swells. Conventionalbuoy moorings and single point moorings are very soft allowing the ship to move freely. At offshorejetties the mooring dolphins are placed far away from the berthing line and often soft fenders areused to allow larger movements of the ship.

J. Mar. Sci. Eng. 2016, 4, 3 4 of 20
The second approach works such that the vessel is not able to build up momentum and thereforethe mooring loads are smaller, even though the mooring system itself is stiffer. Alternative mooringsystems are generally based on this philosophy.
Various options are available:
‚ Shore-based mooring lines,‚ Softer fenders,‚ A combination of softer fenders and shore-based mooring lines,‚ MoorMaster vacuum mooring system,‚ ShoreTension hydraulic mooring system,‚ Dock Lock magnetic mooring system.
A general description of these options is presented in the following sections.
2.2.1. Shore-Based Mooring Lines
Conventionally, ships carry their own mooring lines that are used to moor the ship in the port.These lines are usually selected based on guidelines for potential loads due to wind and current, e.g.,from the OCIMF Mooring Equipment Guidelines for tankers [10]. Potential loads due to long wavesas experienced in the Port of Geraldton are generally not taken into account. Moreover, many bulkcarriers carry old and worn-out lines that can break when the vessel visits a port with above-averageenvironmental conditions, such as in Geraldton.
The purpose of providing mooring lines from the port will be to use stronger lines and to uselines that are guaranteed to be well-maintained. Another related advantage is that higher pretensioncan be applied to pull the ship against the fenders, and that the pretension can be monitored by portstaff, thus not relying on the vessel’s crew.
Shore-based mooring lines can be deployed by connecting the lines between a bit on the shipand a bollard on the quay and using a towing motor to tension the line. The advantage of this is thatonly one motor is required to tension all lines. However, the capacity is limited. Moreover, it is notstraightforward to change the pretension during the loading process, which may be needed due todraft changes or water level fluctuations. A better and more versatile, but also more costly, optionwould be to connect each line to a winch on the wharf. This solution was adopted at the Dahej LNGterminal in India to reduce vessel motions [5].
Four options are evaluated in this paper:
‚ Provide flexible nylon mooring tails. The tails can be connected to the ship’s lines to providemore flexibility. The ship’s winches can be used to provide pretension.
‚ Provide strong and stiff Dyneema lines with flexible nylon tails. These lines are strong andlight for easy handling. The nylon tails provide the required flexibility to reduce the line loads.A towing motor is used to apply pretension.
‚ Provide strong and flexible nylon breast lines. These lines can be put under a high pretensionwithout critically risking line breakage, because the ropes are very soft. A regular brake winchon the wharf is used to set and manually change pretension.
‚ Provide strong and fairly stiff breast lines connected to a constant tension winch on thewharf. The winch pays the line in and out as the vessel sways and yaws to maintain the setpretension value.
The first and second options with only mooring tails or lines provided are fairly cheap and easyto implement. The third and fourth options with winches on the wharf for the breast lines are basedon the philosophy that it is beneficial to press the vessel tightly to the fenders. The two most extremecases are considered here, one with a brake winch and one with a perfect constant tension winches.There are, however, also constant tension winches that do not respond immediately, or that only payout or in outside certain render and recovery limits, respectively.

J. Mar. Sci. Eng. 2016, 4, 3 5 of 20
2.2.2. Soft Fenders
Generally, buckling fenders are used in harbours to absorb berthing energy and to protectquay walls and berthing dolphins. Common types are cell fenders and cone fenders, such as theSupercone fenders used in Geraldton. These fenders combine good energy absorption with a lowrated maximum force, which is beneficial for the design of berthing dolphins. However, the initialstiffness (at small compressions) for these fenders is very high. As a result, the vessel is “bounced”away from the fender and can therefore surge easily without friction from the fender panels. It is alsonoted that the usually applied low-friction fender panels may be beneficial for the tensile loadingon the core of the fender, but do not provide much resistance against surging of the vessel alongthe berth.
Softer fenders are used in many offshore oil and LNG jetties because of the good performanceunder adverse mooring conditions. Typical types are:
‚ pneumatic fenders, or‚ air block fenders.
A picture of a pneumatic fender is shown in Figure 3. These fenders provide more flexibility sothat the natural period of the moored ship is away from the swell period and so that the ship stays inthe fenders when moored. A requirement for the latter is that adequate pretension is applied in thebreast lines.
J. Mar. Sci. Eng. 2016, 4, 0000
5/20
2.2.2. Soft Fenders
Generally, buckling fenders are used in harbours to absorb berthing energy and to protect quay
walls and berthing dolphins. Common types are cell fenders and cone fenders, such as the Supercone
fenders used in Geraldton. These fenders combine good energy absorption with a low rated
maximum force, which is beneficial for the design of berthing dolphins. However, the initial stiffness
(at small compressions) for these fenders is very high. As a result, the vessel is “bounced” away from
the fender and can therefore surge easily without friction from the fender panels. It is also noted that
the usually applied low‐friction fender panels may be beneficial for the tensile loading on the core of
the fender, but do not provide much resistance against surging of the vessel along the berth.
Softer fenders are used in many offshore oil and LNG jetties because of the good performance
under adverse mooring conditions. Typical types are:
• pneumatic fenders, or
• air block fenders.
A picture of a pneumatic fender is shown in Figure 3. These fenders provide more flexibility so
that the natural period of the moored ship is away from the swell period and so that the ship stays in the
fenders when moored. A requirement for the latter is that adequate pretension is applied in the breast lines.
Figure 3. Pneumatic fenders.
Pneumatic fenders are floating objects that can be connected to the wharf with chains. Air block
fenders look more similar to cell fenders with a cylindrical core and a flat fender panel. However, the
fender force is not significantly provided by the deformation of rubber, but by compression of the air
in the cylinder.
2.2.3. Combination of Soft Fenders and Large Tension in Breast Lines
Mitigation measures considering either different mooring lines or different fenders were
discussed in the previous sections. Some of these mitigation measures can be combined such that the
two systems (mooring lines and fenders) work together to achieve a better reduction of vessel motions
and/or reduction of mooring forces. The combinations that are investigated in this paper are:
• pneumatic fenders and shore‐based nylon breast lines,
• pneumatic fenders and constant tension winches on the breast lines,
• air block fenders and constant tension winches on the breast lines.
The concept for all these three options is that the ship is pulled into the fenders using a large
pretension force, which is more effective with the softer fenders than with stiff buckling fenders.
Figure 3. Pneumatic fenders.
Pneumatic fenders are floating objects that can be connected to the wharf with chains. Air blockfenders look more similar to cell fenders with a cylindrical core and a flat fender panel. However, thefender force is not significantly provided by the deformation of rubber, but by compression of the airin the cylinder.
2.2.3. Combination of Soft Fenders and Large Tension in Breast Lines
Mitigation measures considering either different mooring lines or different fenders werediscussed in the previous sections. Some of these mitigation measures can be combined such thatthe two systems (mooring lines and fenders) work together to achieve a better reduction of vesselmotions and/or reduction of mooring forces. The combinations that are investigated in this paper are:
‚ pneumatic fenders and shore-based nylon breast lines,‚ pneumatic fenders and constant tension winches on the breast lines,‚ air block fenders and constant tension winches on the breast lines.
The concept for all these three options is that the ship is pulled into the fenders using a largepretension force, which is more effective with the softer fenders than with stiff buckling fenders.

J. Mar. Sci. Eng. 2016, 4, 3 6 of 20
2.2.4. MoorMaster™ Vacuum Mooring System
MoorMaster is an innovative mooring concept by Cavotec (Christchurch, New Zealand)consisting of vacuum pads, which attach to the ship hull, and that are connected to a unit on thequay with flexible hydraulic arms. The pads can move freely in heave (to follow tidal movementsand the loading of the ship) and provide stiffness and damping to the vessel movements in surgeand sway. The forces in the pads are controlled by an electrical PID control system in the unit. Themaximum force in a standard MM200 unit does not exceed 100 kN in surge and 200 kN in sway.
The MoorMaster mooring is initially very stiff and is therefore based on the philosophy that theship should not build up momentum in the ship motions. In this way, the vessel motions are keptsmall, while the maximum force in the pads is capped at the abovementioned values. A large enoughnumber of units needs to be adopted at the berth for the system to be effective and provide adequatedamping. The units are not very effective when the vessel motions increase, since the maximumforces are capped at a fairly low value.
A description of prototype measurements and numerical modelling of MoorMaster units withQuaysim is given in Goring [8] and De Bont et al. [11], both for the container terminal of the Port ofSalalah, Oman. A picture of a MoorMaster unit in Salalah is shown in Figure 4.
J. Mar. Sci. Eng. 2016, 4, 0000
6/20
2.2.4. MoorMaster™ Vacuum Mooring System
MoorMaster is an innovative mooring concept by Cavotec (Christchurch, New Zealand)
consisting of vacuum pads, which attach to the ship hull, and that are connected to a unit on the quay
with flexible hydraulic arms. The pads can move freely in heave (to follow tidal movements and the
loading of the ship) and provide stiffness and damping to the vessel movements in surge and sway.
The forces in the pads are controlled by an electrical PID control system in the unit. The maximum
force in a standard MM200 unit does not exceed 100 kN in surge and 200 kN in sway.
The MoorMaster mooring is initially very stiff and is therefore based on the philosophy that the
ship should not build up momentum in the ship motions. In this way, the vessel motions are kept
small, while the maximum force in the pads is capped at the abovementioned values. A large enough
number of units needs to be adopted at the berth for the system to be effective and provide adequate
damping. The units are not very effective when the vessel motions increase, since the maximum
forces are capped at a fairly low value.
A description of prototype measurements and numerical modelling of MoorMaster units with
Quaysim is given in Goring [8] and De Bont et al. [11], both for the container terminal of the Port of
Salalah, Oman. A picture of a MoorMaster unit in Salalah is shown in Figure 4.
Figure 4. MoorMaster unit connected to a container ship (Source: Cavotec [12]).
2.2.5. Other Alternative Mooring Systems
In addition to MoorMaster, other alternative mooring concepts have been developed in recent
years. Two noteworthy systems are ShoreTenstion® from the KRVE (Rotterdam, The Netherlands)
and Mampaey’s Dock Lock® (Dordrecht, The Netherlands). The ShoreTension system consists of a
long cylinder with a hydraulically controlled piston that can move in and out. The unit is usually
placed between two bollards on the quay and stiff rope is lead from the head of the piston through a
pulley at the bollard to the fairlead and a bitt on the ship. ShoreTension units do not need to be
connected to all mooring lines, but they can be added or replace a few lines, thus providing additional
pretension and damping to the vessel motions. A (non‐technical) description of the ShoreTension
mooring system is given by Van der Burg [13] and a numerical investigation of the behaviour of the
ShoreTension system is provided by Van Deyzen et al. [14].
The Dock Lock® system consists of electronically controlled magnets connected to the main unit
with hydraulic arms. The strong magnetic field guarantees a solid attachment to the ship’s hull, but
does not penetrate into the ship beyond the hull plate. The Dock Lock system is currently used on
bunker vessels that are used to transfer fuel to ships in the port, but can also be used on berths with
the objective to reduce vessel motions due to long waves. A non‐technical description of the system
Figure 4. MoorMaster unit connected to a container ship (Source: Cavotec [12]).
2.2.5. Other Alternative Mooring Systems
In addition to MoorMaster, other alternative mooring concepts have been developed in recentyears. Two noteworthy systems are ShoreTenstionr from the KRVE (Rotterdam, The Netherlands)and Mampaey’s Dock Lockr (Dordrecht, The Netherlands). The ShoreTension system consists of along cylinder with a hydraulically controlled piston that can move in and out. The unit is usuallyplaced between two bollards on the quay and stiff rope is lead from the head of the piston througha pulley at the bollard to the fairlead and a bitt on the ship. ShoreTension units do not need to beconnected to all mooring lines, but they can be added or replace a few lines, thus providing additionalpretension and damping to the vessel motions. A (non-technical) description of the ShoreTensionmooring system is given by Van der Burg [13] and a numerical investigation of the behaviour of theShoreTension system is provided by Van Deyzen et al. [14].
The Dock Lockr system consists of electronically controlled magnets connected to the main unitwith hydraulic arms. The strong magnetic field guarantees a solid attachment to the ship’s hull, butdoes not penetrate into the ship beyond the hull plate. The Dock Lock system is currently used onbunker vessels that are used to transfer fuel to ships in the port, but can also be used on berths withthe objective to reduce vessel motions due to long waves. A non-technical description of the system isgiven by Van Reenen [15]. The Dock Lock system is not part of the modelling investigation presentedin this paper. However, this system could be included in further studies.

J. Mar. Sci. Eng. 2016, 4, 3 7 of 20
3. Methodology
The effectiveness of the mitigation measures is tested using numerical simulation of the motionsof the moored ship at the berth. A schematic overview if the modelling process is presented inFigure 5.
J. Mar. Sci. Eng. 2016, 4, 0000
7/20
is given by Van Reenen [15]. The Dock Lock system is not part of the modelling investigation
presented in this paper. However, this system could be included in further studies.
3. Methodology
The effectiveness of the mitigation measures is tested using numerical simulation of the motions
of the moored ship at the berth. A schematic overview if the modelling process is presented in Figure 5.
Figure 5. Flow chart of the numerical modelling approach.
The wave forcing is obtained from the results of available wave simulations at the berth with
Funwave [16] from MetOcean Solutions [17,18]. The incident short wave frequency spectra were
obtained from the time series of surface elevations. The long wave components in the standing long
wave pattern along the berth were derived from the time series of surface elevations and velocities
using the Matlab toolbox DIWASP [19].
The wave forces are subsequently determined with Wavescat [20] from the incident short and
long wave frequency‐direction spectra at berth, including the effects of diffraction around the ship
hull and interaction with the quay. The wave forces are the exciting forces on the moored ship.
The simulation of ship motions with the interaction with the mooring system is modelled with
Quaysim [11].
3.1. Wavescat
The Baird in‐house model Wavescat is a 3D wave diffraction model based on the
boundary‐integral equation method (BIEM). It is possible to include multiple bodies, e.g., to model
the effect of a revetment close to the ship. The results are added mass and damping coefficients, first
order wave forces, and drift forces.
3.2. Quaysim
The ship motions for the dynamic mooring analysis are determined with the Baird in‐house
model Quaysim. This program comprises a time domain simulation to analyse the dynamic
behaviour of a moored ship subject to combined swell and long waves. The mooring line and fender
loads follow from the computed ship motions and the characteristics of the mooring lines and
fenders. Because the computations are made in the time‐domain, nonlinearities such as the
asymmetry in the mooring system (stiff into the fenders and soft away from the fenders), nonlinear
characteristics of mooring lines and fenders, the effect of fender friction, and the effect of low‐frequency
hydrodynamic damping can all be incorporated in the simulation. The added mass and damping
coefficients are obtained from a pre‐computed hydrodynamic file as prepared with Wavescat.
Figure 5. Flow chart of the numerical modelling approach.
The wave forcing is obtained from the results of available wave simulations at the berth withFunwave [16] from MetOcean Solutions [17,18]. The incident short wave frequency spectra wereobtained from the time series of surface elevations. The long wave components in the standing longwave pattern along the berth were derived from the time series of surface elevations and velocitiesusing the Matlab toolbox DIWASP [19].
The wave forces are subsequently determined with Wavescat [20] from the incident short andlong wave frequency-direction spectra at berth, including the effects of diffraction around the shiphull and interaction with the quay. The wave forces are the exciting forces on the moored ship.The simulation of ship motions with the interaction with the mooring system is modelled withQuaysim [11].
3.1. Wavescat
The Baird in-house model Wavescat is a 3D wave diffraction model based on the boundary-integralequation method (BIEM). It is possible to include multiple bodies, e.g., to model the effect of arevetment close to the ship. The results are added mass and damping coefficients, first order waveforces, and drift forces.
3.2. Quaysim
The ship motions for the dynamic mooring analysis are determined with the Baird in-housemodel Quaysim. This program comprises a time domain simulation to analyse the dynamicbehaviour of a moored ship subject to combined swell and long waves. The mooring line and fenderloads follow from the computed ship motions and the characteristics of the mooring lines and fenders.Because the computations are made in the time-domain, nonlinearities such as the asymmetry in themooring system (stiff into the fenders and soft away from the fenders), nonlinear characteristics ofmooring lines and fenders, the effect of fender friction, and the effect of low-frequency hydrodynamicdamping can all be incorporated in the simulation. The added mass and damping coefficients areobtained from a pre-computed hydrodynamic file as prepared with Wavescat.
Different mooring configurations can be tested by including different characteristics of mooringlines and fenders. A mooring system with MoorMaster™ units can also be investigated. For this, thePID control system in the units is simulated in the model to control the forces in the vacuum pads.

J. Mar. Sci. Eng. 2016, 4, 3 8 of 20
4. Model Set-Up
Dynamic mooring simulations were carried out with the time domain moored ship responsemodel Quaysim to investigate the effect of various mitigation measures, as described in Section 2,on a vessel moored at Berth 5.
Berth 5 consists of a deck on piles over a revetment with an approximated steepness of 1:1.75. Theeffect of the revetment was included in the hydrodynamic modelling. Forces in sway and momentsin yaw are, therefore, also exerted on the vessel even though the long waves were assumed parallelto the berth.
The vessel is a typical Panamax bulk carrier with a draft close to the maximum allowable draftin the Port of Geraldton. A laden vessel is considered, because laden vessels generally respond morein long waves. The main dimension of the vessel are given in Table 1.
Table 1. Main dimensions of the Panamax bulk carrier.
Length Over All 225.00 mBeam 32.24 mDraft 12.50 m
A total of 11 mooring configurations were considered in the dynamic mooring simulations. Theconfigurations are one Base Case (existing conditions) and ten mitigation measures based on the ideasand optimisation philosophies outlined in Section 2, namely:
‚ nylon tails,‚ Dyneema lines with nylon tails,‚ nylon breast lines,‚ constant tension winches on breast lines,‚ pneumatic fenders,‚ air block fenders,‚ pneumatic fenders + nylon breast lines,‚ pneumatic fenders + constant tension winches on breast lines,‚ air block fenders + constant tension winches on breast lines,‚ MoorMaster™.
The long-elongation characteristics of the polypropylene and braided nylon mooring ropes arepresented in Figure 6 and the load-compression characteristics of the three tested fender types arepresented in Figure 7.
J. Mar. Sci. Eng. 2016, 4, 0000
8/20
Different mooring configurations can be tested by including different characteristics of mooring
lines and fenders. A mooring system with MoorMaster™ units can also be investigated. For this, the
PID control system in the units is simulated in the model to control the forces in the vacuum pads.
4. Model Set‐Up
Dynamic mooring simulations were carried out with the time domain moored ship response
model Quaysim to investigate the effect of various mitigation measures, as described in Section 2, on
a vessel moored at Berth 5.
Berth 5 consists of a deck on piles over a revetment with an approximated steepness of 1:1.75.
The effect of the revetment was included in the hydrodynamic modelling. Forces in sway and
moments in yaw are, therefore, also exerted on the vessel even though the long waves were assumed
parallel to the berth.
The vessel is a typical Panamax bulk carrier with a draft close to the maximum allowable draft
in the Port of Geraldton. A laden vessel is considered, because laden vessels generally respond more
in long waves. The main dimension of the vessel are given in Table 1.
Table 1. Main dimensions of the Panamax bulk carrier.
Length Over All 225.00 m Beam 32.24 m
Draft 12.50 m
A total of 11 mooring configurations were considered in the dynamic mooring simulations.
The configurations are one Base Case (existing conditions) and ten mitigation measures based on the
ideas and optimisation philosophies outlined in Section 2, namely:
• nylon tails,
• Dyneema lines with nylon tails,
• nylon breast lines,
• constant tension winches on breast lines,
• pneumatic fenders,
• air block fenders,
• pneumatic fenders + nylon breast lines,
• pneumatic fenders + constant tension winches on breast lines,
• air block fenders + constant tension winches on breast lines,
• MoorMaster™.
The long‐elongation characteristics of the polypropylene and braided nylon mooring ropes are
presented in Figure 6 and the load‐compression characteristics of the three tested fender types are
presented in Figure 7.
Figure 6. Mooring line load-elonation curves for polypropylene (—) and braided nylon, stiff (- -) andsoft (¨ ´¨ ).
J. Mar. Sci. Eng. 2016, 4, 3 9 of 20
J. Mar. Sci. Eng. 2016, 4, 0000
9/20
Figure 6. Mooring line load‐elonation curves for polypropylene (―) and braided nylon, stiff (‐ ‐) and
soft (·−·).
Figure 7. Fender load‐compression curves for Supercone fender SCN 1200 E1.1 (―), Pneumatic fender
2500 × 4000 (− −) and airblock fender 1800 × 1800 (·−·).
The chosen characteristic for polypropylene is fairly stiff, which is conservative with respect to
mooring line forces. For nylon ropes there is more variety in characteristics. The variability depends
on the rope manufacturer, but also on factors that are not easy to control, such as age of the line, water
absorption, etc. The softer of the two characteristics for nylon is used for nylon breast lines and the
stiffer one for the nylon tails, which appeared most conservative in these cases.
4.1. Base Case
The Base Case is a standard mooring configuration and mooring layout as currently adopted in
port. The Panamax bulk carrier is assumed to carry 14 polypropylene mooring lines with a breaking
strength of 607 kN. The mooring layout is 3‐2‐2 for the number of bow/stern, breast and spring lines,
forward and aft, as shown in Figure 8. The fenders are Supercone 1200 E1.1 fenders. This fender has
a rated energy absorption of 668 kNm and a rated fender force of 1073 kN. There are five fenders at
the berth. The aft fender (not shown in Figure 8) does not touch the vessel. The forward fender is
assumed to leave a gap of 1 m with the ship’s hull.
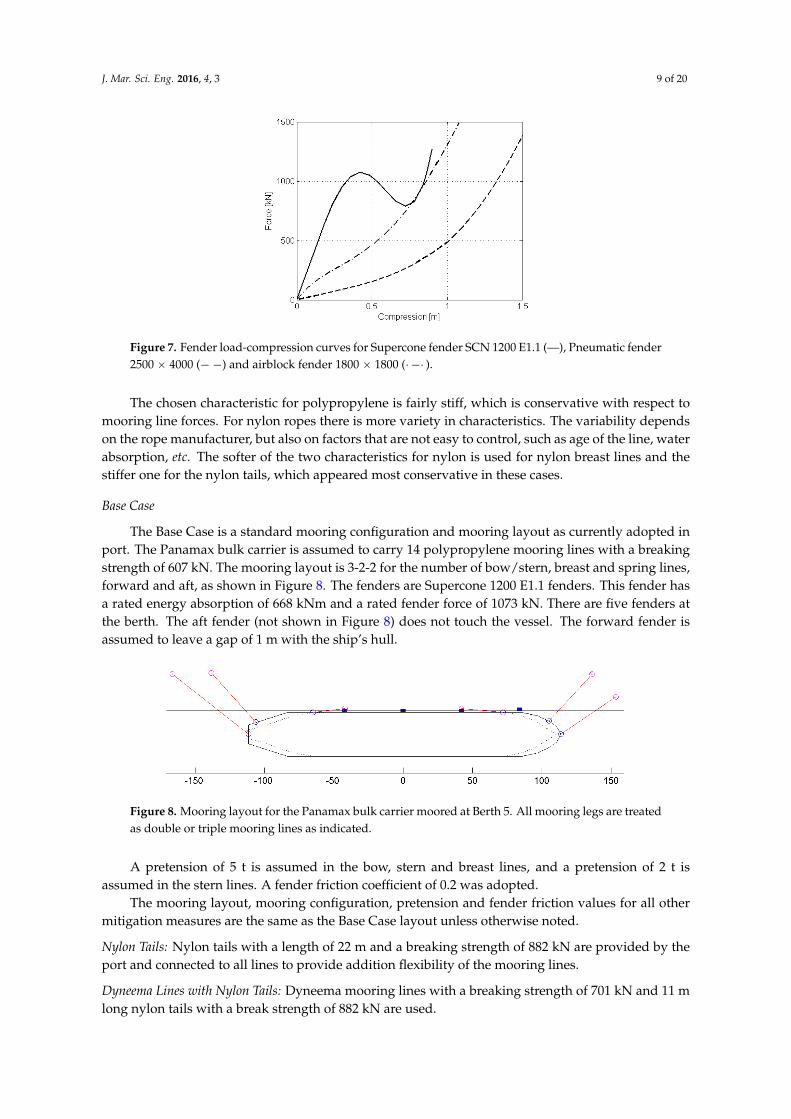
Figure 8. Mooring layout for the Panamax bulk carrier moored at Berth 5. All mooring legs are treated
as double or triple mooring lines as indicated.
A pretension of 5 t is assumed in the bow, stern and breast lines, and a pretension of 2 t is
assumed in the stern lines. A fender friction coefficient of 0.2 was adopted.
The mooring layout, mooring configuration, pretension and fender friction values for all other
mitigation measures are the same as the Base Case layout unless otherwise noted.
Nylon Tails: Nylon tails with a length of 22 m and a breaking strength of 882 kN are provided by the
port and connected to all lines to provide addition flexibility of the mooring lines.
Figure 7. Fender load-compression curves for Supercone fender SCN 1200 E1.1 (—), Pneumatic fender2500 ˆ 4000 (´ ´) and airblock fender 1800 ˆ 1800 (¨ ´¨ ).
The chosen characteristic for polypropylene is fairly stiff, which is conservative with respect tomooring line forces. For nylon ropes there is more variety in characteristics. The variability dependson the rope manufacturer, but also on factors that are not easy to control, such as age of the line, waterabsorption, etc. The softer of the two characteristics for nylon is used for nylon breast lines and thestiffer one for the nylon tails, which appeared most conservative in these cases.
Base Case
The Base Case is a standard mooring configuration and mooring layout as currently adopted inport. The Panamax bulk carrier is assumed to carry 14 polypropylene mooring lines with a breakingstrength of 607 kN. The mooring layout is 3-2-2 for the number of bow/stern, breast and spring lines,forward and aft, as shown in Figure 8. The fenders are Supercone 1200 E1.1 fenders. This fender hasa rated energy absorption of 668 kNm and a rated fender force of 1073 kN. There are five fenders atthe berth. The aft fender (not shown in Figure 8) does not touch the vessel. The forward fender isassumed to leave a gap of 1 m with the ship’s hull.
J. Mar. Sci. Eng. 2016, 4, 0000
9/20
Figure 6. Mooring line load‐elonation curves for polypropylene (―) and braided nylon, stiff (‐ ‐) and
soft (·−·).
Figure 7. Fender load‐compression curves for Supercone fender SCN 1200 E1.1 (―), Pneumatic fender
2500 × 4000 (− −) and airblock fender 1800 × 1800 (·−·).
The chosen characteristic for polypropylene is fairly stiff, which is conservative with respect to
mooring line forces. For nylon ropes there is more variety in characteristics. The variability depends
on the rope manufacturer, but also on factors that are not easy to control, such as age of the line, water
absorption, etc. The softer of the two characteristics for nylon is used for nylon breast lines and the
stiffer one for the nylon tails, which appeared most conservative in these cases.
4.1. Base Case
The Base Case is a standard mooring configuration and mooring layout as currently adopted in
port. The Panamax bulk carrier is assumed to carry 14 polypropylene mooring lines with a breaking
strength of 607 kN. The mooring layout is 3‐2‐2 for the number of bow/stern, breast and spring lines,
forward and aft, as shown in Figure 8. The fenders are Supercone 1200 E1.1 fenders. This fender has
a rated energy absorption of 668 kNm and a rated fender force of 1073 kN. There are five fenders at
the berth. The aft fender (not shown in Figure 8) does not touch the vessel. The forward fender is
assumed to leave a gap of 1 m with the ship’s hull.
Figure 8. Mooring layout for the Panamax bulk carrier moored at Berth 5. All mooring legs are treated
as double or triple mooring lines as indicated.
A pretension of 5 t is assumed in the bow, stern and breast lines, and a pretension of 2 t is
assumed in the stern lines. A fender friction coefficient of 0.2 was adopted.
The mooring layout, mooring configuration, pretension and fender friction values for all other
mitigation measures are the same as the Base Case layout unless otherwise noted.
Nylon Tails: Nylon tails with a length of 22 m and a breaking strength of 882 kN are provided by the
port and connected to all lines to provide addition flexibility of the mooring lines.
Figure 8. Mooring layout for the Panamax bulk carrier moored at Berth 5. All mooring legs are treatedas double or triple mooring lines as indicated.
A pretension of 5 t is assumed in the bow, stern and breast lines, and a pretension of 2 t isassumed in the stern lines. A fender friction coefficient of 0.2 was adopted.
The mooring layout, mooring configuration, pretension and fender friction values for all othermitigation measures are the same as the Base Case layout unless otherwise noted.
Nylon Tails: Nylon tails with a length of 22 m and a breaking strength of 882 kN are provided by theport and connected to all lines to provide addition flexibility of the mooring lines.
Dyneema Lines with Nylon Tails: Dyneema mooring lines with a breaking strength of 701 kN and 11 mlong nylon tails with a break strength of 882 kN are used.

J. Mar. Sci. Eng. 2016, 4, 3 10 of 20
Nylon Breast Lines: Four nylon breast lines with a breaking strength of 1216 kN on a brake winch onthe wharf are supplied by the port and used instead of the ship’s own breast lines. The pretension inthe breast lines is set at 25 t, while the pretension in the ship’s own lines remains unchanged.
Constant Tension Winches on Breast Lines: Four strong breast lines on a constant tension winch on thewharf are supplied by the port and used instead of the ship’s own breast lines. The pretension in theconstant tension winches is set at 30 t. The pretension in the ship’s own lines remains unchanged.
Pneumatic Fenders: Yokohama pneumatic fenders 2500 ˆ 4000 (diameter ˆ width in mm) with aninitial internal pressure of 0.5 bar are used instead of the existing Supercone fenders. The rated energyabsorption of this pneumatic fender of 663 kNm is similar to the energy absorption of the Superconefender. The rated fender force is 1381 kN. A fender friction coefficient of 0.4 was adopted for thefriction between the rubber tyres, which protect the fender, and the ship hull.
Air Block Fenders: Yokohama air block fenders 1800 ˆ 1800 (height x diameter in mm) with an initialinternal pressure of 1.0 bar are used instead of the existing Supercone fenders. The rated energyabsorption of this pneumatic fender of 682 kNm is similar to the energy absorption of the Superconefender. The rated fender force is 1491 kN.
Pneumatic Fenders + Nylon Breast Lines: A combined mitigation measure is adopted consisting of2500 ˆ 4000 Yokohama pneumatic fenders and four nylon breast lines with a break strength of1216 kN and a pretension of 25 t on a brake winch on the wharf. A fender friction coefficient of0.4 was adopted.
Pneumatic Fenders + Constant Tension Winches: A combined mitigation measure is adopted consistingof 2500 ˆ 4000 Yokohama pneumatic fenders and four breast lines on constant tension winches onthe wharf, set to provide a constant force of 30 t. A fender friction coefficient of 0.4 was adopted.
Air Block Fenders + Constant Tension Winches: A combined mitigation measure is adopted consistingof Yokohama air block fenders 1800 ˆ 1800 and four breast lines on constant tension winches on thewharf, set to provide a constant force of 30 t.
MoorMaster™: Four MoorMaster MM200 units are adopted on each of the three central breastingdolphins for a total of 12 MoorMaster units. The ship may still connect its mooring lines to thebollards, but the lines were neglected in the mooring simulations. The number of units (12) is chosenhere as an example, but should be optimized during more detailed design studies.
5. Results
5.1. Long Waves in the Harbour
Several standing wave patterns occur in the harbour basin. Standing waves in the East-Westdirection travel along the southern berths and standing waves in the North-South direction travelalong the western berths. The natural periods of the harbour basin in these directions are:
‚ East-West direction, first mode between 160 s and 180 s, and second mode near 65 s,‚ North-South direction, first mode near 90 s and second mode near 45 s.
The two modes in the East-West direction do not have a ratio of 2:1 due to effects of the tug boatharbour and the irregular shape near the harbour entrance.
The wave conditions at the berth were obtained from the results of Boussinesq wave modellingwith Funwave by MetOcean Solutions [17] to study the effect of extension of the Western Breakwater.Four measured offshore wave conditions were considered by Metocean Solutions and simulated inFunwave for the existing harbour layout and breakwater extensions of 200 m and 350 m.
The results of the Funwave runs considered in this paper are given in Table 2. Events 2 and 3were very similar. Hence, only one of these events was considered.

J. Mar. Sci. Eng. 2016, 4, 3 11 of 20
Table 2. Significant long wave height for the considered events and breakwater extensions at the 20 mcontour in the channel (Offshore), the western end of Berth 3 (B3W) and the centre of Berth 5 (B5).
Event Breakwater Hm0,LPW
Extension Offshore B3W B5
Event 10 m 0.09 0.18 0.20
200 m 0.09 0.15 0.18350 m 0.09 0.13 0.17
Event 30 m 0.07 0.14 0.16
200 m 0.07 0.12 0.15350 m 0.07 0.11 0.13
Event 40 m 0.10 0.22 0.23
200 m 0.10 0.18 0.20350 m 0.10 0.15 0.18
Long wave energy from the Funwave model runs were analysed at three locations (bow,mid-ship, stern) of each Berth. Directional spectra were computed with the EMEP method using theDIWASP wave analysis toolbox. Frequency spectra for surface elevation and currents (berth paralleland berth normal) were also calculated at berth locations.
Figure 9 presents a comparison of the surface elevation and current (E-W, N-S) frequency spectrafor Event 1 for the 0 m and 350 m breakwater extension cases at the entrance to Geraldton Harbour.Figure 10 presents a comparison of the surface elevation and current (berth-parallel, berth-normal)frequency spectra for Event 1 for the 0 m and 350 m breakwater extension cases at the middle of Berth 5.
The Funwave model results are similar in character to measured long wave spectra [18], howeverthe standing wave character along Berths 5 and 6 observed in some measured data is not as evidentin the Funwave outputs provided for this investigation.
In summary, the breakwater extension only provides limited reduction of the long waves in theharbour, especially at the lower frequencies (f < 0.015 Hz) that are important for the motions of themoored ships.J. Mar. Sci. Eng. 2016, 4, 0000
12/20
Figure 9. Surface elevation (top), East‐West current (middle) and North‐South current frequency
spectra for existing and 350 m breakwater cases at the port entrance — Event 1.
Figure 10. Surface elevation (top), Berth Parallel (X) current (middle) and Berth Normal (Y) current
frequency spectra for existing and 350 m breakwater cases at middle of Berth 5 — Event 1.
Figure 9. Surface elevation (top), East-West current (middle) and North-South current frequencyspectra for existing and 350 m breakwater cases at the port entrance — Event 1.

J. Mar. Sci. Eng. 2016, 4, 3 12 of 20
J. Mar. Sci. Eng. 2016, 4, 0000
12/20
Figure 9. Surface elevation (top), East‐West current (middle) and North‐South current frequency
spectra for existing and 350 m breakwater cases at the port entrance — Event 1.
Figure 10. Surface elevation (top), Berth Parallel (X) current (middle) and Berth Normal (Y) current
frequency spectra for existing and 350 m breakwater cases at middle of Berth 5 — Event 1.
Figure 10. Surface elevation (top), Berth Parallel (X) current (middle) and Berth Normal (Y) currentfrequency spectra for existing and 350 m breakwater cases at middle of Berth 5 — Event 1.
5.2. Vessel Motions and Mooring Forces
The results of moored ship motions, mooring line forces, and fender compressions from theQuaysim simulations are provided in this section. The focus in this paper is on the comparisonbetween different mooring systems. Comparisons between numerical results and prototype measurementsof moored ship motions are available for ports with comparable long wave problems, such asTomakomai Port, Japan [21,22] and the Port of Salalah, Oman [11]. The results of the Base Caseare discussed first in this section to assess the behaviour of the ship and the interaction withmooring lines and fenders. Subsequently, the improvements by extending the Western Breakwateror changing the mooring configuration are discussed.
5.2.1. Results for the Base Case
The results of significant and maximum ship motions, maximum mooring line forces, andmaximum fender compressions for the Base Case are given in Tables 3–6 respectively. The maximumvalues are expected values of the maximum per three hours. It appears that the most prominentmotions are the horizontal motions, surge, sway, and yaw. The spectra of these motions for Event 1are given in Figure 11.
Table 3. Significant peak-to-peak vessel motions for the Base Case.
Mode of Motion Unit Event
1 3 4
Surge m 2.66 2.30 3.00Sway m 0.71 0.69 0.86Heave m 0.16 0.15 0.24
Roll deg 0.37 0.32 0.43Pitch deg 0.16 0.15 0.25Yaw deg 1.51 1.18 1.57

J. Mar. Sci. Eng. 2016, 4, 3 13 of 20
Table 4. Maximum peak-to-peak vessel motions for the Base Case.
Mode of Motion Unit Event
1 3 4
Surge m 4.04 3.19 4.66Sway m 1.09 0.89 1.22Heave m 0.26 0.23 0.35
Roll deg 0.68 0.53 0.72Pitch deg 0.28 0.23 0.39Yaw deg 2.64 1.95 2.53
Table 5. Maximum mooring line forces for the Base Case.
Mooring lines Unit Event
1 3 4
Stern lines kN 200 144 209Aft breast lines kN 285 189 277Aft spring lines kN 336 258 317
Forward spring lines kN 298 232 364Forward breast lines kN 223 178 236
Bow lines kN 222 178 233
Table 6. Maximum fender compressions for the Base Case.
Fender Unit Event
1 3 4
F1 (aft) m 0.00 0.00 0.00F2 m 1.01 0.70 0.85F3 m 0.29 0.21 0.32F4 m 0.49 0.43 0.51
F5 (forward) m 0.18 0.06 0.24
J. Mar. Sci. Eng. 2016, 4, 0000
14/20
Table 6. Maximum fender compressions for the Base Case.
Fender Unit Event
1 3 4
F1 (aft) m 0.00 0.00 0.00
F2 m 1.01 0.70 0.85
F3 m 0.29 0.21 0.32
F4 m 0.49 0.43 0.51
F5 (forward) m 0.18 0.06 0.24
Figure 11. Sprectra of surge, sway. and yaw for the Base Case, Event 1.
The PIANC guidelines for maximum vessel motions for bulk carriers loaded with a conveyer
belt shiploader are 5 m for surge, 2.5 m for sway, and 3° for yaw [23]. The calculated ship motions
are within the thresholds for all three events.
The PIANC guideline for the maximum allowable mooring line force for synthetic ropes is 50%
of the break strength [23], which is equal to 304 kN. This value is exceeded in the spring lines for
Events 1 and 4. All line forces are within the limits for Event 3. The fact that design line forces are
exceeded and guidelines for maximum vessel motions are not is consistent observations at the port
that mooring line failures are a concern, while vessel motions are generally not a concern.
The long wave height for Event 3 at Berth 3 at 0.14 m is slightly higher than the threshold long
wave height of 0.12 m for operations at Berth 5. The maximum line forces would, therefore, have been
Figure 11. Sprectra of surge, sway. and yaw for the Base Case, Event 1.

J. Mar. Sci. Eng. 2016, 4, 3 14 of 20
The peak of the motions is near 0.11 Hz (T = 90 s) for the horizontal motions, which is near thefirst resonant mode of the harbour basin. There is a very low-frequency peak in the sway motionstoo, which is due to coupling between sway and yaw.
The PIANC guidelines for maximum vessel motions for bulk carriers loaded with a conveyerbelt shiploader are 5 m for surge, 2.5 m for sway, and 3˝ for yaw [23]. The calculated ship motions arewithin the thresholds for all three events.
The PIANC guideline for the maximum allowable mooring line force for synthetic ropes is 50%of the break strength [23], which is equal to 304 kN. This value is exceeded in the spring lines forEvents 1 and 4. All line forces are within the limits for Event 3. The fact that design line forces areexceeded and guidelines for maximum vessel motions are not is consistent observations at the portthat mooring line failures are a concern, while vessel motions are generally not a concern.
The long wave height for Event 3 at Berth 3 at 0.14 m is slightly higher than the threshold longwave height of 0.12 m for operations at Berth 5. The maximum line forces would, therefore, havebeen expected to just exceed the design line force for Event 3. The fact that the calculated maximumline force is slightly lower may due to one or a combination of the following factors:
‚ some worn-out mooring lines break at lower loads than the design line force,‚ the vessel response is slightly underestimated due to approximations in the calculation of the
long wave forces on the ship, or‚ the vessel response is larger in some conditions in reality due to the effect of wind.
The fender compression exceeds the rated fender deflection for the Supercone fender of 0.86 mfor Event 1. This could result in damage of the fender and excessive loads on the breasting dolphin.It is not known if this happens in reality in the port and, therefore, requires further investigation.
5.2.2. Results for Extending the Western Breakwater and Different Mooring Configurations
The results of maximum horizontal vessel motions are given in Tables 7–9 for surge, sway, andyaw, respectively. All values are maximum peak-to-peak values. The results of maximum mooringline forces in bow/stern lines, breast lines, and spring lines are given in Tables 10–12 respectively.Only the maximum of the line force in each group of mooring lines, fore or aft, is given. The resultsof maximum fender compressions are given in Table 13. Only the maximum of the compressions ofthe five fenders at Berth 5 are given.
Table 7. Maximum surge motions (m).
Mooring Config./Breakw. Ext. Event
1 3 4
Base case, polypropylene lines 4.04 3.19 4.66Breakwater extension, 200 m 4.00 3.03 4.01Breakwater extension, 350 m 3.64 2.62 3.51
Nylon tails 4.65 3.57 4.84Dyneema lines with nylon tails 2.82 2.21 3.84
Nylon breast lines 4.19 2.56 3.73Constant tension winches 4.16 2.46 3.79
Pneumatic fenders 3.74 2.18 4.14Air block fenders 4.20 3.17 4.75
Pneumatic f. + Nylon breast lines 1.86 1.23 2.96Pneum. f. + Const. tens. winches 2.45 1.15 2.92Air bl. f. + Const. tens. winches 3.80 2.22 3.71
MoorMaster (12 units) 0.52 0.26 3.97

J. Mar. Sci. Eng. 2016, 4, 3 15 of 20
Table 8. Maximum sway motions (m).
Mooring Config./Breakw. Ext. Event
1 3 4
Base case, polypropylene lines 1.09 0.89 1.22Breakwater extension, 200 m 1.10 0.90 1.05Breakwater extension, 350 m 0.97 0.83 0.94
Nylon tails 1.22 0.90 1.30Dyneema lines with nylon tails 0.84 0.71 0.98
Nylon breast lines 0.65 0.29 0.69Constant tension winches 0.31 0.28 0.66
Pneumatic fenders 1.46 1.01 1.64Air block fenders 1.45 1.11 1.72
Pneumatic f. + Nylon breast lines 0.89 0.72 0.89Pneum. f. + Const. tens. winches 1.20 0.87 0.93Air bl. f. + Const. tens. winches 0.97 0.70 0.75
MoorMaster (12 units) 0.26 0.18 1.01
Table 9. Maximum yaw motions (deg).
Mooring Config./Breakw. Ext. Event
1 3 4
Base case, polypropylene lines 2.64 1.95 2.53Breakwater extension, 200 m 2.39 1.64 2.21Breakwater extension, 350 m 2.11 1.33 2.02
Nylon tails 2.59 1.96 2.67Dyneema lines with nylon tails 1.53 1.06 1.90
Nylon breast lines 1.30 0.67 1.25Constant tension winches 0.57 0.52 0.93
Pneumatic fenders 2.09 1.45 2.06Air block fenders 2.59 2.05 2.77
Pneumatic f. + Nylon breast lines 1.26 1.04 1.40Pneum. f. + Const. tens. winches 1.83 1.38 1.49Air bl. f. + Const. tens. winches 1.51 1.29 1.29
MoorMaster (12 units) 0.78 0.58 1.92
Table 10. Maximum forces in bow or stern lines (kN).
Mooring Config./Breakw. Ext. Event
1 3 4
Base case, polypropylene lines 222 178 233Breakwater extension, 200 m 201 168 203Breakwater extension, 350 m 176 148 187
Nylon tails 219 170 239Dyneema lines with nylon tails 335 241 529
Nylon breast lines 187 140 208Constant tension winches 196 142 212
Pneumatic fenders 208 154 249Air block fenders 253 193 273
Pneumatic f. + Nylon breast lines 167 135 197Pneum. f. + Const. tens. winches 188 152 192Air bl. f. + Const. tens. winches 219 172 215
MoorMaster (12 units) - - -

J. Mar. Sci. Eng. 2016, 4, 3 16 of 20
Table 11. Maximum forces in breast lines (kN).
Mooring Config./Breakw. Ext. Event
1 3 4
Base case, polypropylene lines 285 189 277Breakwater extension, 200 m 249 161 234Breakwater extension, 350 m 216 141 212
Nylon tails 268 182 244Dyneema lines with nylon tails 304 261 490
Nylon breast lines 342 305 365Constant tension winches 296 296 296
Pneumatic fenders 271 183 269Air block fenders 317 222 312
Pneumatic f. + Nylon breast lines 371 335 404Pneum. f. + Const. tens. winches 297 297 297Air bl. f. + Const. tens. winches 297 297 297
MoorMaster (12 units) - - -
Table 12. Maximum forces in spring lines (kN).
Mooring Config./Breakw. Ext. Event
1 3 4
Base case, polypropylene lines 336 258 364Breakwater extension, 200 m 323 240 296Breakwater extension, 350 m 276 193 273
Nylon tails 305 224 301Dyneema lines with nylon tails 497 340 651
Nylon breast lines 292 175 272Constant tension winches 252 145 251
Pneumatic fenders 281 153 310Air block fenders 324 254 376
Pneumatic f. + Nylon breast lines 149 99 206Pneum. f. + Const. tens. winches 185 89 222Air bl. f. + Const. tens. winches 282 150 285
MoorMaster (12 units) - - -
Table 13. Maximum fender compressions (m).
Mooring Config./Breakw. Ext. Event
1 3 4
Base case, polypropylene lines 1.01 0.70 0.85Breakwater extension, 200 m 0.87 0.60 0.68Breakwater extension, 350 m 0.71 0.47 0.66
Nylon tails 1.00 0.69 0.90Dyneema lines with nylon tails 0.63 0.41 0.92
Nylon breast lines 0.59 0.37 0.66Constant tension winches 0.39 0.37 0.51
Pneumatic fenders 1.47 1.25 1.57Air block fenders 1.27 1.03 1.31
Pneumatic f. + Nylon breast lines 1.52 1.39 1.58Pneum. f. + Const. tens. winches 1.74 1.54 1.53Air bl. f. + Const. tens. winches 1.16 1.03 1.01
MoorMaster (12 units) 0.23 0.21 0.61

J. Mar. Sci. Eng. 2016, 4, 3 17 of 20
The Base Case results are presented first in tables, which are a repeat of the results presented inthe previous section. Subsequently, the results for the two breakwater extensions and the 10 differentmooring configurations are presented.
5.2.3. Discussion of the Results for Extension of the Western Breakwater
The results show the construction of the breakwater extension leads to a decrease in the shipmotions and mooring line forces. The decrease in the ship motions is approximately 20% for the350 m breakwater extension. This is less than the 35% reduction in long wave height in the port asfound from the Funwave simulations [4]. The reason for this is that most long wave energy reductionis near the second harmonic harbour resonance mode near a period of 45 s, while the first resonancemode near 90 s is much less affected. The larger Panamax ships in laden condition respond mostly tothe long waves near 90 s in surge, sway, and yaw, so the response is not much affected.
5.2.4. Discussion of the Results for Different Mooring Configurations
The main observations from the results of the vessel motions and mooring forces for differentmooring configurations are:
‚ The forces are slightly reduced by using nylon mooring tails.‚ The forces become larger when using Dyneema mooring lines with nylon tails. However, this
could, in practice, still be a better solution than the ship’s mooring lines, since the shore-basedlines are better maintained.
‚ Addition of strong nylon breast lines under a high pretension of 25 t or breast lines under aconstant tension of 30 t significantly reduces the vessel motions and mooring forces.
‚ Use of pneumatic fenders leads to a similar significant improvement as the nylon breast lines,while the improvement with air block fenders is less. This is because the pneumatic fenders aresofter than air block fenders.
‚ MoorMaster units effectively reduce the vessel motions. However, the motions exceed thethresholds for maximum excursions of the arms of the MoorMaster units for Event 4. This meansthat more than the 12 units as tested are required.
‚ The largest reduction of vessel motions and mooring forces, not considering the MoorMasterunits, are achieved with the combination of pneumatic fenders and nylon breast lines or constanttension winches.
It is concluded that the best improvement is achieved by applying a combination of pneumaticfenders and constant tension winches set to 30 t, or nylon breast lines with a pretension of 25 t. Thesetwo concepts achieve the optimal configuration whereby the vessel is pulled into the soft fenders witha constant large force and stays in the fenders when the vessel moves in sway and yaw due to longwave action.
5.3. Threshold Long Wave Heights
A set of additional simulations was carried out for the most promising mitigation measures.The design mooring line force of 304 kN is exceeded for the Base Case when the long wave heightat Berth 3 is equal to 0.16 m in the simulations. It is assessed that this limit corresponds to thecurrently adopted threshold of 0.12 m in the port. The difference is due to the reasons as explainedin Section 5.1. The thresholds for the mitigation measures, as presented in Table 14, were determinedas the value for which the design mooring line force is exceeded, corrected for the difference betweenthe calculated and adopted thresholds for the Base Case.

J. Mar. Sci. Eng. 2016, 4, 3 18 of 20
Table 14. Threshold long wave height (m, at Berth 3) for operations at Berth 5.
Mooring Configuration/Breakwater Ext. Threshold
Base case, polypropylene lines 0.12Breakwater extension, 350 m 0.15
Nylon breast lines 0.14Constant tension winches 0.14
Pneumatic fenders 0.15Pneumatic fenders + Nylon breast lines 0.18
Pneumatic fenders + Const. tens. winches 0.18
The observations from the values in Table 14 are similar to the observations discussed in theprevious section. Additional observations are:
‚ The effectiveness of the 350 m breakwater extension, nylon breast lines, constant tension winches,and pneumatic fenders are fairly similar.
‚ A significantly better improvement is achieved when combining the pneumatic fenders withnylon breast lines or constant tension winches.
‚ It is interesting to note that the effectiveness of pneumatic fenders and nylon breast lines orconstant tension winches is more than the sum of the improvements of pneumatic fenders andtensioned breast lines (nylon or constant tension). This confirms the statement that mooring linesand fenders work very well together in the combined option to keep the vessel in the fenders andreduce the surge motions.
It is noted that only the two most extreme types of winches were tested for the winches onthe wharf to connect the breast lines, i.e., brake winches and perfect constant tension winches.As mentioned in Section 3.1, there are also constant tension winches that do not respond immediately,or that do only pay out or in outside certain render and recovery limits, respectively. These winchesmay perform slightly better. Performance data from the winch manufacturer would be required toadequately model these winches in order to optimise this concept.
6. Conclusions
Geraldton Harbour experiences frequent downtime related to (risk of) breakage of mooring linesdue to long waves that are generated as swells propagate over the shallow reefs to the north andnorthwest of the port. An analysis of these problems and possible countermeasures were discussedin this paper, focusing on Berth 5 for iron ore export.
From an assessment of the existing berth and current practice to moor vessels, it is concludedthat the layout of mooring lines is fairly optimal. The berthing dolphins are far apart, which maycause excessive yawing of the vessel. However, this is costly to improve, so that it is recommendedto assess other options to reduce the risk of mooring line failures at Berth 5.
Ten alternatives for changing the mooring configuration at Berth 5 were analysed alongwith extension of the Western Breakwater with 200 m or 350 m (without changing the mooringconfiguration). Dynamic mooring simulations were carried out for the existing situation (Base Case),the two breakwater extensions, and the 10 alternative mooring configurations. Available computedlong wave records at the berth were used as input.
The best reduction of vessel motions and mooring line forces is achieved by installing acombination of pneumatic fenders and constant tension winches set to 30 t, or nylon breast lineswith a pretension of 25 t. The idea behind these concepts is that the vessel is pulled into the fendersand keeps resting against the fenders when the vessel moves in sway and yaw due to long waves.The threshold long wave height for the long wave height in the port for these two alternatives wasdetermined at 0.18 m. This is a significant improvement from the presently adopted threshold of0.12 m.

J. Mar. Sci. Eng. 2016, 4, 3 19 of 20
Slightly better results may be achieved with constant tension winches that do not keep the lineforce perfectly constant, but that pay in when the force is below a certain recovery limit and payout above a certain render limit. It is recommended to further investigate this option using winchperformance data from manufacturers.
Author Contributions: Wim van der Molen wrote Sections 1–6 except Sections 2.1 and 5.1; Doug Scott reviewedSections 1–6; David Taylor wrote Section 5.1; Trevor Elliott wrote Section 2.1 and reviewed Section 5.
Conflicts of Interest: This study was undertaken as part of a project to investigate solutions to mitigate longwaves and related motions of moored ships in the Geraldton Harbour for the Mid West Ports Authority.
References
1. Cardno Lawson Treloar. Wave and Ship Mooring Study; Report J2321/R2163; Cardno Lawson Treloar:Gordon, Australia, 2004.
2. MetOcean Solutions. Long Waves at Geraldton; MetOcean Solutions: New Plymouth, New Zealand, 2006.3. MetOcean Solutions. Long Period Waves at Geraldton Port. Wave Measurements from 2013; Report P0146–02;
MetOcean Solutions: New Plymouth, New Zealand, 2014.4. McComb, P.; Johnson, D.; Beamsley, B. Numerical study of options to reduce swell and long waves at port
geraldton. In Proceedings of the Coasts & Ports 2009, Wellington, New Zealand, 16–18 September 2009.5. Ahuja, M.M.; Mani, C.S.; Joshi, A.K. LNG Berths for Open Seas. Part 2: Dahej LNG Terminal, a Case Study.
Port Technol. Int. 2010, 46, 125–129.6. Yoneyama, H.; Asakura, K.; Kawasaki, T.; Otake, Y. Development of a reduction system for low-frequency
ship motions and its field experiments by using a large ship. In Proceedings of the 19th ISOPE Conference,Osaka, Japan, 21–26 June 2009; pp. 1117–1123.
7. Sakakibara, S.; Kubo, M. Effect of Mooring System on Moored Ship Motions and Harbour Tranquility.Int. J. Ocean Syst. Manag. 2008, 1, 84–99. [CrossRef]
8. Goring, D.B. Ship surging induced by long waves in Port of Salalah, Oman. In Proceedings of the Coasts &Ports 2005 Conference, Adelaide, Australia, 20–23 July 2005.
9. Van Deyzen, A.F.J.; Beimers, P.B.; Van der Lem, J.C.; Messiter, D.; De Bont, J.A.M. To improve the efficiencyof ports exposed to swell. In Proceedings of the Coasts & Ports 2015 Conference, Auckland, New Zealand,15–18 September 2015.
10. Oil Companies International Marine Forum (OCIMF). Mooring Equipment Guidelines, 3rd Ed. ed; Witherby:London, UK, 2008; p. 278.
11. De Bont, J.A.M.; van der Molen, W.; van der Lem, J.C.; Mühlestein, D.; Ligteringen, H.; Howie, M.Calculations of the motions of a ship moored with the Moormaster™ units. In Proceedings of the 32ndPIANC International Navigation Congress, Liverpool, UK, 10–14 May 2010; pp. 622–635.
12. Cavotec Home Cavotec Home Page. Available online: www.cavotec.com (accessed on 5 October 2015).13. Van der Burg, G. ShoreTension: Secured to shore all times. Port Technol. Int. 2012, 52, 43–45.14. Van Deyzen, A.F.J.; Van der Lem, J.C.; Beimers, P.B.; De Bont, J.A.M. The effect of active motion
dampening systems on the behaviour of moored ships. In Proceedings of the 33rd PIANC World Congress,San Francisco, CA, USA, 1–5 June 2014.
15. Van Reenen, W. Dock Lock: Automatic Magnetic Mooring. United Nations Economic Commission forEurope. Available online: www.unece.org/trans/main/dgdb/ac2/ac2inf23.html (accessed on 5 October 2015).
16. Wei, G.; Kirby, J.T. Time-dependent Numerical Code for Extended Boussinesq Equations. J. Waterw. PortCoast. Ocean Eng. 1995, 129, 124–135. [CrossRef]
17. Metocean Solutions. Reducing Long Period Wave Energy at Geraldton. In Numerical Modelling of Changes toLong Period Wave Energy in the Geraldton Harbour Basin Resulting from Breakwater Extensions; Report 0015-05;Metocean Solutions: New Plymouth, New Zealand, 2011.
18. Johnson, D.; McComb, P. Modelling long wave generation and propagation around and within ports.In Proceedings of the Coasts & Ports 2011, Perth, Australia, 28–30 September 2011.
19. Johnson, D. DIWASP, A Directional Wave Spectra Toolbox for MATLABr: User Manual; Research ReportWP-1601-DJ (V1.1); Centre for Water Research, University of Western Australia: Perth, Australia, 2002.

J. Mar. Sci. Eng. 2016, 4, 3 20 of 20
20. Van der Molen, W. Boundary Element Model Wavescat: Description and Validation; W.F. Baird & AssociatesReport: Ottawa, QC, Canada, 2014.
21. Shiraishi, S.; Kubo, M.; Sakakibara, S.; Sasa, K. A study on numerical simulation methods to reproducelong-period ship motions. In Proceedings of the 9th ISOPE Conference, Brest, France, 30 May–4 June 1999;pp. 536–543.
22. Van der Molen, W.; Monárdez, P.; Van Dongeren, A.R. Numerical Simulation of Long-Period Waves andShip Motions in Tomakomai Port, Japan. Coast. Eng. J. 2006, 48, 59–79. [CrossRef]
23. The World Association for Waterborne Transport Infrastructure (PIANC). Criteria for Movement of MooredShips in Harbours: A Practical Guide (Supplement to Bulletin No 88) Report of Working Group PCT II-24.PIANC: Bruxelles, Belgium, 1995.
© 2015 by the authors; licensee MDPI, Basel, Switzerland. This article is an openaccess article distributed under the terms and conditions of the Creative Commons byAttribution (CC-BY) license (http://creativecommons.org/licenses/by/4.0/).