
guidance for using the marcogaz methane emissions ...
24
© MARCOGAZ 1/24 WG_ME-710 GUIDANCE FOR USING THE MARCOGAZ METHANE EMISSIONS REPORTING TEMPLATE DSO, TSO, LNG RECEIVING TERMINALS AND UGS ALIGNED WITH THE OGMP REPORTING FRAMEWORK November 2020
-
Upload
khangminh22 -
Category
Documents
-
view
3 -
download
0
Transcript of guidance for using the marcogaz methane emissions ...
© MARCOGAZ 1/24 WG_ME-710
GUIDANCE FOR USING THE MARCOGAZ METHANE
EMISSIONS REPORTING TEMPLATE
DSO, TSO, LNG RECEIVING TERMINALS AND UGS
ALIGNED WITH THE OGMP REPORTING FRAMEWORK
November 2020
© MARCOGAZ 2/24 WG_ME-710
Contents
1 Introduction ............................................................................................................................... 4
2 List of definitions ........................................................................................................................ 5
3 level 1 to 5 REPORTING ............................................................................................................... 9 3.1 OGPM – “Level” approach ....................................................................................................... 9
3.1.1 Level definitions and associated granularity ......................................................................... 9 3.2 United Nations (UNFCCC, IPCC) “Tier” approach ...................................................................... 11
4 Guidelines for filling in the template ............................................................................................ 13 4.1 Description of the template’s structure ................................................................................... 13
4.1.1 Organisation .................................................................................................................. 13 4.1.2 Natural gas composition .................................................................................................. 13 4.1.3 Emissions ...................................................................................................................... 14 4.1.3.1 Type of gas systems (TSO – UGS – LNG – DSO) .............................................................. 15 4.1.3.2 Type of emissions ........................................................................................................ 15 4.1.3.3 Guidance for the use of emission factors ......................................................................... 16 4.1.3.4 Guidance for use of activity factors ................................................................................ 17 4.1.4 General information: ...................................................................................................... 18 4.1.5 Source of data [columns Q to V] ...................................................................................... 18 4.1.5.1 Source ....................................................................................................................... 18 4.1.5.2 Data quality ................................................................................................................ 18
4.2 Description of colour codes [level 1- level 5] ........................................................................... 19
5 Bibliography ............................................................................................................................. 20
6 ANNEX - OGMP Level 1, 2, 3, 4 and 5 .......................................................................................... 21
List of tables
Table 1 - Different types of emissions .................................................................................................. 15
List of figures
Figure 1 - Granularity related terms ..................................................................................................... 10 Figure 2 - Relation between IPCC Tier approach and OGMP level 1-5 reporting. ......................................... 12 Figure 3 – Organisation details ............................................................................................................ 13 Figure 4 – Scope of reporting .............................................................................................................. 13 Figure 5 – Natural gas composition ...................................................................................................... 13 Figure 6 - Main body of the emissions template. .................................................................................... 14 Figure 7 - Emission factors in the template ........................................................................................... 17 Figure 8 - Incomplete combustion in the template ................................................................................. 17 Figure 9 - Example showing colour codes of the levels. .......................................................................... 18 Figure 10 - Data quality in template ..................................................................................................... 19 Figure 11 - Example template for level 1 .............................................................................................. 21 Figure 12 - Example template for level 2. ............................................................................................. 22 Figure 13 - Example template for level 3. ............................................................................................. 23

© MARCOGAZ 3/24 WG_ME-710
Figure 14 - Example template for level 4. ............................................................................................. 23 Figure 15 - Example template for level 5. ............................................................................................. 24
© MARCOGAZ 4/24 WG_ME-710
1 INTRODUCTION
In an international context where decarbonisation of the energy systems is crucial for accelerating the energy
transition and contribute to the goals of achieving the Paris targets. The European gas industry supports the
EU’s climate-neutrality objective by 2050 and recognise the need to signficantly reduce all greenhouse gas
(GHG) emissions.
The gas industry has successfully been working for many years to reduce methane (CH4) emissions through
mandatory and voluntary programmes and remains strongly committed to tackle this issue.
In order to address the quantification and the reporting of all types of methane emissions from the natural gas
industry in a transparent, reliable and harmonized way, MARCOGAZ developed a methodology based on a
bottom-up approach: “Assessment of methane emissions for gas Transmission and Distribution system
operators”1. This method is currently being converted into a CEN Technical Report (CEN\TC234\WG14).
Based on this methodology, MARCOGAZ has developed a methane emissions reporting template, which will
contribute to put in place a robust MRV system for the gas mid and downstream segments.
The aim is to harmonize the reporting among the different gas infrastructure operators across Europe and for
this reason MARCOGAZ prepared an Excel form to be used by the companies for environmental reporting.
Therefore this reporting template is adopted by OGMP for the use of OGMP golden standard 2.0 reporting for
TSO, DSO, UGS and LNG terminals.
Methane emission reporting for business such as CNG/LNG fuelling stations, biomethane plants, waste
management site, small scale installations… has to be considered only if they are inside a gas
transmission/storage/LNG asset (compressor stations, LNG terminal…)/distribution; if not they are not within
OGMP, taking into account the small potential quantity of the gas emitted.
The present document is a guideline which describes how to fill in the Excel form “MARCOGAZ methane emissions
reporting template - TSO-UGS-LNG receiving terminals-DSO”2.
1 MARCOGAZ “Assessment of methane emissions for gas Transmission and Distribution system operators” (WG_ME-485, 2019) 2 MARCOGAZ “Methane emissions reporting template - TSO-UGS-LNG receiving terminals-DSO” (WG_ME-756, 2020)
© MARCOGAZ 5/24 WG_ME-710
2 LIST OF DEFINITIONS
For the purposes of this document, the following terms and definitions apply.
❖ Activity Factor
A numerical value describing the size of the population of emitting devices such as length of pipelines, number
of valves (per type), number of pneumatic devices (per type), or the frequency of emitting events such as
number of operating vents.
(Note – this is not an exhaustive list, the activity factor is linked to the emission factor and expressed in a
numerical value consistent with the emission factor.)
❖ Block valve
A valve used to isolate a segment of the main transmission pipeline for tie-in or maintenance
purposes.
(Note - Block valves typically are located along each line to limit the amount of piping that may need to be
depressurized for tie-ins and maintenance, and to reduce the amount of gas that would be lost in the event of
a line break.)
❖ Blow down valve
A valve used to empty a gas pipeline section or a whole installation and, when activated, initiates the blowdown
(e.g. when gas compressor units are shut down).
❖ Blow down open ended line (BD-OEL)
A pipeline to evacuate a pressurized section of the network from gas.
❖ Component
A part or element of a larger whole, i.e. flange, valve, connection.
❖ Connection
Area of contact between two or more linked parts, normally sealed by mechanic means in order to keep
tightness.
❖ Control valve
Modulating valve that controls either the flow rate or pressure through the pipeline. In the latter case, this
facility is often referred to as a (pressure) regulator.
(Note - Typically, high pressure gas from the pipeline is used as the supply medium needed to energize the
valve actuator.)
❖ Device
Equipment (active or passive) related to the physical gas system and needed in order to keep the normal
operation of the network.
❖ Emission Factor – EF
The emission factor describes typical methane emissions of a component or part of the gas system (e.g. valve,
pipeline section) and can have units like [m3/km] or [m3/event].
(Note - this is not an exhaustive list, the emission factor is linked to the activity factor and expressed in a
numerical value consistent with the activity factor)
© MARCOGAZ 6/24 WG_ME-710
❖ Flaring
Controlled burning of hydrocarbons mainly for safety reasons
❖ Fugitive emission
Leakages due to tightness failure and permeation.
❖ Gas distribution system (1)
Mains and service lines including piping above and below ground and all other equipment necessary to supply
the gas to the consumer.
❖ Gas transmission system
A pipeline system for transport of natural gas, which mainly contains high-pressure pipelines, other than an
upstream pipeline network and other than the part of high-pressure pipelines primarily used in the context of
local distribution of natural gas, with a view to its delivery to customers, but not including supply.
(Note: Transport from production companies to the distribution companies and to the industry. Transmission
lines transport natural gas across long distances and occasionally across interstate boundaries. They are
connected to the distribution grid via city gate stations.
High-pressure gas transport over long distance including pipelines, compressor stations, metering and regulating
stations and a variety of above-ground facilities to support the overall system. Underground gas storage and
LNG terminals are excluded. Operating pressure is normally equal or greater than 16 bar.)
❖ Gate station
A facility located adjacent to a transmission facility where at least one of the following functions is performed:
pressure reduction, odorization, measurement or flow of gas through a splitter system for distribution to different
districts or areas.
❖ Incident (2)
Unexpected occurrence, which could lead to an emergency situation.
❖ Incident emission
Methane emissions from an incident.
❖ Incomplete combustion emissions
Unburned methane in the exhaust gases from gas turbines, gas engines and combustion facilities and flaring.
❖ LNG facility
A terminal which is used for the liquefaction of natural gas or the importation, offloading, and re-gasification of
LNG, and includes ancillary services and temporary storage necessary for the re-gasification process and
subsequent delivery to the transmission system, but does not include any part of LNG terminals used for storage.
❖ Main lines of distribution (3)
Pipework in a gas supply system to which service lines are connected.
❖ Methane emission
Any release of methane to the atmosphere, whatever is the origin, reason and duration.
❖ Open Ended Line (OEL)
A line to safely evacuate gas.
© MARCOGAZ 7/24 WG_ME-710
❖ Operational emission (4)
Methane emissions from normal or planned operating activities where often significant volume of natural gas is
released to the atmosphere from the gas network. This includes release through stacks; blow off valves, pressure
release and purging of turbines and emissions due to normal maintenance inspection and control. Operational
vents comprise planned venting and purging of pipelines, which is usually done during commissioning,
decommissioning, renewal and maintenance of pipelines for safety reasons to prevent the risk of explosions.
Pneumatic emissions are also operational emissions.
❖ Permeation
Penetration of a permeate (such as a liquid, gas, or vapour) through a solid. In case of natural gas through
polyethylene pipelines, it is directly related to the pressure of the gas and polyethylene intrinsic permeability.
❖ Pneumatic emission (4)
Emissions caused by gas operated valves (actuators), continuous as well as intermittent emissions.
❖ Pressure regulating station (3)
Installation comprising all the equipment including the inlet and outlet pipework as far as the isolating valves
and any structure within which the equipment is housed, used for gas pressure regulation and over-pressure
protection.
❖ Pressure relief valve (3)
A device designed to release gas in the event of an unacceptable pressure being detected within the system it
protects.
(Note: Safety relief device is the same.)
❖ Purging (1)
Process for safely removing air or inert gas from pipework and/or pipeline components and replacing it with gas,
or the reverse process
❖ Regulator (5)
Device which reduces the gas pressure to a set value and maintains it within prescribed limits.
❖ Sector
Part of the complete gas value chain.
(Note: The oil and gas industry is usually divided into three major sectors: upstream (or exploration and
production - E&P), midstream and downstream.)
❖ Service lines (3) (6)
The pipework from the main lines to the point of delivery of the gas into the installation pipework.
(Note: Service line is usually a short, small diameter pipeline that delivers gas from distribution main or
transmission pipeline to the customer. They are usually made of steel pipe or steel tubing (either cathodically
protected or not), or plastic (usually polyethylene, but sometimes PVC or other plastic), although copper tubing
was also used in the past. Service lines can be installed under or above ground.)
© MARCOGAZ 8/24 WG_ME-710
❖ Source
A component within a process or equipment that releases methane to the atmosphere either intentionally or
unintentionally, intermittently or persistently.
❖ Storage facility
The part of the natural gas supply chain that stores natural gas to be used when there is a high demand. Storage
facilities include various types of underground storage (depleted gas reservoirs, salt formations, aquifers), as
well as above-ground facilities such as LNG storage.
❖ Uncertainty (of measurement) (7)
Parameter, associated with the result of a measurement, that characterizes the dispersion of the values that
could reasonably be attributed to the measurand.
NOTE 1: The parameter may be, for example, a standard deviation (or a given multiple of it), or the half-width
of an interval having a stated level of confidence.
NOTE 2 Uncertainty of measurement comprises, in general, many components. Some of these components may
be evaluated from the statistical distribution of the results of series of measurements and can be characterized
by experimental standard deviations. The other components, which also can be characterized by standard
deviations, are evaluated from assumed probability distributions based on experience or other information.
NOTE 3 It is understood that the result of the measurement is the best estimate of the value of the measurand,
and that all components of uncertainty, including those arising from systematic effects, such as components
associated with corrections and reference standards, contribute to the dispersion.
© MARCOGAZ 9/24 WG_ME-710
3 LEVEL 1 TO 5 REPORTING
3.1 OGPM – “Level” approach
The companies are requested to categorize their reporting by 5 distinct Levels. The Levels are based upon:
➢ Reporting granularity, both at the level of sources and geography (i.e. global, simplified consolidation
categories, detailed source type and/or by region/ country/ assets),
➢ Quantification methodologies (e.g. generical and source specific emissions factors, engineering
calculations, simulations, direct measurement, etc.), and
➢ Confidence and Verification level (e.g. generic emission factors, direct measurements based
quantification, and complementary reconciliation monitoring processes, e.g. site-level measurements)
The levels 1 to 3 are based on the measurement granularity only to progressively escalate to the highest level
of detail available in the template. In The level 3 to 5 the quantification methodology is gradually refined to
improve uncertainties/ level of confidence, from generic Emission factors to source specific measurement-based
result (bottom-up) consolidated by site level measurements (top-down).
3.1.1 Level definitions and associated granularity
The granularity relates to the level of detail in a set of data. For example, pipeline Assets could be distinguished
by the various materials or diameters, pressure levels, valves could be distinguished by construction type etc.
Granularity also relates to geographic resolution of a Gas System. The appropriate granularity to account for
emission sources must be selected together with categorization of emission sources. Appropriate activity factors
of emission characteristics at component level allows to minimize uncertainties and helps to identify emissions
reductions opportunities. In principle a finer granularity is appropriate at increasingly higher levels.
The template provides a fixed granularity for reporting. However, the underlying data may depend on a finer
granularity, also depending on the reporting Level, and aggregated in the provided rows of the template.
For sake of clarity the following terms will be used as a basis to define the granularity associated to level
description here below: Gas system, Asset, Device, Component (see definitions)
© MARCOGAZ 10/24 WG_ME-710
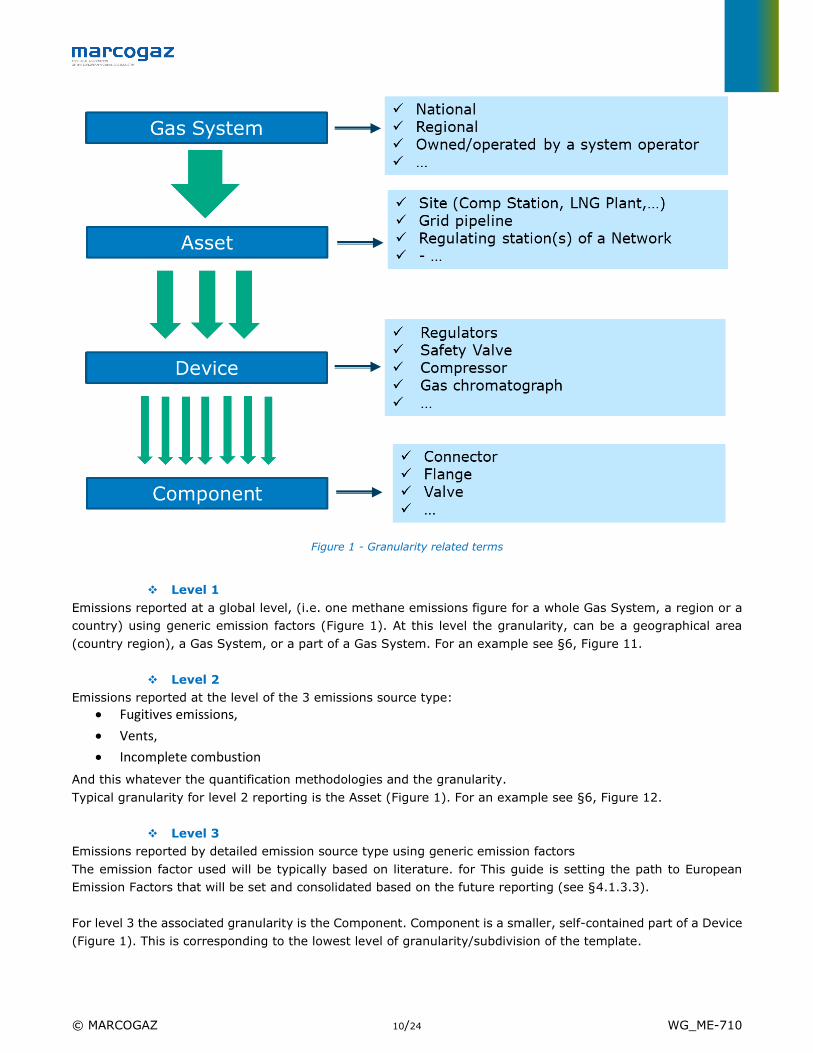
Figure 1 - Granularity related terms
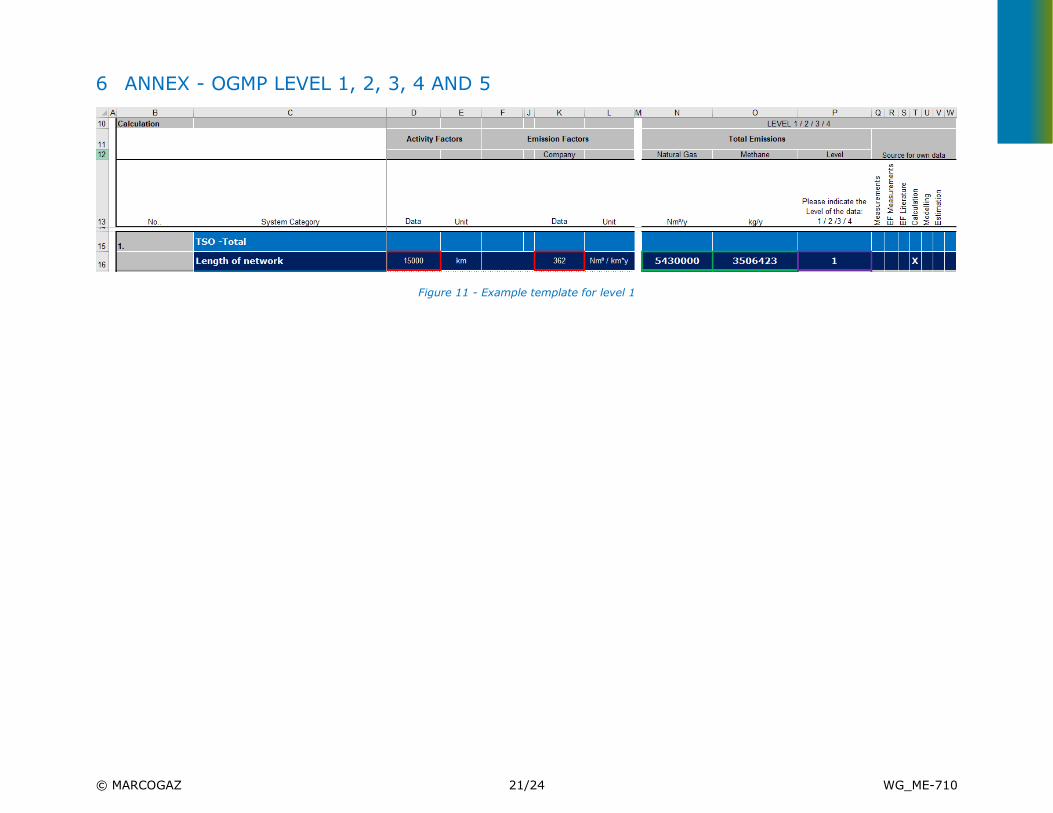
❖ Level 1
Emissions reported at a global level, (i.e. one methane emissions figure for a whole Gas System, a region or a
country) using generic emission factors (Figure 1). At this level the granularity, can be a geographical area
(country region), a Gas System, or a part of a Gas System. For an example see §6, Figure 11.
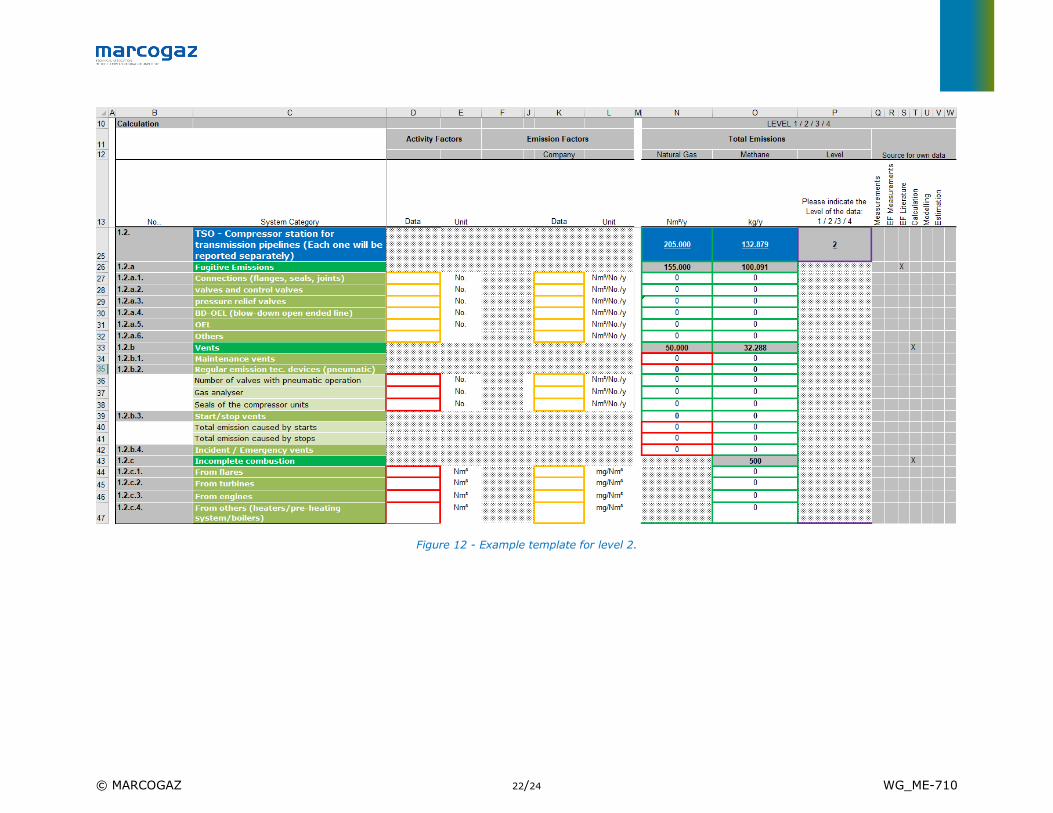
❖ Level 2
Emissions reported at the level of the 3 emissions source type:
• Fugitives emissions,
• Vents,
• Incomplete combustion
And this whatever the quantification methodologies and the granularity.
Typical granularity for level 2 reporting is the Asset (Figure 1). For an example see §6, Figure 12.
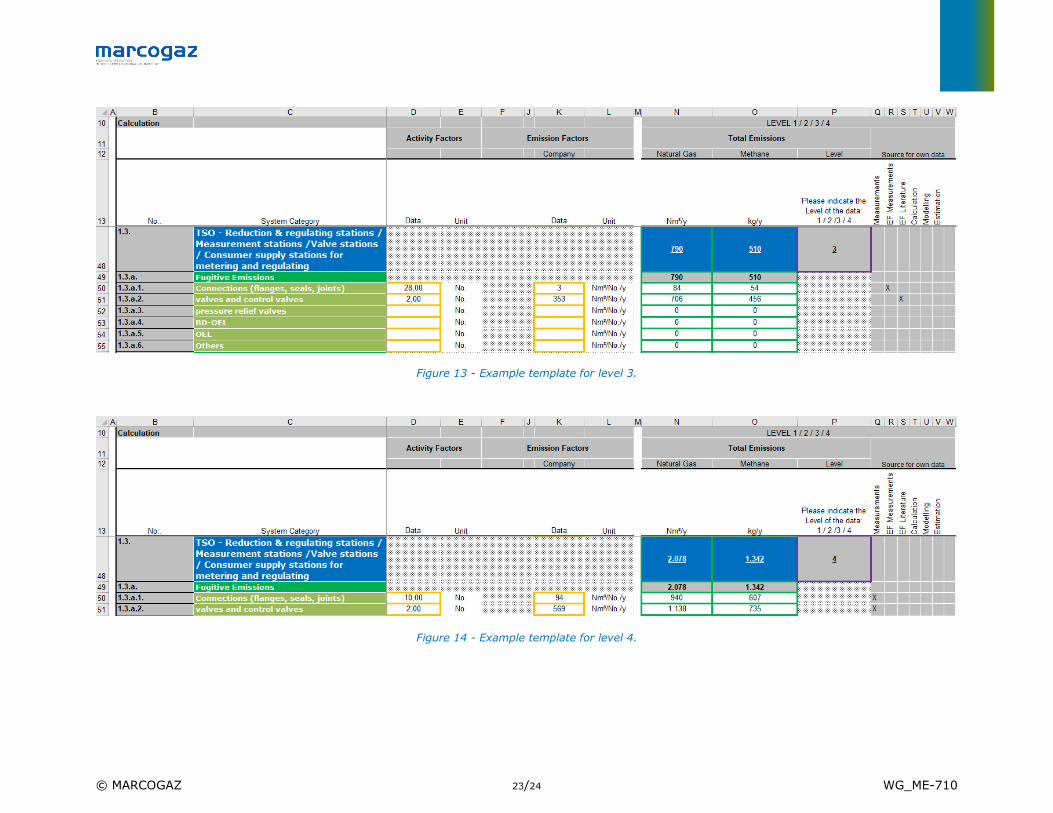
❖ Level 3
Emissions reported by detailed emission source type using generic emission factors
The emission factor used will be typically based on literature. for This guide is setting the path to European
Emission Factors that will be set and consolidated based on the future reporting (see §4.1.3.3).
For level 3 the associated granularity is the Component. Component is a smaller, self-contained part of a Device
(Figure 1). This is corresponding to the lowest level of granularity/subdivision of the template.
© MARCOGAZ 11/24 WG_ME-710
As an example a regulating valve can be considered as a Device (Figure 1), with the following emitting
Components : 10 flanges, 2 valve stem (“valve” in the template), and 16 connectors. In that case the emissions
from that device will be reported as in §6, Figure 13.
❖ Level 4
Emissions reported per by detailed emission source type.
Direct measurements are used at level 4 and the associated granularity is the Component (Figure 1).
Relevant source-level measurement should be used as well as sampling, in that last case, EF will be defined by
measuring the emission of a representative sample of Asset or Devices population.
For example measurements can be done on a representative sample of valve stations (Assets) on a Gas System,
for each Components of each Devices of the given stations (e.g.: 100 valve stations corresponding to the square
root of a 10.000 stations population). Emission factors will be set accordingly for each kind of Components of
the sample, and the emissions for each Component population of the whole network derived from these
measurement based, emission factors.
Where appropriate, other source type specific quantification methodologies such as simulation tools and detailed
engineering calculations Should be used as shown in the examples in §6, Figure 14.
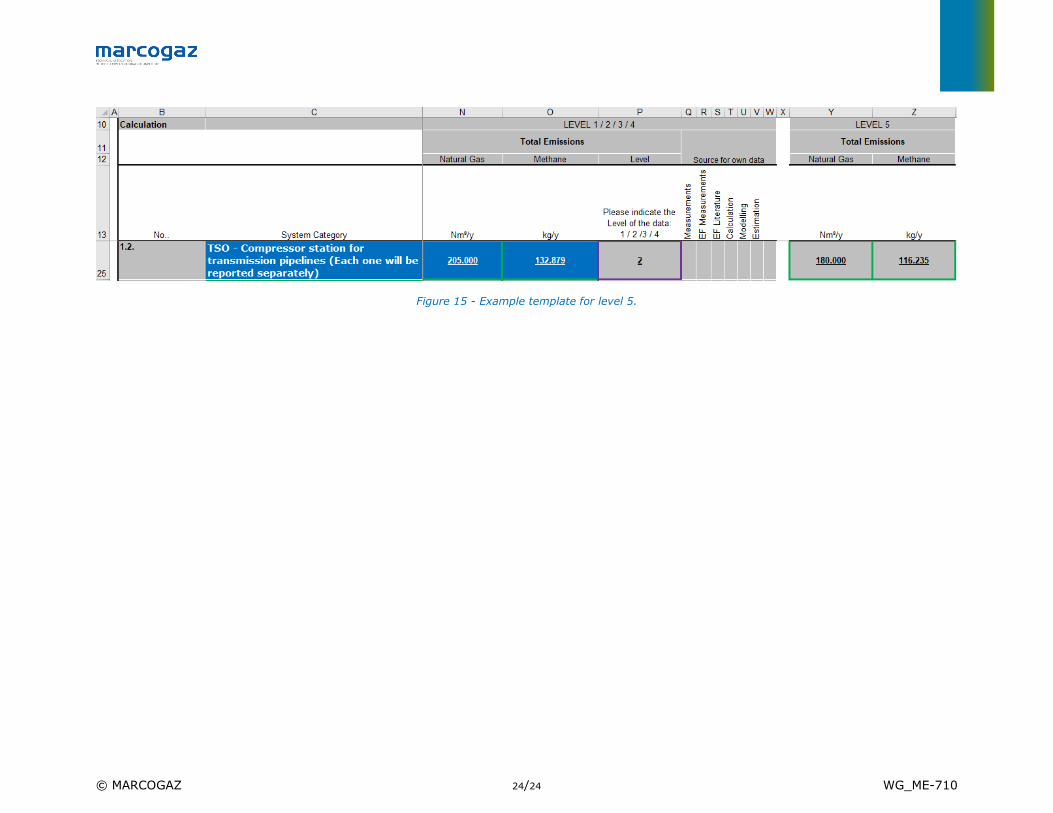
❖ Level 5
Emissions reported similarly to Level 4, but with the addition of Site-level/Asset-level measurements validation.
These measurements can be airborne (aircrafts, drones…) or vehicle based (downwind concentration
measurement), Satellites are also used when the granularity and sensitivity is adequate.
The top-down measurement/assessment is only used to verify and validate the results from the level 4 approach
(bottom-up). The data that will be considered for any further use (e.g. inventories) are the one resulting from
the bottom-up approach (level 4).
The sampling principal to achieve the level 4 is valid for level 5: i.e. the reconciliation between emission source
specific quantification and asset/site measurement can be achieved on a representative sample of Sites/Assets
to achieve the level 5 as shown in §6, Figure 15.
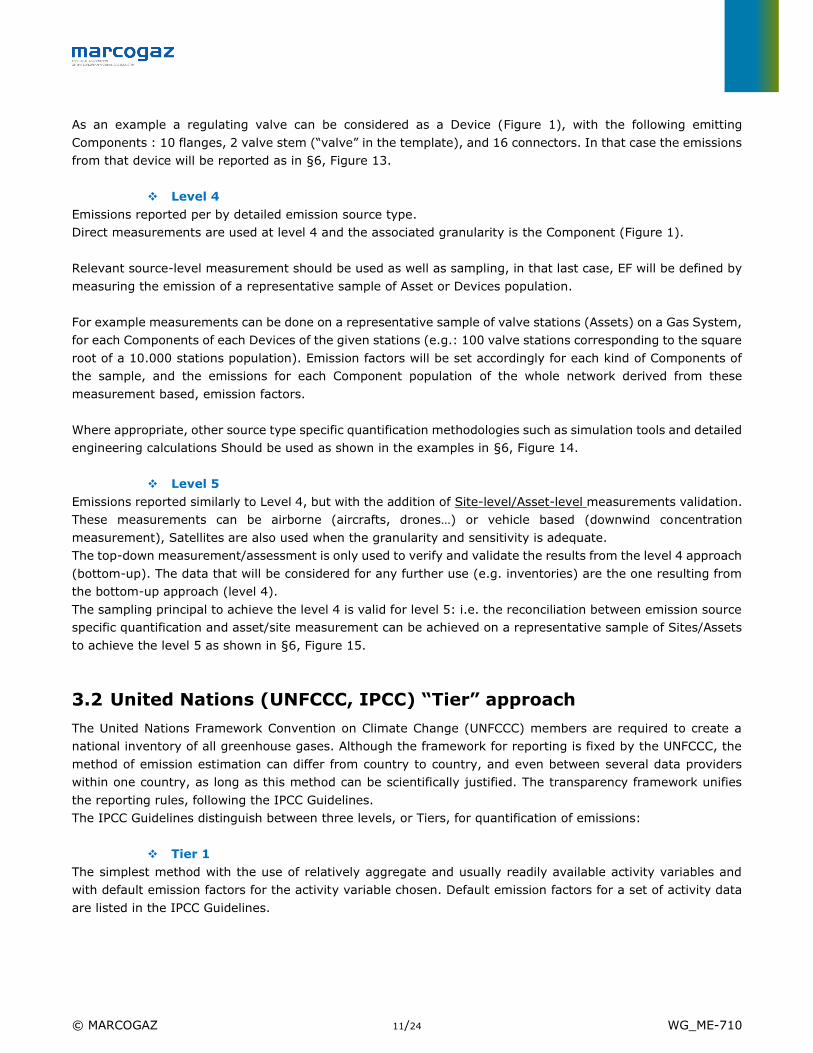
3.2 United Nations (UNFCCC, IPCC) “Tier” approach
The United Nations Framework Convention on Climate Change (UNFCCC) members are required to create a
national inventory of all greenhouse gases. Although the framework for reporting is fixed by the UNFCCC, the
method of emission estimation can differ from country to country, and even between several data providers
within one country, as long as this method can be scientifically justified. The transparency framework unifies
the reporting rules, following the IPCC Guidelines.
The IPCC Guidelines distinguish between three levels, or Tiers, for quantification of emissions:
❖ Tier 1
The simplest method with the use of relatively aggregate and usually readily available activity variables and
with default emission factors for the activity variable chosen. Default emission factors for a set of activity data
are listed in the IPCC Guidelines.
© MARCOGAZ 12/24 WG_ME-710
❖ Tier 2
Similar specification for the level of activity data as for Tier, 1 but with emission factors which are specific to
the country, e.g., based on national measurements and analysis.
❖ Tier 3
The most detailed approach based on a rigorous assessment at the facility level, involving the identification of
equipment-specific emission sources, count of equipment units, measurement of emission rates per equipment
type, etc.
The regulations on the use of these factors are different per country and often the country specifies its emission
factors, mostly for use to determine the remaining amount of methane after combustion.
Progressing from Tier 1 to Tier 3 represents a reduction in the uncertainty of Green House Gas estimates.
National Inventory Reports (NIR) should be based on Tier 3 approach for the entire gas chain: it means that
every gas and oil company across Europe should quantify methane emissions using a rigorous bottom-up
assessment at the facility level, involving identification and specific emission sources, count of equipment units,
measurement of emission rates per equipment type.
Figure 2 - Relation between IPCC Tier approach and OGMP level 1-5 reporting.
© MARCOGAZ 13/24 WG_ME-710
4 GUIDELINES FOR FILLING IN THE TEMPLATE
4.1 Description of the template’s structure
4.1.1 Organisation
The organization table should contain name and address of the company, the year for which methane emissions
will be reported, and contact details of the person responsible for its completion.
Figure 3 – Organisation details
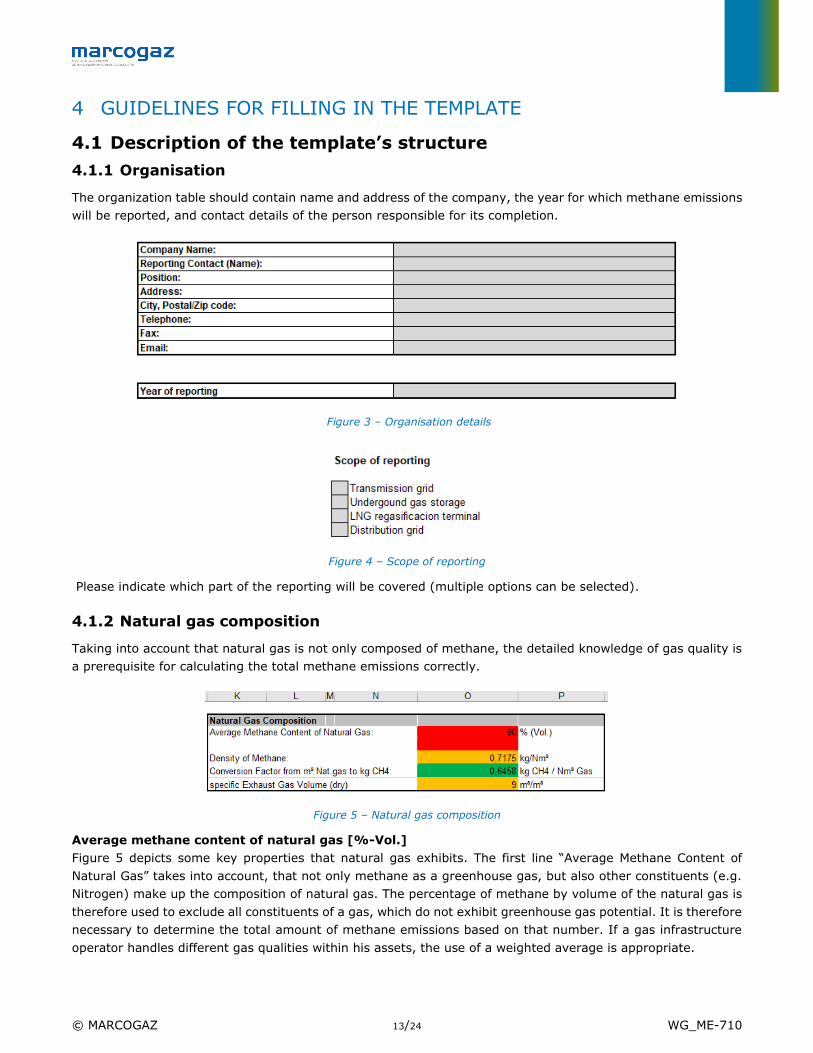
Figure 4 – Scope of reporting
Please indicate which part of the reporting will be covered (multiple options can be selected).
4.1.2 Natural gas composition
Taking into account that natural gas is not only composed of methane, the detailed knowledge of gas quality is
a prerequisite for calculating the total methane emissions correctly.
Figure 5 – Natural gas composition
Average methane content of natural gas [%-Vol.]
Figure 5 depicts some key properties that natural gas exhibits. The first line “Average Methane Content of
Natural Gas” takes into account, that not only methane as a greenhouse gas, but also other constituents (e.g.
Nitrogen) make up the composition of natural gas. The percentage of methane by volume of the natural gas is
therefore used to exclude all constituents of a gas, which do not exhibit greenhouse gas potential. It is therefore
necessary to determine the total amount of methane emissions based on that number. If a gas infrastructure
operator handles different gas qualities within his assets, the use of a weighted average is appropriate.
© MARCOGAZ 14/24 WG_ME-710
Density of methane [kg/m³] and conversion factor
The density of methane under normal conditions (273,15 K; 101.325 kPa) is a natural constant. Its value is
0,7175 kg/Nm³ [Ref. (8)]. It is used for converting volume to mass (and vice versa).
Specific exhaust gas volume (dry)
The specific exhaust gas volume determines volume of exhaust gas when burning one cubic meter (1m³) of a
gaseous fuel. The value is dependent on the composition of the natural gas. It is normalized to normal conditions
and dry exhaust gas (not taking the water vapour into account). Furthermore, the Air–fuel equivalence ratio is
set to 1 by definition (i.e. the oxygen concentration in the exhaust gas is zero). Typical H-Gases exhibit a specific
exhaust gas volume (dry) of approx. 9 Nm³/Nm³.
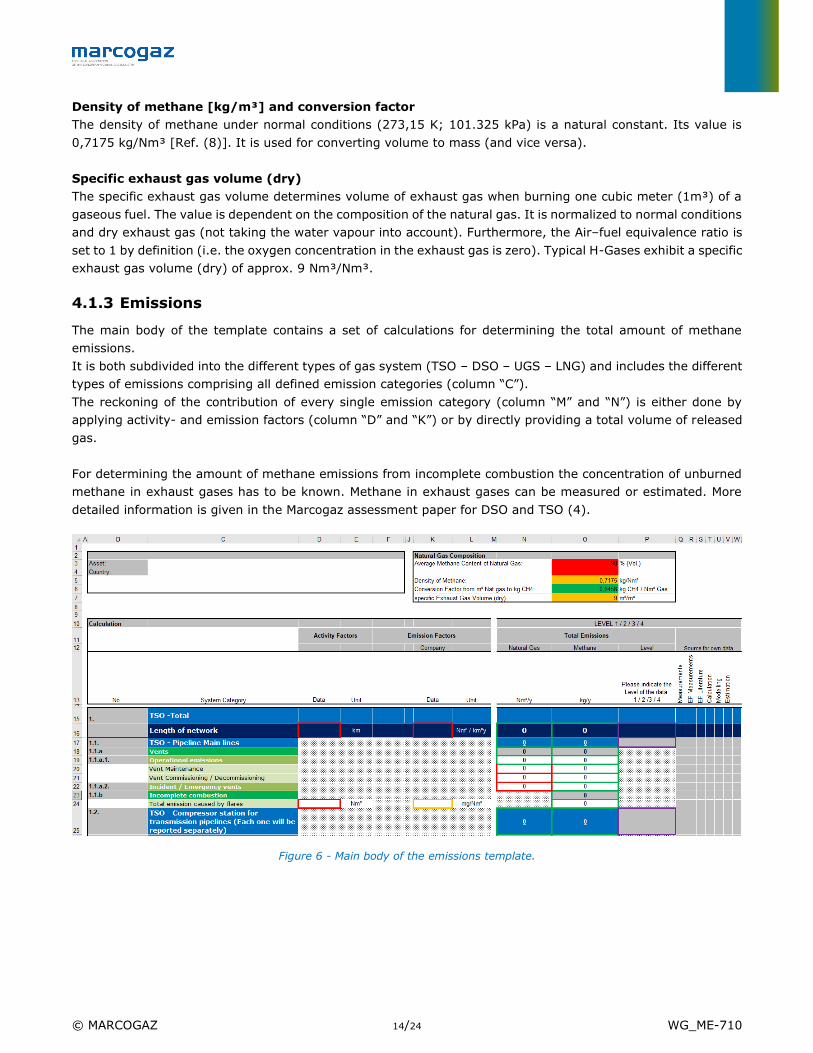
4.1.3 Emissions
The main body of the template contains a set of calculations for determining the total amount of methane
emissions.
It is both subdivided into the different types of gas system (TSO – DSO – UGS – LNG) and includes the different
types of emissions comprising all defined emission categories (column “C”).
The reckoning of the contribution of every single emission category (column “M” and “N”) is either done by
applying activity- and emission factors (column “D” and “K”) or by directly providing a total volume of released
gas.
For determining the amount of methane emissions from incomplete combustion the concentration of unburned
methane in exhaust gases has to be known. Methane in exhaust gases can be measured or estimated. More
detailed information is given in the Marcogaz assessment paper for DSO and TSO (4).
Figure 6 - Main body of the emissions template.
© MARCOGAZ 15/24 WG_ME-710
In general
The templates cells are partially framed in different colours indicating the type of numbers / values / figures
they are containing:
✓ Red framed: input of data from user is necessary
✓ Orange framed: content may change from time to time, but not necessarily on a yearly basis. Changes
may be caused by the user (e. g. new emission factors provided by the user) or new literature data
respectively.
✓ Green framed: data coming from measurements (input from the user) or content directly calculated in
the spreadsheet
4.1.3.1 Type of gas systems (TSO – UGS – LNG – DSO)
The system categories (assets / devices / components) that are depicted in the template are derived from the
typical assets that the different stakeholders of the midstream gas sector are operating. As all the four sectors
are dealing with natural gas, several assets are similar, nevertheless the sectoral specialities are taken into
account.
An aggregation to groups of similar assets was introduced where it seemed appropriate. Moreover, it may be
possible, that a company from a certain sector is not operating all the assets types which are mentioned in the
template (i.e. a TSO may not necessarily operate a compressor station).
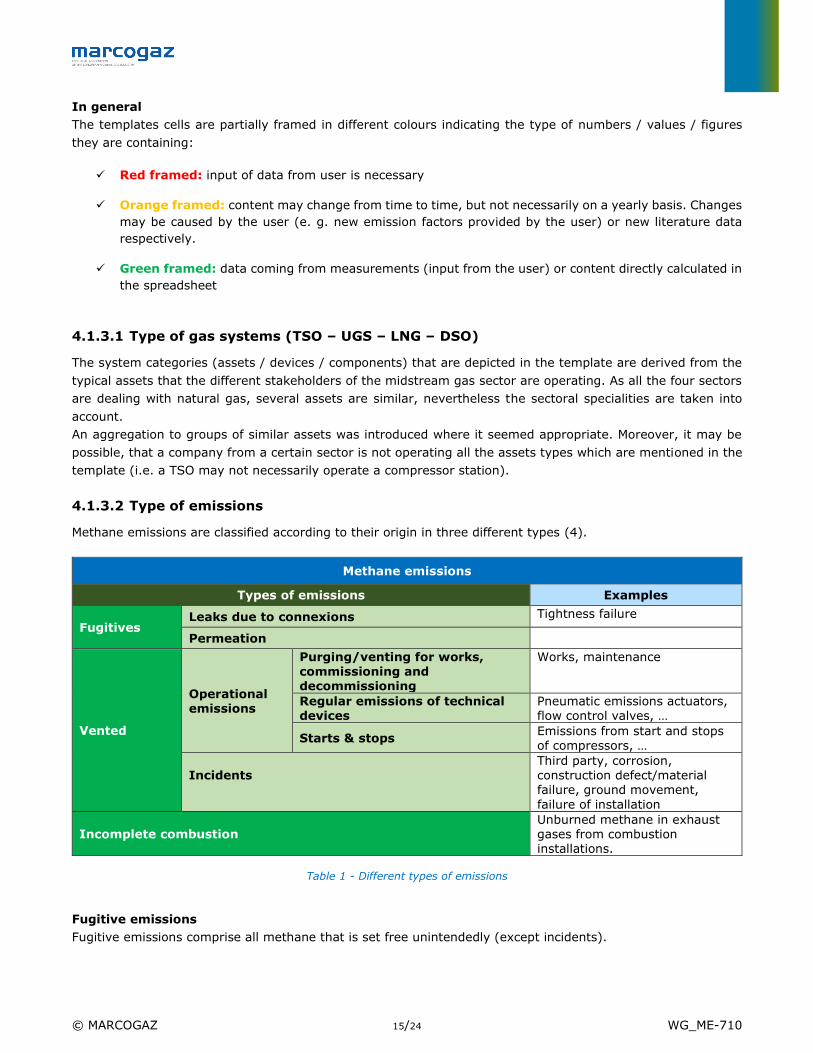
4.1.3.2 Type of emissions
Methane emissions are classified according to their origin in three different types (4).
Methane emissions
Types of emissions Examples
Fugitives Leaks due to connexions Tightness failure
Permeation
Vented
Operational emissions
Purging/venting for works, commissioning and decommissioning
Works, maintenance
Regular emissions of technical devices
Pneumatic emissions actuators, flow control valves, …
Starts & stops Emissions from start and stops of compressors, …
Incidents
Third party, corrosion,
construction defect/material failure, ground movement,
failure of installation
Incomplete combustion
Unburned methane in exhaust gases from combustion installations.
Table 1 - Different types of emissions
Fugitive emissions
Fugitive emissions comprise all methane that is set free unintendedly (except incidents).
© MARCOGAZ 16/24 WG_ME-710
Fugitive emissions occur mostly due to tightness failures of any type of connections; however, many other
components are prone to fugitive emissions, too.
The total of all fugitive emissions of one operator can hardly be measured empirically. They are estimated on
the basis of multiplying one single emission factor with the activity factor for a specific system category.
Vented emissions
Vented emissions include both intentional release of gas from different parts of the system and emissions caused
by incidents due to integrity failures, third-party damages and emergency situations. Typically, vented emissions
are not reckoned by using emission and activity factors, they are reported directly by calculating the emitted
volume (geometric volume * applied pressure).
Incomplete combustion emissions
Combustion of natural gas contribute to this category depending on combustion technology.
More detailed information is given in the Marcogaz assessment paper for DSO and TSO (4).
4.1.3.3 Guidance for the use of emission factors
Emissions factors indicate the amount of (in most cases fugitive) emissions that may occur on any kind of
installation. It’s in the nature of things that emissions factors cannot be infinitely precise, for they are covering
in most cases a plurality (see: activity factor) of similar however in detail different types of installations.
Suitable emission factors are currently rare and incomplete However, it is expected that OGMP (Oil and Gas
Methane Partnership) will give guidance for suitable emission factors.
The EF used describes a typical methane emission from a component or an emission event, established from
academic publications, field measurement campaigns on a device population sample, gas industry R&D research,
or equipment supplier data, so that the EF are at the closest of the company equipment reality. The relevant EF
is then applied to a population of emitting sources.
In general, if the source of emissions on a certain installation is not known or cannot be separated, it has to be
reported in the next higher ranked level.
Example: if for compressor vents, the details between maintenance vents, start vents and stop vents are not
known, the emission in question has to be reported as vents in general (category 1.2.b).
If the granularity of data from the reporting company is larger than the template indicates (e.g. there may more
than one emission factor for one single category) then using an (weighted) average value as emission factor is
appropriate.
Emission factors can be determined by measurement (e.g. Bagging, High Flow Sampler, FID, etc.) or can be
estimated from literature and experience. Anyway, the operator of a specific asset has to report on the source
of the chosen emission factors. emission factors can be expressed in different unit. In the Marcogaz report:
Assesment of Methane emissions for gas transmission and Distribution system operators (4) different appraches
are given to derive emisssion factors.
The Column “K” contains the emission factors specified for a single company. Columns “G”, “H” and “I” contain
emission factors that were collected (or will be in future time) from the MARCOGAZ-group from different
companies all over Europe (in a separate work flow), indicating a minimum, a medium and a maximum value
reported by any company. In case of not knowing your companies’ emissions factor for a certain category of
emissions, it may be reasonable to use these.
© MARCOGAZ 17/24 WG_ME-710
Figure 7 - Emission factors in the template
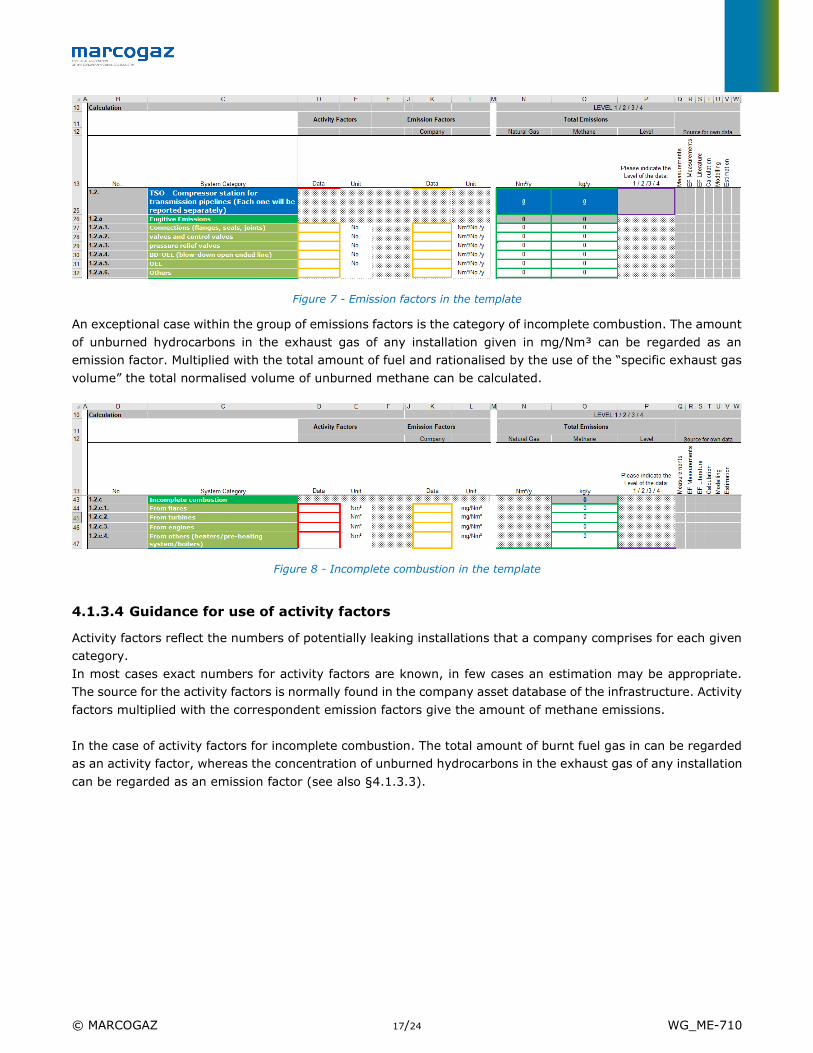
An exceptional case within the group of emissions factors is the category of incomplete combustion. The amount
of unburned hydrocarbons in the exhaust gas of any installation given in mg/Nm³ can be regarded as an
emission factor. Multiplied with the total amount of fuel and rationalised by the use of the “specific exhaust gas
volume” the total normalised volume of unburned methane can be calculated.
Figure 8 - Incomplete combustion in the template
4.1.3.4 Guidance for use of activity factors
Activity factors reflect the numbers of potentially leaking installations that a company comprises for each given
category.
In most cases exact numbers for activity factors are known, in few cases an estimation may be appropriate.
The source for the activity factors is normally found in the company asset database of the infrastructure. Activity
factors multiplied with the correspondent emission factors give the amount of methane emissions.
In the case of activity factors for incomplete combustion. The total amount of burnt fuel gas in can be regarded
as an activity factor, whereas the concentration of unburned hydrocarbons in the exhaust gas of any installation
can be regarded as an emission factor (see also §4.1.3.3).
© MARCOGAZ 18/24 WG_ME-710
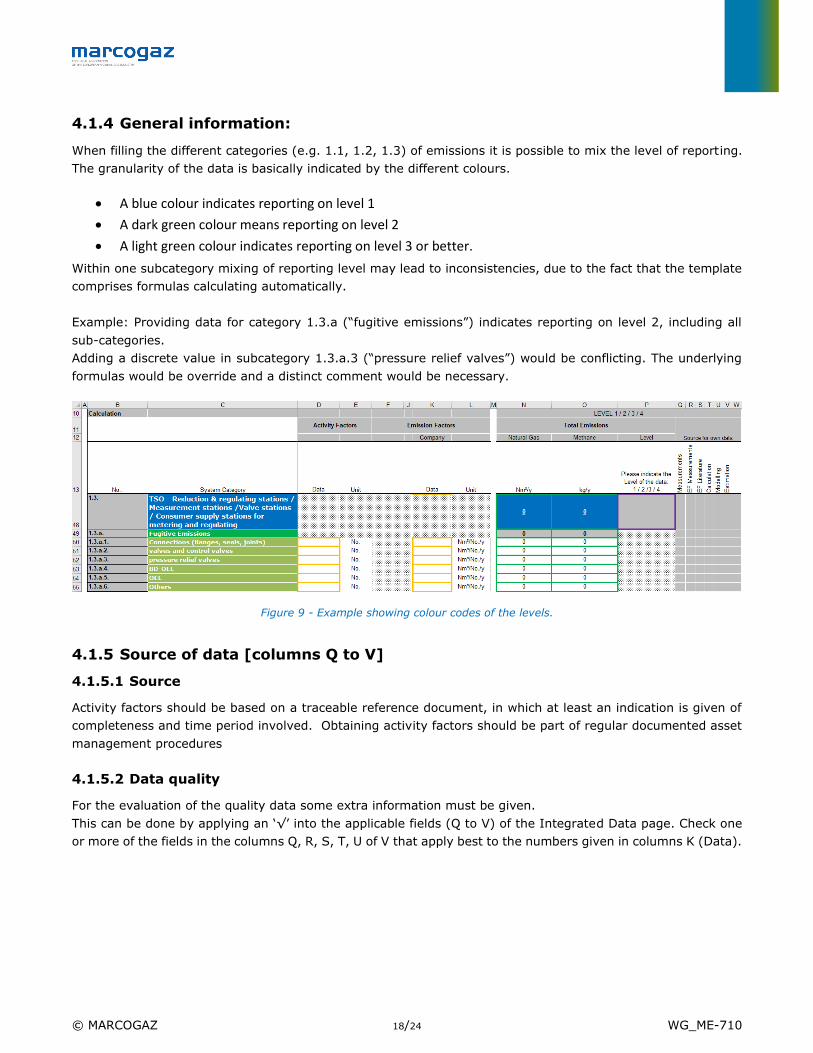
4.1.4 General information:
When filling the different categories (e.g. 1.1, 1.2, 1.3) of emissions it is possible to mix the level of reporting.
The granularity of the data is basically indicated by the different colours.
• A blue colour indicates reporting on level 1
• A dark green colour means reporting on level 2
• A light green colour indicates reporting on level 3 or better.
Within one subcategory mixing of reporting level may lead to inconsistencies, due to the fact that the template
comprises formulas calculating automatically.
Example: Providing data for category 1.3.a (“fugitive emissions”) indicates reporting on level 2, including all
sub-categories.
Adding a discrete value in subcategory 1.3.a.3 (“pressure relief valves”) would be conflicting. The underlying
formulas would be override and a distinct comment would be necessary.
Figure 9 - Example showing colour codes of the levels.
4.1.5 Source of data [columns Q to V]
4.1.5.1 Source
Activity factors should be based on a traceable reference document, in which at least an indication is given of
completeness and time period involved. Obtaining activity factors should be part of regular documented asset
management procedures
4.1.5.2 Data quality
For the evaluation of the quality data some extra information must be given.
This can be done by applying an ‘√’ into the applicable fields (Q to V) of the Integrated Data page. Check one
or more of the fields in the columns Q, R, S, T, U of V that apply best to the numbers given in columns K (Data).
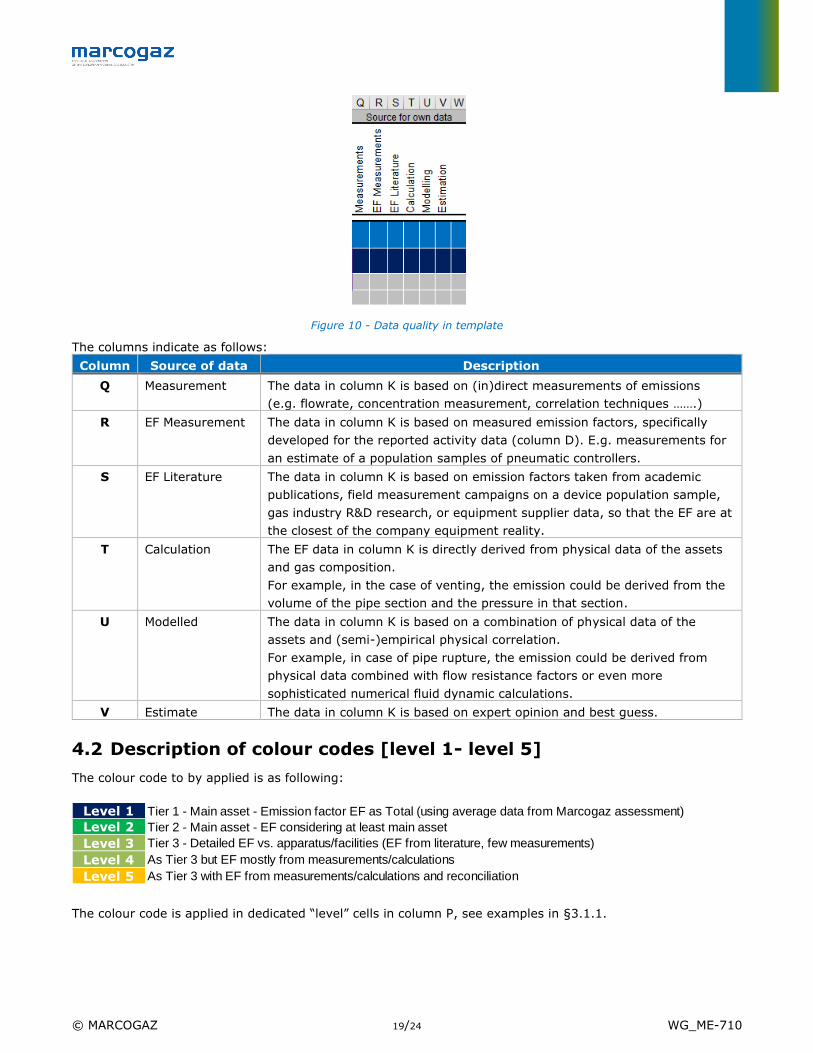
© MARCOGAZ 19/24 WG_ME-710
Figure 10 - Data quality in template
The columns indicate as follows:
Column Source of data Description
Q Measurement The data in column K is based on (in)direct measurements of emissions
(e.g. flowrate, concentration measurement, correlation techniques …….)
R EF Measurement The data in column K is based on measured emission factors, specifically
developed for the reported activity data (column D). E.g. measurements for
an estimate of a population samples of pneumatic controllers.
S EF Literature The data in column K is based on emission factors taken from academic
publications, field measurement campaigns on a device population sample,
gas industry R&D research, or equipment supplier data, so that the EF are at
the closest of the company equipment reality.
T Calculation The EF data in column K is directly derived from physical data of the assets
and gas composition.
For example, in the case of venting, the emission could be derived from the
volume of the pipe section and the pressure in that section.
U Modelled The data in column K is based on a combination of physical data of the
assets and (semi-)empirical physical correlation.
For example, in case of pipe rupture, the emission could be derived from
physical data combined with flow resistance factors or even more
sophisticated numerical fluid dynamic calculations.
V Estimate The data in column K is based on expert opinion and best guess.
4.2 Description of colour codes [level 1- level 5]
The colour code to by applied is as following:
The colour code is applied in dedicated “level” cells in column P, see examples in §3.1.1.
Level 1 Tier 1 - Main asset - Emission factor EF as Total (using average data from Marcogaz assessment)
Level 2 Tier 2 - Main asset - EF considering at least main asset
Level 3 Tier 3 - Detailed EF vs. apparatus/facilities (EF from literature, few measurements)
Level 4 As Tier 3 but EF mostly from measurements/calculations
Level 5 As Tier 3 with EF from measurements/calculations and reconciliation
© MARCOGAZ 20/24 WG_ME-710
5 BIBLIOGRAPHY
1. prCEN/TR 234. Definition Paper — Definitions used in CEN/TC 234 standards. 2018. 2. EN-12583. Gas Infrastructure - Compressor stations - Functional rquirements. Brussels : CEN-CENELEC,
2014.
3. EN-12186. Gas infrastructure - Gas pressure regulating stations for transmission and distribution - Functional
requirements. s.l. : CEN, 2014.
4. MARCOGAZ. Assesment of Methane emissions for gas transmission and Distribution system operators. [En
ligne] https://www.marcogaz.org/app/download/8161672063/WG_ME-485-
Assessment+of+methane+emissions+for+gas+Transmission+and+Distribution+system+operator.pdf?t=1588
852446.
5. Gas supply - Gas pipework for buildings - Maximum operating pressure less than or equal to 5 bar - Functional
recommendations. EN-1775. Vol. 2007.
6. 12279, NEN-EN. Gas supply systems - Gas pressure regulating installations on service lines - Functional
requirements. 2000.
7. JCGM-100. Evaluation of measurement data - Guide to the expression of uncertainty in measurement. s.l. :
Committee for Guides in Metrology (JCGM/WG 1), 2008.
8. G. T. Armstrong, T. L. Jobe Jr. "Heating Values of Natural Gas and Its Components", NBSIR 82-2401,
Washington: US Department of Commerce. 1982.
9. 2009/73/EC. DIRECTIVE 2009/73/EC OF THE EUROPEAN PARLIAMENT AND OF THE COUNCIL of 13 July
2009 concerning common rules for the internal market in natural gas and repealing Directive 2003/55/EC. s.l.
. 2009.
10. EN-12327. Gas infrastructure - Pressure testing, commissioning and decommissioning procedures -
Functional requirement. 2012.
© MARCOGAZ 21/24 WG_ME-710
6 ANNEX - OGMP LEVEL 1, 2, 3, 4 AND 5
Figure 11 - Example template for level 1
© MARCOGAZ 22/24 WG_ME-710
Figure 12 - Example template for level 2.
© MARCOGAZ 23/24 WG_ME-710
Figure 13 - Example template for level 3.
Figure 14 - Example template for level 4.
© MARCOGAZ 24/24 WG_ME-710
Figure 15 - Example template for level 5.