Methane Emissions from Large Dams as Renewable Energy Resources: A Developing Nation Perspective
14
Abstract By means of a theoretical model, bootstrap resampling and data provided by the International Commission On Large Dams (ICOLD (2003) World register of dams. http://www.icold-cigb.org) we found that global large dams might annually release about 104 ± 7.2 Tg CH 4 to the atmosphere through reservoir surfaces, tur- bines and spillways. Engineering technologies can be implemented to avoid these emissions, and to recover the non-emitted CH 4 for power generation. The imme- diate benefit of recovering non-emitted CH 4 from large dams for renewable energy production is the mitigation of anthropogenic impacts like the construction of new large dams, the actual CH 4 emissions from large dams, and the use of unsustainable fossil fuels and natural gas reserves. Under the Clean Development Mechanism of the Kyoto Protocol, such technologies can be recognized as promising alternatives for human adaptations to climate change concerning sustainable power generation, particularly in developing nations owning a considerable number of large dams. In view of novel technologies to extract CH 4 from large dams, we estimate that roughly 23 ± 2.6, 2.6 ± 0.2 and 32 ± 5.1 Tg CH 4 could be used as an environmentally sound option for power generation in Brazil, China and India, respectively. For the whole world this number may increase to around 100 ± 6.9 Tg CH 4 . Keywords Emission mitigation MDL Methane recovery Renewable energy Reservoir Spillway Turbine 1 Introduction Large dams (LD) present a central role in the civilization development. In several nations, they are responsible for drinking water supply, river flood/drought control, irrigation for food production, and, more recently, for hydroelectric power genera- tion. Although LD have been essential for the well-being of mankind, there are a I. B. T. Lima (&) F. M. Ramos L. A. W. Bambace R. R. Rosa National Institute for Space Research (INPE), Astronautas Av., 1758, S. J. Campos, SP, Brazil e-mail: [email protected] 123 Mitig Adapt Strat Glob Change (2008) 13:193–206 DOI 10.1007/s11027-007-9086-5 ORIGINAL PAPER Methane Emissions from Large Dams as Renewable Energy Resources: A Developing Nation Perspective Ivan B. T. Lima Fernando M. Ramos Luis A. W. Bambace Reinaldo R. Rosa Received: 14 November 2006 / Accepted: 5 February 2007 / Published online: 2 March 2007 ȑ Springer Science+Business Media B.V. 2007
Transcript of Methane Emissions from Large Dams as Renewable Energy Resources: A Developing Nation Perspective
Abstract By means of a theoretical model, bootstrap resampling and data providedby the International Commission On Large Dams (ICOLD (2003) World register ofdams. http://www.icold-cigb.org) we found that global large dams might annuallyrelease about 104 ± 7.2 Tg CH4 to the atmosphere through reservoir surfaces, tur-bines and spillways. Engineering technologies can be implemented to avoid theseemissions, and to recover the non-emitted CH4 for power generation. The imme-diate benefit of recovering non-emitted CH4 from large dams for renewable energyproduction is the mitigation of anthropogenic impacts like the construction of newlarge dams, the actual CH4 emissions from large dams, and the use of unsustainablefossil fuels and natural gas reserves. Under the Clean Development Mechanism ofthe Kyoto Protocol, such technologies can be recognized as promising alternativesfor human adaptations to climate change concerning sustainable power generation,particularly in developing nations owning a considerable number of large dams. Inview of novel technologies to extract CH4 from large dams, we estimate that roughly23 ± 2.6, 2.6 ± 0.2 and 32 ± 5.1 Tg CH4 could be used as an environmentally soundoption for power generation in Brazil, China and India, respectively. For the wholeworld this number may increase to around 100 ± 6.9 Tg CH4.
Keywords Emission mitigation Æ MDL Æ Methane recovery Æ Renewable energy ÆReservoir Æ Spillway Æ Turbine
1 Introduction
Large dams (LD) present a central role in the civilization development. In severalnations, they are responsible for drinking water supply, river flood/drought control,irrigation for food production, and, more recently, for hydroelectric power genera-tion. Although LD have been essential for the well-being of mankind, there are a
I. B. T. Lima (&) Æ F. M. Ramos Æ L. A. W. Bambace Æ R. R. RosaNational Institute for Space Research (INPE), Astronautas Av., 1758, S. J. Campos, SP, Brazile-mail: [email protected]
123
Mitig Adapt Strat Glob Change (2008) 13:193–206DOI 10.1007/s11027-007-9086-5
ORI GI N A L P A PE R
Methane Emissions from Large Dams as RenewableEnergy Resources: A Developing Nation Perspective
Ivan B. T. Lima Æ Fernando M. Ramos ÆLuis A. W. Bambace Æ Reinaldo R. Rosa
Received: 14 November 2006 / Accepted: 5 February 2007 / Published online: 2 March 2007� Springer Science+Business Media B.V. 2007
number of environmental shortcomings emerging from damming and floodingpristine river basins. The well-known worldwide impacts of LD are local peopledisplacement (Bartolome et al. 2000), fish community alteration and vanish ofcommercial fishery practices, lost of biodiversity, lost of natural and agriculturalterrestrial ecosystems (Berkamp et al. 2000), and the emission of greenhouse gasesto the atmosphere (Rosa and Santos 2000), especially methane (CH4). In fact, thepractice of flooding terrestrial ecosystems might be altering atmospheric CH4 sincethe past five thousand years (Ruddiman 2003; Ruddiman et al. 2005).
After carbon dioxide, CH4 is the most important greenhouse gas. It is responsiblefor more than 20% of change in the radiative forcing due to anthropogenic green-house gas emissions to the atmosphere (Shindell et al. 2005). The anthropogenicincrease of the CH4 mixing ratio in the atmosphere after the XVIII century has beenattributed to coal, natural gas, forest clearing/burning, landfill, domestic ruminantsand rice cultivation (Wuebbles and Hayhoe 2002). Several authors have shown thatLD may also represent a fraction of the anthropogenic CH4 (Saint Louis et al. 2000;Abril et al. 2005; Soumis et al. 2005; Duchemin et al. 2006). A first estimate indi-cated that for a global LD area of 1.5 · 106 km2 about 69.3 Tg CH4 (1 Tg = 1012 g)can be annually released by bubbling and diffusive processes (Saint Louis et al.2000). Despite the uncertainties on LD upstream (reservoir surface) emissions, aforming consensus is that LD downstream (turbines and spillways) emissions mightbe responsible for a substantial release of CH4 to the atmosphere (Fearnside 2002;Abril et al. 2005; Guerin et al. 2006; Kemenes et al. 2006). A ‘‘degas drop-pressureeffect’’ arises when CH4-saturated water passes through turbines and spillways(Fearnside 2002; 2004; 2005a, b). In conjunction with turbulence, this effect may leadto cavitation phenomena, creating suitable conditions for bubble (short-term) CH4
releases immediately downstream to LD. In addition, enriched-CH4 waters maysteadily (long-term) release CH4 to the atmosphere on the course of severalkilometers downstream to LD (Guerin et al. 2006; Kemenes et al. 2006).
Following this rational, Bambace et al. (2007) have proposed a series of engi-neering solutions to mitigate upstream and downstream CH4 emissions. Thesetechnologies, associated to efficient CH4 degassing and storage systems, can promotethe recover of the non-emitted CH4 for power generation. In brief, turbine andspillway emissions should be controlled by gate-buoys, allowing only CH4-depletedsurface waters being turbined or spilled downstream. The non-emitted CH4 cantherefore be extracted upstream at the hypolimnion via CH4 degassing/storagesystems (Bambace et al. 2007), before the occurrence of either surface atmosphericemission or oxidation by methanotrophic bacteria in the water column (Guerin andAbril 2004; Lima 2005). For Amazon LD, a first assessment indicates that powergeneration from biogenic CH4 is technically and economically viable (Ramos et al.2007).
In the present paper, we show updated calculations for global LD CH4 emissions.By means of a theoretical model, bootstrap resampling and data provided by theInternational Commission On Large Dams (ICOLD 2003) we compute approxi-mations of upstream and downstream LD CH4 emissions. We further estimate thepotential power generation from LD CH4 recovery in the world, and in threeimportant developing nations owning a considerable number of LD, namely Brazil,China and India.
194 Mitig Adapt Strat Glob Change (2008) 13:193–206
123
2 Data sources, model premises and parameterization
Although most premises in the present model are based on published information,chosen parameters can be very specific, and a case-by-case model would be ratherimpracticable for 31,148 LD available in ICOLD (2003) between 1880 and 2005. Themodel is then an a priori assessment, and an effort to extend the global empiricalinformation is necessary to better define model parameters and to improve theresults herein obtained.
2.1 Annual upstream CH4 emission model
Annual upstream CH4 emission estimations (fup) were made by using empiricalequations determined for temperate lakes by Bastviken et al. (2004, Table 2, p. 6),relating lake surface area to diffusive, bubble and storage (overturn) CH4 emissions.There are in total 33,071 registered LD in ICOLD (2003). From 1880 to 2005 thereare 31,148 registered LD in the world, of which 73% present surface area infor-mation (ICOLD 2003).
Uncertainties in the upstream CH4 emission model are in part associated tolog-log regression equations given in Bastviken et al. (2004). Log–log regressionindeterminacies are approximately 22, 14 and 59% for bubble, diffusive and overturnemissions (Bastviken et al. 2004). Besides, the equations are given solely for lakes inthe temperate region. After several years of impoundment, a steady state reservoirtends to present similar bacterial abundance and biomass of surrounding naturallakes (Soumis et al. 2005). It was then assumed that both temperate reservoirs andlakes might exhibit comparable steady state annual upstream CH4 emissions. We donot consider transient large emission after LD reservoir filling because the timespam to reach steady state of about 10 years is small (Abril et al. 2005; Soumis et al.2005) in relation to the 125-year period of analysis. Furthermore, CH4 lifetime in theatmosphere was around 6.2 and 8.4 years between 1880 and 2005 (Lelieveld et al.1998).
Upstream CH4 emissions of tropical LD should be 5- to 15-fold superior to up-stream CH4 emissions of temperate LD (Saint Louis et al. 2000; Soumis et al. 2005).For this reason, it was assumed that CH4 upstream emissions in tropical LD can beroughly 10-fold superior to those in temperate LD. Another simplification andsource of uncertainty in the upstream CH4 emission model is that tropical (tem-perate) LD were considered those that at lest 50% of the LD nation area is within(outside) the equatorial region between 20� N and 20� S. The same was done for thedownstream CH4 emission calculations.
For consistency assessment in the upstream emission model, we calculated localmean (±1 standard deviation, SD) and median CH4 emission factors for temperateand tropical LD, and compared them to empirical values of a recent compilation(Table 1). Such compilation however does not include overturn emissions (Soumiset al. 2005). Although all uncertainties cannot be fully assessed for model optimi-zation, the output of the upstream CH4 emission model is reasonably consistent toempirical data. The model and empirical means were of similar magnitude in bothtemperate and tropical cases (Table 1). For the tropical case, the model median isabout 2.3 above the empirical median, while the separation between model andempirical means is quite narrow. In general, empirical means are 4.8 and 1.2 greaterthan model means. Coefficients of variation are between 38 and 43% in model and
Mitig Adapt Strat Glob Change (2008) 13:193–206 195
123
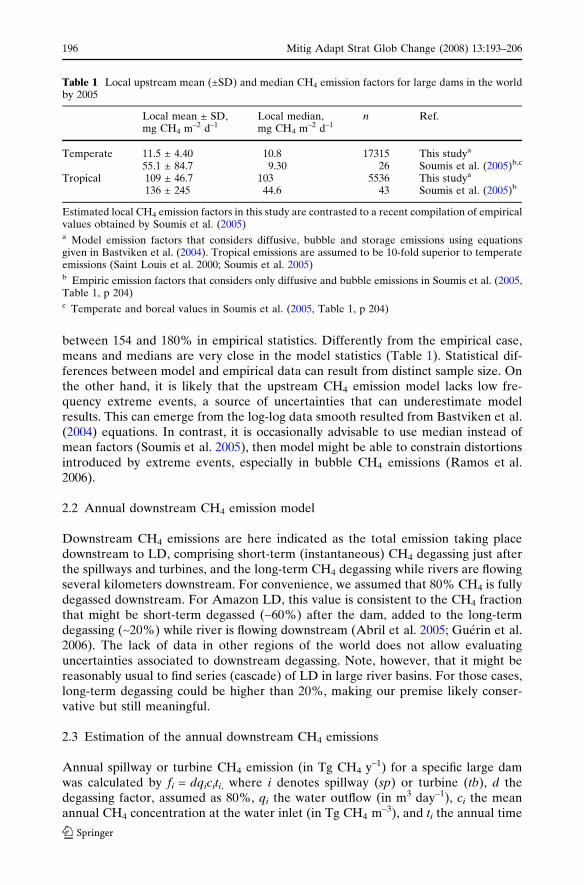
between 154 and 180% in empirical statistics. Differently from the empirical case,means and medians are very close in the model statistics (Table 1). Statistical dif-ferences between model and empirical data can result from distinct sample size. Onthe other hand, it is likely that the upstream CH4 emission model lacks low fre-quency extreme events, a source of uncertainties that can underestimate modelresults. This can emerge from the log-log data smooth resulted from Bastviken et al.(2004) equations. In contrast, it is occasionally advisable to use median instead ofmean factors (Soumis et al. 2005), then model might be able to constrain distortionsintroduced by extreme events, especially in bubble CH4 emissions (Ramos et al.2006).
2.2 Annual downstream CH4 emission model
Downstream CH4 emissions are here indicated as the total emission taking placedownstream to LD, comprising short-term (instantaneous) CH4 degassing just afterthe spillways and turbines, and the long-term CH4 degassing while rivers are flowingseveral kilometers downstream. For convenience, we assumed that 80% CH4 is fullydegassed downstream. For Amazon LD, this value is consistent to the CH4 fractionthat might be short-term degassed (~60%) after the dam, added to the long-termdegassing (~20%) while river is flowing downstream (Abril et al. 2005; Guerin et al.2006). The lack of data in other regions of the world does not allow evaluatinguncertainties associated to downstream degassing. Note, however, that it might bereasonably usual to find series (cascade) of LD in large river basins. For those cases,long-term degassing could be higher than 20%, making our premise likely conser-vative but still meaningful.
2.3 Estimation of the annual downstream CH4 emissions
Annual spillway or turbine CH4 emission (in Tg CH4 y–1) for a specific large damwas calculated by fi = dqiciti, where i denotes spillway (sp) or turbine (tb), d thedegassing factor, assumed as 80%, qi the water outflow (in m3 day–1), ci the meanannual CH4 concentration at the water inlet (in Tg CH4 m–3), and ti the annual time
Table 1 Local upstream mean (±SD) and median CH4 emission factors for large dams in the worldby 2005
Local mean ± SD,mg CH4 m–2 d–1
Local median,mg CH4 m–2 d–1
n Ref.
Temperate 11.5 ± 4.40 10.8 17315 This studya
55.1 ± 84.7 9.30 26 Soumis et al. (2005)b,c
Tropical 109 ± 46.7 103 5536 This studya
136 ± 245 44.6 43 Soumis et al. (2005)b
Estimated local CH4 emission factors in this study are contrasted to a recent compilation of empiricalvalues obtained by Soumis et al. (2005)a Model emission factors that considers diffusive, bubble and storage emissions using equationsgiven in Bastviken et al. (2004). Tropical emissions are assumed to be 10-fold superior to temperateemissions (Saint Louis et al. 2000; Soumis et al. 2005)b Empiric emission factors that considers only diffusive and bubble emissions in Soumis et al. (2005,Table 1, p 204)c Temperate and boreal values in Soumis et al. (2005, Table 1, p 204)
196 Mitig Adapt Strat Glob Change (2008) 13:193–206
123
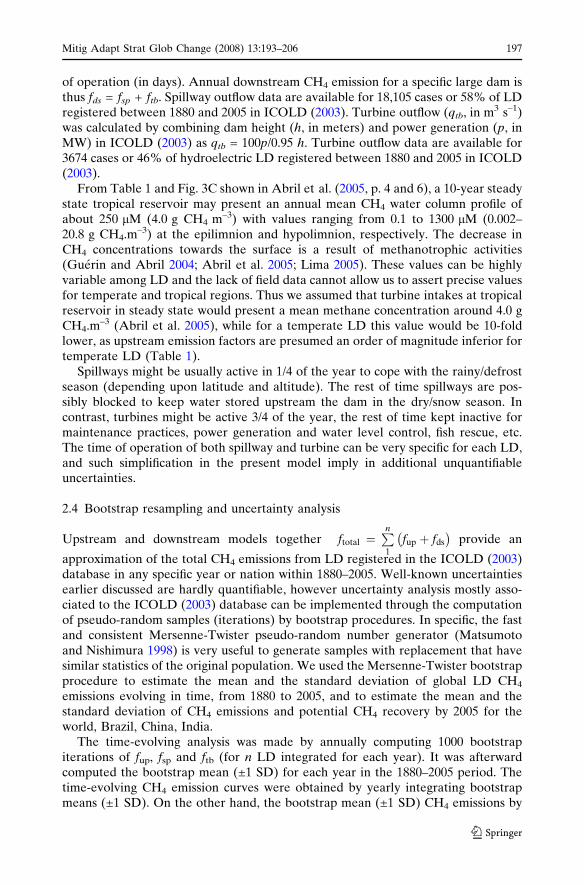
of operation (in days). Annual downstream CH4 emission for a specific large dam isthus fds = fsp + ftb. Spillway outflow data are available for 18,105 cases or 58% of LDregistered between 1880 and 2005 in ICOLD (2003). Turbine outflow (qtb, in m3 s–1)was calculated by combining dam height (h, in meters) and power generation (p, inMW) in ICOLD (2003) as qtb = 100p/0.95 h. Turbine outflow data are available for3674 cases or 46% of hydroelectric LD registered between 1880 and 2005 in ICOLD(2003).
From Table 1 and Fig. 3C shown in Abril et al. (2005, p. 4 and 6), a 10-year steadystate tropical reservoir may present an annual mean CH4 water column profile ofabout 250 lM (4.0 g CH4 m–3) with values ranging from 0.1 to 1300 lM (0.002–20.8 g CH4.m–3) at the epilimnion and hypolimnion, respectively. The decrease inCH4 concentrations towards the surface is a result of methanotrophic activities(Guerin and Abril 2004; Abril et al. 2005; Lima 2005). These values can be highlyvariable among LD and the lack of field data cannot allow us to assert precise valuesfor temperate and tropical regions. Thus we assumed that turbine intakes at tropicalreservoir in steady state would present a mean methane concentration around 4.0 gCH4.m–3 (Abril et al. 2005), while for a temperate LD this value would be 10-foldlower, as upstream emission factors are presumed an order of magnitude inferior fortemperate LD (Table 1).
Spillways might be usually active in 1/4 of the year to cope with the rainy/defrostseason (depending upon latitude and altitude). The rest of time spillways are pos-sibly blocked to keep water stored upstream the dam in the dry/snow season. Incontrast, turbines might be active 3/4 of the year, the rest of time kept inactive formaintenance practices, power generation and water level control, fish rescue, etc.The time of operation of both spillway and turbine can be very specific for each LD,and such simplification in the present model imply in additional unquantifiableuncertainties.
2.4 Bootstrap resampling and uncertainty analysis
Upstream and downstream models together ftotal ¼Pn
1
fup þ fds
� �provide an
approximation of the total CH4 emissions from LD registered in the ICOLD (2003)database in any specific year or nation within 1880–2005. Well-known uncertaintiesearlier discussed are hardly quantifiable, however uncertainty analysis mostly asso-ciated to the ICOLD (2003) database can be implemented through the computationof pseudo-random samples (iterations) by bootstrap procedures. In specific, the fastand consistent Mersenne-Twister pseudo-random number generator (Matsumotoand Nishimura 1998) is very useful to generate samples with replacement that havesimilar statistics of the original population. We used the Mersenne-Twister bootstrapprocedure to estimate the mean and the standard deviation of global LD CH4
emissions evolving in time, from 1880 to 2005, and to estimate the mean and thestandard deviation of CH4 emissions and potential CH4 recovery by 2005 for theworld, Brazil, China, India.
The time-evolving analysis was made by annually computing 1000 bootstrapiterations of fup, fsp and ftb (for n LD integrated for each year). It was afterwardcomputed the bootstrap mean (±1 SD) for each year in the 1880–2005 period. Thetime-evolving CH4 emission curves were obtained by yearly integrating bootstrapmeans (±1 SD). On the other hand, the bootstrap mean (±1 SD) CH4 emissions by
Mitig Adapt Strat Glob Change (2008) 13:193–206 197
123
2005 were calculated by computing 1000 iterations of fup, fsp and ftb for the world,Brazil, China and India in the whole 1880–2005 period. For both time-evolving and2005 calculations, the bootstrap resampling included the (n-N) missing values, thusraising the bootstrap sample size to the total number of LD between 1880 and 2005in ICOLD (2003).
Besides to the quantification of LD CH4 emissions and recovery, the bootstrapupstream/downstream model also allowed contrasting historical CH4 emissions fromLD to the observed increase in the atmospheric CH4 mixing ratio (Etheridge et al.2002, Dlugokencky et al. 2006), and to well-known anthropogenic CH4 sources(Stern and Kaufmann 1996; Houghton and Hackler 2002).
3 Results and discussions
3.1 Global CH4 budget and upstream/downstream CH4 sources
Atmospheric CH4 burden is globally modulated by natural and anthropogenicsources. Natural sources as wetlands, termites, oceans, marine sediments, geologicalsources and wild fires may annually release 145 to 200 Tg CH4 (Lelieveld et al. 1998;Wuebbles and Hayhoe 2002). Anthropogenic emissions, comprising coal mining andcombustion, oil and gas related emissions, biomass burning, domestic ruminants,waste disposal and rice paddies are expected to range in between 340 and 350 TgCH4 (Lelieveld et al. 1998; Wuebbles and Hayhoe 2002). The total annual sourcescan therefore be estimated in between 485 and 550 Tg CH4. There are uncertaintiesconcerning these values, as it assumes constancy in atmospheric CH4 removal bysinks, while the strength of natural and anthropogenic CH4 sources are very variablein space and time (Bousquet et al. 2006). That makes possible the addition of pre-viously unconsidered CH4 sources, such as geologic (Etiope 2004) and tropical forestemissions (Keppler et al. 2006). Here we provide convincingly evidences to add LDCH4 sources in the global atmospheric CH4 budget.
3.1.1 Upstream CH4 emissions
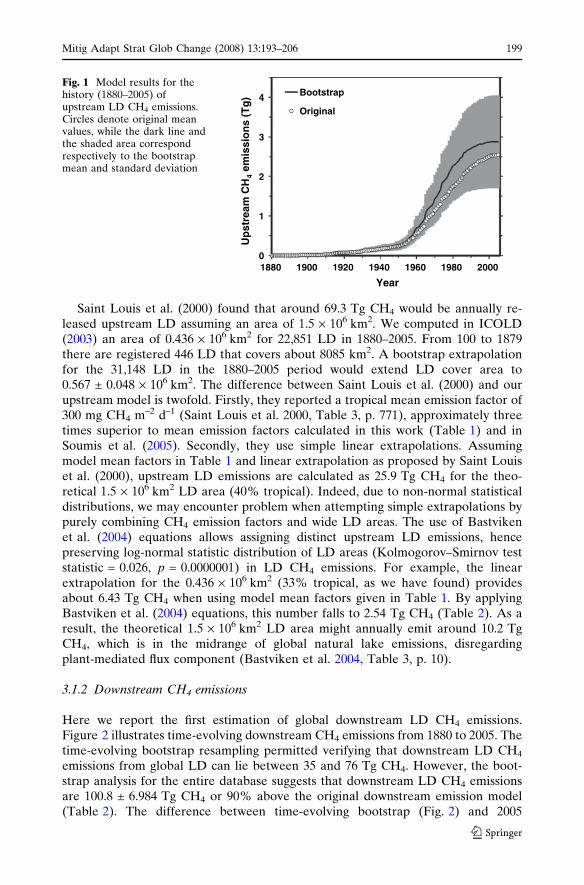
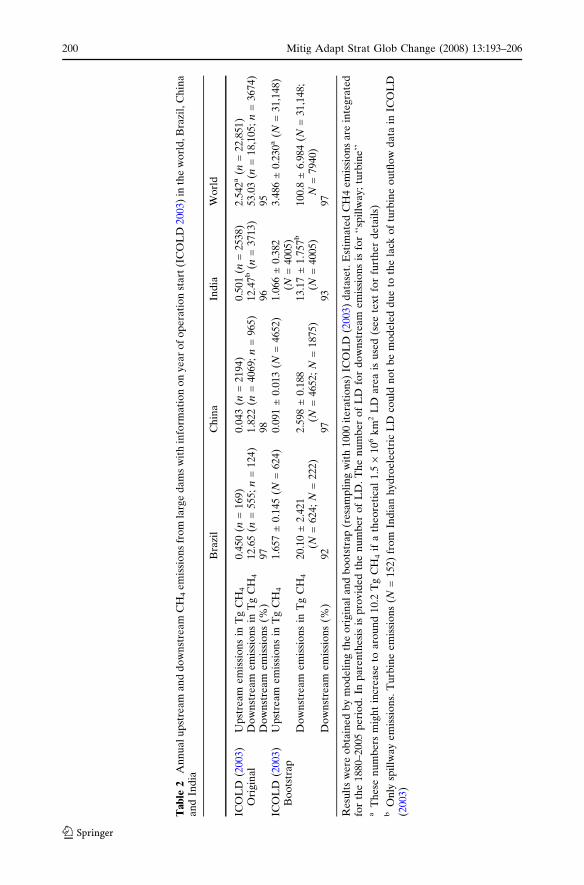
Figure 1 illustrates time-evolving upstream CH4 emissions from 1880 to 2005. Thecircles denote the time-evolving upstream emissions for the original data in ICOLD(2003). The black curve and the shade area correspond respectively to the bootstrapmean and ±1 SD. The bootstrap model departs from the original model by 1950.Between 1950 and 2005 more than 8000 LD were created in the world, howeverthese LD lack area information in ICOLD (2003). Thus time-evolving bootstrapresampling permitted verifying that actual upstream CH4 emissions from global LDare most likely between 1.7 and 4.1 Tg CH4. Table 2 shows global 2005 upstreamCH4 emissions estimated from the original ICOLD (2003) and from the bootstrapanalysis for the whole resampled ICOLD (2003) database. The bootstrap analysis forthe whole database including missing values suggests that global upstream CH4
emissions are about 3.486 ± 0.230 Tg CH4 or 37% above the original upstreamemission model. This difference results from the inclusion of missing values in thebootstrap resampling procedure.
198 Mitig Adapt Strat Glob Change (2008) 13:193–206
123
Saint Louis et al. (2000) found that around 69.3 Tg CH4 would be annually re-leased upstream LD assuming an area of 1.5 · 106 km2. We computed in ICOLD(2003) an area of 0.436 · 106 km2 for 22,851 LD in 1880–2005. From 100 to 1879there are registered 446 LD that covers about 8085 km2. A bootstrap extrapolationfor the 31,148 LD in the 1880–2005 period would extend LD cover area to0.567 ± 0.048 · 106 km2. The difference between Saint Louis et al. (2000) and ourupstream model is twofold. Firstly, they reported a tropical mean emission factor of300 mg CH4 m–2 d–1 (Saint Louis et al. 2000, Table 3, p. 771), approximately threetimes superior to mean emission factors calculated in this work (Table 1) and inSoumis et al. (2005). Secondly, they use simple linear extrapolations. Assumingmodel mean factors in Table 1 and linear extrapolation as proposed by Saint Louiset al. (2000), upstream LD emissions are calculated as 25.9 Tg CH4 for the theo-retical 1.5 · 106 km2 LD area (40% tropical). Indeed, due to non-normal statisticaldistributions, we may encounter problem when attempting simple extrapolations bypurely combining CH4 emission factors and wide LD areas. The use of Bastvikenet al. (2004) equations allows assigning distinct upstream LD emissions, hencepreserving log-normal statistic distribution of LD areas (Kolmogorov–Smirnov teststatistic = 0.026, p = 0.0000001) in LD CH4 emissions. For example, the linearextrapolation for the 0.436 · 106 km2 (33% tropical, as we have found) providesabout 6.43 Tg CH4 when using model mean factors given in Table 1. By applyingBastviken et al. (2004) equations, this number falls to 2.54 Tg CH4 (Table 2). As aresult, the theoretical 1.5 · 106 km2 LD area might annually emit around 10.2 TgCH4, which is in the midrange of global natural lake emissions, disregardingplant-mediated flux component (Bastviken et al. 2004, Table 3, p. 10).
3.1.2 Downstream CH4 emissions
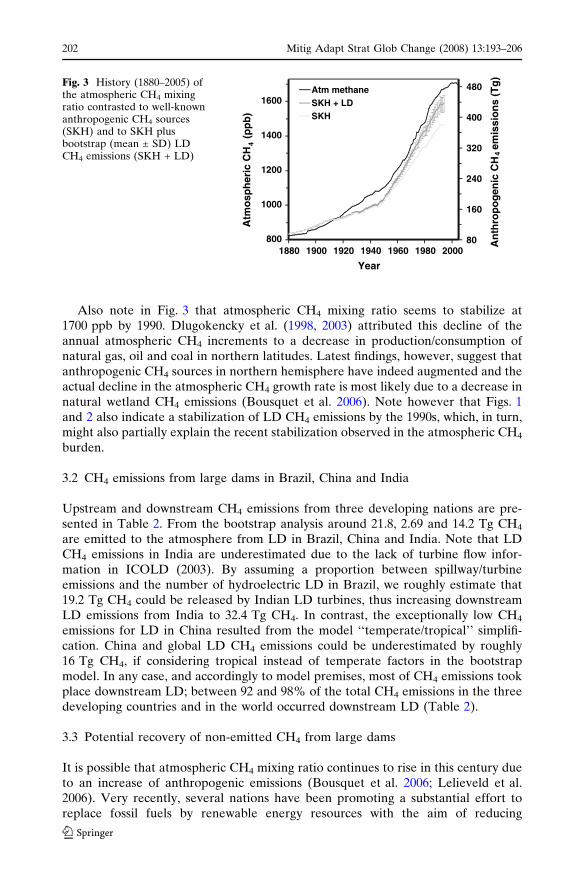
Here we report the first estimation of global downstream LD CH4 emissions.Figure 2 illustrates time-evolving downstream CH4 emissions from 1880 to 2005. Thetime-evolving bootstrap resampling permitted verifying that downstream LD CH4
emissions from global LD can lie between 35 and 76 Tg CH4. However, the boot-strap analysis for the entire database suggests that downstream LD CH4 emissionsare 100.8 ± 6.984 Tg CH4 or 90% above the original downstream emission model(Table 2). The difference between time-evolving bootstrap (Fig. 2) and 2005
0
1
2
3
4
2000198019601940192019001880
Up
stre
am C
H4
emis
sio
ns
(Tg
)
Year
Bootstrap
Original
Fig. 1 Model results for thehistory (1880–2005) ofupstream LD CH4 emissions.Circles denote original meanvalues, while the dark line andthe shaded area correspondrespectively to the bootstrapmean and standard deviation
Mitig Adapt Strat Glob Change (2008) 13:193–206 199
123
Tab
le2
An
nu
al
up
stre
ama
nd
do
wn
stre
am
CH
4e
mis
sio
ns
fro
mla
rge
da
ms
wit
hin
form
atio
no
ny
ea
ro
fo
pe
rati
on
sta
rt(I
CO
LD
20
03)
inth
ew
orl
d,B
razi
l,C
hin
aa
nd
Ind
ia
Bra
zil
Ch
ina
Ind
iaW
orl
d
ICO
LD
(20
03)
Ori
gin
al
Up
stre
am
em
issi
on
sin
Tg
CH
40
.450
(n=
16
9)
0.0
43
(n=
21
94)
0.5
01(n
=2
53
8)2
.542
a(n
=2
2,8
51
)D
ow
nst
ream
em
issi
on
sin
Tg
CH
41
2.6
5(n
=5
55
;n
=1
24
)1
.82
2(n
=4
06
9;n
=9
65
)1
2.4
7b
(n=
37
13)
53
.03
(n=
18
,10
5;
n=
36
74)
Do
wn
stre
ame
mis
sio
ns
(%)
97
98
96
95
ICO
LD
(20
03)
Bo
ots
tra
pU
pst
rea
me
mis
sio
ns
inT
gC
H4
1.6
57±
0.1
45
(N=
62
4)
0.0
91
±0
.013
(N=
46
52)
1.0
66±
0.3
82
(N=
40
05)
3.4
86±
0.2
30
a(N
=3
1,1
48
)
Do
wn
stre
ame
mis
sio
ns
inT
gC
H4
20
.10
±2
.42
1(N
=6
24
;N
=2
22
)2
.59
8±
0.1
88(N
=4
65
2;
N=
18
75)
13
.17
±1
.75
7b
(N=
40
05)
10
0.8
±6
.98
4(N
=3
1,1
48
;N
=7
94
0)D
ow
nst
ream
em
issi
on
s(%
)9
29
79
39
7
Res
ult
sw
ere
ob
tain
ed
by
mo
de
lin
gth
eo
rig
ina
la
nd
bo
ots
tra
p(r
esa
mp
lin
gw
ith
10
00
ite
rati
on
s)IC
OL
D(2
00
3)
da
tase
t.E
stim
ate
dC
H4
em
issi
on
sa
rein
teg
rate
dfo
rth
e1
88
0–2
005
pe
rio
d.
Inp
are
nth
esi
sis
pro
vid
ed
the
nu
mb
ero
fL
D.
Th
en
um
ber
of
LD
for
do
wn
stre
am
em
issi
on
sis
for
‘‘sp
illw
ay;
turb
ine
’’a
Th
ese
nu
mb
ers
mig
ht
incr
ea
seto
aro
un
d1
0.2
Tg
CH
4if
ath
eo
reti
cal
1.5
·1
06
km
2L
Da
rea
isu
sed
(se
ete
xt
for
furt
he
rd
eta
ils)
bO
nly
spil
lwa
ye
mis
sio
ns.
Tu
rbin
ee
mis
sio
ns
(N=
15
2)
fro
mIn
dia
nh
yd
roe
lect
ric
LD
cou
ldn
ot
be
mo
de
led
du
eto
the
lack
of
turb
ine
ou
tflo
wd
ata
inIC
OL
D(2
00
3)
200 Mitig Adapt Strat Glob Change (2008) 13:193–206
123
bootstrap calculations (Table 2) is due to the greater (n-N)/N ratio in time-evolvingprocedure, i.e., the inclusion of a greater number of missing values when bootstrap isyearly computed. On the other hand, the difference between original and bootstrapmodels results from the inclusion of missing values in the bootstrap resamplingprocedure.
3.1.3 Large dams altering atmospheric CH4 burden
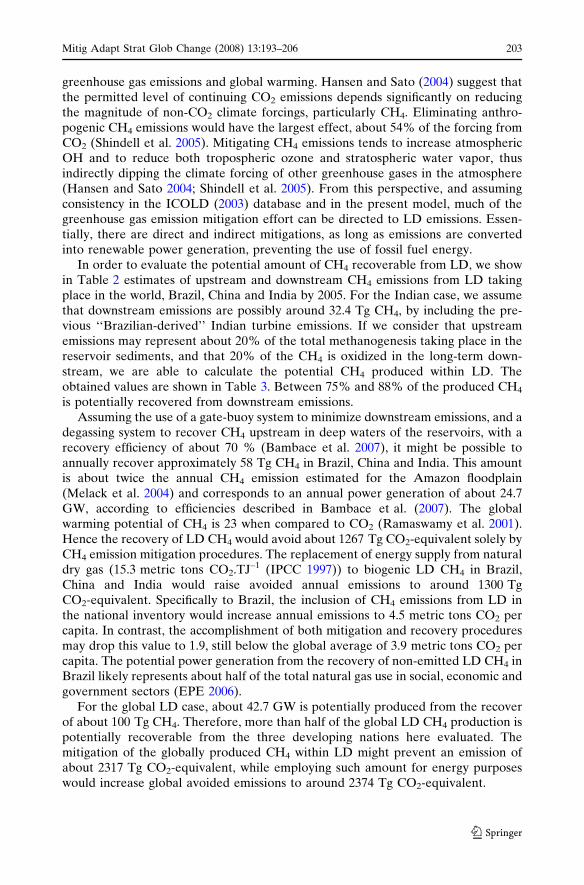
Data from 1880 to 1994 of well-known anthropogenic CH4 sources as landfill, ricepaddies, livestock, coal mining, gas flaring, gas supply and biomass burning wereobtained in Stern and Kaufmann (1996). Recalculations of annual biomass burningwere made with recent data provided in (Houghton and Hackler 2002), thusimproving anthropogenic (SKH) CH4 sources. In Fig. 3 is shown a plot contrastingatmospheric CH4 mixing ratio (Etheridge et al. 2002; Dlugokencky et al. 2006) toSKH sources alone and to SKH + LD. Compared to SKH sources alone, LD con-tribution turn out significant in the middle of the XX century. By summing upbootstrap upstream and downstream emissions we achieve global LD CH4 emissionsof 104.3 ± 7.214 Tg CH4, which represent about 30 to 31% of the actual anthropo-genic CH4 sources (Lelieveld et al. 1998; Wuebbles and Hayhoe 2002). Conse-quently, anthropogenic CH4 sources should lie in roughly 450 Tg CH4 when LD CH4
sources are included (Fig. 3).
0
20
40
60
80
2000198019601940192019001880
Do
wn
stre
am C
H4
emis
sio
ns
(Tg
)
Year
Bootstrap
Original
Fig. 2 Model results for thehistory (1880–2005) ofdownstream LD CH4
emissions. Circles denoteoriginal mean values, while thedark line and the shaded areacorrespond respectively to thebootstrap mean and standarddeviation
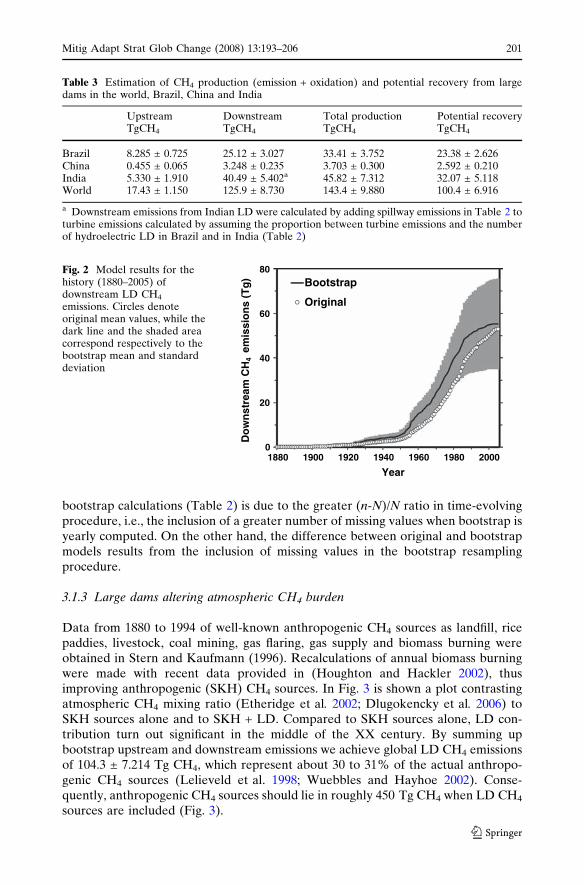
Table 3 Estimation of CH4 production (emission + oxidation) and potential recovery from largedams in the world, Brazil, China and India
Upstream Downstream Total production Potential recoveryTgCH4 TgCH4 TgCH4 TgCH4
Brazil 8.285 ± 0.725 25.12 ± 3.027 33.41 ± 3.752 23.38 ± 2.626China 0.455 ± 0.065 3.248 ± 0.235 3.703 ± 0.300 2.592 ± 0.210India 5.330 ± 1.910 40.49 ± 5.402a 45.82 ± 7.312 32.07 ± 5.118World 17.43 ± 1.150 125.9 ± 8.730 143.4 ± 9.880 100.4 ± 6.916
a Downstream emissions from Indian LD were calculated by adding spillway emissions in Table 2 toturbine emissions calculated by assuming the proportion between turbine emissions and the numberof hydroelectric LD in Brazil and in India (Table 2)
Mitig Adapt Strat Glob Change (2008) 13:193–206 201
123
Also note in Fig. 3 that atmospheric CH4 mixing ratio seems to stabilize at1700 ppb by 1990. Dlugokencky et al. (1998, 2003) attributed this decline of theannual atmospheric CH4 increments to a decrease in production/consumption ofnatural gas, oil and coal in northern latitudes. Latest findings, however, suggest thatanthropogenic CH4 sources in northern hemisphere have indeed augmented and theactual decline in the atmospheric CH4 growth rate is most likely due to a decrease innatural wetland CH4 emissions (Bousquet et al. 2006). Note however that Figs. 1and 2 also indicate a stabilization of LD CH4 emissions by the 1990s, which, in turn,might also partially explain the recent stabilization observed in the atmospheric CH4
burden.
3.2 CH4 emissions from large dams in Brazil, China and India
Upstream and downstream CH4 emissions from three developing nations are pre-sented in Table 2. From the bootstrap analysis around 21.8, 2.69 and 14.2 Tg CH4
are emitted to the atmosphere from LD in Brazil, China and India. Note that LDCH4 emissions in India are underestimated due to the lack of turbine flow infor-mation in ICOLD (2003). By assuming a proportion between spillway/turbineemissions and the number of hydroelectric LD in Brazil, we roughly estimate that19.2 Tg CH4 could be released by Indian LD turbines, thus increasing downstreamLD emissions from India to 32.4 Tg CH4. In contrast, the exceptionally low CH4
emissions for LD in China resulted from the model ‘‘temperate/tropical’’ simplifi-cation. China and global LD CH4 emissions could be underestimated by roughly16 Tg CH4, if considering tropical instead of temperate factors in the bootstrapmodel. In any case, and accordingly to model premises, most of CH4 emissions tookplace downstream LD; between 92 and 98% of the total CH4 emissions in the threedeveloping countries and in the world occurred downstream LD (Table 2).
3.3 Potential recovery of non-emitted CH4 from large dams
It is possible that atmospheric CH4 mixing ratio continues to rise in this century dueto an increase of anthropogenic emissions (Bousquet et al. 2006; Lelieveld et al.2006). Very recently, several nations have been promoting a substantial effort toreplace fossil fuels by renewable energy resources with the aim of reducing
80
160
240
320
400
480
800
1000
1200
1400
1600
2000198019601940192019001880
An
thro
po
gen
ic C
H4
emis
sio
ns
(Tg
)
Atm
osp
her
ic C
H4
(pp
b)
Year
Atm methaneSKH + LDSKH
Fig. 3 History (1880–2005) ofthe atmospheric CH4 mixingratio contrasted to well-knownanthropogenic CH4 sources(SKH) and to SKH plusbootstrap (mean ± SD) LDCH4 emissions (SKH + LD)
202 Mitig Adapt Strat Glob Change (2008) 13:193–206
123
greenhouse gas emissions and global warming. Hansen and Sato (2004) suggest thatthe permitted level of continuing CO2 emissions depends significantly on reducingthe magnitude of non-CO2 climate forcings, particularly CH4. Eliminating anthro-pogenic CH4 emissions would have the largest effect, about 54% of the forcing fromCO2 (Shindell et al. 2005). Mitigating CH4 emissions tends to increase atmosphericOH and to reduce both tropospheric ozone and stratospheric water vapor, thusindirectly dipping the climate forcing of other greenhouse gases in the atmosphere(Hansen and Sato 2004; Shindell et al. 2005). From this perspective, and assumingconsistency in the ICOLD (2003) database and in the present model, much of thegreenhouse gas emission mitigation effort can be directed to LD emissions. Essen-tially, there are direct and indirect mitigations, as long as emissions are convertedinto renewable power generation, preventing the use of fossil fuel energy.
In order to evaluate the potential amount of CH4 recoverable from LD, we showin Table 2 estimates of upstream and downstream CH4 emissions from LD takingplace in the world, Brazil, China and India by 2005. For the Indian case, we assumethat downstream emissions are possibly around 32.4 Tg CH4, by including the pre-vious ‘‘Brazilian-derived’’ Indian turbine emissions. If we consider that upstreamemissions may represent about 20% of the total methanogenesis taking place in thereservoir sediments, and that 20% of the CH4 is oxidized in the long-term down-stream, we are able to calculate the potential CH4 produced within LD. Theobtained values are shown in Table 3. Between 75% and 88% of the produced CH4
is potentially recovered from downstream emissions.Assuming the use of a gate-buoy system to minimize downstream emissions, and a
degassing system to recover CH4 upstream in deep waters of the reservoirs, with arecovery efficiency of about 70 % (Bambace et al. 2007), it might be possible toannually recover approximately 58 Tg CH4 in Brazil, China and India. This amountis about twice the annual CH4 emission estimated for the Amazon floodplain(Melack et al. 2004) and corresponds to an annual power generation of about 24.7GW, according to efficiencies described in Bambace et al. (2007). The globalwarming potential of CH4 is 23 when compared to CO2 (Ramaswamy et al. 2001).Hence the recovery of LD CH4 would avoid about 1267 Tg CO2-equivalent solely byCH4 emission mitigation procedures. The replacement of energy supply from naturaldry gas (15.3 metric tons CO2.TJ–1 (IPCC 1997)) to biogenic LD CH4 in Brazil,China and India would raise avoided annual emissions to around 1300 TgCO2-equivalent. Specifically to Brazil, the inclusion of CH4 emissions from LD inthe national inventory would increase annual emissions to 4.5 metric tons CO2 percapita. In contrast, the accomplishment of both mitigation and recovery proceduresmay drop this value to 1.9, still below the global average of 3.9 metric tons CO2 percapita. The potential power generation from the recovery of non-emitted LD CH4 inBrazil likely represents about half of the total natural gas use in social, economic andgovernment sectors (EPE 2006).
For the global LD case, about 42.7 GW is potentially produced from the recoverof about 100 Tg CH4. Therefore, more than half of the global LD CH4 production ispotentially recoverable from the three developing nations here evaluated. Themitigation of the globally produced CH4 within LD might prevent an emission ofabout 2317 Tg CO2-equivalent, while employing such amount for energy purposeswould increase global avoided emissions to around 2374 Tg CO2-equivalent.
Mitig Adapt Strat Glob Change (2008) 13:193–206 203
123
4 Concluding remarks
In spite of its simplicity, the a priori model allowed us to estimate LD CH4 emissionsand the corresponding potential CH4 recover for power production. We also verifiedthat the history of worldwide LD CH4 emissions follows the increase of well-knownCH4 sources and the atmospheric CH4 mixing ratio from 1880 to 2005. Furtherefforts are urged to better characterize emissions and the potential power productionfrom non-emitted LD CH4. We might be careful with the results herein shown notonly due to model uncertainties, but especially because the distribution of LDemissions are log-normal. Accordingly, the effort to recover non-emitted CH4
should be addressed to more representatives LD in the world, as about 47% of totalCH4 emissions occur for approximately 25% of global LD.
If ICOLD (2003) database and model premises are all suitably consistent,non-emitted CH4 from LD might represent a promising alternative source of power.The purification of the recovered LD biogas might be a matter of concern becausethere are large amounts of CO2 accompanying CH4 gas. CO2 may determine theburning efficiency of the gas mixture, but if adequately removed, it can be directlyreleased to the atmosphere because it originates from biogenic (not fossil) activities.
Mitigation of climate change would primarily require the replacement ofnon-renewable energy resources. Although biomass, wind and solar power havegained notice in the last years, we provide evidences of a neglected clean powersource. The CH4 emission mitigation and the recovery of CH4 from LD might bevery useful, as the recovered biogas can be used in thermopower facilities, industrialsites, villages, or even purified for public vehicle transportation. All this can beimplemented under the Kyoto Protocol for the creation of novel Clean DevelopingMechanism (and also Joint Implementation) projects.
References
Abril G, Guerin F, Richard S et al (2005) Carbon dioxide and methane emissions and the carbonbudget of a 10-year old tropical reservoir (Petit Saut, French Guiana). Global BiogeochemCycles 19:doi:10.1029/2005GB002457
Bambace LAW, Ramos FM, Lima IBT et al (2007) Mitigation and recovery of methane emissionsfrom tropical hydroelectric dams. Energy (in press) (http://www.sciencedirect.com/science/article/B6V2S-4M9H3J1-2/2/3809fd6c7a60d2ee3bfa512378427077)
Bartolome LJ, de Wet C, Mander H et al (2000) Displacement, resettlement, rehabilitation, repa-ration and development, Thematic Review I.3 prepared as an input to the World Commission onDams, Cape Town, http://www.dams.org
Bastviken D, Cole J, Pace M et al (2004) Methane emissions from lakes: dependence of lakecharacteristics, two regional assessments, and a global estimate. Global Biogeochem Cycles18:doi:10.1029/2004GB002238
Berkamp G, McCartney M, Dugan P et al (2000) Dams, ecosystem functions and environmentalrestoration, Thematic Review II.1 prepared as an input to the World Commission on Dams,Cape Town, http://www.dams.org
Bousquet P, Ciais P, Miller JB et al (2006) Contribution of anthropogenic and natural sources toatmospheric methane variability. Nature 443:439–443
Dlugokencky EJ, Houweling S, Bruhwiler L et al (2003) Atmospheric methane levels off: temporarypause or a new steady-state? Geophys Res Lett 30:doi: 10.1029/2003GL018126
Dlugokencky EJ, Masarie KA, Lang PM et al (1998) Continuing decline in the growth rate of theatmospheric methane burden. Nature 393:447–450
204 Mitig Adapt Strat Glob Change (2008) 13:193–206
123
Dlugokencky EJ, Lang PM, Masarie KA (2006) Atmospheric methane data at South Pole Station(89�59¢ S, 24�48¢ W, 2810 m), Antarctica. Thomas J. Conway, NOAA/ESRL Global MonitoringDivision. On-line at the World Data Centre for Greenhouse Gases – Global Atmosphere Watch.http://gaw.kishou.go.jp/wdcgg.html
Duchemin E, Lucotte M, Canuel R et al (2006) Reservoir emissions upon ice break-up: firstassessment of methane and carbon dioxide emissions from shallow and deep zones of borealreservoirs upon ice break-up. Lakes Reservoirs Res Manage 11:9–19
EPE (2006) Balanco Energetico Nacional 2006: Ano base 2005. Relatorio final/Ministerio de Minas eEnergia. Empresa de Pesquisa Energetica, Rio de Janeiro. p. 188. http://ben.epe.gov.br/downloads/BEN2006_Versao_Completa.pdf
Etheridge DM, Steele LP, Francey RJ et al (2002) Historical CH4 mixing ratios from Law Dome(Antarctica) and Summit (Greenland) ice cores. Historical CH4 record from DE08, DE08-2 andDSS ice cores (Antarctica). In: Trends: a compendium of data on global change. On line atthe Carbon Dioxide Information Analysis Center. http://cdiac.esd.ornl.gov/trends/atm_meth/lawdome_meth.html
Etiope G (2004) New directions: GEM – geologic emissions of methane, the missing source in theatmospheric methane budget. Atmos Environ 38:3099–3100
Fearnside PM (2002) Greenhouse gas emissions from a hydroelectric reservoir (Brazil’s TucuruıDam) and the energy policy implications. Water Air Soil Pollut 133:69–96
Fearnside PM (2004) Greenhouse gas emissions from hydroelectric dams: controversies provide aspringboard for rethinking a supposedly clean energy source. Clim Change 66:1–8
Fearnside PM (2005a) Do hydroelectric dams mitigate global warming? The case of Brazil’s Curua-Una Dam. Mitig Adapt Strat Glob Change 10:675–691
Fearnside PM (2005b) Brazil’s Samuel Dam: lessons for hydroelectric development policy and theenvironment in Amazonia. Environ Manage 35:1–19
Guerin F, Abril G (2004) Kinetics of methane oxidation in a tropical reservoir. Geophys ResAbstracts 6:03922
Guerin F, Abril G, Richard S et al (2006) Methane and carbon dioxide emissions from tropicalreservoirs: significance of downstream rivers. Geophys Res Lett 33:doi:10.1029/2006GL027929
Hansen J, Sato M (2004) Greenhouse gas growth rates. Proc Natl Acad Sci 101:16109–16114Houghton RA, Hackler JL (2002) Carbon flux to the atmosphere from land-use changes. In: Trends:
A compendium of data on global change. Carbon dioxide information analysis center, OakRidge National Laboratory, U.S. Department of Energy, Oak Ridge, USA. http://cdiac.ornl.gov/trends/landuse/houghton/houghton.html
International Commission On Large Dams (ICOLD) 2003 (2003) World register of dams. http://www.icold-cigb.org
IPCC (1997) Revised 1996 IPCC Guidelines for National Greenhouse Gas Inventories. ReferenceManual, Intergovernmental Panel on Climate Change. Workbook (Volume 2). Module 1,Energy. p. 22. http://www.ipcc-nggip.iges.or.jp/public/gl/guidelin/ch1wb1.pdf
Kemenes A, Forsberg BR, Melack JM (2006) Gas release below Balbina dam. In: Proceedings of 8ICSHMO, Foz do Iguacu, Brazil. April 24–28, 2006, INPE, pp 663–667
Keppler F, Hamilton JTG, Brass M et al (2006) Methane emissions from terrestrial plants underaerobic conditions. Nature 439:187–191
Lelieveld J, Crutzen PJ, Dentener FJ (1998) Changing concentration, lifetime and climate forcing ofatmospheric methane. Tellus-B 50:128–150
Lelieveld J (2006) A nasty surprise in the greenhouse. Nature 443:405–406Lima IBT (2005) Biogeochemical distinction of methane releases from two Amazon hydroreservoirs.
Chemosphere 59:1697–702Matsumoto M, Nishimura T (1998) Mersenne twister: a 623-dimensionally equidistributed uniform
pseudorandom number generator. ACM Trans. Model Comput Simul 8:3–30Melack JM, Hess LL, Gastil M et al (2004) Regionalization of methane emissions in the Amazon
basin with microwave remote sensing. Global Change Biol 10:530–544Ramos FM, Lima IBT, Rosa RR et al (2006) Extreme event dynamics in methane ebullition fluxes
from tropical reservoirs. Geophys Res Lett 33:doi:10.1029/2006GL027943Ramos FM, Bambace LAW, Lima IBT et al (2007) Methane stocks in tropical hydropower reser-
voirs as a potential energy source. Clim Change (under review, second revision)Ramaswamy V (2001) In: Houghton JT et al (eds) Climate change 2001: The scientific basis.
Cambridge University Press, pp 349–416
Mitig Adapt Strat Glob Change (2008) 13:193–206 205
123

Rosa LP, Santos MA (2000) Certainty and uncertainty in the science of greenhouse gas emissionsfrom hydroelectric reservoirs. Thematic Review II.2 prepared as an input to the World Com-mission on Dams, Cape Town, http://www.dams.org
Ruddiman WF (2003) The anthropogenic era began thousands of years ago. Clim Change 61:261–293Ruddiman WF, Vavrus SJ, Kutzbach JE (2005) A test of the overdue-glaciation hypothesis. Quat Sci
Reviews 24:1–10Saint Louis VL, Kelly CA, Duchemin E et al (2000) Reservoir surface as sources of greenhouse gases
to the atmosphere: a global estimate. Bioscience 50:766–775Shindell DT, Faluvegi G, Bell N et al (2005) An emissions-based view of climate forcing by methane
and tropospheric ozone. Geophys Res Lett 32:doi:10.1029/2004GL021900Soumis N, Lucotte M, Canuel R et al (2005) Hydroelectric reservoirs as anthropogenic sources of
greenhouse gases. In: Lehr JH, Keeley J (eds) Water encyclopedia: Surface and agriculturalwater. Wiley-Interscience, Hoboken, N. J., pp 203–210
Stern DI, Kaufmann RK (1996) Estimates of global anthropogenic methane emissions 1860–1993.Chemosphere 33:159–176. (See also http://cdiac.ornl.gov/trends/meth/ch4.htm)
Wuebbles DJ, Hayhoe K (2002) Atmospheric methane and global change. Earth-Science Rev57:177–210
206 Mitig Adapt Strat Glob Change (2008) 13:193–206
123