VH replacement in primary immunoglobulin repertoire ... - PNAS

Patterns in Wetland Microbial Community Composition andFunctional Gene Repertoire Associated with Methane Emissions
Shaomei He,a Stephanie A. Malfatti,a,c Jack W. McFarland,b Frank E. Anderson,b Amrita Pati,a Marcel Huntemann,a Julien Tremblay,a
Tijana Glavina del Rio,a Mark P. Waldrop,b Lisamarie Windham-Myers,b Susannah G. Tringea
DOE Joint Genome Institute, Walnut Creek, California, USAa; U.S. Geological Survey, Menlo Park, California, USAb; Lawrence Livermore National Laboratory, Livermore,California, USAc
ABSTRACT Wetland restoration on peat islands previously drained for agriculture has potential to reverse land subsidence andsequester atmospheric carbon dioxide as peat accretes. However, the emission of methane could potentially offset the green-house gas benefits of captured carbon. As microbial communities play a key role in governing wetland greenhouse gas fluxes, weare interested in how microbial community composition and functions are associated with wetland hydrology, biogeochemistry,and methane emission, which is critical to modeling the microbial component in wetland methane fluxes and to managing resto-ration projects for maximal carbon sequestration. Here, we couple sequence-based methods with biogeochemical and green-house gas measurements to interrogate microbial communities from a pilot-scale restored wetland in the Sacramento-SanJoaquin Delta of California, revealing considerable spatial heterogeneity even within this relatively small site. A number of mi-crobial populations and functions showed strong correlations with electron acceptor availability and methane production; somealso showed a preference for association with plant roots. Marker gene phylogenies revealed a diversity of major methane-producing and -consuming populations and suggested novel diversity within methanotrophs. Methanogenic archaea were ob-served in all samples, as were nitrate-, sulfate-, and metal-reducing bacteria, indicating that no single terminal electron acceptorwas preferred despite differences in energetic favorability and suggesting spatial microheterogeneity and microniches. Notably,methanogens were negatively correlated with nitrate-, sulfate-, and metal-reducing bacteria and were most abundant at sam-pling sites with high peat accretion and low electron acceptor availability, where methane production was highest.
IMPORTANCE Wetlands are the largest nonanthropogenic source of atmospheric methane but also a key global carbon reservoir.Characterizing belowground microbial communities that mediate carbon cycling in wetlands is critical to accurately predictingtheir responses to changes in land management and climate. Here, we studied a restored wetland and revealed substantial spatialheterogeneity in biogeochemistry, methane production, and microbial communities, largely associated with the wetland hydrau-lic design. We observed patterns in microbial community composition and functions correlated with biogeochemistry andmethane production, including diverse microorganisms involved in methane production and consumption. We found thatmethanogenesis gene abundance is inversely correlated with genes from pathways exploiting other electron acceptors, yet theubiquitous presence of genes from all these pathways suggests that diverse electron acceptors contribute to the energetic balanceof the ecosystem. These investigations represent an important step toward effective management of wetlands to reduce methaneflux to the atmosphere and enhance belowground carbon storage.
Received 27 January 2015 Accepted 17 April 2015 Published 19 May 2015
Citation He S, Malfatti SA, McFarland JW, Anderson FE, Pati A, Huntemann M, Tremblay J, Glavina del Rio T, Waldrop MP, Windham-Myers L, Tringe SG. 2015. Patterns inwetland microbial community composition and functional gene repertoire associated with methane emissions. mBio 6(3):e00066-15. doi:10.1128/mBio.00066-15.
Editor Mark J. Bailey, CEH-Oxford
Copyright © 2015 He et al. This is an open-access article distributed under the terms of the Creative Commons Attribution-Noncommercial-ShareAlike 3.0 Unported license,which permits unrestricted noncommercial use, distribution, and reproduction in any medium, provided the original author and source are credited.
Address correspondence to Susannah G. Tringe, [email protected].
Wetlands cover about 5 to 8% of the earth’s land surface (1)and provide important ecosystem services such as wildlife
habitat, water purification, and flood control. As a major terres-trial carbon reservoir, estimated at 20 to 30% of the global soilcarbon pool (2), wetlands play an important role in global carboncycling, yet around the world wetlands are shrinking due to agri-cultural and industrial development and urbanization (3), releas-ing stored carbon into the atmosphere and accelerating climatechange.
In the Sacramento-San Joaquin (SSJ) Delta area, California,historic freshwater tidal marshes were drained and converted to
agriculture for their fertile organic-rich soils between the late 19thand early 20th centuries (4). Substantial land surface subsidencehas since occurred, largely due to accelerated microbial oxidationof peat as drainage increased soil aeration (5), causing significantcarbon loss to the atmosphere and imposing a risk of levee failuresin the SSJ Delta (6). One potential means to mitigate these risks isto restore these historical wetlands, as waterlogged anoxic condi-tions are expected to slow microbial decomposition and favor peataccumulation from wetland plant detritus. To evaluate the long-term carbon storage rates and land subsidence reversal potentialof reestablished wetlands, in 1997 the U.S. Geological Survey
RESEARCH ARTICLE crossmark
May/June 2015 Volume 6 Issue 3 e00066-15 ® mbio.asm.org 1
m
bio.asm.org
on May 27, 2015 - P
ublished by m
bio.asm.org
Dow
nloaded from

(USGS) and the California Department of Water Resources(DWR) started a pilot-scale restoration project on Twitchell Is-land in the SSJ Delta with managed hydrology. Data collectedfrom 1997 to 2006 demonstrated that rapid peat accretion andland surface elevation were achievable, with an average rate of~4 cm/year (7).
In addition to reversing land subsidence, the high primary pro-duction and low decomposition rates in restored wetlands mayresult in a net atmospheric carbon dioxide (CO2) sequestration,allowing them to act as “carbon farms.” However, one major con-cern is the emission of methane (CH4), a common decompositionend product in anoxic environments when terminal electron ac-ceptors are depleted. CH4 is a potent greenhouse gas (GHG) witha 100-year global warming potential 25 times higher than that ofCO2, and natural wetlands contribute ~20 to 39% of global CH4
emissions (8), making them the largest nonanthropogenic sourceof atmospheric CH4. When CH4 emission is large enough to coun-terbalance the CO2 captured by primary production, a wetlandmay effectively change from a GHG sink to a GHG source (9). CH4
and CO2 flux data collected during the first 6 years (1997 to 2003)from the pilot-scale restoration wetlands on Twitchell Island in-dicated that these wetlands could mitigate carbon loss and evenbecome a net GHG sink (10). However, their long-term carbonstorage potential and GHG budget are the subject of ongoing in-vestigation.
Net CH4 emission is governed by production, oxidation, andtransportation and varies widely among wetlands due to differ-ences in vegetation, soil type, pH, organic carbon composition,water chemistry, hydrology, and climate, as discussed in reviews(11–14). In wetland ecosystems, microbial communities play animportant role in governing carbon flux, as dead plant biomass iseither stored as peat or decomposed through microbial activities.Under conditions depleted of oxygen and other electron accep-tors, methanogenic archaea use CO2 or small organic compounds(e.g., acetate and methylamines) as the terminal electron acceptorto produce CH4. The amount of carbon diverted to methanogen-esis can be influenced by anaerobic respiration processes depen-dent on nitrate, manganese(IV), iron(III), and sulfate, whichcommonly occur in wetland environments. The produced CH4
can be consumed by methanotrophs, which generate energythrough oxidation of CH4 with oxygen at the water-sediment in-terface or rhizosphere, where both CH4 and oxygen are available.All these microbial processes can affect the net production andrelease of CH4.
Variations in peat accretion within the pilot-scale restored wet-land on Twitchell Island have been attributed to the hydraulicdesign (a gradient from inlet to outlet), and we expected to alsoobserve biogeochemical gradients associated with the hydrology.Therefore, we hypothesized that peat microbial community com-position and functions, as well as CH4 emission, would exhibitpatterns associated with the biogeochemical gradients due to dis-tance from the inlet and proximity to plant roots. To test this, wecollected biogeochemical data, evaluated CH4 emission from dif-ferent sites and sample types within the wetland, and applied ahigh-throughput sequencing approach to characterize peat mi-crobial community composition and functional profiles, focusingon the microbial populations and processes influencing CH4 flux.We aimed to identify community patterns, indicator species,genes, and pathways that are associated with biogeochemical vari-ables and CH4 emission along the gradient.
RESULTS AND DISCUSSIONSite biogeochemistry. We selected sites with a decreasing prox-imity to the inlet and differing rates of peat accretion: an “inlet”site with low accretion (A), a “transitional” site with intermediateaccretion (B), and two “interior” sites with high accretion (C andL) (7) (see Fig. S1 in the supplemental material).
From the inlet to interior sites, pH, sulfate, nitrate, and dis-solved oxygen (DO) at the standing water-peat interface de-creased, and soluble iron (Fe) and manganese (Mn) increased inFebruary (Fig. 1a and b). Increasing solubilization of Fe and Mnresults from solid-phase Fe(III) and Mn(IV) reduction (12).These physicochemical patterns across sites were similar for Au-gust (Fig. 1d and e), although weaker than those in February. ThepH of river water inputs was ~7.7 and decreased from the inlet tointerior sites (from 7.0 to 6.5 in February and from 6.5 to 6.2 inAugust), likely due to anoxic decomposition of plant detritus,which releases carbonic, fulvic, humic, and other organic acids(15). River water had a DO concentration of ~8 mg/liter and wasthe primary source of nitrate, sulfate, and oxidized Fe (10). Theobserved decreases in electron acceptors in conjunction with in-creases in reduced Fe and Mn suggest that a variety of electronacceptors were being consumed along the water passage, althoughat these concentrations nitrate is predicted to be the most energet-ically favorable electron acceptor. Additionally, interior sites(“backwater” areas) experienced less hydraulic mixing and chem-ical exchange with river water than did the inlet site, which likelyfurther decreased the influx of electron acceptors to the interior.
At the inlet site, with increasing peat depth, we observed de-creases of nitrate and sulfate and increases of soluble Fe(II) andMn(II) for both seasons (Fig. 1c and f), indicating that the envi-ronment becomes more reduced with depth as is common forwetland pore waters (16). Other sampling sites displayed similardepth-dependent redox gradients (see Fig. S1 in the supplementalmaterial).
CH4 flux. From laboratory incubations of February samples,statistically significant differences in CH4 production were ob-served among the three sites (Fig. 2a). As the incubations wereconducted in airtight jars, CH4 oxidation was expected to be min-imal. The lower net production of CH4 from samples collected atthe inlet than from the transitional or the interior site suggestslower methanogenic potential at the inlet site
In August, CH4 flux was monitored in situ using static cham-bers. Significantly lower CH4 emissions were observed at the inletand transitional sites than at the interior site (Fig. 2b). AlthoughCH4 emission at the inlet site averaged lower than that at thetransitional site, this difference was not significant. Overall, bothFebruary laboratory incubation and August on-site measurementsuggest similar variation in CH4 emission among sites, which waslower at the inlet and higher at the interior.
Microbial community composition. Wetland microbial com-munities as assessed by 16S rRNA gene sequencing harboredmembers of numerous phyla and averaged a Shannon diversityindex of 5.8, higher than the average Shannon index of 5.0 in theadjacent cornfield soil. Wetland microbial community composi-tion was also different from that of the adjacent cornfield soil.Specifically, wetlands displayed higher abundances of Proteobac-teria, Chloroflexi, Bacteroidetes, and Euryarchaeota, particularlyMethanomicrobia (see Fig. S2 in the supplemental material), andthis is consistent with the expectation that after inundation, soil
He et al.
2 ® mbio.asm.org May/June 2015 Volume 6 Issue 3 e00066-15
m
bio.asm.org
on May 27, 2015 - P
ublished by m
bio.asm.org
Dow
nloaded from

environments become more anoxic and therefore enriched inthese phyla commonly found in anoxic environments (17).
At the operational taxonomic unit (OTU) level, communitycomposition was more influenced by sample site and sample type(bulk peat versus plant rhizome) and less influenced by depth or
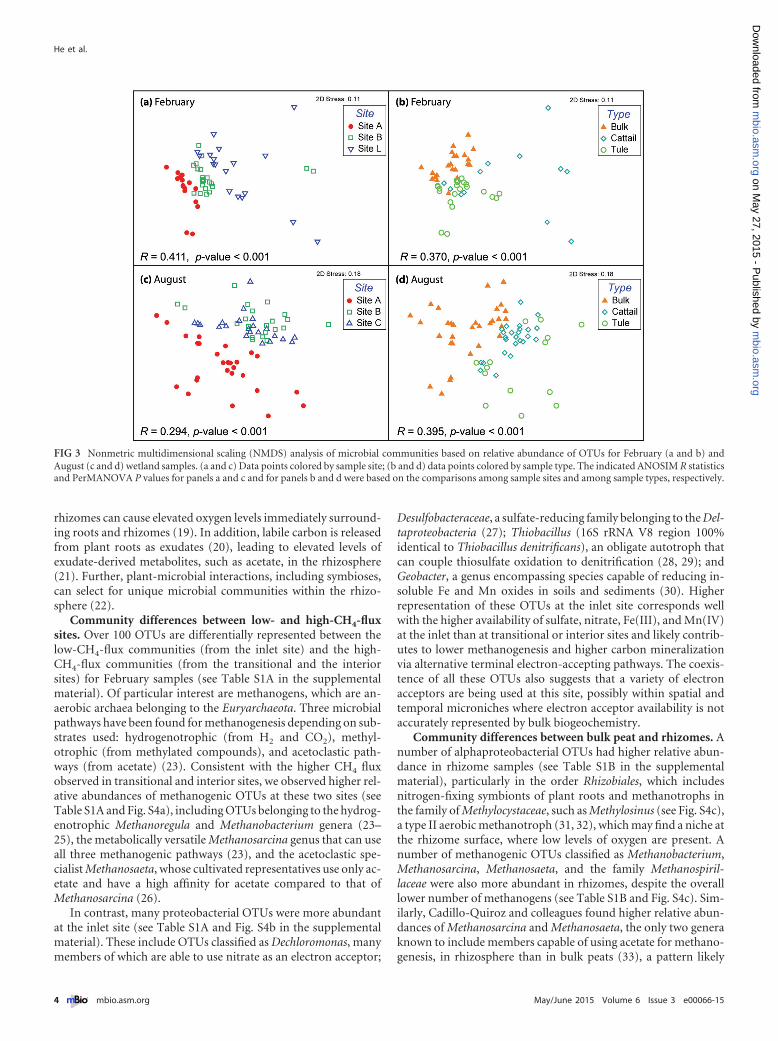
season (Fig. 3). Among February samples, the largest site-associated community difference was between the inlet and theinterior site, with communities from the transitional site in be-tween on the nonmetric multidimensional scaling (NMDS) plot(Fig. 3a). A similar site-associated community pattern was ob-served for August samples, but communities from the transitionaland the interior sites were not significantly different (Fig. 3c),which may be attributed to the weaker site chemical gradients inAugust than in February (Fig. 1). Site-associated community dif-ferences were also revealed on the correspondence analysis biplot(see Fig. S3 in the supplemental material), where the environmen-tal variables, particularly the electron acceptor availabilities (suchas DO, sulfate, and nitrate), were strongly correlated with thecommunity patterns.
Sample type also influenced microbial communities. Tule andcattail rhizomes contain microbial communities distinct frombulk peat communities (Fig. 3b and d), likely reflecting the mi-croenvironmental and/or chemical differences between rhizomesand bulk peat. Bulk peat is anoxic and mainly comprised of de-composed plant material. However, wetland vascular plants trans-port oxygen to roots to support root aerobic respiration and oxi-dation of Fe(II) and Mn(II) (18); oxygen leakage from roots and
)L/gm( noitartnecnoC
pH
6.5
6.4
6.3
6.2
6.1
6.6
Mn (mg/L)Fe (mg/L)0
0.2
0.4
0.6
0.8
1
A B L
Mn (mg/L)Fe (mg/L)0
0.2
0.4
0.6
0.8
1
A B C
(d) (f)(e)
pH
7.2
7.0
6.8
6.4
6.2
7.4
6.6
)L/gm( noitartnecnoC
Dep
th o
f pea
t (cm
)D
epth
of p
eat (
cm)
0.0 0.2 0.4 0.6 0.8
0.0 2.0 4.0 6.0 0
5
10
15
20
Soluble Fe, Mn (mg/L)
Nitrate, Sulfate (mg/L)
Nitrate Sulfate Mn Fe -
-
-
-
0.0 2.0 4.0 6.0
0.0 5.0 10.0 15.00
5
10
15
20
Soluble Fe, Mn (mg/L)
Nitrate Sulfate Mn Fe -
-
-
-
Soluble Fe, Mn (mg/L)
Nitrate, Sulfate (mg/L)
Nitrate, Sulfate (mg/L)
Soluble Fe, Mn (mg/L)(c)(a) (b)
FIG 1 Physicochemical gradients across sites A (inlet), B (transitional), and L/C (interior) at the standing water-peat interface in February (a and b) and August(d and e) and peat pore water chemical profiles along the depth at site A (inlet) in February (c) and in August (f). Iron (Fe) and manganese (Mn) were measuredas the soluble fraction, which is mostly as Fe(II) and Mn(II), respectively, under in situ pH.
CH4 p
rodu
ctio
n (m
g CH
4 /g
sam
ple/
day)
(a) (b)
CH4 fl
ux (m
g/m
2 /day
)
FIG 2 Box plot of net CH4 production from the laboratory incubation ofsamples collected in February (a) and box plot of noon CH4 flux measuredon-site during August sampling (b) for the different sites. Letters within theplots (“a,” “b,” and “c”) indicate groups by Duncan’s new multiple range test.Sites within the same group are not significantly different.
Microbial Communities in a Restored Wetland
May/June 2015 Volume 6 Issue 3 e00066-15 ® mbio.asm.org 3
m
bio.asm.org
on May 27, 2015 - P
ublished by m
bio.asm.org
Dow
nloaded from
rhizomes can cause elevated oxygen levels immediately surround-ing roots and rhizomes (19). In addition, labile carbon is releasedfrom plant roots as exudates (20), leading to elevated levels ofexudate-derived metabolites, such as acetate, in the rhizosphere(21). Further, plant-microbial interactions, including symbioses,can select for unique microbial communities within the rhizo-sphere (22).
Community differences between low- and high-CH4-fluxsites. Over 100 OTUs are differentially represented between thelow-CH4-flux communities (from the inlet site) and the high-CH4-flux communities (from the transitional and the interiorsites) for February samples (see Table S1A in the supplementalmaterial). Of particular interest are methanogens, which are an-aerobic archaea belonging to the Euryarchaeota. Three microbialpathways have been found for methanogenesis depending on sub-strates used: hydrogenotrophic (from H2 and CO2), methyl-otrophic (from methylated compounds), and acetoclastic path-ways (from acetate) (23). Consistent with the higher CH4 fluxobserved in transitional and interior sites, we observed higher rel-ative abundances of methanogenic OTUs at these two sites (seeTable S1A and Fig. S4a), including OTUs belonging to the hydrog-enotrophic Methanoregula and Methanobacterium genera (23–25), the metabolically versatile Methanosarcina genus that can useall three methanogenic pathways (23), and the acetoclastic spe-cialist Methanosaeta, whose cultivated representatives use only ac-etate and have a high affinity for acetate compared to that ofMethanosarcina (26).
In contrast, many proteobacterial OTUs were more abundantat the inlet site (see Table S1A and Fig. S4b in the supplementalmaterial). These include OTUs classified as Dechloromonas, manymembers of which are able to use nitrate as an electron acceptor;
Desulfobacteraceae, a sulfate-reducing family belonging to the Del-taproteobacteria (27); Thiobacillus (16S rRNA V8 region 100%identical to Thiobacillus denitrificans), an obligate autotroph thatcan couple thiosulfate oxidation to denitrification (28, 29); andGeobacter, a genus encompassing species capable of reducing in-soluble Fe and Mn oxides in soils and sediments (30). Higherrepresentation of these OTUs at the inlet site corresponds wellwith the higher availability of sulfate, nitrate, Fe(III), and Mn(IV)at the inlet than at transitional or interior sites and likely contrib-utes to lower methanogenesis and higher carbon mineralizationvia alternative terminal electron-accepting pathways. The coexis-tence of all these OTUs also suggests that a variety of electronacceptors are being used at this site, possibly within spatial andtemporal microniches where electron acceptor availability is notaccurately represented by bulk biogeochemistry.
Community differences between bulk peat and rhizomes. Anumber of alphaproteobacterial OTUs had higher relative abun-dance in rhizome samples (see Table S1B in the supplementalmaterial), particularly in the order Rhizobiales, which includesnitrogen-fixing symbionts of plant roots and methanotrophs inthe family of Methylocystaceae, such as Methylosinus (see Fig. S4c),a type II aerobic methanotroph (31, 32), which may find a niche atthe rhizome surface, where low levels of oxygen are present. Anumber of methanogenic OTUs classified as Methanobacterium,Methanosarcina, Methanosaeta, and the family Methanospiril-laceae were also more abundant in rhizomes, despite the overalllower number of methanogens (see Table S1B and Fig. S4c). Sim-ilarly, Cadillo-Quiroz and colleagues found higher relative abun-dances of Methanosarcina and Methanosaeta, the only two generaknown to include members capable of using acetate for methano-genesis, in rhizosphere than in bulk peats (33), a pattern likely
FIG 3 Nonmetric multidimensional scaling (NMDS) analysis of microbial communities based on relative abundance of OTUs for February (a and b) andAugust (c and d) wetland samples. (a and c) Data points colored by sample site; (b and d) data points colored by sample type. The indicated ANOSIM R statisticsand PerMANOVA P values for panels a and c and for panels b and d were based on the comparisons among sample sites and among sample types, respectively.
He et al.
4 ® mbio.asm.org May/June 2015 Volume 6 Issue 3 e00066-15
m
bio.asm.org
on May 27, 2015 - P
ublished by m
bio.asm.org
Dow
nloaded from

linked to root exudation of acetate (21). Though methanogens areoften regarded as strict anaerobes, oxygen is present near the rhi-zome (19), and so methanogens found on rhizomes must be ableto tolerate oxygen. Indeed, Kiener and Leisinger (34) determinedthat some members of Methanosarcina and Methanobacterium areable to survive after an exposure to oxygen. In addition, Methano-sarcina was found to be able to produce CH4 even under oxicconditions, and its catalase genes were actively transcribed foroxygen detoxification (35).
OTUs more abundant in bulk peats include those classified asMethanoregula, Crenarchaeota C2 group, Bacteroidales, and Ther-modesulfovibrionaceae (see Fig. S4d in the supplemental material).Previously, Methanoregula was also found to be more abundant inbulk peats than in rhizosphere and was the dominant methanogenin bulk peats (33). Members of Methanoregula are hydrog-enotrophic methanogens (24, 25) and sensitive to even traceamounts of oxygen (25) and therefore are more likely to occur inbulk peats than under the microaerobic conditions surroundingrhizomes and roots. The Crenarchaeota C2 group, also known asrice cluster IV (36), is a deeply branched lineage initially identifiedfrom lake and marsh sediments (37) and has since been found inmany anoxic environments, including sediment, soil, rice pad-dies, and anaerobic digesters (38). No cultured representative isavailable for this group, and their physiology is yet to be investi-gated.
Interspecies interactions. Interspecies interactions have thepotential to affect wetland belowground processes through co-metabolic or syntrophic interactions. We explored potential in-terspecific interactions using correlation and network analyses(see Table S2A and B and Fig. S5 in the supplemental material).Methanogen OTUs were positively correlated with OTUs belong-ing to Planctomycetes and Firmicutes (particularly Clostridia), pre-sumably due to methanogens’ consumption of the carbohydratefermentation products (e.g., acetate and hydrogen) generated bythese populations. A number of methylotrophic alphaproteobac-terial OTUs and a few Syntrophaceae OTUs in the Deltaproteobac-teria cooccurred with methanogen OTUs. Methanogens werenegatively correlated with many OTUs in Proteobacteria and Ni-trospirae (especially Thermodesulfovibrionaceae), which containanaerobic respiring populations. In total, there are 1,019 positiveand 286 negative pairs of significant correlations among the ana-lyzed OTUs. Interestingly, about one-third of the positive corre-lations were between OTUs in the same phylum, whereas only 3%of negative correlations occurred within the same phylum. Forexample, 26 pairs of methanogen OTUs were positively corre-lated, yet no negative correlations were found among methano-gens. This indicates that species with the same functional guildtend to cooccur and may suggest that habitat filtering is a strongfactor shaping microbial communities in this carbon- andnutrient-rich but electron-acceptor-poor environment.
Functional gene abundance profiles by metagenomics. Met-agenome sequencing was conducted on 11 selected samples col-lected from the surface 0- to 12-cm peats in February, includingdifferent combinations of sample site and type, and two additionalsamples from a replicate core at site B, because a large variation ofcommunity composition was observed between the duplicatecores at this site. At least 52 Gb of sequence data was generatedfrom each site. However, fewer than 10% of reads assembled intocontigs of �200 bases in length for most samples (see Text S1A inthe supplemental material), which reflects the high complexity of
wetland peat microbial communities. Indeed, under comparablesequencing efforts, the percentage of reads assembled was in-versely correlated to the Shannon diversity index (H) of microbialcommunities estimated by 16S rRNA gene analysis (see Text S1A).Therefore, to best analyze the data, the assembled contigs andunassembled reads were both used for gene prediction and func-tional annotation, with the abundance of each contig adjusted byits read depth (fold coverage) for quantitative analyses. Genes andpathways involved in microbial processes in wetland peats, such aslignocellulose degradation, fermentation, anaerobic respiration,and production and oxidation of CH4, were present in each met-agenome as expected.
We used gene-centric analysis to reveal major differences incommunity functional profiles. The equal representation ofhousekeeping clusters of orthologous groups (COGs) amongmetagenomes indicates that bias associated with the average ge-nome size in different samples was minimal and thus verifies thecomparability of these metagenomes (see Text S1B in the supple-mental material). Gene families involved in CH4 metabolism,denitrification, dissimilatory sulfate reduction, dissimilatorymetal reduction, nitrogen fixation, and hydrogen production andconsumption were among the differentially represented gene fam-ilies among sample sites and types. These are important functionsgenerally found in wetland peats and are relevant to the biogeo-chemistry measurements that we collected. Therefore, we focusedon gene families in these pathways, and a heat map was generatedfor these gene families to show their distribution patterns (Fig. 4).
Metagenomes from the interior site had the highest relativeabundance of genes in methanogenesis pathways, consistent withhigher CH4 emission and higher abundance of methanogen OTUsat the interior site than at the inlet site. Metagenomes from theinlet site, on the other hand, had the highest representation ofgenes involved in dissimilatory sulfate reduction, denitrification,and metal reduction. Unlike the [NiFe] hydrogenase genes(pfam00374), the iron-only hydrogenase genes (pfam02256 andpfam02906) increased from the inlet to the interior site, suggest-ing that the environment became more fermentative and thatmore hydrogen was likely produced from fermentation throughthe iron-only hydrogenases in the interior site. As observed in thecommunity composition data, the replicate cores from the transi-tional site (B1 and B2) showed large differences in functional geneabundance profiles (Fig. 4). Nevertheless, the abundance patternsof genes in these anaerobic respiration pathways are consistentwith the chemical gradients and the differentially representedOTUs among these sites. Such functional gene distributions havenot, to our knowledge, been previously demonstrated in wetlandenvironments.
Nitrogenase genes required for nitrogen fixation were moreabundant in rhizomes than in bulk peats, consistent with the over-representation of nitrogen-fixing Rhizobiales OTUs in rhizomesamples from the 16S rRNA gene data. Similar to the nitrogenasegene pattern, genes involved in aerobic oxidation of CH4 weremore abundant in rhizomes than in bulk peats, reflecting theavailability of oxygen near rhizomes and consistent with the over-representation of aerobic methanotrophs in rhizome samplesfrom 16S rRNA gene analysis. The pattern of genes in CH4 oxida-tion supports the idea that the oxygen leakage from roots andrhizomes creates a niche for aerobic methanotrophs to oxidizeCH4 to CO2, thereby mitigating CH4 emissions (39, 40). Becausediffusion and gas-bubble ebullition through the water column
Microbial Communities in a Restored Wetland
May/June 2015 Volume 6 Issue 3 e00066-15 ® mbio.asm.org 5
m
bio.asm.org
on May 27, 2015 - P
ublished by m
bio.asm.org
Dow
nloaded from

typically contribute a minor proportion to CH4 emission fromwetlands compared to plant aerenchyma transport (10, 41),methanotrophs associated with plant roots and rhizomes can be amitigating barrier that significantly reduces wetland CH4 emis-sion.
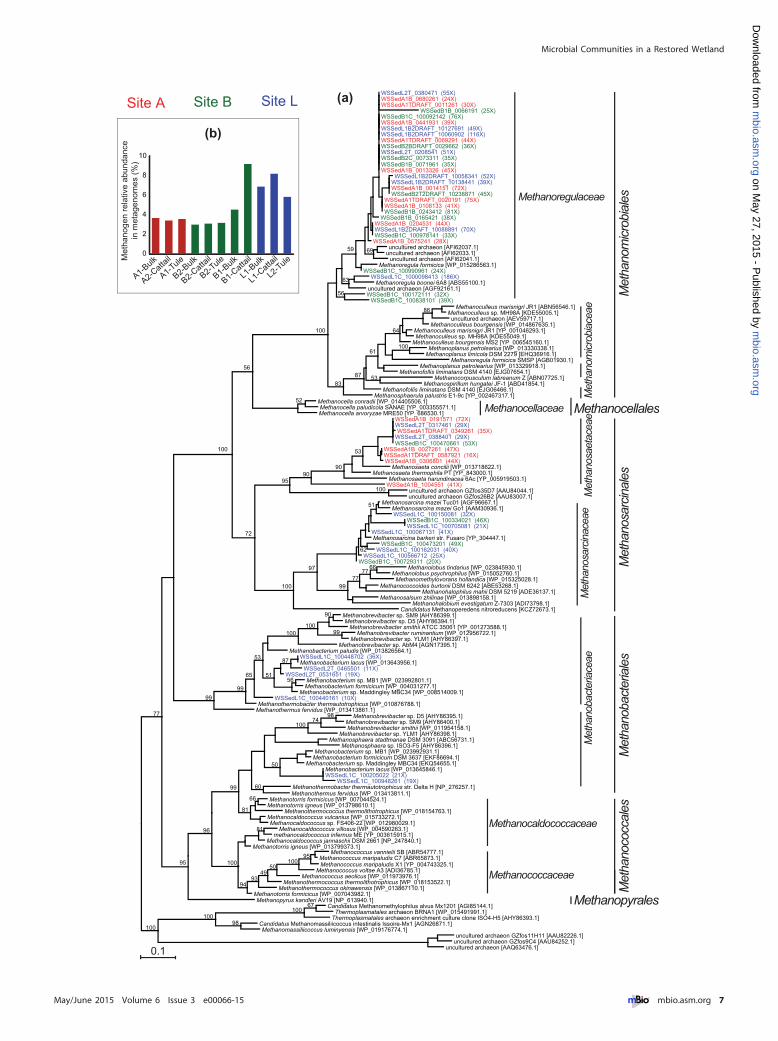
Diversity and distribution of methanogens. The genes encod-ing methyl coenzyme M reductase (MCR), which catalyzes theterminal step in methanogenesis, are functional markers ofmethanogenesis, and the gene for its subunit A, mcrA, is oftenused as a methanogen phylogenetic marker. We performed phy-logenetic analysis using metagenome mcrA sequences from theassembled part, presumably derived from abundant methanogenpopulations in this wetland (Fig. 5a). All analyzed metagenome
mcrA sequences were affiliated with Methanomicrobiales, Metha-nobacteriales, and Methanosarcinales, spanning three out of the sixmajor orders of known methanogens. The Methanoregulaceaefamily within Methanomicrobiales harbors more than half of met-agenome mcrA sequences, some of which have high coverage (e.g.,�50�). Particularly, an mcrA gene closely affiliated with Metha-noregula boonei 6A8 has a very high coverage (i.e., 186�), whichallowed the recovery of a near-complete genome of the methano-gen containing it (data not shown). This genome has only thehydrogenotrophic methanogenesis pathway and lacks the methy-lotrophic pathway and the hdrDE genes needed for growing onacetate, confirming it as a hydrogenotrophic specialist. As mem-bers of Methanomicrobiales and Methanobacteriales are mostly hy-
pfam02239pfam00394pfam09698COG4548COG3043COG3301pfam09699pfam12139COG2920COG2046pfam07732COG2146COG0175COG2895COG3303COG2221COG3256COG0529COG1251pfam00034pfam00374COG4263COG3005pfam11854COG1140COG5013COG2132COG2181COG2180COG4007COG4074COG4064COG1962COG1153COG4063COG4218COG1927COG4061COG4062COG4060COG4055COG4056COG4058COG4057COG4054COG4059pfaff m02406pfaff m02332COG1348COG2710pfaff m02964pfam04744pfam04896pfam02461pfam02906pfam02256COG2191COG2218COG1029COG2037COG3252COG1229
−2 0 2Row Z−Score
Color Key
L1-CattailL2-Tule
L1-Bulk
B1-CattailB1-Bulk
A1-Tule
A1-Bulk
B2-CattailB2-Bulk
B2-Tule
A2-Cattail
Sulfate reductionDenitrification
Metal reduction
Nitrogen fixation
HydrogenaseMethanogenesis
Methane oxidation
FIG 4 Heat map of gene families in important pathways generated with R and its “gplots” package, using the odds ratios between an individual metagenomeand the combined average. Note that there are no COGs and Pfams specific for nitrite reductase genes nirK and nirS. As pfam02239 and pfam00034 are domainsconstituting nirS and COG2132, pfam00394, and pfam07732 are domains constituting nirK, we included them in this heat map, but note that they can also becomponents of some other redox genes.
He et al.
6 ® mbio.asm.org May/June 2015 Volume 6 Issue 3 e00066-15
m
bio.asm.org
on May 27, 2015 - P
ublished by m
bio.asm.org
Dow
nloaded from
WSSedL2T_0380471 (55X)WSSedA1B_0680261 (24X)WSSedA1TDRAFT_0011261 (30X)
WSSedB1B_0066191 (25X)WSSedB1C_100092142 (76X)WSSedA1B_0441931 (39X)WSSedL1B2DRAFT_10127691 (49X)WSSedL1B2DRAFT_10060902 (116X)WSSedA1TDRAFT_0069291 (44X)WSSedB2BDRAFT_0029662 (36X)WSSedL2T_0208541 (51X)WSSedB2C_0073311 (35X)WSSedB1B_0071961 (35X)WSSedA1B_0013326 (45X)
WSSedL1B2DRAFT_10058341 (52X)WSSedL1B2DRAFT_10138441 (39X)WSSedA1B_0014151 (72X)WSSedB2T2DRAFT_10238871 (45X)
WSSedA1TDRAFT_0020191 (75X)WSSedA1B_0108133 (41X)WSSedB1B_0243412 (81X)
WSSedB1B_0165421 (38X)WSSedA1B_0204531 (44X)WSSedL1B2DRAFT_10088891 (70X)WSSedB1C_100978141 (33X)WSSedA1B_0575241 (28X)
uncultured archaeon [AFI62037.1]uncultured archaeon [AFI62033.1]69
uncultured archaeon [AFI62041.1]Methanoregula formicica [WP_015286563.1]
WSSedB1C_100990961 (24X)
59
WSSedL1C_1000098413 (186X)Methanoregula boonei 6A8 [ABS55100.1]63
uncultured archaeon [AGF92161.1]WSSedB1C_100172111 (32X)
WSSedB1C_100838101 (39X)56
Methanoculleus marisnigri JR1 [ABN56546.1]Methanoculleus sp. MH98A [KDE55005.1]uncultured archaeon [AEV59717.1]
86
Methanoculleus bourgensis [WP_014867635.1]Methanoculleus marisnigri JR1 [YP_001046293.1]Methanoculleus sp. MH98A [KDE55049.1]
Methanoculleus bourgensis MS2 [YP_006545160.1]
64
Methanoplanus petrolearius [WP_013330338.1]Methanoplanus limicola DSM 2279 [EHQ36916.1]
100
Methanoregula formicica SMSP [AGB01930.1]Methanoplanus petrolearius [WP_013329918.1]
Methanofollis liminatans DSM 4140 [EJG07654.1]
61
Methanocorpusculum labreanum Z [ABN07725.1]Methanospirillum hungatei JF-1 [ABD41854.1]
53
Methanofollis liminatans DSM 4140 [EJG06466.1]
87
Methanosphaerula palustris E1-9c [YP_002467317.1]
83
100
Methanocella conradii [WP_014405506.1]Methanocella paludicola SANAE [YP_003355571.1]
52
Methanocella arvoryzae MRE50 [YP_686530.1]
56
WSSedA1B_0191571 (72X)WSSedL2T_0317461 (29X)WSSedA1TDRAFT_0349261 (35X)
WSSedL2T_0388401 (29X)WSSedB1C_100470661 (53X)
WSSedA1B_0027261 (47X)WSSedA1TDRAFT_0587921 (16X)WSSedA1B_0306801 (44X)
Methanosaeta concilii [WP_013718622.1]
53
Methanosaeta thermophila PT [YP_843000.1]Methanosaeta harundinacea 6Ac [YP_005919503.1]
90
WSSedA1B_1004551 (41X)
90
uncultured archaeon GZfos35D7 [AAU84044.1]uncultured archaeon GZfos26B2 [AAU83007.1]
10095
Methanosarcina mazei Tuc01 [AGF96667.1]Methanosarcina mazei Go1 [AAM30936.1]WSSedL1C_100150081 (32X)
51
WSSedB1C_100334021 (46X)WSSedL1C_100705081 (21X)
WSSedL1C_100067131 (41X)Methanosarcina barkeri str. Fusaro [YP_304447.1]
WSSedB1C_100473201 (49X)WSSedL1C_100162031 (40X)62
WSSedL1C_100566712 (25X)WSSedB1C_100729311 (20X)
Methanolobus tindarius [WP_023845930.1]Methanolobus psychrophilus [WP_015052760.1]
66
Methanomethylovorans hollandica [WP_015325028.1]77
Methanococcoides burtonii DSM 6242 [ABE53268.1]Methanohalophilus mahii DSM 5219 [ADE36137.1]
77
Methanosalsum zhilinae [WP_013898158.1]Methanohalobium evestigatum Z-7303 [ADI73798.1]
99
97
Candidatus Methanoperedens nitroreducens [KCZ72673.1]
100
72
100
Methanobrevibacter sp. SM9 [AHY86399.1]Methanobrevibacter sp. D5 [AHY86394.1]
90
Methanobrevibacter smithii ATCC 35061 [YP_001273588.1]Methanobrevibacter ruminantium [WP_012956722.1]
Methanobrevibacter sp. YLM1 [AHY86397.1]99
100
Methanobrevibacter sp. AbM4 [AGN17395.1]
100
Methanobacterium paludis [WP_013826564.1]WSSedL1C_100448702 (36X)Methanobacterium lacus [WP_013643956.1]
WSSedL2T_0465501 (11X)87
WSSedL2T_0531651 (19X)Methanobacterium sp. MB1 [WP_023992801.1]Methanobacterium formicicum [WP_004031277.1]
56
Methanobacterium sp. Maddingley MBC34 [WP_008514009.1]
51
53
WSSedL1C_100440161 (10X)
65
Methanothermobacter thermautotrophicus [WP_010876788.1]
99
Methanothermus fervidus [WP_013413861.1]
99
96
Methanopyrus kandleri AV19 [NP_613940.1]
95
77
Candidatus Methanomethylophilus alvus Mx1201 [AGI85144.1]Thermoplasmatales archaeon BRNA1 [WP_015491991.1]
67
Thermoplasmatales archaeon enrichment culture clone ISO4-H5 [AHY86393.1]100
Candidatus Methanomassiliicoccus intestinalis Issoire-Mx1 [AGN26871.1]Methanomassiliicoccus luminyensis [WP_019176774.1]
98100
uncultured archaeon GZfos11H11 [AAU82226.1]uncultured archaeon GZfos9C4 [AAU84252.1]
uncultured archaeon [AAQ63476.1]
100
Methanoregulaceae
Met
hano
micr
obia
ceae
Methanocellaceae Methanocellales
Met
hano
saet
acea
eM
etha
nosa
rcin
acea
e
Met
hano
sarc
inal
es M
etha
nom
icrob
iale
s
Met
hano
bact
eria
ceae
Met
hano
bact
eria
les
Methanobrevibacter sp. D5 [AHY86395.1]Methanobrevibacter sp. SM9 [AHY86400.1]
98
Methanobrevibacter smithii [WP_011954158.1]74
Methanobrevibacter sp. YLM1 [AHY86398.1]100
Methanosphaera stadtmanae DSM 3091 [ABC56731.1]Methanosphaera sp. ISO3-F5 [AHY86396.1]
Methanobacterium sp. MB1 [WP_023992931.1]Methanobacterium formicicum DSM 3637 [EKF86694.1]
Methanobacterium sp. Maddingley MBC34 [EKQ54655.1]Methanobacterium lacus [WP_013645846.1]WSSedL1C_100205022 (21X)
WSSedL1C_100948261 (19X)
50
Methanothermobacter thermautotrophicus str. Delta H [NP_276257.1]Methanothermus fervidus [WP_013413811.1]
60
Methanotorris formicicus [WP_007044524.1]Methanotorris igneus [WP_013798610.1]
66
Methanothermococcus thermolithotrophicus [WP_018154763.1]Methanocaldococcus vulcanius [WP_015733272.1]Methanocaldococcus sp. FS406-22 [WP_012980029.1]
81
99
Methanocaldococcaceae
100
Methanocaldococcus villosus [WP_004590263.1]methanocaldococcus infernus ME [YP_003615915.1]
81
Methanocaldococcus jannaschii DSM 2661 [NP_247840.1]Methanotorris igneus [WP_013799373.1]
Methanococcus vannielii SB [ABR54777.1]Methanococcus maripaludis C7 [ABR65873.1]Methanococcus maripaludis X1 [YP_004743325.1]
95
Methanococcus voltae A3 [ADI36785.1]100
Methanococcus aeolicus [WP_011973976.1]50
Methanothermococcus thermolithotrophicus [WP_018153522.1]49
Methanothermococcus okinawensis [WP_013867110.1]93
Methanotorris formicicus [WP_007043982.1]94
Methanococcaceae
Met
hano
cocc
ales
Methanopyrales
0
2
4
6
8
10
A1-Bulk
A2-Catt
ail
A1-Tule
B2-Bulk
B2-Catt
ail
B2-Tule
B1-Bulk
B1-Catt
ail
L1-B
ulk
L1-C
attail
L2-Tule
Site LSite A Site BM
etha
noge
n re
lativ
e ab
unda
nce
in m
etag
enom
es (%
)(b)
(a)
0.1
Microbial Communities in a Restored Wetland
May/June 2015 Volume 6 Issue 3 e00066-15 ® mbio.asm.org 7
m
bio.asm.org
on May 27, 2015 - P
ublished by m
bio.asm.org
Dow
nloaded from

drogenotrophic (23–25), their abundant presence suggests theimportance of hydrogenotrophic methanogenesis in this wetland.
Among Methanosarcinales, the acetoclastic specialist genus,Methanosaeta, mainly contains sequences from site A, and the meta-bolically versatile genus, Methanosarcina, exclusively contains se-quences from cattail rhizomes on sites B and L. The Methanobacteri-aceae branch within the Methanobacteriales is represented only byrhizome samples from site L. These site- and type-associatedmethanogen distribution patterns remain even when we includedadditional shorter sequences from wetland metagenomes (datanot shown). The type-associated patterns likely reflect acetate andoxygen availabilities as discussed in the above 16S rRNA geneanalysis session.
We estimated the relative abundance of methanogens and sev-eral other functional guilds in the community by comparing theirspecific functional marker gene abundance to general single-copyhousekeeping genes, using their length-normalized abundances(see Text S1C in the supplemental material for details on the nor-malization method). We expect this method to be much less bi-ased than traditional PCR-based quantification, which is subjectto PCR bias and depends on the design of functional gene andhousekeeping gene primers inclusive enough for different taxa. Tovalidate this method, we compared methanogen estimates by rel-ative abundance of mcr genes against the estimates by 16S rRNAgene amplicon sequencing and by the classification of 16S rRNAgene reads in the metagenomes (42) (see Text S1D for details). Wedemonstrate that the estimate by metagenome mcr was very com-parable to the estimate by metagenome 16S rRNA genes and wasmore quantitatively accurate than 16S rRNA gene amplicon se-quencing. The estimated methanogens ranged from 2% to 10% ofthe total community and were highest at the interior and lowest atthe inlet (Fig. 5b).
Diversity and distribution of methanotrophs. Metha-notrophs use methane as a sole carbon and energy source and canbe classified as type I (belonging to Gammaproteobacteria) andtype II (belonging to Alphaproteobacteria) methanotrophs (43).For example, these types differ in carbon assimilation pathways,cell morphology, and ultrastructure. In addition, a verrucomicro-bial methanotroph (44) and a nitrite-dependent anaerobic meth-ane oxidizer, “Candidatus Methylomirabilis oxyfera” in candidatedivision NC10 (45), were also reported. The first step in methaneoxidation is catalyzed by methane monooxygenase (MMO),which has two forms: a particulate membrane-bound form(pMMO) and a soluble cytoplasmic form (sMMO). Nearly allmethanotrophs (with some exceptions such as Methylocella) pos-sess pMMO, whereas sMMO is present in only a few metha-notroph genera (32, 46). The alpha subunits of pMMO (pmoA)and sMMO (mmoX) genes are often used to study methanotrophphylogeny (32).
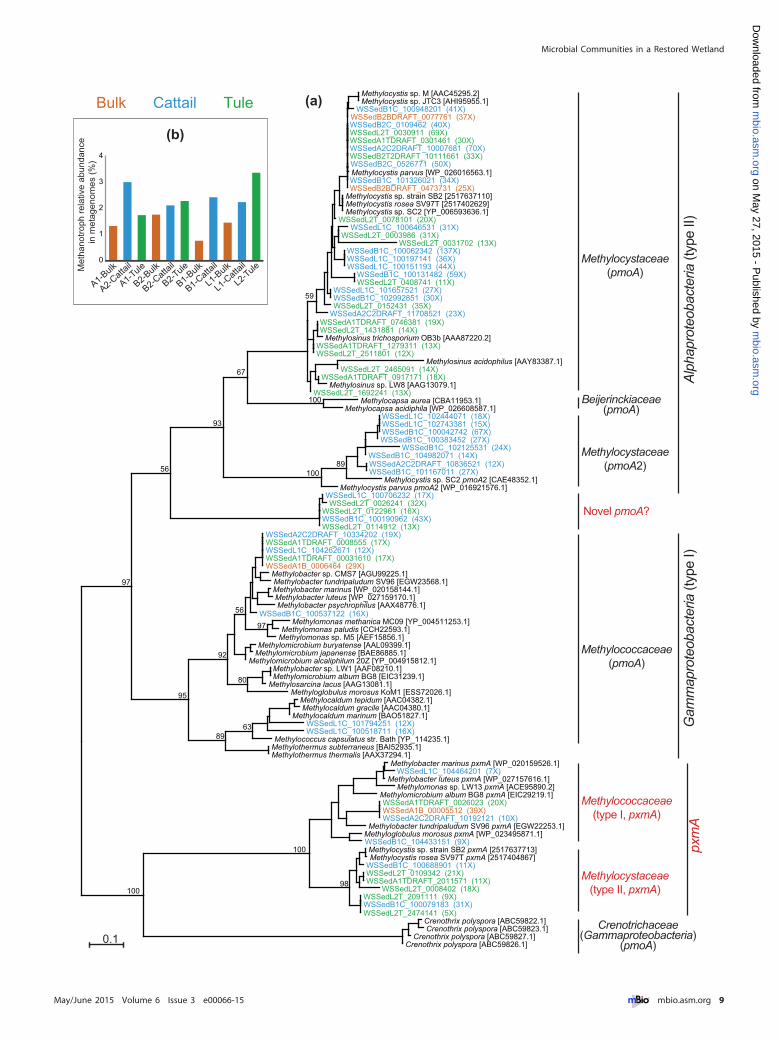
To reveal the diversity of methanotrophs, we first constructeda pmoA phylogenetic tree (Fig. 6a). The majority of wetland pmoAgenes were affiliated with Methylocystis and Methylosinus withinMethylocystaceae (type II), and some were affiliated with Methylo-coccaceae (type I). No sequence was affiliated with Verrucomicro-
bia or “Ca. Methylomirabilis oxyfera” (tree not shown), and thiswas confirmed by blasting Verrucomicrobia and “Ca. Methylomi-rabilis oxyfera” pmoA genes against our metagenomes. Notably, abranch of pmoA consists only of metagenome rhizome sequences,and these sequences are less than 65% identical to any sequence inthe nr database. It is not clear whether they are true pmoA genes orpmoA-homologous amoA (ammonia monooxygenase) genes, asthey match to Nitrosococcus and methanotrophs almost equally.However, their adjacent pmoB components are more similar tomethanotrophs than to Nitrosococcus, suggesting that these novelsequences are likely from an unidentified methanotroph group.
It was previously reported that all pMMO operons were orga-nized as pmoCAB, whereas some gammaproteobacterial metha-notrophs possess a novel pmoA gene in a pmoABC operon, inaddition to the traditional pmoA gene in the pmoCAB operon (47).This pmoA was proposed to have an unknown function differentfrom the traditional pmoA genes and was referred to as “pxmA.” Anumber of our wetland sequences were within the newly identifiedMethylococcaceae pxmA cluster, and they also have a pmoABCoperon structure (if the operon is recovered), confirming theiraffiliation with pxmA. In addition, by searching reference metha-notroph genomes, we also identified Methylocystis strain SB2 andMethylocystis rosea SV97T possessing such operon structures, andtogether with Methylococcaceae, they form a pxmA cluster, differ-ent from the traditional pmoA in either type I or II metha-notrophs. A number of our wetland sequences were affiliated withthese two Methylocystis pxmA sequences, and this finding suggeststhat this novel pxmA is present not only in type I as previouslythought (47) but also in type II methanotrophs, although its func-tion is still unclear.
The distribution of pmoA exhibited some patterns associatedwith sample types (Fig. 6a). Clearly, the number of pmoA se-quences recovered from bulk peats is much lower than that fromrhizomes. In addition, pmoA sequences affiliated with Methylosi-nus are mainly from tule rhizomes, whereas the MethylocystaceaepmoA2 (an isozyme of pmoA in some Methylocystis genomes [48])was found only in cattail rhizomes, suggesting some differentialrecruitments by the two plants.
As most methanotrophs possess pMMO (32), the abundanceof methanotrophs was estimated by pmoA genes (see method de-tails in Text S1E in the supplemental material) and ranged from0.7 to 3.4% of the total community (Fig. 6b). In general, metha-notrophs were present at higher abundances in the rhizomes thanin the bulk peats within the same site. Overall, there is no correla-tion between methanotroph abundance and methanogen ormethane production, suggesting that oxygen availability in themicroenvironment is probably the limiting factor controllingmethanotroph populations in this wetland. As we consider thebulk sediment to be anoxic, the presence of aerobic methanogens,although at low levels, may be due to the many fine roots in thesediment, allowing oxygen to penetrate peats surrounding theseroots, therefore increasing the microheterogeneity of the sedi-ment.
We also constructed an mmoX phylogenetic tree (see Fig. S6 in
FIG 5 Diversity of mcrA genes and abundance of methanogens. (a) Phylogenetic tree of mcrA, including all sequences recovered from metagenome assemblieswith lengths of �150 amino acids. Wetland sequences are labeled with colors indicative of different sample sites, and their fold coverage in metagenomes isindicated in the parentheses. The accession numbers of reference sequences are in brackets. (b) Relative abundance of methanogens in the total communityestimated by mcr genes.
He et al.
8 ® mbio.asm.org May/June 2015 Volume 6 Issue 3 e00066-15
m
bio.asm.org
on May 27, 2015 - P
ublished by m
bio.asm.org
Dow
nloaded from
Methylocystaceae(pmoA)
Methylococcaceae(pmoA)
Methylocystaceae(pmoA2)
Crenotrichaceae(Gammaproteobacteria)
(pmoA)
Methylococcaceae(type I, pxmA)
Methylocystaceae(type II, pxmA)
Alph
apro
teob
acte
ria (t
ype
II)G
amm
apro
teob
acte
ria (t
ype
I)px
mA
0.1
Methylocystis sp. M [AAC45295.2]Methylocystis sp. JTC3 [AHI95955.1]
WSSedB1C_100948201 (41X)WSSedB2BDRAFT_0077761 (37X)WSSedB2C_0109462 (40X)WSSedL2T_0030911 (69X)WSSedA1TDRAFT_0301461 (30X)WSSedA2C2DRAFT_10007681 (70X)WSSedB2T2DRAFT_10111661 (33X)WSSedB2C_0526771 (50X)Methylocystis parvus [WP_026016563.1]WSSedB1C_101326021 (34X)WSSedB2BDRAFT_0473731 (25X)
Methylocystis sp. strain SB2 [2517637110]Methylocystis rosea SV97T [2517402629]Methylocystis sp. SC2 [YP_006593636.1]
WSSedL2T_0078101 (20X)WSSedL1C_100646531 (31X)
WSSedL2T_0003986 (31X)WSSedL2T_0031702 (13X)
WSSedB1C_100062342 (137X)WSSedL1C_100197141 (36X)WSSedL1C_100151193 (44X)
WSSedB1C_100131482 (59X)WSSedL2T_0408741 (11X)
WSSedL1C_101657521 (27X)WSSedB1C_102992851 (30X)WSSedL2T_0152431 (35X)
WSSedA2C2DRAFT_11708521 (23X)
59
WSSedA1TDRAFT_0746381 (19X)WSSedL2T_1431881 (14X)
Methylosinus trichosporium OB3b [AAA87220.2]WSSedA1TDRAFT_1279311 (13X)WSSedL2T_2511801 (12X)
Methylosinus acidophilus [AAY83387.1]WSSedL2T_2465091 (14X)
WSSedA1TDRAFT_0917171 (18X)Methylosinus sp. LW8 [AAG13079.1]
WSSedL2T_1692241 (13X)Methylocapsa aurea [CBA11953.1]
Methylocapsa acidiphila [WP_026608587.1]100
67
WSSedL1C_102444071 (18X)WSSedL1C_102743381 (15X)WSSedB1C_100042742 (67X)WSSedB1C_100383452 (27X)
WSSedB1C_102125531 (24X)WSSedB1C_104982071 (14X)WSSedA2C2DRAFT_10836521 (12X)WSSedB1C_101167011 (27X)
Methylocystis sp. SC2 pmoA2 [CAE48352.1]
89
Methylocystis parvus pmoA2 [WP_016921576.1]
100
93
WSSedL1C_100706232 (17X)WSSedL2T_0026241 (32X)
WSSedL2T_0122961 (16X)WSSedB1C_100190962 (43X)WSSedL2T_0114912 (13X)
56
WSSedA2C2DRAFT_10334202 (19X)WSSedA1TDRAFT_0008555 (17X)WSSedL1C_104262671 (12X)WSSedA1TDRAFT_00031610 (17X)WSSedA1B_0006464 (29X)
Methylobacter sp. CMS7 [AGU99225.1]Methylobacter tundripaludum SV96 [EGW23568.1]Methylobacter marinus [WP_020158144.1]Methylobacter luteus [WP_027159170.1]Methylobacter psychrophilus [AAX48776.1]
WSSedB1C_100537122 (16X)Methylomonas methanica MC09 [YP_004511253.1]
Methylomonas paludis [CCH22593.1]Methylomonas sp. M5 [AEF15856.1]
97
56
Methylomicrobium buryatense [AAL09399.1]Methylomicrobium japanense [BAE86885.1]
Methylomicrobium alcaliphilum 20Z [YP_004915812.1]Methylobacter sp. LW1 [AAF08210.1]Methylomicrobium album BG8 [EIC31239.1]
Methylosarcina lacus [AAG13081.1]Methyloglobulus morosus KoM1 [ESS72026.1]
80
92
Methylocaldum tepidum [AAC04382.1]Methylocaldum gracile [AAC04380.1]
Methylocaldum marinum [BAO51827.1]WSSedL1C_101794251 (12X)WSSedL1C_100518711 (16X)
Methylococcus capsulatus str. Bath [YP_114235.1]63
Methylothermus subterraneus [BAI52935.1]Methylothermus thermalis [AAX37294.1]
89
95
97
Methylobacter marinus pxmA [WP_020159526.1]WSSedL1C_104464201 (7X)
Methylobacter luteus pxmA [WP_027157616.1]Methylomonas sp. LW13 pxmA [ACE95890.2]
Methylomicrobium album BG8 pxmA [EIC29219.1]WSSedA1TDRAFT_0026023 (20X)WSSedA1B_00005512 (39X)WSSedA2C2DRAFT_10192121 (10X)
Methylobacter tundripaludum SV96 pxmA [EGW22253.1]Methyloglobulus morosus pxmA [WP_023495871.1]WSSedB1C_104433151 (9X)Methylocystis sp. strain SB2 pxmA [2517637713]Methylocystis rosea SV97T pxmA [2517404867]
WSSedB1C_100688901 (11X)WSSedL2T_0109342 (21X)WSSedA1TDRAFT_2011571 (11X)
WSSedL2T_0008402 (18X)WSSedL2T_2091111 (9X)WSSedB1C_100079183 (31X)WSSedL2T_2474141 (5X)
98
100
Crenothrix polyspora [ABC59822.1]Crenothrix polyspora [ABC59823.1]
Crenothrix polyspora [ABC59827.1]Crenothrix polyspora [ABC59826.1]
100
0
1
2
3
4
A1-Bulk
A2-Catt
ail
A1-Tule
B2-Bulk
B2-Catt
ail
B2-Tule
B1-Bulk
B1-Catt
ail
L1-B
ulk
L1-C
attail
L2-TuleM
etha
notro
ph re
lativ
e ab
unda
nce
in m
etag
enom
es (%
)
(b)
(a)Bulk Cattail Tule
Novel pmoA?
Beijerinckiaceae(pmoA)
Microbial Communities in a Restored Wetland
May/June 2015 Volume 6 Issue 3 e00066-15 ® mbio.asm.org 9
m
bio.asm.org
on May 27, 2015 - P
ublished by m
bio.asm.org
Dow
nloaded from
the supplemental material). As expected, fewer mmoX sequenceswere recovered from the wetland, and in particular, no mmoXsequences were obtained from bulk peats. About two-thirds of thewetland mmoX sequences are in the Methylocystaceae and Methy-lococcaceae families, and about one-third belong to Beijerincki-aceae, including members such as Methylocella and Methyloferula,which lack the pmoA genes in their genomes. Therefore, the abovemethanotroph abundance estimation by pmoA overlooked thecontribution of Beijerinckiaceae methanotrophs, although theyare minor based on the number and sequence coverage of theirmmoX genes.
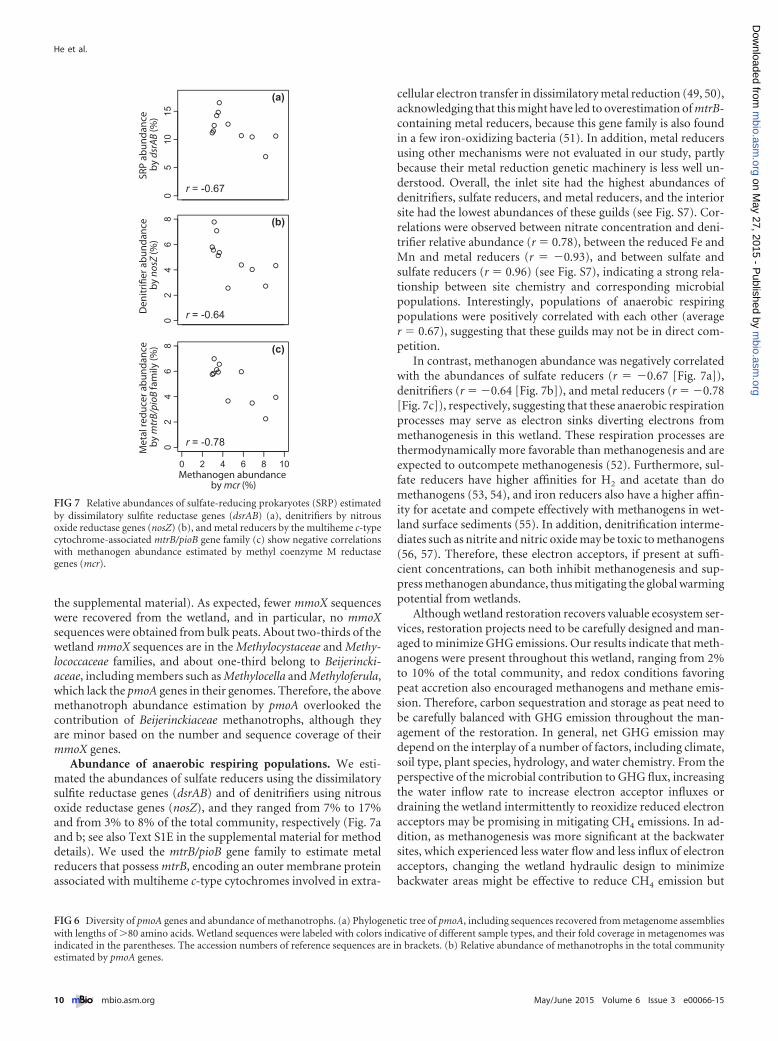
Abundance of anaerobic respiring populations. We esti-mated the abundances of sulfate reducers using the dissimilatorysulfite reductase genes (dsrAB) and of denitrifiers using nitrousoxide reductase genes (nosZ), and they ranged from 7% to 17%and from 3% to 8% of the total community, respectively (Fig. 7aand b; see also Text S1E in the supplemental material for methoddetails). We used the mtrB/pioB gene family to estimate metalreducers that possess mtrB, encoding an outer membrane proteinassociated with multiheme c-type cytochromes involved in extra-
cellular electron transfer in dissimilatory metal reduction (49, 50),acknowledging that this might have led to overestimation of mtrB-containing metal reducers, because this gene family is also foundin a few iron-oxidizing bacteria (51). In addition, metal reducersusing other mechanisms were not evaluated in our study, partlybecause their metal reduction genetic machinery is less well un-derstood. Overall, the inlet site had the highest abundances ofdenitrifiers, sulfate reducers, and metal reducers, and the interiorsite had the lowest abundances of these guilds (see Fig. S7). Cor-relations were observed between nitrate concentration and deni-trifier relative abundance (r � 0.78), between the reduced Fe andMn and metal reducers (r � �0.93), and between sulfate andsulfate reducers (r � 0.96) (see Fig. S7), indicating a strong rela-tionship between site chemistry and corresponding microbialpopulations. Interestingly, populations of anaerobic respiringpopulations were positively correlated with each other (averager � 0.67), suggesting that these guilds may not be in direct com-petition.
In contrast, methanogen abundance was negatively correlatedwith the abundances of sulfate reducers (r � �0.67 [Fig. 7a]),denitrifiers (r � �0.64 [Fig. 7b]), and metal reducers (r � �0.78[Fig. 7c]), respectively, suggesting that these anaerobic respirationprocesses may serve as electron sinks diverting electrons frommethanogenesis in this wetland. These respiration processes arethermodynamically more favorable than methanogenesis and areexpected to outcompete methanogenesis (52). Furthermore, sul-fate reducers have higher affinities for H2 and acetate than domethanogens (53, 54), and iron reducers also have a higher affin-ity for acetate and compete effectively with methanogens in wet-land surface sediments (55). In addition, denitrification interme-diates such as nitrite and nitric oxide may be toxic to methanogens(56, 57). Therefore, these electron acceptors, if present at suffi-cient concentrations, can both inhibit methanogenesis and sup-press methanogen abundance, thus mitigating the global warmingpotential from wetlands.
Although wetland restoration recovers valuable ecosystem ser-vices, restoration projects need to be carefully designed and man-aged to minimize GHG emissions. Our results indicate that meth-anogens were present throughout this wetland, ranging from 2%to 10% of the total community, and redox conditions favoringpeat accretion also encouraged methanogens and methane emis-sion. Therefore, carbon sequestration and storage as peat need tobe carefully balanced with GHG emission throughout the man-agement of the restoration. In general, net GHG emission maydepend on the interplay of a number of factors, including climate,soil type, plant species, hydrology, and water chemistry. From theperspective of the microbial contribution to GHG flux, increasingthe water inflow rate to increase electron acceptor influxes ordraining the wetland intermittently to reoxidize reduced electronacceptors may be promising in mitigating CH4 emissions. In ad-dition, as methanogenesis was more significant at the backwatersites, which experienced less water flow and less influx of electronacceptors, changing the wetland hydraulic design to minimizebackwater areas might be effective to reduce CH4 emission but
FIG 6 Diversity of pmoA genes and abundance of methanotrophs. (a) Phylogenetic tree of pmoA, including sequences recovered from metagenome assemblieswith lengths of �80 amino acids. Wetland sequences were labeled with colors indicative of different sample types, and their fold coverage in metagenomes wasindicated in the parentheses. The accession numbers of reference sequences are in brackets. (b) Relative abundance of methanotrophs in the total communityestimated by pmoA genes.
05
1015
02
46
8
0 2 4 6 8 10
02
46
8
Methanogen abundance by mcr (%)
SRP
abun
danc
e by
dsr
AB (%
)D
enitr
ifier
abu
ndan
ce
by n
osZ
(%)
Met
al re
duce
r abu
ndan
ce
by m
trB/
pioB
fam
ily (%
)
r = -0.67
r = -0.64
r = -0.78
(a)
(b)
(c)
FIG 7 Relative abundances of sulfate-reducing prokaryotes (SRP) estimatedby dissimilatory sulfite reductase genes (dsrAB) (a), denitrifiers by nitrousoxide reductase genes (nosZ) (b), and metal reducers by the multiheme c-typecytochrome-associated mtrB/pioB gene family (c) show negative correlationswith methanogen abundance estimated by methyl coenzyme M reductasegenes (mcr).
He et al.
10 ® mbio.asm.org May/June 2015 Volume 6 Issue 3 e00066-15
m
bio.asm.org
on May 27, 2015 - P
ublished by m
bio.asm.org
Dow
nloaded from
must be evaluated against benefits of plant productivity and hab-itat quality.
In summary, the differences in microbial community compo-sition and functional profiles reveal complex interactions amongfunctional guilds and among wetland plants, microorganisms,and their environment. Analyses of 16S rRNA and functionalgenes showed distribution patterns associated with biogeochem-istry and indicated microspatial heterogeneity of wetland sedi-ments. Phylogeny of marker genes revealed a diversity of majormethane-producing and -consuming populations and discoverednovel diversity within methanotrophs. Quantitative comparativeanalyses of shotgun sequence data reveal the competition with andinhibition of methanogens by anaerobic respiring microorgan-isms without biases introduced by cultivation or PCR amplifica-tion and provided molecular evidence explaining the spatial vari-ations in biogeochemistry and methane production. Thisinformation is useful in planning and operating wetland restora-tion projects in order to reduce CH4 emission to the atmosphereand maintain the carbon storage potential of restored wetlands.Based on these findings, more specific studies can be carried out toevaluate the impact of wetland water chemistry and hydrology onCH4 emission and carbon sequestration before large-scale resto-ration projects are implemented.
MATERIALS AND METHODSSite description. A USGS pilot-scale wetland restoration project, locatedon Twitchell Island in the Sacramento-San Joaquin River Delta, CA, USA(121.65°W, 38.11°N), was constructed in 1997 by permanently floodingtwo adjacent agricultural plots, each about 3 ha, with standing waterdepths of 25 cm (west pond) and 55 cm (east pond), respectively (seeFig. S1 in the supplemental material). Details about the wetland construc-tion were described previously (7). The water table was maintained bypiping in fresh water from the surrounding San Joaquin River, continu-ously entering the wetlands from inlets, and flowing out through weirsnear the middle of the north edge of each pond (see Fig. S1). The riverwater was a source of sulfate, phosphate, nitrate, and iron, ranging from 6to 35 mg SO4
2�/liter, 0.1 to 0.4 mg PO43�/liter, 0.1 to 1.0 mg NO3
�/liter,and 0.2 to 0.5 mg Fe/liter, respectively (10). Two emergent marsh species,cattails (Typha spp.) and tules (Schoenoplectus acutus), are the primaryvegetation that established postrestoration (58).
Sample collection and pore water chemical analysis. We collectedbelowground samples from three sites with various proximities to theinlets: sites A (inlet), B (transitional), and L (interior) in February (winter,nongrowing season for wetland vegetation) and sites A (inlet), B (transi-tional), and C (interior) in August (growing season) during 2011 (seeFig. S1 in the supplemental material). We used a custom-made Hargiscorer (59) to collect duplicate cores from each site (e.g., cores A1 and A2from site A). Each core, about 10 cm in diameter and 25 cm in length, wassplit into two sections by depth, 0 to 12 cm and 12 to 25 cm belowground,respectively. From each section, we collected three types of biomass sam-ples, including bulk peat (mostly unidentifiable decomposed organic ma-terial), cattail rhizomes, and tule rhizomes, if available. Surface soil sam-ples from the adjacent cornfield, to approximate soil prior to therestoration, were collected as a reference point. Samples for DNA extrac-tion were immediately frozen on dry ice upon collection. For the Februarycollection, in parallel with preserving samples for microbial communityanalysis, a subsample was taken from each sample, placed on ice, andtransported immediately to the laboratory for anoxic incubation (see be-low). Temperature, pH, and dissolved oxygen (DO) were measured onsite with YSI probes (model 6920-v2). Pore water was collected by syringefrom each site at three depths, 0 cm (at the standing water-peat interface),5 cm, and 20 cm belowground, respectively, and then filtered through0.45-�m filters for soluble chemicals. For February sampling, two sets of
pore water subsamples were collected. One set was directly collected intosealed serum bottles, and the other set was preserved in sulfuric acid(H2SO4) to a concentration of 0.2% by volume in sealed serum bottles.Both sets were immediately frozen on dry ice for later testing by the Aque-ous Chemistry Laboratory at Lawrence Berkeley National Laboratory.Sulfuric acid-preserved pore water samples were used for total iron (Fe)and manganese (Mn) measurements using inductively coupled plasmamass spectrometry (ICP-MS). The other set of pore water samples wasused for nitrate, nitrite, phosphate, sulfate, chloride, and acetate anionmeasurements using ion chromatography and for ammonia measure-ment using the salicylate method (Hach, Loveland, CO). For August sam-pling, pore water samples were directly collected into sealed serum bottlesand immediately frozen on dry ice for the above-described tests by theAqueous Chemistry Laboratory at Lawrence Berkeley National Labora-tory. Ammonia and nitrite concentrations were mostly below their detec-tion limits (0.05 mg/liter and 0.1 mg/liter, respectively), and acetate con-centrations were below 1 mg/liter and in many cases below the detectionlimit (0.1 mg/liter).
Laboratory incubation. Fresh wet samples (6.3 � 4.0 g by dry weight)collected in February were placed into 480-ml glass jars fitted with airtightlids. Water from sites A, B, and L was used to submerge samples col-lected from the corresponding site; air and water volumes of the jarswere recorded. Jars containing samples and water blanks were flushedwith N2 and incubated in the dark at 10°C for 12 days. Gas samplingwas achieved through a bulkhead union sealed with silicone and fittedwith a three-way stopcock. On days 7 and 12, headspace gas was sam-pled with a syringe and analyzed for CH4 concentration using amicro-GC P200 gas chromatograph (Agilent Technologies Inc., SantaClara, CA). CH4 production was calculated using the ideal gas law,corrected for CH4 equilibration with water using Henry’s law, andthen normalized by sample dry weights, which were determined byoven-drying the sample to a consistent mass at 65°C. CH4 productionrates from the two time points were averaged. Duncan’s new multiplerange test with a confidence level of 0.10 was performed using the R“agricolae” package to evaluate the statistical significance of differ-ences among the three sites.
On-site CH4 flux. For August sampling, on-site GHG flux was mea-sured using a series of stationary whole-plant chambers deployed at sitesA, B, and C, with duplicate chambers at each site. The chambers, withdifferent heights customized to best accommodate vegetation heights(280 to 412 cm tall, 1-m2 area), were constructed of polyvinyl chloride(PVC) pipes and enclosed by large Mylar sleeves, which moved freely overthe PVC structures. Chambers were constructed as non-steady-state,nonvented flowthrough systems where air inside the chambers was cycledthrough a fast greenhouse gas analyzer (FGGA; Los Gatos Research Inc.)to measure CH4 concentration at a frequency of 1 Hz. Each site wasequipped with one FGGA, and a manifold alternated air samples betweenthe two chambers in 1-min intervals for 16 min at the beginning of eachhour, generating eight 1-min intervals from each chamber. Prior to thefirst measurement in each hour, the Mylar sleeves were lowered, allowinga short period (usually less than a minute) for the chamber environmentto equilibrate. The sleeves then remained lowered and maintained consis-tent contact with the water surface for the duration of the 16-min mea-surement period. Between each 1-min interval, ambient atmospheric airwas cycled through the FGGA to provide a clear reference delimiting thetwo chambers at each site. At the end of each 16-min sampling period,sleeves were raised and the chambers remained open until the next hour.Within each 1-min interval, concentrations (parts per million) wereconverted to number of moles using the ideal gas law and fluxes werethen calculated as a change in GHG mass per square meter of coveredarea versus time. As CH4 flux exhibited a diurnal pattern with peaksaround midmorning to noon (data not shown), the results from theeight intervals during the 16-min period at noon in two consecutivedays from the two replicate chambers were averaged to indicate noonflux for each site.
Microbial Communities in a Restored Wetland
May/June 2015 Volume 6 Issue 3 e00066-15 ® mbio.asm.org 11
m
bio.asm.org
on May 27, 2015 - P
ublished by m
bio.asm.org
Dow
nloaded from

DNA extraction. About 1.5 g of peat sample (by wet weight) was usedin each DNA extraction. Phosphate-buffered saline solution (PBS; 1�,pH 7.2) was added to each sample and vigorously mixed at the maximalspeed on a Vortex-Genie 2 vortex (USA Scientific, Inc., Orlando, FL) for atleast 5 min to elute microbial biomass from plant tissues or detritus. Largepieces of plant material were removed with pipette tips, and the remainingcell suspension was transferred to a new tube and centrifuged at 5,000 � gat 4°C for 5 min to collect cell pellets. DNA was extracted from cell pelletsby using the PowerLyzer PowerSoil DNA isolation kit (Mo Bio Laborato-ries, Inc., Carlsbad, CA) according to the manufacturer’s instructions.Duplicate DNA extractions were performed on each sample, and bothduplicates were individually used for 16S rRNA gene sequencing. Formetagenome sequencing, multiple DNA extractions were performed foreach sample and pooled to obtain sufficient DNA for shotgun libraryconstruction.
16S rRNA gene sequencing and microbial community analysis. Py-rosequencing of PCR-amplified V8 regions of 16S rRNA genes was used togenerate microbial community profiles. The 454 adaptor-added 16SrRNA gene primer set, 926Fw (5= to 3=, AAACTYAAAKGAATTGRCGG)and 1392R (5= to 3=, ACGGGCGGTGTGTRC), was used to amplify theV6-V8 region, with 5-bp bar codes incorporated into the reverse primer toallow sample multiplexing. PCR amplicons were sequenced by the DOEJoint Genome Institute, using the Roche 454 GS FLX titanium technologyas previously described (60). Sequences were analyzed through the Pyro-Tagger computational pipeline (http://pyrotagger.jgi-psf.org) for se-quence trimming, clustering into operational taxonomic units (OTUs)based on 97% sequence identity, and taxonomic assignment by BLASTnagainst the Greengenes database (61). For sequence trimming with Pyro-Tagger, based on the per-base sequence quality graph, quality scores didnot start to drop until after the first 200 bases, and therefore, we trimmedall sequences to a uniform length to contain only the first 200 bases.Singletons and potential chimeras were removed to minimize the impactof PCR artifacts. This primer set amplifies 16S rRNA sequences from mostbacteria and archaea as well as 18S rRNA sequences from eukaryotes;eukaryote sequences, both nuclear and organelle, made up 0.1% to 48.5%of reads per sample and were excluded from downstream analysis. Tocalculate alpha diversity, we used the R “phyloseq” package to rarefy allsamples to the size of the smallest data set, 1,738 sequences, before calcu-lating the Shannon diversity index. For beta diversity, nonmetric multi-dimensional scaling (NMDS) analysis was conducted using the softwarepackage PRIMER (v6.1.9), with a Bray-Curtis similarity matrix based onthe relative abundance of OTUs. Analysis of similarities (ANOSIM) wasused to assess the community composition differences among the classi-fied sample groups. The ANOSIM R statistic value of “0” indicates com-pletely random grouping, and “1” indicates a complete separation amongsample groups. In addition, permutation multivariate analysis of vari-ance (PerMANOVA) was also performed to evaluate statistical signif-icance of differences among classified sample groups using the R“vegan” package, with Bray-Curtis distance and 1,000 permutations.OTUs that contributed to �0.1% of the dissimilarity between twosample groups were identified by the similarity percent (SIMPER) test.Student t tests were performed on these identified OTUs to determinethe statistically over- or underrepresented (P value of �0.05) OTUsbetween the two groups of samples. Correspondence analysis was alsoconducted to study community composition patterns and the corre-lation with environmental variables using Canoco for Windows(v4.5.3). In addition, Spearman correlation was generated betweeneach pair of OTUs based on their relative abundance among all sam-ples, with P values adjusted using the false discovery rate (FDR)(Benjamini-Hochberg) method (62) for multiple hypothesis testingusing the R “Hmisc” package, and the correlation matrix was used fornetwork analysis with Cytoscape (v3.0.2).
Metagenome sequencing, assembly, and annotation. For metag-enomic analysis, we selected a total of 11 representative samples collectedin February, including a spectrum of sample sites and types. Shotgun
libraries were constructed with insert sizes of ~250 bp and sequenced onthe Illumina HiSeq 2000 platform to generate paired-end (2 � 150-bp)reads. One lane of HiSeq sequences was generated for each library, withraw sequence yields of 50 to 60 Gbp from each lane. Raw reads weretrimmed using a minimum quality cutoff of Q10 and assembled largely asdescribed in the work of Scholz et al. (63). Trimmed, paired-end readsfrom each sample were first assembled using SOAPdenovo v1.05 (http://soap.genomics.org.cn/soapdenovo.html) with default settings (– d 1 and–R) at different kmer sizes (85, 89, 93, 97, 101, and 105, respectively).Contigs generated by each assembly (a total of six contig sets from the sixkmer sizes) were merged using in-house Perl scripts as following. Contigswere first dereplicated and sorted into two pools based on length. Contigsof �1,800 bp were assembled using Newbler (Life Technologies, Carls-bad, CA) to generate larger contigs (-tr, -rip, -mi 98, -ml 80). All assem-bled contigs of �1,800 bp, as well as the contigs generated from the New-bler assembly, were combined and merged using minimus2 (-DMINID�98 -D OVERLAP�80) (AMOS: http://sourceforge.net/projects/amos). The average fold coverage (or read depth) of each contig wasestimated by mapping all reads back to the final assembly using BWA(v1.2.2) (64). The metagenome sequences, including both assembled con-tigs and reads not mapped to the assembly (i.e., unassembled reads), wereuploaded to the Integrated Microbial Genomes with Microbiomes(IMG/M) database (img.jgi.doe.gov/m) for gene prediction and func-tional annotation (65). The IMG/M taxon identifiers (IDs) are3300000030, 3300000090, 3300000091, 3300000092, 3300000093,3300000094, 3300000100, 3300000108, 3300000786, 3300000854, and3300000894 for the 11 metagenomes, respectively. The average read depthfor each contig was also uploaded to IMG/M as an estimator of the abun-dance of the population from which the contig was derived.
Metagenome comparison. We used gene-centric analysis of shotgunmetagenome data to reveal differences in community functional profiles(66). We compared metagenomes based on the functional unit of COGsand on Pfams in cases where COGs were not available or not specific for afunction. The abundance of a functional gene family was estimated by thenumber of recovered genes belonging to this gene family adjusted (mul-tiplied) by the average read depth of the corresponding contig to accountfor the population abundance. To compare among all metagenomes, weformed a combined average metagenome from the 11 metagenomes as acommon reference. The odds ratio of a COG (or Pfam) between an indi-vidual metagenome and the combined average metagenome was used tocompare gene abundance across samples.
Phylogenetic tree construction. Multiple sequence alignment wasgenerated with MUSCLE (67). A maximum likelihood phylogenetic treewas constructed using PhyML 3.0 (68), with the LG substitution model(69) and gamma distribution parameter estimated by PhyML. Bootstrapvalues were calculated based on 100 replicas. The tree was visualized withDendroscope (v3.2.10) with midpoint root.
Estimation of relative abundance of functional populations. Theabundance of a functional population was estimated by marker genesin the corresponding pathway, and the total microbial community wasestimated by the average from a total of 37 COGs representing single-copy housekeeping genes. Because the detection frequency of a gene ishighly dependent on its expected full length, especially in short readdata, we performed normalization on COG or Pfam gene abundanceby its expected full length (the consensus length of a COG or theaverage domain length for a Pfam). The length-normalized abundanceof a functional marker gene family was then compared against theaverage of length-normalized abundance of the 37 housekeepingCOGs to approximate the percentage of genomes possessing that func-tion (i.e., relative abundance of a functional population). Method de-tails and relevant discussion are available in Text S1 in the supplemen-tal material.
Nucleotide sequence accession numbers. Raw sequence reads of theV8 regions of 16S rRNA genes were submitted to the Sequence ReadArchive (SRA) under accession no. SRP003022. Raw sequence reads for
He et al.
12 ® mbio.asm.org May/June 2015 Volume 6 Issue 3 e00066-15
m
bio.asm.org
on May 27, 2015 - P
ublished by m
bio.asm.org
Dow
nloaded from

metagenomes were submitted to the SRA with accession numbersSRP010671, SRP010730, SRP010738, SRP010741, SRP010747,SRP010748, SRP010751, SRP010862, SRP010870, and SRP011309.
SUPPLEMENTAL MATERIALSupplemental material for this article may be found at http://mbio.asm.org/lookup/suppl/doi:10.1128/mBio.00066-15/-/DCSupplemental.
Text S1, DOCX file, 1.8 MB.Figure S1, PDF file, 0.5 MB.Figure S2, PDF file, 0.1 MB.Figure S3, PDF file, 0.2 MB.Figure S4, PDF file, 0.2 MB.Figure S5, PDF file, 2.4 MB.Figure S6, PDF file, 0.2 MB.Figure S7, PDF file, 0.2 MB.Table S1, PDF file, 0.1 MB.Table S2, PDF file, 0.8 MB.
ACKNOWLEDGMENTS
We thank the production and sequence analysis teams at JGI for sequenc-ing and bioinformatic support; Scott Clingenpeel at JGI, Maggi Kelly,Sarah Lewis, and Lisa Schile at University of California, Berkeley, andKristin Byrd at U.S. Geological Survey for help with sample collection;USGS staff support, including Travis von Dessonneck and Kathryn Keat-ing, for GHG data collection and interpretation over 24-h periods; AprilVan Hise at LBNL for pore water analyses; Shane Canon at NERSC forassistance with annotation; and Trina McMahon at University of Wiscon-sin Madison for feedback on the manuscript.
This project was funded by the DOE Early Career Research Program,grant no. KP/CH57/1; the DOE JGI Community Sequencing Program;and the USGS Climate and Land Use Change Program. The work con-ducted by the U.S. Department of Energy Joint Genome Institute is sup-ported by the Office of Science of the U.S. Department of Energy undercontract no. DE-AC02-05CH11231.
The authors declare no conflict of interest.
REFERENCES1. Mitsch WJ, Gosselink JG. 2007. Wetlands, 4th ed. John Wiley & Sons,
Hoboken, NJ.2. Mitsch WJ, Bernal B, Nahlik AM, Mander Ul, Zhang L, Anderson CJ,
Jørgensen SE, Brix H. 2013. Wetlands, carbon, and climate change. Land-scape Ecol 28:583–597. http://dx.doi.org/10.1007/s10980-012-9758-8.
3. Sleeter BM, Sohl TL, Loveland TR, Auch RF, Acevedo W, DrummondMA, Sayler KL, Stehman SV. 2013. Land-cover change in the contermi-nous United States from 1973 to 2000. Glob Environ Change 23:733–748.http://dx.doi.org/10.1016/j.gloenvcha.2013.03.006.
4. Thompson J. 1957. The settlement geography of the Sacramento-SanJoaquín Delta, California. Ph.D. thesis. Stanford University, Stanford, CA.
5. Deverel SJ, Rojstaczer S. 1996. Subsidence of agricultural lands in theSacramento-San Joaquín Delta, California: role of aqueous and gaseouscarbon fluxes. Water Resour Res 32:2359 –2367. http://dx.doi.org/10.1029/96WR01338.
6. Drexler JZ, Fontaine CS, Deverel SJ. 2009. The legacy of wetland drain-age on the remaining peat in the Sacramento-San Joaquín Delta, Califor-nia, USA. Wetlands 29:372–386. http://dx.doi.org/10.1672/08-97.1.
7. Miller RL, Fram MS, Fujii R, Wheeler G. 2008. Subsidence reversal in are-established wetland in the Sacramento-San Joaquín Delta, California,USA. San Francisco Estuary Watershed Sci 6:1–20. http://escholarship.org/uc/item/5j76502x
8. Denman KL, Brasseur G, Chidthaisong A, Ciais P, Cox PM, DickinsonRE, Hauglustaine D, Heinze C, Holland E, Jacob D, Lohmann U,Ramachandran S, Dias PLDS, Wofsy SC, Zhang X. 2007. Couplingsbetween changes in the climate system and biogeochemistry, p 499 –587.In Solomon S, Qin D, Manning M, Chen Z, Marquis M, Averyt KB, TignorM, Miller HL. (ed), Climate change 2007: the physical science basis. Con-tribution of Working Group I to the Fourth Assessment Report of theIntergovernmental Panel on Climate Change. Cambridge UniversityPress, Cambridge, United Kingdom.
9. Whiting GJ, Chanton JP. 2001. Greenhouse carbon balance of wetlands:
methane emission versus carbon sequestration. Tellus B 53:521–528.http://dx.doi.org/10.1034/j.1600-0889.2001.530501.x.
10. Miller RL. 2011. Carbon gas fluxes in re-established wetlands on organicsoils differ relative to plant community and hydrology. Wetlands 31:1055–1066. http://dx.doi.org/10.1007/s13157-011-0215-2.
11. Kayranli B, Scholz M, Mustafa A, Hedmark Å. 2010. Carbon storage andfluxes within freshwater wetlands: a critical review. Wetlands 30:111–124.http://dx.doi.org/10.1007/s13157-009-0003-4.
12. Laanbroek HJ. 2010. Methane emission from natural wetlands: interplaybetween emergent macrophytes and soil microbial processes. A mini-review. Ann Bot 105:141–153. http://dx.doi.org/10.1093/aob/mcp201.
13. Le Mer J, Roger JP. 2001. Production, oxidation, emission and consump-tion of methane by soils: a review. Eur J Soil Biol 37:25–50. http://dx.doi.org/10.1016/S1164-5563(01)01067-6.
14. Bridgham SD, Cadillo-Quiroz H, Keller JK, Zhuang Q. 2013. Methaneemissions from wetlands: biogeochemical, microbial, and modeling per-spectives from local to global scales. Glob Chang Biol 19:1325–1346.http://dx.doi.org/10.1111/gcb.12131.
15. Carpenter K, Snyder D, Duff J, Triska F, Lee K, Avanzino R, Sobieszc-zyk S. 2009. Hydrologic and water-quality conditions during restorationof the Wood River wetland, upper Klamath River Basin, Oregon, 2003– 05:U.S. Geological Survey Scientific Investigations Report 2009-5004. U.S.Department of the Interior, U.S. Geological Survey, Reston, VA.
16. Reddy KR, DeLaune RD. 2008. Biogeochemistry of wetlands: science andapplications. CRC Press, Taylor and Francis Group, Boca Raton, FL.
17. Rivière D, Desvignes V, Pelletier E, Chaussonnerie S, Guermazi S,Weissenbach J, Li T, Camacho P, Sghir A. 2009. Towards the definitionof a core of microorganisms involved in anaerobic digestion of sludge.ISME J 3:700 –714. http://dx.doi.org/10.1038/ismej.2009.2.
18. Roberts DG, McComb AJ. 1984. The structure and continuity of thelacunar system of the seagrass Halophila ovalis (R. Br.) Hook f. (Hydro-charitaceae). Aquat Bot 18:377–388.
19. Caffrey JM, Kemp WM. 1991. Seasonal and spatial patterns of oxygenproduction, respiration and root-rhizome release in Potamogeton perfolia-tus L. and Zostera marina L. Aquat Bot 40:109 –128. http://dx.doi.org/10.1016/0304-3770(91)90090-R.
20. Walker TS, Bais HP, Grotewold E, Vivanco JM. 2003. Root exudationand rhizosphere biology. Plant Physiol 132:44 –51. http://dx.doi.org/10.1104/pp.102.019661.
21. Ström L, Ekberg A, Mastepanov M, Røjle Christensen T. 2003. Theeffect of vascular plants on carbon turnover and methane emissions froma tundra wetland. Glob Change Biol 9:1185–1192. http://dx.doi.org/10.1046/j.1365-2486.2003.00655.x.
22. Bais HP, Weir TL, Perry LG, Gilroy S, Vivanco JM. 2006. The role ofroot exudates in rhizosphere interactions with plants and other organ-isms. Annu Rev Plant Biol 57:233–266. http://dx.doi.org/10.1146/annurev.arplant.57.032905.105159.
23. Liu Y, Whitman WB. 2008. Metabolic, phylogenetic, and ecological di-versity of the methanogenic archaea. Ann N Y Acad Sci 1125:171–189.http://dx.doi.org/10.1196/annals.1419.019.
24. Bräuer SL, Cadillo-Quiroz H, Ward RJ, Yavitt JB, Zinder SH. 2011.Methanoregula boonei gen. nov., sp. nov., an acidiphilic methanogen iso-lated from an acidic peat bog. Int J Syst Evol Microbiol 61:45–52. http://dx.doi.org/10.1099/ijs.0.021782-0.
25. Yashiro Y, Sakai S, Ehara M, Miyazaki M, Yamaguchi T, Imachi H.2011. Methanoregula formicica sp. nov., a methane-producing archaeonisolated from methanogenic sludge. Int J Syst Evol Microbiol 61:53–59.http://dx.doi.org/10.1099/ijs.0.014811-0.
26. Jetten M, Stams AJM, Zehnder AJB. 1992. Methanogenesis from acetate:a comparison of the acetate metabolism in Methanothrix soehngenii andMethanosarcina spp. FEMS Microbiol Lett 88:181–198. http://dx.doi.org/10.1016/0378-1097(92)90802-U.
27. Castro HF, Williams NH, Ogram A. 2000. Phylogeny of sulfate-reducingbacteria1. FEMS Microbiol Ecol 31:1–9.
28. Hoor AT-T. 1975. A new type of thiosulphate oxidizing, nitrate reducingmicroorganism: Thiomicrospira denitrificans sp. nov. Neth J Sea Res9:344 –350.
29. Beller HR, Chain PS, Letain TE, Chakicherla A, Larimer FW, Richard-son PM, Coleman MA, Wood AP, Kelly DP. 2006. The genome sequenceof the obligately chemolithoautotrophic, facultatively anaerobic bacte-rium Thiobacillus denitrificans. J Bacteriol 188:1473–1488. http://dx.doi.org/10.1128/JB.188.4.1473-1488.2006.
30. Lovley DR, Ueki T, Zhang T, Malvankar NS, Shrestha PM, Flanagan
Microbial Communities in a Restored Wetland
May/June 2015 Volume 6 Issue 3 e00066-15 ® mbio.asm.org 13
m
bio.asm.org
on May 27, 2015 - P
ublished by m
bio.asm.org
Dow
nloaded from
KA, Aklujkar M, Butler JE, Giloteaux L, Rotaru A.-E, Holmes DE,Franks AE, Orellana R, Risso C, Nevin KP, Robert KP. 2011. Geobacter:the microbe electric’s physiology, ecology, and practical applications. AdvMicrob Physiol 59:1–100. http://dx.doi.org/10.1016/B978-0-12-387661-4.00004-5.
31. Hanson RS, Hanson TE. 1996. Methanotrophic bacteria. Microbiol Rev60:439 – 471.
32. McDonald IR, Bodrossy L, Chen Y, Murrell JC. 2008. Molecular ecologytechniques for the study of aerobic methanotrophs. Appl Environ Micro-biol 74:1305–1315. http://dx.doi.org/10.1128/AEM.02233-07.
33. Cadillo-Quiroz H, Yavitt JB, Zinder SH, Thies JE. 2010. Diversity andcommunity structure of archaea inhabiting the rhizoplane of two con-trasting plants from an acidic bog. Microb Ecol 59:757–767. http://dx.doi.org/10.1007/s00248-009-9628-3.
34. Kiener A, Leisinger T. 1983. Oxygen sensitivity of methanogenic bacteria.Syst Appl Microbiol 4:305–312. http://dx.doi.org/10.1016/S0723-2020(83)80017-4.
35. Angel R, Matthies D, Conrad R. 2011. Activation of methanogenesis inarid biological soil crusts despite the presence of oxygen. PLoS One6:e20453. http://dx.doi.org/10.1371/journal.pone.0020453.
36. Grosskopf R, Stubner S, Liesack W. 1998. Novel euryarchaeotal lineagesdetected on rice roots and in the anoxic bulk soil of flooded rice micro-cosms. Appl Environ Microbiol 64:4983– 4989.
37. Hershberger KL, Barns SM, Reysenbach A.-L, Dawson SC, Pace NR.1996. Wide diversity of Crenarchaeota. Nature 384:420. http://dx.doi.org/10.1038/384420a0.
38. Sekiguchi Y. 2006. Yet-to-be cultured microorganisms relevant to meth-ane fermentation processes. Microb Environ 21:1–15. http://dx.doi.org/10.1264/jsme2.21.1.
39. Philippot L, Hallin S, Börjesson G, Baggs EM. 2009. Biochemical cyclingin the rhizosphere having an impact on global change. Plant Soil 321:61– 81. http://dx.doi.org/10.1007/s11104-008-9796-9.
40. Chanton JP, Whiting GJ, Blair NE, Lindau CW, Bollich PK. 1997.Methane emission from rice: stable isotopes, diurnal variations, and CO2
exchange. Global Biogeochem Cycles 11:15–27. http://dx.doi.org/10.1029/96GB03761.
41. Schütz H, Seiler W, Conrad R. 1989. Processes involved in formation andemission of methane in rice paddies. Biogeochemistry 7:33–53. http://dx.doi.org/10.1007/BF00000896.
42. Logares R, Sunagawa S, Salazar G, Cornejo-Castillo FM, Ferrera I,Sarmento H, Hingamp P, Ogata H, de Vargas C, Lima-Mendez G, RaesJ, Poulain J, Jaillon O, Wincker P, Kandels-Lewis S, Karsenti E, Bork P,Acinas SG. 2014. Metagenomic 16S rDNA Illumina tags are a powerfulalternative to amplicon sequencing to explore diversity and structure ofmicrobial communities. Environ Microbiol 16:2659 –2671. http://dx.doi.org/10.1111/1462-2920.12250.
43. Bowman JP, Sly LI, Nichols PD, Hayward AC. 1993. Revised taxonomyof the methanotrophs: description of Methylobacter gen. nov., emendationof Methylococcus, validation of Methylosinus and Methylocystis species, anda proposal that the family Methylococcaceae includes only the group Imethanotrophs. Int J Syst Bacteriol 43:735–753.
44. Dunfield PF, Yuryev A, Senin P, Smirnova AV, Stott MB, Hou S, Ly B,Saw JH, Zhou Z, Ren Y, Wang J, Mountain BW, Crowe MA, WeatherbyTM, Bodelier PL, Liesack W, Feng L, Wang L, Alam M. 2007. Methaneoxidation by an extremely acidophilic bacterium of the phylum Verruco-microbia. Nature 450:879 – 882. http://dx.doi.org/10.1038/nature06411.
45. Ettwig KF, Butler MK, Le Paslier D, Pelletier E, Mangenot S, KuypersMM, Schreiber F, Dutilh BE, Zedelius J, de Beer D, Gloerich J, WesselsHJ, van Alen T, Luesken F, Wu ML, van de Pas-Schoonen KT, Op denCamp HJ, Janssen-Megens EM, Francoijs KJ, Stunnenberg H, Weissen-bach J, Jetten MS, Strous M. 2010. Nitrite-driven anaerobic methaneoxidation by oxygenic bacteria. Nature 464:543–548. http://dx.doi.org/10.1038/nature08883.
46. Theisen AR, Ali MH, Radajewski S, Dumont MG, Dunfield PF, Mc-Donald IR, Dedysh SN, Miguez CB, Murrell JC. 2005. Regulation ofmethane oxidation in the facultative methanotroph Methylocella silvestrisBL2. Mol Microbiol 58:682– 692. http://dx.doi.org/10.1111/j.1365-2958.2005.04861.x.
47. Tavormina PL, Orphan VJ, Kalyuzhnaya MG, Jetten MS, Klotz MG.2011. A novel family of functional operons encoding methane/ammoniamonooxygenase-related proteins in gammaproteobacterial metha-notrophs. Environ Microbiol Rep 3:91–100. http://dx.doi.org/10.1111/j.1758-2229.2010.00192.x.
48. Baani M, Liesack W. 2008. Two isozymes of particulate methane mono-oxygenase with different methane oxidation kinetics are found in Methy-locystis sp. strain sc2. Proc Natl Acad Sci U S A 105:10203–10208. http://dx.doi.org/10.1073/pnas.0702643105.
49. Beliaev AS, Saffarini DA. 1998. Shewanella putrefaciens mtrB encodes anouter membrane protein required for Fe(III) and Mn(IV) reduction. JBacteriol 180:6292– 6297.
50. Shi L, Squier TC, Zachara JM, Fredrickson JK. 2007. Respiration ofmetal (hydr)oxides by Shewanella and Geobacter: a key role for multihaemc-type cytochromes. Mol Microbiol 65:12–20. http://dx.doi.org/10.1111/j.1365-2958.2007.05783.x.
51. Liu J, Wang Z, Belchik SM, Edwards MJ, Liu C, Kennedy DW, MerkleyED, Lipton MS, Butt JN, Richardson DJ, Zachara JM, Fredrickson JK,Rosso KM, Shi L. 2012. Identification and characterization of MtoA: adecaheme c-type cytochrome of the neutrophilic Fe(II)-oxidizing bacte-rium Sideroxydans lithotrophicus ES-1. Front Microbiol 3:37. http://dx.doi.org/10.3389/fmicb.2012.00037.
52. Thauer RK, Kaster A.-K, Seedorf H, Buckel W, Hedderich R. 2008.Methanogenic archaea: ecologically relevant differences in energy conser-vation. Nat Rev Microbiol 6:579 –591. http://dx.doi.org/10.1038/nrmicro1931.
53. Lovley DR, Klug MJ. 1983. Sulfate reducers can outcompete methano-gens at freshwater sulfate concentrations. Appl Environ Microbiol 45:187–192.
54. Kristjansson JK, Schönheit P. 1983. Why do sulfate-reducing bacteriaoutcompete methanogenic bacteria for substrates? Oecologia 60:264 –266.http://dx.doi.org/10.1007/BF00379530.
55. Roden EE, Wetzel RG. 2003. Competition between Fe(III)-reducing andmethanogenic bacteria for acetate in iron-rich freshwater sediments. Mi-crob Ecol 45:252–258. http://dx.doi.org/10.1007/s00248-002-1037-9.
56. Klüber H, Conrad R. 1998. Effects of nitrate, nitrite, NO and N2O onmethanogenesis and other redox processes in anoxic rice field soil. FEMSMicrobiol Ecol 25:301–318. http://dx.doi.org/10.1016/S0168-6496(98)00011-7.
57. Klüber H, Conrad R. 1998. Inhibitory effects of nitrate, nitrite, NO andN2O on methanogenesis by Methanosarcina barkeri and Methanobacte-rium bryantii. FEMS Microbiol Ecol 25:331–339. http://dx.doi.org/10.1016/S0168-6496(97)00102-5.
58. Miller RL, Fujii R. 2010. Plant community, primary productivity, andenvironmental conditions following wetland re-establishment in theSacramento-San Joaquín Delta, California. Wetlands Ecol Manage 18:1–16. http://dx.doi.org/10.1007/s11273-009-9143-9.
59. Hargis TG, Twilley RR. 1994. Improved coring device for measuring soilbulk-density in a Louisiana deltaic marsh. J Sediment Res 64:681– 683.http://dx.doi.org/10.1306/D4267E60-2B26-11D7-8648000102C1865D.
60. Engelbrektson A, Kunin V, Wrighton KC, Zvenigorodsky N, Chen F,Ochman H, Hugenholtz P. 2010. Experimental factors affecting PCR-based estimates of microbial species richness and evenness. ISME J4:642– 647. http://dx.doi.org/10.1038/ismej.2009.153.
61. Kunin V, Engelbrektson A, Ochman H, Hugenholtz P. 2010. Wrinkles inthe rare biosphere: pyrosequencing errors can lead to artificial inflation ofdiversity estimates. Environ Microbiol 12:118 –123. http://dx.doi.org/10.1111/j.1462-2920.2009.02051.x.
62. Benjamin Y, Hochberg Y. 1995. Controlling the false discovery rate: apractical and powerful approach to multiple testing. J R Stat Soc B (Meth-odol) 57:289 –300.
63. Scholz M, Lo CC, Chain PS. 2014. Improved assemblies using a source-agnostic pipeline for MetaGenomic assembly by merging (MeGAMerge)of contigs. Sci Rep 4:6480. http://dx.doi.org/10.1038/srep06480.
64. Li H, Durbin R. 2009. Fast and accurate short read alignment withBurrows-Wheeler transform. Bioinformatics 25:1754 –1760. http://dx.doi.org/10.1093/bioinformatics/btp324.
65. Markowitz VM, Chen I-MA, Chu K, Szeto E, Palaniappan K, Pillay M,Ratner A, Huang J, Pagani I, Tringe S, Huntemann M, Billis K,Varghese N, Tennessen K, Mavromatis K, Pati A, Ivanova NN, Kyrpi-des NC. 2014. IMG/M 4 version of the integrated metagenome compar-ative analysis system. Nucleic Acids Res 42(D1):D568 –D573. http://dx.doi.org/10.1093/nar/gkt919.
66. Tringe SG, von Mering C, Kobayashi A, Salamov AA, Chen K, ChangHW, Podar M, Short JM, Mathur EJ, Detter JC, Bork P, Hugenholtz P,
He et al.
14 ® mbio.asm.org May/June 2015 Volume 6 Issue 3 e00066-15
m
bio.asm.org
on May 27, 2015 - P
ublished by m
bio.asm.org
Dow
nloaded from

Rubin EM. 2005. Comparative metagenomics of microbial communities.Science 308:554 –557. http://dx.doi.org/10.1126/science.1107851.
67. Edgar RC. 2004. MUSCLE: a multiple sequence alignment method withreduced time and space complexity. BMC Bioinformatics 5:113. http://dx.doi.org/10.1186/1471-2105-5-113.
68. Guindon S, Dufayard JF, Lefort V, Anisimova M, Hordijk W, Gascuel
O. 2010. New algorithms and methods to estimate maximum-likelihoodphylogenies: assessing the performance of PhyML 3.0. Syst Biol 59:307–321. http://dx.doi.org/10.1093/sysbio/syq010.
69. Le SQ, Gascuel O. 2008. An improved general amino acid replacementmatrix. Mol Biol Evol 25:1307–1320. http://dx.doi.org/10.1093/molbev/msn067.
Microbial Communities in a Restored Wetland
May/June 2015 Volume 6 Issue 3 e00066-15 ® mbio.asm.org 15
m
bio.asm.org
on May 27, 2015 - P
ublished by m
bio.asm.org
Dow
nloaded from
Copyright © 2022 FDOKUMEN