Mitigation and recovery of methane emissions from tropical hydroelectric dams
9
Energy 32 (2007) 1038–1046 Mitigation and recovery of methane emissions from tropical hydroelectric dams L.A.W. Bambace, F.M. Ramos , I.B.T. Lima, R.R. Rosa Instituto Nacional de Pesquisas Espaciais (INPE), PO Box 515, 12201-090, Sa˜o Jose´dos Campos, Brazil Abstract Tropical hydroelectric reservoirs generally constitute an appreciable source of methane to the atmosphere. This paper proposes simple mitigation and recovery procedures to substantially reduce atmospheric methane emissions from hydroelectric reservoirs. We aim at transforming existing methane stocks of tropical reservoirs into a clean, renewable energy source. The recovered gas methane may be pumped to large consuming centers, stocked locally and burned in gas turbines to generate electricity during high demand periods, or even purified for transport applications. Our simulations show that the use of biogenic methane may increase considerably the energy supply in countries like Brazil. As a result, it would be possible to reduce the need of additional hydroelectric dams, protecting important pristine biomes, and avoiding the resettlement of villages and indigenous reserves. r 2006 Elsevier Ltd. All rights reserved. Keywords: Methane emissions; Mitigation; Recovery; Spraying; Bubbling; Energy availability 1. Introduction Hydropower is largely used in several countries as a major source of energy. Recently, Fearnside [1] argued that hydroelectric dams, especially in tropical areas, are not as ‘clean’ as previously considered, and present a global role in terms of methane (CH 4 ) emissions and global warming. He showed that large volumes of CH 4 might be released from the water passing through turbines and spillways. In some cases, these emissions can reach up to 70% of the total reservoir emissions, as for Tucuruı´ in the Brazilian Amazon [1]. The cause of this scenario is quite simple but was frequently overlooked in previous estimates of reservoir emissions (see for instance St. Louis et al. [2]). Since, water intakes are located well below the water surface and CH 4 concentration quickly increases with depth, most of the dissolved CH 4 is promptly degassed, due to the sudden pressure drop, as the CH 4 enriched water passes through the turbines. This is more or less what happens when one opens a bottle of a soft drink. Here, we discuss simple and cost-effective engineering solutions for reducing emissions and recovering of CH 4 from hydro- electric dams. In order to put our proposals in a real context, we study the case of the Brazil’s Serra da Mesa Dam, with a reservoir that covers an area of 1784 km 2 and produces 1275 MW of electrical power. Serra da Mesa is located in Goia´s state, in a Savanna (Cerrado) area, on the Tocantins river, a tributary of the Amazon river and by its orographical, and geomorpho- logical characteristics is a good representative of many existing and planned Brazilian hydropower dams. We develop our analysis in a quantitative and qualitative way, pointing to possible mitigation measures and to CH 4 recovery strategies, capable not only to reduce the environmental impact of CH 4 emissions, but also and most important, to transform CH 4 stocks into a clean, renewable energy source. We compare Serra da Mesa results with simulation data from other well-known Brazilian reservoirs, like Tucuruı´ and Itaipu. Our ultimate goal here is to show that, through the use of simple and inexpensive solutions and accurate environmental impact analysis, even during the post-con- struction phase, it is possible to reduce the environmental impact of hydroelectric reservoirs. ARTICLE IN PRESS www.elsevier.com/locate/energy 0360-5442/$ - see front matter r 2006 Elsevier Ltd. All rights reserved. doi:10.1016/j.energy.2006.09.008 Corresponding author. Tel.: +55 12 39456534; fax: +55 12 39456573. E-mail address: [email protected] (F.M. Ramos).
Transcript of Mitigation and recovery of methane emissions from tropical hydroelectric dams

ARTICLE IN PRESS
0360-5442/$ - se
doi:10.1016/j.en
�CorrespondE-mail addr
Energy 32 (2007) 1038–1046
www.elsevier.com/locate/energy
Mitigation and recovery of methane emissions from tropicalhydroelectric dams
L.A.W. Bambace, F.M. Ramos�, I.B.T. Lima, R.R. Rosa
Instituto Nacional de Pesquisas Espaciais (INPE), PO Box 515, 12201-090, Sao Jose dos Campos, Brazil
Abstract
Tropical hydroelectric reservoirs generally constitute an appreciable source of methane to the atmosphere. This paper proposes simple
mitigation and recovery procedures to substantially reduce atmospheric methane emissions from hydroelectric reservoirs. We aim at
transforming existing methane stocks of tropical reservoirs into a clean, renewable energy source. The recovered gas methane may be
pumped to large consuming centers, stocked locally and burned in gas turbines to generate electricity during high demand periods, or
even purified for transport applications. Our simulations show that the use of biogenic methane may increase considerably the energy
supply in countries like Brazil. As a result, it would be possible to reduce the need of additional hydroelectric dams, protecting important
pristine biomes, and avoiding the resettlement of villages and indigenous reserves.
r 2006 Elsevier Ltd. All rights reserved.
Keywords: Methane emissions; Mitigation; Recovery; Spraying; Bubbling; Energy availability
1. Introduction
Hydropower is largely used in several countries as amajor source of energy. Recently, Fearnside [1] argued thathydroelectric dams, especially in tropical areas, are not as‘clean’ as previously considered, and present a global rolein terms of methane (CH4) emissions and global warming.He showed that large volumes of CH4 might be releasedfrom the water passing through turbines and spillways. Insome cases, these emissions can reach up to 70% of thetotal reservoir emissions, as for Tucuruı in the BrazilianAmazon [1]. The cause of this scenario is quite simple butwas frequently overlooked in previous estimates ofreservoir emissions (see for instance St. Louis et al. [2]).Since, water intakes are located well below the watersurface and CH4 concentration quickly increases withdepth, most of the dissolved CH4 is promptly degassed, dueto the sudden pressure drop, as the CH4 enriched waterpasses through the turbines. This is more or less whathappens when one opens a bottle of a soft drink. Here, we
e front matter r 2006 Elsevier Ltd. All rights reserved.
ergy.2006.09.008
ing author. Tel.: +5512 39456534; fax: +55 12 39456573.
ess: [email protected] (F.M. Ramos).
discuss simple and cost-effective engineering solutions forreducing emissions and recovering of CH4 from hydro-electric dams.In order to put our proposals in a real context, we study
the case of the Brazil’s Serra da Mesa Dam, with a reservoirthat covers an area of 1784km2 and produces 1275MW ofelectrical power. Serra da Mesa is located in Goias state, in aSavanna (Cerrado) area, on the Tocantins river, a tributary ofthe Amazon river and by its orographical, and geomorpho-logical characteristics is a good representative of manyexisting and planned Brazilian hydropower dams. Wedevelop our analysis in a quantitative and qualitative way,pointing to possible mitigation measures and to CH4 recoverystrategies, capable not only to reduce the environmentalimpact of CH4 emissions, but also and most important, totransform CH4 stocks into a clean, renewable energy source.We compare Serra da Mesa results with simulation data fromother well-known Brazilian reservoirs, like Tucuruı andItaipu. Our ultimate goal here is to show that, through theuse of simple and inexpensive solutions and accurateenvironmental impact analysis, even during the post-con-struction phase, it is possible to reduce the environmentalimpact of hydroelectric reservoirs.

ARTICLE IN PRESS
Nomenclature
C methane concentrationD methane diffusion coefficient (m2/s)r radius (m)li i-order eigenvalueai i-order Fourier series solution sine coefficientbi i-order Fourier series solution cosine coefficientP methane partial pressure (Pa)R universal gas constant (Pam3K�1mol�1)T absolute temperature (K)H mass transfer coefficient
X molar fractionRd droplet radiusvfall droplet fall velocityRe Reynolds numberrar air densityddroplet droplet diametermar air viscosity
Subscripts
liq liquid phasegas gas phase
L.A.W. Bambace et al. / Energy 32 (2007) 1038–1046 1039
2. The fate of CH4 in tropical hydroelectric dams
Atmospheric CH4 concentration has increased duringthe past centuries basically due to biogenic and pyrogenicanthropogenic emissions [3]. Recent studies have shownthat CH4 emissions from tropical hydroelectric reservoirsmay comprise a non-negligible fraction of the anthropo-genic CH4 [1,2,4]. Hydroelectric reservoirs are classified asland use changes according to the revised IPCC Guidelineson National Inventories (1996) [5], and countries whichpresent large areas covered by reservoirs ought to reduceuncertainties regarding the role of hydropower reservoirs inclimate change and global warming. Note that, per ton ofgas, CH4 has 23 times more impact on global warming thanCO2, considering the 100 years time horizon adopted bythe Kyoto Protocol [6].In general, CH4 emissions from reservoirs and wetlands
depend on a wide range of geographical, geophysical,biochemical and other factors [2,7–9]. CO2 and CH4 areproduced from the decomposition of organic matter. Intropical reservoirs, the main sources of organic matter arethe original vegetation that is flooded, and allocthonousand autochthonous organic matter. Several years after theimpoundment, the original biomass decay is completed,and carbon emissions reach a steady baseline value. At thisstage, the drainage basin absorbs almost the same amountof carbon emitted by the reservoir. Allocthonous organicmatter is the dissolved and particulate organic matterswept from neighboring shores and drainage basins.Autochthonous is the biomass that grows within thereservoir itself. The amount of allocthonous carbon issignificantly larger in reservoirs than in natural waterbodies due to their larger flow rate. CH4 is produced underanaerobic conditions mainly at the bottom of the reservoir,acetate and CO2 reduction being the main methanogenicpathways [10]. CH4 fluxes at the reservoir surface,particularly through bubbling, are smaller in deeper waterbecause they have a higher probability of being oxidizedbefore reaching the water–air interface [11,12]. Large anddeep tropical reservoirs are often thermally stratified,which prevents water mixing and diffusion between deep
and shallow waters. This situation favors a CH4 concen-tration profile that increases rapidly with depth until thelocal saturation level is reached. CH4 concentration profilesmay differ from a reservoir to another, or even within thesame reservoir. This variability depends on the amount offlooded organic matter, allochthonous inputs and waterredox conditions. Reservoir secondary branches havesmaller flow rates than the main channel and thus, havehigher CH4 concentration levels. According to Lima et al.[13], CH4 concentrations and fluxes to the atmosphere arebigger in tributaries than in the main channel. CH4
concentrations also fluctuate over time in a way thatcorrelates with the variations in climate and weathervariables such as temperature and precipitation [14,15].In order to evaluate the economic impact of CH4
mitigation and recovery systems, we considered Serra daMesa as an illustrative case. We also compare Serra daMesa results with simulation data from two other well-known Brazilian reservoirs, Tucuruı and Itaipu. All threeare reservoirs where the rapid decay of soft plant parts fromthe original watershed vegetation cover is now probablycomplete. The potential CH4 production of a reservoir has alower limit equal to the total amount of all kinds of itsemissions. To calculate this limit, one needs direct data onsurface emissions and on the total water flow rate throughthe turbines and spillways. Tucuruı surface emissions weretaken from [14]. Itaipu and Serra da Mesa surface emissionswere estimated considering data given in [16]. Serra daMesa spillway mass rate was set to zero, given theuncertainties related to this figure. The mean surfaceemissions are computed by multiplying the reservoir areaby the mean diffusive and bubbling surface emissions. Forcomputing the amount of CH4 degassed by turbines andspillways, we used the CH4 concentration profile in themain flow channel of the reservoir. For Tucuruı and Itaipu,we used concentration profiles adapted from [1], with aslope proportional to the respective total surface emissions.This choice embodies the assumption of stratification with anegligible CH4 concentration above the thermocline, atabout 10m depth, and a linear CH4 rise below 10m, at arate of 0.375 g/m3, for Tucuruı, and 0.036 g/m3, for Itaipu.
ARTICLE IN PRESSL.A.W. Bambace et al. / Energy 32 (2007) 1038–10461040
For Serra da Mesa, we used a single profile measured nearthe turbine intakes on March 2005. This profile is welldescribed by the power function, ½CH4� ¼ 2:2� 10�5z3:16,where [CH4] is the CH4 content in g/m
3 and z the depth inmeters. Tucuruı has a circular turbine intake with adiameter of 17.1m, located at 35.4m [1]. Tucuruı spillwayintake height is 6.5m, with its bottom located 20m belowthe water surface. Itaipu has a circular turbine intake with adiameter of 18m, located at 27m depth. Itaipu spillwaybottom is located 20m below the water surface. In Serra daMesa, the water goes to the turbines through an 18m highrectangular channel. The channel bottom is at 61.6m depth.Serra da Mesa spillway is located 23m below the surfaceand its intake height is 7m.To integrate, the CH4 fluxes for a given flow rate at the
turbines and spillways intakes, two assumptions weremade. First, the water speed at the intake is constant;and second, the channel CH4 concentration profiles remainunchanged in time at the intakes. Tucuruı turbine andspillway flow rates are, respectively, 3600 and 7600m3/s[1,4]. For Itaipu, which is a ‘‘run of the river’’ type plant,we considered a turbine average flow rate of 9920m3/s,corresponding to an average power production of11,000MW [17]. We also adopted, an average spillwayflow rate of 1880m3/s. In Serra da Mesa, the water flows byturbine bypasses during low energy demand periods andspillways are seldom opened. Thus, we adopted for itsturbines the nominal flow rate of 1080m3/s. Estimatedannual reservoir emission results are presented in Table 1.Note that these results only consider the CH4 emitted bythe reservoirs, and not its production, which is muchlarger. For the Tucuruı case, the calculated annualemissions for the turbines and the spillway (1.67Tg/y) arein good agreement with the value of 1.34 Tg/y estimated in[1,4]. The difference between the former estimates [1,4] andthe present one is probably due to the use of differentintegration schemes (here we used a actual CH4 profileinstead of considering mean values).CH4 has a combustion heat of 55.675MJ/kg. Thus, a
CH4 production of 1Tg/y corresponds to an equivalentannual power production of 1760MW. Assuming, the useof a spray CH4 recovery system with 60% efficiency (seeTable 2) and a typical 40% joint efficiency for a big gasturbine and its generator [18], it is possible to produce423MW for each Tg of CH4, which is equivalent to3711GWh of electric energy. To evaluate economic impact
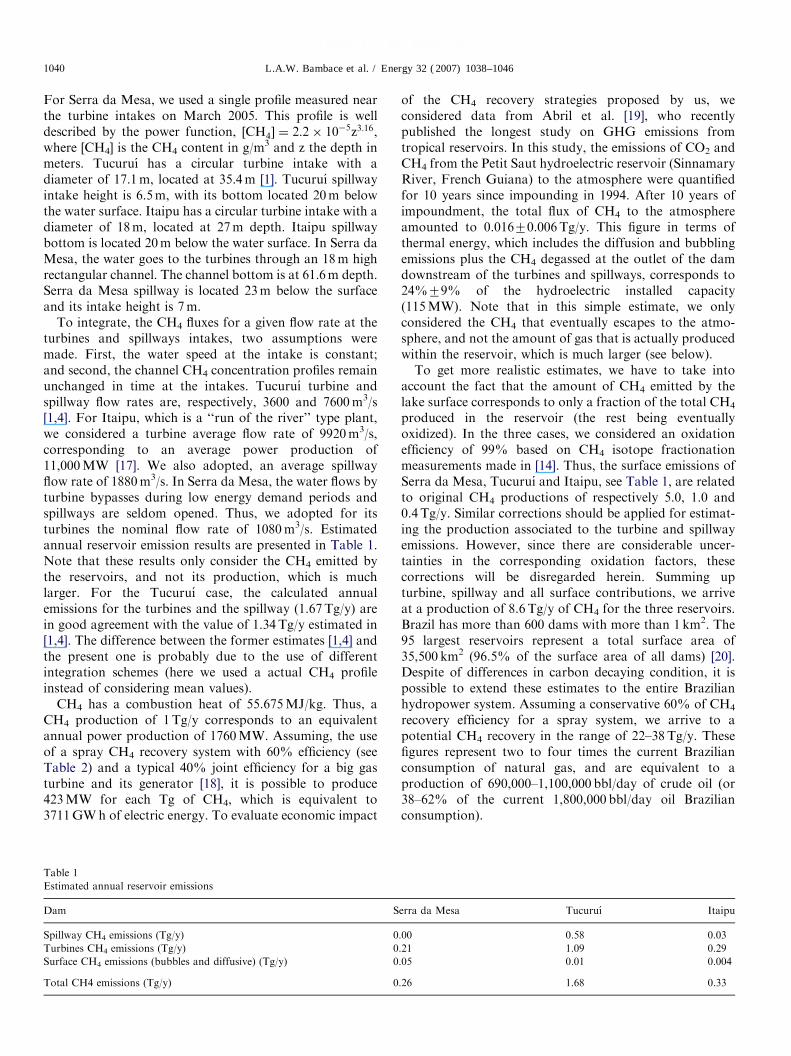
Table 1
Estimated annual reservoir emissions
Dam S
Spillway CH4 emissions (Tg/y) 0
Turbines CH4 emissions (Tg/y) 0
Surface CH4 emissions (bubbles and diffusive) (Tg/y) 0
Total CH4 emissions (Tg/y) 0
of the CH4 recovery strategies proposed by us, weconsidered data from Abril et al. [19], who recentlypublished the longest study on GHG emissions fromtropical reservoirs. In this study, the emissions of CO2 andCH4 from the Petit Saut hydroelectric reservoir (SinnamaryRiver, French Guiana) to the atmosphere were quantifiedfor 10 years since impounding in 1994. After 10 years ofimpoundment, the total flux of CH4 to the atmosphereamounted to 0.01670.006Tg/y. This figure in terms ofthermal energy, which includes the diffusion and bubblingemissions plus the CH4 degassed at the outlet of the damdownstream of the turbines and spillways, corresponds to24%79% of the hydroelectric installed capacity(115MW). Note that in this simple estimate, we onlyconsidered the CH4 that eventually escapes to the atmo-sphere, and not the amount of gas that is actually producedwithin the reservoir, which is much larger (see below).To get more realistic estimates, we have to take into
account the fact that the amount of CH4 emitted by thelake surface corresponds to only a fraction of the total CH4
produced in the reservoir (the rest being eventuallyoxidized). In the three cases, we considered an oxidationefficiency of 99% based on CH4 isotope fractionationmeasurements made in [14]. Thus, the surface emissions ofSerra da Mesa, Tucuruı and Itaipu, see Table 1, are relatedto original CH4 productions of respectively 5.0, 1.0 and0.4 Tg/y. Similar corrections should be applied for estimat-ing the production associated to the turbine and spillwayemissions. However, since there are considerable uncer-tainties in the corresponding oxidation factors, thesecorrections will be disregarded herein. Summing upturbine, spillway and all surface contributions, we arriveat a production of 8.6 Tg/y of CH4 for the three reservoirs.Brazil has more than 600 dams with more than 1 km2. The95 largest reservoirs represent a total surface area of35,500 km2 (96.5% of the surface area of all dams) [20].Despite of differences in carbon decaying condition, it ispossible to extend these estimates to the entire Brazilianhydropower system. Assuming a conservative 60% of CH4
recovery efficiency for a spray system, we arrive to apotential CH4 recovery in the range of 22–38Tg/y. Thesefigures represent two to four times the current Brazilianconsumption of natural gas, and are equivalent to aproduction of 690,000–1,100,000 bbl/day of crude oil (or38–62% of the current 1,800,000 bbl/day oil Brazilianconsumption).
erra da Mesa Tucuruı Itaipu
.00 0.58 0.03
.21 1.09 0.29
.05 0.01 0.004
.26 1.68 0.33

ARTICLE IN PRESS
Table 2
Performance of a 200m3/s impact spraying recovery system as described in Fig. 4
Recovery time (s) 1 3 1 3 2 5
Droplet diameter (mm) 0.12 0.12 0.2 0.2 0.4 0.4
Drag coefficient 12.16 12.16 4.49 4.49 1.71 1.71
Droplet peak fall speed (m/s) 0.33 0.33 0.7 0.7 1.61 1.61
Nominal fall height (m) 0.33 1.99 1.7 2.11 3.22 3.04
Vessel diameter (m) 72.81 72.81 51.28 51.28 35.41 35.41
Separated gas available power (MW) 156.82 162.21 121.96 158.01 89.44 131.95
1.7% efficiency spray system power (kW) 42,941.18 42,941.18 25,764.71 25,764.71 12,882.35 12,882.35
Pumping power (kW) 2213 2213 1328 1328 564 564
Liquid power with gas-turbine drive (kW) 62,746.8 68,139.8 65,512.86 101,570.86 61,430.76 103,932.76
Fraction of water methane degassed (%) 93 96 72 93 53 78
Real recovery fraction (%) 37.2 40.32 38.88 59.52 36.57 61.62
Vessel pressure (bar) 1 1 1 1 1 1
Gross CH4 extraction (kg/s) 2.83 2.93 2.2 2.85 1.61 2.38
Net CH4 recovery (kg/s) 1.13 1.23 1.19 1.82 1.11 1.88
Fig. 1. The concept of metal box and sliding plate CH4 emission mitigation system for turbine intakes.
L.A.W. Bambace et al. / Energy 32 (2007) 1038–1046 1041
3. Mitigation and CH4 recovery systems
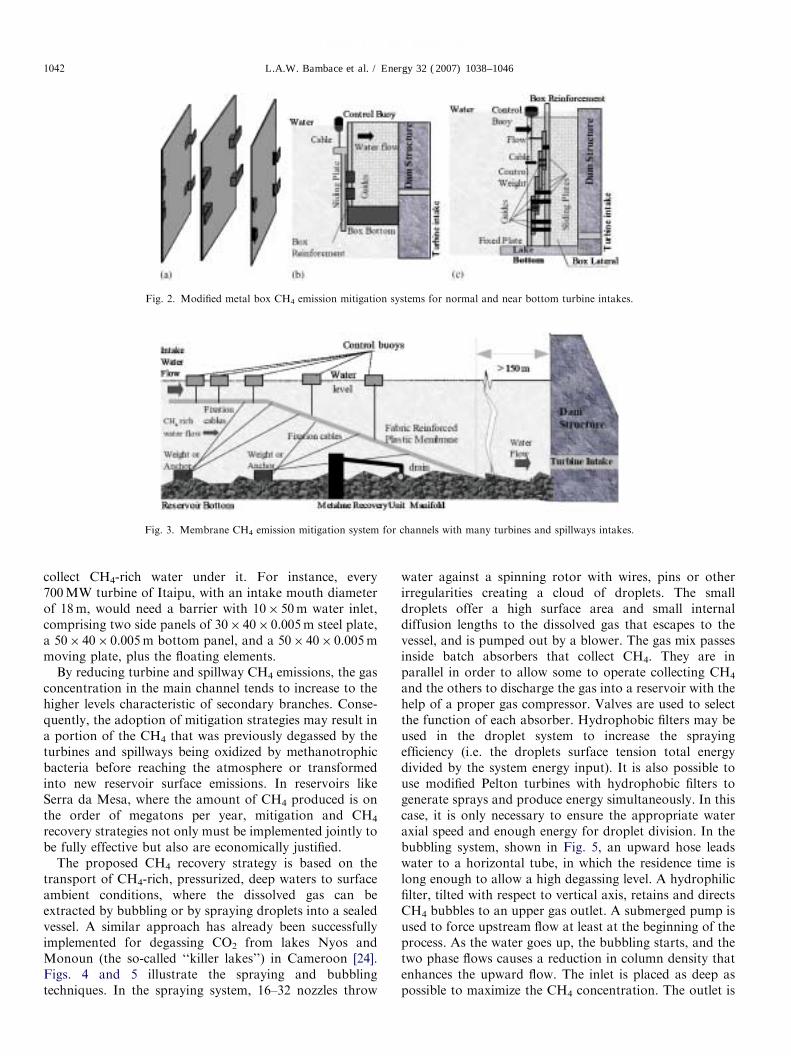
The main cause of the large CH4 emissions from tropicalreservoirs like Tucuruı is the fact that the water intakes ofspillway and turbines are located relatively deep inside thewater body, at depths where CH4 bacterial oxidation is farfrom its completion. As a result, water passing in turbinesand spillways is CH4 enriched, and large amounts of thisgas are degassed to the atmosphere as the pressure drops.The vertical position of the turbine intake is specifiedregarding solely the risk of water shortage in dry periods.In several dams, spillways are used to control wateroutflow during periods of low energy demand. Taking as abasic premise that engineering solutions to CH4 emissionsshould not imply major modifications of the alreadyexisting energy-producing infrastructure, it is clear thatany simple and cost-effective mitigation strategy must bebased on ensuring that only shallow, CH4-depleted watersreach the intakes of the turbines and spillways. This can beachieved by using light metal structures or even membranesas barriers, associated with buoys and anchors, to controltheir position relative to the water surface. Proper barrier
dimensioning must ensure a negligible impact on theoverall energy production efficiency of the dam. Figs. 1–3show some of the proposed configurations [21–23]. In theseconfigurations, a control buoy ensures the relative positionbetween the water surface and a movable element, one ormore sliding plates or a membrane. In low water operation,the buoy will also be in a lower position, and there is norisk of water shortage. With the help of real-timemeasurements, it is possible to evaluate directly the CH4
concentration inside the device and to specify the correctcable length. In Fig. 2a, three self-guided plate configura-tions are presented. The use of such plates reduces thebuilding costs of metal box barriers. Fig. 2b shows a crosssection of a self-guided plate system. When the turbineintake is too close to the reservoir bottom, a telescopicsystem with self-guided plates is needed, as shown inFig. 2c. In many cases the distance between the intakes issmall, and it is better to block the whole channel with amembrane, properly anchored to the reservoir bottom, andplaced far enough from the inlets to allow maintenance andminimization of accidents. The membrane induces a re-circulation near the bottom, and it makes possible to
ARTICLE IN PRESS
Fig. 2. Modified metal box CH4 emission mitigation systems for normal and near bottom turbine intakes.
Fig. 3. Membrane CH4 emission mitigation system for channels with many turbines and spillways intakes.
L.A.W. Bambace et al. / Energy 32 (2007) 1038–10461042
collect CH4-rich water under it. For instance, every700MW turbine of Itaipu, with an intake mouth diameterof 18m, would need a barrier with 10� 50m water inlet,comprising two side panels of 30� 40� 0.005m steel plate,a 50� 40� 0.005m bottom panel, and a 50� 40� 0.005mmoving plate, plus the floating elements.By reducing turbine and spillway CH4 emissions, the gas
concentration in the main channel tends to increase to thehigher levels characteristic of secondary branches. Conse-quently, the adoption of mitigation strategies may result ina portion of the CH4 that was previously degassed by theturbines and spillways being oxidized by methanotrophicbacteria before reaching the atmosphere or transformedinto new reservoir surface emissions. In reservoirs likeSerra da Mesa, where the amount of CH4 produced is onthe order of megatons per year, mitigation and CH4
recovery strategies not only must be implemented jointly tobe fully effective but also are economically justified.The proposed CH4 recovery strategy is based on the
transport of CH4-rich, pressurized, deep waters to surfaceambient conditions, where the dissolved gas can beextracted by bubbling or by spraying droplets into a sealedvessel. A similar approach has already been successfullyimplemented for degassing CO2 from lakes Nyos andMonoun (the so-called ‘‘killer lakes’’) in Cameroon [24].Figs. 4 and 5 illustrate the spraying and bubblingtechniques. In the spraying system, 16–32 nozzles throw
water against a spinning rotor with wires, pins or otherirregularities creating a cloud of droplets. The smalldroplets offer a high surface area and small internaldiffusion lengths to the dissolved gas that escapes to thevessel, and is pumped out by a blower. The gas mix passesinside batch absorbers that collect CH4. They are inparallel in order to allow some to operate collecting CH4
and the others to discharge the gas into a reservoir with thehelp of a proper gas compressor. Valves are used to selectthe function of each absorber. Hydrophobic filters may beused in the droplet system to increase the sprayingefficiency (i.e. the droplets surface tension total energydivided by the system energy input). It is also possible touse modified Pelton turbines with hydrophobic filters togenerate sprays and produce energy simultaneously. In thiscase, it is only necessary to ensure the appropriate wateraxial speed and enough energy for droplet division. In thebubbling system, shown in Fig. 5, an upward hose leadswater to a horizontal tube, in which the residence time islong enough to allow a high degassing level. A hydrophilicfilter, tilted with respect to vertical axis, retains and directsCH4 bubbles to an upper gas outlet. A submerged pump isused to force upstream flow at least at the beginning of theprocess. As the water goes up, the bubbling starts, and thetwo phase flows causes a reduction in column density thatenhances the upward flow. The inlet is placed as deep aspossible to maximize the CH4 concentration. The outlet is

ARTICLE IN PRESS
Fig. 4. Sealed vessel spraying gas–liquid separator system, methane purification, and storage.
Fig. 5. Horizontal tube bubbling gasliquid separation unit.
L.A.W. Bambace et al. / Energy 32 (2007) 1038–1046 1043
also placed at a reasonable depth to avoid surface watercontamination with CH4. A hydrophilic screen stackretains the bubbles that escape to a gas chamber througha set of small hydrophobic orifices, or a fine porehydrophobic foam. This hydrophobic material repelswater, avoiding its entrance in the gas chamber. From thischamber, the gas flows to the storage tanks.CH4-rich waters may be collected by a network of pipes
within the reservoir and transported to a main recovery siteon the shore. The main pipeline should be connected toflexible secondary pipelines, which are connected to flexibletertiary pipelines, and so on. Buoys could be used to easethe task of retrieving a certain branch end during pipelinenetwork reconfigurations. When the water is carried to thedam, part of the pipeline works as a swimming poolaspirator. Nonetheless, instead of having only one waterintake, the pipelines are ramified, presenting several tipentrances, and also other entrances due to apertures spread
around the pipe surface. In a different approach, the gasmay be recovered on especially designed boats powered byCH4 gas and/or solar energy. Light and scalable, therecovery boat may be moved from one site to anotherwhenever an exploitation zone becomes poor in CH4.CH4 may be pumped to large consuming centers,
stocked locally or burned in gas turbines to generateelectricity during high demand periods, or even purified fortransport applications. If the water is collected at depthsgreater than 50m within the CH4 saturation zone, the gasrecovered will have a partial CH4 pressure in the range of36%–80% (the rest being mainly N2 and CO2), suitable forstationary applications. CH4 stoichiometric mass air/fuelratio is 10, so the mass of impurities is low compared to themass of air, with a small impact in the burning process. Fortransport applications, the CH4 must be purified from CO2with soda lime or quicklime systems, in order to avoid alarge increase in the size of vehicles storage tanks. Overall,given that the initial investment and the costs of extractionand maintenance are probably much lower than thoserequired by the oil and natural gas industry, the economicviability of the recovery systems here described is indicated,especially in young tropical reservoirs where CH4 produc-tion is the highest.
4. Dynamics of gas–liquid separation
Regardless of the recovery technique (bubbling orspraying), the partial differential equation that describesthe dynamic of the CH4 concentration in the water, C, isgiven in by, in spherical coordinates:
q2C=qr2 þ r�1C=qr ¼ D�1 qC=qt; (1)
where D is the CH4 diffusion coefficient in water, r the localradius, and t the time. This equation has a solution in theform of
Ce ¼X
ail�1i r�1 sinðl�1i rÞ þ bil
�1i r�1 cosðliÞ
� �exp ð�DtliÞ
2� �
,
(2)
ARTICLE IN PRESSL.A.W. Bambace et al. / Energy 32 (2007) 1038–10461044
where li are the eigenvalues, Ce is the approximation for C,ai and bi the Fourier series solution coefficients.For a droplet releasing gas in the air, the coefficients bi
shall be zero to ensure limited value of Ce at the center ofthe sphere. To ensure CH4 flux continuity at the gas–liquidinterface, we have
�D qC=qx ¼ HðPliq � PgasÞ ¼ HRTðCliq � C0Þ (3)
where R is the universal gas constant, T the temperature inKelvin, H the mass transfer coefficient, Pgas the gas phasepartial CH4 pressure, and the CH4 pressure inside theliquid, Pliq is proportional to the CH4 molar fraction Xmeth,assuming Rault’s law is valid. The saturation value ofXmeth varies with temperature according to
lnðXmeth_maxÞ ¼ � 3:111� 4949:439=T � 6:050 lnðTÞ
þ 0:058T , ð4Þ
where C0 is defined as C–C0, and Rd as the droplet externalradius; the eigenvalues li are calculated with Eq. (3) assolutions of li cotg(liRd) ¼ 1�ARd
�1D�1. For low CH4
concentration, the total number of molecules in a givenvolume is close to the number of water moles, which maybe linked to the volume with water density. The aicoefficients are calculated with the initial condition ofC0equal to C00
0.To understand bubble-stripping systems, it is necessary
to understand bubble formation. This process starts whenthe total pressure of all dissolved gases is higher than thesum of the hydrostatic and atmospheric pressures, and theproportion of gases in the liquid and the bubble is thesame. It may also start due to liquid cavitation. AddingCO2 may enhance bubbling and CH4 separation fromwater, but will require a gas purification system. In case ofbubbling, the solution may be approximated by Fourierseries. In the bubble surface, Eq. (3) is valid (with a signchange). A zero flux condition is imposed at the surface ofa sphere, with a radius re, whose volume equals the totalliquid volume divided by the number of bubbles. Due tosurface tension, the pressure inside the bubble is higherthan in the liquid. The smaller the bubble, the higher thepressure drop across the interface. This means thatnucleation and coalescence are required for the beginningof liquid–gas stripping. Generally, there are large numbersof particles and nanometer scale bubbles in the water toinitiate the process. These nucleation starting particles orbubbles are called Harvey nuclei. Nucleation may also startdirectly in a liquid even without these agents, however withmuch more difficulty. Ref. [25] details nucleation in liquidswith and without these nuclei. Roughly speaking, 108–1011
bubbles are formed per second in the liquid in thenucleation phase. After this initial phase, small bubblescollide and form larger ones [26]. All these phenomena takefew seconds, as can be seen by filling a glass with a recentlyopened soft drink bottle. After the bubbles achieve a radiusof about 0.1mm, it is possible to approximately model the
degassing, for eigenvalues given by
l�1i r�1i cot gðliri þ arctan ðliriÞ � liriÞ ¼ AriD�1 þ 1
� �,
(5)
where ri is the average bubble radius, re, li, A and D werepreviously defined.The average distance between bubbles at the beginning
of the diffusion growth phase is about 0.4–2mm, depend-ing on the nucleation rate. A supersaturated bubble systemwith internal radius of 0.1 and 0.4mm of mean separationneeds about 2min to eliminate 70% of the gases in excessto the saturation level. If separation increases to 0.5mm,the same residual level is achieved in 3.5min. Theremaining dissolved gas and segregated one are almostequally mixed, containing basically CH4, CO2 and about1.3 gmol/m3 of nitrogen, as deep water is oxygen-depleted.Nitrogen partial pressure is almost constant due to the factthat its formation and consumption are negligible com-pared to methane formation.CH4 recovery ratio from stripping systems may be
calculated as function of all relevant parameters: dropletsize, bubble average spacing, residence time, and CH4
partial pressures in the liquid and gas phases. Averagefalling velocity of the droplets, vfall, is calculated asfunction of the Reynolds number, Re as follows:
vfall ¼ 24ð1� 0:15 Re0:687Þ=Re, (6)
Re ¼ rarnfallddroplet=mar (7)
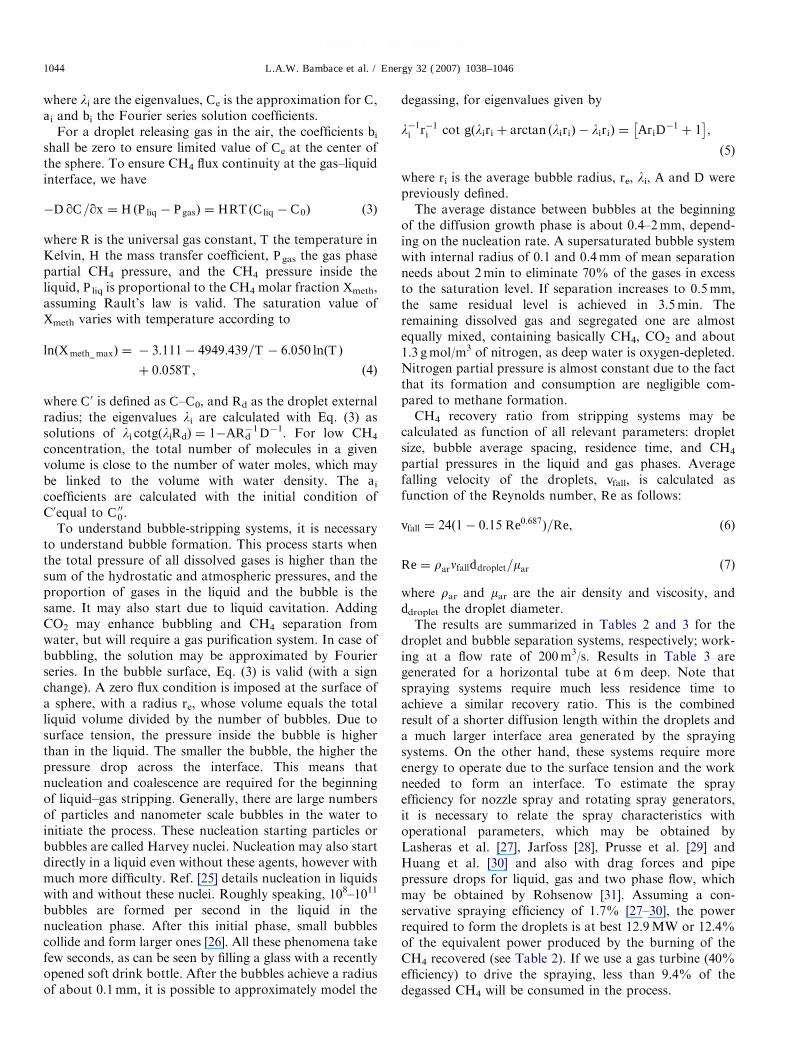
where rar and mar are the air density and viscosity, andddroplet the droplet diameter.The results are summarized in Tables 2 and 3 for the
droplet and bubble separation systems, respectively; work-ing at a flow rate of 200m3/s. Results in Table 3 aregenerated for a horizontal tube at 6m deep. Note thatspraying systems require much less residence time toachieve a similar recovery ratio. This is the combinedresult of a shorter diffusion length within the droplets anda much larger interface area generated by the sprayingsystems. On the other hand, these systems require moreenergy to operate due to the surface tension and the workneeded to form an interface. To estimate the sprayefficiency for nozzle spray and rotating spray generators,it is necessary to relate the spray characteristics withoperational parameters, which may be obtained byLasheras et al. [27], Jarfoss [28], Prusse et al. [29] andHuang et al. [30] and also with drag forces and pipepressure drops for liquid, gas and two phase flow, whichmay be obtained by Rohsenow [31]. Assuming a con-servative spraying efficiency of 1.7% [27–30], the powerrequired to form the droplets is at best 12.9MW or 12.4%of the equivalent power produced by the burning of theCH4 recovered (see Table 2). If we use a gas turbine (40%efficiency) to drive the spraying, less than 9.4% of thedegassed CH4 will be consumed in the process.

ARTICLE IN PRESS
Table 3
Performance of a 200m3/s bubbling recovery system as described in Fig. 5
Residence time (s) 276 126 56 2400 3600 1000
Bubble initial radius (mm) 0.1 0.1 0.1 0.1 0.1 0.1
Bubble separation (mm) 0.503 0.4 0.3 0.1 0.2 0.7
Separator recovery fraction (%) 71 70 77 68 18 22
Global recovery fraction (%) 55 55 60 53 14 17
CH4 recovery (kg/s) 8.77 8.73 9.55 8.43 2.2 2.75
L.A.W. Bambace et al. / Energy 32 (2007) 1038–1046 1045
5. Conclusions
In this paper, we have shown that the use of low cost,innovative mitigation and recovery strategies are able notonly to control atmospheric CH4 emissions from hydro-electric reservoirs, but also to transform existing biogenicCH4 stocks into a renewable energy source. CH4 recoveredgas may be pumped to large consuming centers, or storedlocally and burned into gas turbines to generate electricityduring high demand periods, or even purified for transportapplications. Our simulations show that the use of biogenicCH4 may increase considerably the energy supply incountries, like Brazil, that possess tropical reservoirs. Asa result, it would be possible to reduce the need for buildingnew reservoirs, protecting important pristine biomes suchas the Amazon forest and the Cerrado, and avoiding theresettlement of villages and indigenous reserves. Eachreservoir has its own biogeochemical dynamics, and thus,the implementation of any mitigation and recoverystrategies must be studied in a case-to-case approach. Inany case, it is important to note that, within the frameworkof the Kyoto Protocol, the additionality principle of theclean developing mechanism can be entirely fulfilled,because dams are already emitting CH4, and the proposedprocedures will significantly reduce CH4 emissions by insitu oxidation or by gas recovery for energy production. Inthe later case, certified emission reductions may also beclaimed since most of the burned gas is from steadybaseline emissions, neither from the original floodedbiomass nor from fossil origin. In this sense, the burningof CH4 recovered from reservoirs is cleaner than burningthe corresponding volume of oil or natural gas.
References
[1] Fearnside PM. Greenhouse gas emissions from a hydroelectric
reservoir (Brazil’s Tucuruı dam) and the energy policy implications.
Water Air Soil Pollut 2002;133:69–96.
[2] St. Louis VL, Kelly CA, Duchemin E, Rudd JWM, Rosenberg DM.
Reservoir surfaces as sources of greenhouse gases to the atmosphere:
a global estimate. Bioscience 2000;50:766–75.
[3] Ferretti DF, Miller JB, White JWC, Etheridge DM, Lassey KR,
Lowe DC, et al. Unexpected changes to the global methane budget
over the past 2000 years. Science 2005;309:1714–7.
[4] Fearnside PM. Greenhouse gas emissions from hydroelectric dams:
controversies provide a springboard for rethinking a supposedly
‘clean’ energy source. Climatic Change 2004;66:1–8.
[5] Revised IPCC Guidelines on National Inventories. Paris: IPCC;
1996.
[6] Ramaswamy V. In: Houghton JT, Ding Y, Griggs DG, Noguer M,
Van der Linden RJ, Xiausu D, editors. Climate change 2001: the
scientific basis. Cambridge University Press; 2001. p. 349–416.
[7] Duchemin E, Lucotte M, Queiroz AG, Canuel R, DaSilva HCP,
Almeida DC, et al. Greenhouse gases emissions from a 21 years old
tropical hydroelectric reservoir, representativity for large scale and
long term estimation. Veranlundgen Int Vereinigung Theor Angew
Limnol 2000;27:1391.
[8] Melack JM, Hess LL, Gastil M, Forsberg BR, Hamilton SK, Lima
IBT, et al. Regionalization of methane emissions in the Amazon
Basin with microwave remote sensing. Global Change Biol
2004;10:530–44.
[9] Whalen SC. Biogeochemistry of methane exchange between natural
Wetlands and the atmosphere. Environ Eng Sci 2005;22:73–94.
[10] Cicerone RJ, Oremland RS. Biogeochemical aspects of atmospheric
methane. Global Biogeochem Cycles 1988;2(2):299–327.
[11] Keller M, Stallard RF. Methane emission by bubbling from Gatun
Lake, Panama. J Geophys Res 1994;99:8307–19.
[12] Joyce JA, Jewell PW. Physical controls of methane ebullition from
reservoirs and lakes. Environ Eng Geosci 2003;9:77–88.
[13] Lima IBT, Novo EMLM, Ballester MV, Ometto JP. Methane
production, transport and emission in Amazon hydroelectric plants.
In: Tammy IS, editor. International geoscience and remote sensing
symposium. Seattle; 1998. p. 2529–31.
[14] Lima IBT. Biogeochemical distinction of methane releases from two
Amazon hydroreservoirs. Chemosphere 2005;59:1697–702.
[15] Nozhevnikova AN, Holliger C, Ammann A, Zehnder AJB.
Methanogenesis in sediments from deep lakes at different tempera-
tures (2–701C). Water Sci Technol 1997;36(6–7):57–64.
[16] Rosa LP, Santos MA. Certainty and uncertainty in the science of
greenhouse gas emissions from hydroelectric reservoirs (Part I and
II). A report on the state of the art for the world commission on
Dams Final Report—November 2000, See also/http://www.dams.orgS.[17] Technical data/production, Itaipu Bnacional, 2006 /http://www.
itaipu.gov.brS.[18] LMS100. GE Power Systems, 2003, /http://www.gepower.com/
prod_s.erv/products/aero_turbines/en/downloads/lms100_brochure.
pdfS.[19] Abril G, Guerin F, Richard S, Delmas R, Galy-Lacaux C, Gosse P, et
al. Carbon dioxide and methane emissions and the carbon budget of a
10 year old tropical reservoir (Petit Saut, French Guiana). Global
Biogeochem Cycles 2005;19:1–16 GB4007.
[20] The International Commission on Large Dams. World Register of
Dams. Paris: International Commission on Large Dams, 2003, see
also /http://www.icold-cigb.orgS.[21] Ramos PAB, Bambace LAW, Ramos FM, Rosa RR, Lima IBT.
Brazilian Patent Pending. Sistema de controle da cota de tomada de
agua para turbinas ou vertedouros de hidreletricas para reduc- ao de
emissoes de metano e outros gases de efeito estufa, March 2005.
[22] Ramos PAB, Bambace LAW, Ramos FM, Rosa RR, Lima IBT.
Brazilian patent pending. Coletor de agua com alto teor de metano
para barragens, March 2005.
[23] Ramos PAB, Bambace LAW, Ramos FM, Rosa RR, Lima IBT.
Brazilian Patent Pending. Sistema de controle via membrana da cota
de tomada de agua para turbinas ou vertedouros de hidreletricas para
reduc- ao de emissoes de metano e outros gases de efeito estufa. March
2005.

ARTICLE IN PRESSL.A.W. Bambace et al. / Energy 32 (2007) 1038–10461046
[24] Kling GW, Evan WC, Tanyileke G, Kusakabe M, Ohba T, Yoshida
Y, et al. Defusing certain disaster: results from degassing lakes Nyos
and Monoun in Cameroon, West Africa. Proc Natl Acad Sci USA
2005;102(40):14185–90.
[25] Delale CF, Okita K, Matsumoto Y. Steady-state cavitating nozzle
flows with nucleation. In: Bathe KJ, editor. CAV2003 5th interna-
tional symposium on cavitation; 2003 paper Cav03-GS-4-001.
[26] Chen L, Li Y, Manasseh R. The coalescence of bubbles a numerical
study. In: El-Genk M, editor. ICMF’98 3rd international conference
on multiphase flow. France: Lyon; 1998 paper 626.
[27] Lasheras JC, Villermaux E, Hopfinger EJ. Break-up and atomization
of a round water jet by a high-speed annular air jet. J Fluid Mech
1998;357:351–79.
[28] Jarfoss AEW. On the design of rotary spray former: an experimental
and theoretical background. J Mater Process Technol 1997;71:
440–55.
[29] Prusse U, Jahnz U, Wittlich P, Breford J, Vorlop KD. Bed
production with jet cutting and rotating disk/nozzle technologies.
Pratical aspects of encapsulation technologies. Bundesforchungsan-
stalt fur Landwirtschaft, Sonderheft 241.
[30] Huang LX, Kumar K, Mujumdar AS. A comparative study of a
spray dryer with rotary disc atomizer and pressure nozzle using
computational fluid dynamic simulations. Chem Eng Process
2006;45:461–70.
[31] Rohsenow WM. Handbook of heat transfer. Boston: McGraw-Hill
Co.; 1998.