
Kinetic and fluid dynamics modeling of methane/hydrogen jet flames in diluted coflow
Chemical Engineering Science 54 (1999) 3543}3552
Hydrogen from methane in a single-step process
B. Balasubramanian, A. Lopez Ortiz, S. Kaytakoglu, D.P. Harrison*
Department of Chemical Engineering, Louisiana State University, Baton Rouge, LA 70803, USA
Abstract
Addition of a calcium-based CO2
acceptor to commercial steam methane reforming catalyst permits the production of 95#%H
2in a single-step process. The combined reforming, shift, and CO
2separation reactions have been studied using a laboratory-scale
"xed-bed reactor as a function of temperature, steam-to-methane ratio, acceptor-to-catalyst ratio, feed gas #ow rate, and methanecontent of the feed gas. The combined reactions were su$ciently rapid above 5503C that equilibrium was closely approached at allreaction conditions studied. The H
2content of the product gas was relatively independent of temperature with the primary impurity
at lower temperatures being CH4. Higher temperatures resulted in increased CH
4conversion but decreased carbon oxide removal
leaving CO and CO2as the primary impurities. Potential advantages of the single-step process, in addition to reducing the number of
processing steps, include improved energy e$ciency, elimination of the need for shift catalysts, and reduction in the temperature of theprimary reactor by 150}2003C. Key unanswered problems involving the single-step process include continuous separation of catalystand acceptor and the durability of the acceptor for multiple cycle operation. ( 1999 Elsevier Science Ltd. All rights reserved.
Keywords: Methane; Steam reforming; Hydrogen; CO2
acceptor
1. Introduction
Hydrogen is an important raw material in the chemicaland petroleum industries; large quantities are used in themanufacture of ammonia and methanol and in a varietyof petroleum hydrotreating processes. A growing de-mand is forecast in all sectors, particularly petroleumre"ning where the increasing need to process heavy,high-sulfur crudes is coupled with decreasing by-producthydrogen from catalytic reforming (Abrardo andKhurana, 1995). The possibility that hydrogen mightbecome a general purpose energy source for space heat-ing, electric power generation, and as a transportationfuel would cause a huge increase in hydrogen demand.
Conversion of natural gas and other light hydrocar-bons via steam reforming is currently the major processfor hydrogen production. Heavier hydrocarbons may beconverted by partial oxidation, while coal and petroleumcoke may serve as raw materials in the future (Lamarre,1994). Small amounts of high-purity hydrogen are
*Corresponding author. Tel. 1-225 388 3066; fax: 1-225 388 1476;e-mail: [email protected].
produced by the electrolysis of water, and hydrogen fromrenewable resources, although the subject of current re-search, is not expected to become competitive in theimmediate future (US DOE, 1995). It is probable thatsteam methane reforming (SMR) will remain the processof choice for the next few decades.
The SMR process involves multiple steps and severeoperating conditions. The primary reformer operates atapproximately 800}8503C and 20 atm and large quantit-ies of supplemental fuel must be burned to supply theenergy necessary to maintain reformer temperature. Thereformer is followed by high- and low-temperature shiftreactors and then by carbon dioxide removal using eitheramine scrubbing or pressure swing adsorption techno-logy. With amine scrubbing it is often necessary to fur-ther reduce carbon oxide concentration to trace levels bymethanation. No further puri"cation of the product isnecessary following pressure swing adsorption but asmuch as 20% of the hydrogen may be lost during columnblowdown and purge.
Within the last few years the concept of combiningreaction and separation to simplify chemical pro-cesses, conserve energy, and/or to improve product qual-ity and yield has received increased attention. Reactive
0009-2509/99/$} see front matter ( 1999 Elsevier Science Ltd. All rights reserved.PII: S 0 0 0 9 - 2 5 0 9 ( 9 8 ) 0 0 4 2 5 - 4
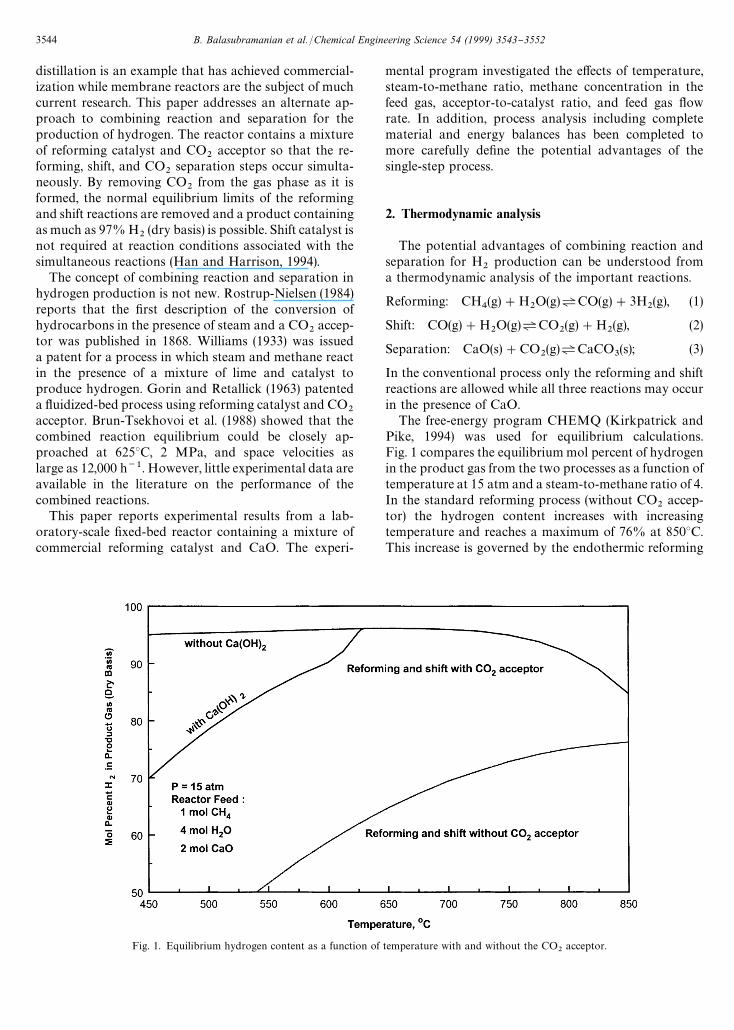
Fig. 1. Equilibrium hydrogen content as a function of temperature with and without the CO2
acceptor.
distillation is an example that has achieved commercial-ization while membrane reactors are the subject of muchcurrent research. This paper addresses an alternate ap-proach to combining reaction and separation for theproduction of hydrogen. The reactor contains a mixtureof reforming catalyst and CO
2acceptor so that the re-
forming, shift, and CO2
separation steps occur simulta-neously. By removing CO
2from the gas phase as it is
formed, the normal equilibrium limits of the reformingand shift reactions are removed and a product containingas much as 97% H
2(dry basis) is possible. Shift catalyst is
not required at reaction conditions associated with thesimultaneous reactions (Han and Harrison, 1994).
The concept of combining reaction and separation inhydrogen production is not new. Rostrup-Nielsen (1984)reports that the "rst description of the conversion ofhydrocarbons in the presence of steam and a CO
2accep-
tor was published in 1868. Williams (1933) was issueda patent for a process in which steam and methane reactin the presence of a mixture of lime and catalyst toproduce hydrogen. Gorin and Retallick (1963) patenteda #uidized-bed process using reforming catalyst and CO
2acceptor. Brun-Tsekhovoi et al. (1988) showed that thecombined reaction equilibrium could be closely ap-proached at 6253C, 2 MPa, and space velocities aslarge as 12,000 h~1. However, little experimental data areavailable in the literature on the performance of thecombined reactions.
This paper reports experimental results from a lab-oratory-scale "xed-bed reactor containing a mixture ofcommercial reforming catalyst and CaO. The experi-
mental program investigated the e!ects of temperature,steam-to-methane ratio, methane concentration in thefeed gas, acceptor-to-catalyst ratio, and feed gas #owrate. In addition, process analysis including completematerial and energy balances has been completed tomore carefully de"ne the potential advantages of thesingle-step process.
2. Thermodynamic analysis
The potential advantages of combining reaction andseparation for H
2production can be understood from
a thermodynamic analysis of the important reactions.
Reforming: CH4(g)#H
2O(g)bCO(g)#3H
2(g), (1)
Shift: CO(g)#H2O(g)bCO
2(g)#H
2(g), (2)
Separation: CaO(s)#CO2(g)b CaCO
3(s); (3)
In the conventional process only the reforming and shiftreactions are allowed while all three reactions may occurin the presence of CaO.
The free-energy program CHEMQ (Kirkpatrick andPike, 1994) was used for equilibrium calculations.Fig. 1 compares the equilibrium mol percent of hydrogenin the product gas from the two processes as a function oftemperature at 15 atm and a steam-to-methane ratio of 4.In the standard reforming process (without CO
2accep-
tor) the hydrogen content increases with increasingtemperature and reaches a maximum of 76% at 8503C.This increase is governed by the endothermic reforming
3544 B. Balasubramanian et al. /Chemical Engineering Science 54 (1999) 3543}3552
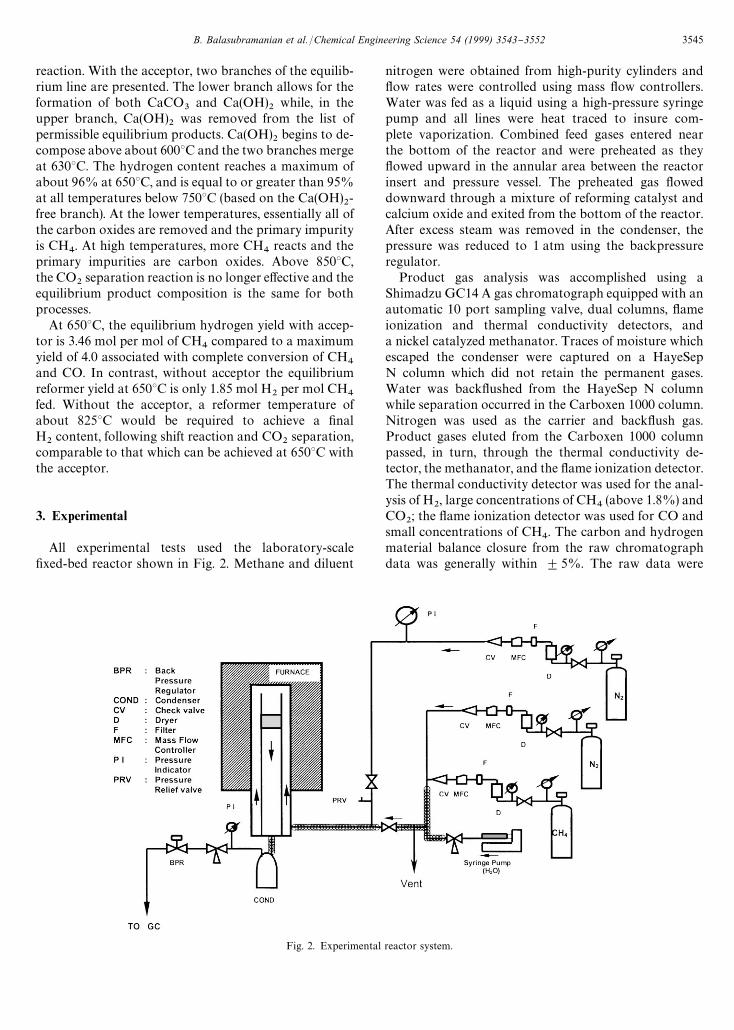
Fig. 2. Experimental reactor system.
reaction. With the acceptor, two branches of the equilib-rium line are presented. The lower branch allows for theformation of both CaCO
3and Ca(OH)
2while, in the
upper branch, Ca(OH)2
was removed from the list ofpermissible equilibrium products. Ca(OH)
2begins to de-
compose above about 6003C and the two branches mergeat 6303C. The hydrogen content reaches a maximum ofabout 96% at 6503C, and is equal to or greater than 95%at all temperatures below 7503C (based on the Ca(OH)
2-
free branch). At the lower temperatures, essentially all ofthe carbon oxides are removed and the primary impurityis CH
4. At high temperatures, more CH
4reacts and the
primary impurities are carbon oxides. Above 8503C,the CO
2separation reaction is no longer e!ective and the
equilibrium product composition is the same for bothprocesses.
At 6503C, the equilibrium hydrogen yield with accep-tor is 3.46 mol per mol of CH
4compared to a maximum
yield of 4.0 associated with complete conversion of CH4
and CO. In contrast, without acceptor the equilibriumreformer yield at 6503C is only 1.85 mol H
2per mol CH
4fed. Without the acceptor, a reformer temperature ofabout 8253C would be required to achieve a "nalH
2content, following shift reaction and CO
2separation,
comparable to that which can be achieved at 6503C withthe acceptor.
3. Experimental
All experimental tests used the laboratory-scale"xed-bed reactor shown in Fig. 2. Methane and diluent
nitrogen were obtained from high-purity cylinders and#ow rates were controlled using mass #ow controllers.Water was fed as a liquid using a high-pressure syringepump and all lines were heat traced to insure com-plete vaporization. Combined feed gases entered nearthe bottom of the reactor and were preheated as they#owed upward in the annular area between the reactorinsert and pressure vessel. The preheated gas #oweddownward through a mixture of reforming catalyst andcalcium oxide and exited from the bottom of the reactor.After excess steam was removed in the condenser, thepressure was reduced to 1 atm using the backpressureregulator.
Product gas analysis was accomplished using aShimadzu GC14 A gas chromatograph equipped with anautomatic 10 port sampling valve, dual columns, #ameionization and thermal conductivity detectors, anda nickel catalyzed methanator. Traces of moisture whichescaped the condenser were captured on a HayeSepN column which did not retain the permanent gases.Water was back#ushed from the HayeSep N columnwhile separation occurred in the Carboxen 1000 column.Nitrogen was used as the carrier and back#ush gas.Product gases eluted from the Carboxen 1000 columnpassed, in turn, through the thermal conductivity de-tector, the methanator, and the #ame ionization detector.The thermal conductivity detector was used for the anal-ysis of H
2, large concentrations of CH
4(above 1.8%) and
CO2; the #ame ionization detector was used for CO and
small concentrations of CH4. The carbon and hydrogen
material balance closure from the raw chromatographdata was generally within $5%. The raw data were
B. Balasubramanian et al. /Chemical Engineering Science 54 (1999) 3543}3552 3545
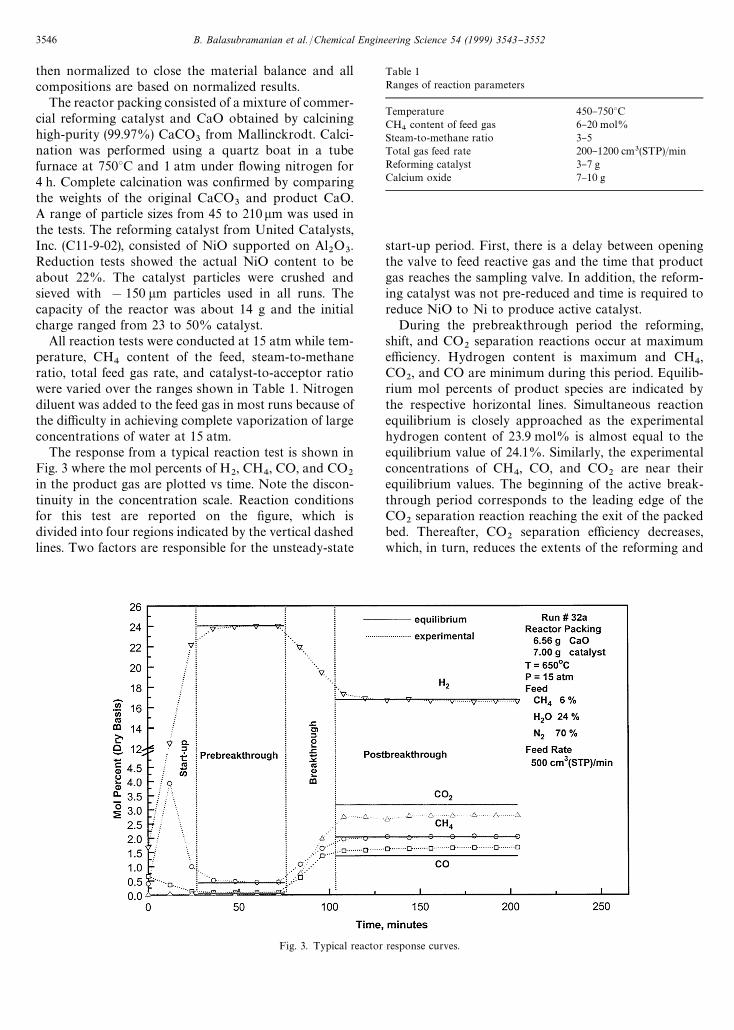
Fig. 3. Typical reactor response curves.
then normalized to close the material balance and allcompositions are based on normalized results.
The reactor packing consisted of a mixture of commer-cial reforming catalyst and CaO obtained by calcininghigh-purity (99.97%) CaCO
3from Mallinckrodt. Calci-
nation was performed using a quartz boat in a tubefurnace at 7503C and 1 atm under #owing nitrogen for4 h. Complete calcination was con"rmed by comparingthe weights of the original CaCO
3and product CaO.
A range of particle sizes from 45 to 210lm was used inthe tests. The reforming catalyst from United Catalysts,Inc. (C11-9-02), consisted of NiO supported on Al
2O
3.
Reduction tests showed the actual NiO content to beabout 22%. The catalyst particles were crushed andsieved with !150 lm particles used in all runs. Thecapacity of the reactor was about 14 g and the initialcharge ranged from 23 to 50% catalyst.
All reaction tests were conducted at 15 atm while tem-perature, CH
4content of the feed, steam-to-methane
ratio, total feed gas rate, and catalyst-to-acceptor ratiowere varied over the ranges shown in Table 1. Nitrogendiluent was added to the feed gas in most runs because ofthe di$culty in achieving complete vaporization of largeconcentrations of water at 15 atm.
The response from a typical reaction test is shown inFig. 3 where the mol percents of H
2, CH
4, CO, and CO
2in the product gas are plotted vs time. Note the discon-tinuity in the concentration scale. Reaction conditionsfor this test are reported on the "gure, which isdivided into four regions indicated by the vertical dashedlines. Two factors are responsible for the unsteady-state
Table 1Ranges of reaction parameters
Temperature 450}7503CCH
4content of feed gas 6}20 mol%
Steam-to-methane ratio 3}5Total gas feed rate 200}1200 cm3(STP)/minReforming catalyst 3}7 gCalcium oxide 7}10 g
start-up period. First, there is a delay between openingthe valve to feed reactive gas and the time that productgas reaches the sampling valve. In addition, the reform-ing catalyst was not pre-reduced and time is required toreduce NiO to Ni to produce active catalyst.
During the prebreakthrough period the reforming,shift, and CO
2separation reactions occur at maximum
e$ciency. Hydrogen content is maximum and CH4,
CO2, and CO are minimum during this period. Equilib-
rium mol percents of product species are indicated bythe respective horizontal lines. Simultaneous reactionequilibrium is closely approached as the experimentalhydrogen content of 23.9 mol% is almost equal to theequilibrium value of 24.1%. Similarly, the experimentalconcentrations of CH
4, CO, and CO
2are near their
equilibrium values. The beginning of the active break-through period corresponds to the leading edge of theCO
2separation reaction reaching the exit of the packed
bed. Thereafter, CO2
separation e$ciency decreases,which, in turn, reduces the extents of the reforming and
3546 B. Balasubramanian et al. /Chemical Engineering Science 54 (1999) 3543}3552
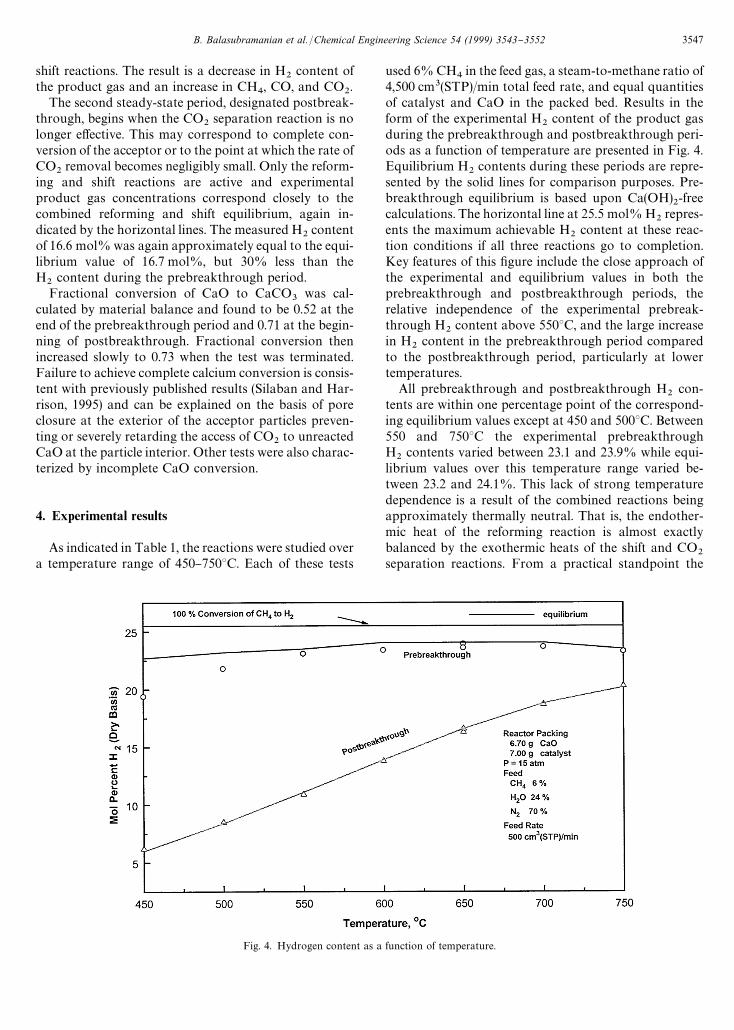
Fig. 4. Hydrogen content as a function of temperature.
shift reactions. The result is a decrease in H2
content ofthe product gas and an increase in CH
4, CO, and CO
2.
The second steady-state period, designated postbreak-through, begins when the CO
2separation reaction is no
longer e!ective. This may correspond to complete con-version of the acceptor or to the point at which the rate ofCO
2removal becomes negligibly small. Only the reform-
ing and shift reactions are active and experimentalproduct gas concentrations correspond closely to thecombined reforming and shift equilibrium, again in-dicated by the horizontal lines. The measured H
2content
of 16.6 mol% was again approximately equal to the equi-librium value of 16.7 mol%, but 30% less than theH
2content during the prebreakthrough period.
Fractional conversion of CaO to CaCO3
was cal-culated by material balance and found to be 0.52 at theend of the prebreakthrough period and 0.71 at the begin-ning of postbreakthrough. Fractional conversion thenincreased slowly to 0.73 when the test was terminated.Failure to achieve complete calcium conversion is consis-tent with previously published results (Silaban and Har-rison, 1995) and can be explained on the basis of poreclosure at the exterior of the acceptor particles preven-ting or severely retarding the access of CO
2to unreacted
CaO at the particle interior. Other tests were also charac-terized by incomplete CaO conversion.
4. Experimental results
As indicated in Table 1, the reactions were studied overa temperature range of 450}7503C. Each of these tests
used 6% CH4in the feed gas, a steam-to-methane ratio of
4,500 cm3(STP)/min total feed rate, and equal quantitiesof catalyst and CaO in the packed bed. Results in theform of the experimental H
2content of the product gas
during the prebreakthrough and postbreakthrough peri-ods as a function of temperature are presented in Fig. 4.Equilibrium H
2contents during these periods are repre-
sented by the solid lines for comparison purposes. Pre-breakthrough equilibrium is based upon Ca(OH)
2-free
calculations. The horizontal line at 25.5 mol% H2repres-
ents the maximum achievable H2
content at these reac-tion conditions if all three reactions go to completion.Key features of this "gure include the close approach ofthe experimental and equilibrium values in both theprebreakthrough and postbreakthrough periods, therelative independence of the experimental prebreak-through H
2content above 5503C, and the large increase
in H2
content in the prebreakthrough period comparedto the postbreakthrough period, particularly at lowertemperatures.
All prebreakthrough and postbreakthrough H2
con-tents are within one percentage point of the correspond-ing equilibrium values except at 450 and 5003C. Between550 and 7503C the experimental prebreakthroughH
2contents varied between 23.1 and 23.9% while equi-
librium values over this temperature range varied be-tween 23.2 and 24.1%. This lack of strong temperaturedependence is a result of the combined reactions beingapproximately thermally neutral. That is, the endother-mic heat of the reforming reaction is almost exactlybalanced by the exothermic heats of the shift and CO
2separation reactions. From a practical standpoint the
B. Balasubramanian et al. /Chemical Engineering Science 54 (1999) 3543}3552 3547
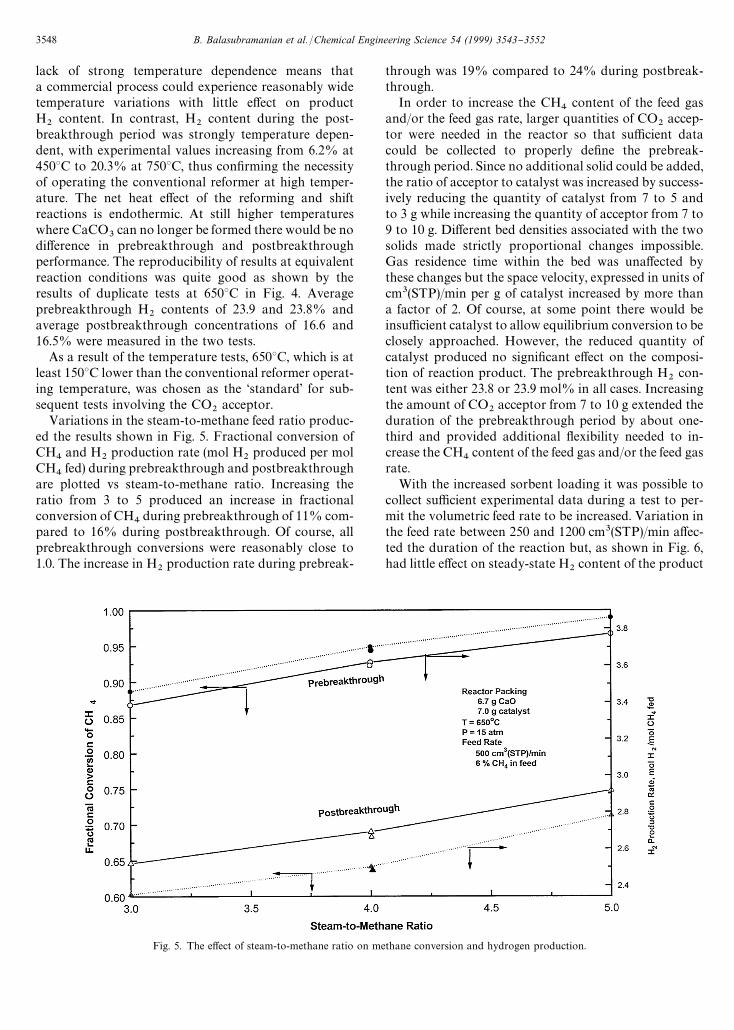
Fig. 5. The e!ect of steam-to-methane ratio on methane conversion and hydrogen production.
lack of strong temperature dependence means thata commercial process could experience reasonably widetemperature variations with little e!ect on productH
2content. In contrast, H
2content during the post-
breakthrough period was strongly temperature depen-dent, with experimental values increasing from 6.2% at4503C to 20.3% at 7503C, thus con"rming the necessityof operating the conventional reformer at high temper-ature. The net heat e!ect of the reforming and shiftreactions is endothermic. At still higher temperatureswhere CaCO
3can no longer be formed there would be no
di!erence in prebreakthrough and postbreakthroughperformance. The reproducibility of results at equivalentreaction conditions was quite good as shown by theresults of duplicate tests at 6503C in Fig. 4. Averageprebreakthrough H
2contents of 23.9 and 23.8% and
average postbreakthrough concentrations of 16.6 and16.5% were measured in the two tests.
As a result of the temperature tests, 6503C, which is atleast 1503C lower than the conventional reformer operat-ing temperature, was chosen as the &standard' for sub-sequent tests involving the CO
2acceptor.
Variations in the steam-to-methane feed ratio produc-ed the results shown in Fig. 5. Fractional conversion ofCH
4and H
2production rate (mol H
2produced per mol
CH4
fed) during prebreakthrough and postbreakthroughare plotted vs steam-to-methane ratio. Increasing theratio from 3 to 5 produced an increase in fractionalconversion of CH
4during prebreakthrough of 11% com-
pared to 16% during postbreakthrough. Of course, allprebreakthrough conversions were reasonably close to1.0. The increase in H
2production rate during prebreak-
through was 19% compared to 24% during postbreak-through.
In order to increase the CH4
content of the feed gasand/or the feed gas rate, larger quantities of CO
2accep-
tor were needed in the reactor so that su$cient datacould be collected to properly de"ne the prebreak-through period. Since no additional solid could be added,the ratio of acceptor to catalyst was increased by success-ively reducing the quantity of catalyst from 7 to 5 andto 3 g while increasing the quantity of acceptor from 7 to9 to 10 g. Di!erent bed densities associated with the twosolids made strictly proportional changes impossible.Gas residence time within the bed was una!ected bythese changes but the space velocity, expressed in units ofcm3(STP)/min per g of catalyst increased by more thana factor of 2. Of course, at some point there would beinsu$cient catalyst to allow equilibrium conversion to beclosely approached. However, the reduced quantity ofcatalyst produced no signi"cant e!ect on the composi-tion of reaction product. The prebreakthrough H
2con-
tent was either 23.8 or 23.9 mol% in all cases. Increasingthe amount of CO
2acceptor from 7 to 10 g extended the
duration of the prebreakthrough period by about one-third and provided additional #exibility needed to in-crease the CH
4content of the feed gas and/or the feed gas
rate.With the increased sorbent loading it was possible to
collect su$cient experimental data during a test to per-mit the volumetric feed rate to be increased. Variation inthe feed rate between 250 and 1200 cm3(STP)/min a!ec-ted the duration of the reaction but, as shown in Fig. 6,had little e!ect on steady-state H
2content of the product
3548 B. Balasubramanian et al. /Chemical Engineering Science 54 (1999) 3543}3552
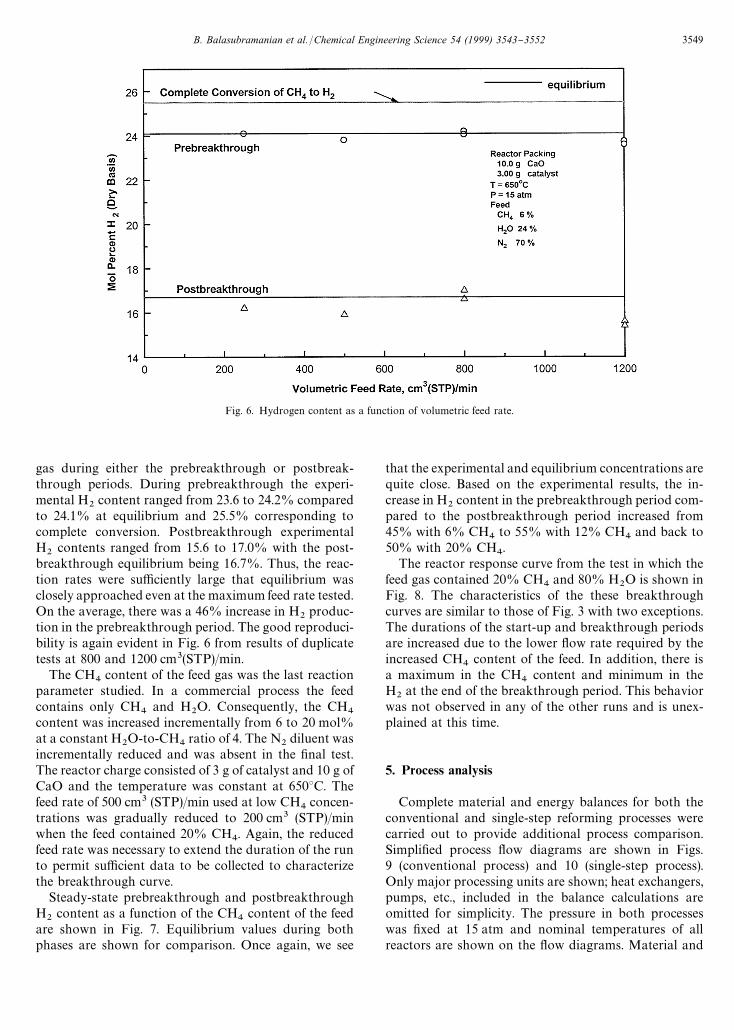
Fig. 6. Hydrogen content as a function of volumetric feed rate.
gas during either the prebreakthrough or postbreak-through periods. During prebreakthrough the experi-mental H
2content ranged from 23.6 to 24.2% compared
to 24.1% at equilibrium and 25.5% corresponding tocomplete conversion. Postbreakthrough experimentalH
2contents ranged from 15.6 to 17.0% with the post-
breakthrough equilibrium being 16.7%. Thus, the reac-tion rates were su$ciently large that equilibrium wasclosely approached even at the maximum feed rate tested.On the average, there was a 46% increase in H
2produc-
tion in the prebreakthrough period. The good reproduci-bility is again evident in Fig. 6 from results of duplicatetests at 800 and 1200 cm3(STP)/min.
The CH4
content of the feed gas was the last reactionparameter studied. In a commercial process the feedcontains only CH
4and H
2O. Consequently, the CH
4content was increased incrementally from 6 to 20 mol%at a constant H
2O-to-CH
4ratio of 4. The N
2diluent was
incrementally reduced and was absent in the "nal test.The reactor charge consisted of 3 g of catalyst and 10 g ofCaO and the temperature was constant at 6503C. Thefeed rate of 500 cm3 (STP)/min used at low CH
4concen-
trations was gradually reduced to 200 cm3 (STP)/minwhen the feed contained 20% CH
4. Again, the reduced
feed rate was necessary to extend the duration of the runto permit su$cient data to be collected to characterizethe breakthrough curve.
Steady-state prebreakthrough and postbreakthroughH
2content as a function of the CH
4content of the feed
are shown in Fig. 7. Equilibrium values during bothphases are shown for comparison. Once again, we see
that the experimental and equilibrium concentrations arequite close. Based on the experimental results, the in-crease in H
2content in the prebreakthrough period com-
pared to the postbreakthrough period increased from45% with 6% CH
4to 55% with 12% CH
4and back to
50% with 20% CH4.
The reactor response curve from the test in which thefeed gas contained 20% CH
4and 80% H
2O is shown in
Fig. 8. The characteristics of the these breakthroughcurves are similar to those of Fig. 3 with two exceptions.The durations of the start-up and breakthrough periodsare increased due to the lower #ow rate required by theincreased CH
4content of the feed. In addition, there is
a maximum in the CH4
content and minimum in theH
2at the end of the breakthrough period. This behavior
was not observed in any of the other runs and is unex-plained at this time.
5. Process analysis
Complete material and energy balances for both theconventional and single-step reforming processes werecarried out to provide additional process comparison.Simpli"ed process #ow diagrams are shown in Figs.9 (conventional process) and 10 (single-step process).Only major processing units are shown; heat exchangers,pumps, etc., included in the balance calculations areomitted for simplicity. The pressure in both processeswas "xed at 15 atm and nominal temperatures of allreactors are shown on the #ow diagrams. Material and
B. Balasubramanian et al. /Chemical Engineering Science 54 (1999) 3543}3552 3549
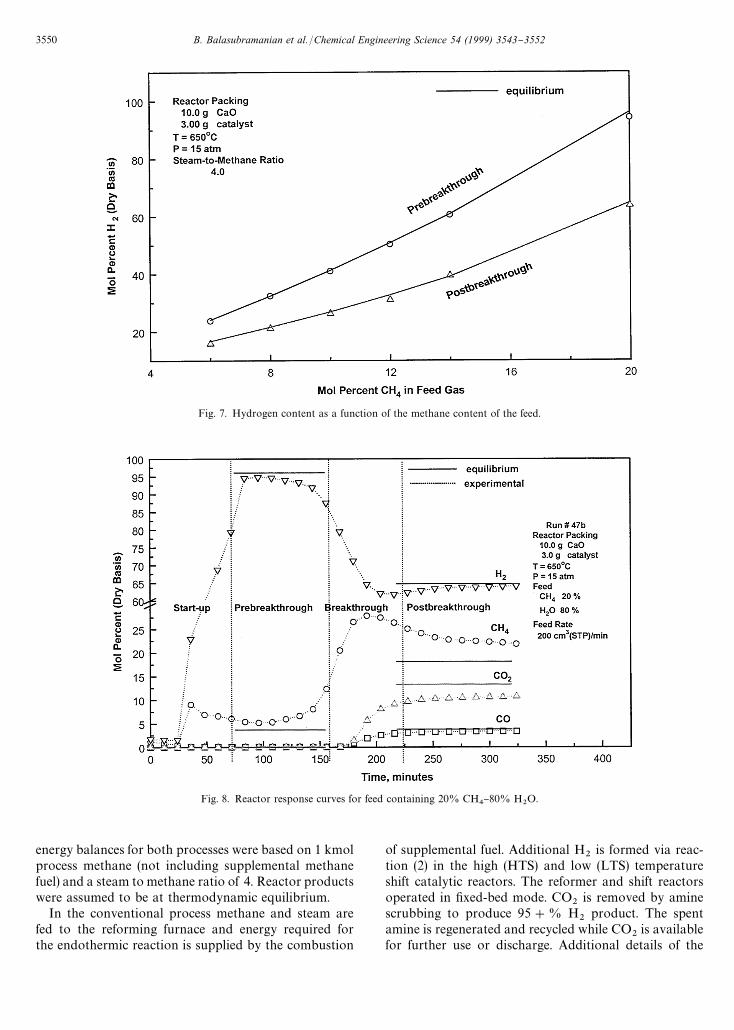
Fig. 7. Hydrogen content as a function of the methane content of the feed.
Fig. 8. Reactor response curves for feed containing 20% CH4}80% H
2O.
energy balances for both processes were based on 1 kmolprocess methane (not including supplemental methanefuel) and a steam to methane ratio of 4. Reactor productswere assumed to be at thermodynamic equilibrium.
In the conventional process methane and steam arefed to the reforming furnace and energy required forthe endothermic reaction is supplied by the combustion
of supplemental fuel. Additional H2
is formed via reac-tion (2) in the high (HTS) and low (LTS) temperatureshift catalytic reactors. The reformer and shift reactorsoperated in "xed-bed mode. CO
2is removed by amine
scrubbing to produce 95#% H2
product. The spentamine is regenerated and recycled while CO
2is available
for further use or discharge. Additional details of the
3550 B. Balasubramanian et al. /Chemical Engineering Science 54 (1999) 3543}3552
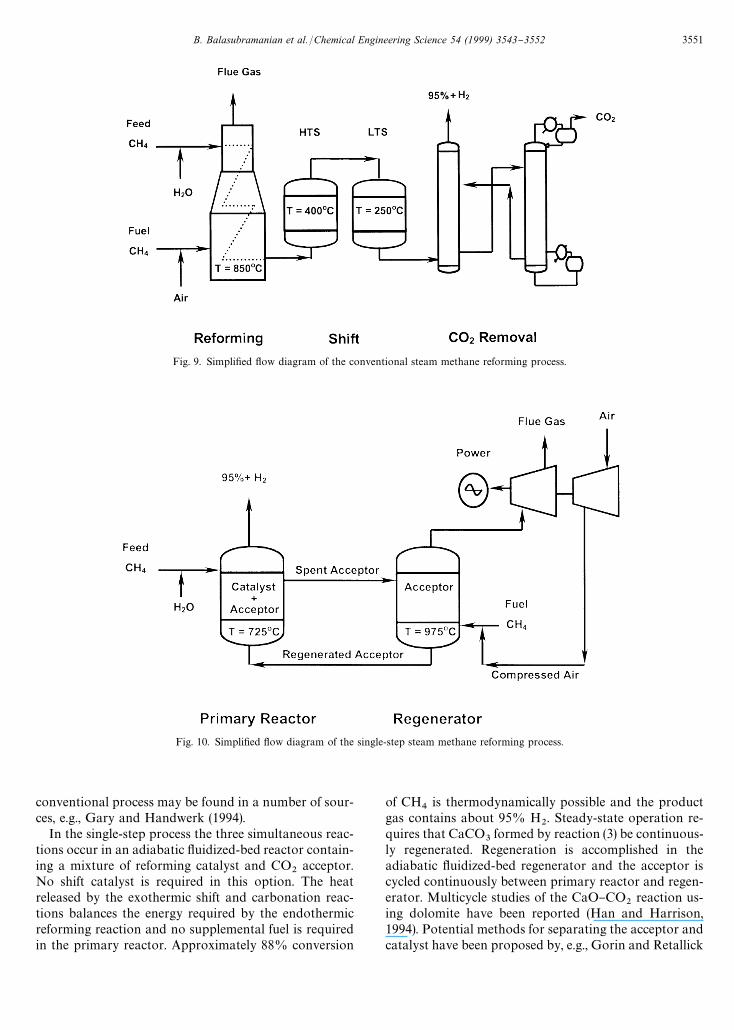
Fig. 9. Simpli"ed #ow diagram of the conventional steam methane reforming process.
Fig. 10. Simpli"ed #ow diagram of the single-step steam methane reforming process.
conventional process may be found in a number of sour-ces, e.g., Gary and Handwerk (1994).
In the single-step process the three simultaneous reac-tions occur in an adiabatic #uidized-bed reactor contain-ing a mixture of reforming catalyst and CO
2acceptor.
No shift catalyst is required in this option. The heatreleased by the exothermic shift and carbonation reac-tions balances the energy required by the endothermicreforming reaction and no supplemental fuel is requiredin the primary reactor. Approximately 88% conversion
of CH4
is thermodynamically possible and the productgas contains about 95% H
2. Steady-state operation re-
quires that CaCO3formed by reaction (3) be continuous-
ly regenerated. Regeneration is accomplished in theadiabatic #uidized-bed regenerator and the acceptor iscycled continuously between primary reactor and regen-erator. Multicycle studies of the CaO}CO
2reaction us-
ing dolomite have been reported (Han and Harrison,1994). Potential methods for separating the acceptor andcatalyst have been proposed by, e.g., Gorin and Retallick
B. Balasubramanian et al. /Chemical Engineering Science 54 (1999) 3543}3552 3551
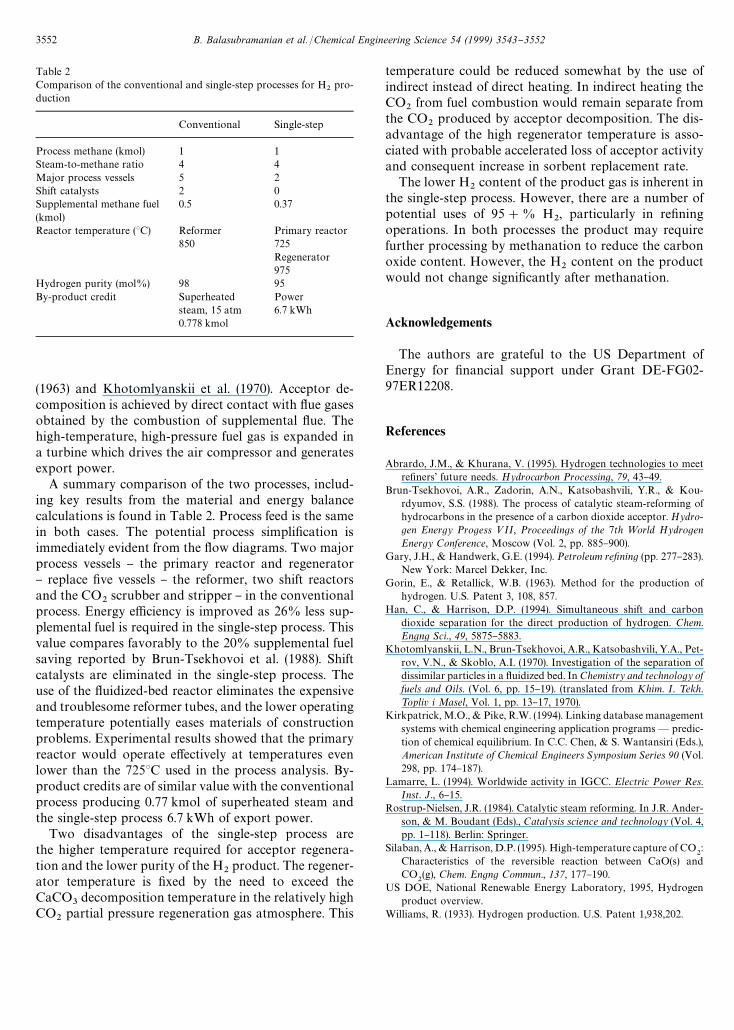
Table 2Comparison of the conventional and single-step processes for H
2pro-
duction
Conventional Single-step
Process methane (kmol) 1 1Steam-to-methane ratio 4 4Major process vessels 5 2Shift catalysts 2 0Supplemental methane fuel 0.5 0.37(kmol)Reactor temperature (3C) Reformer Primary reactor
850 725Regenerator975
Hydrogen purity (mol%) 98 95By-product credit Superheated Power
steam, 15 atm 6.7 kWh0.778 kmol
(1963) and Khotomlyanskii et al. (1970). Acceptor de-composition is achieved by direct contact with #ue gasesobtained by the combustion of supplemental #ue. Thehigh-temperature, high-pressure fuel gas is expanded ina turbine which drives the air compressor and generatesexport power.
A summary comparison of the two processes, includ-ing key results from the material and energy balancecalculations is found in Table 2. Process feed is the samein both cases. The potential process simpli"cation isimmediately evident from the #ow diagrams. Two majorprocess vessels } the primary reactor and regenerator} replace "ve vessels } the reformer, two shift reactorsand the CO
2scrubber and stripper } in the conventional
process. Energy e$ciency is improved as 26% less sup-plemental fuel is required in the single-step process. Thisvalue compares favorably to the 20% supplemental fuelsaving reported by Brun-Tsekhovoi et al. (1988). Shiftcatalysts are eliminated in the single-step process. Theuse of the #uidized-bed reactor eliminates the expensiveand troublesome reformer tubes, and the lower operatingtemperature potentially eases materials of constructionproblems. Experimental results showed that the primaryreactor would operate e!ectively at temperatures evenlower than the 7253C used in the process analysis. By-product credits are of similar value with the conventionalprocess producing 0.77 kmol of superheated steam andthe single-step process 6.7 kWh of export power.
Two disadvantages of the single-step process arethe higher temperature required for acceptor regenera-tion and the lower purity of the H
2product. The regener-
ator temperature is "xed by the need to exceed theCaCO
3decomposition temperature in the relatively high
CO2
partial pressure regeneration gas atmosphere. This
temperature could be reduced somewhat by the use ofindirect instead of direct heating. In indirect heating theCO
2from fuel combustion would remain separate from
the CO2
produced by acceptor decomposition. The dis-advantage of the high regenerator temperature is asso-ciated with probable accelerated loss of acceptor activityand consequent increase in sorbent replacement rate.
The lower H2
content of the product gas is inherent inthe single-step process. However, there are a number ofpotential uses of 95#% H
2, particularly in re"ning
operations. In both processes the product may requirefurther processing by methanation to reduce the carbonoxide content. However, the H
2content on the product
would not change signi"cantly after methanation.
Acknowledgements
The authors are grateful to the US Department ofEnergy for "nancial support under Grant DE-FG02-97ER12208.
References
Abrardo, J.M., & Khurana, V. (1995). Hydrogen technologies to meetre"ners' future needs. Hydrocarbon Processing, 79, 43}49.
Brun-Tsekhovoi, A.R., Zadorin, A.N., Katsobashvili, Y.R., & Kou-rdyumov, S.S. (1988). The process of catalytic steam-reforming ofhydrocarbons in the presence of a carbon dioxide acceptor. Hydro-gen Energy Progess <II, Proceedings of the 7th =orld HydrogenEnergy Conference, Moscow (Vol. 2, pp. 885}900).
Gary, J.H., & Handwerk, G.E. (1994). Petroleum re,ning (pp. 277}283).New York: Marcel Dekker, Inc.
Gorin, E., & Retallick, W.B. (1963). Method for the production ofhydrogen. U.S. Patent 3, 108, 857.
Han, C., & Harrison, D.P. (1994). Simultaneous shift and carbondioxide separation for the direct production of hydrogen. Chem.Engng Sci., 49, 5875}5883.
Khotomlyanskii, L.N., Brun-Tsekhovoi, A.R., Katsobashvili, Y.A., Pet-rov, V.N., & Skoblo, A.I. (1970). Investigation of the separation ofdissimilar particles in a #uidized bed. In Chemistry and technology offuels and Oils. (Vol. 6, pp. 15}19). (translated from Khim. I. ¹ekh.¹opliv i Masel, Vol. 1, pp. 13}17, 1970).
Kirkpatrick, M.O., & Pike, R.W. (1994). Linking database managementsystems with chemical engineering application programs* predic-tion of chemical equilibrium. In C.C. Chen, & S. Wantansiri (Eds.),American Institute of Chemical Engineers Symposium Series 90 (Vol.298, pp. 174}187).
Lamarre, L. (1994). Worldwide activity in IGCC. Electric Power Res.Inst. J., 6}15.
Rostrup-Nielsen, J.R. (1984). Catalytic steam reforming. In J.R. Ander-son, & M. Boudant (Eds)., Catalysis science and technology (Vol. 4,pp. 1}118). Berlin: Springer.
Silaban, A., & Harrison, D.P. (1995). High-temperature capture of CO2:
Characteristics of the reversible reaction between CaO(s) andCO
2(g), Chem. Engng Commun., 137, 177}190.
US DOE, National Renewable Energy Laboratory, 1995, Hydrogenproduct overview.
Williams, R. (1933). Hydrogen production. U.S. Patent 1,938,202.
3552 B. Balasubramanian et al. /Chemical Engineering Science 54 (1999) 3543}3552
Copyright © 2022 FDOKUMEN