Boron Removal by Sorption on Modified Chitosan Hydrogel ...
18
materials Article Boron Removal by Sorption on Modified Chitosan Hydrogel Beads Joanna Kluczka 1, * , Gabriela Dudek 2 , Wojciech Pudlo 3 , Alicja Kazek-K ˛ esik 1 and Roman Turczyn 2 Citation: Kluczka, J.; Dudek, G.; Pudlo, W.; Kazek-K˛ esik, A.; Turczyn, R. Boron Removal by Sorption on Modified Chitosan Hydrogel Beads. Materials 2021, 14, 5646. https:// doi.org/10.3390/ma14195646 Academic Editors: Valentina Gargiulo and Dorota Kolody ´ nska Received: 5 August 2021 Accepted: 24 September 2021 Published: 28 September 2021 Publisher’s Note: MDPI stays neutral with regard to jurisdictional claims in published maps and institutional affil- iations. Copyright: © 2021 by the authors. Licensee MDPI, Basel, Switzerland. This article is an open access article distributed under the terms and conditions of the Creative Commons Attribution (CC BY) license (https:// creativecommons.org/licenses/by/ 4.0/). 1 Department of Inorganic, Analytical Chemistry and Electrochemistry, Faculty of Chemistry, Silesian University of Technology, B. Krzywoustego 6, 44-100 Gliwice, Poland; [email protected] 2 Department of Physical Chemistry and Technology of Polymers, Faculty of Chemistry, Silesian University of Technology, ks. M. Strzody 9, 44-100 Gliwice, Poland; [email protected] (G.D.); [email protected] (R.T.) 3 Department of Chemical Engineering and Process Design, Faculty of Chemistry, Silesian University of Technology, ks. M. Strzody 7, 44-100 Gliwice, Poland; [email protected] * Correspondence: [email protected]; Tel.: +48-32-237-1383 Abstract: An excess concentration of boron in irrigation and drinking water can negatively affect the yield of plants and the human nervous system, respectively. To meet the recommended levels, hybrid biosorbent hydrogel beads based on chitosan and manganese (II-IV) were employed for the removal of boron from aqueous media. The results showed that the biosorbent effectively removed boric acid from the aqueous medium at neutral pH over a sorption time of 2 h and the liquid/hydrogel ratio of 20 mL/g, achieving a maximum sorption capacity near 190 mg/g. The modeling of the sorption equilibrium data indicated that the Freundlich isotherm equation gave the best fit out of the isotherm models examined. A pseudo-second-order model was found to best describe the sorption kinetics. The favorable attachment of manganese to the chitosan structure enabled the sorption of boron and was confirmed by FTIR, RS, XRD, SEM and ICP-OES methods. Boron desorption from the spent biosorbent was successfully achieved in three cycles using a NaOH solution. In general, the results of this research indicate that this method is one of the possibilities for improving water quality and may contribute to reducing pollution of the aquatic environment. Keywords: boron; removal; sorption; chitosan hydrogel beads; manganese ions 1. Introduction Boron is a low-abundance element in the Earth’s crust. As the first element in group 13 of the periodic table, its properties differ significantly from those of the other boron group elements. Boron is a non-metal, occurring in nature in the form of minerals, such as borax and kernite. In a natural water ecosystem, the concentration of boron is usually small and does not exceed 0.5 mg/L in freshwater. However, increased boron levels can be observed locally due to some natural or anthropogenic factors. Consequently, the amount of boron in waters ranges widely, in groundwater from <0.3 to >100 mg/L (from <0.5 to >1.5 mg/L in EU) and in surface water from <0.001 to even >360 mg/L (from <0.001 to >2 mg/L in EU), which is the case with boron-rich deposit occurrence or wastewater discharges [1]. For most of the world, the concentration of boron in drinking water is judged to be below 0.5 mg/L [2], which is closely related to the amount of boron in fresh waters, which are a principal source of drinking water. In regions with increased volcanic activity or boron mining, such as Turkey, the boron concentration in tap water can be as high as 29 mg/L [3]. Since boron can negatively affect the nervous system in humans and mammals, as well as significantly reduce the yield of plants susceptible to excessive boron, it is recom- mended to remove it from drinking water, irrigation water, and watercourses down to a concentration limit ranging from 3 mg/L to 0.1 mg/L, depending on the recommendations of the country concerned [4,5]. Materials 2021, 14, 5646. https://doi.org/10.3390/ma14195646 https://www.mdpi.com/journal/materials
-
Upload
khangminh22 -
Category
Documents
-
view
2 -
download
0
Transcript of Boron Removal by Sorption on Modified Chitosan Hydrogel ...

materials
Article
Boron Removal by Sorption on Modified ChitosanHydrogel Beads
Joanna Kluczka 1,* , Gabriela Dudek 2 , Wojciech Pudło 3, Alicja Kazek-Kesik 1 and Roman Turczyn 2
�����������������
Citation: Kluczka, J.; Dudek, G.;
Pudło, W.; Kazek-Kesik, A.; Turczyn,
R. Boron Removal by Sorption on
Modified Chitosan Hydrogel Beads.
Materials 2021, 14, 5646. https://
doi.org/10.3390/ma14195646
Academic Editors: Valentina Gargiulo
and Dorota Kołodynska
Received: 5 August 2021
Accepted: 24 September 2021
Published: 28 September 2021
Publisher’s Note: MDPI stays neutral
with regard to jurisdictional claims in
published maps and institutional affil-
iations.
Copyright: © 2021 by the authors.
Licensee MDPI, Basel, Switzerland.
This article is an open access article
distributed under the terms and
conditions of the Creative Commons
Attribution (CC BY) license (https://
creativecommons.org/licenses/by/
4.0/).
1 Department of Inorganic, Analytical Chemistry and Electrochemistry, Faculty of Chemistry,Silesian University of Technology, B. Krzywoustego 6, 44-100 Gliwice, Poland; [email protected]
2 Department of Physical Chemistry and Technology of Polymers, Faculty of Chemistry, Silesian University ofTechnology, ks. M. Strzody 9, 44-100 Gliwice, Poland; [email protected] (G.D.);[email protected] (R.T.)
3 Department of Chemical Engineering and Process Design, Faculty of Chemistry, Silesian University ofTechnology, ks. M. Strzody 7, 44-100 Gliwice, Poland; [email protected]
* Correspondence: [email protected]; Tel.: +48-32-237-1383
Abstract: An excess concentration of boron in irrigation and drinking water can negatively affect theyield of plants and the human nervous system, respectively. To meet the recommended levels, hybridbiosorbent hydrogel beads based on chitosan and manganese (II-IV) were employed for the removalof boron from aqueous media. The results showed that the biosorbent effectively removed boric acidfrom the aqueous medium at neutral pH over a sorption time of 2 h and the liquid/hydrogel ratioof 20 mL/g, achieving a maximum sorption capacity near 190 mg/g. The modeling of the sorptionequilibrium data indicated that the Freundlich isotherm equation gave the best fit out of the isothermmodels examined. A pseudo-second-order model was found to best describe the sorption kinetics.The favorable attachment of manganese to the chitosan structure enabled the sorption of boron andwas confirmed by FTIR, RS, XRD, SEM and ICP-OES methods. Boron desorption from the spentbiosorbent was successfully achieved in three cycles using a NaOH solution. In general, the resultsof this research indicate that this method is one of the possibilities for improving water quality andmay contribute to reducing pollution of the aquatic environment.
Keywords: boron; removal; sorption; chitosan hydrogel beads; manganese ions
1. Introduction
Boron is a low-abundance element in the Earth’s crust. As the first element in group13 of the periodic table, its properties differ significantly from those of the other borongroup elements. Boron is a non-metal, occurring in nature in the form of minerals, such asborax and kernite.
In a natural water ecosystem, the concentration of boron is usually small and does notexceed 0.5 mg/L in freshwater. However, increased boron levels can be observed locallydue to some natural or anthropogenic factors. Consequently, the amount of boron in watersranges widely, in groundwater from <0.3 to >100 mg/L (from <0.5 to >1.5 mg/L in EU) andin surface water from <0.001 to even >360 mg/L (from <0.001 to >2 mg/L in EU), which isthe case with boron-rich deposit occurrence or wastewater discharges [1]. For most of theworld, the concentration of boron in drinking water is judged to be below 0.5 mg/L [2],which is closely related to the amount of boron in fresh waters, which are a principal sourceof drinking water. In regions with increased volcanic activity or boron mining, such asTurkey, the boron concentration in tap water can be as high as 29 mg/L [3].
Since boron can negatively affect the nervous system in humans and mammals, aswell as significantly reduce the yield of plants susceptible to excessive boron, it is recom-mended to remove it from drinking water, irrigation water, and watercourses down to aconcentration limit ranging from 3 mg/L to 0.1 mg/L, depending on the recommendationsof the country concerned [4,5].
Materials 2021, 14, 5646. https://doi.org/10.3390/ma14195646 https://www.mdpi.com/journal/materials

Materials 2021, 14, 5646 2 of 18
To meet the above recommendations, scientists have considered many methods,such as sorption, ion exchange, co-precipitation, and membrane techniques, to eliminateboron compounds from water and wastewater. Currently, boron is removed using boron-selective resins (BSRs) by the ion exchange technique, most often in systems integrated withother separation techniques, such as precipitation, reverse osmosis, and electrodialysis [6].Despite many advantages, the method has a serious drawback, namely high investmentand operating costs. Sorption is a superior technique because of its low cost, easy operation,and good yield [6,7]. The interest in biosorbents obtained from plants or animal waste hasbeen growing in recent years [8–12]. In addition to the advantages mentioned above, suchbiosorbents often require shorter preparation time, are easily available, biodegradable, anddo not disturb the balance of the ecosystem. Many researchers have tried to remove boronfrom water with various biosorbents. Among them, those based on alginate, cellulose, andchitosan deserve special mention [8,10,11].
Chitosan is a biopolymer separated from the skeleton of crustaceans (such as crabs andshrimp) and the cell walls of fungi. Among other biopolymers, chitosan is characterized byits’ easy ability to create various morphological structures, such as films, fibers, hydrogels,membranes, nanoparticles, and microspheres. One of the fabrication methods of chitosanbeads is a coagulation process. This method takes advantage of the low solubility ofchitosan in alkaline solutions, a polymer that precipitates when in contact with an acidicsolution with a basic medium. Depending on the method of producing the droplets,different sizes of spheres can be obtained: macro-, micro-, or even nano-spheres. Othermethods of obtaining micro- and nano-spheres include the emulsifying of an acidic aqueouschitosan solution in the oil phase combined with a cross-linking and ion gelation of acidicchitosan solution in a solution of tripolyphosphate polyanions. Chitosan films are obtainedby pouring out the solution and gelling it by cross-linking. The choice of fabrication methoddepends on the specific application. Apart from the chemical structure and biologicalactivity, the variety of structural forms enables the use of chitosan in many areas of theeconomy: water and wastewater treatment, the food industry, the textile industry, thepaper industry, the cosmetics industry, pharmacology, and biomedicine [12]. Various waterpollutants, such as metal cations, anions, dyes, and pharmaceuticals, can be captured bythe hydroxyl (OH) and amino (NH2) functional groups present in the chitosan structurethrough chelating effects or electrostatic attraction [12–14]. Modifying chitosan can makethe biopolymer acquire even better properties. One of the modification methods is the cross-linking of chitosan, e.g., with glutaraldehyde, epichlorohydrin, and diethyl ether, whichimproves mechanical and chemical resistance. Another very popular method is mixingchitosan with other substances, such as polymers, e.g., poly(vinyl alcohol), poly(acrylicacid), collagen, gelatin, cellulose, polylactide, and poly(ethylene oxide) [12].
In recent years, the introduction of many transition metal ions to the chitosan skeletonhas been carried out, often giving excellent sorption capacities for anionic pollutants, suchas fluoride, nitrate, phosphate, chromate, vanadate, and borate [15–21]. These hybridmaterials can be synthesized by the incorporation and entrapment (or encapsulation)of metal oxide or other metal compound micro- or nano-particles in a chitosan matrix.In water purification, manganese oxides or zeolites modified with them are often used,because in the process of removing impurities, such as arsenic (III) or chromium (III),manganese oxides combine catalytic oxidation and sorption [22]. The efficient removalof arsenic from water using granular sorbent Fe–Mn binary oxide-impregnated chitosanbeads was reported by Qi et al. [23]. The separation of Co (II) ions from environmentalsample solutions by a MnFe2O4/bentonite nanocomposite (a magnetic nanomaterial)was described by Rahmani et al. [24]. Muliwa et al. [25] reported manganese removalfrom water using chitosan/bentonite/MnO composite beads. The removal of nickel fromgroundwater by iron and manganese oxides was carried out by Matern et al. [26]. Saeedet al. [27] synthesized a manganese oxide-polyvinyl chloride (MnO2-PVC) composite forthe removal of methylene blue from aqueous solutions. Another way to introduce sometransition metal ions to the chitosan skeleton is via direct coagulation of the hybrid material
Materials 2021, 14, 5646 3 of 18
during contact with metal salt dissolved in acidic chitosan solution with a base solution.The authors have reported the use of various cations, such as Ni2+, Fe3+, Co2+, and Zr4+,to turn raw chitosan into an effective sorbent for borate [10,19–21]. However, until now,boron recovery using manganese, both alone and together with chitosan, has not beencomprehensively studied.
Bearing in mind the possibility of using manganese compounds in water and wastew-ater treatment technology, as well as the favorable results of preliminary studies of boronsorption on freshly precipitated manganese hydroxide, in this study, we designed a sor-bent that was a combination of manganese and chitosan. Chitosan acted as a matrix, andits granular form had a task to facilitate the separation of sorbent from the water afterthe purification process. The purpose of the present study was to characterize the newbiosorbent based on a chitosan matrix with trapped manganese (II) ions introduced to thechitosan skeleton by coagulation, to study the equilibrium of boron sorption using thishybrid biosorbent in a batch system, and to determine the possibility of boron desorptionand the reusability of this hybrid biosorbent.
2. Materials and Methods2.1. Reagents
Chitosan (molecular weight 600,000–800,000) was purchased from Acros Organics(Geel, Belgium); its degree of deacetylation, determined by a 1H NMR method, was 97%.Manganese chloride, MnCl2·4H2O, and other reagents, namely potassium nitrate, sodiumhydroxide, and hydrochloric acid, were supplied by Avantor Performance Materials PolandS.A., Gliwice, Poland. A working boron solution of a concentration of 5 g/L was preparedusing boric acid provided by Avantor Performance Materials Poland S.A., Gliwice, Poland.A basic standard solution of boron in the form of boric acid (1 g/L) and a manganesestandard solution of 1 g/L were supplied by Merck.
2.2. Biosorbent Preparation
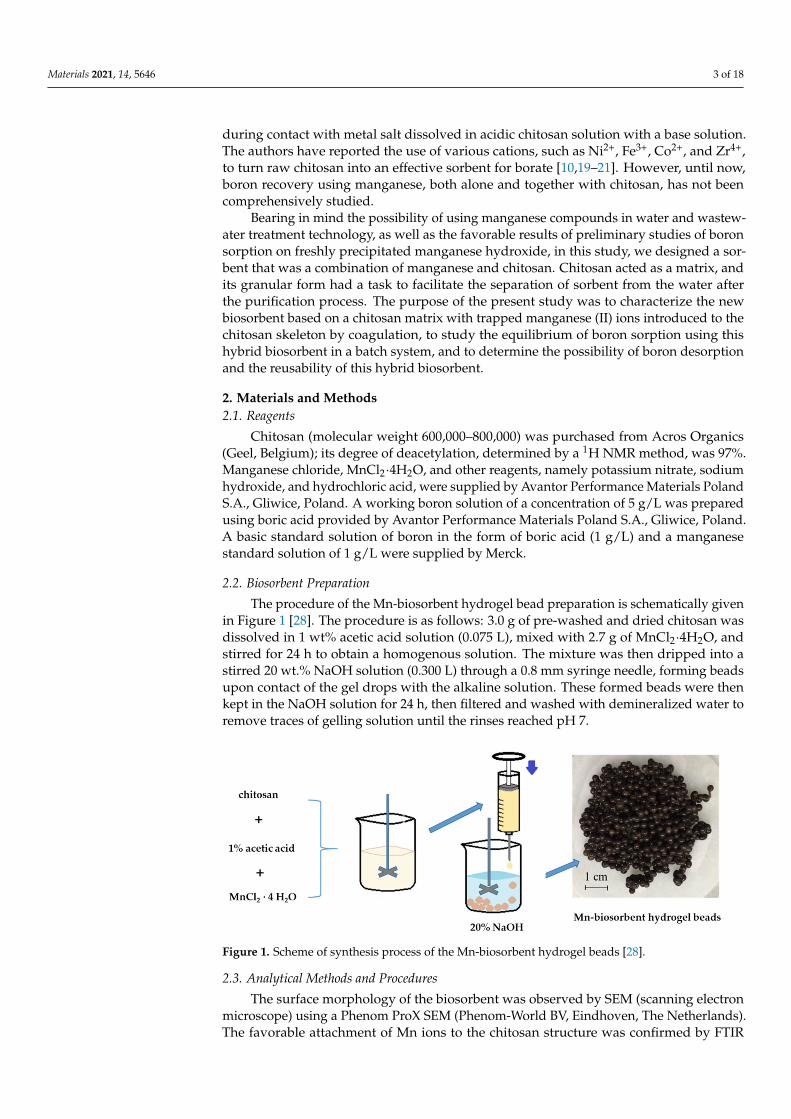
The procedure of the Mn-biosorbent hydrogel bead preparation is schematically givenin Figure 1 [28]. The procedure is as follows: 3.0 g of pre-washed and dried chitosan wasdissolved in 1 wt% acetic acid solution (0.075 L), mixed with 2.7 g of MnCl2·4H2O, andstirred for 24 h to obtain a homogenous solution. The mixture was then dripped into astirred 20 wt.% NaOH solution (0.300 L) through a 0.8 mm syringe needle, forming beadsupon contact of the gel drops with the alkaline solution. These formed beads were thenkept in the NaOH solution for 24 h, then filtered and washed with demineralized water toremove traces of gelling solution until the rinses reached pH 7.
Materials 2021, 14, x FOR PEER REVIEW 4 of 18
Figure 1. Scheme of synthesis process of the Mn-biosorbent hydrogel beads [28].
2.3. Analytical Methods and Procedures The surface morphology of the biosorbent was observed by SEM (scanning electron
microscope) using a Phenom ProX SEM (Phenom-World BV, Eindhoven, The Nether-lands). The favorable attachment of Mn ions to the chitosan structure was confirmed by FTIR (Fourier-transform infrared) using a Spectrum Two spectrometer (PerkinElmer, Waltham, MA, USA). The RS (Raman spectroscopy) spectra obtained with a spectrometer (inVia confocal Raman microscope, Renishaw plc, United Kingdom) were used to confirm boron sorption on the biosorbent. The phase composition of the biosorbent was deter-mined using a Seifert 3003TT X-ray powder diffractometer with a Cu X-ray tube (Seifert, Ahrensburg, Germany). The specific surface area was determined by low nitrogen ad-sorption (using a Micromeritics ASAP 2020 adsorption analyzer, Micromeritics Inc., Nor-cross, GA, USA) using the Brunauer–Emmett–Teller equation (BET equation) [29]. Before the analyses, the chitosan beads were lyophilized using a freeze drier (Christ Alpha 1-2 LDplus, Martin Christ GmbH, Osterode am Harz, Germany) to remove the water from the pore structure. The samples were lyophilized for 70 h at −22 °C with condenser adjust-ment under a reduced pressure of 0.54 to 0.33 mbar. For the FTIR, RS, XRD, and BET methods, a portion of the dry beads was powdered in an agate mortar. Prior to taking the nitrogen adsorption measurements, each chitosan sample was outgassed for 24 h under vacuum at 333 K.
A point of zero charge on a surface of the biosorbent was determined according to the method of Balistrieri and Murray [30], as described in the previous paper [31]. Briefly, to a series of solutions containing 0.025 L of 0.01 M KNO3 with differing pH values from 4 to 9, 0.5 g of the biosorbent was added. After 72 h of equilibration with discontinuous shaking, the pH value of the supernatant liquid was noted using a pH meter (Basic 20+, Crison Instruments, Barcelona, Spain). The point of zero charge (pHpzc) of the biosorbent surface was read by graphically plotting ΔpH (the difference between the initial and equi-libration pH) against the initial pH. The solution pH at which ΔpH = 0 was the pHpzc of the biosorbent.
The boron and manganese concentrations in the solutions were determined by ICP-OES (inductively coupled plasma optical emission spectroscopy) with a Varian 710-ES spectrometer (Varian, Mulgrave, Victoria, Australia).
2.4. Sorption and Desorption Studies The sorption experiments were carried out with 1 g of the Mn-biosorbent in the form
of hydrogel beads and boron solution obtained by appropriately diluting a 5 g/L working solution. The mixture of the boron solution and the biosorbent was agitated at 60 rpm in an orbital shaker. The biosorbent was then filtered from the solution to determine the bo-ron and manganese concentrations in the latter. Each experiment was repeated two or three times to obtain repeatable results.
Figure 1. Scheme of synthesis process of the Mn-biosorbent hydrogel beads [28].
2.3. Analytical Methods and Procedures
The surface morphology of the biosorbent was observed by SEM (scanning electronmicroscope) using a Phenom ProX SEM (Phenom-World BV, Eindhoven, The Netherlands).The favorable attachment of Mn ions to the chitosan structure was confirmed by FTIR

Materials 2021, 14, 5646 4 of 18
(Fourier-transform infrared) using a Spectrum Two spectrometer (PerkinElmer, Waltham,MA, USA). The RS (Raman spectroscopy) spectra obtained with a spectrometer (inViaconfocal Raman microscope, Renishaw plc, United Kingdom) were used to confirm boronsorption on the biosorbent. The phase composition of the biosorbent was determined usinga Seifert 3003TT X-ray powder diffractometer with a Cu X-ray tube (Seifert, Ahrensburg,Germany). The specific surface area was determined by low nitrogen adsorption (usinga Micromeritics ASAP 2020 adsorption analyzer, Micromeritics Inc., Norcross, GA, USA)using the Brunauer–Emmett–Teller equation (BET equation) [29]. Before the analyses, thechitosan beads were lyophilized using a freeze drier (Christ Alpha 1-2 LDplus, MartinChrist GmbH, Osterode am Harz, Germany) to remove the water from the pore structure.The samples were lyophilized for 70 h at −22 ◦C with condenser adjustment under areduced pressure of 0.54 to 0.33 mbar. For the FTIR, RS, XRD, and BET methods, a portionof the dry beads was powdered in an agate mortar. Prior to taking the nitrogen adsorptionmeasurements, each chitosan sample was outgassed for 24 h under vacuum at 333 K.
A point of zero charge on a surface of the biosorbent was determined according tothe method of Balistrieri and Murray [30], as described in the previous paper [31]. Briefly,to a series of solutions containing 0.025 L of 0.01 M KNO3 with differing pH values from4 to 9, 0.5 g of the biosorbent was added. After 72 h of equilibration with discontinuousshaking, the pH value of the supernatant liquid was noted using a pH meter (Basic 20+,Crison Instruments, Barcelona, Spain). The point of zero charge (pHpzc) of the biosorbentsurface was read by graphically plotting ∆pH (the difference between the initial andequilibration pH) against the initial pH. The solution pH at which ∆pH = 0 was the pHpzcof the biosorbent.
The boron and manganese concentrations in the solutions were determined by ICP-OES (inductively coupled plasma optical emission spectroscopy) with a Varian 710-ESspectrometer (Varian, Mulgrave, Victoria, Australia).
2.4. Sorption and Desorption Studies
The sorption experiments were carried out with 1 g of the Mn-biosorbent in the formof hydrogel beads and boron solution obtained by appropriately diluting a 5 g/L workingsolution. The mixture of the boron solution and the biosorbent was agitated at 60 rpm in anorbital shaker. The biosorbent was then filtered from the solution to determine the boronand manganese concentrations in the latter. Each experiment was repeated two or threetimes to obtain repeatable results.
In the studies on the influence of pH on the sorption efficiency, pH was adjusted inthe range of 5 to 10; the solution volume and boron concentration were set at 0.01 L and20 mg/L, respectively; and the process was carried out for 48 h.
For kinetic studies, 4.0 g of the hydrogel beads was added to a volumetric flaskcontaining 0.100 L of boric acid solution at boron concentrations of 20 or 100 mg/L andpH 7 and subsequently agitated for 0.5–72 h. Aliquots were collected at appropriate timeintervals and analyzed in terms of boron and manganese concentrations as describedearlier.
During the isotherm experiments, 1 g of biosorbent beads and 0.020 L boron solutionwith a concentration range of 2–5000 mg/L and a pH adjusted to 7 were placed in contactwith each other for 2 h at 20 ◦C.
The boron sorption capacity (q (mg/g)) was calculated using the following equation:
q =(C0 − C)
m× V0 (1)
where C0 and C are the initial and final concentrations of boron in the solution (mg/L),respectively; V0 is the volume of the solution (L); and m is the dry mass of the biosorbent (g).
To desorb boron from the spent biosorbent, 1 g of biosorbent beads and 0.020 L ofsodium hydroxide solution at a concentration of 0.1, 1.0, or 2.0 mol/L were agitated for 24or 2 h at room temperature. The boron and manganese concentrations were determined in

Materials 2021, 14, 5646 5 of 18
the resulting aliquots based on three experimental results. The boron desorption efficiency,D (%), was calculated using the following equation:
D =qDq
× 100 (2)
where qD is the amount of desorbed boron per dry biosorbent mass (mg/g), calculatedusing the following equation:
qD =CDm
× VNaOH (3)
where CD is the final concentration of boron in the solution after desorption (mg/L),VNaOH is the volume of sodium hydroxide solution (L), and m is the dry mass of the spentbiosorbent (g).
Finally, after the desorption of boron, the hydrogel was tested for reuse in two con-secutive sorption–desorption cycles using the batch sorption and desorption procedurespreviously described, with a sorption and desorption time of 2 h and an initial boronconcentration of 100 mg/L.
3. Results and Discussion3.1. Characterization of the Mn-Biosorbent before and after Boron Sorption3.1.1. Fourier-Transform Infrared Spectroscopy
The FTIR ATR (attenuated total reflectance) spectra and the detailed description ofthe unmodified chitosan beads and those filled with manganese particles are shown inthe Supplementary Materials (Figure S1). The spectrum of the Mn-biosorbent demon-strated two significant absorption peaks at 600 and 420 cm−1 that were characteristic ofMn–O stretching modes in tetrahedral sites, whereas the vibration frequency at 550 cm−1
corresponded to the distortion vibration mode of an Mn–O peak in an octahedral environ-ment [32]. In the spectrum of the Mn-biosorbent after boron sorption (Mn-biosorbent-B), anoticeable weakening of the tetrahedral Mn-O peak at 600 cm−1 and the octahedral Mn-Oband at 550 cm−1, which was hardly visibly in the shoulder, was noted, along with theappearance of two signals at 475 and 414 cm−1, respectively. This was probably an effect ofthe interaction with adsorbed boron species.
3.1.2. X-ray Diffraction
Figure 2 shows the XRD pattern of the Mn-biosorbent. The sample was in the amor-phous crystalline form with a visible broadening of its peaks. The characteristic bumptypical for an amorphous phase was recorded in a range from 10◦ to 25◦ 2θ and indicatedthat some amorphous phases existed in the Mn-biosorbent. In this case, the first peakarising from the Mn3O4 phase was not well defined. The other peaks presented on theXRD pattern corresponded to the Mn3O4 phase (PDF ref. card: 00-016-0154). The verybroad diffraction peaks at 2θ = 20◦ were typical fingerprints of a semi-crystalline polymerand were related to the crystal-II in the chitosan structure, with a relatively high degree ofcrystallinity of the polymer matrix [33].
3.1.3. Scanning Electron Microscopy
Figure 3 shows the SEM images of the Mn-biosorbent composite bead cross-section. Ascan be seen, the biosorbent had a porous inner structure with several layers (Figure 3a). Thefirst was a thin, dense skin layer with a size of a few micrometers. Beneath the skin, the layercomposed of the channels with a diameter of about 3–4 micrometers and perpendicularto the surface was located (Figure 3b). The interior of the beads was composed of acomplex 3D porous network formed by the chitosan matrix (Figure 3c). Such a porousstructure greatly facilitated the Mn-biosorbent beads in their sorption of boron throughoutthe highly developed surface area. As can be seen on the micro-graph (Figure S2b inSupplementary Materials), the structure of the Mn-biosorbent composite bead was notchanged significantly after boron sorption; however, the surface of the biosorbent became

Materials 2021, 14, 5646 6 of 18
denser and smoother, which indicates the sorption of boron species in the pores of theMn-biosorbent bead.
Materials 2021, 14, x FOR PEER REVIEW 6 of 18
Figure 2 shows the XRD pattern of the Mn-biosorbent. The sample was in the amor-phous crystalline form with a visible broadening of its peaks. The characteristic bump typical for an amorphous phase was recorded in a range from 10° to 25° 2θ and indicated that some amorphous phases existed in the Mn-biosorbent. In this case, the first peak aris-ing from the Mn3O4 phase was not well defined. The other peaks presented on the XRD pattern corresponded to the Mn3O4 phase (PDF ref. card: 00-016-0154). The very broad diffraction peaks at 2θ = 20° were typical fingerprints of a semi-crystalline polymer and were related to the crystal-II in the chitosan structure, with a relatively high degree of crystallinity of the polymer matrix [33].
Figure 2. XRD pattern of the Mn-biosorbent.
3.1.3. Scanning Electron Microscopy Figure 3 shows the SEM images of the Mn-biosorbent composite bead cross-section.
As can be seen, the biosorbent had a porous inner structure with several layers (Figure 3a). The first was a thin, dense skin layer with a size of a few micrometers. Beneath the skin, the layer composed of the channels with a diameter of about 3–4 micrometers and perpendicular to the surface was located (Figure 3b). The interior of the beads was com-posed of a complex 3D porous network formed by the chitosan matrix (Figure 3c). Such a porous structure greatly facilitated the Mn-biosorbent beads in their sorption of boron throughout the highly developed surface area. As can be seen on the micro-graph (Figure S2b in Supplementary Materials), the structure of the Mn-biosorbent composite bead was not changed significantly after boron sorption; however, the surface of the biosorbent be-came denser and smoother, which indicates the sorption of boron species in the pores of the Mn-biosorbent bead.
The successful incorporation of the manganese inside the chitosan beads, aside from FTIR spectroscopy, was also confirmed by the EDS elemental analysis conducted during SEM image acquisition. The determined compositions of the unmodified chitosan and Mn-biosorbent beads with incorporated manganese species are presented in Table 1. It should be pointed out that the peak of manganese emerged clearly in the EDS spectrum, confirming that Mn was effectively incorporated into the chitosan hydrogel beads. As could be expected, carbon, nitrogen, and oxygen were the primary elements in the Mn-biosorbent beads, and the content of Mn was approx. 20 wt.%. The sorption of boron ions was not confirmed by EDS due to the limitation of the method associated with its low atomic number.
Figure 2. XRD pattern of the Mn-biosorbent.Materials 2021, 14, x FOR PEER REVIEW 7 of 18
(a) (b) (c)
Figure 3. SEM image of a cross-section of the Mn-biosorbent bead: near-surface layer, mag. 1000× (a); near-surface layer, mag. 5000× (b); and middle area of the bead, mag. 5000× (c).
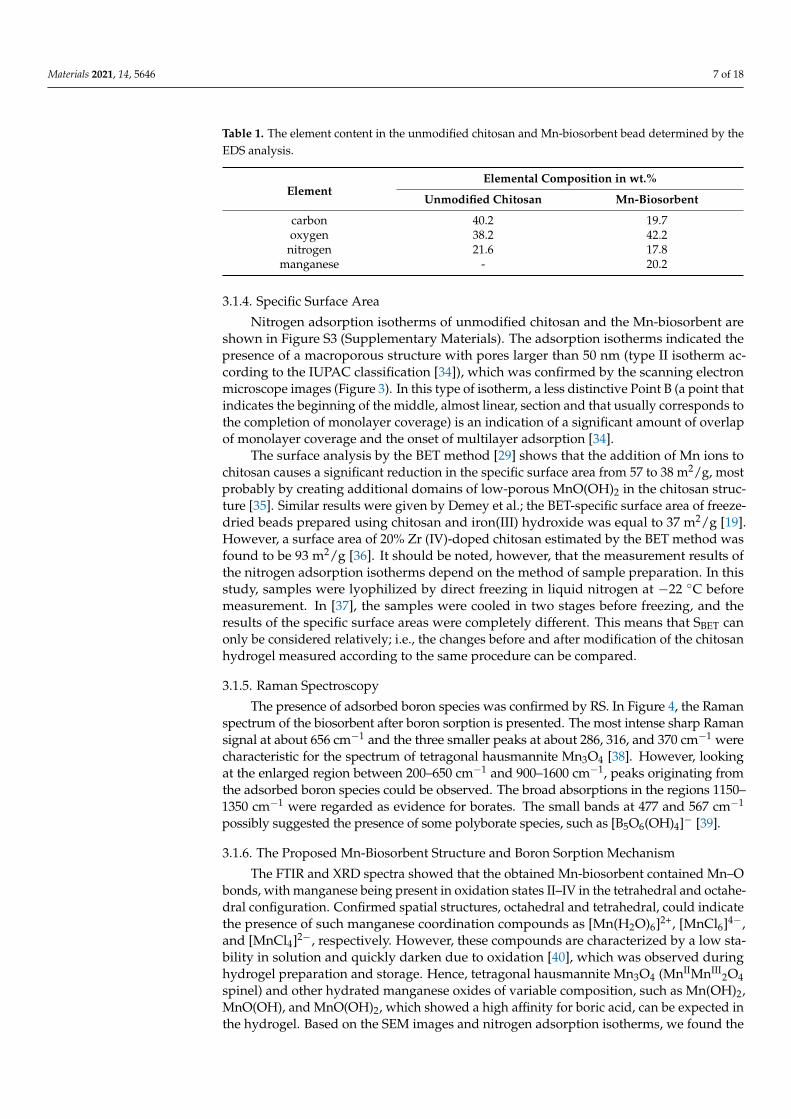
Table 1. The element content in the unmodified chitosan and Mn-biosorbent bead determined by the EDS analysis.
Element Elemental Composition in wt.%
Unmodified Chitosan Mn-Biosorbent carbon 40.2 19.7 oxygen 38.2 42.2
nitrogen 21.6 17.8 manganese - 20.2
3.1.4. Specific Surface Area Nitrogen adsorption isotherms of unmodified chitosan and the Mn-biosorbent are
shown in Figure S3 (Supplementary Materials). The adsorption isotherms indicated the presence of a macroporous structure with pores larger than 50 nm (type II isotherm ac-cording to the IUPAC classification [34]), which was confirmed by the scanning electron microscope images (Figure 3). In this type of isotherm, a less distinctive Point B (a point that indicates the beginning of the middle, almost linear, section and that usually corre-sponds to the completion of monolayer coverage) is an indication of a significant amount of overlap of monolayer coverage and the onset of multilayer adsorption [34].
The surface analysis by the BET method [29] shows that the addition of Mn ions to chitosan causes a significant reduction in the specific surface area from 57 to 38 m2/g, most probably by creating additional domains of low-porous MnO(OH)2 in the chitosan struc-ture [35]. Similar results were given by Demey et al.; the BET-specific surface area of freeze-dried beads prepared using chitosan and iron(III) hydroxide was equal to 37 m2/g [19]. However, a surface area of 20% Zr (IV)-doped chitosan estimated by the BET method was found to be 93 m2/g [36]. It should be noted, however, that the measurement results of the nitrogen adsorption isotherms depend on the method of sample preparation. In this study, samples were lyophilized by direct freezing in liquid nitrogen at −22 °C before measurement. In [37], the samples were cooled in two stages before freezing, and the re-sults of the specific surface areas were completely different. This means that SBET can only be considered relatively; i.e., the changes before and after modification of the chitosan hydrogel measured according to the same procedure can be compared.
Figure 3. SEM image of a cross-section of the Mn-biosorbent bead: near-surface layer, mag. 1000× (a); near-surface layer,mag. 5000× (b); and middle area of the bead, mag. 5000× (c).
The successful incorporation of the manganese inside the chitosan beads, aside fromFTIR spectroscopy, was also confirmed by the EDS elemental analysis conducted duringSEM image acquisition. The determined compositions of the unmodified chitosan andMn-biosorbent beads with incorporated manganese species are presented in Table 1. Itshould be pointed out that the peak of manganese emerged clearly in the EDS spectrum,confirming that Mn was effectively incorporated into the chitosan hydrogel beads. Ascould be expected, carbon, nitrogen, and oxygen were the primary elements in the Mn-biosorbent beads, and the content of Mn was approx. 20 wt.%. The sorption of boron ionswas not confirmed by EDS due to the limitation of the method associated with its lowatomic number.
Materials 2021, 14, 5646 7 of 18
Table 1. The element content in the unmodified chitosan and Mn-biosorbent bead determined by theEDS analysis.
ElementElemental Composition in wt.%
Unmodified Chitosan Mn-Biosorbent
carbon 40.2 19.7oxygen 38.2 42.2
nitrogen 21.6 17.8manganese - 20.2
3.1.4. Specific Surface Area
Nitrogen adsorption isotherms of unmodified chitosan and the Mn-biosorbent areshown in Figure S3 (Supplementary Materials). The adsorption isotherms indicated thepresence of a macroporous structure with pores larger than 50 nm (type II isotherm ac-cording to the IUPAC classification [34]), which was confirmed by the scanning electronmicroscope images (Figure 3). In this type of isotherm, a less distinctive Point B (a point thatindicates the beginning of the middle, almost linear, section and that usually corresponds tothe completion of monolayer coverage) is an indication of a significant amount of overlapof monolayer coverage and the onset of multilayer adsorption [34].
The surface analysis by the BET method [29] shows that the addition of Mn ions tochitosan causes a significant reduction in the specific surface area from 57 to 38 m2/g, mostprobably by creating additional domains of low-porous MnO(OH)2 in the chitosan struc-ture [35]. Similar results were given by Demey et al.; the BET-specific surface area of freeze-dried beads prepared using chitosan and iron(III) hydroxide was equal to 37 m2/g [19].However, a surface area of 20% Zr (IV)-doped chitosan estimated by the BET method wasfound to be 93 m2/g [36]. It should be noted, however, that the measurement results ofthe nitrogen adsorption isotherms depend on the method of sample preparation. In thisstudy, samples were lyophilized by direct freezing in liquid nitrogen at −22 ◦C beforemeasurement. In [37], the samples were cooled in two stages before freezing, and theresults of the specific surface areas were completely different. This means that SBET canonly be considered relatively; i.e., the changes before and after modification of the chitosanhydrogel measured according to the same procedure can be compared.
3.1.5. Raman Spectroscopy
The presence of adsorbed boron species was confirmed by RS. In Figure 4, the Ramanspectrum of the biosorbent after boron sorption is presented. The most intense sharp Ramansignal at about 656 cm−1 and the three smaller peaks at about 286, 316, and 370 cm−1 werecharacteristic for the spectrum of tetragonal hausmannite Mn3O4 [38]. However, lookingat the enlarged region between 200–650 cm−1 and 900–1600 cm−1, peaks originating fromthe adsorbed boron species could be observed. The broad absorptions in the regions 1150–1350 cm−1 were regarded as evidence for borates. The small bands at 477 and 567 cm−1
possibly suggested the presence of some polyborate species, such as [B5O6(OH)4]− [39].
3.1.6. The Proposed Mn-Biosorbent Structure and Boron Sorption Mechanism
The FTIR and XRD spectra showed that the obtained Mn-biosorbent contained Mn–Obonds, with manganese being present in oxidation states II–IV in the tetrahedral and octahe-dral configuration. Confirmed spatial structures, octahedral and tetrahedral, could indicatethe presence of such manganese coordination compounds as [Mn(H2O)6]2+, [MnCl6]4−,and [MnCl4]2−, respectively. However, these compounds are characterized by a low sta-bility in solution and quickly darken due to oxidation [40], which was observed duringhydrogel preparation and storage. Hence, tetragonal hausmannite Mn3O4 (MnIIMnIII
2O4spinel) and other hydrated manganese oxides of variable composition, such as Mn(OH)2,MnO(OH), and MnO(OH)2, which showed a high affinity for boric acid, can be expected inthe hydrogel. Based on the SEM images and nitrogen adsorption isotherms, we found the

Materials 2021, 14, 5646 8 of 18
Mn-biosorbent hydrogel beads had a macroporous structure with several layers. Such aporous structure greatly facilitated the Mn-biosorbent beads in their high sorption of boron.As a result of the sorption process, some polyborate species, such as [B5O6(OH)4]−, werestated in chitosan, which was confirmed by the RS analysis.
Materials 2021, 14, x FOR PEER REVIEW 8 of 18
3.1.5. Raman Spectroscopy The presence of adsorbed boron species was confirmed by RS. In Figure 4, the Raman
spectrum of the biosorbent after boron sorption is presented. The most intense sharp Ra-man signal at about 656 cm−1 and the three smaller peaks at about 286, 316, and 370 cm−1 were characteristic for the spectrum of tetragonal hausmannite Mn3O4 [38]. However, looking at the enlarged region between 200–650 cm−1 and 900–1600 cm−1, peaks originating from the adsorbed boron species could be observed. The broad absorptions in the regions 1150–1350 cm−1 were regarded as evidence for borates. The small bands at 477 and 567 cm−1 possibly suggested the presence of some polyborate species, such as [B5O6(OH)4]− [39].
Figure 4. Raman spectra for the Mn-biosorbent after boron sorption.
3.1.6. The Proposed Mn-Biosorbent Structure and Boron Sorption Mechanism The FTIR and XRD spectra showed that the obtained Mn-biosorbent contained Mn–
O bonds, with manganese being present in oxidation states II–IV in the tetrahedral and octahedral configuration. Confirmed spatial structures, octahedral and tetrahedral, could indicate the presence of such manganese coordination compounds as [Mn(H2O)6]2+, [MnCl6]4−, and [MnCl4]2−, respectively. However, these compounds are characterized by a low stability in solution and quickly darken due to oxidation [40], which was observed during hydrogel preparation and storage. Hence, tetragonal hausmannite Mn3O4 (MnIIMnIII2O4 spinel) and other hydrated manganese oxides of variable composition, such as Mn(OH)2, MnO(OH), and MnO(OH)2, which showed a high affinity for boric acid, can be expected in the hydrogel. Based on the SEM images and nitrogen adsorption isotherms, we found the Mn-biosorbent hydrogel beads had a macroporous structure with several layers. Such a porous structure greatly facilitated the Mn-biosorbent beads in their high sorption of boron. As a result of the sorption process, some polyborate species, such as [B5O6(OH)4]−, were stated in chitosan, which was confirmed by the RS analysis.
3.2. Effect of pH A very significant parameter, which influences the fractionation of boron chemical
forms in water, is the pH of the aqueous solution. Boric acid, B(OH)3, and tetrahydroxy-borate, B(OH)4−, are the main chemical forms of boron in natural water [1]. The concentra-tion of both molecules and anions is determined by the equilibrium state between B(OH)3
Figure 4. Raman spectra for the Mn-biosorbent after boron sorption.
3.2. Effect of pH
A very significant parameter, which influences the fractionation of boron chemicalforms in water, is the pH of the aqueous solution. Boric acid, B(OH)3, and tetrahydroxybo-rate, B(OH)4
−, are the main chemical forms of boron in natural water [1]. The concentrationof both molecules and anions is determined by the equilibrium state between B(OH)3 andB(OH)4
−, which is described by the first dissociation constant pKa of boric acid, which isequal to 9.28 in pure water at a temperature of 20 ◦C [41]. As can be seen in Figure 5, at apH below 7, mainly boric acid molecules were present in the solution (green color line).Both forms occurred in the pH range of 7–11, with anions predominating above pH 9.28(orange color line).
The possible presence of boron in the solution in the forms of a molecule or a complexanion means that an important parameter in the process of boron sorption is the surfacecharge of the sorbent, the so-called point of zero charge on a surface (pHpzc). This point ofzero charge means that the surface of the sorbent has a positive charge below pHpzc anda negative charge above pHpzc. The determined pHpzc value of the Mn-biosorbent was7.7 ± 0.3 (Figure 6). In the case of the adsorptive removal of anions from the aqueoussolution, it is desirable for the sorbent surface to be positively charged. Accordingly, atpH < 7.7, the surface of the Mn-biosorbent was positively charged, and B(OH)4
− anions,which are negatively charged, could be electrostatically attracted to the hydrogel surface.
The influence of the solution’s pH on boron sorption by the Mn-biosorbent is illus-trated in Figure 5 (blue bars). When the pH was in the range of 5 to 7, the sorption capacityremained rather constant; a slight increase up to 0.210 ± 0.014 mg/g was observed at apH of 7. At pH values higher than 7, boron sorption on the Mn-biosorbent was drasticallydecreased, which might be explained by the repulsive force between the negatively chargedB(OH)4
− species that dominated in the alkaline solution and the negative charge of thesorption sites on the surface of Mn-biosorbent that occurred at pH > pHpzc (7.7). As aresult, the boron sorption was depressed with a further increase in the pH value to above 8.

Materials 2021, 14, 5646 9 of 18
Materials 2021, 14, x FOR PEER REVIEW 9 of 18
and B(OH)4−, which is described by the first dissociation constant pKa of boric acid, which is equal to 9.28 in pure water at a temperature of 20 °C [41]. As can be seen in Figure 5, at a pH below 7, mainly boric acid molecules were present in the solution (green color line). Both forms occurred in the pH range of 7–11, with anions predominating above pH 9.28 (orange color line).
Figure 5. Boron sorption capacity (blue bars) and boron speciation (percentage of boric acid—green line, percentage of borate anion—orange line) as a function of initial pH value; mass of the Mn-biosorbent hydrogel beads: 1 g; initial concentration of boron: 20 mg/L; volume of solution: 10 mL; contact time: 48 h; temperature: 20 ± 1 °C.
The possible presence of boron in the solution in the forms of a molecule or a complex anion means that an important parameter in the process of boron sorption is the surface charge of the sorbent, the so-called point of zero charge on a surface (pHpzc). This point of zero charge means that the surface of the sorbent has a positive charge below pHpzc and a negative charge above pHpzc. The determined pHpzc value of the Mn-biosorbent was 7.7 ± 0.3 (Figure 6). In the case of the adsorptive removal of anions from the aqueous solution, it is desirable for the sorbent surface to be positively charged. Accordingly, at pH < 7.7, the surface of the Mn-biosorbent was positively charged, and B(OH)4- anions, which are negatively charged, could be electrostatically attracted to the hydrogel surface.
Figure 6. pHi versus ΔpH for the Mn-biosorbent hydrogel beads.
Figure 5. Boron sorption capacity (blue bars) and boron speciation (percentage of boric acid—greenline, percentage of borate anion—orange line) as a function of initial pH value; mass of the Mn-biosorbent hydrogel beads: 1 g; initial concentration of boron: 20 mg/L; volume of solution: 10 mL;contact time: 48 h; temperature: 20 ± 1 ◦C.
Materials 2021, 14, x FOR PEER REVIEW 9 of 18
and B(OH)4−, which is described by the first dissociation constant pKa of boric acid, which is equal to 9.28 in pure water at a temperature of 20 °C [41]. As can be seen in Figure 5, at a pH below 7, mainly boric acid molecules were present in the solution (green color line). Both forms occurred in the pH range of 7–11, with anions predominating above pH 9.28 (orange color line).
Figure 5. Boron sorption capacity (blue bars) and boron speciation (percentage of boric acid—green line, percentage of borate anion—orange line) as a function of initial pH value; mass of the Mn-biosorbent hydrogel beads: 1 g; initial concentration of boron: 20 mg/L; volume of solution: 10 mL; contact time: 48 h; temperature: 20 ± 1 °C.
The possible presence of boron in the solution in the forms of a molecule or a complex anion means that an important parameter in the process of boron sorption is the surface charge of the sorbent, the so-called point of zero charge on a surface (pHpzc). This point of zero charge means that the surface of the sorbent has a positive charge below pHpzc and a negative charge above pHpzc. The determined pHpzc value of the Mn-biosorbent was 7.7 ± 0.3 (Figure 6). In the case of the adsorptive removal of anions from the aqueous solution, it is desirable for the sorbent surface to be positively charged. Accordingly, at pH < 7.7, the surface of the Mn-biosorbent was positively charged, and B(OH)4- anions, which are negatively charged, could be electrostatically attracted to the hydrogel surface.
Figure 6. pHi versus ΔpH for the Mn-biosorbent hydrogel beads. Figure 6. pHi versus ∆pH for the Mn-biosorbent hydrogel beads.
3.3. Kinetic Study
The influence of contact time, t, on boron sorption capacity, q, is shown in Figure 7.An equilibrium state was achieved after 2 h for the initial concentrations of boron 20 mg/Land 100 mg/L. To determine the kinetics of sorption, three kinetic models, namely thepseudo-first-order, the pseudo-second-order, and the parabolic diffusion models, weretested [42–44]. The pseudo-first-order kinetic model is given by Equation (4):
qt = qe × (1 − Exp(−k1 × t)) (4)
where qt and qe are the amounts of boron sorbed (mg/g) at any time t and at the time ofequilibrium, and k1 is the pseudo-first-order rate constant for the sorption process (1/h).The pseudo-second-order kinetic equation is expressed by Equation (5):
tqt
=1
k2 × (qe)2 +
tqe
(5)

Materials 2021, 14, 5646 10 of 18
where k2 is the pseudo-second-order rate constant (g/(mg × h)). Moreover, an initialsorption rate, r (mg/(g × h)), at t = 0, can be calculated using the constant k2 according toEquation (6):
r = k2 × (qe)2 (6)
Materials 2021, 14, x FOR PEER REVIEW 11 of 18
(a) (b)
Figure 7. Effect of contact time on boron sorption efficiency using Mn-biosorbent hydrogel beads and boron sorption fit with kinetic and diffusion model; initial boron concentration: 20 mg/L (a) and 100 mg/L (b).
Table 2. Kinetic parameters for boron sorption on the Mn-biosorbent hydrogel beads at 20 ± 1 °C.
Initial Boron Concentration Experimental Capacity Parameters of the Kinetic Models
Pseudo-first order C0 (mg/L) qexpt (mg/g) q1 (mg/g) K1 (g/(mg × h)) R12
20 1.08 0.167 −0.006 0.133 100 4.79 0.439 0.040 0.386
Pseudo-second order C0 (mg/L) qexpt (mg/g) q2 (mg/g) k2 (g/(mg × h)) R22 r (mg/(g × h))
20 1.08 1.14 3.41 0.999 4.40 100 4.79 4.86 1.90 0.999 44.8
Intraparticle diffusion model C0 (mg/L) qexpt (mg/g) q3 (mg/g) Kp (mg/(g × (h)1/2)) R32
20 1.08 0.950 0.028 0.552 100 4.79 4.07 0.136 0.377
3.4. Sorption Isotherms The sorption capacity of the Mn-biosorbent for boron was evaluated by isothermal
experiments, and the results are shown in Figure 8. The Mn-biosorbent was characterized by a high sorption capacity for boron; the experimental sorption capacity achieved a value of 187 ± 10 mg/g at 20 °C and a pH value of 7, with a contact time of 2 h and an initial boron concentration of C0 = 5 g/L. As can be seen in Figure 8a, the sorption isotherm was regular, positive, and slightly convex to the consistency axis. The initial slope was steep (see the inserted figure in Figure 8a showing the isotherm in the concentration range 2–100 mg/L), indicating that the affinity of the hydrogel beads to boron is strong. Such an isotherm was classified as the L-class and the 1-subgroup according to the classification of Giles et al. [46].
To describe the experimental data, three two-parameter models of isotherms were applied: the Langmuir, Freundlich, and Dubinin–Radushkevich equations [47–49]. The Langmuir model (Equation (8)) supposes a homogeneous surface with regard to the en-ergy of sorption, which is equal for each surface site; no interaction between the sorbed species; and an equal availability of each sorption site to all the sorbed species.
Figure 7. Effect of contact time on boron sorption efficiency using Mn-biosorbent hydrogel beads and boron sorption fitwith kinetic and diffusion model; initial boron concentration: 20 mg/L (a) and 100 mg/L (b).
The overall kinetics of the sorption from solutions may be governed by diffusionalprocesses as well as by the kinetics of the surface chemical reaction. In diffusion studies,the rate is often expressed in terms of the square root of time (Equation (7)):
qt = kp × t1/2 (7)
where kp is the intraparticle diffusion rate constant (mg/(g/(h)1/2)).The parameters of the three kinetic models and their correlation coefficients, R2, for
two initial boron concentrations are listed in Table 2. The calculated values of R2 forthe pseudo-first-order kinetic and the intraparticle diffusion equations were very low,indicating that these models are not applicable to the discussed process. For the pseudo-second-order kinetic model, the coefficients R2
2 were 0.999, which meant a good correlationbetween this model and the experimental data. The calculated values of q2 agreed with theexperimental sorption capacity, and the initial sorption rate, r, increased when the initialboron concentration increased from 20 to 100 mg/L.
The results indicated that the pseudo-second-order model gave an excellent descrip-tion of boron sorption on the solid surfaces of the Mn-biosorbent hydrogel beads forinitial concentrations of boron ≤ 100 mg/L. This meant that the sorption rate of boronspecies in hydrogel beads could be controlled by the chemisorption. We suggest the non-homogeneous process was caused by the inseparability of the transport phenomena andthe chemical reactions. A similar case was also noted by other researchers; e.g., the sorp-tion of copper ions in chitosan granules also proceeded according to a mixed mechanismcombining the chemical reaction with diffusion inside the porous structure of chitosan [45].
3.4. Sorption Isotherms
The sorption capacity of the Mn-biosorbent for boron was evaluated by isothermalexperiments, and the results are shown in Figure 8. The Mn-biosorbent was characterizedby a high sorption capacity for boron; the experimental sorption capacity achieved a valueof 187 ± 10 mg/g at 20 ◦C and a pH value of 7, with a contact time of 2 h and an initialboron concentration of C0 = 5 g/L. As can be seen in Figure 8a, the sorption isothermwas regular, positive, and slightly convex to the consistency axis. The initial slope was

Materials 2021, 14, 5646 11 of 18
steep (see the inserted figure in Figure 8a showing the isotherm in the concentration range2–100 mg/L), indicating that the affinity of the hydrogel beads to boron is strong. Such anisotherm was classified as the L-class and the 1-subgroup according to the classification ofGiles et al. [46].
Table 2. Kinetic parameters for boron sorption on the Mn-biosorbent hydrogel beads at 20 ± 1 ◦C.
Initial Boron Concentration Experimental Capacity Parameters of the Kinetic Models
Pseudo-first orderC0 (mg/L) qexpt (mg/g) q1 (mg/g) K1 (g/(mg × h)) R1
2
20 1.08 0.167 −0.006 0.133100 4.79 0.439 0.040 0.386
Pseudo-second orderC0 (mg/L) qexpt (mg/g) q2 (mg/g) k2 (g/(mg × h)) R2
2 r (mg/(g × h))20 1.08 1.14 3.41 0.999 4.40
100 4.79 4.86 1.90 0.999 44.8
Intraparticle diffusion modelC0 (mg/L) qexpt (mg/g) q3 (mg/g) Kp (mg/(g × (h)1/2)) R3
2
20 1.08 0.950 0.028 0.552100 4.79 4.07 0.136 0.377
Materials 2021, 14, x FOR PEER REVIEW 12 of 18
(a) (b)
(c) (d)
Figure 8. Sorption isotherms of boron on the Mn-biosorbent hydrogel beads at 20 °C: sorption capacity vs. equilibrium boron concentration; initial boron concentration range: 10–5000 mg/L and 2–100 mg/L (the inserted figure) (a); boron sorption data fitted with Langmuir model (b); boron sorption data fitted with Freundlich model (c); boron sorption data fitted with Dubinin–Radushkevich model (d); pH: 7.0; hydrogel dose: 1 g/20 mL.
𝑞 = 𝑞 × 𝐵 × 𝐶1 + 𝐵 × 𝐶 (8)
where qe is the amount of boron adsorbed at equilibrium (mg/g), Ce is the concentration of boron in the solution at equilibrium (mg/L), and qm and B are the Langmuir parameters: qm is the sorption capacity (mg/g), which is equal to the maximum amount of boron that can be sorbed by the biosorbent as a monolayer, and B is an equilibrium constant that corresponds to the sorption energy (L/mg). The Freundlich model (Equation (9)) is appli-cable to the sorption process that occurs on heterogeneous surfaces on which there are several kinds of sorption sites, each having a different energy: 𝑞 = 𝐾 × 𝐶 / (9)
where the parameters K ((mg/g)(L/mg)1/n) and n relate to the sorption capacity and the sorption intensity of the biosorbent, respectively. The Dubinin–Radushkevich (Equation (10)) equation is a local isotherm in which the sorption follows a micropore filling mech-anism: 𝑞 = 𝑥 × 𝑒 ( ) (10)
Figure 8. Sorption isotherms of boron on the Mn-biosorbent hydrogel beads at 20 ◦C: sorption capacity vs. equilibriumboron concentration; initial boron concentration range: 10–5000 mg/L and 2–100 mg/L (the inserted figure) (a); boronsorption data fitted with Langmuir model (b); boron sorption data fitted with Freundlich model (c); boron sorption datafitted with Dubinin–Radushkevich model (d); pH: 7.0; hydrogel dose: 1 g/20 mL.
To describe the experimental data, three two-parameter models of isotherms wereapplied: the Langmuir, Freundlich, and Dubinin–Radushkevich equations [47–49]. TheLangmuir model (Equation (8)) supposes a homogeneous surface with regard to the energy

Materials 2021, 14, 5646 12 of 18
of sorption, which is equal for each surface site; no interaction between the sorbed species;and an equal availability of each sorption site to all the sorbed species.
qe = qm × B × Ce
1 + B × Ce(8)
where qe is the amount of boron adsorbed at equilibrium (mg/g), Ce is the concentrationof boron in the solution at equilibrium (mg/L), and qm and B are the Langmuir parameters:qm is the sorption capacity (mg/g), which is equal to the maximum amount of boronthat can be sorbed by the biosorbent as a monolayer, and B is an equilibrium constantthat corresponds to the sorption energy (L/mg). The Freundlich model (Equation (9)) isapplicable to the sorption process that occurs on heterogeneous surfaces on which thereare several kinds of sorption sites, each having a different energy:
qe = K × Ce1/n (9)
where the parameters K ((mg/g)(L/mg)1/n) and n relate to the sorption capacity andthe sorption intensity of the biosorbent, respectively. The Dubinin–Radushkevich (Equa-tion (10)) equation is a local isotherm in which the sorption follows a micropore fillingmechanism:
qe = xm × e−(kε2) (10)
where ε is the Polanyi potential, which is equal to RTln (1 + 1/Ce); xm is the sorptioncapacity (mg/g); k is a constant corresponding to the sorption energy (mol2/kJ2); T is thetemperature (K); and R is the gas constant (kJ/(mol × K)). From the Dubinin–Radushkevichmodel, the sorption energy can be calculated according to the following equation:
E = −(2k)−(0.5) (11)
The calculated parameters and correlation coefficients are presented in Table 3. Theexperimental data in the range of the initial boron concentration 2–100 mg/L fitted theFreundlich equation better than the Langmuir and Dubinin–Radushkevich models be-cause the correlation coefficient (R2) was 0.9996. Although the Langmuir model gave thehigh value of correlation coefficient (R2 = 0.9950), the calculated value of the parameterqm = 4.1 mg/g (sorption capacity of a monolayer) differed from the experimental capacityqexp = 4.8 mg/g, which excluded the full interpretation of the process by the Langmuirmodel. In contrast, the Freundlich model gave the highest value of the correlation coeffi-cient R2 and a parameter n greater than 1, which indicated favorable sorption and showedthis model to be adequate for describing the discussed process [50]. Furthermore, theFreundlich model usually corresponds to the sorption process on heterogeneous surfaces,which confirms the conclusions of the kinetic studies. As can be seen in Table 3, theDubinin–Radushkevich model was less suitable because of the slightly lower correlationcoefficient. The calculated value of Xm (the sorption capacity of the micropores) equaled21.8 mg/g and was not in agreement with the experimental sorption capacity (4.8 mg/g).The calculated value of the sorption energy (E), less than 20 kJ/mol, could mean thatthe sorption of boron on the Mn-biosorbent proceeded by means of weak Van der Waalsforces [50].
Table 3. Langmuir, Freundlich, and Dubinin–Radushkevich isotherm parameters for boron sorption on the Mn-biosorbenthydrogel beads at 20 ± 1 ◦C.
Langmuir Model Freundlich Model Dubinin–Radushkevich Model
qm (mg/g) B (L/mg) R2 KF ((mg/g)(L/mg)1/n) n R2 xm (mg/g) E (kJ/mol) R2
4.1 0.0195 0.9950 0.068 1.035 0.9996 21.8 −7.1 0.9914

Materials 2021, 14, 5646 13 of 18
3.5. Desorption of Boron
Based on the boron sorption and capacity results presented in Figure 5, which showthat the sorption capacity of boron on the Mn-biosorbent proceeded very weakly underalkaline conditions, we decided to conduct the desorption experiment in a sodium hy-droxide solution. The influence of the NaOH concentration and contact time on borondesorption efficiency, D (%), is shown in Figure 9. Satisfactory boron desorption, 95 ± 3%,was observed using 2 mol/L NaOH solution after both 24 and 2 h.
Materials 2021, 14, x FOR PEER REVIEW 13 of 18
where ε is the Polanyi potential, which is equal to RTln (1 + 1/Ce); xm is the sorption capac-ity (mg/g); k is a constant corresponding to the sorption energy (mol2/kJ2); T is the temper-ature (K); and R is the gas constant (kJ/(mol×K)). From the Dubinin–Radushkevich model, the sorption energy can be calculated according to the following equation: 𝐸 = −(2𝑘) ( . ) (11)
The calculated parameters and correlation coefficients are presented in Table 3. The experimental data in the range of the initial boron concentration 2–100 mg/L fitted the Freundlich equation better than the Langmuir and Dubinin–Radushkevich models be-cause the correlation coefficient (R2) was 0.9996. Although the Langmuir model gave the high value of correlation coefficient (R2 = 0.9950), the calculated value of the parameter qm = 4.1 mg/g (sorption capacity of a monolayer) differed from the experimental capacity qexp = 4.8 mg/g, which excluded the full interpretation of the process by the Langmuir model. In contrast, the Freundlich model gave the highest value of the correlation coefficient R2 and a parameter n greater than 1, which indicated favorable sorption and showed this model to be adequate for describing the discussed process [50]. Furthermore, the Freun-dlich model usually corresponds to the sorption process on heterogeneous surfaces, which confirms the conclusions of the kinetic studies. As can be seen in Table 3, the Dubinin–Radushkevich model was less suitable because of the slightly lower correlation coefficient. The calculated value of Xm (the sorption capacity of the micropores) equaled 21.8 mg/g and was not in agreement with the experimental sorption capacity (4.8 mg/g). The calcu-lated value of the sorption energy (E), less than 20 kJ/mol, could mean that the sorption of boron on the Mn-biosorbent proceeded by means of weak Van der Waals forces [50].
Table 3. Langmuir, Freundlich, and Dubinin–Radushkevich isotherm parameters for boron sorption on the Mn-biosorbent hydrogel beads at 20 ± 1 °C.
Langmuir Model Freundlich Model Dubinin–Radushkevich Model qm (mg/g) B (L/mg) R2 KF ((mg/g)(L/mg)1/n) n R2 xm (mg/g) E (kJ/mol) R2
4.1 0.0195 0.9950 0.068 1.035 0.9996 21.8 −7.1 0.9914
3.5. Desorption of Boron Based on the boron sorption and capacity results presented in Figure 5, which show
that the sorption capacity of boron on the Mn-biosorbent proceeded very weakly under alkaline conditions, we decided to conduct the desorption experiment in a sodium hy-droxide solution. The influence of the NaOH concentration and contact time on boron desorption efficiency, D (%), is shown in Figure 9. Satisfactory boron desorption, 95 ± 3%, was observed using 2 mol/L NaOH solution after both 24 and 2 h.
Figure 9. The influence of the concentration of NaOH solution and time on boron desorption effi-ciency from the spent Mn-biosorbent hydrogel beads. Figure 9. The influence of the concentration of NaOH solution and time on boron desorptionefficiency from the spent Mn-biosorbent hydrogel beads.
3.6. Reuse and Stability of the Mn-Biosorbent
Sorption–desorption cycles were repeated three times, with a sorption and desorptiontime of 2 h to determine the reusability of the biosorbent. As can be seen in Table 4,the sorption capacity slightly decreased in the second and third cycles. The quantitativedesorption yield in the first cycle was 94% when over 100% in the second and third cycles.Because the stability of the biosorbent, especially the bond strength between the fillerand chitosan, is a significant factor for qualifying the proposed biosorbent for use inpurifying water or wastewater [51], we checked the leaching of manganese ions fromthe Mn-biosorbent during the sorption and desorption process. The results shown inTable 4 indicated that trace amounts of manganese eluted within sorption and desorptionto the solution, but the Mn concentration was far less than the legal limit of 0.5 mg/L (thelimit for manganese concentration is 0.5 mg/L, both in natural water and in wastewaterdiscarded into the environment [51,52]). Furthermore, we noticed that a compact form ofhydrogel beads was retained after three sorption–desorption cycles (see Figure S4 in theSupplementary Materials).
Table 4. Sorption and desorption efficiency of the Mn-biosorbent hydrogel beads.
Cycle No q (mg/g) D (%)Manganese Concentration in Solution (mg/L)
After Sorption After Desorption
1 4.44 ± 0.20 94.5 ± 2.2 0.010 ± 0.002 0.026 ± 0.0022 4.17 ± 0.18 103.4 ± 3.8 0.027 ± 0.008 0.020 ± 0.0023 4.07 ± 0.07 102.2 ± 3.1 0.023 ± 0.008 0.020 ± 0.001
We also checked the sorbent behavior when it was immersed in high concentrationsolutions of boron, up to 5 g/L. The elution of manganese ions from the biosorbent into thesolution after 2 h of sorption is shown in Figure 10. The concentration of manganese inthe solution after sorption was dependent on the sorption capacity, and it increased withincreasing qe. However, the CMn in the solution was relatively low, even for the highestsorption capacity 187 mg/g and was 0.324 mg/L. This result means that the leaching of

Materials 2021, 14, 5646 14 of 18
manganese ions was below the legal limit of 0.5 mg/L and that there was no secondarymanganese contamination of the treated water.
Materials 2021, 14, x FOR PEER REVIEW 14 of 18
3.6. Reuse and Stability of the Mn-Biosorbent Sorption–desorption cycles were repeated three times, with a sorption and desorp-
tion time of 2 h to determine the reusability of the biosorbent. As can be seen in Table 4, the sorption capacity slightly decreased in the second and third cycles. The quantitative desorption yield in the first cycle was 94% when over 100% in the second and third cycles. Because the stability of the biosorbent, especially the bond strength between the filler and chitosan, is a significant factor for qualifying the proposed biosorbent for use in purifying water or wastewater [51], we checked the leaching of manganese ions from the Mn-bio-sorbent during the sorption and desorption process. The results shown in Table 4 indi-cated that trace amounts of manganese eluted within sorption and desorption to the solu-tion, but the Mn concentration was far less than the legal limit of 0.5 mg/L (the limit for manganese concentration is 0.5 mg/L, both in natural water and in wastewater discarded into the environment [51,52]). Furthermore, we noticed that a compact form of hydrogel beads was retained after three sorption–desorption cycles (see Figure S4 in the Supple-mentary Materials).
Table 4. Sorption and desorption efficiency of the Mn-biosorbent hydrogel beads.
Cycle no q (mg/g) D (%) Manganese Concentration in Solution (mg/L)
After Sorption After Desorption 1 4.44 ± 0.20 94.5 ± 2.2 0.010 ± 0.002 0.026 ± 0.002 2 4.17 ± 0.18 103.4 ± 3.8 0.027 ± 0.008 0.020 ± 0.002 3 4.07 ± 0.07 102.2 ± 3.1 0.023 ± 0.008 0.020 ± 0.001
We also checked the sorbent behavior when it was immersed in high concentration solutions of boron, up to 5 g/L. The elution of manganese ions from the biosorbent into the solution after 2 h of sorption is shown in Figure 10. The concentration of manganese in the solution after sorption was dependent on the sorption capacity, and it increased with increasing qe. However, the CMn in the solution was relatively low, even for the high-est sorption capacity 187 mg/g and was 0.324 mg/L. This result means that the leaching of manganese ions was below the legal limit of 0.5 mg/L and that there was no secondary manganese contamination of the treated water.
Figure 10. The influence of the sorption capacity of boron on the elution of manganese ions from the Mn-biosorbent hydrogel beads. Initial boron concentration C0 = 100–5000 mg/L; biosorbent dose 1 g/20 mL; temperature 20 °C; contact time 2 h.
3.7. Comparison of the Results As mentioned in the introduction, there are many papers on boron removal from
water and wastewater in the available literature, among them are those dealing with re-moval by sorption. This is due to, on the one hand, quite restrictive boron concentration
Figure 10. The influence of the sorption capacity of boron on the elution of manganese ions from theMn-biosorbent hydrogel beads. Initial boron concentration C0 = 100–5000 mg/L; biosorbent dose1 g/20 mL; temperature 20 ◦C; contact time 2 h.
3.7. Comparison of the Results
As mentioned in the introduction, there are many papers on boron removal from waterand wastewater in the available literature, among them are those dealing with removal bysorption. This is due to, on the one hand, quite restrictive boron concentration limits inforce in some countries and, on the other hand, the need to treat water due to its globalscarcity. The result obtained in our research, 187 mg of boron per 1 g of dry Mn-biosorbent(equivalent to a sorption capacity of 13 mg B per 1 g of wet hydrogel), is a very high result,which makes the proposed manganese–chitosan hydrogel competitive to BSRs (a maximalcapacity between 5.9 and 7.2 mg-B/g [53]). Table 5 compares the sorption capacities of theMn-biosorbent and other sorbents reported over the last five years.
Table 5. Comparison of various boron sorbents reported in 2016–2021.
Sorbent/Parameter Temp. (◦C) pH C0 (mg/L) SorbentDosage (g/L) t (h) q (mg/g) Ref.
BSR Amberlite IRA-743 30 9.5 40 10 - 7.5 [6]Alginate–alumina 25 9.5 500 7 72 19.6 [8]
Alumina 25 9.5 500 7 72 4.5 [8]Chitosan–NanoTiO2 25 4 20 50 5 4.3 [10]
Chitosan–NanoCr2O3 25 4 20 50 5 3.5 [10]Chitosan–NanoFe3O4 25 4 20 50 5 4.4 [10]
Chitosan–Fe(OH)3 25 4 20 50 5 7.8 [10]Chitosan–NanoTiO2 25 4 20 50 5 4.3 [10]Chitosan–Co(OH)2 25 8.5 20 50 60 2.5 [31]
Activated carbon F400 25 7 60 10 2 0.85 [54]F400-mannitol 25 8.5 60 10 4 1.5 [54]
Waste tire rubber - 2 17.5 - - 16.7 [55]Glycidol-magnesium ferrite 25 7 100 1 0.5 69.2 [56]
Polyethylenimine-epichlorohydrin resin 25 9 5000 5 24 55 [57]Polyurethane-algae - 7 6.44 OPW * 20 72 0.27 [58]
Cooper oxide nanoparticles 25 7 10 1 24 3.5 [59]Chitosan–Ce(OH)4 20 7 500 100 48 13.5 [60]Chitosan–La(OH)3 20 5 100 100 24 11.1 [61]
Poly (VBC-DVB)-TRIS - 8 500 - - 8.99 [62]Nano-magnetite (Fe3O4) - 8 50 0.5 3 8.44 [63]
Mn-biosorbent 20 7 5000 50 2 187 Present studyMn-biosorbent 20 7 100 50 2 4.8 Present study
* Oil-produced water.

Materials 2021, 14, 5646 15 of 18
4. Conclusions
We prepared an economical, harmless, and recyclable Mn-biosorbent, employingan encapsulation method. The resulting biosorbent in the form of hydrogel beads wascharacterized by its structure and behavior in solution and used for the effective eliminationof boron from aqueous media.
Based on FTIR, XRD, ICP-OES, and EDS analyses, it was found that manganese (II)ions in the new biosorbent were incorporated into the chitosan lattice and that they wereoxidized to MnO(OH) and MnO(OH)2. The surface of the biosorbent was macroporouswith several layers, however, with a much smaller specific surface area relative to thesurface area of the raw chitosan hydrogel (which we determined by the BET method andobserved using an SEM microscope). The reduction in the BET surface indicated that thepores were filled with manganese compounds and that the chemical properties, rather thanthe physical properties, of the surface were of dominant importance for boron sorption.
Thus, the favorable attachment of manganese to the chitosan structure enabled thesorption of boron. The presence of sorbed boron, probably as polyborates, was confirmedby ICP-OES and RS analysis. At pH 7 and within about 2 h, we obtained a maximumsorption capacity of 187 mg/g. The modeling of the experimental data indicated thebest fit occurred for the Freundlich isotherm equation and a pseudo-second-order kineticmodel, which indicated that the sorption process was heterogeneous. We suggest a mixedmechanism combining the chemical reaction with diffusion inside the granule structure ofMn-biosorbent best describes this process.
Furthermore, a satisfactory boron desorption, of around 95%, was observed afterelution with 2 mol/L NaOH solution. The sorption capacity slightly decreased in thesecond and third cycles; however, the quantitative desorption yields in the following cycleswere satisfactory. No significant trace of Mn ions was determined in the eluate when thesorption and desorption proceeded within 2 h.
The high sorption capacity and successful regeneration of the Mn-biosorbent, its sta-bility under the sorption and desorption process, and beads that are suitable for separationfrom aqueous media should enable its application in water treatment. Furthermore, theuse of sodium hydroxide as a desorbing agent is economically viable. After desorption,the resulting solution can be concentrated and then crystallized as borax, which is aninnovative approach to boron recovery from liquid media.
Supplementary Materials: The following are available online at https://www.mdpi.com/article/10.3390/ma14195646/s1, Figure S1: FTIR spectra of the unmodified chitosan, the Mn-biosorbentand the Mn-biosorbent after boron sorption (Mn-biosorbent-B) [28], Figure S2: SEM image of across-section of the Mn-biosorbent bead (a) and SEM image of the Mn-biosorbent after boron sorption(Mn-biosorbent-B) (b), Figure S3: Nitrogen adsorption isotherms for unmodified chitosan and Mn-biosorbent, Figure S4: Photo of the Mn-biosorbent hydrogel beads just after the third boron sorptioncycle completed.
Author Contributions: Conceptualization, J.K.; methodology, J.K.; software, J.K., G.D., A.K.-K.,W.P. and R.T.; validation, J.K.; formal analysis J.K., G.D., A.K.-K., W.P. and R.T.; investigation, J.K.;resources, J.K. and G.D.; data curation, J.K., G.D., A.K.-K., W.P. and R.T.; writing—original draftpreparation, J.K.; writing—review and editing, J.K., G.D., A.K.-K., W.P. and R.T.; visualization, J.K.;supervision, J.K. and R.T.; project administration, J.K.; funding acquisition, J.K. All authors have readand agreed to the published version of the manuscript.
Funding: This research was funded by the Polish Ministry of Science and Higher Education, grantnumber BK-223/RCH1/2020. The APC was funded by the Polish Ministry of Science and HigherEducation, grant number BK–201/RCH1/2021.
Institutional Review Board Statement: Not applicable.
Informed Consent Statement: Not applicable.
Data Availability Statement: Data is contained within the article or supplementary material.

Materials 2021, 14, 5646 16 of 18
Acknowledgments: J.K. thanks Andrzej Milewski for lyophilization of hydrogel beads. J.K. isgrateful to Małgorzata Gnus for preparing the first batch of hydrogel beads for preliminary tests.
Conflicts of Interest: The authors declare no conflict of interest. The funders had no role in the designof the study; in the collection, analyses, or interpretation of data; in the writing of the manuscript; orin the decision to publish the results.
References1. Kabay, N.; Bryjak, M.; Hilal, N. Boron Separation Processes, 1st ed.; Elsevier: Amsterdam, The Netherlands, 2015.2. Guidelines for Drinking-Water Quality, 4th ed.; World Health Organization (WHO): Geneva, Switzerland, 2011; ISBN 978-92-4-154815-1.3. Kuru, R.; Yilmaz, S.; Sacan, O.; Yanardag, R.; Yarat, A.; Sahin, F. Boron concentrations in tap water in many cities of Turkey. Toxicol.
Environ. Chem. 2020, 102, 240–249. [CrossRef]4. Shireen, F.; Nawaz, M.A.; Chen, C.; Zhang, Q.; Zheng, Z.; Sohail, H.; Sun, J.; Cao, H.; Huang, Y.; Bie, Z. Boron: Functions and
Approaches to Enhance Its Availability in Plants for Sustainable Agriculture. Int. J. Mol. Sci. 2018, 19, 1856. [CrossRef] [PubMed]5. Bobrowska-Grzesik, E.; Ciba, J.; Grossman, A.; Kluczka, J.; Trojanowska, J.; Zołotajkin, M. Chemical Elements Compendium; 2 Theta:
Cesky Tesin, Czech Republic, 2013.6. Guan, Z.; Lv, J.; Bai, P.; Guo, X. Boron removal from aqueous solutions by adsorption—A review. Desalination 2016, 383, 29–37.
[CrossRef]7. Kluczka, J. Reactive Polymers in Mercury Removal from Electrolytic Brine. Sep. Sci. Technol. 2009, 44, 3698–3716. [CrossRef]8. Demey, H.; Barron-Zambrano, J.; Mhadhbi, T.; Miloudi, H.; Yang, Z.; Ruiz, M.; Sastre, A.M. Boron Removal from Aqueous
Solutions by Using a Novel Alginate-Based Sorbent: Comparison with Al2O3 Particles. Polymers 2019, 11, 1509. [CrossRef]9. Jakóbik-Kolon, A.; Bok-Badura, J.; Milewski, A.; Karon, K. Long Term and Large-Scale Continuous Studies on Zinc(II) Sorption
and Desorption on Hybrid Pectin-Guar Gum Biosorbent. Polymers 2019, 11, 96. [CrossRef]10. Kluczka, J.; Gnus, M.; Dudek, G.; Turczyn, R. Removal of boron from aqueous solution by composite chitosan beads. Sep. Sci.
Technol. 2017, 52, 1559–1571. [CrossRef]11. Ngwabebhoh, F.A.; Mammadli, N.; Yildiz, U. Bioinspired modified nanocellulose adsorbent for enhanced boron recovery from
aqueous media: Optimization, kinetics, thermodynamics and reusability study. J. Environ. Chem. Eng. 2019, 7. [CrossRef]12. Liu, X.; Zhao, X.; Liu, Y.; Zhang, T. Review on preparation and adsorption properties of chitosan and chitosan composites. Polym.
Bull. 2021, in press. [CrossRef]13. Heydaripour, J.; Gazi, M.; Oladipo, A.A.; Gulcan, H.O. Porous magnetic resin-g-chitosan beads for adsorptive removal of phenolic
compounds. Int. J. Biol. Macromol. 2019, 123, 1125–1131. [CrossRef]14. Wang, J.; Zhuang, S. Removal of various pollutants from water and wastewater by modified chitosan adsorbents. Crit. Rev. Env.
Sci. Technol. 2017, 47, 2331–2386. [CrossRef]15. Liang, P.; Zhang, Y.; Wang, D.; Xu, Y.; Luo, L. Preparation of mixed rare earths modified chitosan for fluoride adsorption. J. Rare
Earths 2013, 31, 817–822. [CrossRef]16. Sowmya, A.; Meenakshi, S. Effective removal of nitrate and phosphate anions from aqueous solutions using functionalised
chitosan beads. Des. Water Treat. 2014, 52, 2583–2593. [CrossRef]17. Zhang, L.; Xia, W.; Teng, B.; Liu, X.; Zhang, W. Zirconium cross-linked chitosan composite: Preparation, characterization and
application in adsorption of Cr(VI). Chem. Eng. J. 2013, 229, 1–8. [CrossRef]18. Zhang, L.; Liu, X.; Xia, W.; Zhang, W. Preparation and characterization of chitosan-zirconium(IV) composite for adsorption of
vanadium(V). Int. J. Biol. Macromol. 2014, 64, 155–161. [CrossRef] [PubMed]19. Demey, H.; Vincent, T.; Ruiz, M.; Nogueras, M.; Sastre, A.M.; Guibal, E. Boron recovery from seawater with a new low-cost
adsorbent material. Chem. Eng. J. 2014, 254, 463–471. [CrossRef]20. Demey, H.; Vincent, T.; Ruiz, M.; Sastre, A.; Guibal, E. Development of a new chitosan/Ni(OH)(2)-based sorbent for boron
removal. Chem. Eng. J. 2014, 244, 576–586. [CrossRef]21. Kluczka, J. Boron Removal from Aqueous Solutions using an Amorphous Zirconium Dioxide. Int. J. Environ. Res. 2015, 9,
711–720.22. Anielak, A.M. High Effective Methods of Water Purification (in Polish); WN PWN SA: Warszawa, Poland, 2015.23. Qi, J.; Zhang, G.; Li, H. Efficient removal of arsenic from water using a granular adsorbent: Fe–Mn binary oxide impregnated
chitosan bead. Bioresour. Technol. 2015, 193, 243–249. [CrossRef]24. Rahmani, A.; Karimi, G.R.; Rahmani, A.; Hosseini, M.; Rahmani, A. Removal/separation of Co(II) ion from environmental sample
solutions by MnFe2O4/bentonite nanocomposite as a magnetic nanomaterial. Des. Water Treat. 2017, 89, 250–257. [CrossRef]25. Muliwa, A.M.; Leswifi, T.Y.; Maity, A.; Ochieng, A.; Onyango, M.S. Fixed-bed operation for manganese removal from water using
chitosan/bentonite/MnO composite beads. Environ. Sci. Pollut. Res. 2018, 25, 18081–18095. [CrossRef]26. Matern, K.; Lux, C.; Ufer, K.; Kaufhold, S.; Mansfeldt, T. Removal of nickel from groundwater by iron and manganese oxides. Int.
J. Environ. Sci. Technol. 2019, 16, 2895–2904. [CrossRef]27. Saeed, T.; Naeem, A.; Mahmood, T.; Ahmad, Z.; Farooq, M.F.; Din, I.U.; Khan, I.W. Comparative study for removal of cationic dye
from aqueous solutions by manganese oxide and manganese oxide composite. Int. J. Environ. Sci. Technol. 2021, 18, 659–672.[CrossRef]

Materials 2021, 14, 5646 17 of 18
28. Kluczka, J.; Kazek-Kesik, A.; Dudek, G. Boron Sorption and Removal Using Hybrid Hydrogel Beads. In Recent Advances inEnvironmental Science from the Euro-Mediterranean and Surrounding Regions, 2nd ed.; Environmental Science and Engineering;Springer: Cham, Switzerland, 2021. [CrossRef]
29. Brunauer, S.; Emmett, P.H.; Teller, E. Adsorption of gases in multimolecular layers. J. Am. Chem. Soc. 1938, 60, 309–319. [CrossRef]30. Balistrieri, L.; Murray, J. The surface-chemistry of goethite (alpha-FeOH) in major ion seawater. Am. J. Sci. 1981, 281, 788–806.
[CrossRef]31. Kluczka, J.; Tórz, A.; Łacka, D.; Kazek-Kesik, A.; Adamek, J. Boron Removal by Adsorption on Cobalt(II) Doped Chitosan
Bio-composite. J. Polym. Environ. 2018, 26, 2039–2048. [CrossRef]32. Peng, T.; Xu, L.; Chen, H. Preparation and characterization of high specific surface area Mn3O4 from electrolytic manganese
residue. Cent. Eur. J. Chem. 2010, 8, 1059–1068. [CrossRef]33. Günister, E.; Pestreli, D.; Ünlü, C.H.; Atıcı, O.; Güngör, N. Synthesis and characterization of chitosan MMT biocomposite systems.
Carbohydr. Polym. 2007, 67, 358–365. [CrossRef]34. Thommes, M.; Kaneko, K.; Neimark, A.V.; Olivier, J.P.; Rodriguez-Reinoso, F.; Rouquerol, J.; Sing, K.S.W. Physisorption of gases,
with special reference to the evaluation of surface area and pore size distribution (IUPAC Technical Report). Pure Appl. Chem.2015, 87, 1051–1069. [CrossRef]
35. Rafigh, S.M.; Heydarinasab, A. Mesoporous Chitosan−SiO2 Nanoparticles: Synthesis, Characterization, and CO2 AdsorptionCapacity. ACS Sustain. Chem. Eng. 2017, 5, 10379–10386. [CrossRef]
36. Dongre, R.; Ghugal, D.N.; Meshram, J.S.; Ramteke, D.S. Fluoride removal from water by zirconium (IV) doped chitosanbio-composite. Afr. J. Environ. Sci. Technol. 2012, 6, 130–141. [CrossRef]
37. Barbusinski, K.; Filipek, K.; Salwiczek, S. Effect of chitosan modification on its structure and specific surface area. In Chitosan-BasedAdsorbents for Wastewater Treatment; Materials Research Foundations: Millersville, PA, USA, 2018; Volume 34, pp. 81–98.
38. Acharyya, S.S.; Ghosh, S.; Sharma, S.K.; Bal, R. Cetyl alcohol mediated fabrication of forest of Ag/Mn3O4 nanowhiskers catalystfor the selective oxidation of styrene with molecular oxygen. RSC Adv. 2015, 5, 89879–89887. [CrossRef]
39. Sasidharanpillai, S.; Arcis, H.; Trevani, L.; Tremaine, P.R. Triborate Formation Constants and Polyborate Speciation underHydrothermal Conditions by Raman Spectroscopy using a Titanium/Sapphire Flow Cell. J. Phys. Chem. B 2019, 123, 5147–5159.[CrossRef]
40. Cotton, F.A.; Wilkinson, G.; Gaus, P.L. Basic Inorganic Chemistry; John Wiley and Sons, Inc.: Hoboken, NJ, USA, 1987.41. Owen, B.B. The dissociation constant of boric acid from 10 to 50 ◦C. J. Am. Chem. Soc. 1934, 56, 1695–1697. [CrossRef]42. Lagergren, S. About the Theory of So-Called Adsorption of Soluble Substances. K. Sven. Vetensk. Handlingar. 1898, 24, 1–39.43. Ho, Y.; McKay, G. The kinetics of sorption of basic dyes from aqueous solution by sphagnum moss peat. Can. J. Chem. Eng. 1998,
76, 822–827. [CrossRef]44. Weber, W.J.; Morris, J.C. Kinetics of Adsorption on Carbon from Solution. J. Sanit. Eng. Div. Proc. Am. Soc. Civ. Eng. 1963, 89,
31–60. [CrossRef]45. Modrzejewska, Z.; Rogacki, G.; Sujka, W.; Zarzycki, R. Sorption of copper by chitosan hydrogel: Kinetics and equilibrium. Chem.
Eng. Process. 2016, 109, 104–113. [CrossRef]46. Giles, C.H.; D’Silva, A.P.; Easton, I.A. A general treatment and classification of the solute adsorption isotherm, II Experimental
interpretation. J. Colloid. Interface Sci. 1974, 47, 766–778. [CrossRef]47. Langmuir, I. The adsorption of gases on plane surfaces of glass, mica, and platinum. J. Am. Chem. Soc. 1918, 40, 1361. [CrossRef]48. Freundlich, H. Over the adsorption in solution. J. Phys. Chem. 1906, 57, 385–471.49. Dubinin, M.M.; Zaverina, E.D.; Radushkevich, L.V. Sorption and structure of active carbons. I. Adsorption of organic vapors. Zh.
Fiz. Khim. 1947, 21, 1351–1362.50. Treybal, R.E. Mass Transfer Operations; McGraw Hill: New York, NY, USA, 1980.51. Kluczka, J. Removal of boron and manganese ions from wet-flue gas desulfurization wastewater by hybrid chitosan-zirconium
sorbent. Polymers 2020, 12, 635. [CrossRef]52. Smolik, M.; Zolotajkin, M.; Kluczka, J. Distribution of trace amounts of impurities during manganese(II) sulfate crystallization at
20 ◦C and 2 ◦C. Pol. J. Chem. 1995, 69, 1322–1327.53. Lin, J.Y.; Mahasti, N.N.N.; Huang, Y.H. Recent advances in adsorption and coagulation for boron removal from wastewater: A
comprehensive review. J. Hazard Mater. 2021, 407, 124401. [CrossRef] [PubMed]54. Kluczka, J.; Pudło, W.; Krukiewicz, K. Boron adsorption removal by commercial and modified activated carbons. Chem. Eng. Res.
Des. 2019, 147, 30–42. [CrossRef]55. Babiker, E.; Al-Ghouti, M.A.; Zouari, N.; McKay, G. Removal of boron from water using adsorbents derived from waste tire
rubber. J. Environ. Chem. Eng. 2019, 7, 102948. [CrossRef]56. Oladipo, A.A.; Gazi, M. High boron removal by functionalized magnesium ferrite nanopowders. Environ. Chem. Lett. 2016, 14,
373–379. [CrossRef]57. Sarri, S.; Misaelides, P.; Zamboulis, D.; Warchol, J. Boron removal from aqueous solutions by a polyethylenimine-epichlorohydrin
resin. J. Serb. Chem. Soc. 2018, 83, 251–264. [CrossRef]58. Syed, M.A.; Al Sawafi, M.; Shaik, F.; Nayeemuddin, M. Polyurethane Green Composites: Synthesize, Characterization and
Treatment of Boron Present in the Oil Produced Water. Int. J. Eng. Res. Technol. 2020, 13, 1866–1873. [CrossRef]

Materials 2021, 14, 5646 18 of 18
59. Mahdavi, S.; Salehi, Z.; Zarabi, M. Isotherm and kinetic studies for adsorption of boron on nano-copper oxide (CuO) innon-competitive and competitive solutions. Desalin. Water Treat. 2020, 192, 259–270. [CrossRef]
60. Kluczka, J.; Dudek, G.; Kazek-Kesik, A.; Gnus, M. Chitosan Hydrogel Beads Supported with Ceria for Boron Removal. Int. J. Mol.Sci. 2019, 20, 1567. [CrossRef] [PubMed]
61. Kluczka, J.; Dudek, G.; Kazek-Kesik, A.; Gnus, M.; Krzywiecki, M.; Mitko, K.; Krukiewicz, K. The Use of Lanthanum Ions andChitosan for Boron Elimination from Aqueous Solutions. Polymers 2019, 11, 718. [CrossRef] [PubMed]
62. Sheng, R.; Zhang, Y.; Kang, J.; Tang, Y.; Zhu, C.; Liu, L. Nanorod-Like Polymer Adsorbents with Intermediate DihydroxyFunctional Groups for Efficient Boron Removal. ChemistrySelect 2021, 6, 6197–6201. [CrossRef]
63. Abba, M.U.; Che Man, H.; Syahidah Azis, R.; Idris, A.I.; Hazwan Hamzah, M.; Abdulsalam, M. Synthesis of Nano-Magnetitefrom Industrial Mill Chips for the Application of Boron Removal: Characterization and Adsorption Efficacy. Int. J. Environ. Res.Public Health 2021, 18, 1400. [CrossRef] [PubMed]