Elastase Responsive Hydrogel Dressing for Chronic Wounds
249
E E l l a a s s t t a a s s e e R R e e s s p p o o n n s s i i v v e e H H y y d d r r o o g g e e l l D D r r e e s s s s i i n n g g f f o o r r C C h h r r o o n n i i c c W W o o u u n n d d s s A thesis submitted to the University of Manchester for the degree of Doctor of Philosophy in the Faculty of Engineering and Physical Sciences 2010 Nurguse Bibi School of Materials
-
Upload
khangminh22 -
Category
Documents
-
view
2 -
download
0
Transcript of Elastase Responsive Hydrogel Dressing for Chronic Wounds
EEllaassttaassee RReessppoonnssiivvee HHyyddrrooggeell DDrreessssiinngg ffoorr CChhrroonniicc WWoouunnddss
A thesis submitted to the University of Manchester for the degree of Doctor of Philosophy in the Faculty of Engineering
and Physical Sciences
2010
Nurguse Bibi
School of Materials

Contents
2
CCOONNTTEENNTTSS
Contents 2
List of Tables 7
List of Figures 8
Abstract 12
Declaration 13
Copyright Statement 14
Acknowledgements 15
Dedication 16
Abbreviations 17
Conference Presentations 24
CCHHAAPPTTEERR 11 II nnttrroodduuccttiioonn 25
1.1 Objective 28
1.2 Aims of the project 29
1.3 Scope of Thesis 30
CCHHAAPPTTEERR 22 LLii tteerraattuurree RReevviieeww –– WWoouunndd HHeeaall iinngg && MMaannaaggeemmeenntt ooff CChhrroonniicc WWoouunnddss 32
2.1 ANATOMY & PHYSIOLOGY OF THE SKIN 33
2.1.1 Anatomy of the skin 33
2.1.1.1 Epidermis 33
2.1.1.2 Dermis 35
2.1.2 Physiological function of the skin 35
2.2 WOUND HEALING 37
2.2.1 Acute and chronic wound healing 37
2.2.2 Phases of wound healing and the immune response 38
2.2.2.1 Hemostasis 38
2.2.2.2 Inflammation 41
2.2.2.3 Proliferation 44
2.2.2.4 Remodelling 46

Contents
3
2.2.3 Role of enzymes in wound healing 46
2.2.3.1 Serine proteases 48
2.2.3.2 Matrix Metalloproteinases 54
2.3 TYPES OF CHRONIC WOUNDS 62
2.4 GRADIENTS OF CHRONIC WOUNDS 62
2.4.1 Oxygen 63
2.4.2 Temperature 63
2.4.3 pH 63
2.5 ROLES OF ENZYMES IN CHRONIC WOUNDS 64
2.6 MANAGEMENT OF WOUND HEALING 67
2.6.1 Debridement of chronic wounds 68
2.6.2 Moist wound healing 68
2.6.3 Management of chronic wounds using hydrogel dressings 69
2.6.3.1 Passive/ Non-responsive hydrogel dressings 70
2.6.3.2 Active/ Responsive hydrogel dressings 71
2.6.3.3 Protease-modulating hydrogel dressings 75
2.7 SUMMARY 88
CCHHAAPPTTEERR 33 FFuunnccttiioonnaall iissaattiioonn ooff PPEEGGAA PPaarrttiicclleess 90
3.1 INTRODUCTION 91
3.2 OBJECTIVES 94
3.3 MATERIALS & METHODS 94
3.3.1 Materials 94
3.3.2 Methods 95
3.3.2.1 Fourier-transform infrared spectroscopy (FT-IR) 95
3.3.2.2 Fmoc solid phase peptide synthesis 96
3.3.2.3 Kaiser test 99
3.3.2.4 Fmoc loading 99
3.3.2.5 Isoelectric focusing and silver staining 101
3.3.2.6 Cleaving functionalised PEGA particles with proteases 102
3.3.2.7 Swelling 103
3.3.2.8 Statistics 104

Contents
4
3.4 RESULTS & DISCUSSION 104
3.4.1 FT-IR of PEGA particles 104
3.4.2 Homogenous loading of solid-phase peptide synthesis 109
3.4.3 Isoelectric point of elastases 112
3.4.4 Designing of the elastase responsive ECPs coupled to PEGA 114
3.4.4.1 Selective design of the ERS responsive to elastase 116
3.4.4.2 Selective hydrolysis of Fmoc-tripeptide-PEGA particles
by proteases 117
3.4.4.3 Selective hydrolysis of the CMR from Fmoc-tripeptide-
PEGA particles by proteases 122
3.4.4.4 Selective hydrolysis of Fmoc-dipeptide-PEGA particles
by proteases 124
3.4.5 Swelling analysis 129
3.4.5.1 Swelling behaviour of un-cleaved Fmoc-tripeptide-
PEGA particles 129
3.4.5.2 Swelling behaviour of cleaved Fmoc-tripeptide-PEGA
particles 135
3.5 CONCLUSION 139
CCHHAAPPTTEERR 44 SSeelleeccttiivvee EEnnttrraappmmeenntt ooff EEllaassttaassee iinnttoo PPEEGGAA PPaarr ttiicclleess 140
4.1 INTRODUCTION 141
4.2 OBJECTIVES 146
4.3 MATERIALS & METHODS 146
4.3.1 Materials 146
4.3.2 Methods 147
4.3.2.1 Fmoc SPPS and Kaiser test 147
4.3.2.2 Potassium phosphate buffer 147
4.3.2.3 Eznyme hydrolysis using HPLC 147
4.3.2.4 Dansyl chloride staining 148
4.3.2.5 SDS-Page 149
4.3.2.6 Accessibility of FITC-dextran 149
4.3.2.7 Accessibility FITC-elastase 150

Contents
5
4.3.2.8 Quantification of TPM micrographs 151
4.3.2.9 Fluorescence substrate assay 151
4.3.2.10 Statistics 152
4.4 RESULTS & DISCUSSION 153
4.4.1 Selective hydrolysis of ECPs by elastase at high ionic strength as a
function of pH 153
4.4.2 Fluorescence Studies 154
4.4.2.1 Diffusion of elastase via dansyl chloride 154
4.4.2.2 Accessibility of a FITC-labelled dextran into PEGA
particles 163
4.4.2.3 FITC-elastase 168
4.4.2.4 Fluorescence substrate assay 171
4.5 CONCLUSION 176
CCHHAAPPTTEERR 55 RReemmoovvaall ooff FFiibbrroobbllaasstt EEllaassttaassee AAccttiivvii ttyy BByy CChhaarrggeedd PPEEGGAA PPaarrttiicclleess 177
5.1 INTRODUCTION 178
5.2 OBJECTIVES 180
5.3 MATERIALS & METHODS 181
5.3.1 Materials 181
5.3.2 Methods 181
5.3.2.1 Fmoc SPPS 181
5.3.2.2 Cell culture of human dermal fibroblast (HDF) 181
5.3.2.3 Activation of HDF cells by IL-1β to express
HDF-elastase 182
5.3.2.4 Elastase treated with functionalised PEGA particles 183
5.3.2.5 Fluorescence substrate assay 183
5.3.2.6 Statistics 184
5.4 RESULTS & DISCUSSION 184
5.4.1 IL-1β induced HDF-elastase expression in HDF cells 184
5.4.2 Reduction of HDF-elastase activity by PEGA particles 195
5.5 CONCLUSION 200

Contents
6
CCHHAAPPTTEERR 66 CCoonncclluussiioonnss && FFuurrtthheerr SSttuuddiieess 202
6.1 CONCLUSIONS 203
6.1.1 Limitations of the studies 205
6.2 FURTHER STUDIES 207
CCHHAAPPTTEERR 77 RReeffeerreenncceess 209
AAPPPPEENNDDIIXX II 232
AAPPPPEENNDDIIXX IIII 237
AAPPPPEENNDDIIXX IIIIII 247
WWoorrdd CCoouunntt
Including references: 71, 993
Excluding references: 64, 306

List of Tables
7
LLIISSTT OOFF TTAABBLLEESS
Table 1. Layers of the epidermis. 34
Table 2. Layers of the dermis. 35
Table 3. Summary – The Physiological function of the skin. 36
Table 4. Human proteases which express elastinolytic activity. 51
Table 5. Systemic and alarm proteinase inhibitors to control HNE activity. 53
Table 6. Summary for the function of human matrilysins, MT-MMPs and other MMPs during in the wound healing process.
60
Table 7. Types of Chronic wounds. 62
Table 8. Application of protease-modulating hydrogel dressings for chronic wounds.
76
Table 9. Washing steps during SPPS. 96
Table 10. Colour observation of PEGA particles and surrounding solution after Kaiser test.
99
Table 11. Assignments of FTIR frequencies of unmodified PEGA(800 and 1900) particles.
106
Table 12. Types of conformational amide bands for FTIR frequencies.
108
Table 13. ECPs coupled to PEGA particles. 115
Table 14. Percentage decrease of HDF-elastase activity in SMF compared to DMEM + 10% FBS for both untreated and treated HDF cells with or without of IL-1β
190
Table 15. Statistical differences and similarities between the elastase activity of PPE in DMEM depending on both the concentration of FBS and temperature
191
Table 16. Statistical comparisons of HDF-elastase activity in DMEM (SFM, or supplemented with 10% or 25% FBS) using one-way ANOVA
194
Table 17. Substrate specificity of proteolytic proteases involved in the process of wound healing
232
Table 18. Passive hydrogel dressings designed to treat chronic wounds 237

List of Figures
8
LLIISSTT OOFF FFIIGGUURREESS
Figure 1. The molecular structure of PEGA particles. 29
Figure 2. A schematic diagram exhibit a deep chronic wound being healed after treatment with PEGA particles.
29
Figure 3. Swelling to collapse of PEGA particles. 30
Figure 4. Events of acute and chronic wound healing. 38
Figure 5. Formation of thrombin and fibrin. 39
Figure 6. Fibrinolytic pathway. 40
Figure 7. General mechanism of leukocyte adhesion to the endothelial cells, mediated by the cell-cell adhesion mechanism of selectins/ integrin.
42
Figure 8. The hydrolysis of peptide substrate via the serine proteases (thrombin, plasmin or elastase).
49
Figure 9. Multifunctional roles of elastase during the wound healing process. 54
Figure 10. The conformational domains of human MMPs. 55
Figure 11. Activation of MMPs via the ‘cysteine-switch’ mechanism. 56
Figure 12. Reciprocal interpretation for the role of plasmin, elastase and MMPs in achieving ECM degradation during the wound healing process.
61
Figure 13. The‘vicious elastase cycle’ causes extensive tissue/ ECM degradation promoting chronic inflammation via a positive feedback mechanism within chronic wounds.
66
Figure 14. Mode of action for OxyzymeTM hydrogel dressing. 73
Figure 15. Mechanism of Cadesorb. 83
Figure 16. Chemical structure of the MMP-inhibitor, bisphosphonate. 86
Figure 17. Bisphosphonate-functionalised hydrogels synthesised via Schotten-Baumann reaction.
87
Figure 18. Mechanism for the functionalisation of unmodified PEGA particles with enzyme cleavable peptides (ECPs) using Fmoc SPPS.
97
Figure 19. Chemical structures of uncharged (neutral) and charged Fmoc-ECPs coupled to PEGA particles.
98
Figure 20. Standard curve for the absorbance (301nm) of Fmoc group. 100
Figure 21. Standard curve for the area of Fmoc group (301 nm) via HPLC 102
Figure 22. FTIR spectrum of unmodified PEGA(800 and 1900) particles and the molecular structure of PEGA.
105
Figure 23. Mechanism of ninhydrin with free amino groups on PEGA particles via imine formation.
110

List of Figures
9
Figure 24. Colorimetric observations of the Kaiser test. 111
Figure 25. Total net charge of elastase specifically PPE (EC 3.4.21.36) within the pH range of 1 – 14.
113
Figure 26. Schematic illustration of designing elastase responsive ECPs that accommodate the environment of chronic wounds both above and below pH 8.31.
114
Figure 27. Selective hydrolysis of neutral ECPs (Fmoc-dipeptides) coupled to PEGA800 particles by elastase.
117
Figure 28. Schematic illustration comparing the charges of thermolysin and elasatse within the pH range of 6.0 – 9.0.
118
Figure 29. A chemical reaction displaying the selective hydrolysis of Fmoc-tripeptide-PEGA particles by a protease.
118
Figure 30. Selective hydrolysis of Fmoc-X-Ala-Ala-PEGA(800,1900) particles by thermolysin and elastase under the influence of pH.
119
Figure 31. Selective hydrolysis of the CMR from Fmoc-X-Ala-Ala-PEGA(800,1900) particles by thermolysin and elastase.
123
Figure 32. The chemical reaction of cleaving of Fmoc-dipeptide-PEGA particles (RA, EA, GA) by proteases.
125
Figure 33. Selective hydrolysis of Fmoc-X-Ala-PEGA(800,1900) particles by thermolysin and elastase at different pH values.
126
Figure 34. Swelling behaviour of functionalised Fmoc-X-Ala-Ala-PEGA1900 particles as a function of pH (a: 7.0, b: 8.0 and c: 9.0) and ionic strength (ranging from 0.001M – 0.2M) in potassium phosphate buffer.
131
Figure 35. Swelling behaviour of functionalised Fmoc-X-Phe-Phe-PEGA1900 particles as a function of pH (a: 7.0, b: 8.0 and c: 9.0) and ionic strength (ranging from 0.001M – 0.2M) in potassium phosphate buffer.
132
Figure 36. Fmoc-tripeptide-PEGA1900 particles (a) cleaved by protease to generate cleaved products (b-c).
135
Figure 37. Swelling behaviour of cleaved product (+)Ala-PEGA1900 and the percentage decrease/increase in swelling when compared to the un-cleaved Fmoc-X-Ala-Ala-PEGA1900 particles.
136
Figure 38. Swelling behaviour of cleaved product (+)Phe-PEGA1900 and the percentage decrease/increase in swelling of the cleaved Fmoc-X-Phe-Phe-PEGA1900 particles.
137
Figure 39. Jablonski diagram and Stokes shift of fluorescence. 142
Figure 40. Jablonski diagram comparing the absorption of two-photon against one-photon.
144
Figure 41. Chemical reaction of dansyl chloride with cleaved PEGA particles. 148
Figure 42. Chemical reaction of staining elastase with the base fluorescein molecule, FITC.
150
Figure 43. The mechanism for the cleaving of the fluorescence-quenched substrate: MeOSuc-Ala-Ala-Pro-Val-AMC by elastase.
152

List of Figures
10
Figure 44. Selective hydrolysis of Fmoc-X-Ala-Ala-PEGA1900 particles and Fmoc-X-Phe-Phe-PEGA1900 particles by elastase at high ionic strength under the influence of pH.
154
Figure 45. TPM micrographs (top) and the average fluorescence graph (bottom) depicting the fluorescence labelling after un-cleaved and cleaved Fmoc-X-Phe-Phe-PEGA1900 particles (RFF, EFF and GFF) were stained with dansyl chloride at pH 8 (0.1 M).
155
Figure 46. TPM micrographs (top) and the average fluorescence (bottom) illustrating the fluorescence observed after un-cleaved and cleaved Fmoc-X-Ala-Ala-PEGA1900 particles (RAA, EAA and GAA) were stained with dansyl chloride at pH 8 (0.1 M).
156
Figure 47. The selective diffusion of elastase into Fmoc-X-Ala-Ala-PEGA1900 particles (RAA, EAA and GAA) followed by the selective hydrolysis of the corresponding ECPs in potassium phosphate buffer at pH 8 and 0.001M monitored over the course of 180 minutes.
159
Figure 48. TPM micrographs demonstrating the diffusion of elastase after Fmoc-X-Ala-Ala-PEGA1900 particles were cleaved with elastase for 3 hours at pH 7 and pH 9 (0.1 M).
160
Figure 49. Treating both un-cleaved and cleaved Fmoc-X-Ala-Ala-PEGA1900 particles (0.1 M, pH 7.0) with Kaiser test.
161
Figure 50. Comparing the pixel fluorescence intensity at pH 7 (0.1 M) after unmodified and ionic PEGA1900 particles were stained with dansyl chloride.
162
Figure 51. TPM micrographs and pixel intensity graphs demonstrating the penetration of a 20 kDa FITC-labelled dextran into both un-cleaved and cleaved Fmoc-X-Ala-Ala-PEGA1900 particles at 0.1 M (pH 8).
165
Figure 52. TPM micrographs (left and middle) and pixel intensity graphs (right) demonstrating the accessibility and diffusion of FITC-labelled 20 kDa dextran into unmodified PEGA1900 particles at an ionic strength of 0.1 M and 0.001 M for the duration of 10 minutes.
166
Figure 53. TPM micrographs and pixel intensity graphs demonstrating the penetration of a 20 kDa FITC-labelled dextran into both un-cleaved and cleaved Fmoc-X-Ala-Ala-PEGA1900 particles at 0.001M (pH 8).
167
Figure 54. TPM micrographs (top) and the average fluorescence graph (bottom) depicting the real-time penetration of FITC-elastase into Fmoc-X-Ala-Ala-PEGA1900 particles in PBS buffer (0.15 M and pH 7.4).
169
Figure 55. TPM micrographs (top) and the average fluorescence graph (bottom) depicting the real-time penetration of FITC-elastase into GAA particles at 0.1 M (pH 7.0).
170
Figure 56. Optimisation of the fluorescence substrate assay using Michaelis-Menten kinetics.
172
Figure 57. Rates of residual elastase activity of PPE after sample fluids containing elastase were treated with Fmoc-X-Ala-Ala-PEGA particles at 0.1 M and at various pH values: pH 7 (a), pH 8 (b) and pH 9 (c).
174
Figure 58. Photomicrographs of HDF cultures (passage 10) showing the effect of IL-1β on the proliferation of HDFa cells after 1 day and 7 days
185

List of Figures
11
growth in DMEM + 10% FBS..
Figure 59. Rate of HDF-elastase activity expressed by HDF cells in DMEM + 10% FBS.
186
Figure 60. Photomicrographs of lysing HDF cells depending on the surrounding media after 5 days growth.
187
Figure 61. Rate of HDF-elastase activity expressed by HDF cells in SFM. 189
Figure 62. Variation of elastase activity in DMEM supplemented with or without FBS against temperature.
191
Figure 63. Rate of HDF-elastase activity expressed by HDF cells in DMEM + 25% FBS.
192
Figure 64. Comparisons between the initial rate for HDF-elastase activity in DMEM + 25% FBS versus both SFM and DMEM + 10% FBS.
194
Figure 65. Rates of residual elastase activity remaining in sample fluids (at physiological pH 7.4 and ionic strength 0.15M) after the removal of functionalised PEGA particles (RAA, EAA, GAA).
196
Figure 66. Rates of residual HDF-elastase activity remaining in sample fluids after treatment with functionalised PEGA particles (RAA, EAA, GAA) swollen in DMEM + 25% FBS.
199
Figure 67. Diffusion of an enzyme into PEGA particles via a ‘ring-effect’. 248
Figure 68. Separation of elastase by SDS-page via 1-D electrophoresis. 249

12
AABBSSRRAACCTT
Chronic wounds are a major financial and clinical burden causing the deaths of millions per year. Over expression of elastase is well documented as the main culprit that delays the normal wound repair process within chronic wounds. The aim of this thesis is to design a responsive chronic wound dressing based on the hydrogel polymer, PEGA (polyethylene glycol acrylamide) in the form of particles to mop-up excess elastase by exploiting polymer collapse in response to elastase hydrolytic activity within sample fluids mimicking the environment of chronic wounds.
PEGA particles were functionalised with enzyme cleavable peptides (ECPs) containing charged residues. Upon cleavage the charge balance changes, causing polymer swelling and consequent elastase entrapment. The pH range of chronic wounds is reported in the range of 5.45 – 8.65. Due to its pI which is around 8.3, within this range elastase exist both in its cationic and anionic forms. To accommodate a hydrogel dressing that could selectively entrap excess elastase both in its cationic and anionic, oppositely charged ECPs were designed. In its cationic form, elastase was found to have a high preference of cleaving ECPs and penetrating into PEGA particles bearing negative charges. In contrast, in its anionic form the opposite effect was observed, wherein elastase preferred to cleave ECPs and penetrate PEGA particles bearing positive charges. The diffusion, accessibility and entrapment of elastase into functionalised PEGA particles was explored using various fluorescence microscopy techniques. Removal of the charged residue by elastase showed a reduction in particle swelling causing the pores of PEGA particles to become restricted. In this manner, cleaved PEGA particles prevented the accessibility of molecules with a molecular weight as low as 20 kDa into the cleaved PEGA particles. Since elastase has a molecular weight of 25.9 kDa the collapsing of the pores within PEGA particles entrapped elastase inside the interior of cleaved PEGA particles. In its cationic form (at pH 7.4) elastase was found to penetrate and become trapped more into both negative and positive PEGA particles compared to neutral particles. The negative particles were shown to trapped cationic elastase within 2 minutes compared to the positive particles. In contrast, the neutral particles failed to retain and encapsulate elastase as the fluorescence inside the neutral particles was found to decrease. Coinciding with these observations, after sample fluids containing elastase were treated with functionalised PEGA particles, the residual elastase activity in sample fluids was reduced more by the charged PEGA particles compared to neutral particles. The cell culture studies demonstrated that the elastase activity observed in human dermal fibroblasts (HDF) was also reduced more by the charged particles compared to the neutral particles. However, the positive particles were found to significantly reduced HDF-elastase activity compared to both the negative and neutral PEGA particles. Overall, this thesis exemplifies that on the basis of charge selective cleaving of ECPs coupled to PEGA particles can be exploited to selectively remove excess proteases such as elastase from sample fluids mimicking the environment of chronic wounds.

13
DDEECCLLAARRAATTIIOONN
No portion of the work referred to in this dissertation has been submitted in support of
an application for another degree or qualification of this or any other university or other
institution of learning.

14
CCOOPPYYRRIIGGHHTT SSTTAATTEEMMEENNTT
i. The author of this thesis (including any appendices and/or schedules to this thesis)
owns certain copyright or related rights in it (the “Copyright”) and s/he has given The University of Manchester certain rights to use such Copyright, including for administrative purposes.
ii. Copies of this thesis, either in full or in extracts and whether in hard or electronic
copy, may be made only in accordance with the Copyright, Designs and Patents Act 1988 (as amended) and regulations issued under it or, where appropriate, in accordance with licensing agreements which the University has from time to time. This page must form part of any such copies made.
iii. The ownership of certain Copyright, patents, designs, trade marks and other
intellectual property (the “Intellectual Property”) and any reproductions of copyright works in the thesis, for example graphs and tables (“Reproductions”), which may be described in this thesis, may not be owned by the author and may be owned by third parties. Such Intellectual Property and Reproductions cannot and must not be made available for use without the prior written permission of the owner(s) of the relevant Intellectual Property and/or Reproductions.
iv. Further information on the conditions under which disclosure, publication and
commercialisation of this thesis, the Copyright and any Intellectual Property and/or Reproductions described in it may take place is available in the University IP Policy (see http://documents.manchester.ac.uk/DocuInfo.aspx?DocID=487), in any relevant Thesis restriction declarations deposited in the University Library, The University Library’s regulations (see http://www.manchester.ac.uk/library/aboutus/ regulations) and in The University’s policy on Presentation of Theses.

15
AACCKKNNOOWWLLEEDDGGEEMMEENNTTSS
I would like to acknowledge and thank first and foremost Professor Rein Ulijn, Dr Julie
Gough and Dr David Farrar for giving me the opportunity to carryout this project. Rein
and Julie are further thanked for the continuous support, understanding and help during
this project; together with their inspiration to expand my knowledge on developing this
idea.
EPSRC and Smith & Nephew are gratefully acknowledged for sponsoring this project
which also assisted in helping me to attend various conferences to present my research to
an international audience. The Biochemical Society is thanked for the full exclusive travel
fund along with the MSCWU team who selected me to attend the Microspectroscopy
FEBS advance course (Netherlands). The MRS committee are thanked for the EPSRC
travel grant that enable me to attend the 2007 MRS Spring Meeting in San Francisco.
Robert Fernandez (FLS) is especially thanked for helping me to obtained images from 2-
photon microscope. Within School of Materials: Olwen Richert is thanked for her help
and kindness of personal and academic related matters; Francis Carabine and Shirley are
thanked for their help throughout the biomaterial labs; and Polly Crook for technical
advice on utilising equipment for studying wet-chemistry of PEGA particles. All
members of the biomaterial group are thanked for the friendship and advice throughout
this research, especially: Rachael Saunders (fluorescence plate reader), Mi Zhou (cell
culturing of HDF), Brian Cousins (providing an insight into SPSS) and Alison Patrick
(assistance with software packages, help and advice). The following people are thanked
including those mentioned above as all them in their own way helped to keep my spirits
up: Honglei Qu, Tom McDonald, Simon Todd, Rumana Rashid, Andrew Hirst, Claire
Tang, Ayeesha Mujeeb, Deepak Kalasker, Vineetha Jayawarna, Naheed Ali, Roukaya
Belkharchouche including members from E15. Karen Morgan, Professor Terry Brown
and Dr Jaleel Miyan are thanked for their kindness and continuous professional advice
since my undergraduate studies at UMIST.
I would like to thank Dr Sarah Herrick and Dr Iain Gibson for the interesting discussion
during my viva of which I thoroughly enjoyed!
Finally, and not forgotten I would like to thank my family and friends for their
continuous encouragement. My family are graciously thanked for their constant
inspiration and for their unfailing love and support; I definitely would have not got this
far without your honourable help throughout my entire career.

16
I dedicate this thesis to my father, mother, brother & sisters;
Life is absolutely meaningless without you…

Abbreviations
17
AABBBBRREEVVIIAATTIIOONNSS
α Alpha
α1-PI antiproteinase inhibitor
α2-MG α2-macroglobulin
β Beta
λ Wavelength
↑ Increase
+ve Positive
–ve Negative
1st First
2nd Second
3D Three dimensional
3rd Third
ACN Acetonitrile
ADAMs A disintegrin and metalloprotease
Ag Silver
AgNO3 silver nitrate
a.k.a Also known as
Ala Alanine (A)
AMC 7-amino-4-methyl coumarin
ANOVA Analysis of variance
Arg Arginine (R)
Asn Asparagine (N)
Asp Aspartic acid (D)
AT III Anti-thrombin III
bFGF Basic fibroblast growth factor
BM Basement membrane
BNF British National Formulary
BP(s) Bisphosphonate(s)
Ca Calcium
CAMs Cell adhesion molecules
CHAPS 3-[(3-Cholamidopropyl)dimethylammonio]-1-propanesulfonate
CMC Carboxymethylcellulose
CMR Charge modified residue: Arg(+) (positive); Glu(–) (negative) and neutral (Gly)
CO2 Carbon dioxide

Abbreviations
18
COOH Carboxyl group
Cys Cysteine (C)
CWFs Chronic wound fluids
DAG Diacylglycerol
DFUs Diabetic foot ulcers
dH2O Deionised water
DH2O Distilled water for cell culture
DHBA 2,3-dihydroxybenzoic acid
DHB-MS Modified gelatin microspheres
DIC Di-isopropylcarbodimide
DMEM Dulbecco’s modified eagle medium
DMF Dimethylformanide
DNA Deoxyribronucleic acid
Dnp Dinitrophenyl
Dpa N3-dnp-L-2,3-diaminopropionic acid
EAA Fmoc-X-Ala-Ala-PEGA, where X: Glu(–)
ECM Extracellular matrix
E.coli Eschericia coli
ECL Enzyme cleavable linkers
ECPs Enzyme cleavable peptides
EDTA Na2+ Diaminoethanetetra – acetic acid disodium salt
EFF Fmoc-X-Phe-Phe-PEGA, where X: Glu(–)
EGF Epidermal growth factor
ESL-1 E-selectin ligand-1
ERS Enzyme recognition sequence
ES Enzyme substrate
EU Europeon Union
FBS Fetal bovine serum
FDPs Fibrin degradation products
FITC Fluorescein-isothiocyanate
Fmoc/ FMOC Fluorenylmethoxycarbonyl
FW First Water
FTIR Fourier-transform infrared spectroscopy
GAA Fmoc-X-Ala-Ala-PEGA, where X: Gly
GAGs Glycosaminoglycans
GFF Fmoc-X-Phe-Phe-PEGA, where X: Gly
Glu Glutamic acid (E)

Abbreviations
19
Gly Glycine (G)
GMAWCP The Global Market for Advanced Wound Care Products
GPCR(s) G-protein coupled receptor(s)
H+ Hydrogen ions
H2O Water
H2O2 Hydrogen peroxide
HCl Hydrochloric acid
HDF Human dermal fibroblast
HEMA Hydroxylethyl methacrylate
His Histidine (H)
HME Human macrophage elastase
HNE Human neutrophil elastase
HOBt Hydroxybenzotriazole
HPLC High Performance Liquid Chromatography
hr-1 Per hour
HRT Hydration Response Technology
IEF Iso-electric focusing
Ig Immunoglobulin
IgSF Immunoglobulin Super family
IL Interleukin
IL-1 Interleukin-1
IL-1α Interleukin-1 alpha
IL-1β Interleukin-1 beta
IL-2 Interleukin-2
IL-6r Interleukin-6 receptor
IL-8 Interleukin-8
Ile Isoleucine (I)
IR Infrared
J&J Johnson & Johnson
K1–4 Mini-plasminogen, angiostatin
KCN Potassium cynanide
K. pneumoniae Klebsiella pneumoniae
KGF Keratinoctye growth factor
KM Michaelis-Menten constant
Leu Leucine (L)
LNE Leukocyte neutrophil elastase
Lys Lysine (K)

Abbreviations
20
LVDP Leucine – Valine – Aspartic acid – Proline
MeOH Methanol
MeOSuc-AAPV-AMC Methyl succiyl-alanyl-alanyl-proline-valine-amino methyl coumarin
MeOSuc-AAPV-pNA Methyl succiyl-alanyl-alanyl-proline-valine-petidyl nitroanilide
Met Methionine (M)
MI Metal ionogen, same as PHI
MMP(s) Matrix metalloproteinase(s)
MMP-1 Collagenase-1, interstitial collagenase
MMP-2 Gelatinase A, 72-kDa gelatinase, Type IV collagenase
MMP-3 Stromelysin-1, Transin, CAP, proteoglycanase
MMP-7 Matrilysin-1
MMP-8 Collagenase-2, neutrophil collagenase
MMP-9 Gelatinase B, 92-kDa gelatinase, Type V collagenase
MMP-10 Stromelysin-2, Transin-2
MMP-11 Stromelysin-3, Furin motif
MMP-12 Macrophage metalloelastase, metalloelastase, Human macrophage elastase (HME)
MMP-13 Collagenase-3, Rat interstital collagenase
MMP-14 Membrane-type MMP-14 (MT-MMP-14), MT1-MMP
MMP-15 Membrane-type MMP-15 (MT-MMP-15), MT2-MMP
MMP-16 Membrane-type MMP-16 (MT-MMP-16), MT3-MMP
MMP-20 Enamelysin
MMP-24 Membrane-type MMP-24 (MT-MMP-24), MT4-MMP
MMP-25 Membrane-type MMP-25 (MT-MMP-25), MT6-MMP
MMP-26 Matrilysin-2
MMP-28 Epilysin
MS Microspheres
MT-MMPs membrane-type MMPs
Na Sodium
Na2CO3 Sodium carbonate
NaOH Sodium hydroxide
NaAMPS Sodium salt of 2-acrylamido-2-methylpropanesulphonic acid
NaSPA Acrylic acid (3-sulphopropyl) ester sodium salt)
NE Neutrophil elastase
NH2 Amino group or amine
NSD Not significantly different, p > 0.05
OH Hydroxyl group

Abbreviations
21
ORC Oxidised regenerated cellulose
OtBu tert-butyl ester
P1–P1′ scissile P1–P1′ bond
PAs Plasminogen activators
P. aeruginosa Pseudomonas aeruginosa
PAIs Plasminogen activator inhibitors
PAs Plasminogen activators
Pbf, pbf pentamethyldihydrobenzofuran-5-sulfonyl
PBS, DPBS Phosphate buffer saline
PC Protein C
PDAF Platelet-derived angiogenic factor
PDGF Platelet-derived growth factor
PDGF-β,β Platelet-derived growth factor-beta, beta
PEG Polyethylene glycol
PEGA Poly (ethylene) glycol acrylamide
Phe Phenylalanine (F)
pH Potential hydrogen
pHEMA Poly(hydroxylethyl methacrylate)
PHI Polyhydrated ionogens
pI Isoelectric point
PIP Phosphoinositol phosphate
PKC Protein kinase C
PLC Phospholipase Cβ2
PMN Polymorphonuclear or polymononuclear
pNA Petidyl-4-nitroanilide
PPE Porcine pancreatic elastase or elastase (Pancreatic from porcine pancreas)
PPG Polypropylene glycol
Pro Proline (P)
Pro-MMPs Proenzyme-MMPs or zymogen of MMPs
PSGL-1 P-selectin glycoprotein ligand -1
PVA Poly(vinyl alcohol)
R1, R2, R3 Amino acid side chains
R2–NH Deprotonated amino acid
R2–NH2 Amine product
RAA Fmoc-X-Ala-Ala-PEGA, where X: Arg(+)
RBCs Red blood cells

Abbreviations
22
RFF Fmoc-X-Phe-Phe-PEGA, where X: Arg(+)
RFU Relative fluorescence units
RGD Arginine – Glycine – Aspartic acid
ROS Reactive oxygen species
RNS Reactive nitrogen species
rpHPLC Reverse phase high performance liquid chromatography
RV Release vesicles
RXKR Furin recognition motif
S&N Smith and Nephew
S. aureus Staphylococcus aureus
So Ground state
S1, S2 High energy state, excitated state
SD Significantly different, p < 0.05
SDS Sodium dodecyl sulphate
SDS-Page Sodium dodecyl sulphate – polyacrylamide gel electrophoresis
SE Standard error
Ser Serine (S)
SEM Standard error of the mean
SFM Serum free medium
sIPNs Semi-interpenetrating networks
SLPI secretory leukocyte elastase inhibitor
SP Signal peptide
SPPS Solid phase peptide synthesis
SPSS Statistical package for social science
S-SEBS Sulfonated styrene – ethylene – butylenes – styrene
TFA Trifluoroacetic acid
TGF-α Transforming growth factor-α
TGF-β Transforming growth factor-β
TI Tetrahedral intermediate
Thr Threonine (T)
TIMPs Tissue inhibitors matrix proteinases or tissue metalloproteases inhibitors (e.g. TIMP-1, -2, -3, -4)
TNF Tumour necrosis factor
TNF-α Tumour necrosis factor-alpha
TNFr Tumour necrosis factor receptor
TM Trademark
tPA Tissue-type plasminogen activator

Abbreviations
23
TPM Two-photon microscopy
Trp Tryptophan (W)
Tyr Tyrosine (Y)
UKSB UK Society for Biomaterials
UMIST University of Manchester Institute of Science & Technology
uPA Urinokinase-type plasminogen activator
US United States
USA United States of America
UK United Kingdom
UV Ultraviolet
UV/VIS Ultraviolet/ visible spectroscopy
VAC® Vacuum-Assisted Closure
Val Valine (V)
VEGF Vascular endothelial growth factor
VLUs Venous leg ulcers
Vmax Maximum velocity
WBCs White blood cells
Zn Zinc
,

24
CCOONNFFEERREENNCCEE PPRREESSEENNTTAATTIIOONNSS
Surface Science of Biologically Important Interfaces meeting (2007). Removal of Chronic Wound Proteases Using Enzyme-Responsive Hydrogel Dressing (poster presentation), University of Manchester, Manchester, UK. Materials Research Society (Spring Meeting, 2007). PEG based enzyme-responsive hydrogel particles for treatment of chronic wounds (oral presentation), San Francisco, USA. UKSB (28th - 29th July 2007). PEG based enzyme-responsive hydrogel particles for treatment of chronic wounds (poster presentation), University of King’s College, London. UK. FEBS advanced course: Microspectroscopy - Imaging Biochemical Dynamics in Living cells (2006). PEG based polymer hydrogel beads for removing proteases in chronic wounds (oral presentation), University of Waginengen (MSCWU), Waginengen, Netherlands, EU. UK Polymer Forum Conference (11th - 12th September 2006). PEG based polymer hydrogel beads for removing proteases in chronic wounds (poster presentation), University of Manchester, Manchester. UK. UKSB (28th - 29th June 2006). Responsive PEGA Beads for Removing Proteases in Chronic wounds (poster presentation), University of Manchester, Manchester. UK. Royal Society of Chemistry (RSC): Biomaterials Chemistry (18th January 2006). Responsive Hydrogel Beads for Selective Removal of Proteases in Chronic Wounds (poster presentation). University of Sheffield, Sheffield. UK. 19th European Conference on Biomaterials: ESB (11th-15th September 2005). Designing PEGA beads as a dressing to treat non-healing wounds (poster presentation), Sorrento. Italy. EU. UK Society for Biomaterials (UKSB, 21st -22nd June 2005). Enzyme Responsive PEGA beads for the Management of Wound Care (poster presentation), University of Nottingham, Nottingham. UK.

CHAPTER 1: Introduction
25
CCHHAAPPTTEERR 11
II nnttrroodduuccttiioonn

CHAPTER 1: Introduction
26
Wound healing is a complex biological process consisting of four overlapping phases by
which the skin or mucous membrane heals itself after an injury (Baranoski and Ayello
2004; Jones et al. 2004; Tortora and Grabowski 1993; Wysocki 1996) whether its an
internal or external break in the body tissue. Several proteins, cytokines, growths factors,
different types of cells, components of extracellular matrix (ECM) and proteolytic
enzymes are all involved in conjunction with the immune response to ensure proper
healing of the wound and that each phase of wound healing process is timely controlled
to completion to restore the integrity of the injured tissue (Westerhof and Vanscheidt
1994; Wysocki 1996; Siedler and Schuller-Petrovic 2002).
Non-healing chronic wounds take ‘time to heal’ as they do not undergo the timely
controlled wound healing process instead eventually become deadlocked during the
inflammation/ proliferation phase (Ayello et al. 2004; Morrison et al. 2004) and are
unable to progress to the final remodelling phase of the wound healing process; and
subsequently the wound struggles to close. This causes substantial trauma, which
decreases both the mobility and quality of life of millions of people which consequently
increases the risk of amputation and mortality of chronic wound sufferers each year. The
patients most at risk are the elderly and those who suffer from clinical diseases/
conditions (e.g. diabetes, heart disease, lung disease, circulation disorders, liver disease,
cancer, arthritis, autoimmune disorders, obesity) and skin ulcers (foot, pressure,
vascular/leg, arterial). Skin ulcers are the largest and more frequent types of chronic
wounds (Eaglstein and Falanga 1997; Stadelmann et al. 1998).
As the population ages, the number of patients suffering from chronic wounds is
reported to increase each year: 2 million for pressure ulcers and between 600,000 – 2.5
million for leg and foot chronic ulcers (Stadelmann et al. 1998). This causes a significant
clinical burden on both the healthcare/ resources required and the financial cost of
treating chronic wounds (Wysocki 1996; The Global Market for Advanced Wound Care
Products (GMAWCP) 2008). In UK alone the wound care treatment for chronic wounds
was estimated to cost the NHS £2.3 – 3.1 billion in 2005 – 2006 (Posnett and Franks
2008), in the US $10 billion dollars was estimated in 2007 (for each unit cost of wound
dressing) and the largest wound care market in 2007 was Europe with a total estimated
cost of healing the wound as US $2.2 billion (GMAWCP 2008). Wound care has been

CHAPTER 1: Introduction
27
estimated to rise to US $12.5 billion in 2012 in the US (GMAWCP 2008) and globally
between $13 – > $15 billion annually (Fonder et al. 2008; Kannan 2008). The length of
hospitalisation faced by chronic suffers is another medical problem that increases the
cost of treatment as wound care physicians/ clinicians are unable to detect the correct
prognosis to effectively treat patients as the pathophysiology of chronic wounds is not
fully understood as of yet.
However, in recent years, at the molecular level substantial research has reported that
various biochemical factors of elevated-expression of proteolytic activity and the
decrease activity of their inhibitors are the underlying problem of deadlocking the healing
of chronic wounds. The imbalance of various proteases: MMPs, plasmin, thrombin, and
elastase (Westerhof and Vanscheidt 1994; Wysocki 1996; Tarnuzzer and Schultz 1996;
Stadelmann et al. 1998; Trengove et al. 1999; Yager et al. 1996, 1997; Yager and
Nwomeh 1999; Cullen et al. 2002b; Greener et al. 2005; Xue et al. 2006; Schultz et al.
2005a) in chronic wound fluids (CWFs) are able to degrade various cellular factors:
growth factors, cytokines, their receptors; and the newly formed ECM and its proteins
(e.g. elastin, fibronection, collagen). This accordingly perturbs the normal tissue repair
and the wound becomes stuck during the healing process.
Excess elastase has been reported as the main culprit for perpetuating the over-
expression of MMPs in chronic wounds during inflammation due to the imbalance of
elastase and elastase inhibitors (Fleck and Chakravarthy 2007). The prime function of
elastase is to degrade elastin, however it also play a role in activating latent MMPs to
active MMPs (Zhu et al. 2001; Fleck and Chakravarthy 2007) which in turn initiates the
cascade of active MMPs to activate other latent MMPs (Zhu et al. 2001). This ‘vicious
cycle’ of elastase is further propagated in chronic wounds by degrading the tissue
metalloproteases inhibitors (TIMPs) which inhibit and control MMPs activity. This
imbalance between MMPs and TIMPs causes extensive turnover and degradation of the
newly formed collagen of the ECM (Zhu et al. 2001; Fleck and Chakravarthy 2007).
Numerous wound dressings are available (Hess 2002); despite widespread scientific
perception about wound dressings, globally most of the available traditional and modern
dressings are passive meaning they are non-responsive. Currently, the research and
innovation within wound companies and university discoveries of wound care products
CHAPTER 1: Introduction
28
is shifting from the conventional non-responsive wound dressings to generating
advanced wound dressings of biocompatible polymers. In doing so, such advanced
wound dressings contain a responsive element that will tackle and control the underlying
biochemical mechanisms, pathological and cellular turnover caused by high proteolytic
activity in order to facilitate wound healing of a deadlocked wound by restoring the
imbalance of proteases to normal levels.
Despite significant advances in developing new advanced wound dressings, traditional
dressings are still used. This is because the complexity and lack of knowledge by wound
care clinicians/ physicians of the new advance wound dressings hinders wound care
clinicians/ physicians to make use of them (Nobel 2006) since the pathophysiology of
chronic wounds is still poorly understood. In recent years, various studies have
demonstrated inhibiting the expression of proteolytic activity by sophisticated wound
dressings such as PromogranTM which has been shown to be more effective (Johnsons &
Johnsons, Cullen et al. 2002a; Nobel 2006; Smeets et al. 2008), but there are built-in risks
associated with this dressing as it is made of bovine which is of animal origin (Eming et
al. 2008). Therefore, there is a necessity and a growing interest to increase the availability
of responsive advanced wound dressings of biocompatible synthetic origin under moist
healing conditions because this is accepted as the most effective way of healing wounds
(Winter 1962). Much attention has been contributed to developing responsive hydrogel
dressings as these materials play an important role in protecting wounds from bacterial
infiltration, dehydration, controls trauma and promotes moist wound healing, but most
importantly is biologically biocompatible to the body.
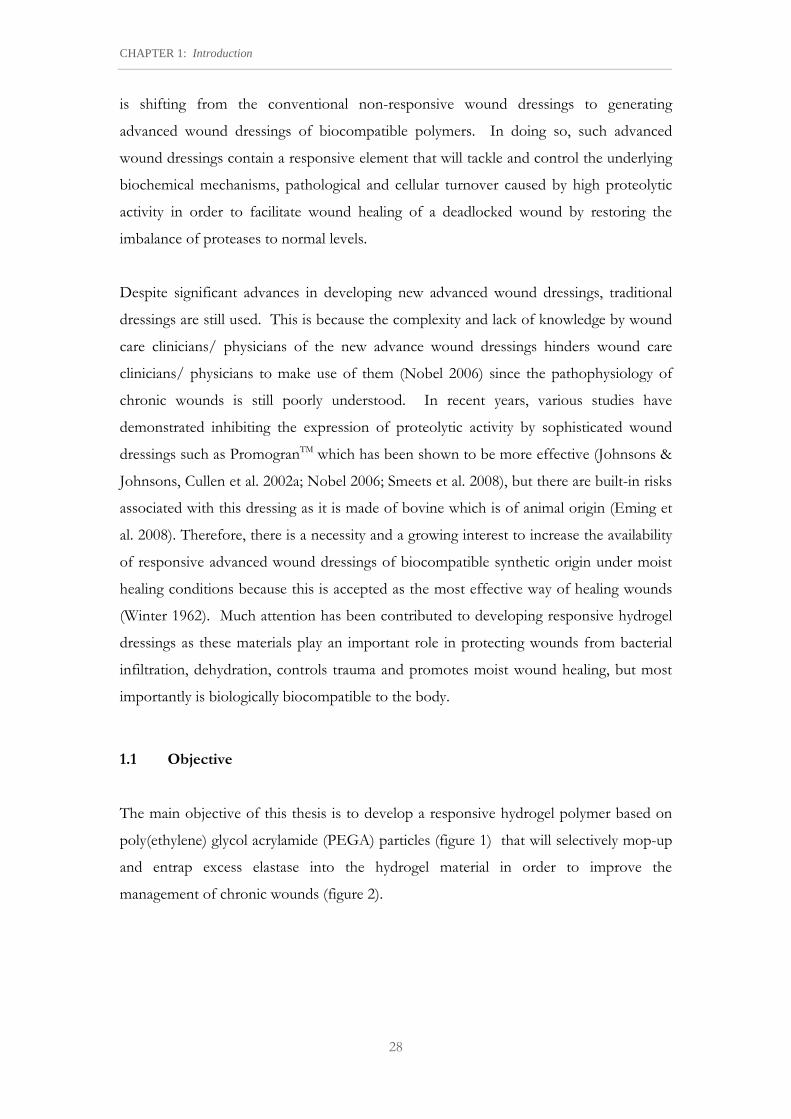
1.1 Objective
The main objective of this thesis is to develop a responsive hydrogel polymer based on
poly(ethylene) glycol acrylamide (PEGA) particles (figure 1) that will selectively mop-up
and entrap excess elastase into the hydrogel material in order to improve the
management of chronic wounds (figure 2).

CHAPTER 1: Introduction
29
NH
O n
NHO
NHO
*
*
NH2
O
n
n
CH3
CH3
O
O C
H2
CH
2
O
xl
n
NH2
CH2
CH2
O
CH3
xl
Figure 1. The molecular structure of PEGA particles. PEGA consists of a polyacrylamide backbone (n, red) with PEG crosslinks (black and blue). The free amine groups (green) are used to couple enzyme cleavable peptides (ECPs) using solid phase peptide synthesis (SPPS). Depending on the type of PEGA, the molecular weight of the bio-inert PEG chains (xl, blue) within the matrix of the hydrogel vary: PEGA1900 has a longer PEG chain as opposed to PEGA800; consequently the loading (mmol/g) of PEGA1900 is less compared to PEGA800.
Figure 2. A schematic diagram exhibit a deep chronic wound being healed after treatment with PEGA particles (light solid circles) that have been are designed to selectivity mop-up excess proteases presence (dark solid circles with pink colour inside) in chronic wounds.
1.2 Aims of the project
The aims of the project are split into three sections. Initially the research involved
functionalising the matrix of PEGA particles with Fmoc-peptide substrates which are
referred to as enzyme cleavable peptides (ECP) so that the hydrogel polymer mimics
elastase substrates involved in normal wound healing. Elastase then recognises and
cleaves the peptide sequences of the ECP; and the charges of the ECP control the
accessibility of elastase into the interior of PEGA particles. The penetration of elastase
into interior of PEGA particles is determined by swelling of the PEGA particles
depending on pH and ionic strength. Once inside the interior of PEGA particles elastase
eventually becomes entrapped. This is achieved by the pores of PEGA particles which
Chronic wound
Remove particles with
entrapped protease
Particles added to chronic wound
↑ Healing of chronic wound

CHAPTER 1: Introduction
30
collapse upon selective removal of charged groups within the matrix of the PEGA
particles (figure 3) thus removing the elastase from the sample fluid. Finally, elastase-
type activity expressed by fibroblast cells was shown to decrease in the presence of
PEGA particles. To address the aims, the scope of the experimental study is split into
three individual chapters (see section 1.3).
Figure 3. Swelling to collapse of PEGA particles. PEGA particles are modified by the incorporation of charges (for example negative) and this causes a proteases of opposite charge (in this case, positive) to be attracted and then diffuse into the PEGA particle. The protease selectively recognises and cleaves the ECPs coupled to PEGA particles. Removing the charge of the ECPs causes the pores of PEGA particles to collapse thus entrapping the proteases within the particle.
1.3 Scope of Thesis
Chapter 2 reviews the literature; firstly the chapter reviews the physiological anatomy
(structure and function) of the skin and the fundamental biology for the process of
wound healing in the context of acute healing in order to understand chronic wound
healing and the two categories are differentiated enabling the reader to understand the
pathophysiology of chronic wounds compared to acute wounds. This chapter gives an
account of the role of proteases in wound healing which includes showing the broad
selectively of wound proteases and most importantly determining the charge of each
protease depending on its pI value. After discussing chronic wounds the chapter focuses
on giving an account of reports of high levels of proteases (e.g. elastase) as the underlying
cause of chronic wounds. Finally, the ending of this chapter is devoted to the
management of wound healing and the discussion in this thesis focuses on hydrogel
dressings (both non-responsive and responsive) that are available/ researched for
chronic wounds as well as the recent developments of protease-modulating hydrogels
design to tackle elevated levels of proteases observed in chronic wounds.
SPPS
Protease (+ve)
PEGA particles swells with the incorporation of
negative charges
PEGA particles collapses upon removal of charge, protease is trapped (pink)
Unmodified PEGA particles

CHAPTER 1: Introduction
31
Following chapter 2, the experimental chapters are presented as three individual chapters.
To lead the reader in a logical way each chapter has their own introduction, methods and
materials, results and discussion as well as conclusions. The reader should note that
there is overlap of certain methods in all three experimental chapters and these have
been cross-referenced to the corresponding chapter to enable the reader to easily locate
the method in question.
Chapter 3 outlines the use of stepwise solid phase peptide synthesis (SPPS) to
functionalise PEGA particles with enzyme cleavable peptides responsive to elastase using
Fmoc-chemistry (HOBt/ DIC). The functionality of modified PEGA particles is further
shown to be controlled by monitoring the swelling of the PEGA particles as a function
of pH and ionic strength. Next, chapter 4 outlines the accessibility and entrapment of
elastase into PEGA particles by exploiting the use of various fluorescence techniques
using both indirect/ direct approaches. Finally, chapter 5 takes advantage of using
human dermal fibroblasts to explore the expression of elastase-like by these cells and
demonstrates that a decrease in elastase-like activity is observed in the presence of the
PEGA responsive hydrogel particles. Subsequently conclusions and further studies are
presented in chapter 6.

CHAPTER 2: Literature Review – Wound Healing & Management of Chronic Wounds
32
CCHHAAPPTTEERR 22
LLii tteerraattuurree RReevviieeww -- WWoouunndd HHeeaall iinngg && MMaannaaggeemmeenntt ooff CChhrroonniicc WWoouunnddss

CHAPTER 2: Literature Review – Wound Healing & Management of Chronic Wounds
33
2.1 ANATOMY & PHYSIOLOGY OF THE SKIN 2.1.1 Anatomy of the skin
Structurally, the human skin consists of three layers: the outer, thinner layer is composed
of epithelium called the EPIDERMIS (a.k.a cuticle; Cohen et al. 1992). The epidermis is
attached to the inner, thicker layer consisting of connective tissue known as the
DERMIS (a.k.a corium; Cohen et al. 1992). Beneath the dermis is the
SUBCUTANEOUS layer (a.k.a. superficial fascia or hypodermis or subcutis), which
consists of aveolar and adipose tissues (Baranoski and Ayello 2004; Tortora and
Grabowski 1993). Fibres from the dermis extend down into the subcutaneous layer and
anchor the skin to it. The subcutaneous layer, in turn, attaches to underlying tissues and
organs, and therefore separates the skin from the muscle of the body wall beneath. The
epidermis and dermis are the two major layers of the skin (Baranoski and Ayello 2004;
Cohen et al. 1992; Tortora and Grabowski 1993), which are now described in detail.
2.1.1.1 Epidermis
The epidermis is the most superficial layer of the skin, composed of stratified squamous
epithelium (layered cells) and contains four principle types of cells of the epidermal cells:
(1) Keratinocytes: these produce the protein keratin, (2) Melanocytes: these produce the
pigment melanin, (3) Langerhans cells: these arise from the bone marrow and interact
with helper T cells in immune responses, and (4) Merkel cells: these make contact with
the tactile disc (and ending of a sensory neuron) (Tortora and Grabowski 1993).
There are two distinct regions of the epidermis (i) Upper area – where cells convert from
living to dead; and (ii) Cell renewal area – allows living cells to be renewed via mitosis.
The two regions are composed of five layers, from the deepest to the most superficial,
are: stratum basale, stratum spinosum, stratum granulosum, stratum lucidum, stratum
corneum (Baranoski and Ayello 2004; Tortora and Grabowski 1993); further details of
these layers are expressed in table 1.

CHAPTER 2: Literature Review – Wound Healing & Management of Chronic Wounds
34
Table 1. Layers of the epidermis
Layers of the epidermis
Description Function
Stratum germination (basale layer)
• Actively living layer of epidermis
• Deepest layer of the epidermis
• Its lower surface is attached to the dermis (from which it receives nutrient fluid from the blood vessels)
• Contains stem cells, which multiply, and produce keratinocytes – which push up towards the surface and become part of the more superficial layers
• Melanocytes (melanin-forming cells) are formed within this layer
• Contains tactile (Merkel) discs
• Cells are in active growth
• Stem cells are capable of continuing cell division (mitosis) – development of new cells occurs and gradual displacement of older cells towards surface of skin
• Melanin: protects skin against damaging ultraviolet (UV) light & changes in skin colour when exposed to the sun
• Tactile disc function in the sensation of touch
Stratum spinosum
(prinkle cell layer)
• Actively living layer of the epidermis
• Contains 8 – 10 rows of polyhedral cells that fit closely together
• Composed of newly formed epidermal cells, called keratinocytes. These cells are joined together by prickly desmosomes (outgrowths), hence the name prickle layer
• Keratinisation is the change of living cells containing a nucleus into layers of flat cells composed of hard durable protein keratin
• Long projections of melanocytes extend among the keratinocytes, which take in melanin by phagocytosis of these melanocyte processes
• Connecting of the keratinocytes allows each cell to receive nourishment from the tissue fluid or protoplasm
• Cells start to die via the Keratinisation process – keratinocytes are in early stages of producing the a tough fibrous protein called keratin
Stratum granulosum (granular layer)
• Non-living layer of epidermis
• Consist of 3 – 5 rows of flattened cells
• Cells become flattened and nucleus disintegrates, there is a loss of fluids which contributes to the development of keratohyalin (a precursor of keratin)
• Breakdown of nucleus – the cells are no longer able to carry out vital metabolic reactions
• Final stages of keratinisation take place in this layer
• Keratohyalin – transforms the cells into keratin (a protein found in outer layer of epidermis)
• Cells die due to the breakdown of nucleus and cell contents
Stratum lucidum
(transparent layer)
• Non-living layer of epidermis
• Lies between the outer Stratum corneum and the inner Stratum granulosum
• Consist of 3 – 5 layers of small, tightly packed (flat) transparent dead cells containing droplets of keratohyalin and no nucleus
• Appears in the thickest areas of skin, the soles of feet and palm of the hands
• These cells contain an epidermal fatty substance resembling bees’ wax
• The droplets keratohyalin (dead cells) is eventually transformed into keratin
• Epidermal fatty substance
– functions as a barrier zone controlling the transmission of water through the skin, and
– helps prevent the skin from cracking and becoming open to bacterial infection
Stratum corneum
(horny layer)
• outer layer – non-living layer of epidermis
• cells have no nucleus
• Consist of 25 – 30 layers of mature squames – keratinised epithelial cells tightly packed together (flat), dead cells completely filled with keratin
• Each squame is roughly disc shaped – has a tough protein wall and packed with keratin
• All molecules of keratin are aligned parallel to the surface of the skin and parallel to each other
• This layer protects the living cells within - serves as an effective barrier against UV light and heat waves, bacteria, and many chemicals
• The generations of squames - they gradually migrate towards the outer surface
• Eventually, cells of superficial layers are continuously shed and replaced by cells from deeper strata
(Baranoski and Ayello 2004; Hess 2002; Tortora and Grabowski 1993)

CHAPTER 2: Literature Review – Wound Healing & Management of Chronic Wounds
35
2.1.1.2 Dermis
The second principal part of the skin, the dermis lies beneath the epidermis and is the
tough elastic layer (composed of connective tissue containing collagen and elastic fibres)
of the skin. The dermis has higher water content than any other region of the skin and
provides nourishment to the epidermis. It is composed of two layers; the outermost
layer just beneath the epidermis is the papillary layer (Baranoski and Ayello 2004; Cohen
et al. 1992; Tortora and Grabowski 1993). Beneath it and forming the bulk of the dermis
is the reticular layer (Baranoski and Ayello 2004; Cohen et al. 1992; Tortora and
Grabowski 1993), which has most of the protein fibres (refer to table 2).
Table 2. Layers of the dermis
Dermis layers Description Function
Papillary 1ayer
• situated at the interface of the dermis with the epidermis
• undulating (wavy) tissue
• consisting of areolar connective tissue containing fine elastic fibres
• upwards projections are called dermal papillae, they contain blood & lymph capillaries and nerve endings
• highly active & important area of skin
• increases surface area of reproductive cells – dermal papillae
• provides living layers of epidermis with vessels which supply nourishment and remove cellular waste
• nerve endings perform skin’s sensory function
Reticular layer
• situated beneath papillary layer
• dense and fibrous (tough and elastic collagen fibres)
• protein fibres are made from fibroblast cells contained in a ‘ground substance’
• contains main components of the skin: spaces between the fibres are occupied by adipose tissue, hair follicles, nerves, oil glands, and ducts of sweat glands
• attached to underlying organs i.e. bone and muscle
• this layer varies in thickness depending on differences in thickness of skin
• protects and repairs injured tissue
• fibres allow skin to bend and fold over underlying muscle activity:
– Collagen: gives skin its strength and resilience
– Elastin: allows skin to stretch easily and quickly regain its shape, and general tone of skin (smoothness to epidermis)
– Reticulum: keeps all the other structures in place
(Baranoski and Ayello 2004; Hess 2002; Tortora and Grabowski 1993)
2.1.2 Physiological function of the skin
The skin is the largest organ of the human body in surface area and weight. It consists of
different tissues that are joined to perform specific activities. It provides a tough, flexible
covering and has many essential functions (as depicted in the table 3).

CHAPTER 2: Literature Review – Wound Healing & Management of Chronic Wounds
36
Table 3. Summary – The physiological function of the skin
Function Description for role of the skin Temperature regulation
Body temperature is controlled by heat loss through the skin and by sweating:
• High temperature - evaporation of sweat from skin surface lowers elevated body temperature to normal.
• Low temperature - production of sweat is decreased, therefore conserves heat
Protection Skin covers the body providing a physical barrier that protects underlying tissues from:
• Physical abrasion
• Bacterial invasion
• Dehydration
• UV radiation
Sensation Skin is very sensitive:
• It contains abundant nerve ending and receptors, which detect stimuli - enabling the feelings of touch, pressure, pain and temperature
Excretion
Skin aids in the removal of waste products from the body:
• Sweat also allows the excretion of small amounts of salts and several organic compounds
Immunity Some cells of epidermis are essential components of the immune system
• Skin provides a warning system (1st line defence mechanism) against outside invasion i.e. foreign invaders
• Visual indication (redness/ irritation) shows the skin is intolerant to either an external or internal stimuli
Blood reservoir
Dermis of skin contains extensive networks of blood vessels
• Skin blood flow may increase – aids to dissipate heat from the body, or
• Skin blood vessels may constrict (narrow) ∴ more blood is able to circulate to contracting muscles.
Nutrition Skin enables fat to be stored:
• An energy reserve Synthesis of Vitamin D:
• Achieved by the activation of a precursor molecule in the skin by UV rays of sunlight
• Enzymes then modify the molecule, finally producing calcitriol (active form of vitamin D)
• Calcitriol – enables the homeostasis of body fluids by the absorption of calcium in foods
• Vitamin D is an hormone as its produced in one location of the body, then transported by
the blood to function in another location ∴ the skin is considered to behave as an endocrine organ
Moisture control
Skin controls the level and movements of moisture from within the deeper layers of the skin
(Baranoski and Ayello 2004; Hess 2002; Tortora and Grabowski 1993)
In order for the skin to function effectively, the skin must be cared for both internally
and externally as it plays an important role in maintaining homeostasis of the body. One
way in which this is achieved, is by wound healing (Tortora and Grabowski 1993).

CHAPTER 2: Literature Review – Wound Healing & Management of Chronic Wounds
37
2.2 WOUND HEALING
Various stimuli can damage the skin, and the body has an extensive defence system,
where it undergoes several mechanisms to maintain normal structure and function
(Tortora and Grabowski 1993). Wound healing can be considered as the process by
which a wound regenerates and repairs itself.
2.2.1 Acute and chronic wound healing
Wound healing can be classified into two forms: acute (normal) and chronic (abnormal)
wound healing (Boyce 1996; Jones et al. 2004). Acute wounds can be considered as
normal wounds, which are the end result of traumatic injury or surgery (Boyce 1996;
Hess 2002; Jones et al. 2004) and can be defined as “a disruption in the integrity of the
skin and underlying tissues that progress through the healing process in a timely and
uncomplicated manner” (Bates-Jensen and Wethe as cited in Jones et al. 2004) via
primary intention (Hess 2002; Jones et al. 2004). On the other hand, chronic wounds
heal by secondary intention (Hess 2002; Jones et al. 2004) and can be defined as “any
interruption in the continuity of the body’s tissue that requires a prolonged time to heal,
does not heal, or recurs” (Wysocki 1996) and “fails to progress through a normal,
orderly, and timely sequence of repair or wounds that pass through the repair process
without restoring anatomic and functional results” (Lazarus as cited in Jones et al. 2004),
and therefore resulting in the formation of a chronic wound. A third way of repairing
the skin is via tertiary intention (delayed primary) where healing of skin involves closure
by using sutures, staples or adhesive skin closures.
Wounds of the skin can be classified into different types according to the layers of the
skin involved: (1) Superficial wounds – the epidermis layer is only involved; (2) Partial
thickness wounds – involve the dermis; and (3) Full thickness skin wounds – cut deep
into the subcutaneous layer (Collins et al. 1992). It can be said that chronic wounds are
usually the result of partial or full thickness wounds. However, superficial wounds can in
turn result into a chronic wound only when the wound healing is disrupted.
CHAPTER 2: Literature Review – Wound Healing & Management of Chronic Wounds
38
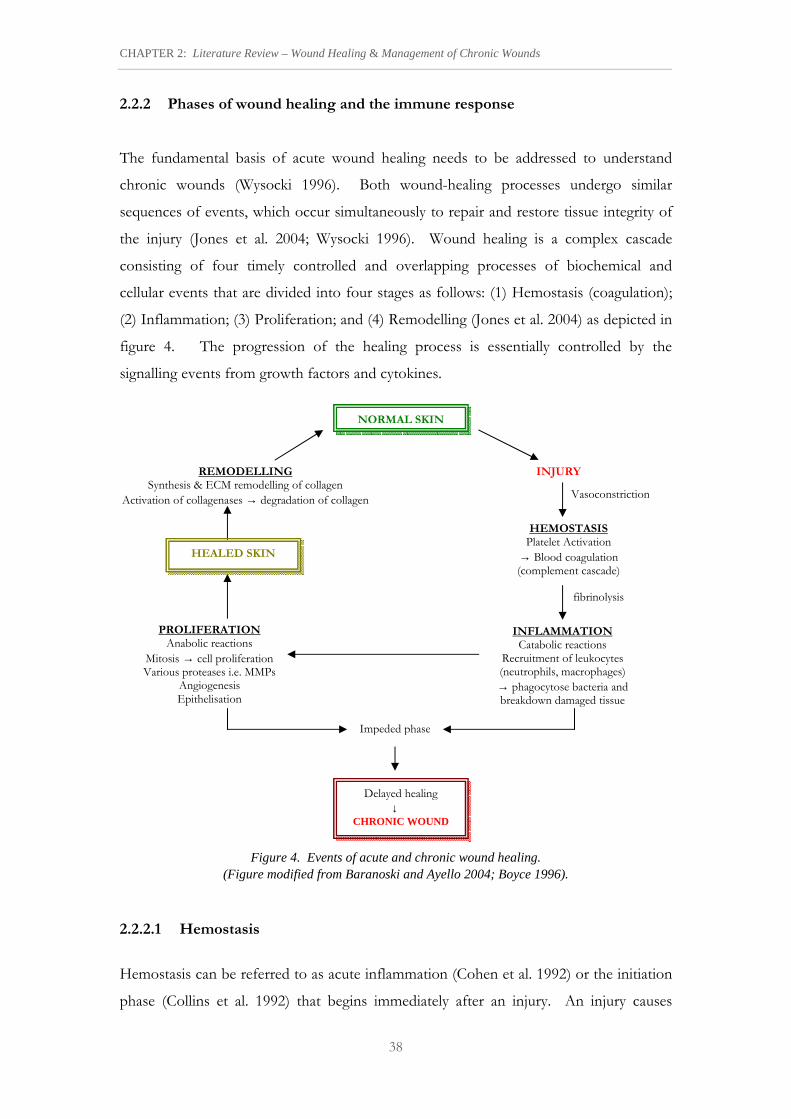
2.2.2 Phases of wound healing and the immune response
The fundamental basis of acute wound healing needs to be addressed to understand
chronic wounds (Wysocki 1996). Both wound-healing processes undergo similar
sequences of events, which occur simultaneously to repair and restore tissue integrity of
the injury (Jones et al. 2004; Wysocki 1996). Wound healing is a complex cascade
consisting of four timely controlled and overlapping processes of biochemical and
cellular events that are divided into four stages as follows: (1) Hemostasis (coagulation);
(2) Inflammation; (3) Proliferation; and (4) Remodelling (Jones et al. 2004) as depicted in
figure 4. The progression of the healing process is essentially controlled by the
signalling events from growth factors and cytokines.
Figure 4. Events of acute and chronic wound healing. (Figure modified from Baranoski and Ayello 2004; Boyce 1996).
2.2.2.1 Hemostasis
Hemostasis can be referred to as acute inflammation (Cohen et al. 1992) or the initiation
phase (Collins et al. 1992) that begins immediately after an injury. An injury causes
PROLIFERATION Anabolic reactions
Mitosis → cell proliferation Various proteases i.e. MMPs
Angiogenesis Epithelisation
HEMOSTASIS Platelet Activation
→ Blood coagulation (complement cascade)
INFLAMMATION Catabolic reactions
Recruitment of leukocytes (neutrophils, macrophages)
→ phagocytose bacteria and breakdown damaged tissue
REMODELLING Synthesis & ECM remodelling of collagen
Activation of collagenases → degradation of collagen
fibrinolysis
Vasoconstriction
NORMAL SKIN
INJURY
HEALED SKIN
Delayed healing
↓ CHRONIC WOUND
Impeded phase

CHAPTER 2: Literature Review – Wound Healing & Management of Chronic Wounds
39
excessive bleeding, which is stopped by the formation of a clot (thrombus) over the
wound; which is controlled by the process of blood clotting (coagulation) - a complex
cascade of enzymatic reactions that occur via two processes: (1) the classical (intrinsic or
contact activation) pathway and (2) the alternative (extrinsic or tissue factor pathway)
pathway. Both pathways eventually combine to activate the complement pathway, and
this releases complement split products that are essential mediators required for
inflammation.
In response to the depositing of the epidermal layer, the blood coagulation cascade is
activated and this process is mediated by the release of platelets (thrombocytes), clotting
factors (a variety of enzymes), erythrocytes, and leukocytes (Wysocki 1996; Boyce 1996;
Lobmann et al. 2005). Ruptured blood vessels expose the ruptured collagen to matrix
proteins, which activate platelet aggregation. The activated platelets release growth
factors, such as the platelet-derived growth factor (PDGF) and the basic fibroblast
growth factor (bFGF) (Silver and Christiansen 1999; Lobmann et al. 2005) that initiate
the initial phase of hemostasis by causing vascular constriction of ruptured blood vessels
to stop bleeding.
Figure 5. Formation of thrombin and fibrin.
This is then followed by vasodilation causing the plasma to exit from the capillaries and
into the wound. When the platelets interact with the injured tissue, this results in the
release of thrombin (a serine protease), which in turn catalyses the conversion of the
soluble plasma protein, fibrinogen into insoluble fibrin strands and fibrinopeptides
(Cohen et al. 1992; Kuby 1997) as summarised by figure 5. The blood plasma becomes
sticky and the fibrin strands crisscross one another like a mesh to form a hemostatic
blood clot (a.k.a the fibrin clot, fibrin plug, fibrin blood clot or blood clot) over the
Prothrombin (inactive enzyme)
THROMBIN (active enzyme)
FX
FXa (thrombokinase)
CLOT
Fibrinogen (soluble)
Fibrinopeptides + FIBRIN (insoluble)

CHAPTER 2: Literature Review – Wound Healing & Management of Chronic Wounds
40
wound that traps red blood cells and activated platelets. The activated platelets release
cytokines and growth factors that provide signals to further propagate the clot (Cohen et
al. 1992) to stick to blood cells and attach to fibronectin and vitronectin (plasma
proteins).
In subsequent phases of wound healing, the fibrin clot serves as a provisional matrix that
allows inflammatory cells to attach, proliferate and migrate into the wound site (Kerstein
1997; Martin 1997). When the blood vessels have sealed, the temporary fibrin clot is
removed from the wounded area by the activation of fibrinolytic pathway (Kuby 1997;
Silver and Christiansen 1999) a.k.a the plasminogen or plasminogen/ plasmin system; an
enzymatic process summarised by figure 6.
Figure 6. Fibrinolytic pathway. Fibrinolysis in the blood is essentially regulated by tPA, whereas in tissues its regulated by uPA. Abbreviations: PAs (plasminogen activators): tPA (tissue-type plasminogen activator) and uPA (urolinase-type plasminogen activator); ↑ (increase); and WBCs (white blood cells). Figure tailored from Kudy 1997; Silver and Christiansen 1999; Liekens et al. 2001.
The fibrin clot is lysed by plasmin (a serine protease) into fibrin degradation products i.e.
chemoattractants and cellular building blocks (Cohen et al. 1992) that are reabsorbed by
the body and utilised during subsequent phases of the wound healing process. In
addition, when the activated platelets degranulate, their α-granules release various
cytokines and growth factors, such as: PDGF, platelet-derived angiogenic factor (PDAF),
transforming growth factor-β (TGF-β), and epidermal growth factor (EGF) (Silver and
Christiansen 1999; Lobmann et al. 2005), transforming growth factor-α (TGF-α) and
vascular endothelial growth factor (VEGF) (Morison et al. 2004) that are largely (1)
chemoattractants for inflammatory cells (neutrophils, monocytes and macrophages) and
(2) mitogens for the non-inflammatory cells (fibroblasts and endothelial cells) that are
Plasminogen (inactive enzyme)
PLASMIN (active enzyme)
Activation of Complement
System
FIBRIN CLOT (insoluble)
Products of fibrin degradation
↑ Vascular permeability
↑ WBCs (neutrophil)
↑ chemotaxis
Endothelial cell factors (PAs: uPA, tPA) Blood clotting factors

CHAPTER 2: Literature Review – Wound Healing & Management of Chronic Wounds
41
involved in subsequent phases of wound healing. The initial release of the growth
factors from the platelets is essentially crucial for successful progression of the
subsequent phases of wound healing (Singer and Clark 1999; Lobmann et al. 2005).
Various vasodilatory substances (such as serotonin, histamines) are produced by
endothelial cells, which also aid in the initiation of the inflammation stage of wound
healing process (Boyce 1996).
2.2.2.2 Inflammation
The inflammation phase is also known as the defence or reaction phase (Hess 2002).
This stage is usually personified by redness, swelling, heat and pain (Hess 2002; Lobmann
et al. 2005) that typically last for 1 – 7 days (Lobmann et al. 2005). The inflammation
phase is exemplified by vasodilation and increased permeability for the migration and
activation of white blood cells (WBCs, mast cells, neurophils, granulocytes, monocytes,
lymphocytes) from the blood into the tissue (as summarised in figure 7). This is
mediated by chemotaxis and various growth factors (Boyce 1996) which is vital for
immune surveillance and inflammation.
The inflammation stage begins 6 hours after injury (Lobmann et al. 2005) and mainly
involves catabolic reactions. The first leukocytes to migrate into the provisional matrix
of the wound are neutrophils. During this diapesis of leukocytes, the leukocytes adhere
to endothelial cell adhesion molecules and then migrate across the vascular endothelium.
Endothelial cell adhesion molecules and their counter-receptors on leukocytes (e.g.
neutrophils, monoctyes etc.) generate intracellular signals. These signals are controlled
by the release of growth factors and chemoattractants from leukocytes and red blood
cells to activate the cell-cell adhesion mechanism.
The selectin family consist of three different single chain transmembrane receptors: E-,
P-, and L-selectin. These receptors initiate leukocyte: capturing, rolling and tethering (i.e.
weak adhesion) during the inflammation process. However, the integrins are involved in
firmer adhesion before leukocyte emigration from blood vessels into the target tissues.
Integrins are heterodimetric transmembrane glycoproteins, composed of non-covalently
associated α and β subunit, each a type-1 membrane protein.

CHAPTER 2: Literature Review – Wound Healing & Management of Chronic Wounds
42
Leukocytes GPCR (G-protein coupled receptors)
RBC (red blood cells)
Chemokine Proteolycan Endothelial cells
Figure 7. General mechanism of leukocyte adhesion to the endothelial cells, mediated by the cell-cell adhesion mechanism of selectins/ integrin. The selectins enable weak adhesion whereas the integrins enable strong adhesion. All leukocytes undergo this general mechanism of cell-cell adhesion once they migrate into provisional matrix during wound healing. (Figure modified from Silver and Christiansen 1999).
Initially, the P- and E-selectins bind to their counter-receptors (P-selectin glycoprotein
ligand-1 (PSGL-1), E-selectin ligand-1 (ESL-1) respectively) on the leukocyte membrane,
which weakly tethers leukocyte to the endothelium and initiates rolling along the
endothelium cell. As the leukocyte cell rolls, the epithelium cells produce and secrete
chemotactic cytokines, such as interleukin-2 (IL-2), which activates L-selectin to shed
from the leukocytes soon after its activation (Springer 1994) to attract the leukocyte to
endothelium. Then, the chemokines bind to their counter-receptors, G-protein coupled
receptors (GPCRs) at the leukocyte surface, and induces an ‘inside-out’ signalling cascade
which induces G-protein/tyrosine kinase activity resulting in phospholipase Cβ2 (PLC)-
mediated phosphoinositol phosphate (PIP) hydrolysis. The subsequent release of
diacylglycerol (DAG) results in protein kinase C (PKC) activation and IP3-mediated
release of [Ca2+]. During cell-cell adhesion, these signals up-regulate cell surface
Ca2+
Selectins Integrins & IgSF Rolling Sticking Extravasation Chemotaxis
Activation by chemokine Activation of
endothelial cells Activation of leukocytes
LUMEN
TSSUE SPACE Site of injury of
wound
Chemotaxis

CHAPTER 2: Literature Review – Wound Healing & Management of Chronic Wounds
43
expression of the α/β2-integrin on the leukocyte to gain affinity for the immunoglobulin
superfamily (IgSF) cell adhesion molecules (CAMs) on the endothelial cells and therefore
the activation of the α/β2-integrin causes its conformational change from an inactive to
an active form. This is further enhanced by binding of divalent cations to α-subunit of
integrin.
The α/β2-integrins then bind to the Leu-Val-Asp-Pro (LVDP) domains of fibronectin
on the endothelial cells of the endothelium – inducing the outside-in signalling
transduction pathways. Such signals stabilise adhesion causing the leukocyte to firmly
adheres to the endothelial cell (Springer 1994), and is able to transmigrate between the
endothelial cells, crossing the blood vessel wall into the damage/infected tissue. In doing
so, the leukocytes mop up debris, damaged tissue, foreign substances and attack any
pathogens to control the infection.
Neutrophils have the ability to phagocytose bacteria, ECM and degrade degenerating
connective tissue by secreting destructive proteases (Morison et al. 2004; Theilgaard-
Moench et al. 2004) such as elastase. At 24 hours, the levels of neutrophils reach their
peak (Cohen et al. 1992; Bowler 2002) and begin to decrease as the monocytes migrate
into the wound (Cohen et al. 1992; Lobmann et al. 2005). These monocytes also
undergo phagocytosis and then differentiate into macrophages (Cohen et al. 1992;
Lobmann et al. 2005) between 48 – 72 hours and persist for a few days. The
macrophages suppress bacterial growth, debride the wounded area of cellular debris,
necrotic tissue (Kuby 1997; Hess 2002) and the damaged matrix is broken down by
proteolytic enzymes (i.e. collagenase and elastase) secreted by macrophages. Also, during
wound healing, the macrophages mediate the conversion of macromolecules to amino
acids and sugars (Hess 2002).
Macrophages further release growth factors (such as transforming growth factor beta,
TGF-β) and chemoattractants/ cytokines (such as interleukin-1, IL-1; tumour necrosis
factor, TNF) to recruit cells involved in the proliferation phase such as fibroblasts
(develop from mesenchymal cells) and endothelial cells to the site of injury around 3 – 4
day post-wounding just before the inflammatory phase ends (Cohen et al. 1992; Hess
2002). Eventually after a couple of days, fibroblasts become the predominant cell type.

CHAPTER 2: Literature Review – Wound Healing & Management of Chronic Wounds
44
This initiates the proliferation phase of wound healing process under the influence of
macrophages.
2.2.2.3 Proliferation
The proliferation stage lasts for approximately 24 days (Hess 2002). This phase involves
various overlapping processes: angiogenesis, granulation, epithelisation and wound
contraction in order for the epithelial cells beneath the scab to grow and replace the
provisional matrix with new collagen molecules that are matured in the remodelling
phase.
Angiogensis is also refer to as ‘neovascularisation’ and this process is initiated by the
secretion of angiogenic factors that are secreted by macrophages and these become
activated by low oxygen tension and the migration of endothelial cells. Angiogensis is
the process by which new blood vessels are formed from the endothelial cells (Cohen et
al. 1992; Tortora and Grabowski 1993; Morison et al. 2004). The process of angiogenesis
occurs simultaneously with the clonal expansion of fibroblast and the migration of
endothelial cells into the provisional matrix as fibroblasts and epithelial cells both require
oxygen, therefore the process of angiogenesis is important for the remaining phases of
wound healing.
During hypoxia (low oxygen levels) macrophages and platelets release angiogenic factors
which chemotactically recruit endothelial cells into the provisional matrix. The new
blood vessels are formed from the endothelial cells of undamaged blood vessels which
develop pseudopodia enabling them to push through the ECM and into the wound site.
The migration of endothelial cells into the provisional matrix is mediated by proteolytic
enzymes (i.e. collagenases and the plasminogen activators) to lyse the clot (for further
details on fibrinolysis see haemostasis phase and role of enzymes in wound healing) and
the ECM (Cohen et al. 1992; Hess 2002; Morison et al. 2004). The process continues
until the blood vessels are repaired and tissue oxygenation is restored (Morison et al.
2004) then the migration of endothelial cells is decreased.
Granulation tissue fills the open wound approximately 2 – 5 days post-wounding (during
the inflammatory phase) and the wound continues to fill and grow until the wound bed is
covered. Granulation tissue is characterised by the presence of macrophages, fibroblasts,

CHAPTER 2: Literature Review – Wound Healing & Management of Chronic Wounds
45
inflammatory cells, endothelial cells, new blood vessels, myofibroblasts, new provisional
ECM and fibronectin (Hess 2002; Morison et al. 2004).
Fibroblasts from the undamaged tissue migrate into the wound site. The growth factors
secreted by fibroblasts enable epithelial cells to migrate to the wound site. For about 2 –
4 weeks, the main function of fibroblasts is to rapidly synthesise collagen by randomly
depositing and laying down immature collagen type III fibres (Tortora and Grabowski
1993; Cohen et al. 1992; Silver and Christiansen 1999; Morison et al. 2004; Baranoski and
Ayello 2004). The growth factors and fibronectin also encourage proliferation,
migration across the wound bed, and production of ECM molecules by fibroblasts.
Eventually the production of immature collagen (type III) levels off as it equals its
destruction by collagenases and other factors (Baranoski and Ayello 2004; Morison et al.
2004). Granulation completes when the levels of fibroblast decrease and at the end of
this process fibroblast undergo apoptosis and the granulation tissue consist mainly of
type III collagen (Stadelmann et al. 1998).
Within a week, growth factors activate fibroblasts to differentiate into myofibroblasts
which cause the wound to contract (Baranoski and Ayello 2004). Under the influence of
fibronectin and growth factors myofibroblasts move along the fibronectin-fibrin clot in
the provisional ECM to migrate to the wound edges. At this stage the myofibroblasts
attach to each other as well as adhering to fibronectin and collagen molecules of the
ECM at the wound margins. In doing so, the actin in myofibroblasts contract
(Stadelmann et al. 1998) causing the edges of the wound to pull together sealing the open
wound from the external environment (Hess 2002). This triggers the epithelialisation
stage, which is the final step of the proliferation phase. The epithelialisation stage is
characterised by the presence of keratinocytes from the wound edges, hair follicles, sweat
glands, and sebaceous glands. The epithelial cells migrate across the granulation tissue to
form a thin barrier between the wound and the environment. Keratinocytes migrate
across the granulation tissue of the wound bed until epithelial cells from either side meet
in the middle, and the edges of the wound align to close the epidermal layer (Cohen et al.
1992; Bradley et al. 1999). The completion of the epithelisation results in the formation
of a scar (Hess 2002). By doing so the keratinocytes stop migrating and the
myofibroblasts stop contracting and this stops the proliferation phase and initiates the
remodelling phase.

CHAPTER 2: Literature Review – Wound Healing & Management of Chronic Wounds
46
2.2.2.4 Remodelling
The wound enters the remodelling phase (final stage of wound healing) by the migration
of keratinocytes. The remodelling stage is sometimes referred to as the maturation phase
(Hess 2002; Tortora and Grabowski 1993) and during this stage the randomly organised
collagen type III fibers are remodelled and matured into organised layers of collagen type
I and the number of fibroblasts present within the wound bed decrease; and finally the
blood vessels are restored to normal (Tortora and Grabowski 1993; Hess 2002). During
this phase, the thickness of the newly formed epidermis returns to 80% of the original
strength (Silver and Christiansen 1999; Hess 2002) by improvement of tensile strength
and cellular organisation causing the wound to contract which in turn causes the scab to
fall off. Depending on the extent of injury, remodelling of the wound (i.e. collagen
matrix) continues for weeks to months and even years as the scar tissue is not strong
compared to the tissue it replaces.
2.2.3 Role of enzymes in wound healing
The composition of the ECM is influenced by the infiltration and migration of various
cells that have numerous immunological functions during the wound healing process.
This regulation for the infiltration and migration of the immune cells is effectively
orchestrated by signals received from both soluble and complexed ECM cytokines and
chemokines which produce ECM degrading, modifying and synthesising proteases
(Alexander and Werb 1989; Goetzl et al. 1996). Accordingly, the wound healing process
is tightly controlled by these proteolytic enzymes which are present within wound
exudates and these enzymes have the ability to cleave numerous substrate specificities as
shown in table 17 (appendix I). The activity of these proteases for a given substrate is
controlled at the transcriptional and translational level by regulating enzyme activation
and inhibition to cause a balance between tissue synthesis and degradation. Any
disruption in the control pathways can lead to the increase of protease activity within
wounds and this over expression of various proteolytic enzymes within wounds can lead
to the development of chronic wounds (Westerhof and Vanscheidt 1994; Morison et al.
2004) as discussed in section 2.5 (see below).

CHAPTER 2: Literature Review – Wound Healing & Management of Chronic Wounds
47
Proteases are classified depending on their catalytic mechanism into two types: (1)
endopeptidases – which degrade proteins by cleaving peptide bonds within proteins; (2)
exopeptidases – degrade proteins by hydrolysing the terminal amino and carboxyl ends
of proteins (Wysocki 1996; Westerhof and Vanscheidt 1994). The exopeptidases remove
amino acids either individually, or as dipeptidylpeptides (Westerhof and Vanscheidt
1994). However, the endopeptidases are further classified according to the mechanistic
role of their active site: (1) serines (represent trypsin and elastase); (2) cysteines (e.g.
papain and lysosomal proteases); (3) aspartics (exemplify by pepsin and cathepsin); and
(4) the MMPs which contain a metal ion (Westerhof and Vanscheidt 1994) e.g.
collagenase, gelatinase, and stromelysin (Wysocki 1996) and membrane-type MMPs (MT-
MMPs).
Essentially there are two important families of proteases involved in wound healing: the
serine proteases and the MMPs (Morison et al. 2004; Xue et al. 2006; Vaday and Lider
2000) during the process of matrix degradation and tissue remodelling (Wysocki 1996).
Proteases have a high specificity of recognising seven or more amino acids that are
flanked on either side of the scissile P1–P1′ bond of peptide sequences (Schechter and
Berger 1967) of any particular substrate. The broad substrate specificities for the serine
proteases and MMPs involved in wound healing within the body are summarised by table
17 (appendix I). To control the cleaving or the activation of the broad substrate
specificities by each protease, the proteases are initially secreted as their inactive
zymogens1 (except for elastase, Vaday and Lider 2000) which are eventually activated by
other mediators and proteases when required during any phase of the wound healing
process. Nevertheless, once elastases are synthesised they are intracellularly stored within
inflammatory cells (i.e. neutrophil, monocytes and macrophage) in their active forms
(Vaday and Lider 2000) and in view of that it is crucial that activity of elastases is
stringently controlled. Herein, the description for the roles of the proteases involved in
wound healing is limited to elastase (neutrophil) and MMPs which as previously
encounter in chapter 1 are proteases that are reported as being elevated in chronic
wounds. At the end of this section, figure 16 summarises the functions of these
proteases within acute wound healing.
1 also known as pro-enzymes, latent/inactive enzymes

CHAPTER 2: Literature Review – Wound Healing & Management of Chronic Wounds
48
2.2.3.1 Serine proteases
During the wound healing process, serine proteases play an important role during
haemostasis (coagulation and fibrinolytic systems), inflammation, proliferation and
degradation of extracellular proteins. Thrombin, plasmin and neutrophil elastase (NE)
are all serine proteases. Serine proteases are a large family of enzymes that contain a
highly reactive serine residue (hence the family name) within the conserved catalytic triad
(or charge-relay system): His57–Asp102– Ser195 (chymotrypsin numbering) of the active
site. All serine proteases share a general catalytic mechanism via an acyl-enzyme
intermediate as highlighted by figure 8.
The serine residue of the active site behaves as the main nucleophile and the histidine
residue behaves as a general-acid/base catalyst which interacts with the side chain of an
aspartate residue (Copeland 2000). The proficiency of the serine protease is highly
marked due to the close vicinity and explicit interactions of both the serine and histidine
residues, since the nitrogen lone pair of the histidine side chain stabilises the highly
nucleophilic hydroxyl group of the serine residue (Voet and Voet 1995; Copeland 2000).
The role of the aspartate residues is unclear (Copeland 2000).
On penetration of a peptide substrate into the active site the mechanism is initiated and
the peptide substrate binds to the enzyme (in this case thrombin, plasmin or NE); and
the catalysis occurs in several steps. Firstly, a nucleophilic ‘addition’ attack at the
carbonyl carbon of the peptide substrate is initiated when the lone pair of the histidine
residue removes a proton from the serine residue of the catalytic triad As a result, a
high-energy unstable acylated tetrahedral intermediate (TI), the Michealis-Menten
complex (Voet and Voet 1995) is formed in the oxyanion hole of the enzyme. The
oxygen atom of the ester leaves the unstable acylated TI and the complex forms a highly
stable acyl enzyme with the serine residue as well as yielding an amine product (an amino
acid, R2–NH2). The reaction of this step is driven forward by the histidine residue which
behaves as a general acid to donate its proton to the deprotonated amino acid (R2– NH).
On departure of the amine product (R2–NH2) from the active site it is replaced with a
water molecule which is then deprotonated by the histidine residue which behaves as a
general base again. Via nucleophillic addition, the carbonyl carbon of the acyl-enzyme is
attacked by the water molecule to generate a deacylated TI. The restoration of the

CHAPTER 2: Literature Review – Wound Healing & Management of Chronic Wounds
49
carbonyl carbon dissociates the deacylated TI to yield an acid product and the free serine
protease is regenerated whereby the lone pair of the nitrogen atom of the histidine side
chain again stabilises the serine oxygen.
H OH
C
R1
O
NH
R2
O
NH2
O
NH2
N N HO
NH2
O
O
NH2
N N H
CON
H
R2
R1
HO
NH2
O
O
NH2
N N
CO
NH2
R2
R1
O
ONH2
O
HO
NH2
O
O
NH2
N N
CO
R1
H
O
H
H
O
NH2
O
O
NH2
N N
CO
R1
H
O
H
H OH O
NH2
O
NH2
N N
O
ONH2
O
C
OH
O
R1
..:
Acylation TI
+
..
Deacylation TI
:
[Asp]
[His]
Serine protease
Peptide substrate
Amine product
[Ser] [Ser]
[Ser]
[His]
[His]
Acyl enzyme
:
[Ser]
[His]
:
Hydration
[Ser]
[His]
[Asp]
[His]
Serine protease
[Ser]
+
Acid product
..
+
......
..........
..... .....
Figure 8. The hydrolysis of peptide substrate via the serine proteases (thrombin, plasmin or elastase). In the first instance the reaction proceeds by an acylation step to yield an amine product (an amino acid, R2–NH2) and an acyl-enzyme intermediate; followed by both an hydration and deacylation step. By doing so, an acid product is yielded and the serine protease (e.g. thrombin, plasmin or elastase) is regenerated. The tetrahedral intermediates are abbreviated by TI; R1 and R2 are amino acids of a peptide substrate. Details of the mechanism are given in the text. Figure adapted from Farley et al. 1997; Stryer 1995.
It should be borne in mind that although serine proteases share a general mechanism of
catalysis, they are highly specific in their ‘substrate specificity’ and this unique distinction
amongst the proteases of this family is maintained by the preference of the enzyme to
recognise and hydrolyse particular scissile P1–P1′ bonds of peptide substrates depending
on certain amino acid residues (Schechter and Berger 1967; Lauwers and Scharpe 1997).

CHAPTER 2: Literature Review – Wound Healing & Management of Chronic Wounds
50
From table 17 (appendix I) it can be seem that even though thrombin, plasmin and NE
are able to cleave or activate the same substrates during the wound healing process their
chosen substrate specificity of the scissile bond differs. Elastases are stated to cleave
peptide bonds after small hydrophobic residues such as Val~X and Ala~X (Lauwers and
Scharpe 1997; Stryer 1995; Purich and Allison 2002). The preference of these residues by
elastases depends on the type of elastase for example human NE (HNE) preferentially
cleaves adjacent to valine residues at the P1 position (Owen and Campbell 1999; Purich
and Allison 2002) whereas porcine pancreatic elastase (PPE) prefers to cleave after
alanine residues (Purich and Allison 2002). The substrate specificity of thrombin and
plasmin is trypsin-like except it is more restricted compared to trypsin (Barrett et al.
2004). Both proteases have similar preference for hydrophilic positively charged residues
within peptide substrates and inhibitors; thrombin prefers to cleave Arg~X bonds (for
examples of full sequences, see table 17 in appendix I) whereas plasmin prefers to cleave
Lys~X and Arg~X bonds (Barrett et al. 2004).
Besides their main roles, thrombin, plasmin and NE have other functions that are
important during the wound healing process. Earlier the prime function of thrombin
and plasmin was briefly covered in section 2.2.2.1 as proteases that control the proper
regulation of both the coagulation and plasminogen pathways during the haemostasis
phase to control, stop and restore vascular bleeding upon tissue injury. Although
thrombin and plasmin are reported as being elevated in chronic wounds their
multifunctional roles will not be discussed within this section as the wound healing
process of chronic wounds is reported as being deadlocked during the inflammation/
proliferation phase (Ayello et al. 2004a; Morison et al. 2004) as mentioned in section 2.5.
As NE plays an important role during the inflammation phase, its multifunctional roles
are now discussed.
Elastase is a broad term that characterises proteases which have the ability to degrade
and solubilise elastin via elastolysis, and such proteases are said to have elastinolytic
activity as depicted in table 4 (Farley et al. 1997; Owen and Campbell 1995). As elastases
have multifunctional roles during tissue repair, confusion can arise when understanding
the subclass of the type of elastase that is synthesised/ secreted by cells as generally
enzymes are grouped according to their substrate specificity, native structure, the
catalytic active site that they possess or even pH (Owen and Campbell 1995). Neutrophil

CHAPTER 2: Literature Review – Wound Healing & Management of Chronic Wounds
51
elastase (NE, entry 1 in table 4) and macrophage elastase (MMP-12, entry 6 in table 4) are
commonly defined as the two major elastases that regulate the wound healing process.
NE functions during the early stages (i.e. haemostasis and especially inflammation);
whereas the MMP-12 functions during the final stages (proliferation and tissue
remodelling) of the wound healing process. This section discusses the roles of NE,
whereas the next section (2.2.3.2) covers the role of MMP activity, hence MMP-12
during normal wound healing.
Table 4. Human proteases which express elastinolytic activity
Entry Protease Cell Type Catalytic family Active site Optimum pH
1 Elastase Neutrophil
2 Cathepsin G Neutrophil
3 Proteinase 3 Neutrophil
Serine protease
Catalytic triad Asp-His-Ser
Neutral
(pH 7 – 9)
4 Collagenase Neutrophil
5 Gelatinase Neutrophil
6 Metalloproteinase Macrophage
Metalloproteinase
Zn2+
coordinated to amino acids
Neutral
(pH 7 – 9)
7 Cathepsin B, L, S Macrophage Cysteine proteinase Cys, His Acidic
(pH 5 – 6)
(Adapted from Farley et al. 1997; Owen and Campbell 1995; Barrick et al. 1999)
In response to inflammatory stimuli of various cytokine signals, neutrophils are the first
inflammatory cells attracted to the wound area to combat and disinfect the wound from
microbial infection and proteolyse the damage tissue by releasing caustic proteases such
as NE that are stored within the peroxidise positive primary lysosome-like, azurophilic
granules of neutrophils. NE (EC 3.4.21.37) is sometimes referred to as human NE
(HNE), leukocyte NE (LNE) and polymorphonuclear (PMN) elastase. It is a
glycoprotein of 218-residues consisting of two asparaginyl N-linked carbohydrate side
chains with four disulfide bridges and the catalytic triad His41–Asp88–Ser173 of NE is
located within the centre of the reactive site (Takahashi et al. 1988; Lee and Downey
2001) and has a preference of hydrolysing Val~X bonds (e.g. X-Ala-Ala-Pro-Val~Y)
more than Ala~X.
During the wound healing process, NE is considered as the most influential and
destructive serine protease as it is proficient at simultaneously carrying out a range of
functions alongside its principal function of degrading the highly cross-linked fibrous

CHAPTER 2: Literature Review – Wound Healing & Management of Chronic Wounds
52
macromolecule of the ECM, elastin into soluble peptides at neutral pH (Takahashi et al.
1988, Prager et al. 1991; Baxter 1994; Owen and Campbell 1995). Initially NE facilitates
the host defence mechanism of the innate immunity in conjunction with wound
debridement by digesting the cell wall of gram-negative bacteria (Takahashi et al. 1988;
Farley et al. 1997; Chua and Laurent 2006) and eventually phagocytosing and engulfing
the bacteria into neutrophils where they are lysed and then digested by the potent active
NE encapsulated within neutrophils (Owen and Campbell 1995; Chua and Laurent
2006).
After phagocytosis, NE has the ability to directly or indirectly speed up tissue damage by
digesting and destroying the majority of the proteins of both the connective tissue and
the ECM. It is able to cleave proteins of both the coagulation and complement pathways
(Takahashi et al. 1988) including endogenous inhibitors such as antithrombin III (AT III)
to increase fibrin deposits and in this fashion supports the pro-coagulant activity during
the coagulation pathway (Prager et al. 1991). On the other hand, NE modulates
thrombin activity in order to decrease the stimulation of platelets to reduce the clotting
of fibrinogen (Brower et al. 1985; 1987) by degrading factor XIII (Wohner 2008) in this
way factor XIIIa is no longer generated to convert insoluble fibrin into crosslinked fibrin
monomers. Additionally NE has the ability to inactivate both the extrinsic and intrinsic
coagulation pathways by inhibiting coagulation factors such as factors VII, VIII, IX and
XII (Wohner 2008). During the fibrinolytic pathway, in parallel to plasmin, NE has the
capacity of directly digesting the fibrin clot into FDPs (Kluft 2003-2004) together with
providing an alternative pathway which indirectly facilitates the dissolution of the fibrin
clot (Wohner 2008). In the alternative pathway, NE directly cleaves 4 kringle domains of
the native plasminogen structure to activate the conversion of plasminogen into mini-
plasminogen (Wohner 2008) which is a.k.a K1-4 or angiostatin (Hoffman et al. 1998).
Mini-plasminogen is readily converted by PAs (i.e. uPA or tPA) into mini-plasmin which
is more proficient at digesting cross-linked fibrin in contrast to plasmin because mini-
plasmin is less likely to be attacked and inhibited by α2–antiplasmin (Wohner 2008). In
this manner, the stability of the fibrin clot varies amongst both pathways i.e. the FDPs
created by elastase-mediated hydrolysis are persistently released as much longer strands in
contrast to plasmin-mediated hydrolysis which rapidly dismantles the fibrin clot and
liberates associated FDPs (Wohner 2008).

CHAPTER 2: Literature Review – Wound Healing & Management of Chronic Wounds
53
In addition to the above, NE is proficient in the turnover of many other ECM
components/proteins, inflammatory mediators and membrane molecules such as
cleaving fibrin, fibronectin, laminin, vitronectin, proteoglycans, collagens and gelatin
(Baxter 1994; Dovi et al. 2004; Xue et al. 2006; Vaday and Lider 2000; Wohner 2008)
alongside other substrates as summarised in table 17 (appendix I). Furthermore, it
controls the conversion of cytokines into active/ inactive forms (Dovi et al. 2004) and
similarly regulates the activation of pro-MMPs to active MMPs (Zhu et al. 2001; Fleck
and Chakravarthy 2007). In doing so, NE possess many functions such as activating:
platelets, leukocytes (i.e. monocytes/macrophages), cytokine secretion and the
complement process (Barrett et al. 2004); as well as efficiently assisting in the migration
of neutrophils (Farley et al. 1997) across the wound bed seeing as active NE is non-
covalently translocated within the plasma membrane of inactive/active neutrophils
(Vaday and Lider 2000; Champagne et al. 1998) but mainly by active neutrophils (Owen
and Campbell 1995). The expression of membrane-bound NE is individually or
sequentially upregulated by TNF-α or via NE activating IL-8 (Vaday and Lider 2000;
Chua and Laurent 2006). Unlike free NE that is present in the extracellular space,
membrane-bound NE is not inhibited by antiproteinase inhibitors because it is resistant
to them (Owen and Campbell 1995). These multiple functions enables NE to properly
systematise the reconstruction and remodelling of the connective tissue (Farley et al.
1997) or ECM during tissue repair. Overall the direct and indirect cascade reactions
mediated by NE are summarised in figure 9.
Table 5. Systemic and alarm proteinase inhibitors to control HNE activity
Class Inhibitor MW (kDa) Synthesised/ secreted Type of Inhibition
Systemic α1-antiproteinase (α1-PI) 52 Hepatocytes � plasma Irreversible
Systemic α2-macroglobulin (α2-MG) 725 Hepatocytes � plasma Partial
Alarm SLPI 11.7 Epithelial, mast,
neutrophils, macrophages
Reversible
Alarm Elafin 9.9 Epithelial, keratinocytes Reversible
(Tailored from Barrick et al. 1999; Fitch et al. 2006; Barrett et al. 2004).
The secretion and cellular biochemical functions of NE activity are stringently controlled
at various levels by endogenous systemic or alarm proteinase inhibitors such as: α1-
antiproteinase inhibitor (α1-PI; previously known as α1-antitrypsin), α2-macroglobulin (α2-

CHAPTER 2: Literature Review – Wound Healing & Management of Chronic Wounds
54
MG), secretory leukocyte elastase inhibitor (SLPI) and elafin (Barrick et al. 1999; Fitch et
al. 2006; Barrett et al. 2004) as summarised in table 5.
From the systemic inhibitors, α1-PI is the most potent irreversible inhibitor as it inhibits
~92% of elastase activity by covalently binding to NE to form an NE-α1-PI complex and
in this way NE is no longer available to bind any of it substrates (Fitch et al. 2006;
Barrett et al. 2004; Medina et al. 2005; Janoff 1985). The remaining systemic inhibition is
achieved by α2-macroglobulin which structurally inhibits NE by partially hindering its
conformation. The alarm inhibitors, SLPI and elafin inhibit elastase activity reversibly
(Fitch et al. 2006; Barrett et al. 2004).
Figure 9. Multifunctional roles of elastase during the wound healing process. Reactions of activation (maroon and red arrows), conversion (black arrow) and inhibition (blue text and arrows). Abbreviations: SLPI (secretory leukocyte elastase inhibitor); α1-PI (α1-antiproteinase inhibitor); IL (interleukin); TNF–α (tumour necrosis factor alpha); α2-MG (α2-macroglobulin); TGF–β (transforming growth factor beta), MMPs (matrix metalloproteinases), TIMPs (tissue inhibitors matrix proteinases); ECM (extracellular matrix), FDP (fibrin degradation products). Figure tailored from the text within this chapter and Lauwers and Sharpe 1997. For a detail description of this figure see text within this section.
2.2.3.2 Matrix metalloproteinases
MMPs (also known as matrixins) constitute a large family of zinc-dependant and calcium
activating endopeptidases and over 20 proteases of this family have been identified
(Nagase and Woessner 1999; Barrick et al. 1999; Eming et al. 2008) and each MMP is
structurally and functionally related (Woessner and Nagase 2002). Initially MMPs were
ELASTASE (active)
Pro-elastase (inactive) Activates cells
(e.g. neutrophils, macrophages, kerinocytes)
Bacterial phagocytosis
↑ Chemokines/ cytokines (e.g. IL-1β; IL-8; TNF–α)
α1-PI
MMPs
ECM DEGRADATION
Pro-MMPs
TIMPs
Plasminogen
Mini-plasminogen
Activate/ Inactivate coagulation process
(e.g. thrombin, factors XIII, VII, VIII, IX, XII)
α1-PI α2-MG
SLPI & Elafin
Mini-plasmin
PAI
PAs
TGF – β (inactive)
(Fibrinolysis)
Fibrin Clot FDP
TGF – β (active)
Angiogenesis
Inactivate AT III, α2- antiplasmin, CI inactivator

CHAPTER 2: Literature Review – Wound Healing & Management of Chronic Wounds
55
classified according to their substrate specificity into various subgroups such as:
collagenases. gelatinases, stromelysins, matrilysins, membrane-type MMPs and a
heterogeneous subgroup termed as other MMPs. Given that the substrate specificity of
some MMPs overlaps (Somerville et al. 2003) they are now further categorised into
various subtypes depending on the structural domains contained within their structure as
summarised by figure 10 (Nagase and Woessner 1999; Somerville et al. 2003; Cawston
and Wilson 2006).
Figure 10. The conformational domains of human MMPs. MMPs are structurally related as they contain 3 distinct domains: a SP (for secretion from cells), a highly conserved N-terminal pro-domain (which specifies their latency) and a catalytic domain containing 3 histidine residues bound to Zn2+ and 2Ca2+ ions within the active site of MMPs (authorises enzymatic activity). The smallest MMPs are group A (MMP-7, -26); groups C (MMP-2) and D (MMP-9) both contain 3 fibronectin type II repeats enabling them to bind gelatin, collagen and laminin; the type V collagen-like domain within MMP-9 makes it structurally and functionally distinctive from MMP-2. The hemopexin domain (groups B – G) determines substrate specificity; whereas the furin recognition motif (RXKR) within the MMPs of groups E – H permits intracellular activation by furin-like proteinases. Furin-recognition MMPs are either secreted (group E) or anchored to the cell surface (groups F, G, H) either by a glycosylphosphatidyl (GPI) domain (MMP-17, -25) or via a transmembrane (type I)/ cytoplasmic domain (MMP-14-16, -24). Exclusively, group H (MMP-23) contains an N-terminal transmembrane (type II) within its SP, a Cys/Pro-rich (cysteine/proline) domain with either a C-terminal interleukin-1 (IL-1)/ immunoglobulin-like (Ig) domain. Figure adapted from Nagase and Woessner 1999; Woessner and Nagase 2002; Visse and Nagase 2003; Somerville et al. 2003; Cawston and Wilson 2006.
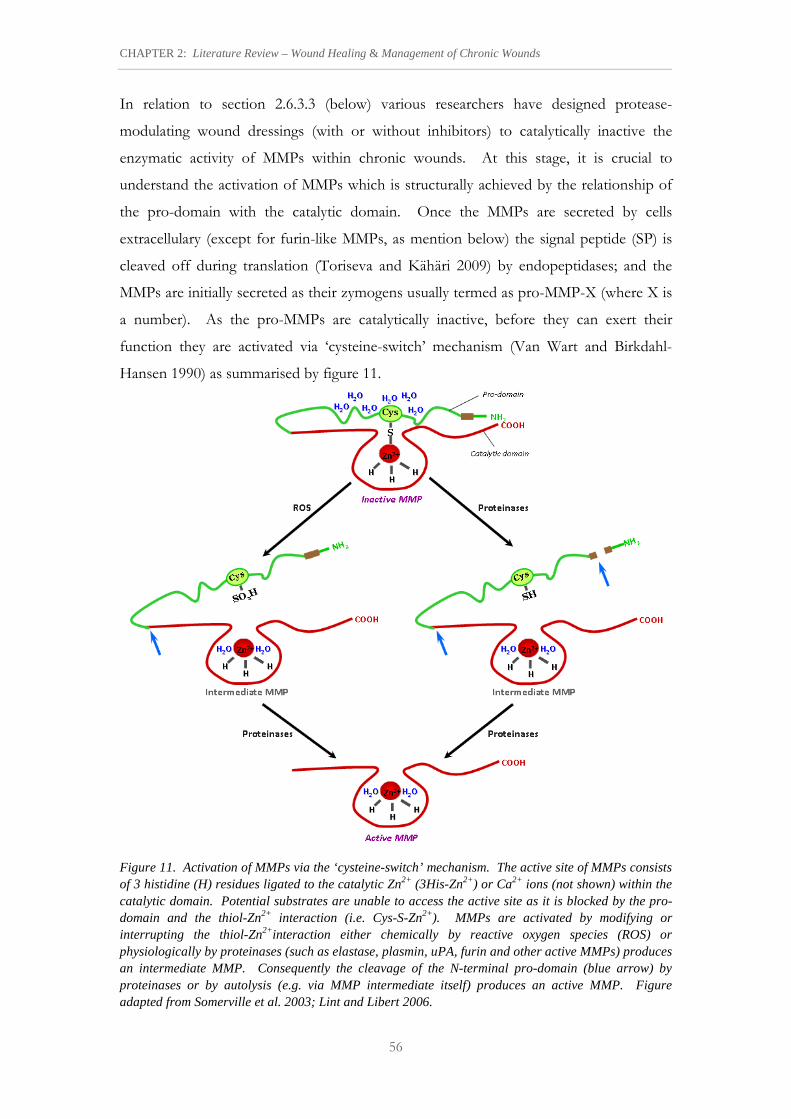
CHAPTER 2: Literature Review – Wound Healing & Management of Chronic Wounds
56
In relation to section 2.6.3.3 (below) various researchers have designed protease-
modulating wound dressings (with or without inhibitors) to catalytically inactive the
enzymatic activity of MMPs within chronic wounds. At this stage, it is crucial to
understand the activation of MMPs which is structurally achieved by the relationship of
the pro-domain with the catalytic domain. Once the MMPs are secreted by cells
extracellulary (except for furin-like MMPs, as mention below) the signal peptide (SP) is
cleaved off during translation (Toriseva and Kähäri 2009) by endopeptidases; and the
MMPs are initially secreted as their zymogens usually termed as pro-MMP-X (where X is
a number). As the pro-MMPs are catalytically inactive, before they can exert their
function they are activated via ‘cysteine-switch’ mechanism (Van Wart and Birkdahl-
Hansen 1990) as summarised by figure 11.
Figure 11. Activation of MMPs via the ‘cysteine-switch’ mechanism. The active site of MMPs consists of 3 histidine (H) residues ligated to the catalytic Zn2+ (3His-Zn2+) or Ca2+ ions (not shown) within the catalytic domain. Potential substrates are unable to access the active site as it is blocked by the pro-domain and the thiol-Zn2+ interaction (i.e. Cys-S-Zn2+). MMPs are activated by modifying or interrupting the thiol-Zn2+interaction either chemically by reactive oxygen species (ROS) or physiologically by proteinases (such as elastase, plasmin, uPA, furin and other active MMPs) produces an intermediate MMP. Consequently the cleavage of the N-terminal pro-domain (blue arrow) by proteinases or by autolysis (e.g. via MMP intermediate itself) produces an active MMP. Figure adapted from Somerville et al. 2003; Lint and Libert 2006.

CHAPTER 2: Literature Review – Wound Healing & Management of Chronic Wounds
57
The N-terminal pro-domain contains a highly conserved Pro-Arg-Cys-Gly-X-Pro-Asp
(where X is a Val/Asn; PRCGXPD) sequence (Nagase and Woessner 1999; Somerville et
al. 2003; Toriseva and Kähäri 2009) at positions 173 – 179 (Woessner and Nagase 2002).
This sequence preserves the latency of pro-MMPs because the unpaired thiol (sulphydryl)
group of the cysteine residue within the PRCGXPD sequence is coordinated opposite
the catalytic Zn2+ ion that is bound to 3 histidine (His) residues (i.e. 3His-Zn2+) of the
highly conserved zinc binding sequence: His-Glu-X-Gly-His-X-X-Gly-X-X-His-Ser
(HEXGHXXGXXHS, where X is any amino acid) at the active site within the catalytic
domain (Nagase and Woessner 1999; Somerville et al. 2003; Toriseva and Kähäri 2009).
Since the thiol-Zn2+ interaction (shown as Cys-S-Zn2+ in figure 11) blocks all proteolytic
activity, during the “cysteine-switch” mechanism the thiol-Zn2+ interaction initially
undergoes modification or interruption either chemically by reactive oxygen species
(ROS) or by a variety of active proteases (such as elastase, plasmin, uPA, furin and other
MMPs) and as a result an MMP intermediate is produced (Somerville et al. 2003; Lint
and Libert 2006; Ra and Parks 2007; Toriseva and Kähäri 2009).
Subsequently within the active site, the thiol group is replaced by water and the activation
process is completed after the pro-domain is proteolytically cleaved off directly by
proteases (Somerville et al. 2003; Lint and Libert 2006) or autolysed by the MMP
intermediate itself (Ra and Parks 2007; Toriseva and Kähäri 2009). Consequently a
biologically active MMP is formed (figure 11), permitting the penetration of potential
substrates into the exposed active site of MMPs; along with 3His-Zn2+, water molecules
and the stabilising Ca2+ binding sides within the catalytic domain enable MMPs to
undergo enzymatic activity of various substrates as summarised by table 17 (appendix I).
Essentially, the activation of furin-like MMPs (containing the furin recognition motif, e.g.
MMP-11, -23 and -28 and MT-MMPs) is achieved intracellularly by furin (an convertase)
during the secretory pathway (Somerville et al. 2003; Ra and Parks 2007; Toriseva and
Kähäri 2009) of the Golgi-body.
During the wound healing process, MMPs are the normal physiologic mediators that are
collectively controlled to preclude substantial matrix degradation (Wysocki 1996) of
majority of the ECM components. The MMPs specifically involved in wound healing
are the collagenases, gelatinases and stromelysins (Morison et al. 2004) including elastases
CHAPTER 2: Literature Review – Wound Healing & Management of Chronic Wounds
58
(e.g. MMP-12) and each have a broad substrate specificity as summarised in table 17
(appendix I). Majority of the MMPs are involved in re-epithelisation, remodelling and
the migration of various cells during the healing process (Greener et al. 2005). The
function of the collagenases (i.e. MMP-1, -8 and –13) is to specifically degrade
connective tissue (Lijnen 2002; Morison et al. 2004) and initiate the splitting of the triple
helix of the native fibrillar collagens (Lobmann et al. 2005; Yager and Nwomeh 1999) or
more precisely they are involved in normal and pathologic remodelling of collagen. Each
collagenase is specific to the type of collagen produced by granulocytes, macrophages,
epidermal cells, and fibroblasts (Westerhof and Vanscheidt 1994). During inflammation
fibroblasts, the epidermal and endothelial cells secrete MMP-1 (Lobmann et al. 2005) and
table 17 (appendix I) displays all the collagenases that are able to degrade: gelatin and the
various collagen types (I, II, III, and X). Compared to MMP-1, MMP-8 prefers to cleave
type I collagen more rapidly than type III collagen (Purich and Allison 2002).
Additionally, MMP-1 regulates the migration of keratinocyte and re-epithelialisation,
MMP-8 inhibits apoptosis and anti-inflammation; whereas MMP-13 enables endothelial
migration (Xue et al. 2006). Each collagenase is specific in the sequence it recognises and
hydrolyses, for examples of the types of sequences recognised by collagenases see entries
4, 5 and 6 in table 17 (appendix I)
Once the collagenases have completed the initial cut into the helical structure of collagen,
then the gelatinases, MMP-2 (gelatinase A, 72-kDa) and MMP-9 (gelatinase B, 92 kDa)
can further degrade the partially denatured collagens i.e. type I and III (Lobmann, R., et
al., 2005) by binding the collagen via the three fibronectin type II repeats within the
catalytic domain of their structure (Visse and Nagase 2003). The gelatinases also mediate
the digestion of the non-fibrillar collagen types IV, V, VII and X (Birkedal-Hasen 1995
as cited in Lobmann et al. 2005) including the basement membrane (BM) (Morison et al.
2004), gelatin and laminin (Visse and Nagase 2003). Of all the MMPs, MMP-2 is the
most common protease as it is continuously produced during the wound healing process
since it is expressed by various cells (e.g. fibroblasts, keratinocytes, endothelial cells and
monocytes; Lobmann et al. 2005) and it is activated by various membrane-type MMPs (in
particular, MMP-14, -16, -24 and -25; Xue et al. 2006) during various stages of the
healing process. Specifically, MMP-2 assists in keratinocyte migration, anti-inflammation
and activates pro-MMPs-1, -9 and -13 (Xue et al. 2006). Compared to MMP-2, MMP-9
is expressed and synthesised by keratinocytes, monocytes and macrophages (Lobmann et

CHAPTER 2: Literature Review – Wound Healing & Management of Chronic Wounds
59
al. 2005) to maintain inflammation and assists in neutrophil migration (Xue et al. 2006).
In contrast to collagenase, the gelatinases recognise and hydrolyse sequences containing
Gly~Ile bonds (see entry 7: MMP-2 and entry 8: MMP-9 in table 17; appendix I)
The stromelysins: MMP-3 (Stromelysin-1), MMP-10 (Stromelysin-2) and MMP-11
(Stromelysin-3) are known to degrade ECM proteoglycans (Morison et al. 2004;
Lobmann et al. 2005). MMP-3 and MMP-10 have a broad specificity to cleave many
substrates such as: collagen type III, IV; gelatin, elastin, MMP-8 (table 17, appendix I).
Both MMP-3 and MMP-10 enable cell migration; additionally MMP-3 facilitates within
the fibrinolytic pathway by directly mediating the degradation of fibrin into FDPs (Kluft
2003-2004) as well as hydrolysing α2-antiplasmin (Medina et al. 2005); finally MMP-3 has
the ability to activate pro-MMP-1, -7, -8, -9, and -13; and it recognises and hydrolyses
following sequences: Arg-Arg-Lys-Pro-Val-Glu~Z-Trp-Arg-Lys and Arg-Pro-Leu-
Ala~X-Trp-Arg-Ser (see entry 9 in table 17, appendix I) whereas MMP-10 facilitates re-
epithelialisation (Xue et al. 2006) and cleaves sequences Asp-Val-Gly-His~Phe-Ser-Ser-
Phe and Gly-Pro-His-Leu~Leu-Val-Glu-Ala (see entry 10 in table 17, appendix I). Anti-
proteolytic activity is inhibited by MMP-11 as it is able to hydrolyse the Ala350 – Met351
bond of the α1-proteinase inhibitor (Purich and Allison 2002) also cleaves sequences
containing X-Ala~Met-Y (see entry 11 in table 17, appendix I).
As mentioned earlier, NE functions during the early stages of the wound healing process;
after neutrophils have completed their function and die; macrophages are then recruited
from the blood circulation (Mutsaers et al. 1997). Macrophages secrete another type of
elastase, human macrophage elastase (HME) or more commonly MMP-12. MMP-12
functions during the final stages of the wound healing process and it continues with
phagocytosing bacteria and has a broad substrate specificity of digesting various proteins
of the ECM (summarised in table 17, appendix I). Its prime substrate is elastin (Chen
2004); in conjunction with its elastolytic activity, MMP-12 regulates the successful
migration of macrophages (Visse and Nagase 2003) alongside encouraging the efficient
proliferation of epithelial cells (Xue et al. 2006), plus has the ability to self regulate its
own activation via autolytic processing and by doing so it amplifies various proteolytic
processes during tissue repair by activating MMP-2 and MMP-3 (Chen 2004). MMP-12
recognises and hydrolyses the following sequences: Leu-Val-Glu-Ala~Leu-Tyr~Leu-

CHAPTER 2: Literature Review – Wound Healing & Management of Chronic Wounds
60
Val-CysO3H-Gly; Arg-Pro-Leu-Ala~Leu-Trp-Arg-Ser; Arg-Pro-Phe-Glu~Val-Lys-Asp-
Thr; and Gly-Ala-Met-Phe~Leu-Glu-Ala-Ile (see entry 12 in table 17, appendix I).
In recent years, matrilysins, membrane-type MMPs (MT-MMPs) and other MMPs have
been identified as playing a role in the wound healing process (Xue et al. 2006). The
function of each of these MMPs has been summarised in table 6 and since these
proteases have not been reported in chronic wounds (except MMP-19; Xue et al. 2006)
their function and substrate specificity will not be discussed in here; however they have
been extensively reviewed elsewhere (Visse and Nagase 2003; Barrett et al. 2004).
Table 6. Summary for the function of human matrilysins, MT-MMPs and other MMPs during in the wound healing process.
Proteases EC Function in wound healing process
Matrilysins
MMP-7 (Matrilysin-1)
MMP-26 (Matrilysin-2)
3.4.24.23
3.4.24.
Directly mediates fibrin digestion. Controls inflammation, re-
epithelialisation, and inhibits apoptosis
Possible role in cell migration
Membrane-type MMPs
MMP-14 (MT1-MMP)
MMP-15 (MT2-MMP
MMP-16 (MT3-MMP)
MMP-24 (MT4-MMP)
MMP-25 (MT6-MMP)
3.4.24.
3.4.24.
3.4.24.
3.4.24.
3.4.24.
Keratinocyte survival and activates pro-MMP2 and MMP-2;
directly mediates fibrin digestion.
Anti-apoptosis
Activates MMP-2
Activates MMP-2
Maintains migration of neutrophils, activates MMP-2
Other MMPs
MMP-19
MMP-20 (Enamelysin)
MMP-28 (Epilysin)
3.4.24.
3.4.24.
3.4.24.
Assists in macrophages migration within the wound bed
Controls enamel formation
Enables epithelial cell proliferation
(Xue et al. 2006; Kluft 2003/2004; Purich and Allison 2002).
MMPs are tightly regulated during transcription (gene expression and secretion), post-
transcription level by activating the MMP zymogens by proteolytically cleaving the pro-
domain (as described above) and finally by controlling the proteolytic activity of the
active MMP by inhibitors. At the extracellular level, TIMPs are the endogenous
inhibitors that inhibit MMP activity and four members of this multigene family have
been identified as TIMP-1, -2, -3 and -4 (Visse and Nagase 2003; Dasu et al. 2003;
Stamenkovic 2003). Physiologically each of the TIMPs form irreversible complexes with
MMPs (Dasu et al. 2003) by directly binding to the Zn2+ ion at the active site within the
catalytic domain (Toy 2005). In tissue fluids/ circulation, the inhibition of MMP activity
is inactivated by the non-specific inhibitor, α2–MG in a ‘bait and trap’ mechanism

CHAPTER 2: Literature Review – Wound Healing & Management of Chronic Wounds
61
(Somerville et al. 2003). When sites within α2–MG are cleaved, this enables α2–MG to
bind and form a cocoon around the MMP forming an irreversible complex which is
attacked and removed by scavenger receptors (Somerville et al. 2003; Stamenkovic 2003)
and the active MMP is segregated from its substrates (Somerville et al. 2003).
The combined mechanism of plasmin, elastase and MMPs to degrade components of the
ECM with the intention of making space for cells to efficiently migrate across the ECM
tissue space in order to facilitate the synthesis of a functional ECM during tissue repair is
summarised by figure 12.
Figure 12. Reciprocal interpretation for the role of plasmin, elastase and MMPs in achieving ECM degradation during the wound healing process. After leukocytes have migrate across the endothelial cells into the tissue space, activated endothelial and epithelial cells secrete pro-inflammatory mediators which activates the transcription of MMP, in addition to causing leukocytes to secrete pro-MMPs, MMPs/ADAMs (a disintegrin and metalloprotease), elastase, heparanase and uPA/tPA. Elastase alongside plasmin activates pro-MMPs into active MMPs and all simultaneously degrade/ modify components of ECM with the intention of producing a functional ECM. Reactions of activation (black arrows), enzymatic activation (red arrows), conversion (blue arrows), secretion (green arrows), positive feedback (+ve) and negative feedback (-ve). Figure adapted from Silver and Christiansen 1999; Vaday and Lider 2000; and the figures/ text within this chapter.

CHAPTER 2: Literature Review – Wound Healing & Management of Chronic Wounds
62
2.3 TYPES OF CHRONIC WOUNDS
Chronic wounds (a.k.a abnormal wounds, Boyce 1996) become disrupted in the
inflammatory and proliferation stages and for that reason wound closure is incomplete as
the wounds struggles to undergo re-epithelialisation within the required time (Ayello et
al., 2004; Morison et al. 2004). Chronic wounds are the result of various pathological
conditions such as diabetes mellitus, poor circulation and nutrition, immunodeficiency’s
(Hess 2002). There are other factors that delay healing such as: infection, pressure,
trauma, edema, necrosis (Hess 2002). There are many types of chronic wounds (as
summarised in table 7) and as it can be seen some of these chronic wounds are the result
of an ulcer which is characterised as inflamed and painful open sores on the skin/
mucous membrane that cause devastation to the tissue surface and are usually referred to
as dermal ulcers (Hess 2002; Morison et al. 2004).
Table 7. Types of Chronic wounds
Ulcers Other chronic wounds
Arterial ulcers
Diabetic ulcers (foot)
Pressure sore ulcers
Trauma ulcers
Vascular ulcers (venous, stasis)
Burn wounds (2nd, 3rd degree)
Sickle cell ulcers
Surgical wounds
Tunnelling wounds
Various authors have written detailed descriptions (including the definitions and
classifications) of such wounds (Cohen et al. 1992; Collins et al. 1992; Eaglstein and
Falanga 1997; Hess 2002; Baranoski and Ayello 2004; Morison et al. 2004). By
understanding the precise pathogenesis of chronic wounds it will enable researchers to
understand the multidisciplinary approach of wound management that can be used to
heal the aetiology of such wounds.
2.4 GRADIENTS OF CHRONIC WOUNDS
In chronic wounds there are a number of gradients: oxygen, temperature and pH. The
variation of these gradients can affect the pathophysiology of chronic wounds.

CHAPTER 2: Literature Review – Wound Healing & Management of Chronic Wounds
63
2.4.1 Oxygen
The level of oxygen plays a crucial role for skin repair as it is highly demanded. Blood
circulation and the atmosphere are the only two sources that supply oxygen to a chronic
wound (Church 2001). An oxygen gradient is present between the blood circulation
and the wound area, as hypoxia is usually the stimulus that causes the activation of
angiogenesis to maintain haemostasis by the development of new blood vessels. Church
(2001) reports that it’s difficult to characterise the micro-environmental dynamics of
oxygen distribution.
2.4.2 Temperature
In most environments, the edge of the skin is much cooler compared with core
temperature of the body (Church 2001; Xia et al. 2000) which is at 37oC. Many factors
(i.e. the blood supply to the wound, whether or not the wound is covered or exposed,
whether or not the wound is synthetically heated) can significantly cause temperature
variations, that is gradients of chronic wounds (Church 2001). For example “necrotic
tissue is ‘cold’, and will remain more or less at ambient temperature” (Church 2001).
Bello et al. averagely reported the wound temperature of an in vivo wound to be on
average 3.1oC below the core temperature (Bello et al. as cited in Xia et al. 2000). For
over a week Xia et al., maintained their experiments at 33.9oC + 0.1 and later the
temperature of their cell culture was modified to 33.0oC to accommodated the
temperature in the range of 32 – 33oC (see citations within Xia et al. 2000).
2.4.3 pH
The effect of pH on wound healing has only been studied by a few researches.
Variations in pH within wounds is known to affect protease activity. Church (2001)
reported that the pH of chronic wounds is low where necrosis is taking place and its
normal where there is viable cellular activity. This statement contradicts Leveen (1973)
observations who showed that acidification of wound surfaces increases wound healing
by increasing the amount of oxygen at the wound bed. It has been reported that an
acidic pH wound fluid is more beneficial for antibacterial activity (Varghese et al. 1986).
Nevertheless, Chai (1992) reported that the pH of chronic wounds (more precisely
granulation of burn) varies with the amount of bacteria present within the wound. They

CHAPTER 2: Literature Review – Wound Healing & Management of Chronic Wounds
64
reported that when the number of Escherichia coli (E.coli) or Staphylococcus aureus (S.
aureus) is above 10 (7 organisms)/gm of granulation tissue the pH of the wound is 6.7;
and when the number of Pseudomonas aeruginosa (P. aeruginosa) is 10 (8 organisms)/gm
of granulation tissue then the pH is 8.0 of the wound.
It has been suggested that the pH of human wounds typically ranges between pH 6.0 –
8.0 (Ayello et al. 2004). Dissemond et al. (2003) demonstrated that the pH of chronic
wounds ranges between 5.45 – 8.65 and similarly this range corresponds to the data given
by Prager et al. (1994) who reported that the range of pH is from pH 5.3 – 8.4 for burn-
wound exudate. Prager et al. (1994) found that by increasing the pH causes an increase
in protease activity. In doing so, chronic wound proteases efficiently have a tendency to
degrade proteins at neutral to slightly alkaline pH (i.e. pH 7 – 8, Greener et al. 2005). It
has been accounted that in order to facilitate wound healing the pH of the wound
environment should be lowered to 4 (Schultz et al. 2005b) or greater than 4 and in
sequence to escape degradation of newly formed ECM the pH must be lower than 7
(Greener et al. 2005) making the wound environment acidic (Schultz et al. 2005b). It
has been stated, that protease activity can be reduced by changing the pH of the wound
bed (Greener et al. 2005) using topical protease-modulating wound care products such as
Cadesorb (for further details of this hydrogel dressing, see section 2.6.3.3).
2.5 ROLES OF ENZYMES IN CHRONIC WOUNDS
It is not clearly understood why the healing process is delayed for chronic wounds
(Stroock and Cabodi 2006). Nevertheless, there has been increasing evidence at both the
biochemical and molecular level signifying the over expression of various proteases such
as neutrophil elastase, MMPs, plasmin and thrombin to cause the healing of chronic
wounds to become delayed in comparison to acute wounds (Wysocki et al. 1993;
Wysocki 1996; Westerhof and Vanscheidt 1994; Grinnell and Zhu 1994, 1996; Bullen et
al. 1995; Harris et al. 1995; Yager et al. 1996, 1997; Yager and Nwomeh 1999; Vaalamo
et al. 1997; Tarnuzzer and Schultz 1996; Stadelmann et al. 1998; Trengove et al. 1999;
Cullen et al. 2002; Morison et al. 2004; Edwards et al. 2004; Ayello and Cuddigan 2004;
Greener et al. 2005; Schultz et al. 2005a). As encountered in section 2.2.3, the chronic
wound proteases (i.e. NE and MMPs) were reported as having multifunctional roles

CHAPTER 2: Literature Review – Wound Healing & Management of Chronic Wounds
65
during acute wound healing where they either regulate or contribute to various protective
mechanisms to collectively restore tissue integrity after an injury; and their progression is
properly regulated via signalling events from growth factors and cytokines/ chemokines.
Essentially, NE is the fundamental predicament that disturbs and deadlocks the normal
tissue repair of chronic wounds since elastase activity is found to be much higher in
CWFs compared to acute wound fluids. For example Trengove et al. (1999) reported
that the concentration of NE in CWFs was in the range of 5.9 – 344 µg/ml (median of
99.5 µg/ml) for 6 patients (46.15 %) suffering from chronic wounds (total: 13 patients);
whereas the wound fluid from acute wounds, all showed NE activity to be less than 1
µg/ml (total: 14 patients). Similarly, Rao et al. (1995) reported chronic wounds to have a
10 – 40 fold increase of elastase activity compared to acute wounds and the authors of
this study as well as other others, report elastase to be exclusively responsible for the
degradation of fibronectin (Grinnell and Zhu 1994, 1996; Rao et al. 1995) and growth
factors (Yager et al. 1997). This is because there is an imbalance between elastase and its
endogenous inhibitors (Rao et al. 1995; Fleck and Chakravarthy 2007) and for that
reason elastase activity has been reported to be uninhibited due to low levels of α2-
macroglobulin (Yager et al. 1997) and essentially α1-PI in chronic wounds because they
are highly degraded by excess chronic wound proteases (Grinnell and Zhu 1994, 1996;
Rao et al. 1995) such as elastase (see figure 13). In doing so, the uncontrolled high levels
of elastase cause immense tissue or ECM destruction (see below).
Pro-MMPs are secreted by many cells (such as neutrophils, monocytes/ macrophages
and fibroblasts/ keratinocytes). Surplus elastase activity is the main culprit for
propagating the overexpression of MMPs in chronic wounds because elastases (such as
NE or MMP-12) activate the conversion of pro-MMPs into active MMPs which
consecutively induces the cascade of active MMPs to activate other pro-MMPs (Zhu et
al. 2001; Fleck and Chakravarthy 2007). Un-interruptedly, the activation cascade of
MMPs spirals out of control seeing as the ‘vicious cycle’ of elastase disseminates further
whereby the endogenous inhibitors of MMPs i.e. TIMPs (or α2-MG) become targets of
elastase as they are highly degraded resulting in an imbalance between MMPs and TIMPs
(or α2-MG). Since the protective tissue mechanisms are overwhelmed by high proteolytic
activity, subsequently the activity of elastase and MMP becomes out of control and
causes substantial degradation and turnover of both the pre-existing and newly formed

CHAPTER 2: Literature Review – Wound Healing & Management of Chronic Wounds
66
collagen of the ECM (Zhu et al. 2001; Fleck and Chakravarthy 2007) as well as degrading
vital ECM components that are required for normal wound healing e.g. ECM proteins/
their receptors and numerous mediators i.e. growth factors, cytokines/ chemokines and
their receptors (Grinnell and Zhu 1994; Rao et al. 1995; Yager et al. 1996; 1997; Snyder
2005; Morison et al. 2004).
Figure 13. The‘vicious elastase cycle’ causes extensive tissue/ ECM degradation promoting chronic inflammation via a positive feedback mechanism within chronic wounds. Neutrophils secrete high amounts of elastase which in chronic wounds elevated levels of elastase degrade antiproteinases (e.g. α1-PI) and TIMPs causing an imbalance in the equilibrium between (1) elastase levels and elastase inhibitors; and (2) MMPs and TIMPs. Elastase activates pro-MMPs into active MMPs, which in turn degrade α2-antiplasmin causing a rise in plasmin activity. Plasmin has a much lower proteolytic activity than elastase, because elastase activates the conversion of plasminogen into mini-plasminogen which inihibits angiogenesis as well as being converted to mini-plasmin to promote fibrinolysis alongside plasmin. Excess levels of elastase and MMP causes extensive ECM degradation resulting in the formation of a non-functional ECM as well as generating chemotactic products which recruit more neutrophils via a positive feedback mechanism to secrete more elastase and then whole vicious cycle begins again promoting extensive chronic inflammation within chronic wounds. Reactions of activation (black arrows), elastase reaction (dark red arrows); secretion (green arrows), inhibition (blue lines), and degradation (dotted black arrows). Figure adapted from Fleck and Chakravarthy 2007; Moseley et al. 2004).
NE activates macrophages which persistently secrete pro-inflammatory cytokines (e.g.
IL-8) to accelerate the influx of neutrophils by stimulating a cascade of reactions causing
neutrophils and macrophages to release elevated levels of elastase (i.e. NE and MMP-12,
respectively) which continually contribute to the ‘vicious elastase cycle’ of promoting
wound chronicity caused by immense tissue damage (Dovi et al. 2004; Fleck and
Chakravarthy 2007) and consequently over time, this hinders the formation of a

CHAPTER 2: Literature Review – Wound Healing & Management of Chronic Wounds
67
functional ECM resulting in a non-functional ECM, cell necrosis and apoptosis.
Accordingly, during chronic inflammation the degradation products (achieved through
the destruction of ECM; and elastase inhibitors i.e. α1-PI) possess chemotactic properties
which enable them to activate and recruit more neutrophils via a positive feedback
mechanism. In doing so, neutrophils secrete excessive amounts of elastase (Menke et al.
2007) and the whole ‘vicious cycle’ of elastase commences again as schematically
summarised by figure 13. Given that neutrophils are constantly present, the wound
healing process of chronic wounds persistently becomes stuck during the inflammation/
proliferation phase (Ayello et al. 2004; Morison et al. 2004).
Additionally, high levels of MMPs (specifically MMP-3, see section 2.2.3.2) degrade α2-
antiplasmin and therefore plasmin levels become elevated within chronic wounds. As a
consequence high plasmin levels facilitate in the conversion of pro-MMPs into active
MMPs and therefore enchances the brutal breakdown of ECM by MMPs as well as
causing immense fibrinolysis of the fibrin clot. On the contrary of plasmin being
elevated in chronic wounds, its concentration is much lower in contrast to elastase
(Cullen et al. 2002a; Hoffman et al. 1998) because NE promotes the conversion of
plasminogen to mini-plasminogen (i.e. K1-4 or K1-3, in which K = kringle) this
therefore reduces the level of intact plasminogen available in chronic wounds and
subsequently reduces the conversion of plasminogen into plasmin (Hoffman et al. 1998).
Mini-plasminogen is a specific potent inhibitor termed as angiostatin which inhibits
angiogensis in VLUs (Hoffman et al. 1998) as summarised by figure 13. Even though
thrombin is said to be elevated within chronic wounds (Schultz et al. 2005a) its function
within chronic wounds remains unclear. Nevertheless, removal of the ‘vicious elastase
cycle’ by reducing elastase activity within chronic wounds will hinder chronic
inflammation and stop the uncontrolled positive feedback mechanism that exists within
chronic wounds.
2.6 MANAGEMENT OF WOUND HEALING
The management of chronic wounds is highly researched as chronic wounds are a major
health issue since the number of patients suffering from chronic wounds increases each
year resulting in 2 million patients suffering from pressure ulcers and between 600,000 –
2.5 million suffering with chronic leg and foot ulcers (Stadelmann et al. 1998) and

CHAPTER 2: Literature Review – Wound Healing & Management of Chronic Wounds
68
eventually causing the deaths of millions per year. The fundamental management of
speeding up the healing of chronic wounds is not completely understood because the
pathophysiology of such wounds is still being investigated.
Essentially the wound care market is subdivided into two areas: traditional and advanced
wound dressings. The wound healing in presence of the traditional dressings functions
in dry surroundings whereas the advance dressings function within moist surroundings
(GMAWCP 2008). Moist surroundings are more acceptable than traditional dressings;
however traditional dressings are still used today (GMAWCP 2008). There are many
wound products available for the treatment of chronic wounds. Nevertheless, there is an
essential need to advance the wound care market due to the trauma that is still faced by
chronic wound sufferers.
2.6.1 Debridement of chronic wounds
A wound is initially debridement which is the removal of damaged tissue and it is a
means of facilitating the healing of a wound to become more efficient. In the wound bed,
on occasion debridement is crucial as damaged tissue may become infiltrated with
bacterial growth which behaves as a physical barrier to healing. It should be borne in
mind that the original methods of treating the wound are still of existence. There are
many methods that are used in the clinical practice to debride a wound and these include:
surgical, enzymatic, autolytic, mechanical and biological. In terms of enzymatic
debridement, the water-soluble collagenase preparation is the best proteinase used and it
functions to breakdown collagen (native or damaged) into gelatin (Falanga 2002).
2.6.2 Moist wound healing
Once the wound has been debrided then an appropriate wound dressing i.e. moist
dressing is chosen to allow the wound to heal within a moist environment. In 1962
George Winter (from Smith & Nephew, Inc.) introduced the concept of moist wound
healing as it was shown that the epithelisation of wounds occurs much faster under
occlusive dressing as such dressings uphold a moist wound area (Winter 1962; Winter
and Scales 1963). A moist environment is important for the infiltration and hence the
migration and movement of cells, growth factors, proteases, oxygen and delivery of

CHAPTER 2: Literature Review – Wound Healing & Management of Chronic Wounds
69
nutrients across the wound surface. This way the rate of epithelisation and angiogenesis
can be reached which then leads to the final stage of collagen synthesis and remodelling.
There are many moisture-maintaining dressings available: wounds of light – moderate
drainage dressings such as occlusive films, hydrogels, and hydrocolloids are usually
preferred. Whereas wounds of moderate – heavy exudates absorbent dressings such as
foams and alginates are usually selected as well as hydrogels. To date considerable
attention has been devoted in designing and developing moist wound dressings.
Several authors have described the range of wound products including wound dressings
to treat chronic wounds (Cohen et al. 1992; Collins et al. 1992; Hess 2002; Baranoski and
Ayello 2004). However, in this thesis the discussion will now summarise the hydrogels
dressings (passive, active and protease-modulating) to treat chronic wounds.
2.6.3 Management of chronic wounds using hydrogel dressings
Hydrogels are sometimes referred to as: stimulated/ responsive, smart, intelligent
hydrogels (Hoffman 2001; Galaev 1995; Galaev and Mattiasson 1999; Kim and Park
1998; Jeong and Gutowska 2002; Peppas et al. 2000; Ulijn 2006) because these polymers
essentially possess unique properties that allows them to change their dimension,
conformation or physical properties from a swell to collapse (shrink) state (or visa-versa)
or solution-to-gel transitions due to changes in the environmental conditions such as pH,
temperature, ionic strength, solvent, light (Kim and Park 1998; Hoffman 2001; Jeong and
Gutowska 2002; Jeong et al. 2002; Peppas et al. 2000; Ju et al. 2001; Ulijn et al. 2007a).
Hydrogels are defined as cross-linked 3D gels that have water (> 90%) as their dispersion
medium and therefore swell but not dissolve in aqueous solvents (Wang et al. 1993), and
are known to be useful biocompatible biomaterials for a wide range of biomedical
applications such as drug delivery, inflammation, tissue engineering (cartilage
replacement), skin grafts, bioseparation and wound dressings (Kim and Park 1998;
Hoffman 2002). In reference to wound healing, hydrogels are essentially important as
they possess ‘ideal’ properties of a dressing (Morgan 2002) such as: non-adherent
(therefore reduce pain when removed), maintain a moist environment, rehydrate the

CHAPTER 2: Literature Review – Wound Healing & Management of Chronic Wounds
70
wounds, maintain a cool and soothing effect, enable autolytic debridement (Hess 2002;
Baranoski and Ayello 2004) and able to absorb wound exudates.
2.6.3.1 Passive / Non-responsive hydrogel dressings
Table 18 (appendix II) summarises the various types of ‘passive’ hydrogel dressings that
are used to treat various chronic wounds. The table depicts the manufacturers that
developed the dressings, the management of action and finally the indications and
contraindications for each type of dressing. All of the hydrogel dressings are non-
responsive because they are designed to create a physical barrier to cover the wounds. In
doing so these hydrogel dressings enable the exchange of fluids and gases, enable
autolytic debridement, soak up fluid from the wound (i.e. hydrate the wound bed) and
essentially provide a moist healing environment.
Some of the dressings mentioned in table 18 (appendix II) are used as a primary dressing
(e.g. Aquasorb, entry 6; CarrGauze pads and strips with Acemannan, entry 9;
Dermagram hydrophilic and zinc saline dressings, entries 17-18; DermaSyn and
DermaGauze, entry 19; MPM gel pad, entry 30) and on the other hand, some dressings
have to be secured by a second dressing (e.g. Aquasite hydrogels: amorphous,
impregnated gauze, impregnated non-woven and sheet, entry 5). Two dressings are said
to be acidic (e.g. Bioloex wound gel, entry 7 and Phyto Derma wound gel, entry 35) to
promote healing. In addition, two dressings are formulated as a combination of
hydrogel/alginate i.e. NU-GEL (entry 33) and Purilon (entry 36) (Morgan 2002).
The advantage of incorporating alginate into hydrogel wound dressings such as Purilon
gel and NU-GEL enables both dressings to soak up significant amounts of fluids ~ 15 to
20 times more compared to their own molecular weight (Jones et al. 2006). The
absorption of NU-GEL is more than Purilon gel (23% and 18% respectively) whereas
the opposite effect is seen for the ability to donate moisture, Purilon donates more than
NU-GEL i.e. 11% and 3%, respectively (Jones and Vaughan 2005). Additionally, the
NU-GEL dressing can function under acidic conditions since the alginate component of
the dressing is modified with propylene glycol (Augst et al. 2006).

CHAPTER 2: Literature Review – Wound Healing & Management of Chronic Wounds
71
In ‘The Global Market for Advanced Wound Care Products 2008’ report, IntraSite and
Purilon gels were recorded as the leading hydrogels used in the wound market. Intrasite
gel (Smith & Nephew, entry 28: table 18 – appendix II) is composed of
carboxymethylcellulose (CMC) polymer (2.3%), propylene glycol (20%) and water
(77.7%) whereas Purilon gel (Coloplast Corporation, entry 36: table 18 – appendix II) is
composed of CMC, calcium alginate and water. Their mechanistic actions are very
similar for both dressings as they consist of the hydrated CMC (cross-linked) material
which has the ability to absorb and donate fluids and subsequently facilitate the
rehydration needs that enable autolytic debridement of necrotic tissue (Thomas and Hay
1994) on top of maintaining a moist environment to improve wound healing. Both
hydrogels have very similar absorption properties i.e. 14% for IntraSite gel and 18% for
Purilon gel (Jones and Vaughan 2005). The moist environment is further increased as
both IntraSite and Purilon gels have a high water content which not only ensures
efficient exchange of water and oxygen molecules but also donates water molecules to
the wound surface (Jones and Milton 2000). Purilon gel is able to donate 11% moisture
compared to IntraSite gel which only donates 6% moisture (Jones and Vaughan 2005).
For both hydrogels the management of action is indicated for pressure ulcers, moreover
Purilon can be use to treat leg ulcers, whereas Intrasite can be used to treat tunnelling
wounds and partial/full-thickness wounds (as indicated in appendix II).
2.6.3.2 Active/ Responsive hydrogel dressings
In recent years, researchers have focused on designing more effective and economical
wound dressings. The current research is based on designing and developing responsive
(active) wound dressings that stimulate the microenvironment to activate chemical
reactions and biochemical processes within wounds to promote wound healing. It is
highly beneficial that such dressings also employed antimicrobial properties to remove
pathogens by transporting antibiotics, silver (Ag+) or iodine to inhibit infection; over the
course of time provide information for the wellbeing of the wound and essentially to
activate wound healing (Stroock and Cabodi 2006). The aim is moving towards
producing natural or synthetic dressings that will tackle more than one biochemical
problem e.g. managing elevated levels of proteases and free radicals; controlling the
release of therapeutic factors into non-healing wounds to restore the lack of protease
inhibitors, growth factors, various ECM proteins, cells and oxygen levels; and

CHAPTER 2: Literature Review – Wound Healing & Management of Chronic Wounds
72
transforming the pH of chronic wounds to normal levels. In doing this, the attempt is to
produce cost-effective wound products that will speed-up the healing of deadlocked
chronic wounds with various physiological problems.
This section briefly gives some examples of the recent advances for active dressing
whereas the next section extensively reviews protease-modulating dressings that are
primarily marketed/ designed or being investigated for the management of elevated
proteases found in chronic wounds.
Recently, Stroock et al. (2006) reviewed a new active hydrogel dressing to treat chronic
wounds. The design of the dressing is based on the concept of vacuum-assisted closure
(VAC®, Kinectic Concepts Inc.) that was developed by Morykwas (Morykwas et al.
1993). The mechanistic action of VAC® is based on a foam (made from polyurethane or
poly(vinyl alcohol) (PVA)) that is placed within a wound, protected with a plastic sheet
and then applying a vacuum (pulled down to ~ 635 torr) to the surface volume of the
wound in accordance to the sponge in order to withdraw wound fluids from wounds.
Under the plastic, compression of the foam delivers active mechanical stress to the
tissues and the wound fluids from tissue are withdraw and transported to the outlet tube.
It is suggested that this approach enables wound healing but the healing mechanism is
unclear. Stroock and colleagues state they intent to use the VAC approach to produce a
microporous poly(hydroxyethyl methacrylate) (pHEMA) sponge with pores of fixed
micro- and macro-geometry (i.e. pores ~20 µm in a 500 µm thick layer). The hydrogel
wound dressing is completed by covalently bonding the sponge to a silicone backing
(termed as PDMS) by acrylate-terminated silanes in doing so this produces strong fluidic
connections to the sponge. By using a model wound bed they have shown to achieve a
consistency of mass transfer of fluid (Stroock and Cabodi 2006). The main disadvantage
of this approach is that the wound dressing is designed to remove everything from the
wounds, and this may not aid in wound healing.
Insense Limited (UK) have marketed a moist oxygenating hydrogel dressing, OxyzymeTM
designed to tackle hypoxia (see section 2.4.1 above) in which the imbalance of oxygen
levels are restored to normal within chronic wounds such as: VLUs, DFUs, pressure and
arterial ulcers including surgical and radiation wounds (Ivins et al. 2007; Queen et al.
2007; Eaton 2008).

CHAPTER 2: Literature Review – Wound Healing & Management of Chronic Wounds
73
Figure 14. Mode of action for OxyzymeTM hydrogel dressing. The imbalance of oxygen within chronic wounds is restored by the application of OxyzymeTM which is an active double dressing utilising oxidative biological mechanisms to catalyses the conversion of the atmosphere oxygen (insoluble) into dissolved oxygen (green). Dissolved oxygen prevents hypoxia and oxygen levels are restored to normal. Figure adapted from Davis 2007.
This enzyme-activated hydrogel dressing is made from polysulphonate synthetic polymer
and > 65% water (Eaton 2008); and constructed together by two hydrogel sheets: (1) a
wound contact hydrogel which contains glucose incorporated with iodide ions (< 0.04%
w/w) and has to be applied directly over the wound; (2) a secondary hydrogel sheet with
immobilised glucose oxidase is placed over the wound contact hydrogel (Insense
Limited; Ivins et al. 2007; Davis 2007; Davis et al. 2009). Merging of the two hydrogel
sheets in the correct order activates the function of OxyzymeTM to mimic the
biochemical ‘respiratory burst’ process observed in leukocytes (Ivins et al. 2007) and the
mechanism of OxyzymeTM action is summarised by figure 14. Glucose and atmospheric
oxygen bind to glucose oxidase which in turn catalyses the oxidation of glucose to
gluconic acid and hydrogen peroxide (H2O2). H2O2 has two roles: firstly it kills anaerobic
bacteria and secondly at the wound edge it acts as an oxygen shuttle in which
endogenous H2O2 (in situ) remaining in OxyzymeTM behaves as a soluble water carrier
(Thorn et al. 2005) that diffuses through OxyzymeTM to react with the iodide ions to
actively release dissolved oxygen (Ivins et al. 2007; Davis et al. 2009) and iodine (Davis
2007) into the wound environment. In doing so, the oxygen levels within chronic
wounds are restored preventing hypoxia; additionally the dissolved oxygen has the ability
Oxygen
11 22
Secondary dressing:
Immobilised glucose
oxidase hydrogel
Primary dressing: Glucose
and iodide containing
wound contact hydrogel
Exuding wound
Oxygen
Glucose
Glucose
Oxidase
Hydrogen
peroxide
Iodide ions
Oxygen Iodine
33
44
3. Binding of oxygen to glucose oxidase catalyses the oxidation of
glucose to gluconic acid (not shown) and hydrogen peroxide
(purple) within the dressing.
4. Hydrogen peroxide binds with the immobilised iodide ions within
the dressing to generate dissolved oxygen and iodine. Oxygen is
delivered to the wound (green arrows) and the iodine combats
bacterial infection at the wound surface.
1. Combining of the hydrogels
dressings enables glucose (orange)
from the bottom dressing to diffuse
into the top enzyme dressing and
this activates glucose oxidase (blue)
in the top dressing.
2. Atmospheric oxygen (green)
migrates into the dressing.

CHAPTER 2: Literature Review – Wound Healing & Management of Chronic Wounds
74
of killing anaerobic bacteria via respiratory burst which is enhanced by iodine as it
behaves as a potent antimicrobial agent that produces a hostile environment for
microbial growth.
Man-made hydrogel release vehicles (RV) have been designed to control the release of
growth factors for wound applications to promote tissue formation within chronic
wounds. Currently, the non-sterile Regranex® hydrogel (Johnson & Johnson) made of
becaplermin (0.01% i.e. 100 µg per 1g), sodium CMC, sodium chloride, sodium acetate
trihydrate, glacial acetic acid, water for injection, including preservatives (i.e.
methylparaben, propylparaben, and m-cresol) and a stabiliser (L-lysine hydrochloride).
From this ingredient, Becapleman is the active component within Regranex® and it is a
mimic of the human PDGF-β,β. It is formulated as a human recombinant PDGF-β,β
generated by recombinant DNA technology in yeast in the form of a homodimer
(containing two identical polypeptide chains connected together by disulphide bridges)
with a molecular weight of 25 kDa. The function of Regranex® is to correct the
imbalance of endogenous growth factors within the wound bed of ulcers by delivering
Becapleman i.e. PDGF-β,β to facilitate chemotactic behaviour by recruiting and
proliferating cells to smooth the progress of granulation tissue formation. However, it is
suggested that such a dressing is inadequate in its treatment due to a prolonged
inflammatory phase (Cullen et al. 2002b). To combat this problem, over the years other
hydrogel RVs have been fabricated to release growth factors for wound healing
applications. Bourke et al. demonstrated a continual release of the PDGF-β,β up to 3-4
days from a UV photo-crosslinked PVA hydrogel with hydrophilic PVA fillers. In this
manner these hydrogels are considered to be more beneficial than contemporary wound
applications as they do not have to be changed frequently (Bourke et al. 2003).
Recently, Bader et al. showed the diffusive release of keratinoctye growth factor (KGF)
and glucose from semi-interpenetrating network (sIPN) hydrogels. These biodegradable
sIPNs were fabricated as a binary hydrogel to mimic the ECM by covalently photo-
crosslinking poly(ethylene glycol) diacrylate with unmodified gelatin. KGF was
successfully released from the sIPNs hydrogels via unidirectional desorption and had a
diffusion coefficient of 4.86 × 10⁻⁹ ± 1.86 × 10⁻¹² cm2/s. On the other hand glucose
was unable to be released from the sIPNs, but the transport of glucose was achieved by a
flow mechanism through sIPN hydrogels with a diffusion coefficient of 2.25

CHAPTER 2: Literature Review – Wound Healing & Management of Chronic Wounds
75
× 10−6 ± 1.98 × 10⁻⁷ cm2/s (Bader et al. 2009). Bader et al. speculate that these sIPNs
are efficient hydrogels for releasing drugs, growth factors and nutrients to proliferating
cells during wound healing.
2.6.3.3 Protease-modulating hydrogel dressings
The failure of Regranex® to work effectively is mainly the result of elevated levels of
proteases present in chronic wound fluids (Cullen et al. 2002b) that cause tremendous
problems to various biochemical pathways within chronic wounds. Although the
pathophysiology of chronic wounds is still not clearly understood, there has been a
gradual increase of wound dressings that enter the wound care market to address and
overcome the biochemical problem of elevated proteases commonly observed in chronic
wounds. The wound dressings that adjust protease activity within chronic wounds
commonly fall into the category of ‘protease-modulating’ dressings or are sometimes
referred to as active dressings. According to the British National Formulary (BNF,
2009), currently there are six protease-modulating dressings available within the UK
wound care market: PromogranTM and Promogran PrismaTM (Johnson & Johnson),
Cadesorb (Smith & Nephew), Suprasorb® C (Activa Healthcare), Sorbion® S (H&R
Healthcare) and Tegaderm® Matrix with PHI technology (3MTM Healthcare Limited).
Additionally, the pro-ionic hydrogels marketed by First Water Limited have recently
become available to inhibit proteases activity (First Water Limited). Nevertheless,
scientific research continues to develop more protease-modulating wound dressings as
there has been a lot of interest to provide a variety of cost-effective protease-modulating
wound care products around the world. Table 8 summarises the protease-modulating
hydrogels that are currently marketed in the wound care market (primarily within UK/
Ireland) and being investigated by various scientists to control the imbalances of
proteases found in chronic wounds.
In 2002, the first enzyme responsive dressing to be marketed was PromogranTM (table 8,
entry 1) which is a sterile, 3 mm thick hexagonal sheet consisting of a freeze-dried
homogeneous matrix composed of bovine collagen (55%) and oxidised regenerated
cellulose (ORC, 45%). After being applied to the wound, when the freeze-dried matrix
comes in contact to the wound exudate, its initial mode of action is to absorb the wound

CHAPTER 2: Literature Review – Wound Healing & Management of Chronic Wounds
76
fluid (assisted by the highly absorbent ORC composition) and upon saturation the matrix
transforms into a soft biodegradable (bio-absorbable) conformable gel.
Table 8. Application of protease-modulating hydrogel dressings for chronic wounds
Entry Name Hydrogel Ingredients Type of response
Enzymes References
1 PromogranTM ORC/ collagen Inhibit enzyme activity
MMPs Elastase Plasmin
J&J Medical; Cullen et al. 2002a, 2002b; GMAWCP 2008; BNF 2009
2 S-SEBS polymer
S-SEBS
Na+, Ag+, doxycycline
Reduce enzyme activity
Neutrophil elastase, MMP-8
Vachon and Yager 2006
3 Promogran PrismaTM
ORC/collagen and silver
Inhibit MMP activity & bacterial infection
MMPs Elastase Plasmin
J&J Medical; BNF 2009
4 Sorbion® S Polyacrylate polymers in cellulose matrix
Modulates MMPs
MMPs Sorbion AG; H&R Healthcare; BNF 2009
5 TenderWet
Polyacrylate superabsorbers preswollen in Ringers’ solution
Reduce enzyme activity
MMPs Eming et al. 2008
6 Pro-ionic hydrogels/ matrix
Sulphonate groups, NaSPA/NaAMPS
Inhibit enzyme activity
MMP-2 MMP-9
FW Ltd, Munro and Boote 2009
7 Cadesorb Starch beads in PEG/PPG
Lowering pH to inhibit MMP activity
MMPs Elastase Plasmin
S&N Wound Management, GMAWCP 2008; BNF 2009
8 Tegaderm™ Matrix
Cellulose acetate matrix, impregnated with PHI in PEG
Inhibit enzyme activity
MMP 3M; BNF 2009; GMAWCP 2008
9 Bisphosphonate-functionalised hydrogels
Bisphosphonate (alendronate) tethered to pHEMA/PEG
Inhibit enzyme activity
MMPs Rayment et al. 2008
10 Modified gelatin microspheres (DHB-MS)
MMP inhibitor (DHBA) conjugated to gelatine MS and impregnated into collagen scaffold
Inhibit MMP activity and control bacterial infection
MMP-2 MMP-9
Adhirajan et al. 2009
Abbreviations: ORC (oxidised regenerated cellulose), MMP (matrix metalloproteinases), J&J (Johnson & Johnson), BNF (British National Formulary), S-SEBS (Sulfonated styrene– ethylene– butylenes–styrene), Na (sodium), Ag (silver), NaSPA (acrylic acid (3-sulphopropyl) ester sodium salt), NaAMPS (sodium salt of 2-acrylamido-2-methylpropanesulphonic acid), FW Ltd (First Water Limited), Ltd (Limited), PEG (polyethylene glycol), PPG (polypropylene glycol), pH (potential hydrogen), S&N (Smith and Nephew),PHI (polyhydrated ionogens), 3M (3MTM
Healthcare Limited), GMAWCP (The Global Market For Advanced Wound Care Products 2008), pHEMA (poly-hydroxyethylmethacrylate), DHB-MS (modified gelatin microspheres), DHBA (2,3-dihydroxybenzoic acid) and MS (microspheres).

CHAPTER 2: Literature Review – Wound Healing & Management of Chronic Wounds
77
Mechanistically, PromogranTM binds and inactivates MMP activity in addition to binding
endogenous growth factors and protecting them from being degraded by the
overabundant proteases (e.g. MMPs) found in wound exudates (Cullen et al. 2002b). The
function of bovine collagen is to behave as an alternative profuse substrate for MMPs.
In addition to its highly absorbent ability, ORC enhances the inhibition of these
proteases by demolishing the 3D structure of MMPs. This is accomplished by the
negative charges of ORC which bind and dislocate the positively charged divalent metal
ions e.g. Zn2+ within the catalytic site of the MMP structure. Removal of the divalent
metal ions inhibits the functional enzymatic activity of MMPs and as a result the MMPs
are incapable of binding to any substrate (Ovington 2007) within wounds. Given that
PromogranTM gel also binds growth factors (e.g. PDGF) in a non-covalent manner, as the
gel degrades over time the growth factors are discharged back into the wound in their
functional form (Johnson & Johnson Gateway). Furthermore, PromogranTM has the
ability of removing oxygen free radicals which are generated by lipid degradation of the
cell membrane (Johnson & Johnson Gateway).
The inhibition mechanism of PromogranTM for chronic wounds proteases was further
studied in comparison to wet gauze. Cullen et al. demonstrated the ability of
PromogranTM to significantly reduce the activity of neutrophil-derived elastase, plasmin
and MMPs activities in wound fluids collected from patients with diabetic foot ulcers
(DFUs) which was not observed with wet gauze (Cullen et al. 2002a). The highest rate
of reduction in protease activity was observed for MMP which reduced by 94% (just
within 30 minutes), plasmin reduced by 67% (within 1 hour) and the slowest rate was for
elastase which reduced by 86% (after 2 hours). Coinciding with these results, another
study showed a reduction of elastase, plasmin and gelatinase activity in wound exudates
collected from patients with chronic VLUs after treatment with OCR/collagen matrix
compared to control patients who were treated with a hydrocholloid dressing (Smeets et
al. 2008). While at the same time as reporting gelatinase activity is reduced, on the
contrary and unexpectedly this study reveals no reduction of MMP-2 activity in wound
exudates of chronic VLUs after treatment with OCR/collagen matrix (Smeets et al.
2008).
However, Vachon and Yager reported that the mode of action of their ion exchange S-
SEBS (sulfonated styrene – ethylene – butylenes – styrene) hydrogel dressing (table 8,

CHAPTER 2: Literature Review – Wound Healing & Management of Chronic Wounds
78
entry 2) was more efficient in binding and inactivating MMP-8 and elastase compared to
PromogranTM. The study established that the collagen matrix of PromogranTM was
susceptible to degradation by NE. The S-SEBS (sulfonated-triblock) polymer consisted
of a sulfonated-hydrocarbon backbone that was layered onto polyester fabric (behaves as
a support) and subsequently modified with various ion-exchange formulations (e.g. Na+,
Ag+ and doxycycline etc). The ion-exchange mechanism of the S-SEBS hydrogel
dressing enable the binding and inactivation of proteases and this was further facilitated
by releasing therapeutic antibiotics e.g. doxycycline into chronic wounds (Vachon and
Yager 2006). The release of doxycycline from the S-SEBS-doxycycline hydrogel
formulation was also found to control the bacterial growth of various pathogens (P.
aeruginosa, S. aureus, E.coli and Enterococcus facecalis) present in wounds for a limited
time of 48 hours (Vachon and Yager 2006).
In view of that, Johnson & Johnson developed a similar sterile, freeze-dried matrix to
that of PromogranTM known as Promogran PrismaTM (table 8, entry 3) consisting of
bovine collagen (55%), oxidised regenerated cellulose (ORC, 44%) and 1% silver-ORC.
Promogran PrismaTM differs from PromogranTM as it contains silver which is ionically
bound to ORC (25% w/w). The application of Promogran PrismaTM to a wound is the
same as Promogran. Even though Promogran PrismaTM has all the benefits as
PromogranTM it is more advanced as it has a dual approach where it not only can inhibit
protease activity but it also functions as an efficient antibacterial barrier as it kills bacteria
(such as P. aeruginosa, S. aureus, E. coli and Streptococcus pyogenes) in the dressing to
decrease the bacterial growth of these pathogens that are normally found within wounds.
By delivering silver to the wound it has the ability to facilitate healthy granulation tissue
formation and epithelialisation without bacterial infection (Johnson & Johnson Medical).
Collagen is increasingly considered as an ideal biomaterial for developing wound
dressings and gradually there has been a rise in developing collagen based dressings.
Elsewhere brief descriptions of the types of collagen dressings marketed for wound care
have been reviewed (see GMAWCP 2008) and will not be reviewed here. In spite of
that, the ideal properties of collagen dressings is that they can directly control elevated
proteases in chronic wounds since the abundant collagen within the matrix of these
dressings bio-mimics and substitutes as an important substrate for chronic wound
proteases as we have seen previously with Promogran. In a recent study, Schönfelder et

CHAPTER 2: Literature Review – Wound Healing & Management of Chronic Wounds
79
al. (2005) showed that Suprasorb® C was able to reduce the elastase activity as the
bovine collagen type I matrix of the Suprasorb® C (a collagen foam product marketed
by Activa Healthcare) behaved as a surrogate substrate for PMN elastase. In addition,
when the collagen matrix within collagen dressings breaks down, it’s broken down
fragments behave as chemotactic to recruit various cells to facilitate cell migration and
control bacterial infection to restore normal tissue repair during wound healing process.
Some authors have criticised collagen or collagen/ ORC dressings to have built-in risk
associated with the collagen composition of the dressing as it is made of animal origin
such as bovine (Eming et al. 2008) which amongst different species can be immunogenic
or problems can arise during conformational changes through processing (Leonard et al.
1998 as referenced in Uchegbu and Schätzlein 2006). Adding to this problem, we have
previously encountered that collagen matrix within wound dressings is susceptible to
degradation via wound proteases such as NE (Vachon and Yager 2006). For that reason,
there is a demand of advancing the wound management products consisting of
biocompatible synthetic origin (Eming et al. 2008) in conjunction with moist healing
properties and antimicrobial agents.
Hydroactive ionic wound dressings containing synthetic superabsorbers composed of
poylacrylate (table 8) are increasingly reported as a novel way of inhibiting the protease
activity normally elevated in chronic wounds. Polyacrylate superabsorbers are gel-
binding highly absorbent polymers compiled from polymerised acrylic acid with different
amounts of crosslinking and this enables polyacrylate dressings to absorb various
amounts of water compared to their own dry weight, hence the name polyacrylate
superabsorbers. The binding of water within these superabsorbing hydrogels is achieved
by electrostatic forces of the high density of ionic charges within polyacrylates (Eming et
al. 2008). Polyacrylates are highly used in diapers, feminine hygiene products and wound
dressings (Eming et al. 2008). Currently, Sorbion® S and TenderWet are two examples
of polyacrylate superabsorbing hydrogels marketed as wound dressings.
Sorbion® S (table 8, entry 4) marketed by Sorbion AG and distributed by H&R
Healthcare Limited (UK) as a sachet format (also known as Sorbion® Sachet S) consists
of polyacrylate superabsorbers in a cellulose matrix. Active control of the wound
environment is achieved by Hydration Response Technology (HRT) and this is achieved

CHAPTER 2: Literature Review – Wound Healing & Management of Chronic Wounds
80
by the propinquity of the polyacrylate superabsorbers with the cellulose fibres. The
striking mechanism of this dressing is that it is able to mop-up large amount of exudates
(~ 700 mL) from the wound surface/ bed via osmostic strength from the underlying
tissues. Once the fluids alongside bacteria are absorbed they become interlocked within
the super-absorbers and cellulose fibres (Sorbion AG: www.sorbion.com). Under the
influence of HRT, besides its absorbent property, according to the manufacturer
Sorbion® S has many advantages: (1) the debridement is very soft as the dressing has the
ability to remove slough and toxins thereby reducing odour within the wound; (2)
prevent infection by managing bioburden of pathogens, since the bacteria becomes
locked therefore risk of cross contamination is reduced; (3) it is cost effective as the
number of changes or visit from the nurse are reduced therefore saving on material and
duration of time spend in hospital; and (4) the dressing possess anti-inflammatory
properties. As a consequence the damage at the wound edge is prevented and healed,
high levels of exudates are removed and finally it has the ability to modulate MMPs
(Sorbion AG: www.sorbion.com). A recent case study reviewed the effectiveness of
using Sorbion® S as a primary dressing to treat a highly exuding DFU which only took
12 weeks to heal after its application and prior to that it would not heal (Chadwick 2008).
Even though the manufacturers fail to comment on the mechanism of how Sorbion® S
modulates MMPs; current investigations of polyacrylate superasbsorbers are shedding
light on determining or understanding the possible mechanistic binding or inhibition of
inflammatory proteases such as elastase and MMPs including the inhibition of ROS or
reactive nitrogen species (RNS).
Eming et al. (2008) demonstrated the first in vivo binding of polyacrylate superabsorber
particles: TenderWet (in Germany/ Hydroclean in France; manufactured by Hartmann)
to MMPs within CWFs from patients suffering from chronic VLUs (table 8, entry 5).
The study showed that MMP-2/-9 activity was inhibited by > 87% within CWFs.
Despite the fact that Eming et al. showed direct binding of MMPs with TenderWet
particles, the mechanism of inhibition was accomplished in an indirect manner as the
concentration of the divalent ions i.e. Ca2+ and Zn2+ within the buffer of an MMP assay
were found to decrease in the presence of TenderWet particles. This allowed the authors
to indirectly conclude that Ca2+ and Zn2+ ions within the catalytic active site of MMPs
competitively bind to polyacrylate superabsorber particles (TenderWet) and when bound

CHAPTER 2: Literature Review – Wound Healing & Management of Chronic Wounds
81
the catalytic Ca2+ and Zn2+ ions are no longer available for MMP activity and accordingly
inhibits the functional enzymatic activity of MMPs (Eming et al. 2008) and therefore are
incapable of binding to any substrate within wounds.
Recently, at the EMWA conference, Abel et al. (2009a) showed that polyacrylate
superabsorbers (e.g. Vilwasorb®, Zetuvit® and Sorbion® sachet) have a high affinity to
bind elastase and MMP-2 in vitro and demonstrated that protease inhibition was
significant after 24 hours incubation. Elastase was found to reduce by 90% (p < 0.001)
whereas MMP-2 reduced by ~ 85% (p < 0.01). Additionally, Abel et al. (2009b) used a
chemiluminescent method to show that polyacrylate superabsorbers i.e. Vliwasorb®
(manufacturer by Lobman & Rauscher) can inhibit free radical formation of oxygen
species (ROS i.e. superoxide from 55% to 90%) and nitrogen species (RNS i.e.
peroxynitrite anion from 70% to 85%).
According to First Water Limited (FW Ltd) even though polyacrylate absorbers are ionic
dressings they are poor at imitating natural body molecules because they utilise
carboxylate chemistry. Whereas the hydrophilic co-polymer formulated within their
newly invented biomimetic pro-ionic hydrogels (table 8, entry 6) is more superior as it
contains multiple synthetic pendant anionic sulphonate groups (e.g. –SO2– or –SO2–OH)
making these hydrogel dressings ideal at mimicking the sulphated glycosaminoglycans
(GAGs, e.g. heparin) that are naturally located on the surface of cell membranes and the
ECM (Munro and Boote 2009). In acute wound healing, GAGs are binding sites that aid
in the regulation of biochemical processes such as influencing proteases activity and
normalising inflammation, whereas in chronic wounds the GAGs are dysfunctional
(Munro and Boote 2009).
In their patent, Munro and Boote state that the pro-ionic hydrogels are composed of two
monomers and both monomers are made from olefinically unsaturated sulphonic acid
monomer/salt. Each monomer is considered to be different, in the sense that the first
monomer consist of acrylic acid ester suphonic acid monomer/salt e.g. acrylic acid (3-
sulphopropyl) ester sodium salt (NaSPA) and the second monomer consist of acrylamide
sulphonic acid monomer/salt e.g. sodium salt of 2-acrylamido-2methylpropanesulphonic
acid (NaAMPS). In this way, the composition of the pro-ionic hydrogel comprises a co-

CHAPTER 2: Literature Review – Wound Healing & Management of Chronic Wounds
82
polymer of NaSPA/NaAMPS with pendant sulphonyl groups counterbalanced by one/
more cations (Munro and Boote 2009).
Alongside managing moisture levels in wounds, the partially-hydrated superabsorbent
ionic polymer of the pro-ionic hydrogels/matrix has the dual functionality of working as
a hydrating and absorbing dressing. The hydration role of these wound dressings has
been design to uniquely mimic the natural water activity of the skin and the water levels
are controlled so that there is a balance with the amount of moisture delivered to the
wound. According to the manufacturer, the hydration levels of pro-ionic matrix is
reported as 0.63 which closely resembles the stratum corneum (i.e. 0.65) of the epidermal
layer of the skin (FW Ltd). Just like the polyacrylates superabsorbers (i.e. Sorbion® S
and TenderWet), pro-ionic hydrogels have the capacity to absorb large amounts of
fluids/exudate (i.e. 2.5 – 50 times more) compared to its own molecular weight and
securely interlock it within the matrix of the hydrophilic wound dressing. Additionally,
ongoing clinical work is demonstrating that the pro-ionic hydrogels/ matrix dressings
have the ability to inhibit the enzyme activity of MMP-2/-9 (FW Ltd) to control the
biochemical environment without the need of releasing active substances into the wound
(GMWCP, 2008).
Many scientists are interested in designing wound dressings that will alter the biochemical
wound environment by addressing the potential hydrogen (pH) concentration within
chronic wounds. It is envisaged that controlling protease activity can be achieved by
altering the pH of chronic wounds to acidic pH (Schultz et al. 2005b; Greener et al.
2005) see section 2.4.3. Cadesorb (table 8, entry 7) manufacturer by Smith & Nephew
(Healthcare, Hull) is a pH-modulating ointment that decreases proteases activity within
chronic wounds. The matrix of the hydrogel ointment/ dressing is composed of
carboxylated cross-linked starch beads within a carrier consisting of polyethylene glycol
and polypropylene glycol (PEG/PPG).
Cadesorb has to be secured by a secondary dressing so it firmly remains in contact with
the wound. After its application, the starch beads neutralise the wound environment by
simultaneously substituting the wound with H+ ions and exchanging them with basic ions
that are elevated in chronic wounds (as summarised in figure 15). The substitution of H+
ions decreases the local pH of the chronic wound from approximately pH 7 – 8 (i.e.
neutral – slightly alkaline) to approximately pH 4 – 5 (i.e. acidic). The reduction of the

CHAPTER 2: Literature Review – Wound Healing & Management of Chronic Wounds
83
pH decreases/ inhibits proteases activity and this facilitates matrix formation of the
healing process without affecting the wound tissue. Epithelialisation starts when
keratinocytes migrate across the wound and this promotes proliferation of new epithelial
cells/ tissue which fill up the wound (figure 15). According to the manufacturer
Cadesorb has been shown to control the elevated proteases activity of elastase, plasmin
and MMPs in chronic wounds.
Figure 15. Mechanism of Cadesorb. At pH 7 – 8 (i.e. neutral – slightly alkaline) the provisional matrix of chronic wounds is destroyed by surplus levels of proteases (1); with the application of Cadesorb to the chronic wound (2); the pH of the wound reduces to pH 4 – 5 (acidic) by the substitution of H+ ions and as a result protease activity decreases which facilitates matrix formation and epithelisation commences with the migration of keratinocytes across the wound (3), this promotes proliferation and new epithelial cells/ tissue fill the wound (4), and the pH profile of protease activity of a chronic wound treated with/ without Cadesorb (5). Figure adapted from Smith & Nephew Wound Management. The recent advance invention by 3M™ Healthcare Limited (termed as 3M in this thesis)
makes use of citric acid buffer to reduce the pH of chronic wound, referred to as
TegadermTM Matrix dressing with polyhydrated ionogens (PHI™) technology (table 8,
entry 8). This advanced wound care solution is made of cellulose acetate that is
impregnated with PHI ointment, water (20%) within the hydrophilic matrix of PEG and
buffered with citric acid. The mechanism of TegadermTM Matrix dressing with PHITM is
to regulate the micro-environment of a wound, by controlling the imbalance of MMP
activity in order to speed-up the smooth progress of re-epithelialisation to facilitate
wound closure of chronic wounds. The cellulose acetate is a non-biodegradable highly

CHAPTER 2: Literature Review – Wound Healing & Management of Chronic Wounds
84
versatile carrier which after the dressing is applied enables the access of wound exudate
into the dressing.
According to 3M, the PHITM technology is the striking feature of this dressing, as it is a
unique ointment that contains a combination of four metallic cations i.e. rubidium,
calcium, zinc and potassium that are present within the body (e.g. wound exudate and in
serum). The PHITM technology promotes natural moisture to modulate the production
of MMPs by down-regulating the protease activity (e.g. MMP-2) within fibroblast cells.
In the presence of wound exudate and under the influence of body heat and moisture,
the PEG moiety enables the accurate activation for the steady liberation of the metal ions
into the wound bed followed by their penetration into fibroblast cells (3M). The first ion
to penetrate the fibroblasts cells is rubidium and its function is to make a channel
opening within the cell membrane to allow the remaining ions of the PHITM technology
to penetrate the cells. The production of MMPs is inhibited by both calcium and zinc
ions. The cell membranes of fibroblasts are depolarized by potassium ion which further
facilitates the inhibition of MMP production at the transcriptional level by switching off
protein synthesis of MMPs (3M). Additionally, potassium supports tissue regeneration.
Citric acid buffers the wound environment by decreasing the local pH of chronic wounds
from neutral/ alkaline to slightly acidic (i.e. pH 5). This reduction of the pH not only
fosters the transport of metal ions over the cell membrane it also increases both the
synthesis of neutral complexes along with cell proliferation to accelerate the normal
wound healing cascade of deadlocked chronic wounds (3M).
TegadermTM Matrix dressing with PHITM is contraindicated for wounds that cannot be
treated with any other wound care product after the duration of 4 – 6 weeks. It can be
used to treat non-infected chronic wounds such as diabetic/ venous ulcers and stages II-
IV pressure ulcers (3M). The manufacturers have carried out some case studies to
determine the efficacy of this dressing; according to 3M TagadermTM Matrix can heal
chronic wounds within the range of 4 – 10 weeks depending on the wound.
It is worth nothing that Epi-Max (in USA), DerMax and MelMax (in EU and Middle
East) are all precursor wound dressings of TagadermTM (in UK) and are all composed of
an acetate carrier impregnated with PHIs ointment (Greystone Pharmaceuticals, Inc.).
Originally, the PHITM technology was extracted from the Red Oak Bark tree but it is now

CHAPTER 2: Literature Review – Wound Healing & Management of Chronic Wounds
85
formulated and synthesised by Greystone Pharmaceuticals, Inc. (sometimes referred to as
PHI formulation, PHI-5 or metal ionogen (MI) technology). It was patented by their
subsidiary group Dermagenics Inc. (Patent Dermagenics Europe B.V., as cited in van
Rossum et al. 2007). For wound care products, in 2007 Greystone Pharmaceuticals put
in force a worldwide licence agreement with 3M for use of Greystone’s patented PHI
technology (Greystone Pharmaceuticals, Inc.); additionally it gave permission for 3M to
distribute TagadermTM within the USA.
Furthermore, various in vitro studies have demonstrated that DerMax has the ability to
inhibit MMP activity such as MMP-2 (van den Berg et al. 2003; Karim et al. 2006)
alongside inhibiting the production of ROS (van den Berg et al. 2003; Pirayesh et al.
2007) and inhibit complement activation (van den Berg et al. 2003). Likewise, at the
molecular level, DNA microarrays studies have shown that the gene expression of
diabetic fibroblasts cells is increased and resembles normal fibroblasts after treatment
with PHITM technology since MMP activity (MMP-9) is found to decrease with increasing
concentration of PHITM technology (Schultz 2008 as cited in 3M PHITM technology
technical brochure). Additionally, Pirayesh et al. carried out an in vivo multi-centre pilot
study on a total of 20 patients with DFUs and demonstrated the effectiveness of the
PHITM technology using DerMax. A total wound closure of the DFUs was observed
within 80% of the patients (16 patients) which was maintained within 6 to 38 weeks with
a total mean time of 18 weeks (Pirayest et al. 2007).
Increasingly a choice of studies have reported the use of synthetic inhibitors as a
beneficial approach of inhibiting MMP activity and a way of promoting forward the
healing of chronic wounds, since the main drawback of previous dressings specifically
the collagen/ ORC dressings is the total inactivation of the proteases within the wound
bed given that the MMPs are required by other processes such as activating growth
factors and regulating the immune system during various phases of the wound healing
process other than just ECM degradation. To overcome this problem, consequently
Rayment et al. (2008) proposed the functionalisation of pHEMA/PEG hydrogels with
the MMP-inhibitor, alendronate (figure 16) in the form of a sodium salt (figures 17) to
develop bisphosphonate-functionalised hydrogels (table 8, entry 9, figure 16) as a novel
way of neutralising the wound environment by inhibiting the activity of MMPs in CWFs
whilst keeping the protease activity active next to the upper cellular layer of a wound bed.

CHAPTER 2: Literature Review – Wound Healing & Management of Chronic Wounds
86
P
PNH
2
OH
OH
O
O
OH
OH
OH
P
P
R2 R1
OH
O
O
OH
OH
OH
AlendronateBisphosphonate (BP)
P-C-P bond has a
strong affinity for
divalent calcium ions
Calcium ions of MMP are
chelated more effectively when
R1 group of BP contains an -OH
The number of nitrogen
groups within the R2 group
concludes the potency of BPs
Figure 16. Chemical structure of the MMP-inhibitor, bisphosphonate. The general structure of BP demonstrates the functional groups that display a strong affinity for the divalent cations e.g. calcium ions within the MMP structure (left) and the structure of the germinal BP, alendronate (right). Figure adapted from Santini et al. 2003 and Heymann et al. 2004.
Alendronate is a small, aliphatic synthetic amino/nitrogen-containing bisphosphonate
(BP), distinctively a germinal BP as it bears two C – P bonds on the same carbon atom
i.e. P–C–P (Fleisch 2002; Rayment et al. 2008) see figure 16 (highlighted in red). This
bond alongside the hydroxyl (OH) group at the R1 side chain of alendronate has a strong
affinity for binding divalent ions (e.g. Ca2+ or Zn2+). Seeing as the aliphatic R2 group of
alendronate contains a single amino group (–NH2) it is said to be highly potent (Santini et
al. 2003; Heyman et al. 2004; Rayment et al. 2008).
The functionalised-bisphosphonate-pHEMA/PEG hydrogels were synthesised via a
Schotten-Baumann reaction which is a nucleophillic acylation reaction that occurs in the
presence of dilute alkali as summarised by figure 17 (Rayment et al. 2008). Since they
efficiently uncovered the inhibition of MMPs in CWF by the unsaturated alendronate
analogue, alendronate-methacrylate was then tethered to pHEMA/PEG hydrogels via
gamma induced polymerisation, generating alendronate-methacrylate-pHEMA/PEG
hydrogels (termed as functionalised-bisphosphonate-pHEMA/PEG hydrogels in this
thesis). The study reported that these hydrogels were able to render the catalytic activity
of MMP inactive as the degradation of collagen type I in CWF was found to decrease
significantly compared to an untreated control (p < 0.01).
It was proposed that once the MMPs are absorbed from the CWFs into the hydrogel
dressing then the mechanism of MMP inactivation is a result of divalent cation (e.g. Zn2+
or Ca2+) chelation (Rayment et al. 2008). In the literature this is achieved by the P–C–P
bond which has a strong affinity for calcium ions and the chelation is further enhanced
by the hydroxyl R1 group of alendronate which has a strong affinity to chelate Ca2+ ions

CHAPTER 2: Literature Review – Wound Healing & Management of Chronic Wounds
87
(or Zn2+) of MMPs (figure 16) via a tridentate binding/ conformation (Santini et al. 2003;
Heyman et al. 2004).
Cl
O P
PNH
2
OH
OH
O
O
OH
ONa . H2O
OH
O
NH
P
P
OH
OH
O
O
OH
ONa . H2O
OH
O
NH
P
P
OH
OH
O
O
OH
ONa . H2O
OH
O
OOH
O
O
OH
ONa
OH
OH
O
O
O
O
O
NH
P
P
OH
OH
O
OOH
O
O
OH
OH
+
3 3NaOH
ice salt bath
Stir vigorously
20 h
Methacryloyl
Chloride
Alendronate
sodium saltAlendronate-methacrylate
+ HCl
+
Polymerisation
(gamma-irradiation)
Alendronate-methacrylate-pHEMA/PEG hydrogel
Alendronate-methacrylate
HEMA monomer
(A)
(B)
+ PEG
3
Figure 17. Bisphosphonate-functionalised hydrogels synthesised via Schotten-Baumann reaction. (A) In a single step reaction the lone pair of the amine group of alendronate sodium salt attacks the carbonyl carbon of the vinyl-containing acid chloride, methacryloyl chloride generating a tetrahedral intermediate (not shown). The swinging back of the alkoxide electrons immediately generates an amide bond forming alendronate-methacrylate and HCl. (B) Co-polymerisation (gamma-induced) of alendronate-methacrylate with hydroxyethylmethacrylate (HEMA) monomer in the presence of PEG generates alendronate-methacrylate-pHEMA/PEG hydrogels. Figure adapted from Rayment et al. 2008.
Previous in vitro studies have shown that nitrogen-containing BPs have the ability to
impede cell growth of normal human epidermal keratinocytes (Reszka et al. 2001) and
the P–C–P containing BPs have the ability to inhibit cell function and possibly promote
apoptosis (Fleisch 2002). In view of that Rayment and colleagues also demonstrated that
the functionalised-bisphosphonate-pHEMA/PEG hydrogels were biocompatible when
exposed to a 3D ex vivo human skin equivalent model (Rayment et al. 2008) making them
promising hydrogels for wound care therapy.
Recently, Adhirajan and colleagues reported a similar approach of tethering MMP
siderophore inhibitors to gelatin (Type B from bovine skin) hydrogel microspheres (MS).
The gelatin MS were functionalised by covalently conjugating the COOH group of the
MMP inhibitor, 2,3-dihydroxybenzoic acid (DHBA, a synthetic catecholate type metal

CHAPTER 2: Literature Review – Wound Healing & Management of Chronic Wounds
88
chelator) to the NH2 groups of gelatin to develop modified gelatin MS (DHB-MS, 60–
120 µm, table 8, entry 10) with the intention of inhibiting the activity of MMP-2 and
MMP-9 within diabetic tissue/wounds (Adhirajan et al. 2009). Complete inhibition of
MMP-2 and MMP-9 activity within tissue lysate by DBH-MS was observed after 6 hours.
A wound dressing with dual ability of both inhibiting MMP activity combined with
controlling pathogen infection was developed in which Adhirajan et al. (2009) loaded
DHB-MS with deoxycycline and by fusion, a reconstituted collagen scaffold (DHB-MS
collagen scaffold) was constructed. The release of deoxycycline from the DHB-MS
collagen scaffold was slow compared to DBH-MS; but antibacterial activity was
continuously delivered by both DHB-MS and DHB-MS collagen scaffold to control the
infection of P. aeruginosa, S. aureus, K. pneumoniae and E. coli (Adhirajan et al. 2009).
2.7 SUMMARY
After the high demands from various clinicians/ scientists, the wound care market has
entered into a new era of developing advanced wound care products to control the
biochemical environment of elevated proteases found in chronic wounds. This is
because such abundant proteases (e.g. elastase, plasmin, thrombin and MMPs) are found
to be detrimental to ECM proteins or factors causing a prolonged inflammatory/
proliferation phases resulting in the development of deadlocked chronic wounds.
Functionalising synthetic hydrogels with a stimulus that is only responsive to one (or
more) of the elevated proteases enables the generation of highly exclusive/specific
bioresponsive wound dressings to manipulate the biochemical wound bed micro-
environment to facilitate and advocate wound healing of chronic wounds.
The moist and transparent ability of hydrogels make them ideal wound dressings. The
swelling and collapsing states exhibited by hydrogels make them an exceptional material
to interlock detrimental proteases within the hydrogel matrix upon removal of the
responsive stimulus. The use of hydrogel particles as opposed to sheets is an ideal
approach as some chronic wounds are deep open wounds, therefore the configuration
and dimension of these particles allows them to accommodate and fit all types of chronic
wounds without the necessity of cutting the hydrogel dressing to size. In contrast to the
protease-modulating wound dressings described within this chapter, this thesis presents

CHAPTER 2: Literature Review – Wound Healing & Management of Chronic Wounds
89
an alternative way of selectively ‘mopping-up’ excess elastase from sample fluids (which
mimic CWFs) into hydrogel particles in the attempt of providing a potential way of
down-regulating excess elastase in deadlocked chronic wounds.

CHAPTER 3: Functionalisation of PEGA Particles
90
CCHHAAPPTTEERR 33
FFuunnccttiioonnaall iissaattiioonn ooff PPEEGGAA PPaarrttiicclleess

CHAPTER 3: Functionalisation of PEGA Particles
91
3.1 INTRODUCTION
Within the last decade, there has been an increased interest in fabricating stimuli-
responsive materials to engineer smart polymers for biomedical applications which have
been reviewed extensively within this scientific field (Ulijn 2006; Ulijn et al. 2007a,
McDonald et al. 2009; Carpi and Smela 2009; Mohammed and Murphy 2009; Roy et al.
2010). In reference to this thesis, this chapter will only summarise the developments of
the enzyme-responsive approach previously demonstrated within the Ulijn group
(Thornton et al. 2005) as this research provided the fundamental inspirations for the
work described within this thesis.
An enzyme-responsive hydrogel is a polymer that is firstly engineered, tuned or
functionalised so that it responds to a target protease. This is achieved by incorporating
or modifying the polymer with peptides that are recognised by the enzymes within the
body. Such peptides are commonly known as substrates or enzyme cleavable peptides or
linkers (ECPs or ECL, respectively); in this thesis they will be referred to as ECPs. As
previously mentioned in section 2.6.3 for a hydrogel to be ‘responsive’ it is defined as a
polymer that will transform its dimension or conformation as a result of physiochemical
or biochemical stimuli (such as pH, temperature, ionic strength etc.). In this fashion, the
enzyme-responsive hydrogel is further modified by an ‘actuator’ which dictates and
manages the electrostatic interactions of the polymer in response to its external
environment and this causes the polymer to macroscopically transform its structure or
swelling property (Ulijn 2006; McDonald et al. 2009).
In 2005, Ulijn and co-workers functionalised PEGA (hydrogel) particles with positively
charged ECPs i.e. Fmoc-Arg(+)-Phe-Gly or Fmoc-Arg(+)-Gly-Phe in each case the Arg
residue acted as the positively charged actuator that caused the PEGA particles to swell
which in turn increased the molecular accessibility of the particles as a result of
electrostatic repulsion between the positive charges of the ECPs. Additionally, they
revealed that when these positively charged PEGA particles were treated with a protease,
such as thermolysin (functions as the external stimulus) the cleaving of the ECPs by
thermolysin resulted in the removal of the terminal positive charge (Arg(+)) from PEGA
particles. As a result, this caused PEGA particles to structurally collapse due to the

CHAPTER 3: Functionalisation of PEGA Particles
92
reduction in electrostatic repulsions and accordingly the molecular accessibility of the
PEGA particles; and in this manner thermolysin became entrapped within the PEGA
particles (Thornton et al. 2005). The inspiration of this thesis arose after Ulijn and co-
workers envisaged that these macroscopic transitions of the hydrogel particles could
potentially be used to selectively remove unwanted macromolecules from biological
systems (Thornton et al. 2005; Ulijn et al. 2007a) such as chronic wounds in which this
thesis investigates.
As previously encountered in chapter 2: abundant levels of NE was the culprit of
propagating positive feedback mechanisms causing the elevation of other proteases (e.g.
MMPs) with an overall effect of developing debilitating chronic wounds (see section 2.5).
Ideally, reducing the levels of elastase activity in chronic wounds would reduce the
vicious cascade reactions of elastase, thus restrain the synthesis of other proteases and
overall decrease the proteolytic activity observed in chronic wounds. By utilising the
macroscopic swelling/ collapsing property of hydrogels via the enzyme-responsive
approach developed by our group (as summarised above) an elastase-responsive hydrogel
wound dressing could potentially be designed so that it could exclusively and selectively
mop-up excess elastase and then entrap it within the hydrogel matrix.
For the basis of this elastase-responsive wound dressing, the hydrophilic PEGA resin
(figure 1) in the form of particles was chosen as a suitable hydrogel matrix. As
encountered previously, PEGA is a three dimensional hydrogel that is synthesised by the
co-polymerisation of polyacrylamide and PEG (Meldal 1992). The advantages of using a
hydrogel wound dressing to treat chronic wounds has previously been covered in chapter
2 (see section 2.6 for details). PEGA particles were chosen for several reasons
compared to other polymers. Firstly, Meldal and colleagues showed that PEGA resins
are much better compared to the current polymer supports for peptide synthesis (Medal
1992; Renil et al. 1998) since PEGA particles are compatible (i.e. stable) and permeable
and to both chemical (organic) and biological reagents meaning that ECPs can easily be
immobilised to the matrix of PEGA via SPPS utilising standard Fmoc chemistry.
Secondly, there has been increasing reports showing the compatibility and permeability
of PEGA particles with biological molecules such as enzymes for enzymatic reactions,
especially the complete accessibility of enzymes throughout the core of PEGA particles

CHAPTER 3: Functionalisation of PEGA Particles
93
(Meldal et al. 1994; Kress et al. 2002; Ulijn et al. 2002; Thornton et al. 2005). Generally,
it is estimated that PEGA1900 has a molecular weight cut-off 35 kDa (Kress et al. 2002;
Ulijn et al. 2002) however enzymes of 50 kDa – 80 kDa have also been reported to enter
the matrix of PEGA1900 (Auzanneau et al. 1995; Meldal et al. 1994; Kress et al. 2002) to
enable enzyme catalysis inside PEGA particles (Meldal et al. 1994; Thornton et al. 2005).
Other advantages of PEGA particles include: they are transparent, under the correct
stimuli they are able to swell and collapse (Thornton et al. 2005, 2007, 2008; McDonald
2009), they are bio-inert and with PEG being the major component of these PEGA
particles they are highly flexible and biocompatible. Additionally, PEG retards non-
specific protein adsorption to the surface of the particles and this feature is interesting
because after functionalising the PEGA particles with ECPs, the specific sensing-
actuation process intended to mimic the elastase substrates involved during the wound
healing can exclusively enhance or solely direct the biocatalysis of elastase compared to
other chronic wound proteins.
Commercially, enzymes (such as NE) are very expensive and essentially the purification
of enzymes to gain high yields can take a long time as many steps are required to attain
good purity (Komives and Chen 2004). For proof-of-concept of removing excess
elastase from sample fluids that are mimicking CWFs, porcine pancreatic elastase (PPE,
EC 3.4.21.36) was chosen as the model protease to NE because of its similaries to NE.
Firstly, PPE is a serine protease (Barrett et al. 2004) which contains the catalytic triad
His–Asp–Ser within its active site and accordingly shares the general catalytic mechanism
to other serine proteases such as NE as illustrated by figure 8. Secondly, the active site
region of PPE has been reported as being similar to NE (Barrett et al. 2004) and PPE
shows 40% homology to NE (Travis 1998). In comparison to NE, it is the most studied
serine protease for determining elastase activity and alongside NE the broad substrate
specificity of PPE includes its preference to cleave elastin which as mention in chapter 2
is considered as the main substrate for elastase(s). PPE prefers to cleave peptide bonds
at the carboxyl-terminal side of amino acid residues with small hydrophobic, non-polar
side chains such as Ala, Gly (Stryer 1995; Barrett et al. 2004) including Val and Leu
(Travis 1998). In comparison to NE, catalytically PPE has preference to hydrolyse
peptides with Ala~X bonds more readily (Purich and Allison 2002; Travis 1998; Barrett
et al. 2004) than Val~X and Leu~X bonds (Travis 1998).

CHAPTER 3: Functionalisation of PEGA Particles
94
Similarly, thermolysin was chosen as a control protease because it is a bacterial elastase
(Morihara and Tsuzuki 1967) that is isolated from Bacillus thermoproteolyticus and belongs
to the metalloendopeptidase family of enzymes (Barrett et al. 2004; Purich and Allison
2002). It contains a functional Zn2+ ion and four calcium ions bound to the polypeptide
chain (316-residue) with a 3D structure at 1.6Å resolution (Holmes and Matthews 1982).
Compared to PPE, the activity of thermolysin depends on the Zn2+ ion and it is reported
as being extremely stable as well as being four to eight times more active than PPE
(Morihara and Tsuzuki 1967) depending on the substrate. The specificity of thermolysin
has preference to cleave at the N-terminal side of hydrophobic amino acid residues in the
P1′ position e.g. Ala, Gly, Phe, Leu, Ile or Val (Morihara et al. 1968; Barrett et al. 2004;
Purich and Allison 2002) in which the order of preference is Leu > Ala > Phe > Gly
(Barrett et al 2004). Interestingly, thermolysin has a molecular weight of 35,000 kDa
(Miki et al. 1996; Barrett et al. 2004) which is the suitable molecular weight for enzyme
catalysis on PEGA particles and various studies have demonstrated thermolysin as being
robust in completely penetrating into the core PEGA particles (Ulijn et al. 2002; Basso et
al. 2003; Thornton et al. 2005, 2007, 2008; McDonald et al. 2009).
3.2 OBJECTIVES
The research objectives of this chapter include firstly characterising unmodified PEGA
particles by FTIR. Secondly, design short charged enzyme cleavable peptides (ECPs) to
functionalise PEGA particles in response to the elastase and subsequently monitor the
loading of the immobilised ECPs to PEGA particles. Thirdly, investigate the enzyme
hydrolysis of the ECPs coupled to PEGA particles by proteases on the basis of charge
under the influence of pH in the range of chronic wounds. Finally, to study the swelling
behaviour of these particles as a function of ionic strength and pH in order to
understand the swelling hence molecular accessibility of functionalised PEGA particles at
low to high ionic strength.
3.3 MATERIALS & METHODS
3.3.1 Materials
PEGA(800 and 1900)–NH2 particles in methanol were supplied by Polymer Laboratories Ltd
(UK). Fluorenylmethoxycarbonyl (Fmoc) protected amino acids and peptides (Fmoc-

CHAPTER 3: Functionalisation of PEGA Particles
95
Ala-OH.H2O, Fmoc-Ala-Ala-OH, Fmoc-Arg(pbf)-OH, Fmoc-Glu(OtBu)-OH, Fmoc-
Gly-OH, Fmoc-Gly-Gly-OH, Fmoc-Phe-OH, Fmoc-Phe-Phe-OH) were all from
Bachem (UK). Elastase (pancreatic from porcine pancreas, PPE, purity 8 units/mg of
protein, EC 3.4.21.36) and Thermolysin (from Bacillus thermoproteolyticus, purity 40
units/mg of protein, EC 3.4.24.27), trifluoroacetic acid (TFA), silver nitrate (AgNO3)
were from Fluka Analytical (UK). Aldrich (UK) supplied acetonitrile (ACN),
dimetylformanide (DMF), methanol (MeOH), 1-hydroxybenzotriazole (HOBt), N,N'-
diisopropylcarbodimide (DIC), potassium cynanide (KCN), pyridine, phenol and ethanol
(EtOH) and acetic acid. Piperidine, 3-[(3-Cholamidopropyl)dimethylammonio]-1-
propanesulfonate (CHAPS), potassium mono-/di-phosphate solutions (1 M) in deionised
water, glutardialdehyde were purchased from Sigma (UK). HiPerSolv HPLC grade ACN
was from VMR international (UK). Precasted pH 3 – 10 isoelectric gels (15-well, 15µl,
8.6 x 6.8 cm), isoelectric focusing stain/markers, lameali sample buffer, IEF loading
buffer, Mini-Protean® 3 Cell and PowerPacTM Universal for electrophoresis were all
supplied by Biorad (Hertfordshire, UK). Sodium thiosulphate, sodium acetate, sodium
carbonate (Na2CO3) anhydrous, glycine, diaminoethanetetra – acetic acid disodium salt
(EDTA Na2+), glycerol solution were from Fisher Scientific. Formaldehyde (37% w/v)
was from Sigma-Aldrich; and trichloroacetic acid was from BDH. All solvents used were
of the highest purity without further purification. Isolute double fritted filtration
columns were purchased from Kinesis. Stuart Scientific supplied the blood rotator and
roller mixer. HPLC 680 series was purchased from Dionex and the C18 nucleosil
column was purchased from Fisher.
3.3.2 Methods
3.3.2.1 Fourier-transform infrared spectroscopy (FT-IR)
Unmodified PEGA particles (0.1g) were dried in a vacuum oven overnight at ambient
temperature. A small amount of dried PEGA particles were transferred onto the
diamond ATR-platform of the Nicolet 5700 FT-IR spectrophotometer and scanned
using a diamond tip (used for polymer analysis). The diamond tip was tightly pressed on
top of the unmodified PEGA particles to reduce the thickness as well as ensuring that no
air gaps were present. The FTIR spectra of unmodified PEGA particles was scanned
between the wavelength of 4000 – 500 cm-1 region of the electromagnetic radiation over
128 scans at an interval of 1.9285 cm–1.

CHAPTER 3: Functionalisation of PEGA Particles
96
3.3.2.2 Fmoc solid phase peptide synthesis
The pioneered solid phase peptide synthesis (SPPS) method by R. Bruce Merrifield
(1963) was used to functionalise unmodified PEGA particles with neutral and charged
ECPs (figure 19 and table 13) using stepwise Fmoc chemistry (Carpino and Han 1972)
which involved covalently attaching the C-terminus of an activated amino acid to PEGA
particles by sequential coupling followed by the de-protection of protecting groups and
washing steps until the desire peptide sequence was coupled. A fresh batch of
unmodified PEGA particles was functionalised for each experiment.
The SPPS mechanism is illustrated by figure 18. The initial step involved activating an
Fmoc-amino acid (10 equivalents in DMF) with the coupling reagents DIC (5 equivalents
in DMF) and HOBt (10 equivalents in DMF) for 15 minutes on a roller. Unmodified
PEGA particles (~ 0.1 – 2.0 g wet) were washed using wash 1 (entry 1, table 9). The C-
terminus of the activated Fmoc-amino acid was coupled to amino group of the washed
unmodified PEGA particles on a blood rotator for a minimum of 1 hour – maximum
overnight. The modified PEGA particles were washed with wash 2 (entry 2, table 9) and
the successfulness of the coupling reaction was monitored using the Kaiser test (section
3.4.2.3); and the variation in the coupling time also depended on the results achieved
from the Kaiser test. If needed the coupling reaction of the activated Fmoc-amino acid
was repeated to efficiently ensure the coupling of all possible amine groups present
within PEGA particles with Fmoc-amino acid was complete. Before commencing to the
next step (after the Kaiser test) modified PEGA particles were washed thoroughly again
with wash 1 (entry 1, table 9).
Table 9. Washing steps during SPPS
Wash Wash 10x each with Reasons of prewashing step:
1 MeOH, DMF;MeOH (50:50), DMF unmodified PEGA particles or before the coupling step of an amino acid
2 DMF, DMF:MeOH (50:50), MeOH, EtOH Before the ninhydrin test
3 DMF, DMF:MeOH (50:50), MeOH, dH2O Before removing protecting side chain groups (pdf, OtBu)
4 DMF, DMF:MeOH (50:50), MeOH End of SPPS and preparing the particles for storage

CHAPTER 3: Functionalisation of PEGA Particles
97
The mechanism of functionalising PEGA particles with Fmoc-ECPs (di/ tripeptide):
O NH
O
R1
O
O
N = C = N CH3
CH3
CH3
CH3
H+
O NH
O
R1
O
O N CH3
CH3
CH3
NH2
O
NH2+O
NH
O
R1O
CH3
NH
CH3
N CH3
CH3
NH
CH3
O
NNH
O
R1O
H
N
NHCH3
CH3
NH
CH3
O CH3
O
NNH
O
R1O
N
CH2
H O
NNH
O
R1O
NH
O
NNH2
R1
CO2
O
NNH
O
R2O
N
R1
O
O
NNH
O
R3O
N
R2
O
N
R1
O
O
NNH
O
R2O
N
R1
O
O
NNH
O
R3O
N
R2
O
N
R1
O
+ HOBt/ DMF(15 minutes)
STEP 1: Activation of Fmoc-amino acid
STEP 2: Coupling activated Fmoc-amino
acid to PEGA particles
(ninhydrin test)
+
STEP 3: Deprotection of Fmoc group+ DMF (2 hrs)
H+
H+
+
+
(1)
(2)
(5) (6)
(7)
(9)
(4)
(8)
(ninhydrin test)
(3)
STEP 4: Deprotect protecting
side chains
(10) (11)
Fmoc-ionic ECP-PEGA particles (charged)
+ 95% TFA/ Water(2 hours)
(12) (13)
Fmoc-ECP-PEGA particles (uncharged)
(+/-) (+/-)
(repeat steps 1 & 2 if Fmoc-amino acid
has not fully coupled to PEGA particles)
(repeat steps 1, 2 & 3 until
desire length of Fmoc-ECP
has coupled to PEGA particles)
Figure 18. Mechanism for the functionalisation of unmodified PEGA particles with enzyme cleavable peptides (ECPs) using Fmoc SPPS. STEP 1: Fmoc-protected amino acid (2) reacts with the activating reagent DIC (1) to form the active intermediate ester, O-acylisourea (3) in the presence of HOBt which prevents racemisation and reduces the formation of the unreactive N-acylurea. STEP 2: O-acylisourea collapses by intramolecular acyl transfer when it reacts directly with the amine groups of the PEGA particles (4) to form an amide bond between Fmoc-amino acid and PEGA particles (5) alongside the by-product, diisopropylurea (6). Completion of the coupling reaction is monitored using the Kaiser test (section 3.4.2.4). STEP 3: The Fmoc group is de-protected with piperidine (7) and several intermediates including the adduct dibenzofulvene (8) and de-protected PEGA particles (9) are formed. Again completion of the de-protection step is monitored using the ninhydrin test. Steps 1 – 3 are repeated until the desired length of ECP is coupled to PEGA particles producing uncharged Fmoc-ECP-PEGA particles (10, 11), where the length of ECP is a dipeptide (10) or a tripeptide (11). STEP 4: Fmoc-ionic-ECP-PEGA particles (12, 13) are produced after treating (10) and (11) with 95% TFA:5%H2O. Figure tailored from Montalbetti and Falque 2005; Newcomb et al. 1998; Jone 2002; Carey and Sundberg 2001; and Sabationo et al. 2004.

CHAPTER 3: Functionalisation of PEGA Particles
98
O
NNH
O
R2O
N
R1
O
O
NNH
O
R3O
N
R2
O
N
R1
O
O
NNH
O
R2O
N
R1
O
O
NNH
O
R3O
N
R2
O
N
R1
O
Gly
Phe
CH3
HCH3
Arg+
N N
N+
Glu
O
O
Gly
PheCH3
H
PheCH3
Arg+
N N
N+
Glu
O
O
(+/-)
(+/-)
(a)
(c)
(b)
(d)
R1, R2 Ala R1
R2
Ala
R1, R2 Ala
R3
R1, R2 Ala
R2
Figure 19. Chemical structures of uncharged (neutral) and charged Fmoc-ECPs coupled to PEGA particles. Amino acids with uncharged R-groups: alanine (Ala), glycine (Gly), phenylalanine (Phe); and charged R-groups: arginine (Arg(+)) and glutamic acid (Glu(–)). Neutral ECPs (a, c) generating Fmoc-ECP-PEGA particles; charged ECPs (b, d) generating Fmoc-ionic ECP-PEGA particles. The length of ECPs were designed as a dipeptide (a, b) or a tripeptide (c, d).
Prior to coupling the next amino acid, the Nα – protecting Fmoc groups were de-
protected using 20% piperidine dissolved in DMF on blood rotator for 2 hours at room
temperature (Note: at this stage the filtration columns were wrapped in foil). For the
mechanism of Fmoc deprotection via piperidine refer to figure 18: step 3. The de-
protected Fmoc groups were collected for UV/VIS analysis to calculate Fmoc loading
(as described in section 3.4.2.4) to PEGA particles. The modified PEGA particles were
washed again using wash 2 (entry 2, table 9) and the Kaiser test was repeated again to
ensure all Fmoc groups were totally removed. The modified PEGA particles were
washed again using wash 1 (entry 1, table 9). The sequential coupling of activated Fmoc-
amino acids, de-protection of Fmoc-group, Kaiser test and washing steps were all
repeated until the desired ECP was achieved, producing functionalised PEGA particles.
In order to achieved charged ECPs i.e. Fmoc-ionic ECP-PEGA particles, the protecting
side chain groups tert-butyl ester (OtBu) and pentamethyldihydrobenzofuran-5-sulfonyl
(Pbf) for glutamic acid (i.e. Fmoc-Glu(OtBu)-OH) and for arginine (i.e. Fmoc-Arg(pbf)-
OH) were removed by treating the functionalised PEGA particles with 95% TFA:5%
dH2O for 2 hours on blood rotator and the washing step prior to removing the

CHAPTER 3: Functionalisation of PEGA Particles
99
protecting side chain groups was wash 3 (entry 3, table 9). At the end of modification, all
functionalised PEGA particles were thoroughly washed using wash 4 (entry 4, table 9)
and if not used immediately the functionalised PEGA particles were vacuum dried using
a filtration tank to remove all excess MeOH and then stored in fridge.
3.3.2.3 Kaiser test
Ninhydrin test referred to as the Kaiser test (Kaiser et al. 1970) in this thesis was used as
a simple rapid colormetric test for detecting the presence of free amino groups in order
to observe whether each of the coupling/ de-protecting steps during SPPS were
complete. Two Kaiser stock solutions (A and B) were prepared. Kaiser solution A: 20 µl
of aqueous KCN solution (13 mg KCN in 20 ml dH2O) was diluted with 980 µl pyridine
and then further diluted to 100 µl with phenol/ethanol solution (8.0 g phenol dissolved
in 2 ml ethanol). Kaiser solution B: 1.0 g ninhydrin was dissolved in 20 ml ethanol.
Both stock solutions were stored in foil wrapped containers at room temperature. To
carry out the Kaiser test, two drops from each of the Kaiser solution (A and B) were
added to a 5 mg of modified PEGA particles and the colour was observed after heating
the PEGA particles at a temperature > 100oC for 5 minutes. Unmodified PEGA
particles were always used as a standard reference alongside modified PEGA particles
since the unmodified PEGA particles possess free amine groups and will always give a
positive result (as summarised in table 10).
Table 10. Colour observation of PEGA particles and surrounding solution after Kaiser test.
Entry Kaiser Test Solution PEGA particles Concluding observation
1 Positive Clear Blue Amino groups (NH2) present
2 Negative Yellow Clear No amino group present, amide bond produced (RNHC=O)
3.3.2.4 Fmoc loading
Unmodified PEGA particles (0.1 gram) were left to dry overnight in a vacuum oven at
room temperature. The weight of the dried PEGA particles was measured and the
percentage weight loss was calculated using mass difference of wet and dry weight of
PEGA particles. The percentage weight loss for both PEGA800 and PEGA1900 was
calculated as 9.16 % and 6.00 % respectively.

CHAPTER 3: Functionalisation of PEGA Particles
100
A stock solution of 5 mg/ml was prepared by dissolving Fmoc-Ala-OH in 20%
piperidine: DMF (in foil wrapped container at room temperature) to deprotect the Fmoc
group from Fmoc-Ala-OH. This solution was then diluted 1/100 with DMF and from this
diluted solution four individual standard solutions were prepared with a concentration
ranging from 0.01 – 0.04 mg/ml in DMF. Fmoc loading of PEGA particles was achieved
by coupling Fmoc-amino acids (such as Fmoc-Ala-OH) to unmodified PEGA particles
(0.5 grams) using Fmoc SPPS (as described above). As stated above, the removal of
Fmoc group was achieved by treating the modified PEGA particles with 20%
piperidine:DMF (2 ml) on a blood rotator for 2 hours. To collate all possible Fmoc
groups, modified PEGA particles were further washed with DMF (8 ml) and this
solution was further diluted 1/100 with DMF. The concentration of the Fmoc groups for
both standards and samples was measured using UV/Vis spectrophotometer (at 301 nm)
using a 1 cm path-length quartz cuvette. For the standards a linear curve was produced
(figure 20) which was used to calculate the Fmoc loading of the functionalised PEGA
particles as summarised by equation 1.
y = 7.7594x
R2 = 0.9998
0.0
0.3
0.5
0.8
1.0
1.3
1.5
0.00 0.05 0.10 0.15 0.20
Fmoc (mmoles/L)
Absorbance (at 301 nm)
Figure 20. Standard curve for the absorbance (301nm) of Fmoc group.
Equation 1. Fmoc loading calculation:
mmoles = Absorbance (301nm)
Gradient (7.7594)x volume collected (L) x Dilution factor
Mass of PEGA (g) = Mass of PEGA (g) x (% Weight loss ÷ 100) dry wet
Mass of PEGA (g) dry
mmoles Loading (mmoles/g) =

CHAPTER 3: Functionalisation of PEGA Particles
101
3.3.2.5 Isoelectric focusing
The pI value of elastase (1 mg/ml was dissolved in various solutions lameli buffer, water
and CHAPS) was determined using 1-D gel isoelectric focusing on 15 well isoelectric gels
(pH 3 – 10) using a Biorad-Miniprotean cell. Five microlitres of both the IEF stain and
elastase were loaded on to the gel. Voltage steps were applied for: 1 hour at 100 V, 1
hour at 200 V and 30 minutes at 500 V. After separation, the gel was stained using the
silver nitrate approach (all solutions were heated to the desired temperature using a
hotplate and all washing steps were manually shaken) as follows:
The gel was first fixed by washing the gel with fixing solution 1 (20 % w/v
trichloroacetic acid) at room temperature for 15 minutes; followed by fixing solution 2
(20 % v/v ethanol, 8 % v/v acetic acid) at 50oC for 10 minutes and then finally with
fixing solution 3 (20% v/v ethanol, 8% v/v acetic acid, 0.4% v/v glutardialdehyde) at
50oC for 10 minutes. After that, the gel was washed with the incubation solution (0.1 %
w/v sodium thiosulphate, 0.4M sodium acetate with the pH adjusted to 6.5 using acetic
acid, 0.4 % v/v glutardialdehyde) at 50oC for 10 minutes. Then washed with the rinsing
solution (20 % v/v ethanol, 8 % v/v acetic acid) at 50oC for 10 minutes; and finally the
gel was washed three times with deionised water at 50oC for 10 minutes.
Next, the gel was washed and then incubated with the silvering solution (0.1 % AgNO3,
25 µl of 37 % w/v formaldehyde per 100 ml) at room temperature for 20 minutes. Next
the gel was washed using two developing steps: developing step 1 (2.5 % w/v Na2CO3,
32.5 µl of 37 % w/v formaldehyde) at room temperature for 1 minute; followed by
developing step 2 (2.5 % w/v Na2CO3, 32.5 µl of 37 % w/v formaldehyde) at room
temperature until elastase bands appeared and were of the desired intensity. The gel was
then de-silvered (with 2 % (w/v) glycine, 0.5 % w/v EDTA Na2+ at room temperature
for 10 minutes. (Note: the waste from the silvering step on-wards was poured into a
suitable container for silver nitrate waste). Finally, the gel was prepared for drying by
washing it in 2 % (v/v) glycerol solution at room temperature for 10 minutes. The gel
was then preserved by transferring the gel on to a plastic cassette and then left to air dry
completely at room temperature for 2 days. The gel was subsequently wrapped with
cling film and stored at 4ºC.

CHAPTER 3: Functionalisation of PEGA Particles
102
3.3.2.6 Cleaving functionalised PEGA particles with proteases
After SPPS, functionalised PEGA particles were thoroughly washed with MeOH, dH2O
and potassium phosphate buffer at the appropriate pH and ionic strength (as indicated).
Functionalised PEGA particles (50 mg) were then cleaved with elastase and thermolysin
(1 ml at 0.1 or 1.0 mg/ml in 0.001M at pH 6.0 – 9.0) overnight at 34 – 37 oC. The
supernatants of the cleaved products were collected and the reaction was stopped by
washing the PEGA particles with ACN:H2O (80:20, 9 ml) containing 0.1% TFA. This
washing also ensured that all the cleaved products were collected from the interior of the
functionalised PEGA particles. The procedure was carried out in duplicates (n = 2 or 4,
as indicated).
For enzymatic analysis and in order to quantify the percentage cleaved product yield after
enzyme cleaving, 20 µl of the cleaved product was injected and analysed by reverse-phase
HPLC (rpHPLC), a technique used to achieve separation of the collected cleaved
product. A linear curve was produced for the standard solution of Fmoc-Ala-OH in the
range of 0.00 – 0.40 mmoles (figure 21) by dissolving Fmoc-Ala.H2O.OH in ACN:H2O
(80:20); and the percentage cleaved product by a given protease was calculated according
to equation 2.
y = 122.07x
R2 = 0.9928
0
11
22
33
44
55
0.00 0.10 0.20 0.30 0.40
Fmoc (mmoles)
Area of Fmoc peak at 301 nm
(mAU*min)
Figure 21. Standard curve for the area of Fmoc group (301nm) via HPLC.
The Dionex HPLC system consisted of P680 pump with ASI-100 Automated sample
injector. Chromatographic analyses were carried out using a Nucleosil C18 reverse-phase
column (5 µm particle size, 100 mm x 4.6 mm I.D.) connected to a UVD170U detector.

CHAPTER 3: Functionalisation of PEGA Particles
103
The mobile phase consisted of ACN:H2O (0.1% TFA) and 0.1% TFA:H2O and was
pumped at a flow rate of 1 ml/min with a solvent gradient of 40% (ACN:dH2O:TFA)
gradually rising to 90% (ACN:dH2O:TFA) over the course of 25 minutes. The cleaved
product was quantified by detecting the UV absorbance at λ = 254 nm (capped/
uncapped amino acids and peptides) and at λ = 301 nm (Fmoc group). HPLC
chromatographs were analysed using Chromeleon 6.60 software and the retention time
of cleaved product was compared with known standards.
Equation 2. Percentage cleave product using Fmoc group obtained:
Fmoc cleaved (mmoles) = Peak Area (301nm)
Gradient (122.07)x Dilution factor
Mass of PEGA (g) = Mass of PEGA (g) x (% Weight loss ÷ 100) dry wet
Mass of PEGA (g) dry
Fmoc cleaved (mmoles) Fmoc cleaved (mmoles/g) =
% Cleaved product = Loading (mmoles/g)
x 100 Fmoc cleaved (mmoles/g)
3.3.2.7 Swelling
Potassium phosphate buffer at appropriate pH (ranging from 7.0 – 9.0) and ionic
strength (0.001M – 0.2 M) were prepared by serial dilution of the 1 M potassium mono-
and di-phosphate solutions in deionised water. Each buffer solution was adjusted to its
desired pH with HCl and NaOH using a pH meter. After SPPS, functionalised PEGA
particles (ionic and neutral) were thoroughly washed with dH2O to remove all traces of
MeOH and were then further washed with the appropriate buffer (at the required pH
and ionic strength). A small amount of functionalised PEGA particles (~ 50 mg) were
swollen in 3 mls of potassium phosphate buffer at the appropriate pH and ionic strength
for 5 minutes. With the aid of the SPOTCam software, photographic images were taken
using a camera coupled to a light microscope (at x10 magnification) of the swollen
functionalised PEGA particles and the diameters (mm) of 100 swollen particles were
measured using the SPOTCam software.

CHAPTER 3: Functionalisation of PEGA Particles
104
3.3.2.8 Statistics
Statistical analysis was carried out with the SPSS for Windows statistical package (SPSS
Inc., version 16.0). The parametric ANOVA test (one-way and three-way, full factorial)
was used to evaluate the statistical differences between: (1) the specificity of proteases in
relation to hydrolysing ECPs on the basis of charge under the influence of pH; and (2)
the diameter measurements of PEGA particles depending on both the pH and ionic
strength. For pair-wise comparisons, post-hoc tests (Tukey and Duncan) alongside a 2-
tailed paired t-test was conducted to determine which ECP or pH affected specificity of
each protease; or which diameters differed significantly from one another. Statistically a
significant difference was observed at the 95% confidence level in which values with p <
0.05 were considered significant and values with p > 0.05 were not significant.
3.4 RESULTS & DISCUSSION
3.4.1 FT-IR of PEGA particles
Since PEGA particles were commercially purchased (Polymer labs, UK) it was essential
to determine molecular structure of unmodified PEGA particles using Fourier-transform
infra-red (FTIR) spectroscopy. FTIR is a non-invasive technique that enables the
functional groups of molecules to be determined by a single beam of infra-red (IR)
through the sample (Faust 1992) in which the IR is absorbed within the electromagnetic
radiation region with a frequency ranging from 4000 – 400 cm-1 (Manning 2005). The
atoms of a molecular structure are in constant motion relative to each other, although the
atoms are linked by chemical bonds their positions are not fixed so during FTIR they are
subjected to several vibrations in which the absorbed IR radiation is converted into
energy of molecular vibrations as the bonds move from the lowest vibrational state to
the next highest due to the bending and stretching of bonds (Nakanishi 1964).
Unmodified PEGA particles were initially dried in a vacuum oven at ambient
temperature and then analysed by FTIR. Figure 22 displays the FTIR spectra of both
PEGA800 and PEGA1900 and the assigned functional groups (entries 1 – 15) are
summarised in table 11. The FTIR spectra of both PEGA800 and PEGA 1900 were found
to be the same and the intensity of some vibrations were weak especially within the

CHAPTER 3: Functionalisation of PEGA Particles
105
fingerprint region (< 1500 cm-1) and the functional region in the range of 3500 – 3100
cm-1 due to the overlap of various functional groups absorbing within the same IR region
(Furniss et al. 1989).
NH
O n
NHO
NHO
*
*
NH2
O
n
n
CH3
CH3
OO C
H2
CH
2
O CH3
xl
n
NH2
CH2
CH2 O
CH3
xl
3, 10
1, 2, 14
3, 6, 7, 10
15
9, 12
1, 2, 14, 5, 10
11, 12
3, 6, 7, 10
15
12, 13, 15
1, 4,
5, 11
10, 13
10, 13
3, 10, 13, 15
10
3, 6, 8
11
11 3, 6, 83, 6, 83, 6, 8
1, 4,
5, 11
1, 4,
5, 11
10
1, 4,
5, 11
99
9
9
11, 12
Figure 22. FTIR spectrum of unmodified PEGA(800 and 1900) particles (top) and the molecular structure of PEGA. Details of the assigned numbers are given in table 11.
The broad stretch ranging from 3500 – 3100 cm-1 was collectively the result of aliphatic
N–H stretches for both amines and amides (Furniss et al. 1989; Rubinson and Rubinson
2000; Simons 1978; Coates 2000). Within this range, the aliphatic vibration at 3344.2 cm-
1 (entry 1: figure 22, table 11) originated from two types of NH2 stretches: (1) a primary

CHAPTER 3: Functionalisation of PEGA Particles
106
amine i.e. >CH–NH2; and (2) a primary amide i.e. – C=O–NH2 (Coates 2000; Rubinson
and Rubinson 2000).
Table 11. Assignments of FTIR frequencies of unmodified PEGA(800 and 1900) particles.
Entry Wavenumber (cm-1) Functional Assignments
1 3344.2 N–H (aliphatic) stretch: 1o NH2 for amine (i.e. > CH–NH2) and amide (i.e. –C=O–NH2) including a 2o amide (i.e. –C=O-NH–R).
2 3204.8 N–H (aliphatic): 1o amine stretch; and 1o amide bend
3 2865.1 C–H (aliphatic) sym. stretch: CH2 and CH3
4 1662.8 C=O stretch (amide I band: 1o and 2o amides); scissoring NH2 (1o amide)
5 1545.7 N–H bend: amide II band (2o amides) and 1o amine (>CH–NH2)
6 1450.7 C–H (aliphatic) bend: scissoring of CH2 (i.e. CH2–C–O) and CH3 (asym.) deformation of C–CH3
7 1411.1 C–H (aliphatic) deformation adjacent to C–O (i.e. CH2–C–O)
8 1372.2 CH3 (sym.) deformation of C–CH3
9 1347.8 C–H (aliphatic) bend; wagging C–H amide bend; and an amine C–N
10 1298.6 CH2 (wagging and twisting); C–O stretch; C–C skeletal vibration; C–N amines
11 1248.8 N–H bend (amide III band); C–O (asym.) stretch of C–O–C
12 1089.9 C–O stretch (asym. and sym.); amine C–N stretch; C–C skeletal vibration
13 946.0 C–C stretch
14 844.3 N–H (oop) arising from NH2 twisting and wagging deformation
15 ~ 750 – 700 C–C backbone; (CH2)n rocking (where n < 4)
Abbreviations: 1o (primary); 2o (secondary); sym. (symmetrical); asym. (asymmetrical); bend a.k.a. deformation; amide I band (C=O stretch + C–N); amide II band (N-H in-plane bend + C–N stretch); amide III band (N–H bend + C–N/ C-C stretch + C=O in-plane bend); and oop (out-of-plane). This table was tailored together from: Kuptosov and Zhizhin 1998; Nakanishi 1964; Furniss et al. 1989; Smith 1999; Bellamy 1975; Faust 1992; Rubinson and Rubinson 2000; Coates 2000; Manning 2005; Ganim, et al. 2008.
Additionally, the vibration at 3204.8 cm-1 (entry 2: figure 22, table 11) were collectively
due to an amine N–H stretch and a primary amide N–H bend (Nakanishi 1964; Furniss
et al. 1989; Kuptosov and Zhizhin 1998). The N–H bend vibration of the primary amide
at 3204.8 cm-1 is sometimes referred to an ‘amide II’ or ‘amide A’ band (Manning 2005;
Kuptosov and Zhizhin 1998; Ganim et al. 2008) as indicated in table 12. In terms of
PEGA, the NH2 stretch of the primary amine corresponds to the free amine group that
is used to couple Fmoc-amino acids/ECPs via SPPS (as highlighted in green in figure
22); and the NH2 of primary amides arises from the polyacrylamide backbone (as
highlighted in red in figure 22).

CHAPTER 3: Functionalisation of PEGA Particles
107
An NH2 stretch is normally observed as a doublet consisting of two absorptions
indicating the asymmetrical and symmetrical stretches for both primary amines and
amides (Furniss et al. 1989; Simons 1978; Smith 1999). From figure 22 the asymmetrical
and symmetrical N–H stretches for primary amine were observed at 3344.2 cm-1 and
3204.8 cm-1, respectively (Nakanishi 1964; Furniss et al. 1989; Kuptosov and Zhizhin
1998; Coates 2000; Smith 1999). The asymmetrical N–H stretch for primary amide was
also observed at 3344.2 cm-1 (Kuptosov and Zhizhin 1998; Furniss et al. 1989) whereas
the symmetrical N-H stretch could not be distinguished within the range of 3500 – 3100
cm-1 because the N–H vibrations were weakly absorbed within this region due to the
overlap of other N–H (free or associate) groups such as an N–H (aliphatic) stretch of a
secondary amide i.e. –C=O–NH–R also absorbing at 3344.2 cm-1 (Furniss et al. 1989;
Nakanishi 1964; Smith 1999) including the N–H vibrations as previously mentioned.
Furthermore, N–H bend vibrations were observed: at 1545.7 cm-1 (entry 5: figure 22,
table 11) due to a secondary amide i.e. ‘amide II band’ and a primary amine i.e. >CH–
NH2 (Rubinson and Rubinson 2000); at 1248.8 cm-1 (entry 11: figure 22, table 11) was the
result of an ‘amide III band’ (Kuptosov and Zhizhin 1998; Nakanishi 1964). In terms of
amides, the composite conformations of the ‘amide II and III bands’ are discussed below
(see table 12). Finally, an out-of-plane N–H deformation arising from the twisting and
wagging of an NH2 was observed at 844.3 cm-1 (entry 14: figure 22, table 11; Furniss et al.
1989).
A combination of C–H stretches and bends were absorbed at several frequencies (entries
3, 6-10 and 15: figure 22, table 11) resulting from various C–H functional groups. A
medium C–H (symmetrical) stretch due to both CH2 and CH3 vibrations were
collectively observed at 2865.1 cm-1 (entry 3: figure 22, table 11); and since the absorption
was below 3000 cm-1 this confirmed that the molecular structure of PEGA was aliphatic
and not aromatic (Faust 1992; Rubinson and Rubinson 2000; Furniss et al. 1989;
Nakanishi 1964; Coates 2000). Within the fingerprint region, C–H bend vibrations
(weak) of CH2 and CH3 were further observed at frequencies ranging from 1475 cm-1–
1290 cm-1 (Rubinson and Rubinson 2000; Coates 2000) and at ~ 750 – 720 cm-1
(Nakanishi 1964) and these are now discussed. At 1450.7cm-1 (entry 6: figure 22, table 11)
a C–H deformation of a scissoring CH2 bend (Furniss et al. 1989); a C–H bend adjacent
to an C–O i.e. CH2–CO group at 1411.1 cm-1 (Furniss et al. 1989; Nakanishi 1964); a
wagging and twisting CH2 deformation at 1298.6 cm-1 (entry 10: figure 22, table 11); and

CHAPTER 3: Functionalisation of PEGA Particles
108
a rocking (CH2)n vibration was observed at ~750 – 720 cm-1 (entry 15: figure 22, table 11)
where n < 4 (Nakanishi 1964). Furthermore, CH3 has two deformations of a methyl-
carbon (i.e. C–CH3): the asymmetric vibration was observed at 1450.1 cm-1 (Furniss et al.
1989; Rubinson and Rubinson 2000) and the symmetric vibration at 1372.2 cm-1 (Bellamy
1975; Furniss et al. 1989; Rubinson and Rubinson 2000). Finally, a combination of an
aliphatic C–H bend alongside an amine C–N bend and a wagging C–H bend of an amide
were all observed at 1347.8 cm-1 (entry 9: figure 22, table 11).
Table 12. Types of conformational amide bands for FTIR frequencies.
Entry Type Wavenumber (cm-1) Functional groups
1 Amide A ~ 3300 N–H stretch
2 Amide B ~ 3080
3 Amide I 1700 – 1600 C=O stretch coupled with a C–N
4 Amide II ~ 3200; 1550 – 1450 N–H (in plane) bend coupled with an C–N stretch
5 Amide III 1350 – 1200; 1290 – 1230 N–H bend coupled with a C–N/ C–C stretch and a C=O bend
Note: the C=O and C–N groups are sometimes written as: C÷O and C÷N respectively. Source: Kuptosov and Zhizhin 1998; Manning 2005; Ganim et al. 2008; Nakanishi 1964.
The molecular structure of PEGA contains both primary (i.e. –C=O–NH2) and
secondary (i.e. –C=O–NHR) amides. Amides are characterised by the functional groups:
C=O, N–H, C–N, and C–C. When the vibrations of these functional groups combine
they tend to absorb within the same IR frequency and their combinations are commonly
characterised into various conformational bands: amide A, amide B, amide I, amide II
and amide III; in which table 12 summaries the distinction between these bands.
The ‘amide I band’ consisting predominantly of a C=O (carbonyl) vibration was strongly
absorbed at 1662.8 cm-1 (entry 4: figure 22, table 11) for both a primary and secondary
amides (Kuptosov and Zhizhin 1998; Nakanishi 1964; Furniss et al. 1989; Rubinson and
Rubinson 2000; Coates 2000; Manning 2005). A scissoring NH2 bend of an amide tends
to overlap and fall at the same frequency or as a shoulder upon the C=O stretch (Smith
1999). As mentioned previously, the N-H bend of secondary amide was absorbed at
1545.7 cm-1 (entry 5: figure 22, table 11) and it is normally expected to absorb at a lower
frequency than the a C=O group of an amide (Furniss et al. 1989) and is usually referred
to an ‘amide II band’ which is a complex vibration consisting of a scissoring N–H (in-
plane) bend strongly coupled with a C–N stretch (Bellamy 1975; Furniss et al. 1989;
CHAPTER 3: Functionalisation of PEGA Particles
109
Kuptosov and Zhizhin 1998; Ganim et al. 2008; Nakanishi 1964). Similarly, an ‘amide
III band’ was also observed at 1248.8 cm-1 (entry 11: figure 22, table 11) and this is
another complex vibration in which the N–H bend is coupled with a C=O bend along
with a C–N/ C–C stretch (Kuptosov and Zhizhin 1998; Manning 2005; Nakanishi 1964).
The amide I, II and III bands appear from the polyacrylamide backbone and the PEG
cross-links within the PEGA structure.
Due to the PEG crosslinks, a strong C–O (rocking) stretch of a symmetrical C–O–C was
observed at 1089.9 cm–1 (entry 12: figure 22, table 11; Nakanishi 1964; Kuptosov and
Zhizhin 1998; Coates 2000) whereas the asymmetrical C–O–C was observed at 1248.8
cm–1 (Furniss et al. 1989; Nakanishi 1964). As expected, the intensity of the C–O stretch
at 1089.9 cm–1 for PEGA1900 was slightly more than PEGA800 this is because PEGA1900
contains more PEG groups (note: the superscript refers to molecular weight of PEG).
Additionally, a C–O stretch was also observed at 1298.6 cm-1 (Rubinson and Rubinson
2000) and it was found to overlap with other functional groups as summarised in table 11
which have previously been discussed elsewhere within this section. Furthermore, C–N
(aliphatic) stretches of primary amine (R–NH2) were observed at 1298.6 cm-1 and 1089.9
cm-1 (Nakanishi 1964; Coates 2000); and finally, the C–C (skeletal/ backbone) vibrations
were observed at: 1089.9 cm-1 (Faust 1992), 946.0 cm-1 (Kuptosov and Zhizhin 1998) and
~750 – 720 cm-1 (Faust 1992).
3.4.2 Homogenous loading of solid-phase peptide synthesis
The combinational method, SPPS first described by Merrifield in 1963 (Merrifield 1963)
based on Fmoc chemistry (Carpino and Han 1972) was used to couple peptides (referred
to as ECPs in this thesis) to PEGA particles (Renil and Meldal 1995). Fmoc SPPS
involved the sequential coupling (sometimes referred as immobilisation) of Fmoc-amino
acids to PEGA particles followed by the de-protection of Fmoc group from the coupled
Fmoc-amino acid, these steps were repeated until the desired length of the ECP was
coupled to PEGA particles. The mechanism of Fmoc SPPS has previously been
illustrated by figure 18; and a list of all the ECPs studied within this thesis are given in
table 13 and the chemical structures of the ECPs have been illustrated previously in
figure 19.

CHAPTER 3: Functionalisation of PEGA Particles
110
O
O
O
O
NNH2
R1
O
O
OH
OH- H2O
NH
O
O
OHN
R1
O
H+
NN
R1
O
O
O
HN
N
R1
O
O
O
:
NN
R1
O
O
O
H
HO
H
NH2
O
O
H
NH2
OH
O
H+
N
R1
O
O
N
O
OO
O
N
O
OO
O
: :
O
O
OH
OH
HO
H
H
NH
O
O
N
R1
OOH
H+
H+
- H2O
(1) (2) (3)
(6)
Anhydrous
form
Hydrated form
(stable)
+
(5a)
+
(5c) stable anion
Hydrolyse
imine
Imine hydrolysis
continues
+
(7)
(8)
(4)
..
..
-
(5b)
Figure 23. Mechanism of ninhydrin with free amino groups on PEGA particles via imine formation. Ninhydrin has two forms: an anhydrous form (1) also known as 1,2,3-triketone and since the middle ketone is electron deficient ninhydrin is used as the hydrate form (2) which is also known as 1,2,3-indanetrione hydrate or triketohydrindene hydrate. The hydrate form of ninhydrin (2) reacts with the free amino groups within PEGA particles (3) to form the intermediate product (4) followed by a ketimine (5a) which stabilises by resonance to form a stabilised imine anion (5b) followed by a new imine (5c). This is then attacked by a water molecule to facilitate the hydrolysis of the imine producing a co-intermediate product (6) and the amine (7). The latter is stabilised by resonance and subsequently the condensation of the free amino group of the amine (7) with another ninhydrin molecule (2) forms the Ruhemann’s purple-blue dye (8). Adapted from Bailey 1990; Sabationo et al. 2004; Friedman 2004).
During each step of the SPPS, the Kaiser test (Kaiser et al. 1970) was used as a rapid
straightforward colorimetric test to monitor the successful completion for both the
coupling and de-protection steps. The mechanism of the Kaiser test (figure 23) involved
the reaction of ninhydrin (hydrate form) with the free amino groups (NH2) of either
amino acids or amines via imine formation to form a purple-blue adduct commonly
referred to as the Ruhemann's purple dye (Bailey 1990; Sabationo et al. 2004; Friedman
2004). The development of the Ruhemann's purple dye normally observed as an intense
blue colour gave a positive Kaiser test indicating both the successful de-protection of the
Fmoc group and an incomplete coupling step; while the coupling of amino acids to

CHAPTER 3: Functionalisation of PEGA Particles
111
completion gave a negative test as a yellow colour was observed (Bailey 1990; Sabationo
et al. 2004; Mergler and Durieux 2005).
Figure 24. Colorimetric observations of the Kaiser test. A positive test is observed when Ruhemann’s purple-blue adduct forms, the PEGA particles are stained blue whereas the solution remains clear which indicates the presence of free amino groups (a, c); and a negative test is observed when the blue adduct is not formed, the PEGA particles remain clear and the solution remains yellow and this indicates the formation of an amide bond (b). Unmodified PEGA particles are used as a standard (a) in reference to modified PEGA particles (b, c).
Figure 24 demonstrates the results observed from the Kaiser test in which unmodified
PEGA particles were always used as a reference standard as the unmodified PEGA
particles contains free NH2 groups therefore the Ruhemann’s blue colour was always
observed (figure 24a). Coupling of an amino acid to completion involved forming an
amide bond and this resulted in a negative test in which a yellow colour was observed
(figure 24b); whereas the de-protection of an Fmoc group gave an incomplete coupling
step and this resulted in obtaining a positive test due to the development of the
Ruhemann’s blue colour (figure 24c). It is worth nothing that upon tilting of the vials
containing the PEGA particles soaked within the Kaiser solutions as expected for the
positive test the particles were found to stain blue colour and the surrounding solution
remained clear; whereas in the presence of an amide bond (after successfully coupling an
amino acid to PEGA particles) the particles remained clear and the colour of the
surrounding solution remained yellow.
It was essential to maintain the same loading of amine groups between each of the
coupling/ de-protecting steps during SPPS and in order to achieve homogenous loading
of the amine groups throughout SPPS double coupling of Fmoc-amino acids to PEGA
particles was carried out and in each case the Kaiser test constantly relieved a yellow
colour indicating complete coupling of the amino acid. To quantify the loading of amine
(a) (b) (c)

CHAPTER 3: Functionalisation of PEGA Particles
112
functional groups of PEGA particles per gram, the de-protected Fmoc groups were
collected during SPPS and analysed by UV–Visible spectroscopy to determine the
concentration of Fmoc loading per gram of PEGA particles. As a maximum of three
amino acids were coupled to PEGA particles to form an ECP consisting of an Fmoc-
tripeptide sequence, this meant that the de-protected Fmoc groups of the first two amino
acids coupled to PEGA particles were only quantified.
The manufacturer (Polymer labs) reported PEGA800 and PEGA1900 to have a loading of
0.4 mmol/g and 0.2 mmol/g, respectively. The average loading was calculated in the
range of 0.47 – 0.33 mmol/g for of PEGA800 particles; and 0.15 – 0.18 mmol/g for
PEGA1900 particles. Other researchers have also reported variations of loading between
different batches (Ulijn et al. 2003a) and consequently the loading calculation was
repeated for every fresh batch of unmodified PEGA particles functionalised with any
given ECPs to obtain an accurate loading for that particular batch of functionalised
PEGA particles. Additionally, the loading measurements are expected to vary in contrast
to manufacturer’s loading because it is possible that the loading measurements are done
under separate conditions since there are various methods available to calculate the Fmoc
loading on a polymeric support (Sabationo et al. 2004; Cin et al. 2002).
3.4.3 Isoelectric point of elastases
A protease exhibits a net charge of zero when the pH equals the pI value (Stryer et al.
2002) however the charge of the protease can vary when the pH of the surrounding
environment is above and below the pI value. In the literature, confusion arose to the
exact isoelectric point (pI) of elastase i.e. PPE as it was reported to have a pI > 8 – 11
(Travis 1988; Barrett et al. 2004; Worthington Limited). To overcome this issue, several
attempts were carried out to determine the pI value of PPE using isoelectric focusing
(IEF), an experimental technique that separates proteins according to their net isoelectric
charge. Initially PPE was dissolved in sample buffer of lameali buffer and after
separation it was observed that the separation was poor for the standards. Although, the
sample buffer of lameali buffer is appropriate for SDS-page, it is not appropriate for iso-
electric focusing. Since PPE could dissolved in deionised water, the separation was
repeated and after silver nitrate staining the separation was found to be poor for both
standards and PPE. Next, attempts were carried out to dissolve PPE in CHAPS to

CHAPTER 3: Functionalisation of PEGA Particles
113
improve the separation; and again after silver nitrate staining the separation was found to
be poor for both standards and PPE. As IEF was not successful and time consuming it
was abandoned.
.
(a) Primary sequence for 3est (PPE, EC 3.4.21.36)
(b) pI value of 3est (PPE, EC 3.4.21.36)
-40
-30
-20
-10
0
10
20
30
0 2 4 6 8 10 12 14 16
pH
Charge
Figure 25. Total net charge of elastase specifically PPE (EC 3.4.21.36) within the pH range of 1 – 14. The primary sequence (3est) of PPE (a) was entered into pI calculator and was used to plot the total net charge of PPE over pH 1 – 14 (b). The overall net charge i.e. pI value was predicted as 8.31; meaning that PPE bears a positive charge below pH 8.31 and a negative charge above pH 8.31 (b). For source refer to reference list under the headings: 3est and pI calculator (chapter 7).
Successfully, the pI value of PPE was determined using a pI calculator in which figure 25
depicts the total net charge of the primary sequence, 3est for elastase i.e. PPE (EC
3.4.1.36) over the pH range of 1 – 14. From figure 25, the pI of PPE was predicted as
8.31; this meant that PPE bears a positive charge below pH 8.31 and a negative charge
above pH 8.31 as summarised by figure 25b. Thermolysin was used as a control enzyme
in this chapter and in the literature the isoelectric point (pI) of thermolysin was found to
be 4.97 (Miki et al. 1996). Thermolysin bears a positive charge below pH 4.97 and a
negative charge above pH 4.97. In this thesis, the pH of sample fluids were examined in
the range of pH 6.0 – 9.0 meaning that PPE was studied both in its cationic/ anionic
forms, whereas thermolysin was only studied in its anionic form. For the remaining
VVGGTEAQRNSWPSQISLQYRSGSSWAHTCGGTLIRQNWVMTAAHCVDRELTFRVVVGEHNLNQNNGTEQYVGVQKIVVHPYWNTDDVAAGYDIALLRLAQSVTLNSYVQLGVLPRAGTILANNSPCYITGWGLTRTNGQLAQTLQQAYLPTVDYAICSSSSYWGSTVKNSMVCAGGDGVRS
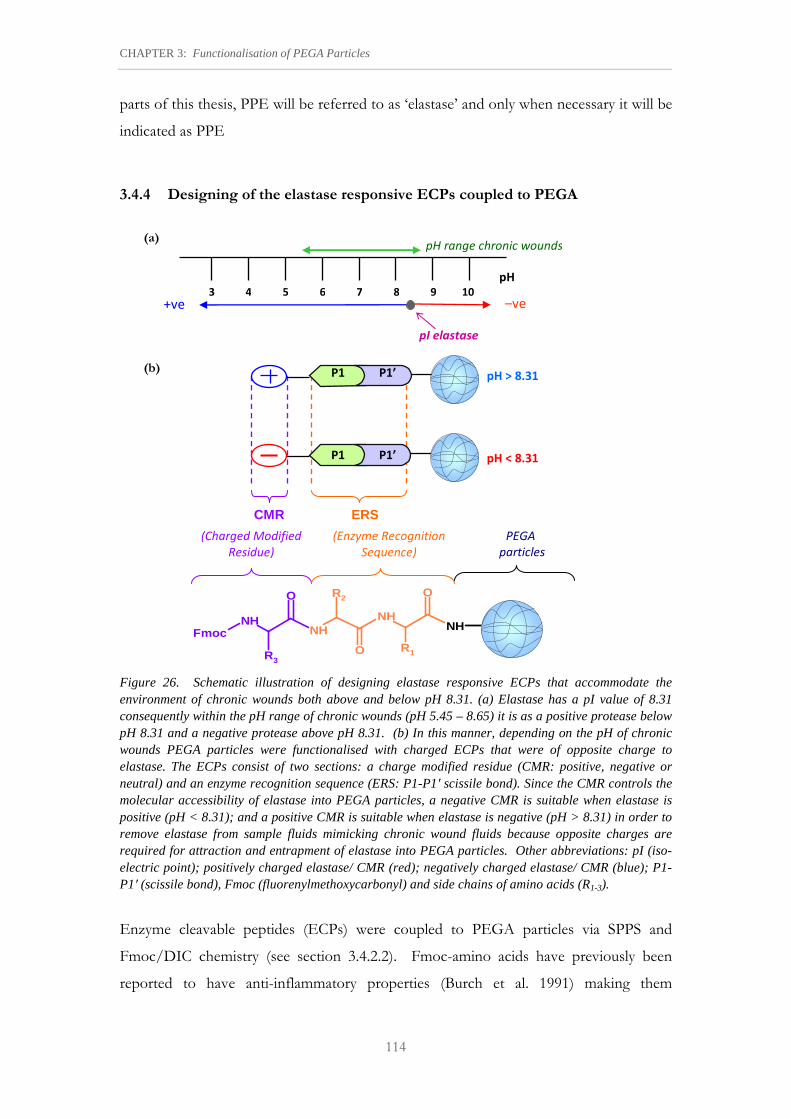
CHAPTER 3: Functionalisation of PEGA Particles
114
parts of this thesis, PPE will be referred to as ‘elastase’ and only when necessary it will be
indicated as PPE
3.4.4 Designing of the elastase responsive ECPs coupled to PEGA
(a)
(b)
Figure 26. Schematic illustration of designing elastase responsive ECPs that accommodate the environment of chronic wounds both above and below pH 8.31. (a) Elastase has a pI value of 8.31 consequently within the pH range of chronic wounds (pH 5.45 – 8.65) it is as a positive protease below pH 8.31 and a negative protease above pH 8.31. (b) In this manner, depending on the pH of chronic wounds PEGA particles were functionalised with charged ECPs that were of opposite charge to elastase. The ECPs consist of two sections: a charge modified residue (CMR: positive, negative or neutral) and an enzyme recognition sequence (ERS: P1-P1′ scissile bond). Since the CMR controls the molecular accessibility of elastase into PEGA particles, a negative CMR is suitable when elastase is positive (pH < 8.31); and a positive CMR is suitable when elastase is negative (pH > 8.31) in order to remove elastase from sample fluids mimicking chronic wound fluids because opposite charges are required for attraction and entrapment of elastase into PEGA particles. Other abbreviations: pI (iso-electric point); positively charged elastase/ CMR (red); negatively charged elastase/ CMR (blue); P1-P1′ (scissile bond), Fmoc (fluorenylmethoxycarbonyl) and side chains of amino acids (R1-3).
Enzyme cleavable peptides (ECPs) were coupled to PEGA particles via SPPS and
Fmoc/DIC chemistry (see section 3.4.2.2). Fmoc-amino acids have previously been
reported to have anti-inflammatory properties (Burch et al. 1991) making them
pH > 8.31
CMR ERS
FmocNH
NHNH
NH
O
O
OR2
R1R3
P1 P1’
P1 P1’
(Charged Modified
Residue)
(Enzyme Recognition
Sequence)
PEGA
particles
pH < 8.31
pI elastase
pH range chronic wounds
3 4 5 6 8 9 7 10
pH
+ve –ve

CHAPTER 3: Functionalisation of PEGA Particles
115
potentially interesting for designing ECPs in the context of generating a hydrogel wound
dressing.
The ECPs consisted of two sections: a charged modified residue (CMR) and an enzyme
recognition sequence (ERS) as schematically illustrated by figure 26. The CMR behaves
as the actuator and its function was to control the attraction and hence the accessibility
of the target protease into the interior of the PEGA particles depending on the ionic
strength and pH of sample fluids. The CMR attracts a target protease of opposite charge
(depending on its pI value) to its own charge. In terms of ionic strength, both the
positive and negative CMRs (achieved by Fmoc-Arg(+) and Fmoc-Glu(-) respectively)
increase the swelling hence the molecular accessibility into PEGA particles compared to
the neutral CMR (i.e. Fmoc-Gly) as discussed below (i.e. selective hydrolysis of ECPs by
proteases including swelling analysis). The ERS behaves as the cleavable substrate
containing the P1-P1′ scissile bond (figure 26b) that is specifically recognised and
selectively cleaved by the target protease.
Table 13. ECPs coupled to PEGA particles.
ECP Entry CMR ERS
Length of ECP
Overall charge
Abbreviations
1 n/a Ala – Ala Ala – Ala
2 n/a Gly – Gly Di-peptide Uncharged Gly – Gly
3 n/a Phe – Phe Phe – Phe
4 Arg(+) Positive RAA
5 Glu(–) Ala – Ala Negative EAA
6 Gly Tri-peptide Neutral GAA
7 Arg(+) Positive RFF
8 Glu(–) Phe – Phe Negative EFF
9 Gly Neutral GFF
10 Arg(+) Positive RA
11 Glu(–) Ala Di-peptide Negative EA
12 Gly Neutral GA
Other abbreviations: ECP (enzyme cleavable peptides); CMR (charge modified residue); ERS (enzyme-recognition sequence); n/a (not applicable). Entries 1-3 and 10 – 12 (Fmoc-dipeptide-PEGA particles); and entries 4 – 9 (Fmoc-tripeptide-PEGA particles).

CHAPTER 3: Functionalisation of PEGA Particles
116
As encountered in chapter 2, chronic wounds are said to have a pH within the range of
5.45 – 8.65 (Dissemond et al. 2003) and previously we encountered that elastase
(specifically PPE) has a pI value of 8.31; in this manner, ionic ECPs of both positive and
negative charges can be considered to accommodate a hydrogel dressing that would be
suitable for the entire pH range of chronic wounds in response to both the cationic/
anionic forms of elastase which is schematically summarised by figure 26. A list of all the
ECPs used to functionalise PEGA particles within this thesis are tabulated in table 13.
From table 13: the uncharged Fmoc-dipeptide-PEGA particles (entries 1-3) were utilised
to determine the ERS in response to elastase; the Fmoc-tripeptide-PEGA particles with
the Fmoc-X-Ala-Ala-PEGA configuration (entries 4 – 6) and the Fmoc-dipeptide-PEGA
particles with the Fmoc-X-Ala-PEGA configuration (entries 10 – 12) were used to
determine the bond specificities of thermolysin and elastase by the selective preference
of cleaving ECPs under the influence of charge depending on pH. The Fmoc-tripeptide-
PEGA particles with the configurations: Fmoc-X-Ala-Ala-PEGA (entries 4 – 6) and
Fmoc-X-Phe-Phe-PEGA (entries 7 – 9) were exploited to study the swelling behaviour
of these particles under the influence of pH and ionic strength. The X residue within the
following configurations: Fmoc-X-Ala-Ala-PEGA, Fmoc-X-Phe-Phe-PEGA and Fmoc-
X-Ala-PEGA (entries 4 – 12) is the CMR. As it can be seen from table 13, the ionic
CMR consisted of two different amino acids: an arginine residue (Arg(+)) or a glutamic
acid residue (Glu(–)) to respectively maintain an overall positive (table 13: entries 4, 7 and
10) or negative charge (table 13: entries 5, 8 and 11) of the ECP coupled to PEGA
particles. In contrast, the neutral PEGA particles contained an uncharged CMR which
was maintained by a glycine residue (Gly; table 13: entries 6, 9 and 12). For simplicity, all
the functionalised PEGA particles (including their ECPs) studied within this thesis are
abbreviated according to the ECPs coupled to PEGA particles as given in table 13 (i.e.
the last column on the right hand side).
3.4.4.1 Selective design of the ERS responsive to elastase
In the literature, the specificity of elastase has been reported to cleave substrates
containing small, neutral and hydrophobic amino acid residues such as alanine and
glycine in the P1 position (Stryer 1995; Purich and Allison 2002) with the preference of
cleaving the di-alanine bond (Ala-Ala) more readily and does not recognise or cleave
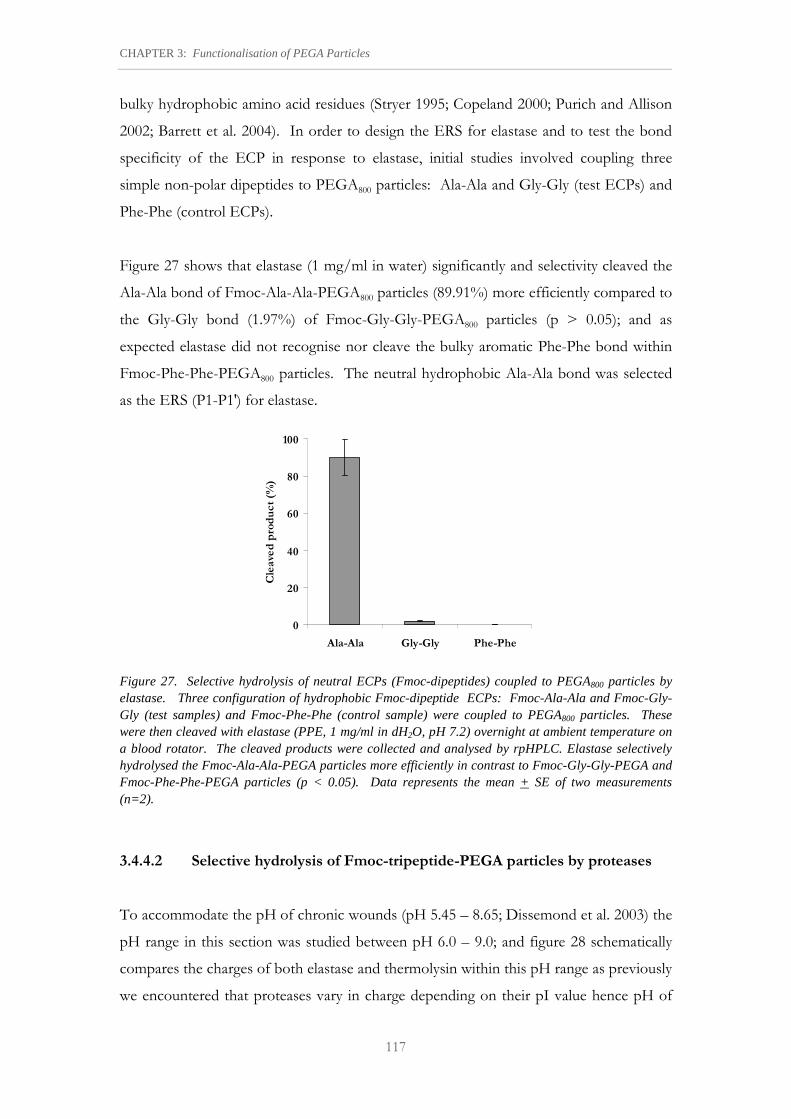
CHAPTER 3: Functionalisation of PEGA Particles
117
bulky hydrophobic amino acid residues (Stryer 1995; Copeland 2000; Purich and Allison
2002; Barrett et al. 2004). In order to design the ERS for elastase and to test the bond
specificity of the ECP in response to elastase, initial studies involved coupling three
simple non-polar dipeptides to PEGA800 particles: Ala-Ala and Gly-Gly (test ECPs) and
Phe-Phe (control ECPs).
Figure 27 shows that elastase (1 mg/ml in water) significantly and selectivity cleaved the
Ala-Ala bond of Fmoc-Ala-Ala-PEGA800 particles (89.91%) more efficiently compared to
the Gly-Gly bond (1.97%) of Fmoc-Gly-Gly-PEGA800 particles (p > 0.05); and as
expected elastase did not recognise nor cleave the bulky aromatic Phe-Phe bond within
Fmoc-Phe-Phe-PEGA800 particles. The neutral hydrophobic Ala-Ala bond was selected
as the ERS (P1-P1′) for elastase.
0
20
40
60
80
100
Ala-Ala Gly-Gly Phe-Phe
Cleaved product (%
)
Figure 27. Selective hydrolysis of neutral ECPs (Fmoc-dipeptides) coupled to PEGA800 particles by elastase. Three configuration of hydrophobic Fmoc-dipeptide ECPs: Fmoc-Ala-Ala and Fmoc-Gly-Gly (test samples) and Fmoc-Phe-Phe (control sample) were coupled to PEGA800 particles. These were then cleaved with elastase (PPE, 1 mg/ml in dH2O, pH 7.2) overnight at ambient temperature on a blood rotator. The cleaved products were collected and analysed by rpHPLC. Elastase selectively hydrolysed the Fmoc-Ala-Ala-PEGA particles more efficiently in contrast to Fmoc-Gly-Gly-PEGA and Fmoc-Phe-Phe-PEGA particles (p < 0.05). Data represents the mean + SE of two measurements (n=2).
3.4.4.2 Selective hydrolysis of Fmoc-tripeptide-PEGA particles by proteases
To accommodate the pH of chronic wounds (pH 5.45 – 8.65; Dissemond et al. 2003) the
pH range in this section was studied between pH 6.0 – 9.0; and figure 28 schematically
compares the charges of both elastase and thermolysin within this pH range as previously
we encountered that proteases vary in charge depending on their pI value hence pH of
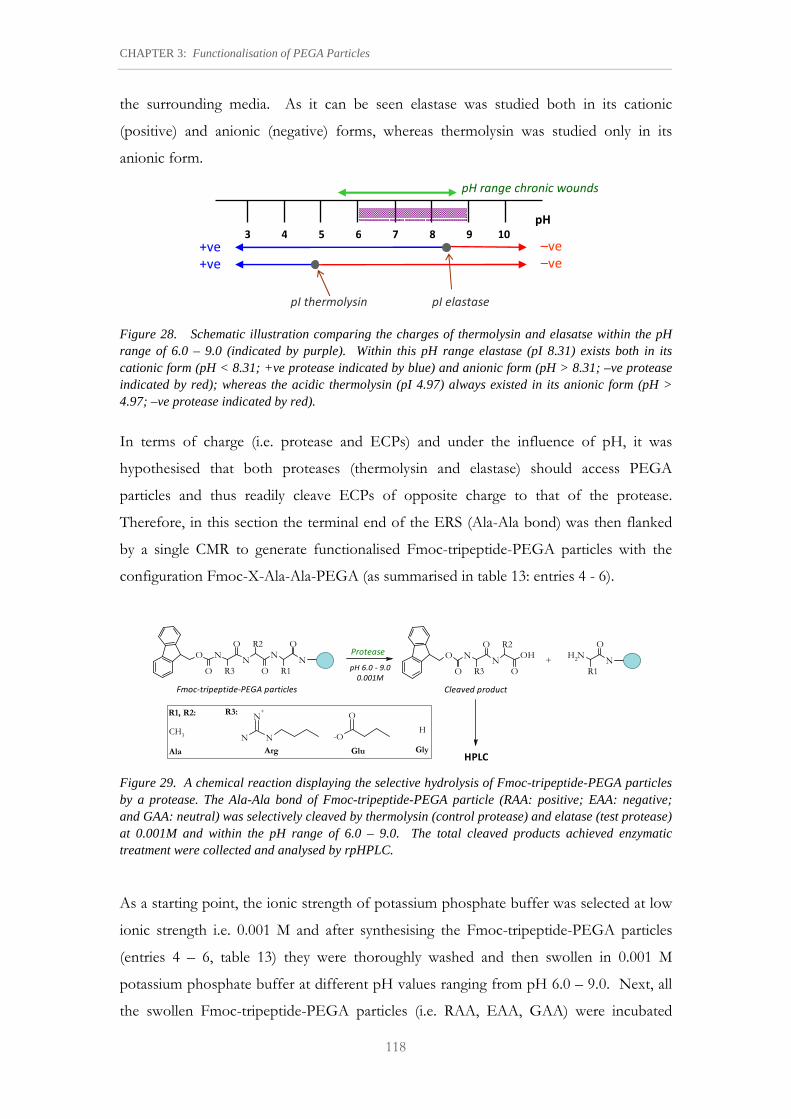
CHAPTER 3: Functionalisation of PEGA Particles
118
the surrounding media. As it can be seen elastase was studied both in its cationic
(positive) and anionic (negative) forms, whereas thermolysin was studied only in its
anionic form.
Figure 28. Schematic illustration comparing the charges of thermolysin and elasatse within the pH range of 6.0 – 9.0 (indicated by purple). Within this pH range elastase (pI 8.31) exists both in its cationic form (pH < 8.31; +ve protease indicated by blue) and anionic form (pH > 8.31; –ve protease indicated by red); whereas the acidic thermolysin (pI 4.97) always existed in its anionic form (pH > 4.97; –ve protease indicated by red).
In terms of charge (i.e. protease and ECPs) and under the influence of pH, it was
hypothesised that both proteases (thermolysin and elastase) should access PEGA
particles and thus readily cleave ECPs of opposite charge to that of the protease.
Therefore, in this section the terminal end of the ERS (Ala-Ala bond) was then flanked
by a single CMR to generate functionalised Fmoc-tripeptide-PEGA particles with the
configuration Fmoc-X-Ala-Ala-PEGA (as summarised in table 13: entries 4 - 6).
O NN
N
O R3
O R2
ON
R1
OO N
NOH
O R3
O R2
ON
R1
ONH2+
Protease
HPLC
Fmoc-tripeptide-PEGA particles Cleaved product
pH 6.0 - 9.0
0.001M
Figure 29. A chemical reaction displaying the selective hydrolysis of Fmoc-tripeptide-PEGA particles by a protease. The Ala-Ala bond of Fmoc-tripeptide-PEGA particle (RAA: positive; EAA: negative; and GAA: neutral) was selectively cleaved by thermolysin (control protease) and elatase (test protease) at 0.001M and within the pH range of 6.0 – 9.0. The total cleaved products achieved enzymatic treatment were collected and analysed by rpHPLC.
As a starting point, the ionic strength of potassium phosphate buffer was selected at low
ionic strength i.e. 0.001 M and after synthesising the Fmoc-tripeptide-PEGA particles
(entries 4 – 6, table 13) they were thoroughly washed and then swollen in 0.001 M
potassium phosphate buffer at different pH values ranging from pH 6.0 – 9.0. Next, all
the swollen Fmoc-tripeptide-PEGA particles (i.e. RAA, EAA, GAA) were incubated
CH3
Ala
N N
N+
Arg
-O
O
Glu
H
Gly
R1, R2: R3:
pI elastase
pH range chronic wounds
3 4 5 6 8 9 7 10
pH
+ve –ve
+ve –ve
pI thermolysin

CHAPTER 3: Functionalisation of PEGA Particles
119
with thermolysin and elastase (0.1 mg/ml) in potassium phosphate buffer (0.001M) at the
appropriate pH (as indicated). The total cleaved product(s) for each functionalised
PEGA particles were collected and analysed by rpHPLC (as schematically summarised by
figure 29).
(a) (b)
0
20
40
60
80
100
RAA EAA GAA
PEGA800
Cleaved product (%)
0
20
40
60
80
100
RAA EAA GAA
PEGA1900
Cleaved product (%
)
(c) (d)
0
20
40
60
80
100
RAA EAA GAA
PEGA800
Cleaved product (%
)
0
20
40
60
80
100
RAA EAA GAA
PEGA1900
Cleaved product (%
)
pH 6.0 pH 6.5 pH 7.0 pH 7.5 pH 8.0 pH 8.5 pH 9.0
Figure 30. Selective hydrolysis of Fmoc-X-Ala-Ala-PEGA(800,1900) particles by thermolysin and elastase under the influence of pH. PEGA800 (a, c) and PEGA1900 (b, d) particles were functionalised with positive (RAA), negative (EAA) and neutral (GAA) ECPs to generate Fmoc-X-Ala-Ala-PEGA particles (where X (CMR): Arg(+); Glu(-); Gly). These particles were treated with 0.1 mg/ml of both thermolysin (a, b) and elastase (c, d) within the pH range of 6.0 – 9.0 in 0.001M potassium phosphate buffer, overnight on a blood rotator at 34oC. The cleaved products were collected and analysed by rpHPLC. Under the influence of pH, thermolysin bears a negative charge (pH > 4.97) and had a high preference to cleave RAA more compared to EAA and GAA for both PEGA800 (a) and PEGA1900 (b); whereas elastase selectively cleaved EAA more compared to RAA and GAA for both PEGA800 (c) and PEGA1900 (d). Interestingly, for the negative ECP (EAA): elastase activity increased when elastase was positively charged between pH 6.0 – 8.0; on the contrary when elastase became negative (pH > 8.31) a decrease in elastase activity was observed for EAA of both PEGA800 and PEGA1900 particles (c-d, respectively) and an increase in elastase activity was observed for RAA (PEGA1900 particles, d). Statistical analysis was conducted using ANOVA and pair-wise comparisons were conducted by post hoc: Tukey and Duncan test: a significant difference observed at the 95% confidence level (p > 0.05). Data represents the mean + SE of four measurements (n=4).
0
5
10
15
20
RAA EAA GAACleaved product (%
)
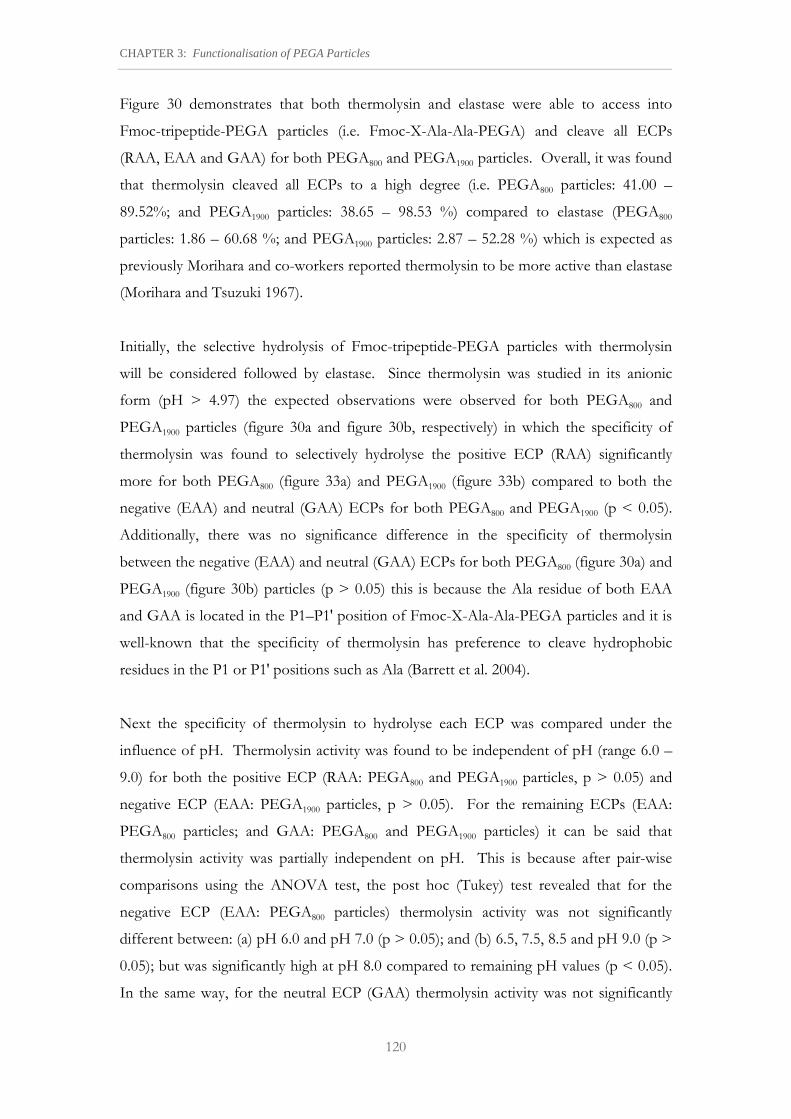
CHAPTER 3: Functionalisation of PEGA Particles
120
Figure 30 demonstrates that both thermolysin and elastase were able to access into
Fmoc-tripeptide-PEGA particles (i.e. Fmoc-X-Ala-Ala-PEGA) and cleave all ECPs
(RAA, EAA and GAA) for both PEGA800 and PEGA1900 particles. Overall, it was found
that thermolysin cleaved all ECPs to a high degree (i.e. PEGA800 particles: 41.00 –
89.52%; and PEGA1900 particles: 38.65 – 98.53 %) compared to elastase (PEGA800
particles: 1.86 – 60.68 %; and PEGA1900 particles: 2.87 – 52.28 %) which is expected as
previously Morihara and co-workers reported thermolysin to be more active than elastase
(Morihara and Tsuzuki 1967).
Initially, the selective hydrolysis of Fmoc-tripeptide-PEGA particles with thermolysin
will be considered followed by elastase. Since thermolysin was studied in its anionic
form (pH > 4.97) the expected observations were observed for both PEGA800 and
PEGA1900 particles (figure 30a and figure 30b, respectively) in which the specificity of
thermolysin was found to selectively hydrolyse the positive ECP (RAA) significantly
more for both PEGA800 (figure 33a) and PEGA1900 (figure 33b) compared to both the
negative (EAA) and neutral (GAA) ECPs for both PEGA800 and PEGA1900 (p < 0.05).
Additionally, there was no significance difference in the specificity of thermolysin
between the negative (EAA) and neutral (GAA) ECPs for both PEGA800 (figure 30a) and
PEGA1900 (figure 30b) particles (p > 0.05) this is because the Ala residue of both EAA
and GAA is located in the P1–P1′ position of Fmoc-X-Ala-Ala-PEGA particles and it is
well-known that the specificity of thermolysin has preference to cleave hydrophobic
residues in the P1 or P1′ positions such as Ala (Barrett et al. 2004).
Next the specificity of thermolysin to hydrolyse each ECP was compared under the
influence of pH. Thermolysin activity was found to be independent of pH (range 6.0 –
9.0) for both the positive ECP (RAA: PEGA800 and PEGA1900 particles, p > 0.05) and
negative ECP (EAA: PEGA1900 particles, p > 0.05). For the remaining ECPs (EAA:
PEGA800 particles; and GAA: PEGA800 and PEGA1900 particles) it can be said that
thermolysin activity was partially independent on pH. This is because after pair-wise
comparisons using the ANOVA test, the post hoc (Tukey) test revealed that for the
negative ECP (EAA: PEGA800 particles) thermolysin activity was not significantly
different between: (a) pH 6.0 and pH 7.0 (p > 0.05); and (b) 6.5, 7.5, 8.5 and pH 9.0 (p >
0.05); but was significantly high at pH 8.0 compared to remaining pH values (p < 0.05).
In the same way, for the neutral ECP (GAA) thermolysin activity was not significantly

CHAPTER 3: Functionalisation of PEGA Particles
121
different between (a) pH 6.0 – 8.0 (p > 0.05) and (b) pH 8.5 – 9.0 (p > 0.05) for
PEGA800 particles (figure 30a); whereas thermolysin activity for PEGA1900 particles was
not significantly different between (a) pH 6.0 – 8.5 (p > 0.05) and (b) pH 6.5 – 9.0 (p >
0.05; figure 30b). This is due to the Ala residues of the ERS because it has previously
been reported that the specificity of thermolysin is independent of pH when an
hydrophobic Ala residue is located either in the P1 or P2 positions of a given substrate
(Murakami et al. 2001) such as Fmoc-X-Ala-Ala which is the configuration of all ECPs
(RAA, EAA, GAA) within this section.
Finally, the yields of the cleaved products were not significantly different between
PEGA800 and PEGA1900 particles for each ECP (RAA, EAA and GAA) which shows that
the accessibility of thermolysin into PEGA800 and PEGA1900 particles was significantly
similar for each type of Fmoc-tripeptide-PEGA particles i.e. RAA, EAA, GAA (p >
0.05).
Next, the effect of elastase was studied for both PEGA800 and PEGA1900 particles (figure
30c and figure 30d, respectively) and elastase had a high specificity to selectively
hydrolyse the negatively charged ECP (EAA: PEGA800 7.65 – 60.68 % and PEGA1900
7.39 – 52.50 %) significantly more compared to both the positive ECP (RAA: PEGA800
2.36 – 5.36 % and PEGA1900 2.87 – 14.27 %) and the neutral ECP (GAA: PEGA800 1.86
– 11.46 % and PEGA1900 2.77 – 6.07 %) over the pH range of 6.0 – 9.0 (p < 0.05).
Previously, another study reported that human elastase (i.e. NE) had a high affinity for
negatively charged substrates because the surface of NE contains Arg residues on one
side of its surface (Watorek et al. 1991). As previously mentioned, PPE has 40%
homology to NE and correspondingly the native primary sequence of PPE has been
reported to have 22 nominal basic sites constituting of 12 Arg, 6 His, 3 Lys residues
including the N-terminus (Hogan and McLuckey 2003). Interestingly, under the
influence of pH this means that Glu(-) residue of the negative ECP for EAA particles
would ion pair with the amine of the Arg, His and Lys side chains on the surface of
elastase i.e. PPE in its cationic form (pH < 8.31). Likewise, the native primary sequence
of PPE contains 12 negative sites comprising of 8 Asp and 3 Glu residues including the
C-terminus (Hogan and McLuckey 2003) therefore the Arg(+) residue of the positive ECP
for RAA particles would ion pair with the carboxyl groups of both the Asp and Glu side
chains on the surface of elastase i.e. PPE in its anionic form (pH < 8.31).

CHAPTER 3: Functionalisation of PEGA Particles
122
Consequently, when comparing the pH activity of elastase to hydrolyse each ECP, the
specificity of elastase was found to be dependant on pH for the charged ECPs (i.e. EAA:
PEGA800 and PEGA1900 particles; and RAA: PEGA1900 particles only). Here, as expected
the specificity of elastase in its cationic form (pH < 8.31) selectively cleaved the negative
ECP (EAA) significantly more for both PEGA800 (i.e. 7.65 – 60.69 %, figure 30c) and
PEGA1900 (i.e. 45.84 – 52.28%, figure 30d) compared to the positive ECP (RAA) for
both PEGA800 (i.e. 7.65 – 60.69 %, figure 30c) and PEGA1900 (i.e. 45.84% – 52.28%,
figure 30d) particles within the pH range of 6.0 – 7.5 (p < 0.05). Quite the opposite,
when elastase was in its anionic form (pH > 8.31), elastase activity was found to decrease
from pH 8.5 – 9.0 for negative ECP (EAA: PEGA800 i.e. 23.95% – 20.74 %, figure 30c
and PEGA1900 i.e. 9.44 – 7.39, figure 30d) whereas for the positive ECP (RAA) it was
found to increase from pH 8.5 – 9.0 for PEGA1900 particles (i.e. 11.28% – 14.27%). In
contrast, elastase activity was significantly independent of pH for the neutral ECP (GAA)
for both PEGA800 and PEGA1900 particles; including the positive ECP (RAA) only for
PEGA800 particles (p > 0.05; figure 30c-d). This shows that the molecular accessibility of
elastase into positive PEGA particles (RAA) was more suitable for PEGA1900 particles
compared to PEGA800 particles.
3.4.4.3 Selective hydrolysis of the CMR from Fmoc-tripeptide-PEGA particles by proteases
When the HPLC separation of the total cleaved products for Fmoc-tripeptide-PEGA
particles as studied in section 3.4.4.3 were carefully looked at, it was found that both
thermolysin and elastase had the ability to cleave at the carboxyl end of the CMR for all
Fmoc-tripeptide ECPs i.e. Fmoc-X~Ala-Ala (Note: ~ indicates the cleaving site; R~AA,
E~AA, G~AA) and the data is summarised by figure 31. Figure 31, shows that
thermolysin had the ability to selectively cleave the Glu(-) and Gly CMRs more compared
to the Arg(+) CMR for both PEGA800 and PEGA1900 particles. In contrast, elastase was
found to selectively cleave the Glu(-) CMR more compared to both the Arg(+) and Gly
CMRs.
Just like the previous section (3.4.43), the specificity of thermolysin to cleave the CMR
was found to be independent of pH. Over the pH range of 6.0 – 9.0, thermolysin was
found to cleave the: Arg(+) residue by 0.39 – 0.69 % (PEGA800) and 18.03 – 25.82 %
(PEGA1900); Glu(-) residue by 21.70 – 54.84 % (PEGA800) and 37.96 – 58.36 %

CHAPTER 3: Functionalisation of PEGA Particles
123
(PEGA1900); and Gly residue by 40.23 – 74.09 % (PEGA800) and 38.34 – 48.80 %
(PEGA1900). When the cleaved product of the CMR for each ECP (figure 31) was
compared with the total cleaved product of each ECP (figure 30) for both PEGA800 and
PEGA1900: the selective cleaving of the Arg(+) and Glu(–) residues from Fmoc-X~Ala-Ala
by thermolysin were significantly lower compared to the total cleaved product for RAA
and EAA (p < 0.05). In contrast, the selective cleaving of the Gly residue from Fmoc-
X~Ala-Ala by thermolysin was not significantly different to the total cleaved product for
GAA (p > 0.05).
(a) (b)
0
20
40
60
80
100
RAA EAA GAA
PEGA800
Cleaved product (%)
0
20
40
60
80
100
RAA EAA GAA
PEGA1900
Cleaved product (%
)
(c) (d)
0
20
40
60
80
100
RAA EAA GAA
PEGA800
Cleaved product (%
)
0
20
40
60
80
100
RAA EAA GAA
PEGA1900
Cleaved product (%
)
pH 6.0 pH 6.5 pH 7.0 pH 7.5 pH 8.0 pH 8.5 pH 9.0
Figure 31. Selective hydrolysis of the CMR from Fmoc-X-Ala-Ala-PEGA(800,1900) particles by thermolysin and elastase. PEGA800 (a, c) and PEGA1900 (b, d) particles were functionalised with Fmoc-X-Ala-Ala-PEGA particles (where X (CMR): Arg(+); Glu(-); Gly). Positive (RAA), negative (EAA) and neutral (GAA) particles were treated with 0.1 mg/ml of both thermolysin (a, b) and elastase (c, d) within the pH range of 6.0 – 9.0 in 0.001M potassium phosphate buffer, overnight on a blood rotator at 34oC. The separation of the CMR by rpHPLC shows that the specificity of both thermolysin and elastase had preference to cleave the Fmoc-tripeptide ECP at the carboxyl end of the CMR i.e. Fmoc-X~Ala-Ala. Data represents the mean + SE of four measurements (n=4).
0.0
0.2
0.4
0.6
0.8
1.0
RAA
Cleaved product (%
)
0.00
0.05
0.10
0.15
0.20
RAA
Cleaved product (%)
0.0
0.5
1.0
1.5
GAA
Cleaved product (%
)
0
2
4
6
8
10
RAA
Cleaved product (%)
0.0
0.5
1.0
1.5
2.0
2.5
GAA
Cleaved product (%)

CHAPTER 3: Functionalisation of PEGA Particles
124
In contrast, over the pH range of 6.0 – 9.0 elastase was found to selectively cleave the
Glu(–) residue (PEGA800: 4.81 – 45.65 %; PEGA1900: 0.20 – 45.37 %) more compared to
both the Arg(+) (PEGA800: 0.03 – 0.15 %; PEGA1900: 0.30 – 8.06 %) and Gly (PEGA800:
0.10 – 1.45 %; PEGA1900: 0.49 – 2.19 %) residues. When the cleaved product of the
CMR for each ECP (figure 31) was compared with the total cleaved product of each
ECP (figure 30) for both PEGA800 and PEGA1900: the selective cleaving of all three
CMRs (Arg(+), Glu(–) and Gly) from Fmoc-X~Ala-Ala by elastase were significantly lower
compared to the total cleaved products for RAA, EAA and GAA (p < 0.05).
Interestingly, just as we saw in figure 30, the pH activity for the specificity of elastase to
cleave the Glu(–) residue from EAA for both PEGA800 and PEGA1900 was found to be
dependant on pH. As expected, the pH profile for the selective hydrolysis of the Glu(–)
residue from EAA by the cationic form of elastase was found to increase (pH < 8.31)
and then elastase activity was found to decrease when elastase was in its anionic form
(pH 8.5 – 9.0) for both PEGA800 and PEGA1900.
3.4.4.4 Selective hydrolysis of Fmoc-dipeptide-PEGA particles by proteases The ECP bond specificities were further characterised for both thermolysin and elastase
in this section since both thermolysin and elastase had the ability to cleave at the carboxyl
end of the CMR for all Fmoc-tripeptide ECPs i.e. Fmoc-X~Ala-Ala (figure 31, in the
previous section 3.4.4.3). In view of that, it was envisaged that for commercial purposes
designing a simple wound dressing with a small ECP could potentially be beneficial as it
would be cheaper to synthesis.
Consequently, in this section the CMRs were flanked at the terminal end of a single Ala
residue coupled to PEGA particles (i.e. Ala-PEGA) to generate Fmoc-dipeptide-PEGA
particles with the configuration of Fmoc-X-Ala-PEGA (where X was again equivalent to
the CMR: Arg(+), Glu(–), or Gly; as summarised by figure 32) and both the ECPs and
PEGA particles in this section are abbreviated as: RA, EA and GA (as indicated in table
13: entries 10-12). Subsequently, the selective hydrolysis of the dipeptide ECPs for both
PEGA800 and PEGA1900 particles by both thermolysin and elastase was investigated
within the pH range of 7.5 – 9.0 (at 0.001M) and the collected cleaved products were
again separated and purified by rpHPLC (figure 32).

CHAPTER 3: Functionalisation of PEGA Particles
125
O NN
N
O R2
O R1
O
O NOH
O R2
O
NH2
NR1
O
+Protease
HPLC
Fmoc-dipeptide-PEGA particles Cleaved product
pH 7.5 - 9.0
0.001M
Figure 32. The chemical reaction of cleaving of Fmoc-dipeptide-PEGA particles (RA, EA, GA) by proteases. The X~Ala bond of the Fmoc-dipeptide-PEGA particle (RA: positive; EA: negative; and GA: neutral) was selectively cleaved by a protease such as thermolysin (control protease) or elatase (test protease) at 0.001M and within the pH range of 7.5 – 9.0. The total cleaved products achieved enzymatic treatment were collected and analysed by rpHPLC.
From figure 33, it can be seen that thermolysin and elastase were compatible in accessing
Fmoc-X~Ala-PEGA particles and had the ability to cleave all ECPs (RA, EA and GA)
for both PEGA800 and PEGA1900 particles. Again, thermolysin was found to cleave all
ECPs (RA, EA and GA) to a high degree (i.e. PEGA800 particles: 59.33 – 95.94 %; and
PEGA1900 particles: 65.89 – 97.50 %) compared to elastase (PEGA800 particles: 0.41 –
1.53 %; and PEGA1900 particles: 0.31 – 11.81 %) which again confirmed that thermolysin
was more selective than elastase (Morihara and Tsuzuki 1967).
For PEGA800 particles as expected thermolsyin selectively cleaved the positive ECPs
(RA: average 79.23 %) significantly more compared to the negative ECP (EA: average
62.89 %) (p < 0.05, figure 33a). Additionally, it can be seen that GA (neutral ECP) was
cleaved to a high degree (average: 85.16 %) compared to both RA and EA (figure 33a);
this is expected because as mentioned above the specificity of thermolysin has preference
to cleave hydrophobic residues such as Gly or Ala in both the P1 and P1′ positions
(Barrett et al. 2004). Although, on average thermolysin cleaved GA more than RA (i.e.
PEGA800 particles), statistically it was found that the specificity of thermolysin was
significantly similar for GA (76.58 – 95.94 %) and RA (72.93 – 89.64 %) because the
average percentage of the cleaved products for both GA (85.16 %) and RA (79.23 %)
were not significantly different (p > 0.05); whereas for EA the cleaved products were
significantly lower (i.e. 59.33 – 66.59 %) than both RA and GA (p < 0.05). For
PEGA1900 particles (figure 33b) no obvious trend was observed for thermolysin activity
between pH 7.5 – 9.0. Here, thermolysin hydrolysed all ECPs to a high degree: RA
(77.09 %), EA (88.40 %) and GA (86.84 %). When comparing the specificity of
thermolysin for all ECPs, it was found to be significantly different between RA and EA
CH3
Ala
N N
N+
Arg
-O
OR1 R2
Glu
H
Gly

CHAPTER 3: Functionalisation of PEGA Particles
126
(p < 0.05) including RA and GA (p < 0.05); whereas for EA and GA it was significantly
similar (p > 0.05).
(a) (b)
0
20
40
60
80
100
RA EA GAPEGA800
Cleaved product (%
)
0
20
40
60
80
100
RA EA GAPEGA1900
Cleaved product (%
)
(c) (d)
0.0
0.5
1.0
1.5
2.0
RA EA GA
PEGA800
Cleaved product (%
)
0.0
3.0
6.0
9.0
12.0
15.0
RA EA GA
PEGA1900
Cleaved product (%
)
pH 7.5 pH 8.0 pH 8.5 pH 9.0
Figure 33. Selective hydrolysis of Fmoc-X-Ala-PEGA(800,1900) particles by thermolysin and elastase at different pH values. PEGA800 (a, c) and PEGA1900 (b, d) particles were functionalised with Fmoc-X-Ala-PEGA particles (where X (CMR): Arg(+); Glu(-); Gly). Positive (RA), negative (EA) and neutral (GA) particles were treated with 0.1 mg/ml of both thermolysin (a, b) and elastase (c, d) within the pH range of 7.5 – 9.0 in 0.001M potassium phosphate buffer, overnight on a blood rotator at 34oC. The cleaved products were collected and analysed by HPLC. Data represents the mean + SE of four measurements (n=4).
Next, the pH activity of thermolysin to hydrolyse each ECP was compared and the
specificity of thermolysin was found to be independent of pH for majority of the ECPs
i.e. RA, EA, GA (i.e. PEGA800 particles, p > 0.05; figure 33a) including EA (PEGA1900
particles, p > 0.05; figure 33b). This is because in these particles, the CMR residues
(referred as X in Fmoc-X-Ala-PEGA particles) is located in the P1 position of the ECP
and in the Murakami et al. study it was also reported that when an Arg, Ala and Gly
0.0
0.2
0.4
0.6
0.8
1.0
RA EA GACleaved product (%
)
CHAPTER 3: Functionalisation of PEGA Particles
127
residues (alongside others) are at the P1 and P2 positions then the specificity of
thermolysin is independent of pH in the order of L-Arg > L-Ala> L-Gly (Murakami et
al. 2001). However, the specificity of thermolysin was found to be dependant on pH for
RA and GA (PEGA1900 particles: figure 33b). After pair-wise comparisons, both post-
hoc tests (Tukey and Duncan) revealed that for RA: thermolysin activity was significantly
different only for pH 7.5 and pH 9.0, and was not significantly different between (a) pH
7.5 – 8.5; and (b) pH 8.0 – 9.0 (p > 0.05). In contrast, for GA thermolysin activity was
significantly different only between pH 7.5 and pH 8.5, and was not significantly
different between: (a) pH: 7.5, 8.0 and 9.0 (p > 0.05); and (b) pH 8.0 – 9.0 (p > 0.05). In
view of that, there is no conclusive trend as to why thermolysin activity depended on pH
for both RA and GA since majority of the pH values show that the specificity of
thermolysin was independent of pH for PEGA1900 particles (figure 33b).
The discussion will now focus on the selective hydrolysis of all the ECPs for Fmoc-X-
Ala-PEGA particles by elastase (figure 33c-d). Although the yields of the cleaved
product collected after treatment with elastase were low in comparison to thermolysin;
interestingly on the basis of charge and under the influence of pH the expected
observations were observed for PEGA800 particles (figure 33c). On average, elastase
cleaved the charged ECPs more (RA: 1.04% and EA: 1.00 %) compared to the neutral
ECPs (GA: 0.77%) between pH 7.5 – 9.0 (figure 33c) but the specificity of elastase for
cleaving these ECPs was significantly similar between pH 7.5 – 9.0 (p > 0.05). However,
for the charge ECPs (RA and EA) it was found that the specificity of elastase activity
significantly depended on pH (p < 0.05). As expected, when elastase was in its cationic
form (pI 8.31, pH < 8.31) that is at pH 7.5 – 8.0, it selectively cleaved the negative ECP
(EA: 1.35 % at pH 7.5; and 0.97 % at pH 8.0) more compared to the positive ECP (RA:
0.41 % – 0.80 % at pH 7.5 – 8.0). On the other hand, the opposite effect was observed
under the conditions when elastase was in its anionic form (pI 8.31, pH > 8.31) it
selectively cleaved the positive ECP (RA: 1.44 % – 1.53 % at pH 8.5 – 9.0) more
compared to the negative ECP (EA: 0.94 – 0.84 % at pH 8.5 – 9.0). From figure 33c it
can be seen that elastase also cleaved the neutral ECP (i.e. GA of PEGA800 particles)
which is not surprising because it is well-known that the specificity of elastase has
preference to cleave small hydrophobic residues such as Gly and Ala residues in the P1
and P1′ positions (Stryer 1995; Purich and Allison 2002).

CHAPTER 3: Functionalisation of PEGA Particles
128
For PEGA1900 particles (figure 33d), elastase selectively cleaved all ECPs more at pH 7.5;
and at this pH the negative ECP (EA: 11.80 %) was significantly cleaved more compared
to both positive (RA: 0.99 %) and neutral (GA: 1.90 %) ECPs which is expected because
at pH 7.5 elastase exists in its cationic form. Overall, for PEGA1900 particles the
selective specificity of elastase for cleaving Fmoc-X~Ala was independent of the charge
of ECP at high pH (p > 0.05), whereas at low pH (i.e. pH 7.5) the specificity of elastase
depended on the charge of ECP.
When comparing the specificity of both thermolysin and elastase for hydrolysing the
X~Ala bond (where X is the CMR) for both the Fmoc-dipeptide ECP (Fmoc-X~Ala
(figure 33) and the Fmoc-tripeptide ECP (Fmoc-X~Ala-Ala (figure 31), overall it was
found that:
• thermolysin had a high preference to hydrolyse the X~Ala bond of the Fmoc-
dipeptide ECP (for all ECPs: RA, EA, GA) for both PEGA800 and PEGA1900
particles; whereas
• elastase had a high preference to cleave the X~Ala bond of the Fmoc-tripeptide
ECP for all ECPs (RAA, EAA and GAA) meaning that the specificity of elastase
for X~Ala bond decreased for the Fmoc-dipeptide sequence i.e. Fmoc-X~Ala
for both PEGA800 and PEGA1900 particles.
This section (3.4.4.4) demonstrated that on the basis of charge and under the influence
of pH, the specificity of both thermolysin and elastase for preference of hydrolysing the
Fmoc-dipeptide ECP (Fmoc-X~Ala, where X was Arg(+), Glu(-) and Gly) was selectively
controlled by PEGA800 particles. For the remaining parts of this thesis, the
functionalised PEGA1900 particles with the configuration of Fmoc-X-Ala-Ala-PEGA
(where X was Arg(+), Glu(-) and Gly) were selected for further investigation having
established that elastase selectively cleaved the Fmoc-tripeptide ECP (i.e. Fmoc-X-Ala-
Ala; figure 30 in section 3.4.4.2) more compared to the Fmoc-dipeptide ECP (i.e. Fmoc-
X-Ala, figure 33 in section 3.4.4.4). This observation confirmed that the di-alanine bond
(Ala-Ala) was required to attain a good response for elastase activity, and this was
expected since the specificity of elastase (PPE) had preference to cleave at the carboxyl-
terminal side of small hydrophobic amino acid residues such as Ala (Stryer 1995; Barrett
et al. 2004). Additionally, high yields of the collected cleaved products for Fmoc-X-Ala-

CHAPTER 3: Functionalisation of PEGA Particles
129
Ala-PEGA in relation to elastase were obtained with PEGA1900 particles compared to
PEGA800 particles.
3.4.5 Swelling analysis
In this section potassium phosphate buffer was chosen as the swelling environment to
maintain both the internal and external pH and ionic strength of functionalised PEGA1900
particles in order to examine the electrostatic swelling behaviour of these PEGA
particles.
3.4.5.1 Swelling behaviour of un-cleaved Fmoc-tripeptide-PEGA particles
The average diameter of 100 particles was measured to study the swelling behaviour of
Fmoc-X-Ala-Ala-PEGA1900 and Fmoc-X-Phe-Phe-PEGA1900 as a function of different
pH and ionic strength. As previously mentioned, the CMR (again indicated as X within
this section) determines the overall charge of the ECP coupled to PEGA particles
producing either ionic (positive and negative) or neutral PEGA particles; as a reminder
the positive and negative charges were achieved by Fmoc-Arg(+) and Fmoc-Glu(–)
respectively; and the neutral charge was maintained by Fmoc-Gly (see section 3.4.4). As
the CMR is the actuator within these functionalised PEGA particles, in this section it will
become evident that the CMR plays an important role in modifying the swelling of the
hydrogel PEGA particles as the CMR can be susceptible to ionisation under aqueous
conditions.
The pH was chosen in the range of 7.0 – 9.0 to accommodate firstly the pH observed in
chronic wounds, and secondly within this pH range elastase (pI 8.31) can exist as both
cationic and anionic protease (see section 3.4.3). While, the ionic strength of the buffer
ranged from 0.001 – 0.2 M, in order to compare the swelling ability of functionalised
PEGA1900 particles at both low and high ionic strengths. The swelling for Fmoc-X-Phe-
Phe-PEGA1900 particles was studied within this chapter because in chapter 4 these
particles were chosen as a control for studying the effect of elastase cleaving at high ionic
strength.

CHAPTER 3: Functionalisation of PEGA Particles
130
Statistical analysis was performed in order to make comparisons between the swelling of
all types (charged and neutral) of functionalised PEGA1900 particles using ANOVA test
which included post-hoc tests (Tukey and Duncan) to determine which diameters differ
significantly from one another followed by a paired t-test. The statistical analysis was
performed at the 95% confidence level, and the effect of swelling was significant when
p< 0.05; whereas when p> 0.05 it was not significant.
The degree of swelling for Fmoc-X-Ala-Ala-PEGA1900 and Fmoc-X-Phe-Phe-PEGA1900
are displayed by figures 34 and 35, respectively. Within this section the Fmoc-X-Ala-Ala-
PEGA1900 and Fmoc-X-Phe-Phe-PEGA1900 particles are abbreviated again according to
table 13 (entries 4 – 9). From figure 34, the effect of swelling for Fmoc-X-Ala-Ala-
PEGA1900 particles was significantly higher for the charged particles (RAA and EAA; p <
0.05) compared to the neutral PEGA particles i.e. on average the diameter of the positive
particles (RAA) increased by 11.00 % and the negative particles (EAA) increased by
8.41% compared to the neutral particles (GAA). The same trend was observed for the
Fmoc-X-Phe-Phe-PEGA1900 particles (figure 35); in which the average diameters of both
the positive particles (RFF) and negative particles (EFF) significantly increased by 6.60 %
and 4.39 % respectively, compared to the neutral particles (GFF) (p < 0.05).
In terms of pH, the effect of swelling for the charged particles varied according to the
pKa of the ionisable side chain of the CMR, in this case the Arg residue for the positive
particles (RAA and RFF) and the Glu residue for the negative particles (EAA and EFF).
The Arg residue for the positive particles were protonated (i.e. C=NH2+) because the
pH of the surrounding buffer (i.e. pH 7 – 9) was below pKa 12.48 of the Arg side chain
causing the particles to swell as a result of electrostatic repulsion between positively
charged groups. Similarly, the Glu residues for the negative particles were carboxlayted
(COO–) because the pH of the surrounding buffer (i.e. pH 7 – 9) was above pKa 4.25 of
the Glu side chain causing the negative particles swell due to electrostatic interactions
between the anions groups. Overall, the effect of swelling for each of the charged
particles (i.e. RAA, EAA, RFF and EFF) did not depend on the pH because the average
diameter for each particle was not significantly different between pH 7 – 9 (p > 0.05;
figures 34 and 35).

CHAPTER 3: Functionalisation of PEGA Particles
131
(a) pH 7.0
0.245
0.270
0.295
0.320
0.345
0.370
0.001 M 0.01 M 0.1 M 0.2 M
Diameter (mm)
(b) pH 8.0
0.245
0.270
0.295
0.320
0.345
0.370
0.001 M 0.01 M 0.1 M 0.2 M
Diameter (m
m)
(c) pH 9.0
0.245
0.270
0.295
0.320
0.345
0.370
0.001 M 0.01 M 0.1 M 0.2 M
Diameter (mm)
Fmoc-Arg(+)-Ala-Ala Fmoc-Glu(-)-Ala-Ala Fmoc-Gly-Ala-Ala
Figure 34. Swelling behaviour of functionalised Fmoc-X- Ala-Ala-PEGA1900 particles as a function of pH (a: 7.0, b: 8.0 and c: 9.0) and ionic strength (ranging from 0.001M – 0.2M) in potassium phosphate buffer. The effect of swelling for the positive (Fmoc-Arg(+)-Ala-Ala), negative (Fmoc-Glu(–)-Ala-Ala) and neutral (Fmoc-Gly-Ala-Ala) PEGA1900 particles were statistically compared using ANOVA (including post-hoc tests) followed by a paired t-test at the 95% confidence level. For detail descriptions of these comparisons see the text within this section. Data represents the mean + SE of 100 measurements (n=100).

CHAPTER 3: Functionalisation of PEGA Particles
132
(a) pH 7.0
0.245
0.270
0.295
0.320
0.345
0.370
0.001 M 0.01 M 0.1 M 0.2 M
Diameter (mm)
(b) pH 8.0
0.245
0.270
0.295
0.320
0.345
0.370
0.001 M 0.01 M 0.1 M 0.2 M
Diameter (mm)
(c) pH 9.0
0.245
0.270
0.295
0.320
0.345
0.370
0.001 M 0.01 M 0.1 M 0.2 M
Diameter (mm)
Fmoc-Arg(+)-Phe-Phe Fmoc-Glu(-)-Phe-Phe Fmoc-Gly-Phe-Phe
Figure 35. Swelling behaviour of functionalised Fmoc-X-Phe-Phe-PEGA1900 particles as a function of pH (a: 7.0, b: 8.0 and c: 9.0) and ionic strength (ranging from 0.001M – 0.2M) in potassium phosphate buffer. The effect of swelling for the positive (Fmoc-Arg(+)-Phe-Phe), negative (Fmoc-Glu(–)-Phe-Phe) and neutral (Fmoc-Gly-Phe-Phe) PEGA1900 particles were statistically compared using ANOVA (including post-hoc tests) followed by a paired t-test at the 95% confidence level. For detail descriptions of these comparisons see the text within this section. Data represents the mean + SE of 100 measurements (n=100).

CHAPTER 3: Functionalisation of PEGA Particles
133
On the contrary, the swelling of the charged particles (RAA, EAA, RFF, EFF)
significantly depended on ionic strength (p < 0.05; figures 34 and 35). Principally, the
electrostatic interactions for both the positive (RAA and RFF) and negative (EAA and
EFF) particles decreased with increasing ionic strength (0.001 – 0.2 M) because the
counter ions of the buffer screened the electrostatic interactions of the CMR for each
ECP, causing the swelling to significantly decrease with increasing ionic strength (0.001 –
0.2 M, p< 0.05); whereas at low ionic strength the electrostatic interactions of the CMR
for all ECPs increased causing the swelling to significantly increase (p < 0.05).
For neutral particles (GAA and GFF: figures 34 and 35 respectively) as there are no
ionisable groups, the effect of swelling remained the same for all tested pH values (pH 7,
8 and 9, p> 0.05); and similarly no measureable effect of swelling was observed
depending on the ionic strength within the range of 0.001 – 0.1 M (p > 0.05) and these
observations confirm with the trends observed by Basso and co-workers for PEGA
particles possessing an overall neutral charge (Basso et al. 2004). The swelling was
significantly lower at 0.2 M (p < 0.05) which was unexpected.
Next, the swelling of Fmoc-X-Ala-Ala-PEGA1900 particles were compared with each
other. The swelling for RAA was significantly different when compared with EAA (p <
0.05) and GAA (p < 0.05) for all ionic strength and pH values. Additionally, the swelling
of EAA and GAA was significantly different at low ionic strength (0.001 – 0.01 M, at all
tested pH values; p < 0.05) whereas at high ionic strength and pH (i.e. 0.1 – 0.2 M and
pH 8 – 9) the effect of swelling for EAA was similar to GAA (p > 0.05). For the Fmoc-
X-Phe-Phe-PEGA1900 particles, the swelling for RFF was significantly similar to EFF at
low ionic strength (0.001 – 0.1 M, at pH 7 – 9; p > 0.05) whereas at high ionic strength
(0.2 M, at pH 7 – 9) it was significantly different (p < 0.05) in which the swelling of the
positive particles (RFF) was more than negative particles (EFF). As expected, the
swelling of RFF against GFF was found to be significantly different at both low ionic
strength (0.001 – 0.01 M, at pH 7 – 9; p < 0.05) and high ionic strength (0.2 M, pH 7 – 9:
p < 0.05) in each case: RFF swelled more than GFF; whereas at 0.1 M (pH 7 – 9) the
swelling for RFF was unexpectedly similar to GFF (p > 0.05). Similarly, as expected the
swelling of EFF against GFF was significantly different at low ionic strength (0.001 –
0.01 M, at pH 7 – 9; p < 0.05) i.e. EFF swelled more than GFF; whereas at high ionic
strength (0.1 – 0.2 M, at pH 7 – 9) the swelling of EFF and GFF was significantly similar

CHAPTER 3: Functionalisation of PEGA Particles
134
(p < 0.05). Overall, it was expected at high ionic strength that the charge particles (RAA,
EAA, RFF, EFF) swelled the same as neutral particles (GAA and GFF) because as
previously mention with increasing ionic strength the counter ions of the buffer increase
which then shield the ionic charges of ECPs and accordingly swelling decreases for
charge particles (RAA, EAA, RFF, EFF), whereas at low ionic strength the counter ions
of the buffer are low in this manner there are more repulsions between the electrostatic
interactions and consequently swelling increases.
Finally, the swelling of Fmoc-X-Ala-Ala-PEGA1900 particles (figure 34) were compared
with Fmoc-X-Phe-Phe-PEGA1900 particles (figure 35). The swelling for Fmoc-X-Phe-
Phe-PEGA1900 particles was significantly lower than Fmoc-X-Ala-Ala-PEGA1900 particles
(p < 0.05) this is because the ECP of the Fmoc-X-Phe-Phe-PEGA1900 particles contain
Phe residues which are more hydrophobic than the Ala residues. The decrease in
swelling by the Fmoc-X-Phe-Phe-PEGA1900 particles is due to ‘hydrophobic effect’
wherein the Phe residues tend to cluster/ pack themselves together in aqueous
environments and therefore prevent water/ hydrophilic molecules to pass between them.
For the reason that, Fmoc-X-Phe-Phe-PEGA1900 particles will let less water in compared
to the Fmoc-X-Ala-Ala-PEGA1900 particles this is the possible reason why the Fmoc-X-
Ala-Ala-PEGA1900 particles are found to swell more compared to the Fmoc-X-Phe-Phe-
PEGA1900 particles. The effect of swelling between the negative particles (EAA vs EFF)
was significantly different at all the tested pH and ionic strength (p < 0.05) which shows
that the swelling of EAA particles to be significantly higher than EFF (p < 0.05; figure
34 and 35). Whereas for the positive particles (RAA vs RFF) the effect of swelling was
not significantly different at low ionic strength (0.001 M) for all the tested pH values (p >
0.05; figure 34 and 35), but was significantly different within the range of 0.01 – 0.2 M
for all pH values (p < 0.05; figure 34 and 35). As expected for the neutral particles
(GAA vs GFF) because there are no ionisable groups the effect of swelling was not
significantly different at low ionic strength: 0.001 – 0.01 M at pH 7, 8 and 9 (p > 0.05);
whereas the swelling was significantly lower for GFF compared to GAA at high ionic
strength i.e. 0.1 – 0.2 M at pH 7 , 8 and 9 (p < 0.05; figure 34 and 35) which is again
possibly due to the counter ions of the buffer shielding the Phe residue at high ionic
strength causing the swelling to decrease.

CHAPTER 3: Functionalisation of PEGA Particles
135
3.4.5.2 Swelling behaviour of cleaved Fmoc-tripeptide-PEGA particles
After Fmoc-tripeptide-PEGA1900 particles (i.e. Fmoc-X-Ala-Ala-PEGA1900 and Fmoc-X-
Phe-Phe-PEGA1900) were treated with either elastase or thermolysin, it was envisaged that
the following cleaved products were produced: (+)Ala-PEGA1900 and (+)Phe-PEGA1900
(figure 36c) because the ERS was selectively cleaved by the protease between the Ala-Ala
or the Phe-Phe bonds of the Fmoc-tripeptide-PEGA1900 particles (chemically indicated
by figure 36a). Subsequently, the diameter of 100 particles for each cleaved product was
measured and the effect of swelling was again studied as a function of pH (7 – 9) and
ionic strength (0.001 – 0.2 M) as demonstrated by figure 37a for (+)Ala-PEGA1900 and
figure 36a for (+)Phe-PEGA1900.
Figure 36. Fmoc-tripeptide-PEGA1900 particles (a) cleaved by protease to generate cleaved products (b-c). Fmoc-tripeptide-PEGA1900 particles (a: Fmoc-R3-Ala-Ala-PEGA1900 and Fmoc-R3-Ala-Ala-PEGA1900); cleaved product 1 (b: Fmoc-R3-R2-COO–) and cleaved product 2 (c: (+)R1-PEGA1900); R-groups (R3: Arg(+)/ Glu(–); R1 and R2: Ala/ Phe). Diameters of Fmoc-tripeptide-PEGA1900 particles (a) and cleaved product 2 (c) were compared to determine the difference in swelling after enzyme treatment.
The swelling behaviour of both (+)Ala-PEGA1900 and (+)Phe-PEGA1900 particles were
similar. The effect of swelling significantly depended on ionic strength because the
swelling was found to decrease with increasing ionic strength (0.001M – 0.2M, p < 0.05)
this is because the electrostatic interactions decreased for both (+)Ala-PEGA1900 and (+)Phe-PEGA1900 particles because the counter ions of the buffer screened the
O
NNH
O
R3O
N
R2
O
N
R1
O
H3N N
R1
O
O
NNH
O
R3O
O
R2
O
Phe
CH3
Arg+
N N
N+
Glu
O
O
Gly H
(a)
(c)(b)
+
Protease
+
Ala R3:R1, R2:

CHAPTER 3: Functionalisation of PEGA Particles
136
electrostatic interactions of the α-NH3+ for both the Ala and Phe residues causing the
swelling to decrease. Nevertheless, within the range of 0.001 – 0.1M the effect of
swelling was not significantly different for the (+)Ala-PEGA1900 particles at pH 8 (p >
0.05) and (+)Phe-PEGA1900 particles at pH 9 (p > 0.05) which is possibly because the pH
of the surrounding buffer solution was closer to the pKa of the terminal α-NH3+ group
for both the Ala and Phe residues as discussed below.
(a) (b)
0.290
0.305
0.320
0.335
0.350
0.365
0.001 M 0.01 M 0.1 M 0.2 M
Diameter (mm)
-8
-4
0
4
8
12
16
20
0.001 M 0.01 M 0.1 M 0.2 M
Swelling (%)
(c) (d)
-8
-4
0
4
8
12
16
20
0.001 M 0.01 M 0.1 M 0.2 M
Swelling (%)
-8
-4
0
4
8
12
16
20
0.001 M 0.01 M 0.1 M 0.2 M
Swelling (%)
pH 7 pH 8 pH 9
Figure 37. Swelling behaviour of cleaved product (+)Ala-PEGA1900 and the percentage decrease/increase in swelling when compared to the un-cleaved Fmoc-X-Ala-Ala-PEGA1900 particles (n=100). Cleaved product: (+)Ala-PEGA1900 (a); cleaved Fmoc-X-Ala-Ala-PEGA1900 particles: RAA (b), EAA (c), and GAA (d). In graphs b-d the percentage increase in swelling is displayed by positive values; whereas the percentage decrease in swelling is displayed by negative values. The effect of swelling was studied as a function of pH (7, 8, 9) and ionic strength (0.001M – 0.2M) in potassium phosphate buffer. Statistical analysis was carried out using ANOVA (including post-hoc tests) followed by a paired t-test at the 95% confidence level. For detail descriptions of these comparisons see the text within this section.

CHAPTER 3: Functionalisation of PEGA Particles
137
In terms of pH, the effect of swelling for (+)Ala-PEGA1900 was significantly higher at pH
7 – 8 compared to pH 9 (p < 0.05) this is because the pH of the surrounding buffer at
pH 9 for the (+)Ala-PEGA1900 particles was closer to pKa 9.96 of the terminal α-NH3+ of
the Ala residue causing the swelling to significantly decrease (p < 0.05). The same trend
was observed for the (+)Phe-PEGA1900 particles because the swelling was significantly
higher at pH 7 compared to pH 8 – 9 (p < 0.05) because in this instance the pH of the
surrounding buffer at pH 8 – 9 was closer to pKa 9.13 of the terminal α-NH3+ of the Phe
residue causing the swelling to significantly decrease (p < 0.05).
(a) (b)
0.290
0.305
0.320
0.335
0.350
0.365
0.001 M 0.01 M 0.1 M 0.2 M
Diameter (mm)
-8
-4
0
4
8
12
16
20
0.001 M 0.01 M 0.1 M 0.2 M
Swelling (%)
(c) (d)
-8
-4
0
4
8
12
16
20
0.001 M 0.01 M 0.1 M 0.2 M
Swelling (%)
-8
-4
0
4
8
12
16
20
0.001 M 0.01 M 0.1 M 0.2 M
Swelling (%)
pH 7 pH 8 pH 9
Figure 38. Swelling behaviour of cleaved product (+)Phe-PEGA1900 and the percentage decrease/increase in swelling of the cleaved Fmoc-X-Phe-Phe-PEGA1900 particles (n=100). Cleaved product: (+)Phe-PEGA1900 (a); cleaved Fmoc-X-Phe-Phe-PEGA1900 particles: RFF (b), EFF (c), and GFF (d). In graphs b-d the percentage increase in swelling is displayed by positive values; whereas the percentage decrease in swelling is displayed by negative values. The effect of swelling was studied as a function of pH (7, 8, 9) and ionic strength (0.001M – 0.2M) in potassium phosphate buffer. Statistical analysis was carried out using ANOVA (including post-hoc tests) followed by a paired t-test at the 95% confidence level. For detail descriptions of these comparisons see the text within this section.

CHAPTER 3: Functionalisation of PEGA Particles
138
Next, the swelling behaviour of the cleaved products were each compared with the
swelling of the un-cleaved Fmoc-tripeptide-PEGA particles as given in the previous
section i.e. (+)Ala-PEGA1900 against Fmoc-X-Ala-Ala-PEGA and (+)Phe-PEGA1900 against
Fmoc-X-Phe-Phe-PEGA. The difference in swelling between the two configurations
(cleaved and un-cleaved particles) was calculated and the percentage increase/decrease in
swelling for the positive (RAA, RFF), negative (EAA, EFF) and neutral (GAA, GFF)
particles were plotted separately for both the Ala containing particles (figure 37b-d) and
the Phe containing particles (figure 38b-d). In both figures, the percentage increase in
swelling is displayed by positive values; whereas the percentage decrease in swelling is
displayed by negative values. From figures 37b-d and figures 38b-d it can be seen that
majority of the particles showed an increase in swelling between the diameters of the un-
cleaved versus cleaved particles for both Ala and Phe containing particles (figures 37 and
38, respectively). In both configurations, the increase in swelling was observed more for
the neutral particles (figure 39c: GAA and figure 40c: GFF) compared to the charged
particles (figures 37b-c: RAA, EAA; and figures 38b-c: RFF, EFF). The average increase
in swelling for the neutral particles was 12.19 % for GAA (figure 37d) and 13.61 % for
GFF (figure 38d), whereas for the positive particles it was 3.81 % for RAA (figure 37b)
and 9.89 % for RFF (figure 38b); and for the negative particles it was 8.66 % for EAA
(figure 37c) and 10.64 % for EFF (figure 38c).
On the contrary, a decrease in swelling was only observed for the charged particles at low
ionic strengths. For the Ala containing particles, the swelling of the positive particles
(RAA, figure 37b) decreased at pH 9 by 2.33 % (0.001 M) and 3.77 % (0.01 M); whereas
the swelling of the negative particles (EAA, figure 37c) decreased by 4.09 – 6.67 %
between pH 7 – 9 (at 0.001 M). For the Phe containing particles, the swelling of the
positive particles (RFF, figure 38b) decreased at 0.001M by 3.51 % at pH 8, and 4.31 %
at pH 9; whereas the negative particles (EFF, figure 38c) only decreased by 0.90 % at pH
8 (0.001 M). For the charged particles of both Ala and Phe containing particles (RAA,
EAA, RFF, EFF) the difference in swelling was found to gradually increase with
increasing ionic strength; whereas no measurable effect was observed between 0.001 –
0.2 M for the neutral particles of both Ala and Phe containing particles (GAA: figure
37d; and GFF: figure 38d). Finally, the difference in swelling at each ionic strength for
majority of the particles was found to decrease with increasing pH (7 – 9), which as
mention previously is caused by the pH of the surrounding buffer at pH 9 being closer to

CHAPTER 3: Functionalisation of PEGA Particles
139
the pKa of the terminal α-NH3+ of both the Ala/ Phe residue(s); whereas at pH 7 the pH
of the surrounding buffer is further away from the pKa of α-NH3+ causing the particles
to swell more.
3.5 CONCLUSION
Using SPPS, PEGA particles were successfully functionalised with short ECPs (Fmoc-
dipeptides and Fmoc-tripeptides) that selectively responded to selected proteases such as
thermolysin and elastase. Comparative studies demonstrated that in sample fluids
mimicking the environment of chronic wounds (i.e. pH 6.0 – 9.0; with a protease
concentration > 0.1 mg/ml) elastase selectively hydrolysed Fmoc-tripeptide ECPs
containing the Ala-Ala bond, whereas thermolysin had a high preference to hydrolyse
both the Fmoc-tripeptide and Fmoc-dipeptide ECPs (the latter ECP did not contain the
Ala-Ala bond). Additionally, the results illustrate that under the influence of pH and
charge, the enzyme-response mechanism of the hydrogel PEGA particles was specifically
tuned so that each protease in its cationic or anionic form could simultaneously and
selectively penetrate functionalised PEGA particles and hence selectively hydrolyse ECPs
of opposite charge to that of the protease. Thermolysin in its anionic form readily
cleaved a positively charged ECP compared to a negatively charged ECP; whereas
elastase in its cationic form had preference to cleave a negatively charged ECP and in its
anionic form the opposite effect was observed. The swelling of PEGA particles
increased with the incorporation of ionic charges (i.e. positive and negative) compared to
PEGA particles possessing a neutral charge. For the ionic particles, removal of the
charge residue (i.e. CMR: positive or negative) by proteases showed a reduction in
particle swelling at low ionic strength compared to neutral particles; whereas at high ionic
strength the swelling was found to increase for all particles (ionic and neutral). Overall,
this chapter exemplifies that on the basis of charge selective cleaving of ECPs coupled to
PEGA800 and PEGA1900 particles can be exploited to selectively remove excess proteases
such as elastase from sample fluids mimicking the environment of chronic wounds. In
doing so, PEGA particles containing ionic charges alongside the Ala-Ala bond may have
an application as new responsive dressings to treat chronic wounds by selectively
removing and entrapping elastase into PEGA particles as investigated further in the next
chapters.

CHAPTER 4: Selective Entrapment of Elastase into PEGA Particles
140
CCHHAAPPTTEERR 44
SSeelleeccttiivvee EEnnttrraappmmeenntt ooff EEllaassttaassee iinnttoo PPEEGGAA PPaarrttiicclleess

CHAPTER 4: Selective Entrapment of Elastase into PEGA Particles
141
4.1 INTRODUCTION
This chapter focuses on understanding the accessibility and diffusion of elastase followed
by its entrapment into PEGA particles by exploiting the use of different fluorescence
techniques. The term fluorescence is very broad as it has many applications and various
techniques can be used to study it. Fluorescence techniques are used in chemistry,
physics and biology and are highly sensitive for the detection and quantification of
molecular interactions and chemical reactions over time. They are highly valuable for
studying cellular structure and function, and bio-molecular interactions of molecules in
biological systems and have gradually become important for the detection and
quantification of: nucleic acids and proteins in gel electrophoresis, microarrays, material
and polymer science and fluorescence spectroscopy.
Fluorescence occurs only in poly-aromatic hydrocarbons and/ or heterocyclic molecules
which are normally referred to as ‘fluorophores’ or fluorescent dyes/ markers as they
absorb light. These molecules are further classed as ‘chromophores’ as part of the
molecule is responsible for colour. A chromoprotein is a protein that absorbs light in the
visible or near-UV range but one that does not necessarily emit fluorescence. To-date
many fluorophores are available which have been synthesised and modified to specifically
interact with cellular/ chemical structures to make them detectable in many different
colours across the spectrum (UV/VIS/IR). The Jablonski energy diagram is a useful
diagram that summarises the kinetic spectra of light absorption and fluorescence (figure
39a). The phenomenon of fluorescence dates back to 1952 when Sir George Gabriel
Stokes reported the shift of fluorescence to a lower energy compared to the absorption
spectrum (Stokes 1852), which is famously known as the ‘Stokes shift’. The process of
fluorescence via the ‘Stokes shift’ of a given fluorophore is summarised in figure 39b-c.
For PEGA research, a choice of fluorophores have been utilised to examine the
accessibility and permeability of enzymes into PEGA particles. Previously, 1-
dimethylaminonapthalene-5-sulfochloride (dansyl chloride) has been used to understand
the diffusion of enzymes into PEGA particles over the course of time (Ulijn et al.
2003b). This study showed that after thermolysin cleaved the ECP, Fmoc-Phe-Phe
coupled to PEGA particles free amino group (NH2) became available and after that the

CHAPTER 4: Selective Entrapment of Elastase into PEGA Particles
142
thermolysin reaction was stopped, the free amino groups on the cleaved PEGA particles
were labelled with dansyl chloride.
(a) (b)
(c) (d)
Figure 39. Jablonski diagram and Stokes shift of fluorescence. (a) Jablonski diagram: A fluorophore molecule in its ground state, S0 absorbs sufficient light from an external source at one wavelength causing the molecule to raise an electron to an excited state that is at an higher-energy state (S1) resulting in luminescence (Campell, 1988) via the process of excitation. A fluorophore can attain multiple excited states (S1, S2) depending on the wavelength or the energy of the external light source. The excited lifetime is the length of time the fluorophore exist in excited states; it lasts for a very short time between 10-15–10-9 seconds. At high-energy level the electrons of the fluorophore are unstable therefore the fluorophore adopts a semi-stable state (strong dotted lines). The excess of energy is then converted to the emission of fluorescence or the light returns the fluorophore back to the ground state, S0 (a-d). The emitted fluorescence energy contains less energy and is at a longer wavelength whereas the absorbed light energy is at a shorter wavelength, this is known as the ‘Stokes Shift’ (b-c) where some of the energy is lost through molecular vibrations during the transient excited lifetime as dissipated heat to the surrounding solvent molecules as they collide with the excited fluorophore (c). The absorption of fluorescence is a cyclic process (d) unless the fluorophore is irreversibly destroyed by continuous light excitation leading to photobleaching. Figure and text tailored from Haugland 2005, Invitrogen technical notes, Kealey and Haines 2002; and Campell 1998.
So
S1
S2
Ab
sorp
tion
(k
ex : 10-15 s)
Flu
orescen
ce (k
em: 10
-9 to -7 s)
Internal conversion (10-12 to -6 s)
750
Stokes shift
Wavelength of light (nm)
400 450 500 550 600 650 700
Emission Excitation
Freq
uen
cy
Heat
Energy levels
Ex
citatio
n
Em
ission
Stokes shift Absorption
Ground State
Emission
Excitation

CHAPTER 4: Selective Entrapment of Elastase into PEGA Particles
143
Then, after washing the cleaved PEGA particles, the spatial distribution of the
fluorescence for the dansyl fluorophore was detected using two-photon microscopy
(TPM) to show where thermolysin had cleaved the ECP from the Fmoc-Phe-Phe-PEGA
particles. The complete diffusion of the thermolysin from the outer surface throughout
the central core of PEGA particles was achieved within 45 minutes (Ulijn et al. 2003b).
Since unmodified PEGA particles contain free NH2 groups (which as mentioned
previously are used during SPPS to couple amino acids) and these can be labelled with
dansyl chloride to examine whether an amino acid, hence ECP has completely been
coupled to PEGA particles. Though, this approach is more expensive compared to
Kaiser test given that dansyl coupling requires advanced microscopy for analysis unlike
the Kaiser test (for details of the Kaiser test: see chapter 3).
Fluorescein-isothiocyanate (FITC) labelled dextrans (referred as FITC-labelled dextrans
in this thesis) of known molecular weights have been used to understand the accessibility
and diffusion of enzymes into unmodified or functionalised PEGA particles that have
been treated with or without a protease. Thornton et al. (2005) examined the diffusion
of FITC-labelled dextrans with molecular weights in the range of 4 – 77 kDa into the
core of the PEGA800 particles in water. The study showed that FITC-labelled dextrans <
20 kDa were able to access unmodified PEGA800 particles, whereas FITC-labelled
dextrans of high molecular weight (40 kDa and 77 kDa) were unable to access
unmodified PEGA particles. However, the penetration of these FITC-labelled dextrans
was enhanced when the swelling of the PEGA particles was increased by the
introduction of positive charges in which the ECP examined were Arg(+)-Phe-Gly and
Arg(+)-Gly-Phe. Additionally, they demonstrated that after both trypsin and thermolysin
selectively cleaved the Arg(+)-Gly-Phe ECP, the accessibility of the 77 kDa FITC-labelled
dextran into PEGA particles was reduced since the Arg(+) residue from the ECP was
removed causing the diameter of the PEGA800 particle to reduce. In contrast, the study
showed that when the unspecific protease i.e. chymotrypsin did not cleave Arg(+)-Gly-
Phe ECP the molecular accessibility of these particles was not reduced. As a result the
FITC-labelled dextran was able to access and diffuse into PEGA800 particles, and its
accessibility was comparable to that observed by the control PEGA800 particles which
were not cleaved with proteases (Thornton et al. 2005).

CHAPTER 4: Selective Entrapment of Elastase into PEGA Particles
144
Both dansyl chloride and FITC-labelled dextrans require the enzyme reaction to be
stopped and then the accessibility and diffusion of the target protease into PEGA
particles can be examined. However, real-time monitoring would be more advantageous
to directly visualise the accessibility, penetration and entrapment of a target protease into
functionalised PEGA particles. In cell biology, FITC is the simplest and cheapest way of
labelling a protein of interest. In this way, a FITC-labelled protein can then be used as a
tracer to examine the permeability or the location of the protein inside cells to
understand the cellular functions of the target protein (Berg et al. 2007). This chapter
takes advantage of this by labelling elastase with FITC to directly visualise the
accessibility and diffusion followed by entrapment of elastase into functionalised PEGA
particles in real-time via TPM.
TPM involves two-photon excitation which means that two photons (low energy) are
simultaneously absorbed to excite a fluorophore’s electrons in a single quantum event as
summarised in figure 40. The emission of fluorescence is of higher energy compared to
the excitatory photons (Rocheleau and Piston 2003; Ulijn et al. 2003b; Haugland 2005,
Invitrogen technical notes). However, the two photons are approximately twice the
wavelength of a one-photon excitation because the fluorescence emission depends on
the square of the excitation intensity (Rocheleau and Piston 2003; figure 40).
Figure 40. Jablonski diagram comparing the absorption of two-photon against one-photon. Left: a single-photon (one purple arrow) absorbed, generates fluorescence of an excited state. Right: simultaneous absorption of two-photons (two purple arrows) can produce identical fluorescence of an identical exited state. Abbreviations: So (ground state), S1 (excitated stated), purple arrow (absorbed photon), green arrow (fluorescence of an excited state). Figure adapted from Rocheleau and Piston 2003. Coinciding with TPM, confocal microscopy enables cross-sectional images to be
obtained, however for the hydrogel PEGA particles TPM is recommended (Ulijn et al.
So
S1
One-photon Two-photon

CHAPTER 4: Selective Entrapment of Elastase into PEGA Particles
145
2003b). In view of the fact that, the fluorescence can be quenched at the centre of
PEGA particles with confocal microscopy, whereas with TPM the spatial distribution of
the fluorophore, hence fluorescence is equally distributed across the entire surface and
interior of PEGA particle (Kress 2002; Ulijn et al. 2003b). This is because in TPM the
higher wavelength (lower photon energy) excitation produces fluorescence at the focal
point and does not produce background fluorescence because the excitation is confined
to the vicinity of the focus with no excitation outside the focal point. Therefore, the
fluorescence is purely generated from the sample that is in focus (Ulijn et al. 2003b;
Bosma et al. 2003). In this way, more of the excitation light can profoundly penetrate
into the sample (e.g. PEGA particles) to the plane of focus producing high quality 3D
cross-sectional images.
For the detection of protease activity, synthetic fluorescence substrates are more
commonly used as the assays are practical and highly sensitive. A fluorescence substrate
contains a fluorophore at one end with an ECP in the middle and a quencher at the other
end. In this way, enzyme activity is directly determined by an increase in fluorescence after
the protease cleaves a peptide bond of the ECP releasing the fluorophore which is then
excited by an external source to emit fluorescence (as described above). The commercial
fluorescence substrate, methylsucciyl-alanyl-alanyl-proline-valine-alanyl-coumarin (MeO-
Suc-Ala-Ala-Pro-Val-Ala-AMC) is graded as the second most fluorescence substrate used
to assess elastase activity of PPE compared to MeO-Suc-Ala-Ala-Pro-Val-Ala-pNA
(Castillo et al. 1979). On the contrary, in this thesis, MeO-Suc-Ala-Ala-Pro-Val-Ala-AMC
was selected since it is highly sensitive because its fluorophore i.e. 7-amino-4-
methylcoumarin (AMC) is effortlessly detected compared to the peptidyl-4-nitroanilide
(pNA) fluorophore of the MeO-Suc-Ala-Ala-Pro-Val-Ala-pNA fluorescence substrate
(Castillo et al. 1979). For the remaining chapters, MeO-Suc-Ala-Ala-Pro-Val-Ala-AMC
was used to demonstrate the reduction of elastase activity in sample fluids after they had
been treated with functionalised PEGA1900 particles.
For a chronic wound dressing, the capacity of the dressing to absorb wound exudates
containing proteases into the dressing is important depending on both the pH and ionic
strength of the wound environment. Consequently, in this chapter the pH of the buffer
solution was selected within the range of 7 – 9 in order to examine the accessibility,
diffusion and entrapment of elastase both in its cationic and anionic forms. In chapter 3,

CHAPTER 4: Selective Entrapment of Elastase into PEGA Particles
146
the selective hydrolysis of elastase was studied at low ionic strength, but for medical
relevance, the accessibility and diffusion of elastase is required to be studied at high ionic
strength in which 0.1 M was selected. This ionic strength was chosen since previously the
swelling of GAA particles was found to decrease un-expectantly at 0.2 M compared to
0.001 M – 0.1 M (see section 3.4.5). Consequently, 0.1 M was chosen as it is closer to
physiological ionic strength of 0.15 M.
4.2 OBJECTIVES
Having established in chapter 3 that Fmoc-X-Ala-Ala-PEGA1900 particles were more
appropriate in targeting elastase, accordingly the focus of this chapter was to understand
the selective hydrolysis of all ECPs (RAA, EAA, GAA) by sample fluids mimicking the
elastase environment (0.01 – 0.1 mg/ml) observed in chronic wounds under the
influence of pH 7 – 9 with an ionic strength of 0.1 M. In conjunction, a variety of
fluorescence techniques were used to understand and demonstrate the accessibility and
diffusion followed by entrapment of elastase (cationic and anionic forms) into
functionalised PEGA particles (RAA, EAA, GAA) depending on the pH and at high
ionic strength (as indicated).
4.3 MATERIALS & METHODS
4.3.1 Materials
PEGA(800 and 1900) – NH2 particles in methanol were supplied by Polymer Laboratories Ltd
(UK). Fmoc protected amino acids (Fmoc-Ala-OH.H2O, Fmoc-Arg(pbf)-OH, Fmoc-
Glu(OtBu)-OH, Fmoc-Gly-OH, Fmoc-Phe-OH) and the elastase substrate, MeO-Suc-
Ala-Ala-Pro-Val-AMC were all supplied by Bachem (UK). Elastase (pancreatic from
porcine pancreas, PPE, 3.9 mg/protein) was purchased from Worthington Biochemical
Corporation (USA). Aldrich (UK) supplied acetonitrile (ACN), dimetylformanide
(DMF), hydroxybenzotriazole (HOBt), di-isopropylcarbodimide (DIC). Piperidine and
potassium mono- and di-phosphate solution (1.0 M, 1L), FITC and FITC-labelled
dextrans (MW 20 kDa) were all purchased from Sigma (UK). HiPerSolv HPLC grade
ACN was from VMR international (UK). Dansyl chloride was purchased from Fluka
Analytical (UK). Precasted 4-20% Tris-glycine gels, molecular weight markers, loading

CHAPTER 4: Selective Entrapment of Elastase into PEGA Particles
147
buffer and Tris-glycine SDS (sodium dodecyl sulphate) buffer, Coomassie brilliant Blue
R-250, Mini-Protean® 3 Cell and PowerPacTM Univeral for electrophoresis were all
supplied by Biorad (Hertfordshire, UK). All solvents used were of the highest purity
without further purification. Isolute double fritted filtration columns were purchased
from Kinesis. Stuart Scientific supplied the blood rotator and roller mixer. HPLC 680
series was purchased from Dionex and the C18 nucleosil column was purchased from
Fisher.
4.3.2 Methods
4.3.2.1 Fmoc SPPS and Kaiser test
Functionalised PEGA particles with the configuration Fmoc-X-Ala-Ala-PEGA (RAA,
EAA, GAA) and Fmoc-X-Phe-Phe-PEGA (RFF, EFF and GFF) were prepared using
the protocol as previously described in chapter 3, section 3.2.2.2. The successful
coupling of amino acids and de-protecting of the Fmoc groups during SPPS was
monitored using the Kaiser test (see section 3.3.2.3).
4.3.2.2 Potassium phosphate buffer
Stocks of 0.001 M and 0.1 M potassium phosphate buffer within the pH range of 7.0 –
9.0 were prepared by serial dilution of the 1 M potassium mono- and di-phosphate
solutions in deionised water. Each buffer solution was adjusted to its desired pH with
HCl and NaOH using a pH meter.
4.3.2.3 Enzyme hydrolysis using HPLC
After SPPS, functionalised PEGA particles were thoroughly washed with MeOH, dH2O
and potassium phosphate buffer at appropriate pH (7, 8, 9) and ionic strength (0.001M
and 0.1M). Swollen functionalised PEGA1900 particles (50 mg) were then cleaved with
elastase (PPE, 2 ml at 0.01 or 0.1 mg/ml in 0.001M or 0.1M, pH 7 – 9) for various time
points at 34 – 37oC. The supernatants of the cleaved products were collected and the
reaction was stopped by washing the PEGA particles with ACN:H2O (80:20, 9 ml)
containing 0.1% TFA. This washing ensured that all the cleaved products were collected
from of the interior of the functionalised PEGA particles. The procedure was carried

CHAPTER 4: Selective Entrapment of Elastase into PEGA Particles
148
out in duplicates. The supernatants of the cleaved products were analysed by HPLC and
the percentage cleaved products were calculated as previously described in chapter 3
(section 3.3.2.6).
PEGA particles were then stained or incubated with various fluorophores (as described
below). In order to maintain the swelling of PEGA particles depending on pH and ionic
strength, prior to TPM the PEGA particles were washed with the appropriate buffer at
the appropriate pH and ionic strength (as indicated).
4.3.2.4 Dansyl chloride staining
After elastase hydrolysis, PEGA particles (un-cleaved/ cleaved) were thoroughly washed
with 0.1 M potassium phosphate buffer (at appropriate pH 7 – 9), followed by DMF:
MeOH (50:50) and finally with DMF. The prewashed PEGA particles were stained with
the fluorophore, dansyl chloride which reacts with free amine/ amino groups (figure 41)
that are present on both unmodified and cleaved PEGA particles (including amino
acids).
Figure 41. Chemical reaction of dansyl chloride with cleaved PEGA particles. The free amine group of cleaved PEGA particles (or of unmodified PEGA particles) react with dansyl chloride to generate dansylated-PEGA particles (dansyl-PEGA particles) that fluoresce blue when viewed by TPM.
Dansyl chloride (18 mg) was dissolved in 2 ml DMF and 20 µl DIPEA and this solution
was added to the foil wrapped filtration columns containing PEGA particles (un-
cleaved/ cleaved: 50 mg) and left to stain between 3 – 12 hours on a blood rotator at
room temperature. After staining, PEGA particles were thoroughly washed with DMF
to remove all excess dansyl chloride that did not react with the free amine group of
PEGA particles. The PEGA particles were further washed with MeOH: DMF (50:50),
N
S
Cl
O O
CH3
CH3
N
S
NH
O O
CH3
CH3
O
R1
N
O
NNH2
R1
+
Dansyl choride
PEGA particles
(with free amine group)
Dansylated-PEGA particles
DIPEA + DMF
(3 hours - overnight)

CHAPTER 4: Selective Entrapment of Elastase into PEGA Particles
149
MeOH, dH2O. Finally washed and swollen with potassium phosphate buffer (0.1 M and
pH 7 – 9) for 15 minutes in order to control the swelling of PEGA particles at 0.1 M and
at the desired pH 7 – 9. The fluorescence of the dansylated-PEGA particles was
examined using TPM at λexc 340 nm (excitation) and λem 490 nm (emission). Cross-
sectional equatorial images of PEGA particles were taken, which were quantified
according to section 4.3.2.8 (as described below).
4.3.2.5 SDS-Page
The molecular weight of the commercially bought porcine pancreatic elastase (3.9 mg per
protein at 1 mg/ml) was determined by SDS-polyacrylamide gel electrophoresis (SDS-
Page). Elastase was dissolved in dH2O (1 mg/ml) and then diluted (1:1, v/v) with Biorad
loading buffer (consisted of 0.125 M Tris-Cl, 4% SDS, 20% glycerol, 10% dithiothreitol,
0.2% bromphenol blue) and heated for 10 minutes at 100oC in a water bath. Molecular
weight marker (5 µl, lane 1) and elastase (10 µl, lane 2) were loaded into the wells of the
gel. Elastase was electrophoretically separated on a pre-casted 4 – 20% SDS-Page gel
using 1X Tris-glycine SDS buffer at step voltage changes: at an initial constant voltage of
100 mV for 15 minutes to align the proteins and then at a final constant voltage of 200
mV for 45 minutes to separate into individual bands. Elastase bands were visualised by
staining the gel with Coomassie brilliant Blue R-250 and the gel was destained with 40%
methanol and 10% acetic acid for up to an hour at room temperature. The gel was then
transferred to a plastic cassette and subsequently wrapped with cling film and then
imaged using a flatbed scanner.
4.3.2.6 Accessibility of FITC-dextran
After SPPS and enzyme hydrolysis, un-cleaved/ cleaved functionalised PEGA particles
(50 mg) were thoroughly washed with potassium phosphate buffer (at pH 8 and at
0.001M or 0.1 M ionic strength). FITC-labelled dextran with a molecular weight of 20
kDa was dissolved in potassium phosphate buffer (at pH 8 with an ionic strength of
0.001M or 0.1 M) at a concentration of 1 mg/ml. To protect the FITC from light, the
vials were foil wrapped. Pre-washed functionalised PEGA particles (un-cleaved/
cleaved, 5 mg) were added to a glass slide and 1 drop of the FITC-labelled dextran was
added to the particles on the glass slide. The permeability of the 20 kDa FITC-labelled

CHAPTER 4: Selective Entrapment of Elastase into PEGA Particles
150
dextran into the core of PEGA particles was monitored by taking cross-sectional
equatorial images of PEGA particles using TPM at λexc 494 nm and λem 520 nm over the
course of 10 - 30 minutes. The fluorescence of the cross-sectional equatorial images was
quantified using the analysis software as described in section 4.3.2.8 below.
4.3.2.7 Accessibility of FITC-elastase
O
O
OOH OH
S=C=N
R-NH2
O
O
OOH OH
R-N-C=N
SH
H
+
Elastase
FITC FITC-elastase
Figure 42. Chemical reaction of staining elastase with the base fluorescein molecule, FITC. The free amine groups within the elastase structure were coupled and cross-linked with FITC to generate a fluorescence-labelled elastase, referred as FITC-elastase.
The chemical reaction of cross-linking FITC to elastase is given in figure 42. A 24-fold
molar ratio is optimal for the conjugation of FITC (MW: 389 Da) with proteins. In a foil
wrapped vial, FITC dye (1 mg) was dissolved in DMF (100 µl) and the FITC dye was
completely dissolved by drawing the solution up-and-down using a micropipette.
Elastase (1 mg/ml) was dissolved in PBS buffer (pH 7.4, 0.15 M) in another foil wrapped
vial.
The appropriate amount of FITC (36.05 µl) was transferred to the elastase containing
vial. FITC dye and elastase were thoroughly mixed by drawing them up-and-down using
a micropipette and then incubated at room temperature for 1 hour on a blood rotator.
After labelling, FITC-elastase was then dialysed to remove any excess FITC dye that did
not crosslink to elastase. A dialysis tube (pore size 12 kDa) was cut to size and a clip was
placed at the bottom of the tube. The FITC-elastase solution was added into the dialysis
tube and the top of the dialysis tube with closed by another clip. The dialysis tube was
then dialysed in a beaker containing PBS (pH 7.4, 0.15 M) and to protect the FITC from
the surrounding light the beaker was covered with foil. The beaker was placed on a
stirrer-plate and continuously stirred in the range of 1 – 3 hours (maximum: overnight) at
room temperature. After that FITC-elastase was transferred to a clean foil wrapped vial
and stored at 4oC.

CHAPTER 4: Selective Entrapment of Elastase into PEGA Particles
151
After SPPS, functionalised PEGA particles were thoroughly washed with dH2O and then
with PBS buffer (0.15M, pH 7.4). Functionalised PEGA particles (5 – 10 mg) were
added to glass slide, then two drops of FITC-elastase was added and after that the direct
penetration of fluorescently labelled elastase into PEGA particles was viewed by taking
cross-sectional equatorial images of functionalised PEGA particles using TPM at λexc 494
nm and λem 520 nm over the course of 15 minutes. The fluorescence of the cross-
sectional equatorial images was quantified using Leica or Image J analysis softwares as
described in section 4.3.2.8.
4.3.2.8 Quantification of TPM micrographs
The cross-sectional equatorial images of PEGA particles obtained from TPM were
quantified using two different analysis softwares. The average fluorescence was
quantified using the Leica analysis software, whereas the pixel intensity across the cross-
sectional images was quantified using Image J analysis software.
4.3.2.9 Fluorescence substrate assay
The fluorescence elastase substrate, MeOSuc-Ala-Ala-Pro-Val-AMC consisted of the
AMC fluorophore which was used to study elastase activity. The mode of substrate
hydrolysis by elastase is summarised in figure 43. The fluorescence substrate was
dissolved in 2 ml methanol (10 mM) and was further diluted to 20 ml with 0.1 M
potassium phosphate buffer within the range of pH 7 – 9 with a final concentration of
0.5 mM (1X stock). For enzyme kinetic studies, various concentrations of the
fluorescence substrate were prepared by initially dissolving the fluorescence substrate in
MeOH and then diluting it with 0.1 M potassium phosphate buffer to give a final
concentration that was: 10-fold, 5-fold, 2- fold, 1-fold in comparison to 1X stock. The
fluorescence substrate concentration of 2X (1.0 mM) was made using the same principles
as the 1X stock (Note: due to low solubility of the fluorescence substrate, concentrations
> 5X did not obey Michealis-Menten kinetics).
Elastase (PPE, 0.01 mg/ml) was dissolved in 0.1 M potassium phosphate buffer at pH 7
– 9. The fluorescence substrate assay was performed by incubating 50 µl of the

CHAPTER 4: Selective Entrapment of Elastase into PEGA Particles
152
fluorescence substrate with 50 µl of the sample fluid. The sample fluid was either: (1)
Fluids containing elastase (PPE, 0.01 mg/ml); and (2) supernatants collected after
elastase was treated with functionalised PEGA particles at various time points. The
fluorescence for the hydrolysis of the substrate was measured at λexc 383 nm (excitation)
and λem 405 nm (emission) continuously for 14 hours. The rate of elastase activity was
expressed as RFU hr-1. After sample fluids were treated with functionalised PEGA
particles the rate of elastase activity was corrected according to the mass of PEGA
particles used i.e. rate / mass: RFU hr-1/mg. All assays were performed at 34 – 37oC in
a black 96-well plate with duplicate measurements.
NH
CH
NH
NCH3
ONH
CH
NH
CH
O
O CH3
O CH3
O
OCH
3CH
3
O
O
CH3
O
NH2
O
CH3
O
CH3
ONH
CH
O
O CH3
O
OH NH2
CH
OH
CH3
CH3
O
NNH
2
CH
CH3
O
O
OH
Elastase
MeOSuc-Ala-Ala-Pro-Val-AMC
AMC
+
MeOSuc-Ala-OH Ala-Pro
+ +
Valine
Figure 43. The mechanism for the cleaving of the fluorescence-quenched substrate: MeOSuc-Ala-Ala-Pro-Val-AMC by elastase. In this FRET substrate, the AMC (blue) fluorophore is conjugated to the peptide Ala-Ala-Pro-Val via an amide bond between the amine of coumarin and the carboxyl group of the C-terminal valine residue. Hydrolysis of this amide bond, including both the Ala-Ala and Pro-Val bonds in presence of elastase releases a free AMC causing the fluorescence to increase which is then monitored over time. Hydrolysis of peptide bonds is indicated by red lines. Figure tailored from Novabiochem (letters 02/05) and Patrick 2010.
4.3.2.10 Statistics
Data are expressed as the mean value + SEM and statistical analysis was carried out using
SPSS 16.0. Statistical significance was determined using ANOVA test (one-way and two-
way full factorial) and for pair-wise comparisons, post-hoc (Tukey and Duncan) tests
alongside the Student-test were conducted. A significant difference was observed at the
95% confidence level in which P values below 0.05 (i.e. p < 0.05) were considered
hν

CHAPTER 4: Selective Entrapment of Elastase into PEGA Particles
153
statistically significant and values above 0.05 (i.e. p > 0.05) were not statistically
significant.
4.4 RESULTS & DISCUSSION
4.4.1 Selective hydrolysis of ECPs by elastase at high ionic strength as a
function of pH
Here, functionalised PEGA particles with the ECPs: RAA, EAA, GAA (test) and RFF,
EFF, GFF (control) were treated with elastase (PPE, 0.1 mg/ml) at pH 7 – 9 and 0.1 M.
Elastase was found to selectively cleave the Fmoc-X-Ala-Ala-PEGA particles (1.50 –
6.23%) significantly more compared to Fmoc-X-Phe-Phe-PEGA particles (0.36 – 0.84%)
(p < 0.05) as summarised in figure 44. On the basis of charge, the selectively of elastase
to cleave RFF, EFF and GFF was not significantly different (p > 0.05). However, as
expected for the Fmoc-X-Ala-Ala-PEGA1900 particles in its cationic form elastase
selectively cleaved EAA more (pH 7 – 8: 6.23 %) compared to both RAA (pH 7: 3.33 %
and pH 8: 4.70 %) and GAA (pH 7: 1.50 % and pH 8: 3.70 %). The opposite effect was
observed at pH 9 wherein elastase in its anionic form selectively cleaved RAA (5.39 %)
more compared to both EAA (4.70 %) and GAA (4.64 %).
It can be seen that the yields of the cleaved products for the Fmoc-X-Ala-Ala-PEGA
particles (figure 44: 1.50 – 6.23 %) are much lower than those obtained in chapter 3
(figure 30). This difference was expected given that in chapter 3 the selective hydrolysis
of RAA, EAA and GAA by elastase was studied at low ionic strength (0.001 M) whereas
in this chapter it is studied at high ionic strength (0.1 M). Previously, the swelling of
RAA, EAA and GAA was significantly more at 0.001 M than 0.1 M (figure 34 in chapter
3). In this way, it is expected that the accessibility of elastase into functionalised PEGA
to reduce at high ionic strength and as a consequence the amount of ECPs cleaved by
elastase would also reduced at 0.1 M (figure 44) in contrast to 0.001 M (figure 30 in
chapter 3).

CHAPTER 4: Selective Entrapment of Elastase into PEGA Particles
154
0
2
4
6
8
RAA EAA GAA RFF EFF GFF
Cle
ave
d p
rod
uct
(%)
pH 7.0
pH 8.0
pH 9.0
Figure 44. Selective hydrolysis of Fmoc-X-Ala-Ala-PEGA1900 particles and Fmoc-X-Phe-Phe-PEGA1900 particles by elastase at high ionic strength under the influence of pH. These particles were treated with elastase at a concentration of 0.1 mg/ml within the pH range of 7.0 – 9.0 in 0.1M potassium phosphate buffer for 3 hours on a blood rotator at 34oC. The cleaved products were collected and analysed by rpHPLC. Elastase selectively cleaved the RAA, EAA, and GAA PEGA1900 particles significantly more than RFF, EFF and GFF PEGA1900 particles (p < 0.05). Cationic elastase (pH 7 – 8) had preference of cleaving EAA (negative) significantly more than RAA (positive) and GAA (neutral); and the opposite effect was observed wherein anionic elastase (pH 9) had preference of cleaving RAA more compared to EAA. Statistical analysis was conducted using ANOVA and pair-wise comparisons were conducted by post hoc (Tukey and Duncan) test: a significant difference observed at the 95% confidence level (p < 0.05). Data represents the mean + SE of two measurements (n = 2). .
4.4.2 Fluorescence studies
4.4.2.1 Diffusion of elastase via dansyl chloride
Next, the diffusion of elastase into functionalised PEGA1900 particles was monitored
using dansyl chloride staining. After the ECPs of functionalised PEGA1900 particles were
cleaved by elastase (0.1 mg/ml), the free amine groups of the cleaved PEGA1900 particles
were stained with dansyl chloride (for chemical reaction see figure 41). After that, cross-
sectional equatorial images were obtained using TPM in which the fluorescence of the
dansylated-PEGA particles was used to visualise and measure the accessibility/ diffusion
of elastase into functionalised PEGA particles at 0.1 M as a function of pH. Un-cleaved
functionalised PEGA1900 particles were used as a control (0 minutes, figure 45 and 46) to
demonstrate that the ECP had fully coupled unmodified PEGA1900 particles during SPPS
and to compare the fluorescence observed by the cleaved functionalised PEGA1900
particles between 5 – 60 minutes.

CHAPTER 4: Selective Entrapment of Elastase into PEGA Particles
155
0
50
100
150
200
250
RFF EFF GFF
Ave
rag
e F
luore
scen
ce (
RF
U)
0 min 5 min 15 min 30 min 60 min
Figure 45. TPM micrographs (top) and the average fluorescence graph (bottom) depicting the fluorescence labelling after un-cleaved and cleaved Fmoc-X-Phe-Phe-PEGA1900 particles (RFF, EFF and GFF) were stained with dansyl chloride at pH 8 (0.1 M). Note: the fluorescence of the un-cleaved particles at 0 min represented the baseline levels; as a result the fluorescence of the cleaved particles (5 – 60 min) were normalised by subtracting the fluorescence of baseline values for each Fmoc-X-Phe-Phe-PEGA1900 particles. ECPs were fully coupled to unmodified PEGA1900 as the un-cleaved Fmoc-X-Phe-Phe-PEGA1900 particles (0 min) were found to fluoresce to a lesser extent compared to the cleaved Fmoc-X-Phe-Phe-PEGA1900 particles (5 – 60 min). Unexpectedly the cleaved RFF, EFF and GFF PEGA1900 particles were found to fluoresce to a high degree compared to un-cleaved particles. Scale bars range from 50 - 100 µm (as indicated). Data represents the mean + SE of the whole well fluorescence (n = > 15 particles).
The manufacturer (Worthington Biochemical Corporation) reported elastase to have an
optimum pH at 8.0, therefore as a starting point the diffusion of elastase by dansyl
chloride staining was examined at pH 8.0 first. It was observed that the fluorescence of
the un-cleaved functionalised PEGA1900 particles (0 minutes) was low compared to the
cleaved products (5 – 60 minutes). This indicated that the ECPs: RFF, EFF, GFF (figure
0 min 5 min 15 min 30 min 60 min
RFF
EFF
GFF

CHAPTER 4: Selective Entrapment of Elastase into PEGA Particles
156
45) and RAA, EAA, and GAA (figure 46) were fully coupled to unmodified PEGA1900
particles.
0
50
100
150
200
250
RAA EAA GAA
Ave
rag
e F
luore
scen
ce (
RF
U)
0 min 5 min 15 min 30 min 60 min
Figure 46. TPM micrographs (top) and the average fluorescence (bottom) illustrating the fluorescence observed after un-cleaved and cleaved Fmoc-X-Ala-Ala-PEGA1900 particles (RAA, EAA and GAA) were stained with dansyl chloride at pH 8 (0.1 M). Note: the fluorescence of the un-cleaved particles at 0 min represented the baseline levels; as a result the fluorescence of the cleaved particles (5 – 60 min) were normalised according to the baseline values for each Fmoc-X-Ala-Ala-PEGA1900 particles. ECPs were fully coupled to unmodified PEGA1900 as the un-cleaved Fmoc-X-Ala-Ala-PEGA1900 particles (0 min) were found to fluoresce to a lesser extent compared to cleaved Fmoc-X-Ala-Ala-PEGA1900 particles (5 – 60 min). The fluorescence of all cleaved particles was found to increase over time, and was completely saturated at 60 minutes. Scale bars represent 75 – 250 µm (as indicated). Data represents the mean + SE of the whole well fluorescence (n = > 15 particles).
Since elastase was previously found to cleave RFF, EFF and GFF to a lesser extent than
RAA, EAA and GAA (see figure 44), it was predicted that the cleaved Fmoc-X-Phe-Phe-
PEGA1900 particles should fluoresce at a lower degree than Fmoc-X-Ala-Ala-PEGA1900
particles. However, both the un-cleaved and cleaved Fmoc-X-Phe-Phe-PEGA1900
RAA
EAA
GAA
0 min 5 min 15 min 30 min 60 min

CHAPTER 4: Selective Entrapment of Elastase into PEGA Particles
157
particles (figure 45) were found to fluoresce to a high degree in contrast to Fmoc-X-Ala-
Ala-PEGA1900 particles (figure 46). The un-cleaved Fmoc-X-Phe-Phe-PEGA1900 particles
had an average fluorescence of 35.46 RFU at 0 minutes; whereas the cleaved particles
were found to fluoresce in the range of: 111.36 – 210.93 RFU (RFF), 12.09 – 218.67
RFU (EFF) and 167.40 – 220.41 RFU (GFF) between 5 – 60 minutes (figure 45). In
contrast the average fluorescence of the un-cleaved Fmoc-X-Ala-Ala-PEGA1900 particles
was 28.59 RFU (at 0 minutes) and the cleaved particles were found to fluoresce in the
range of: 66.89 – 223.88 RFU (RAA), 1.03 – 227.03 RFU (EAA) and 8.72 – 224.58 RFU
between 5 – 60 minutes (figure 46). The possible reason for the increase in fluorescence
observed by the cleaved Fmoc-X-Phe-Phe-PEGA1900 particles is because the aromatic
side chains of the Phe residues of the ECPs and the aromatic groups of dansyl chloride
are in close proximity of one another (Creighton 1993). This means that when dansyl
chloride was excited by TPM, it is possible that energy was transferred between the
aromatics groups causing the fluorescence of the cleaved particles to increase (Creighton
1993). Subsequently, in order to avoid obtaining false observations, for the remaining
experiments, the accessibility/ diffusive behaviour of elastase into Fmoc-X-Phe-Phe-
PEGA1900 particles by various fluorophores was abandoned.
From figure 46 it can be seen over the course of time, elastase increasingly penetrated
Fmoc-X-Ala-Ala-PEGA1900 particles since the fluorescence of the cleaved Fmoc-X-Ala-
Ala-PEGA1900 particles was found to gradually increase from 5 – 60 minutes. The
expected observation was only observed at 15 minutes in which elastase in its cationic
form was found to diffuse into the EAA particles more compared to both RAA and
GAA particles. Un-expectantly, at both 5 and 30 minutes cationic elastase was found to
diffuse and cleaved the RAA ECP (5 min: 89.20 RFU and 30 min: 216.31 RFU)
significantly more compared to EAA (5 min: 1.03 RFU and 30 min: 90.70 RFU) (p <
0.05). There was no significant difference in the diffusion of elastase at 60 minutes as
the average fluorescence for all cleaved Fmoc-X-Ala-Ala-PEGA1900 particles was
significantly similar i.e. RAA: 223.88 RFU; EAA: 227.03 RFU and GAA: 224.58 RFU (p
> 0.05). For that reason, > 60 minutes was considered as the sufficient time to cleave all
ECPs from functionalised PEGA1900 particles.
Next, several attempts were carried out to visual that elastase (0.1 mg/ml at pH 8 and
0.1M) firstly cleaved the ECPs of Fmoc-X-Ala-Ala-PEGA1900 particles from the outer

CHAPTER 4: Selective Entrapment of Elastase into PEGA Particles
158
surface and then following its diffusion into Fmoc-X-Ala-Ala-PEGA1900 particles elastase
cleaved the ECPs located within the inner-central core of Fmoc-X-Ala-Ala-PEGA1900
particles. It was difficult to capture this by TPM at 0.1 M, as the entire surface of the
Fmoc-X-Ala-Ala-PEGA1900 particles appeared to be cleaved within 5 minutes seeing as
no ring-effect was observed at this time point (figure 46). A brief description illustrating
the meaning of a ‘ring-effect’ has been given in figure 67 (see appendix III). This
suggested that as soon as elastase was treated with Fmoc-X-Ala-Ala-PEGA1900 particles
the elastase reaction was completed within 2 – 5 minutes for the entire surface (i.e. outer
and inner) of the cleaved particles. For that reason, it was envisaged that possibly
slowing down the enzyme reaction may facilitate the formation of rings; consequently the
concentration of elastase was diluted to 0.01 mg/ml. In addition, since the entire surface
appeared to be cleaved at 0.1 M, the ionic strength was reduced as well because
previously in chapter 3 the swelling of Fmoc-X-Ala-Ala-PEGA1900 particles was more
profound at low ionic strength (0.001 M) compared to high ionic strength (0.1 M).
Subsequently, a time course study was then carried out in which Fmoc-X-Ala-Ala-
PEGA1900 particles were cleaved with elastase (0.01 mg/ml at pH 8 and 0.001 M) and the
elastase reaction was stopped at various time points as indicated in figure 47.
From figure 47, the un-cleaved Fmoc-X-Ala-Ala-PEGA1900 particles (0 min) were found
to fluorescence to a lesser extent compared to cleaved Fmoc-X-Ala-Ala-PEGA1900
particles (5 – 180 min). This indicated that all ECPs were successfully coupled to
unmodified PEGA1900 particles during SPPS. As expected, the cationic form of elastase
had preference to diffuse into EAA particles more compared to both RAA and GAA
particles. Interestingly, from the TPM micrographs a ring-effect of fluorescence was
observed for the EAA particles (figure 47a). These micrographs clearly demonstrated
that elastase first diffused into EAA particles and cleaved the ECPs from the outer
surface < 5 minutes. Then, elastase diffused into the inner-core of EAA particles
wherein the ECP was gradually cleaved from the inner surface and then completely from
the centre of EAA particles with 30 minutes compared to RAA and GAA (figure 47a).
However, from the pixel intensity graph (figure 45b) it was measured that the ECP was
completely cleaved from the centre of EAA particles within 1 hour rather than 30
minutes as fluorescence for dansyl chloride staining was found to be homogenous
between 60 – 180 minutes since the average fluorescence was not significantly different

CHAPTER 4: Selective Entrapment of Elastase into PEGA Particles
159
(72.72 – 75.79 RFU: p > 0.05; figure 45b). To further confirm this, at each time point
the cleaved products were collected and analysed by rpHPLC. From figure 45c it can be
seen that the cationic form of elastase selectively hydrolysed the negatively charged ECP
(EAA: 20.79 – 60.92 %) more compared to both the positive ECP (RAA: 0.23 – 0.78 %)
and neutral ECP (GAA: 1.65 – 2.68 %).
(a)
(b) (c)
0
25
50
75
100
0 25 50 75 100 125 150 175 200
Time (minutes)
Pix
el
Inte
nsi
ty (
RF
U)
RAA
EAA
GAA
0
25
50
75
100
0 50 100 150 200
Time (minutes)
Cle
aved
pro
du
ct
(%)
RAA
EAA
GAA
Figure 47. The selective diffusion of elastase into Fmoc-X-Ala-Ala-PEGA1900 particles (RAA, EAA and GAA) followed by the selective hydrolysis of the corresponding ECPs in potassium phosphate buffer at pH 8 and 0.001M monitored over the course of 180 minutes. (a) TPM micrographs demonstrating the fluorescence observed after un-cleaved and cleaved Fmoc-X-Ala-Ala-PEGA1900 particles were stained with dansyl chloride (a). The pixel intensity graph was plotted by measuring the average fluorescence across the equatorial cross-section of the TPM micrographs illustrating the gradual diffusion of elastase into RAA, EAA and GAA particles (b) in which the data represents the mean + SE of the whole well fluorescence (n = 10 particles). At each time point, the cleaved products were collected and analysed by rpHPLC (c) in which the data represents the mean + SE of two measurements (n = 2). In its cationic form, elastase selectively diffused into EAA particles and cleaved its ECP significantly more compared to both RAA and GAA particles (p < 0.05). Scale bar of TPM micrographs represent 75 – 100 µm (as indicated).
0 min 10 min 180 min 60 min 30 min 5 min
RAA
EAA
GAA

CHAPTER 4: Selective Entrapment of Elastase into PEGA Particles
160
Next, the diffusion of elastase was examined at pH 7 and pH 9 after Fmoc-X-Ala-Ala-
PEGA particles were cleaved for 3 hours with elastase (0.1 mg/ml) at 0.1 M rather than
0.001 M. This is because previously at 0.1 M we encountered that elastase in its cationic
form (pH 8) penetrated RAA particles more compared to EAA and GAA (figure 46).
Consequently, it would be interesting to examine whether the same effect is observed at
pH 7 seeing as elastase is positively charged at both pH 7 and pH 8.
0
50
100
150
200
250
300
RAA EAA GAA
Ave
rag
e F
luo
resc
ence
(R
FU
)
pH 7 pH 9
Figure 48. TPM micrographs demonstrating the diffusion of elastase after Fmoc-X-Ala-Ala-PEGA1900 particles were cleaved with elastase for 3 hours at pH 7 and pH 9 (0.1 M). In its cationic form, elastase unexpectedly diffused and cleaved the RAA particles significantly compared to EAA and GAA particles. However, at pH 9, the expected effect was observed at pH 9, wherein elastase in its anionic forms selectively diffused into RAA more compared to EAA and GAA. Scale bar represents 250 µm; and the data represents the mean + SE of the whole well fluorescence (n = > 15 particles).
RAA EAA GAA
pH 9
pH 7
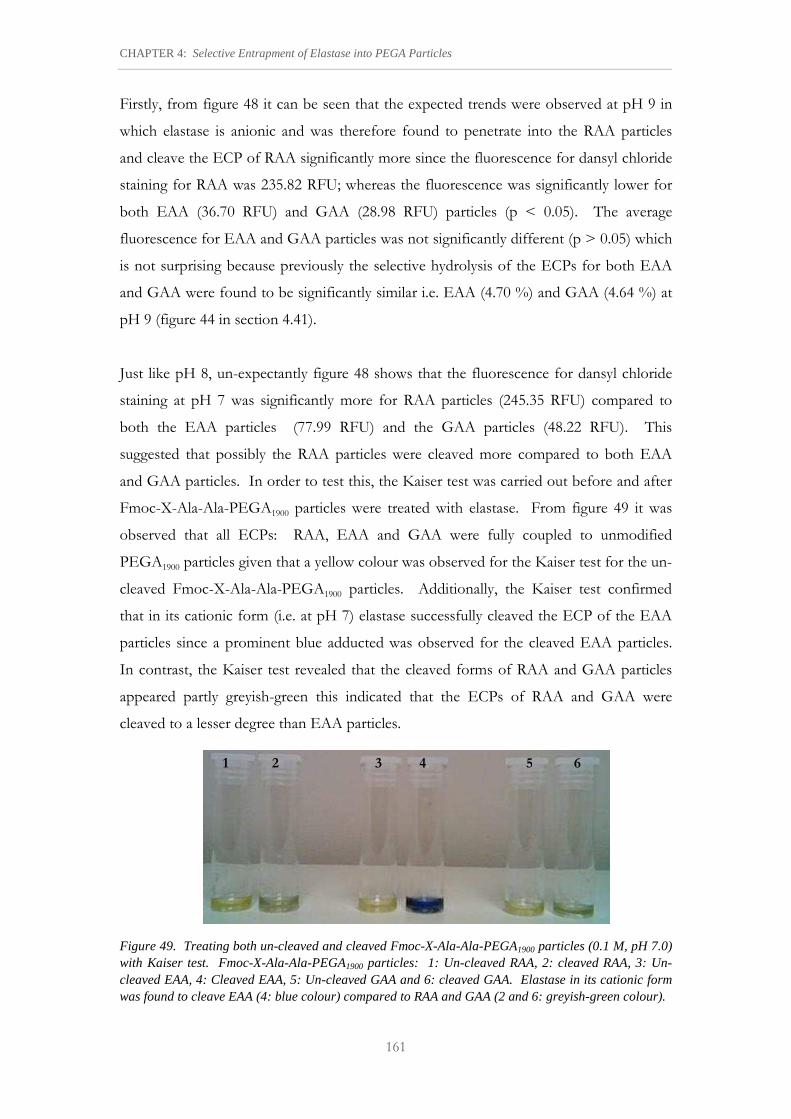
CHAPTER 4: Selective Entrapment of Elastase into PEGA Particles
161
Firstly, from figure 48 it can be seen that the expected trends were observed at pH 9 in
which elastase is anionic and was therefore found to penetrate into the RAA particles
and cleave the ECP of RAA significantly more since the fluorescence for dansyl chloride
staining for RAA was 235.82 RFU; whereas the fluorescence was significantly lower for
both EAA (36.70 RFU) and GAA (28.98 RFU) particles (p < 0.05). The average
fluorescence for EAA and GAA particles was not significantly different (p > 0.05) which
is not surprising because previously the selective hydrolysis of the ECPs for both EAA
and GAA were found to be significantly similar i.e. EAA (4.70 %) and GAA (4.64 %) at
pH 9 (figure 44 in section 4.41).
Just like pH 8, un-expectantly figure 48 shows that the fluorescence for dansyl chloride
staining at pH 7 was significantly more for RAA particles (245.35 RFU) compared to
both the EAA particles (77.99 RFU) and the GAA particles (48.22 RFU). This
suggested that possibly the RAA particles were cleaved more compared to both EAA
and GAA particles. In order to test this, the Kaiser test was carried out before and after
Fmoc-X-Ala-Ala-PEGA1900 particles were treated with elastase. From figure 49 it was
observed that all ECPs: RAA, EAA and GAA were fully coupled to unmodified
PEGA1900 particles given that a yellow colour was observed for the Kaiser test for the un-
cleaved Fmoc-X-Ala-Ala-PEGA1900 particles. Additionally, the Kaiser test confirmed
that in its cationic form (i.e. at pH 7) elastase successfully cleaved the ECP of the EAA
particles since a prominent blue adducted was observed for the cleaved EAA particles.
In contrast, the Kaiser test revealed that the cleaved forms of RAA and GAA particles
appeared partly greyish-green this indicated that the ECPs of RAA and GAA were
cleaved to a lesser degree than EAA particles.
Figure 49. Treating both un-cleaved and cleaved Fmoc-X-Ala-Ala-PEGA1900 particles (0.1 M, pH 7.0) with Kaiser test. Fmoc-X-Ala-Ala-PEGA1900 particles: 1: Un-cleaved RAA, 2: cleaved RAA, 3: Un-cleaved EAA, 4: Cleaved EAA, 5: Un-cleaved GAA and 6: cleaved GAA. Elastase in its cationic form was found to cleave EAA (4: blue colour) compared to RAA and GAA (2 and 6: greyish-green colour).
1 2 3 4 5 6

CHAPTER 4: Selective Entrapment of Elastase into PEGA Particles
162
Next, it was envisaged that possibly the Arg residues were localised by dansyl chloride at
pH 7. In this way, the problem was further investigated by staining unmodified and
ionic PEGA1900 particles with dansyl chloride. The ionic particles were coupled with
Fmoc-Arg(+) (positively charged) and Fmoc-Glu(–) (negatively charged). From figure 50,
it was observed that the unmodified PEGA1900 particles were found to fluoresce
significantly more (9.50 RFU) than both the Fmoc-Arg(+)-PEGA1900 particles (6.24 RFU)
and the Fmoc-Glu(–)-PEGA1900 particles (1.00 RFU). This was expected because
unmodified PEGA particles contain a lot more free amino groups (NH2) compared to
functionalised PEGA1900 particles as the amine groups of these particles are protected by
a terminal Fmoc-group which cannot be stained by dansyl chloride.
0
2
4
6
8
10
12
PEGA Fmoc-Arg(+)-PEGA Fmoc-Glu(-)-PEGA
Pix
el
Inte
nsi
ty (
RF
U)
Figure 50. Comparing the pixel fluorescence intensity at pH 7 (0.1 M) after unmodified and ionic PEGA1900 particles were stained with dansyl chloride. Unmodified PEGA1900 particles were found to fluorescence significantly more because these particles contained more free amine groups compared to ionic PEGA1900 particles. The amine groups of the ionic PEGA1900 particles (Fmoc-Arg(+)-PEGA and Fmoc-Glu(-)-PEGA) are protected by the terminal Fmoc-group during SPPS causing the fluorescence to decrease. An increase in fluorescence was observed for Fmoc-Arg(+)-PEGA particles compared to Fmoc-Glu(-)-PEGA particles. This is because there is an effect of localised pH on the dansyl group with the Arg residues for Fmoc-Arg(+)-PEGA particles. Length of scale bar for: PEGA (69 µm), Fmoc-Arg(+)-PEGA (73.24 µm) and Fmoc-Glu(-)-PEGA (62.84 µm). Data represents the mean + SE of the whole well fluorescence (n = 10 particles).

CHAPTER 4: Selective Entrapment of Elastase into PEGA Particles
163
Studies have shown that the dansyl chloride reaction with peptides and amino acids is
susceptible to hydrolysis depending on the pH. It has been reported that the rate of
hydrolysis for dansyl chloride reaction is stable up to pH 9.5 (Gros and Labouesse 1969;
Walker 1996). However, other studies have reported that in order to successfully react
free amine groups with dansyl chloride, then the dansyl chloride reaction must be carried
out at a pH > 8.5 (Gray 1967) or more specifically in the range of pH 9.5 – 10.5 (Walker
1996). This is because if the pH increases above this pH range then the hydrolytic
reaction for dansyl chloride increases via base catalysed reaction (Gros and Labouesse
1969). Therefore, since the Arg side chain has a pKa of 12.48
this means that it provides a basic environment as a result it is possible that the
hydrolytic reaction increased via base catalysed reaction which consequently hydrolysed
the dansyl chloride reagent (Gros and Labouesse 1969). In this manner, it is most likely
that the Fmoc-group was hydrolysed via OH– catalysed reaction which therefore caused
the fluorescence of the Arg containing particles i.e. Fmoc-Arg(+)-Ala-Ala-PEGA1900
particles and Fmoc-Arg(+)-PEGA1900 particles to increase.
Moreover, at the required pH range (pH > 8.5 – 10. 5) the N-terminal amino group
remains in the unprotonated i.e. NH2 form and this facilitates the labelling reaction with
dansyl chloride (Walker 1996; Gros and Labouesse 1969). In contrast, the unreactive
protonated form of an N-terminal amino group (NH3+) could potentially alter the pH
value outside the required pH range of the dansyl chloride reaction (Walker 1996) or
slow the labelling reaction down if the pH is lower than pH 8 (Sandhu and Robbins
1989). Since the labelling reaction for dansyl chloride was slow at pH 7 and pH 8, this
explains why the fluorescence of the Glu(–) containing particles i.e. Fmoc-Glu(–)-Ala-Ala-
PEGA1900 particles (figures 44 and 46) and Fmoc-Glu(–)-PEGA1900 particles (figure 48)
was found to decrease. Overall, it was found the dansyl chloride approach was not
suitable for assessing the diffusion of elastase into PEGA particles containing both acidic
and basic groups and for that reason this method was abandoned.
4.4.2.2 Accessibility of a FITC-labelled dextran into PEGA particles
As the aim of this thesis involved designing a wound dressing that would selectively
remove elastase by entrapping it inside functionalised PEGA1900 particles, this section
investigated whether a FITC-labelled dextran with a molecular weight as low as 20 kDa

CHAPTER 4: Selective Entrapment of Elastase into PEGA Particles
164
could access Fmoc-X-Ala-Ala-PEGA1900 particles at high ionic strength after these
functionalised PEGA1900 particles had been treated with elastase. The 20 kDa FITC-
labelled dextran was chosen as its molecular weight was lower than the molecular weight
of elastase. Firstly, the molecular weight of elastase was confirmed by SDS-page, and the
active form of PPE had a molecular weight of 25.9 kDa (figure 68: appendix III).
Consequently, this suggests that elastase has the ability of penetrating into PEGA1900
particles since these particles have a molecular weight cut-off of 35 kDa (Kress et al.
2002; Polymer Laboratories Ltd). Nevertheless, the accessibility of proteases into PEGA
particles can vary owing to the swelling of PEGA particles depending on the ionic
strength in addition to the selective hydrolysis of ECPs by protease.
Un-cleaved and cleaved PEGA1900 particles (5 mg of RAA, EAA and GAA) were washed
and swollen in 0.1 M potassium phosphate buffer at pH 8 and they were then incubated
with the 20 kDa FITC-labelled dextran in which its accessibility into the PEGA1900
particles was monitored using TPM. For the un-cleaved PEGA1900 particles, it can be
seen from the pixel intensity graphs that within 10 minutes the 20 kDa FITC-labelled
dextran diffused into the charged PEGA particles (RAA and EAA) more compared to
neutral particles (GAA) as the fluorescence was found to increase from 0 – 10 minutes
(figure 51: green).
However, after elastase cleaved the ECP of the Fmoc-X-Ala-Ala-PEGA1900 particles it
was expected that the molecular accessibility of the cleaved Fmoc-X-Ala-Ala-PEGA1900
PEGA particles decreased by limiting the amount of the 20 kDa FITC-labelled dextran
diffusing into the cleaved PEGA particles. From the pixel intensity graph the
fluorescence for the RAA particles was to found to increase (figure 51: top, red) this
showed that the 20 kDa FITC-labelled dextran penetrated into the cleaved RAA particles
at 0.1 M. In contrast, the accessibility of the 20 kDa FITC-labelled dextran into the
cleaved EAA particles was found to reduce (figure 51: middle, red). These observations
were expected seeing as elastase in its cationic form has the preference of selectively
cleaving the negative ECP (EAA) more than the positive ECP (RAA) as previously
observed in figure 44 (HPLC analysis). Lastly, it was seen that the 20 kDa FITC-labelled
dextran was unable to penetrate into the GAA particles after they had been treated with
elastase (figure 51: bottom, red). Additionally, there was no difference in the accessibility
of the 20 kDa FITC-labelled dextran into both the un-cleaved and cleaved GAA

CHAPTER 4: Selective Entrapment of Elastase into PEGA Particles
165
particles, as the fluorescence intensity for the un-cleaved and cleaved GAA particles was
the same (figure 51: bottom).
0
25
50
75
100
0 200 400Diameter (pixels)
Inte
nsi
ty (
Pix
els)
0
25
50
75
100
0 200 400Diameter (pixels)
Inte
nsi
ty (
Pix
els)
0
25
50
75
100
0 200 400Diameter (pixels)
Inte
nsi
ty (
Pix
els)
Figure 51. TPM micrographs and pixel intensity graphs demonstrating the penetration of a 20 kDa FITC-labelled dextran into both un-cleaved and cleaved Fmoc-X-Ala-Ala-PEGA1900 particles at 0.1 M (pH 8). Un-cleaved Fmoc-X-Ala-Ala-PEGA1900 particles were treated with a 20 kDa FITC-labelled dextran and its penetration into PEGA particles was monitored via TPM at 0 minutes (un-cleaved: 0 min; black:�) and up to 10 minutes (un-cleaved: 10 min; green:�). After Fmoc-X-Ala-Ala-PEGA1900 particles were cleaved with elastase (cleaved) the penetration of the 20 kDa FITC-labelled dextran was again monitored up to 10 minutes (cleaved: 10 min; red:�). Scale bars are either 75 µm or 100 µm (as indicated); and the data represents the pixel intensity across the diameter of each particle.
Seeing as the 20 kDa FITC-labelled dextran did not diffuse into both un-cleaved and
cleaved Fmoc-X-Ala-Ala-PEGA1900 particles to a high degree at 0.1 M, it was predicted
that possibly the swelling of the functionalised PEGA1900 particles at high ionic strength
(0.1 M) hindered the complete accessibility of the 20 kDa FITC-labelled dextran into the
central-core of both un-cleaved and cleaved Fmoc-X-Ala-Ala-PEGA1900 particles.
Consequently, comparative studies were then carried out using unmodified PEGA
particles to investigate the difference in the penetration of the 20 kDa FITC-labelled
dextran into the PEGA1900 particles at 0.1 M and 0.001 M (figure 52). Unmodified
PEGA1900 particles were first washed and then swollen in potassium phosphate buffer at
Un-cleaved: 0 min
Un-cleaved: 10 min
Cleaved: 10 min
RAA
EAA
GAA
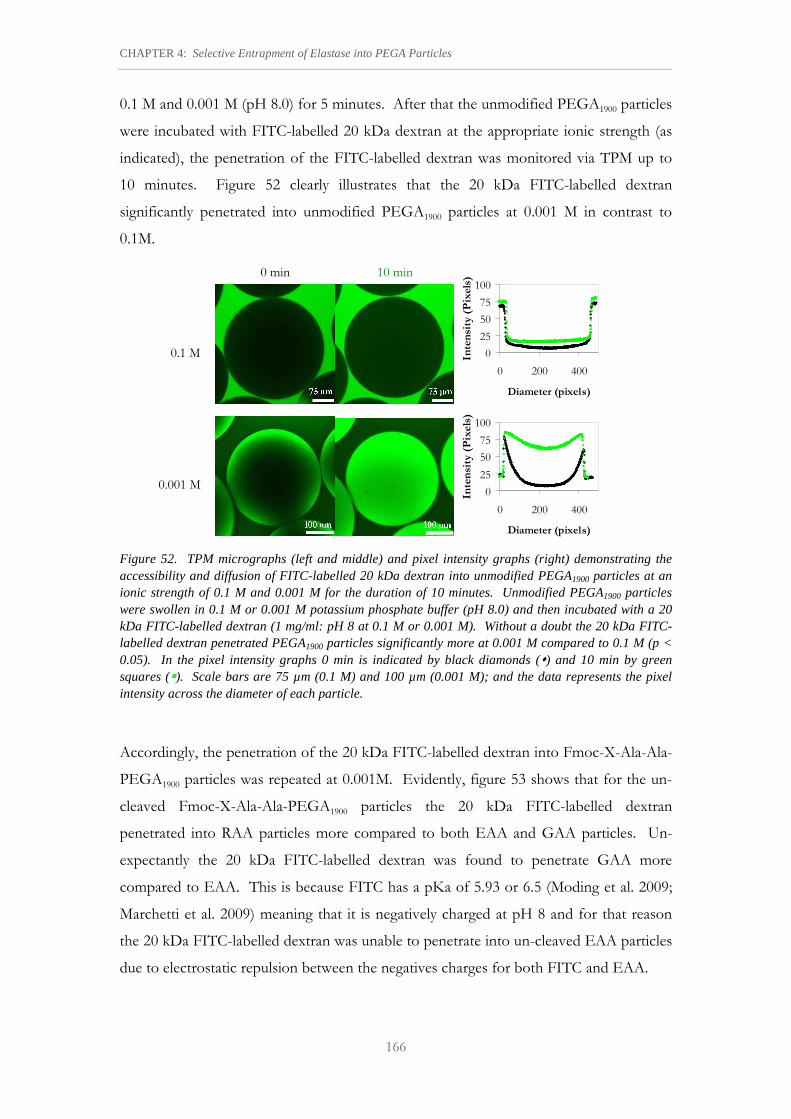
CHAPTER 4: Selective Entrapment of Elastase into PEGA Particles
166
0.1 M and 0.001 M (pH 8.0) for 5 minutes. After that the unmodified PEGA1900 particles
were incubated with FITC-labelled 20 kDa dextran at the appropriate ionic strength (as
indicated), the penetration of the FITC-labelled dextran was monitored via TPM up to
10 minutes. Figure 52 clearly illustrates that the 20 kDa FITC-labelled dextran
significantly penetrated into unmodified PEGA1900 particles at 0.001 M in contrast to
0.1M.
Figure 52. TPM micrographs (left and middle) and pixel intensity graphs (right) demonstrating the accessibility and diffusion of FITC-labelled 20 kDa dextran into unmodified PEGA1900 particles at an ionic strength of 0.1 M and 0.001 M for the duration of 10 minutes. Unmodified PEGA1900 particles were swollen in 0.1 M or 0.001 M potassium phosphate buffer (pH 8.0) and then incubated with a 20 kDa FITC-labelled dextran (1 mg/ml: pH 8 at 0.1 M or 0.001 M). Without a doubt the 20 kDa FITC-labelled dextran penetrated PEGA1900 particles significantly more at 0.001 M compared to 0.1 M (p < 0.05). In the pixel intensity graphs 0 min is indicated by black diamonds (�) and 10 min by green squares (�). Scale bars are 75 µm (0.1 M) and 100 µm (0.001 M); and the data represents the pixel intensity across the diameter of each particle.
Accordingly, the penetration of the 20 kDa FITC-labelled dextran into Fmoc-X-Ala-Ala-
PEGA1900 particles was repeated at 0.001M. Evidently, figure 53 shows that for the un-
cleaved Fmoc-X-Ala-Ala-PEGA1900 particles the 20 kDa FITC-labelled dextran
penetrated into RAA particles more compared to both EAA and GAA particles. Un-
expectantly the 20 kDa FITC-labelled dextran was found to penetrate GAA more
compared to EAA. This is because FITC has a pKa of 5.93 or 6.5 (Moding et al. 2009;
Marchetti et al. 2009) meaning that it is negatively charged at pH 8 and for that reason
the 20 kDa FITC-labelled dextran was unable to penetrate into un-cleaved EAA particles
due to electrostatic repulsion between the negatives charges for both FITC and EAA.
0.1 M
0.001 M
0
25
50
75
100
0 200 400
Diameter (pixels)
Inte
nsi
ty (
Pix
els)
0
25
50
75
100
0 200 400
Diameter (pixels)
Inte
nsi
ty (
Pix
els)
0 min 10 min

CHAPTER 4: Selective Entrapment of Elastase into PEGA Particles
167
For the cleaved Fmoc-X-Ala-Ala-PEGA1900 particles, after 10 minutes the accessibility of
the 20 kDa FITC-labelled 20 kDa dextran became restricted for both RAA and GAA
since the fluorescence within the pixel intensity graphs was found to decrease for both of
these PEGA1900 particles (figure 53: red). This is because the molecular accessibility of
RAA and GAA PEGA1900 particles became reduced after elastase cleaved the ECP for
both the positive and neutral Fmoc-X-Ala-Ala-PEGA1900 particles. However, it can be
seen that the molecular accessibility of RAA was profoundly reduced compared to GAA,
which is expected since elastase was previously found to selectively hydrolyse the ECP of
the RAA particles significantly more than the GAA particles (figure 53: pH 8, p < 0.05).
0
25
50
75
100
0 200 400Diameter (pixels)
Inte
nsi
ty (
Pix
els
)
0
25
50
75
100
0 200 400Diameter (pixels)
Inte
nsi
ty (
Pix
els)
0
25
50
75
100
0 200 400Diameter (pixels)
Inte
nsi
ty (
Pix
els
)
Figure 53. TPM micrographs and pixel intensity graphs demonstrating the penetration of a 20 kDa FITC-labelled dextran into both un-cleaved and cleaved Fmoc-X-Ala-Ala-PEGA1900 particles at 0.001M (pH 8). Un-cleaved Fmoc-X-Ala-Ala-PEGA1900 particles were treated with 20 kDa FITC-labelled dextran and its penetration into PEGA particles was monitored via TPM at 0 minutes (un-cleaved: 0 min; black:�) and up to 10 minutes (un-cleaved: 10 min; green:�). After Fmoc-X-Ala-Ala-PEGA1900 particles were cleaved with elastase (cleaved) the penetration of the 20 kDa FITC-labelled dextran was again monitored up to 10 minutes (cleaved: 10 min; red:�). Scale bars are either 75 µm or 100 µm (as indicated); and the data represents the pixel intensity across the diameter of each particle.
Additionally, it can be deduced that after elastase cleaved the ECP of the RAA particles,
removal of the positively charged Arg(+) residues caused the pores of the RAA particles
to collapse and therefore the accessibility of the FITC-labelled 20 kDa dextran became
Un-cleaved: 0 min
Un-cleaved: 10 min
Cleaved: 10 min
RAA
EAA
GAA
CHAPTER 4: Selective Entrapment of Elastase into PEGA Particles
168
limited within 10 minutes. Furthermore, it can be concluded that if the accessibility of a
FITC-labelled dextran with a molecular weight as low as 20 kDa becomes restricted after
the positive particles were cleaved by elastase, subsequently due to polymer collapse this
confirms that elastase becomes trapped inside the RAA particles as it has a molecular
weight of 25.9 kDa which is greater than 20 kDa.
As mentioned above, the FITC-labelled 20 kDa dextran did not penetrate un-cleaved
EAA particles. Interestingly, once the ECP of the EAA particles was cleaved by elastase,
the FITC-labelled 20 kDa dextran was found to slightly penetrate the EAA particles as
the fluorescence within the pixel intensity graph was found to increase slightly (figure 53:
middle, red). This is because some of the Glu residues, hence negative charges of the
EAA particles were removed by elastase causing the negatively charged FITC-labelled
dextran (at pH 8) to diffuse into the cleaved EAA particles. It is not surprising that only
a small fraction of FITC-labelled 20 kDa dextran penetrated into the cleaved EAA
particles since previously in chapter 3 the swelling of cleaved EAA particles was found to
decrease at 0.001 M (figure 37).
4.4.2.3 FITC-elastase
The penetration of FITC-labelled dextran of known molecular weight into both un-
cleaved and cleaved PEGA particles can be considered as an indirect approach of
visualising the penetration followed by entrapment of the enzyme into PEGA particles.
Therefore, in order to directly visualise the penetration of elastase into Fmoc-X-Ala-Ala-
PEGA particles under real-time conditions, elastase was labelled with FITC to generate
FITC-elastase in PBS buffer (0.15 M and pH 7.4). Figure 54 depicts the TPM
micrographs along with the average fluorescence intensity graph for the accessibility and
penetration of FITC-elastase into RAA, EAA and GAA particles. FITC-elastase was
found to penetrate the RAA and EAA significantly more compared to GAA (p < 0.05).
However, since FITC-elastase existed in its cationic form, as expected FITC-elastase was
highly proficient in accessing and cleaving the ECP of EAA particles more quickly
compared to both RAA and GAA (p < 0.05).. The ECP of EAA particles was cleaved
from the inner-core of PEGA within 2 minutes (101.05 RFU) and there was no
significant difference in the fluorescence between 2 – 15 minutes for the total reaction
time (i.e. 101.05 – 104.65 RFU).

CHAPTER 4: Selective Entrapment of Elastase into PEGA Particles
169
(a)
(b)
30
75
120
165
210
0.0 0.5 2.0 5.0 7.5 15.0
Time (minutes)
Aver
age
flu
ore
scen
ce (
RF
U)
RAA
EAA
GAA
Figure 54. TPM micrographs (top) and the average fluorescence graph (bottom) depicting the real-time penetration of FITC-elastase into Fmoc-X-Ala-Ala-PEGA1900 particles in PBS buffer (0.15 M and pH 7.4). Sequential cross-sectional equatorial images of functionalised PEGA particles were obtained over the course of 15 minutes (as indicated). The fluorescence was found to increase for the charged particles, this means that FITC-elastase was encapsulated by both RAA and EAA particles to a greater extent compared to GAA particles. Since elastase predominantely in its cationic form under these conditions, it selectively cleaved and became trapped into EAA particles within two minutes compared to RAA particles (x minutes). For the neutral particles, GAA (light grey) over the course of time the fluorescence inside the PEGA1900 particles was found to decrease illustrating that the GAA particles were unable to retained elastase. Scale bar represents 75 µm; and the data represents the mean + SE of fluorescence across the diameter of each particle.
It was difficult to monitor the actual time required for FITC-elastase to cleave the ECP
from the outer surface of the EAA particles. As soon as a drop of FITC-elastase was
added to EAA particles and straight after that the TPM was quickly placed into focus it
0 min 2.0 min 15 min 7.5 min 5.0 min 0.5 min
RAA
EAA
GAA

CHAPTER 4: Selective Entrapment of Elastase into PEGA Particles
170
can be seen that majority of the ECP had already been cleaved by FITC-elastase (figure
54: 0 min). In contrast, at 2.0 minutes the fluorescence intensity of RAA was 84.11 RFU
and for GAA it was 102.55 RFU (figure 54). Compared to the charged particles (RAA
and EAA) the fluorescence intensity for the penetration of FITC-elastase inside the
GAA particles was found to decrease over time from 124.25 RFU at time zero to 73.25
RFU at 15 minutes.
Previously in chapter 3, it was shown that the swelling of GAA at high ionic strength i.e.
0.2 M was much lower than the charged PEGA1900 particles. It was envisaged that
possibly the swelling due to the high ionic strength restricted the accessibility of FITC-
elastase into GAA. Subsequently, the penetration of FITC-elastase into GAA particles
was repeated at 0.1 M (pH 7.0) and monitored up to 30 minutes.
0 min 5 min 10 min 15 min 20 min 25 min 30 min
0
25
50
75
100
125
0 5 10 15 20 25 30
Time (minutes)
Ave
rag
e F
luo
resc
ence
(R
FU
)
Figure 55. TPM micrographs (top) and the average fluorescence graph (bottom) depicting the real-time penetration of FITC-elastase into GAA particles at 0.1 M (pH 7.0). Sequential cross-sectional equatorial images of the GAA particles were obtained over the course of 30 minutes (as indicated). As the fluorescence for the penetration of FITC-elastase was found to decrease over the course of time this indicated that the GAA particles were unable to retain and entrap elastase. Scale bar represents 75 µm; and the data represents the mean + SE of fluorescence across the diameter of each particle.
Figure 55 demonstrated that the fluorescence intensity was again found to decrease
inside the GAA particles over time from 101.47 RFU at time zero to 28.53 RFU at 30
minutes. Therefore, it was concluded that although elastase has the ability to cleave the

CHAPTER 4: Selective Entrapment of Elastase into PEGA Particles
171
neutral ECP possibly from the surface of the GAA particles, elastase is not retained by
GAA particles. This observation is further confirmed by the fluorescence assay whereby
sample fluids containing elastase are treated with Fmoc-X-Ala-Ala-PEGA1900 particles at
0.1 M (at pH 7-8: figure 57) and at 0.15 M (PBS buffer, at pH 7.4: figure 65). In each
case, elastase activity is found to be reduced by the charged particles (RAA and EAA)
compared to the neutral particles (GAA). The latter particles are found not to reduce
elastase activity at pH 7 – 8 (0.1 – 0.15 M). Detailed descriptions of these observations
are given in section 4.4.2.4 (figure 57) and chapter 5 (figure 65).
4.4.2.4 Fluorescence substrate assay
In this section the elastase activity in sample fluids mimicking the environment of
chronic wounds before and after the sample fluids had been treated with functionalised
PEGA particles was examined. This was achieved by enzyme kinetics which involved
measuring the initial rates of elastase activity of PPE using the fluorescence substrate
MeOSuc-Ala-Ala-Pro-Val-AMC.
Firstly, it was essential to optimise the initial rates of elastase-catalysed reactions of PPE
and to determine the Michaelis-Menten constant (KM). In enzyme kinetics, KM is an
important parameter, it is the concentration of a substrate when the active site of an
enzyme is half filled and therefore yields half maximal velocity wherein significant
enzyme catalysis takes place (Stryer et al. 2002). Additionally, the KM directly influences
the fluorescence intensity of the enzyme-catalysed reaction depending on the
environment of the substrate under the influence of pH, ionic strength and temperature
(Stryer et al. 2002). These parameters were selected according to the environment
observed in chronic wounds and depending on the optimal conditions for elastase.
Firstly, elastase was dissolved at a concentration of 0.01 mg/ml as this concentration of
elastase is observed in chronic wounds (as reported previously in chapter 2). Secondly,
given that elastase is optimal at pH 8 (Worthington Biochemical Corporation), the
fluorescence substrate assay was optimised at this pH wherein both the fluorescence
substrate and elastase were both dissolved in potassium phosphate buffer at pH 8 and
0.1 M. Finally, to mimic the temperature observed in chronic wounds the fluorescence
substrate assay was carried out in the range of 34 – 37oC. The fluorescence substrate was
dissolved in buffer within the range of 0.00 – 1.00 mM and within this range elastase

CHAPTER 4: Selective Entrapment of Elastase into PEGA Particles
172
activity of PPE was found to obey Michealis-Menten kinetics as a hyperbolic curve was
observed (figure 56a) which is derived from Michaelis-Menten equation (see equation 3:
figure 56a).
(a)
Equation 3. Michaelis-Menten equation:
(b)
Equation 4. Derivation of the Michaelis-Menten equation:
y = 0.0000297x + 0.0002262
R2 = 0.992
-0.0004
-0.0002
0.0000
0.0002
0.0004
0.0006
0.0008
0.0010
-20 -10 0 10 20 30
1/[S] (mM-1)
1/V
o
Figure 56. Optimisation of the fluorescence substrate assay using Michaelis-Menten kinetics. Elastase (PPE, 0.01 mg/ml) and the fluorescence substrate MeOsuc-Ala-Ala-Pro-Val-AMC (0 – 1.00 mM) were dissolved in potassium phosphate buffer at pH 8 (0.1 M). The increase in fluorescence was measured after elastase cleaved the fluorescence substrate releasing AMC over the course of 14 hours. The initial velocity (Vo) for the elastase activity of PPE at various concentrations of the fluorescence substrate (0 – 1.00 mM) was found to obey Michaelis-Menten kinetics as a hyperbolic curve was observed (a). From the Lineweaver-Burk plot (b) the kinetic constants: Vmax (4420.87 µmol hr-1) and KM (0.133 mM) were calculated.
Vo = Vmax[S]
+[S] KM
Vo Vmax
K M1=
Vmax[S]
1+. 1
0
1125
2250
3375
4500
0.00 0.25 0.50 0.75 1.00
[S] (mM)
Vo
(µm
ol h
r-1)

CHAPTER 4: Selective Entrapment of Elastase into PEGA Particles
173
From figure 56a it can be seen that at constant concentration of elastase (0.01 mg/ ml)
increasing the concentration of the fluorescence substrate was found to increase the
velocity of the enzyme reaction. As a result this caused the fluorescence for the elastase
activity of PPE to increase at which point the elastase reaction was at first order (Zubay
et al. 1995). Eventually, it was found that increasing the concentration of the
fluorescence substrate caused the elastase reaction of PPE to reach zero order whereby
the elastase reaction became saturated. This is most commonly referred to as Vmax i.e.
maximum velocity (Stryer et al. 2002). Vmax is the point at which elastase had
completely complexed with the fluorescence substrate to form the enzyme substrate (ES)
complex i.e. elastase/ MeOSuc-Ala-Ala-Pro-Val-AMC and at this point the products (see
figure 43) are constant (Stryer 1995; Zubay et al. 1995). Due to the solubility of the
fluorescence substrate, high concentrations of the fluorescence substrate were avoided in
the range of > 2.50 – 5.00 mM as Michaelis-Menten kinetics was not obeyed since the
elastase activity of PPE was found to decrease. Seeing as it was impossible to calculate
Vmax from the hyperbolic plot, the Lineweaver-Burk plot (figure 56b) was used along
with equation 4 (given in figure 56b) which is the derivation of the Michaelis-Menten
equation (equation 3) to determine both the kinetic constants: Vmax and KM. These
were calculated as 4420.87 µmol hr-1 (Vmax) and 0.133 mM (KM). For subsequent
experiments, 0.133 mM was used as the optimal substrate concentration for the
fluorescence assay.
Next the reduction of elastase activity of PPE was examined when sample fluids
containing elastase were treated with Fmoc-X-Ala-Ala-PEGA1900 particles. Sample fluids
were prepared by dissolving elastase (0.01 mg/ml) in 0.1 M potassium phosphate buffer
at pH 7 – 9. Subsequently, after SPPS Fmoc-X-Ala-Ala-PEGA1900 particles were washed
with H2O and then with 0.1 M potassium phosphate buffer at the appropriate pH (as
indicated). After that, Fmoc-X-Ala-Ala-PEGA1900 particles were transferred (10 mg) to
individual centrifuges vials and then swollen in 0.1 M potassium phosphate buffer (at pH
7 – 9; 50 µl) for 5 minutes. Next, sample fluids containing elastase were treated with the
pre-washed and swollen Fmoc-X-Ala-Ala-PEGA1900 particles (RAA, EAA and GAA)
over the course of 20 minutes. At each time point, the elastase reaction was stopped and
the supernatants were examined for the residual elastase activity of PPE in the sample
fluids after they had been treated with Fmoc-X-Ala-Ala-PEGA1900 particles using the
fluorescence substrate assay.
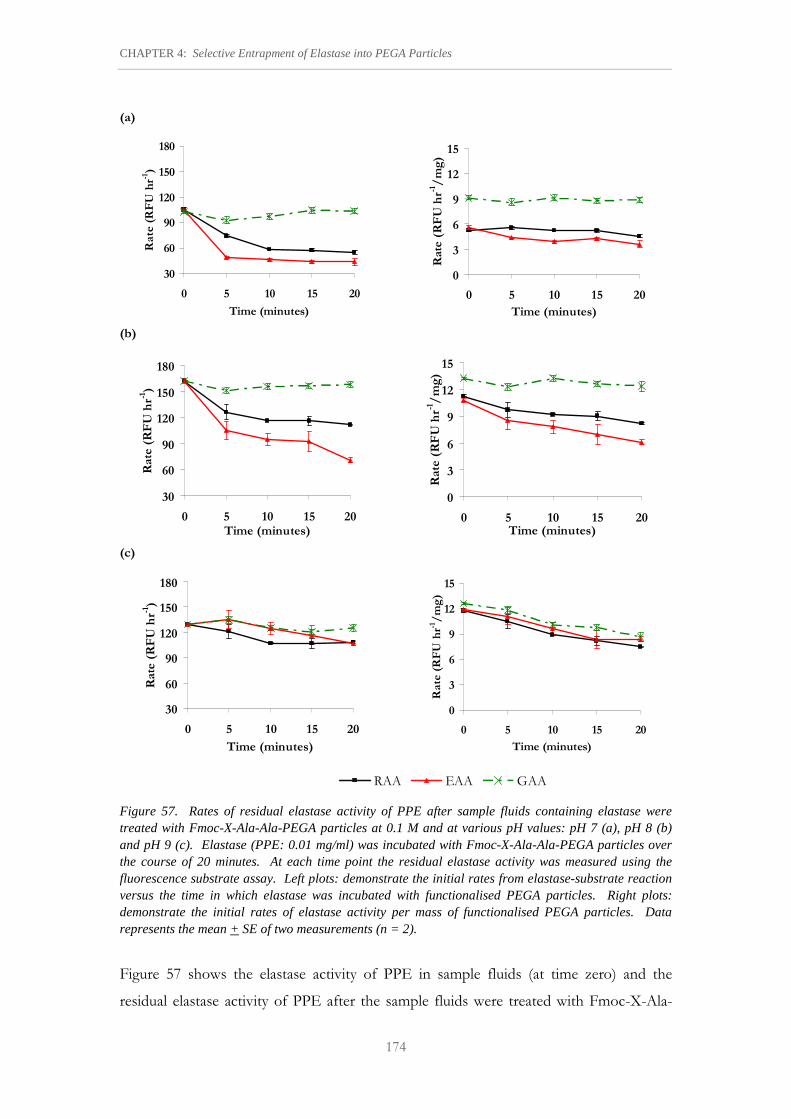
CHAPTER 4: Selective Entrapment of Elastase into PEGA Particles
174
(a)
30
60
90
120
150
180
0 5 10 15 20
Time (minutes)
Ra
te (
RF
U h
r-1)
0
3
6
9
12
15
0 5 10 15 20
Time (minutes)
Rat
e (
RF
U h
r-1/
mg
)
(b)
30
60
90
120
150
180
0 5 10 15 20Time (minutes)
Rate
(R
FU
hr-1
)
0
3
6
9
12
15
0 5 10 15 20Time (minutes)
Rat
e (R
FU
hr-1
/m
g)
(c)
30
60
90
120
150
180
0 5 10 15 20
Time (minutes)
Rat
e (
RF
U h
r-1)
0
3
6
9
12
15
0 5 10 15 20
Time (minutes)
Rate
(R
FU
hr-1
/m
g)
RAA EAA GAA
Figure 57. Rates of residual elastase activity of PPE after sample fluids containing elastase were treated with Fmoc-X-Ala-Ala-PEGA particles at 0.1 M and at various pH values: pH 7 (a), pH 8 (b) and pH 9 (c). Elastase (PPE: 0.01 mg/ml) was incubated with Fmoc-X-Ala-Ala-PEGA particles over the course of 20 minutes. At each time point the residual elastase activity was measured using the fluorescence substrate assay. Left plots: demonstrate the initial rates from elastase-substrate reaction versus the time in which elastase was incubated with functionalised PEGA particles. Right plots: demonstrate the initial rates of elastase activity per mass of functionalised PEGA particles. Data represents the mean + SE of two measurements (n = 2).
Figure 57 shows the elastase activity of PPE in sample fluids (at time zero) and the
residual elastase activity of PPE after the sample fluids were treated with Fmoc-X-Ala-

CHAPTER 4: Selective Entrapment of Elastase into PEGA Particles
175
Ala-PEGA1900 particles over the course of 20 minutes. The initial rates of residual
elastase activity of PPE are expressed as RFU hr-1 (figure 57a-c: left side) and according
the initial rates of the residual elastase activity of PPE in the sample fluids were corrected
according to the mass of Fmoc-X-Ala-Ala-PEGA1900 particles used, in which the initial
rates were expressed as Rate/ mass (RFU hr-1/mg, figure 57a-c: right side).
It was established that elastase activity of PPE at each pH varied (figure 57) and as
expected the initial rate elastase activity of PPE was optimal at pH 8 (161.75 RFU hr-1)
compared to pH 7 (105.36 RFU hr-1) and pH 9 (129.48 RFU hr-1). When elastase was in
its cationic form at pH 7-8, collectively on average the elastase activity of PPE was found
to reduce more by the EAA (pH 7: 57.89 RFU hr-1 and pH 8: 105.07 RFU hr-1)
compared to both RAA (pH 7: 70.22 RFU hr-1 and pH 8: 126.417 RFU hr-1) and GAA
(pH 7: 100.40 RFU hr-1 and pH 8: 127.48 RFU hr-1) PEGA particles (p > 0.05, figure
57a-b: left). When elastase was in its anionic form at pH 9, although elastase activity of
PPE was collectively reduced more by RAA (average: 114.64 RFU hr-1) compared to
both EAA (average: 122.57 RFU hr-1) and GAA (average: 127.20 RFU hr-1) PEGA
particles (figure 57c: left) on the contrary the initial rates of elastase activity for PPE were
not significantly different between RAA, EAA and GAA PEGA particles (p > 0.05).
When taking the mass of Fmoc-X-Ala-Ala-PEGA1900 particles into account, the residual
elastase activity of PPE in samples fluids after they had been treated with Fmoc-X-Ala-
Ala-PEGA particles were compared (figure 57a-c: right). The elastase activity was
reduced by: 21.26 – 35.68 % at pH 7; 20.83 – 43.70 % at pH 8 and 6.95 – 29.79 % at pH
9 (5 – 20 minutes) after samples fluids were treated with EAA particles. In contrast,
when samples fluids were treated with RAA particles, the elastase activity of PPE was
reduced by -5.92 – 13.55 % at pH 7; 13.75 – 27.06 % at pH 8 and 10.57 – 36.06 % at pH
9 (5 – 20 minutes). Although, the residual elastase activity of PPE remained fairly
constant for the GAA particles at pH 7 – 8, within this pH range the level of reduction
for elastase activity of PPE was very small i.e. 6.04 – 2.74 % at pH 7 and 7.03 – 6.43 % at
pH 8 (5 – 20 minutes); whereas at pH 9 it was found to increase from 6.34 – 31.22 (5 –
20 minutes). Overall, from figure 55 it was deduced that the residual cationic form of
elastase activity for PPE in samples fluids was highly reduced by EAA particles at pH 7 –
8; whereas the residual anionic form of elastase activity for PPE in sample fluids was
reduced by all Fmoc-X-Ala-Ala-PEGA1900 particles (RAA, EAA and GAA) at pH 9.
CHAPTER 4: Selective Entrapment of Elastase into PEGA Particles
176
4.5 CONCLUSION
The results in this chapter demonstrate the accessibility and diffusion of elastase into
Fmoc-X-Ala-Ala-PEGA1900 particles at 0.1 M under the influence of pH by exploiting the
used of various fluorophores (dansyl chloride, FITC-labelled dextran and FITC). It was
found that assessing the diffusion of elastase by staining cleaved PEGA1900 particles with
dansyl chloride was not appropriate method for PEGA1900 particles containing both
acidic and basic amino acids due to the effect of localised pH on the dansyl chloride
group. The FITC-labelled dextran studies showed that elastase significantly penetrated
into RAA particles more compared to the GAA particles. Additionally the FITC-labelled
dextran showed that after the CMR was removed from the charged PEGA1900 particles
the pores of PEGA1900 particles became restricted as a 20 kDa FITC-labelled dextran was
unable to penetrate into PEGA1900 particles. This demonstrated that since elastase has a
molecular weight of 25.9 kDa it became trapped inside the PEGA1900 particles due to the
collapsing of the pores within the PEGA1900 particles.
Subsequently, for real-time monitoring elastase was labelled with FITC to demonstrate
the direct penetration and entrapment of FITC-elastase into PEGA particles in PBS at
physiological pH and ionic strength (at pH 7.4 and 0.15 M, respectively). FITC-elastase
was studied in its cationic form and was found to penetrate and eventually became
trapped into both EAA and RAA particles more compared to GAA particles. Cationic
FITC-elastase was found to totally cleave the ECP of the EAA particles within 2 minutes
and subsequently FITC-elastase became trapped into EAA particles within 2 minutes. In
contrast, the neutral particles were unable to retain and encapsulate FITC-elastase at 0.1 -
0.15 M as the fluorescence inside the GAA particles was found decrease.
Finally, it was demonstrated that Fmoc-X-Ala-Ala-PEGA1900 particles were found to
reduce elastase activity of PPE after sample fluids containing elastase were treated with
Fmoc-X-Ala-Ala-PEGA1900 particles. At high ionic strength i.e. 0.1 M the residual
elastase activity of PPE in sample fluids was reduced more by the charged PEGA
particles (RAA and EAA) compared to neutral particles (GAA) within the pH range of 7
– 8, although all Fmoc-X-Ala-Ala-PEGA1900 particles were found to reduce elastase
activity of PPE at pH 9.

CHAPTER 5: Reduction of Fibroblast Elastase Activity by PEGA Particles
177
CCHHAAPPTTEERR 55
RReedduuccttiioonn ooff FFiibbrroobbllaasstt EEllaassttaassee AAccttiivvii ttyy bbyy PPEEGGAA PPaarrttiicclleess

CHAPTER 5: Reduction of Fibroblast Elastase Activity by PEGA Particles
178
5.1 INTRODUCTION
In chapter 1, skin ulcers were reported as the largest and most frequently occuring types
of chronic wounds (Eaglstein and Falanga 1997; Stadelmann et al. 1998). Previously in
chapter 2 we encountered that there are various human proteases that express
elastinolytic activity (for examples see table 4). Neutrophils and macrophages were
reported as the two major cells that express elastase(s) during the wound healing process.
However, since the late eighties skin fibroblasts, specifically human dermal fibroblasts
(HDF) have been reported to express elastase activity (Homsy et al. 1988; Croute et al.
1991; Tsukahara et al. 2001; Tsuji et al. 2001; Isnard et al. 2002; Suganuma et al. 2010).
For that reason, in this chapter HDF were chosen as the cells to study the elastase
activity expressed inside or outside the cell. Elastase or elastase activity that is expressed
intracellularly or extracellularly by fibroblast is sometimes referred to as human skin
fibroblast elastase activity (Homsy et al. 1988), elastase-type activity (Isnard et al. 2002) or
skin fibroblast elastase (Suganuma et al. 2010). In this thesis, it is designated as HDF-
elastase and the elastase activity as HDF-elastase activity. Interestingly, some
investigators have shown elastase localised at the surface of fibroblasts in which elastase
binds to receptors on the surface of fibroblasts (Cunningham et al. 1986; Campbell and
Cunningham 1987) and the research carried out by Robert and colleagues shows elastase
activity bound to the membrane of dermal fibroblasts (Archillas-Marcos and Robert
1993; Beranger et al. 1994; Isnard et al. 2002). The class of enzymes responsible for this
elastinolytic activity by fibroblasts has been stated as an endopeptidase of MMP origin, a
metalloendopeptidase (Homsy et al. 1988) such as the metalloelastase-type protease:
MMP-2 and MMP-9 (Beranger et al. 1994; Isnard et al. 2002) as well as a serineprotease
(Schmidt et al. 2009).
Fibroblasts are considered as the most important cell type during the wound healing
process for the reason that proper healing requires the migration and proliferation of
fibroblasts into the wound bed. The prominent role of fibroblast is laying down and re-
organising the ECM by synthesising and secreting high levels of newly synthesised
collagen (main component of the ECM) alongside other ECM components e.g. elastin,
fibronectin, glycoaminoglycans, proteoglycans, growth factors (Singer and Clark 1999;
Porter 2007; Schultz and Mast 1998; Dasu et al. 2003) in the attempt of replacing and
regenerating the provisional matrix of the fibrin clot. Fibroblast successfully achieve this

CHAPTER 5: Reduction of Fibroblast Elastase Activity by PEGA Particles
179
by controlling the levels of MMPs which degrade the old ECM and TIMPs (Mutsaers et
al. 1997; Enoch and Harding 2003; Schultz and Mast 1998). Eventually, fibroblasts
generate a compact and contracting-ECM around occupying cells (Singer and Clark 1999;
Porter 2007; Lauffenburger and Wells 2003). A detailed description for the function of
fibroblasts during the wound healing process was previously covered in chapter 2
(section 2.2).
Chronic wounds are known to exhibit elevated levels of various pro-inflammatory
cytokines such as IL-1α (Barone et al. 1998), IL-1β and TNF-α (Tarnuzzer and Schultz
1996; Trengrove et al. 2000) and under in-vitro conditions cultured normal human
fibroblast cells have been stimulated with the cytokine, IL-1β to produce elastase activity
(Croute et al. 1991). IL-1β is a polypeptide, a potent pleiotropic pro-inflammatory
cytokine that mediates processes in host defense, inflammation and in-response to injury.
In healing wounds, even though activated monocytes/macrophages are considered as the
main source for IL-1β, fibroblasts alongside other cells are reported to produce or
secrete IL-1β (Manninen et al. 1992; Robson et al. 1994; Robbins et al. 1999; Chung
2001). TNF-α self-regulates its own synthesis by macrophages and then macrophages
and fibroblasts enhance the generation of IL-1β (Mast and Schultz 1996; Bryant and Nix
2007). Cytokines are stated to be extremely potent and active at picomolar-to-nanomolar
concentrations (Henry and Garner 2003). During the wound healing process binding of
these cytokines to cell surface receptors results in signal transduction wherein IL-1β and
TNF-α act synergistically to exert many functions: stimulate endothelial cells to express
cell adhesion molecules, influence collagen synthesis by fibroblasts by up-regulating the
expression of MMPs, however for the latter role IL-1β is said to be mitogenic for
fibroblast MMP expression (Elias et al. 1989; Chung 2001; Robson 2003; Mast and
Schultz 1996; Schultz and Mast 1998; Bryant and Nix 2007; Robbins et al. 1999; Dasu et
al. 2003). Additionally, IL-1β and TNF-α promote chemotaxis (Schultz et al. 2003)
alongside the migration, increase mitosis and proliferation of fibroblasts (Mast and
Schultz 1996; Robbins et al. 1999; Rumalla and Borah 2001; Chung 2001; Robson 2003;
Henry and Garner 2003) and are known to downregulate the expression of TIMPs (Mast
and Schultz 1996; Schultz and Mast 1998; Bryant and Nix 2007).
When designing a wound dressing (i.e. functionalised PEGA particles) it is important to
assess the surface of the wound dressing in the presence of cells. The biocompatibility

CHAPTER 5: Reduction of Fibroblast Elastase Activity by PEGA Particles
180
of PEGA has previously been addressed by Ulijn and co-workers in which PEGA
surfaces and particles were demonstrated as being biocompatible with the growth of
both fibroblast and osteoblast cells (Zourob et al. 2006; Patrick 2010; Todd et al. 2007).
However, for the clinical use of functionalised PEGA particles as a chronic wound
dressing for mopping-up elastase it is essential to examine the efficacy of the
functionalised PEGA particles under in-vitro conditions to reduce/ remove levels of
elastase that is expressed both outside (extracellular) or inside (intracellular) HDF cells
within sample fluids mimicking the environment of a wound exudate. This chapter
highlights the reduction of HDF-elastase activity from HDF cells by functionalised
PEGA particles at physiological pH and ionic strength.
5.2 OBJECTIVES Having demonstrated in chapters 3 and 4, the recognition of ECPs by elastase followed
by its accessibility into functionalised PEGA particles containing the Ala-Ala peptide at
both low and high ionic strength, accordingly the main focus of this final experimental
chapter was to analyse the reduction of elastase activity that was expressed by HDF cells
under in-vitro conditions at physiological pH and ionic strength (pH 7.4, 0.15 M
respectively). The experimental study was undertaken in two parts: firstly HDF cells
were stimulated with IL-1β to express HDF-elastase both outside or inside (extracellular
or intracellular) HDF cells and this stimulation process was optimised to achieve
detectable levels of HDF-elastase activity from HDF cells; and secondly sample fluids
containing HDF-elastase activity were treated with functionalised PEGA particles (RAA,
EAA, and GAA) and residual HDF-elastase activity in the sample fluids was examined to
demonstrate the mopping-up of HDF-elastase by functionalised PEGA particles.
In the literature it was confusing to understand whether authors made reference to HDF-
elastase or HDF-elastase activity that was expressed outside (extracellular) or inside
(intracellular) fibroblasts. Consequently to avoid confusion in this chapter, the elastase
activity of HDF-elastase expressed outside HDF cells is designated as the ‘HDF-elastase
activity expressed outside HDF cells (extracellular) whereas the elastase activity of the
HDF-elastase expressed inside HDF cells is designated as the HDF-elastase activity
expressed inside HDF cells (intracellular)’.

CHAPTER 5: Reduction of Fibroblast Elastase Activity by PEGA Particles
181
5.3 MATERIALS & METHODS
5.3.1 Materials
Dulbecco’s Modified Eagle Medium (DMEM + 1000 mg/L glucose, + GlutaMAX 1, +
pyruvate), Fetal Bovine Serum (FBS), Antibiotic/antimycotic, DPBS (phosphate buffer
saline), DH2O, Trypsin (0.25 % trypsin, 1 mM EDTA.4Na+) were all purchased from
Invitrogen (UK). Human dermal fibroblasts (adult) were from Cascade Biologics
(Invitrogen). IL-1β was supplied by Sigma (UK). Fmoc-protected amino acids (Fmoc-
Ala-OH.H2O, Fmoc-Arg(pbf)-OH, Fmoc-Glu(OtBu)-OH, Fmoc-Gly-OH) and
MeOSuc-Ala-Ala-Pro-Val-AMC were all purchased from Bachem (UK). Porcine
pancreatic elastase (PPE, 3.9 mg per protein) was purchased from Worthington
Biochemical Corporation (USA). Culture flasks, centrifuge tubes, pipettes and 96-well
plates (black) were purchased from Fisher Scientific (UK). Well-plates (48) were
purchased from VMR (UK). Microplate reader FLUORstar OPTIMA was supplied by
BMG LABTECH. Class II laminar flow microbiological cabinets (Bio2+) were from
Envair Ltd.
5.3.2 Methods
5.3.2.1 Fmoc SPPS
Functionalised PEGA particles i.e. Fmoc-tripeptide-PEGA particles with the
configuration Fmoc-X-Ala-Ala-PEGA (abbreviated as RAA, EAA, GAA) were prepared
using the protocol as previously described in chapter 3, section 3.2.2.2. The successful
coupling of amino acids and de-protecting of the Fmoc groups during SPPS was
monitored using the Kaiser test (see section 3.3.2.3).
5.3.2.2 Cell culture of human dermal fibroblast (HDF)
For cell culture studies asceptic techniques were carried out in microbiological laminar
flow cabinets (class II). HDF cells were cultured in DMEM (supplemented with 10%
heat inactivated FBS and 1% (v/v) antibiotic/ antimycotic) and the culture flasks (75
cm2) were incubated at 37oC in a humidified atmosphere containing 95% air and 5%

CHAPTER 5: Reduction of Fibroblast Elastase Activity by PEGA Particles
182
CO2. After every 2 days the DMEM was replaced with fresh DMEM. Near confluent
(> 95%) HDF cells were rinsed with DPBS and then detached from the culture flask by
incubating the HDF cells with trypsin for 5 minutes at 37oC in a humidified atmosphere
containing 95% air and 5% CO2. The bottom of the culture flask was gently tapped to
completely detach all HDF cells from the surface of the culture flask. The HDF cells
were then re-suspended in fresh DMEM to deactivate trypsin activity and then
centrifuged for 5 minutes at 1.5 x 1000 rpm to produce a pellet of HDF cells. The
supernatant was removed by aspiration and the pellet of HDF cells were re-suspended in
fresh DMEM (as described below). Passages 10 – 12 were used for the experiments (as
indicated).
5.3.2.3 Activation of HDF cells by IL-1ß to express HDF-elastase
HDF cells were re-suspended in DMEM i.e. serum-free media (SFM) or supplemented
with either 10% or 25% FBS). When DMEM was supplemented with FBS, in all
experiments heat inactivated FBS was used. For each experiment in a 48 well-plate, 0.5
ml HDF cells (40, 000 cells/ ml) were seeded in each well and incubated at 37oC in a
humidified atmosphere containing 95% air: 5% CO2. IL-1β (25 – 500 nM) was dissolved
in the appropriate DMEM i.e. SFM or supplemented with either 10% or 25% FBS.
After 4 hours, HDF cells were stimulated with IL-1β (0.25 ml at various concentrations)
over the course of 7 days.
After activation of HDF cells by IL-1β, each day the cell culture medium was examined
for HDF-elastase activity expressed outside (extracellular) HDF cells using the protocol
described in section 5.3.2.5. In order to test whether HDF cells expressed elastase
activity inside (intracellular) HDF cells, the HDF cells were lysed to release all their
intracellular contents by freeze-thaw using two approaches. In the first approach, the
incubated DMEM (supplemented with/ without both FBS and IL-1β) was not removed
and the HDF cells were lysed by freeze-thaw directly after the activation process by IL-
1β. The second approach involved removing the incubated DMEM (supplemented
with/ without both FBS and IL-1β) and subsequently the HDF cells were firstly washed
with DPBS (twice) and then incubated with DH2O (0.75 mL) and then lysed by freeze-
thaw. Freeze-thaw involved first freezing HDF cells (incubated with both DMEM and
DH2O) at –80 oC and once frozen they were then thawed at 37oC in a humidified

CHAPTER 5: Reduction of Fibroblast Elastase Activity by PEGA Particles
183
atmosphere containing 95% air: 5% CO2. In order to efficiently lyse the HDF cells the
freeze-thaw procedure was repeated twice. After lysing the HDF cells, it was essential
that the collected lysate was not centrifuged as previous studies reported that the surface
of fibroblasts contains bound elastase (Cunningham et al. 1986; Campbell and
Cunningham 1987). Instead the lysate of HDF cells was thoroughly mixed by pipetting
it in-and-out using a micropipette to efficiently mix both bound and unbound HDF-
elastase and after that the expressed HDF-elastase activity by HDF cells (intracellular)
was monitored each day using the protocol described in section 5.3.2.5.
5.3.2.4 Elastase treated with functionalised PEGA particles
After SPPS, functionalised PEGA particles (i.e. RAA, EAA, GAA) were thoroughly
washed with H2O, DH2O, DPBS and DMEM + 25% FBS. Then PEGA particles (10
mg) were transferred to a microcentrifuge tube and swollen in 50 µl DMEM + 25% FBS.
The positive control, elastase (PPE, 0.01 mg/mL) was also dissolved in DMEM + 25%
FBS. In the microcentrifude tubes, 250 µl of the sample fluid i.e. elastase (PPE) or the
HDF cell lysate was added to the swollen PEGA particles. The microcentrifuge vials
were then mixed vigorously on a vortex for 1 minute; and then centrifuged for 4 and 14
minutes, resulting in an overall incubation time of 5 and 15 minutes, respectively. At
each time point, the supernatant of the sample fluids after they had been treated with
each functionalised PEGA particle (RAA, EAA, and GAA) were tested for the residual
elastase activity in the sample fluids using the protocol described in section 5.3.2.5.
5.3.2.5 Fluorescence substrate assay
The fluorescence substrate, MeOSuc-Ala-Ala-Pro-Val-AMC was dissolved in 2 ml
methanol and then further diluted with DPBS giving a final concentration of 0.133 mM
(as determined in chapter 4). Elastase assay was carried out by incubating 50 µl of the
substrate with 50 µl of the sample fluid. The sample fluid was either: (1) cell suspension
of the unlysed HDF cells and the HDF cell lysate of the lysed HDF cells treated with/
without IL-1β; and (2) the supernatants collected after the cell suspension and HDF cell
lysate had been treated with each functionalised PEGA particle (RAA, EAA, and GAA).
In this assay, elastase i.e. PPE was used as a positive control and the negative controls
were DMEM, DH2O and IL-1β. The fluorescence of the substrate hydrolysis was

CHAPTER 5: Reduction of Fibroblast Elastase Activity by PEGA Particles
184
measured at λexc 383 nm (excitation) and λem 405 nm (emission) and rate of elastase
activity was expressed as RFU hr-1 and when the latter was corrected according to the
mass of PEGA particles used, the rate of elastase activity was expressed as rate/ mass i.e.
RFU hr-1/mg. The assay was carried out using a black 96-well plate with triplicate
measurements and the temperature of the assay was maintained within the range of 34 oC
– 37oC.
5.3.2.6 Statistics
Data are expressed as the mean value + SEM and statistical analysis was carried out using
SPSS 16.0. Statistical significance was determined using ANOVA test (one-way and two-
way full factorial) and for pair-wise comparisons, post-hoc (Tukey and Duncan) tests
were conducted. A significant difference was observed at the 95% confidence level in
which P values below 0.05 (i.e. p < 0.05) were considered statistically significant and
values above 0.05 (i.e. p > 0.05) were not statistically significant.
5.4 RESULTS & DISCUSSION
5.4.1 IL-1β induced HDF-elastase expression in HDF cells
This section discusses the optimisation for the expression of extracellular and
intracellular HDF-elastase by HDF cells with or without the influence of IL-1β. After
cell culture, confluent HDF cells (> 95%, passage 10) were firstly re-suspended in fresh
DMEM supplemented with 10% heat inactivated FBS (refer as DMEM + 10% FBS) and
seeded at a concentration of 40, 000 cells/ml per well. The expressed HDF-elastase
(extracellular and intracellular) was examined by stimulating treated HDF cells with
various concentrations of IL-1β (25 – 500 nM in DMEM + 10% FBS). For the control
experiment (untreated HDF cells), IL-1β was omitted. It is evident from figure 58 that
IL-1β increased the proliferation of treated HDF cells (figure 58b, d) compared to
untreated HDF cells (figure 58a, c) and this confirmed that IL-1β plays a role in
proliferation of fibroblast cells (Rumalla and Borah 2001; Henry and Garner 2003).
Additionally, it was observed that the growth of both untreated and treated HDF cells
(with or without IL-1β) increased from day 1 (figure 58a-b) to day 7 (figure 58c-d).

CHAPTER 5: Reduction of Fibroblast Elastase Activity by PEGA Particles
185
(a) Control HDF cells: Day 1 (b) Treated HDF cells (IL-1β): Day 1
(c) Control HDF cells: Day 7 (d) Treated HDF cells (IL-1β): Day 7
Figure 58. Photomicrographs of HDF cultures (passage 10) showing the effect of IL-1β on the proliferation of HDF cells after 1 day and 7 days growth in DMEM + 10% FBS. Growth of HDF cells after 1 day (a, b) and 7 days (c, d). Control HDF cells in DMEM + 10% FBS without IL-1β (a, c) and increased number of HDF cells in DMEM + 10% FBS supplemented with IL-1β (500 nM; b, d). Scale bar = 100 µm.
Next, the in-vitro cell conditions for HDF cells to express HDF-elastase activity were
optimised. For the positive control experiment, the commercially bought elastase i.e.
PPE was used to demonstrate elastase activity; and the negative controls (DMEM + 10%
FBS, DH2O and 500 nM IL-1β) were used to demonstrate no elastase activity.
In comparison to the negative controls (figure 59a) low amounts of HDF-elastase activity
was produced by the HDF-elastase expressed outside HDF cells (extracellular) as the
initial rates were in the range of 0.26 – 10.46 RFU hr-1 (figure 59b) and on average the
rates for the negative controls were < 9.29 RFU hr-1. Additionally, over the 7 day period
there was no significant difference in the HDF-elastase activity of the extracellular HDF-
elastase expressed by HDF cells depending on the concentration of IL-1β (p > 0.05).

CHAPTER 5: Reduction of Fibroblast Elastase Activity by PEGA Particles
186
(a) (b)
0
500
1000
1500
2000
DMEM DH2O IL-1ß PPE
Rate
(R
FU
hr-1
)
1
3
5
7
02550100
250500
0
5
10
15
20
25
Rate
(RFU hr-1)
Day
IL-1ß (nM)
(c) (d)
1
3
5
7
02550
100250500
0
5
10
15
20
25
Rate
(RFU hr-1)
Day
IL-1ß (nM)
1
3
5
7
025
50100250500
0
100
200
300
400
500
Rate
(RFU hr-1)
Day
IL-1ß (nM)
Figure 59. Rate of HDF-elastase activity expressed by HDF cells in DMEM + 10% FBS. (a): initial rates of elastase activity for both negative (DMEM, DH2O and IL-1β) and the positive (elastase: PPE) controls. HDF cells (passage 10: 40, 000 cells/ml) were stimulated with various concentrations of IL-1β (25 – 500 nM) to examine the rate of HDF-elastase activity expressed extracellular (b) or intracellular (c-d) by HDF cells in DMEM + 10% FBS. Low amounts of HDF-elastase activity were expressed extracellular by both untreated (0 nM IL-1β) and treated (25-500 nM IL-1β) HDF cells (b). In contrast, when HDF cells were lysed, HDF cells were found to express HDF-elastase activity when the surrounding media of HDF cells was water (d: after day 4) rather than DMEM + 10% FBS incubated with/without IL-1β (c). The data for the negative/ positive controls are expressed as the average rate + SE for 7 days with 3 measurements observed per day. The data for the HDF-elastase activity are expressed as the mean rate per day for 3 measurements (n = 3).
In order to determine whether HDF cells expressed elastase activity inside the cells
(intracellular), the cell membrane of HDF cells were lysed releasing the internal contents
into the surrounding media. After HDF cells were stimulated with IL-1β, both untreated
and treated HDF cells were lysed by freeze-thaw and two approaches of the surrounding
media were used in which the HDF cells were incubated.
0
2
4
6
8
10
DMEM DH2O IL-1ß
Ra
te (
RF
U h
r-1)
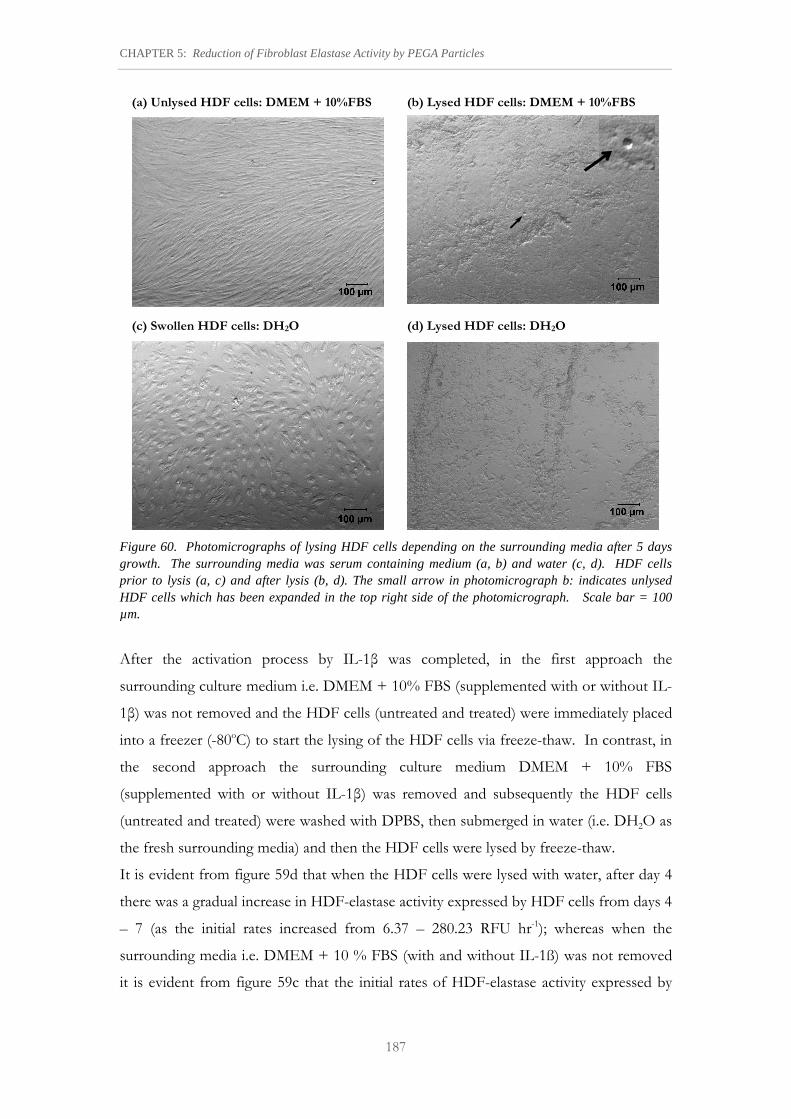
CHAPTER 5: Reduction of Fibroblast Elastase Activity by PEGA Particles
187
(a) Unlysed HDF cells: DMEM + 10%FBS (b) Lysed HDF cells: DMEM + 10%FBS
(c) Swollen HDF cells: DH2O (d) Lysed HDF cells: DH2O
Figure 60. Photomicrographs of lysing HDF cells depending on the surrounding media after 5 days growth. The surrounding media was serum containing medium (a, b) and water (c, d). HDF cells prior to lysis (a, c) and after lysis (b, d). The small arrow in photomicrograph b: indicates unlysed HDF cells which has been expanded in the top right side of the photomicrograph. Scale bar = 100 µm.
After the activation process by IL-1β was completed, in the first approach the
surrounding culture medium i.e. DMEM + 10% FBS (supplemented with or without IL-
1β) was not removed and the HDF cells (untreated and treated) were immediately placed
into a freezer (-80oC) to start the lysing of the HDF cells via freeze-thaw. In contrast, in
the second approach the surrounding culture medium DMEM + 10% FBS
(supplemented with or without IL-1β) was removed and subsequently the HDF cells
(untreated and treated) were washed with DPBS, then submerged in water (i.e. DH2O as
the fresh surrounding media) and then the HDF cells were lysed by freeze-thaw.
It is evident from figure 59d that when the HDF cells were lysed with water, after day 4
there was a gradual increase in HDF-elastase activity expressed by HDF cells from days 4
– 7 (as the initial rates increased from 6.37 – 280.23 RFU hr-1); whereas when the
surrounding media i.e. DMEM + 10 % FBS (with and without IL-1ß) was not removed
it is evident from figure 59c that the initial rates of HDF-elastase activity expressed by

CHAPTER 5: Reduction of Fibroblast Elastase Activity by PEGA Particles
188
HDF cells was significantly lower as the initial rates were in the range of 0.27 – 10.06
RFU hr-1 (p < 0.05).
Using the first approach, there are two possible reasons as to why HDF cells did not
express HDF-elastase activity and these are now considered. Firstly, it was possibly that
the HDF cells were not efficiently lysed with DMEM + 10% FBS (figure 60b) in
comparison to water (figure 60d). It was observed that when water was added to HDF
cells they instantly swelled (figure 60c) which is expected because in the presence of
water the ionic strength of the surrounding media was lowered making it easier for water
to penetrate into the HDF cells and thus allowing the HDF cells to efficiently burst
releasing their internal contents into surrounding media via freeze-thaw (figure 60d). As
a result, for the remaining experiments in this chapter, water was used as the surrounding
media to lyse HDF cells via freeze-thaw.
Secondly, for the reason that HDF cells were found to express HDF-elastase activity
when lysed with water, it was envisaged that possibly the serum (10% FBS) in DMEM
may inhibit HDF-elastase activity (Meyer et al. 1975) or the HDF cells were secreting
something resulting in the inhibition of HDF-elastase activity outside the HDF cells.
Accordingly, the experiment was repeated in serum-free medium (SFM): again the HDF
cells were cultured in DMEM + 10% FBS and then near confluent HDF cells (>95%,
passage 12) were re-suspended in SFM and 40, 000 cells/ml were seeded per well. IL-1β
was dissolved at various concentrations (25 – 500 nM) in SFM and subsequently after 4
hours the treated HDF cells were stimulated with IL-1β (25 – 500 nM) whereas SFM was
added to the untreated HDF cells instead of IL-1β. Next, the extracellular and
intracellular expression of HDF-elastase activity by both untreated and treated HDF cells
was monitored over 7 days.
Collectively, over the course of 7 days, in comparison to the negative controls the HDF-
elastase activity of the extracellular or intracellular HDF-elastase expressed by HDF cells
was not significantly different (p > 0.05). Additionally, the HDF-elastase activity of the
extracellular HDF-elastase expressed by HDF cells (untreated and treated) in SFM had
initial rates in the range of 0.83 – 6.69 RFU hr-1 (figure 61b) and these initial rates were
not significantly different from the HDF-elastase activity of the intracellular HDF-
elastase expressed inside HDF cells (untreated and treated) in SFM as the initial rates

CHAPTER 5: Reduction of Fibroblast Elastase Activity by PEGA Particles
189
were in the range of 0.86 – 10.07 RFU hr-1 (figure 61c, p > 0.05). Furthermore, on
average there was no significant difference in the HDF-elastase activity of the
extracellular or intracellular HDF-elastase depending on the concentration of IL-1β in
SFM (p > 0.05).
(a) (b)
0
500
1000
1500
2000
SFM DH2O IL-1ß PPE
Rate
(R
FU
hr-1
)
1
3
5
7
02550100
250500
0
5
10
15
20
25
Rate
(RFU hr-1)
Day
IL-1ß (nM)
(c)
1
3
5
7
025
50100250500
0
5
10
15
20
25
Rate
(RFU hr-1)
Day
IL-1ß (nM)
Next the HDF-elastase activity of the extracellular and intracellular HDF-elastase by
both untreated and treated HDF cells in SFM (figure 61b-c) and in DMEM + 10% FBS
(figure 59a, d) were compared. The percentage decrease of HDF-elastase in SFM in
comparison to DMEM + 10% FBS is summarised in table 14: it can be seen that the
HDF-elastase activity of the extracellular or intracellular HDF-elastase expressed by
HDF cells in SFM was significantly lower than in DMEM + 10% FBS (p < 0.05). It was
therefore evident that serum was required for HDF-elastase activity.
Figure 61. Rate of HDF-elastase activity expressed by HDF cells in SFM. (a): the intial rates of elastase activity for both the negative (DMEM, DH2O and IL-1β) and positive (elastase: PPE) controls are expressed as the average rate + SE for 7 days with 3 measurements observed per day. HDF cells (passage 12: 40, 000 cells/ml) were stimulated by IL-1β (25-500 nM) in SFM and the initial rates of HDF-elastase activity expressed extracellularly (b) or intracellularly (c) by both untreated (0 nM IL-1β) and treated (25-500 nM IL-1β) HDF cells. The data for the expression of HDF-elastase activity (b-c) are expressed as the mean rate per day for 3 measurements (n = 3).
0
1
2
3
4
5
SFM DH2O IL-1ß
Rate
(R
FU
hr-1
)

CHAPTER 5: Reduction of Fibroblast Elastase Activity by PEGA Particles
190
Table 14. Percentage decrease of HDF-elastase activity in SMF compared to DMEM + 10% FBS for both untreated and treated HDF cells with or without of IL-1β
Average Rate (RFU hr-1) ** HDF-elastase activity
HDF cells *
IL-1 β
SFM DMEM + 10 % FBS
Decrease HDF-elastase activity in SFM (%) #
p-value #
(ANOVA)
Untreated None 3.80 4.07 6.63 p < 0.05
Secreted Treated Added 2.95 4.63 36.37 p < 0.05
Untreated None 2.84 17.13 83.42 p < 0.05
Expressed Treated Added 4.02 58.62 93.14 p < 0.05
* Untreated HDF cells (control: no IL-1β); treated HDF cells (test: added IL-1β i.e. 25 – 500 nM)
** The collective average rate (RFU hr-1) of HDF-elastase activity over 7 days # Comparison between the rate of HDF-elastase activity for SFM versus DMEM + 10% FBS
Consequently, a positive control experiment was then conducted to determine whether
supplementing DMEM with 25% heat inactivated FBS (DMEM + 25% FBS) was
sufficient to increase elastase activity. As the commercially bought elastase i.e. PPE was
used as a positive control for all experiments in this chapter it was therefore used as the
positive model standard to mimic the elastase activity that would normally be expressed
intracellularly or extracellularly by any particular cell such as HDF cells within the
environment of a wound. As we encountered earlier, various researchers have reported
that HDF-elastase is an MMP (Homsy et al. 1988; Beranger et al. 1994; Isnard et al.
2002) whereas PPE is a serine protease and in a previous study Meyer et al. showed
elastase activity of pure PPE to be inhibited by human serum (Meyer et al. 1975). As a
consequence, in order to make direct comparisons between the elastase activity of PPE
and HDF-elastase it was essential to measure the effect of elastase activity for PPE in the
presence of SFM and DMEM + 10% FBS. Therefore, PPE was dissolved in DMEM
(i.e. SFM or supplemented with 10% or 25% FBS) at a concentration of 0.01 mg/ml.
Furthermore, after the PPE was prepared in the above experiments (referred as the
positive control) it was stored at 4oC until it was required for analysis and was
subsequently added to the wells of a 96 well-plate just before the fluorescence substrate
assay was carried out. It was predicted that possibly the storage temperature of PPE
(positive control) may affect the fluorescence output reading. For that reason, it was
essential to measure elastase activity of PPE after it had been stored at 4 oC or incubated
at 37 oC (incubated in a humidified atmosphere containing 5% CO2) to determine the
effect of temperature on the elastase activity of PPE.

CHAPTER 5: Reduction of Fibroblast Elastase Activity by PEGA Particles
191
750
1250
1750
2250
2750
SFM 10% FBS 25% FBS
Rate
(R
FU
hr-1
)
4 oC 37 oC
Figure 62. Variation of elastase activity in DMEM supplemented with or without FBS against temperature. Elastase (PPE, 0.01 mg/ml) was dissolved in DMEM i.e. serum-free medium (SFM) or supplemented with either 10% or 25% heat inactivated FBS and then stored at 4 oC or incubated at 37 oC for 15 minutes prior to analysis via the fluorescence assay. Initial rates of elastase-substrate reaction versus DMEM (i.e. SFM, +10% FBS and + 25% FBS) demonstrate elastase activity to increase with increasing serum concentration. Elastase activity was significantly high for DMEM + 25% FBS at 37oC compared to SFM and DMEM + 10% FBS (p < 0.05). Data are expressed as the mean + SE of five measurements (n = 5).
Table 15. Statistical differences and similarities between the elastase activity of PPE in DMEM depending on both the concentration of FBS and temperature
Entry DMEM SFM:
4oC
SFM:
37oC
10% FBS:
4oC
10% FBS:
37oC
25% FBS:
4oC
25% FBS:
37oC
1 SFM: 4oC n/a NSD SD SD SD SD
2 SFM: 37oC NSD n/a SD SD SD SD
3 10% FBS: 4oC SD SD n/a NSD NSD NSD
4 10% FBS: 37oC SD SD NSD n/a NSD SD
5 25% FBS: 4oC SD SD NSD NSD n/a NSD
6 25% FBS: 37oC SD SD NSD SD NSD n/a
Abbreviations: SFM (serum-free medium), FBS (fetal bovine serum), n/a (not applicable), NSD (not significantly different, p > 0.05); SD (significantly different, p < 0.05). Note for each row/ column the shaded grey is the same as the un-shaded parts (except for when it states n/a).
Figure 62 shows that the initial rates of elastase activity of PPE significantly depended on
both concentration of serum (FBS) in DMEM and the storage temperature of PPE after
its preparation. Depending on the concentration of serum in DMEM, elastase activity
was found to increase with increasing serum concentration at both 4oC (figure 62: blue
bars) and 37oC (figure 62: maroon bars). High elastase activity of PPE was observed
when PPE was dissolved in DMEM + 25% FBS at 37oC compared to SFM and DMEM
+ 10% FBS. Statistically, elastase activity of PPE was significantly lower for SFM
compared to both 10% and 25% FBS containing DMEM at both 4oC and 37oC (entries
1-2: table 15, p < 0.05). On the contrary, when the initial rates of elastase activity of PPE

CHAPTER 5: Reduction of Fibroblast Elastase Activity by PEGA Particles
192
for both 10% and 25% FBS containing DMEM at both 4oC and 37oC were compared,
elastase activity of PPE was not significantly different as summarised in table 15 (entries
3 – 6); whereas at 37oC elastase activity of PPE for DMEM + 25% FBS was significantly
different from DMEM + 10% FBS (p < 0.05).
(a) (b)
0
500
1000
1500
2000
2500
DMEM DH2O IL-1ß PPE
Rate
(R
FU
hr-1
)
1
3
5
7
02550100
250500
0
5
10
15
20
25
Rate
(RFU hr-1)
Day
IL-1ß (nM)
(c)
1
3
5
7
025
50100250500
0
100
200
300
400
500
Rate
(RFU hr-1)
Day
IL-1ß (nM)
As elastase activity of PPE was found to increase with increasing serum, it was therefore
predicted that HDF cells required more serum (i.e. 25% FBS) in DMEM to possibly
increase the HDF-elastase activity of the secreted HDF-elastase by HDF cells.
Subsequently, the experiment was repeated in DMEM + 25% FBS: near confluent HDF
cells (>95%, passage 12) were re-suspended in DMEM + 25% FBS and 40, 000 cells/ ml
were seeded per well, IL-1β (25 – 500 nM) was dissolved in DMEM + 25% FBS and
subsequently after 4 hours the treated HDF cells were stimulated with IL-1β (i.e. 25 –
500 nM) whereas DMEM + 25% FBS was added to untreated HDF cells instead of IL-
Figure 63. Rate of HDF-elastase activity expressed by HDF cells in DMEM + 25% FBS. (a): Initial rates of elastase activity for both negative (DMEM, DH2O and IL-1β) and positive (elastase: PPE) controls are expressed as the average rate + SE for 7 days with 3 measurements observed per day. HDF cells (passage 12: 40, 000 cells/ml) were stimulated by IL-1β (25-500 nM) in DMEM + 25% FBS and the initial rates of the HDF-elastase activity expressed extracellularly (b) or intraceullarly (c) by both untreated (0 nM IL-1β) and treated HDF cells (25-500 nM IL-1β) demonstrate that HDF cells are found to intracellularly express elastionolytic activity (c) rather than express HDF-elastase extracellularly. The data for the HDF-elastase activity (b-c) are expressed as the mean rate per day for 3 measurements (n = 3).
0
1
2
3
4
5
DMEM DH2O IL-1ß
Rate
(R
FU
hr-1
)

CHAPTER 5: Reduction of Fibroblast Elastase Activity by PEGA Particles
193
1β. After that the HDF-elastase activity of the expressed extracellular or intracellular
HDF-elastase was again monitored for both untreated and treated HDF cells in DMEM
+ 25% FBS over 7 days (figure 63).
Additionally, in order to keep the temperature consistent for the fluorescence assay, both
the positive (PPE) and negative controls were all equilibrated for 15 minutes at 37oC (in a
humidified atmosphere containing 5% CO2) prior to analysis via the fluorescence
substrate assay.
Although, the serum concentration of DMEM was increased to 25% FBS, collectively
the HDF-elastase activity of the expressed extracellular HDF-elastase by HDF cells was
< 6.00 RFU hr-1 (figure 63b: initial rates ranged from 0.77 – 5.57 RFU hr-1) over the
period of 7 days. As a result, this confirmed that HDF cells were unable to express
extracellular HDF-elastase in the absence or presence of IL-1β (figure 63b). Previously it
was proposed that HDF cells were secreting elastase inhibitors. As mention earlier,
various reports have illustrated that the elastase secreted by fibroblasts is an MMP such
as MMP-2 or MMP-9 (Homsy et al. 1988; Beranger et al. 1994; Isnard et al. 2002).
Additionally, fibroblasts have been reported to secrete MMP-1 (Lobmann et al. 2005;
Lovejoy et al. 1994) and IL-1β has been reported as being linked with the production of
MMP-1 (Herny and Garner 2003; Dasu et al. 2003) in which Dasu et al. have showed
that stimulated dermal fibroblasts primarily produce MMP-1 alongside TIMP-1 under the
influence of IL-1β (Dasu et al. 2003) and Mast et al. have also reported that fibroblasts
secrete TIMPs (Mast and Schultz 1996) which as we have encountered in chapter 2 are
the natural inhibitors of MMPs. This would suggest that if the extracellular HDF-
elastase expressed by HDF cells is an MMP and if the HDF cells are also secreting
TIMPs, then it is most likely that the extracellular HDF-elastase expressed by HDF cells
is inhibited by TIMPs.
Yet again, HDF cells were found to express (intracellular) HDF-elastase activity in
DMEM + 25% FBS (figure 63c) and as expected HDF-elastase activity was expressed
more by the treated HDF cells (i.e. 4.04 – 306.53 RFU hr-1) compared to untreated HDF
cells (i.e. 4.03 – 8.98 RFU hr-1). Although, the HDF-elastase activity of the expressed
intracellular HDF-elastase gradually increased from days 4 – 7 (i.e. initial rates increased
from 25.43 – 306.53 RFU hr-1) statistically the initial rates of HDF-elastase activity for

CHAPTER 5: Reduction of Fibroblast Elastase Activity by PEGA Particles
194
days 5 – 7 i.e. 130.27 – 306.53 RFU hr-1 were significantly higher than days 1 – 4 i.e. 4.04
– 55.81 RFU hr-1 (p < 0.05). On average over the 7 day period, the HDF-elastase activity
for the treated HDF cells was independent on the concentration of IL-1β (p > 0.05).
However, 250 nM of IL-1β gave the highest HDF-elastase activity for the expressed
intracellular HDF-elastase inside HDF cells and was therefore selected for subsequent
experiments.
Next the HDF-elastase activity of the expressed intracellular HDF-elastase in HDF cells
in DMEM + 25% FBS (figure 63b) was compared with DMEM + 10% FBS (figure 59d)
and SFM (figure 61b) only for the treated HDF cells (with 25 – 500 nM IL-1ß) as they
expressed more HDF-elastase activity. Comparisons were made using ANOVA
(oneway) followed by pair comparisons via post hoc Tukey and Duncan tests. As
expected the HDF-elastase activity of the expressed intracellular HDF-elastase in HDF
cells was significantly higher in DMEM + 25% FBS compared to SFM (p < 0.05: figure
64; entry 1: table 16).
Figure 64. Comparisons between the initial rate for HDF-elastase activity in DMEM + 25% FBS versus both SFM and DMEM + 10% FBS. Statistical analysis was carried out using oneway ANOVA followed by pairwise comparison using post hoc (Tukey and Duncan) tests.
However, mixed observations were obtained when HDF-elastase activity in DMEM +
25% FBS was compared with that in DMEM + 10% FBS as summarised in table 16
(entry 2): the Tukey post hoc test indicated that HDF-elastase activity in both 10% and
25% containing DMEM was not significantly different (p > 0.05: figure 64; entry 2: table
16); whereas the Duncan post hoc test indicated that HDF-elastase activity in DMEM +
Table 16. Statistical comparisons of HDF-elastase activity in DMEM (SFM, or supplemented with 10% or 25% FBS) using one-way ANOVA
Entry DMEM 10% FBS 25% FBS
1 SFM SD */# SD */#
2 10% FBS n/a NSD*
SD#
Abbreviations: FBS (fetal bovine serum), SFM (serum-free medium), SD (significantly different, p < 0.05); NSD (not significantly different, p > 0.05), * post hoc: Tukey test and # post hoc: Duncan test.

CHAPTER 5: Reduction of Fibroblast Elastase Activity by PEGA Particles
195
25% FBS was significantly different from that in DMEM + 10% FBS (p < 0.05: figure
64; entry 2: table 16).
Collectively, the initial mean rates of HDF-elastase activity of the expressed intracellular
HDF-elastase in HDF cells in DMEM + 10% FBS (58.62 RFU hr-1) was lower than in
DMEM + 25% FBS (96.97 RFU hr-1) for all IL-1β concentrations over the 7 day period.
As a result, DMEM + 25% FBS was selected for subsequent experiments.
5.4.2 Reduction of HDF-elastase activity by PEGA particles
This section demonstrates the reduction of elastase activity when sample fluids or HDF
cell lysate containing elastase activity are treated with functionalised PEGA particles.
Firstly, a positive control experiment was carried out in which PPE was again used as the
model elastase standard to demonstrate the feasibility of reducing elastase activity in
samples fluids containing PPE at physiological pH and ionic strength. Sample fluids
were prepared by dissolving elastase (PPE, 0.01 mg/ml) in DMEM + 25% FBS (pH 7.4
and 0.15M). After SPPS, functionalised PEGA particles (RAA, EAA, GAA) were
washed with H2O, DH2O, DPBS and then with DMEM + 25% FBS. Functionalised
PEGA particles (10 mg) were transferred to individual centrifuges vials and then swollen
in DMEM + 25% FBS (50 µl) for 5 minutes. Next sample fluids containing PPE were
treated with the prewashed and swollen functionalised PEGA particles (RAA, EAA,
GAA) for 5 and 15 minutes. After that, at each time point the supernatants were
examined with the fluorescence elastase substrate (MeOSuc-Ala-Ala-Pro-Val-AMC) for
the residual elastase activity of PPE in the sample fluids after they had been treated with
PEGA particles using the fluorescence substrate assay.
Figure 65 shows the elastase activity of PPE in sample fluids and the residual elastase
activity of PPE after the sample fluids were treated with PEGA particles for 5 and 15
minutes and the initial rates of elastase for PPE are expressed as RFU hr-1 (figure 65a).
However, as the mass for each PEGA particle varied, the initial rates of residual elastase
activity of PPE in the sample fluids was corrected according to the mass of PEGA
particles used, in which the initial rates were expressed as Rate/ mass (RFU hr-1/mg,
figure 65b).

CHAPTER 5: Reduction of Fibroblast Elastase Activity by PEGA Particles
196
(a) (b)
1500
1750
2000
2250
2500
0 5 10 15Time (minutes)
Rat
e (
RF
U h
r-1)
Elastase RAAEAA GAA
120
140
160
180
200
RAA EAA GAA
Ra
te/
Ma
ss (
RF
U h
r-1/
mg
)
5 minutes 15 minutes
Figure 65. Rates of residual elastase activity remaining in sample fluids (at physiological pH 7.4 and ionic strength 0.15M) after the removal of functionalised PEGA particles (RAA, EAA, GAA). Elastase (PPE: 0.01 mg/ml dissolved in DMEM + 25% FBS) was incubated with functionalised PEGA particles for 5 and 15 minutes. Plots demonstrate (a) the intial rates from elastase-substrate reaction versus the time in which elastase was incubated with PEGA particles, and (b) initial rates of elastase activity per mass of PEGA particles. Data represents the mean + SE of three measurements (n = 3).
Collectively at both 5 minutes and 15 minutes, on average the elastase activity of PPE
(initial rate: 2223.78 RFU hr-1) was significantly reduced more by EAA (negative: 1702.51
RFU hr-1) and RAA (positive: 1881.29 RFU hr-1) PEGA particles (p < 0.05, figure 65a)
compared to GAA (neutral: 2015.35 RFU hr-1) PEGA particles (p > 0.05, figure 65a).
Next, depending on the mass of PEGA particles used, the residual elastase activity of
PPE in samples fluids after they had been treatment with PEGA particles were
compared: elastase activity of PPE was reduced by 20.8 – 26.1% (5 – 15 minutes) after
samples fluids were treated with EAA; whereas when treated with RAA elastase activity
of PPE reduced by 15.0 – 15.8% (5 – 15 minutes) and for GAA it reduced by 11.6 –
7.1% (5 – 15 minutes). Statistically, the elastase activity of PPE was significantly reduced
more by EAA compared to both RAA and GAA (p < 0.05) which was expected since at
pH 7.4 elastase i.e. PPE exists in its cationic form (pI < 8.31) which means that it has
preference of accessing PEGA particles of opposite charge such as EAA (negative)
PEGA particles more compared to both RAA (positive) and GAA (neutral) PEGA
particles. Additionally, as we learnt in chapter 3, after elastase (PPE) cleaves the ECP
from EAA, the negative charge (Glu(–)) is removed causing elastase (PPE) to become
trapped into the matrix of the negative PEGA particles (EAA) and as a result this would
cause a drop in the residual elastase activity of PPE in sample fluids compared to both
the positive (RAA) and neutral (GAA) PEGA particles.

CHAPTER 5: Reduction of Fibroblast Elastase Activity by PEGA Particles
197
Depending on the mass of PEGA particles (figure 65b), statistically the residual elastase
activity of PPE in sample fluids was significantly lower for EAA compared to GAA at
both 5 and 15 minutes (p < 0.05) and RAA at 15 minutes (p < 0.05; figure 65b).
However, the residual elastase activity of PPE for the charged PEGA particles (EAA
versus RAA) was not significantly different at 5 minutes (p > 0.05). Similarly the residual
elastase activity of PPE in sample fluids was not significantly different between RAA
versus GAA at both 5 and 15 minutes (p > 0.05). When each PEGA particle (RAA,
EAA and GAA) was compared to time, for each PEGA particle the residual elastase
activity of PPE in all samples fluids was not significantly different at both 5 and 15
minutes (figure 65b). However, the residual elastase activity of PPE was high in sample
fluids that had been treated with the neutral PEGA particles (GAA) and from figure 65a
it was observed that the initial rate of elastase activity of PPE was found to increase at 15
minutes, whereas when taking the mass of GAA particles into account, the residual
elastase activity of PPE were roughly the same for both 5 and 15 minutes (figure 63b),
although it was observed that at 15 minutes the residual elastase activity of PPE was
found to increase by 4.5% in respect of 5 minutes. These observations for GAA
correspond to findings observed in chapter 4 (i.e. fluorescence substrate assay and FITC-
elastase) in which the mopping-up of elastase activity for PPE in sample fluids at pH 7 –
8 and with an ionic strength of 0.1 M did not change over time, there was a slight
increase in elastase activity observed from 5 minutes to 15 minutes (using fluorescence
substrate assay). Similarly, the penetration of FITC-elastase into GAA showed that
fluorescence was found to decrease inside the GAA particles over time. The results in
this chapter and chapter 4 confirm the reason why elastase (PPE) is not retained by the
neutral (GAA) PEGA particles: after elastase i.e. PPE cleaves the neutral ECP it
becomes trapped for the first 5 minutes and subsequently elastase leaks back out of the
GAA particles. This is because with the GAA particles there is no initial charge to be
removed. Instead after elastase (PPE) cleaves the Ala-Ala bond of the neutral ECP
(GA~A) the terminal amine group of the Ala residue becomes protonated (NH3+), hence
causing the swelling of the (+)Ala-PEGA particles to increase (see chapter 3) which
possibly explains why elastase (PPE) is not retained by the neutral GAA particles.
Additionally, it is possible that initial swelling of the neutral GAA particles can only
accommodate and trap some of the elastase (PPE) from sample fluids whereas the
remaining elastase (PPE) remains in the sample fluid.

CHAPTER 5: Reduction of Fibroblast Elastase Activity by PEGA Particles
198
Having established that HDF cells express intracellular HDF-elastase, hence HDF-
elastase activity under the influence of IL-1β in DMEM + 25% FBS, the remaining part
of this section highlights the reduction of HDF-elastase activity of the expressed
intracellular HDF-elastase in HDF cells by incubating and treating it with functionalised
PEGA particles (RAA, EAA, and GAA). After HDF cells were lysed, the HDF cell
lysate containing HDF-elastase was collected and thoroughly mixed by drawing the HDF
cell lysate ‘in-and-out’ of a micropipette. Subsequently, the pH of the collected HDF cell
lysate was examined (pH 7.6) and it was then incubated and treated with functionalised
PEGA particles (RAA, EAA, GAA) for 5 and 15 minutes.
After centrifugation, at each time point the supernatant were assayed with the synthetic
fluorescence elastase substrate (MeOSuc-Ala-Ala-Pro-Val-AMC) to examine the residual
HDF-elastase activity in the supernatants of the HDF cell lysate after it had been treated
with each functionalised PEGA particles (RAA, EAA, GAA).
Figure 66 illustrates the mopping-up of HDF-elastase activity by all functionalised PEGA
particles. The elastase activity of both the positive control (PPE) and the negative
controls (DMEM, DH2O and 250 nM IL-1β) are given by figure 66a. Figure 66b shows
the HDF-elastase activity of the expressed HDF-elastase in HDF cells that was added to
PEGA particles and the same trend was previously seen by figure 63b; in figure 66b
HDF-elastase gradually increased from days 4 onwards (> 99.91 – 419.83 RFU hr-1) and
statistically the initial rates of HDF-elastase activity were significantly higher for both
days 6 (419.83 RFU hr-1) and day 7 (296.70 RFU hr-1) compared to days 1 – 5 (p < 0.05).
When HDF cell lysate containing the HDF-elastase activity was treated with PEGA
particles, comparing the initial HDF-elastase activity (figure 66b) with the residual HDF-
elastase activity for all functionalised PEGA particles i.e. RAA (positive: figure 66c) EAA
(negative: figure 66e) and GAA (neutral: figure 66g) the HDF-elastase activity was
significantly reduced by all functionalised PEGA particles at both 5 and 15 minutes (p <
0.05). The initial rates for residual HDF-elastase activity were significantly similar for all
PEGA particles (figure 66c, e, g: p > 0.05).
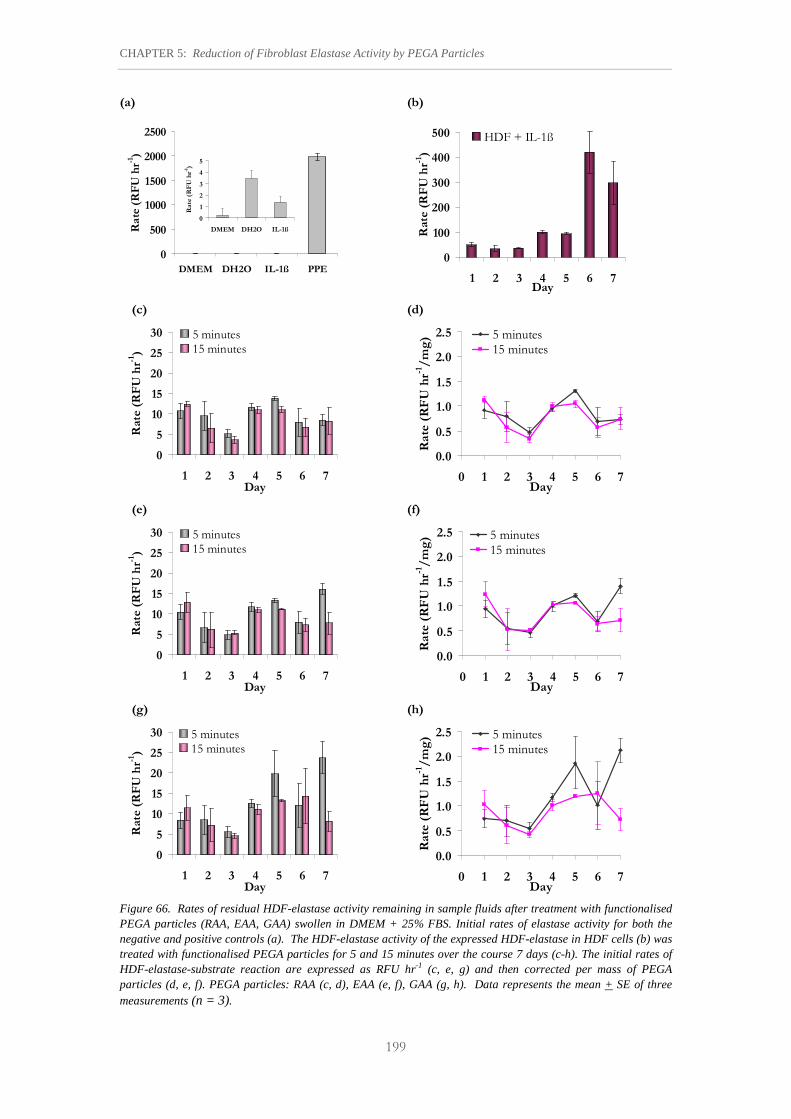
CHAPTER 5: Reduction of Fibroblast Elastase Activity by PEGA Particles
199
(a) (b)
0
500
1000
1500
2000
2500
DMEM DH2O IL-1ß PPE
Ra
te (
RF
U h
r-1)
0
100
200
300
400
500
1 2 3 4 5 6 7Day
Rat
e (
RF
U h
r-1)
HDF + IL-1ß
(c) (d)
0
5
10
15
20
25
30
1 2 3 4 5 6 7Day
Rat
e (R
FU
hr-1
)
5 minutes15 minutes
0.0
0.5
1.0
1.5
2.0
2.5
0 1 2 3 4 5 6 7Day
Rate
(R
FU
hr-1
/m
g) 5 minutes
15 minutes
(e) (f)
0
5
10
15
20
25
30
1 2 3 4 5 6 7Day
Rat
e (R
FU
hr-1
)
5 minutes15 minutes
0.0
0.5
1.0
1.5
2.0
2.5
0 1 2 3 4 5 6 7Day
Rate
(R
FU
hr-1
/m
g) 5 minutes
15 minutes
(g) (h)
0
5
10
15
20
25
30
1 2 3 4 5 6 7Day
Rat
e (R
FU
hr-1
)
5 minutes15 minutes
0.0
0.5
1.0
1.5
2.0
2.5
0 1 2 3 4 5 6 7Day
Rate
(R
FU
hr-1
/m
g) 5 minutes
15 minutes
Figure 66. Rates of residual HDF-elastase activity remaining in sample fluids after treatment with functionalised PEGA particles (RAA, EAA, GAA) swollen in DMEM + 25% FBS. Initial rates of elastase activity for both the negative and positive controls (a). The HDF-elastase activity of the expressed HDF-elastase in HDF cells (b) was treated with functionalised PEGA particles for 5 and 15 minutes over the course 7 days (c-h). The initial rates of HDF-elastase-substrate reaction are expressed as RFU hr-1 (c, e, g) and then corrected per mass of PEGA particles (d, e, f). PEGA particles: RAA (c, d), EAA (e, f), GAA (g, h). Data represents the mean + SE of three measurements (n = 3).
0
1
2
3
4
5
DMEM DH2O IL-1ß
Rate
(R
FU
hr-1
)

CHAPTER 5: Reduction of Fibroblast Elastase Activity by PEGA Particles
200
However, differences were achieved when the mass of PEGA was taken into account, in
which the initial rate of HDF-elastase-substrate complex were expressed as the rate/mass
i.e. RFU hr-1/mg (figure 66d, f, h). When the initial rates of HDF-elastase activity were
compared with all PEGA particles collectively at both 5 and 15 minutes, on average the
reduction of HDF-elastase activity was significantly similar between the positive and
negative PEGA particles (RAA: figure 66d and EAA: figure 66f, p > 0.05) as well as the
negative and neutral PEGA particles (EAA: figure 66f; and GAA: figure 66h, p > 0.05),
but was significantly different between the positive and neutral PEGA particles (RAA:
figure 66d; and GAA: figure 66h, p < 0.05). RAA was found to reduce HDF-elastase
activity significantly more compared to GAA (figures 66d and 66h respectively, p <
0.05). There are two possible reasons for these observations, firstly as we observed in
chapter 3 at high ionic strength the positive PEGA particles (RAA) were found to swell
significantly more than both the negative (EAA) and neutral (GAA) PEGA particles (p <
0.05) whereas the swelling for EAA and GAA was significantly similar; and for that
reason HDF-elastase was able to penetrate RAA more compared to EAA and GAA.
Secondly, as mentioned previously it is possible the intracellular HDF-elastase expressed
by HDF cells is in fact an MMP such as MMP-1, MMP-2 or MMP-9 (Homsy et al. 1988;
Lobmann et al. 2005; Lovejoy et al. 1994; Herny and Garner 2003; Dasu et al. 2003;
Beranger et al. 1994; Isnard et al. 2002). From table 17 (given in appendix I) the pI
values of these proteases are:- MMP-1: pI 6.47 (entry 4, table 17), MMP-2: pI 5.26 (entry
7, table 17) and MMP-9: pI 5.69 (entry 8, table 17) and since the pH of the HDF cell
lysate containing HDF-elastase that was added to the PEGA particles was pH 7.6, this
therefore means that if HDF-elastase is an MMP then the pI value for each MMP-1,
MMP-2 and MMP-9 indicates that intracellular HDF-elastase expressed by HDF cells
existed in its anionic form and as expected it would access, cleave and become trapped
more in the positive (RAA) PEGA particles and as a result the residual HDF-elastase
activity would be reduce more by RAA compared to both the negative (EAA) and
neutral (GAA) PEGA particles.
5.5 CONCLUSION
The results in this chapter demonstrate that HDF cells were unable to express HDF
elastase extracellularly, but when the cell membrane of HDF cells were lysed in the

CHAPTER 5: Reduction of Fibroblast Elastase Activity by PEGA Particles
201
presence of water, the HDF cells were found to express HDF-elastase (intracellularly)
under the influence of IL-1β and the levels of HDF-elastase activity were found to
increase from day 4 onwards. HDF-elastase activity was elevated when the
concentration of serum was increased from 10% to 25% FBS in DMEM and HDF-
elastase activity was found to decrease in SFM.
After sample fluids containing cationic elastase (i.e. PPE) were treated with
functionalised PEGA particles (RAA, EAA and GAA) at physiological pH 7.4 and ionic
strength 0.15M, the residual elastase of PPE (cationic) was significantly reduced more by
EAA (negative) PEGA particles compared to both RAA (positive) and GAA (neutral)
PEGA particles. Similarly, when the supernatants of HDF cell lysate containing HDF-
elastase activity from HDF cells were treated with functionalised PEGA particles
(prewashed and swollen in PBS at pH 7.4, 0.15 M) for 5 and 15 minutes. The residual
HDF-elastase activity in the supernatants of HDF cell lysate was reduced by all
functionalised PEGA particles (RAA, EAA and GAA) over 7 days. Although, it was
found that both the charged particles (RAA and EAA) contained low residual HDF-
elastase activity in the supernatants of HDF cell lysate compared to GAA, the positive
particles were found to significantly reduce HDF-elastase activity expressed by HDF cells
more compared to both the negative (EAA) and neutral (GAA) PEGA particles.

CHAPTER 6: Conclusions & Further Studies
202
CCHHAAPPTTEERR 66
CCoonncclluussiioonnss && FFuurrtthheerr SSttuuddiieess

CHAPTER 6: Conclusions & Further Studies
203
6.1 CONCLUSIONS
The management of chronic wounds has entered a new era of developing sophisticate
‘responsive’ mechanism-based care products for treating chronic wounds. Abundant
levels of elastase (namely NE) are documented as the main culprit of developing
unbearable chronic wounds as a result of causing the normal wound healing process to
become deadlocked. The aim of this thesis, therefore, was to design an elastase-
responsive chronic wound dressing based on the hydrogel polymer, PEGA in the form
of particles to exclusively and selectively mop-up excess elastase activity in sample fluids
mimicking the environment of chronic wounds. In order to address this, the
experimental study was split into to separate chapters and the findings are summarised
below.
In the first experimental chapter (chapter 3) PEGA(800, 1900) particles were functionalised
with various ECPs using SPPS consisting of the following configurations i.e. Fmoc-X-
Ala-Ala and Fmoc-X-Ala. Comparative studies demonstrated that elastase has a high
preference of hydrolysing Fmoc-X-Ala-Ala-PEGA(800, 1900) particles more whereas
thermolysin had a high preference to hydrolyse both the Fmoc-X-Ala-Ala-PEGA(800, 1900)
particles and Fmoc-X-Ala-PEGA(800, 1900) particles. At low ionic strength, it was
demonstrated that under the influence of pH (6.0 – 9.0) and charge, both thermolysin
and elastase in their cationic and anionic forms selectively penetrated functionalised
PEGA particles and selectively hydrolyse ECPs of opposite charge to that of the
thermolysin or elastase. Thermolysin was studied in its anionic form and was found to
readily hydrolyse the positively charged ECP (RAA or RA) compared to a negatively
charged ECP (EAA or EA). In contrast, elastase was studied both in its cationic and
anionic forms, cationic elastase had a high preference to cleave a negatively charged ECP
(EAA) whereas anionic elastase had the opposite effect. Additionally, the introduction
of ionic charges (positive: Arg(+) and negative: Glu(–)) into PEGA particles were found to
induce an increase in swelling compared to PEGA particles with a neutral charge
(achieved by Gly residue). Once the CMR was removed by a protease from both RAA
and EAA the swelling of each particle was found to reduce at low ionic strength
compared to GAA which contained no CMR. In contrast at high ionic strength the
swelling was found to increase for all ionic and neutral PEGA1900 particles i.e Fmoc-X-
Ala-Ala-PEGA1900 and Fmoc-X-Phe-Phe-PEGA1900. Overall, chapter 3 demonstrated the

CHAPTER 6: Conclusions & Further Studies
204
potential of selectively removing excess elastase from sample fluids mimicking the
environment of chronic wounds and this was then investigated further in chapter 4 and
5.
Firstly, in chapter 4 it was confirmed that in its cationic form at pH 7 – 8 elastase had
preference of cleaving the ECP of EAA significantly more than the ECPs of both RAA
and GAA at 0.1 M. The opposite effect was observed; wherein in its anionic form at pH
9 elastase was found to cleave RAA more compared to EAA and GAA at 0.1 M. Next,
the diffusion and accessibility of elastase into Fmoc-X-Ala-Ala-PEGA1900 particles was
explored with the use of various fluorescence techniques. As a consequence of localised
pH effect on the dansyl group, the fluorophore dansyl chloride was found not to be a
suitable staining approach for assessing the diffusion of elastase at various pH into
PEGA particles containing both acidic (e.g. Glu(–)) and basic (e.g. Arg(+)) groups. The
localised pH effect was found to cause base hydrolysis of the dansyl group causing the
fluorescence to increase for the Arg containing particles. Additionally, it is possible that
the dansyl labelling method was slow below pH 8 due to the presence of protonated
molecules causing the fluorescence to decrease for acidic residues.
Comparing the penetration of a 20 kDa FITC-labelled dextran into both un-cleaved and
cleaved PEGA particles, demonstrated the penetration of elastase followed by its
entrapment into charged particles (i.e. RAA particles) compared to neutral particles
(GAA). Removal of the CMR e.g. Arg(+) from the charged PEGA particles by elastase
activated the pores of PEGA particles to become restricted. In doing so, the 20 kDa
FITC-labelled dextran was unable to penetrate into the cleaved PEGA particles. This
collapsing of the pores within the matrix of PEGA1900 particles caused elastase to remain
trapped inside PEGA particles as it has a molecular weight of 25.9 kDa. Interestingly,
the direct penetration and entrapment of elastase into Fmoc-X-Ala-Ala-PEGA1900
particles was achieved by labelling elastase with FITC. At physiological pH 7.4 and ionic
strength 0.15 M, it was demonstrated that FITC-elastase became trapped in both EAA
and RAA particles more compared to GAA particles. In its cationic form, FITC-elastase
was found to become trapped into EAA particles within 2 minutes as FITC-elastase
managed to completely cleave the anionic ECP of the EAA particles within 2 minutes.
In contrast, at 0.1 - 0.15 M it was demonstrated that the neutral particles (GAA) were
unable to retain or encapsulate elastase as the fluorescence of the FITC-elastase inside

CHAPTER 6: Conclusions & Further Studies
205
the GAA particles was found to decrease. Coinciding with the observations achieved
from the FITC-dextran and FITC-elastase studies, it was observed that when sample
fluids containing elastase were treated with Fmoc-X-Ala-Ala-PEGA1900 particles, the
residual elastase activity of PPE in the sample fluids was reduced more by both RAA and
EAA compared to GAA particles.
In chapter 5, it was initially demonstrated that after treating sample fluids containing
cationic elastase with functionalised PEGA particles at physiological pH 7.4 and ionic
strength 0.15M, the residual elastase activity of PPE (cationic) was significantly reduced
more by negative PEGA particles compared to both positive and neutral PEGA
particles. Next, after HDF cells were activated by IL-1β and then lysed they were found
to express intracellular HDF-elastase. High HDF-elastase activity was expressed by
HDF cells when DMEM was supplemented with 25% FBS rather than 10% FBS or
SFM. Subsequently, supernatants of HDF cell lysate containing HDF-elastase were
treated with functionalised PEGA particles; over the course of 7 days the residual HDF-
elastase activity was found to decrease more by the ionic particles (RAA and EAA)
compared to GAA. Nevertheless, it was demonstrated that RAA were found to
significantly reduce HDF-elastase activity expressed by HDF cells more compared to
both the EAA and GAA PEGA1900 particles.
Overall, this thesis demonstrates the reduction of elastase activity by mopping it up into
both ionic (positive: RAA and negative: EAA) and neutral (GAA) PEGA particles.
Depending on the charge of elastase (i.e. PPE or HDF-elastase), PEGA particles of
opposite charge (RAA and EAA) were able to reduce elastase more compared to neutral
particles (GAA). Additionally, the charged particles (RAA and EAA) were found to
retain and entrap elastase, unlike the neutral GAA particles which were unable to retain/
entrap elastase.
6.1.1 Limitations of the studies
During the course of this thesis, there were a few limitations associate with the
experimental design of some methods, which are now discussed according to each
chapter.

CHAPTER 6: Conclusions & Further Studies
206
In chapter 3, due to time constraints the swelling of the cleaved particles was predicted in
which unmodified PEGA particles were functionalised with either (+)Ala or (+)Phe to
generate (+)Ala-PEGA particles and (+)Phe-PEGA particles, respectively. These particles
represented the cleaved products as schematically summarised in figure 36; and the
swelling of these particles was measured at various pH and ionic strength (figure 37a:
(+)Ala-PEGA; figure 38a: (+)Phe-PEGA). After that the difference in swelling was
calculated between the swelling of the un-cleaved particles (Fmoc-X-Ala-Ala-PEGA:
figure 34; Fmoc-X-Phe-Phe-PEGA: figure 35) and the cleaved particles ((+)Ala-PEGA:
figure 37a; and (+)Phe-PEGA: figure 38a) generating either an increase or decrease in
swelling as demonstrated by figure 37b-d and figure 38b-d, respectively. The method
could be improved by directly measuring the swelling of Fmoc-X-Ala-Ala-PEGA and
Fmoc-X-Phe-Phe-PEGA particles after they have been treated and cleaved with
proteases (e.g. thermolysin and elastase: PPE).
In chapter 4, after the functionalised particles were cleaved with elastase and then stained
with dansyl chloride the ring-effect for the accessibility and diffusion of elastase from
outer surface in the core of PEGA particles was successfully shown by reducing both the
ionic strength and enzyme concentration (figure 47). Seeing as both factors (i.e. ionic
strength and elastase concentration) were studied together, this raises the question as to
which factor influences the accessibility and diffusion of elastase into functionalised
PEGA particles:
• Does reducing ionic strength increase the accessibility of PEGA particles to
enable elastase to diffuse into PEGA particles?
• Does reducing the enzyme concentration slow the reaction to facilitate the
diffusion of elastase into PEGA particles?
To answer these questions, the experiment could be improved by examining each factor
(i.e. reducing the ionic strength or reducing elastase concentration) individually. Then
after dansyl chloride staining, the fluorescence of the TPM images for each factor could
be quantified and compared with one another including the fluorescence observed in
figure 47 in order to determine if one factor or both factors are required to be reduced to
influence the accessibility and diffusion of elastase in functionalised PEGA particles.
In chapter 5, after the HDF cells were lysed, the total cellular protein content should
have been determined using the Biorad protein assay or BCA protein assays in order to

CHAPTER 6: Conclusions & Further Studies
207
accurately determine whether or not the HDF elastase had completely released from the
lysed cells. Additionally, the cell culture conditions of the fluorescence substrate assay
for elastase activity should have been optimised by standardisation of the intracellular
concentration of HDF elastase with the cell number of HDF.
Additionally, during the cell culture studies in chapter 5 it became apparent that the
intracellular HDF elastase expressed by HDF cells maybe an MMP (e.g. MMP-1, MMP-2
or MMP-9: see the ending of section 5.4.2). The identification on whether this
predication was true was not investigated in this thesis. Accordingly, further work could
be done to confirm if the intracellular HDF-elastase was an MMP by reacting the HDF
cell lysate with commercially available MMP inhibitor's as this is a more specific
approach of distinguishing between which MMP it could be. For instance, the
commercial available MMPs inhibitors could be: tetracycline derivatives, hydroxamate/
heterocyclic base MMP inhibitors (as reviewed by Hayashi et al. 2007) and the
bisphosphonate: alendronate (as previously mentioned in chapter 2, see section 2.6.3.3).
6.2 FURTHER STUDIES
Having proven in this thesis that collapsing of pores within the matrix of PEGA particles
entraps elastase within the interior of charged Fmoc-X-Ala-Ala-PEGA particles after the
CMR of the ECP is selectively removed by elastase; clinically it is fundamental to take
other considerations into account before these elastase responsive hydrogel particles can
be applied as a chronic wound dressing to treat chronic wounds. For instance, since
PEGA particles cannot be degraded by the body, the next important factor is to consider
designing a biodegradable dressing or introducing a degradable element/ system into the
polymer PEGA particles dressing which will enable the body to degrade the polymer
PEGA particles to remove them.
Additionally, on a clinical basis before the functionalised PEGA particles can be use to
treat chronic wounds, in-vitro studies should be conducted in which wound fluids
obtained from chronic wounds patients are treated with functionalised PEGA particles.
Consequently, the fluorescence substrate assay as described in chapter 4 could be used to
measure elastase activity observed in chronic wound fluids before and after it has been

CHAPTER 6: Conclusions & Further Studies
208
treated with functionalised PEGA particles. Furthermore, the elastase activity present in
chronic wound fluids can be compared with the elastase activity observed in acute
wound fluids. In relation to acute wounds, the length of time required to decrease the
elastase activity observed in chronic wounds could be determined to normal levels;
bearing in mind that the levels of elastase cannot be totally depleted, as this in turn may
impair the wound healing process.
There are other possibilities of future work in which these particles could be designed for
other applications. In chapter 2, other proteases (such as MMPs, plasmin and thrombin)
were also reported as being elevated in chronic wounds. In order to control the
imbalance levels of these chronic wounds proteases by mopping and entrapping them
into the enzyme responsive PEGA particles as described in this thesis, the P1-P1′ scissile
bond of the ECP would have to be modified so that it mimics the substrate sequence
that is specifically recognised by the target protease(s). A list of substrates/ substrate
sequences recognised by MMPs, plasmin and thrombin including the P1-P1′ scisscle
bond for each substrate sequence are provided in appendix I (table 17). For other
clinical proteases, the same principles would have to be applied in which the P1-P1′
scissile bond would be modified to suit clinically found proteases.
Furthermore, the enzyme responsive PEGA particles could also be designed to have a
dual approach so that the particles have the ability to remove excess proteases as well as
control bacterial infection observed in chronic wounds. This could be achieved by
replacing the terminal Fmoc-group with an anti-inflammatory component that could
release a bioactive group into the wound to combat bacterial infection to facilitate the
healing of chronic wounds.
Additionally, elevated levels of elastase and MMPs have been reported to be associated
with the development of wrinkles (Tsuji et al. 2001; Tsukahara et al. 2001).
Consequently, the enzyme responsive PEGA particles as described within this thesis
could potentially in the same way be used to design cosmetic anti-wrinkle skin creams to
reduce the formation of wrinkles by mopping-up or reducing the levels of elastase or
MMPs by entrapping them into the matrix of these enzyme responsive PEGA particles.

CHAPTER 7: References
209
CCHHAAPPTTEERR 77
RReeffeerreenncceess

CHAPTER 7: References
210
3est sequence: http://www.rcsb.org/pdb/explore/remediatedSequence.do?structureld=3est (accessed 21st July 2008). 3MTM Healthcare Limited: www.3M.com (accessed 27th December 2009). Abel, M., Wiegand, C., Ruth, P. and Hipler, U-C. (2009a). Polyacrylate-superabsorbers bind inflammatory proteases in vitro. EWMA 2009 conference, 20 – 22 May Helsinki, Finland. P127, www.EMWA2009.ORG/EMWG2009 (accessed 27th December 2009). Abel, M., Wiegand, C., Ruth, P. and Hipler, U-C. (2009b). Polyacrylate-superabsorber inhibit the formation of ROS/RNS in vitro. EWMA 2009 conference, 20 – 22 May Helsinki, Finland. P128, www.EMWA2009.ORG/EMWG2009 (accessed 27th December 2009b). Activa Healthcare: http://www.activahealthcare.co.uk/products.php?q=Suprasorb_C (accessed 27th December 2009). Adhirajan, N., Shanmugasundaram, N., Shanmuganathan, S. and Babu, M. (2009). Functionally modified gelatin microspheres impregnated collagen scaffold as novel wound dressing to attenuate the proteases and bacterial growth. European Journal of Pharmaceuticals Sciences, v36 (2-3), pp. 235 – 245. Alexander, C. M. and Werb, Z. (1989). Proteinases and extracellular matrix remodeling. Current Opinion in Cell Biology, v1, pp. 974 – 982. Archillas-Marcos, M. and Robert, L. (1993). Control of the biosynthesis and excretion of the elastase-type protease of human skin fibroblasts by elastin receptor. Clinical Physiology and Biochemistry, v10, pp. 86 – 91. Augst, A.D., Kong, H.J. and Mooney, D.J. (2006). Alginate hydrogels as biomaterials. Macromolecular Bioscience, v6, pp. 623 – 633.
Auzanneau, F.I., Meldal, M. and Bock, K. (1995). Synthesis, characterization and biocompatibility of PEGA resins. Journal of Peptide Science, v1, pp 31 – 44. Ayello, E.A. and Cuddigan, J.E. (2004). Conquer chronic wounds with wound bed preparation. The Nurse Practitioner, v29 (3), pp. 8 – 25. Ayello, E.A., Dowsett, C., Schultz, G.S., Sibbald, R.G., Falanga, V., Harding, K., Romanelli, M., Stacey, M. and Vanscheidt, W. (2004). Time heals all wounds. Nursing, v34 (4), pp. 36 – 41. Backes, B.J., Harris, J.L., Leonetti, F., Craik, C.S. and Ellman, J.A. (2000). Synthesis of positional-scanning libraries of fluorogenic peptide substrates to define the extended substrate specificity of plasmin and thrombin. Nature Biotechnology, v18, pp. 187 – 193. Bader, R.A., Herzog, K.T. and Kao, W.J. (2009). A study of diffusion in poly(ethyleneglycol)-gelatin based semi-interpenetrating networks for use in wound healing. Polymer Bulletin, v62 (3), pp. 381 – 389.

CHAPTER 7: References
211
Bailey, P.D. (1990). An introduction to peptide chemistry. John Wiley & Sons Ltd, West Sussex, England. UK. Baranoski, S. and Ayello, E.A. (2004). Wound care essentials: practice principles. Lippincott Williams & Wilkins. Barone, E.J., Yager, D.R., Pozez, A.L., Olutoye, O.O., Crossland, M.C., Diegelmann, R.F. and Cohen, I.K. (1998). Interleukin-1alpha and collagenase activity are elevated in chronic wounds. Plastic and Reconstructive Surgery, v102 (4), pp. 1023 – 1027. Barrett, A.J., Rawlings, N.D. and Woessner, J.F. (2004). Handbook of proteolytic enzymes. Volume I and II. Elsevier Academic Press, London, UK. Barrick, B., Campbell, E.J. and Owen, C.A. (1999). Leukocyte proteinases in wound healing: roles in physiologic and pathologic processes. Wound Repair and Regeneration, v7, pp. 410 – 422. Basso, A., Martin, L.D., Gardossi, L. Margetts, G., Brazendale, I., Bosma, A.Y., Ulijn, R.V. and Flitsch, S.L. (2003). Improved biotransformations on charged PEGA supports. Chemical Communications, (11), pp. 1296 – 1297. Basso, A., Ulijn, R.V., Flitsch, S.L., Margetts, G., Brazendale, I., Ebert, C., Martin, L.D., Linda, P., Verdelli, S. and Gardossi, L. (2004). Introduction of permanently charged groups into PEGA resins leads to improved biotransformations on solid support. Tetrahedron, v60, pp. 589 – 594.
Baxter, C.R. (1994). Immunologic Reactions in Chronic Wounds. The American Journal of Surgery, v167 (1A suppl.), pp. 12S – 14S. Bellamy, L.J. (1975). The Infra-red Spectra of Complex Molecules. Chapman and Hall.
Berg, J.M., Tymoczko, J.L. and Stryer, L. (2007). Biochemistry, 6th edition. W.H. Freeman and Company, New York, USA. Beranger, J.Y., Godeau, G., Frances, C. and Robert, L. (1994). Presence of gelatinase A and metalloelastase-type protease at the plasma membrane of human skin fibroblasts. Influence of cytokines and growth factors on cell-associated metalloelastase levels. Cell Biology International, v18, pp. 715 – 722. Bianchini, E.P., Louvain, V.B., Marque, P-E., Juliano, M.A., Juliano, L. and Le Bonniec, B.F. (2002). Mapping of the catalytic groove preferences of factor Xa reveals an inadequate selectivity for its macromolecule substrates. The Journal of Biological Chemistry, v277 (23), pp. 20527 – 20534. Bode, W. (2006). Structure and interaction modes of thrombin. Blood Cells, Molecules, and Diseases, v36, pp. 122–130. Bosma, A.Y., Ulijn, R.V., McConnell, G., Girkin, J., Halling, P.J. and Flitsch, S.L. (2003). Using two photon microscopy to quantify enzymatic reaction rates on polymer beads. Chemical Communications, (22), pp. 2790 – 2791.

CHAPTER 7: References
212
Bowler, P. G. (2002). Wound pathophysiology, infection and therapeutic options. Annals of Medicine, v34, pp 419 – 427. Boyce, S.T. (1996). Skin repair with cultured cells and biopolymers, in Human Biomaterials Applications, edited by Wise, D.L., Trantolo, D.J., Altobelli, D.E. and Yaszemski, M.J., Chapter 15, pp. 347 – 377. Humana Press Inc. Bourke, S.L., Al-Khalili, M., Briggs, T., Michniak, B.B., Kohn, J. and Poole-Warren, L.A. (2003). A photo-crosslinked poly(vinyl alcohol) hydrogel growth factor release vehicle for wound healing application. AAPS PharmSci, v5 (4), pp. 1 – 11. BNF (2009): see British National Formulary 58 (2009). Bradley, M., Cullum, N., Nelson, E.A., Petticrew, M., Sheldon, T. and Toryerson, D. (1999). Systematic reviews of wound care management: (2) Dressings and tropical agents used in the healing of chronic wounds. Health Technology, v3 (17 Pt2). British National Formulary 58 (2009). Section A8.4.1 Protease-modulating matrix dressings: http://www.medicinescomplete.com/mc/bnf/current/202829.htm (accessed 27th December 2009). Brower, M.S., Levin, R.I. and Garry, K. (1985). Human neutrophil elastase modulates platelet function by limited proteolysis of membrane glycoproteins. The Journal of Clinical Investigation, v75, pp. 657 – 666. Brower, M.S., Walz, D.A., Garry, K.E. and Fenton II, J.W. (1987). Human neutrophil elastase alters human α-thrombin function: limited proteolysis near the γ-cleavage site results in decreased fibrinogen clotting and platelet-stimulatory activity. Blood, v69 (3), pp. 813 – 819. Bryant, R.A. and Nix, D.P. (2007). Acute and chronic wounds: current management concepts, 3rd Edition: Chapter 5, p. 85. Mobsy, Inc., USA. Bullen, E.C., Logaker, M.T., Updike, D.L., Benton, R., Ladin, D., Hou, Z. and Howard, E.W. (1995). Tissue inhibitor of metalloproteinases-1 is decreased and activated gelatinases are increased in chronic wounds. The Journal of Investigative Dermatology, v104 (2), pp. 236 – 240. Burch, R.M., Weitzberg, M., Blok, N., Muhlhauser, R., Martin, D., Farmer, S.G., Bator, J.M., Connor, J.R., Ko, C., Kuhn, W., Mcmillian, B.A., Raynor, M., Shearer, B.G., Tiffany, C. and Wilkins, D.E. (1991). N-(Fluorenyl-9-methoxycarbonyl) amino acids, a class of anti-inflammatory agents with a different mechanism of action. Proceedings of the National Academy of Sciences of the USA, v88, pp. 355 – 359.
Campell, A.K. (1988). Chemiluminescence principles and Applications in Biology and Medicine. VCH/Horwood, Chichester, UK; as reference in Thomson, C.M. and Ward, W.W. (2004). A Guide to Green-Fluorescent Protein: Applications in Cell Biology and Drug Discovery. Guide #9133 (January issue). D & MD, Westborough, USA.

CHAPTER 7: References
213
Campbell, C.H. and Cunningham, D.D. (1987). Binding sites for elastase on cultured human fibroblasts that do not mediate internalization. Journal of Cellular Physiology, v130, pp. 142 – 149. Carey, F.A. and Sundberg, R.J. (2001). Advanced organic chemistry. Part B: Reactions and synthesis, 4th edition. Kluwer Academic/ Plenum Publishers, New York.
Carpi, F. and Smela, E. (2009). Biomedical applications of electroactive polymer actuators. John Wiley & Sons Ltd, West Sussex, England. UK.
Carpino, L.A. and Han, G.Y. (1972). The 9-Fluorenylmethoxycarbonyl amino-protecting group. Journal of Organic Chemistry, v37, pp. 3404 – 3409.
Castillo, M.J., Nakajima, K., Zimmerman, M. and Powers, J.C. (1979). Sensitive substrates for human leukocyte and porcine pancreatic elastase: A study of the merits of various chromophoric and fluorogenic leaving groups in assays for serine proteases. Analytical Biochemistry, v99, pp. 53 – 64. Cawston T.E. and Wilson A.J. (2006). Understanding the role of tissue degrading enzymes and their inhibitors in development and disease. Best Practice and Research Clinical Rheumatology, v20 (5), pp. 983 – 1002. Chadwick, P. (2008). The use of sorbion sachet S in the treatment of a highly exuding diabetic foot wound. The Diabetic Foot Journal, v11 (4), pp. 183 – 186. Chai, J.K. (1992). [The pH value of granulating wound and skin graft in burn patients]. Zhonghua Zheng Xing Shao Shang Wai Ke Za Zhi (Chinese), Abstract, v8 (3), p. 177. Champagne, B., Tremblay, P., Cantin, A. and Pierre, Y.S. (1998). Proteolytic cleavage of ICAM-1 by human neutrophil elastase. The Journal of Immunology, v161, pp. 6398 – 6405.
Chen, Y.E. (2004). MMP-12, an old enzyme plays a new role in the pathogenesis of rheumatoid arthritis? American Journal of Pathology, v165 (4), pp. 1069 – 1070. Chua, F. and Laurent, G.J. (2006). Neutrophil elastase: Mediator of extracellular matrix destruction and accumulation. Proceedings of the American Thoracic Society, v3, pp. 424 – 427. Chung, L., Shimokawa, K., Dinakarpandian, D., Grams, F., Fields, G.B. and Nagase, H. (2000). Indentification of the 183RWTNNFREY191 region as a critical segment of matrix metalloproteinase 1 for the expression of collagenolytic activity. Journal of Biological Chemistry, v275 (38), pp. 29610 – 29617. Chung, K.F. (2001). Cytokines in chronic obstructive pulmonary disease. The European Respiratory Journal: Supplement, v18 (suppl. 34), SS. 50 – 59. Church, J. C. T. (2001). Larval intervention in the chronic wound. European Wound Management Association Journal, v1 (2), pp. 10 – 13.

CHAPTER 7: References
214
Cin, M.D., Davalli, S., Marchioro, C., Passarini, M., Perini, O., Provera, S. and Zaramella, A. (2002). Analytical methods for the monitoring of solid phase organic synthesis. II Farmaco, v57, pp. 497 – 510. Coates, J. (2000). Interpretation of infrared spectra, a practical approach; in Meyers, R.A. (2000). Encyclopedia of Analytical Chemistry, pp. 10815 – 10837. John Wiley & Sons Ltd, Chichester. UK
Cohen, I.K., Diegelmann, R.F. and Lindblad, W.J. (1992). Wound healing: Biochemical and clinical aspects. W.B. Saunders Company. Collins, J., Cree, I. and Ghosh, S. (1992). The wound programme. Published by the Centre for Medical Education. Compute pI/MW, a database provided by SwissProt: www.ebi.ac.uk/swissprot/ (accessed: 12th November 2005). Copeland, R.A. (2000). Enzymes: A practical introduction to structure, mechanism and data analysis. Second edition. John Wiley & Sons, Inc., Publication. New York, US. Creighton, T.E. (1993). Proteins: Structures and molecular properties. W.H. Freeman and Company. USA. Croute, F., Delaporte, E., Bonnefoy, J.Y., Fertin, C., Thivolet, J. and Nicolas, J.E. (1991). Interleukin-1β stimulates fibroblast elastase activity. British Journal of Dermatology, v124, pp. 538 – 541. Cullen, B., Smith, R., McCulloch, E., Silcock, D. and Morrison, L. (2002a). Mechanism of action of PROMOGRAN, a protease modulating matrix, for the treatment of diabetic foot ulcers. Wound Repair and Regeneration, v10 (1), pp. 16 – 25. Cullen, B., Watt, P.W., Lundqvist, C., Silcock, D., Schmidt, R.J., Bogan, D. and Light, N.D. (2002b). The role of oxidised regenerated cellulose/collagen in chronic wound repair and its potential mechanism of action. The International Journal of Biochemistry & Cell Biology, v34, pp. 1544 – 1556. Cunningham, D.D., Van Nostrand, W.E., Farrell, D.H. and Campbell, C.H. (1986). Interactions of serine proteases with cultured fibroblasts. Journal of Cellular Biochemistry, v32, pp. 281 – 291. Dasu, M.R.K., Barrow, R.E., Spies, M. and Herndon, D.N. (2003). Matrix metalloproteinase expression in cytokine stimulated human dermal fibroblasts. Burns, v29, pp. 527 – 531. Davis, P.J. (2007). How might we achieve oxygen balance in wounds? International Wound Journal, v4 (Suppl. 3), pp. 18 – 24. Davis, P.J., Wood, L., Wood, Z., Eaton, A. and Wilkins, J. (2009). Clinical experience with a glucose oxidase-containing dressing on recalcitrant wounds. Journal of Wound Care, v18 (3), pp. 114 – 121.

CHAPTER 7: References
215
Dissemond, J., Witthoff, M., Brauns, T.C., Haberer, D. and Goos, M. (2003). pH-Wert des Milieus chronischer Wunden. Hautarzt, v54, pp. 959 – 965. Dovi, J.V., Szpaderska, A.M. and DiPietro, L.A. (2004). Neutrophil function in the healing wound: adding insult to injury? Thrombosis and Haemostasis, v92, pp. 275 – 80. Eaglstein, W.H. and Falanga, V. (1997). Chronic wounds. Surgical Clinics of North America, v77 (3), pp. 689 – 700. Eaton, A. (2008). Oxyzyme and Iodozyme FAQ’s. Archimed: http://www.archimed.co.uk (accessed: 27th December 2009). Edwards, J.V., Batiste, S.L., Gibbins, B.M. and Goheen, S.C. (1999). Synthesis and activity of NH2- and COOH-terminal elastase recognition sequences on cotton. The Journal of Peptide Research, v54, pp. 536 – 543. Edwards, J.V., Howley, P. and Cohen, I.K. (2004). In vitro inhibition of human neutrophil elastase by oleic acid albumin formulations from derivatized cotton wound dressings. International Journal of Pharmaceutics, v284 (1-2), pp 1 – 12. Elias, J.A., Reynolds, M.M., Kotloff, R.M. and Kern, J.A. (1989). Fibroblast interleukin 1β: Synergistic stimulation by recombinant interleukin and tumour necrosis factor and posttranscriptional regulation. Proceedings of the National Academy of Sciences of the USA, v86, pp. 6171 – 6175. Eming, S., Smola, H., Hartmann, B., Malchau, G., Wegner, R., Krieg, T. and Smola-Hess, S. (2008). The inhibition of matrix metalloproteinase activity in chronic wounds by a polyacrylate superabsorber. Biomaterials, v29, pp. 2932 – 2940. Enoch, S. and Harding, K. (2003). Wound bed preparation the science behind the removal of barriers to healing. Wounds, v15 (7), pp. 213 – 229. Falanga, V. (2002). Wound bed preparation and the role of enzymes: A case for multiple actions of therapeutic agents. Wounds. 14 (2), pp. 47 – 57.
Farley, D., Faller, B. and Nick, H. (1997). Therapeutic protein inhibitors of elastase. Chapter 13; edited by Lauwers, A. and Scharpe, S. (1997). Pharmaceutical enzymes. Volume 84 of Drugs and the Pharmaceutical Sciences. Marcel Dekker, Inc. New York, USA. Faust, C.B. (1992). Modern chemical techniques. The Royal Society of Chemistry. UK. Fenton, J.W.II. (1981). Thrombin specificity. Annals of the New York Academy of Science, v370, pp. 468 – 495.
First Water Limited: http://www.first-water.com. Brochures downloaded for: pro-ionic hydrogels (http://www.first-water.com/pro-ionic-sheet-gel/); pro-ionic matrix (http://www.first-water.com/pro-ionic-matrix/) and pro-ionic technology (http://www.first-water.com/pro-ionic-technology/), (accessed: 27th December 2009).

CHAPTER 7: References
216
Fitch, P.M., Roghanian, A., Howie, S.E.M. and Sallenave, J-M. (2006). Human neutrophil elastase inhibitors in innate and adaptive immunity. Biochemical Society Transactions, v34 (part 2), pp. 279 – 282. Fleisch, H. (2002). Development of bisphosphonates. Breast Cancer Research, v4, pp. 30 – 34. Fleck, C.A. and Chakravarthy, D. (2007). Understanding the mechanisms of collagen dressings. Advances in Skin & Wound Care, v20 (5), pp. 256 – 259. Fonder, M.A., Lazarus, G.S. and Cowan, D.A. (2008). Treating the chronic wound: a practical approach to the care of nonhealing wounds and wound care dressings. Journal of the American Academy of Dermatology, v58, pp. 185 – 206. Friedman, M. (2004). Applications of the ninhydrin reaction for analysis of amino acids, peptides, and proteins to agricultural and biomedical sciences. Journal of Agricultural and Food Chemistry, v52, pp. 385 – 406. Furniss, B.S., Hannafard, A.J., Smith, P.W.G. and Tatchell, A.R. (1989). Vogel’s textbook of practical organic chemistry, 5th edition. Longman Scientific & Technical. Longman Group UK Limited. Galaev, I.Y. (1995). ‘Smart’ polymers in biotechnology and medicine. Russian Chemical Reviews v64 (5), pp. 471 – 489. Galaev, I.Y. and Mattiasson, B. (1999). ‘Smart’ polymers and what they could do in biotechnology and medicine. Trends in Biotechnology, v17 (18), pp. 335 – 340. GMAWCP (2008): see The Global Market For Advanced Wound Care Products 2008. Ganim, Z., Sung, H., Smith, A.W., Deflores, L.P., Jones, K.C. and Tokmakoff, A. (2008). Amide I Two-dimensional infrared spectroscopy of proteins. Accounts of Chemical Research, v41 (3), pp. 432 – 441. Goetzl, E. J., Banda, M. J. and Leppert, D. (1996). Matrix metalloproteinases in immunity. The Journal of Immunology, v156 (1), pp. 1 – 4. Gray, W.R. (1967) Dansyl chloride procedure. Methods in Enzymology, v11, pp. 139 – 151. Greener, B., Hughes, A.A., Bannister, N.P. and Douglass, J. (2005). Proteases and pH in chronic wounds. Journal of Wound Care, v14 (2), pp. 59 – 61. Greystone Pharmaceuticals, Inc: www.greystonepharmaceuticals.com (accessed: 11th January 2010). Grinnell, F. and Zhu, M. (1994). Identification of neutrophil elastase as the proteinase in burn wound fluid responsible for degradation of fibronectin. The Journal of Investigative Dermatology, v103, pp. 155 – 161.

CHAPTER 7: References
217
Grinnell, F. and Zhu, M. (1996). Fibronectin degradation in chronic wounds depends on the relative levels of elastase, alpha1-proteinase inhibitor, and alpha2-macroglobulin. The Journal of Investigative Dermatology, v106 (2), pp. 335 – 341. Gros, C. and Labouesse, B. (1969). Study of the dansylation reaction of amino acids, peptides and proteins. Europeon Journal of Biochemistry, v7 (4), pp. 463 – 470. Harris, I.R., Yee, K.C., Walters, C.E., Cunliffe, W.J., Kearney, J.N., Wood, E.J. and Ingham, E. (1995). Cytokine and protease levels in healing and non-healing chronic venous leg ulcers. Experimental Dermatology, v4 (6), pp. 342 – 349. Haugland, R.P. (2005). The handbook: A guide to fluorescence probes and labelling technologies, 10th Edition, Invitrogen Corp., USA; including www.invitrogen.com (accessed: 2nd Novemeber 2007). Hayashi, R., Jin, X. and Cook, G.R. (2007). Synthesis and evaluation of novel heterocyclic MMP inhibitors. Bioorganic and Medicinal Chemistry Letters, v17 (24), pp. 6864 – 6870. Henry, G. and Garner, W.L. (2003). Inflammatory mediators in wound healing. The Surgical Clinics of North America, v83 (3), pp. 483 – 507. Hess, C.T. (2002). Clinical guide: Wound care. 4th Edition, Springhouse Corporation. Heymann, D., Ory, B., Gouin, F., Green, J.R. and Redini, F. (2004). Bisphosphonates: a new therapeutic agents for the treatment of bone tumors. Trends in Molecular Medicine, v10 (7), pp. 337 – 343. Hoffman, A.S. (2001). Hydrogels for biomedical applications. Annals of the New York Academy of Sciences, v944 (Bioartifical Organs III: Tissue Sourcing, Immunoisolation, and Clinical Trials), pp. 62 – 73. Hoffman, A.S. (2002). Hydrogels for biomedical applications. Advanced Drug Delivery Reviews, v43, pp. 3 – 12. Hoffman, R., Starkey, S. and Coad, J. (1998). Wound fluid from venous leg ulcers degrades plasminogen and reduces plasmin generation by keratinocytes. The Journal of Investigative Dermatology, v111, pp. 1140 – 1144. Hogan, J.M. and McLuckey, S.A. (2003). Charged state dependent collision-induced dissociation of native and reduced porcine elastase. Journal of Mass Spectrometry, v38, pp. 245 – 256. Holmes, M.A. and Matthews, B.W. (1982). Structure of thermolysin refined at 1.6Å resolution. Journal of Molecular Biology, v160, pp. 623 – 639.
Homsy, R., Pelletier-Lebon, P., Tixier, J-M., Godeau, G., Robert, L. and Hornbeck, W. (1988). Characterization of human skin fibroblast elastase activity. The Journal of Investigative Dermatology, v91, pp. 472 – 477. H&R Healthcare: http://www.hrhealthcare.co.uk/ (accessed 27th December 2009).

CHAPTER 7: References
218
Huntington, J.A. (2005). Molecular recognition mechanisms of thrombin. Journal of Thrombosis and Haemostasis, v3, pp. 1861 – 1872. Insense Limited, UK (http://www.insense.co.uk/). ArchimedTM - a division of Insense Limited: www.archimed.co.uk (accessed: 27th December 2009 and 4th January 2010). Invitrogen technical notes on the principles of fluorescence: http://probes.invitrogen.com/resources/education/ (accessed: 2nd November 2007). Ivins, N., Simmonds, W., Turner, A. and Harding, K. (2007). The use of an oxygenating hydrogel dressing in VLU. Wounds UK, v3 (1), pp. 77 – 81. Isnard, N., Péterszegi, G., Robert, A.M. and Robert, L. (2002). Regulation of elastase-type endopeptidase activity, MMP-2 and MMP-9 expression and activation in human dermal fibroblasts by fucose and a fucose-rich polysaccharide. Biomedicine and Pharmacotherapy, v56 (5), pp. 258 – 264. Janoff, A. (1985). Elastase in tissue injury. Annual Review of Medicine, v36, pp. 207 – 216. Jeong, B. and Gutowska, A. (2002). Lessons from nature: stimuli-responsive polymers and their biomedical applications. Trends in Biotechnology, v20 (7), pp. 305 – 311. Jeong, B., Kim, S. and Bae, Y. (2002). Thermosensitive sol-gel reversible hydrogels. Advanced Drug Delivery Reviews, v54 (1), pp. 37 – 51. Johnson & Johnson (J&J) or J&J Medical: www.jnj.com (accessed: 2004 – 2009).
Johnson & Johnson Gateway. How PROMOGRAN Works: http://jnjgateway.com/home.jhtml?loc=SDVENG&page=viewContent&contentId=09008b98804f8c5a&parentId=09008b98804f8b58 (accessed: 2008).
Jones, A. and Vaughan, D. (2005). Hydrogel dressings in the management of a variety of wound types: A review. Journal of Orthopaedic Nursing, v9 (suppl. 1), S1 – S11. Jone, J. (2002). Amino acid and peptide synthesis, 2nd edition. Oxford University Press. Jones, V., Bale, S. and Harding, K. (2004). Acute and chronic wound healing, in Baranoski, S. and Ayello, E.A. (Eds), Wound Care Essentials, Chapter 5, pp. 61 – 78. Lippincott Williams & Wilkins. Jones, V., Grey, J.E. and Harding K.G. (2006). Wound dressings. BMJ, v332, pp. 777 – 780. Jones , V. and Milton, T. (2000). When and how to use hydrogels. Nursing Times, v96 (23), pp. 3 – 4. Ju, H.K., Kim, S.Y. and Lee, Y.M. (2001). pH/temperature-responsive behaviors of semi-IPN and comb-type graft hydrogels composed of alginate and poly(N-isopropylacrylamide). Polymer, v42, pp. 6851 – 6857.

CHAPTER 7: References
219
Kaiser, E., Colescott, R.L., Bossinger, C.D. and Cook, P.I. (1970). Colour test for detection of free terminal amino groups in the solid-phase synthesis of peptides. Analytical Biochemistry, v34, pp. 595 – 598. Kannan, P.V. (2008). Time heals all wounds. Available from hospital management web link: http://www.hospitalmanagement.net/features/feature43129/ (accessed: 9th November 2008). Karim, R.B., Brito, B.L., Dutrieux, P.R., Lassance, F.P. and Hage, J.J. (2006). Analysis of morphological and immunohistochemical changes during treatment with DerMax. Advances in Skin Care, v19 (6), pp. 324 – 327. Kealey, D. and Haines, P.J. (2002). Instant Notes: Analytical chemistry. BIOS Scientific publishers limited, Kent, England. UK. Kerstein, M.D. (1997). The scientific basis of healing. Advances in Wound Care, v10 (4), pp. 30 – 36. Kim, J.J. and Park, K. (1998). Smart hydrogels for bioseparation. Biomedical and Life Sciences, v7 (4 – 5), pp. 177 – 184. Kluft, C. (2003-2004). The Fibrinolytic System and Thrombotic Tendency. Pathophysiology of Haemostasis and Thrombosis, v33, pp. 425 – 429. Kolev, K., Owen, W.G. and Machovich, R. (1995). Dual effect of synthetic plasmin substrates on plasminogen activation. Biochimica et Biophysica Acta, v1247, pp. 239-245. Komives, C.F. and Chen, R.R. (2004). Biocatalysis. Volume 1, p72 – 77; edited by Wnek, G.E. and Bowlin, G.L. (2004). Encyclopedia of Biomaterials and Biomedical Engineering. Volume I and 2. Marcel Dekker, Inc. New York, USA.
Kress, J., Zanaletti, R., Amour, A., Ladlow, M., Frey, J.G. and Bradley, M. (2002). Enzyme accessibility and solid supports: Which molecular weight enzymes can be used on solid supports? An investigation using confocal raman microscopy. Chemistry – A European Journal, v8 (16), pp 3769 – 3772.
Kuby, J. (1997). Immunology. 3rd Edition. W.H. Freeman and Company. Kuptosov, A.H. and Zhizhin, G.N. (1998). Handbook of fourier transform raman and infrared spectra of polymers. Elsevier Science Publishers, Amsterdam, The Netherlands.
Lauffenburger, D.A. and Wells, A. (2003). Quantitative parsing of cell multi-tasking in wound repair and tissue morphogenesis. Biophysical Journal, v684, pp. 3499 – 3500. Lauwers, A. and Scharpe, S. (1997). Pharmaceutical Enzymes. Volume 84 of Drugs and the pharmaceutical sciences. Marcel Dekker, Inc. New York, USA. Lee, W.L. and Downey, G.P. (2001). Leukocyte elastase: physiological functions and role in acute lung injury. American Journal of Respiratory and Critical Care Medicine, v14, pp. 896 – 904.

CHAPTER 7: References
220
Leonard, M.P., Decter, A., Hills, K. and Mix, L.W. (1998). Endoscopic subureteral collagen injection: are immunological concerns justified? J. urol., v160, p1012; as referenced in the book edited by Uchegbu, I.E. and Schätzlein, A.G. (2006). Polymers in drug delivery. Chapter 6, p. 70 and p. 77. CRC Press: Taylor & Francis Group, LLC, USA. Leveen, H.H. (1973). Chemical acidification of wounds. An adjuvant to healing and the unfavourable action on alkalinity and ammonia. Annals of Surgery, v178, pp. 745 – 753. Lijnen, H.R. (2002). Matrix Metalloproteinases and cellular fibrinolytic activity. Biochemistry, v67 (1), pp. 92 – 98. Lint, P.V. and Libert, C. (2006.). Matrix metalloproteinase-8: cleavage can be decisive. Cytokine and Growth Factor Reviews, v17, pp. 217 – 223. Lobmann, R., Schultz, G. and Lehnert, H. (2005). Proteases and the diabetic foot syndrome: Mechanisms and therapeutic implications. Diabetes Care, v28 (2), pp 461 – 471. Lovejoy, B., Hassell, A.M., Luther, M.A., Weigl, D. and Jordan, S.R. (1994). Crystal structures of recombinant 19-kDa human fibroblast collagenase complexed to itself. Biochemistry, v33 (27) pp. 8207 – 8217. Manninen, A., Lewis, D.M., Olenchock, S.A., Sorenson, W.G., Mull, J.C., Whitmer, M., Terho, E.O., Husman, K.R.H and Kotimaa, M. (1992). Interleukin 1 and its inhibition in an inflammatory reaction caused by Aspergillus umbrosus. Scandinavian Journal of Work, Environment & Health, v18 (suppl. 2), pp. 75 – 77. Manning, M.C. (2005). Use of infrared spectroscopy to monitor protein structure and stability. Expert Review of Proteomics, v2(5), pp. 731 – 743. Marchetti, A., Lelong, E. and Cosson, P. (2009). A measure of endosomal pH by flow cytometry in Dictyostelium. BMC Research Notes, v2 (7). Martin, P. (1997). Wound healing-aiming for the perfect skin regeneration. Science, v276, pp. 75 – 81. Mast, B.A. and Schultz, G.S. (1996). Interactions of cytokines, growth factors and proteases in acute and chronic wounds. Wound Repair and Regeneration, v4, pp. 411 – 420. McCrawley, L.J. and Matrisian, L.M. (2001). Matrix metalloproteinases: they're not just for matrix anymore! Current Opinion in Cell Biology, v13 (5), pp. 534 – 540. McDonald, T.O. (2009). Preparing enzyme responsive hydrogel particles using peptide actuators. PhD Thesis. University of Manchester, England. UK.
McDonald, T.O., Patrick, A., Williams, R., Cousins, B.G. and Ulijn, R.V. (2009). Bio-responsive hydrogels for biomedical applications, in Biomedical applications of

CHAPTER 7: References
221
electroactive polymer actuators, edited by Carpi, F. and Smela, E., Chapter 2, pp. 43 – 60. John Wiley & Sons Ltd, West Sussex, England. UK. Medina, A., Scott, P.G., Ghahary, A. and Tredget, E.E. (2005). Pathophysiology of chronic nonhealing wounds. Journal of Burn Care and Rehabilitation, v26 (4), pp. 306 – 319. Meldal, M. (1992). PEGA: a flow stable polyethylene glycol dimethyl acrylamide copolymer for solid phase peptide synthesis. Tetrahedron Letters, v33 (21), pp. 3077 – 3080.
Meldal, M., Svendsen, I.B., Breddam, K. and Auzanneau, F-I. (1994). Portion-mixing peptide libraries of quenched fluorogenic substrates for complete subsite mapping of endoprotease specificity. Proceedings of the National Academy of Sciences of the USA, v91, pp. 3314 – 3318. Menke, N.B., Ward, K.R., Witten, T.M., Bonchev, D.G. and Diegelmann, R.F. (2007). Impaired wound healing. Clinics in Dermatology, v25, pp. 19 – 25. Mergler, M. and Durieux, J.P. (2005). The Bachem practice of SPPS: Tips and tricks from the experts at Bachem. Bachem AG, Switzerland. Merrifield R.B. (1963). Solid Phase Peptide Synthesis. 1. The synthesis of a tetrapeptide. Journal of American Chemical Society, v85, pp. 2149 – 2154. Meyer, J-F., Bieth, J. and Metais. (1975). On the inhibition of elastase by serum, some distinguishing properties of α1-antityrpsin and α2-macroglobulin. Clinica Chimica Acta, v62, pp. 43 – 53. Miki, Y., Kidokoro, S., Endo, K., Wada, A., Yoneya, T., Aoyama, A., Kai, K., Miyake, T., and Nagao, H. (1996). Effect of a charged residue at the 213th site of thermolysin on the enzymatic activity. Journal of Molecular Catalysis B: Enzymatic, v1 (3 – 6), pp. 191 – 199. Moding, E., Hellyer, J., Rank, K., Lostroh, P and Brasuel, M. (2009). Characterisation of PEBBLEs as a tool for real-time measurement of Dictyostelium discoideum endosomal pH. Journal of Sensors, v2009, 4 pages. Mohammed, J.S. and Murphy, W.L. (2009). Bioinspired design of dynamic materials. Advanced Materials, v21, pp. 1 – 14. Montalbetti, C.A.G.N and Falque, V. (2005). Amide bond formation and peptide coupling. Tetrahedron, v61, pp. 10827 – 10852.
Morgan, D. (2002). Wounds – what should a dressings formulary include? Hospital Pharmacist, v9, pp. 261 – 266. Morihara, K. and Tsuzuki, H. (1967). Elastolytic properties of various proteinases from microbial origin. Archives of Biochemistry and Biophysics, v120, pp 68 – 78.

CHAPTER 7: References
222
Morihara, K., Tsuzuki, H. and Oka, T. (1968). Comparison of specificities of various neutral proteinases from microorganisms. Archives of Biochemistry and Biophysics, v123 (3), pp. 572 – 588.
Morison, M.J., Ovington, L.G. and Wilkie, K. (2004). Chronic wound care: a problem-based learning approach. Elsevier Limited. Edinburgh; New York: Mosby. Morykwas, M. and Argenta, L.C. (1993). FASEB J., v7, p. A138; as cited in Stroock, A.D. and Cabodi, M. (2006). Microfluidic biomaterials. MRS Bulletin, v114 (2), pp. 116 – 119. Moseley, R., Stewart, J.E., Stephens, P., Waddington, R.J. and Thomas, D.W. (2004). Extracellular matrix metabolites as potential biomarkers of disease activity in wound fluid: lessons learned from other inflammatory diseases? British Journal of Dermatology, v150, pp. 401 – 413. Munro, H.S. and Boote, N. (2009). Hydrogel co-polymer composition and its uses for example as a wound dressing. PCT Int. Appl. (2009), IPN: WO 2009/090403 A1, 62pp. Murakami, Y., Chiba, K., Oda, T and Hirata, A. (2001). Novel kinetic analysis of enzymatic dipeptide synthesis: Effect of pH and substrates on thermolysin catalaysis. Biotechnology and Bioengineering, v74, pp. 406 – 415.
Mutsaers, S.E., Bishop, J.E., McGrouther, G. and Laurent, G.J. (1997). Mechanisms of tissue repair: from wound healing to fibrosis. The International Journal of Biochemistry & Cell Biology, v29 (1), pp. 5 – 17. Nagase, H. and Woessner, J.F. (1999). Matrix metalloproteinases. Journal of Biological Chemistry, v274 (31), pp. 21491 – 21494. Nakanishi, K. (1964). Infrared Absorption Spectroscopy practical. Nankodo Company Limited. Newcomb, W.S., Deegan, T.L., Miller, W. and Porco, J.A. (1998). Analysis of 9-Fluorenylmethoxycarbonyl (FMOC) Loading of Solid-Phase Synthesis Resins by Gas Chromatography. Biotechnology & Bioengineering (combinatorial chemistry), v 61 (1), pp. 55 – 60. Noble, T. (2006). Use of a protease-modulating matrix dressing on a non-healing tendo-Achilles surgical wound. Journal of Wound Care, v15 (18), pp. 368 – 371. Novabiochem (letters 02/05). New products for biomolecule labelling: http://www.emdbiosciences.com/showBrochure/200907.154.ProNet.pdf (accessed 14th August 2009). Ohtsuka, K., Maekawa, I., Waki, M. and Takenaka, S. (2009). Electrochemical assay of plasmin acitivty and its kinetic analysis. Analytical Biochemistry, v385, pp. 293- 299. Ovington, L.G. (2007). Advances in wound dressings. Clinics in Dermatology, v25, pp. 33 – 38.

CHAPTER 7: References
223
Owen, C.A. and Campbell, E.J. (1995). Neutrophil proteinases and matrix degradation. The cell biology of pericellular proteolysis. Seminars in Cell Biology, v6, pp. 367 – 376.
Owen, C.A. and Campbell, E.J. (1999). The cell biology of leukocyte-mediated proteolysis. Journal of Leukocyte Biology, v65, pp. 137 – 150. Parfyonova, Y.V., Plekhanova, O. S. and Tkachuk, V. A. (2002). Plasminogen activators in vascular remodeling and angiogenesis. Biochemistry (Moscow), v67 (1), pp. 119 – 134. Patent Dermagenics Europe B.V. Dressing material and dressings for the treatment of wounds. Madrid Registration No. 780930. 2002 Mar 12; as in van Rossum, M., Vooijs, D.P.P., Walboomers, X.F., Hoekstra, M.J., Spauwen, P.H.M. and Jansen, J.A. (2007). The influence of a PHI-5-loaded silicone membrane, on cutaneous wound healing in vivo. Journal of Materials Science: Materials in Medicine, v18, pp. 1449 – 1456. Patrick, A.G. (2010). Designing fluorescent biosensors for the detection and removal of proteases secreted from cells. PhD Thesis. University of Manchester, England. UK. Peppas, N.A., Huang, Y., Torres-Lugo, M., Ward, J.H. and Zhang, J. (2000). Physicochemical foundations and structural design of hydrogels in medicine and biology. Annual Review of Biomedical Engineering, v2, pp. 9 – 29. pI calculator: http://www.rcsb.org/pdb/explore.do?structureld=3est (accessed 21st July 2008). Pirayesh, A., Dessy, L. A., Rogge, F. J., Hoeksema, H. J. P., Sinove, Y. M. G., Dall’ Antonia, A., Jawad, M. A., Gilbert, P. M., Rubino, C., Scuderi, N., Blondeel, P. and Monstrey, S. (2007). The efficacy of polyhydrated ionogen impregnated dressing in the treatment of recalcitrant diabetic foot ulcers: a multi-centre pilot study. Acta Chirurgica Belgica, v107, pp. 675 – 681. Polymer Laboratories Ltd: www.polymerlabs.com (accessed September 2004 – December 2007). Polymer Laboratories is part of Varian, Inc.,: https://www.varianinc.com/image/vimage/docs/products/consum/stratospheres/shared/applications.pdf (accessed: December 2007 - September 2009). Porter, S. (2007). The role of the fibroblast in wound contraction and healing. Wounds UK, v3 (1), pp. 33 – 40. Posnett, J. and Franks, P.J. (2008). The burden of chronic wounds in UK. Nursing Times, v104 (3), pp. 44-45. Prager, M.D., Baxter, C.R. and Hartline, B. (1994). Proteolytic activity in burn wound exudates and comparison of fibrin degradation products and protease inhibitors in exudates and sera. The Journal of Burn Care & Rehabilitation, v15 (2), pp. 130 – 136. Prager, M.D., Herring, M., Germany, B. and Baxter, C.R. (1991). Elastase and alpha 1-protease inhibitors in burn wound exudates. The Journal of Burn Care & Rehabilitation, v12 (4), pp. 300 – 305.

CHAPTER 7: References
224
Purich, D.L. and Allison, R.D. (2002). The enzyme reference. Elsevier Science Academic Press, London, UK. Queen, D., Coutts, P., Fierheller, M. and Sibbald, R.G. (2007). The use of a novel oxygenating hydrogel dressing in the treatment of different chronic wounds. Advances in Skin & Wound Care, v20 (4), pp. 200 – 206. Ra, H-J. and Parks, W.C. (2007). Control of matrix metalloproteinase catalytic activity. Matrix Biology, v26 (8), pp. 587 – 596. Rao, C.N., Ladin, D.A., Liu, Y.Y., Chilukuri, K., Hou, Z.Z. and Woodley, D.T. (1995). Α1-Antitrypsin is degraded and non-functional in chronic wounds but intact and functional in acute wounds: the inhibitors protects fibronectin from degradation by chronic wound fluid enzymes. The Journal of Investigative Dermatology, v105, pp. 572 – 578. Rayment, E.A., Dargaville, T.R., Shooter, G.K., George, G.A. and Upton, Z. (2008). Attenuation of protease activity in chronic wound fluid with bisphosphonate-functionalised hydrogels. Biomaterials, v29 (12), pp. 1785 – 1795. Renil, M., Ferreras, M., Delaisse, J.M., Foged, N.T. and Meldal, M. (1998). PEGA supports for combinatorial peptide synthesis and solid-phase enzymatic library assays. Journal of Peptide Science, v4, pp 195 – 210.
Renil, M. and Meldal, M. (1995). Synthesis and application of a PEGA polymeric support for high capacity continuous flow solid-phase peptide synthesis. Tetrahedron Letters, v36 (26), pp 4647 - 4650. Reszka, A.A., Halasy-Nagy, J. and Rodan, G.A. (2001). Nitrogen-bisphosphonates block retinoblastoma phosphorylation and cell growth by inhibiting the cholesterol biosynthetic pathway in a keratinocyte model for esophageal irritation. Mol. Pharmacol., v59, pp. 193 – 202; as referenced in Fleisch, H. (2002). Development of bisphosphonates. Breast Cancer Research, v4, pp. 30 – 34. Robson, M.C. (2003). Cytokine manipulation of the wound. Clinics in Plastic Surgery, v30 (1), pp. 57 – 65. Robson, M.C., Abdullah, A., Burns, B.F., Phillips, L.G., Garrison, L., Cowan, W., Hill, D., Vanderberg, J., Robson, L.E. and Schecler, S. (1994). Safety and effect of topical recombinant human interleukin-1beta in the management of pressure sores. Wound Repair and Regeneration, v2, pp. 177 – 181. Robbins, S.L., Cotran, R.S., Kumar, V. and Collins, T. (1999). Pocket companion to Robbins: Pathologic basis of disease, 6th edition (p. 67). W.B. Saunders Company. Philadelphia, USA. Rocheleau, J.V. and Piston, D.W. (2003). Two-photon excitation microscopy for the study of living cells and tissues. Current Protocols in Cell Biology, pp. 4.11 - 4.15.

CHAPTER 7: References
225
Roy, D., Cambre, J.N. and Sumerlin, B.S. (2010). Future perspectives and recent advances in stimuli-responsive materials. Progress in Polymer Science, v35, pp. 278 – 301.
Rubinson, K.A. and Rubinson, J.F. (2000). Contemporary instrumental analysis. Chapter 10, p438. Prentice-Hall, Inc.
Rumalla, V.K. and Borah, G.L. (2001). Cytokines, growth factors, and plastic surgery. Plastic and Reconstructive Surgery, v108, pp. 719 – 733. Sabationo, G., Chelli, M., Brandi, A. and Papini, A. (2004). Analytical methods for solid phase peptide synthesis. Current Organic Chemistry, v8, pp. 291-301. Sandhu, S.S. and Robbins, C.R. (1989). A sensitive fluorescence technique using dansyl chloride to asses hair damage. Journal of the Society of Cosmetic Chemists, v40 (5), pp. 287 – 296. Santini, D., Gentilucci, U.V., Vincenzi, B., Picardi, A., Vasaturo, F., La Cesa, A., Onori, N., Scarpa, S. and Tonini, G. (2003). The antineoplastic role of bisphosphonates: from basic research to clinical evidence. Annals of Oncology, v14, pp. 1468 – 1476. Schechter, I. and Berger, A. (1967). On the size of the active site in proteases. I. Papain. Biochemical and Biophysical Research Communications, v27 (2), pp 157-162. Schönfelder, U., Abel, M., Wiegand, C., Klemm, D., Elsner, P. and Hipler, U-C. (2005). Influence of selected wound dressings on PMN elastase in chronic wound fluid and their antioxidative potential in vitro. Biomaterials, v26 (23), pp. 6664 – 6673. Schmidt, C., Fronza, M., Goettert, M., Gellar, F., Luik, S., Flores, E.M.M., Bittencourt, C.F., Zanetti, G.D., Heinzmann, B.M., Laufer, S. and Merfort, I. (2009). Biological studies on Brazillian plants used in wound healing. Journal of Ethnopharmacology, v122, pp. 523 – 532. Schultz, G. (2008). MMP-9 protease levels as an indicator of wound bed preparation and healing. The World Union of wound Healing Societies, Third Congress, Toronto, Canada; as cited in 3M PHITM technology technical brochure: http://multimedia.3m.com/mws/mediawebserver?66666UuZjcFSLXTtNXManX&EEVuQEcuZgVs6EVs6E666666-- (accessed: 27th December 2009). Schultz, G.S., Ladwig, G. and Wysocki, A. (2005a). Extracellular matrix: review of its roles in acute and chronic wounds. World Wide Wounds: http://www.worldwidewounds.com/2005/august/Schultz/Extrace-Matric-Acute-Chronic-Wounds.html (accessed: 10th January 2006). Schultz, G.S. and Mast, B.A. (1998). Molecular analysis of the environments of healing and chronic wounds: Cytokines, proteases and growth factors. Wounds, v10 (suppl. F), ff. 1 – 9. Schultz, G., Mozingo, D., Romanelli, M. and Claxton, K. (2005b). Wound healing and TIME; new concepts and scientific applications. Wound Repair and Regeneration, v13 (4 Suppl), S1–S11.

CHAPTER 7: References
226
Schultz, G.S., Sibbald, G., Falange, V., Ayello, E.A., Dowsett, C., Harding, K., Romanelli, M., Stacey, M.C., Teot, L. and Vanscheidt, W. (2003). Wound bed preparation: a systematic approach to wound management. Wound Repair and Regeneration, v11, pp. 1 – 28. Siedler, S. and Schuller-Petrovic, S. (2002). Wound healing enhancement in leg ulcers: A case report. Cell and Tissue Banking, v3 (1), pp. 25–28. Silver, F.H. and Christiansen, D.L. (1999). Biomaterials science and biocompatibility. Chapters 8 and 9. Sringer-Verlag, Inc. New York, US. Simons, W.W. (1978). The sadtler handbook of infrared spectra. Sadtler Research Laboratories, Inc. ISBN: 0-85501-441-5. Singer, A.J. and Clark, R.A (1999). Cutaneous wound healing. The New England Journal of Medicine, v341 (10), pp. 738 – 746. Smeets, R., Ulrich, D., Unglaub, F., Wöltje, M. and Pallua, N. (2008). Effects of oxidised regenerated cellulose/collagen matrix on proteases in wound exudate of patients with chronic venous ulceration. International Wound Journal, v5 (2), pp. 195 – 203. Smith, B.C. (1999). Infrared spectral interpretation: a systematic approach. Boca Raton: CRC Press. Smith & Nephew: see Smith & Nephew Wound Management. Smith & Nephew Wound Management: www.smith-nephew.com (accessed 2005 – 2009); http://wound.smith-nephew.com/UK/node.asp?NodeId=3522 (accessed: 14th October 2008); and http://global.smith-nephew.com/master/CADESORB_27561.htm (accessed: 14th October 2008). Snyder, R.J. (2005). Treatment of nonhealing ulcers with allografts. Clinics in Dermatology, v23 (4), pp 388 – 395. Somerville, R.P.T., Oblander, S.A. and Apte, S.S. (2003). Matrix metalloproteinases: old dogs with new tricks. Genome Biology, v4 (6), article 216, pp. 216.1 - 216.11. Sorbion AG: www.sorbion.com (accessed: 4th January 2010). Springer, T.A. (1994). Traffic Signals for lymphocyte recirculation and leukocyte emigration: The multistep paradigm. Cell, v76, pp. 301 – 314. Stadelmann, W.K., Digenis, A.G. and Tobin, G.R. (1998). Physiology and healing dynamics of chronic cutaneous wounds. The American Journal of Surgery, v126 (Suppl. 2A), ss. 26 – 38. Stamenkovic, I. (2003). Extracellular matrix remodelling: the role of matrix metalloproteinases. Journal of Pathology, v200, pp. 448 – 464.

CHAPTER 7: References
227
Sternlicht, M.D. and Werb, Z. (2001). How matrix metalloproteinases regulate cell behavior. Annual Review of Cell and Developmental Biology, v17, pp. 463 - 516. Stokes, G. G. (1852). On the change of refrangibility of light. Philosophical Transactions of the Royal Society of London, v142, pp. 463 – 562. Stroock, A.D. and Cabodi, M. (2006). Microfluidic biomaterials. MRS Bulletin, v114 (2), pp. 116 – 119. Stryer, L. (1995). Biochemistry, 4th Edition, W.H. Freeman and Company, New York, USA. Stryer, L., Berg, J.M. and Tymoczko, J.L. (2002). Biochemistry, 5th edition. W.H. Freeman and Company, New York, USA. Suganuma, K., Nakajima, H., Ohtsuki, M. and Imolawa, G. (2010). Astaxanthin attenuates the UVA-induced up-regulation of matrix metalloproteinase-1 and skin fibroblast elastase in human dermal fibroblasts. Journal of Dermatological Science, v58, pp. 136 – 142. SwissProt: www.ebi.ac.uk/swissprot/ (accessed 12th November 2005). Syrovets, T. and Simmet, T. (2004). Novel aspects and new roles for the serine protease plasmin. Cellular Molecular Life Sciences, v61, pp. 873 – 885. Takahashi, H., Nukiwa, T., Yoshimura, K., Quick, C.D., States, D.J., Holmes, M.D., Whang-Peng, J., Knutsen, T. and Crystal. R.G. (1988). Structure of the human neutrophil elastase gene. Journal of Biological Chemistry, v263 (29), pp. 14739 – 14747. Tarnuzzer , R.W. and Schultz, G.S. (1996). Biochemical analysis of acute and chronic wound environments. Wound Repair and Regeneration, v4 (3) , pp. 321–325 The Global Market For Advanced Wound Care Products 2008. Espicom Business Intelligence. ISBN: 978-1-85 822-318-6. Theilgaard-Moench, K., Knudsen, S., Follin, P. and Borregaard, N. (2004). The transcriptional activation program of human neutrophils in skin lesions supports their important role in wound healing. The Journal of Immunology, v172, pp. 7684 – 7693. Thomas, S. and Andrews, A. (1999). The effect of hydrogel dressings on maggot development. Journal of Wound Care, v8 (2), pp. 75 – 77. Thomas, S. and Hay, N.P. (1994). Assessing the hydro-affinity of hydrogel dressings. Journal of Wound Care, v3 (3), pp. 89 – 91. Thorn, R.M.S., Greeman, J. and Austin, A.J. (2005). In vitro method to assess the antimicrobial activity and potential efficacy of novel types of wounds dressings. Journal of Applied Microbiology, v99, pp. 895 – 901. Thornton, P.D., Mart, R.J. and Ulijn, R.V. (2007). Enzyme-responsive polymer hydrogel particles for controlled release. Advanced Materials, v19, pp. 1252 – 1256.

CHAPTER 7: References
228
Thornton, P.D., McConnell, G. and Ulijn, R.V. (2005). Enzyme responsive polymer hydrogel beads. Chemical Communications, v47, pp. 5913 – 5915. Thornton, P.D., Mart, R.J., Webb, S.J. and Ulijn R.V. (2008). Enzyme-responsive hydrogel particles for the controlled release of proteins: designing peptide actuators to match payload. Soft Matter, v4, pp. 821 – 827.
Todd, S.J., Farrar, D., Gough, J.E. and Ulijn, R.V. (2007). Enzyme-triggered cell attachment to hydrogel surfaces. Soft Matter, v3, pp. 747 – 550. Toriseva, M. and Kähäri, V-M. (2009). Proteinases in cutaneous wound healing. Cellular and Molecular Life Sciences, v66, pp. 203 – 224. Tortora, G.J. and Grabowski, S.R. (1993). Principles of anatomy and physiology, 7th Edition. Harper Collins College Publishers. Toy, T.W. (2005). Matrix metalloproteinases: their function in tissue repair. Journal of Wound Care, v14 (1), pp. 20 – 22. Travis, J. (1998). Structure, function, and control of neutrophil proteinases. The American Journal of Medicine, v84 (suppl. 6A), pp. 37 – 42.
Trengrove, N.J., Bielefeldt-Ohmann, H. and Stacey, M.C. (2000). Mitogenic activity and cytokine levels in non-healing chronic leg ulcers. Wound Repair and Regeneration, v8 (1), pp 13 – 25. Trengove, N.J., Stacey, M.C., MacAuley, S., Bennett, N., Gibson, J., Burslem, F., Murphy, G. and Schultz, G. (1999). Analysis of the acute and chronic wound environments: the role of proteases and their inhibitors. Wound Repair and Regeneration, v7 (6), pp. 442–52. Tsuji, N., Moriwaki, S., Suzuki, Y., Takema, Y. and Imokawa, G. (2001). The role of elastases secreted by fibroblasts in wrinkle formation: implication through selective inhibition of elastase activity. Photochemistry and Photobiology, v74 (2), pp. 283 – 290. Tsukahara, K., Takema, Y., Moriwaki, S., Tsuji, N., Suzuki, Y., Fujimura, T. and Imokawa, G. (2001). Selective inhibition of skin fibroblast elastase elicits a concentration-dependent prevention of ultraviolet B-induced wrinkle formation. Journal of Investigated Dermatology, v117, pp. 671 – 677. Ulijn, R.V. (2006). Enzyme-responsive materials: a new class of smart biomaterials. Journal of Materials Chemistry, v16, pp. 2217 – 2225. Ulijn, R.V., Baragana, B., Halling, P.J. and Flitsch, S.L. (2002). Protease-catalysed peptide synthesis on solid support. Journal of the American Chemical Society, v124 (37), pp. 10988 – 10989.
Ulijn, R.V., Bibi, N., Jayawarna, V., Thornton, P.D., Todd, S.J., Mart, R.J., Smith, A.M. and Gough, J.E. (2007a). Bioresponsive hydrogels. Materials Today, v10 (4), pp. 40 – 48.

CHAPTER 7: References
229
Ulijn, R.V., Bisek, N., Halling, P.J. and Flitsch, S.L. (2003a). Understanding protease catalysed solid phase peptide synthesis. Organic & Biomolecular Chemistry, v1, pp. 1277 – 1281
Ulijn, R.V., Brazendale, I., Margetts, G., Flitsch, S.L., McConnell, G., Girkin, J. and Halling, P.J. (2003b). Two-photon microscopy to spatially resolve and quantify fluorophores in single-bead chemistry. Journal of Combinatorial Chemistry, v5 (3), pp. 215 – 217. Ulijn, R.V., Thornton, P.D. and Mart, R.J. (2007b). Protease-responsive PEGA-based hydrogel particle for pharmaceutical and affinity chromatography use. PCT Int. Appl. (2007), 84pp. Vaalamo, M., Mattila, L., Johansson, N., Kariniemi, A.L., Karjalainen-Lindsberg, M.L., Kahari, V.M., and Saarialhokere, U. (1997). Distinct populations of stromal cells express collagenase-3 (MMP-13) and collagenase-1 (MMP-1) in chronic ulcers but not in normally healing wounds. The Journal of Investigative Dermatology, v109, pp. 96 – 101. Vachon, D.J. and Yager, D.R. (2006). Novel sulfonated hydrogel composite with the ability to inhibit proteases and bacterial growth. Journal of Biomedical Materials Research. Part A, v76 (1), pp. 35 – 43. Vaday, G.G. and Lider, O. (2000). Extracellular matrix moieties, cytokines, and enzymes: dynamic effects on immune cell behaviour and inflammation. Journal of Leukocyte Biology, v67, pp. 149 – 159. van den Berg, A.J., Halkes, S.B., van Ufford, H.C., Hoekatra, M.J. and Beukelman, C.J. (2003). A novel formulation of metal ions and citric acid reduces reactive oxygen species in vitro. Journal of Wound Care, v12 (10), pp. 413 – 418. van Rossum, M., Vooijs, D.P.P., Walboomers, X.F., Hoekstra, M.J., Spauwen, P.H.M. and Jansen, J.A. (2007). The influence of a PHI-5-loaded silicone membrane, on cutaneous wound healing in vivo. Journal of Materials Science: Materials in Medicine, v18, pp. 1449 – 1456. Van Wart, H.E. and Birkedal-Hansen, H. (1990). The cysteine switch: a principle of regulation of metalloproteinase activity with potential applicability to the entire matrix metalloproteinase gene family. Proceedings of the National Academy of Sciences of the USA, v87, pp. 5578 – 5582. Varghese, M.C., Balin, A.K., Carter, D.M. and Caldwell, D. (1986). Local environment of chronic wounds under synthetic dressings. Archives of Dermatology, v122 (1), pp. 52 – 57. Visse, R. and Nagase, H. (2003). Matrix metalloproteinases and tissue inhibitors of metalloproteinases: Structure, function, and biochemistry. Circulation Research, v92, pp. 827 – 839. Voet, D. and Voet, J.G. (1995). Biochemistry. 2nd edition. John Wiley & Sons, New York, USA.

CHAPTER 7: References
230
Walker J.M. (1996). The dansyl method for identifying N-terminal amino acids. The Protein Protocols Handbook, part V, pp. 529 – 534. Wang, K.L., Burban, J.H. and Cussler, E.L. (1993). Hydrogels as separation agents. Advances in Polymer Science, v110, pp. 68 – 79. Watorek, W., Farley, D., Salvesen, G. and Travis, J. (1991). Neutrorphil elastase and cathepsin G. Am. NY Acad. Sci., v624, pp. 23–31; as cited in Edwards, J.V., Yager, D.R., Cohen, I.K.., Diegelmann, R.F., Montante, S., Bertoniere, N. and Bopp, A.F. (2001). Modified cotton gauze dressing that selectively absorb neutrophil elastase acitivity in solution. Wound Repair and Regeneration, v9, pp 50 – 58. Westerhof, W. and Vanscheidt, W. (1994). Proteolytic enzymes and wound healing. Springer-Verlag Berlin Heidelberg. Winter, G.D. (1962). Formation of scab and rate of epithelialization of superficial wounds in the skin of the young domestic pig. Nature, v193, pp. 293 – 294. Winter, G. and Scales, J.T. (1963). Effect of air drying and dressings on the surface of a wound, Nature, v197, pp. 91 – 92. Woessner, J.F. and Nagase, H. (2002). Matrix metalloproteinases and TIMPs. Oxford University Press, Oxford, England. UK. Wohner, N. (2008). Role of cellular elements in thrombus formation and dissolution. Cardiovascular & Hematological Agents in Medicinal Chemistry, v6 (3), pp. 224 – 228. Worthington Biochemical Corporation: http://www.worthington-biochem.com/ (accessed: November 2004 – September 2009) Wysocki, A.B. (1996). Wound fluids and the pathogenesis of chronic wounds. Journal of Wound, Ostomy and Continence Nursing, v23, pp. 283 – 290. Wysocki, A.B., Staiano-Coico, L. and Grinnell, F. (1993). Wound fluid from chronic leg ulcers contains elevated levels of metalloproteinases MMP-2 and MMP-9. The Journal of Investigative Dermatology, v101, pp. 64 – 68. Xia, Z., Sato, A., Hughes, M.A. and Cherry, G.W. (2000). Stimulation of fibroblast growth in vitro intermittent radiant warming. Wound Repair and Regeneration, v8, pp. 138 – 144. Xue, M., Le, N.T.V. and Jackson, C.J. (2006). Targeting matrix metalloproteases to improve cutaneous wound healing. Expert Opinion on Therapeutic Targets, v10 (1), pp. 143 – 155. Yager, D.R., Chen, S.M., Ward, B.S., Olutoye, O.O., Diegelmann., R.F. and Cohen, I.K. (1997). Ability of chronic wound fluids to degrade peptide growth factors is associated with increased levels of elastase activity and diminished levels of proteinase inhibitors. Wound Repair and Regeneration, v5, pp. 23 – 32.

CHAPTER 7: References
231
Yager, D.R. and Nwomeh, B.C. (1999). The proteolytic environment of chronic wounds. Wound Repair and Regeneration, v7, pp. 433 – 441. Yager, D.R., Zhang, L.Y., Liang, H.X., Diegelmann., R.F. and Cohen, I.K. (1996). Wound fluids from human pressure ulcers contain elevated matrix metalloproteinase levels and activity compared to surgical wound fluids. The Journal of Investigative Dermatology, v107 (5), pp. 743 – 748. Zhu, Y. K., Liu, X. D., Sköld, C. M., Umino, T., Wang, H. J., Spurzem, J. R., Kohyama, T., Ertl, R. F. and Rennard, S. I. (2001). Synergistic neutrophil elastase-cytokine interation degrades collagen in three-dimensional culture. American Journal of Physiology Lung Cell Molecular Physiology, v281, L868 – L878. Zourob, M., Gough, J.E. and Ulijn, R.V. (2006). A micro-patterned hydrogel platform for chemical synthesis and biological analysis. Advanced Materials., v18, pp. 655 – 659. Zubay, G.L., Parson, W.W. and Vance, D.E. (1995). Principles of Biochemistry. Wm. C. Brown Communications, Inc. Dubuque, USA.

232
AAPPPPEENNDDIIXX II
TTaabbllee 1177

233
Table
17.
Subst
rate
spec
ific
ity
of pro
teoly
tic
pro
tease
s in
volv
ed in the
pro
cess
of wound h
ealing
Pro
tease
s E
nzy
me
Nam
e(s
)/E
C
MW
(kD
a)
Entry
Fam
ily
Typ
e M
MP
Oth
er n
am
es
late
nt
act
ive
Subst
rate
s Subst
rate
spec
ific
ity
pI
1 Ser
ine
E
last
ase
N
/A
N
eutr
op
hil
elas
tase
, PM
N
elas
tase
, HN
E,
LN
E, l
euko
cyte
en
asta
se,
En
asta
se-2
,
(EC
3.4
.21.3
7)
28.6
E
last
in, c
olla
gen
s (I
, II,
II
I, I
V),
cro
sslin
ked
fi
bri
n, f
ibro
nec
tin
, la
min
in, p
rote
ogl
ycan
s,
vitr
on
ecti
n, I
L-2
, IL
-1β,
TN
F-α
, IL
-8, T
NF
r,
CD
4, C
D8,
CD
2, c
lott
ing
fact
ors
, co
mp
lem
ent
fact
ors
, im
mun
ogl
ob
ulin
s
Val
~X
> A
la~
X
X-A
la-A
la-P
ro-V
al~
Y
(X =
MeO
-Suc,
Y =
NH
Ph
NO
2/SB
zl)
X-A
la-A
la-A
la~
Y (
X =
Suc,
Y =
NH
Ph
NO
2)
Val
-Pro
-Val
9.31
2 Ser
ine
Thro
mbin
N
/A
Co
agula
tio
n
fact
or
II,
Fib
rin
oge
nas
e,
pro
thro
mb
in
pre
curs
or,
th
rom
bin
lig
ht/
h
eavy
ch
ain
, α-
Th
rom
bin
,
(EC
3.4
.21.5
)
36
.5
Fib
rin
oge
n, f
ibri
n,
colla
gen
s, c
oag
ula
tio
n
fact
ors
(V
, V
III,
XII
I),
thro
mb
in r
ecep
tors
(P
AR
1, P
AR
3),
hep
arin
co
fact
or
II,
thro
mb
om
od
ulin
, pla
tele
t gl
yco
pro
tein
1b
, p
rote
in
C, a
ctiv
ates
dif
fere
nt
cell
typ
es a
nd
pla
tele
ts
Met
-Pro
-Arg
~Ser
-Ph
e-A
rg
Gly
-Gly
-Val
-Arg
~G
ly-P
ro-A
rg
Ph
e-Ser
-Ala
-Arg
~G
ly-H
is-A
rg
Leu
-Gly
-Ile
-Arg
~Ser
-Ph
e-A
rg
Leu
-Ser
-Pro
-Arg
~T
hr-
Ph
e-H
is
Trp
-Tyr
-Leu
-Arg
~Ser
-Asn
-Asn
Il
e-G
ln-I
le-A
rg~
Ser
-Val
-Ala
Il
e-G
lu-P
ro-A
rg~
Ser
-Ph
e-Ser
G
ln-S
er-P
ro-A
rg~
Ser
-Ph
e-G
ln
Gly
-Val
-Pro
-Arg
~G
ly-V
al-A
sn
Leu
-Asp
-Pro
-Arg
~Ser
-Ph
e-L
eu
Pro
-Ala
-Pro
-Arg
~G
ly-T
yr-P
ro
Ile-
Lys
-Pro
-Arg
~Il
e-V
al-G
ly
Val
-Asp
-Pro
-Arg
~L
eu-I
le-A
sp
Val
-Ser
-Pro
-Arg
~A
la-S
er-A
la
Ile-
Ala
-Gly
-Arg
~Ser
-Leu
-Asn
P
he-
Met
-Pro
-Leu
~Ser
-Th
r-G
ln
Ben
zoyl
-Ph
e-V
al-A
rg-p
NA
,HC
l
3 Ser
ine
Pla
smin
N
/A
Fib
rin
ase,
F
ibri
no
lysi
n,
(EC
3.4
.21.7
)
90
.6
Fib
rin
, lam
inin
, fi
bro
nec
tin
, vit
ron
ecti
n,
coag
ula
tio
n f
acto
rs
(V,
Va,
VII
I, V
IIIa
), p
lasm
in,
colla
gen
s
Lys
~X
> A
rg~
X
Ac-
Lys
-Th
r-X
-Lys
-AM
C (
X =
Tyr
, Ph
e, T
rp,
Ser
) A
c-P
he-
Th
r-T
yr-L
ys-A
MC
A
c-L
eu-T
hr-
Ph
e-L
ys-A
MC
A
c-L
eu-G
lu-P
he-
Lys
-AM
C
7.04

234
Tab
le 1
7. C
on
tinue…
Pro
tease
s E
nzy
me
Nam
e(s
)/E
C
MW
(kD
a)
Entry
Fam
ily
Typ
e M
MP
Oth
er n
am
es
late
nt
act
ive
Subst
rate
s Subst
rate
spec
ific
ity
pI
Pla
smin
(c
on
tin
ue)
T
hr-
Glu
-Tyr
-Arg
L
ys-G
ly-T
ry-A
rg
Glu
-Ala
-Tyr
-Arg
L
ys-T
hr-
Ph
e-L
ys-(
X) 6
-Cys
(X
= G
ly)
Bo
c-G
lu-L
ys-L
ys~
AM
C
4 M
MP
Collagen
ase
s M
MP
-1
Co
llage
nas
e-1,
in
ters
tita
l co
llage
nas
e,
(EC
3.4
.24.7
)
52
43
Co
llage
ns
(I, II
, II
I, V
II,
VII
I, X
, XI)
; ge
lati
n;
aggr
ecan
; ten
asci
n, L
-se
lect
in; I
L-1
β;
pro
teo
glyc
ans;
en
tact
in;
ovo
stat
in; M
MP
-2; M
MP
-9
Ac-
Pro
-Leu
-Gly
-Ser
~L
eu-L
eu-G
ly-O
Et
Mca
-Pro
-Leu
-Gly
~L
eu-D
pa-
Ala
-Arg
-NH
2
Pro
-Met
-Ala
~L
eu-T
rp-A
la-T
hr
Leu
-Pro
-Met
~P
he-
Ser
-Pro
A
c-P
ro-L
eu-A
la-S
~N
va-T
rp-
NH
2 18
3A
rg-T
rp-T
hr-
Asn
-Asn
-Ph
e-A
rg-G
lu-T
ry19
1 P
ro-G
lu-G
ly~
Ile-
Ala
-Gly
P
ro-G
lu-G
ly~
Leu
-L
eu-G
ly
6.47
5 M
MP
Collagen
ase
s M
MP
-8
Co
llage
nas
e-2,
n
eutr
op
hil
colla
gen
ase,
(EC
3.4
.24.3
4)
75
58
Co
llage
ns
(I, II
, II
I, V
, V
II, V
III,
an
d X
); g
elat
in;
enta
ctin
; agg
reca
n;
ten
asci
n,
fib
ron
ecti
n,
Pro
MM
P-1
,2
Gly
-Pro
-Gln
-Gly
~Il
e-T
rp-G
ly-G
ln
Pro
-Leu
-Glu
/A
la~
Tyr
-Trp
-Ser
2,
4-D
np
-Pro
-Gln
-Gly
~Il
e-A
la-G
ly-D
-Arg
-OH
6.38
6 M
MP
Collagen
ase
s M
MP
-13
C
olla
gen
ase-
3,
Rat
in
ters
tita
l co
llage
nas
e,
(EC
3.4
.24.?
)
52
42
Co
llage
ns
(I, II
, II
I, I
V,
IX, X
, XIV
); g
elat
in;
enta
ctin
; agg
reca
n;
ten
asci
n,
pla
smin
oge
n;a
ggre
can
; p
erle
can
; fib
ron
ecti
n;
fib
rin
oge
n/
fib
rin
; o
steo
nec
tin
; MM
P-9
, P
roM
MP
-9,1
3
Mca
-Pro
-Leu
-Gly
~L
eu-D
pa-
Ala
- A
rg-N
H2
Gly
-Pro
-Gln
-Gly
~L
eu-A
la-G
ly-G
ln779
Asp
-Val
-Gly
-Glu
~T
yr-A
sn-V
al-P
he8
8
5.32

235
Tab
le 1
7. C
on
tinue…
Pro
tease
s E
nzy
me
Nam
e(s
)/E
C
MW
(kD
a)
Entry
Fam
ily
Typ
e M
MP
Oth
er n
am
es
late
nt
act
ive
Subst
rate
s Subst
rate
spec
ific
ity
pI
7 M
MP
Gel
atinase
s M
MP
-2
Gel
atin
ase
A,
72-k
Da
gela
tin
ase,
Typ
e IV
co
llage
nas
e,
(EC
3.4
.24.2
4)
71
62
Co
llage
ns
(I, IV
, V
, VII
, X
, XI)
; ge
lati
ns;
fi
bro
nec
tin
; ela
stin
; la
min
in; a
ggre
can
; vi
tro
nec
tin
; dec
ori
n;
IGF
BP
-3/
5; p
ro-M
MP
s (1
, 9 a
nd
13)
Gly
-Pro
-Gln
-Gly
~Il
e-P
he-
Gly
-Gln
M
ca-P
ro-L
eu-G
ly~
Leu
-Trp
-Ala
- A
rg-N
H2
Ac-
Pro
-Leu
-Ala
~SN
va-T
rp-N
H2
Pro
-Gln
-Gly
~Il
e-A
la-G
ly-G
ln
5.26
8 M
MPs
Gel
atinase
s M
MP
-9
Gel
atin
ase
B,
92-k
Da
ge
lati
nas
e, T
ype
V c
olla
gen
ase,
(E
C 3
.4.2
4.3
5)
76
67
Co
llage
ns
(IV
, V, V
II, X
, X
IV, X
VII
); g
elat
in;
enta
ctin
; agg
reca
n; e
last
in;
fib
ron
ecti
n;
fib
rin
oge
n/
fib
rin
; o
steo
nec
tin
; pla
smin
oge
n;
MB
P; I
L-1
β
Gly
-Pro
-Leu
-Gly
~Il
e-A
la-G
ly-G
ln
Pro
-Leu
-Gly
~M
et-L
eu-S
er-H
is
5.69
9 M
MPs
Strom
elys
ins
MM
P-3
Str
om
elys
in-1
, T
ran
sin
, CA
P,
pro
teo
glyc
anas
e,
(EC
3.4
.24.1
7)
52
43
Co
llage
ns
(III
, IV
, V
, an
d
IX);
gel
atin
; agg
reca
n;
per
leca
n; d
eco
rin
; fi
bro
nec
tin
; lam
inin
; el
asti
n; p
rote
ogl
ycan
s;
caes
in;
ost
eon
ecti
n;
ovo
stat
in; e
nta
ctin
; p
lasm
ino
gen
; MB
P;
IL-1
β; M
MP
-2/
TIM
P-2
; p
ro-M
MP
s (1
, 7, 8
, 9, 1
3)
Mca
-Arg
-Arg
-Lys
-Pro
-Val
-Glu
~Z
-Trp
-Arg
-L
ys(d
np
)- N
H2
Dn
p-A
rg-P
ro-L
eu-A
la~
X-T
rp-A
rg-S
er, w
her
e X
equal
s: L
eu, P
he,
Tyr
, Trp
5.77
10
MM
P
Strom
elys
ins
MM
P-
10
Str
om
elys
in-2
, T
ran
sin
-2,
(EC
3.4
.24.2
2)
52
44
Co
llage
ns
(II-
V);
gel
atin
; ca
sein
; agg
reca
n; e
nta
ctin
; el
asti
n;
fib
ron
ecti
n;
vitr
on
ecti
n; l
amin
in,
fib
rin
oge
n/
fib
rin
; M
MP
-1; M
MP
-8
Asp
-Val
-Gly
-His
~P
he-
Ser
-Ser
-Ph
e85
Gly
-Pro
-His
-Leu
~L
eu-V
al-G
lu-A
la29
5.
49

236
Tab
le 1
7. C
on
tinue…
Pro
tease
s E
nzy
me
Nam
e(s
)/E
C
MW
(kD
a)
Entry
Fam
ily
Typ
e M
MP
Oth
er n
am
es
late
nt
act
ive
Subst
rate
s Subst
rate
spec
ific
ity
pI
11
MM
P
Strom
elys
ins
MM
P-
11
Str
om
elys
in-3
, F
uri
n m
oti
f,
(E
C 3
.4.2
4.?
)
51
46
Lam
inin
; fib
ron
ecti
n;
aggr
ecan
;; IG
FB
P-1
; α
1-p
rote
inas
e in
hib
ito
r
Ala
-Ala
-Gly
-Ala
~M
et-P
he-
Leu
-Glu
354
Arg
-Val
-Gly
-Ph
e~T
yr-G
lu-S
er-A
sp68
8 L
ys-A
la-L
eu-H
is~
Val
-Th
r-A
sn-I
le14
4 D
ns-
Pro
-Leu
-Ala
~C
ys(O
meB
zl)-
Trp
-Ala
-Arg
-N
H2
6.25
12
MM
P
Oth
er
MM
Ps
or el
ast
ase
MM
P-
12
Mac
rop
hag
e m
etal
loel
asta
se,
met
allo
elas
tase
, (E
C 3
.4.2
4.6
5)
52
20
Inso
lub
le e
last
in; c
olla
gen
IV
; gel
atin
; cas
ein
; fi
bro
nec
tin
; vit
ron
ecti
n;
lam
inin
; en
tact
in; M
BP
; p
rote
ogl
ycan
s;
fib
rin
oge
n/
fib
rin
; p
lasm
ino
gen
; hep
arin
su
lph
ates
Leu
-Val
-Glu
-Ala
~L
eu-T
yr~
Leu
-Val
-Cys
O3H
-G
ly20
D
np
-Arg
-Pro
-Leu
-Ala
~L
eu-T
rp-A
rg-S
er-N
H2
Arg
-Pro
-Ph
e-G
lu~
Val
-Lys
-Asp
-Th
r203
G
ly-A
la-M
et-P
he~
Leu
-Glu
-Ala
-Ile
356
8.75
En
trie
s 1
, 2
, 4
– 1
2 w
ere
pre
sen
ted
in
pa
rt o
f a
pa
ten
t a
ppl
ica
tion
(Ulij
n,
R.V
., et
al.,
200
7b);
in
the
ab
ove
ta
ble
so
me o
f th
e i
nfo
rma
tion
fo
r th
ese
en
trie
s h
as
been
up
date
d.
Mod
ified
fro
m:
Pu
rich
and
Alli
son
2002
; D
ovi
et
al.
2004
; B
axt
er
199
4;
Pra
ger
et
al.
199
1;
Ed
wa
rds
et
al.
199
9;
Bia
nc
hin
i et
al.
200
2;
Fent
on 1
981
; H
unt
ing
ton
2005
; B
od
e 20
06;
Ko
lev
et
al.
1995
; P
arf
yono
va e
t a
l. 20
02;
Ba
ckes
et
al.
200
0;
Oh
tsu
ka e
t a
l. 20
09;
McC
raw
ley
and
Ma
tris
ian
200
1; S
tern
lich
t an
d W
erb
200
1;
Chu
ng
et
al.
2000
; W
oess
ner
and
Na
ga
se 2
002
; S
yro
vets
and
S
imm
et
200
4;
Xu
e e
t al
. 20
06;
Va
day
and
Lid
er
2000
. T
he i
soele
ctric
po
int
(pI)
of
all
en
zym
es
wa
s ca
lcu
late
d u
sin
g ‘
Co
mpu
te p
I/M
W’
thro
ugh
th
e d
ata
base
pro
vid
ed
by
Sw
issP
rot
(ww
w.e
bi.a
c.u
k/sw
issp
rot/
) fo
r th
e h
um
an
speci
es.
C
lea
vag
e b
etw
een
sci
ssile
P1
–P1
′ b
on
d (~
, i.e
. P
1~P
1′ ),
AM
C (
7-a
min
o-4
-meth
ylco
um
arin
), Dn
p (d
initr
oph
enyl
), D
pa
(N3 -dn
p-L
-2,3
-d
iam
inop
ropi
onic
aci
d).

237
AAPPPPEENNDDIIXX IIII
TTaabbllee 1188
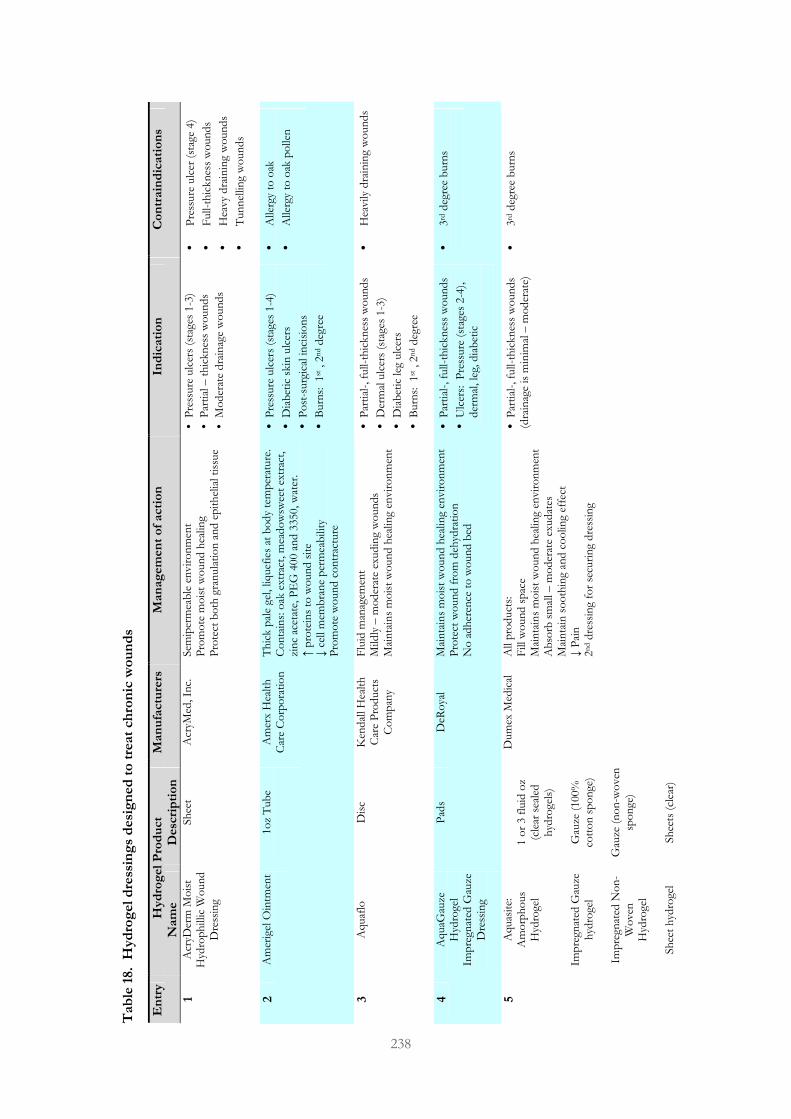
238
Table
18. H
ydro
gel dre
ssin
gs designed to tre
at chro
nic w
ounds
Hydro
gel Pro
duct
Entry
Nam
e
Desc
ription
Manufactu
rers
M
anagem
ent of action
Indication
Contrain
dications
1 A
cryD
erm
Mo
ist
Hyd
rop
hill
ic W
oun
d
Dre
ssin
g
Sh
eet
A
cryM
ed, I
nc.
Sem
iper
mea
ble
en
vir
on
men
t P
rom
ote
mo
ist
wo
un
d h
ealin
g P
rote
ct b
oth
gra
nula
tio
n a
nd
ep
ith
elia
l ti
ssue
• P
ress
ure
ulc
ers
(sta
ges
1-3
)
• P
arti
al –
th
ickn
ess
wo
un
ds
• M
od
erat
e d
rain
age
wo
un
ds
• P
ress
ure
ulc
er (
stag
e 4)
• F
ull-
thic
kn
ess
wo
un
ds
• H
eavy
dra
inin
g w
oun
ds
• T
un
nel
ling
wo
un
ds
2
Am
erig
el O
intm
ent
1o
z T
ub
e
Am
erx
Hea
lth
C
are
Co
rpo
rati
on
T
hic
k p
ale
gel,
liquef
ies
at b
od
y te
mp
erat
ure
.
Co
nta
ins:
oak
ext
ract
, mea
do
wsw
eet
extr
act,
zi
nc
acet
ate,
PE
G 4
00
and
335
0, w
ater
. ↑
pro
tein
s to
wo
un
d s
ite
↓ c
ell m
emb
ran
e p
erm
eab
ility
P
rom
ote
wo
un
d c
on
trac
ture
• P
ress
ure
ulc
ers
(sta
ges
1-4
)
• D
iab
etic
ski
n u
lcer
s
• P
ost
-surg
ical
in
cisi
on
s
• B
urn
s:
1st ,
2n
d d
egre
e
• A
llerg
y to
oak
• A
llerg
y to
oak
po
llen
3
Aquaf
lo
Dis
c K
end
all H
ealt
h
Car
e P
rod
uct
s C
om
pan
y
Flu
id m
anag
emen
t M
ildly
– m
od
erat
e ex
ud
ing
wo
un
ds
Mai
nta
ins
mo
ist
wo
un
d h
ealin
g en
viro
nm
ent
• P
arti
al-,
full-
thic
kn
ess
wo
un
ds
• D
erm
al u
lcer
s (s
tage
s 1-
3)
• D
iab
etic
leg
ulc
ers
• B
urn
s:
1st ,
2n
d d
egre
e
• H
eavi
ly d
rain
ing
wo
un
ds
4
AquaG
auze
H
ydro
gel
Imp
regn
ated
Gau
ze
Dre
ssin
g
Pad
s D
eRo
yal
Mai
nta
ins
mo
ist
wo
un
d h
ealin
g en
viro
nm
ent
Pro
tect
wo
un
d f
rom
deh
ydra
tio
n
No
ad
her
ence
to
wo
un
d b
ed
• P
arti
al-,
full-
thic
kn
ess
wo
un
ds
• U
lcer
s:
Pre
ssure
(st
ages
2-4
),
der
mal
, leg
, dia
bet
ic
• 3r
d d
egre
e b
urn
s
5
Aquas
ite:
A
mo
rph
ous
Hyd
roge
l
Imp
regn
ated
Gau
ze
hyd
roge
l
Imp
regn
ated
No
n-
Wo
ven
H
ydro
gel
Sh
eet
hyd
roge
l
1
or
3 fl
uid
oz
(cle
ar s
eale
d
hyd
roge
ls)
G
auze
(10
0%
cott
on
sp
on
ge)
G
auze
(n
on
-wo
ven
sp
on
ge)
Sh
eets
(cl
ear)
Dum
ex M
edic
al
All
pro
duct
s:
Fill
wo
un
d s
pac
e M
ain
tain
s m
ois
t w
oun
d h
ealin
g en
viro
nm
ent
Ab
sorb
sm
all –
mo
der
ate
exud
ates
M
ain
tain
so
oth
ing
and
co
olin
g ef
fect
↓
Pai
n
2nd d
ress
ing
for
secu
rin
g d
ress
ing
• P
arti
al-,
full-
thic
kn
ess
wo
un
ds
(d
rain
age
is m
inim
al –
mo
der
ate)
•
3rd d
egre
e b
urn
s
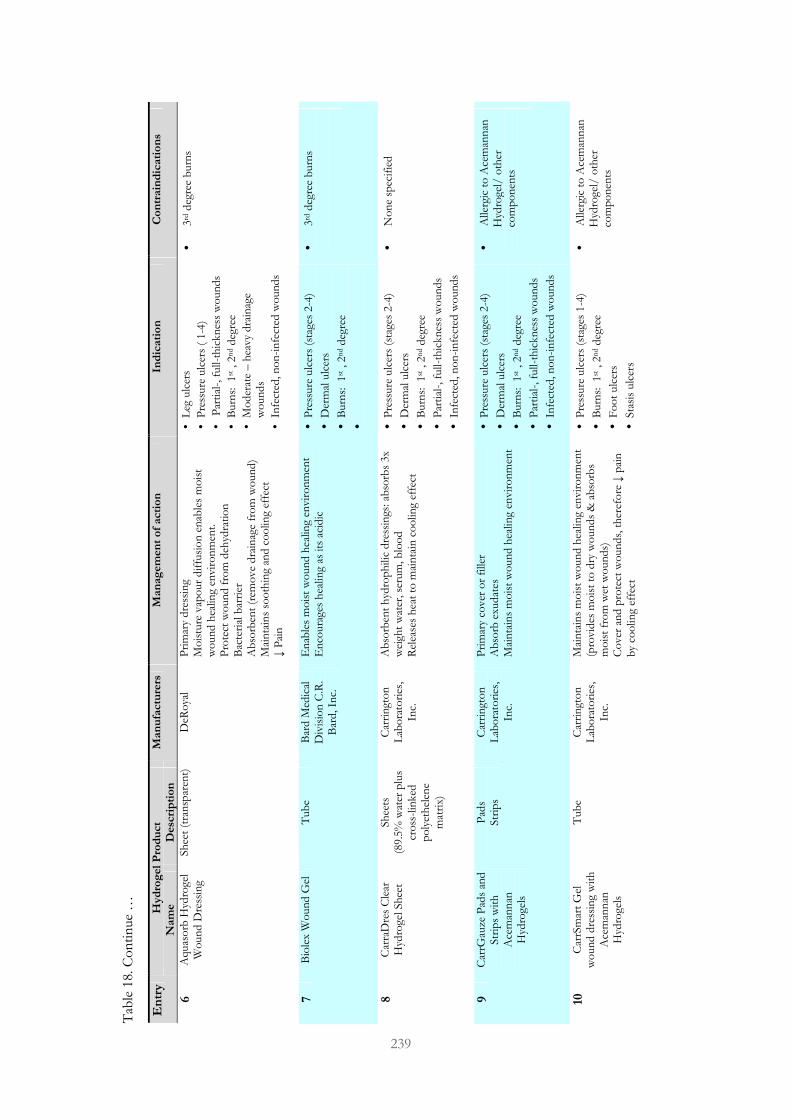
239
Tab
le 1
8. C
on
tin
ue
…
Hydro
gel Pro
duct
Entry
Nam
e
Desc
ription
Manufactu
rers
M
anagem
ent of action
Indication
Contrain
dications
6
Aquas
orb
Hyd
roge
l W
oun
d D
ress
ing
Sh
eet
(tra
nsp
aren
t)
DeR
oya
l P
rim
ary
dre
ssin
g M
ois
ture
vap
our
dif
fusi
on
en
able
s m
ois
t w
oun
d h
ealin
g en
viro
nm
ent.
P
rote
ct w
oun
d f
rom
deh
ydra
tio
n
Bac
teri
al b
arri
er
Ab
sorb
ent
(rem
ove
dra
inag
e fr
om
wo
un
d)
Mai
nta
ins
soo
thin
g an
d c
oo
ling
effe
ct
↓ P
ain
• L
eg u
lcer
s
• P
ress
ure
ulc
ers
( 1-
4)
• P
arti
al-,
full-
thic
kn
ess
wo
un
ds
• B
urn
s:
1st ,
2n
d d
egre
e
• M
od
erat
e –
hea
vy d
rain
age
wo
un
ds
• In
fect
ed, n
on
-in
fect
ed w
oun
ds
• 3r
d d
egre
e b
urn
s
7
Bio
lex
Wo
un
d G
el
Tub
e B
ard
Med
ical
D
ivis
ion
C.R
. B
ard
, In
c.
En
able
s m
ois
t w
oun
d h
ealin
g en
viro
nm
ent
En
coura
ges
hea
ling
as its
aci
dic
•
Pre
ssure
ulc
ers
(sta
ges
2-4
)
• D
erm
al u
lcer
s
• B
urn
s:
1st ,
2n
d d
egre
e
•
• 3r
d d
egre
e b
urn
s
8
Car
raD
res
Cle
ar
Hyd
roge
l Sh
eet
Sh
eets
(8
9.5%
wat
er p
lus
cro
ss-l
inked
p
oly
eth
elen
e m
atri
x)
Car
rin
gto
n
Lab
ora
tori
es,
Inc.
Ab
sorb
ent
hyd
rop
hili
c d
ress
ings
: ab
sorb
s 3x
w
eigh
t w
ater
, ser
um
, blo
od
R
elea
ses
hea
t to
mai
nta
in c
oo
ling
effe
ct
• P
ress
ure
ulc
ers
(sta
ges
2-4
)
• D
erm
al u
lcer
s
• B
urn
s:
1st ,
2n
d d
egre
e
• P
arti
al-,
full-
thic
kn
ess
wo
un
ds
• In
fect
ed, n
on
-in
fect
ed w
oun
ds
• N
on
e sp
ecif
ied
9
Car
rGau
ze P
ads
and
Str
ips
wit
h
Ace
man
nan
H
ydro
gels
Pad
s Str
ips
Car
rin
gto
n
Lab
ora
tori
es,
Inc.
Pri
mar
y co
ver
or
fille
r A
bso
rb e
xud
ates
M
ain
tain
s m
ois
t w
oun
d h
ealin
g en
viro
nm
ent
• P
ress
ure
ulc
ers
(sta
ges
2-4
)
• D
erm
al u
lcer
s
• B
urn
s:
1st ,
2n
d d
egre
e
• P
arti
al-,
full-
thic
kn
ess
wo
un
ds
• In
fect
ed, n
on
-in
fect
ed w
oun
ds
• A
llerg
ic t
o A
cem
ann
an
Hyd
roge
l/ o
ther
co
mp
on
ents
10
Car
rSm
art
Gel
w
oun
d d
ress
ing
wit
h
Ace
man
nan
H
ydro
gels
Tub
e C
arri
ngt
on
L
abo
rato
ries
, In
c.
Mai
nta
ins
mo
ist
wo
un
d h
ealin
g en
viro
nm
ent
(pro
vid
es m
ois
t to
dry
wo
un
ds
& a
bso
rbs
mo
ist
fro
m w
et w
oun
ds)
C
ove
r an
d p
rote
ct w
oun
ds,
th
eref
ore
↓ p
ain
b
y co
olin
g ef
fect
• P
ress
ure
ulc
ers
(sta
ges
1-4
)
• B
urn
s:
1st ,
2n
d d
egre
e
• F
oo
t ulc
ers
• Sta
sis
ulc
ers
• A
llerg
ic t
o A
cem
ann
an
Hyd
roge
l/ o
ther
co
mp
on
ents

240
Tab
le 1
8. C
on
tin
ue
…
Hydro
gel Pro
duct
Entry
Nam
e
Desc
ription
Manufactu
rers
M
anagem
ent of action
Indication
Contrain
dications
11
Car
rasy
n G
el w
oun
d
dre
ssin
g w
ith
A
cem
ann
an
Hyd
roge
ls
C
arra
syn
Sp
ray
Gel
w
oun
d d
ress
ing
wit
h
Ace
man
nan
H
ydro
gels
Car
rasy
n V
wit
h
Ace
man
nan
H
ydro
gels
Tub
e
Bo
ttle
Tub
e
Car
rin
gto
n
Lab
ora
tori
es, I
nc.
A
ll p
rod
uct
s:
Mai
nta
ins
mo
ist
wo
un
d h
ealin
g en
viro
nm
ent
En
able
s au
toly
tic
deb
rid
emen
t
All
pro
duct
s ar
e use
d t
o t
reat
:
• P
ress
ure
ulc
ers
(sta
ges
2-4
)
• V
eno
us
stas
is u
lcer
s
• B
urn
s:
1st ,
2n
d d
egre
e
• P
arti
al-,
full-
thic
kn
ess
wo
un
ds
• In
fect
ed, n
on
-in
fect
ed w
oun
ds
Car
rasy
n G
el w
oun
d d
ress
ing,
C
arra
syn
V:
• D
iab
etic
ulc
er
• F
oo
t ulc
ers
• P
ost
surg
ical
in
cisi
on
s
• A
llerg
ic t
o:
alo
e ve
ra/
Ace
man
nan
h
ydro
gel
12
Co
mfo
rt-A
id
Sh
eet
wit
h
adh
esiv
e b
ord
er
(glt
ceri
n c
on
ten
t)
So
uth
wes
t T
ech
no
logi
es,
Inc.
En
able
s co
ol an
d s
oo
thin
g ef
fect
P
reve
nts
dry
ing
out
Bac
teri
ost
atic
& f
un
gist
atic
• Surg
ical
in
cisi
on
s
• F
oo
t ulc
ers
• L
eg u
lcer
s
• P
ress
ure
ulc
ers
(sta
ges
2-4
)
• B
urn
s:
1st ,
2n
d d
egre
e
• P
arti
al-,
full-
thic
kn
ess
wo
un
ds
• In
fect
ed, n
on
-in
fect
ed w
oun
ds
• H
igh
ly e
xud
ing
wo
un
ds
• O
ther
ab
sorb
ent
mat
eria
ls
13
Cura
fil G
el w
oun
d
dre
ssin
g &
im
pre
gnat
ed s
trip
s
Tub
e
Imp
regn
ated
pad
Ken
dal
l H
ealt
h
Car
e P
rod
uct
s C
om
pan
y
Mai
nta
ins
mo
ist
wo
un
d h
ealin
g en
viro
nm
ent
Aid
gra
nula
tio
n, e
pit
hel
ialis
atio
n
En
able
s au
toly
tic
deb
rid
emen
t
• P
ress
ure
ulc
ers
(sta
ges
2-4
)
• P
arti
al-,
full-
thic
kn
ess
wo
un
ds
• N
on
e sp
ecif
ied
14
Cura
gel
Dre
ssin
g K
end
all H
ealt
h
Car
e P
rod
uct
s C
om
pan
y
Cle
ar g
el e
nab
les
hyd
rati
on
M
anag
e fl
uid
s •
Der
mal
ulc
ers
(sta
ges
1-3)
• D
iab
etic
leg
ulc
ers
• B
urn
s:
1st ,
2n
d d
egre
e
• P
arti
al-,
full-
thic
kn
ess
wo
un
ds
• H
igh
ly e
xud
ing
wo
un
ds

241
Tab
le 1
8. C
on
tin
ue
…
Hydro
gel Pro
duct
Entry
Nam
e
Desc
ription
Manufactu
rers
M
anagem
ent of action
Indication
Contrain
dications
15
Cura
sol ge
l w
oun
d
dre
ssin
g T
ub
e P
ad
Hea
lth
po
int
Mai
nta
ins
mo
ist
wo
un
d h
ealin
g en
viro
nm
ent
Pro
tect
s w
oun
d f
rom
fo
reig
n c
on
tam
inat
ion
•
Surg
ical
in
cisi
on
s
• F
oo
t ulc
ers
• D
iab
etic
ulc
ers
• P
ress
ure
ulc
ers
(sta
ges
1-4
)
• Sta
sis
ulc
ers
• B
urn
s:
1st ,
2n
d d
egre
e
• N
on
e sp
ecif
ied
16
Der
maG
el H
ydro
gel
Sh
eet
Sh
eet
Med
line
Ind
ust
ries
, In
c.
Mai
nta
ins
mo
ist
wo
un
d h
ealin
g en
viro
nm
ent
Ab
sorb
s ex
ud
ates
~ 5
x o
wn
wei
ght
Bac
teri
ost
atic
&
fun
gist
atic
• L
eg u
lcer
s
• P
ress
ure
ulc
ers
(sta
ges
1-4
)
• P
arti
al-,
full-
thic
kn
ess
wo
un
ds
• H
igh
ly e
xud
ing
wo
un
ds
17
Der
mag
ram
H
ydro
ph
ilic
Wo
un
d
Dre
ssin
g
Tub
e Im
pre
gnat
ed g
auze
D
erm
a Sci
ence
s,
Inc.
P
rim
ary
cover
or
fille
r A
bso
rb e
xud
ates
(m
ild)
Mai
nta
ins
an a
cid
ic (
mild
) en
viro
nm
ent
• Surg
ical
in
cisi
on
s
• P
arti
al-,
full-
thic
kn
ess
wo
un
ds
• D
iab
etic
ulc
ers
• P
ress
ure
ulc
ers
(sta
ges
1-4
)
• V
eno
us
stas
is u
lcer
s
• B
urn
s:
Par
tial
-th
ickn
ess
• N
on
e sp
ecif
ied
18
Der
mag
ran
Zin
c-Sal
ine
Hyd
roge
l T
ub
e D
erm
a Sci
ence
s,
Inc.
P
rim
ary
cover
or
fille
r M
ain
tain
s m
ois
t fo
r h
ealin
g gr
anula
tio
n t
issu
e
• Surg
ical
in
cisi
on
s
• P
ress
ure
ulc
ers
(sta
ges
1-4
)
• V
eno
us
stas
is u
lcer
s
• B
urn
s:
Par
tial
-th
ickn
ess
ther
mal
b
urn
s
• N
on
e sp
ecif
ied
19
Der
maS
yn
D
erm
aGau
ze
Tub
e/Sp
ray
Ste
rile
pad
Der
maR
ite
ind
ust
ries
P
rim
ary
cover
or
fille
r M
ain
tain
s m
ois
t w
oun
d h
ealin
g en
viro
nm
ent
Fill
ing
dea
d s
pac
e o
f si
nus
trac
ts
Man
age
dee
p w
oun
ds
• P
ress
ure
ulc
ers
• V
eno
us
ulc
ers
• D
iab
etic
ulc
ers
• A
rter
ial ulc
ers
• 3r
d d
egre
e b
urn
s
20
Dia
B G
el w
ith
A
cem
ann
an
Hyd
roge
l
Tub
e C
arri
ngt
on
L
abo
rato
ries
, In
c.
• N
on
-oily
pre
par
atio
n f
or
dia
bet
ic f
oo
t ulc
ers
• D
iab
etic
fo
ot
ulc
ers
• A
llerg
ic t
o:
- A
cem
ann
an H
ydro
gel
• o
ther
co
mp
on
ents
of
pro
duct
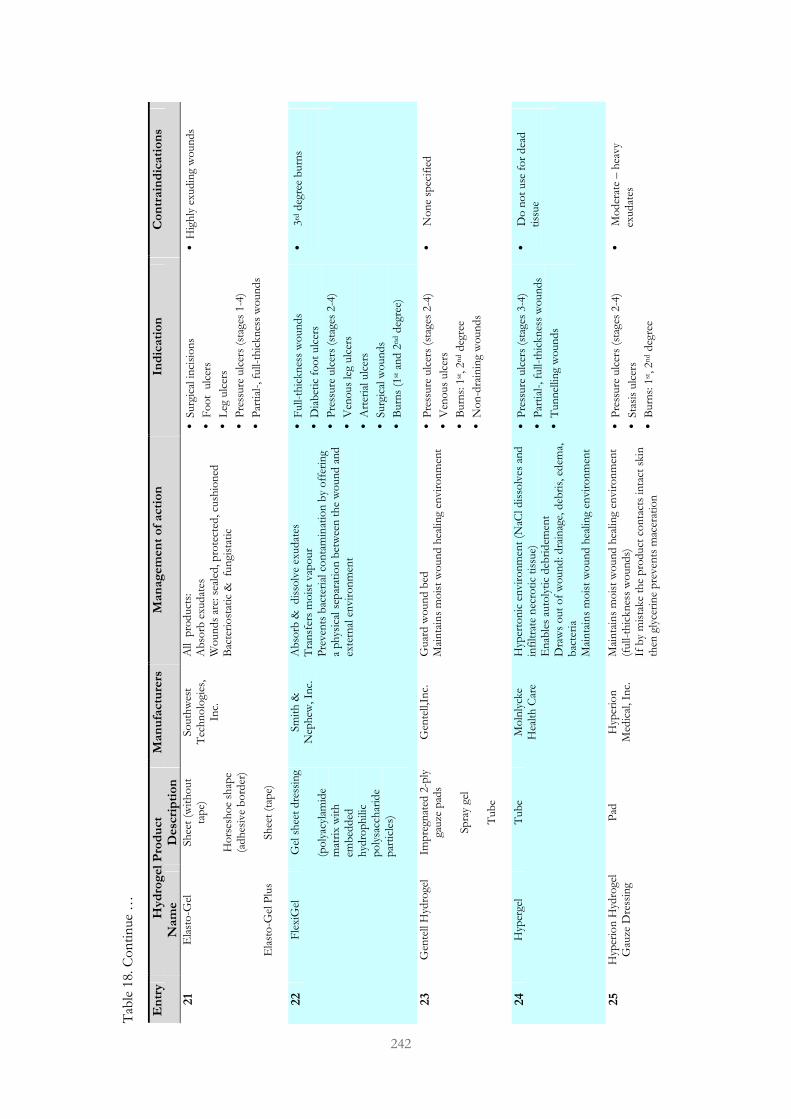
242
Tab
le 1
8. C
on
tin
ue
…
Hydro
gel Pro
duct
Entry
Nam
e
Desc
ription
Manufactu
rers
M
anagem
ent of action
Indication
Contrain
dications
21
Ela
sto
-Gel
Ela
sto
-Gel
Plu
s
Sh
eet
(wit
ho
ut
tap
e)
H
ors
esh
oe
shap
e (a
dh
esiv
e b
ord
er)
Sh
eet
(tap
e)
So
uth
wes
t T
ech
no
logi
es,
Inc.
All
pro
duct
s:
Ab
sorb
exu
dat
es
Wo
un
ds
are:
sea
led
, pro
tect
ed, c
ush
ion
ed
Bac
teri
ost
atic
&
fun
gist
atic
• Surg
ical
in
cisi
on
s
• F
oo
t u
lcer
s
• L
eg u
lcer
s
• P
ress
ure
ulc
ers
(sta
ges
1-4
)
• P
arti
al-,
full-
thic
kn
ess
wo
un
ds
• H
igh
ly e
xud
ing
wo
un
ds
22
Fle
xiG
el
Gel
sh
eet
dre
ssin
g
(po
lyac
ylam
ide
mat
rix
wit
h
emb
edd
ed
hyd
rop
hili
c p
oly
sacc
har
ide
par
ticl
es)
Sm
ith
&
Nep
hew
, In
c.
Ab
sorb
&
dis
solv
e ex
ud
ates
T
ran
sfer
s m
ois
t vap
our
Pre
ven
ts b
acte
rial
co
nta
min
atio
n b
y o
ffer
ing
a p
hys
ical
sep
arat
ion
bet
wee
n t
he
wo
un
d a
nd
ex
tern
al e
nvi
ron
men
t
• F
ull-
thic
kn
ess
wo
un
ds
• D
iab
etic
fo
ot
ulc
ers
• P
ress
ure
ulc
ers
(sta
ges
2-4
)
• V
eno
us
leg
ulc
ers
• A
rter
ial ulc
ers
• Surg
ical
wo
un
ds
• B
urn
s (1
st a
nd
2n
d d
egre
e)
• 3r
d d
egre
e b
urn
s
23
Gen
tell
Hyd
roge
l Im
pre
gnat
ed 2
-ply
ga
uze
pad
s
Sp
ray
gel
T
ub
e
Gen
tell,
Inc.
G
uar
d w
oun
d b
ed
Mai
nta
ins
mo
ist
wo
un
d h
ealin
g en
viro
nm
ent
• P
ress
ure
ulc
ers
(sta
ges
2-4
)
• V
eno
us
ulc
ers
• B
urn
s: 1
st, 2
nd d
egre
e
• N
on
-dra
inin
g w
oun
ds
• N
on
e sp
ecif
ied
24
Hyp
erge
l T
ub
e M
oln
lyck
e H
ealt
h C
are
Hyp
erto
nic
en
viro
nm
ent
(NaC
l d
isso
lves
an
d
infi
ltra
te n
ecro
tic
tiss
ue)
E
nab
les
auto
lyti
c d
ebri
dem
ent
Dra
ws
out
of
wo
un
d: d
rain
age,
deb
ris,
ed
ema,
b
acte
ria
Mai
nta
ins
mo
ist
wo
un
d h
ealin
g en
viro
nm
ent
• P
ress
ure
ulc
ers
(sta
ges
3-4
)
• P
arti
al-,
full-
thic
kn
ess
wo
un
ds
• T
un
nel
ling
wo
un
ds
• D
o n
ot
use
fo
r d
ead
ti
ssue
25
Hyp
erio
n H
ydro
gel
Gau
ze D
ress
ing
Pad
H
yper
ion
M
edic
al, I
nc.
M
ain
tain
s m
ois
t w
oun
d h
ealin
g en
viro
nm
ent
(full-
thic
kn
ess
wo
un
ds)
If
by
mis
take
th
e p
rod
uct
co
nta
cts
inta
ct s
kin
th
en g
lyce
rin
e p
reve
nts
mac
erat
ion
• P
ress
ure
ulc
ers
(sta
ges
2-4
)
• Sta
sis
ulc
ers
• B
urn
s: 1
st, 2
nd d
egre
e
• M
od
erat
e –
hea
vy
exud
ates

243
Tab
le 1
8. C
on
tin
ue
…
Hydro
gel Pro
duct
Entry
Nam
e
Desc
ription
Manufactu
rers
M
anagem
ent of action
Indication
Contrain
dications
26
Hyp
erio
n
Hyd
rop
hill
ic
Wo
un
d G
el
H
yper
ion
H
ydro
ph
ilic
Wo
un
d
Dre
ssin
g
Tub
e
Imp
regn
ated
gau
ze
Hyp
erio
n
Med
ical
, In
c.
Bo
th p
rod
uct
s:
Mai
nta
ins
mo
ist
wo
un
d h
ealin
g en
viro
nm
ent
by
hyd
rate
wo
un
d b
ed
En
able
osm
oti
c gr
adie
nt
• P
ress
ure
ulc
ers
(sta
ges
2-4
)
• Sta
sis
ulc
ers
• B
urn
s: 1
st, 2
nd d
egre
e
• M
od
erat
e –
hea
vy
exud
ates
27
Lam
in H
ydra
tin
g G
el
Tub
e B
ard
Med
ical
D
ivis
ion
C
.R.B
ard
, In
c.
Mai
nta
ins
mo
ist
envi
ron
men
t fo
r w
oun
ds/
burn
s •
Pre
ssure
ulc
ers
(sta
ges
1-4
)
• P
arti
al-,
full-
thic
kn
ess
wo
un
ds
• D
iab
etic
ulc
ers
• Sta
sis
ulc
ers
• B
urn
s: 1
st, 2
nd d
egre
e
• A
rter
ial ulc
ers
• P
ost
op
erat
ive
inci
sio
ns
• 3r
d d
egre
e b
urn
s
28
Intr
aSit
e G
el
Ap
plip
aks
(w
ater
, ca
rbo
xym
eth
ylce
llose
p
oly
mer
, so
diu
m a
nd
p
rop
ylen
e gl
yco
l)
Sm
ith
&
Nep
hew
, In
c.
Hyd
rate
s: g
ran
ula
tio
n t
issu
e R
ehyd
rate
s: d
ry e
sch
ar, s
lough
D
isso
lve
nec
roti
c ti
ssue
to liq
uid
A
id a
uto
lysi
s M
ain
tain
s m
ois
t w
oun
d h
ealin
g en
viro
nm
ent
• P
ress
ure
ulc
ers
(sta
ges
2-4
)
• P
arti
al-,
full-
thic
kn
ess
wo
un
ds
• T
un
nel
ling
wo
un
ds
• 3r
d d
egre
e b
urn
s
29
MP
M E
xcel
Gel
MP
M H
ydro
gel
Tub
e
Tub
e
MP
M M
edic
al,
Inc.
M
ain
tain
s m
ois
t w
oun
d h
ealin
g en
viro
nm
ent
E
nab
les
auto
lyti
c d
ebri
dem
ent
• P
ress
ure
ulc
ers
(sta
ges
2-4
)
• V
eno
us
stas
is u
lcer
s
• B
urn
s: 1
st, 2
nd d
egre
e
• P
arti
al-,
full-
thic
kn
ess
wo
un
ds
• D
o n
ot
use
fo
r d
rain
ing
wo
un
ds
30
MP
M G
elP
ad
Hyd
roge
l Sat
ura
ted
D
ress
ing
Ste
rile
Pad
M
PM
Med
ical
, In
c.
Pri
mar
y co
ver
M
ain
tain
s m
ois
t w
oun
d h
ealin
g en
viro
nm
ent
E
nab
les
auto
lyti
c d
ebri
dem
ent
• P
ress
ure
ulc
ers
(sta
ges
1-4
)
• B
urn
s: 1
st, 2
nd d
egre
e
• P
arti
al-,
full-
thic
kn
ess
wo
un
ds
• D
o n
ot
use
fo
r d
rain
ing
wo
un
ds
31
MP
M R
egen
ecar
e T
ub
e M
PM
Med
ical
, In
c.
Mai
nta
ins
mo
ist
wo
un
d h
ealin
g en
viro
nm
ent
E
nab
les
auto
lyti
c d
ebri
dem
ent
• P
ress
ure
ulc
ers
(sta
ges
2-4
)
• V
eno
us
stas
is u
lcer
s
• B
urn
s: 1
st, 2
nd d
egre
e
• P
arti
al-,
full-
thic
kn
ess
wo
un
ds
• N
on
e sp
ecif
ied

244
Tab
le 1
8. C
on
tin
ue
…
Hydro
gel Pro
duct
Entry
Nam
e
Desc
ription
Manufactu
rers
M
anagem
ent of action
Indication
Contrain
dications
32
No
rmlg
el
Ste
rile
tub
e M
őln
lyck
e H
ealt
h C
are
Mai
nta
ins
mo
ist
wo
un
d h
ealin
g en
viro
nm
ent
• P
ress
ure
ulc
ers
(sta
ges
2-4
)
• P
arti
al-,
full-
thic
kn
ess
wo
un
ds
• In
fect
ed w
oun
ds
33
NU
-GE
L
Tub
e
(co
nta
ins
wat
er,
carb
oxy
met
hyl
cello
se
po
lym
er, so
diu
m
algi
nat
e an
d p
rop
ylen
e gl
yco
l)
Joh
nso
n &
Jo
hn
son
, In
c.
Mai
nta
ins
mo
ist
wo
un
d h
ealin
g en
viro
nm
ent
E
nab
les
auto
lyti
c d
ebri
dem
ent
• P
ress
ure
ulc
ers
(sta
ges
2-4
)
• V
eno
us
stas
is u
lcer
s
• B
urn
s: 1
st, 2
nd d
egre
e
• P
arti
al-,
full-
thic
kn
ess
wo
un
ds
• 3r
d d
egre
e b
urn
s
34
Pan
oP
lex
Hyd
roge
l W
oun
d D
ress
ing
P
ano
Gau
ze N
on
W
ove
n H
ydro
gel
Dre
ssin
g
Syr
inge
/T
ub
e
Imp
regn
ated
Gau
ze P
ad
Sag
e P
har
mac
euti
cals
B
oth
pro
duct
s:
Mai
nta
ins
mo
ist
wo
un
d h
ealin
g en
viro
nm
ent
C
ove
r w
oun
d t
her
efo
re p
reven
t fo
reig
n
mat
eria
l en
teri
ng
wo
un
d a
rea
• P
ress
ure
ulc
ers
(sta
ges
1-4
)
• D
erm
al u
lcer
s
• B
urn
s: 1
st, 2
nd d
egre
e
• P
arti
al-,
full-
thic
kn
ess
wo
un
ds
• P
ost
-op
erat
ive
inci
sio
ns
• N
on
e sp
ecif
ied
35
Ph
yto
Der
ma
Wo
un
d G
el
Squee
ze B
ott
le
Alo
e L
ife
Inte
rnat
ion
al
Aid
hea
ling
by
mo
ist
and
aci
dic
en
viro
nm
ents
•
Pre
ssure
ulc
ers
(sta
ges
1-4
)
• N
on
e sp
ecif
ied
36
Puri
lon
Gel
A
cco
rdio
n P
ack
(co
nta
ins
wat
er,
carb
oxy
met
hyl
cellu
lose
an
d c
alci
um
alg
inat
e)
Co
lop
last
C
orp
ora
tio
n
En
able
s au
toly
tic
deb
rid
emen
t o
f n
ecro
tic
tiss
ue
• P
ress
ure
ulc
ers
(sta
ges
1-4
)
• L
eg u
lcer
s
• 3r
d d
egre
e b
urn
s
37
Res
tore
Hyd
roge
l D
ress
ing
Am
orp
ho
us
tub
e/
imp
rega
nat
ed g
auze
sp
on
ge/
im
pre
gnat
ed g
auze
p
acki
ng
stri
p
Ho
llist
er
Inco
rpo
rate
d
Mai
nta
ins
mo
ist
wo
un
d h
ealin
g en
viro
nm
ent
F
illin
g d
ead
sp
ace
of
sin
us
trac
ts
Man
age
dee
p w
oun
ds
• P
ress
ure
ulc
ers
(sta
ges
2-4
)
• A
rter
ial st
asis
ulc
ers
• B
urn
s: 1
st, 2
nd d
egre
e
• N
on
e sp
ecif
ied
38
SA
F-G
el H
ydra
tin
g D
erm
al W
oun
d
Dre
ssin
g
Tub
e (a
lgin
ate-
con
tain
ing)
C
on
vaT
ec
Mai
nta
ins
max
imum
mo
ist
envi
ron
men
t
•
Pre
ssure
ulc
ers
(sta
ges
1-4
)
• Sta
sis
ulc
ers
• B
urn
s: 1
st, 2
nd d
egre
e
• N
on
e sp
ecif
ied

245
Tab
le 1
8. C
on
tin
ue
…
Hydro
gel Pro
duct
Entry
Nam
e
Desc
ription
Manufactu
rers
M
anagem
ent of action
Indication
Contrain
dications
39
Ski
nte
grit
y A
mo
rph
ous
Hyd
roge
l
Ski
nte
grit
y H
ydro
gel
Imp
regn
ated
Gau
ze
Bel
low
s b
ott
le/
T
ub
e/
Imp
regn
ated
gau
ze
Med
line
Ind
ust
ries
, In
c.
Mai
nta
ins
mo
ist
envi
ron
men
t
•
Pre
ssure
ulc
ers
(sta
ges
2-4
)
• V
eno
us
stas
is u
lcer
s
• B
urn
s: 1
st, 2
nd d
egre
e
• P
arti
al-,
full-
thic
kn
ess
wo
un
ds
• P
ost
-op
erat
ive
inci
sio
ns
• H
yper
sen
siti
ve
to
pro
duct
40
So
loSit
e W
oun
d G
el
So
loSit
e G
el
Co
nfo
rmab
le
Wo
un
d D
ress
ing
Tub
e/
Push
-butt
on
ap
plic
ato
rs
G
el p
ad
Sm
ith
&
Nep
hew
, In
c.
.
Hyd
rate
s: g
ran
ula
tio
n t
issu
e R
ehyd
rate
s: d
ry e
sch
ar, s
lough
A
dd
itio
n o
f p
rese
rvat
ives
in
hib
it b
acte
rial
gr
ow
th
Ab
sorb
exc
ess
exud
ate
En
able
s au
toly
tic
deb
rid
emen
t M
ain
tain
s m
ois
t w
oun
d h
ealin
g en
viro
nm
ent
• P
arti
al-,
full-
thic
kn
ess
wo
un
ds
chro
nic
wo
un
ds:
• P
ress
ure
ulc
ers
• V
eno
us
leg
ulc
ers
• 3r
d d
egre
e b
urn
s
41
Ten
der
Wet
Gel
Pad
P
ad
Med
line
Ind
ust
ries
, In
c.
Mult
i-la
yer
gel,
wit
h a
co
re a
bso
rben
t.
Hyd
rop
ho
bic
co
veri
ng
laye
r al
low
s w
oun
d
exud
ates
to
pen
etra
te g
el w
ith
out
adh
erin
g to
th
e w
oun
d.
Mai
nta
ins
mo
ist
wo
un
d e
nvi
ron
men
t d
ue
to
the
Ten
der
Wet
(R
inge
r’s)
so
luti
on
.
En
able
s au
toly
tic
deb
rid
emen
t (e
rad
icat
e n
ecro
tic
tiss
ue
and
deb
ris)
• P
arti
al-,
full-
thic
kn
ess
wo
un
ds
• P
ress
ure
ulc
ers
(sta
ges
2-4
)
• V
eno
us
ulc
ers
• A
rter
ial ulc
ers
• D
iab
etic
ulc
ers
• B
urn
s: 1
st, 2
nd d
egre
e
• 3r
d d
egre
e b
urn
s
42
3M T
egag
el
Hyd
roge
l W
oun
d
Fill
ers
Pad
/T
ub
e 3M
Hea
lth
Car
e E
nab
les
auto
lyti
c d
ebri
dem
ent
(hyd
rati
ng
dea
d t
issu
e)
Fill
s d
ead
sp
ace
of
thic
knes
s w
oun
ds
• P
arti
al-,
th
ickn
ess
der
mal
w
oun
ds:
• P
ress
ure
ulc
ers
• V
eno
us
ulc
ers
(in
suff
icie
ncy
)
• A
rter
ial ulc
ers
• D
iab
etic
ulc
ers
• B
urn
s: 1
st, 2
nd d
egre
e
• P
ost
-surg
ical
in
cisi
on
s
• 3r
d d
egre
e b
urn
s
• A
llerg
ic t
o p
rod
uct
in
gred
ien
t

246
Tab
le 1
8. C
on
tin
ue
…
Hydro
gel Pro
duct
Entry
Nam
e
Desc
ription
Manufactu
rers
M
anagem
ent of action
Indication
Contrain
dications
43
Ult
rex
Gel
Wo
un
d
Dre
ssin
g w
ith
A
cem
ann
an
Hyd
roge
l
Tub
e (c
on
tain
s A
cem
ann
an
Hyd
roge
l)
Car
rin
gto
n
Lab
ora
tori
es, I
nc.
M
ain
tain
s m
ois
t w
oun
d h
ealin
g en
viro
nm
ent
• P
ress
ure
ulc
ers
(sta
ges
1-4
)
• Sta
sis
ulc
ers
• F
oo
t ulc
ers
• B
urn
s: 1
st, 2
nd d
egre
e
• P
ost
-surg
ical
in
cisi
on
s
• A
llerg
ic t
o:
- A
cem
ann
an H
ydro
gel
- o
ther
co
mp
on
ents
of
pro
duct
44
WO
UN
’DR
ES
Co
llage
n H
ydro
gel
Tub
e C
olo
pla
st
Co
rpo
rati
on
M
ain
tain
s m
ois
t w
oun
d e
nvi
ron
men
t G
ives
pro
tect
ion
to
gra
nula
tio
n t
issu
e E
nab
les
auto
lyti
c d
ebri
dem
ent
• P
ress
ure
ulc
ers
(sta
ges
2-4
)
• V
eno
us
stas
is u
lcer
s
• P
arti
al-,
th
ickn
ess
wo
un
ds
• B
urn
s: 1
st, 2
nd d
egre
e
• 3r
d d
egre
e b
urn
s
45
Wo
un
d D
ress
ing
wit
h C
lear
Sit
e
Ban
dag
e R
oll
wit
h
Cle
arSit
e
Bo
rder
ed
dre
ssin
g/
Bo
rder
less
d
ress
ing/
Is
lan
d d
ress
ing
B
and
age
roll
CO
NM
ED
C
orp
ora
tio
n
Bo
th p
rod
uct
s:
Mai
nta
ins
mo
ist
wo
un
d h
ealin
g en
viro
nm
ent
• P
arti
al-,
th
ickn
ess
wo
un
ds
• D
erm
al leg
ulc
ers
• P
ress
ure
ulc
ers
(sta
ges
1-4
)
• V
eno
us
stas
is u
lcer
• B
urn
s: 1
st, 2
nd d
egre
e
• In
fect
ed w
oun
ds
• 3r
d d
egre
e b
urn
s
(Ta
ilore
d f
rom
: H
ess
200
2; T
hom
as
and
An
dre
ws
1999
; Jo
nes
and
Vau
ghan
200
5)

247
AAPPPPEENNDDIIXX IIIIII
SSuupppplleemmeennttaarryy II nnffoorrmmaattiioonn

248
Ring-effect:
From the cross-sectional images obtained from TPM, the diffusion of an enzyme into
PEGA particles can be monitored from the outer surface into the central-core of PEGA
particles by observing a ‘ring-effect’ as schematically illustrated by figure 67.
Figure 67. Diffusion of an enzyme into PEGA particles via a ‘ring-effect’. When unmodified PEGA particles are stained by dansyl chloride they fluoresce blue (1), coupling of an ECP (2) generates functionalised PEGA particles (3) which are viewed as a black image via TPM (3). After the functionalised particles are treated with an enzyme at various time points (4) the cleaving of the ECP exposes free NH2 groups (blue) over the course of time, generating a ring-effect (5) which thickens inwards as the enzyme diffuses into the particles and cleaves the ECPs from within the PEGA particles until the entire ECP is cleaved from the inner-central core of PEGA particles.
(1)
(2)
(3)
(4)
(5)

249
Figure 68. Separation of elastase by SDS-page via 1-D electrophoresis. Lane 1: standards of known molecular weight. Lane 2: separation of elastase (PPE) gave 2 bands with a molecular weight of 31.35 kDa (top band: inactive PPE) and 25.95 kDa (bottom band: active PPE).
250 kDa
150 kDa
100 kDa
75 kDa
50 kDa
37 kDa
25 kDa
20 kDa
15 kDa
10 kDa
PPE (inactive)
PPE (active)
Lane 1 Lane 2