Identification of Genetic Susceptibility Loci for Colorectal Tumors in a Genome-Wide Meta-analysis
33
Identification of Genetic Susceptibility Loci for Colorectal Tumors in a Genome-Wide Meta-analysis ULRIKE PETERS, 1,2, * SHUO JIAO, 1, * FREDRICK R. SCHUMACHER, 3, * CAROLYN M. HUTTER, 1,2, * AARON K. ARAGAKI, 1 JOHN A. BARON, 4 SONJA I. BERNDT, 5 STÉPHANE BÉZIEAU, 6 HERMANN BRENNER, 7 KATJA BUTTERBACH, 7 BETTE J. CAAN, 8 PETER T. CAMPBELL, 9 CHRISTOPHER S. CARLSON, 1,2 GRAHAM CASEY, 3 ANDREW T. CHAN, 10,11 JENNY CHANG–CLAUDE, 12 STEPHEN J. CHANOCK, 5 LIN S. CHEN, 13 GERHARD A. COETZEE, 3 SIMON G. COETZEE, 3 DAVID V. CONTI, 3 KEITH R. CURTIS, 1 DAVID DUGGAN, 14 TODD EDWARDS, 15 CHARLES S. FUCHS, 11,16 STEVEN GALLINGER, 17 EDWARD L. GIOVANNUCCI, 11,18 STEPHANIE M. GOGARTEN, 19 STEPHEN B. GRUBER, 3 ROBERT W. HAILE, 3 TABITHA A. HARRISON, 1 RICHARD B. HAYES, 20 BRIAN E. HENDERSON, 3 MICHAEL HOFFMEISTER, 7 JOHN L. HOPPER, 21 THOMAS J. HUDSON, 22,23 DAVID J. HUNTER, 18 REBECCA D. JACKSON, 24 SUN HA JEE, 25 MARK A. JENKINS, 21 WEI–HUA JIA, 26 LAURENCE N. KOLONEL, 27 CHARLES KOOPERBERG, 1 SÉBASTIEN KÜRY, 6 ANDREA Z. LACROIX, 1 CATHY C. LAURIE, 19 CECELIA A. LAURIE, 19 LOIC LE MARCHAND, 27 MATHIEU LEMIRE, 22 DAVID LEVINE, 19 NORALANE M. LINDOR, 28 YAN LIU, 29 JING MA, 11 KAREN W. MAKAR, 1 KEITARO MATSUO, 30 POLLY A. NEWCOMB, 1,2 JOHN D. POTTER, 1,31 ROSS L. PRENTICE, 1 CONGHUI QU, 1 THOMAS ROHAN, 32 STEPHANIE A. ROSSE, 1,2 ROBERT E. SCHOEN, 33 DANIELA SEMINARA, 34 MARTHA SHRUBSOLE, 15 XIAO–OU SHU, 15 MARTHA L. SLATTERY, 35 DARIN TAVERNA, 14 STEPHEN N. THIBODEAU, 36 CORNELIA M. ULRICH, 1,2,37 EMILY WHITE, 1,2 YONGBING XIANG, 38 BRENT W. ZANKE, 39 YI–XIN ZENG, 26 BEN ZHANG, 15 WEI ZHENG, 40 and LI HSU, 1 on behalf of the Colon Cancer Family Registry and the Genetics and Epidemiology of Colorectal Cancer Consortium 1 Public Health Sciences Division, Fred Hutchinson Cancer Research Center, Seattle, Washington; 19 Department of Biostatistics, 2 School of Public Health, University of Washington, Seattle, Washington; 3 Keck School of Medicine, University of Southern California, Los Angeles, California; 4 Department of Medicine, School of Medicine, University of North Carolina, Chapel Hill, North Carolina; 5 Division of Cancer Epidemiology and Genetics, 34 Division of Cancer Control and Population Sciences, National Cancer Institute, Bethesda, Maryland; 6 Service de Génétique Médicale, CHU Nantes, Nantes, France; 7 Division of Clinical Epidemiology and Aging Research, 12 Division of Cancer Epidemiology, German Cancer Research Center, Heidelberg, Germany; 8 Division of Research, Kaiser Permanente Medical Care Program, Oakland, California; 9 American Cancer Society, Atlanta, Georgia; 10 Division of Gastroenterology, Massachusetts General Hospital and Harvard Medical School, Boston, Massachusetts; 11 Channing Division of Network Medicine, Brigham and Women’s Hospital and Harvard Medical School, Boston, Massachusetts; 13 Department of Health Studies, University of Chicago, Chicago, Illinois; 14 Translational Genomics Research Institute, Phoenix, Arizona; 15 Department of Medicine, Vanderbilt University School of Medicine, Nashville, Tennessee; 16 Department of Medical Oncology, Dana Farber Cancer Institute, Boston, Massachusetts; 17 Department of Surgery, Toronto General Hospital, Toronto, Ontario, Canada; 18 School of Public Health, Harvard University, Boston, Massachusetts; 20 Division of Epidemiology, New York University School of Medicine, New York, New York; 21 Melborne School of Population Health, University of Melbourne, Melbourne, Victoria, Australia; 22 Ontario Institute for Cancer Research, Toronto, Ontario, Canada; 23 Departments of Medical Biophysics and Molecular Genetics, University of Toronto, Toronto, Ontario, Canada; 24 Division of Endocrinology, Diabetes, and Metabolism, Ohio State University, Columbus, Ohio; 25 Institute for Health Promotion, Yonsei University, Seoul, Korea; 26 Cancer Center, Sun Yat-sen University, Guangzhou, China; 27 Epidemiology Program, University of Hawaii Cancer Center, Honolulu, Hawaii; 28 Department of Health Sciences Research, Mayo Clinic, Scottsdale, Arizona; 29 Stephens and Associates, Carrollton, Texas; 30 Division of Epidemiology and Prevention, Aichi Cancer Center Research Institute, Nagoya, Japan; 31 Centre for Public Health Research, Massey University, Wellington, New Zealand; 32 Department of Epidemiology and Population Health, Albert Einstein College of Medicine, Bronx, New York; 33 Department of Epidemiology, University of Pittsburgh Medical Center, Pittsburgh, Pennsylvania; 35 Department of Internal Medicine, University of Utah Health Sciences Center, Salt Lake City, Utah; 36 Departments of Laboratory Medicine and Pathology and Laboratory Genetics, Mayo Clinic, Rochester, Minnesota; 37 Division of Preventive Oncology, National Center for Tumor Diseases and German Cancer Research Center, Heidelberg, Germany; 38 Department of Epidemiology, Shanghai Cancer Institute, Shanghai, China; 39 Division of Hematology, Faculty of Medicine, The University of Ottawa, Ottawa, Ontario, Canada; and 40 Department of Medicine, Vanderbilt Epidemiology Center, Vanderbilt University School of Medicine, Nashville, Tennessee See Covering the Cover synopsis on page 665. BACKGROUND & AIMS: Heritable factors contribute to the development of colorectal cancer. Identifying the genetic loci associated with colorectal tumor formation could elucidate the mechanisms of pathogenesis. METH- ODS: We conducted a genome-wide association study that included 14 studies, 12,696 cases of colorectal tu- mors (11,870 cancer, 826 adenoma), and 15,113 controls of European descent. The 10 most statistically significant, previously unreported findings were followed up in 6 studies; these included 3056 colorectal tumor cases (2098 cancer, 958 adenoma) and 6658 controls of European and Asian descent. RESULTS: Based on the combined analy- sis, we identified a locus that reached the conventional genome-wide significance level at less than 5.0 10 8 : an intergenic region on chromosome 2q32.3, close to nucleic acid binding protein 1 (most significant single nucleotide polymorphism: rs11903757; odds ratio [OR], 1.15 per risk allele; P 3.7 10 8 ). We also found evidence for 3 additional loci with P values less than 5.0 10 7 : a locus within the laminin gamma 1 gene on chromosome 1q25.3 (rs10911251; OR, 1.10 per risk allele; P 9.5 10 8 ), a * Authors share co-first authorship. Abbreviations used in this paper: CCFR, Colon Cancer Family Registry; CCND, cyclin D2; CEU, Utah residents with Northern and Western European ancestry from the CEPH collection; CEPH, Centre d’etude du polymor- phisme humain; GECCO, Genetics and Epidemiology of Colorectal Cancer Consortium; GWAS, genome-wide association study; HWE, Hardy Wein- berg Equilibrium; LAMC1, laminin gamma 1; MAF, minor allele frequency; NABP1, nucleic acid binding protein 1; ORs, odds ratios; QC, quality control; SNP, single nucleotide polymorphism; TBX3, T-box 3. © 2013 by the AGA Institute 0016-5085/$36.00 http://dx.doi.org/10.1053/j.gastro.2012.12.020 BASIC AND TRANSLATIONAL AT GASTROENTEROLOGY 2013;144:799 – 807
Transcript of Identification of Genetic Susceptibility Loci for Colorectal Tumors in a Genome-Wide Meta-analysis

B
V
T
HP
sgi
BA
SIC
AN
DTR
AN
SLA
TIO
NA
LA
T
GASTROENTEROLOGY 2013;144:799–807
Identification of Genetic Susceptibility Loci for Colorectal Tumors in aGenome-Wide Meta-analysisULRIKE PETERS,1,2,* SHUO JIAO,1,* FREDRICK R. SCHUMACHER,3,* CAROLYN M. HUTTER,1,2,* AARON K. ARAGAKI,1
JOHN A. BARON,4 SONJA I. BERNDT,5 STÉPHANE BÉZIEAU,6 HERMANN BRENNER,7 KATJA BUTTERBACH,7
BETTE J. CAAN,8 PETER T. CAMPBELL,9 CHRISTOPHER S. CARLSON,1,2 GRAHAM CASEY,3 ANDREW T. CHAN,10,11
JENNY CHANG–CLAUDE,12 STEPHEN J. CHANOCK,5 LIN S. CHEN,13 GERHARD A. COETZEE,3 SIMON G. COETZEE,3
DAVID V. CONTI,3 KEITH R. CURTIS,1 DAVID DUGGAN,14 TODD EDWARDS,15 CHARLES S. FUCHS,11,16
STEVEN GALLINGER,17 EDWARD L. GIOVANNUCCI,11,18 STEPHANIE M. GOGARTEN,19 STEPHEN B. GRUBER,3
ROBERT W. HAILE,3 TABITHA A. HARRISON,1 RICHARD B. HAYES,20 BRIAN E. HENDERSON,3
MICHAEL HOFFMEISTER,7 JOHN L. HOPPER,21 THOMAS J. HUDSON,22,23 DAVID J. HUNTER,18
REBECCA D. JACKSON,24 SUN HA JEE,25 MARK A. JENKINS,21 WEI–HUA JIA,26 LAURENCE N. KOLONEL,27
CHARLES KOOPERBERG,1 SÉBASTIEN KÜRY,6 ANDREA Z. LACROIX,1 CATHY C. LAURIE,19 CECELIA A. LAURIE,19
LOIC LE MARCHAND,27 MATHIEU LEMIRE,22 DAVID LEVINE,19 NORALANE M. LINDOR,28 YAN LIU,29 JING MA,11
KAREN W. MAKAR,1 KEITARO MATSUO,30 POLLY A. NEWCOMB,1,2 JOHN D. POTTER,1,31 ROSS L. PRENTICE,1
CONGHUI QU,1 THOMAS ROHAN,32 STEPHANIE A. ROSSE,1,2 ROBERT E. SCHOEN,33 DANIELA SEMINARA,34
MARTHA SHRUBSOLE,15 XIAO–OU SHU,15 MARTHA L. SLATTERY,35 DARIN TAVERNA,14 STEPHEN N. THIBODEAU,36
CORNELIA M. ULRICH,1,2,37 EMILY WHITE,1,2 YONGBING XIANG,38 BRENT W. ZANKE,39 YI–XIN ZENG,26 BEN ZHANG,15
WEI ZHENG,40 and LI HSU,1 on behalf of the Colon Cancer Family Registry and the Genetics and Epidemiology ofColorectal Cancer Consortium1Public Health Sciences Division, Fred Hutchinson Cancer Research Center, Seattle, Washington; 19Department of Biostatistics,2School of Public Health, University ofWashington, Seattle, Washington; 3Keck School of Medicine, University of Southern California, Los Angeles, California; 4Department of Medicine, School of Medicine,University of North Carolina, Chapel Hill, North Carolina; 5Division of Cancer Epidemiology and Genetics, 34Division of Cancer Control and Population Sciences,National Cancer Institute, Bethesda, Maryland; 6Service de Génétique Médicale, CHU Nantes, Nantes, France; 7Division of Clinical Epidemiology and Aging Research,12Division of Cancer Epidemiology, German Cancer Research Center, Heidelberg, Germany; 8Division of Research, Kaiser Permanente Medical Care Program,Oakland, California; 9American Cancer Society, Atlanta, Georgia; 10Division of Gastroenterology, Massachusetts General Hospital and Harvard Medical School,
oston, Massachusetts; 11Channing Division of Network Medicine, Brigham and Women’s Hospital and Harvard Medical School, Boston, Massachusetts;13Department of Health Studies, University of Chicago, Chicago, Illinois; 14Translational Genomics Research Institute, Phoenix, Arizona; 15Department of Medicine,
anderbilt University School of Medicine, Nashville, Tennessee; 16Department of Medical Oncology, Dana Farber Cancer Institute, Boston, Massachusetts;17Department of Surgery, Toronto General Hospital, Toronto, Ontario, Canada; 18School of Public Health, Harvard University, Boston, Massachusetts; 20Division ofEpidemiology, New York University School of Medicine, New York, New York; 21Melborne School of Population Health, University of Melbourne, Melbourne, Victoria,Australia; 22Ontario Institute for Cancer Research, Toronto, Ontario, Canada; 23Departments of Medical Biophysics and Molecular Genetics, University of Toronto,oronto, Ontario, Canada; 24Division of Endocrinology, Diabetes, and Metabolism, Ohio State University, Columbus, Ohio; 25Institute for Health Promotion, Yonsei
University, Seoul, Korea; 26Cancer Center, Sun Yat-sen University, Guangzhou, China; 27Epidemiology Program, University of Hawaii Cancer Center, Honolulu,awaii; 28Department of Health Sciences Research, Mayo Clinic, Scottsdale, Arizona; 29Stephens and Associates, Carrollton, Texas; 30Division of Epidemiology andrevention, Aichi Cancer Center Research Institute, Nagoya, Japan; 31Centre for Public Health Research, Massey University, Wellington, New Zealand; 32Department
of Epidemiology and Population Health, Albert Einstein College of Medicine, Bronx, New York; 33Department of Epidemiology, University of Pittsburgh Medical Center,Pittsburgh, Pennsylvania; 35Department of Internal Medicine, University of Utah Health Sciences Center, Salt Lake City, Utah; 36Departments of Laboratory Medicineand Pathology and Laboratory Genetics, Mayo Clinic, Rochester, Minnesota; 37Division of Preventive Oncology, National Center for Tumor Diseases and GermanCancer Research Center, Heidelberg, Germany; 38Department of Epidemiology, Shanghai Cancer Institute, Shanghai, China; 39Division of Hematology, Faculty of
40Department of Medicine, Vanderbilt Epidemiology Center, Vanderbilt University School of
Medicine, The University of Ottawa, Ottawa, Ontario, Canada; andMedicine, Nashville, Tennesseeapaa
See Covering the Cover synopsis on page 665.
BACKGROUND & AIMS: Heritable factors contributeto the development of colorectal cancer. Identifying thegenetic loci associated with colorectal tumor formationcould elucidate the mechanisms of pathogenesis. METH-ODS: We conducted a genome-wide association studythat included 14 studies, 12,696 cases of colorectal tu-mors (11,870 cancer, 826 adenoma), and 15,113 controlsof European descent. The 10 most statistically significant,previously unreported findings were followed up in 6studies; these included 3056 colorectal tumor cases (2098cancer, 958 adenoma) and 6658 controls of European andAsian descent. RESULTS: Based on the combined analy-is, we identified a locus that reached the conventionalenome-wide significance level at less than 5.0 � 10�8: an
ntergenic region on chromosome 2q32.3, close to nucleiccid binding protein 1 (most significant single nucleotideolymorphism: rs11903757; odds ratio [OR], 1.15 per riskllele; P � 3.7 � 10�8). We also found evidence for 3dditional loci with P values less than 5.0 � 10�7: a locus
within the laminin gamma 1 gene on chromosome 1q25.3(rs10911251; OR, 1.10 per risk allele; P � 9.5 � 10�8), a
*Authors share co-first authorship.
Abbreviations used in this paper: CCFR, Colon Cancer Family Registry;CCND, cyclin D2; CEU, Utah residents with Northern and Western Europeanancestry from the CEPH collection; CEPH, Centre d’etude du polymor-phisme humain; GECCO, Genetics and Epidemiology of Colorectal CancerConsortium; GWAS, genome-wide association study; HWE, Hardy Wein-berg Equilibrium; LAMC1, laminin gamma 1; MAF, minor allele frequency;NABP1, nucleic acid binding protein 1; ORs, odds ratios; QC, qualitycontrol; SNP, single nucleotide polymorphism; TBX3, T-box 3.
© 2013 by the AGA Institute0016-5085/$36.00
http://dx.doi.org/10.1053/j.gastro.2012.12.020

(a(
eW
hf
itate
aggspmar
dsr
ctfAaiM2r
BA
SICA
ND
TRA
NSLA
TION
AL
AT
800 PETERS ET AL GASTROENTEROLOGY Vol. 144, No. 4
locus within the cyclin D2 gene on chromosome 12p13.32rs3217810 per risk allele; OR, 0.84; P � 5.9 � 10�8), and
locus in the T-box 3 gene on chromosome 12q24.21rs59336; OR, 0.91 per risk allele; P � 3.7 � 10�7). CON-
CLUSIONS: In a large genome-wide association study,we associated polymorphisms close to nucleic acid bind-ing protein 1 (which encodes a DNA-binding proteininvolved in DNA repair) with colorectal tumor risk.We also provided evidence for an association betweencolorectal tumor risk and polymorphisms in laminingamma 1 (this is the second gene in the laminin familyto be associated with colorectal cancers), cyclin D2(which encodes for cyclin D2), and T-box 3 (which
ncodes a T-box transcription factor and is a target ofnt signaling to �-catenin). The roles of these genes
and their products in cancer pathogenesis warrantfurther investigation.
Keywords: Colon Cancer; Genetics; Risk Factors; SNP.
Colorectal cancer has a sizable heritable component; alarge twin study estimated that 35% of colorectal
cancer risk may be explained by heritable factors.1 Overthe past several years, genome-wide association studies(GWAS), which focus on common single-nucleotide poly-morphisms (SNPs), successfully have discovered low-pen-etrance loci for colorectal cancer.2–12 These analyses have
ighlighted genes within the known transforming growthactor-� and Wnt signaling pathways (eg, bone morphogenetic
protein 2 & 4, SMAD7), as well as regions and genes notpreviously strongly implicated in colorectal cancer (eg,zinc finger protein 90, laminin alpha 5, disco-interacting protein2), thereby highlighting pathways previously not under-stood to be involved in colorectal carcinogenesis.2–12
To identify additional common genetic risk factors forcolorectal tumors, we conducted a genome-wide scanacross 14 independent studies including nearly 28,000subjects and follow-up evaluation of nearly 10,000 inde-pendent subjects. We included both colorectal cancercases and colorectal adenoma cases. Colorectal adenomais a well-defined colorectal cancer precursor13 and themajority of colorectal cancers develop through the adeno-ma-cancer sequence.14 It has been estimated that the 10-year cumulative rate for advanced adenoma to transitionto colorectal cancer is between 10% and 45%, dependingon age and sex.13,15,16 Accordingly, the 2 phenotypes haveoverlapping etiology.17 Inclusion of adenoma cases canncrease sample size, and hence statistical power, to iden-ify genetic risk factors related to early events in thedenoma-carcinoma process, during which risk factor in-ervention strategies may offer the greatest potential ben-fit for cancer prevention.
Materials and MethodsStudy ParticipantsEach study is described in detail in the Supplementary
Materials and Methods section and the number of cases and i
controls as well as age and sex distributions are listed in Sup-plementary Table 1. In brief, colorectal cancer cases were definedas colorectal adenocarcinoma and confirmed by medical records,pathologic reports, or death certificate. Colorectal adenomacases were confirmed by medical records, histopathology, orpathologic reports. Controls for adenoma cases had a negativecolonoscopy (except for the Nurses’ Health Study and theHealth Professionals Follow-up Study controls matched to caseswith distal adenoma, which either had a negative sigmoidoscopyor colonoscopy examination). All participants provided writteninformed consent and studies were approved by their respectiveinstitution’s Institutional Review Boards.
GenotypingGWAS in the Genetics and Epidemiology of Colo-
rectal Cancer Consortium and the Colon Cancer FamilyRegistry. We conducted a meta-analysis of GWAS from 13studies within the Genetics and Epidemiology of ColorectalCancer Consortium (GECCO) (10,729 cases and 13,328 con-trols) and additional GWAS within the Colon Cancer FamilyRegistry (CCFR) (1967 cases and 1785 controls). Details ongenotyping, quality assurance/quality control, and imputationcan be found in the Supplementary Materials and Methodssection. Average sample and SNP call rates and concordancerates for blinded duplicates are listed in Supplementary Table 2.In brief, all analyses were restricted to European ancestry. Geno-typed SNPs were excluded based on call rate (�98%), lack ofHardy–Weinberg equilibrium in controls (HWE, P � 1 � 10�4),
nd low minor allele frequency (MAF). Because imputation ofenotypes is established as standard practice in the analysis ofenotype array data, we imputed the autosomal SNPs of alltudies to the Utah residents with Northern and Western Euro-ean ancestry from the Centre d’etude du polymorphisme hu-ain (CEPH) collection (CEU) population in HapMap II (avail-
ble at: http://hapmap.ncbi.nlm.nih.gov/). Imputed SNPs wereestricted based on MAF (�1%) and imputation accuracy (R2 �
0.3). After imputation and quality control (QC), a total of2,708,280 SNPs were used in the meta-analysis of GECCO stud-ies and CCFR. In our detailed result table (Supplementary Table3), we list for each SNP the number of studies with directlygenotyped or imputed data and the mean imputation R2. These
ata show, as expected, that imputed SNPs tend to show veryimilar results as SNPs that were directly genotyped if the cor-elation is high between SNPs.
Follow-up studies. We selected the 10 most statisti-ally significant regions (excluding known GWAS loci) based onhe P value from the GECCO and CCFR meta-analysis forurther follow-up evaluation in colorectal cancer studies in thesian colorectal cancer consortium and a US-based colorectaldenoma study. Details on genotyping, quality assurance/qual-ty control, and imputation can be found in the Supplementary
aterials and Methods section. After quality control exclusions,098 colorectal cancer cases and 5749 controls, and 958 colo-ectal adenoma cases and 909 controls remained in the analysis.
Statistical AnalysisGWAS in GECCO and CCFR. Statistical analyses of
the GECCO and CCFR samples were conducted centrally at thecoordinating center on individual-level data to ensure a consis-tent analytic approach. For each study, we estimated the asso-ciation between SNPs and risk for colorectal cancer by calculat-ing � values, odds ratios (ORs), standard errors, 95% confidence
ntervals, and P values using logistic regression models with
rat
ttc
i
hstmteo
ft1saws
uatcattnfttS
5
iuGldH
dBA
SIC
AN
DTR
AN
SLA
TIO
NA
LA
T
April 2013 GENOME–WIDE SCAN FOR COLORECTAL TUMORS 801
log-additive genetic effects. Each directly genotyped SNP wascoded as 0, 1, or 2 copies of the risk allele. For imputed SNPs, weused the expected number of copies of the risk allele (thedosage), which has been shown to provide unbiased estimates inthe association test for imputed SNPs.18 We adjusted for age, sex(when appropriate), center (when appropriate), smoking status(Physicians’ Health Study only), batch effects (The french Asso-ciation STudy Evaluating RISK for sporadic colorectal cancer),and the first 3 principal components from EIGENSTRAT (avail-able at: http://genepath.med.harvard.edu/�reich/EIGENSTRAT.htm) to account for population substructure. Because CCFR set2 is a family-based study, we used a conditional logistic regres-sion stratified by family identification while adjusting for ageand sex. When analyzing genotyped SNPs on the X chromosomewe need to account for different genotype variances betweenmales and females. Therefore, we used the 1 degree of freedommodified Cochran–Armitage test19 to test for associations. Thismethod has been shown to have robust and powerful perfor-mance across a wide range of scenarios.20 We used logisticegression to model SNP � SNP interaction effects for a log-dditive model, in which the interaction term is the product ofhe 2 SNPs.
Quantile-quantile plots were assessed to determine whetherhe distribution of the P values in each study was consistent withhe null distribution (except for the extreme tail). We also cal-ulated the genomic inflation factor (�) to measure the overdis-
persion of the test statistics from the association tests by divid-ing the median of the squared Z statistics by 0.455, the medianof a chi-squared distribution with 1 degree of freedom. Theinflation factor � was between 0.999 and 1.044 for individualstudies based on all SNPs including both directly genotyped andimputed, indicating there is little evidence of residual popula-tion substructure, cryptic relatedness, or differential genotypingbetween cases and controls. This result was consistent with thevisual inspection of the study-specific quantile-quantile plots.
We conducted inverse-variance weighted, fixed-effects meta-analysis to combine � estimates and standard errors acrossndividual studies. In this approach, we weighed the � estimate
of each study by its inverse variance and calculated a combinedestimate by summing the weighted � estimates and dividing bythe summed weights. For imputed SNPs, it has been shown thatthe inverse variance is approximately proportional to the impu-tation quality.18 Thus, the inverse variance weighting schemeautomatically incorporates imputation quality in the meta-anal-ysis for imputed SNPs. We calculated the heterogeneity P valuesbased on Cochran’s Q statistic21 and investigated sources for
eterogeneity if the P value was less than .05 for the 10 mostignificant SNPs. For the most significant SNPs highlighted inhis article, we also examined recessive and unrestricted genetic
odels and compared models by calculating the Akaike informa-ion criterion. We used PLINK (available at: pngu.mgh.harvard.du/�purcell/plink/)22 and R (available at: http://www.r-project.rg/)23 to conduct the statistical analysis and summarized
results graphically using LocusZOOM (available at: http://csg.sph.umich.edu/locuszoom/).24
Follow-up studies. The 10 most significant SNPsrom the GWAS meta-analysis described earlier were analyzed inhe follow-up studies (P values from GWAS meta-analysis 2.5 �0�7 to 6.5 � 10�6). For the Asian colorectal cancer follow-uptudy, genotyped SNPs and dosage data of imputed SNPs werenalyzed using the program mach2dat (available at: http://ww.sph.umich.edu/csg/abecasis/MACH/download/).25 The as-
ociation between SNP and colorectal cancer risk was assessed
sing logistic regression with log-additive genetic effects afterdjusting for age and sex. Meta-analyses were performed usinghe inverse-variance method based on a fixed-effects model, andalculations were implemented in the METAL package (availablet: http://www.sph.umich.edu/csg/abecasis/metal/).26 Becausehe MAF in the Asian follow-up population was very low forhe locus on chromosome 14q23.1 (MAF, 0 – 0.006 in Han Chi-ese individuals from Beijing, China), we excluded this SNP
rom the follow-up evaluation in the Asian studies. Given po-ential differences in the linkage disequilibrium structure be-ween European and Asian descent subjects, we also included allNPs correlated with these 10 selected SNPs (r2 � 0.5 in CEU).
For the adenoma follow-up study (all European descent), theassociation between each genetic marker and risk for colorectaladenoma was estimated by calculating ORs and 95% confidenceintervals, using a log-additive genetic model. SNPTESTv2.2.0(available at: https://mathgen.stats.ox.ac.uk/genetics_software/snptest/snptest.html) with the “-method score” option27 wasused for logistic regression with the frequentist test, and themodel was adjusted for age and sex.
For a combined analysis of GWAS and follow-up results, weconducted inverse-variance weighted fixed-effects meta-analysisto combine ORs from log-additive models across individualstudies and measured heterogeneity using Cochran’s Q statistic,as discussed earlier.
Criterion for genome-wide significance. Based onan increasing number of articles28 –33 providing a detailed dis-cussion on the appropriate genome-wide significance threshold,which all arrive at similar values in the range of 5 � 10�7 to 5 �10�8 for European populations, we decided to use a P value of
� 10�8 as the genome-wide significance threshold. In addition,we reported on SNPs with P values between less than 5 � 10�7
and greater than 5 � 10�8 as a potentially novel SNP thatmerited additional follow-up evaluation.
Heritability estimates. We estimated the additive her-tability of colorectal cancer explained by all genotyped SNPssing the method by Yang et al34 and implemented in theenome-wide Complex Trait Analysis tool.35 We set the preva-
ence of colorectal cancer to 0.004, based on Surveillance, Epi-emiology and End Results incidence and National Center forealth Statistics mortality statistics.36 We used all genotyped
SNPs of Darmkrebs: Chancen der Verhütung durch Screeningset II and Diet, Activity, and Lifestyle Study set I given the sizablesample set, different genotyping platforms, and inclusion ofboth sexes (Supplementary Table 1). We also estimated theheritability of previously and newly identified variants by usingthe method of So et al.37 Furthermore, we used the method
escribed by Park et al38 to estimate the total number of lociexpected to be identified for colorectal cancer based on theobserved effect sizes and power for identifying the loci knownto date (Table 1 and Supplementary Table 4).
Functional annotation of findings. We conducted afunctional annotation for all tagging SNPs (and correlatedSNPs) highlighted in this article. As detailed in the Supplemen-tary Materials and Methods section, we queried multiple bioin-formatic databases based on the University of California, SantaCruz genome browser.
ResultsSummary results of the GWAS meta-analysis of
GECCO and CCFR are shown in the Manhattan plot
(Supplementary Figure 1). Several of the previously iden-
1TfGSitsra
Sa0st
ft
1h1e
Frr
(
BA
SICA
ND
TRA
NSLA
TION
AL
AT
802 PETERS ET AL GASTROENTEROLOGY Vol. 144, No. 4
tified GWAS SNPs were highly significantly associatedwith colorectal cancer, and overall we found a nominalsignificant association (P � .05) in the same direction for
6 of 18 previously identified GWAS loci (Supplementaryable 4). After excluding previously identified regions, we
ollowed up the 10 most significant regions from theWAS meta-analysis (P � 2.5 � 10�7 to 6.5 � 10�6;upplementary Table 3). In 4 regions the follow-up stud-
es showed evidence of replication with the association inhe same directions as the GWAS and an overall improvedignificance level (Table 1). Of these 4 regions, 1 regioneached the conventional genome-wide significance levelt a P value less than 5.0 � 10�8 in the combined analysis
(GWAS � follow-up evaluation). This region was on chro-mosome 2q32.3 (rs11903757: OR, 1.16 per risk allele; P �3.7 � 10�8; Table 1 and Supplementary Figure 2). The
NP showed no evidence for heterogeneity (P � .27)cross all studies. The SNP was correlated strongly (r2 �.9) with several SNPs in the same region, which showedimilar results (Supplementary Figure 3 and Supplemen-ary Table 3).
The other 3 regions had P values less than 5.0 � 10�7
(and P � 5.0 � 10�8) in the combined analysis (GWAS �ollow-up evaluation). Reporting by chromosomal posi-
Table 1. Risk Estimates for Newly Identified SNPs Associated
SNPChromosome
(gene)aRiskallele Stageb
SNP with P � 5 � 10�8
rs11903757 2q32.3 C GWAS(NABP1) Asian
AdenomaOverall
SNPs with P � 5 � 10�7
and P � 5 � 10�8
rs10911251 1q25.3 A GWAS(LAMC1) Asian
AdenomaOverall
rs3217810 12p13.32 T GWAS(CCND2) Asian
AdenomaOverall
rs3217901 12p13.32 G GWAS(CCND2) Asian
AdenomaOverall
rs59336 12q24.21 T GWAS(TBX3) Asian
AdenomaOverall
CI, confidence interval; RAF, risk allele frequency.NOTE. Bolded entries signify combined results.aChromosome position and build from Genome Browser based on buibGWAS (n � 12,696 cases and 15,113 controls); Asian (2098 case15,752 cases and 21,771 controls except for rs3217810, which ha
cMean and (range) computed from respective studies.
ion, the first of these 3 regions was on chromosome
q25.3. In this region, the association with rs10911251ad the lowest P value (OR, 1.09 per risk allele; P � 9.5 �0�8; Table 1 and Supplementary Figure 2), showing novidence of heterogeneity (P � .69) across studies. This
was correlated strongly with a large number of SNPs inthe same region showing similar allele frequencies, riskestimates, and P values spanning across the entire laminingamma 1 (LAMC1) gene (Supplementary Figure 3 andSupplementary Table 3).
The second region with P values less than 5.0 � 10�7
and greater than 5.0 � 10�8 was on chromosome 12p13,within the cyclin D2 (CCND2) gene. The most statisticallysignificant SNP was rs3217810 (OR, 1.20 per risk allele;P � 5.9 � 10�8; Table 1 and Supplementary Figure 2).
urthermore, only 17.1 kb apart resides a second SNP,s3217901, which was not strongly correlated withs3217810 (r2 � 0.052– 0.063) and showed a slightly lower
significance level (OR, 1.10 per risk allele; P � 4.9 � 10�7).Although the risk allele frequency of rs3217810 in ourEuropean descent studies was on average 0.16, this SNP isvery uncommon in Asian populations (0.03 in Japanese inTokyo, Japan, and 0.01 in Han Chinese individuals fromBeijing, China) and, hence, the follow-up evaluation ofrs3217810 did not include the Asian cases and controls.
ith Colorectal Cancer at a P Value Less Than 5 � 10�7
AF (range)c OR (95% CI) P value P heterogeneity
6 (0.11–0.23) 1.15 (1.09–1.22) 1.38E-065 (0.04–0.08) 1.16 (0.95–1.41) 1.34E-01
0.15 1.23 (1.03–1.47) 2.30E-021.16 (1.10–1.22) 3.71E-08 .27
7 (0.49–0.63) 1.10 (1.06–1.14) 1.34E-064 (0.50–0.55) 1.09 (1.01–1.17) 3.20E-02
0.58 1.06 (0.93–1.21) 3.66E-011.09 (1.06–1.13) 9.45E-08 .69
6 (0.18–0.10) 1.19 (1.11–1.28) 3.40E-07NA NA NA
0.15 1.31 (1.00–1.71) 5.07E-021.20 (1.12–1.28) 5.86E-08 .91
1 (0.43–0.39) 1.10 (1.06–1.15) 1.71E-066 (0.54–0.58) 1.08 (0.98–1.18) 1.04E-01
0.42 1.08 (0.91–1.27) 3.72E-011.10 (1.06–1.14) 3.31E-07 .51
8 (0.51–0.42) 1.10 (1.06–1.14) 7.64E-070 (0.56–0.62) 1.05 (0.94–1.18) 3.61E-01
0.48 1.13 (0.90–1.40) 2.89E-011.09 (1.06–1.13) 3.67E-07 .39
7.nd 5749 controls); adenoma (958 cases and 909 controls); overall3,654 cases and 16,022 controls).
W
R
0.10.0
0.50.5
0.1
0.40.5
0.40.6
ld 3s as 1
Both SNPs were not heterogeneous across studies (P for

Stt
mrai
mmwdt
ccaCamu
ah5
bct
bcsgcaei2c
BA
SIC
AN
DTR
AN
SLA
TIO
NA
LA
T
April 2013 GENOME–WIDE SCAN FOR COLORECTAL TUMORS 803
heterogeneity � .51 and .91). When we included bothNPs simultaneously in the logistic regression analysishe significance of both SNPs was reduced (Supplemen-ary Table 5).
The third region with P values less than 5.0 � 10�7 wasin the T-box 3 (TBX3) gene on chromosome 12q24.21. The
ost statistically significant SNP in this region wass59336 (OR, 1.09 per risk allele; P � 3.7 � 10�7; Table 1nd Supplementary Figure 2). Again, we observed no ev-dence for heterogeneity across studies (P � .39).
We investigated if the 4 regions listed earlier might beore significant (lower P value) under a different geneticodel than the log-additive model. None of the variantsas more significant when we modeled the unrestricted,ominant, or recessive mode of inheritance (Supplemen-ary Table 6).
When we stratified results by colorectal adenoma andancer we observed stronger associations for adenomaompared with cancer for rs11903757 at 2q32.3, similarssociations for rs3217810 and rs3217901 at 12p13/CDN2 and for rs59336 at 12q24.21/TBX3, and a weakerssociation for rs10911251 at 1q25.3/LAMC1 (Supple-entary Table 7). For previously identified loci, in partic-
lar, associations for rs16892766 at 8q23.3/EIF3H andrs4939827 at 18q21/SMAD7 tended to be stronger foradenoma, whereas associations for other loci tended to besimilar or weaker compared with cancer (SupplementaryTable 4).
We observed no evidence for interaction between theSNPs in the newly identified regions or with SNPs inpreviously identified regions. The smallest P value forinteraction was .017 for rs59336/TBX3 and rs11632715/15q13 and was not significant after accounting for mul-tiple comparisons.
As popularized by Yang et al,34 we estimated that theadditive heritability of colorectal cancer explained by allgenotyped SNPs would be 14.2% (standard error, 8.2%).The newly identified loci (Table 1) and previously identi-fied loci (Supplementary Table 4) explained about 11% ofthe additive heritability and cumulatively these newly andpreviously identified loci explain 1.6% of the variation ofcolorectal cancer. Based on the study by Park et al38 weestimated that the total number of loci expected to beidentified for colorectal cancer would be between 239and 500 if the type I error rate was between 5 � 10�7
and 5 � 10�8.
DiscussionIn this large genome-wide scan meta-analysis and
follow-up evaluation of a total of close to 38,000 subjects,we identified an intergenic region on chromosome 2q32.3close to nucleic acid binding protein 1 (NABP1) that wasassociated with colorectal tumor risk with P values lessthan 5.0 � 10�8, the conventional genome-wide signifi-cance level. Furthermore, we identified 3 regions with Pvalues less than 5.0 � 10�7: one on chromosome 1q31 in
LAMC1, a second on chromosome 12p13 in CCND2, andthird on chromosome 12q24.21 in TXB3. All showedighly significant associations with P values less than� 10�7.Our study provides strong support for an intergenic
locus on chromosome 2q32.3. The most significant SNPsin this region are in closest proximity to the NABP1 gene(44 kb centromeric) and the gene serum deprivation response(112 kb telomeric), which encodes for the serum-depriva-tion response phosphatidylserine-binding protein. TheSNPs are downstream of NABP1, which also is known ashuman single-strand DNA binding protein 2 or oligonucleotide/oligosaccharide binding fold-containing protein 2A. This proteinbinds single-stranded DNA via the oligonucleotide/oligo-saccharide binding fold domain.39 Single-stranded DNA
inding proteins are important for diverse DNA pro-esses, such as DNA replication, recombination, transcrip-ion, and repair.40 – 42 Cells depleted of NABP1 show
hypersensitivity to DNA-damaging reagents; NABP1participates in repair of DNA double-strand breaks andataxia telangiectasia mutated– dependent signaling path-ways,43 similar to the role of its homolog, NABP2 (whichis also known as human single-strand DNA binding pro-tein 1).39 Although our functional annotation did notprovide further insights on the function of the SNPs, thebiologic data described earlier support the importance ofNABP1 with respect to genomic stability, which couldexplain a link to the development of cancer.44
In addition to the genome-wide significant region weobserved 3 regions that were slightly less significant withP values less than 5 � 10�7 but greater than 5 � 10�8. Ashas been shown previously,45 a large fraction of SNPs with
orderline genome-wide–significant associations repli-ated when results from additional studies were added,uggesting that further follow-up evaluation of these re-ions is warranted. The first of these 3 regions was onhromosome 1q31 and included correlated SNPs showingssociations that spanned across the LAMC1 gene. Inter-stingly, previous genome-wide scans of colorectal cancerdentified a different laminin gene on chromosome0q13.33, laminin alpha 5, as associated with colorectalancer,9,11 supporting the importance of this gene family
for the development of colorectal cancer. Laminins areextracellular matrix glycoproteins that constitute a majorcomponent of the basement membrane in most tissues46
and in the colon are part of the intestinal epithelialbarrier. Laminins are involved in a wide variety of biolog-ical functions, such as regulation of cell adhesion, differ-entiation, migration, signaling, and metastasis.47–50 Lossof cell-surface laminin anchoring has been found in manycancer cells, particularly those with aggressive subtypes.51
LAMC1 is a large gene spanning 122 kb and containing28 coding exons. rs10911251 is correlated strongly (r2 �0.8) with several other SNPs across the gene (Supplemen-tary Figure 3 and Supplementary Table 3). Upon func-tional annotation, we identified a potential functionalcandidate (rs10911205) that is correlated strongly withthe most significant tagSNP (r2 � 0.73) and located 72 kb
upstream within the first intron of LAMC1. As shown in
C
iTem
ad
enicicsmaccpiatswTimcafoo
stpratfi
BA
SICA
ND
TRA
NSLA
TION
AL
AT
804 PETERS ET AL GASTROENTEROLOGY Vol. 144, No. 4
the University of California, Santa Cruz Genome Browserview (Supplementary Figure 4), rs10911205 is locatedwithin a highly evolutionarily conserved region and, givenits close proximity to the promoter, it is possible that thisregion influences gene transcription. In addition, the pat-terns of histone modifications and DNase signals indicat-ing accessibility for transcription factors suggest that thisvariant may affect cell-type–specific enhancer activity. Insummary, given the statistical evidence, support fromfunctional annotation, and evidence from a previousGWAS that identified another laminin gene to be associatedwith colorectal cancer, we believe there is strong support forthe importance of LAMC1 in the development of colorectalcancer. It is of note that the biologic role of this gene familyhas not yet been studied substantially in relation to colorec-tal cancer, supporting the novelty of this finding.
A second region with P values less than 5 � 10�7 was onchromosome 12p13.32, with 2 independent SNPs bothlocated in the intron of CCND2, which belongs to thehighly conserved cyclin family, specifically encoding forthe protein cyclin D2. Through regulation of CDK4 andCDK6, cyclin D2 affects the cell-cycle transition of theG1/S phase.52,53 Furthermore, cyclin D2 interacts withtumor-suppressor protein retinoblastoma. Recent studieshave identified CCND2 as an microRNA target gene indifferent colorectal cancer cell lines.54,55 Interestingly, ge-netic variants in CCND1 also have been related to colo-rectal cancer56,57 and a previous GWAS identified a SNP in
CND1 to be associated with breast cancer.58
The third region with P values less than 5 � 10�7 wedentified was within the TBX3 gene, which encodes the-box transcription factor. TBX3 is overexpressed in sev-ral cancers, including pancreas, liver, breast cancer, andelanoma,59 playing multiple roles in normal develop-
ment and cancer.60 In liver cancer, TBX3 was identified asdownstream target of the Wnt/�-catenin pathway, me-
iating �-catenin activities on cell proliferation and sur-vival.61 The Wnt/�-catenin pathway plays a key role incolorectal cancer development.62 TBX5, another memberof the T-Box gene family, has been suggested as an epige-netically inactivated tumor-suppressor gene in colon can-cer63 and provides an additional mechanism by which thisgene family may influence colorectal cancer development.
Our study adds further support for all, except 3, previ-ously identified GWAS loci for colorectal cancer. The 3SNPs (on chromosomes 1q41, 3q26.2, and 6p21) that didnot replicate are among the more recently identifiedGWAS loci9,12 and have smaller effect sizes (OR for riskallele, �1.1) compared with the earlier GWAS findings. Asa result, larger sample sizes may be needed to fully repli-cate these SNPs. Furthermore, it is possible that the effectvaries by environmental exposures, which may differ amongthe study populations. Overall, effect sizes from our studyfor previous GWAS loci tend to be weaker than in the initialreports, which may be explained by the fact that previousresults were subject to the “winner’s curse.”64
The large sample size of our GWAS and follow-up
studies and availability of individual-level GWAS data areimportant advantages of our study. However, the studyalso had limitations. To increase the sample size, weincluded Asian descent subjects, who may have differentlinkage disequilibrium patterns, and the SNPs analyzedmay be tagging different underlying causal variants. Toaddress this potential limitation we included all SNPscorrelated with the most significant SNPs, which likelywill identify any variant that genuinely is associated withcolorectal cancer risk across different ancestral groups, asshown for other GWAS loci.65– 68 Given that genotypingplatforms only capture a subset of the genome, we usedimputation to HapMap II to obtain a better coverage ofthe common variation across the genome and to generatea common set of SNPs from the different platforms.Because imputed SNPs tend to result in less significantfindings depending on their imputation accuracy,69 wexpect that our results provide relative conservative sig-ificance levels.70 Similar to previous GWAS,2,4,6 –10,12 we
ncluded colorectal adenoma as the major precursor ofolorectal cancer to improve our statistical power and todentify genetic variants that act early in the adenoma-ancer sequence, where adenomas and cancer have ahared etiology. Although the inclusion of adenoma also
ay add heterogeneity because adenomas will not shown association for genetic variants that act later in thearcinogenic process (ie, on progression from adenoma toancer) or for variants that act through adenoma-inde-endent pathways, stratified analysis may provide insights
nto the mediating roles of genes within the normal todenoma to cancer pathway. We show that for some ofhe newly and previously identified loci, associations aretronger for adenomas compared with cancer; however,e observed similar or weaker associations for other loci.hese results may suggest that some genes are important
n early stages of cancer development while others may beore important for the progression from adenoma to
ancer. However, given the relatively small number ofdenoma cases (only 6.5% of the GWAS and 31% of theollow-up cases were adenoma cases), it is important thatur findings are replicated in studies with larger numbersf adenoma cases.
In summary, in this large study, we identified one novelusceptibility locus associated with the risk of colorectalumor on chromosome 2q32.3 close to NABP1, and 3otential loci with borderline genome-wide significantesults within LAMC1, CCND2, and TBX3. These findingsre supported by biologic plausibility, functional annota-ion, and previous GWAS findings within the same geneamily, emphasizing the potential relevance of these genesn the etiology of colorectal cancer.
Supplementary Material
Note: To access the supplementary materialaccompanying this article, visit the online version ofGastroenterology at www.gastrojournal.org, and at http://
dx.doi:10.1053/j.gastro.2012.12.020.
1
1
1
1
1
1
1
1
1
1
2
2
2
2
2
2
2
2
2
2
3
3
3
3
3
3
3
3
3
3
4
4
4
4
4
4
4
4
BA
SIC
AN
DTR
AN
SLA
TIO
NA
LA
T
April 2013 GENOME–WIDE SCAN FOR COLORECTAL TUMORS 805
References
1. Lichtenstein P, Holm NV, Verkasalo PK, et al. Environmental andheritable factors in the causation of cancer—analyses of cohortsof twins from Sweden, Denmark, and Finland. N Engl J Med2000;343:78–85.
2. Tomlinson I, Webb E, Carvajal-Carmona L, et al. A genome-wideassociation scan of tag SNPs identifies a susceptibility variant forcolorectal cancer at 8q24.21. Nat Genet 2007;39:984–988.
3. Zanke BW, Greenwood CM, Rangrej J, et al. Genome-wide associ-ation scan identifies a colorectal cancer susceptibility locus onchromosome 8q24. Nat Genet 2007;39:989–994.
4. Broderick P, Carvajal-Carmona L, Pittman AM, et al. A genome-wide association study shows that common alleles of SMAD7influence colorectal cancer risk. Nat Genet 2007;39:1315–1317.
5. Tenesa A, Farrington SM, Prendergast JG, et al. Genome-wideassociation scan identifies a colorectal cancer susceptibility locuson 11q23 and replicates risk loci at 8q24 and 18q21. Nat Genet2008;40:631–637.
6. Jaeger E, Webb E, Howarth K, et al. Common genetic variants atthe CRAC1 (HMPS) locus on chromosome 15q13.3 influence colo-rectal cancer risk. Nat Genet 2008;40:26–28.
7. Tomlinson IP, Webb E, Carvajal-Carmona L, et al. A genome-wideassociation study identifies colorectal cancer susceptibility loci onchromosomes 10p14 and 8q23.3. Nat Genet 2008;40:623–630.
8. Houlston RS, Webb E, Broderick P, et al. Meta-analysis of genome-wide association data identifies four new susceptibility loci forcolorectal cancer. Nat Genet 2008;40:1426–1435.
9. Houlston RS, Cheadle J, Dobbins SE, et al. Meta-analysis of threegenome-wide association studies identifies susceptibility loci forcolorectal cancer at 1q41, 3q26.2, 12q13.13 and 20q13.33. NatGenet 2010;42:973–977.
0. Tomlinson IP, Carvajal-Carmona LG, Dobbins SE, et al. Multiplecommon susceptibility variants near BMP pathway loci GREM1,BMP4, and BMP2 explain part of the missing heritability of colo-rectal cancer. PLoS Genet 2011;7:e1002105.
1. Peters U, Hutter CM, Hsu L, et al. Meta-analysis of new genome-wide association studies of colorectal cancer risk. Hum Genet2012;131:217–234.
2. Dunlop MG, Dobbins SE, Farrington SM, et al. Common variationnear CDKN1A, POLD3 and SHROOM2 influences colorectal cancerrisk. Nat Genet 2012;44:770–776.
3. Brenner H, Hoffmeister M, Stegmaier C, et al. Risk of progressionof advanced adenomas to colorectal cancer by age and sex:estimates based on 840,149 screening colonoscopies. Gut2007;56:1585–1589.
4. Kinzler KW, Vogelstein B. Lessons from hereditary colorectal can-cer. Cell 1996;87:159–170.
5. Eide TJ. Risk of colorectal cancer in adenoma-bearing individualswithin a defined population. Int J Cancer 1986;38:173–176.
6. Stryker SJ, Wolff BG, Culp CE, et al. Natural history of untreatedcolonic polyps. Gastroenterology 1987;93:1009–1013.
7. Potter JD. Colorectal cancer: molecules and populations. J NatlCancer Inst 1999;91:916–932.
8. Jiao S, Hsu L, Hutter CM, et al. The use of imputed values in themeta-analysis of genome-wide association studies. Genet Epide-miol 2011;35:597–605.
9. Clayton D. Testing for association on the X chromosome. Biosta-tistics 2008;9:593–600.
0. Hickey PF, Bahlo M. X chromosome association testing in genomewide association studies. Genet Epidemiol 2011;35:664–670.
1. Ioannidis JP, Patsopoulos NA, Evangelou E. Heterogeneity inmeta-analyses of genome-wide association investigations. PLoSONE 2007;2:e841.
2. Purcell S, Neale B, Todd-Brown K, et al. PLINK: a tool set forwhole-genome association and population-based linkage analy-ses. Am J Hum Genet 2007;81:559–575.
3. R Development Core Team. R: a language and environment forstatistical computing. Vienna, Austria: R Foundation for Statistical
Computing, 2011.4. Pruim RJ, Welch RP, Sanna S, et al. LocusZoom: regional visual-ization of genome-wide association scan results. Bioinformatics2010;26:2336–2337.
5. Li Y, Willer CJ, Ding J, et al. MaCH: using sequence and genotypedata to estimate haplotypes and unobserved genotypes. GenetEpidemiol 2010;34:816–834.
6. Willer CJ, Li Y, Abecasis GR. METAL: fast and efficient meta-analysis of genomewide association scans. Bioinformatics 2010;26:2190–2191.
7. Marchini J, Howie B, Myers S, et al. A new multipoint method forgenome-wide association studies by imputation of genotypes. NatGenet 2007;39:906–913.
8. Risch N, Merikangas K. The future of genetic studies of complexhuman diseases. Science 1996;273:1516–1517.
9. International HapMap Consortium. A haplotype map of the humangenome. Nature 2005;437:1299–1320.
0. Wellcome Trust Case Control Consortium. Genome-wide associa-tion study of 14,000 cases of seven common diseases and 3,000shared controls. Nature 2007;447:661–678.
1. Hoggart CJ, Clark TG, De IM, et al. Genome-wide significance fordense SNP and resequencing data. Genet Epidemiol 2008;32:179–185.
2. Pe’er I, Yelensk R, Altshuler D, et al. Estimation of the multipletesting burden for genomewide association studies of nearly allcommon variants. Genet Epidemiol 2008;32:381–385.
3. Dudbridge F, Gusnanto A. Estimation of significance thresholdsfor genomewide association scans. Genet Epidemiol 2008;32:227–234.
4. Yang J, Benyamin B, McEvoy BP, et al. Common SNPs explain alarge proportion of the heritability for human height. Nat Genet2010;42:565–569.
5. Yang J, Lee SH, Goddard ME, et al. GCTA: a tool for genome-widecomplex trait analysis. Am J Hum Genet 2011;88:76–82.
6. Howlader N, Noone AM, Krapcho M, et al. SEER cancer statisticsreview, 1975-2009. Bethesda, MD: National Cancer Institute,2012.
7. So HC, Gui AH, Cherny SS, et al. Evaluating the heritability ex-plained by known susceptibility variants: a survey of ten complexdiseases. Genet Epidemiol 2011;35:310–317.
8. Park JH, Wacholder S, Gail MH, et al. Estimation of effect sizedistribution from genome-wide association studies and implica-tions for future discoveries. Nat Genet 2010;42:570–575.
9. Richard DJ, Bolderson E, Cubeddu L, et al. Single-stranded DNA-binding protein hSSB1 is critical for genomic stability. Nature2008;453:677–681.
0. Bochkarev A, Bochkareva E, Frappier L, et al. The crystal structureof the complex of replication protein A subunits RPA32 and RPA14reveals a mechanism for single-stranded DNA binding. EMBO J1999;18:4498–4504.
1. Wold MS. Replication protein A: a heterotrimeric, single-strandedDNA-binding protein required for eukaryotic DNA metabolism.Annu Rev Biochem 1997;66:61–92.
2. Yang H, Jeffrey PD, Miller J, et al. BRCA2 function in DNA bindingand recombination from a BRCA2-DSS1-ssDNA structure. Science2002;297:1837–1848.
3. Li Y, Bolderson E, Kumar R, et al. HSSB1 and hSSB2 form similarmultiprotein complexes that participate in DNA damage response.J Biol Chem 2009;284:23525–23531.
4. Broderick S, Rehmet K, Concannon C, et al. Eukaryotic single-stranded DNA binding proteins: central factors in genome stabil-ity. Subcell Biochem 2010;50:143–163.
5. Panagiotou OA, Ioannidis JP. What should the genome-wide sig-nificance threshold be? Empirical replication of borderline geneticassociations. Int J Epidemiol 2012;41:273–286.
6. Kalluri R. Basement membranes: structure, assembly and role intumour angiogenesis. Nat Rev Cancer 2003;3:422–433.
7. Turck N, Gross I, Gendry P, et al. Laminin isoforms: biological
roles and effects on the intracellular distribution of nuclear pro-
BA
SICA
ND
TRA
NSLA
TION
AL
AT
806 PETERS ET AL GASTROENTEROLOGY Vol. 144, No. 4
teins in intestinal epithelial cells. Exp Cell Res 2005;303:494–503.
48. Pouliot N, Saunders NA, Kaur P. Laminin 10/11: an alternativeadhesive ligand for epidermal keratinocytes with a functional rolein promoting proliferation and migration. Exp Dermatol 2002;11:387–397.
49. Gudjonsson T, Ronnov-Jessen L, Villadsen R, et al. Normal andtumor-derived myoepithelial cells differ in their ability to interactwith luminal breast epithelial cells for polarity and basementmembrane deposition. J Cell Sci 2002;115:39–50.
50. Patarroyo M, Tryggvason K, Virtanen I. Laminin isoforms in tumorinvasion, angiogenesis and metastasis. Semin Cancer Biol 2002;12:197–207.
51. Akhavan A, Griffith OL, Soroceanu L, et al. Loss of cell-surfacelaminin anchoring promotes tumor growth and is associated withpoor clinical outcomes. Cancer Res 2012;72:2578–2588.
52. Lukas J, Muller H, Bartkova J, et al. DNA tumor virus oncoproteinsand retinoblastoma gene mutations share the ability to relieve thecell’s requirement for cyclin D1 function in G1. J Cell Biol 1994;125:625–638.
53. Matsushime H, Quelle DE, Shurtleff SA, et al. D-type cyclin-depen-dent kinase activity in mammalian cells. Mol Cell Biol 1994;14:2066–2076.
54. Ragusa M, Statello L, Maugeri M, et al. Specific alterations of themicroRNA transcriptome and global network structure in colorectalcancer after treatment with MAPK/ERK inhibitors. J Mol Med (Berl)2012;90:1421–1438.
55. Zhang P, Ma Y, Wang F, et al. Comprehensive gene and microRNAexpression profiling reveals the crucial role of hsa-let-7i and itstarget genes in colorectal cancer metastasis. Mol Biol Rep 2012;39:1471–1478.
56. Yang Y, Wang F, Shi C, et al. Cyclin D1 G870A polymorphismcontributes to colorectal cancer susceptibility: evidence from asystematic review of 22 case-control studies. PLoS One 2012;7:e36813.
57. Yang J, Zhang G, Chen J. CCND1 G870A polymorphism is asso-ciated with increased risk of colorectal cancer, especially forsporadic colorectal cancer and in Caucasians: a meta-analysis.Clin Res Hepatol Gastroenterol 2012;36:169–177.
58. Turnbull C, Rapley EA, Seal S, et al. Variants near DMRT1, TERTand ATF7IP are associated with testicular germ cell cancer. NatGenet 2010;42:604–607.
59. Smith J, Mowla S, Prince S. Basal transcription of the human TBX3gene, a key developmental regulator which is overexpressed inseveral cancers, requires functional NF-Y and Sp1 sites. Gene2011;486:41–46.
60. Washkowitz AJ, Gavrilov S, Begum S, et al. Diverse functionalnetworks of Tbx3 in development and disease. Wiley InterdiscipRev Syst Biol Med 2012;4:273–283.
61. Renard CA, Labalette C, Armengol C, et al. Tbx3 is a downstreamtarget of the Wnt/beta-catenin pathway and a critical mediator ofbeta-catenin survival functions in liver cancer. Cancer Res 2007;67:901–910.
62. Morin PJ, Sparks AB, Korinek V, et al. Activation of beta-catenin-Tcf signaling in colon cancer by mutations in beta-catenin or APC.Science 1997;275:1787–1790.
63. Yu J, Ma X, Cheung KF, et al. Epigenetic inactivation of T-boxtranscription factor 5, a novel tumor suppressor gene, is associ-ated with colon cancer. Oncogene 2010;29:6464–6474.
64. Garner C. Upward bias in odds ratio estimates from genome-wideassociation studies. Genet Epidemiol 2007;31:288–295.
65. Setiawan VW, Haessler J, Schumacher F, et al. HNF1B and endo-metrial cancer risk: results from the PAGE study. PLoS One 2012;7:e30390.
66. Lindstrom S, Schumacher FR, Campa D, et al. Replication of fiveprostate cancer loci identified in an Asian population–results fromthe NCI Breast and Prostate Cancer Cohort Consortium (BPC3).
Cancer Epidemiol Biomarkers Prev 2012;21:212–216.67. Dumitrescu L, Carty CL, Taylor K, et al. Genetic determinants oflipid traits in diverse populations from the population architectureusing genomics and epidemiology (PAGE) study. PLoS Genet2011;7:e1002138.
68. Buyske S, Wu Y, Carty CL, et al. Evaluation of the metabochipgenotyping array in African Americans and implications for finemapping of GWAS-identified loci: the PAGE study. PLoS One 2012;7:e35651.
69. Pritchard JK, Przeworski M. Linkage disequilibrium in humans:models and data. Am J Hum Genet 2001;69:1–14.
70. Newton-Cheh CN, Eijgelsheim M, Rice KM, et al. Common variantsat ten loci infuence QT interval duration in the QTGEN Study. NatGenet 2009;41:399–406.
Author names in bold designate shared co-first authorship.Received August 10, 2012. Accepted December 14, 2012.
Reprint requestsAddress requests for reprints to: Ulrike Peters, PhD, MPH, Fred
Hutchinson Cancer Research Center, 1100 Fairview Avenue North,M4-B402, PO Box 19024, Seattle, Washington 98109-1024. e-mail:[email protected]; fax: (206) 667-7850; or Li Hsu, PhD, FredHutchinson Cancer Research Center, 1100 Fairview Avenue North,M2-B500, Seattle, Washington 98109-1024. e-mail: [email protected];fax: (206) 667-7004.
AcknowledgmentsThe authors wish to thank the following:Asian Consortium: The authors wish to thank the study
participants and research staff for their contributions andcommitment to this project, Regina Courtney for DNA preparation,and Jing He for data processing and analyses.
The french Association STudy Evaluating RISK for sporadiccolorectal cancer: The authors are very grateful to Dr Bruno Buecherwithout whom this project would not have existed. The authors alsothank all those who agreed to participate in this study, including thepatients and the healthy control persons, as well as all thephysicians, technicians, and students.
Darmkrebs: Chancen der Verhütung durch Screening: The authorsthank all participants and cooperating clinicians, and Ute Handte-Daub, Renate Hettler-Jensen, Utz Benscheid, Muhabbet Celik, andUrsula Eilber for excellent technical assistance.
GECCO: The authors would like to thank all those at the GECCOCoordinating Center for helping to bring together the data andpeople who made this project possible.
Health Professionals Follow-up Study, Nurses’ Health Study, andPhysicians’ Health Study: The authors would like to acknowledgePatrice Soule and Hardeep Ranu of the Dana Farber Harvard CancerCenter High-Throughput Polymorphism Core who assisted in thegenotyping for Nurses’ Health Study, Health Professionals Follow-upStudy, and Physician’s Health Study under the supervision of DrImmaculata Devivo and Dr David Hunter, Qin (Carolyn) Guo, andLixue Zhu who assisted in programming for Nurses’ Health Study andHealth Professionals Follow-up Study, and Haiyan Zhang whoassisted in programming for the Physicians’ Health Study. Theauthors would like to thank the participants and staff of the Nurses’Health Study and the Health Professionals Follow-up Study for theirvaluable contributions as well as the following state cancer registriesfor their help: AL, AZ, AR, CA, CO, CT, DE, FL, GA, IA, ID, IL, IN, KY,LA, MA, MD, ME, MI, NC, ND, NE, NH, NJ, NY, OH, OK, OR, PA, RI, SC,TN, TX, VA, WA, and WY.
Prostate, Lung, Colorectal Cancer, and Ovarian Cancer ScreeningTrial: The authors thank Drs Christine Berg and Philip Prorok,Division of Cancer Prevention, National Cancer Institute, theScreening Center investigators and staff of the Prostate, Lung,Colorectal Cancer, and Ovarian Cancer Screening Trial, Mr Tom Rileyand staff of Information Management Services, Inc, Ms BarbaraO’Brien and staff of Westat, Inc, and Drs Bill Kopp, Wen Shao, and
staff of SAIC-Frederick. Most importantly, the authors acknowledge
BA
SIC
AN
DTR
AN
SLA
TIO
NA
LA
T
April 2013 GENOME–WIDE SCAN FOR COLORECTAL TUMORS 807
the study participants for their contributions to making this studypossible.
Postmenopausal Hormone study: The authors would like to thankthe study participants and staff of the Hormones and Colon Cancerstudy.
Tennessee Colorectal Polyp Study: The authors thank the studyparticipants and the research staff for their contributions andcommitment to this project, and Regina Courtney for DNApreparation.
Women’s Health Initiative: The authors thank the Women’s HealthInitiative investigators and staff for their dedication, and the studyparticipants for making the program possible. A full listing ofWomen’s Health Initiative investigators can be found at:https://cleo.whi.org/researchers/Documents%20%20Write%20a%20Paper/WHI%20Investigator%20Short%20List.pdf.
Conflicts of interestThe authors disclose no conflicts.
FundingThe Genetics and Epidemiology of Colorectal Cancer Consortium
study was supported by the National Cancer Institute, NationalInstitutes of Health, and the US Department of Health and HumanServices (U01 CA137088; R01 CA059045). The Asian Consortiumwas supported by a Grant-in-aid for Cancer Research, the Grant forthe Third Term Comprehensive Control Research for Cancer andGrants-in-Aid for Scientific Research from the Japanese Ministry ofEducation, Culture, Sports, Science and Technology (17015018 and221S0001). The french Association STudy Evaluating RISK forsporadic colorectal cancer was supported by a Hospital ClinicalResearch Program (PHRC) and by the Regional Council of Pays de laLoire, the Groupement des Entreprises Françaises dans la LutteContre le Cancer, the Association Anne de Bretagne Génétique, andthe Ligue Régionale Contre le Cancer. The Assessment of Risk inColorectal Tumours in Canada study was supported by the NationalInstitutes of Health through funding allocated to the Ontario Registryfor Studies of Familial Colorectal Cancer (U01 CA074783; see theColon Cancer Family Registry support section below); and by a GL2grant from the Ontario Research Fund, the Canadian Institutes ofHealth Research, by a Cancer Risk Evaluation Program grant fromthe Canadian Cancer Society Research Institute, and by SeniorInvestigator Awards (T.J.H. and B.W.Z.) from the Ontario Institute forCancer Research, through generous support from the OntarioMinistry of Economic Development and Innovation. The HawaiiColorectal Cancer Studies 2 and 3 studies were supported by theNational Institutes of Health (R01 CA60987). The Colon CancerFamily Registry was supported by the National Institutes of Health(RFA CA-95-011) and through cooperative agreements with membersof the Colon Cancer Family Registry and P.I.s. This genome-widescan was supported by the National Cancer Institute, NationalInstitutes of Health (U01 CA122839). The content of this manuscriptdoes not necessarily reflect the views or policies of the NationalCancer Institute or any of the collaborating centers in the cancerfamily registries, nor does mention of trade names, commercialproducts, or organizations imply endorsement by the US Governmentor the cancer family registries. The following colon cancer familyregistries centers contributed data to this article and were supportedby National Institutes of Health: the Australasian Colorectal CancerFamily Registry (U01 CA097735), Seattle Colorectal Cancer FamilyRegistry (U01 CA074794), and the Ontario Registry for Studies ofFamilial Colorectal Cancer (U01 CA074783). The Darmkrebs:Chancen der Verhütung durch Screening study was supported by theGerman Research Council (Deutsche Forschungsgemeinschaft, BR1704/6-1, BR 1704/6-3, BR 1704/6-4, and CH 117/1-1), and the
German Federal Ministry of Education and Research (01KH0404 and01ER0814). The Diet, Activity, and Lifestyle Study was supported bythe National Institutes of Health (R01 CA48998 to M.L.S.);Guangzhou-1 was supported by the National Key Scientific andTechnological Project (2011ZX09307-001-04) and the National BasicResearch Program (2011CB504303) was supported by the People’sRepublic of China. The Health Professionals Follow-up Study wassupported by the National Institutes of Health (P01 CA 055075, UM1CA167552, R01 137178, and P50 CA 127003), the Nurses’ HealthStudy was supported by the National Institutes of Health (R01137178, P01 CA 087969, and P50 CA 127003), and the Physicians’Health Study was supported by the National Institutes of Health(CA42182). The Korean Cancer Prevention Study-II study wassupported by the National R&D Program for cancer control(1220180), and the Seoul R&D Program (10526, Republic of Korea).The Multiethnic Cohort study was supported by the NationalInstitutes of Health (R37 CA54281, P01 CA033619, and R01CA63464). The Prostate, Lung, Colorectal Cancer, and OvarianCancer Screening Trial was supported by the Intramural ResearchProgram of the Division of Cancer Epidemiology and Genetics, andsupported by contracts from the Division of Cancer Prevention,National Cancer Institute, National Institutes of Health, Departmentof Health and Human Services. Control samples were genotyped aspart of the Cancer Genetic Markers of Susceptibility prostate cancerscan, supported by the Intramural Research Program of the NationalCancer Institute. The data sets used in this analysis were accessedwith appropriate approval through the dbGaP online resource (http://www.cgems.cancer.gov/data_acess.html) through dbGaP accessionnumber 000207v.1p1. Control samples also were genotyped as partof the GWAS of Lung Cancer and Smoking (Yeager, M et al. NatGenet 2008;124:161-170). Support for this work was providedthrough the National Institutes of Health, Genes, Environment andHealth Initiative (Z01 CP 010200). The human subjects participatingin the genome-wide association study were derived from theProstate, Lung, Colon, and Ovarian Screening Trial and the study wassupported by intramural resources of the National Cancer Institute.Assistance with genotype cleaning, as well as with general studycoordination, was provided by the Gene Environment AssociationStudies, Geneva Coordinating Center (U01 HG004446). Assistancewith data cleaning was provided by the National Center forBiotechnology Information. Funding support for genotyping, whichwas performed at the Johns Hopkins University Center for InheritedDisease Research, was provided by the National Institutes of Health,Genes, Environment and Health Initiative (U01 HG 004438). The datasets used for the analyses described in this article were obtainedfrom dbGaP at http://www.ncbi.nlm.nih.gov/gap through dbGaPaccession number phs000093 v2.p2. The Postmenopausal HormoneStudy was supported by the National Institutes of Health (R01CA076366 to P.A.N.). The Shanghai-1 and Shanghai-2 studies weresupported by the National Institutes of Health (R37CA070867,R01CA082729, R01CA124558, R01CA148667, and R01CA122364),as well as an Ingram Professorship and Research Reward funds fromthe Vanderbilt University School of Medicine. The TennesseeColorectal Polyp Study was supported by the National Institutes ofHealth (P50CA95103 and R01CA121060) and was conducted by theSurvey and Biospecimen Shared Resource, which was supported inpart by the Vanderbilt-Ingram Cancer Center (P30 CA 68485). TheVITamins And Lifestyle study was supported by the NationalInstitutes of Health (K05 CA154337). The Women’s Health Initiativeprogram was funded by the National Heart, Lung, and BloodInstitute, National Institutes of Health, US Department of Health andHuman Services, through contracts HHSN268201100046C,HHSN268201100001C, HHSN268201100002C,HHSN268201100003C, HHSN268201100004C, and
HHSN271201100004C.
ssm
GTft
ct
dpayntirtpgT
807.e1 PETERS ET AL GASTROENTEROLOGY Vol. 144, No. 4
Supplementary Materials and Methods
Study Populations Included in GWAS andFollow-up StudiesGWAS in GECCO and CCFR. We describe each
tudy population used in the GWAS. For information onample sizes and demographic factors please see Supple-
entary Table 1.Ontario Familial Colorectal Cancer Registry. In
ECCO, a subset of the Assessment of Risk in Colorectalumours in Canada from the OFCCR (Ontario Registry
or Studies of Familial Colorectal Cancer) was used. Bothhe case-control study1 and the OFCCR2 have been de-
scribed in detail previously, as have the GWAS results.3 Inbrief, cases were confirmed incident colorectal cancercases if they were ages 20 to 74 years, residents of On-tario, identified through comprehensive registry, and di-agnosed between July 1997 and June 2000. Population-based controls were selected randomly among Ontarioresidents (random-digit dialing and listing of all Ontarioresidents), and matched by sex and 5-year age groups. Atotal of 1236 colorectal cancer cases and 1223 controlswere genotyped successfully on at least one of the follow-ing: Illumina 1536 GoldenGate assay (Illumina, Inc, SanDiego, CA), the Affymetrix GeneChip Human Mapping100K and 500K Array Set (Affymetrix, Inc, Santa Clara,CA), or a 10K nonsynonymous SNP chip. Analysis wasbased on a set of unrelated subjects who were non-Hispanic, white by self-report, or by investigation of ge-netic ancestry. We further excluded subjects if there wasa sample mix-up, if they were missing epidemiologicquestionnaire data, if they were cases with a tumor in theappendix, or if they overlapped with the CCFR. In addi-tion, only samples genotyped on the Affymetrix Ge-neChip 500K Array were used to avoid coverage issues inimputation.
The french Association STudy Evaluating RISKfor sporadic colorectal cancer. Participants were re-ruited from the Pays de la Loire region in France be-ween December 2002 and March 2006.4 Eligibility crite-
ria for cases included being Caucasian, age 40 years orolder at diagnosis, and having no family history of colo-rectal cancer or polyps. Cases were patients with firstprimary colorectal cancer diagnosed in 1 of the 6 publichospitals and 5 clinics located in the Pays de la Loireregion that participated in the study. Cases were con-firmed based on medical and pathology reports. Controlswere recruited at 2 Health Examination Centers of thePays de la Loire region, and the recruitment of controlsage 70 years and older was completed in the Departmentsof Internal Medicine and Hepatogastroenterology of theUniversity Hospital Center of Nantes, located in the sameregion. Controls were eligible to participate if they wereCaucasian, age 40 years or older, and had no familyhistory of colorectal cancer or polyps. In the presence of
the physician, each participant filled out a standardizedquestionnaire on family information, medical history,lifestyle, and dietary intake. Cases and controls provideda blood sample.
CCFR. The CCFR is a National Cancer Institute–supported consortium consisting of 6 centers dedicatedto the establishment of a comprehensive collaborativeinfrastructure for interdisciplinary studies in the geneticepidemiology of colorectal cancer.5 The CCFR includes
ata from approximately 30,500 total subjects (10,500robands and 20,000 unaffected and affected relativesnd unrelated controls). Cases and controls, age 20 –74ears, were recruited at the 6 participating centers begin-ing in 1998. CCFR implemented a standardized ques-ionnaire that was administered to all participants andncluded established and suspected risk factors for colo-ectal cancer, which included questions on medical his-ory and medication use, reproductive history (for femalearticipants), family history, physical activity, demo-raphics, alcohol and tobacco use, and dietary factors.he set 1 scan, which has been described previously,6
included population-based cases and age-matched con-trols from the 3 population-based centers: Seattle, To-ronto, and Australia. Cases were enriched genetically byoversampling those with a young age at onset or positivefamily history. Controls were matched to cases on ageand sex. All cases and controls were self-reported aswhite, which was confirmed with genotype data. The set2 scan included population-based cases and matchedcontrols from all 6 colon CFR centers including the MayoClinic, Hawaii Cancer Registry, University of SouthernCalifornia, Fred Hutchinson Cancer Research Center,Ontario Cancer Care, and University of Melbourne. Aswith set 1, cases were enriched genetically by oversam-pling those with a young age at onset or positive familyhistory. Controls were same-generation family controls.
Darmkrebs: Chancen der Verhütung durchScreening. This study was initiated as a large popula-tion-based, case-control study in 2003 in the Rhine-Neckar-Odenwald region (southwest region of Germany)to assess the potential of endoscopic screening for reduc-tion of colorectal cancer risk and to investigate etiologicdeterminants of disease, particularly lifestyle/environ-mental factors and genetic factors.7,8 Cases with a firstdiagnosis of invasive colorectal cancer (InternationalClassification of Diseases 10 codes C18-C20) who were atleast 30 years of age (no upper age limit), German speak-ing, a resident in the study region, and mentally andphysically able to participate in a 1-hour interview wererecruited by their treating physicians either in the hospi-tal a few days after surgery or by mail after dischargefrom the hospital. Cases were confirmed based on histo-logic reports and hospital discharge letters after diagno-sis of colorectal cancer. All hospitals treating colorectalcancer patients in the study region participated. Based onestimates from population-based cancer registries, more
than 50% of all potentially eligible patients with incident
trdJ
OnA
April 2013 GENOME–WIDE SCAN FOR COLORECTAL TUMORS 807.e2
colorectal cancer in the study region were included. Com-munity-based controls were selected randomly from pop-ulation registries, using frequency matching with respectto age (5-year groups), sex, and county of residence.Controls with a history of colorectal cancer were ex-cluded. Controls were contacted by mail and follow-uptelephone calls. The participation rate was 51%. Duringan in-person interview, data were collected on demo-graphics, medical history, family history of colorectalcancer, and various lifestyle factors, as were blood andmouthwash samples. The set 1 scan consisted of a subsetof participants recruited up until 2007, and samples werefrequency matched on age and sex. The set 2 scan con-sisted of additional subjects who were recruited until2010 as part of this ongoing study.
Diet, Activity, and Lifestyle Study. DALS (Diet,Activity, and Lifestyle Study) was a population-based,case-control study of colon cancer. Participants were re-cruited between 1991 and 1994 from 3 locations: theKaiser Permanente Medical Care Program of NorthernCalifornia, an 8-county area in Utah, and the metropol-itan Twin Cities area of Minnesota.9 Eligibility criteria forcases included age at diagnosis between 30 and 79 years;diagnosis with first primary colon cancer (InternationalClassification of Diseases for Oncology second editioncodes 18.0 and 18.2–18.9) between October 1, 1991, andSeptember 30, 1994; English speaking; and competencyto complete the interview. Individuals with cancer of therectosigmoid junction or rectum were excluded, as werethose with a pathology report noting familial adenoma-tous polyposis, Crohn’s disease, or ulcerative colitis. Arapid-reporting system was used to identify all incidentcases of colon cancer, resulting in the majority of casesbeing interviewed within 4 months of diagnosis. Controlsfrom the Kaiser Permanente Medical Care Program wereselected randomly from membership lists. In Utah, con-trols younger than 65 years of age were selected randomlythrough random-digit dialing and driver’s license lists.Controls, 65 years of age and older, were selected ran-domly from Health Care Financing Administration lists.In Minnesota, controls were identified from Minnesotadriver’s licenses or state identification lists. Controls werematched to cases by 5-year age groups and sex. The set Iscan consisted of a subset of the study designed earlier,from Utah, Minnesota, and the Kaiser Permanente Med-ical Care Program, and was restricted to subjects whoself-reported as white non-Hispanic. The set 2 scan con-sisted of subjects from Utah and Minnesota who werenot genotyped in set 1. Set 2 was restricted to subjectswho self-reported as white non-Hispanic and those whohad appropriate consent to post data to dbGaP.
Hawaii Colorectal Cancer Studies 2 and 3. Pa-ients with colorectal cancer were identified through theapid reporting system of the Hawaii Surveillance, Epi-emiology and End Results registry and consisted of all
apanese, Caucasian, and native Hawaiian residents of
ahu who were newly diagnosed with an adenocarci-oma of the colon or rectum between January 1994 andugust 1998.10 Control subjects were selected from par-
ticipants in an ongoing population-based health surveyconducted by the Hawaii State Department of Healthand from Health Care Financing Administration partic-ipants. Controls were matched to cases by sex, ethnicity,and age (within 2 years). Personal interviews were ob-tained from 768 matched pairs, resulting in a participa-tion rate of 58.2% for cases and 53.2% for controls. Aquestionnaire, administered during an in-person inter-view, included questions about demographics, lifetimehistory of tobacco, alcohol use, aspirin use, physical ac-tivity, personal medical history, family history of colorec-tal cancer, height and weight, diet (Food Frequency Ques-tionnaire), and postmenopausal hormone use. A bloodsample was obtained from 548 (71%) interviewed casesand 662 (86%) interviewed controls. Surveillance, Epide-miology and End Results staging information was ex-tracted from the Hawaii Tumor Registry. In GECCO,self-reported Caucasian subjects with DNA, and clinicaland epidemiologic data, were selected for genotyping.
Health Professionals Follow-up Study. TheHPFS (Health Professionals Follow-up Study) is a parallelprospective study to the NHS (Nurses’ Health Study).11
The HPFS cohort comprised 51,529 men who, in 1986,responded to a mailed questionnaire. The participantswere US male dentists, optometrists, osteopaths, podia-trists, pharmacists, and veterinarians born between 1910and 1946. Participants provided information on health-related exposures, including current and past smokinghistory, age, weight, height, diet, physical activity, aspirinuse, and family history of colorectal cancer. Colorectalcancer and other outcomes were reported by participantsor next-of-kin and were followed up through review ofthe medical and pathology record by physicians. Overall,more than 97% of self-reported colorectal cancers wereconfirmed by medical record review. Information wasabstracted on histology and primary location. Incidentcases were defined as those occurring after the subjectprovided the blood sample. Prevalent cases were definedas those occurring after enrollment in the study butbefore the subject provided the blood sample. Follow-upevaluation has been excellent, with 94% of the men re-sponding to date. Colorectal cancer cases were ascer-tained through January 1, 2008. In 1993–1995, 18,825men in the HPFS mailed blood samples by overnightcourier, which were aliquoted into buffy coat and storedin liquid nitrogen. In 2001–2004, 13,956 men in theHPFS who had not provided a blood sample previouslymailed in a swish-and-spit sample of buccal cells. Inci-dent cases were defined as those occurring after thesubject provided a blood or buccal sample. Prevalentcases were defined as those occurring after enrollment inthe study in 1986, but before the subject provided either
a blood or buccal sample. After excluding participants
9totbttwtTi
RaCbGcc
13t
807.e3 PETERS ET AL GASTROENTEROLOGY Vol. 144, No. 4
with histories of cancer (except nonmelanoma skin can-cer), ulcerative colitis, or familial polyposis, 2 case-controlsets were constructed from which DNA was isolated fromeither buffy coat or buccal cells for genotyping, as fol-lows: (1) a case-control set with cases of colorectal cancermatched to randomly selected controls who provided ablood sample and were free of colorectal cancer at thesame time the colorectal cancer was diagnosed in thecases; and (2) a case-control set with cases of colorectalcancer matched to randomly selected controls who pro-vided a buccal sample and were free of colorectal cancerat the same time the colorectal cancer was diagnosed inthe case. For both case-control sets, matching criteriaincluded year of birth (within 1 year) and month/year ofblood or buccal cell sampling (within 6 months). Caseswere pair-matched 1:1, 1:2, or 1:3 with a controlparticipant(s).
In addition to colorectal cancer cases and controls, aset of adenoma cases and matched controls with availableDNA from buffy coat were selected for genotyping. Overthe follow-up period, data were collected on endoscopicscreening practices and, if individuals had been diag-nosed with a polyp, the polyps were confirmed to beadenomatous by medical record review. Adenoma caseswere ascertained through January 1, 2008. A separatecase-control set was constructed of participants diag-nosed with advanced adenoma matched to control par-ticipants who underwent a lower endoscopy in the sametime period and did not have an adenoma. Advancedadenoma was defined as an adenoma 1 cm or larger indiameter and/or with tubulovillous, villous, or high-grade dysplasia/carcinoma-in-situ histology. Matchingcriteria included year of birth (within 1 year) and month/year of blood sampling (within 6 months), the reason fortheir lower endoscopy (screening, family history, orsymptoms), and the time period of any prior endoscopy(within 2 years). Controls matched to cases with a distaladenoma either had a negative sigmoidoscopy or colono-scopy examination, and controls matched to cases withproximal adenoma all had a negative colonoscopy.
Multiethnic Cohort study. The MEC (MultiethnicCohort) was initiated in 1993 to investigate the impact ofdietary and environmental factors on major chronic dis-eases, particularly cancer, in ethnically diverse popula-tions in Hawaii and California.12 The study recruited
6,810 men and 118,441 women aged 45–75 years be-ween 1993 and 1996. Incident colorectal cancer casesccurring since January 1995 and controls were con-acted for blood or saliva samples. The median intervaletween diagnosis and blood draw was 14 months (in-erquartile range, 10 –19 mo) among cases and the par-icipation rate was 74%. A sample of cohort participantsas selected randomly to serve as controls at the onset of
he nested case-control study (participation rate, 66%).he selection was stratified by sex, age, and race/ethnic-
ty. Colorectal cancer cases were identified through the
apid Reporting System of the Hawaii Tumor Registrynd through quarterly linkage to the Los Angeles Countyancer Surveillance Program. Both registries are mem-ers of Surveillance, Epidemiology and End Results. InECCO, self-reported white subjects from the nested
ase-control study described earlier with DNA and clini-al and epidemiologic data were selected for genotyping.
Nurses’ Health Study. The NHS cohort began in976 when 121,700 married female registered nurses age0 –55 years returned the initial questionnaire that ascer-ained a variety of important health-related exposures.13
Since 1976, follow-up questionnaires have been mailedevery 2 years. Colorectal cancer and other outcomes werereported by participants or next-of-kin and followed upthrough review of the medical and pathology record byphysicians. Overall, more than 97% of self-reported colo-rectal cancers were confirmed by medical-record review.Information was abstracted on histology and primarylocation. The rate of follow-up evaluation has been high:as a proportion of the total possible follow-up time,follow-up evaluation has been more than 92%. Colorectalcancer cases were ascertained through June 1, 2008. In1989 –1990, 32,826 women in NHS I mailed blood sam-ples by overnight courier, which were aliquoted intobuffy coat and stored in liquid nitrogen. In 2001–2004,29,684 women in NHS I who did not previously providea blood sample mailed a swish-and-spit sample of buccalcells. Incident cases were defined as those occurring afterthe subject provided a blood or buccal sample. Prevalentcases were defined as those occurring after enrollment inthe study in 1976 but before the subject provided eithera blood or buccal sample. After excluding participantswith histories of cancer (except nonmelanoma skin can-cer), ulcerative colitis, or familial polyposis, 2 case-controlsets were constructed from which DNA was isolated fromeither buffy coat or buccal cells for genotyping: (1) acase-control set with cases of colorectal cancer matchedto randomly selected controls who provided a bloodsample and were free of colorectal cancer at the sametime the colorectal cancer was diagnosed in the case; and(2) a case-control set with cases of colorectal cancermatched to randomly selected controls who provided abuccal sample and were free of colorectal cancer at thesame time the colorectal cancer was diagnosed in thecases. For both case-control sets, matching criteria in-cluded year of birth (within 1 year) and month/year ofblood or buccal cell sampling (within 6 months). Caseswere pair matched 1:1, 1:2, or 1:3 with a controlparticipant(s).
In addition to colorectal cancer cases and controls, aset of adenoma cases and matched controls with availableDNA from buffy coat were selected for genotyping. Overthe follow-up period, data were collected on endoscopicscreening practices and, if individuals had been diag-nosed with a polyp, the polyps were confirmed to be
adenomatous by medical record review. Adenoma cases
aa
g
c
apwbcoto
aswisCceWuFaoIbps
April 2013 GENOME–WIDE SCAN FOR COLORECTAL TUMORS 807.e4
were ascertained through June 1, 2008. A separate case-control set was constructed of participants diagnosedwith advanced adenoma matched to control participantswho underwent a lower endoscopy in the same timeperiod and did not have an adenoma. Advanced adenomawas defined as an adenoma more than 1 cm in diameterand/or with tubulovillous, villous, or high-grade dyspla-sia/carcinoma-in-situ histology. Matching criteria in-cluded year of birth (within 1 year) and month/year ofblood sampling (within 6 months), the reason for theirlower endoscopy (screening, family history, or symp-toms), and the time period of any prior endoscopy(within 2 years). Controls matched to cases with a distaladenoma either had a negative sigmoidoscopy or colono-scopy examination, and controls matched to cases withproximal adenoma all had a negative colonoscopy.
Physicians’ Health Study. The PHS (Physicians’Health Study) was established as a randomized, double-blind, placebo-controlled trial of aspirin and �-carotene
mong 22,071 healthy US male physicians, between 40nd 84 years of age, in 1982.14,15 Participants completed 2
mailed questionnaires before being assigned randomly,additional questionnaires at 6 and 12 months, and ques-tionnaires annually thereafter. In addition, participantswere sent postcards at 6 months to ascertain status. FromAugust 1982 to December 1984, there were 14,916 base-line blood samples collected from the physicians duringthe run-in phase before randomization. When partici-pants reported a diagnosis of cancer, medical records andpathology reports were reviewed by study physicians whowere blinded to exposure data. Among those who pro-vided baseline blood samples, colorectal cases were ascer-tained through March 31, 2008, and controls werematched on age (within 1 year for younger participants,up to 5 years for older participants) and smoking status(never, past, current). Cases were pair-matched 1:1, 1:2, or1:3 with a control participant(s). Because of DNA avail-ability, samples were genotyped in 2 batches on the sameplatform at the same genotyping center at different timepoints.
Prostate, Lung, Colorectal, and Ovarian CancerScreening Trial. The PLCO (Prostate, Lung, ColorectalCancer, and Ovarian Cancer Screening Trial) enrolled154,934 participants (men and women, aged between 55and 74 y) at 10 centers into a large, randomized, 2-armtrial to determine the effectiveness of screening to reducecancer mortality. Sequential blood samples were collectedfrom participants assigned to the screening arm. Partic-ipation was 93% at the baseline blood draw. In the ob-servational (control) arm, buccal cells were collected viamail using the swish-and-spit protocol; the participationrate was 65%. Details of this study have been describedpreviously16,17 and are available online (http://dcp.cancer.
ov/plco).The set 1 scan included a subset of 577 colon cancer
ases self-reported as being non-Hispanic white with
vailable DNA samples, questionnaire data, and appro-riate consent for ancillary epidemiologic studies. Casesere excluded if they had a history of inflammatoryowel disease, polyps, polyposis syndrome, or cancer (ex-luding basal or squamous cell skin cancer). Controlsriginated from the Cancer Genetic Markers of Suscep-ibility prostate cancer scan18,19 (all male) and the GWASf Lung Cancer and Smoking20 (enriched for smokers),
along with an additional 92 non-Hispanic white femalecontrols. For the set 2 scan, cases were individuals withcolorectal cancer from both arms of the trial who werenot already included in set 1. Samples were excluded ifparticipants did not sign appropriate consent forms, ifDNA was unavailable, if baseline questionnaire data withfollow-up evaluation were unavailable, if they had a his-tory of colon cancer before the trial, if they had a rarecancer, if they were already in a colon GWAS, or if theywere a control in the prostate or lung populations. Con-trols were frequency-matched 1:1 to cases without re-placement, and cases were not eligible to be controls.Matching criteria were age at enrollment (2-year blocks),enrollment date (2-year blocks), sex, race/ethnicity, trialarm, and study year of diagnosis (ie, controls must becancer free into the case’s year of diagnosis).
Postmenopausal Hormones Supplementary Studyto the CCFR. Eligible case patients included all femaleresidents, ages 50 –74 years, residing in the 13 counties inWashington State, reporting to the Cancer Surveillance,Epidemiology and End Results program, who were newlydiagnosed with invasive colorectal adenocarcinoma(ICD-O C18.0, C18.2–C18.9, C19.9, C20.0 –C20.9) be-tween October 1998 and February 2002.21 Eligibility for
ll individuals was limited to those who were Englishpeaking with available telephone numbers, throughhich they could be contacted. On average, cases were
dentified within 4 months of diagnosis. The overall re-ponse proportion of eligible cases identified was 73%.ommunity-based controls were selected randomly ac-
ording to age distribution (in 5-year age intervals) of theligible cases by using lists of licensed drivers from the
ashington State Department of Licensing for individ-als, ages 50 – 64 years, and rosters from the Health Careinancing Administration (now the Centers for Medicarend Medicaid), for individuals older than age 64. Theverall response proportion of eligible controls was 66%.n GECCO, samples with sufficient DNA extracted fromlood were genotyped. Only participants who were notart of the CCFR Seattle site were included in the sampleet.
VITamins And Lifestyle. The VITAL (VITaminsAnd Lifestyle) cohort comprised 77,721 WashingtonState men and women aged 50 –76 years, recruited from2000 to 2002, to investigate the association of supple-ment use and lifestyle factors with cancer risk. Subjectswere recruited by mail, from October 2000 to December
2002, using names purchased from a commercial mailing
cctrnlBa1rctt
ccbctttystFtsacnptisMeVtesrw
amrao
tudweiwSctcnp
807.e5 PETERS ET AL GASTROENTEROLOGY Vol. 144, No. 4
list. All subjects completed a 24-page questionnaire andbuccal-cell specimens for DNA were self-collected by 70%of the participants. Subjects were followed up for cancerby linkage to the western Washington Surveillance, Epi-demiology and End Results cancer registry and werecensored when they moved out of the area covered by theregistry or at time of death. Details of this study havebeen described previously.22 In GECCO, a nested case-ontrol set was genotyped. Samples included colorectalancer cases with DNA, excluding subjects with colorec-al cancer before baseline; in situ cases; (large cell) neu-oendocrine carcinoma; squamous cell carcinoma; carci-oid tumor; Goblet-cell carcinoid; and any type of
ymphoma, including non-Hodgkin, Mantle cell, large-cell, or follicular lymphoma. Controls were matched onge at enrollment (within 1 year), enrollment date (withinyear), sex, and race/ethnicity. One control was selected
andomly per case among all controls who matched ac-ording to the 4 factors described earlier and for whomhe control follow-up time was greater than the follow-upime of the case until diagnosis.
Women’s Health Initiative. The WHI (Women’sHealth Initiative) is a long-term health study of 161,808post-menopausal women aged 50 –79 years at 40 clinicalcenters throughout the United States. WHI comprised aclinical trial arm, an observational study (OS) arm, andseveral extension studies. The details of WHI have beendescribed previously23,24 and are available online (https://leo.whi.org/SitePages/Home.aspx). In GECCO, set 1ases were selected from the September 12, 2005, data-ase and comprised centrally adjudicated colon cancerases from the OS arm who self-reported as white. Con-rols were first selected among controls previously geno-yped as part of a hip fracture GWAS conducted withinhe WHI OS arm and matched to cases on age (within 3ears), enrollment date (within 365 days), hysterectomytatus, and prevalent conditions at baseline. For 37 cases,here was no control match in the hip fracture GWAS.or these participants, we identified a matched control inhe WHI OS arm based on the same criteria. In the set 2can, cases were selected from the August 2009 databasend comprised centrally adjudicated colon and colorectalancer cases from the OS and clinical trial arms who wereot genotyped in set 1. In addition, case and controlarticipants were subject to the following exclusion cri-eria: a prior history of colorectal cancer at baseline,nstitutional review board approval not available for dataubmission into dbGaP, and insufficient DNA available.
atching criteria included age (within years), race/thnicity, WHI date (within 3 years), WHI Calcium anditamin D study date (within 3 years), and randomiza-
ion arms (OS flag, hormone therapy assignments, di-tary modification assignments, calcium/vitamin D as-ignments). In addition, they were matched by the 4egions of randomization centers. Each case was matched
ith 1 control (1:1) who met the matching criteria ex-ctly. Control selection was performed in a time-forwardanner, selecting one control for each case first from the
isk set at the time of the case’s event. The matchinglgorithm was allowed to select the closest match basedn a criterion to minimize an overall distance measure.25
Each matching factor was given the same weight. Addi-tional available controls who were genotyped as part ofthe hip fracture GWAS were included to improve power.
Follow-up StudiesIn the following, we describe each study popula-
tion used in the follow-up study. For information onsample sizes and demographic factors please see Supple-mentary Table 1.
Asia Colorectal Cancer Consortium. The studyprotocols were approved by relevant institutional reviewboards at all study sites, and all included subjects pro-vided informed consent. Sample size, genotype platform,the number of SNPs used in imputation, and genomicinflation factors in each of the 5 studies are presented inSupplementary Table 8.
Shanghai study 1 and 2. Colorectal cancer caseswere derived from the Shanghai Women’s Health Study26
and the Shanghai Men’s Health Study,27 both popula-ion-based cohort studies that are being conducted inrban Shanghai, China. A total of 777 pathologicallyiagnosed colorectal cancer cases with DNA availableere identified in participants from the Shanghai Wom-
n’s Health Study and Shanghai Men’s Health Study andncluded in this study. A total of 758 cancer-free controlsere derived from the Shanghai Women’s Health Study/hanghai Men’s Health Study and frequency-matched toolorectal cancer cases by age and sex. To increase statis-ical power, we also included 2131 community femaleontrols who were scanned using the Affymetrix Ge-ome-Wide Human SNP Array 6.0 (Affymetrix 6.0) asart of an ongoing GWAS of breast cancer.28 A total of
481 cases and 2632 controls were genotyped using Af-fymetrix 6.0 (Shanghai Study 1). A total of 296 cases and257 controls were genotyped using Illumina HumanOm-niExpress BeadChip (Illumina OmniExpress) (ShanghaiStudy 2).
Guangzhou study 1. This study contributed 694cases and 972 controls. Histopathologically diagnosedcolorectal cancer cases were recruited from the Sun Yat-Sen University Cancer Center between January 2002 andJanuary 2012. Healthy controls were recruited from phys-ical examination centers of several large general hospitalsin Guangdong province communities.29 At enrollment,controls reported no history of any cancer. All cases andcontrols were self-reported Han Chinese who lived inGuangdong Province at the time of recruitment. Bloodsamples from all cases and controls were obtained as thesource of genomic DNA for the study.
Aichi study 1. This study is part of the Hospital-
based Epidemiologic Research Program at Aichi Cancer
otpC29ttcshc4wd
scf
mGa1oasu
sgcSH[DHPc(uIocp
i
April 2013 GENOME–WIDE SCAN FOR COLORECTAL TUMORS 807.e6
Center in Japan.30 All first-visit outpatients 20 –79 yearsf age at the Aichi Cancer Center during December 2000o November 2005 were asked to participate in the Hos-ital-based Epidemiologic Research Program at Aichiancer Center. Of 29,736 eligible patients approached,8,766 participated in the study, with a response rate of6.7%. All participants completed self-administered ques-ionnaires about their lifestyle and demographic charac-eristics and provided blood samples. Case status wasonfirmed via the Hospital-based Epidemiologic Re-earch Program at Aichi Cancer Center database and theospital-based cancer registry database. A total of 589olorectal cancer cases were identified in this cohort and97 were included in the GWAS. A total of 942 controlsithout any cancer at recruitment were selected ran-omly and frequency-matched to cases by age and sex.31
Korean Cancer Prevention Study-II. The KoreanCancer Prevention Study-II included 266,258 individuals,20 –77 years of age, who visited 16 health promotioncenters nationwide from April 2004 to December 2008 inSouth Korea.32 Subjects were interviewed at baseline toobtain exposure data. Cancer diagnoses were identifiedthrough 2008 using data from the national cancer regis-try and hospitalization records. For the study, we selected325 colorectal cancer patients who provided a bloodsample. Cancer-free cohort members (N � 977) wereselected randomly as controls.
Tennessee Colorectal Polyp Study. The Tennes-ee Colorectal Polyp Study was a colonoscopy-based,ase-control study conducted in Nashville, Tennessee,rom 2003 to 2011.33 Eligible participants, aged 40 –75
years old, were identified from patients at the VanderbiltGastroenterology Clinic and the Veteran’s Affairs Tennes-see Valley Health System Nashville Campus. Participantswere excluded if they had genetic colorectal cancer syn-dromes, a prior history of inflammatory bowel disease,prevalent adenomatous polyps, or any cancer other thannonmelanoma skin cancer. Colonoscopic procedureswere performed and reported using standard clinical pro-tocols and all pathology diagnoses were determined byhospital pathologists. Participants provided DNA eitherbefore or after colonoscopy (blood and buccal sampleswere collected). The analysis included only participantsof Caucasian race.
Genotyping, Quality Assurance/QC, andImputationGWAS in GECCO and CCFR. We conducted a
eta-analysis of GWAS from 13 studies within theECCO consortium (10,729 cases and 13,328 controls)
nd additional GWAS within the CCFR (1967 cases and785 controls). The GWAS from CCFR, which consistedf participants from sites in the United States, Canada,nd Australia, included a population-based, case-controlet (CCFR set 1, 1171 cases and 983 controls) genotyped
sing Illumina Human1M or Human1M-Duo,6 and a oibling-pair set (CCFR set 2, 796 cases and 802 controls)enotyped using Illumina Omni1. The GECCO GWASonsisted of participants within The french AssociationTudy Evaluating RISK for sporadic colorectal cancer;awaiian Colorectal Cancer Studies 2 and 3; DACHS
Darmkrebs: Chancen der Verhütung durch Screening];ALS; HPFS; MEC; NHS; OFCCR; PHS; Postmenopausalormone Study; PLCO; VITAL study; and the WHI.hase one genotyping of a total of 1709 colon cancerases and 4214 controls from PLCO, WHI, and DALSPLCO set 1, WHI set 1, and DALS set 1) was performedsing Illumina HumanHap 550K, 610K, or combined
llumina 300K and 240K, and has been described previ-usly.34 A total of 650 colorectal cancer cases and 522ontrols from OFCCR were included in GECCO fromrevious genotyping using Affymetrix platforms.3 A total
of 5540 colorectal cancer cases and 5425 controls fromthe The french Association STudy Evaluating RISK forsporadic colorectal cancer, Hawaiian Colorectal CancerStudies 2 and 3, DACHS set 1, DALS set 2, the MEC,Postmenopausal Hormone study, PLCO set 2, VITALstudy, and WHI set 2 were genotyped successfullyusing Illumina HumanCytoSNP. A total of 2004 colo-rectal cancer cases and 2244 controls from HPFS,NHS, PHS, and DACHS set 2, as well as a total of 826advanced adenoma cases and 923 controls from HPFSand NHS were genotyped successfully using IlluminaHumanOmniExpress.
DNA was extracted from blood samples or, for a subsetof DACHS, HPFS, MEC, NHS, and PLCO samples, andfor all VITAL samples, from buccal cells, using conven-tional methods. All studies included 1%– 6% blinded du-plicates to monitor the quality of the genotyping. Allindividual-level genotype data were managed and under-went quality assurance and QC at the University ofSouthern California (CCFR sets 1 and 2), the OFCCR, theUniversity of Washington Genetics Coordinating Center(HPFS, NHS, PHS, and DACHS set 2), or the GECCOCoordinating Center at the Fred Hutchinson Cancer Re-search Center (all other studies). Details on the qualityassurance/QC can be found in Supplementary Table 2. Inbrief, samples were excluded based on call rate, heterozy-gosity, unexpected duplicates, gender discrepancy, andunexpectedly high identity-by-descent or unexpected ge-notype concordance (�65%) with another individual. Allanalyses were restricted to samples clustering with theUtah residents with northern and western European an-cestry from the CEU population in principal componentanalysis, including the HapMap II populations as refer-ence. SNPs were excluded if they were triallelic, not as-signed an rs number, or were reported or observed as notperforming consistently across platforms. In addition,genotyped SNPs were excluded based on call rate (�98%),lack of HWE in controls (P � 1 � 10�4), and MAF (�5%n set 1 for PLCO, WHI, DALS, and OFCCR; �5/number
f samples for remaining studies).
Bb
Atag
eu5has9cH
tttabn
gtooi
awaaapawi
807.e7 PETERS ET AL GASTROENTEROLOGY Vol. 144, No. 4
Because imputation of genotypes is established as stan-dard practice in the analysis of genotype array data, allautosomal SNPs from all studies were imputed to theCEU population in HapMap II release 24, with the ex-ception of OFCCR, which was imputed to HapMapII release 22. CCFR sets 1 and 2 were imputed usingIMPUTE (available at: https://mathgen.stats.ox.ac.uk/impute/impute.html),35 OFCCR was imputed using
EAGLE (available at: http://faculty.washington.edu/rowning/beagle/beagle.html),36 and all other studies
were imputed using MACH (available at: www.sph.umich.edu/csg/abecasis/MACH/tour/).37 Imputed datawere merged with genotype data such that genotype datapreferentially were selected if a SNP had both types ofdata, unless there was a difference in terms of referenceallele frequency (�0.1) or position (�100 base pairs), inwhich case imputed data were used. Given the highagreement of imputation accuracy among MACH, IM-PUTE, and BEAGLE,38 the common practice to use dif-ferent imputation programs is unlikely to cause hetero-geneity39 and it has become common practice to combineresults across SNPs imputed using different programs. Asa measurement of imputation accuracy we calculated R2.
nalyses of imputed data had different QC cut-off valueshan those for directly genotyped SNPs discussed earliernd were restricted to SNPs with either a MAF of 1% orreater or an R2 value greater than 0.3, with the exception
of CCFR set 2, which was restricted to SNPs with both aMAF of 1% or greater and an R2 value of 0.3 or greater.After imputation and QC, a total of 2,708,280 SNPs wereused in the meta-analysis of the GECCO and CCFRstudies.
Follow-up studies. We selected the 10 most sta-tistically significant regions (excluding known GWASloci) based on the P value from the GECCO and CCFRmeta-analyses for follow-up evaluation in colorectal can-cer studies in Asian populations and adenoma studies inpopulations of European descent.
The Asian colorectal cancer follow-up study compriseda meta-analysis of 5 studies conducted in China, Japan,and South Korea, including 2293 colorectal cancer casesand 5780 controls. Cases and controls were genoty-ped using multiple SNP arrays, including AffymetrixGenome-Wide Human SNP Array 6.0, Affymetrix Ge-nome-Wide Human SNP Array 5.0, Illumina InfiniumHumanHap610 BeadChip, Illumina Human610-QuadBeadChip, and Illumina HumanOmniExpress BeadChip.Samples were excluded based on low call rate (�95%),heterozygosity, unexpected duplicates, gender discrep-ancy, and outlying population substructure. After qualitycontrol exclusions, 2098 cases and 5749 controls re-mained in the analysis. SNPs were excluded for low callrate (�95%), low genotype concordance (�95%) amongpositive QC samples, an MAF less than 5%, or an HWE Pvalue less than 1 � 10�5 in controls. For each of the 5
studies, SNPs were imputed for autosomal SNPs that Hwere present in HapMap Japanese in Tokyo, Japan�HanChinese individuals from Beijing, China Phase 2 release22 using MACH.37 SNPs with an R2 value greater than 0.5were included in the analysis.
The colorectal adenoma follow-up study consisted of aUS-based GWAS of 1049 cases and 987 controls.33 DNAxtracted from blood and buccal samples were genotypedsing the Affymetrix Genome-Wide Human SNP Array.0. Samples were excluded based on low call rate (�95%),eterozygosity, unexpected duplicates, gender discrep-ncy, identity-by-descent, and outlying population sub-tructure. After quality control exclusions, 958 cases and09 controls remained in the analysis. SNPs were ex-luded for low call rate (�95%), MAF less than 1%, orWE P value less than 1 � 10�6. After quality control
exclusions, a total of 402,326 SNPs remained in theanalysis. Data were imputed to the 1000 Genomes Projectand HapMap Phase 3 using IMPUTE.35 SNPs with an R2
value greater than 0.5 were included in the analysis.
Details on Functional Annotation FindingsUsing Bioinformatic DatabasesThere are several bioinformatic tools available for
the post-GWAS functional characterization of putativedisease-causing loci through the University of California,Santa Cruz genome browser.40 Annotation of non–pro-ein-coding regions operates under the hypothesis thatrait-associated alleles exert their effects by influencingranscriptional levels through multiple regulatory mech-nisms. The University of California, Santa Cruz genomerowser provides several tracks that can be used to an-otate enhancers, promoters, insulators, and silencers40
(for details see Supplementary Table 9). Such tools helpexpedite the discovery of causal variants by isolating afew likely culprits from a large background of variants inlinkage disequilibrium with the surrogate marker (tagSNP). Because distal enhancers often facilitate cell-type–specific expression, it is helpful to look for evidence in avariety of cell lines in addition to those related to thetrait. For example, the ENCODE (availble at: http://
enome.ucsc.edu/ENCODE/) transcription summaryrack assayed by RNA-sequencing can be displayed as anverlay of histograms denoting expression levels in vari-us tissues marked by a specific color, thus allowing
dentification of cell-type–specific expression.Similarly the histone modification tracks can provide
dditional evidence for cell-specific regulatory elementshen displayed in this configuration. The methylationnd acetylation of histone proteins changes chromatinccessibility for transcription and such marks can serves a powerful tool for identifying both enhancer andromoter regions. There are 3 summary ENCODE tracksvailable to detect specific chemical modifications andere assayed in 7 different tissues using chromatin
mmunoprecipitation sequencing methodology. The
3K4me1 histone mark is associated with enhancers
1
1
1
1
1
1
1
1
1
1
2
2
2
2
2
2
2
2
April 2013 GENOME–WIDE SCAN FOR COLORECTAL TUMORS 807.e8
downstream of transcription start sites. The H3k27Achistone mark is similarly thought to enhance transcrip-tion and likely does so through the blocking of therepressive histone mark H3K27Me3. The last histonemodification in the summary tracks, H3K4Me3, is asso-ciated with active promoters. Additional chemical modi-fications and cell lines are available under the BroadInstitute histone modification track for further interro-gation.
Regulatory regions are susceptible to DNase cuttingand ENCODE has assayed this hypersensitivity in a largecollection of cell types. The precision of the DNase clus-ter track is somewhat better than that of chromatinmodifications. Identification of evolutionarily conservedsegments, phylogenetic footprints, has been used to dis-cover functionally important regions. However, histonemarks and DNase hypersensitivity tracks are more robusttools for characterizing regulatory regions because theseelements are not always constrained across vertebrateevolution. Functional hypotheses around regulatory re-gions can be strengthened with the ENCODE transcrip-tion factor track. By using the chromatin immunopre-cipitation sequencing method, this track helps to identifythe alteration of transcription factor binding sites, whichpotentially alter expression levels. As an example,CCCTC-binding factor is a transcription factor that as-sumes multiple forms and can act as an activator, arepressor/silencer, or an insulator. When binding chro-matic insulators, it can prevent interactions between pro-moters and nearby enhancers or silencers. However, italso mediates long-range chromatin looping, which canbring enhancers in proximity of a gene’s promoter. Com-bining the strengths and weaknesses of each of thesetracks can provide in silico evidence for regulatory func-tion, and enables selection of strong candidates for ad-ditional functional studies using reporter gene methods.
Supplementary References
1. Cotterchio M, Manno M, Klar N, et al. Colorectal screening isassociated with reduced colorectal cancer risk: a case-controlstudy within the population-based Ontario Familial Colorectal Can-cer Registry. Cancer Causes Control 2005;16:865–875.
2. Cotterchio M, Keown-Eyssen G, Sutherland H, et al. Ontario fa-milial colon cancer registry: methods and first-year responserates. Chronic Dis Can 2000;21:81–86.
3. Zanke BW, Greenwood CM, Rangrej J, et al. Genome-wide asso-ciation scan identifies a colorectal cancer susceptibility locus onchromosome 8q24. Nat Genet 2007;39:989–994.
4. Küry S, Buecher B, Robiou-du-Pont S, et al. Combinations ofcytochrome P450 gene polymorphisms enhancing the risk forsporadic colorectal cancer related to red meat consumption.Cancer Epidemiol Biomarkers Prev 2007;16:1460–1467.
5. Newcomb PA, Baron J, Cotterchio M, et al. Colon Cancer FamilyRegistry: an international resource for studies of the geneticepidemiology of colon cancer. Cancer Epidemiol Biomarkers Prev2007;16:2331–2343.
6. Figueiredo JC, Lewinger JP, Song C, et al. Genotype-environmentinteractions in microsatellite stable/microsatellite instability-lowcolorectal cancer: results from a genome-wide association study.
Cancer Epidemiol Biomarkers Prev 2011;20:758–766.7. Brenner H, Chang-Claude J, Seiler CM, et al. Protection fromcolorectal cancer after colonoscopy: population-based case-con-trol study. Ann Intern Med 2011;154:22–30.
8. Lilla C, Verla-Tebit E, Risch A, et al. Effect of NAT1 and NAT2genetic polymorphisms on colorectal cancer risk associated withexposure to tobacco smoke and meat consumption. Cancer Epi-demiol Biomarkers Prev 2006;15:99–107.
9. Slattery ML, Potter J, Caan B, et al. Energy balance and coloncancer–beyond physical activity. Cancer Res 1997;57:75–80.
0. Le Marchand L, Hankin JH, Wilkens LR, et al. Combined effects ofwell-done red meat, smoking, and rapid N-acetyltransferase 2and CYP1A2 phenotypes in increasing colorectal cancer risk.Cancer Epidemiol Biomarkers Prev 2001;10:1259–1266.
1. Rimm EB, Stampfer MJ, Colditz GA, et al. Validity of self-reportedwaist and hip circumferences in men and women. Epidemiology1990;1:466–473.
2. Kolonel LN, Henderson BE, Hankin JH, et al. A multiethnic cohortin Hawaii and Los Angeles: baseline characteristics. Am J Epide-miol 2000;151:346–357.
3. Belanger CF, Hennekens CH, Rosner B, et al. The Nurses’ HealthStudy. Am J Nurs 1978;78:1039–1040.
4. Hennekens CH, Eberlein K. A randomized trial of aspirin andbeta-carotene among U.S. physicians. Prev Med 1985;14:165–168.
5. Christen WG, Gaziano JM, Hennekens CH. Design of Physicians’Health Study II–a randomized trial of beta-carotene, vitamins Eand C, and multivitamins, in prevention of cancer, cardiovasculardisease, and eye disease, and review of results of completedtrials. Ann Epidemiol 2000;10:125–134.
6. Prorok PC, Andriole GL, Bresalier RS, et al. Design of the Pros-tate, Lung, Colorectal and Ovarian (PLCO) cancer screening trial.Control Clin Trials 2000;21:273S–309S.
7. Gohagan JK, Prorok PC, Hayes RB, et al. The Prostate, Lung,Colorectal and Ovarian (PLCO) cancer screening trial of the Na-tional Cancer Institute: history, organization, and status. ControlClin Trials 2000;21:251S–272S.
8. National Cancer Institute. Cancer Genetic Markers of Suscepti-bility (CGEMS) data website. Available at: http://cgems.cancer-.gov/data_access.html. CGEMS Data Accessed October 5,2009.
9. Yeager M, Chatterjee N, Ciampa J, et al. Identification of a newprostate cancer susceptibility locus on chromosome 8q24. NatGenet 2009;41:1055–1057.
0. Landi MT, Chatterjee N, Yu K, et al. A genome-wide associationstudy of lung cancer identifies a region of chromosome 5p15associated with risk for adenocarcinoma. Am J Hum Genet 2009;85:679–691.
1. Newcomb PA, Zheng Y, Chia VM, et al. Estrogen plus progestinuse, microsatellite instability, and the risk of colorectal cancer inwomen. Cancer Res 2007;67:7534–7539.
2. White E, Patterson RE, Kristal AR, et al. VITamins And Lifestylecohort study: study design and characteristics of supplementusers. Am J Epidemiol 2004;159:83–93.
3. Hays J, Hunt JR, Hubbell FA, et al. The Women’s Health Initiativerecruitment methods and results. Ann Epidemiol 2003;13:S18–S77.
4. The Women’s Health Initiative Study Group. Design of the Wom-en’s Health Initiative clinical trial and observational study. Con-trol Clin Trials 1998;19:61–109.
5. Bergstralh EJ, Kosanke JL. Computerized matching of cases tocontrols. 56th ed. Rochester MN: Department of Health SciencesResearch, Mayo Clinic, 1995.
6. Zheng W, Chow WH, Yang G, et al. The Shanghai Women’s HealthStudy: rationale, study design, and baseline characteristics. Am JEpidemiol 2005;162:1123–1131.
7. Cai H, Zheng W, Xiang YB, et al. Dietary patterns and their
correlates among middle-aged and elderly Chinese men: a report
807.e9 PETERS ET AL GASTROENTEROLOGY Vol. 144, No. 4
from the Shanghai Men’s Health Study. Br J Nutr 2007;98:1006–1013.
28. Zheng W, Long J, Gao YT, et al. Genome-wide association studyidentifies a new breast cancer susceptibility locus at 6q25.1. NatGenet 2009;41:324–328.
29. Bei JX, Li Y, Jia WH, et al. A genome-wide association study ofnasopharyngeal carcinoma identifies three new susceptibilityloci. Nat Genet 2010;42:599–603.
30. Matsuo K, Suzuki T, Ito H, et al. Association between an 8q24locus and the risk of colorectal cancer in Japanese. BMC Cancer2009;9:379.
31. Nakata I, Yamashiro K, Yamada R, et al. Association between theSERPING1 gene and age-related macular degeneration and pol-ypoidal choroidal vasculopathy in Japanese. PLoS One 2011;6:e19108.
32. Jee SH, Sull JW, Lee JE, et al. Adiponectin concentrations: agenome-wide association study. Am J Hum Genet 2010;87:545–552.
33. Edwards TL, Shrubsole MJ, Cai Q, et al. A study of prostaglandinpathway genes and interactions with current nonsteroidal anti-inflammatory drug use in colorectal adenoma. Cancer Prev Res(Phila) 2012;5:855–863.
34. Peters U, Hutter CM, Hsu L, et al. Meta-analysis of new genome-wide association studies of colorectal cancer risk. Hum Genet
2012;131:217–234.35. Marchini J, Howie B, Myers S, et al. A new multipoint method forgenome-wide association studies by imputation of genotypes.Nat Genet 2007;39:906–913.
36. Browning SR, Browning BL. Rapid and accurate haplotype phas-ing and missing-data inference for whole-genome associationstudies by use of localized haplotype clustering. Am J Hum Genet2007;81:1084–1097.
37. Li Y, Willer CJ, Ding J, et al. MaCH: using sequence and genotypedata to estimate haplotypes and unobserved genotypes. GenetEpidemiol 2010;34:816–834.
38. Nothnagel M, Ellinghaus D, Schreiber S, et al. A comprehensiveevaluation of SNP genotype imputation. Hum Genet 2009;125:163–171.
39. Gogele M, Minelli C, Thakkinstian A, et al. Methods for meta-analyses of genome-wide association studies: critical assess-ment of empirical evidence. Am J Epidemiol 2012;175:739–749.
40. Kent WJ, Sugnet CW, Furey TS, et al. The human genome browserat UCSC. Genome Res 2002;12:996–1006.
41. Pruim RJ, Welch RP, Sanna S, et al. LocusZoom: regional visu-alization of genome-wide association scan results. Bioinformat-ics 2010;26:2336–2337.
Author names in bold designate shared co-first authorship.

F
Ps because of the sibling-pair study design.
April 2013 GENOME–WIDE SCAN FOR COLORECTAL TUMORS 807.e10
Supplementary Table 1. Descriptive Characteristics of Study
Study name Other name Design C
GWASAssociation STudy Evaluating
RISK for sporadiccolorectal cancer
ASTERISK Case-control France
Colorectal Cancer Studies2&3
Hawaiian Colo2&3 Case-control United St
Colon Cancer FamilyRegistrya
CCFR Case-control andsib-pair
United StCanad
Darmkrebs: Chancen derVerhütung durchScreening
DACHS Case-control Germany
Diet, Activity and LifestyleStudy
DALS Case-control United St
Health Professionals Follow-up Study
HPFS Cohort United St
Multiethnic Cohort Study MEC Cohort United StNurses’ Health Study NHS Cohort United StOntario Familial Colorectal
Cancer RegistryOFCCR Case-control Canada
Physicians’ Health Study PHS Cohort United St
Postmenopausal Hormonestudy
PMH Case-control United St
Prostate, Lung, Colorectal,and Ovarian CancerScreening Trial
PLCO Cohort United St
VITamins And Lifestyle VITAL Cohort United StWomen’s Health Initiative WHI Cohort United St
Health Professionals’ Follow-up Study, AdenomaSet
HPFS Ad Cohort United St
Nurses’ Health Study,Adenoma Set
NHS Ad Cohort United St
ollow-up studiesAsian Consortium, Colorectal
CancerShanghai-1 Shanghai-1 Cohort ChinaShanghai-2 Shanghai-2 Cohort ChinaGuangzhou Guangzhou Case-control ChinaAichi Aichi-1 Case-control JapanKorean Cancer Prevention
Study-IIKCPS-II Cohort Korea
Tennessee Colorectal PolypStudy
TCPS Case-control United St
CA, principal component analysis.aCCFR is a collaborating study with GECCO. The analysis of set 2 data did not adjust for PC
Populations
ountry Cases Controls
Agerange,
yMeanage, y
Female,%
Covariates usedin analysis
948 947 40–99 65.3 41.3 Age, sex, 3 PCAs,batch
ates 87 125 38–86 65.2 44.8 Age, sex, 3 PCAs
ates,a, Australia
1967 1785 19–88 55.5 51.8 Age, sex, 3 PCAs,center
2376 2206 33–98 68.7 39.9 Age, sex, PCAs
ates 1116 1174 30–79 65.2 44.9 Age, sex, 3 PCAs,center
ates 403 402 48–83 65.2 0 age, 3PCAs
ates 328 346 45–76 63.0 46.4 Age, sex, 3 PCAsates 553 955 44–69 59.8 100 Age, 3 PCAs
650 522 31–79 64.1 52.0 Age, sex, 3 PCAs
ates 382 389 40–84 58.4 0 Age, 3 PCAs,smoking
ates 280 122 50–75 64.8 100 Age, 3 PCAs
ates 1019 2391 55–75 64.0 30.8 Age, sex, 3 PCAs,center
ates 285 288 50–76 66.5 47.6 Age, sex, 3 PCAsates 1476 2538 50–79 67.4 100 Age, 3 PCAs,
regionates 313 345 48–81 60.7 0 Age, 3 PCAs
ates 513 578 44–69 57.0 100 Age, 3 PCAs
2098 5749
474 2628 25–75 53.22 91.62 Age, sex254 231 40–75 60.96 55.67 Age, sex641 972 14–85 50.36 30.81 Age, sex404 942 20–79 51.34 44.65 Age, sex325 976 20–88 43.79 39.28 Age, sex
ates 958 909 40–76 58.72 26.65 Age, sex

ACDDDDHHHMNNNPP
PPVW
W
N
i
807.e11 PETERS ET AL GASTROENTEROLOGY Vol. 144, No. 4
Supplementary Table 2. Details on Genotyping Platform and Quality Assurance and Quality Control
StudyGenotypingplatforma
Duplicateconcordance,
%
Meansample
callrate, %
SNPexclusions,b
n
SNPspassingQC, n
Mean SNPcall rate,
%
Number of imputed SNPs by R2
�0.3 0.3–0.8 �0.8
STERISK 300K 100 99.97 30,446 252,176 99.95 76,043 443,302 1,856,490olo2&3 300K 100 99.95 40,390 258,978 99.96 71,487 445,613 1,854,778ACHS Set 1 300K 99.9 99.93 33,588 255,208 99.90 70,989 434,295 1,869,458ACHS Set 2 730K 100 99.84 32,159 609,115 99.85 18,551 154,813 1,865,294ALS Set 1 550K, 610K �97c 99.69 34,644 516,631 99.82 20,173 180,322 1,912,832ALS Set 2 300K 100 99.94 32,885 250,320 99.94 69,289 438,282 1,867,371PFS Set 1 730K 99.90 99.93 32,953 612,091 99.93 18,257 150,880 1,857,252PFS Set 2 730K 99.9 99.83 51,725 590,132 99.84 20,040 160,464 1,861,553PFS Ad 730K 100 99.86 61,201 597,470 99.86 18,610 155,527 1,861,220EC 300K 100 99.97 34,494 259,364 99.96 68,634 433,560 1,868,693HS Set 1 730K 100 99.93 47,295 628,541 99.93 17,142 147,723 1,855,814HS Set 2 730K 100 99.81 53,328 594,015 99.81 19,434 160,804 1,875,767HS Ad 730K 100 99.81 35,954 614,357 99.81 17,901 152,373 1,863,872HS Sets 1�2 730K 100 99.90 32,088 594,205 99.90 19,387 157,993 1,864,677LCO Set 1 300/240S and
610K�97c 99.65 33,342 503,351 99.85 20,855 184,854 1,921,986
LCO Set 2 300K 99.90 99.80 38,655 253,702 99.90 68,059 434,769 1,870,311MH 300K 99.90 99.89 39,275 256,743 99.92 67,818 429,887 1,875,260ITAL 300K 99.90 99.81 36,805 243,625 99.89 73,966 461,036 1,845,318HI set 1 550K, 550Kduo,
610K�97c 99.60 40,276 511,251 99.77 21,655 184,833 1,914,909
HI set 2 300K 100 99.96 27,392 251,707 99.96 72,272 442,111 1,864,141
OTE. CCFR and OFCCR had quality assurance/QC performed separately by OFCCR and CCFR investigators as documented by Zanke et al3 andFigueiredo et al.6
ASTERISK, The french Association STudy Evaluating RISK for sporadic colorectal cancer; Colo2&3, Hawaiian Colorectal Cancer Studies 2 and 3;DACHS, Darmkrebs: Chancen der Verhütung durch Screening; MEC, Multiethnic cohort; PMH, Postmenopausal Hormone study; VITAL, VITaminsAnd Lifestyle.aAll platforms were Illumina assays, except for OFCCR, which was genotyped using Affymetrix platforms.bDirectly genotyped SNPs were excluded for a call rate less than 98%, HWE less than 1 � 10�4, MAF less than 5 for WHI set 1, PLCO set 1,DALS set 1, and OFCCR set 1; MAF less than 5 per number of samples for remaining studies, and if SNPs reportedly did not perform consistentlyacross platforms.cBlinded duplicates were assessed across DALS set 1, PLCO set 1, and WHI set 1; exact concordance was not recorded, but all 98 pairs were
dentified as having concordance greater than 97%.
tp(G
April 2013 GENOME–WIDE SCAN FOR COLORECTAL TUMORS 807.e12
Supplementary Figure 1. Manhattan plot of the GWAS inverse-variance–weighted, fixed-effects meta-analysis, comprising 12,696 cases and15,113 controls. The �log10 of P values for 2,708,280 SNPs plotted against physical chromosomal positions. SNPs above the blue line representhose with a P value less than 5 � 10�7 whereas SNPs above the red line represent those with a P value less than 5 � 10�8. The green dots representreviously identified loci as listed in Supplementary Table 4. Chromosome 23 is the X-chromosome. Because we do not have linkage disequilibrium
LD) information for SNPs on the X chromosome, we only show the result of the GWAS SNP on the X chromosome but not SNPs correlated with this
WAS SNP.
807.e13 PETERS ET AL GASTROENTEROLOGY Vol. 144, No. 4
Supplementary Figure 2. Forest plot for meta-analysis results for all new findings with a P value less than 5 � 10�7 in a combined analysis ofGWAS and follow-up studies as listed in Table 1. ORs and 95% confidence intervals (95% CIs) are presented for each additional copy of the minorallele in the multiplicative model. The grey boxes are proportional in size to the inverse of the variance for each study, and the lines visually depict theconfidence interval. Results from the fixed-effects meta-analysis are shown as diamonds. The width of the diamond represents the confidence
interval.
April 2013 GENOME–WIDE SCAN FOR COLORECTAL TUMORS 807.e14
Supplementary Figure 2. Continued

807.e15 PETERS ET AL GASTROENTEROLOGY Vol. 144, No. 4
Supplementary Figure 2. Continued

April 2013 GENOME–WIDE SCAN FOR COLORECTAL TUMORS 807.e16
Supplementary Figure 2. Continued

807.e17 PETERS ET AL GASTROENTEROLOGY Vol. 144, No. 4
Supplementary Figure 2. Continued

tESra
April 2013 GENOME–WIDE SCAN FOR COLORECTAL TUMORS 807.e18
Supplementary Figure 3. Regional association results for all new findings with a P value less than 5 � 10�7, as listed in Table 1. The top half ofhe figure shows the physical position of the SNP on the chromosome along the x-axis, and the -log10 of the meta-analysis P value on the y-axis.ach dot on the plot represents the P value of the association for one SNP with colorectal cancer (allele test) across all studies. The most significantNP in the region (index SNP) is marked as a purple diamond. The color scheme represents the pairwise correlation (r2) for the SNPs across the
egion with the index SNP. Correlation was calculated using the HapMap CEU data. The bottom half of the figure shows the position of the genes
cross the region. These regional association plots are also known as LocusZoom plots.41Supplementary Figure 3. Continued

807.e19 PETERS ET AL GASTROENTEROLOGY Vol. 144, No. 4
Supplementary Figure 3. Continued
Supplementary Figure 3. Continued

April 2013 GENOME–WIDE SCAN FOR COLORECTAL TUMORS 807.e20
Supplementary Figure 3. Continued
Supplementary Table 5. Risk Estimates for the 2 Top SNPsin 12p13.32/CCND2 When BothWere Included Simultaneously inthe Logistic Regression Analysis
SNP OR (95% CI) P value
Each SNP analyzed separatelyrs3217901 1.10 (1.06–1.15) 1.71E-06rs3217810 1.19 (1.11–1.28) 3.40E-07
Both SNPs includedsimultaneously in thelogistic regressionanalysis
rs3217901 1.08 (1.03–1.13) .0008rs3217810 1.14 (1.06–1.23) .004
NOTE. Analysis was based on the log-additive model in GWAS ofGECCO and CCFR only (12,696 cases and 15,113 controls).
CI, confidence interval.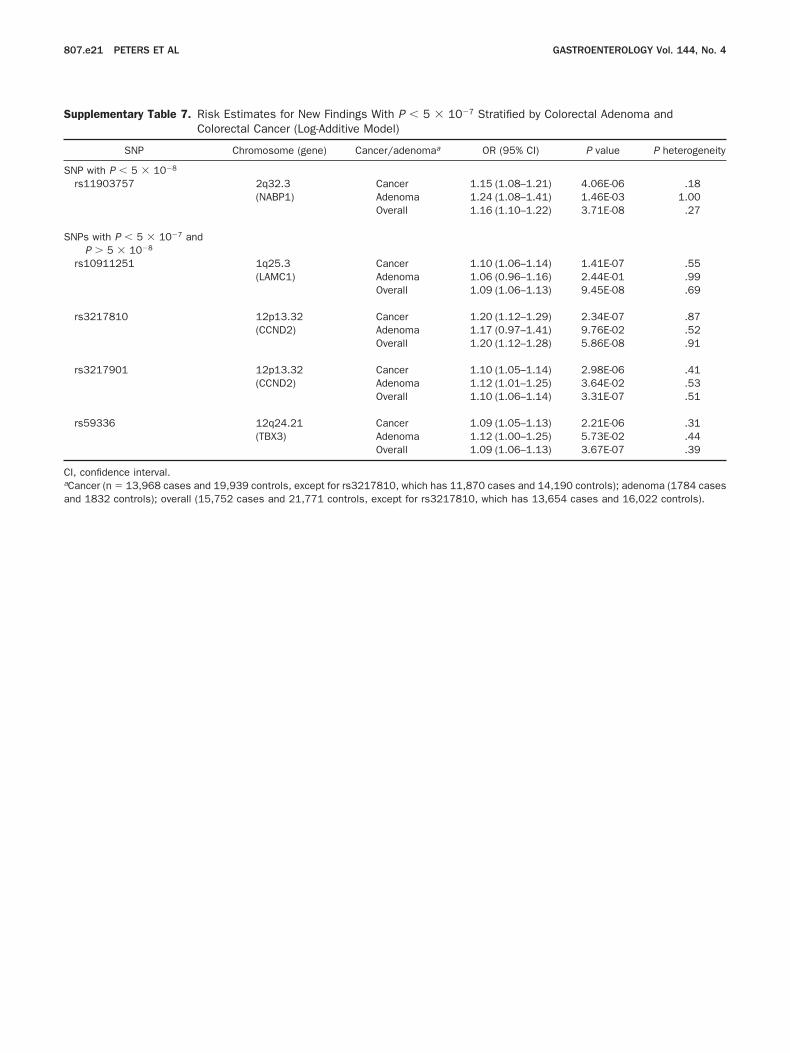
S
S
C
a
807.e21 PETERS ET AL GASTROENTEROLOGY Vol. 144, No. 4
Supplementary Table 7. Risk Estimates for New Findings With P � 5 � 10�7 Stratified by Colorectal Adenoma andColorectal Cancer (Log-Additive Model)
SNP Chromosome (gene) Cancer/adenomaa OR (95% CI) P value P heterogeneity
NP with P � 5 � 10�8
rs11903757 2q32.3 Cancer 1.15 (1.08–1.21) 4.06E-06 .18(NABP1) Adenoma 1.24 (1.08–1.41) 1.46E-03 1.00
Overall 1.16 (1.10–1.22) 3.71E-08 .27
NPs with P � 5 � 10�7 andP � 5 � 10�8
rs10911251 1q25.3 Cancer 1.10 (1.06–1.14) 1.41E-07 .55(LAMC1) Adenoma 1.06 (0.96–1.16) 2.44E-01 .99
Overall 1.09 (1.06–1.13) 9.45E-08 .69
rs3217810 12p13.32 Cancer 1.20 (1.12–1.29) 2.34E-07 .87(CCND2) Adenoma 1.17 (0.97–1.41) 9.76E-02 .52
Overall 1.20 (1.12–1.28) 5.86E-08 .91
rs3217901 12p13.32 Cancer 1.10 (1.05–1.14) 2.98E-06 .41(CCND2) Adenoma 1.12 (1.01–1.25) 3.64E-02 .53
Overall 1.10 (1.06–1.14) 3.31E-07 .51
rs59336 12q24.21 Cancer 1.09 (1.05–1.13) 2.21E-06 .31(TBX3) Adenoma 1.12 (1.00–1.25) 5.73E-02 .44
Overall 1.09 (1.06–1.13) 3.67E-07 .39
I, confidence interval.aCancer (n � 13,968 cases and 19,939 controls, except for rs3217810, which has 11,870 cases and 14,190 controls); adenoma (1784 cases
nd 1832 controls); overall (15,752 cases and 21,771 controls, except for rs3217810, which has 13,654 cases and 16,022 controls).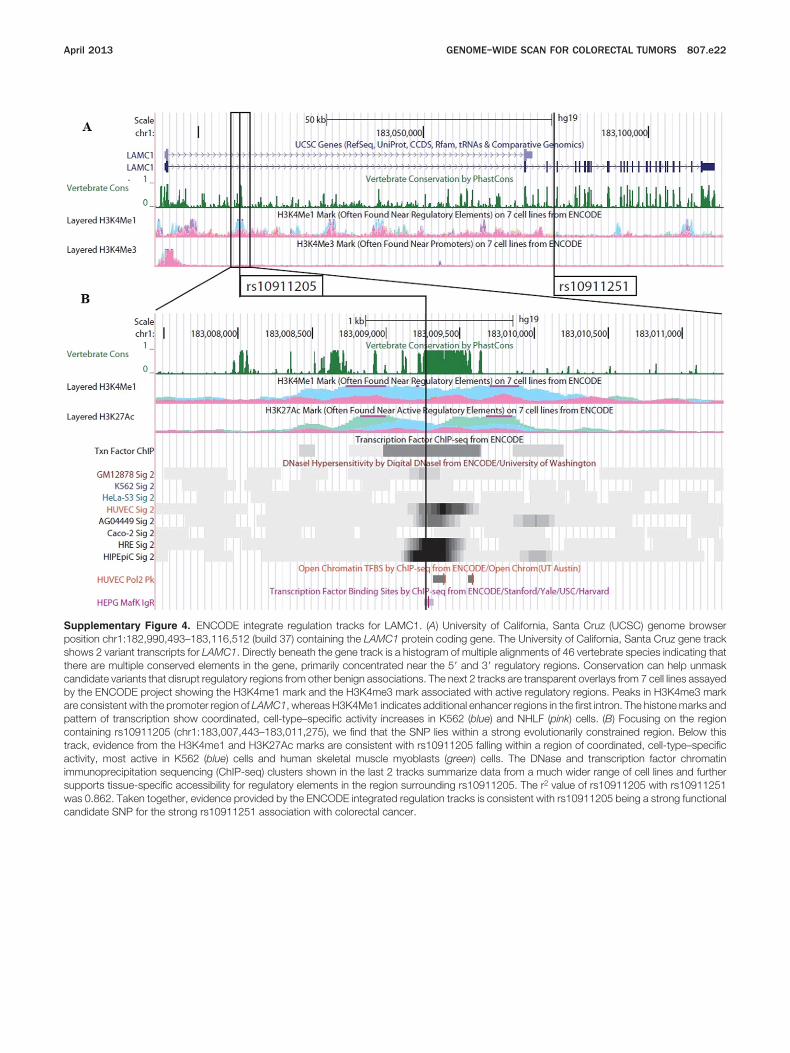
wc
April 2013 GENOME–WIDE SCAN FOR COLORECTAL TUMORS 807.e22
Supplementary Figure 4. ENCODE integrate regulation tracks for LAMC1. (A) University of California, Santa Cruz (UCSC) genome browserposition chr1:182,990,493–183,116,512 (build 37) containing the LAMC1 protein coding gene. The University of California, Santa Cruz gene trackshows 2 variant transcripts for LAMC1. Directly beneath the gene track is a histogram of multiple alignments of 46 vertebrate species indicating thatthere are multiple conserved elements in the gene, primarily concentrated near the 5= and 3= regulatory regions. Conservation can help unmaskcandidate variants that disrupt regulatory regions from other benign associations. The next 2 tracks are transparent overlays from 7 cell lines assayedby the ENCODE project showing the H3K4me1 mark and the H3K4me3 mark associated with active regulatory regions. Peaks in H3K4me3 markare consistent with the promoter region of LAMC1, whereas H3K4Me1 indicates additional enhancer regions in the first intron. The histone marks andpattern of transcription show coordinated, cell-type–specific activity increases in K562 (blue) and NHLF (pink) cells. (B) Focusing on the regioncontaining rs10911205 (chr1:183,007,443–183,011,275), we find that the SNP lies within a strong evolutionarily constrained region. Below thistrack, evidence from the H3K4me1 and H3K27Ac marks are consistent with rs10911205 falling within a region of coordinated, cell-type–specificactivity, most active in K562 (blue) cells and human skeletal muscle myoblasts (green) cells. The DNase and transcription factor chromatinimmunoprecipitation sequencing (ChIP-seq) clusters shown in the last 2 tracks summarize data from a much wider range of cell lines and furthersupports tissue-specific accessibility for regulatory elements in the region surrounding rs10911205. The r2 value of rs10911205 with rs10911251
as 0.862. Taken together, evidence provided by the ENCODE integrated regulation tracks is consistent with rs10911205 being a strong functional
andidate SNP for the strong rs10911251 association with colorectal cancer.
w
807.e23 PETERS ET AL GASTROENTEROLOGY Vol. 144, No. 4
Supplementary Table 8. Sample Size and Genotyping Methods Used in Asian GWAS
Study
Genotyped After quality control Genotyping platformNumber of
SNPsaInflation
factor (�)bCases Controls Cases Controls Cases Controls
Shanghai-1 481 2632 474 2628 Affymetrix 6.0 Affymetrix 6.0 502,145 1.03Shanghai-2 296 257 254 231 Illumina
OmniExpressIlluminaOmniExpress
515,701 1.03
Guangzhou-1 694 972 641 972 IlluminaOmniExpress
IlluminaHuman610-Quad
250,612 1.02
Aichi-1 497 942 404 942 IlluminaOmniExpress
IlluminaHumanHap610
232,426 1.04
KCPS-II 325 977 325 976 Affymetrix 5.0 Affymetrix 5.0 312,869 1.02Overall 2293 5780 2098 5749 1.01
NOTE. Number of cases and controls differ from Supplementary Table 1 due to quality assurance/quality control exclusions.aNumber of SNPs in autosome used for imputation in GWAS.bGenomic inflation factor (lambda) derived from 1,636,780 imputed SNPs with MAF �0.05 and high imputation quality (RSQR �0.50), adjusted
ith age, sex, and the first 10 principal components.

E
E
E
E
E
E
E
V
C
April 2013 GENOME–WIDE SCAN FOR COLORECTAL TUMORS 807.e24
Supplementary Table 9. Tools for Functional Annotation of Noncoding Variants
UCSC genome browser Genomic class Description Functional evidence
NCODE transcription Transcribed region Transcription levels in 7 celllines from ENCODE
Assayed by high-throughputsequencing of polyadenylatedRNA
Variable expression in different tissuesprovides evidence forcell-type–specific regulation whendisplayed as transparent overlay ofeach cell line
NCODE layeredH3K4Me1
Nonpromoter regulatoryelements
Uses ChIP-seq method to identifyregions of DNA that interactwith the mono-methylation oflysine 4 of the H3 histoneprotein in 7 different cell lines
Actual enhancer is likely a smallportion of the broad regionmarked
Methylation of histone proteins changeschromatin accessibility fortranscription
H3K4Me1 is associated with enhancersdownstream of the transcription startsite
NCODE layeredH3K4Me3
Promoter regulatory element Uses ChIP-seq method to identifyregions of DNA that interactwith the trimethylation of lysine4 of the H3 histone protein in7 different cell lines
Actual regulatory element is likelya small portion of the broadregion marked
H3K4Me3 is associated with promotersthat are active or accessible foractivation
NCODE layered H3K27Ac Nonpromoter regulatoryelements
Uses ChIP-seq method to identifyregions of DNA that interactwith the acetylation of lysine27 of the H3 histone protein in7 different cell lines
Actual regulatory element is likelya small portion of the broadregion marked
H3K27Ac enhances transcription,possibly by blocking the spread of therepressive histone mark H3K27Me3
This mark often is found near activeregulatory elements
NCODE DNase clusters Regulatory element Measures digital DNaseIhypersensitivity clusters in alarge collection of cell typesfrom ENCODE
Greater precision than histonemodifications
Regulatory regions and promoters aresusceptible DNase cutting
Hypersensitivity is used to mapchromatin accessibility
NCODE Txn factor ChIP Regulatory element Transcription Factor ChIP-seqfrom ENCODE is assayed bychromatin immunoprecipitationusing antibodies for specifictranscription factors andsequencing the precipitatedDNA
Marks regions where transcriptionfactors bind DNA and exert specificfunctions
Activators can recruit RNA polymerase,repressors suppress recruitment, andinsulators block the activity of nearbyactivators or repressors
NCODE UW CTCF binding(within the ENCODEtranscription factorbinding tracks)
Insulated element CTCF binding sites are assayedby chromatinimmunoprecipitation usingantibodies for CTCF andsequencing the precipitatedDNA
CTCF can function as a transcriptionalactivator, a repressor/silencer, or aninsulator
Binds chromatin insulators to preventinteraction between promoter andnearby enhancers or silencers
Also mediates long-range chromatinlooping, which can bring enhancers inproximity of a gene’s promoter
ertebrate multi-alignmentand conservation(phastCons)
Conserved element Multiple alignments of 46vertebrate species
Estimates the probability thateach nucleotide belongs to aconserved element
Identification of evolutionarily conservedsegments of homology, potentiallyidentifying a functionally importantregion
hIP-seq, chromatin immunoprecipitation sequencing; CTCF, CCCTC-binding factor; UCSC, University of California, Santa Cruz.