Tumor markers of bladder cancer: the schistosomal bladder tumors versus non-schistosomal bladder...
14
BioMed Central Page 1 of 14 (page number not for citation purposes) Journal of Experimental & Clinical Cancer Research Open Access Research Tumor markers of bladder cancer: the schistosomal bladder tumors versus non-schistosomal bladder tumors Ahmed S Abdulamir* 1,2 , Rand R Hafidh 2 , Haider S Kadhim 2 and Fatimah Abubakar 2 Address: 1 Microbiology Research Department, University Putra Malaysia, 43400, UPM, Serdang, Malaysia and 2 Institute of Bioscience, University Putra Malaysia, 43400, UPM, Serdang, Selangor Darul Ehsan, Malaysia Email: Ahmed S Abdulamir* - [email protected]; Rand R Hafidh - [email protected]; Haider S Kadhim - [email protected]; Fatimah Abubakar - [email protected] * Corresponding author Abstract Background: The aim of this study is to comparatively elucidate the underlying molecular pathways and clinicopathological criteria in schistosomal bladder tumor (SBT) versus non- schistosomal bladder tumor (NSBT). Methods: This study explored the role of p53, p16, bcl-2, ki-67, c-myc, Rb and EGFR, by using Immunohistochemistry assay, in 45 SBT and 39 NSBT patients in comparison with 16 schistosomal chronic cystitis (SC), 28 non-schistosomal chronic cystitis (NSC), and 20 normal control (CTL) subjects. The studied markers in SBT and NSBT were correlated with different clinicopathological criteria namely, tumor histopathology, grading, invasiveness, stage, and presentation of the disease. Results: SBT was associated with high grade invasive squamous cell carcinoma (SCC) while NSBT was associated with lower grade less invasive transitional cell carcinoma (TCC). The expression of p53, bcl-2, c-myc, and EGFR was higher in SBT than in NSBT while Rb was higher in NSBT than in SBT. However, p16 and ki-67 were not different between SBT and NSBT. The profile of molecular markers in SC was similar to NSC except for EGFR which was higher in SC than in NSC. Both SC and NSC showed higher level of p53, bcl-2, ki-67, and EGFR than in CTL group while p16, Rb, and c-myc were not different. p53 was associated with high grade SCC in both SBT and NSBT. Bcl-2 was associated with high grade invasive tumors in SBT and NSBT. P16 was associated with low grade, late stage, and recurrent SBT and high grade, invasive, late stage, and recurrent NSBT. Rb was associated with SCC in SBT, invasive tumors in NSBT, and late stage and recurrent presentation in both SBT and NSBT. C-myc was associated with high grade, invasive, and late stage SBT and SCC, high grade, invasive, and late stage NSBT. EGFR was associated with invasive SCC in SBT and invasive, high grade, and late stage TCC in NSBT. ki-67 was associated with invasive SBT and high grade late stage NSBT. Conclusion: SBT and NSBT showed distinct molecular profile of tumor development and progression which can be taken into consideration in fine adjusting the anti-cancer therapy for SBT and NSBT. Published: 25 February 2009 Journal of Experimental & Clinical Cancer Research 2009, 28:27 doi:10.1186/1756-9966-28-27 Received: 12 December 2008 Accepted: 25 February 2009 This article is available from: http://www.jeccr.com/content/28/1/27 © 2009 Abdulamir et al; licensee BioMed Central Ltd. This is an Open Access article distributed under the terms of the Creative Commons Attribution License (http://creativecommons.org/licenses/by/2.0 ), which permits unrestricted use, distribution, and reproduction in any medium, provided the original work is properly cited.
-
Upload
alnahrainuniversity -
Category
Documents
-
view
0 -
download
0
Transcript of Tumor markers of bladder cancer: the schistosomal bladder tumors versus non-schistosomal bladder...

BioMed Central
Journal of Experimental & Clinical Cancer Research
ss
Open AcceResearchTumor markers of bladder cancer: the schistosomal bladder tumors versus non-schistosomal bladder tumorsAhmed S Abdulamir*1,2, Rand R Hafidh2, Haider S Kadhim2 and Fatimah Abubakar2Address: 1Microbiology Research Department, University Putra Malaysia, 43400, UPM, Serdang, Malaysia and 2Institute of Bioscience, University Putra Malaysia, 43400, UPM, Serdang, Selangor Darul Ehsan, Malaysia
Email: Ahmed S Abdulamir* - [email protected]; Rand R Hafidh - [email protected]; Haider S Kadhim - [email protected]; Fatimah Abubakar - [email protected]
* Corresponding author
AbstractBackground: The aim of this study is to comparatively elucidate the underlying molecularpathways and clinicopathological criteria in schistosomal bladder tumor (SBT) versus non-schistosomal bladder tumor (NSBT).
Methods: This study explored the role of p53, p16, bcl-2, ki-67, c-myc, Rb and EGFR, by usingImmunohistochemistry assay, in 45 SBT and 39 NSBT patients in comparison with 16 schistosomalchronic cystitis (SC), 28 non-schistosomal chronic cystitis (NSC), and 20 normal control (CTL)subjects. The studied markers in SBT and NSBT were correlated with different clinicopathologicalcriteria namely, tumor histopathology, grading, invasiveness, stage, and presentation of the disease.
Results: SBT was associated with high grade invasive squamous cell carcinoma (SCC) while NSBTwas associated with lower grade less invasive transitional cell carcinoma (TCC). The expression ofp53, bcl-2, c-myc, and EGFR was higher in SBT than in NSBT while Rb was higher in NSBT than inSBT. However, p16 and ki-67 were not different between SBT and NSBT. The profile of molecularmarkers in SC was similar to NSC except for EGFR which was higher in SC than in NSC. Both SCand NSC showed higher level of p53, bcl-2, ki-67, and EGFR than in CTL group while p16, Rb, andc-myc were not different. p53 was associated with high grade SCC in both SBT and NSBT. Bcl-2was associated with high grade invasive tumors in SBT and NSBT. P16 was associated with lowgrade, late stage, and recurrent SBT and high grade, invasive, late stage, and recurrent NSBT. Rbwas associated with SCC in SBT, invasive tumors in NSBT, and late stage and recurrentpresentation in both SBT and NSBT. C-myc was associated with high grade, invasive, and late stageSBT and SCC, high grade, invasive, and late stage NSBT. EGFR was associated with invasive SCC inSBT and invasive, high grade, and late stage TCC in NSBT. ki-67 was associated with invasive SBTand high grade late stage NSBT.
Conclusion: SBT and NSBT showed distinct molecular profile of tumor development andprogression which can be taken into consideration in fine adjusting the anti-cancer therapy for SBTand NSBT.
Published: 25 February 2009
Journal of Experimental & Clinical Cancer Research 2009, 28:27 doi:10.1186/1756-9966-28-27
Received: 12 December 2008Accepted: 25 February 2009
This article is available from: http://www.jeccr.com/content/28/1/27
© 2009 Abdulamir et al; licensee BioMed Central Ltd. This is an Open Access article distributed under the terms of the Creative Commons Attribution License (http://creativecommons.org/licenses/by/2.0), which permits unrestricted use, distribution, and reproduction in any medium, provided the original work is properly cited.
Page 1 of 14(page number not for citation purposes)

Journal of Experimental & Clinical Cancer Research 2009, 28:27 http://www.jeccr.com/content/28/1/27
IntroductionBladder cancer is the second most common malignancy ofthe genitourinary system in both males and females [1].The most common type diagnosed in North America,South America, Europe, and Asia is transitional cell carci-noma (TCC), which is mainly non-schistosomal bladdertumors (NSBT), followed by squamous cell carcinoma(SCC) which is found more in geographical regions whereschistosomiasis is prevalent [1]. The neoplastic changes inthe urothelium of bladder is a multistep phenomenon[2]. The exact genetic events leading to urothelial transfor-mation involve the activation of oncogenes, inactivationor loss of tumor suppressor genes, and alterations in theapoptotic gene products [3].
One of the conditions leads to bladder cancer in Africa,the Middle East, and Asia is schistosomiasis [4,5]. S. hae-matobium is the most predominant species in the MiddleEast, Asia, and Africa and the most implicated in the schis-tosomal bladder tumors (SBT) in these regions [6,7].
C-myc is implicated in bladder cancer, the genetic mecha-nism causing overexpression of the c-myc gene in bladdercancer is unknown. It could be related to hypomethyla-tion [8] and its overexpression has been shown to be asso-ciated with high-grade bladder cancer [9]. Anotheroncogene implicated in bladder cancer, namely epidermalgrowth factor receptor (EGFR). Overexpression of EGFRhas been described in several solid tumors including blad-der, breast, colorectal, prostate, and ovarian cancers [10].And 70% of muscle-invasive bladder cancers expressEGFR, which is associated with poor prognosis [11].
The majority of aggressive and invasive bladder carcino-mas have alterations in the tumor suppressor genes prod-ucts such as retinoblastoma (Rb) [12]. A study revealedthat tumor expression of Rb proteins in locally advancedbladder cancers was found abnormal [13]. Another tumorsuppressor protein, p53, plays a vital role in the regulationof cell cycle. The defective p53 in human cancer leads tothe loss of p53-dependent apoptosis, proliferative advan-tage, genomic instability and DNA repair and angiogeniccontrol loss [14]. Mutations in the p53 gene result in theproduction of dysfunctional protein product with a pro-longed half-life compared to the wild-type protein [14].On the other hand, p16, which is a tumor suppressor pro-tein, was found almost abnormal in the advanced bladdercancers where it was severely lowered and impaired infunction. [12].
Overexpression of bcl-2 has been reported in a wide vari-ety of cancers including prostate, colorectal, lung, renal,bladder and leukemia [15]. Several studies have providedconclusive evidence that elevations in bcl-2 expressioncause resistance to chemotherapy and radiotherapy and
increases the proliferation [16]. On the other hand, Ki 67is used to evaluate the proliferative potential of any tumoras it is one of the important markers for cell proliferation[17].
There was no previous study explored the profiling ofmolecular markers in SBT and NSBT with respect to tumorsuppressor proteins: p53, Rb, and p16, oncogenes: c-myc,and EGFR, an antiapoptotic protein: bcl-2, and a prolifer-ative protein, ki-67 together in one study. Moreover, c-myc, EGFR, and Rb have not been investigated thoroughlyin relation to SBT. In addition, this study compared theprofile of the studied markers among SBT, NSBT, chronicschistosomal cystitis (SC), chronic non-schistosomal cys-titis (NSC), and normal control subjects (CTL). This studyis believed to highlight the essential molecular targets thatcan be important candidates for anti-cancer therapy inboth SBT and NSBT.
Materials and methodsThe population of the studyBladder cancer patientsEighty four (84) patients (63 men and 21 women) withbladder cancer, confirmed by histopathology, wereincluded in this study in the period from March 2007 toMay 2008. The patients with bladder cancer wereretrieved, examined, interviewed, and sampled in theregion of The Middle East (Jordan, Syria and Iraq). Theinvestigational study was conducted in the UniversityPutra Malaysia (UPM) in Malaysia. The patients' ageranged 38–72 years old with mean age 59.49 ± 5.7 years.The involved patients were selected from 3 central teach-ing hospitals without bias to age, sex, or cancer pathology.The involved patients were sampled before the beginningof anti-cancer therapy. The diagnosis of bladder cancerwas established by doing urine cytology and diagnosticcyctoscopy where the histopathology of biopsies con-firmed the diagnosis of bladder cancer and determinedthe tumor grade, local invasiveness, and the histopatho-logical type of cancer. The tumor spread and metastasiswas assessed by CT scans and cystoscopy.
Moreover, past schistosomal infection was monitored byretrieving the previous medical records. The current diag-nosis of schistosomiasis was done by cystoscopy throughfinding bilharzial granuloma or egg in histopathologicalsections. Accordingly, patients with bladder cancer werecategorized into 45 patients with SBT and 39 patients withNSBT. The involved patients with bladder cancer did notshow extra-bladder tumors. The stages of the retrievedpatients ranged from I to IV.
Moreover, cancer patients were categorized accordinglyinto muscle invasive (T2, T3, and T4) and non invasivetumors (Ta, T1, and CIS). For comparative purposes with
Page 2 of 14(page number not for citation purposes)
Journal of Experimental & Clinical Cancer Research 2009, 28:27 http://www.jeccr.com/content/28/1/27
previous reports, the 1973 WHO grading system (papil-loma, G1, G2 or G3) was used in this study which is stillthe most commonly used system despite being super-seded by the 2004 WHO. The retrieved tumors were histo-logically categorized as low grade (grades 1–2) and highgrade (grade 3). Moreover, the tumor morphology wascategorized by cystoscopy into 71 cases papillary, 12 casessessile and 1 case nodular. Written consents were grantedby the involved subjects for sampling. The handling withhuman subjects was done under the permission of theregional committee of Ethics for biomedical research.
The group of benign bladder lesionsThis group encompassed 44 untreated cases of chroniccystitis patients (29 men and 15 women) with mean age57.62 ± 3.78 years. The patients with chronic cystitis wereretrieved and sampled from the same geographical regionof cancer patients, the Middle East. Patients with chroniccystitis were diagnosed by urine cytology and diagnosticcystoscopy coupled with histopathological examination.There were no signs of premalignant lesions (squamousmetaplasia, dysplastic changes, or leukoplakia) nor weresigns of prostatic enlargement found. Under the samediagnostic protocols done for bladder cancer patients, thechronic cystitis patients were grouped into 16 schisto-somal cystitis (SC) patients and 28 non-schistosomal cys-titis (NSC) patients.
Control groupTwenty age- and sex- matched individuals (12 men and 8women) at mean age 58.3 ± 6.1 years old were involvedfrom the Middle East region. Their bladders were investi-gated by routine cystoscopy and biopsies were taken. Theywere found free of bladder cancer or any other bladderdisease or inflammation, therefore, they were consideredas control group (CTL).
Processing of biopsiesThe bladder cancer patients, the chronic cystitis patients,and CTL subjects underwent transurethral resection ofbladder tumor (TUR-BT), cystitis tissues, and normalmucosal tissues respectively. The retrieved specimens werecomposed of multiple pieces, 2–5 mm in thickness. Spec-imens were immersed in 10% formalin in order to makea paraffin block. The histopathological paraffin blocks ofbiopsies were sectioned into 4 um thick sections. Hema-toxylin and Eosin slides were prepared and examined by ahistopathologist for confirming the histopathologicaldiagnosis, the grade, and the invasiveness of the tumor. Aset of steps were pursued under the supervision of apathologist to minimize as could as possible the fixation-related loss of target proteins. These steps were: minimalprefixation time of 1 hour, the use of cold 4% paraformal-dehyde and cold fixation at 4°C, and short duration of fix-ation up to 5 hours [18]. Moreover, the paraffin-
embedded sections processed for immunohistochemistry(IHC) assay were examined in a period not more than 3days. It was stated that insignificant loss of nucleic acids orproteins was observed within the first 3 days of fixation-paraffin embedding [18].
Immunohistochemistry assayAntibodiesIHC staining was conducted using a set of mouse mono-clonal antibodies; anti-p53, anti-p16, anti bcl-2, and anti-c-myc (InnoGenex, USA) and anti Ki-67, anti-Rb-1, andanti-EGFR (DakoCytomation). Secondary biotinylatedgoat anti-mouse antibodies were used (DakoCytoma-tion). Antibodies were diluted in the recommended anti-body diluting buffer (Dako). The working dilutions andthe final concentrations of the primary antibodies were1:100 and 0.005 mg/mL for anti-p53, 1:120 and 0.008mg/mL for anti-p16, 1:75 and 0.006 mg/mL for anti-bcl-2, 1:100 and 0.01 mg/mL for c-myc, 1: 50 and 0.01 mg/mL for anti-Rb-1, 1:200 and 0.005 mg/mL for anti-ki67,and 1:120 and 0.008 mg/mL for anti-EGFR antibodies.The used dilution and concentration of the biotinylatedgoat anti-mouse antibodies were 1:800 at final concentra-tion 0.0025 mg/mL.
Immunohistochemistry procedureThe procedure of IHC was conducted according to themanufacturer instructions (LSAB2 Universal Dakocyto-mation strepavidin-biotin detection system). After bakingslides in oven at 65°C overnight, slides were deparaffin-ized by applying sequential immersion for 5 min inxylene, 95% ethanol, 70% ethanol, and distilled water(DW). Autoclave-based antigen retrieval was standardizedfor each target protein. Slides were placed in a jar contain-ing antigen retrieval solution (0.1 M citrate buffer fromBDH at pH 6) and left in autoclave, for 0.5–8 min (varia-ble time for each target protein) at 121°C. 100 μL of thediluted primary antibodies were then applied onto thesections and the slides were incubated in a humid cham-ber overnight at 4°C.
The next day, slides were rinsed gently with PBS (Merck)-Tween (Sigma) and placed in fresh PBS-Tween bath for 1min. One-two drops of the diluted biotinylated secondarygoat anti-mouse antibodies (DakoCytomation) wereapplied onto the sections and the slides were incubated ina humid chamber for 1 h at 37°C. After rinsing step, One-two drops of streptavidin-Horseradish peroxidase reagent(DakoCytomation) was applied onto the sections, slideswere incubated for 30 min at 37°C. The prepared DAB-substrate chromogen solution was applied onto sections,Slides were incubated in dark at room temperature for 20min. Mayer's hematoxylin stain was used as counterstain,then slides were dehydrated and mounted with DPXmounting fluid. In every run, two negative controls were
Page 3 of 14(page number not for citation purposes)

Journal of Experimental & Clinical Cancer Research 2009, 28:27 http://www.jeccr.com/content/28/1/27
used. The first negative control was antibody dilutingbuffer added alone without primary antibodies. This isessential for measuring the non-specific noise of staining.The second negative control was a known normal urothe-lium section devoid of any positive staining of the corre-sponding target molecule. On the other hand, a strongand consistently stained section was used as a positivecontrol for each target. The detected staining noise, if any,was subtracted from the corresponding test section.
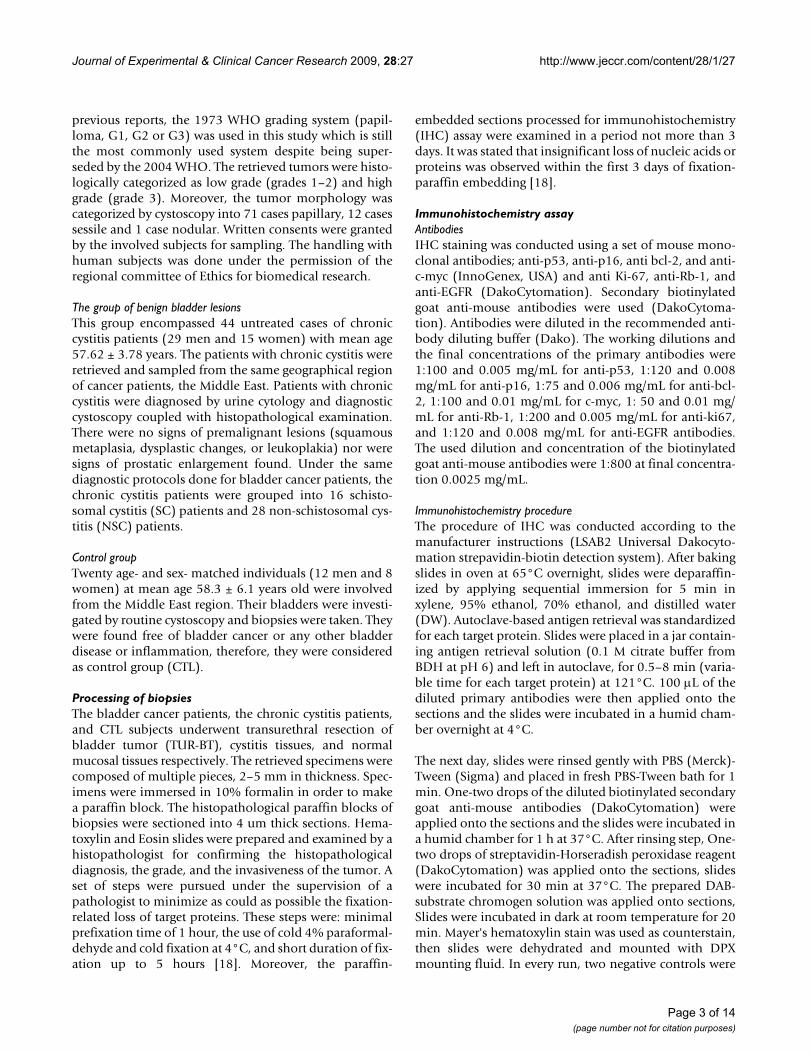
Staining analysisThe tumor cell staining, membranous, cytoplasmic, andnuclear compartments were taken into consideration. Fur-thermore, staining of the stromal cells dispersed betweentumor epithelial cells (not more than 5% of the total cellsin the section) was taken into account as these cellsreflected the same mutational abnormality of the epithe-lial cells. However, other stromal cells scattered through-out the section were not taken into account. The patternof staining was dominantly nuclear for p53, p16, Rb, andbcl-2, nuclear and cytoplasmic for ki-67, cytoplasmic andmembranous for EGFR, and mainly cytoplasmic for c-myc. Since differences in the staining intensity of the stud-ied proteins were slight, the qualitative positive/negativesystem was used. The immunostained cells at moderate tointense dark brown color were considered positive whileother cells were considered negative (Figure. 1). Underlight microscope, the mean percentage of the positivelystained cells in each section was calculated from 3 dense,medium, and light staining areas. In each area, the per-centage of brown stained cells was calculated out of totalcountable cells in 5 high power fields. Due to the numer-ous, sometimes contradicting, scoring systems of the tar-get proteins, the mean percentage of the positively stainedcells was quantitively compared among the differentgroups of this study. To keep the scientific fidelity and toensure the impartial evaluation, the immunostainedslides were examined blindly by two scientists, one fromthe research team and a consultant histopathologist out-side the research team.
Statistical AnalysisStatistical analysis was conducted using SPSS software ver-sion 10 and MS Excel 2000. Chi-square test of independ-ence was used for evaluating the significant association ofhistopathology type, tumor grade, tumor invasiveness,disease staging, and disease recurrence with SBT and NSBTgroups. After proving that the studied groups obey thenormal distribution pattern by using Kolmogorov andSemirnov normalization tests, parametric tests were used.Accordingly, student t test was used to measure the signif-icant difference of the mean percentage of the positivelystained cells for p53, p16, Rb, bcl-2, ki-67, c-myc, andEGFR proteins among the different groups of the study.Moreover, Pearson's correlation coefficient (r) was used to
measure the correlating behavior of the studied markerswith each other. P value less than 0.05 was considered assignificant.
ResultsDemographic features of the bladder cancer and cystitis patientsThe demographic features of the involved patients withbladder cancer and chronic cystitis are summarized in(Table 1). It was found that the mean age of SBT and SCwere less than of NSBT and NSC receptively (P < 0.05).Male: female ratio was higher in SBT and SC than in NSBTand NSC respectively (P < 0.05). On the other hand, therewas no significant difference between bladder cancer, as awhole, and cystitis patients regarding mean age and sexratio (P > 0.05). Moreover, there was no significant differ-ence in age and sex ratio in relation to tumor histopathol-ogy, disease stage and presentation, tumor grade, tumorinvasion, or the tumor growth pattern in both SBT andNSBT groups (P > 0.05).
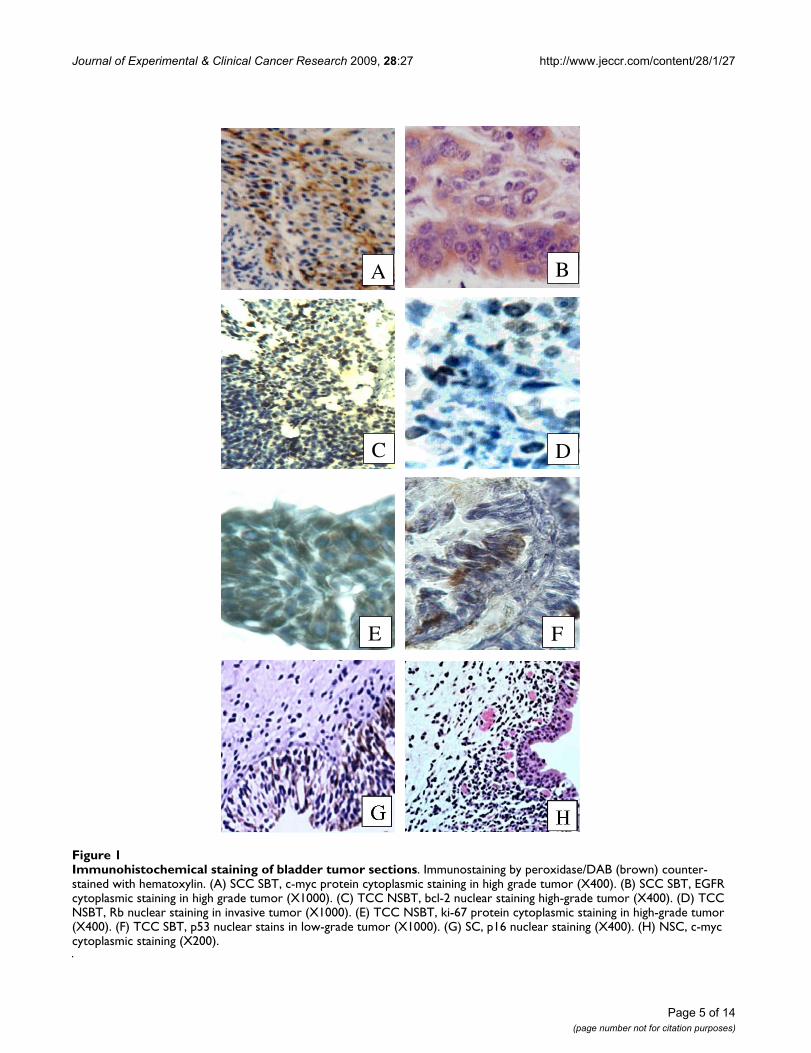
Molecular profile among SBT, NSBT, SC, NSC, and CTL groupsThe immunostaining of the paraffin-embedded sectionsin terms of mean percentage of the positively stained cellsfor p53, p16, bcl-2, ki-67, Rb, c-myc, and EGFR proteinswas compared among SBT, NSBT, SC, NSC, and CTLgroups. It was shown that the molecular profiles of SBTand NSBT were different from each other and from that ofSC, NSC and CTL groups.
The mean percentage of the positively stained cells for p53protein was higher in SBT than in NSBT (P < 0.05) andboth SBT and NSBT showed higher p53 expression than inSC and NSC groups (P < 0.05) which both showed closelevels of p53 expression (P > 0.05). However, SC and NSCshowed higher levels of p53 than in CTL group (P < 0.05)(Figure. 2-A). P16 level of expression was almost similaramong CTL, SC, and NSC groups (P > 0.05) while its levelsharply decreased in both SBT and NSBT (P < 0.05) with-out any difference between SBT and NSBT (P > 0.05) (Fig-ure. 2-B). Bcl-2 level of expression was higher in SBT thanin NSBT (P < 0.05) and both showed higher bcl-2 expres-sion than in SC and NSC (P < 0.05). The bcl-2 level wasnot different between SC and NSC (P > 0.05) which bothshowed higher expression than in CTL group (P < 0.05)(Figure. 2-C). Ki-67 expression was increasing from CTLtowards SC and NSC (P < 0.05) and from SC and NSCtowards SBT and NSBT (P < 0.05) without any significantdifference between SC and NSC or between SBT and NSBT(P > 0.05) (Figure. 2-D). The level of c-myc in both SC andNSC was not higher than in CTL group (P > 0.05) but itwas remarkably higher in SBT and NSBT than othergroups (P < 0.05). Interestingly, c-myc was higher in SBTthan in NSBT (P < 0.05) (Figure. 2-E). The expression of
Page 4 of 14(page number not for citation purposes)
Journal of Experimental & Clinical Cancer Research 2009, 28:27 http://www.jeccr.com/content/28/1/27
Page 5 of 14(page number not for citation purposes)
Immunohistochemical staining of bladder tumor sectionsFigure 1Immunohistochemical staining of bladder tumor sections. Immunostaining by peroxidase/DAB (brown) counter-stained with hematoxylin. (A) SCC SBT, c-myc protein cytoplasmic staining in high grade tumor (X400). (B) SCC SBT, EGFR cytoplasmic staining in high grade tumor (X1000). (C) TCC NSBT, bcl-2 nuclear staining high-grade tumor (X400). (D) TCC NSBT, Rb nuclear staining in invasive tumor (X1000). (E) TCC NSBT, ki-67 protein cytoplasmic staining in high-grade tumor (X400). (F) TCC SBT, p53 nuclear stains in low-grade tumor (X1000). (G) SC, p16 nuclear staining (X400). (H) NSC, c-myc cytoplasmic staining (X200).
C D
A B
E F

Journal of Experimental & Clinical Cancer Research 2009, 28:27 http://www.jeccr.com/content/28/1/27
Page 6 of 14(page number not for citation purposes)
Table 1: The demographic features of the involved patients with baldder cancer and chronic cystitis.
Demographic feature Value
Bladder cancerNumber of patients:
SBT 45 (53.57%)NSBT 39 (46.43%)
Sex of patients:SBT 38 men and 7 women
NSBT 25 men and 14 women
Recurrence of bladder cancer:First presentation 61 (72.62%)
Recurrent 23 (27.38%)
Age of patients:SBT Range: 38–64 years, mean: 51.4 ± 6.2 years
NSBT Range: 46–72, mean: 66.5 ± 5.3 years
Type of tumor growth:SBT 37 papillary
8 sessileNSBT 34 papillary
4 sessile1 nodular
Tumor muscle invasiveness:Invasive (T2, T3, and T4) 62 (73.81%) patients
Non invasive (Ta, T1, and CIS) 22 (26.19%) patients
Grading:Low grade (grade 1 and 2) 35 (41.66%) patients
High grade (grade 3) 49 (58.33%) patients
Histopathology of bladder tumors:SCC 52 (61.91%) patientsTCC 32 (38.09%) patients
Staging of bladder cancer patients:Stage I 9 (10.71%)Stage II 13 (15.47%)Stage III 18 (21.42%)Stage IV 44 (52.38%)
Chronic cystitis
Number of patients:SC 16 (36.36%)
NSC 28 cases (63.64%)
Sex of patients:SC 14 men and 2 women
NSC 15 men and 13 women
Age of patients:SC mean age 62.5 ± 3.5 years
NSC mean age 53.4 ± 4.2 years
Journal of Experimental & Clinical Cancer Research 2009, 28:27 http://www.jeccr.com/content/28/1/27
Page 7 of 14(page number not for citation purposes)
The mean percentage of the positively immunostained cells for (A) p53, (B) p16, (C) bcl-2, (D) ki-67, (E) c-myc, (F) Rb, (G) EGFR in bladder tissue sections of SBT, NSBT, SC, NSC, and CTL groupsFigure 2The mean percentage of the positively immunostained cells for (A) p53, (B) p16, (C) bcl-2, (D) ki-67, (E) c-myc, (F) Rb, (G) EGFR in bladder tissue sections of SBT, NSBT, SC, NSC, and CTL groups.
76.2360.11
27.45 21.518.980
102030405060708090
100
SBT NSBT SC NSC CTLPer
cen
tag
e p
osi
tive
cel
ls (
%)
.
A) p53
18.82 20.4
60.8251.52 58.5
0102030405060708090
100
SBT NSBT SC NSC CTLPer
cen
tag
e p
osi
tive
cel
ls (
%)
.
B) p16
84.71
58.37
26.37 31.48 3.74
0102030405060708090
100
SBT NSBT SC NSC CTLPer
cen
tag
e p
osi
tive
cel
ls (
%)
.
C) bcl-2
91.63 84.68
26.6832.38
11.640102030405060708090
100
SBT NSBT SC NSC CTLPer
cen
tag
e p
osi
tive
cel
ls (
%)
.
D) ki-67
64.9247.38
12.8411.2 10.070102030405060708090
100
SBT NSBT SC NSC CTLPer
cen
tag
e p
osi
tive
cel
ls (
%)
.
E) c-myc
41.823.68
54.4257.9 62.2
0102030405060708090
100
SBT NSBT SC NSC CTLPer
cen
tag
e p
osi
tive
cel
ls (
%)
.
F) Rb
84.89
58.37
16.838.28 8.52
0102030405060708090
100
SBT NSBT SC NSC CTLPer
cen
tag
e p
osi
tive
cel
ls (
%)
.
G) EGFR
Journal of Experimental & Clinical Cancer Research 2009, 28:27 http://www.jeccr.com/content/28/1/27
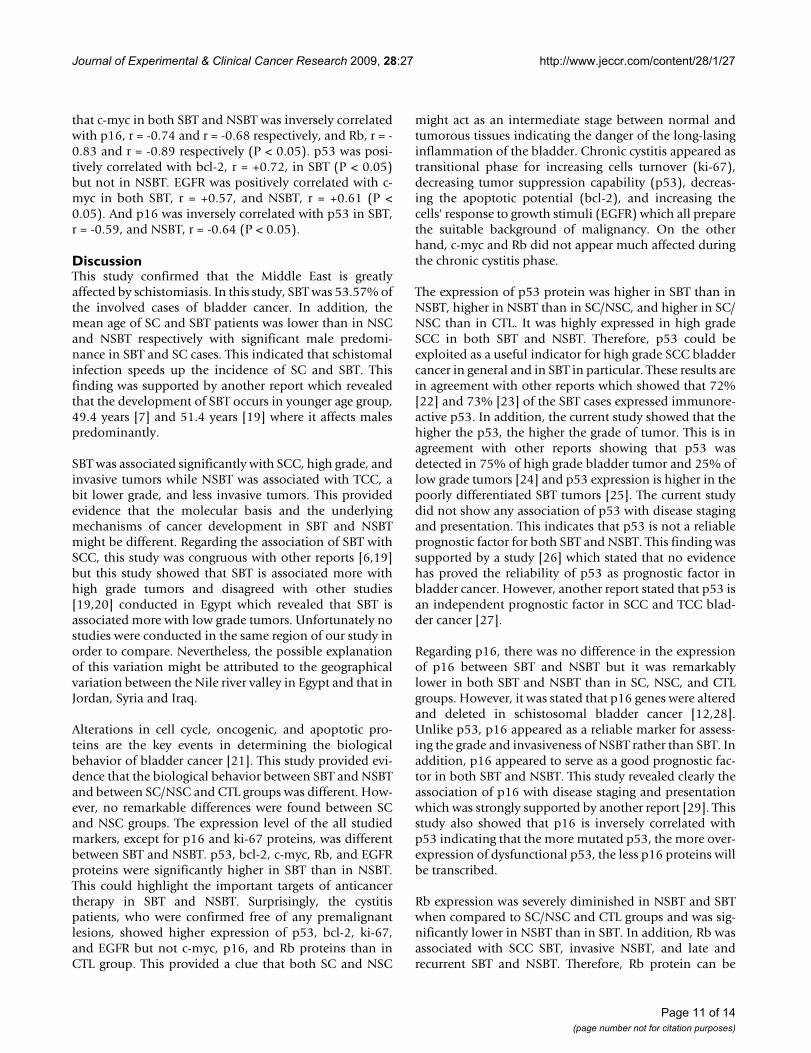
Rb was diminished in both SBT and NSBT when com-pared with CTL, SC, and NSC groups (P < 0.05). NSBTgroup showed lower Rb expression than in SBT group (P< 0.05). Rb level in both SC and NSC was close and notsignificantly different from that in CTL group (P > 0.05)(Figure. 2-F). The expression level of EGFR increased sig-nificantly from CTL group towards NSC, SC, NSBT, andSBT (P < 0.05) (Figure. 2-G).
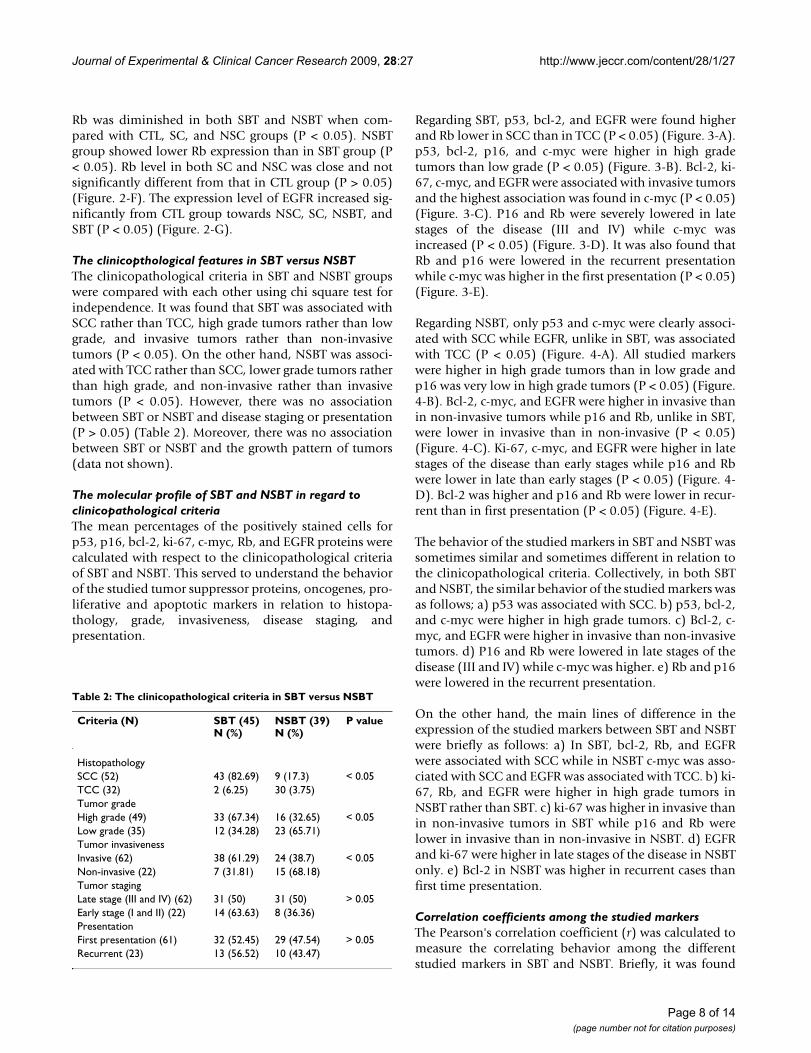
The clinicopthological features in SBT versus NSBTThe clinicopathological criteria in SBT and NSBT groupswere compared with each other using chi square test forindependence. It was found that SBT was associated withSCC rather than TCC, high grade tumors rather than lowgrade, and invasive tumors rather than non-invasivetumors (P < 0.05). On the other hand, NSBT was associ-ated with TCC rather than SCC, lower grade tumors ratherthan high grade, and non-invasive rather than invasivetumors (P < 0.05). However, there was no associationbetween SBT or NSBT and disease staging or presentation(P > 0.05) (Table 2). Moreover, there was no associationbetween SBT or NSBT and the growth pattern of tumors(data not shown).
The molecular profile of SBT and NSBT in regard to clinicopathological criteriaThe mean percentages of the positively stained cells forp53, p16, bcl-2, ki-67, c-myc, Rb, and EGFR proteins werecalculated with respect to the clinicopathological criteriaof SBT and NSBT. This served to understand the behaviorof the studied tumor suppressor proteins, oncogenes, pro-liferative and apoptotic markers in relation to histopa-thology, grade, invasiveness, disease staging, andpresentation.
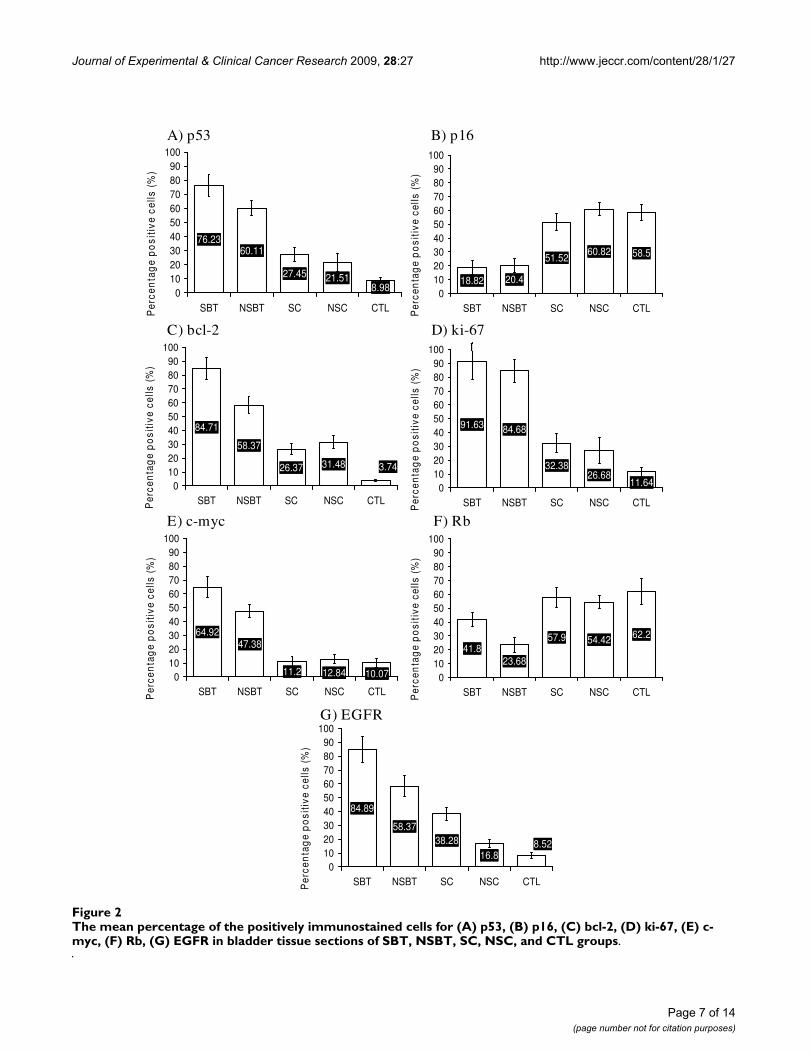
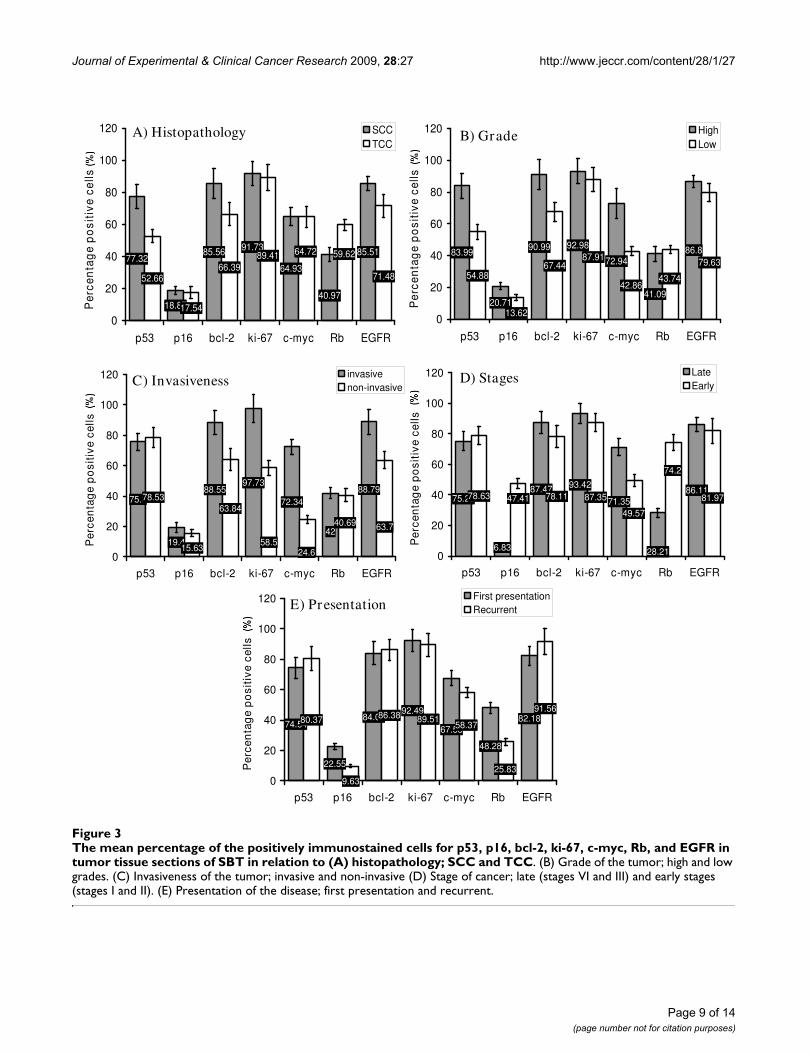
Regarding SBT, p53, bcl-2, and EGFR were found higherand Rb lower in SCC than in TCC (P < 0.05) (Figure. 3-A).p53, bcl-2, p16, and c-myc were higher in high gradetumors than low grade (P < 0.05) (Figure. 3-B). Bcl-2, ki-67, c-myc, and EGFR were associated with invasive tumorsand the highest association was found in c-myc (P < 0.05)(Figure. 3-C). P16 and Rb were severely lowered in latestages of the disease (III and IV) while c-myc wasincreased (P < 0.05) (Figure. 3-D). It was also found thatRb and p16 were lowered in the recurrent presentationwhile c-myc was higher in the first presentation (P < 0.05)(Figure. 3-E).
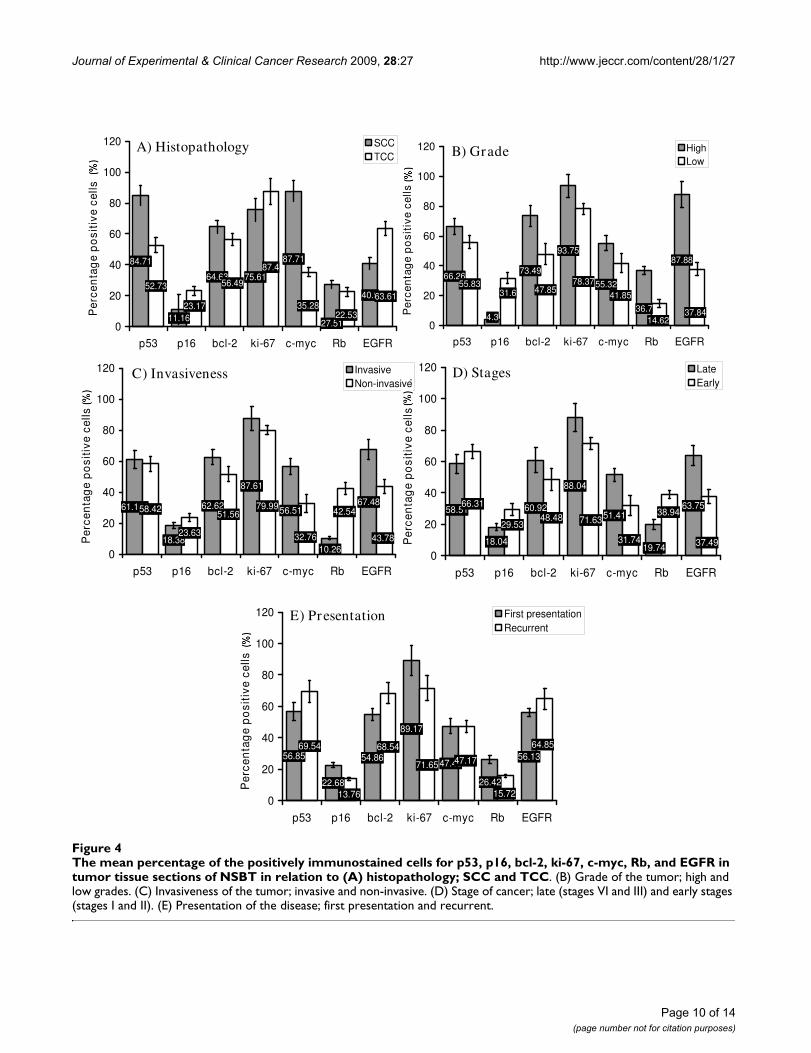
Regarding NSBT, only p53 and c-myc were clearly associ-ated with SCC while EGFR, unlike in SBT, was associatedwith TCC (P < 0.05) (Figure. 4-A). All studied markerswere higher in high grade tumors than in low grade andp16 was very low in high grade tumors (P < 0.05) (Figure.4-B). Bcl-2, c-myc, and EGFR were higher in invasive thanin non-invasive tumors while p16 and Rb, unlike in SBT,were lower in invasive than in non-invasive (P < 0.05)(Figure. 4-C). Ki-67, c-myc, and EGFR were higher in latestages of the disease than early stages while p16 and Rbwere lower in late than early stages (P < 0.05) (Figure. 4-D). Bcl-2 was higher and p16 and Rb were lower in recur-rent than in first presentation (P < 0.05) (Figure. 4-E).
The behavior of the studied markers in SBT and NSBT wassometimes similar and sometimes different in relation tothe clinicopathological criteria. Collectively, in both SBTand NSBT, the similar behavior of the studied markers wasas follows; a) p53 was associated with SCC. b) p53, bcl-2,and c-myc were higher in high grade tumors. c) Bcl-2, c-myc, and EGFR were higher in invasive than non-invasivetumors. d) P16 and Rb were lowered in late stages of thedisease (III and IV) while c-myc was higher. e) Rb and p16were lowered in the recurrent presentation.
On the other hand, the main lines of difference in theexpression of the studied markers between SBT and NSBTwere briefly as follows: a) In SBT, bcl-2, Rb, and EGFRwere associated with SCC while in NSBT c-myc was asso-ciated with SCC and EGFR was associated with TCC. b) ki-67, Rb, and EGFR were higher in high grade tumors inNSBT rather than SBT. c) ki-67 was higher in invasive thanin non-invasive tumors in SBT while p16 and Rb werelower in invasive than in non-invasive in NSBT. d) EGFRand ki-67 were higher in late stages of the disease in NSBTonly. e) Bcl-2 in NSBT was higher in recurrent cases thanfirst time presentation.
Correlation coefficients among the studied markersThe Pearson's correlation coefficient (r) was calculated tomeasure the correlating behavior among the differentstudied markers in SBT and NSBT. Briefly, it was found
Table 2: The clinicopathological criteria in SBT versus NSBT
Criteria (N) SBT (45)N (%)
NSBT (39)N (%)
P value
HistopathologySCC (52) 43 (82.69) 9 (17.3) < 0.05TCC (32) 2 (6.25) 30 (3.75)Tumor gradeHigh grade (49) 33 (67.34) 16 (32.65) < 0.05Low grade (35) 12 (34.28) 23 (65.71)Tumor invasivenessInvasive (62) 38 (61.29) 24 (38.7) < 0.05Non-invasive (22) 7 (31.81) 15 (68.18)Tumor stagingLate stage (III and IV) (62) 31 (50) 31 (50) > 0.05Early stage (I and II) (22) 14 (63.63) 8 (36.36)PresentationFirst presentation (61) 32 (52.45) 29 (47.54) > 0.05Recurrent (23) 13 (56.52) 10 (43.47)
Page 8 of 14(page number not for citation purposes)
Journal of Experimental & Clinical Cancer Research 2009, 28:27 http://www.jeccr.com/content/28/1/27
Page 9 of 14(page number not for citation purposes)
The mean percentage of the positively immunostained cells for p53, p16, bcl-2, ki-67, c-myc, Rb, and EGFR in tumor tissue sec-tions of SBT in relation to (A) histopathology; SCC and TCCFigure 3The mean percentage of the positively immunostained cells for p53, p16, bcl-2, ki-67, c-myc, Rb, and EGFR in tumor tissue sections of SBT in relation to (A) histopathology; SCC and TCC. (B) Grade of the tumor; high and low grades. (C) Invasiveness of the tumor; invasive and non-invasive (D) Stage of cancer; late (stages VI and III) and early stages (stages I and II). (E) Presentation of the disease; first presentation and recurrent.
75.8
19.4
88.5597.73
72.3488.79
78.5363.84
4240.69 63.7
15.6358.5
24.60
20
40
60
80
100
120
p53 p16 bcl-2 ki-67 c-myc Rb EGFR
Per
cen
tag
e p
osi
tive
cel
ls
.
invasivenon-invasive
75.22
6.83
87.47 93.42
71.3586.11
78.63 78.11
28.21
74.2
81.9747.41 87.35
49.57
0
20
40
60
80
100
120
p53 p16 bcl-2 ki-67 c-myc Rb EGFR
Per
cen
tag
e p
osi
tive
cel
ls
.
LateEarly
74.54
22.55
84.0392.49
67.5882.1880.37 86.38
48.28
25.83
91.56
9.63
89.5158.37
0
20
40
60
80
100
120
p53 p16 bcl-2 ki-67 c-myc Rb EGFR
Per
cen
tag
e p
osi
tive
cel
ls
.
First presentationRecurrent
77.32
18.87
85.56 91.73
64.93
85.51
52.6666.39
40.97
59.62
71.48
17.54
89.41 64.72
0
20
40
60
80
100
120
p53 p16 bcl-2 ki-67 c-myc Rb EGFR
Per
cen
tag
e p
osi
tive
cel
ls
.
SCCTCC
83.99
20.71
90.99 92.98
72.9486.8
54.8867.44
41.09
43.74
79.63
13.62
87.91
42.86
0
20
40
60
80
100
120
p53 p16 bcl-2 ki-67 c-myc Rb EGFR
Per
cen
tag
e p
osi
tive
cel
ls
.
HighLow
E) Presentation
D) StagesC) Invasiveness
A) Histopathology B) Grade
Journal of Experimental & Clinical Cancer Research 2009, 28:27 http://www.jeccr.com/content/28/1/27
Page 10 of 14(page number not for citation purposes)
The mean percentage of the positively immunostained cells for p53, p16, bcl-2, ki-67, c-myc, Rb, and EGFR in tumor tissue sec-tions of NSBT in relation to (A) histopathology; SCC and TCCFigure 4The mean percentage of the positively immunostained cells for p53, p16, bcl-2, ki-67, c-myc, Rb, and EGFR in tumor tissue sections of NSBT in relation to (A) histopathology; SCC and TCC. (B) Grade of the tumor; high and low grades. (C) Invasiveness of the tumor; invasive and non-invasive. (D) Stage of cancer; late (stages VI and III) and early stages (stages I and II). (E) Presentation of the disease; first presentation and recurrent.
84.71
11.16
64.63
87.71
40.952.73 56.49
75.61
27.5122.53
63.6123.17
87.4
35.28
0
20
40
60
80
100
120
p53 p16 bcl-2 ki-67 c-myc Rb EGFR
Per
cen
tag
e p
osi
tive
cel
ls
.
SCCTCC
61.166
18.38
62.62 56.5167.48
58.42 51.56
87.61
10.26
42.54
43.7823.63
79.99
32.76
0
20
40
60
80
100
120
p53 p16 bcl-2 ki-67 c-myc Rb EGFR
Per
cen
tag
e p
osi
tive
cel
ls
.
InvasiveNon-invasive
66.26
4.3
73.49
55.32
87.88
55.8347.85
36.7
93.75
41.85
78.3731.6
37.8414.620
20
40
60
80
100
120
p53 p16 bcl-2 ki-67 c-myc Rb EGFR
Per
cen
tag
e p
osi
tive
cel
ls
.
HighLow
58.51
18.04
60.9251.41
63.7566.31
48.48
19.74
88.04
31.74
71.6329.53
37.49
38.94
0
20
40
60
80
100
120
p53 p16 bcl-2 ki-67 c-myc Rb EGFR
Per
cen
tag
e p
osi
tive
cel
ls
.
LateEarly
56.85
22.68
54.8647.45
56.1369.54 68.54
26.42
89.17
47.1771.65
13.76
64.85
15.720
20
40
60
80
100
120
p53 p16 bcl-2 ki-67 c-myc Rb EGFR
Per
cen
tag
e p
osi
tive
cel
ls
.
First presentationRecurrent
D) StagesC) Invasiveness
E) Presentation
B) GradeA) Histopathology
Journal of Experimental & Clinical Cancer Research 2009, 28:27 http://www.jeccr.com/content/28/1/27
that c-myc in both SBT and NSBT was inversely correlatedwith p16, r = -0.74 and r = -0.68 respectively, and Rb, r = -0.83 and r = -0.89 respectively (P < 0.05). p53 was posi-tively correlated with bcl-2, r = +0.72, in SBT (P < 0.05)but not in NSBT. EGFR was positively correlated with c-myc in both SBT, r = +0.57, and NSBT, r = +0.61 (P <0.05). And p16 was inversely correlated with p53 in SBT,r = -0.59, and NSBT, r = -0.64 (P < 0.05).
DiscussionThis study confirmed that the Middle East is greatlyaffected by schistomiasis. In this study, SBT was 53.57% ofthe involved cases of bladder cancer. In addition, themean age of SC and SBT patients was lower than in NSCand NSBT respectively with significant male predomi-nance in SBT and SC cases. This indicated that schistomalinfection speeds up the incidence of SC and SBT. Thisfinding was supported by another report which revealedthat the development of SBT occurs in younger age group,49.4 years [7] and 51.4 years [19] where it affects malespredominantly.
SBT was associated significantly with SCC, high grade, andinvasive tumors while NSBT was associated with TCC, abit lower grade, and less invasive tumors. This providedevidence that the molecular basis and the underlyingmechanisms of cancer development in SBT and NSBTmight be different. Regarding the association of SBT withSCC, this study was congruous with other reports [6,19]but this study showed that SBT is associated more withhigh grade tumors and disagreed with other studies[19,20] conducted in Egypt which revealed that SBT isassociated more with low grade tumors. Unfortunately nostudies were conducted in the same region of our study inorder to compare. Nevertheless, the possible explanationof this variation might be attributed to the geographicalvariation between the Nile river valley in Egypt and that inJordan, Syria and Iraq.
Alterations in cell cycle, oncogenic, and apoptotic pro-teins are the key events in determining the biologicalbehavior of bladder cancer [21]. This study provided evi-dence that the biological behavior between SBT and NSBTand between SC/NSC and CTL groups was different. How-ever, no remarkable differences were found between SCand NSC groups. The expression level of the all studiedmarkers, except for p16 and ki-67 proteins, was differentbetween SBT and NSBT. p53, bcl-2, c-myc, Rb, and EGFRproteins were significantly higher in SBT than in NSBT.This could highlight the important targets of anticancertherapy in SBT and NSBT. Surprisingly, the cystitispatients, who were confirmed free of any premalignantlesions, showed higher expression of p53, bcl-2, ki-67,and EGFR but not c-myc, p16, and Rb proteins than inCTL group. This provided a clue that both SC and NSC
might act as an intermediate stage between normal andtumorous tissues indicating the danger of the long-lasinginflammation of the bladder. Chronic cystitis appeared astransitional phase for increasing cells turnover (ki-67),decreasing tumor suppression capability (p53), decreas-ing the apoptotic potential (bcl-2), and increasing thecells' response to growth stimuli (EGFR) which all preparethe suitable background of malignancy. On the otherhand, c-myc and Rb did not appear much affected duringthe chronic cystitis phase.
The expression of p53 protein was higher in SBT than inNSBT, higher in NSBT than in SC/NSC, and higher in SC/NSC than in CTL. It was highly expressed in high gradeSCC in both SBT and NSBT. Therefore, p53 could beexploited as a useful indicator for high grade SCC bladdercancer in general and in SBT in particular. These results arein agreement with other reports which showed that 72%[22] and 73% [23] of the SBT cases expressed immunore-active p53. In addition, the current study showed that thehigher the p53, the higher the grade of tumor. This is inagreement with other reports showing that p53 wasdetected in 75% of high grade bladder tumor and 25% oflow grade tumors [24] and p53 expression is higher in thepoorly differentiated SBT tumors [25]. The current studydid not show any association of p53 with disease stagingand presentation. This indicates that p53 is not a reliableprognostic factor for both SBT and NSBT. This finding wassupported by a study [26] which stated that no evidencehas proved the reliability of p53 as prognostic factor inbladder cancer. However, another report stated that p53 isan independent prognostic factor in SCC and TCC blad-der cancer [27].
Regarding p16, there was no difference in the expressionof p16 between SBT and NSBT but it was remarkablylower in both SBT and NSBT than in SC, NSC, and CTLgroups. However, it was stated that p16 genes were alteredand deleted in schistosomal bladder cancer [12,28].Unlike p53, p16 appeared as a reliable marker for assess-ing the grade and invasiveness of NSBT rather than SBT. Inaddition, p16 appeared to serve as a good prognostic fac-tor in both SBT and NSBT. This study revealed clearly theassociation of p16 with disease staging and presentationwhich was strongly supported by another report [29]. Thisstudy also showed that p16 is inversely correlated withp53 indicating that the more mutated p53, the more over-expression of dysfunctional p53, the less p16 proteins willbe transcribed.
Rb expression was severely diminished in NSBT and SBTwhen compared to SC/NSC and CTL groups and was sig-nificantly lower in NSBT than in SBT. In addition, Rb wasassociated with SCC SBT, invasive NSBT, and late andrecurrent SBT and NSBT. Therefore, Rb protein can be
Page 11 of 14(page number not for citation purposes)
Journal of Experimental & Clinical Cancer Research 2009, 28:27 http://www.jeccr.com/content/28/1/27
used as an efficient prognostic and discriminatory factorfor both SBT and NSBT. This might give a clue that schis-tosomiasis has no particular relationship with Rb gene inbladder cancer. There is a report [30] revealed that infre-quent loss of Rb expression was found in invasive lesionsassociated with schistosomiasis. Unfortunately, no previ-ous study was done on the association of Rb with SBT inthe same geographical region of the current study. Inter-estingly, both Rb and p16 proteins were inversely corre-lated with c-myc in both SBT and NSBT. A recent study[31] found that the mechanism of Rb inactivation isthrough hyperphosphorylation, which results from loss ofp16 expression.
Bcl-2 protein was similar to that of p53. It was higher inSBT than in NSBT, in SBT/NSBT than in SC/NSC, and inSC/NSC than CTL. And it was associated with SCC SBTand high grade invasive SBT and NSBT. Moreover, it wasnot associated with staging, presentation or TCC NSBT.Accordingly, bcl-2 proved to be a useful discriminatoryfactor between SBT and NSBT, cystitis and bladder cancer,and cancer/cystitis and CTL. This study showed that bcl-2,or loss of apoptotic potential, increases steadily with blad-der chronic inflammation and with bladder cancer favor-ing SBT on NSBT. These findings are in agreement with[24] who stated that the positive immunostaining of bcl-2 was observed in 69% of bladder cancers where 75% ofpatients were with high-grade tumors. In addition, thecurrent study supports a recent report [32] stating that bcl-2 is of little prognostic value. However, our findings con-tradict another report [23] which showed that bcl-2expression was only 20% in schistosomal bladder cancerand it has no relationship with tumor grade. On the otherhand, the current study confirmed the presence of signifi-cant direct correlation between bcl-2 and p53 which sup-ports the conclusions of another report [16] stating thatthe loss of p53 function enhances the expression of bcl-2,by relieving it from the transcriptional repression of thewild type p53 protein.
Regarding oncogenes, c-myc was higher in SBT than inNSBT, higher in SBT/NSBT than in other groups. It wasassociated with tumor grade, invasiveness, and late stagesin both SBT and NSBT. It was the only factor associatedwith tumor invasiveness, grade, and prognosis as well as itproved to be a good discriminatory factor between SBTand NSBT and between bladder cancer and cystitis/CTLgroups. These findings are in agreement with [33] whoshowed that 58% of bladder cancer patients were c-mycpositive and 59% of the positive cases were of muscle-invasive tumors. However unlike the results of our study,they concluded that c-myc over-expression did not corre-late with tumor grade or tumor progression while anotherstudy [34] found that 34% of patients had positive c-mycwhich was associated with tumor grade but with no prog-
nostic value. Unfortunately, no previous study was con-ducted on the association of c-myc with SBT to comparewith. The current study might be the first to investigate therole of c-myc in SBT and NSBT and might be the first torelate c-myc with the clinicopathological criteria of blad-der cancer.
Regarding EGFR, this oncogene increased significantlyfrom CTL towards NSC, SC, NSBT, and SBT. ThereforeEGFR could be used as a reliable discriminatory factor forthe all studied groups. Moreover, it was associated withSBT SCC, NSBT TCC, high grade NSBT, invasive SBT andNSBT, and late stages of NSBT. The results of the currentstudy are supported by a study [35] which stated thatEGFR is associated with SCC of bladder and another study[10] stated that 70% of muscle-invasive bladder cancersexpress EGFR which is associated with poor prognosis.Accordingly, the current study showed the importance ofEGFR as a candidate for anti-cancer therapy in bladder. Itwas suggested that there is a need to use anti-EGFR as anovel anti-cancer therapy in bladder [11].
In cancer cells, Ki-67 plays an important role as an indexfor the replication and the prognosis and is well associ-ated to tumor grade, stage and recurrence [36]. In thisstudy, expression of Ki-67 protein was higher in SBT/NSBT than in SC/NSC which was higher than in CTLgroup. There was no difference in the proliferation ratebetween SBT and NSBT. Therefore, a limited role of ki-67might be present in schistosoma-related pathogenesis ofbladder cancers. Moreover, ki-67 was associated with highgrade NSBT, invasive SBT, and late stage NSBT. This is inagreement with other studies [37,38] which showed thatKi-67 positive immunostaining was correlated with tumorgrade and muscle invasion.
ConclusionTaken together, the molecular background of SBT seemsdistinct from that of NSBT. SBT was associated with SCC,higher grade and more invasive tumors while NSBT wasassociated with TCC, lower grade and less invasivetumors. p53, bcl-2, c-myc, Rb, and EGFR were highlyexpressed in SBT, more than in NSBT, which are thereforemight be useful as indicators and discriminatory markersfor bladder cancer in general and SBT in particular.Chronic cystitis acts as an intermediate stage for the over-expression of p53, bcl-2, and EGFR markers that wereshown implicated in both SBT and NSBT. p53 is stronglyassociated with high grade SCC tumors in both SBT andNSBT but it is poor prognostic factor. Bcl-2 is similar top53 but it is increased in recurrent cases. P16, Rb, and c-myc were shown as good prognostic markers for SBT andNSBT. C-myc and EGFR appeared central in many aspectsof carcinogenesis, tumor grade, tumor invasiveness, andcancer staging.
Page 12 of 14(page number not for citation purposes)

Journal of Experimental & Clinical Cancer Research 2009, 28:27 http://www.jeccr.com/content/28/1/27
Competing interestsThe authors declare that they have no competing interests.
Authors' contributionsRR and HS carried out patients sampling and interviewingin conjunction with specialist urologists. AS and F did theimmunostaining procedures and examination in conjunc-tion with specialist pathologists. AS and F carried out thepaper drafting, statistical design, statistical analysis, andthe proofreading of the article language and integrity. Allauthors read and approved the final manuscript.
AcknowledgementsThis study was greatly supported by many medical centers in many coun-tries in the Middle East and in Malaysia where the study was done. We awe the success of this study to the peerless collaboration of the specialist urol-ogists and pathologists in recruiting, examining, diagnosing, and sorting the population of the study correctly and double-blind examining the his-topathological tissue sections.
References1. Shirai T: Etiology of bladder cancer. Semin Urol 1993, 3:113-116.2. Carroll PR: Urothelial Carcinoma: Cancers of the Bladder
Ureter & Renal Pelvis. In General Urology 14th edition. Edited by:Tanagho EA, McAninch JW. Philadelphia: Prentice-Hall InternationalInc; 1995:353-372.
3. Sandberg AA, Berger CS: Review of chromosome studies in uro-logical tumors. II. Cytogenetics and molecular genetics ofbladder cancer. J Urol 1994, 151:545-560.
4. Ejezie GC: The epidemiology and control of schistosomiasis inAfrica. Nigeria J Med 1991, 1:29-30.
5. El-Harvey MA, Amr MM, Abdel-Rahman AB: The epidemiology ofschistosomiasis in Egypt: Gharbia Governorate. Am J Trop MedHyg 2000, 62:42-48.
6. Mostafa MH, Sheweita SA, O'Connor PJ: Relationship betweenschistosomiasis and bladder cancer. Clin Microbiol Rev 1999,12:97-111.
7. Warren W, Biggs PJ, el-Baz M, Ghoneim MA, Stratton MR, Venitt S:Mutations in the p53 gene in schistosomal bladder cancer: astudy of 92 tumours from Egyptian patients and a compari-son between mutational spectra from schistosomal and non-schistosomal urothelial tumours. Carcinogenesis 1995,16:1181-1189.
8. Del Senno L, Maestri I, Piva R, Hanau S, Reggiani A, Romano A, RussoG: Differential hypomethylation of the c- myc protoonco-gene in bladder cancers at different stages and grades. J Urol1989, 142:146-149.
9. Williams SG, Buscarini M, Stein JP: Molecular markers for diagno-sis, staging and prognosis of bladder cancer. Oncology 2001,15:1461-1484.
10. Villares GJ, Zigler M, Blehm K, Bogdan C, McConkey D, Colin D, Bar-Eli M: Targeting EGFR in bladder cancer. World J Urol 2007,25:573-579.
11. Colquhoun AJ, McHugh LA, Tulchinsky E, Kriajevska M, Mellon JK:Combination treatment with ionising radiation and gefitinib('Iressa', ZD1839), an epidermal growth factor receptor(EGFR) inhibitor, significantly inhibits bladder cancer cellgrowth in vitro and in vivo. J Radiat Res (Tokyo) 2007, 48:351-360.
12. Mitra AP, Birkhahn M, Cote RJ: p53 and retinoblastoma path-ways in bladder cancer. World J Urol 2007, 25:563-571.
13. Tzai TS, Tsai YS, Chow NH: The prevalence and clinicopatho-logic correlate of p16INK4a, retinoblastoma and p53 immu-noreactivity in locally advanced urinary bladder cancer. UrolOncol 2004, 22:112-118.
14. Bellamy CO, Malcomson R, Wyllie A: The role of p53 in apoptosisand cancer. In Apoptosis and cancer 2nd edition. Edited by: Martin SJ.Basel: Karger Landes systems; 1997:67-71.
15. Cho HJ, Kim JK, Kim KD, Yoon HK, Cho MY, Park YP, Jeon JH, LeeES, Byun SS, Lim HM: Upregulation of Bcl-2 is associated with
cisplatin-resistance via inhibition of Bax translocation inhuman bladder cancer cells. Cancer Lett 2006, 237:56-66.
16. Reed JC: Bcl-2 Family proteins: Role in dysregulation of apop-tosis and chemoresistance in cancer. In Apoptosis and cancer 2ndedition. Edited by: Martin SJ. Basel: Karger Landes systems;1997:112-116.
17. Lindboe CF, Torp SH: Comparison of Ki-67 equivalent antibod-ies. J Clin Pathol 2002, 55:467-471.
18. Srinivasan M, Sedmak D, Jewell S: Effect of fixatives and tissueprocessing on the content and integrity of nucleic acids. AmJ Pathol 2002, 161:1961-1971.
19. El Bolkainy MN, Mokhtar NM, Ghoneim MA, Hussein MH: Theimpact of schistosomiasis on the pathology of bladder carci-noma. Cancer 1981, 48:2643-2648.
20. Tawfik HN: Carcinoma of the urinary bladder associated withschistosomiasis in Egypt: the possible causal relationship.Princess Takamatsu Symp 1987, 18:197-209.
21. Pich A, Margaria M, Chiusa L, Bortolin P, Palestro G: Relationshipbetween AgNORs, MIB-1 and oncogene expression in malebreast carcinoma and papillary superficial bladder neoplasm.Oncology Reports 2003, 10:1329-1335.
22. Chaudhary KS, Lu QL, Abel PD, Khandan-Nia N, Shoma AM, el BazM, Stamp GW, Lalani EN: Expression of bcl-2 and p53 oncopro-teins in schistosomiasis-associated transitional and squa-mous cell carcinoma of urinary bladder. Br J Urol 1997,79:78-84.
23. Badr KM, Nolen JD, Derose PB, Cohen C: Muscle invasive schis-tosomal squamous cell carcinoma of the urinary bladder:frequency and prognostic significance of p53, BCL-2, HER2/neu, and proliferation (MIB-1). Hum Pathol 2004, 35(2):184-189.
24. Atug F, Turkeri L, Ozyurek M, Akdas A: bcl-2 and p53 overexpres-sion as associated risk factors in TCC of the bladder. Int UrolNephrol 1998, 30:455-461.
25. Helal Tel A, Fadel MT, El-Sayed NK: Human papilloma virus andp53 expression in bladder cancer in Egypt: relationship toschistosomiasis and clinicopathologic factors. Pathol Oncol Res2006, 12(3):173-178.
26. Malats N, Bustos A, Nascimento CM, Fernandez F, Rivas M, PuenteD, Kogevinas M, Real FX: p53 as a prognostic marker for blad-der cancer: a meta-analysis and review. Lancet Oncol 2005,6:678-686.
27. Haitel A, Posch B, El-Baz M, Mokhtar AA, Susani M, Ghoneim MA,Marberger M: Bilharzial related, organ confined, muscle inva-sive bladder cancer: prognostic value of apoptosis markers,proliferation markers, p53, E-cadherin, epidermal growthfactor receptor and c-erbB-2. J Urol 2001, 165(5):1481-1487.
28. Eissa S, Ali-Labib R, Khalifa A: Deletion of p16 and p15 genes Inschistosomiasis-associated bladder cancer (SABC). Clin ChimActa 2000, 300:159-169.
29. Brunner A, Verdorfer I, Prelog M, Mayerl C, Mikuz G, Tzankov A:Large-scale analysis of cell cycle regulators in urothelial blad-der cancer identifies p16 and p27 as potentially useful prog-nostic markers. Pathobiology 2008, 75:25-33.
30. Ramchurren N, Cooper K, Summerhayes IC: Molecular eventsunderlying schistosomiasis-related bladder cancer. Int J Can-cer 1995, 62:237-244.
31. Chatterjee SJ, George B, Goebell PJ, Alavi-Tafreshi M, Shi SR, FungYK, Jones PA, Cordon-Cardo C, Datar RH, Cote RJ: Hyperphos-phorylation of pRb: a mechanism for RB tumour suppressorpathway inactivation in bladder cancer. J Pathol 2004,203:762-770.
32. Hameed DA, Abdel Raheem AM, Mosad E, Hammouda HM, KamelNA, Abdel Aziz MA: Bcl-XL and Bcl-2 expression in bilharzialsquamous cell carcinoma of the urinary bladder: which pro-tein is prognostic? Urology 2008, 72(2):374-378.
33. Schmitz-Drager BJ, Schulz WA, Jurgens B, Gerharz CD, van RoeyenCR, Bultel H: c-myc in bladder cancer, clinical findings andanalysis of mechanism. Urol Res 1997, 25:S45-S49.
34. Lipponen PK: Expression of c-myc protein is related to cellproliferation and expression of growth factor receptors intransitional cell bladder cancer. J Pathol 1995, 175:203-210.
35. Tungekar MF, Linehan J: Patterns of expressions of transforminggrowth factor and epidermal growth factor receptor in squa-mous cell lesions of the urinary bladder. J Clin Pathol 1998,51:583-587.
Page 13 of 14(page number not for citation purposes)
http://www.ncbi.nlm.nih.gov/entrez/query.fcgi?cmd=Retrieve&db=PubMed&dopt=Abstract&list_uids=7905930
http://www.ncbi.nlm.nih.gov/entrez/query.fcgi?cmd=Retrieve&db=PubMed&dopt=Abstract&list_uids=7905930
http://www.ncbi.nlm.nih.gov/entrez/query.fcgi?cmd=Retrieve&db=PubMed&dopt=Abstract&list_uids=7905930
http://www.ncbi.nlm.nih.gov/entrez/query.fcgi?cmd=Retrieve&db=PubMed&dopt=Abstract&list_uids=9880476
http://www.ncbi.nlm.nih.gov/entrez/query.fcgi?cmd=Retrieve&db=PubMed&dopt=Abstract&list_uids=9880476
http://www.ncbi.nlm.nih.gov/entrez/query.fcgi?cmd=Retrieve&db=PubMed&dopt=Abstract&list_uids=7767983
http://www.ncbi.nlm.nih.gov/entrez/query.fcgi?cmd=Retrieve&db=PubMed&dopt=Abstract&list_uids=7767983
http://www.ncbi.nlm.nih.gov/entrez/query.fcgi?cmd=Retrieve&db=PubMed&dopt=Abstract&list_uids=7767983
http://www.ncbi.nlm.nih.gov/entrez/query.fcgi?cmd=Retrieve&db=PubMed&dopt=Abstract&list_uids=2733094
http://www.ncbi.nlm.nih.gov/entrez/query.fcgi?cmd=Retrieve&db=PubMed&dopt=Abstract&list_uids=2733094
http://www.ncbi.nlm.nih.gov/entrez/query.fcgi?cmd=Retrieve&db=PubMed&dopt=Abstract&list_uids=7306921
http://www.ncbi.nlm.nih.gov/entrez/query.fcgi?cmd=Retrieve&db=PubMed&dopt=Abstract&list_uids=7306921
http://www.ncbi.nlm.nih.gov/entrez/query.fcgi?cmd=Retrieve&db=PubMed&dopt=Abstract&list_uids=7306921
http://www.ncbi.nlm.nih.gov/entrez/query.fcgi?cmd=Retrieve&db=PubMed&dopt=Abstract&list_uids=3147281
http://www.ncbi.nlm.nih.gov/entrez/query.fcgi?cmd=Retrieve&db=PubMed&dopt=Abstract&list_uids=3147281
http://www.ncbi.nlm.nih.gov/entrez/query.fcgi?cmd=Retrieve&db=PubMed&dopt=Abstract&list_uids=9043502
http://www.ncbi.nlm.nih.gov/entrez/query.fcgi?cmd=Retrieve&db=PubMed&dopt=Abstract&list_uids=9043502
http://www.ncbi.nlm.nih.gov/entrez/query.fcgi?cmd=Retrieve&db=PubMed&dopt=Abstract&list_uids=9043502
http://www.ncbi.nlm.nih.gov/entrez/query.fcgi?cmd=Retrieve&db=PubMed&dopt=Abstract&list_uids=9821049
http://www.ncbi.nlm.nih.gov/entrez/query.fcgi?cmd=Retrieve&db=PubMed&dopt=Abstract&list_uids=9821049
http://www.ncbi.nlm.nih.gov/entrez/query.fcgi?cmd=Retrieve&db=PubMed&dopt=Abstract&list_uids=7628866
http://www.ncbi.nlm.nih.gov/entrez/query.fcgi?cmd=Retrieve&db=PubMed&dopt=Abstract&list_uids=7628866
http://www.ncbi.nlm.nih.gov/entrez/query.fcgi?cmd=Retrieve&db=PubMed&dopt=Abstract&list_uids=9079756
http://www.ncbi.nlm.nih.gov/entrez/query.fcgi?cmd=Retrieve&db=PubMed&dopt=Abstract&list_uids=9079756
http://www.ncbi.nlm.nih.gov/entrez/query.fcgi?cmd=Retrieve&db=PubMed&dopt=Abstract&list_uids=7738716
http://www.ncbi.nlm.nih.gov/entrez/query.fcgi?cmd=Retrieve&db=PubMed&dopt=Abstract&list_uids=7738716
http://www.ncbi.nlm.nih.gov/entrez/query.fcgi?cmd=Retrieve&db=PubMed&dopt=Abstract&list_uids=7738716
http://www.ncbi.nlm.nih.gov/entrez/query.fcgi?cmd=Retrieve&db=PubMed&dopt=Abstract&list_uids=9828815
Journal of Experimental & Clinical Cancer Research 2009, 28:27 http://www.jeccr.com/content/28/1/27
Publish with BioMed Central and every scientist can read your work free of charge
"BioMed Central will be the most significant development for disseminating the results of biomedical research in our lifetime."
Sir Paul Nurse, Cancer Research UK
Your research papers will be:
available free of charge to the entire biomedical community
peer reviewed and published immediately upon acceptance
cited in PubMed and archived on PubMed Central
yours — you keep the copyright
Submit your manuscript here:http://www.biomedcentral.com/info/publishing_adv.asp
BioMedcentral
36. Masliukova EA, Pozharisskii KM, Karelin MI, Startsev V, Ten VP:[Role of Ki-67, mutated gene-suppressor p53 and HER-2neuoncoprotein in the prognosis for the clinical course of blad-der cancer]. Vopr Onkol 2006, 52:643-648.
37. Nakopoulou L, Vourlakou C, Zervas A: The prevalence of bcl-2,p53 and Ki-67 immunoreactivity in transitional cell bladdercarcinomas and their clinicopathologic correlates. Hum Pathol1998, 29:146-154.
38. Pfister C, Moore L, Allard P, Larue H, Fradet Y: Predictive Value ofCell Cycle Markers p53, MDM2, p21, and Ki-67 in SuperficialBladder Tumor Recurrence. Clini Ca Res 1999, 5:4079-4084.
Page 14 of 14(page number not for citation purposes)
http://www.ncbi.nlm.nih.gov/entrez/query.fcgi?cmd=Retrieve&db=PubMed&dopt=Abstract&list_uids=9490274
http://www.ncbi.nlm.nih.gov/entrez/query.fcgi?cmd=Retrieve&db=PubMed&dopt=Abstract&list_uids=9490274