Towards markers assisted selection
17
Review Towards marker-assisted selection in pulses: a review Jitendra K UMAR , Arbind K. C HOUDHARY , Ramesh K. S OLANKI and Aditya P RATAP Division of Crop Improvement, Indian Institute of Pulses Research, Kanpur 208024, India, E-mail: [email protected] With 2 figures and 2 tables Received July 24, 2010/Accepted December 29, 2010 Communicated by R. Varshney Abstract Pulses are important sources of proteins in vegetarian diet. However, genetic improvement in production and productivity of pulse crops has been very slow owing to several constraints. The present view of researchers is that the effectiveness and efficiency of conventional breeding can be significantly improved by using molecular markers. Nowadays, molecular markers are routinely utilized worldwide in all major crops as a component of breeding. The pace of development of molecular markers and other genomic sources has been accelerated in chickpea, pigeon pea and some other pulses, and marker–trait associations have been established for a number of important agronomic traits. The efforts are underway to use high-throughput genotyping platforms besides developing more genomic resources in other pulses. So far, progress in the use of marker-assisted selection as a part of pulse breeding programmes has been very slow and limited to few pulse crops such as chickpea and common bean. In this article, we have reviewed the progress made, limitations encountered and future possibilities for the application of marker-assisted selection in the genetic improvement of pulse crops. Key words: legumes — molecular markers — mapping — molecular breeding Pulses are leguminous crops harvested almost exclusively for dry grains. The Food and Agriculture Organization (FAO) recognizes 10 primary and five minor pulses, which are cultivated worldwide over 105 countries. From the standpoint of production, dry beans (19.7 mt), field pea (10.4 mt), chickpea (9.7 mt), cowpea (5.7 mt), lentil (3.6 mt) and pigeon pea (3.5 mt) are the most important (FAO, 2010). During the last five decades, the global pulse production has witnessed only an average marginal annual production increase of 0.77% with a wide fluctuation from 40.78 to 55.85 million tons (FAO, 2010). India, which is the largest producer and consumer of pulses in the world, recorded a lower than average annual productivity growth rate of only 0.24% (AICRP on MUL- LaRP, 2009–2010). Slow pulse production growth (from 12.70 million tones in 1960–1961 to 14.6 million tones in 2008–2009) leading to higher price of pulses, rising population and change in food habits (i.e., use of alternative protein-rich food products such as fish, meet and eggs) have substantially reduced the per capita consumption of pulses, especially in predominantly vegetarian countries (Vepa 2003). It reduced consumption from 63.0 g/day in 1961 to 35.3 g in 2009, and it is expected to decline up to 27.3 g in 2010 (ASSOCHAM and Agri Watch; http://www.commodityonline.com/news/ Indias-Green-Revolution-that-bypassed-pulses-15163-3-1.html). In the future, this reduction trend is expected to continue because of the diversion of cultivated land to other uses, rising temperature, frequent drought, diversification of food options and mainly declining productivity. Despite the systematic and continuous breeding efforts through conventional methods, substantial genetic gain in pulses production and productivity could not be achieved. For example, in India alone, more than 550 improved varieties of pulses have been released but production increased only marginally from 12.70 million tones in 1960–1961 to 14.6 million tones in 2008–2009 and productivity increased from 539 kg/ha in 1960–1961 to 659 kg/ha in 2008–2009 (AICRP on MULLaRP, 2009–2010). The major yield constraint in pulses is high genotype · environment (G · E) interactions on the expression of important quantitative traits leading to slow gain in genetic improvement and yield stability of pulses (Kumar and Ali 2006), besides severe losses caused by susceptibility of pulses to biotic and abiotic stresses. These issues require an immediate attention, and overall, a paradigm shift is needed in the breeding strategies to strengthen our traditional crop improvement programmes. One way is to utilize genomics tools in conventional breeding programmes involving mole- cular marker technology in selection of desirable genotypes or growing of transgenic crops. The use of transgenic crops is especially required for those traits that are not easy to improve genetically through conventional approaches because of the lack of satisfactory sources of desirable gene(s) in crossable gene pools. However, the ongoing debate on bio-safety and ethical issues involving use of transgenic crops for commercial cultivation suggests that molecular marker–aided conventional methods of breeding may be the main short-term option for increasing productivity. For this purpose, available high- yielding diverse lines need to be used as base material for incorporating some useful attributes/genes from otherwise unadapted cultivars, lines or wild relatives. The present view of researchers is that the efficiency and effectiveness of conven- tional breeding can be significantly improved by using molec- ular markers. Nowadays, deployment of molecular markers is not a dream to a conventional plant breeder as it is routinely used worldwide in all major cereal crops as a component of breeding because of the availability of a large amount of basic genetic and genomic resources (Gupta et al. 2010). This success of marker-assisted breeding in a major cereal crop (i.e. wheat) has been discussed recently (Gupta et al. 2010). In the past few years, major emphasis has also been given to develop similar kind of genomic resources for improving Plant Breeding 130, 297—313 (2011) doi:10.1111/j.1439-0523.2011.01851.x Ó 2011 Blackwell Verlag GmbH wileyonlinelibrary.com
Transcript of Towards markers assisted selection
Review
Towards marker-assisted selection in pulses: a review
J itendra KUMAR, Arbind K. CHOUDHARY, Ramesh K. SOLANKI and Aditya PRATAP
Division of Crop Improvement, Indian Institute of Pulses Research, Kanpur 208024, India, E-mail: [email protected]
With 2 figures and 2 tables
Received July 24, 2010/Accepted December 29, 2010Communicated by R. Varshney
Abstract
Pulses are important sources of proteins in vegetarian diet. However,
genetic improvement in production and productivity of pulse crops has
been very slow owing to several constraints. The present view of
researchers is that the effectiveness and efficiency of conventional
breeding can be significantly improved by using molecular markers.
Nowadays, molecular markers are routinely utilized worldwide in all
major crops as a component of breeding. The pace of development of
molecular markers and other genomic sources has been accelerated in
chickpea, pigeon pea and some other pulses, and marker–trait
associations have been established for a number of important
agronomic traits. The efforts are underway to use high-throughput
genotyping platforms besides developing more genomic resources in
other pulses. So far, progress in the use of marker-assisted selection as
a part of pulse breeding programmes has been very slow and limited to
few pulse crops such as chickpea and common bean. In this article, we
have reviewed the progress made, limitations encountered and future
possibilities for the application of marker-assisted selection in the
genetic improvement of pulse crops.
Key words: legumes — molecular markers — mapping —molecular breeding
Pulses are leguminous crops harvested almost exclusively fordry grains. The Food and Agriculture Organization (FAO)recognizes 10 primary and five minor pulses, which are
cultivated worldwide over 105 countries. From the standpointof production, dry beans (19.7 mt), field pea (10.4 mt),chickpea (9.7 mt), cowpea (5.7 mt), lentil (3.6 mt) and pigeon
pea (3.5 mt) are the most important (FAO, 2010). During thelast five decades, the global pulse production has witnessedonly an average marginal annual production increase of 0.77%
with a wide fluctuation from 40.78 to 55.85 million tons (FAO,2010). India, which is the largest producer and consumer ofpulses in the world, recorded a lower than average annualproductivity growth rate of only 0.24% (AICRP on MUL-
LaRP, 2009–2010). Slow pulse production growth (from 12.70million tones in 1960–1961 to 14.6 million tones in 2008–2009)leading to higher price of pulses, rising population and change
in food habits (i.e., use of alternative protein-rich foodproducts such as fish, meet and eggs) have substantiallyreduced the per capita consumption of pulses, especially in
predominantly vegetarian countries (Vepa 2003). It reducedconsumption from 63.0 g/day in 1961 to 35.3 g in 2009, andit is expected to decline up to 27.3 g in 2010 (ASSOCHAM
and Agri Watch; http://www.commodityonline.com/news/Indias-Green-Revolution-that-bypassed-pulses-15163-3-1.html).
In the future, this reduction trend is expected to continuebecause of the diversion of cultivated land to other uses, rising
temperature, frequent drought, diversification of food optionsand mainly declining productivity.Despite the systematic and continuous breeding efforts
through conventional methods, substantial genetic gain inpulses production and productivity could not be achieved. Forexample, in India alone, more than 550 improved varieties ofpulses have been released but production increased only
marginally from 12.70 million tones in 1960–1961 to 14.6million tones in 2008–2009 and productivity increased from539 kg/ha in 1960–1961 to 659 kg/ha in 2008–2009 (AICRP on
MULLaRP, 2009–2010). The major yield constraint in pulsesis high genotype · environment (G · E) interactions on theexpression of important quantitative traits leading to slow gain
in genetic improvement and yield stability of pulses (Kumarand Ali 2006), besides severe losses caused by susceptibility ofpulses to biotic and abiotic stresses. These issues require an
immediate attention, and overall, a paradigm shift is needed inthe breeding strategies to strengthen our traditional cropimprovement programmes. One way is to utilize genomicstools in conventional breeding programmes involving mole-
cular marker technology in selection of desirable genotypes orgrowing of transgenic crops. The use of transgenic crops isespecially required for those traits that are not easy to improve
genetically through conventional approaches because of thelack of satisfactory sources of desirable gene(s) in crossablegene pools. However, the ongoing debate on bio-safety and
ethical issues involving use of transgenic crops for commercialcultivation suggests that molecular marker–aided conventionalmethods of breeding may be the main short-term option for
increasing productivity. For this purpose, available high-yielding diverse lines need to be used as base material forincorporating some useful attributes/genes from otherwiseunadapted cultivars, lines or wild relatives. The present view of
researchers is that the efficiency and effectiveness of conven-tional breeding can be significantly improved by using molec-ular markers. Nowadays, deployment of molecular markers is
not a dream to a conventional plant breeder as it is routinelyused worldwide in all major cereal crops as a component ofbreeding because of the availability of a large amount of basic
genetic and genomic resources (Gupta et al. 2010). Thissuccess of marker-assisted breeding in a major cereal crop(i.e. wheat) has been discussed recently (Gupta et al. 2010). Inthe past few years, major emphasis has also been given to
develop similar kind of genomic resources for improving
Plant Breeding 130, 297—313 (2011) doi:10.1111/j.1439-0523.2011.01851.x� 2011 Blackwell Verlag GmbH
wileyonlinelibrary.com
productivity of pulse crops (Varshney et al. 2009, 2010a, Satoet al. 2010). Use of molecular marker technology can give realoutput in terms of high-yielding genotypes in pulses becausehigh phenotypic instability for important traits makes them
difficult for improvement through conventional breedingmethods. The progress made in using marker-assisted selection(MAS) in pulses has been highlighted in a few recent reviews
emphasizing on mapping genes controlling agronomicallyimportant traits and molecular breeding of pulses in general(Liu et al. 2007, Varshney et al. 2010b) and faba bean in
particular (Torres et al. 2010). In the present review, we havediscussed why molecular marker technology, in spite ofestablished marker–trait association, has not hitherto been apart of conventional pulse breeding programmes to bring real
changes in the genetic improvement in pulse crops in compar-ison with cereals. We have also discussed future possibilities todeploy molecular markers successfully as a component of
conventional breeding programmes.
Major Constraints in Genetic Improvement
During the past decades, concerted efforts were made toimprove the genetic potential of genotypes for increasing the
yield of pulses through conventional breeding approaches. Butthe pace of genetic gain has been very low translating in slowgrowth in production and productivity (Ali et al. 2003, Ali and
Kumar 2005, Kumar and Ali 2006). The major challengesmodern plant breeders face are discussed below briefly.
Genotype and environment interactions
The quantitative traits of economical importance in pulsesdisplay phenotypic instability resulting in variation in yield
potential owing to the influence of environments (70–80%)and genotype · environment (G · E) interactions (17–27%)(Kumar and Ali 2006). The contribution of the genotypic
effects is only 1.5–7% (Imrie and Shanmugasundaram 1987,Malhotra and Singh 1991, Singh and Kumar 1994, Kumaret al. 1996). Therefore, the role of the environment is of major
concern because of the slowdown in the progress in geneticimprovement and yield stability in pulses (Kumar and Ali2006).
Multiple stresses
Pulses encounter multiple stresses including wilt, ascochyta
blight (lentil, chickpea), rust (pea and lentil), powdery mildew(pea), terminal drought, heat and salinity (chickpea, lentil,pigeon pea), and water-logging (pigeon pea) during their life
cycle. To ensure stable productivity, it is necessary to developvarieties resistant to more than one stress. However, geneticimprovement for a single biotic stress using single gene–basedresistance does not result in permanent gains in productivity
because of emergence of increasingly more virulent races/biotypes in nature (Ali et al. 2003). The introgression ofseveral genes to develop superior genotypes is expected to
perform better against incidence of multiple stresses and/ordiseases. Sometimes, negative linkage between the genescontrolling resistance to different stresses and agronomic and
quality parameters makes it problematic to combine them inthe background of high-yielding genotypes using conventionalmethods of breeding (Chaturvedi et al. 1998). Pyramiding
multiple genes is challenging and time-consuming; modern
biotechnological tools facilitate and guide the introgression ofmultiple resistant genes and also assist in minimizing linkagedrag (Shi et al. 2009, Li et al. 2010).
Dissection of abiotic stresses into its components
Several abiotic stresses such as terminal drought, water-
logging, extreme temperatures, salinity, alkalinity and acidityare encountered during the crop growth period. For improvingbreeding efficiency, there is need to identify the specific
physiological, biochemical and molecular characteristics thatmay improve yields under such stresses. So far, these stresseshave not been properly dissected into its different componentsat physiological, chemical and molecular genetics levels, and
only limited information is available in pulse crops (Stoddardet al. 2006), placing constraints in designing an appropriatebreeding methodology to facilitate the genetic improvements.
Therefore, detailed understanding of the mechanisms under-lying these traits is needed, which could lead to novel andsuperior mitigating strategies.
Limited screening methods for precise phenotyping of target
traits
Several traits of economic importance such as root length andbiomass, wilt resistance and so on are difficult to screenbecause of imprecise measurements or visual observations
owing to lack of a simple, easy, precise, repeatable and large-scale screening technique (Singh et al. 1997, Infantino et al.2006, Agbicodo et al. 2009). Thus, the lack of precise
phenotyping makes us incompetent to select for desirablegenotype having genetic potential for yield and quality traits.However, phenotypic screening for adaption to drought is now
available in chickpea and pigeon pea (Upadhyaya et al. 2010).This has led to the use of genomic and physiologicalapproaches for root trait breeding to improve drought
tolerance in chickpea (Varshney et al. 2010c).
Limited genetic diversity in the primary gene pool
For pulse crops, a large collection of genetic resources (bothcultivated and wild relatives) are conserved globally in genebanks. For utilization of these genetic resources, studies have
been conducted to perform analysis of genetic variabilityamong a large collection of germplasm accessions on the basisof phenotypic characters. For example, in chickpea and pigeon
pea, a range of variability for different qualitative andquantitative traits have been documented, but the blueprintof diversity varies in different regions (Upadhyaya et al. 2001).In lentil, 8550 accessions have been evaluated for 20 key traits
at ICRADA, and a �Lentil Germplasm Catalog� of 4000accessions was published to enhance their potential forutilization in lentil breeding programme (Erskine and
Witcombe 1984, Furman et al. 2009). Morphological charac-terizations of accessions belonging to cultivated species revealonly ample genetic variability for a trait rather than genetic
diversity, which is estimated by taking all economically keytraits together. For example, using 12 key descriptors tocharacterize 1770 lentil accessions of Indian origin confirmed
genetic variability ranging from 20% to 30% (Solanki et al.2010). Notwithstanding these, in pulses, only few genotypeswith high degree of relatedness have been repeatedly utilized asparents in crossing programmes for the development of new
298 J . Kum ar , A . K . Choud hary , R . K . Solank i et al.
cultivars, leading to narrowing down the genetic base ofcultivated germplasm of pulses (Kumar et al. 2004). Forexample, 41% (35) and 34% (16) of the released cultivars inchickpea and in pigeon pea, respectively, were developed in
India involving one or two genotypes as one of the ancestors intheir pedigree (Kumar et al. 2004). Moreover, pedigree anal-ysis of released varieties revealed that only the top three to ten
ancestors contributed 30–79% to the genetic base in lentil,urdbean, mungbean and field pea (Dixit and Katiyar 2004,2006, Katiyar et al. 2007, 2008). Thus, it is general perception
among the scientists that current genetic improvement meth-ods lead to narrowing down the cultivated gene pool becauseof limited use of diversity. Contrary to this, the trend of geneticdiversity estimated recently using molecular markers in differ-
ent crops including pea as the representative of pulse cropsdemonstrates that no gain or reduction in genetic diversity hasoccurred since the last five decades (van de Wouw et al. 2010).
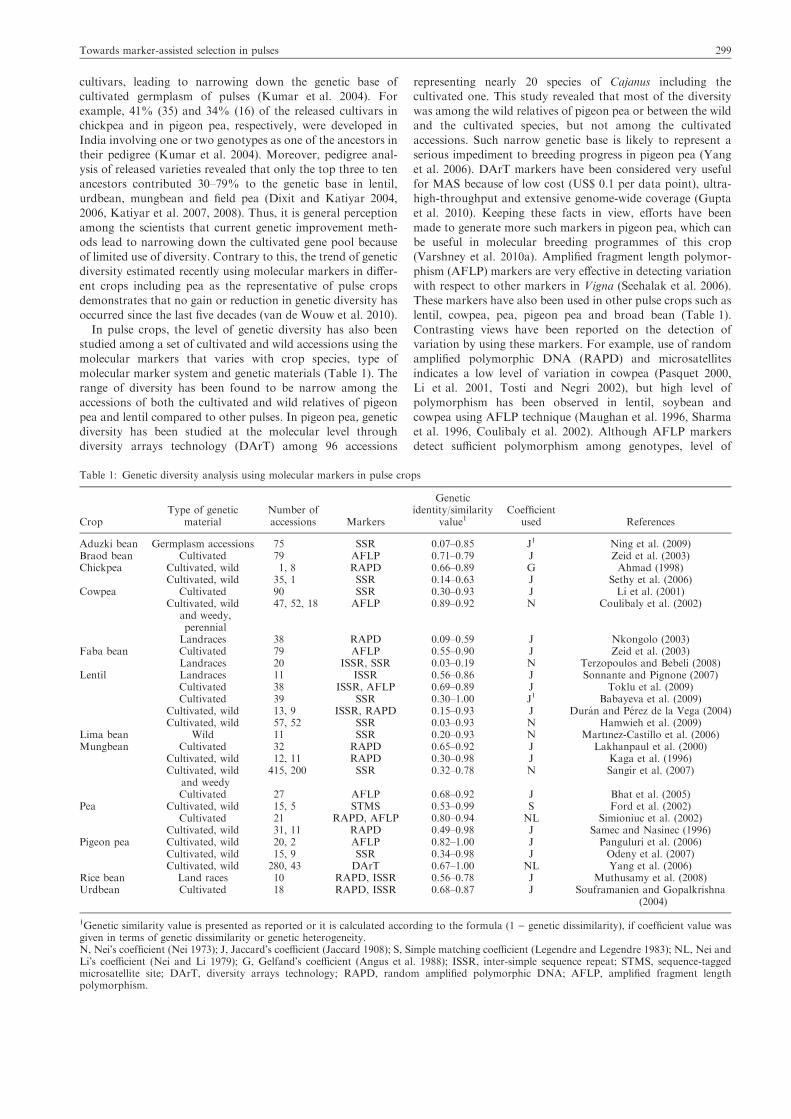
In pulse crops, the level of genetic diversity has also beenstudied among a set of cultivated and wild accessions using themolecular markers that varies with crop species, type of
molecular marker system and genetic materials (Table 1). Therange of diversity has been found to be narrow among theaccessions of both the cultivated and wild relatives of pigeon
pea and lentil compared to other pulses. In pigeon pea, geneticdiversity has been studied at the molecular level throughdiversity arrays technology (DArT) among 96 accessions
representing nearly 20 species of Cajanus including thecultivated one. This study revealed that most of the diversitywas among the wild relatives of pigeon pea or between the wildand the cultivated species, but not among the cultivated
accessions. Such narrow genetic base is likely to represent aserious impediment to breeding progress in pigeon pea (Yanget al. 2006). DArT markers have been considered very useful
for MAS because of low cost (US$ 0.1 per data point), ultra-high-throughput and extensive genome-wide coverage (Guptaet al. 2010). Keeping these facts in view, efforts have been
made to generate more such markers in pigeon pea, which canbe useful in molecular breeding programmes of this crop(Varshney et al. 2010a). Amplified fragment length polymor-phism (AFLP) markers are very effective in detecting variation
with respect to other markers in Vigna (Seehalak et al. 2006).These markers have also been used in other pulse crops such aslentil, cowpea, pea, pigeon pea and broad bean (Table 1).
Contrasting views have been reported on the detection ofvariation by using these markers. For example, use of randomamplified polymorphic DNA (RAPD) and microsatellites
indicates a low level of variation in cowpea (Pasquet 2000,Li et al. 2001, Tosti and Negri 2002), but high level ofpolymorphism has been observed in lentil, soybean and
cowpea using AFLP technique (Maughan et al. 1996, Sharmaet al. 1996, Coulibaly et al. 2002). Although AFLP markersdetect sufficient polymorphism among genotypes, level of
Table 1: Genetic diversity analysis using molecular markers in pulse crops
CropType of genetic
materialNumber ofaccessions Markers
Geneticidentity/similarity
value1Coefficient
used References
Aduzki bean Germplasm accessions 75 SSR 0.07–0.85 J1 Ning et al. (2009)Braod bean Cultivated 79 AFLP 0.71–0.79 J Zeid et al. (2003)Chickpea Cultivated, wild 1, 8 RAPD 0.66–0.89 G Ahmad (1998)
Cultivated, wild 35, 1 SSR 0.14–0.63 J Sethy et al. (2006)Cowpea Cultivated 90 SSR 0.30–0.93 J Li et al. (2001)
Cultivated, wildand weedy,perennial
47, 52, 18 AFLP 0.89–0.92 N Coulibaly et al. (2002)
Landraces 38 RAPD 0.09–0.59 J Nkongolo (2003)Faba bean Cultivated 79 AFLP 0.55–0.90 J Zeid et al. (2003)
Landraces 20 ISSR, SSR 0.03–0.19 N Terzopoulos and Bebeli (2008)Lentil Landraces 11 ISSR 0.56–0.86 J Sonnante and Pignone (2007)
Cultivated 38 ISSR, AFLP 0.69–0.89 J Toklu et al. (2009)Cultivated 39 SSR 0.30–1.00 J1 Babayeva et al. (2009)
Cultivated, wild 13, 9 ISSR, RAPD 0.15–0.93 J Duran and Perez de la Vega (2004)Cultivated, wild 57, 52 SSR 0.03–0.93 N Hamwieh et al. (2009)
Lima bean Wild 11 SSR 0.20–0.93 N Martınez-Castillo et al. (2006)Mungbean Cultivated 32 RAPD 0.65–0.92 J Lakhanpaul et al. (2000)
Cultivated, wild 12, 11 RAPD 0.30–0.98 J Kaga et al. (1996)Cultivated, wild
and weedy415, 200 SSR 0.32–0.78 N Sangir et al. (2007)
Cultivated 27 AFLP 0.68–0.92 J Bhat et al. (2005)Pea Cultivated, wild 15, 5 STMS 0.53–0.99 S Ford et al. (2002)
Cultivated 21 RAPD, AFLP 0.80–0.94 NL Simioniuc et al. (2002)Cultivated, wild 31, 11 RAPD 0.49–0.98 J Samec and Nasinec (1996)
Pigeon pea Cultivated, wild 20, 2 AFLP 0.82–1.00 J Panguluri et al. (2006)Cultivated, wild 15, 9 SSR 0.34–0.98 J Odeny et al. (2007)Cultivated, wild 280, 43 DArT 0.67–1.00 NL Yang et al. (2006)
Rice bean Land races 10 RAPD, ISSR 0.56–0.78 J Muthusamy et al. (2008)Urdbean Cultivated 18 RAPD, ISSR 0.68–0.87 J Souframanien and Gopalkrishna
(2004)
1Genetic similarity value is presented as reported or it is calculated according to the formula (1 ) genetic dissimilarity), if coefficient value wasgiven in terms of genetic dissimilarity or genetic heterogeneity.N, Nei�s coefficient (Nei 1973); J, Jaccard�s coefficient (Jaccard 1908); S, Simple matching coefficient (Legendre and Legendre 1983); NL, Nei andLi�s coefficient (Nei and Li 1979); G, Gelfand�s coefficient (Angus et al. 1988); ISSR, inter-simple sequence repeat; STMS, sequence-taggedmicrosatellite site; DArT, diversity arrays technology; RAPD, random amplified polymorphic DNA; AFLP, amplified fragment lengthpolymorphism.
Towards marker-assisted selection in pulses 299
genetic diversity reported was still narrow in several pulsecrops (see Table 1). Like other crops, simple sequence repeat(SSR) markers have shown higher range of diversity thanobserved earlier in pulses (Table 1) and therefore their
development and use in each pulse crop will certainly boostthe efficiency of breeding programmes. However, difference inthe detection of DNA polymorphism by different marker
systems may be attributed to different mechanisms involved ingenerating the various molecular markers and low level ofdiversity may be attributed to the extensive use of dominant
markers (Powell et al. 1996). Therefore, more than one type ofmarker systems for diversity analysis must be encouraged asthese could estimate higher range of molecular diversityobserved earlier in several reports (Millan et al. 2010). In fact,
most of the studies (Table 1) have focused to characterizelimited accessions using molecular markers, although vastgermplasm collections are available to plant breeders in
various pulses (Duc et al. 2010, Glaszmann et al. 2010). Forassessing genetic diversity contained in the large germplasmcollections, molecular markers have clarified the structure of
genetic diversity in a broad range of crops and helped todevelop the accessible core reference sets. According toGlaszmann et al. (2010), a crop core reference set is a set of
genetic stocks that are representative of the genetic resourcesof the crop and are used by the scientific community asreference for an integrated characterization of its biologicaldiversity. Therefore, efforts have been made to develop
reference sets in pulses like chickpea (Upadhyaya et al. 2008)and similar efforts are underway in lentil and faba bean underGeneration Challenge Program (GCP). In pea, a Chinese core
collection has also been made using SSR markers after analysisof global diversity (Zong et al. 2009).The pod-boring insect (Helicoverpa armigera) is perhaps the
most persistent and solemn constraint to chickpea and pigeonpea productivity. In these crops, screening of more than 5000germplasm accessions revealed that there is no resistant source
against this insect pest in germplasm (Kumar et al. 2004).Although few resistance sources have been reported in the pastin cultivated gene pool, they show either inconsistency or lowlevels of resistance leading to their limited exploitation in
breeding programmes so far (Lateef 1992). Therefore, there isneed to identify stable genetic resistance sources in thecrossable gene pool for pod borers to facilitate conventional
genetic improvement programmes. Use of unexplored genes inexisting gene pools and use of the wild relatives as a richreservoir of resistance genes against abiotic and biotic stresses
merit special attention to broaden the genetic base of breedingpool (Clement et al. 2009).
Development and Use of Breeder-Friendly Markers
The success of deployment of the marker technology to deal
with the above-mentioned constraints depends on the avail-ability of suitable marker systems in pulses. During the lastthree decades, DNA-based marker systems such as restrictionfragment length polymorphisms (RFLPs), RAPD, SSRs or
microsatellites, AFLPs, single-nucleotide polymorphism(SNP), and DArT have become available. Among these markersystems, RAPD, RFLP and AFLP are commonly employed for
marker–trait association and diversity analysis in pulses, buttheir use for MAS is not preferred by conventional plantbreeders because of the poor reproducibility, difficulty in
handling, requirement of highly skilled person and use of
radioactive elements for generating these markers (Gupta et al.2010). Only PCR (polymerase chain reaction)-based SSR andSNP markers have been preferred by breeders because thesemarkers can easily be employed in genotyping of large
segregating populations in a cost-effective manner and withminimum infrastructure facilities. Also, high reproducibilityand user-friendliness make them preferential to traditional
plant breeders for MAS (Gupta et al. 2010). In many othercrops, these have been extensively utilized (Kumar et al. 2010),but their use is still limited in pulses like chickpea and pigeon
pea (Varshney et al. 2009, Saxena et al. 2010). Therefore, inrecent years, attention has been paid to develop more markersin pulses considered as orphan legumes (Hamwieh et al. 2009,Varshney et al. 2009). To reduce the cost of development of
these markers, close phylogenetic similarity has encouragedresearchers to transfer SSR markers from one pulse crop to theother (Datta et al. 2010, Reddy et al. 2010). However, the fast-
growing advances in genomic technology, especially in the next-generation DNA sequencing and high-throughput genotyping,have made available a large amount of SSR and SNP types of
markers in a cost-effective manner and in a short period of timein chickpea and pigeon pea (Varshney et al. 2009), mungbean(Tangphatsornruang et al. 2009) and cowpea (Muchero et al.
2009). This strongly suggests the rapid development of a hugeamount of polymorphic markers in several pulses in the nearfuture. However, it is not possible for plant breeders to use thesemarkers routinely in conventional plant breeding programmes
without the support of skilled personnel and good laboratoryfacilities.Over the last few years, functionally characterized genes,
ESTs and coding genome sequences have been made availableto build up molecular markers like SNP, SSR or COS(conserved orthologous set) (Varshney et al. 2005). These
markers are often called perfect or functional markers and aredeveloped from putative coding sequences having knownfunction and consequently have complete association with the
quantitative trait loci (QTL) or gene. Nowadays, functionalgenomic resources (ESTs and other gene sequences) areavailable in related model legumes as well as pulse crops likechickpea, pigeon pea, cowpea, common bean and soybean
(Choi et al. 2004, Young and Udvardi 2009, Kumar et al.2009a), which certainly will boost up development of perfectmarkers in pulses. For example, use of the sequences of
resistance gene analogues (RGAs) or resistance gene candidates(RGACs) has been transformed into molecular markersincluding RGA polymorphism (Mutlu et al. 2006), NBS
profiling (van der Linden et al. 2004), CAPS (Gutierrez et al.2006, Muchero et al. 2010a) and derived CAPS (dCAPS)(Palomino et al. 2009, Torres et al. 2010). The RGAs belongingto NBS gene families were recently isolated and characterized in
faba bean and chickpea (Palomino et al. 2006). The dCAPs andCAPs have been developed from 10 RGA classes and used toexplore the presence of SNPs to map them in the available
mapping populations of faba bean, pea and chickpeas (Palo-mino et al. 2009, Torres et al. 2010). Two genes (PvP5CS andP5CS) controlling D1-pyrroline-5-carboxylate synthase in com-
mon bean and several genes controlling flowering time in modellegume species were identified and cloned (Hecht et al. 2005,Chen et al. 2009, 2010). Several other structural genes involved
in phytic acid biosynthesis have also been characterized incommon bean (Fileppi et al. 2009). Nucleotide sequences ofthese genes are useful to provide opportunity to develop gene-based functional markers and finding out their association with
300 J . Kum ar , A . K . Choud hary , R . K . Solank i et al.
agronomically important traits through genetic mapping, asthese markers have been developed and mapped in commonbean (Hanai et al. 2010), cowpea (Muchero et al. 2009, 2010a)and chickpea (Nayak et al. 2010, Spurthi et al. 2010).
Marker–Trait Association
To use MAS in conventional breeding programmes, markerstightly linked to gene(s) controlling target trait must beidentified first. Therefore, efforts have been made to find out
the genetic distance between molecular markers and the genescontrolling qualitative and quantitative traits of interestthrough different approaches.
Simple vs. complex traits
Inheritance studies conducted in major pulses suggest thatgenetic variation for a trait of importance could be eitherqualitative or quantitative in nature. The traits like seedcotyledon colour, some disease resistance, seed coat colour,
flower colour and double poddedness have been reported tohave simple inheritance (Gill and Cubero 1993, Sandhu et al.1993, Ghatge 1994, Mathur 1998, Kumar et al. 2003, Singh
and Raina 2005, Sharma 2009, Barilli et al. 2009, Halila et al.2010). However, many traits contributing to yield, yieldcomponents (seed number, seed weight), quality and resistance
to biotic and abiotic stresses are quantitative in nature. In thepast years, classical biometrical techniques were used to studythe inheritance of such traits. But through biometricalapproaches, individual genes could not be identified and the
contribution of each individual gene to the trait could not beworked out. Sax (1923) for the first time tagged individual locuscontributing to a quantitative trait (seeds size) with the help of
monogenic trait (seed coat colour) in bean. But QTL analysisusing polygenic traits could not become popular because oflimited availability of morphological markers. After the advent
of DNA-based molecular markers (which are inherited as themajor genes), it became possible to use them routinely to detectand locate the positions of QTL controlling variation for
quantitative traits. The genetic dissection of complex polyge-netic traits through QTL analysis leads to the identification ofmolecular markers linked with genomic regions having major(main effect QTL or M-QTL) or interactive (epistatic effect
QTL or E-QTL) or interactive with environments (QE-QTL)on the expression of a trait of interest. In the case of pulseswhere G · E interactions for a quantitative trait are promi-
nent, QTLs can be categorized into constitutive and adaptiveQTLs. Constitutive QTLs show the stability of their effectsacross environmental conditions, whereas adaptive QTLs are
expressed in specific environmental conditions (Collins et al.2008). Thus, QTLs that control heritable variability of thetraits and have positive direct impact on target traits can bemanipulated precisely and can be pyramided towards the
development of improved plant types through MAS. Further-more, this may also result in greatest potential genetic gainseven for the traits having low heritability.
Genetic mapping of traits
Genetic linkage mapping, QTL mapping and associationmapping, and comparative genomics are commonly usedapproaches for genetic mapping in crop plants. In pulses,
several genes/QTL controlling the target traits (qualitative and
quantitative) have been mapped/tagged using molecular mark-ers (Table 2). Different mapping approaches used for marker–trait analysis in pulses are discussed in following text.
Genetic linkage mapping
For this purpose, a biparental mapping population developed
from parents having contrasting traits is required, which maybe an F2, BC (backcross) and DH (doubled haploid) popula-tion. A mapping population consisting of 50–200 individuals isgenotyped with a number of markers polymorphic between
parents (Kumar et al. 2009b). If the target trait is measured asdiscrete trait, marker–trait association can be established onthe basis of expected and observed recombination frequency
using chi-square test, and genetic distance between marker andtrait can be measured with or without preparing the geneticlinkage maps. However, for QTL mapping, construction of
molecular maps is essential. This kind of mapping can beperformed for all kind of traits (i.e., qualitative and quanti-tative traits), which are measured quantitatively. For this
purpose, genotypic data of a mapping population are used toprepare a molecular map using statistical software (e.g. MAP-
MAKER). Then, genotypic data and the phenotypic datarecorded on target traits over the environments are used to
establish marker–trait association using computer software(e.g. QTL CATOGRAPHER, JOINMAP) (see Kumar et al.2009b for details). Both framework and dense molecular maps
comprising more than one type of molecular markers havebeen constructed in the past years in chickpea (Winter et al.2000), cowpea (Kelly et al. 2003), lentil (Hamwieh et al. 2005)
and other pulse crops listed in a recent review (Varshney et al.2010b). However, more recently, such molecular maps havebeen developed in chickpea (Nayak et al. 2010) and commonbean (Hanai et al. 2010). Moreover, a consensus genetic map
consisting of 555 loci involving different markers has also beendeveloped in chickpea from 10 mapping populations (Millanet al. 2010). A genetic map was developed covering 1283.3 cM
and including 146 markers (144 RAPDs and two sequence-tagged sites (STS), and markers distributed in nine linkagegroups have been used to map QTL controlling partial
resistance to rust (Barilli et al. 2010). During the past years,considerable work has been carried out on molecular geneticmapping of oligogenic traits (Varshney et al. 2010b). However,
limited efforts have been made on genetic dissection ofquantitative traits (Table 2). These traits often encounter highlevel of G · E interaction leading to confounding performanceof the genotypes, thereby reducing the progress through
empirical selection (Kumar and Ali 2006). QTL analysisfacilitates to understand networks of genes controlling thephenotypic expression of traits and estimates the magnitude of
each individual QTL for a trait in specific environmentalcondition. Thus, major individual QTL accounting for arelatively larger phenotypic variation (R2 > 20%) in a partic-
ular environment (environment-responsive QTL) can be dis-sected from other poorly or negatively contributing genes/QTL(West et al. 2007, Ikeda et al. 2009). Therefore, QTL analysis
using phenotypic data across the environment helps us identify(i) the inconsistent QTL owing to their weak expression acrossthe environments and (ii) QTL interacting significantly withenvironment in the opposite direction to the QTL with main
effects (Liu et al. 2007). Thus, effects of each individual QTLcan be taken into account during their application in MAS forquantitative traits (Li et al. 2003).
Towards marker-assisted selection in pulses 301
Table 2: Molecular markers linked to desirable genes/QTL for marker-assisted selection in legumes
Crop Trait(s) QTL/genes Type of markersGenetic
distance (cM)1 References
Common bean Resistance to common bacterialblight
QTL RAPD, SCAR,STS, SSR,RFLP
4.0 Taran et al. (2001)
QTL RAPD 13.0 Jung et al. (1997)Resistance to bean commonmosaic virus
I SCAR 1.0–5.0 Melotto et al. (1996)
Resistance to anthracnose Are SCAR 12.0 Adam-Blondon et al. (1994)Resistance to white mould QTL RAPD, AFLP 14.0 Kolkman and Kelly (2003)Resistance to Fusarium wilt PvPR1, PvPR2 RAPD 28.4 Schneider et al. (2001)
Cowpea Resistance to Striga gesneriodes Rsg1 SCAR 4.8 Bouker et al. (2004)Resistance to Thrips tabaci andFrankliniella schultzei
QTL AFLP 22.8, 6.91 Muchero et al. (2010b)
Chickpea Resistance to Ascochyta blight QTLs RAPD 2.3 Millan et al. (2003),Cobos et al. (2005)
Ar19 RAPD 13.7 Rakshit et al. (2003)QTL SSR – Udupa and Baum (2003)QTLAR3 SSR 24.0 Iruela et al. (2007, 2009)QTL SSR – Anbessa et al. (2009)
Resistance to Fusarium wilt QTLFoc02,
QTLFoc5
SSR 10.7 Cobos et al. (2009)
foc1 SSR 6.0 Gowda et al. (2009)foc2 SSR 2.9 Gowda et al. (2009)foc3 SSR 0.9 Gowda et al. (2009)
Seed/pod Spp SSR 1.9 Radhika et al. (2007)Double podding Sfl SSR 3.1 Radhika et al. (2007)Plant growth habit prostrate SSR 14.5 Aryamanesh et al. (2010)
Hg/hg RAPD 10.0 Cobos et al. (2009)Resistance to Ascochyta blight QTL SSR 8.1 Aryamanesh et al. (2010)Days to flowering QTLDF3 SSR 4.0 Cobos et al. (2009)
2 QTL SSR 10.1
17.9
Aryamanesh et al. (2010)
Seed coat thickness QTLTt SSR 10.0 Cobos et al. (2009)Seed size QTLSW1 SSR 10.3 Cobos et al. (2009)
Pea Resistance to powdery mildew er RFLP 11.0 Dirlewanger et al. (1994)Resistance to pea seed bornemosaic virus
Sbm-1 STS 4.0 Frew et al. (2002)
Resistance to Fusarium wilt Fw RFLP 6.0 Dirlewanger et al. (1994)Resistance to pea common mosaicvirus
mo RFLP 15.0 Dirlewanger et al. (1994)
Sbm-1 cDNA-AFLP 0.7 Gao et al. (2004)Resistance to rust Up1 RAPD 13.4 Barilli et al. (2010).
Mungbean Resistance to powdery mildew QTLs RFLP 1.3 Humphry et al. (2003)RAPD, CAP,AFLP
Chen et al. (2007)
Blackgram Resistance to yellow mosaic virus Monogenic STS-RGA 0.0 Basak et al. (2004)Faba bean Resistance to broomrape Oc1, Oc2, Oc3 RAPD 19.3 Roman et al. (2002)
Resistance to rust Uvf-1 RAPD 0.0 cM Avila et al. (2003)Lentil Resistance to Ascochyta blight Ra/2 RAPD, SCAR 14.0
16.0Chowdhery et al. (2001)
Resistance to anthracnose LCt-2 AFLP, RAPD 4.1 Tullu et al. (2003)Resistance to Fusarium wilt fw RAPD 10.8 Eujayl et al. (1998)
AFLP 3.5 Hamwieh et al. (2005)SSR 8.0 Hamwieh et al. (2005)
Cold winter hardiness Frt RAPD 9.1 Eujayl et al. (1999)RAPD, SSR,AFLP
0.3–21.0 Kahraman et al. (2004)
Earliness and plant height QTLs RAPD, SSR,AFLP
17.0 Tullu et al. (2008)
Plant structure, growth habit andyield
QTLs RAPDs, ISSRs,AFLPs, SSRs
6.0–48.0 Fratini et al. (2007)
Blue Lupin Resistance to Diaporthe toxica Phr1 SCAR – Yang et al. (2002)Resistance to Colletotrichumgloeosporiodes
Lanr1 SCAR – Yang et al. (2004)
Lathyrus Resistance to Ascochyta blight QTL RAPD, STMS 18.3 Skiba et al. (2004)Pigeon pea Resistance to Fusarium wilt Gene RAPD – Kotresh et al. (2006)
Plant type 2 Genes RAPD 8.49.60
Dhanasekar et al. (2010)
1Values given in bold font are genetic distance interval between two adjacent markers harbouring the QTL.RAPD, random amplified polymorphic DNA; RFLP, restriction fragment length polymorphism; SSR, simple sequence repeat; STS, sequence-tagged site; AFLP, amplified fragment length polymorphism; ISSR, inter-simple sequence repeat; STMS, sequence-tagged microsatellite site.
302 J . Kum ar , A . K . Choud hary , R . K . Solank i et al.
Association mapping
In the recent years, emphasis has been given to make use ofassociation mapping based on linkage disequilibrium (LD)mapping for determining tight linkage between the molecular
marker and QTL controlling target traits (within 1–2 cMintervals or within the gene itself; Bachlava et al. 2009). This isbecause of the use of a natural population comprising the
individuals, which was developed after several rounds ofrecombination events occurring over the years. This leads to ahigh level of LD between the adjacent markers. If these
markers show the association with a target trait, it reflects tightmarker–trait association (Risch and Merikangas 1996, Nord-borg and Tavare 2002). In crop plants, candidate gene and
whole-genome scan or genome-wide association-mappingmethods are currently used. Originally, utility of candidategenes and genome scan methods were compared by Risch andMerikangas (1996). The detailed understanding of above
association-mapping approaches has been discussed recentlyin two reviews (Zhu et al. 2008, Rafalski 2010). For conduct-ing association mapping, several steps are needed (Fig. 1). (i) A
natural mapping population for association analysis must becomprised of diverse individuals that can be derived from wildrelatives, core collection of germplasm or subsets of breeding
germplasm and elite germplasm (Breseghello and Sorrells
2006). Use of release cultivars (elite germplasm) is likely toidentify superior alleles that have been captured by breedingpractices. Thus, marker(s) associated with these alleles can beutilized by MAS. Association mapping with diverse germ-
plasm or wild populations can identify new superior allelesthat were not captured by breeding practices and supportintrogression of these alleles into elite breeding germplasm.
However, whatever population is being utilized, the level ofgenetic diversity, extent of genome-wide LD, populationstructure and relatedness within the population must be taken
into consideration because these factors determine mappingresolution, marker density, statistical methods and mappingpower. (ii) It is obvious that larger germplasm collectionsprovide more power and precision. Therefore, for association
mapping, at least 100–500 individuals are needed. (iii) Thechoice of appropriate type of marker and their density isimportant for association mapping. Use of codominant SSRs
and SNPs is more informative (no allelic ambiguity) than otherdominant markers. Besides, DArT markers are also becomingpopular for analysing the whole-genome diversity, and hence,
their development has been focused in those pulse crops (i.e.pigeon pea) that have narrow genetic base (Varshney et al.2010a). In case of candidate gene association mapping, a
modest number of genetic markers ranging from 50 to 100 are
Fig. 1: The steps involved in association mapping of crop plants; solid black colour arrows indicate the steps involved in both association-mapping approaches, while grey and white colour arrows indicate the steps involved in genome-wide and candidate gene association mapping,respectively
Towards marker-assisted selection in pulses 303
sufficient for population structure analysis (Pritcharda et al.2000, Rafalski 2010).In genome-wide association analysis, density of markers has
to increase for scanning every region of genome and popula-
tion structure analysis has to be performed by selecting anumber of unlinked markers from each chromosome arms. (iv)After selecting the markers, population structure needs to be
estimated so that spurious (false positives) associations couldbe avoided. A set of unlinked markers covering the wholegenome are employed to broadly characterize the genetic
composition of individuals. The genotypic data obtained isused to estimate population structure (Q) and the relativekinship matrix (K) among the individuals (Lynch and Ritland1999, Pritcharda et al. 2000, Yu et al. 2006). Different methods
and softwares have been developed to correct the result ofpopulation structure, usually dividing the germplasm collec-tions into subgroups or adjusting the probability of the null
hypothesis (P value). Alternatively, use of a population havinggenetically diverse individuals is the best way to minimizepopulation structure. (v) For genome-wide association map-
ping, understanding of association between the marker locineeds to be taken into consideration before choosing theappropriate number of genetic markers for genome scan. It has
been shown that decay of LD is slower in inbred species andfaster in outbred species. (vi) The power of associationmapping depends upon the quality of the phenotypic dataand number of individuals. The field experimental design
should provide good control over the error variances causedby environments. The data recording should be accurate andprecise. (vii) Finally, information obtained on phenotypic
data, genotypic data of markers and population structure andkinship relatedness is used in software (e.g. TASSEL; Bradburyet al. 2007) to estimate the association between markers/
candidate genes and the target traits.In recent years, nested association mapping has been
reported. This approach, which has been used successfully in
maize, reduces the LD and avoids population structureanalysis. The nested population, which consists of diverseRILs of several high-resolution biparental progeny, is gener-ated and used in nested association mapping. Because these
biparental progeny have one parent in common, it leads tovery high resolution and power to detect associations includingepistatic interactions. As very high density genotypic data are
available on each biparental population, one can map imme-diately a new trait by taking the new phenotype measurements(Yu et al. 2008, McMullen et al. 2009).
In pulses, the use of association mapping is only restricted tobasic studies involving diversity and population structureanalysis (Huh and Huh 2001, Jin et al. 2008, Smykal et al.2008, Asfaw et al. 2009, Kwak and Gepts 2009, Vir et al. 2009,
Burle et al. 2010). However, the use of association mappinghas indeed a great scope in pulse crops owing to accessibility toa large collection of worldwide germplasm (Varshney et al.
2009). Under the generation challenge programme (GCP;http://www.generationcp.org), association mapping for impor-tant traits are being carried out in cassava and beans with the
goal of discovering more useful markers for a wider range ofgenotypes (Blair et al. 2007). Moreover, use of high-through-put next-generation sequencing and genotyping technologies
has markedly reduced the cost of development of molecularmarkers, leading to possibilities of genome-wide associationmapping for complex traits in the pulses (Hirschhorn and Daly2005, Syvanen 2005).
Comparative mapping
The well-known close phylogenetic relationships among dif-ferent pulse crops (Cannon et al. 2009) have the way fortransfer of molecular markers from one species to the other.
That is why molecular markers linked to a trait are employeddirectly in mapping the genes for the same trait in anotherrelated species. This approach is more fruitful to domesticated
traits because they are conserved over the evolutionary periodamong different species and are under the control of few geneshaving major phenotypic effects. At least 15 genes are known
to control such traits besides few major QTL (Weeden 2007).For instance, QTL analysis in common bean verified that threedifferent QTLs collectively explained 36% and 48% of the
variation for seed weight and length, respectively (Park et al.2000). The study carried out for seed size in cowpea [Vignaunguiculata (L.) Walp.] and mungbean [Vigna radiata (L.)Wilczek] revealed that a major gene discriminates wild
progenitor from cultivated descendant (Fatokun et al. 1992).The genes controlling different traits of domestication syn-drome are shown to be frequently clustered or linked within
the genome in several crops including pulses. As in commonbean, genes controlling growth habit and flowering time, seeddispersal and dormancy, and pod and seed size are clustered
together in only three genomic locations, respectively (Koin-ange et al. 1996). Therefore, clustering of genes may beapparent sometimes as a single gene with pleiotropic effects
(Johnson et al. 1996, Koinange et al. 1996, Xiong et al. 1999,Poncet et al. 2000), which is the sole explanation for clusteringof the domestication syndrome loci (Park et al. 2000). Traits ofdomestication syndrome are involved in adaptation and hence
favoured during selection, leading to their conservation over aperiod of time between the species. For example, comparativegenomics of a QTL for seed weight mapped in cowpea was
found apparently conserved in cowpea and mungbean on thesame locations (Fatokun et al. 1992). A comparative studyamong common bean, cowpea and mungbean suggested that a
seed weight QTL was associated with Phs locus. This locusencodes the most abundant seed storage protein (phaseolin) incommon bean, which has a putative orthologue in mungbean(Johnson et al. 1996). Interestingly, a similar candidate for
orthology was not identified in cowpea. Maughan et al. (1996)identified a different soybean seed weight locus with a potentialcounterpart in cowpea. Moreover, comparative genomics
using molecular markers linked with QTL for domesticatedtraits have facilitated to know whether two crops have same ordifferent pattern of genes/QTL. In case of pea, a different set of
genes were used to produce the same or similar phenotypicchanges when compared with common bean, which demon-strated that relatively few genes appear to have been modified
during the domestication of pea (Weeden 2007). However,similar gene pattern for trait(s) among different species canfacilitate the use of marker–trait association from one speciesto other related crop species in marker-assisted breeding or
cloning of the genes of agronomic importance.
MAS Targeting Individual Chromosome (via ReverseBreeding)
For a long time, it remained desirable in pulses to locate and
map the genes of individual chromosomes, but difficulties inthe development of trisomic, monosomic and nulli-tetrasomiclines did not make it possible so far. However, the concept of
reverse plant breeding developed recently can pave the way for
304 J . Kum ar , A . K . Choud hary , R . K . Solank i et al.
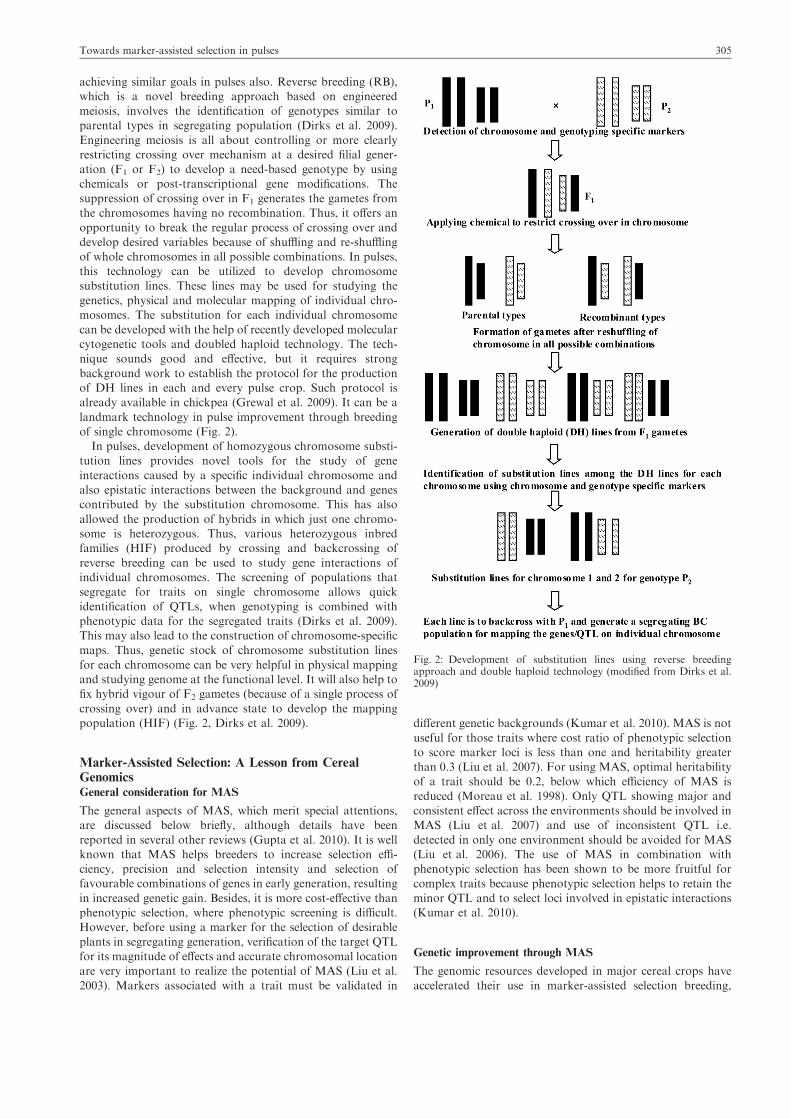
achieving similar goals in pulses also. Reverse breeding (RB),which is a novel breeding approach based on engineeredmeiosis, involves the identification of genotypes similar toparental types in segregating population (Dirks et al. 2009).
Engineering meiosis is all about controlling or more clearlyrestricting crossing over mechanism at a desired filial gener-ation (F1 or F2) to develop a need-based genotype by using
chemicals or post-transcriptional gene modifications. Thesuppression of crossing over in F1 generates the gametes fromthe chromosomes having no recombination. Thus, it offers an
opportunity to break the regular process of crossing over anddevelop desired variables because of shuffling and re-shufflingof whole chromosomes in all possible combinations. In pulses,this technology can be utilized to develop chromosome
substitution lines. These lines may be used for studying thegenetics, physical and molecular mapping of individual chro-mosomes. The substitution for each individual chromosome
can be developed with the help of recently developed molecularcytogenetic tools and doubled haploid technology. The tech-nique sounds good and effective, but it requires strong
background work to establish the protocol for the productionof DH lines in each and every pulse crop. Such protocol isalready available in chickpea (Grewal et al. 2009). It can be a
landmark technology in pulse improvement through breedingof single chromosome (Fig. 2).
In pulses, development of homozygous chromosome substi-tution lines provides novel tools for the study of gene
interactions caused by a specific individual chromosome andalso epistatic interactions between the background and genescontributed by the substitution chromosome. This has also
allowed the production of hybrids in which just one chromo-some is heterozygous. Thus, various heterozygous inbredfamilies (HIF) produced by crossing and backcrossing of
reverse breeding can be used to study gene interactions ofindividual chromosomes. The screening of populations thatsegregate for traits on single chromosome allows quick
identification of QTLs, when genotyping is combined withphenotypic data for the segregated traits (Dirks et al. 2009).This may also lead to the construction of chromosome-specificmaps. Thus, genetic stock of chromosome substitution lines
for each chromosome can be very helpful in physical mappingand studying genome at the functional level. It will also help tofix hybrid vigour of F2 gametes (because of a single process of
crossing over) and in advance state to develop the mappingpopulation (HIF) (Fig. 2, Dirks et al. 2009).
Marker-Assisted Selection: A Lesson from CerealGenomicsGeneral consideration for MAS
The general aspects of MAS, which merit special attentions,are discussed below briefly, although details have been
reported in several other reviews (Gupta et al. 2010). It is wellknown that MAS helps breeders to increase selection effi-ciency, precision and selection intensity and selection offavourable combinations of genes in early generation, resulting
in increased genetic gain. Besides, it is more cost-effective thanphenotypic selection, where phenotypic screening is difficult.However, before using a marker for the selection of desirable
plants in segregating generation, verification of the target QTLfor its magnitude of effects and accurate chromosomal locationare very important to realize the potential of MAS (Liu et al.
2003). Markers associated with a trait must be validated in
different genetic backgrounds (Kumar et al. 2010). MAS is not
useful for those traits where cost ratio of phenotypic selectionto score marker loci is less than one and heritability greaterthan 0.3 (Liu et al. 2007). For using MAS, optimal heritabilityof a trait should be 0.2, below which efficiency of MAS is
reduced (Moreau et al. 1998). Only QTL showing major andconsistent effect across the environments should be involved inMAS (Liu et al. 2007) and use of inconsistent QTL i.e.
detected in only one environment should be avoided for MAS(Liu et al. 2006). The use of MAS in combination withphenotypic selection has been shown to be more fruitful for
complex traits because phenotypic selection helps to retain theminor QTL and to select loci involved in epistatic interactions(Kumar et al. 2010).
Genetic improvement through MAS
The genomic resources developed in major cereal crops have
accelerated their use in marker-assisted selection breeding,
Fig. 2: Development of substitution lines using reverse breedingapproach and double haploid technology (modified from Dirks et al.2009)
Towards marker-assisted selection in pulses 305

leading to the availability of a number of improved cultivarsworldwide for farmers. For example, in wheat, more than 12cultivars developed through MAS have been released so far forcommercial cultivation (Gupta et al. 2010). The success of
MAS in cereals provides a lesson for orphan pulse crops.During the past few years, considerable genomic resourceshave been developed and utilized in marker–trait association
analysis in pulses (Sato et al. 2010). For example, to improvethe availability of pigeon pea genomic resources, the pigeonpea genomics initiative (PGI) programme was started in
November 2006 by the Indian Council of AgriculturalResearch (ICAR) and the Government of India, under theumbrella of Indo-US Agricultural Knowledge Initiative (AKI)programme. It resulted in the development of 25 different
mapping populations and molecular markers including SSR(>3000), SNP and DArT (>15 000 features) (Varshney et al.2010a). Similar progress in other pulses like chickpea, lentil,
common bean and faba bean has also been noted (Varshney2007, Torres et al. 2010, Chamarthi et al. 2011). This has led tothe use of MAS successfully in a few pulse crops. For example,
in common bean, introgression of major gene(s) using MAShas resulted in the development of several lines resistant to rust(Stavely 2000, Faleiro et al. 2001), anthracnose (Alzate-Marin
et al. 1999), BGYMV (Miklas 2002) and angular leaf spot (deOliveira et al. 2005). Also, two major QTLs controllingresistance to white mould in common bean (Ender et al.2007) and a major QTL associated with root rot resistant in
snap bean have been introgressed using MAS with realizedgain in the target traits (Navarro et al. 2009). The near-isogenic lines (NILs) of chickpea with resistance/susceptibility
to Fusarium oxysporum f. sp. ciceris (Foc) have also beendeveloped on the basis of selection made by closely linkedmarkers in RIL population (Castro et al. 2009). Moreover, in
common bean, two improved lines �USPT-ANT-1� (carryingCo-42 gene for resistance to all known North American racesof anthracnose) and �USDK-CBB-15� (carrying QTL for
bacterial blight resistance) have been registered in USA(Miklas et al. 2003, 2006). On the other hand, however,MAS could not be found very useful for some traits as nosignificant gain was observed for multiple branching in
common bean by introgression of a QTL through MAS(Fazio et al. 2003). For making MAS as a routine componentto conventional breeding, a one-stop shop having information,
analytical tools and related services for designing and effi-ciently conducting molecular-assisted breeding experimentshas been recently launched as the Molecular Breeding
Platform (MBP) at the Marriott Convention Center inHyderabad, India, on 17 February 2010. The aim of thisfacility is to increase breeding efficiency in developing coun-tries. MBP was jointly initiated by the GCP of the Consulta-
tive Group on International Agricultural Research (CGIAR),in collaboration with the Bill & Melinda Gates Foundationand the International Crops Research Institute for the
Semi-Arid Tropics (ICRISAT). The MBP will have threecomponents: the molecular breeding portal and helpdesk,information system and services component (http://www.icri-
sat.org/newsroom/news-releases/icrisat-pr-2010-media3.htm).
Marker-assisted gene pyramiding
Combining in a single genotype, the genes scattered in differentgenotypes (often called gene pyramiding), is not impossiblewhen individual gene controls different traits. However, it is
difficult through recombination breeding approach by select-ing desirable plants on the basis of phenotype. Breedersfrequently face complex choices in designing efficient crossesand selection strategies (Wang et al. 2007). This situation is
further complicated when different genes control the samephenotype, as selection of plants with multiple genes is difficultbased on phenotype alone due to epistasis (Mohler and
Singrun 2004) and inability of phenotypic screening techniquesto differentiate genes.The use of genetic resistance is the most effective and
economical way of controlling plant diseases. Therefore, genepyramiding is a pragmatic approach to achieve multiple anddurable resistance (Shi et al. 2009). However, identification ofa plant having multiple resistance genes for a disease like rust
becomes impossible because different resistance genes showsame disease reaction after screening under artificial conditionsagainst the target disease. Therefore, it is often cited that
genetic markers can be deployed as an alternative to identifyand select specific genes or combine multiple resistance genes(Brahm et al. 2000, Fjellstrom et al. 2004). The possible
breeding schemes that can be used for gene pyramidinginvolving MAS and required population size in each segregat-ing population have been discussed in several recent reviews
(Ishii and Yonezawa 2007a,b, Ye and Smith 2008a,b, 2009,Gupta et al. 2010). Marker-assisted pyramiding has beenemployed widely in cereal crops for combining multiplegenes/QTLs controlling both qualitative (Huang et al. 1997,
Hittalmani et al. 2000) and quantitative (Castro et al. 2003)disease resistance. In pulse crops, marker-assisted gene pyr-amiding has not been reported so far. However, in soybean, it
has been used to stack the genes controlling resistance tosoybean cyst nematode (SCN). Its use in this crop has beenshown to be cost-effective compared to greenhouse screening
and has increased the efficiency and speed of developing SCN-resistant cultivars (Concibido et al. 2004). Also, QTL/genescontrolling tolerance to Phytophthora root rot and resistance
to soybean mosaic virus have been pyramided in this crop (Shiet al. 2009, Li et al. 2010). The successful pyramiding of gene/QTL in soybean could have been possible only because of tightmarker–trait association. In pulses, well-established tight
association between markers and target traits has alreadybeen reported (Table 2). Thus, breeders can make similarefforts to use them for marker-assisted pyramiding in pulse
crops as well.
Why use of MAS is so uncommon in pulse breeding
programmes?
The present review indicates that involvement of MAS in pulseis very limited compared to cereals, although considerable
efforts have been made in developing genomic resources duringthe past decades (Sato et al. 2010). This may be ascribed toseveral reasons. First, it has been shown that pulse crops have
suffered to a great extent from poorly developed infrastructureincluding both knowledge and physical capacity for geneticand genomic analysis. Also, basic infrastructure facilities for
MAS are lacking for the conventional plant breeders. Sec-ondly, a dearth of sufficient genomic data in most of the pulsecrops except few ones such as chickpea, cowpea, common bean
and pigeon pea is the major constraint to establish closelinkage between molecular marker and trait of interest.Marker–trait association established so far in pulses haslinkage of such molecular markers that are not breeder-
306 J . Kum ar , A . K . Choud hary , R . K . Solank i et al.
friendly. This has limited their use in selection of desirableplant routinely in pulse breeding programmes. Therefore, toincrease the availability of genomic resources and data in keyspecies, highly polymorphic and reproducible markers such as
SSR and SNP in marker–trait association analysis is the majorissue for exploitation of MAS in breeding programmes.Thirdly, the interaction between biotechnologists and plant
breeders should be enhanced to use MAS more systematicallyand efficiently. Overcoming these barriers may facilitate theadoption of complex genomic data sets by crop improvement
specialists and development of improved cultivars involvingMAS. Fourthly, conventional plant breeders hesitate to useMAS in their routine breeding programmes. This limitationcan be surmounted by imparting training to the next gener-
ation of scientists to navigate both basic and applied plantscience and thus span the �gap� between genomics andbreeding. The final and last limitation relates to different
biological system of pulse crops having high plasticity andG · E interactions. Simultaneously, it also provides opportu-nity to improve the complex quantitative traits through MAS
because magnitude and direction of QTL effects differ indifferent environments (Mackay 2009). Therefore, in pulses,major emphasis has to be given on identification of appropri-
ate statistical analysis and there is need to study systematicgenetics from QTL to biology and omitting all of theintermediate aspects in the chain of causation from geneticperturbation to phenotype variation during association of
DNA sequence variation with variation in phenotypes.
Future Possibilities for Deploying MAS as a Componentof Pulse Breeding Programmes
During the last few years, considerable progress has been made
in the development of genomic resources in major pulses likecowpea, common bean, chickpea and pigeon pea. The time hascome for plant breeders to use these resources for improving
the pulses and making MAS an integral part of conventionalbreeding programmes. To this end, breeders need to developthe trait-specific mapping populations in these crops and map
the important gene/QTL so that they can fulfil the basicrequirements of MAS. The mapping of important traits willfacilitate identification of tightly linked markers for MAS.
Certainly, the latest technological developments in the areas
of DNA sequencing and genotyping are serving to redefine thescope of germplasm classification. Further, precise phenotyp-ing of germplasm accessions belonging to natural mapping
populations will facilitate marker–trait association, and alsofor mining rare alleles of genes controlling important traitsthrough TILLING approach.
The close phylogenetic relationship of pulse crops with themodel legume species Medicago truncatula and Lotus japonicus(Cannon et al. 2005) can facilitate the cross-species transfer-
ability of molecular markers from model to various pulseswhere progress of development of such genomic resources isstill slow. Therefore, research work in this direction canaccelerate mapping of important genes for target traits, and
tightly linked markers can be utilized through MAS.However, it will be better to pay attention to the develop-
ment of vast amount of genomic resources in every pulse. This
will help to develop the breeder-friendly molecular markerslike SSR and SNP and to improve our genetic understandingof complex traits, relations among traits, and between target
trait and environments. The high-throughput genotyping
platform equipped with new-generation sequencing technolo-gies is rapidly evolving. This will certainly provide cheap andlarge-scale screening of segregating individuals for selectingdesirable genotypes. It will make MAS breeding of pulse crops
more broad, useful and efficient as well as cost-effective infuture.The slow progress in the use of molecular technology in
pulses has been attributed to the limited efforts and resourcesdedicated to develop genomic resources. Breeders selectsimultaneously for many traits, which are quite often complex
in nature. In many species, the knowledge obtained on thebasis of marker–trait studies using mapping populationscannot be applied to the diverse germplasm the breeders use.There are genetic background effects, interactions, etc. Thus,
validation studies are always necessary. Also quite often, theeffect and percentage of the phenotypic variance explained isoverestimated in control experiments, and the values do not
hold when such breeding materials are used. Breeders usingMAS encounter such difficulties, so it is important to under-stand these limitations. MAS is a great tool but not a magic
tool. However, young generations of scientists including bothplant breeders and biotechnologists have potential to surpassthis barrier as most of them are aware of the potentiality of
MAS.
Acknowledgements
Thanks are due to the Head, Division of Crop Improvement, Indian
Institute of Pulses Research, Kanpur, for providing the facilities.
References
Adam-Blondon, A. F., M. Sevigenc, H. Bannerot, and M. Dron, 1994:
SCAR, RAPD and RFLP markers linked to a dominant gene (Are)
conferring resistance to anthracnose in common bean. Theor. Appl.
Genet. 88, 865—870.
Agbicodo, E. M., C. A. Fatokun, S. Muranaka, R. G. F. Visser, and
C. G. Linden van der, 2009: Breeding drought tolerant cowpea:
constraints, accomplishments, and future prospects. Euphytica 167,
353—370.
Ahmad, F., 1998: Random amplified polymorphic DNA (RAPD)
analysis reveals genetic relationships among the annual Cicer
species. Theor. Appl. Genet. 98, 657—663.
AICRP on MULLaRP, 2009–2010: Project Coordinator�s Report,
Rabi 2009–2010. Indian Institute of Pulses Research, Kanpur, India.
Ali, M., and S. Kumar, 2005: Advances in Pigeon Pea Research.
Indian Institute of Pulses Research, Kanpur, India, p. 356.
Ali, M., S. Kumar, and N. B. Singh, 2003: Chickpea Research in India,
1st edn. Indian Institute of Pulses Research, Kanpur, India.
Alzate-Marin, A. L., H. Menarim, M. C. C. Arruda, J. M. Chagas, E.
G. Barros, and M. A. Moreira, 1999: Backcross assisted by RAPD
markers for introgression of Co-4 and Co-6 anthracnose resistant
genes in common bean cultivars. Ann. Rev. Rep. Bean. Improv.
Coop. 42, 15—16.
Anbessa, Y., B. Taran, T. D. Warkentin, A. Tullu, and A. Vanden-
berg, 2009: Genetic analyses and conservation of QTL for ascochyta
blight resistance in chickpea (Cicer arietinum L.). Theor. Appl.
Genet. 119, 757—765.
Angus, R. A., S. W. Hardwick, and G. B. Cline, 1988: A computer
program that calculates various similarity coefficients between
electropherograms. J. Hered. 79, 74—75.
Aryamanesh, N., M. N. Nelson, G. Yan, H. J. Clarke, and K. H. M.
Siddique, 2010: Mapping a major gene for growth habit and
QTLs for ascochyta blight resistance and flowering time in a
population between chickpea and Cicer reticulatum. Euphytica 173,
307—319.
Towards marker-assisted selection in pulses 307

Asfaw, A., M. W. Blair, and C. Almekinders, 2009: Genetic diversity
and population structure of common bean (Phaseolus vulgaris L.)
landraces from the East African highlands. Theor. Appl. Genet. 120,
1—12.
Avila, C. M., J. C. Sillero, D. Rubiales, M. T. Moreno, and A. M.
Torres, 2003: Identification of RAPD markers linked to the Uvf-1
gene conferring hypersensitive resistance against rust (Uromuces
viciae-fabae) in Vicia Faba L. Theor. Appl. Genet. 107, 353—358.
Babayeva, S., Z. Akparov, M. J. Abbasov, A. Mammadov, M.
Zaifizadeh, and K. Street, 2009: Diversity analysis of Central Asia
and Caucasian lentil (Lens culinaris Medik.) germplasm using SSR
fingerprinting. Genet. Resour. Crop Evol. 56, 293—298.
Bachlava, E., R. E. Dewey, J. W. Burton, and A. J. Cardinal, 2009:
Mapping candidate genes for oleate biosynthesis and their associ-
ation with unsaturated fatty acid seed content in soybean. Mol.
Breed. 23, 337—347.
Barilli, E., J. C. Sillero, A. Moral, and D. Rubiales, 2009: Character-
ization of resistance response of pea (Pisum spp.) against rust
(Uromyces pisi). Plant Breed. 128, 665—670.
Barilli, E., Z. Satovic, D. Rubiales, and A. M. Torres, 2010: Mapping
of quantitative trait loci controlling partial resistance against rust
incited by Uromyces pisi (Pers.) Wint. in a Pisum fulvum L.
intraspecific cross. Euphytica 175, 151—159.
Basak, J., S. Kundagrami, T. K. Ghoose, and A. Pal, 2004:
Development of yellow mosaic virus (YMV) resistance linked
DNA marker in Vigna mungo from populations segregating for
YMV-reaction. Mol. Breed. 14, 375—382.
Bhat, K. V., S. Lakhanpaul, and S. Chadha, 2005: Amplified fragment
length polymorphism (AFLP) analysis of genetic diversity in Indian
mungbean [Vigna radiata (L.) Wilczek] cultivars. Indian J. Biotech.
4, 56—64.
Blair, M. W., L. M. Rodriguez, F. Pedraza, F. Morales, and S. Beebe,
2007: Genetic mapping of the bean olden mosaic geminivirus
resistant gene Bgm-1 and linkage with potyvirus resistance in
common bean (Phaseolus vulgaris L.). Theor. Appl. Genet. 107,
1362—1374.
Bouker, O., L. Kong, B. B. Singh, K. Murdock, and H. W. Ohm,
2004: AFLP and AFLP-derived SCAR markers associated with
Striga gesnerioides resistance in cowpea. Crop Sci. 44,
1259—1264.
Bradbury, P. J., Z. Zhang, D. E. Kroon, T. M. Casstevens, Y.
Ramdoss, and E. S. Buckler, 2007: TASSEL: software for associ-
ation mapping of complex traits in diverse samples. Bioinformatics
23, 2633—2635.
Brahm, L., R. Thomas, and F. Wolfgang, 2000: PCR-based markers
facilitating marker assisted selection in sunflower for resistance to
downy mildew. Crop Sci. 40, 676—682.
Breseghello, F., and M. E. Sorrells, 2006: Association analysis as a
strategy for improvement of quantitative traits in plants. Crop Sci.
46, 1323—1330.
Burle, M. L., J. R. Fonseca, J. A. Kami, and P. Gepts, 2010:
Microsatellite diversity and genetic structure among common bean
(Phaseolus vulgaris L.) landraces in Brazil, a secondary center of
diversity. Theor. Appl. Genet. 121, 801—813.
Cannon, S. B., J. A. Crow, M. L. Heuer, X. Wang, E. K. Cannon, C.
Dwan, A. F. Lamblin, J. Vasdewani, J. Mudge, A. Cook, J. Gish, F.
Cheung, S. Kenton, T. M. Kunau, D. Brown, G. D. May, D. Kim,
D. R. Cook, B. A. Roe, C. D. Town, N. D. Young, and E. F.
Retzel, 2005: Databases and information integration for the
Medicago truncatula genome and transcriptome. Plant Physiol.
138, 1—3.
Cannon, S. B., G. D. May, and S. A. Jackson, 2009: Three sequenced
legume genomes and many crop species: rich opportunities for
translational genomics. Plant Physiol. 151, 970—977.
Castro, A. J., X. Chen, A. Corey, T. Filichkina, P. M. Hayes, C.
Mundt, K. Richardson, S. Sandoval-Islas, and H. Vivar, 2003:
Pyramiding and validation of quantitative trait locus (QTL) alleles
determining resistance to barley stripe rust: effects on adult plant
resistance. Crop Sci. 43, 2234—2239.
Castro, P., F. Piston, E. Madrid, T. Millan, J. Gil, and J. Rubio, 2009:
Development of chickpea near-isogenic lines for fusarium wilt
Theor. Appl. Genet. 121, 1519—1526.
Chamarthi, S. K., A. Kumar, T. D. Voung, M. W. Blair, P. M. Gaur,
H. T. Nguyen, and R. K. Varshney, 2011: Trait mapping and
molecular breeding. In: A. Pratap, and J. Kumar (eds), Biology and
Breeding of Food Legumes. CAB International, Oxfordshire, UK
(in press).
Chaturvedi, S. K., S. N. Gurha, S. Sewak, R. Ahmed, H. K. Dikshit,
and P. Bhaduoria, 1998: Possible combined resistance against
Fusarium wilt and pod borer in chickpea (Cicer arietinum L.).
Indian J. Pulses Res. 11, 117—119.
Chen, H. M., C. A. Liu, C. G. Kuo, C. M. Chein, H. C. Sun, C. C.
Huang, Y. C. Lin, and H. M. Ku, 2007: Development of a molecular
marker for a bruchid (Callosobruchus chinensis L.) resistance gene in
mungbean. Euphytica 157, 113—122.
Chen, J. B., S. M. Wang, R. L. Jing, and X. G. Mao, 2009: Cloning the
PvP5CS gene from common bean (Phaseolus vulgaris) and its
expression patterns under abiotic stresses. Plant Physiol. 166, 12—19.
Chen, J., X. Zhang, R. Jing, M. W. Blair, X. Mao, and S. Wang, 2010:
Cloning and genetic diversity analysis of a new P5CS gene from
common bean (Phaseolus vulgaris L.). Theor. Appl. Genet. 120,
1393—1404.
Choi, H. K., D. Kim, T. Uhm, E. Limpens, H. Lim, J. H. Mun,
P. Kalo, R. V. Penmetsa, A. Seres, O. Kulikova, B. A. Roe,
T. Bisseling, G. B. Kiss, and D. R. Cook, 2004: A sequence-based
genetic map of Medicago truncatula and comparison of marker
colinearity with Medicago sativa. Genetics 166, 1463—1502.
Chowdhery, M. A., C. P. Andrahennadi, A. E. Slinkard, and A.
Vandenberg, 2001: RAPD and SCAR markers for resistance to
ascochyta blight in lentil. Euphytica 118, 331—337.
Clement, S. L., K. E. McPhee, L. R. Elberson, and M. A. Evans, 2009:
Pea weevil, Bruchus pisorum L. (Coleoptera: Bruchidae), resistance
in Pisum sativum · Pisum fulvum interspecific crosses. Plant Breed.
128, 478—485.
Cobos, M. J., M. J. Fernandez, J. K. M. Rubio, M. T. Moreno, J. Gil,
and T. Millan, 2005: A linkage map of chickpea (Cicer arietinum L.)
based on populations from Kabuli · Desi crosses: location of genes
for resistance to Fusarium wilt race 0. Theor. Appl. Genet. 110,
1347—1353.
Cobos, M. J., P. Winter, M. Kharrat, J. I. Cubero, J. Gill, T. Millan,
and J. Rubio, 2009: Genetic analysis of agronomic traits in a wide
cross of chickpea. Field Crops Res. 111, 130—136.
Collins, N. C., F. Tardieu, and R. Tuberosa, 2008: Quantitative trait
loci and crop performance under abiotic stresses: where do we
stand? Plant Physiol. 147, 469—486.
Concibido, V. C., B. W. Diers, and P. R. Arelli, 2004: A decade of
QTL mapping for cyst nematode resistance in soybean. Crop Sci. 44,
1121—1131.
Coulibaly, S., R. S. Pasquet, R. Papa, and P. Gepts, 2002: AFLP
analysis of the phenetic organization and genetic diversity of Vigna
unguiculata L. Walp. reveals extensive gene flow between wild and
domesticated types. Theor. Appl. Genet. 104, 358—366.
Datta, S., M. Kaashyap, and S. Kumar, 2010: Amplification of
chickpea-specific SSR primers in Cajanus species and their validity in
diversity analysis. Plant Breed. 129, 334—340, DOI: 10.1111/j.1439-
0523.2009.01678.x.
Dhanasekar, P., K. N. Dhumal, and K. S. Reddy, 2010: Identification
of RAPD markers linked plant type gene in pigeonpea. Indian
J. Biotech. 9, 58—63.
Dirks, R., K. van Dun, C. B. de Snoo, M. Vandenberg, C. L. C.
Lelivelt, W. Voermans, L. Woudenberg, J. P. C. de Wit, K. Reinink,
J. W. Schut, E. van der Zeeuw, A. Vogelaar, G. Freymark, E. W.
Gutteling, M. N. Keppe, P. van Drongelen, M. Kieny, P. Ellu, A.
Touraev, H. Ma, H. de Jong, and E. Wijnker, 2009: Reverse
breeding: a novel breeding approach based on engineered meiosis.
Plant Biotechnol. J. 7, 837—845.
Dirlewanger, E., P. G. Isaac, S. Ranade, M. Belagouza, R. Cousin, and
D. de Vienne, 1994: Restriction fragment length polymorphism
308 J . Kum ar , A . K . Choud hary , R . K . Solank i et al.
analysis of loci associated with disease resistance genes and
development traits in Pisum sativum L. Theor. Appl. Genet. 88,
17—27.
Dixit, G. P., and P. K. Katiyar, 2004: Genetic base of lentil (Lens
culinaris) varieties and breeding lines developed in India. Indian J.
Agri. Sci. 74, 625—627.
Dixit, G. P., and P. K. Katiyar, 2006: Genetic base of Indian fieldpea
(Pisum sativum L.) varieties and breeding lines. Indian J. Genet. 66,
316—318.
Duc, G., S. Bao, M. Baumc, B. Redden, M. Sadiki, M. J. Suso, M.
Vishniakova, and X. Zong, 2010: Diversity maintenance and use of
Vicia faba L. genetic resources. Field Crops Res. 115, 270—278.
Duran, Y., and M. Perez de la Vega, 2004: Assessment of genetic
variation and species relationships in a collection of Lens using
RAPD and ISSR. Spanish J. Agri. Res. 2, 538—544.
Ender, M., K. Terpstra, and J. D. Kelly, 2007: Marker-assisted
selection for white mold resistance in common bean. Mol. Breed. 21,
149—157.
Erskine, W., and J. R. Witcombe, 1984: Lentil Gemplasm Catalog.
International Center for Agricultural research in the Dry Areas
(ICARDA), Aleppo, Syria.
Eujayl, I., W. Erskine, B. Bayaa, M. Baum, and E. Pehu, 1998:
Fusarium vascular wilt in lentil: inheritance and identification of
DNA markers for resistance. Plant Breed. 117, 497—499.
Eujayl, I., W. Erskine, M. Baum, and E. Pehu, 1999: Inheritance and
linkage analysis of frost injury in lentil. Crop Sci. 39, 639—642.
Faleiro, F. G., V. A. Ragagnin, G. A. Carvalho, J. T. J. Paula, M. A.
Moreira, and E. G. Barros, 2001: Development of common bean
lines resistant to rust and anthracnose by molecular marker-assisted
backcrossing. Annu. Rev. Rep. Bean Improv. Coop. 44,
1130—1133.
FAO, 2010: Production Statistics. Food and Agriculture Organization,
Rome, Italy.
Fatokun, C. A., D. I. Menancio-Hautea, D. Danesh, and N. D.
Young, 1992: Evidence for orthologous seed weight genes in cowpea
and mungbean based on RFLP mapping. Genetics 132, 841—846.
Fazio, G., S. M. Chung, and J. E. Staub, 2003: Comparative analysis
of response to phenotypic and marker-assisted selection for multiple
lateral branching in cucumber (Cucumis sativus L.). Theor. Appl.
Genet. 107, 875—883.
Fileppi, M., I. Galasso, G. Tagliabue, M. G. Daminati, B. Campion,
E. Doria, and F. Sparvoli, 2009: Characterization of structural genes
involved in phytic acid biosynthesis in common bean (Phaseolus
vulgaris L.). Mol. Breed. 25, 453—470.
Fjellstrom, R., C. A. Conaway-Bormans, A. M. McClung, M. A.
Marchetti, A. R. Shank, and W. D. Park, 2004: Development of
DNA markers suitable for marker assisted selection of three Pi
genes conferring resistance to multiple Pyricularia grisea pathotypes.
Crop Sci. 44, 1790—1798.
Ford, R., K. L. Roux, C. Itman, J. B. Brouwer, and P. W. J. Taylor,
2002: Diversity analysis and genotyping in Pisum with sequence
tagged microsatellite site (STMS) primers. Euphytica 124, 397—405.
Fratini, R., Y. Duran, P. Garcıa, and M. P. de la Vega, 2007:
Identification of quantitative trait loci (QTL) for plant structure,
growth habit and yield in lentil. Spanish J. Agri. Res. 5, 348—356.
Frew, T. J., A. C. Russell, and G. M. Timmerman-Vaughan, 2002:
Sequence tagged site markers linked to the smb1 gene for resistance
to pea seed borne mosaic virus in pea. Plant Breed. 121, 512—516.
Furman, B. J., C. Coyne, B. Redden, S. K. Sharma, and M.
Vishnyyakova, 2009: Genetic resources: Collection characterization,
conservation and documentation. In: W. Erskine, F. J. Muehlbauer,
A. Sarker, and B. Sharma (eds), The Lentil: Botany, Production,
and Uses, 64—75. CAB International, Oxfordshire, UK.
Gao, Z., S. Eyers, C. Thomas, N. Eills, and A. Maule, 2004:
Identification of markers tightly linked to the sbm recessive genes
for resistance to pea seed-borne mosaic virus. Theor. Appl. Genet.
109, 488—494.
Ghatge, R., 1994: Pleoitropic action of genes in gram (Cicer arietinum
L.). J. Soils Crops 4, 15—17.
Gill, J., and J. I. Cubero, 1993: Inheritance of seed coat thickness in
chickpea (Cicer arietinum L.). Plant Breed. 38, 245—251.
Glaszmann, J. C., B. Kilian, H. D. Upadhyaya, and R. K. Varshney,
2010: Accessing genetic diversity for crop improvement. Curr. Opin.
Plant Biol. 13, 167—173.
Gowda, S. J. M., P. Radhika, N. Y. Kadoo, L. B. Mhase, and V. S.
Gupta, 2009: Molecular mapping of wilt resistance genes in
chickpea. Mol. Breed. 24, 177—183.
Grewal, R. K., M. Lulsdorf, J. Croser, S. Ochatt, A. Vandenberg, and
T. D. Warkentin, 2009: Doubled-haploid production in chickpea
(Cicer arietinum L.): role of stress treatments. Plant Cell Rep. 28,
1289—1299.
Gupta, P. K., J. Kumar, R. R. Mir, and A. Kumar, 2010: Marker-
assisted selection as a component of conventional plant breeding.
Plant Breed. Rev. 33, 145—217.
Gutierrez, N., C. M. Avila, G. Duc, P. Marget, M. J. Suso, M. T.
Moreno, and A. M. Torres, 2006: CAPs markers to assist selection
for low vicine and convicine contents in faba bean (Vicia faba L.).
Theor. Appl. Genet. 114, 59—66.
Halila, I., J. Rubio, T. Millan, J. Gil, M. Kharrat, and M. Marrakchi,
2010: Resistance in chickpea (Cicer arietinum) to Fusarium wilt race
�0�. Plant Breed. 129, 563—566.
Hamwieh, A., S. M. Udupa, W. Choumane, A. Sarker, F. Dreyer,
C. Jung, andM. Baum, 2005: A genetic linkage map ofLens sp. based
on microsatellite and AFLPmarkers and the localization of fusarium
vascular wilt resistance. Theor. Appl. Genet. 110, 669—677.
Hamwieh, A., S. M. Udupa, A. Sarker, C. Jung, and M. Baum,
2009: Development of new microsatellite markers and their
application in the analysis of genetic diversity in lentils. Breed.
Sci. 59, 77—86.
Hanai, L. R., L. Santini, L. E. A. Camargo, M. H. P. Fungaro, P.
Gepts, S. M. Tsai, and M. L. C. Vieira, 2010: Extension of the core
map of common bean with EST-SSR, RGA, AFLP, and putative
functional markers. Mol. Breeding 25, 25—45.
Hecht, V., F. Foucher, C. Ferrandiz, R. Macknight, C. Navarro,
J. Morin, M. E. Vardy, N. Ellis, J. P. Beltran, C. Rameau, and J. L.
Weller, 2005: Conservation of Arabidopsis flowering genes in model
legumes1[w]. Plant Physiol. 137, 1420—1434.
Hirschhorn, J. N., and M. J. Daly, 2005: Genome-wide association
studies for common diseases and complex traits. Nat. Rev. Genet. 6,
95—108.
Hittalmani, S., A. Parco, T. V. Mew, R. S. Zeigler, and N. Huang,
2000: Fine mapping and DNA marker-assisted pyramiding of the
three major genes for blast resistance in rice. Theor. Appl. Genet.
100, 1121—1128.
Huang, N., E. R. Angeles, J. Domingo, G. Magpantay, S. Singh, G.
Zhang, N. Kumaravadivel, J. Bennett, and G.S. Khush, 1997:
Pyramiding of bacterial blight resistance genes in rice: Marker-
assisted selection using RFLP and PCR. Theor. Appl. Genet. 95,
313—320.
Huh, M. K., and H. W. Huh, 2001: Genetic diversity and population
structure of wild lentil tare. Crop Sci. 41, 1940—1946.
Humphry, M. E., T. Magner, C. L. McIntyre, E. A. B. Aitken, and
C. J. Liu, 2003: Identification of a major locus conferring resistance
to powdery mildew (Erysiphe polygoni DC) in mungbean (Vigna
radiata (L.) Wilczek) by QTL analysis. Genome 46, 738—744.
Ikeda, T., S. Ohnishi, M. Senda, T. Miyoshi, M. Ishimoto, K. Kitam-
ura, and H. Funatsuki, 2009: A novel major quantitative trait locus
controlling seed development at low temperature in soybean
(Glycine max). Theor. Appl. Genet. 118, 1477—1488.
Imrie, B. C., and S. Shanmugasundaram, 1987: Source of variation in
yield in international mungbean trials. Field Crops Res. 16,
197—208.
Infantino, A., M. Kharrat, L. Riccioni, C. J. Coyne, K. E. McPhee,
and N. J. Grunwald, 2006: Screening techniques and sources of
resistance to root diseases in cool season food legumes. Euphytica
147, 201—221.
Iruela, M., P. Castro, J. Rubio, J. I. Cubero, C. Jacinto, T. Millan, and
J. Gil, 2007: Validation of a QTL for resistance to ascochyta blight
Towards marker-assisted selection in pulses 309
linked to resistance to Fusarium wilt race 5 in chickpea (Cicer
arietinum L.). Eur. J. Plant Pathol. 119, 29—37.
Iruela, M., F. Piston, J. I. Cubero, T. Millan, F. Barro, and J. Gil,
2009: The marker SCK13603 associated with resistance to ascochyta
blight in chickpea is located in a region of a putative retrotranspo-
son. Plant Cell Rep. 28, 53—60.
Ishii, T., and K. Yonezawa, 2007a: Optimization of the marker-based
procedures for pyramiding genes from multiple donor lines: I.
Schedule of crossing between the donor lines. Crop Sci. 47,
537—546.
Ishii, T., and K. Yonezawa, 2007b: Optimization of the marker-based
procedures for pyramiding genes from multiple donor lines: II.
Strategies for selecting the objective homozygous plant. Crop Sci.
47, 1878—1886.
Jaccard, P., 1908: Nouvelles recherches sur la distribution florale. Bull.
Soc. Vaud. Sci. Nat. 44, 223—270.
Jin, L., G. Jian-Ping, X. Dong-Xu, Z. G. Xiao-Yan, G. U. Jing, and Z.
Xu-Xiao, 2008: Genetic diversity and population structure in lentil
(Lens culinaris Medik.) germplasm detected by ssr markers. Acta
Agron. Sin. 34, 1901—1909.
Johnson, W. C., C. Menendez, R. Nodari, E. M. K. Koinange,
S. Magnusson, S. P. Singh, and P. Gepts, 1996: Association of a seed
weight factor with the phaseolin seed storage protein locus across
genotypes, environments and genomes in Phaseolus-Vigna spp.: Sax
(1923) revisited. J. Quant. Trait Loci 2, 5.
Jung, G., P. W. Skroch, D. P. Coyne, J. Nienhuis, E. Arnaud-Santana,
S. M. A. Kaeppler, and M. J. Basset, 1997: Molecular-marker-based
genetic analysis of tepary bean-derived common bacterial blight
resistance in different developmental stages of common bean. J. Am.
Soc. Hort. Sci. 122, 329—337.
Kaga, A., N. Tamooka, Y. Egawa, K. Hosaka, and O. Kamijima,
1996: Species relationships in subgenus Ceratotropis (genus Vigna)
as revealed by RAPD analysis. Euphytica 88, 17—24.
Kahraman, A., I. Kusmenoglu, N. Aydin, A. Aydogan, W. Erskine,
and F. J. Muehlbauer, 2004: QTL mapping of winter hardness genes
in lentil. Crop Sci. 44, 13—22.
Katiyar, P. K., G. P. Dixit, and B. B. Singh, 2007: Ancestral
relationship of greengram (Vigna radiata) advance breeding lines
developed in India. Indian J. Agri. Sci. 77, 579—582.
Katiyar, P. K., G. P. Dixit, and B. B. Singh, 2008: Genetic base of
advanced urdbean breeding lines developed in India as revealed by
pedigree analysis. Indian J. Genet. 68, 324—326.
Kelly, J. D., P. Gepts, P. N. Miklas, and D. P. Coyne, 2003: Tagging
and mapping of genes and QTL and molecular marker-assisted
selection for traits of economic importance in bean and cowpea.
Field Crops Res. 82, 135—154.
Koinange, E. M. K., S. P. Singh, and P. Gepts, 1996: Genetic control
of the domestication syndrome in common bean. Crop Sci. 36,
1037—1045.
Kolkman, J. M., and J. D. Kelly, 2003: QTL conferring resistance
and avoidance to white mold in common bean. Crop Sci. 43,
539—548.
Kotresh, H., B. Fakrudin, S. M. Punnuri, B. K. Rajkumar, M. Thudi,
H. Paramesh, H. Lohithaswa, and M. S. Kuruvinashetti, 2006:
Identification of two RAPD markers genetically linked to a recessive
allele of a Fusarium wilt resistance gene in pigeon pea (Cajanus cajan
L. Millsp.). Euphytica 149, 113—120.
Kumar, S., and M. Ali, 2006: GE interaction and its breeding
implications in pulses. The Botanica 56, 31—36.
Kumar, J., K. B. Singh, R. S. Malhotra, J. H. Miranda, and
T. Dasgupta, 1996: Genotype · environment interaction for seed
yield in chickpea. Indian J. Genet. 56, 69—78.
Kumar, S., S. Rakshit, and S. Gupta, 2003: Genetics and cytogenetics
of chickpea. In: M. Ali, S. Kumar, and N. B. Singh (eds), Chickpea
Research in India, 31—37. IIPR, Kanpur, India.
Kumar, S., S. Gupta, S. Chandra, and B. B. Singh, 2004: How wide is
the genetic base of pulse crops. In: M. Ali, B. B. Singh, S. Kumar,
and Vishwadhar (eds), Pulses in New Perspective, 211—221. IIPR,
Kanpur, India.
Kumar, K. R. R., T. Srinivasan, and P. B. Kirti, 2009a: A mitogen-
activated protein kinase gene, AhMPK3 of peanut: molecular
cloning, genomic organization, and heterologous expression confer-
ring resistance against Spodoptera litura in tobacco. Mol. Genet.
Genomics 282, 65—81.
Kumar, J., A. Pratap, and R. K. Solanki, 2009b: Basics in molecular
genetic mapping and QTL analysis in plants. In: P. Bhowmik, S. K.
Basu, and A. Goyal (eds), Advances in Biotechnology, 35—52.
Bentham Sciences Publishers, IL, USA.
Kumar, J., R. R. Mir, N. Kumar, A. Kumar, A. Mohan, K. V.
Prabhu, H. S. Balyan, and P. K. Gupta, 2010: Marker-assisted
selection for pre-harvest sprouting tolerance and leaf rust resistance
in bread wheat. Plant Breed. 33, 145—217.
Kwak, M., and P. Gepts, 2009: Structure of genetic diversity in the two
major gene pools of common bean (Phaseolus vulgaris L., Faba-
ceae). Theor. Appl. Genet. 118, 979—992.
Lakhanpaul, S., S. Chadha, K. V. Bhat, and S. Chadha, 2000:
Random amplified polymorphic DNA (RAPD) analysis in Indian
mungbean (Vigna radiata L. Wilczek) cultivars. Genetica 109,
227—234.
Lateef, S. S., 1992: Scope and limitations of host plant resistance in
pulses for the control of Helicoverpa armigera. In: J. N. Schan (ed.),
Helicoverpa Management: Current Status and Future Strategies,
31—37. IIPR, Kanpur, India.
Legendre, P., and L. Legendre, 1983: Numerical Ecology. First English
Edition. Elsevier Publishers, Amsterdam, The Netherlands.
Li, C. D., C. A. Fatokun, B. Ubi, B. B. Singh, and G. Scoles, 2001:
Determining genetic similarities among cowpea breeding lines and
cultivars by microsatellite markers. Crop Sci. 41, 189—197.
Li, Z. K., S. B. Yu, H. R. Lafitte, N. Huang, B. Courtois,
S. Hittalmani, C. H. Vijayakumar, G. F. Liu, G. C. Wang, H.
E. Shashidhar, J. Y. Zhuang, K. L. Zheng, V. P. Singh, J. S. Sidhu,
S. Srivantaneeyakul, and G. S. Khush, 2003: QTL x environment
interactions in rice. I. Heading date and plant height. Theor. Appl.
Genet. 108, 1141—1153.
Li, X., Y. Han, W. Teng, S. Zhang, K. Yu, V. Poysa, T. Anderson, J.
Ding, and W. Li, 2010: Pyramided QTL underlying tolerance to
Phytophthora root rot in mega-environments from soybean cultivars
Conrad and Hefeng 25. Theor. Appl. Genet. 121, 651—658.
van der Linden, C. G., D. C. A. E. Wouters, V. Mihalka, E. Z.
Kochieva, M. J. M. Smulders, and B. Vosmanm, 2004: Efficient
targeting of plant disease resistance loci using NBS profiling. Theor.
Appl. Genet. 109, 384—393.
Liu, P. Y., J. Zhu, X. Y. Lou, and Y. Lu, 2003: A method for marker-
assisted selection based on QTLs with epistatic effects. Genetica 119,
75—86.
Liu, P. Y., Z. Jun, and Y. Lu, 2006: Impacts of QTL · environment
interactions on genetic response to marker-assisted selection. Acta
Genet. Sin. 33, 63—71.
Liu, S., M. Banik, K. Yu, S. J. Park, V. Poysa, and Y. Guan, 2007:
Marker-assisted election (MAS) in major cereal and legume crop
breeding: current progress and future directions. Int. J. Plant Breed.
1, 74—88.
Lynch, M., and K. Ritland, 1999: Estimation of pair wise relatedness
with molecular markers. Genetics, 152, 1753—1766.
Mackay, T. F. C., 2009: A-maize-ing diversity. Science, 325, 688—689.
Malhotra, R. S., and K. B. Singh, 1991: Classification of chickpea
growing environments to control genotype by environment interac-
tion. Euphytica 58, 5—12.
Martınez-Castillo, J., D. Zizumbo-Villarreal, P. Gepts, P. Delgado-
Valerio, and P. Colunga-GarcıaMarın, 2006: Structure and genetic
diversity of wild populations of lima bean (Phaseolus lunatus L.)
from the Yucatan Peninsula, Mexico. Crop Sci. 46, 1071—1080.
Mathur, D. S., 1998: Inheritance of light dependent purple pigmen-
tation in chickpea. Indian J. Genet. 58, 149—152.
Maughan, P. J., M. A. Saghai-Maroof, and G. R Buss, 1996:
Molecular marker analysis of seed-weight: genomic locations, gene
action and evidence for orthologous evolution among three legume
species. Theor. Appl. Genet. 93, 574—579.
310 J . Kum ar , A . K . Choud hary , R . K . Solank i et al.
McMullen, M. D., S. Kresovich, H. S. Villeda, P. Bradbury, H. Li,
Q. Sun, S. Flint-Garcia, J. Thornsberry, C. Acharya, C. Bottoms,
P. Brown, C. Browne, M. Eller, K. Guill, C. Harjes, D. Kroon, N.
Lepak, S. E. Mitchell, B. Peterson, G. Pressoir, S. Romero, M. O.
Rosas, S. Salvo, H. Yates, M. Hanson, E. Jones, S. Smith, J.
C. Glaubitz, M. Goodman, D. Ware, J. B. Holland, and E. S.
Buckler, 2009: Genetic properties of the maize nested association
mapping population. Science 325, 737—740.
Melotto, M., L. Afanador, and J. D. Kelly, 1996: Development of a
SCAR marker linked to the I gene in common bean. Genome 39,
1216—1219.
Miklas, P. N., 2002: Marker assisted selection for disease resistance in
common beans. Annu. Rev. Rep. Bean. Improv. Coop. 45, 1—3.
Miklas, P. N., J. D. Kelly, and S. P. Singh, 2003: Registration of
anthracnose-resistant pinto bean germplasm line USPT-ANT-1.
Crop Sci. 43, 1889—1890.
Miklas, P. N., J. R. Smith, and S. P. Singh, 2006: Registration of
common bacterial blight resistant dark red kidney bean germplasm
line USDK-CBB-15. Crop Sci. 46, 1005—1006.
Millan, T., J. Rubio, M. Iruela, K. Daly, J. I. Cubero, and J. Gil, 2003:
Markers associated with Ascochyta blight resistance in chickpea and
their potential in marker assisted selection. Field Crops Res. 84,
373—384.
Millan, T., P.Winter, R. Jungling, J. Gil, J. Rubio, S. Cho,M. J. Cobos,
M. Iruela, P.N.Rajesh,M.Tekeoglu,G.Kahl, andF. J.Muehlbauer,
2010: A consensus genetic map of chickpea (Cicer arietinumL.) based
on 10 mapping populations. Euphytica 175, 175—189.
Mohler, V., and C. Singrun, 2004: General considerations: marker
assisted selection. In: H. Lorz, and G. Wenzel (ed.), Biotechnology
in Agriculture and Forestry: Molecular Marker Systems in Plant
Breeding and Crop Improvement, 305—318. Springer, Berlin.
Moreau, L., A. Charcosset, F. Hospital, and A. Gallais, 1998: Marker-
assisted selection efficiency in populations of finite size. Genetics
148, 1353—1365.
Muchero, W., N. N. Diop, P. R. Bhat, R. D. Fenton, S. Wanamaker,
M. Pottorff, S. Hearne, N. Cisse, C. Fatokun, J. D. Ehlers, P. A.
Roberts, and T. J. Close, 2009: A consensus genetic map of cowpea
[Vigna unguiculata (L) Walp.] and synteny based on EST-derived
SNPs. Proc. Natl. Acad. Sci. 106, 18159—18164.
Muchero, W., J. D. Ehlers, and P. A. Roberts, 2010a: Restriction site
polymorphism-based candidate gene mapping for seedling drought
tolerance in cowpea [Vigna unguiculata (L.) Walp.]. Theor. Appl.
Genet. 120, 509—518.
Muchero, W., J. D. Ehlers, and P. A. Roberts, 2010b: QTL analysis for
resistance to foliar damage caused by Thrips tabaci and Frankliniella
schultzei (Thysanoptera: Thripidae) feeding in cowpea [Vigna
unguiculata (L.) Walp.]. Mol. Breed. 25, 47—56.
Muthusamy, S., S. Kanagarajan, and S. Ponnusamy, 2008: Efficiency
of RAPD and ISSR markers system in accessing genetic variation of
rice bean (Vigna umbellata) landraces. Electronic J. Biotechnol. 11,
http://www.ejbiotechnology.info/content/vol11/issue3/full/8/
Mutlu, N., P. N.Miklas, andD. P. Coyne, 2006: Resistance gene analog
polymorphism (RGAP) markers co-localize with disease resistance
genes and QTL in common bean. Mol. Breed. 17, 127—135.
Navarro, F. M., M. E. Sass, and J. Nienhuis, 2009: Marker-facilitated
selection for a major QTL associated with root rot resistance in snap
bean (Phaseolus vulgaris L.). Crop Sci. 49, 850—856.
Nayak, S. N., H. Zhu, N. Varghese, S. Datta, H. K. Choi, R. Horres,
R. Jungling, J. Singh, P. B. K Kishor, S. Sivaramakrishnan, D. A.
Hoisington, G. Kahl, P. Winter, D. R. Cook, and R. K. Varshney,
2010: Integration of novel SSR and gene-based SNP marker loci in
the chickpea genetic map and establishment of new anchor points
with Medicago truncatula genome. Theor. Appl. Genet. 120,
1415—1441.
Nei, M., 1973: Analysis of gene diversity in subdivided populations.
Proc. Natl Acad. Sci. USA 70, 3321—3323.
Nei, M., and W. H. Li, 1979: Mathematical models for studying
genetic variation in terms of restriction endonucleases. Proc. Natl
Acad. Sci. USA 76, 5269—5273.
Ning, X., C. Xu-Zhen, W. Li-Xia, W. Su-Hua, L. Chang-You, S. Lei,
and M. Li, 2009: Screening SSR marker for adzuki bean and its
application in diversity evaluation in chinese adzuki bean germplasm
resources. Acta Agron. Sin. 35, 219—227.
Nkongolo, K. K., 2003: Genetic characterization of Malawian cowpea
(Vigna unguiculata (L.) Walp) landraces: diversity and gene flow
among accessions. Euphytica 129, 219—228.
Nordborg, M., and S. Tavare, 2002: Linkage disequilibrium: what
history has to tell us. Trends Genet. 18, 83—90.
Odeny, D. A., B. Jayashree, M. Ferguson, D. Hoisington, L. J. Cry,
and C. Gebhardt, 2007: Development, characterization and utiliza-
tion of microsatellite markers in pigeonpea. Plant Breed. 126,
130—136.
de Oliveira, E. J., A. L. Alzate-Marin, A. Borem, F. S. de Azeredo,
E. G. de Barros, and M. A. Moreira, 2005: Molecular marker-
assisted selection for development of common bean lines resistant to
angular leaf spot. Plant Breed. 124, 572—575.
Palomino, C., Z. Satovic, J. I. Cubero, and A. M. Torres, 2006:
Identification and characterization of NBS-LRR class resistance
gene analogs in faba bean (Vicia faba L.) and chickpea (Cicer
arietinum L.). Genome 49, 1227—1237.
Palomino, C., M. D. Fernandez-Romero, J. Rubio, A. Torres, M.
T. Moreno, and T. Millan, 2009: Integration of new CAPS and
dCAPS-RGA markers into a composite chickpea genetic map and
their association with disease resistance. Theor. Appl. Genet. 118,
671—682.
Panguluri, S., K. Janaiah, J. Govil, P. Kumar, and P. Sharma, 2006:
AFLP fingerprinting in pigeon pea (Cajanus cajan (L.) Millsp.) and
its wild relatives. Genet. Resour. Crop Evol. 53, 523—531.
Park, S. O., D. P. Coyne, G. Jung, P. W. Skroch, E. Arnaud-Santana,
J. R. Steadman, H. M. Ariyarathne, and J. Nienhuis, 2000: Mapping
of QTL for seed size and shape traits in common bean. J. Am. Soc.
Hort. Sci. 125, 466—475.
Pasquet, R. S., 2000: Allozyme diversity of cultivated cowpea Vigna
unguiculata (L.) Walp. Theor. Appl. Genet. 101, 211—219.
Poncet, V., F. Lamy, K. M. Devos, M. D. Gale, A. Sarr, and
T. Robert, 2000: Genetic control of domestication traits in pearl
millet (Pennisetum glaucum L., Poaceae). Theor. Appl. Genet. 100,
147—159.
Powell, W. M., M. Morgante, C. Andre, M. Hanafey, J. Vogel,
S. Tingey, and A. Rafalski, 1996: The comparison of RFLP, RAPD,
AFLP and SSR (microsatellite) markers for germplasm analysis.
Mol. Breed. 2, 225—238.
Pritcharda, J. K., M. Stephens, and P. Donnelly, 2000: Inference of
population structure using multilocus genotype data. Genetics, 155,
945—959.
Radhika, P., S. J. M. Gowda, N. Y. Kadoo, L. B. Mhase, B.
M. Jamadagni, M. N. Sainani, S. Chandra, and V. S. Gupta, 2007:
Development of an integrated intraspecific map of chickpea (Cicer
arietinum L.) using two recombinant inbred line populations Theor.
Appl. Genet. 115, 209—216.
Rafalski, J. A., 2010: Association genetics in crop improvement. Curr.
Opin. Plant Biol. 13, 174—180.
Rakshit, S., P. Winter, M. Tekeoglu, J. J. Munoz, T. Pfaff, M. Benko-
Iseppon, F. J. Muehlbauer, and G. Kahl, 2003: DAF markers tightly
linked to a major locus for Ascochyta blight resistance in chickpea
(Cicer arietinum L.). Euphytica 132, 23—30.
Reddy, M. R. K., R. Rathour, N. Kumar, P. Katoch, and T. R.
Sharma, 2010: Cross-genera legume SSR markers for analysis of
genetic diversity in Lens species. Plant Breed. 129, 514—518.
Risch, N., and K. Merikangas, 1996: The future of genetic studies of
complex human diseases. Science 273, 1516—1517.
Roman, B., A. M. Torres, D. Rubiales, J. I. Cubero, and Z. Satovic,
2002: Mapping of quantitative trait loci conferring broomrape
(Orobanche crenata Forsk.) resistance in faba bean (Vicia faba L.).
Genome 45, 1057—1063.
Samec, P., and V. Nasinec, 1996: The use of RAPD technique for the
identification and classification of Pisum sativum L. genotypes.
Euphytica 89, 229—234.
Towards marker-assisted selection in pulses 311
Sandhu, J. S., M. M. Verma, and H. S. Brar, 1993: Inheritance of
foliage colour in chickpea. Intl. Chickpea News 28, 8.
Sangir, C., A. Kaga, N. Tomooka, D. Vaughan, and P. Srinives, 2007:
Genetic diversity of the mungbean (Vigna radiata, Leguminosae)
genepool on the basis of microsatellite analysis. Aust. J. Bot. 55,
837—847.
Sato, S., S. Isobe, and S. Tabata, 2010: Structural analyses of the
genomes in legumes. Curr. Opin. Plant Biol. 13, 1—17.
Sax, K., 1923: The association of size differences with seed-coat pattern
and pigmentation in Phaseolus vulgaris. Genetics 8, 552—560.
Saxena, R. K., C. Prathima, K. B. Saxena, D. A. Hoisington, N. K.
Singh, and R. K. Varshney, 2010: Novel SSR Markers for
polymorphism detection in pigeon pea (Cajanus spp.). Plant Breed.
129, 142—148.
Schneider, K. A., K. F. Grafton, and J. D. Kelly, 2001: QTL
analysis of resistance to Fusarium root rot in bean. Crop Sci. 41,
535—542.
Seehalak, W., N. Tomooka, A. Waranyuwat, P. Thipyapong, P. Lao-
suwan, A. Kaga, and D. A. Vaughan, 2006: Genetic diversity of the
Vigna germplasm from Thailand and neighbouring regions revealed
by AFLP analysis. Genet. Resour. Crop Evol. 53, 1043—1059.
Sethy, N. K., B. Shokeen, K. J. Edwards, and S. Bhatia, 2006:
Development of microsatellite markers and analysis of intraspecific
genetic variability in chickpea (Cicer arietinum L.). Theor. Appl.
Genet. 112, 1416—1428.
Sharma, B., 2009: Genetics of economics traits. In: W. Erskine, F. J.
Muehlbauer, A. Sarker, and B. Sharma (ed.), The Lentil: Botany,
Production, andUses, 76—101.CABInternational,Oxfordshire,UK.
Sharma, S. K., M. R. Knox, and T. H. N. Ellis, 1996: AFLP analysis
of the diversity and phylogeny of Lens and its comparison with
RAPD analysis. Theor. Appl. Genet. 93, 751—758.
Shi, A., P. Chen, D. Li, C. Zheng, B. Zhang, and A. Hou, 2009:
Pyramiding multiple genes for resistance to soybean mosaic virus in
soybean using molecular markers. Mol. Breed. 23, 113—124.
Simioniuc, D., R. Uptmoor, W. Friedt, and F. Ordon, 2002: Genetic
diversity and relationships among pea cultivars revealed by RAPDs
and AFLPs. Plant Breed. 121, 429—435.
Singh, O., and S. Kumar, 1994: Phenotypic stability of yield and
related characters in desi gram (Cicer arietinum). Indian J. Agric.
Sci. 64, 815—820.
Singh, R. M., and R. Raina, 2005: Genetics and cytogenetics of
pigeonpea. In: M. Ali, and S. Kumar (eds), Advances in Pigeon Pea
Research, 39—66. IIPR, Kanpur, India.
Singh, K. B., M. Omar, M. C. Saxena, and C. Johansen, 1997:
Screening for drought resistance in spring chickpea in the Mediter-
ranean region. J. Agron. Crop Sci. 178, 227—235.
Skiba, B., R. Ford, and E. C. K. Pang, 2004: Construction of a linkage
map based on a Lathyrus sativus backcross population and
preliminary investigation of QTLs associated with resistance to
Ascochyta blight. Theor. Appl. Genet. 109, 1726—1735.
Smykal, P., M. Hybl, J. Corander, J. Jarkovsky, A. J. Flavell, and
M. Griga, 2008: Genetic diversity and population structure of pea
(Pisum sativum L.) varieties derived from combined retrotransposon,
microsatellite and morphological marker analysis. Theor. Appl.
Genet. 117, 413—424.
Solanki, R. K., S. Gupta, J. Kumar, and S. Kumar, 2010: Charac-
terization and evaluation of Indian lentil germplasm for useful traits.
IFLRC V & AEP-VII, April 26–30, 2010, Anaalya, Turkey.
Sonnante, G., and D. Pignone, 2007: The major Italian landraces of
lentil (Lens culinaris Medik.): their molecular diversity and possible
origin, Genet. Resour. Crop Evol. 54, 1023—1031.
Souframanien, J., and T. Gopalkrishna, 2004: A comparative analysis
of genetic diversity in blackgram genotypes using RAPD and ISSR
markers. Theor. Appl. Genet. 109, 1687—1693.
Spurthi, N. N., H. Zhu, N. Varghese, S. Datta, H. K. Choi, R. Horres,
R. Jungling, J. Singh, P. B. K. Kishor, S. Sivaramakrishnan, D. A.
Hoisington, G. Kahl, P. Winter, D. R. Cook, and R. K. Varshney,
2010: Integration of novel SSR and gene-based SNP marker loci in
the chickpea genetic map and establishment of new anchor points
with Medicago truncatula genome. Theor. Appl. Genet. 120,
1415—1441.
Stavely, J. R., 2000: Pyramiding rust and viral resistance genes using
traditional and marker techniques in common bean. Annu. Rev.
Rep. Bean Improv. Coop. 43, 1—3.
Stoddard, F. L., C. Balko, W. Erskine, H. R. Khan, W. Link, and A.
Sarker, 2006: Screening techniques and sources of resistance to abiotic
stresses in cool-season food legumes. Euphytica 147, 167—186.
Syvanen, A. C., 2005: Toward genome-wide SNP genotyping. Nat.
Genet. 37, S5—S10.
Tangphatsornruang, S., P. Somta, P. Uthaipaisanwong, J. Chanpra-
sert, D. Sangsrakru, W. Seehalak, W. Sommanas, S. Tragoonrung,
and P. Srinives, 2009: Characterization of microsatellites and gene
contents from genome shotgun sequences of mungbean (Vigna
radiata (L.) Wilczek). BMC Plant Biol. 9, 137—148.
Taran, B., T. E. Michaels, and K. P. Pauls, 2001: Mapping genetic
factors affecting the reaction to Xanthomous axonopodis pv. phaseoli
in Phaseolus vulgaris L. under field conditions. Genome 44,
1045—1056.
Terzopoulos, P. J., and P. J. Bebeli, 2008: Genetic diversity analysis of
Mediterranean faba bean (Vicia faba L.) with ISSR markers. Field
Crops Res. 115, 270—278.
Toklu, F., T. Karako, E. Hakl, T. Bicer, A. Brandolini, B. Kilian, and
H. Ozkan, 2009: Genetic variation among lentil (Lens culinaris
Medik) landraces from Southeast Turkey. Plant Breed. 128, 178.
Torres, A. M., C. M. Avila, N. Gutierrez, C. Palomino, M. T. Moreno,
and J. I. Cubero, 2010: Marker-assisted selection in faba bean (Vicia
faba L.). Field Crops Research 115, 243—252.
Tosti, N., and V. Negri, 2002: Efficiency of three PCR-based markers
in assessing genetic variation among cowpea (Vigna unguiculata
subsp. unguiculata) landraces. Genome 45, 268—275.
Tullu, A., L. Buchwaldt, T. Warkentin, B. Taran, and A. Vandenberg,
2003: Genetics of resistance to anthracnose and identification of
AFLP and RAPD markers linked to the resistance gene in PI320937
germplasm of lentil (Lens culinaris Medikus). Theor. Appl. Genet.
106, 428—434.
Tullu, A., B. Taran, T. Warkentin, and A. Vandenberg, 2008:
Construction of an intraspecific linkage map and QTL Analysis
for earliness and plant height in lentil. Crop Sci. 48, 2254—2264.
Udupa, S. M., and M. Baum, 2003: Genetic dissection of pathotype-
specific resistance to ascochyta blight disease in chickpea (Cicer
arietinum L.) using microsatellite markers. Theor. Appl. Genet. 106,
1196—1202.
Upadhyaya, H. D., P. J. Bramel, and S. Singh, 2001: Development of a
chickpea core subset using geographical distribution and quantita-
tive traits. Crop Sci. 41, 206—210.
Upadhyaya, H. D., S. L. Dwivedi, M. Baum, R. K. Varshney,
S. Mupa, C. L. L. Gowda, D. Hoisington, and S. Singh, 2008:
Genetic structure, diversity, and allelic richness in composite
collection and reference set in chickpea (Cicer arietinum L.). BMC
Plant Biol. 8, 106—127.
Upadhyaya, H. D., J. Kashiwagi, R. K. Varshney, P. M. Gaur,
K. B. Saxena, L. Krishnamurthy, C. L. L. Gowda, R. P. S. Pundir,
S. K. Chaturvedi, P. S. Basu, and I. P. Singh, 2010: Phenotyping
chickpeas and pigeonpeas for adaption to drought. In: J. M. Ribaut,
and P. Monneveux (eds), Drought Phenotyping in Crops: from
Theory to Practice, 343—354. CIMMYT/Generation Challenge
Programme, Mexico City, Mexico.
Varshney, R. K. 2007: Chickpea genomics consortium on drought
tolerance. J. SAT Agril. Res. 3, 1 (http://dx.doi.org/10.3914/ICRI-
SAT.0264).
Varshney, R. K., A. Graner, and M. E. Sorrells, 2005: Genic
microsatellite markers in plants: features and applications. Trends
Biotechnol. 23, 48—55.
Varshney, R. K., T. J. Close, N. K. Singh, D. A. Hoisington, and D.
R. Cook, 2009: Orphan legume crops enter the genomics era! Curr.
Opin. Plant. Biol. 12, 1—9.
Varshney, R. K., R. V. Penmetsa, S. Dutta, P. L. Kulwal, R. K.
Saxena, S. Datta, T. R. Sharma, B. Rosen, N. Carrasquilla-Garcia,
312 J . Kum ar , A . K . Choud hary , R . K . Solank i et al.

A. D. Farmer, A. Dubey, K. B. Saxena, J. Gao, B. Fakrudin, M. N.
Singh, B. P. Singh, K. B. Wanjari, M. Yuan, R. K. Srivastava, A.
Kilian, H. D. Upadhyaya, N. Mallikarjuna, C. D. Town, G. E.
Bruening, G. He, G. D. May, R. McCombie, S. A. Jackson, N. K.
Singh, and D. R. Cook, 2010a: Pigeon pea genomics initiative (PGI):
an international effort to improve crop productivity of pigeon pea
(Cajanus cajan L.). Mol. Breed. 26, 393—408.
Varshney, R. K., T. Mahendar, G. D. May, and S. A. Jackson,
2010b: Legume genomics and breeding. Plant Breed. Rev. 33,
257—304.
Varshney, R. K., L. Pazhamala, J. Kashiwagi, P. M. Gaur, L. Krish-
namurthy, and D. A. Hoisington, 2010c: Genomics and physiolog-
ical approaches for root trait breeding to improve drought tolerance
in chickpea (Cicer arietinum L.). In: A. D. de Oliveira, and R. K.
Varshney (eds.), Root Genomics, 233—250. Springer-Verlag,
Dordrecht, the Netherlands.
Vepa, S. S., 2003: Impact of globalisation on food consumption of
urban India. In: FAO Technical Workshop on Globalization of
Food Systems: Impacts on Food Security and Nutrition. 8–10
October 2003, Rome, Italy.
Vir, R., K. V. Bhat, and S. Lakhanpaul, 2009: Analysis of population
substructure, genetic differentiation and phylogenetic relationships
among selected Asiatic Vigna Savi species. Genet. Resour. Crop
Evol. 56, 783—795.
Wang, J., S. C. Chapman, D. G. Bonnett, G. J. Rebetzke, and
J. Crouch, 2007: Application of population genetic theory and
simulation models to efficiently pyramid multiple genes via marker-
assisted selection. Crop Sci. 47, 582—588.
Weeden, N. F., 2007: Genetic changes accompanying the domesti-
cation of Pisum sativum L.: is there a common genetic basis to
the �domestication syndrome� for legumes? Ann. Bot. 100,
1017—1025.
West, M. A. L., K. Kim, D. J. Kliebenstein, H. van Leeuwen, R. W.
Michelmore, R. W. Doerge, and D. A. St. Clair, 2007: Global eQTL
mapping reveals the complex genetic architecture of transcript-level
variation in Arabidopsis. Genetics 175, 1441—1450.
Winter, P., A. M. Benko-Iseppon, B. Huttel, M. Ratnaparkhe,
A. Tullu, G. Sonnante, T. Pfaff, M. Tekeoglu, D. Santra, V. J.
Sant, P. N. Rajesh, G. Kahl, and F. J. Muehlbauer, 2000: A linkage
map of the chickpea (Cicer arietinum L.) genome based on
recombinant inbred lines from C. arietinum · C. reticulatum cross:
localization of resistance genes for fusarium wilt race 4 and 5. Theor.
Appl. Genet. 101, 115—1163.
van de Wouw, M., T. van Hintum, C. Kik, R. van Treuren, and
B. Visser, 2010: Genetic diversity trends in twentieth century crop
cultivars: a meta analysis. Theor. Appl. Genet. 120, 1241—1252.
Xiong, L. Z., K. D. Liu, X. K. Dai, C. G. Xu, and Q. Zhang, 1999:
Identification of genetic factors controlling domestication-related
traits of rice using an F2 population of a cross between Oryza sativa
and O. rufipogon. Theor. Appl. Genet. 98, 243—251.
Yang, H., M. Shanker, B. J. Buirchell, M. W. Sweetingham,
C. Caminero, and P. M. C Smith, 2002: Development of molecular
markers using AFLP linked to a gene conferring resistance to
Diaporthe toxica in narrow-leafed lupin (Lupinus angustifolius L.).
Theor. Appl. Genet. 105, 262—270.
Yang, H., J. G. Boerama, B. J. Buirchell, and M. W. Sweetingham,
2004: Development and implementation of a sequence-specific PCR
marker linked to a gene conferring resistance to anthracnose disease
in narrow-leafed lupin (Lupinus angustifolius L.). Mol. Breed. 14,
145—151.
Yang,S.Y.,W.Pang,G.Ash, J.Harper, J.Carling,P.Wenzl,E.Huttner,
X. X. Zong, and A. Kilian, 2006: Low level of genetic diversity in
cultivated pigeon pea compared to its wild relatives is revealed by
diversity arrays technology. Theor. Appl. Genet. 113, 585—595.
Ye, G., and K. F. Smith, 2008a: Marker-assisted gene pyramiding for
inbred line development: basic principles and practical guidelines.
Int. J. Plant Breed. 2, 1—10.
Ye, G., and K. F. Smith, 2008b: Marker-assisted gene pyramiding for
inbred line development: practical applications. Int. J. Plant Breed.
2, 11—22.
Ye, G., and K. F. Smith, 2009: Marker-assisted gene pyramiding for
cultivar development. Plant. Breed. Rev. 33, 219—256.
Young, N. D., and M. Udvardi, 2009: TranslatingMedicago truncatula
genomics to crop legumes. Curr. Opin. Plant Biol. 12, 193—201.
Yu, J., G. Pressoir, W. H. Briggs, I. V. Bi, M. Yamasaki, J. F.
Doebley, M. D. McMullen, B. S. Gaut, D. M. Nielsen, J. B.
Holland, S. Kresovich, and E. S. Buckler, 2006: A unified mixed-
model method for association mapping that accounts for multiple
levels of relatedness. Nat. Genet. 38, 203—208.
Yu, J., J. B. Holland, M. D. McMullen, and E. S. Buckler, 2008:
Genetic design and statistical power of nested association mapping
in maize. Genetics 178, 539—551.
Zeid, M., C. C. Schon, and W. Link, 2003: Genetic diversity in recent
elite faba bean lines using AFLP markers. Theor. Appl. Genet. 107,
1304—1314.
Zhu, C., M. Gore, E. S. Buckler, and J. Yu, 2008: Status and prospects
of association mapping in plants. Plant Genome 1, 5—20.
Zong, X. X., R. Redden, Q. C. Liu, S. Wang, J. Guan, J. Liu, Y. Xu,
X. Liu, J. Gu, L. Yan, P. Ades, and R. Ford, 2009: Analysis of a
diverse global Pisum sp. collection and comparison to a Chinese
local P. sativum collection with microsatellite markers. Theor. Appl.
Genet. 118, 193—204.
Towards marker-assisted selection in pulses 313