Loci controlling lymphocyte production of interferon gamma after alloantigen stimulation in vitro...
11
ORIGINAL ARTICLE Loci controlling lymphocyte production of interferon c after alloantigen stimulation in vitro and their co-localization with genes controlling lymphocyte infiltration of tumors and tumor susceptibility Marie Lipoldova ´ Helena Havelkova ´ Jana Badalova ´ Jarmila Vojtı ´s ˇkova ´ Lei Quan Magdale ´na Krulova ´ Yahya Sohrabi Alphons P. Stassen Peter Demant Received: 5 February 2009 / Accepted: 2 July 2009 / Published online: 5 August 2009 Ó The Author(s) 2009. This article is published with open access at Springerlink.com Abstract Low infiltration of lymphocytes into cancers is associated with poor prognosis, but the reasons why some patients exhibit a low and others a high infiltration of tumors are unknown. Previously we mapped four loci (Lynf1–Lynf4) controlling lymphocyte infiltration of mouse lung tumors. These loci do not encode any of the molecules that are involved in traffic of lymphocytes. Here we report a genetic relationship between these loci and the control of production of IFNc in allogeneic mixed lymphocyte cultures (MLC). We found that IFNc production by lymphocytes of O20/A mice is lower than by lymphocytes of OcB-9/Dem mice (both H2 pz ) stimulated in MLC by irradiated splenocytes of C57BL/10SnPh (H2 b ) or BALB/ cHeA (H2 d ) mice, or by ConA. IFNc production in MLCs of individual (O20 9 OcB-9)F 2 mice stimulated by irradiated C57BL/10 splenocytes and genotyped for microsatellite markers revealed four IFNc-controlling loci (Cypr4-Cypr7), each of which is closely linked with one of the four Lynf loci and with a cluster of susceptibility genes for different tumors. This suggests that inherited differences in certain lympho- cyte responses may modify their propensity to infiltrate tumors and their capacity to affect tumor growth. Keywords Genetic control of interferon c production Gene mapping Lymphocyte infiltration of tumors Tumor susceptibility Abbreviations Cypr Cytokine production Lynf Lymphocyte infiltration MLC Mixed lymphocyte culture MLR Mixed lymphocyte reaction QTL Quantitative trait locus Introduction Interaction between the immune system and cancer is one of the most important determinants of cancer growth, progression, and metastasis. The interconnected processes of innate and adaptive immunity co-determine the devel- opment of cancer from the very beginning, when acute inflammation tends to suppress and chronic inflammation to promote carcinogenesis [1]. The interaction of adaptive immunity with cancer is less clear. It is a powerful agent in rejection of virally induced tumors [2], but its effects on spontaneous and carcinogen-induced tumors are still subject of discussion [3, 4]. Recently, however, in a M. Lipoldova ´(&) H. Havelkova ´ J. Badalova ´ J. Vojtı ´s ˇkova ´ M. Krulova ´ Y. Sohrabi Department of Molecular and Cellular Immunology, Institute of Molecular Genetics, Academy of Sciences of the Czech Republic, Vı ´den ˇska ´ 1083, 14220 Prague 4, Czech Republic e-mail: [email protected] Present Address: J. Badalova ´ Institute of Care for Mother and Child, Podolske Nabrezi 157, 14700 Prague 4, Czech Republic L. Quan P. Demant Department of Molecular and Cellular Biology, Roswell Park Cancer Institute, Buffalo, NY 14263, USA A. P. Stassen Department of Genetics and Cell Biology, Maastricht University, Maastricht, The Netherlands 123 Cancer Immunol Immunother (2010) 59:203–213 DOI 10.1007/s00262-009-0739-y
-
Upload
insitutemoleculargenetics -
Category
Documents
-
view
0 -
download
0
Transcript of Loci controlling lymphocyte production of interferon gamma after alloantigen stimulation in vitro...

ORIGINAL ARTICLE
Loci controlling lymphocyte production of interferon cafter alloantigen stimulation in vitro and their co-localizationwith genes controlling lymphocyte infiltration of tumorsand tumor susceptibility
Marie Lipoldova Æ Helena Havelkova Æ Jana Badalova Æ Jarmila Vojtıskova ÆLei Quan Æ Magdalena Krulova Æ Yahya Sohrabi Æ Alphons P. Stassen ÆPeter Demant
Received: 5 February 2009 / Accepted: 2 July 2009 / Published online: 5 August 2009
� The Author(s) 2009. This article is published with open access at Springerlink.com
Abstract Low infiltration of lymphocytes into cancers is
associated with poor prognosis, but the reasons why some
patients exhibit a low and others a high infiltration of
tumors are unknown. Previously we mapped four loci
(Lynf1–Lynf4) controlling lymphocyte infiltration of mouse
lung tumors. These loci do not encode any of the molecules
that are involved in traffic of lymphocytes. Here we report
a genetic relationship between these loci and the control of
production of IFNc in allogeneic mixed lymphocyte
cultures (MLC). We found that IFNc production by
lymphocytes of O20/A mice is lower than by lymphocytes
of OcB-9/Dem mice (both H2pz) stimulated in MLC by
irradiated splenocytes of C57BL/10SnPh (H2b) or BALB/
cHeA (H2d) mice, or by ConA. IFNc production in MLCs
of individual (O20 9 OcB-9)F2 mice stimulated by irradiated
C57BL/10 splenocytes and genotyped for microsatellite
markers revealed four IFNc-controlling loci (Cypr4-Cypr7),
each of which is closely linked with one of the four Lynf loci
and with a cluster of susceptibility genes for different tumors.
This suggests that inherited differences in certain lympho-
cyte responses may modify their propensity to infiltrate
tumors and their capacity to affect tumor growth.
Keywords Genetic control of interferon c production �Gene mapping � Lymphocyte infiltration of tumors �Tumor susceptibility
Abbreviations
Cypr Cytokine production
Lynf Lymphocyte infiltration
MLC Mixed lymphocyte culture
MLR Mixed lymphocyte reaction
QTL Quantitative trait locus
Introduction
Interaction between the immune system and cancer is one
of the most important determinants of cancer growth,
progression, and metastasis. The interconnected processes
of innate and adaptive immunity co-determine the devel-
opment of cancer from the very beginning, when acute
inflammation tends to suppress and chronic inflammation
to promote carcinogenesis [1]. The interaction of adaptive
immunity with cancer is less clear. It is a powerful agent
in rejection of virally induced tumors [2], but its effects
on spontaneous and carcinogen-induced tumors are still
subject of discussion [3, 4]. Recently, however, in a
M. Lipoldova (&) � H. Havelkova � J. Badalova �J. Vojtıskova � M. Krulova � Y. Sohrabi
Department of Molecular and Cellular Immunology,
Institute of Molecular Genetics, Academy of Sciences
of the Czech Republic, Vıdenska 1083,
14220 Prague 4, Czech Republic
e-mail: [email protected]
Present Address:J. Badalova
Institute of Care for Mother and Child,
Podolske Nabrezi 157, 14700 Prague 4, Czech Republic
L. Quan � P. Demant
Department of Molecular and Cellular Biology,
Roswell Park Cancer Institute, Buffalo, NY 14263, USA
A. P. Stassen
Department of Genetics and Cell Biology,
Maastricht University, Maastricht, The Netherlands
123
Cancer Immunol Immunother (2010) 59:203–213
DOI 10.1007/s00262-009-0739-y
number of human cancers it has been observed that pres-
ence of infiltrating CD3? T lymphocytes is a positive
prognostic factor [5], although in some studies their effect
was mitigated by presence of T regulatory lymphocytes [6].
This indicated a positive role of CD3? T lymphocytes in
suppression of cancer. However, it is not known why
infiltrating T lymphocytes are abundant in cancers of some
patients but scarce in others. Although in the past decade, a
large progress has been made in unravelling the sequence
of molecular steps that participate in the passage of lym-
phocytes from blood circulation into tumor, and more than
60 different molecules (or closely related members of the
same family) that facilitate and mediate lymphocyte traffic
were identified [7], differences in structure or expression of
these molecules were not yet correlated with individual
propensity to tumor infiltration.
To the contrary, a new insight into the regulation of
lymphocyte infiltration in tumors has been provided by the
observations that the presence of infiltrating lymphocytes
in mouse lung tumors is pronounced in some strains but
virtually absent in others [8] and that this difference is
controlled by four chromosomal loci designated Lynf1–
Lynf4 (Lynf = Lymphocyte infiltration) that determine the
presence of intra-tumoral infiltrating lymphocytes [9] in a
cross between strains O20/A and OcB-9/Dem. Surpris-
ingly, none of the four Lynf loci (Lynf1—chromosome 4;
Lynf2—chromosome 8; Lynf3 and Lynf4—chromosome 6)
encoded any of set of[60 molecules that were reported to
participate in migration of lymphocytes into tumors.
Therefore, other processes than direct molecular interac-
tions of lymphocyte and surrounding tissue may be the
primary determinants of individual’s propensity to lym-
phocyte infiltration of tumors.
Our previous data showed that genetic polymorphisms
of the intensity of nonspecific inflammation-related activity
of immunocytes are linked with cancer susceptibility
genes. We defined previously two loci, Marif1 controlling
production of IL-12, TNFa and iNOS, and Marif2 con-
trolling production of TNFa and IL-12, by in vitro stimu-
lated bone marrow-derived macrophages [10], and two
loci, Cinda3 and Cinda5, controlling in vitro proliferative
response of lymphocytes to cytokines IL-2 and IL-4 [11].
Marif1 and Cinda3 are linked to each other and Cinda3 is
closely linked to Lynf1 as well as the mouse lung cancer
susceptibility loci Sluc6/Sluc21 on chromosome 4. Marif2
and Cinda5 are linked to each other and to Lynf2 as well as
to the mouse lung cancer susceptibility locus Sluc20 on
chromosome 8. This suggests a possible functional con-
nection between activation of immunocytes and capacity of
tumor infiltration.
In the present study, we analysed the genetic control of
production of another cytokine, IFNc, during in vitro
reaction to major histocompatibility complex (MHC) allo-
antigens. The differences in the MHC antigens induce the
strongest responses [12]. But genetic disparity in minor
alloantigens also modifies the alloresponse. Earlier studies
found that some strong MLC-stimulations (Mls) antigens
are coded by mouse Mtv (mammary tumor virus) [13]; later
studies revealed a broad spectrum of additional minor
human antigens [14]. Intensity of MLC-response to allo-
antigens is determined by two major factors—the genetic
disparity between the responding and stimulating cells and
the genetically defined intrinsic capacity of the responding
cells to react to the stimulus [15–17].
Responder cells react to stimulator cells by proliferation
and by cytokine production. We have studied the genetic
basis of these two responses, using the recombinant congenic
(RC) strains, which were developed for analysis of multi-
genically controlled biological processes [18]. A series of
RC strains is derived from two parental inbred strains: a
‘‘background’’ strain and a ‘‘donor’’ strain. Each of these RC
strains contains a different subset of about 12.5% of genes
from the parental donor strain and the remaining approxi-
mately 87.5% of background strain genes. The BALB/
cHeA-c-STS/A (CcS) and O20/A-c-B10.O20/Dem (OcB)
series of strains were used previously for analysis of allo-
antigen response. The strain distribution pattern of magni-
tude of proliferative response in MLR of individual RC
strains to stimulator cells of four different strains was almost
identical, indicating that differences in responsiveness,
rather than the alloantigenic difference itself, determine the
magnitude of the response, and that the responsiveness to
different MHC alloantigens is largely controlled by the same
genes [19, 20]. We have mapped previously two of these
responsiveness genes, Alan1 and Alan2 (Alloantigen
response 1, 2) located on chromosomes 17 and 4, respec-
tively, that control differences in proliferative response to
several alloantigens in CcS and OcB RC strains [16, 17]. We
have also shown that in the individual RCS the levels of
proliferation and IL-2 production in MLR are not correlated,
and therefore these two responses are under a different
genetic control [19].
In the present work we defined four loci, Cypr4–Cypr7
(Cypr = Cytokine production), that control IFNc production
by responder cells in MLR. IFNc plays important role in
immunity against infection, and it has been associated with a
number of autoinflammatory and autoimmune diseases
(reviewed in [21]). IFNc has also multiple and diverse essential
functions in immune response to cancer [22–25]. For that rea-
son, genetics of capacity of IFNc production may be important
for a variety of biological reactions. Here we show that control
of IFNc production is genetically linked to and possibly
responsible for the control of intensity of lymphocyte infiltra-
tion in tumors and control of tumor growth and progression.
204 Cancer Immunol Immunother (2010) 59:203–213
123
Materials and methods
Mice
Males and females of strains O20/A (abbrev. O20), OcB-9/
Dem (abbrev. OcB-9) (both strains have the MHC haplo-
type H2pz) and F2 hybrids between O20 and OcB-9 came
from P. Demant’s breeding colony. The haplotype H2pz is
described in [26]. The genetic composition of strain OcB-9
has been described in detail by Stassen and co-workers
[27]. When used for these experiments strain OcB-9 passed
more than 31 generations of brother–sister mating and was
highly homozygous. C57BL/10SnPh (abbrev. B10) (H2b)
mice were from the Institute of Molecular Genetics (Pra-
gue). As the strains O20 and OcB-9 are MHC identical, all
mixed lymphocyte reactions tested in this paper involved
the same MHC incompatibility (H2pz–H2b).
Mixed lymphocyte culture
Spleen cells of O20, OcB-9, and of individual F2 hybrid
mice (6 9 105 cells per well) were mixed with 8 9 105
irradiated (3000 R) C57BL/10 stimulator cells in 800 ll in
24-well tissue culture plates in complete RPMI 1640
medium, respectively (Nunc, Roskilde, Denmark) [28].
Supernatants were removed after 96 h incubation period
and stored at -70�C before use. Each day in a separate
experiment 20 F2 mice and appropriate controls (O20 and
OcB-9 mice) were tested. In the experiments, comparing
IFNc, IL-2, and IL-4 production by stimulated lymphocytes
of strains O20 and OcB-9, supernatants were removed also
48 and 72 h after stimulation.
Concanavalin A-stimulated cultures
Spleen cells (4 9 105 cells per well) were incubated in
800 ll in 24-well tissue culture plates in complete RPMI
1640 medium with 2.5 lg/ml ConA. Supernatants were
collected after 24, 48, or 72 h of incubation and assayed for
IFNc presence.
Estimation of cytokine levels
Supernatants from MLR cultures were assayed for IFNc,
IL-2, and IL-4 presence using the primary and secondary
mAbs (R46A2, XMG1.2; JES6-1A11, JES6-5H4; 11B11,
BVD6-24G2) and standards (mIFNc, mIL-2, and mIL-4)
from BD Bioscience, San Jose, CA. Similarly, superna-
tants from ConA stimulated cultures were assayed for
IFNc. The ELISA was performed using the conditions
recommended by BD Bioscience. In brief, a 96-well flat-
bottom plate (Costar, Cambridge, MA) was coated with
primary mAb at a concentration of 1 lg/ml in 0.1 M
NaHCO3 pH 8.2 and incubated overnight at 4�C. The
plates were washed with PBS-Tween (Costar, Corning,
NY) and incubated for 2 h with 200 ll of PBS 8% BSA.
After washing, aliquots of supernatants were added to
duplicate wells and incubated overnight at 4�C. Plates
were washed again and biotin-labeled secondary mAb
was added for 45 min. Plates were washed, followed by
addition of horseradish peroxidase streptavidin (Vector
Laboratories, Burlingame, CA). 2,20-azino-bis(3-ethyl-
benzthiazoline-6-sulfonic acid) (Sigma-Aldrich, St. Louis,
MO) and peroxide were used as chromogen. Color reac-
tion was stopped by sodium dodecyl sulfate (SDS) in N,N-
dimethylformamide and plates were read at OD 405 nm
and the IFNc levels were estimated by the ELISA reader
Tecan and the curve fitter program KIM-E (Schoeller
Pharma, Prague, Czech Republic) using least square
nonlinear regression analysis. Sensitivity of detection of
IFNc, IL-2, and IL-4 levels in supernatants was 32, 4, and
15 pg/ml, respectively.
Genotyping of microsatellites by PCR
DNA was isolated from tails using a standard proteinase
procedure. The strain OcB-9 differs from O20 by carrying
B10.O20-derived segments at 10 chromosomes [27]. These
differential segments were typed in the F2 hybrid mice using
15 microsatellite markers: D2Mit7, D2Mit56; D4Mit54;
D6Mit31, D6Mit52; D7Mit12, D7Nds2; D8Mit3, D8Mit65;
D10Mit12; D11Mit15; D16Mit130; D18Mit17; D19Mit3,
D19Mit63. These markers were selected because they cover
optimally the chromosomal segments at which the OcB-9
strain has genetic material from the B10.O20 strain. They
carry different alleles in the two parental strains, the O20
allele (designated o), and the B10.O20 allele (designated b).
PCR genotyping was performed as described [29]. Briefly,
amplification was performed with a MJ Research Thermal
Cycler PTC 100 Model 96 (MJ Research, Watertown, MA)
in a volume of 10 ll with 20 ng DNA, 0.23 lM of forward
primer [c-32P]ATP end-labeled with T4 polynucleotide
kinase (New England Biolabs, Schwalbach, Germany),
0.23 lM of reverse primer, 200 lM of each dNTP and 0.04 u
Taq polymerase (GIBCO, Grand Island, NY) in a 96-well U-
bottom microtiter plate (FALCON, Oxford, UK) with 1 cycle
of 3 min at 94�C and 30 cycles of 30 s at 94�C, 1 min at 55�C
and 1 min at 72�C and 1 cycle of 1 min at 55�C, 3 min at
72�C, and 1 min at 23�C. Each PCR product was mixed with
30 ll of loading buffer and electrophoresed in 6% acryl-
amide gels for 2–2.5 h at 50 W. Gels were wrapped in Saran
Wrap (Dow Chemicals Co., Midland, MI) and exposed to
X-ray film X-OMAT AR (Kodak, Weesp, The Netherlands)
for 1.5–24 h at -70�C.
Cancer Immunol Immunother (2010) 59:203–213 205
123
Statistical analysis
The role of genetic factors in IFNc production in MLR
response was examined by analysis of variance
[ANOVA, PROC GLM statement of the SAS 8.2 for
Windows (SAS Institute, Cary, NC)]. The effect of each
marker, sex, and experiment on IFNc level in superna-
tants was tested. Each individual marker and its inter-
actions with other markers and sex or experiment were
subjected to ANOVA. A backward elimination procedure
[30] was followed wherein the interaction of marker (or
interaction) bearing the highest P value (if P [ 0.05)
was eliminated first. The markers and interactions with P
value smaller than 0.05 were pooled for the next round
of ANOVA. The backward elimination procedure was
repeated till the final set of significant markers and
interactions was obtained. The P values (Pc = aT) were
corrected according to Lander and Kruglyak [31] using
the formula:
aT� � C þ 2qGhðTÞ½ �aT
with G = 2 M (the length of the segregating part of the
genome: 12.5% of 16 M); C = 10 (number of chromo-
somes segregating in this cross); q = 1.5 for F2 hybrids;
and h(T) = the observed statistics (F ratio).
IFNc, IL-2, and IL-4 production in MLR by cells of
responder strains O20 and OcB-9 was compared by Mann–
Whitney U test (STATISTICA for Windows 5.0, StatSoft,
Inc., Tulsa, OK).
Results
Strain differences in proliferation and production
of cytokines after stimulation with alloantigen or ConA
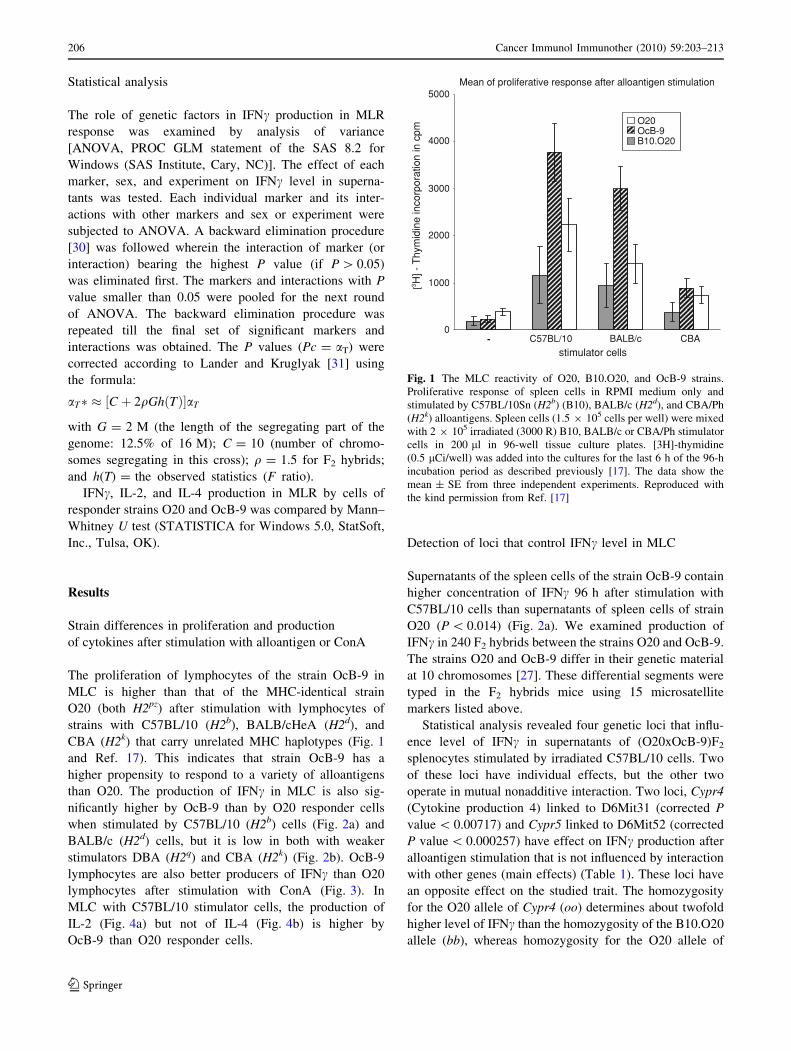
The proliferation of lymphocytes of the strain OcB-9 in
MLC is higher than that of the MHC-identical strain
O20 (both H2pz) after stimulation with lymphocytes of
strains with C57BL/10 (H2b), BALB/cHeA (H2d), and
CBA (H2k) that carry unrelated MHC haplotypes (Fig. 1
and Ref. 17). This indicates that strain OcB-9 has a
higher propensity to respond to a variety of alloantigens
than O20. The production of IFNc in MLC is also sig-
nificantly higher by OcB-9 than by O20 responder cells
when stimulated by C57BL/10 (H2b) cells (Fig. 2a) and
BALB/c (H2d) cells, but it is low in both with weaker
stimulators DBA (H2q) and CBA (H2k) (Fig. 2b). OcB-9
lymphocytes are also better producers of IFNc than O20
lymphocytes after stimulation with ConA (Fig. 3). In
MLC with C57BL/10 stimulator cells, the production of
IL-2 (Fig. 4a) but not of IL-4 (Fig. 4b) is higher by
OcB-9 than O20 responder cells.
Detection of loci that control IFNc level in MLC
Supernatants of the spleen cells of the strain OcB-9 contain
higher concentration of IFNc 96 h after stimulation with
C57BL/10 cells than supernatants of spleen cells of strain
O20 (P \ 0.014) (Fig. 2a). We examined production of
IFNc in 240 F2 hybrids between the strains O20 and OcB-9.
The strains O20 and OcB-9 differ in their genetic material
at 10 chromosomes [27]. These differential segments were
typed in the F2 hybrids mice using 15 microsatellite
markers listed above.
Statistical analysis revealed four genetic loci that influ-
ence level of IFNc in supernatants of (O20xOcB-9)F2
splenocytes stimulated by irradiated C57BL/10 cells. Two
of these loci have individual effects, but the other two
operate in mutual nonadditive interaction. Two loci, Cypr4
(Cytokine production 4) linked to D6Mit31 (corrected P
value \ 0.00717) and Cypr5 linked to D6Mit52 (corrected
P value \ 0.000257) have effect on IFNc production after
alloantigen stimulation that is not influenced by interaction
with other genes (main effects) (Table 1). These loci have
an opposite effect on the studied trait. The homozygosity
for the O20 allele of Cypr4 (oo) determines about twofold
higher level of IFNc than the homozygosity of the B10.O20
allele (bb), whereas homozygosity for the O20 allele of
0
1000
2000
3000
4000
5000
- C57BL/10 BALB/c CBA
Mean of proliferative response after alloantigen stimulation
[3 H] -
Thy
mid
ine
inco
rpor
atio
n in
cpm
O20 OcB-9 B10.O20
stimulator cells
Fig. 1 The MLC reactivity of O20, B10.O20, and OcB-9 strains.
Proliferative response of spleen cells in RPMI medium only and
stimulated by C57BL/10Sn (H2b) (B10), BALB/c (H2d), and CBA/Ph
(H2k) alloantigens. Spleen cells (1.5 9 105 cells per well) were mixed
with 2 9 105 irradiated (3000 R) B10, BALB/c or CBA/Ph stimulator
cells in 200 ll in 96-well tissue culture plates. [3H]-thymidine
(0.5 lCi/well) was added into the cultures for the last 6 h of the 96-h
incubation period as described previously [17]. The data show the
mean ± SE from three independent experiments. Reproduced with
the kind permission from Ref. [17]
206 Cancer Immunol Immunother (2010) 59:203–213
123

Cypr5 is associated with about two-and-half fold decrease
level of this cytokine than the homozygosity of the
B10.O20 allele. Influence of the experimental group was
evident (P \ 1.75 9 10-24), but no significant interaction
between experimental group and marker was observed.
Cypr6 influences IFNc level in interaction with Cypr7
(corrected P \ 0.00111). F2 mice with homozygous
B10.O20 (bb) alleles at Cypr6 and O20 (oo) alleles at
Cypr7 or homozygous for B10.O20 allele at Cypr7 and
homozygous for O20 alleles in Cypr6 produce approxi-
mately twice higher IFNc level in supernatants in alloan-
tigen-stimulated spleen cells in comparison with other
combinations of Cypr6 and Cypr7 O20 and B10.O20
alleles (Table 2). The levels of IFNc seem to be negatively
correlated with the intensity of lymphocyte infiltration,
both in the strains and in comparable genotypes. The
production of IFNc is higher in the strain OcB-9 than O20,
while in O20 mice the numbers of intratumoral lympho-
cytes are higher than in OcB-9 [8]. A similar negative
correlation is seen also at locus level: IFNc levels at the
three Cypr4 genotypes are negatively correlated with
lymphocyte infiltration scores at the corresponding
Mean of IFN production after alloantigen stimulationby C57BL/10 splenocytes
time
Con
cent
ratio
n of
IFN
(ng
/ml)
48h 72h 96h0
1
2
3
4
5
6
7
8
9 *
b
a
Mean of IFNγ production after alloantigen stimulation
Con
cent
ratio
n of
IFN
γ (n
g/m
l)
0
1
2
3
4
5
6
7
8
9
O20 OcB-9
C57BL/10 BALB/c DBA/1 CBA
*
*
stimulator cells
O20 OcB-9
72h 96h72h 96h72h 96h72h 96h
Fig. 2 a Comparison of concentration of IFNc in supernatants of the
spleen cells of the strains OcB-9 and O20 after alloantigen
stimulation. Spleen cells (6 9 105 cells per well) were mixed with
8 9 105 irradiated (3000 R) C57BL/10 stimulator cells in 800 ll in
24-well tissue culture plates. Cell supernatants were analyzed 48, 72,
and 96 h after stimulation. Data summarize the result of 13
independent experiments. Both female and male mice were used in
our analysis, but no influence of sex on strain difference was
observed. The columns show the means ± SE of IFNc concentration
in ng/ml. Filled square: OcB-9, unfilled square: O20. b Comparison
of concentration of IFNc in supernatants of the spleen cells of the
strains OcB-9 and O20 after stimulation by C57BL/10Sn (H2b),
BALB/c (H2d), CBA (H2k), and DBA/1 (H2q) alloantigens. Spleen
cells (6 9 105 cells per well) were mixed with 8 9 105 irradiated
(3000 R) C57BL/10Sn, BALB/c, CBA, or DBA/1 stimulator cells in
800 ll in 24-well tissue culture plates. Cell supernatants were
analysed 72 and 96 h after stimulation. Data summarize the result of
13 independent experiments
Mean of IFN production after 2.5 g/ml ConA stimulation
time C
once
ntra
tion
of IF
N (
ng/m
l)
O20 OcB-9
24h 72h0
5
10
15
20
25
30
35
*
*
48h
Fig. 3 Comparison of concentration of IFNc in supernatants of the
spleen cells of the strains OcB-9 and O20 after stimulation with
2.5 lg/ml ConA. To test IFNc concentration, 800 ll of spleen cells
(4 9 105 cells per well) were incubated in 24-well tissue culture
plates in complete RPMI 1640 medium with 2.5 lg/ml ConA. After
24, 48, or 72 h of incubation supernatants were collected and assayed
for IFNc presence. The columns show the means ± SE of IFNcconcentration in ng/ml. Data summarize the result of four independent
experiments. Square: OcB-9, unfilled square: O20
Cancer Immunol Immunother (2010) 59:203–213 207
123

genotypes [9] of the co-localizing Lynf4 locus: oo: IFNc—
7.74 ng/ml, infiltration score (IS)—0.04; ob: IFNc—
5.77 ng/ml, (IS)—0.39; bb: IFNc—3.78 ng/ml, (IS)—0.34.
Allelic correlations within the other Cypr-Lynf could not be
assessed, because these loci were defined by inter-locus
interactions.
Discussion
In the present study, we demonstrate genetic linkage
between in vitro production of IFNc and in vivo lympho-
cyte infiltration of tumors. Previously, we have shown that
responder’s genotype strongly influences various in vitro
responses of lymphocytes to stimulation by allogeneic cells
[16, 17], anti-CD3 antibodies [28], mitogens [32], and
cytokines [11, 28]. Importantly, in MLC these differences
in response were obvious in spite of identical MHC
incompatibility. We have shown that these differences are
controlled by several loci with quantitative additive effects,
and that different components of a response, for example
proliferation or production of different cytokines, are
controlled by different genes. We observed that two genetic
loci that control activation of macrophages [10] and lym-
phocytes [11] co-localize with the genes that control sus-
ceptibility to lung tumors. This suggested that the loci
regulating activity of lymphocytes and macrophages in
vitro could have also in vivo effect on tumor growth. The
genetic analysis of production of IFNc by responder lym-
phocytes in allogeneic mixed lymphocyte cultures dem-
onstrated four genetic loci with significant influence. We
analyzed the difference in the phenotype of interferon
production between the strain O20 and the RC strain OcB-
9 that is in about 87.5% genes identical to O20, but
received a random subset of about 12.5% of genes from the
strain B10.O20 [18, 27]. The genetic material obtained
from B10.O20 is almost entirely contained in several
contiguous chromosomal segments, mostly 10–20 cM
long. They were described previously [27, 33] and are
covered by 15 polymorphic microsatellite markers listed in
‘‘Materials and methods’’ section. Thus, any genetic dif-
ferences between these two strains must be controlled by a
gene or genes located in one of these B10.O20-derived
segments [34]. It should be pointed out that the strains O20
and OcB-9 have identical MHC haplotype (H2pz), so they
respond to the same MHC incompatibility (H2b) and any
difference in the response must be host-related. The stim-
ulation by non-MHC alloantigens is not a likely cause of
the observed differences in production of IFNc between
O20 and OcB-9, because the two strains have the same
genotype at the strong stimulatory locus Mtv13 (Mls1) [27]
and no other stimulators in MLC were described in the
vicinity of the Cypr loci mapped here.
Mean of IL-2 production after alloantigen stimulation by C57BL/10 splenocytes
time
Con
cent
ratio
n of
IL-2
(ng
/ml)
O20 OcB-9
48h 96h0,0
0,5
1,0
1,5
2,0
a
b
*
Mean of IL-4 production after alloantigen stimulation by C57BL/10 splenocytes
time
Con
cent
ratio
n of
IL-4
(ng
/ml)
48h 72h0.00
0.25
0.50
0.75
1.00
O20 OcB-9
96h
72h
Fig. 4 a Comparison of concentration of IL-2 in supernatants of the
spleen cells of the strains OcB-9 and O20 after alloantigen
stimulation. Spleen cells (6 9 105 cells per well) were mixed with
8 9 105 irradiated (3000 R) C57BL/10 stimulator cells in 800 ll in
24-well tissue culture plates. Cell supernatants were analysed 48, 72,
and 96 h after stimulation. Data summarize the result of 13
independent experiments. Both female and male mice were used in
our analysis, but no influence of sex on strain difference was
observed. The columns show the means ± SE of IL-2 concentration
in ng/ml. Filled square: OcB-9, unfilled square: O20. b Comparison
of concentration of IL-4 in supernatants of the spleen cells of the
strains OcB-9 and O20 after alloantigen stimulation. Spleen cells
(6 9 105 cells per well) were mixed with 8 9 105 irradiated (3000 R)
C57BL/10 stimulator cells in 800 ll in 24-well tissue culture plates.
Cell supernatants were analysed 48, 72, and 96 h after stimulation.
Data summarize the result of 13 independent experiments. Both
female and male mice were used in our analysis, but no influence
of sex on strain difference was observed. The columns show the
means ± SE of IL-4 concentration in ng/ml. Filled square: OcB-9,
unfilled square: O20
208 Cancer Immunol Immunother (2010) 59:203–213
123

However, the higher production of IFNc by OcB-9 cells
is not likely a mere consequence of a higher proliferative
response. We measured proliferation in parallel MLCs of
individual F2 hybrid animals that were tested for IFNcproduction. We found in that population only one locus
controlling the proliferation, Alan2 [17]. It is linked to a
marker that is different from but relatively close (6 cM) to
the marker identifying Cypr6, so the identity of the two loci
is neither indicated nor ruled out. The other three loci
(Cypr4, 5, and 7) were not linked to proliferative activity in
MLR. This prevailing genetic independence of prolifera-
tion and IFNc production in MLC is similar to the exten-
sively documented distinct genetic control of lymphocyte
proliferation and IL-2 production in MLC [19].
An unexpected feature of our data is the complete co-
localization of the four newly detected loci Cypr control-
ling production of IFNc in mixed lymphocyte culture with
the four Lynf loci that control infiltration of lymphocytes
into tumors: Cypr4–Lynf4; Cypr5–Lynf3; Cypr6–Lynf1;
Cypr7–Lynf2. This general Cypr-Lynf co-localization con-
trasts sharply with a complete lack of co-localization of
Lynf loci with any genes encoding the more than 60 mol-
ecules that were either reported to participate in traffic of
lymphocytes from the circulation to tumors or belong to the
same family [9]. This suggests that, contrary to the pre-
vailing emphasis in the literature, the principal control of
capacity of lymphocytes to infiltrate tumors might reside in
the regulation of the processes of lymphocyte activation.
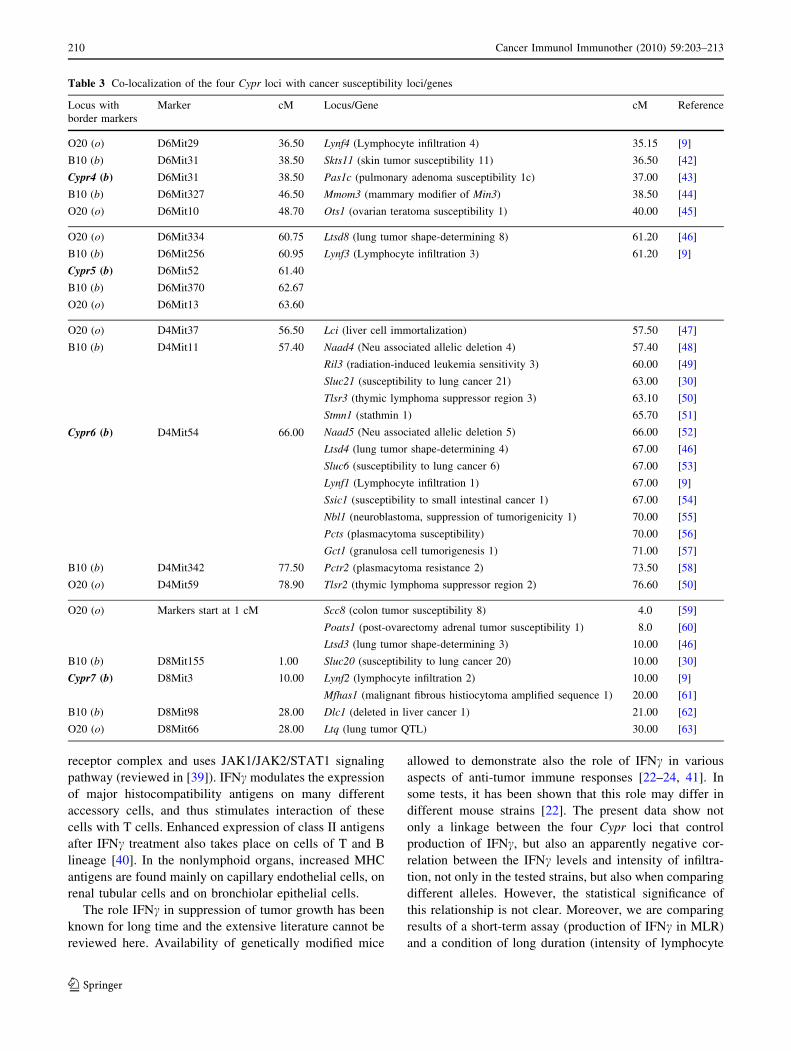
In addition, the four Cypr loci described here co-localize
with or are linked to a number of loci that control suscepti-
bility to or patterns of progression of a variety of tumors that
were independently described by different groups (Table 3).
Cypr4 is linked to four such loci, Mmom1, Ots1, Pas1c,
Skts11, Cypr5 to one locus, Ltsd8, Cypr6 to 15 loci (10 of
them within 5 cM) Gct1, Ltsd4, Naad5, Nbl1, Pcts, Sluc6,
Sluc21, Ssic1, Stmn1, Tlsr3, and Cypr7 to 7 loci Dlc1, Ltq,
Ltsd3, Mfhas1, Sluc20, Scc8, Poats1.
IFNc has an important role in host defenses, in both
innate and acquired immunity. IFNc is produced by many
different cell types, such as by T cells, NK cells, NKT cells
[35] upon their stimulation by antigens or mitogens.
Macrophages and other accessory cells, such as dendritic
cells, besides having a boosting effect on IFNc production
by resting T cells [36] can themselves also produce large
amounts of IFNc [37]. The interaction of T cells with
antigen-presenting cells results in the production of IL-1,
which then activates the T cells to produce IL-2, which
promotes the IFNc production [38]. All IFNc inducers
activate T cells either in a polyclonal (mitogen or anti-
bodies) or a clonally restricted (antigen-specific) manner.
IFNc (class II interferon) mediates broad immune
responses to pathogens. It binds to IFNGR1/IFNGR2
Table 1 Effects of genotype at the loci Cypr4 and Cypr5 on the concentration of IFNc in supernatants of spleen cells of individual F2 hybrids
between OcB-9 and O20 stimulated by irradiated B10 splenocytes
Marker/locus Genotype P value Corrected P
oo ob bb
D6Mit31 (Cypr4) 7.74 ± 0.60 (n = 64) 5.77 ± 0.47 (n = 105) 3.78 ± 0.69 (n = 63) 0.000100 0.00717
D6Mit52 (Cypr5) 3.66 ± 0.74 (n = 55) 5.09 ± 0.47 (n = 121) 9.43 ± 0.66 (n = 63) 0.00000296 0.000257
The phenotypic values given for individual genotypes indicate mean and standard errors of the concentration of IFNc and (in brackets) the
number of mice (for computations the measured values of IFNc in supernatants (ng/ml) were normalized by natural logarithm of (value ? 0.5) to
the power of 0.005)
Table 2 Effects of genotype at the loci Cypr6 and Cypr7 on the concentration of IFNc in supernatants of spleen cells of F2 hybrids between
OcB-9 and O20 stimulated by irradiated B10 splenocytes
D8Mit3 (Cypr7)
oo ob bb
D4Mit54 (Cypr6)
oo 5.57 ± 1.89 (n = 15) 3.13 ± 0.93 (n = 29) 10.64 ± 1.57 (n = 10)
ob 5.16 ± 0.83 (n = 31) 5.66 ± 0.55 (n = 58) 4.67 ± 0.69 (n = 33)
bb 9.06 ± 1.38 (n = 10) 4.77 ± 0.77 (n = 28) 4.61 ± 0.85 (n = 11)
The phenotypic values given for individual genotypes indicate mean and standard errors of the concentration of IFNc and (in brackets) the
number of mice. (B10.O20 allele b, O20 allele o), P value = nominal P value, corrected P = P value corrected for total genome screen)
P value = 0.000189, corrected P value = 0.00111
Cancer Immunol Immunother (2010) 59:203–213 209
123
receptor complex and uses JAK1/JAK2/STAT1 signaling
pathway (reviewed in [39]). IFNc modulates the expression
of major histocompatibility antigens on many different
accessory cells, and thus stimulates interaction of these
cells with T cells. Enhanced expression of class II antigens
after IFNc treatment also takes place on cells of T and B
lineage [40]. In the nonlymphoid organs, increased MHC
antigens are found mainly on capillary endothelial cells, on
renal tubular cells and on bronchiolar epithelial cells.
The role IFNc in suppression of tumor growth has been
known for long time and the extensive literature cannot be
reviewed here. Availability of genetically modified mice
allowed to demonstrate also the role of IFNc in various
aspects of anti-tumor immune responses [22–24, 41]. In
some tests, it has been shown that this role may differ in
different mouse strains [22]. The present data show not
only a linkage between the four Cypr loci that control
production of IFNc, but also an apparently negative cor-
relation between the IFNc levels and intensity of infiltra-
tion, not only in the tested strains, but also when comparing
different alleles. However, the statistical significance of
this relationship is not clear. Moreover, we are comparing
results of a short-term assay (production of IFNc in MLR)
and a condition of long duration (intensity of lymphocyte
Table 3 Co-localization of the four Cypr loci with cancer susceptibility loci/genes
Locus with
border markers
Marker cM Locus/Gene cM Reference
O20 (o) D6Mit29 36.50 Lynf4 (Lymphocyte infiltration 4) 35.15 [9]
B10 (b) D6Mit31 38.50 Skts11 (skin tumor susceptibility 11) 36.50 [42]
Cypr4 (b) D6Mit31 38.50 Pas1c (pulmonary adenoma susceptibility 1c) 37.00 [43]
B10 (b) D6Mit327 46.50 Mmom3 (mammary modifier of Min3) 38.50 [44]
O20 (o) D6Mit10 48.70 Ots1 (ovarian teratoma susceptibility 1) 40.00 [45]
O20 (o) D6Mit334 60.75 Ltsd8 (lung tumor shape-determining 8) 61.20 [46]
B10 (b) D6Mit256 60.95 Lynf3 (Lymphocyte infiltration 3) 61.20 [9]
Cypr5 (b) D6Mit52 61.40
B10 (b) D6Mit370 62.67
O20 (o) D6Mit13 63.60
O20 (o) D4Mit37 56.50 Lci (liver cell immortalization) 57.50 [47]
B10 (b) D4Mit11 57.40 Naad4 (Neu associated allelic deletion 4) 57.40 [48]
Cypr6 (b) D4Mit54 66.00
Ril3 (radiation-induced leukemia sensitivity 3) 60.00 [49]
Sluc21 (susceptibility to lung cancer 21) 63.00 [30]
Tlsr3 (thymic lymphoma suppressor region 3) 63.10 [50]
Stmn1 (stathmin 1) 65.70 [51]
Naad5 (Neu associated allelic deletion 5) 66.00 [52]
Ltsd4 (lung tumor shape-determining 4) 67.00 [46]
Sluc6 (susceptibility to lung cancer 6) 67.00 [53]
Lynf1 (Lymphocyte infiltration 1) 67.00 [9]
Ssic1 (susceptibility to small intestinal cancer 1) 67.00 [54]
Nbl1 (neuroblastoma, suppression of tumorigenicity 1) 70.00 [55]
Pcts (plasmacytoma susceptibility) 70.00 [56]
Gct1 (granulosa cell tumorigenesis 1) 71.00 [57]
B10 (b) D4Mit342 77.50 Pctr2 (plasmacytoma resistance 2) 73.50 [58]
O20 (o) D4Mit59 78.90 Tlsr2 (thymic lymphoma suppressor region 2) 76.60 [50]
O20 (o) Markers start at 1 cM Scc8 (colon tumor susceptibility 8) 4.0 [59]
Poats1 (post-ovarectomy adrenal tumor susceptibility 1) 8.0 [60]
Ltsd3 (lung tumor shape-determining 3) 10.00 [46]
B10 (b) D8Mit155 1.00 Sluc20 (susceptibility to lung cancer 20) 10.00 [30]
Cypr7 (b) D8Mit3 10.00 Lynf2 (lymphocyte infiltration 2) 10.00 [9]
Mfhas1 (malignant fibrous histiocytoma amplified sequence 1) 20.00 [61]
B10 (b) D8Mit98 28.00 Dlc1 (deleted in liver cancer 1) 21.00 [62]
O20 (o) D8Mit66 28.00 Ltq (lung tumor QTL) 30.00 [63]
210 Cancer Immunol Immunother (2010) 59:203–213
123
infiltration in tumors). Before the responsible Cypr-Lynf
genes are identified, it is difficult to assess, which of the
multiple effects of IFNc on lymphocytes, other inflamma-
tory cells, vasculature, and tumor cells modifies the level of
infiltration. Cypr-Lynf congenic strains, currently under
production, will create possibilities for more detailed
studies of function of these genes.
The data presented here may be a suitable model for
analysis of the potent modifying effects of infiltrating
lymphocytes in human cancer. Although the mechanisms
of the suppressive effects of lymphocyte infiltration on
growth of human cancers are not known, it is interesting
that there is an extensive genetic association between the
four Cypr-Lynf loci and more than 20 loci controlling
susceptibility to and progression of a variety of mouse
tumors (Table 3). Each of the four Cypr/Lynf loci is linked
to a number of susceptibility loci to various tumors
including lung, skin, ovary, liver, mammary gland, lympho-
mas, leukemia, plasmacytoma, and histiocytoma. This multi-
plicity of tumor types affected by these loci/genes is compatible
with a genetic effect that is not organ specific but possibly
systemic, like control of effective immunosurveillance.
In conclusion, our data provide a novel link between
genetic polymorphisms of regulation of lymphocyte acti-
vation and genetic variation in immunoregulation of tumor
growth. Analysis of the genes involved and their human
homologues may contribute to the understanding of indi-
vidual predisposition to a high or low anti-tumor activity of
lymphocytes and thus improve the decisions about per-
sonalized selection of appropriate therapies.
Acknowledgments We thank Neelima Kakarlapudi for useful
comments. This work was supported by Grant Agency of the Czech
Academy of Sciences (Grant GA AV A500520606), by Ministry of
Education of the Czech Republic (Project Grant LC 06009), Grant
Agency of the Czech Republic (Grant 310/08/H077), and Academy of
Sciences of the Czech Republic (Project Grant AVOZ50520514).
P.D. and L.Q. are supported by Roswell Park Cancer Institute’s
Institutional Funds and by NIH-NCI Grant 1R01CA127162-01.
Open Access This article is distributed under the terms of the
Creative Commons Attribution Noncommercial License which per-
mits any noncommercial use, distribution, and reproduction in any
medium, provided the original author(s) and source are credited.
References
1. de Visser KE, Eichten A, Coussens LM (2006) Paradoxical roles
of the immune system during cancer development. Nat Rev
Cancer 6:24–37
2. Klein G, Imreh S, Zabarovsky ER (2007) Why do we not all die
of cancer at an early age? Adv Cancer Res 98:1–16
3. Smyth MJ, Dunn GP, Schreiber RD (2006) Cancer immunosur-
veillance and immunoediting: the roles of immunity in sup-
pressing tumor development and shaping tumor immunogenicity.
Adv Immunol 90:1–50
4. Willimsky G, Blankenstein T (2007) The adaptive immune
response to sporadic cancer. Immunol Rev 220:102–112
5. Galon J, Costes A, Sanchez-Cabo F, Kirilovsky A, Mlecnik B,
Lagorce-Pages C, Tosolini M, Camus M, Berger A, Wind P,
Zinzindohoue F, Bruneval P, Cugnenc PH, Trajanoski Z, Fridman
WH, Pages F (2006) Type, density, and location of immune cells
within human colorectal tumors predict clinical outcome. Science
313:1960–1964
6. Bui JD, Uppaluri R, Hsieh CS, Schreiber RD (2006) Comparative
analysis of regulatory and effector T cells in progressively
growing versus rejecting tumors of similar origins. Cancer Res
66:7301–7309
7. Chen Q, Wang WC, Evans SS (2003) Tumor microvasculature as
a barrier to antitumor immunity. Cancer Immunol Immunother
52:670–679
8. Horlings H, Demant P (2005) Lung tumor location and lym-
phocyte infiltration in mice are genetically determined. Exp Lung
Res 31:513–525
9. Kakarlapudi N, Vernooy JH, Quan L, Fijneman RJ, Demant P
(2008) Control of lymphocyte infiltration of lung tumors in mice
by host’s genes: mapping of four Lynf (lymphocyte infiltration)
loci. Cancer Immunol Immunother 57:217–225
10. Fijneman RJ, Vos M, Berkhof J, Demant P, Kraal G (2004)
Genetic analysis of macrophage characteristics as a tool to
identify tumor susceptibility genes: mapping of three macro-
phage-associated risk inflammatory factors, marif1, marif2, and
marif3. Cancer Res 64:3458–3464
11. Lipoldova M, Havelkova H, Badalova J, Demant P (2005) Novel
loci controlling lymphocyte proliferative response to cytokines
and their clustering with loci controlling autoimmune reactions,
macrophage function and lung tumor susceptibility. Int J Cancer
114:394–399
12. Bodmer WF, Jones EA, Barnstable CJ, Bodmer JG (1978)
Genetics HLA: the major human histocompatibility system. Proc
R Soc Lond B Biol Sci 202:93–116
13. Huber BT (1992) Mls genes and self-superantigens. Trends Genet
8:399–402
14. Feng X, Hui KM, Younes HM, Brickner AG (2008) Targeting
minor histocompatibility antigens in graft versus tumor or graft
versus leukemia responses. Trends Immunol 29:624–632
15. Rychlikova M, Demant P, Ivanyi P (1973) The mixed lympho-
cyte reaction in H-2K, H-2D, and non-H-2 incompatibility.
Biomedicine 18:401–407
16. Holan V, Havelkova H, Krulova M, Demant P, Lipoldova M
(2000) A novel alloreactivity-controlling locus, Alan1, mapped to
mouse chromosome 17. Immunogenetics 51:755–757
17. Havelkova H, Badalova J, Demant P, Lipoldova M (2000) A new
type of genetic regulation of allogeneic response. A novel locus
on mouse chromosome 4, Alan2 controls MLC reactivity to three
different alloantigens: C57BL/10, BALB/c and CBA. Genes
Immun 1:483–487
18. Demant P, Hart AA (1986) Recombinant congenic strains—a
new tool for analyzing genetic traits determined by more than one
gene. Immunogenetics 24:416–422
19. Holan V, Lipoldova M, Demant P (1996) Identical genetic con-
trol of MLC reactivity to different MHC incompatibilities,
independent of production of and response to IL-2. Immunoge-
netics 44:27–35
20. Havelkova H, Holan V, Karnik L, Lipoldova M (2006) Mouse
model for analysis of non-MHC genes that influence allogeneic
response: recombinant congenic strains of OcB/Dem series that
carry identical H2 locus. Central European Journal of Biology
1:16–28
21. Schoenborn JR, Wilson CB (2007) Regulation of interferon-
gamma during innate and adaptive immune responses. Adv
Immunol 96:41–101
Cancer Immunol Immunother (2010) 59:203–213 211
123
22. Street SE, Trapani JA, MacGregor D, Smyth MJ (2002) Sup-
pression of lymphoma and epithelial malignancies effected by
interferon gamma. J Exp Med 196:129–134
23. Enzler T, Gillessen S, Manis JP, Ferguson D, Fleming J, Alt FW,
Mihm M, Dranoff G (2003) Deficiencies of GM-CSF and inter-
feron gamma link inflammation and cancer. J Exp Med
197:1213–1219
24. Qin Z, Kim HJ, Hemme J, Blankenstein T (2002) Inhibition of
methylcholanthrene-induced carcinogenesis by an interferon
gamma receptor-dependent foreign body reaction. J Exp Med
195:1479–1490
25. Blankenstein T (2005) The role of tumor stroma in the interaction
between tumor and immune system. Curr Opin Immunol 17:
180–186
26. Klein J (1989) Immunologically important loci. In: Lyon M,
Searle A (eds) Genetic variants and strains of the laboratory
mouse. Oxford University Press, Oxford
27. Stassen AP, Groot PC, Eppig JT, Demant P (1996) Genetic
composition of the recombinant congenic strains. Mamm Gen-
ome 7:55–58
28. Lipoldova M, Kosarova M, Zajicova A, Holan V, Hart AA,
Krulova M, Demant P (1995) Separation of multiple genes con-
trolling the T-cell proliferative response to IL-2 and anti-CD3
using recombinant congenic strains. Immunogenetics 41:301–311
29. Dietrich W, Katz H, Lincoln SE, Shin HS, Friedman J, Dracopoli
NC, Lander ES (1992) A genetic map of the mouse suitable for
typing intraspecific crosses. Genetics 131:423–447
30. Tripodis N, Hart AA, Fijneman RJ, Demant P (2001) Complexity
of lung cancer modifiers: mapping of thirty genes and twenty-five
interactions in half of the mouse genome. J Natl Cancer Inst
93:1484–1491
31. Lander E, Kruglyak L (1995) Genetic dissection of complex
traits: guidelines for interpreting and reporting linkage results.
Nat Genet 11:241–247
32. Kosarova M, Havelkova H, Krulova M, Demant P, Lipoldova M
(1999) The production of two Th2 cytokines, interleukin-4 and
interleukin-10, is controlled independently by locus Cypr1 and by
loci Cypr2 and Cypr3, respectively. Immunogenetics 49:134–141
33. Groot PC, Moen CJ, Dietrich W, Stoye JP, Lander ES, Demant P
(1992) The recombinant congenic strains for analysis of multi-
genic traits: genetic composition. FASEB J 6:2826–2835
34. Demant P (2003) Cancer susceptibility in the mouse: genetics,
biology and implications for human cancer. Nat Rev Genet
4:721–734
35. Cui J, Shin T, Kawano T, Sato H, Kondo E, Toura I, Kaneko Y,
Koseki H, Kanno M, Taniguchi M (1997) Requirement for Val-
pha14 NKT cells in IL-12-mediated rejection of tumors. Science
278:1623–1626
36. Blanchard DK, Djeu JY, Klein TW, Friedman H, Stewart WE
2nd (1986) Interferon-gamma induction by lipopolysaccharide:
dependence on interleukin 2 and macrophages. J Immunol
136:963–970
37. Murata Y, Ohteki T, Koyasu S, Hamuro J (2002) IFN-gamma and
pro-inflammatory cytokine production by antigen-presenting cells
is dictated by intracellular thiol redox status regulated by oxygen
tension. Eur J Immunol 32:2866–2873
38. Vilcek J, Henriksen-Destefano D, Siegel D, Klion A, Robb RJ,
Le J (1985) Regulation of IFN-gamma induction in human
peripheral blood cells by exogenous and endogenously produced
interleukin 2. J Immunol 135:1851–1856
39. Sadler AJ, Williams BR (2008) Interferon-inducible antiviral
effectors. Nat Rev Immunol 8:559–568
40. Kim KJ, Chaouat G, Leiserson WM, King J, De Maeyer E (1983)
Characterization of T-cell-soluble factors modulating the
expression of Ia and H-2 antigens on BALB/c B lymphoma cell
lines. Cell Immunol 76:253–267
41. Kaplan DH, Shankaran V, Dighe AS, Stockert E, Aguet M, Old
LJ, Schreiber RD (1998) Demonstration of an interferon gamma-
dependent tumor surveillance system in immunocompetent mice.
Proc Natl Acad Sci USA 95:7556–7561
42. Nagase H, Mao JH, Balmain A (2003) Allele-specific Hras
mutations and genetic alterations at tumor susceptibility loci in
skin carcinomas from interspecific hybrid mice. Cancer Res 63:
4849–4853
43. Festing MF, Lin L, Devereux TR, Gao F, Yang A, Anna CH,
White CM, Malkinson AM, You M (1998) At least four loci and
gender are associated with susceptibility to the chemical induc-
tion of lung adenomas in A/J 9 BALB/c mice. Genomics
53:129–136
44. Wang H, Teske D, Tess A, Kohlhepp R, Choi Y, Kendziorski C,
Moser AR (2007) Identification of novel modifier loci of Apc
Min affecting mammary tumor development. Cancer Res 67:
11226–11233
45. Lee GH, Bugni JM, Obata M, Nishimori H, Ogawa K, Drink-
water NR (1997) Genetic dissection of susceptibility to murine
ovarian teratomas that originate from parthenogenetic oocytes.
Cancer Res 57:590–593
46. Tripodis N, Demant P (2003) Genetic analysis of three-dimen-
sional shape of mouse lung tumors reveals eight lung tumor
shape-determining (Ltsd) loci that are associated with tumor
heterogeneity and symmetry. Cancer Res 63:125–131
47. Lee GH, Ogawa K, Nishimori H, Drinkwater NR (1995) Most
liver epithelial cell lines from C3B6F1 mice exhibit parentally-
biased loss of heterozygosity at the Lci (Liver cell immortaliza-
tion) locus on chromosome 4. Oncogene 11:2281–2287
48. Cool M, Depault F, Jolicoeur P (2006) Fine allelotyping of
Erbb2-induced mammary tumors in mice reveals multiple dis-
continuous candidate regions of tumor-suppressor loci. Genes
Chromosomes Cancer 45:191–202
49. Meruelo D, Offer M, Flieger N (1981) Genetics of susceptibility
for radiation-induced leukemia. Mapping of genes involved to
chromosomes 1, 2, and 4, and implications for a viral etiology in
the disease. J Exp Med 154:1201–1211
50. Santos J, Herranz M, Perez de Castro I, Pellicer A, Fernandez-
Piqueras J (1998) A new candidate site for a tumor suppressor
gene involved in mouse thymic lymphomagenesis is located on
the distal part of chromosome 4. Oncogene17:925–929
51. Zhu XX, Kozarsky K, Strahler JR, Eckerskorn C, Lottspeich F,
Melhem R, Lowe J, Fox DA, Hanash SM, Atweh GF (1989)
Molecular cloning of a novel human leukemia-associated gene.
Evidence of conservation in animal species. J Biol Chem
264:14556–14560
52. Cool M, Jolicoeur P (1999) Elevated frequency of loss of het-
erozygosity in mammary tumors arising in mouse mammary
tumor virus/neu transgenic mice. Cancer Res 59:2438–2444
53. Fijneman RJ, Jansen RC, van der Valk MA, Demant P (1998)
High frequency of interactions between lung cancer susceptibility
genes in the mouse: mapping of Sluc5 to Sluc14. Cancer Res
58:4794–4798
54. Fijneman RJ, Demant P (1995) A gene for susceptibility to small
intestinal cancer, ssic1, maps to the distal part of mouse chro-
mosome 4. Cancer Res 55:3179–3182
55. Matsuda Y, Ozaki T, Enomoto H, Saito T, Sakiyama S (1996)
Chromosome mapping of the mouse and rat homologs of the
human DAN gene, D1S1733E. Mamm Genome 7:709–710
56. Mock BA, Krall MM, Dosik JK (1993) Genetic mapping of
tumor susceptibility genes involved in mouse plasmacytoma-
genesis. Proc Natl Acad Sci USA 90:9499–9503
57. Dorward AM, Shultz KL, Horton LG, Li R, Churchill GA,
Beamer WG (2005) Distal Chr 4 harbors a genetic locus (Gct1)
fundamental for spontaneous ovarian granulosa cell tumorigen-
esis in a mouse model. Cancer Res 65:1259–1264
212 Cancer Immunol Immunother (2010) 59:203–213
123
58. Bliskovsky V, Ramsay ES, Scott J, DuBois W, Shi W, Zhang S,
Qian X, Lowy DR, Mock BA (2003) Frap, FKBP12 rapamycin-
associated protein, is a candidate gene for the plasmacytoma
resistance locus Pctr2 and can act as a tumor suppressor gene.
Proc Natl Acad Sci USA 100:14982–14987
59. van Wezel T, Ruivenkamp CA, Stassen AP, Moen CJ, Demant P
(1999) Four new colon cancer susceptibility loci, Scc6 to Scc9 in
the mouse. Cancer Res 59:4216–4218
60. Bernichtein S, Petretto E, Jamieson S, Goel A, Aitman TJ,
Mangion JM, Huhtaniemi IT (2008) Adrenal gland tumorigenesis
after gonadectomy in mice is a complex genetic trait driven by
epistatic loci. Endocrinology 149:651–661
61. Ko MS, Kitchen JR, Wang X, Threat TA, Wang X, Hasegawa A,
Sun T, Grahovac MJ, Kargul GJ, Lim MK, Cui Y, Sano Y,
Tanaka T, Liang Y, Mason S, Paonessa PD, Sauls AD, DePalma
GE, Sharara R, Rowe LB, Eppig J, Morrell C, Doi H (2000)
Large-scale cDNA analysis reveals phased gene expression pat-
terns during preimplantation mouse development. Development
127:1737–1749
62. Durkin ME, Avner MR, Huh CG, Yuan BZ, Thorgeirsson SS,
Popescu NC (2005) DLC-1, a Rho GTPase-activating protein
with tumor suppressor function, is essential for embryonic
development. FEBS Lett 579:1191–1196
63. Wang D, Lemon WJ, You M (2002) Linkage disequilibrium
mapping of novel lung tumor susceptibility quantitative trait loci
in mice. Oncogene 21:6858–6865
Cancer Immunol Immunother (2010) 59:203–213 213
123