Mechanisms controlling crescentic bar amplitude
14
Click Here for Full Article Mechanisms controlling crescentic bar amplitude Roland Garnier, 1,2 Nicholas Dodd, 1 Albert Falqués, 3 and Daniel Calvete 3 Received 2 June 2009; revised 5 November 2009; accepted 17 December 2009; published 15 April 2010. [1] The formation of crescentic bars from self‐organization of an initially straight shore‐parallel bar for shore‐normal incident waves is simulated with a two‐dimensional horizontal morphodynamical model. The aim is to investigate the mechanisms behind the saturation process defined as the transition between the linear regime (maximum and constant growth of the crescentic pattern) and the saturated state (negligible growth). The global properties of the morphodynamical patterns over the whole computational domain are studied (“global analysis”). In particular, consideration of the balance of the potential energy of the emerging bar gives its growth rate from the difference between a production term (related to the positive feedback leading to the instability) and a damping term (from the gravity‐driven downslope transport). The production is approximately proportional to the average over the domain of the cross‐shore flow velocity times the bed level perturbation. The damping is essential for the onset of the saturation, but it remains constant while the production decreases. Thus, it is notable that the saturation occurs because of a weakening of the instability mechanism rather than an increase of the damping. A reason for the saturation of the crescentic bar growth is the change in bar shape from its initial stage rather than the growth in amplitude itself. This change is mainly characterized by the narrowing of the rip channels, the onshore migration of the crests, and the change in the mean beach profile due to alongshore variability. These properties agree with observations of mature rip channel systems in nature. Citation: Garnier, R., N. Dodd, A. Falqués, and D. Calvete (2010), Mechanisms controlling crescentic bar amplitude, J. Geophys. Res., 115, F02007, doi:10.1029/2009JF001407. 1. Introduction [2] The surf zone of sandy barred beaches is characterized by the presence of one or several shore‐parallel bars. They are not always straight in plan view but are often meandering with deep and shallow sections alternating along the bars with a striking regularity. These bars are called crescentic bars (or lunate bars) and are probably the most documented and observed rhythmic features in the surf zone [ Wright and Short , 1984; Short , 1999; van Enckevort et al., 2004; Lafon et al., 2004; Castelle et al., 2007; Ruessink et al., 2007]. They are associated with the typical current circulation of strong jet‐like offshore‐ oriented currents (called rip currents) in the deep sections (called rip channels) and weaker wider onshore currents in the shallow sections. [3] Understanding the formation and the evolution of crescentic bar systems is an active area of research. Although their formation had been attributed to the hydro- dynamical forcing of infragravity edge waves [Bowen and Inman, 1971; Holman and Bowen, 1982], it is well accepted nowadays that the feedback from the morphology into the flow is the primary cause of their formation [Deigaard et al., 1999; Falqués et al., 2000; Damgaard et al., 2002; Reniers et al., 2004; Klein and Schuttelaars, 2006; van Leeuwen et al. , 2006; Calvete et al. , 2007; Dronen and Deigaard, 2007; Garnier et al., 2008; Smit et al., 2008]. Apart from Dronen and Deigaard [2007], who used a quasi‐three‐dimensional area (Q3D) model, all these self‐ organization studies are based on wave‐ and depth‐averaged process‐based (two‐dimensional horizontal (2DH)) mor- phological modeling. They show that crescentic bar systems would emerge from a free instability because of a positive feedback between waves, currents, and morphology. [4] Under normal or near‐normal wave incidence, the positive feedback is explained by the bed surf mechanism [Falqués et al., 2000; Caballeria et al., 2002; Ribas et al., 2003; Calvete et al., 2005; Garnier et al., 2008]. Crescen- tic bars are sometimes viewed as two adjacent series of shoals and troughs. These series are antisymmetric with respect to a line parallel to the coast. In particular, the bed surf mechanism explains that these crescentic features can appear on an alongshore uniform beach if the depth‐averaged sediment concentration profile admits a local maximum. The position of the maximum defines the antisymmetric axis, 1 Environmental Fluid Mechanics Research Centre, Process and Environmental Division, Faculty of Engineering, University of Nottingham, Nottingham, UK. 2 Now at Departament de Física Aplicada, Universitat Politécnica de Catalunya, Barcelona, Spain. 3 Departament de Física Aplicada, Universitat Politécnica de Catalunya, Barcelona, Spain. Copyright 2010 by the American Geophysical Union. 0148‐0227/10/2009JF001407 JOURNAL OF GEOPHYSICAL RESEARCH, VOL. 115, F02007, doi:10.1029/2009JF001407, 2010 F02007 1 of 14
Transcript of Mechanisms controlling crescentic bar amplitude

ClickHere
for
FullArticle
Mechanisms controlling crescentic bar amplitude
Roland Garnier,1,2 Nicholas Dodd,1 Albert Falqués,3 and Daniel Calvete3
Received 2 June 2009; revised 5 November 2009; accepted 17 December 2009; published 15 April 2010.
[1] The formation of crescentic bars from self‐organization of an initially straightshore‐parallel bar for shore‐normal incident waves is simulated with a two‐dimensionalhorizontal morphodynamical model. The aim is to investigate the mechanisms behind thesaturation process defined as the transition between the linear regime (maximum andconstant growth of the crescentic pattern) and the saturated state (negligible growth). Theglobal properties of the morphodynamical patterns over the whole computationaldomain are studied (“global analysis”). In particular, consideration of the balance of thepotential energy of the emerging bar gives its growth rate from the difference between aproduction term (related to the positive feedback leading to the instability) and a dampingterm (from the gravity‐driven downslope transport). The production is approximatelyproportional to the average over the domain of the cross‐shore flow velocity times thebed level perturbation. The damping is essential for the onset of the saturation, but itremains constant while the production decreases. Thus, it is notable that the saturationoccurs because of a weakening of the instability mechanism rather than an increase of thedamping. A reason for the saturation of the crescentic bar growth is the change in bar shapefrom its initial stage rather than the growth in amplitude itself. This change is mainlycharacterized by the narrowing of the rip channels, the onshore migration of the crests,and the change in the mean beach profile due to alongshore variability. These propertiesagree with observations of mature rip channel systems in nature.
Citation: Garnier, R., N. Dodd, A. Falqués, and D. Calvete (2010), Mechanisms controlling crescentic bar amplitude, J. Geophys.Res., 115, F02007, doi:10.1029/2009JF001407.
1. Introduction
[2] The surf zone of sandy barred beaches is characterizedby the presence of one or several shore‐parallel bars.They are not always straight in plan view but are oftenmeandering with deep and shallow sections alternatingalong the bars with a striking regularity. These bars arecalled crescentic bars (or lunate bars) and are probably themost documented and observed rhythmic features in thesurf zone [Wright and Short, 1984; Short, 1999; vanEnckevort et al., 2004; Lafon et al., 2004; Castelle etal., 2007; Ruessink et al., 2007]. They are associated withthe typical current circulation of strong jet‐like offshore‐oriented currents (called rip currents) in the deep sections(called rip channels) and weaker wider onshore currents inthe shallow sections.[3] Understanding the formation and the evolution of
crescentic bar systems is an active area of research.
Although their formation had been attributed to the hydro-dynamical forcing of infragravity edge waves [Bowenand Inman, 1971; Holman and Bowen, 1982], it is wellaccepted nowadays that the feedback from the morphologyinto the flow is the primary cause of their formation[Deigaard et al., 1999; Falqués et al., 2000;Damgaard et al.,2002; Reniers et al., 2004; Klein and Schuttelaars, 2006; vanLeeuwen et al., 2006; Calvete et al., 2007; Dronen andDeigaard, 2007; Garnier et al., 2008; Smit et al., 2008].Apart from Dronen and Deigaard [2007], who used aquasi‐three‐dimensional area (Q3D) model, all these self‐organization studies are based on wave‐ and depth‐averagedprocess‐based (two‐dimensional horizontal (2DH)) mor-phological modeling. They show that crescentic bar systemswould emerge from a free instability because of a positivefeedback between waves, currents, and morphology.[4] Under normal or near‐normal wave incidence, the
positive feedback is explained by the bed surf mechanism[Falqués et al., 2000; Caballeria et al., 2002; Ribas et al.,2003; Calvete et al., 2005; Garnier et al., 2008]. Crescen-tic bars are sometimes viewed as two adjacent series ofshoals and troughs. These series are antisymmetric withrespect to a line parallel to the coast. In particular, the bedsurf mechanism explains that these crescentic features canappear on an alongshore uniform beach if the depth‐averagedsediment concentration profile admits a local maximum. Theposition of the maximum defines the antisymmetric axis,
1Environmental Fluid Mechanics Research Centre, Process andEnvironmental Division, Faculty of Engineering, University of Nottingham,Nottingham, UK.
2Now at Departament de Física Aplicada, Universitat Politécnica deCatalunya, Barcelona, Spain.
3Departament de Física Aplicada, Universitat Politécnica de Catalunya,Barcelona, Spain.
Copyright 2010 by the American Geophysical Union.0148‐0227/10/2009JF001407
JOURNAL OF GEOPHYSICAL RESEARCH, VOL. 115, F02007, doi:10.1029/2009JF001407, 2010
F02007 1 of 14
which, for a barred beach, is close to the top of the bar.Garnier et al. [2008] showed that, for random waves over abarred beach, the inner series (shoreward of the axis) emergesfrom a free instability but the outer is forced by the inner sothat its amplitude is weaker and crescentic bars are mainlydefined by the inner series.[5] Most of these modeling studies, based either on the
linear stability analysis or on nonlinear modeling, are lim-ited to the bar formation and to the earliest stage of the barevolution because of the model formulation (linear models)or because the nonlinear models break down. The reason forthis nonlinear model limitation is not clear and has not beeninvestigated. The reason is not necessarily numerical; itcould be a lacuna in the physics, casting doubt on whetherthe saturation of the growth of crescentic bars can bedescribed by numerical models. Recently, Garnier et al.[2008] reproduced this saturation by using a simple 2DHmodel, but the physical mechanisms are still unexplored.They reached the nonlinear regime and were able to simulatethe finite amplitude behavior of crescentic bars, showing thatthe final bar shape differs from the initial one: the channelsbecome narrower than the crests (this is associated withjet‐like rip currents), the channels tend to migrate offshore,and the shoals tend to migrate onshore.[6] Finite amplitude modeling of morphological features
is fundamental for any comparison with observations. Thesaturation of the bed form growth has been obtained for othermorphodynamical systems such as shoreface‐connectedsand ridges [Calvete and de Swart, 2003; Roos et al., 2004;Vis‐Star et al., 2008], sand ripples [Marieu et al., 2008],and shore‐transverse sandbars [Garnier et al., 2006]. Amethod to investigate the mechanisms of saturation wasintroduced byGarnier et al. [2006] and extended by Vis‐Staret al. [2008]; it is called the global analysis. It consists ofstudying the global properties of the bed forms over thewhole computational domain by deriving a potential energybalance of the bed forms. For both the shoreface‐connectedridges and the transverse bars, the saturation of the bedforms occurs because of the balance between a productionand a damping term. However, the reason for this balancehas not yet been explained.[7] The objective of this contribution is to investigate the
mechanisms behind the saturation of the growth of cres-centic bars from the numerical experiments of Garnier et al.[2008] by using the global analysis. It is organized asfollows. Section 2 presents the methodology by introducingthe equations and the hypothesis necessary to understandthe derivation of the global analysis. The general resultsand the main variables of the analysis are given in section 3.The physical mechanisms are explained in section 4.Section 5 gives the conclusions.
2. Methodology
2.1. Governing Equations
[8] The 2DHMORFO55 model solves the phase‐averagednonlinear shallow water equations with sediment transportand bed updating [Mei, 1989; Caballeria et al., 2002;Garnier et al., 2006, 2008]. The water mass (equation (1)),the momentum (equation (2)), and the sediment mass
(equation (3)) conservation equations read (repeated indicesindicate summation with i, j = 1, 2; t is time)
@D
@tþ @
@xjD vj� � ¼ 0; ð1Þ
@vi@t
þ vj@vi@xj
¼ �g@zs@xi
� 1
�D
@
@xjS0 ij � S00ij� �� �bi
�D; ð2Þ
@zb@t
þ @qj@xj
¼ 0; ð3Þ
whereD is the total mean depth, v is the depth‐averagedmeanvelocity vector (v = (v1, v2) = (u, v)), g is the acceleration dueto gravity (g = 9.8 m s−2), zs is the mean sea level, r is thewater density (r= 1024 kgm−3), S′ is thewave radiation stresstensor, S″ is the turbulent Reynolds stress tensor, tb is the bedshear stress vector, zb is the bed level, and q is the horizontalsediment flux vector. Note that the bed porosity effect hasbeen included in the sediment flux in order to simplify thenotations. The wave field is solved by using the wave energydissipation equation and Snell’s law; the wave current inter-action has been removed as it only has a small effect on thepresented results. For more details, refer to Garnier et al.[2006, 2008].[9] An initial topography that is strictly alongshore uni-
form forced by a stationary alongshore uniform wave field isconsidered. Since the dynamics of crescentic bars areassumed to be mainly governed by rip current circulation,the cross‐shore transport driven by undertow, wave non-linearities, and gravity is disregarded. This means thatthose contributions are considered to be in balance forthis basic state, which is therefore an equilibrium state.When departures from this bathymetry develop, the sedimentflux q does not vanish. It is based on the Soulsby–Van Rijntotal load formula [Soulsby, 1997] (see Garnier et al. [2008]for details) and reads
q ¼ � v� � ub rhð Þ; ð4Þ
where a is the stirring factor, which includes the bed porosityp = 0.4 (a = asvr/(1 − p)); g is the bed slope coefficient; ub isthe root‐mean‐square wave orbital velocity amplitude at thebottom; and h is the bed level deviation from initial equilib-rium (h = zb − zb
0, where zb0 is the initial bed level). The stirring
factor asvr is computed as follows:
�svr ¼ AS us � ucð Þ2:4 if us > uc
�svr ¼ 0 otherwise;
according to Soulsby [1997], where AS and uc dependessentially on sediment characteristics and water depth[Soulsby, 1997]. The stirring velocity us reads
us ¼ jvj2 þ 0:018
cDu2b
� �1=2
;
cD being the morphodynamical drag coefficient [Soulsby,1997]. Essentially, a v describes the contribution fromthe circulation, and −ag ub rh describes the contribution
GARNIER ET AL.: MECHANISMS CONTROLLING BAR AMPLITUDE F02007F02007
2 of 14
that would bring the bathymetry back to the equilibriumprofile if there were no circulation.
2.2. Bottom Evolution Equation Approximation
[10] The Bottom Evolution Equation (BEE) has beenintroduced by Falqués et al. [2000] as an approximateexpression of bed changes to facilitate understanding bedevolution in connection with hydrodynamics. For complete-ness, we briefly revisit it in our context. By using the sedimenttransport formula (equation (4)), the sediment conservationequation (equation (3)) reads
@h
@t¼ �rrrrrrr � �vð Þ þ rrrrrrr � �rrrrrrrhð Þ;
where G = g a ub. According to the water mass conservationequation (equation (1)),
rrrrrrr � �vð Þ ¼ rrrrrrr � CDvð Þ ¼ Dv � rrrrrrrC � C@D
@t;
where C is the equivalent depth‐averaged concentration(C = a/D), also called the potential stirring.[11] From the combination of the two previous equations,
and by assuming ∣∂D/∂t∣ ’ ∣∂h/∂t∣ (the flow is assumed toadjust instantaneously to the bed changes), we obtain
1� Cð Þ @h@t
’ �D v � rrrrrrrC þrrrrrrr � �rrrrrrrhð Þ:
Finally, by using the approximation C � 1 (for instance,C ’ 0.001 from Garnier et al. [2008]), the BEE reads
@h
@t’ �D v � rrrrrrrC þrrrrrrr � �rrrrrrrhð Þ: ð5Þ
2.3. Global Analysis
[12] The global analysis of beach evolution was intro-duced by Garnier et al. [2006] and consists of analyzingvariables that are integrated over the computational domain.It differs from the local analysis used by Garnier et al.[2008], which can only explain the formation of featuresand not the saturation of the growth. The limitation of thelocal analysis can be understood because the bars can still bein movement while their growth on average is already sat-urated, so that some sort of equilibrium is reached (we referto this as a “dynamical equilibrium”). For instance, foroblique waves, an equilibrium state is reached, but the barsstill migrate; thus, the local analysis still predicts erosionand deposition at some locations. The global analysis for theevolution of transverse bar systems appearing on a planarbeach [Garnier et al., 2006] is extended here to the case ofrip channels developing from the deformation of an initiallyalongshore uniform parallel bar obtained by Garnier et al.[2008].[13] We first introduce the overbar notation to define an
average over the computational domain. It reads, for anyfunction f = f(x, y),
f ¼ 1
LxLy
Z Ly
0
Z Lx
0f dx dy;
where Lx (Ly) is the cross‐shore (alongshore) length of thecomputational domain. Following Garnier et al. [2006], theproduction P and the damping D can be defined by
P ¼ � hrrrrrrr � �vð Þ; ð6Þ
� ¼ � hrrrrrrr � �rrrrrrrhð Þ: ð7Þ
The production term P comes from the first contribution ofthe sediment flux vector q (equation (4)) (advective part).According to BEE (equation (5)), it can be approximated by
P ’ � hD v�rC ð8Þ
and therefore measures the tendency for growth or decay ofbars by the bed flow couplings and bed surf couplings[Garnier et al., 2006]. The damping term D comes from thedownslope or diffusive contribution of q.[14] By using the same definition as Vis‐Star et al. [2008],
the “global growth rate” s of the instability reads
� ¼ 1
k h k2d
dt
1
2k h k2
� �; ð9Þ
where khk is the L2 norm of h and is defined as
k h k¼ h2� �1=2
;
so that khk2 can be interpreted as the potential energydensity of the bed forms [Vis‐Star et al., 2008].[15] To illustrate the physical meaning of s, let us con-
sider a topographic perturbation like
h x; y; tð Þ ¼ exp �0tð ÞH x; yð Þ; ð10Þ
which represents a topographic wave that exponentiallygrows with a growth rate s0 and which keeps a constantshape given by H(x, y), with H being an Ly periodic functionwith respect to y. This occurs, for instance, during the linearregime (initial stage) of the bar evolution. Then,
� tð Þ ¼ �0:
[16] More generally, the sign of s determines the differentstate of the bar evolution: the growth (decay) of the bars canbe characterized by s � 0 (s < 0), while the saturation ofbars occurs when s = 0. Moreover, the global growth ratecan be computed with the relationship
� ¼ 1
k h k2 P ��ð Þ; ð11Þ
which can be obtained from the definition (equation (9)) bymultiplying the BEE (equation (5)) by h and integrating.
3. Model Results
[17] The morphodynamical evolution of an initiallyalongshore uniform parallel barred beach is studied forhundreds of days. A numerical experimental setup similarto that of Garnier et al. [2008] is used. Waves are assumedto arrive normal to the coast. At the offshore boundary
GARNIER ET AL.: MECHANISMS CONTROLLING BAR AMPLITUDE F02007F02007
3 of 14

(x = Lx = 250 m) the height of the incident waves isHrms0 = 1 m, and the period is T = 6 s. By perturbing
the initial topography, instability develops, and an equilib-rium state is eventually reached. The final state is presentedin Figures 1a–1c for a random perturbation (perturbationamplitude ∼ 1 mm). The evolution of the bed profile is dis-
played in Figure 1h along a channel and along a crest (asindicated in Figure 1c). It shows that the shore‐parallel barcrest, initially at 2 m depth (black dots), subsequently risesup to 1.5 m depth on the crescentic horns (darkest solid line).[18] Figures 1d–1g show time series of variables taken
from the longshore section defined at x = 50 m. Figure 1d is
Figure 1. Final state (day 100): (a) top view of the bed level zb and current vectors v and (b) top view ofthe bed level perturbation h and its contour. Solid (dashed) lines represent the crests (troughs). (c) Tridi-mensional view of the bed level zb. Time series: (d) h(x = 50 m, y, t), bed level perturbation along thelongshore section x = 50 m (the darker colors represent the deeper areas); (e) F (x = 50 m, l, t), its Fouriertransform (the darker colors correspond to the more predominant wavelengths); (f) lm(x = 50 m, t),resulting predominant wavelength; and (g) growth rates computed with different formula. Black thick line,s, (global) growth rate computed with relationship (11). Gray thin lines, sm, growth rates corresponding tolm of Figure 1f. Different gray levels are used to distinguish the two wavelengths. (h) Bed level profileevolution of a crest (solid lines) and of a channel (dashed lines). The selected sections are shown inFigure 1c. The darker the lines are, the longer the evolution is. The dots indicate the initial bed level.
GARNIER ET AL.: MECHANISMS CONTROLLING BAR AMPLITUDE F02007F02007
4 of 14

the bed level variation, Figure 1e is its Fourier analysis,Figure 1f is the predominant wavelength (lm), and inFigure 1g the growth rates (predominant sm and global s)are displayed. The predominant wavelength lm (Figure 1f)corresponds to the maximum Fourier coefficient at eachtime step (plotted in Figure 1e). The growth rate (sm)corresponding to lm is displayed in Figure 1g. Notice thatsimilar results are obtained if the Fourier analysis is made atanother cross‐shore location where crescentic bars develop.Thus, these wavelengths correspond to the same unstablemode, that is, the crescentic bar system. At the final state,lm = 180 m, and the corresponding initial growth rate(from Fourier analysis) is about sm = 0.6 d−1. This growthrate is similar to the initial growth rate corresponding tolm = 200 m, which is dominant from day 3 to day 65.Notice that these initial growth rates are taken during the firstperiod where they are constant in time: this period corre-sponds to the time when the mode amplitude grows expo-nentially, i.e., to the linear regime. Interestingly, thesegrowth rates obtained from Fourier analysis are similar tothe global growth rate s computed from relationship (11)(Figure 1g, thick black line), which takes into accountthe overall patterns, not only the features appearing in thesection x = 50 m.[19] The saturation of features begins when s decreases
(Figure 2a). The saturated state is defined as the state forwhich for the first time s ’ 0. This state can be highlydynamical, in particular if there is merging of bars [Garnieret al., 2006]. The equilibrium state is reached when s = 0 forall times. The time taken to reach the equilibrium state issometimes very long, as the growth rate during the saturatedstate is small; it can be an order of magnitude longer thanthe time corresponding to the saturation processes. Becauseequilibrium is sometimes not observed, its existence issometimes unknown. Here our interest is the saturationprocess, so we want to understand why s decreases. Thiscan be due to either the decrease of the production (moreexactly, of P/khk2) or the increase of the damping termD/khk2.[20] As Figure 3 shows, there are two ways to observe the
evolution of s and all the variables: as a function of t(Figures 2a and 3a–3e) or of khk (Figure 2b or Figures 3f–3j).The condition of instability is given by s � 0; that is, the
bars grow if P � D. It is found that P and D are verysimilar (Figures 3a and 3f), only their small differencesexplaining the instability (Figures 3b and 3g).[21] The difference in the normalized variables P/khk2
and D/khk2, i.e., s, should be constant in time for the initialgrowth of any linearly unstable mode. Because of non-linearities, it is not constant, and we see that the dynamics ofthese variables are better represented by analyzing theirvariations as a function of khk (Figure 3h) rather than time.To be precise, we remark that D/khk2 is constant during thesaturation process, while P/khk2 is only constant at theinitial stage, decreasing thereafter until it balances D/khk2.[22] Thus, the saturation seems to be due to the reduction
of the production term rather than an increase of thedamping. This will be analyzed in detail in section 4.
4. Physical Mechanisms
4.1. Analysis of the Damping Term
[23] Integrating by parts, and because of the boundaryconditions, i.e., because a(x = 0) ’ 0, h(x = Lx) ’ 0, andsince h is Ly periodic, we can write
�= k h k2¼R Ly0
R Lx0 � @xhð Þ2 þ @yh
� �2n odx dyR Ly
0
R Lx0 h2 dx dy
� 0 ;
so that D will contribute to a loss of potential energy[Vis‐Star et al., 2008].
4.2. Analysis of the Production Term
4.2.1. Breaking Down the Production[24] From equation (8), P can be broken down as
P = Pu + Pv, with
Pu ¼ � uhD@xC;
Pv ¼ � vhD@yC;
which describe the role of the cross‐shore and the longshoreflow components on the production.
Figure 2. Sketch of the saturation processes: (a) s as a function of t and (b) s as a function of khk.
GARNIER ET AL.: MECHANISMS CONTROLLING BAR AMPLITUDE F02007F02007
5 of 14

[25] Figure 4a shows the Pu contribution during the sat-uration process. We see that Pu � Pv ≥ 0:
P ’ Pu ¼ � uhD@xC : ð12Þ
4.2.2. Local Analysis of the Production[26] The variables controlling the growth and saturation
of the bed forms are examined locally by plotting theintegrands of (11), (12), and (7) for two different states:during the linear regime (day 11) and during the saturationprocess (day 19) (Figure 4). In agreement with Figure 3i, thedecrease of P/khk2 (by 26%) with khk is much stronger thanthe decrease of D/khk2 (by 6%).
[27] To understand the variations of P and, more partic-ularly, the decrease of P/khk2 for increasing khk, weexamine, locally, the variable uhD∂xC. Figure 5 shows, at theinitial state and during the saturation process, the variables−uh/khk2, D∂xC, and their product −uhD∂xC/khk2, which,integrated over the whole domain, gives P/khk2. FromFigures 5a and 5e, the product −uh is seen to be mainlypositive, and its highest values are attained where the insta-bility occurs. Where the bars develop, i.e., where the gradientin potential stirring is strong, the variable D∂xC is also posi-tive. This explains why P is positive.[28] To analyze if the decrease of P/khk2 is due to a phase
shift between −uh and D∂xC, the correlation between thesetwo signals is examined. The correlation between two real
Figure 3. General results obtained from the global analysis. (left) Variables as a function of time. (right)Variables as a function of k h k. (a, f) Production P and damping D. (b, g) P – D. (c, h) P/khk2 andD/khk2. (d, i) Global growth rate s. (e, j) Bar norm khk.
GARNIER ET AL.: MECHANISMS CONTROLLING BAR AMPLITUDE F02007F02007
6 of 14

functions f and g (f ? g) is made with a cross correlationdefined as
f ? g x0; yð Þ ¼Z Lx
0f x; yð Þg xþ x0; yð Þ dx;
where −Lx < x′ < Lx. For each alongshore location, the cross‐shore position of the maximum of f ? g, denoted as x?′ ,represents the cross‐shore shift between f and g. Thecorrelation −uh/khk2 D∂xC in Figures 5d and 5h shows
that, at the most unstable alongshore location (i.e., over crestsor troughs), the cross‐shore profiles of the signals −uh andD∂xC are centered at the initial state and also during thesaturation process. Therefore, the decrease of P/khk2 is notprimarily due, for this specific modeled case, to a shiftbetween the two signals.[29] Moreover, we notice that the alongshore variations of
D and ∂xC are small compared to those of u and h (Figure 5).Therefore, the effect of the variations in D∂xC is negligiblein comparison to the effect of the variations of −uh/khk2.
Figure 4. (a) Decomposition of the production P ’ Pu: P/khk2 and Pu/khk2 as a function of khk. (b–g)Local analysis. Contour lines represent the bed level perturbations h; solid (dashed) lines are used forcrests (troughs). Figures 4b–4d show the initial state corresponding to the maximum growth rate ofinstabilities (day 11, linear regime). Figures 4e–4g show the intermediate state corresponding to a decreas-ing growth rate (day 19, saturation process). Figures 4b and 4e are for −uhD∂xC/khk2 − hrrrrr · (Grrrrrh)/khk2.Figures 4c and 4f are for −uhD∂xC/khk2. Figures 4d and 4g are for −hrrrrr · (Grrrrrh)/khk2.
GARNIER ET AL.: MECHANISMS CONTROLLING BAR AMPLITUDE F02007F02007
7 of 14

[30] In conclusion, the variations of P/khk2 seem con-trolled by the local variations of −uh/khk2.4.2.3. Variations of −uh[31] To understand the behavior of −uh, we introduce the
variable S:
S ¼ � uh; ð13Þ
which is expected to govern the variation of P. To checkthis claim, we define S0 as the average of P/S (Figure 6b):
S0 ¼Rmaxkhk0 P=S d k h k
max k h k :
As shown in Figures 6b and 6c, during the entire saturationprocess, P/S can be approximated as a constant (its relativevariation is less than 2%), and
P ’ S0 S: ð14ÞThus, S seems to control the variation of P, and we willfocus on investigating why S/khk2 decreases with khk. Tounderstand the variations of the global variable S/khk2, wecan distinguish the processes over the crests and the chan-nels by introducing the variables S′cha and S′bar, which arerepresentative of the quantity S/khk2 over the channels andthe bars, respectively. They read
S0cha ¼ �max u=min h;
S0bar ¼ �min u=max h;
Figure 5. Local analysis of the production. (left) Initial state corresponding to the maximum growth rateof instabilities (day 11, linear regime) and (right) intermediate state corresponding to a decreasing growthrate (day 19, saturation process): (a, e) −uh/khk2, (b, f) D∂xC, (c, g) −uhD∂xC, repeated from Figures 4cand 4g (in Figures 5a–5c and 5e–5g, contour lines represent the bed level perturbations h, and solid(dashed) lines are used for crests (troughs)); and (d, h) −uh/khk2 ? D∂xC. Small values are shaded, andlarge values are white. The dashed line defines the maximum for each alongshore location.
GARNIER ET AL.: MECHANISMS CONTROLLING BAR AMPLITUDE F02007F02007
8 of 14

where min and max stand for the minimum and maximumvalue of the variables in the computational domain. Becausethe current is offshore (onshore) oriented, and h is negative(positive) over a channel (bar), the quantity S′cha (S′bar) ispositive. Assuming that in the linear regime −u and h are inphase (and have the same cross‐shore distribution), we canwrite u(x, y) = −Ah(x, y), with A = S′cha = S′bar = S/khk2, sothat channels and shoals contribute equally. Figure 6d showsthat S′cha = S′bar only at the earliest stage, but later S′cha isconstant while S′bar decreases; thus, the saturation of thecrescentic bar growth seems to occur because of the satu-ration of the bar crests.
4.3. Analysis of the Saturation Process
[32] We have shown that the main reason explaining thesaturation of the growth is the decrease of S/khk2 when thebars grow (reduction by 35%, Figure 6a). This decreasecomes from the change in the bar characteristics during thesaturation process. The primary bar property that changesduring the saturation is the amplitude, and the increase incurrent intensity with increasing bar amplitude could slowdown for large amplitudes. Another possibility for the sat-uration could be the change in bar shape. In particular, wenotice at saturation (Figure 7) that the crests become widerand the channels become narrower, the shoals tend to mi-grate onshore while the channels migrate offshore, and thedeepening of the channels becomes less pronounced thanthe increased shoal elevation (i.e., the bed level perturbationnormalized with the bar norm (h/khk2) increases in thechannels when saturation occurs). Actually, these changes inshape properties can be seen as an increase of asymmetrybetween the linear regime (symmetric bed forms) and thenonlinear stage.[33] These hypotheses are now investigated by means of
“flow over topography” experiments. This means that themodel has been used in its hydrodynamical mode (i.e.,without sediment transport and bed changes), starting fromthe same initial profile but superimposing preexisting bedpatterns, similar to the rip channel systems obtained by self‐organization (Figure 8a). For the default case, the wave-length of the bed forms is set to 200 m, and the amplitude isset to max(h) = −min(h) = 50 cm, which corresponds to anorm of khk = 0.11 m. In each experiment, a hydrody-namical equilibrium state is reached after less than 1 h.[34] Then the properties of the preexisting bars will be
modified to analyze their expected global growth rate ifsediment transport and bed evolution were switched on.This fictive growth rate is computed by using formula (11).This allows us to characterize which property of the satu-rated bar system causes the saturation.4.3.1. Change in Bar Amplitude[35] To investigate if the change in bar amplitude affects
the growth rate of the instabilities, the amplitude of theimposed features has been varied from 1 mm to 1 m.Figure 8b shows an estimate of the global growth rate s ofthese bed forms by using formula (11). Within the range ofamplitude simulated in the morphodynamical experiments(i.e., khk < 0.15 m), the growth rate decreases with the barnorm, but it does not vanish. Thus, the increase in baramplitude contributes to the saturation process, but we willsee that it is not the main reason. Interestingly, we noticean increase of the growth rate for higher bed forms due to
Figure 6. Variations of −uh. (a) S/khk2 as a function ofkhk. P ’ S0S: (b) P/S, D/S, and S0 as a function ofk h k and (c) P/k h k 2 and S0 S/k h k 2 as a functionof khk. (d) S/khk 2 (black solid line), S′cha (gray dashedline), and S′bar (gray solid line) as a function of khk.
GARNIER ET AL.: MECHANISMS CONTROLLING BAR AMPLITUDE F02007F02007
9 of 14
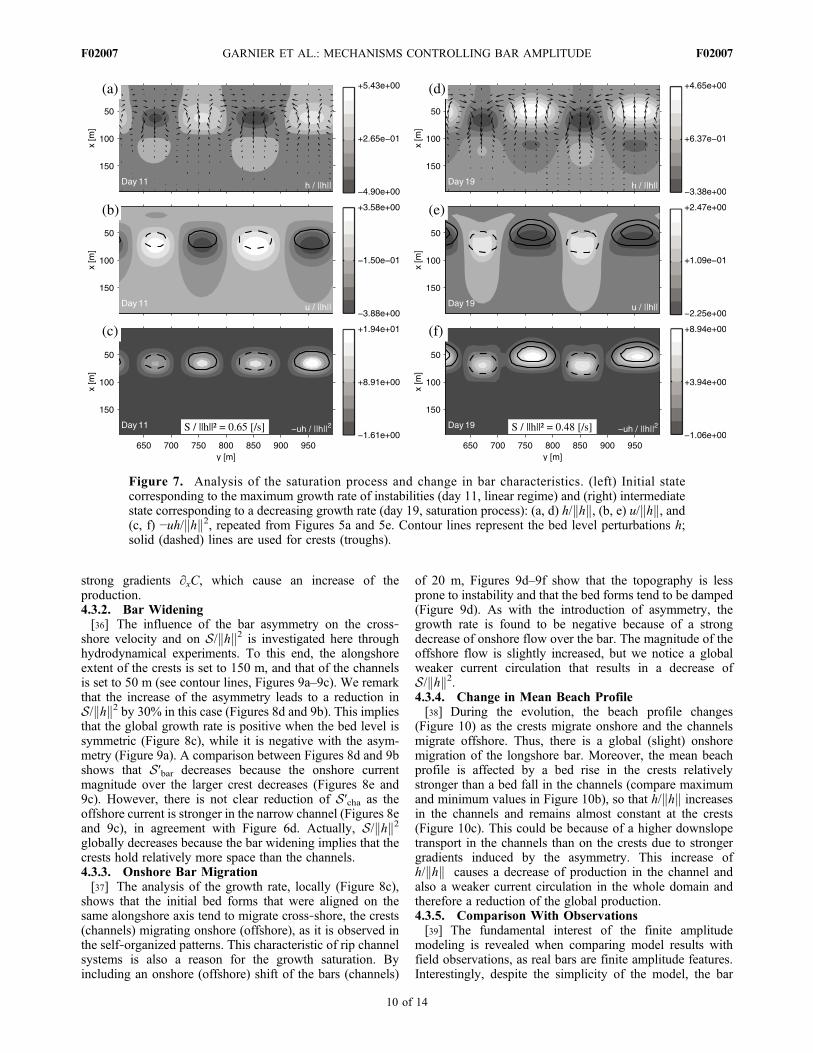
strong gradients ∂xC, which cause an increase of theproduction.4.3.2. Bar Widening[36] The influence of the bar asymmetry on the cross‐
shore velocity and on S/khk2 is investigated here throughhydrodynamical experiments. To this end, the alongshoreextent of the crests is set to 150 m, and that of the channelsis set to 50 m (see contour lines, Figures 9a–9c). We remarkthat the increase of the asymmetry leads to a reduction inS/khk2 by 30% in this case (Figures 8d and 9b). This impliesthat the global growth rate is positive when the bed level issymmetric (Figure 8c), while it is negative with the asym-metry (Figure 9a). A comparison between Figures 8d and 9bshows that S′bar decreases because the onshore currentmagnitude over the larger crest decreases (Figures 8e and9c). However, there is not clear reduction of S′cha as theoffshore current is stronger in the narrow channel (Figures 8eand 9c), in agreement with Figure 6d. Actually, S/khk2globally decreases because the bar widening implies that thecrests hold relatively more space than the channels.4.3.3. Onshore Bar Migration[37] The analysis of the growth rate, locally (Figure 8c),
shows that the initial bed forms that were aligned on thesame alongshore axis tend to migrate cross‐shore, the crests(channels) migrating onshore (offshore), as it is observed inthe self‐organized patterns. This characteristic of rip channelsystems is also a reason for the growth saturation. Byincluding an onshore (offshore) shift of the bars (channels)
of 20 m, Figures 9d–9f show that the topography is lessprone to instability and that the bed forms tend to be damped(Figure 9d). As with the introduction of asymmetry, thegrowth rate is found to be negative because of a strongdecrease of onshore flow over the bar. The magnitude of theoffshore flow is slightly increased, but we notice a globalweaker current circulation that results in a decrease ofS/khk2.4.3.4. Change in Mean Beach Profile[38] During the evolution, the beach profile changes
(Figure 10) as the crests migrate onshore and the channelsmigrate offshore. Thus, there is a global (slight) onshoremigration of the longshore bar. Moreover, the mean beachprofile is affected by a bed rise in the crests relativelystronger than a bed fall in the channels (compare maximumand minimum values in Figure 10b), so that h/khk increasesin the channels and remains almost constant at the crests(Figure 10c). This could be because of a higher downslopetransport in the channels than on the crests due to strongergradients induced by the asymmetry. This increase ofh/khk causes a decrease of production in the channel andalso a weaker current circulation in the whole domain andtherefore a reduction of the global production.4.3.5. Comparison With Observations[39] The fundamental interest of the finite amplitude
modeling is revealed when comparing model results withfield observations, as real bars are finite amplitude features.Interestingly, despite the simplicity of the model, the bar
Figure 7. Analysis of the saturation process and change in bar characteristics. (left) Initial statecorresponding to the maximum growth rate of instabilities (day 11, linear regime) and (right) intermediatestate corresponding to a decreasing growth rate (day 19, saturation process): (a, d) h/khk, (b, e) u/khk, and(c, f) −uh/khk2, repeated from Figures 5a and 5e. Contour lines represent the bed level perturbations h;solid (dashed) lines are used for crests (troughs).
GARNIER ET AL.: MECHANISMS CONTROLLING BAR AMPLITUDE F02007F02007
10 of 14

shape at the final state that causes the saturation seems to beconsistent with the observations of mature crescentic barsystems.[40] First, the commonly observed narrow jet‐like rip
currents along with wider and weaker onshore return cur-rents [Short, 1999; MacMahan et al., 2006] are reproducedhere as a result of nonlinearity (the alongshore profiles beingsinusoidal for the linear regime). In our morphodynamicalmodel, which couples morphology and circulation, thewidths of the rips and of the return currents are correlatedwith the widths of the channels and shoals, respectively. Therip currents being narrower than the return currents is a veryrobust characteristic of the system, and it has been shown tooccur even in the absence of bed changes because of con-servation of vorticity for a horizontal circulation (purelyhydrodynamical problem) on a plane sloping beach [Arthur,1962]. In this case, if rip channels are just carved by thecurrent, their widths should be correlated too. This corre-lation between narrow rips and narrow channels is alsoobserved in some intertidal bars [Castelle et al., 2007;Bruneau et al., 2009]. Therefore, all this suggests that thenarrowing of the channels and widening of the shoals thathas been shown to slow down the growth of the crescenticpattern would be characteristic of mature crescentic bars.However, from bathymetric measurements there is no gen-eral evidence for the narrowing of the channels. Moreover,experimental studies do not show the correlation between
the width of the narrow rip currents and the width of thechannels. This could be due to the difficulties in gettingcurrent measurements and underlying bathymetry in the surfzone. For instance, during the Rip Current Experiment(RIPEX) [MacMahan et al., 2005, 2006], for some partic-ular events, the channels can appear wider than the bars. Butthe data are given for a fixed cross‐shore location withouttaking into account the cross‐shore variability. This could becritical because the widths of the channels and of the barsshould be measured where the bed alongshore variability isthe highest or where the cross‐shore current magnitude isthe strongest. Therefore, in the absence of systematicbathymetric measurements, we conclude that the widelyobserved asymmetry in the circulation indicates thatalthough there is no clear direct experimental evidence ofthe corresponding asymmetry between channels and shoals,it is, in general, very likely to occur.[41] Second, the onshore (offshore) migration of the crests
(channels) can be seen as a step in the transition “RhythmicBar and Beach” to “Transverse Bar and Rip” of the Short[1999] classification [Ranasinghe et al., 2004; Garnier etal., 2008]. This transition typically occurs for calm waveconditions following a storm, which is consistent with thepresented simulations. Moreover, this behavior of the cres-centic bar system is linked to an onshore migration of themean parallel bar, due to a net sand deposition shoreward ofthe bar and erosion seaward.
Figure 8. Change in bar amplitude. Hydrodynamical experiments. (a) Linear bed level perturbation for anamplitude of max(h) = 50 cm (k h k = 0.11 m) and (b) s as a function of the bar norm khk at the hydro-dynamical equilibrium state. Equilibrium state (max(h) = 50 cm): (c) −uhD∂xC/khk2 − hr · (Grh)/khk2,(d)−uh/khk2, and (e) u. Contour lines represent the bed level perturbations h; solid (dashed) lines are usedfor crests (troughs).
GARNIER ET AL.: MECHANISMS CONTROLLING BAR AMPLITUDE F02007F02007
11 of 14

Figure 10. Change in mean beach profile. Bed perturbation h, the dashed line indicates the cross‐shoreposition of the maximum production for each alongshore location: (a) initial state (day 11) and (b) inter-mediate state (day 19). (c) Alongshore profiles of h/khk following the dashed line of Figures 10a and 10b.(d) Cross‐shore profiles of zbmean
(x) = meany(zb(x, y)). The thick black line corresponds to the beginning ofthe evolution (Figure 10a), and the thin gray line corresponds to the saturation process (Figure 10b).
Figure 9. Change in bar shape. Hydrodynamical experiments. (left) Bars and channels, alongshoreextended and reduced, respectively, by 50 m and (right) bars and channels, onshore and offshore shifted,respectively, by 20 m: (a, d) −uhD∂xC/khk2 − hr · (Grh)/k h k 2, (b, e) −uh/k h k 2, and (c, f) u. Contourlines represent the bed level perturbations h; solid (dashed) lines are used for crests (troughs).
GARNIER ET AL.: MECHANISMS CONTROLLING BAR AMPLITUDE F02007F02007
12 of 14
[42] Interestingly, this global migration is exclusively dueto 2‐D circulations as the cross‐shore sediment transportprocesses (undertow, wave asymmetry, etc.) are assumed tobe in balance. This result is in agreement with the empiricalmodeling study of Plant et al. [2006], as it illustrates thecoupling between the bathymetric alongshore variability andthe displacement of the shore‐parallel bar. The alongshorevariability, which can be seen as the cross‐shore span of thecrescentic system (as defined by Plant et al. [2006]),becomes stronger because of the increase of the bar ampli-tude, the onshore migration of the crests, and the offshoremigration of the channels (although the increase of the baramplitude induces the migrations by producing the non-linearities). This will cause the net onshore bar migration.Moreover, in this particular experiment, which is represen-tative of calm, stationary wave conditions approaching abeach previously smoothed by a storm, a morphodynamicalequilibrium state is obtained, and it is characterized by anincrease of the variability and by the onshore migration of theparallel bar, as Plant et al. [2006] suggests.[43] More generally, the overall changes in bar shape
causing the growth saturation (the bar widening, the onshorecrest migration, and the decreasing channel depth) comprisea development of bar asymmetry due to the nonlinearity ofthe beach system. All of them lead to a change in the meanbeach profile. This shows the importance of the role of thealongshore variability and of the 2‐D nonlinear processes inthe cross‐shore dynamics, which are generally not addressedby 1‐D cross‐shore modeling studies.
5. Conclusions
[44] The reasons for the saturation of the growth ofcrescentic bars emerging from self‐organization of an ini-tially straight parallel bar have been investigated for normalwave incidence. The saturation process is defined as thetransition between the linear regime (maximum and constantgrowth rate) and the saturated state (negligible growth). Awave‐ and depth‐averaged nonlinear shallow water equationsolver with wave transformation, sediment transport, andbed updating has been used to reproduce the saturation andtherefore to simulate the finite amplitude behavior of suchrhythmic systems. Thereafter, the global analysis of thebeach system has been used to understand the mechanismsbehind the saturation process. It consists of studying theglobal properties of the morphodynamical patterns over thewhole computational domain. In particular, the potentialenergy balance of the morphological pattern gives anexpression for the growth rate as the difference betweenthe production (related to the positive feedback leading tothe instability) and the damping (loss of energy due to thegravity‐driven downslope transport). To understand whichaspects of the developing bar system cause the decrease ofthe growth rate, a new method is introduced. It is based oncomputing the hydrodynamics on preexisting fixed (i.e., nosediment transport) arbitrary morphological patterns (calledthe “flow over topography” problem). This has been used inprevious studies in the case of a local morphodynamicalanalysis, but the innovative aspect here is its combinationwith the global analysis, which allows us to compute thefictive growth rate of the patterns, along with the productionand damping terms.
[45] The analysis leads to the following conclusions.(1) Although the damping is essential for the onset of thesaturation, it is remarkable that the saturation occurs becauseof a weakening of the instability mechanism rather than anincrease of the damping. (2) The effect of the alongshorecomponent of the current in the bar evolution is negligibleduring both the initial development and the saturationprocess. (3) The saturation of the crescentic patterns issubstantially due to the changes in bar shape from itsinitial stage rather than the growth in amplitude itself.(4) The alongshore variability of the topography induces thedisplacement of the mean shore‐parallel bar.[46] Although the conclusions are drawn for a specific
modeled case, the method introduced here is likely to beapplicable to other types of sandbars.
[47] Acknowledgments. The work of R. Garnier was supported bythe University of Nottingham and is part of the Spanish Governmentproject under contract CTM2006‐08875. Their support is gratefullyacknowledged. We thank Paolo Blondeaux, the anonymous reviewer, andthe associate editor for their useful reviews.
ReferencesArthur, R. (1962), A note on the dynamics of rip currents, J. Geophys. Res.,67, 2777–2779.
Bowen, A. J., and D. L. Inman (1971), Edge waves and crescentic bars,J. Geophys. Res., 76, 8662–8671.
Bruneau, N., et al. (2009), Field observations of an evolving rip current ona meso‐macrotidal well‐developed inner bar and rip morphology, Cont.Shelf Res., 29, 1650–1662.
Caballeria, M., G. Coco, A. Falqués, and D. A. Huntley (2002), Self‐organization mechanisms for the formation of nearshore crescentic andtransverse sand bars, J. Fluid Mech., 465, 379–410.
Calvete, D., and H. E. de Swart (2003), A nonlinear model study on thelong‐term behavior of shore face‐connected sand ridges, J. Geophys.Res., 108(C5), 3169, doi:10.1029/2001JC001091.
Calvete, D., N. Dodd, A. Falqués, and S. M. van Leeuwen (2005), Morpho-logical development of rip channel systems: Normal and near normal waveincidence, J. Geophys. Res., 110, C10006, doi:10.1029/2004JC002803.
Calvete, D., G. Coco, A. Falqués, and N. Dodd (2007), (Un)predictabilityin rip channel systems, Geophys. Res. Lett., 34, L05605, doi:10.1029/2006GL028162.
Castelle, B., P. Bonneton, H. Dupuis, and N. Senechal (2007), Double barbeach dynamics on the high‐energy meso‐macrotidal French Aquitaniancoast: A review, Mar. Geol., 245, 141–159.
Damgaard, J., N. Dodd, L. Hall, and T. Chesher (2002), Morphodynamicmodelling of rip channel growth, Coastal Eng., 45, 199–221.
Deigaard, R., N. Drnen, J. Fredsoe, J. H. Jensen, and M. P. Jrgesen (1999),A morphological stability analysis for a long straight barred coast,Coastal Eng., 36, 171–195.
Dronen, N., and R. Deigaard (2007), Quasi‐three‐dimensional modelling ofthe morphology of longshore bars, Coastal. Eng., 54, 197–215.
Falqués, A., G. Coco, and D. A. Huntley (2000), A mechanism for the gen-eration of wave‐driven rhythmic patterns in the surf zone, J. Geophys.Res., 105, 24,071–24,088.
Garnier, R., D. Calvete, A. Falqués, and M. Caballeria (2006), Generationand nonlinear evolution of shore‐oblique/transverse sand bars, J. FluidMech., 567, 327–360.
Garnier, R., D. Calvete, A. Falqués, and N. Dodd (2008), Modelling the for-mation and the long‐term behavior of rip channel systems from the defor-mation of a longshore bar, J. Geophys. Res., 113, C07053, doi:10.1029/2007JC004632.
Holman, R. A., and A. J. Bowen (1982), Bars, bumps, and holes: Modelsfor the generation of complex beach topography, J. Geophys. Res., 87,457–468.
Klein, M. D., and H. M. Schuttelaars (2006), Morphodynamic evolution ofdouble‐barred beaches, J. Geophys. Res., 110, C06017, doi:10.1029/2005JC003155.
Lafon, V., D. D. M. Apoluceno, H. Dupuis, D. Michel, H. Howa, and J. M.Froidefond (2004), Morphodynamics of nearshore rhythmic sandbars in amixed‐energy environment (SW France): I. Mapping beach changes usingvisible satellite imagery, Estuarine Coastal Shelf Sci., 61, 289–299.
GARNIER ET AL.: MECHANISMS CONTROLLING BAR AMPLITUDE F02007F02007
13 of 14

MacMahan, J. H., E. B. Thornton, T. P. Stanton, and A. J. H. M. Reniers(2005), RIPEX: Observations of a rip current system, Mar. Geol., 218,113–134.
MacMahan, J. H., E. B. Thornton, and A. J. H. M. Reniers (2006), Ripcurrent review, Coastal Eng., 53, 191–208.
Marieu, V., P. Bonneton, D. Foster, and F. Ardhuin (2008), Modeling of vor-tex ripple morphodynamics, J. Geophys. Res., 113, C09007, doi:10.1029/2007JC004659.
Mei, C. C. (1989), The Applied Dynamics of Ocean Surface Waves, Adv.Ser. Ocean Eng., vol. 1, World Sci., Singapore.
Plant, N. G., K. T. Holland, and R. A. Holman (2006), A dynamical attrac-tor governs beach response to storms, Geophys. Res. Lett., 33, L17607,doi:10.1029/2006GL027105.
Ranasinghe, R., G. Symonds, K. Black, and R. Holman (2004), Morphody-namics of intermediate beaches: A video imaging and numerical model-ling study, Coastal Eng., 51, 629–655.
Reniers, A. J. H. M., J. A. Roelvink, and E. B. Thornton (2004), Morpho-dynamic modeling of an embayed beach under wave group forcing,J. Geophys. Res., 109, C01030, doi:10.1029/2002JC001586.
Ribas, F., A. Falqués, and A. Montoto (2003), Nearshore oblique sand bars,J. Geophys. Res., 108(C4), 3119, doi:10.1029/2001JC000985.
Roos, P. C., S. J. M. Hulscher, M. A. F. Knaapen, and R. M. J. V. Damme(2004), The cross‐sectional shape of tidal sandbanks: Modeling and obser-vations, J. Geophys. Res., 109, F02003, doi:10.1029/2003JF000070.
Ruessink, B. G., G. Coco, R. Ranasinghe, and I. L. Turner (2007), Coupledand noncoupled behavior of three‐dimensional morphological patterns ina double sandbar system, J. Geophys. Res., 112, C07002, doi:10.1029/2006JC003799.
Short, A. D. (1999), Handbook of Beach and Shoreface Morphodynamics,John Wiley, New York.
Smit, M., A. Reniers, B. Ruessink, and J. Roelvink (2008), The morpholog-ical response of a nearshore double sandbar system to constant waveforcing, Coastal Eng., 55, 761–770.
Soulsby, R. L. (1997), Dynamics of Marine Sands, Thomas Telford,London.
van Enckevort, I. M. J., B. G. Ruessink, G. Coco, K. Suzuki, I. L. Turner,N. G. Plant, and R. A. Holman (2004), Observations of nearshorecrescentic sandbars, J. Geophys. Res., 109, C06028, doi:10.1029/2003JC002214.
van Leeuwen, S. M., N. Dodd, D. Calvete, and A. Falqués (2006), Physicsof nearshore bed pattern formation under regular or random waves,J. Geophys. Res., 111, F01023, doi:10.1029/2005JF000360.
Vis‐Star, N., H. de Swart, and D. Calvete (2008), Patch behaviour andpredictability properties of modelled finite‐amplitude sand ridges onthe inner shelf, Nonlinear Processes Geophys., 15, 943–955.
Wright, L. D., and A. D. Short (1984), Morphodynamic variability of surfzones and beaches: A synthesis, Mar. Geol., 56, 93–118.
D. Calvete, A. Falqués, and R. Garnier, Departament de Física Aplicada,Universitat Politécnica de Catalunya, Campus Nord, Modùl B4, E‐08034Barcelona, Spain. ([email protected]; [email protected]; [email protected])N. Dodd, Environmental Fluid Mechanics Research Centre, Process
and Environmental Division, Faculty of Engineering, University ofNottingham, University Park, Nottingham NG7 2RD, UK. ([email protected])
GARNIER ET AL.: MECHANISMS CONTROLLING BAR AMPLITUDE F02007F02007
14 of 14