Genetic variation within the Daphnia pulex genome
156
University of New Hampshire University of New Hampshire University of New Hampshire Scholars' Repository University of New Hampshire Scholars' Repository Doctoral Dissertations Student Scholarship Spring 2009 Genetic variation within the Daphnia pulex genome Genetic variation within the Daphnia pulex genome Abraham Eaton Tucker University of New Hampshire, Durham Follow this and additional works at: https://scholars.unh.edu/dissertation Recommended Citation Recommended Citation Tucker, Abraham Eaton, "Genetic variation within the Daphnia pulex genome" (2009). Doctoral Dissertations. 490. https://scholars.unh.edu/dissertation/490 This Dissertation is brought to you for free and open access by the Student Scholarship at University of New Hampshire Scholars' Repository. It has been accepted for inclusion in Doctoral Dissertations by an authorized administrator of University of New Hampshire Scholars' Repository. For more information, please contact [email protected].
-
Upload
khangminh22 -
Category
Documents
-
view
0 -
download
0
Transcript of Genetic variation within the Daphnia pulex genome

University of New Hampshire University of New Hampshire
University of New Hampshire Scholars' Repository University of New Hampshire Scholars' Repository
Doctoral Dissertations Student Scholarship
Spring 2009
Genetic variation within the Daphnia pulex genome Genetic variation within the Daphnia pulex genome
Abraham Eaton Tucker University of New Hampshire, Durham
Follow this and additional works at: https://scholars.unh.edu/dissertation
Recommended Citation Recommended Citation Tucker, Abraham Eaton, "Genetic variation within the Daphnia pulex genome" (2009). Doctoral Dissertations. 490. https://scholars.unh.edu/dissertation/490
This Dissertation is brought to you for free and open access by the Student Scholarship at University of New Hampshire Scholars' Repository. It has been accepted for inclusion in Doctoral Dissertations by an authorized administrator of University of New Hampshire Scholars' Repository. For more information, please contact [email protected].

GENETIC VARIATION WITHIN THE DAPHNIA PULEX GENOME
BY
ABRAHAM EATON TUCKER
B.S., University of Southern Maine, 2003
DISSERTATION
Submitted to the University of New Hampshire
in Partial Fulfillment of
the Requirements for the Degree of
Doctor of Philosophy
In
Genetics
May, 2009

UMI Number: 3363734
INFORMATION TO USERS
The quality of this reproduction is dependent upon the quality of the copy
submitted. Broken or indistinct print, colored or poor quality illustrations
and photographs, print bleed-through, substandard margins, and improper
alignment can adversely affect reproduction.
In the unlikely event that the author did not send a complete manuscript
and there are missing pages, these will be noted. Also, if unauthorized
copyright material had to be removed, a note will indicate the deletion.
UMI UMI Microform 3363734
Copyright 2009 by ProQuest LLC All rights reserved. This microform edition is protected against
unauthorized copying under Title 17, United States Code.
ProQuest LLC 789 East Eisenhower Parkway
P.O. Box 1346 Ann Arbor, Ml 48106-1346

This dissertation has been examined and approved.
Dissertation Director, W. Kelley Thomas, Ph.D. Director, Hubbard Center for Genome Studies Professor of Biochemistry and Molecular Biology-and Genetics
/? r y 1 ij/aii; >'\ ,&
R. Daniel Bergeron, Pn'.D. Professor of Computer Science
John J. Collins, Ph.D. Associate Professor of Biochemistry and Molecular Biology and Genetics
'•C?t y\
Vaughn S. Cooper, Ph.D. Assistant Professor of Microbiology and Genetics
(X^^^l^^ Anita S. Klein, Ph.D. Associate Professor of Biochemistry and Molecular Biology and Genetics
Date

DEDICATION
To my grandparents, Rev. Ralph Lewis and Mildred Moore Tucker, who have
always encouraged, supported and shown interest in my education.
in

ACKNOWLEDGEMENTS
Funding Sources:
Sequencing Facility Technician (September 2003-December 2004)
Genetics Department Teaching Assistantship (Spring 2005)
NSF GK-12 PROBE Fellowship (May 2005-May 2007)
NSF Research Assistantship (May 2007-December 2008)
People:
Special thanks to my advisor Kelley Thomas for his mentorship and support.
Dissertation Committee: Profs. R. Daniel Bergeron, John Collins, Vaughn Cooper and Anita Klein
This research project was aided directly and indirectly by the collaborations and contributions of the following people;:
Way Sung, Morel Henley, Sanjuro Jogdeo, Phil Hatcher, Darren J. Bauer, Shilpa Kulkarni, Karen Carleton, Wenli Li, John Colbourae, Don Gilbert, Mike Lynch, Jeong-Hyeon Choi.
Genome center comrades: Feseha, Joe, Janet, Kazu, Krys, Weston, Will
Most importantly, I acknowledge the friendship and love of my wife, Antoinette.
IV

TABLE OF CONTENTS
DEDICATION iii
ACKNOWLEDGEMENTS iv
LIST OF TABLES viii
LIST OF FIGURES ix
ABSTRACT xii
CHAPTER PAGE
INTRODUCTION 1
Current state of genome biology 1
Population genomics and evolution 4
Daphnia pulex genome 6
I. SMALL NUCLEOTIDE POLYMORPHISMS 11
Background 11
SNPs and evolution 11
Neutral theory and population genetics 13
SNP studies 18
Daphnia variation 22

Methods 24
Comparative Assembly (TCO) 24
Comparative Assembly (TRO) 28
Results and Discussion 29
Pre-assembly quality control 29
Comparative Assembly (TCO vs. TCO 30
Scope of study 31
Magnitude of variation 32
SNP types 33
Functional distribution 41
Physical distribution 42
Recombination 45
Windows analysis 47
Windows analysis 49
Comparative Assembly (TCO vs. TRO) 55
Maximum likelihood analysis 58
Conclusion 59
Acknowledgements 59
II. PATTERNS OF VARIATION IN RECENTLY DIVERGED
MITOCHONDIRAL GENOMES OF DAPHNIA PULEX 60
Background 60
Mitochondrial genomes and evolution 60
vi

Methods 63
Results and discussion 64
III. INTRON GAIN/LOSS POLYMORPHISMS IN DAPHNIA PULEX 69
Background 69
Intron evolution 69
Methods 71
Results and discussion 72
Acknowledgements 78
IV. GENE DUPLICATION IN DAPHNIA PULEX 79
Background 79
Methods 83
Results and discussion 85
Acknowledgements 99
LIST OF REFERENCES 103
APPENDICES 122
VII

LIST OF TABLES
Table
Table 1-1
Table 1-2
Table 2-1
Table 3-1
Table 4-1
Table 4-2
Table 4-3
Table 4-4
Title
Pre and post LUCY-treated data
Types of the transversions
Observed and expected substitutions in mtDNA
Intron absences in TRO
Gene content of fully sequenced invertebrates
Birth rates of gene duplicates
Ks values for all, single and pseudogene pairs
Spatial categories among all gene duplicates
Page
29
40
66
77
82
86
96
99
VIII

LIST OF FIGURES
Table
Figure 1-1
Figure 1-2
Figure 1-3
Figure 1-1
Figure 1-2
Figure 1-3
Figure 1-4
Figure 1-5
Figure 1-6
Figure 1-7
Figure 1-8
Figure 1-9
Figure 1-10
Figure 1-11
Figure 1-12
Figure 1-13
Figure 1-14
Title
Phylogeny of completed arthropod genome
Reproductive mode in Daphnia
Distribution of N50 scaffold sizes
SNP Pipeline flowchart
TRO reads mapped to the TCO assembly
Average coverage of assemblies
Frequency of coverage
N50 sites under criteria
Categories of polymorphic sites
Base substituional matrix
Frequency of SNP types by scaffold
Distribution of sequential indels found within TCO
Distribution of sequential base substitutions within TCO
Frequency of SNP types in N50 scaffolds
Ts/Tv by scaffold
Ts/Tv and SNP frequency
SNPs in exons, intron and intergenic sequence
Page
6
8
10
26
29
31
31
32
33
34
35
36
37
38
39
40
41
ix

Figure 1-15
Figure 1-16
Figure 1-17
Figure 1-18
Figure 1-19
Figure 1-20
Figures 1-21
Figure 1-31
Figure 1-32
Figure 1-33
Figure 2-1
Figure 2-2
Figure 3-1
Figure 4-1
Figure 4-2
Figure 4-3
Figure 4-4
Figure 4-5
Figure 4-6
Figure 4-7
Figure 4-8
Figure 4-9
Figure 4-10
Distribution of base substitutions in exons
Scaffold-wide base substitution frequency
Polymorphism on mapped scaffolds
SNP frequency and recombination rate
Windows analysis of SNP frequency across scaffold 1
Runs of Zero-SNP windows
Polymorphism across scaffolds
Frequency of coverage for TRO
Polymorphism and divergence between TRO and TCO
Nucleotide divergence between TRO and the TCO
TCO-TRO-Crease tree
Dilatory mutation-selection
Duplications at rntron/exon boundaries in 13/30 TCO introns
Homology among predicted genes in D. pulex
Age distribution of gene duplicates at >60% AA identity
Age distribution of gene duplicates at >40% AA identity
Distribution of single copy gene pairs
Single gene duplicates using 40%
Selection intensity (Ka/Ks) and age of single gene pairs
Selection intensity (Ka/Ks) and age of all gene pairs
Selection intensity (Ka/Ks) and age of pseudogene-gene pairs
Distribution of Ks for gene pairs
KOG classes of gene duplicates
42
44
45
47
48
49
50
56
57
58
64
68
76
88
89
90
91
92
94
94
95
96
98
X

Figure 4-11 All gene pairs along Ks in four spatial categories 100
Figure 4-12 N50 gene pairs along Ks in four spatial categories 101
Figure 4-13 Number of cis and trans duplicates over time. 102
XI

ABSTRACT
GENETIC VARIATION WITHIN THE DAPHNIA PULEXGENOME
by
Abraham Eaton Tucker
University of New Hampshire, May, 2009
Genetic variation within the diploid Daphnia pulex genome was examined using a
high quality de novo assembly and shotgun reads from two distinct D. pulex clones.
Patterns of variation and divergence at single nucleotides were examined in physical and
functional regions of the genome using comparative assembly output and available
annotations. Additionally, mitochondrial genomes of the same D. pulex clones were
assembled and compared for patterns of divergence, and substitutional biases. Intron
presence/absence polymorphisms were identified computationally and verified
experimentally. Finally, gene duplicate demographics were examined for patterns of
divergence and estimates of gene birth rates.
XII

INTRODUCTION
Current state of genome biology
The scientific study of inheritance is entering the post-genomic phase. Over the
past decade, whole genome sequences, from dozens of mammals, reptiles and fish to
hundreds of viruses and bacteria have been published (www.genomesonline.org). Among
-100 eukaryotes published to date, chordates, fungi, nematodes and arthropods are among
the most studied (Appendix A). The rapidly accelerating pace of genome sequencing,
assembly and annotation has moved the field of genomics past a mentality of a
"canonical" genome sequence for each species to a recognition that substantial genomic
variation underlies the diversity within individuals and populations. When funding major
genome projects, an early emphasis on the macroevolutionary trends of genome evolution
led to the prioritization of phylogenetic breadth over population depth when choosing
taxa. This may have led to a misconception of static genome structure within species and
an underemphasis on intraspecific variation in genome analysis. From a purely
computational point of view, genetic variation has been considered a problem and not an
opportunity (Green 1997, Vinson et al. 2005). This has meant that many organisms are
chosen for genome sequencing specifically because they lack variation (through artificial
inbreeding and/or recently bottlenecked populations). The avoidance of genome projects
with natural levels of genetic variation has exacerbated the all-to-common view of
1

canonical genomes, although the increasing affordability of whole genome sequencing is
changing this.
The commonly quoted statistic that humans are "99.9% similar" belies the fact
that much of the variation within species is not at single nucleotides, but at larger
segments and sections that are modified, lost and gained (Kidd et al. 2008; Feuk et al.
2006; Redon et al. 2006; Khaja et al. 2006). Genetic variation comes in many forms, from
single nucleotide polymorphisms to gene duplications and large-scale karyotype-level
changes. In fact, there is evidence that genomes of individual humans can differ by
hundreds of active gene copies (Nozawa et al. 2007; Zhang 2007; Young et al. 2008) and
substantially more other segmental variants (Jakobsson et al. 2008; Tuzun et al. 2005;
Nguyen et al. 2008). Similarly, the oft-quoted statistic that humans and chimps are 98.8%
similar (The Chimpanzee Sequencing and Analysis Consortium 2005; Wildman 2003;
Kumar and Hedges 1998; Eichler et al. 2004; Tishkoff and Kidd 2004) gives an overly
conservative estimate of genetic divergence. Larger scale structural divergence is
estimated to be many times that estimated for nucleotide substitution (Kerher-Sawatzki
and Cooper 2007; Newman et al. 2005; Nguyen et al. 2008; Shianna and Willard 2006).
With a greater appreciation for the many scales of genomic variation and the development
of high throughput sequencing technologies (Mardis 2008; Wang et al. 2008; Wheeler et
al. 2008), a new era of individual genome sequencing has begun. As genomes from related
individual organisms are sequenced, it is clear that we have only started to understand the
many forms of genetic variation and their consequences for genome evolution and
biology.
2
Characterizing the mechanisms and forces driving genome evolution is a
fundamental challenge for the field of biology. The first decade of whole-genome
sequencing (-1995-2005) gave a glimpse of macroevolutionary trends in genome structure
(Lynch 2007; Gregory 2005). In the context of a phylogenetic framework, the broad
comparative genome approach has proved to be an informative and powerful strategy for
cataloging genomic differences and similarities. However, the signatures of evolutionary
events are quickly masked by subsequent divergence. For example, an extreme bias
towards transition substitutions in animal mitochondrial DNA becomes less apparent as
comparative distances increase, due to saturation. To preempt the erosion of signal in
newly arisen genetic novelties, highly related genomes must be compared. For instance,
newly arisen mutant alleles such as an intron loss (Llopert et al. 2002) or gain (Omilian et
al. 2008) have more information about their origin and fate when discovered and
described in the context of population genetic data. The mutational processes responsible
for generating new variants (e.g. point mutation, micro insertion-deletion, duplication,
recombination, transposon activity, segmental duplication and deletion), and the
microevolutionary forces responsible for maintaining them (i.e. drift, selection) can best
be described through the examination of genomic variation within individuals and
populations. As we enter an era of population genomics, the microevolutionary
perspective will help describe genomic variation soon after it originates. With a solid
grounding in the principles of population genetics and with genomic data from closely
related alleles in populations, the genome biologist can begin to more fully and
specifically describe the mechanisms and forces underlying microevolution.
3

Population genomics and evolution
Theodosius Dobzhansky famously stated "Nothing in biology makes sense except
in the light of evolution." (Dobzhansky 1973). Recently, Lynch (2007) extended
Dobzhansky's statement to reflect the microevolutionary perspective when he wrote
"Nothing in evolution makes sense except in the light of population genetics." As more
organisms are fully sequenced, analyzed and compared, the forces affecting genome
content and structure can be detected, leading to an improved understanding of the
processes of genome evolution. Principles of population genetics and molecular evolution
contribute to predictions about how variation, from single nucleotides to genes and large
segmental variants, are proliferated, maintained and purged from genomes. Understanding
how forces of mutation, recombination, drift and selection act to shape the genome in the
process of biological evolution requires a look at how variation, in its many forms,
originates within a genome. From this perspective, comparing two genomes from the same
or highly related species will be more informative than comparing phylogenetically distant
taxa.
Population genomics is an emerging field that promises to deliver direct and
practical insight into personal medicine and modern evolution (Jorde et al. 2001; Butlin
2008; Li et al. 2008; Begun et al. 2007; Tsai et al. 2008; Stranger et al. 2007). Association
studies using genomic variation such as SNPs, copy number variants (CNVs), and
structural polymorphisms are becoming increasingly common (McCarroll and Altshuler
2007; Iuliana Ionita-Laza et al. 2008; Hiroaki and Sato 2008; McCarroll 2008). Similarly,
insights into recent evolutionary pressures on populations are being accelerated by
comparative population genomic approaches that examine polymorphism on a genomic
4

scale (Begun et al. 2007; Hawks et al. 2007; Wang et al. 2006; Zhang et al. 2006; Sabeti et
al. 2007; Tang et al. 2007; Williamson et al. 2007; Anisamova and Liberies 2007; Cutter
and Payseur 2003). As biologists strive to describe and understand how the genome
builds, develops and manages individual organisms, the differences between individual
genome sequences can tell us much more than simple phylogeny, but can serve as a
historical record of the evolutionary forces that act on organisms, helping us understand
how and why genomes change over time. The population genomics paradigm promises a
renaissance of environmental genomic research where the genetic basis of ecological
specialization and adaptation can be elucidated through the examination of genomes from
natural isolates as well as traditional ecological models (Stinchcombe and Hoekstra 2008;
McKay and Stinchcombe 2008; Ungerer et al. 2008; Cooper and Lenski 2000).
The series of projects described below examine genetic variation across the
Daphnia pulex genome from four different scales, but all from the perspective of
population-level molecular evolution. In Chapter 1, SNPs in the nuclear genome are
characterized and examined on a regional and functional basis. Chapter 2 outlines an
analysis of patterns of substitution among recently diverged mitochondrial genomes from
three D. pulex clones. Chapter 4 describes how intron turnover in genes was assayed using
the assembly and shotgun reads of two related D. pulex clones. Finally, in Chapter 4,
patterns of divergence between gene duplicates are quantified using the latest D. pulex
gene predictions. These four aspects of variation arise from different mutational processes
that contribute to the ongoing molecular evolution of the genome and give important clues
to the microevolutionary processes that direct the evolution of the D. pulex genome.
5

Daphnia pulex genome
Arthropods are one of the most diverse and successful animal phyla with millions
of species (Ruppert et al. 2003). Whole genome projects from Arthropoda, however, have
been heavily skewed towards Insecta, an overwhelmingly terrestrial class that includes
many disease model organisms as well as traditional genetics workhorse species (Figure
1-1). Ongoing arthropod genome projects continue to emphasize the insects (Appendix
B). Daphnia pulex was recently tapped as the first member of Crustacea, sister taxon to
Insecta (Dunn et al. 2008), to be fully sequenced. Daphnia is also the first aquatic
arthropod genome sequence. As an outgroup to the many complete insect genomes,
Daphnia pulex will serve an important role in clarifying lineage-specific genetic novelties
(Colbourne et al. 2007) and provide unprecedented opportunities for linking evolutionary
ecology and genomics (http://daphnia.cgb.indiana.edu/files/papersAVhitePaper.pdf).
Arthropoda
Pancrustacea
Insecta
Diptera
1, scapularis D. pulex
j — A . pisum •— P. humanus
B. mori •— A. mellifera •— N. vitripennis
T. casteneum D. melanogaster
A. gambiae
' I—A. aegypti «— C. quinquefasciatus
1-1: Phylogeny of completed arthropod genome projects as of 2008. Common names (from top to bottom) are tick, waterflea, aphid, louse, silkworm, honeybee, wasp, beetle, fruitfly, mosquito (last three). Many species of Drosophila have
6

been fully sequenced and not included here (Drosophila 12 Genomes Consortium 2007).
Commonly known as the "waterflea", Daphnia are globally distributed
microcrustaceans generally found in freshwater lakes and ponds and serve as keystone
species in aquatic food chains as foragers of algae and bacteria and prey for carnivorous
zooplankton and fish. Daphnia have a long history as an ecological model and are one of
the most widely studied model organisms (Peters and de Bernardi 1987; Banta 1939).
The Daphnia system is unique among genomically characterized model systems
for its combination of ecological tractability and vast history of ancient and recent
evolutionary radiation (Colbourne and Hebert 1996). Through an examination of various
scales of genomic variation, the Daphnia molecular toolbox will be expanded to prepare
for the coming age of population genomics where natural genetic variation will be used to
understand the basis of phenotypic evolution (Mitchell-Olds et al. 2007; Benfey and
Mitchell-Olds 2008; Colbourne et al. 2000). Among animal models, Daphnia is quickly
being established as a premier model system for evolutionary and ecological genomics
(Feder and Mitchell-Olds 2003) and promises a unique chance to tie natural genomic
variation to local ecological adaptation (Lynch 1983; Eads et al. 2007). Heavily studied
by limnologists, ecotoxicologists and other ecologists, Daphnia are known to inhabit a
wide variety of aquatic environments, from freshwater to saline, coastal to alpine,
eutrophic to oligotrophic and temperate to arctic. Evolutionary studies have shown that
Daphnia provide a rich model for understanding physiological and morphological
diversification, convergence and adaptation (Colbourne et al. 2000). For instance,
tolerance to toxic cyanobacteria (Hairston et al. 2001), hypersaline conditions (Hebert et
7

al. 2002), predation (Cousyn et al. 2001), acidification and metal contamination (Pollard
et al. 2003) and other anthropomorphic disturbances (Weider et al. 1997) have been
investigated using Daphnia.
Additionally, most lineages of D. pulex are cyclic parthenogens that alternate
between asexual and sexual reproduction (Figure 1-2, left). However, some lineages of D.
pulex have evolved obligate asexuality, where parthenogenesis is the sole mode of
reproduction (Figure 1-2, right). The divergent reproductive modes of Daphnia make
them useful models for studying the genomic consequences of recombination (Paland and
Lynch 2006; Lynch et al. 2008).
Cyclical Parthenogenesis Obligate Asexuality
Figure 1-2: Reproductive mode in Daphnia
Genomic data from Daphnia populations will enable genomicists and ecologists to
combine forces to infer the genetic consequences of environmental disturbance, life-
history (Dudycha and Tessier 1999) and other ecological forces that affect population
parameters. Conversely, with genome in hand, the geneticist can provide candidate loci
that may be evolutionarily and ecologically important (Li et al. 2008).
8

This study examines standing variation across the diploid genome of an individual
microcrustacean, providing a platform to infer the nature of recent mutation, the fate of
which is determined by immediate evolutionary forces. The evolutionary scale of this
population genomics study provides the power to describe recent, ecologically relevant
variation, a stated goal of the Daphnia Genome Consortium.
The 200 Mb Daphnia genome {clone TCO) was sequenced at 9X coverage using
the whole genome shotgun approach (WGS) and Sanger sequencing using libraries of 3,
8 and 40 Kb. The first draft assembly contains 100 N50 scaffolds (the largest scaffolds
that make up half the genome), with scaffold 100 containing 0.5 Mb of sequence (Figure
1-3). The entire assembly contains 30,104 gene predictions, with ~ 20% of the genome
coding for predicted proteins. An additional IX coverage of another D. pulex clone
(TRO) was sequenced, providing additional opportunities for comparative genome
analysis. Daphnia pulex was chosen as the first crustacean genome to be fully sequenced,
a decision motivated by the deep ecological understanding of the Daphnia system and its
modest genome size. The TCO clone was isolated from an ephemeral pond along the
Oregon coast and was chosen for its naturally low heterozygosity.
9

I/)
o
u
Scaffold Number
Figure 1-3: Distribution of N50 scaffold sizes from JAZZ Assembly of D. pulex.
The Daphnia Genome Project is a collaborative effort of the Daphnia Genome
Consortium (DGC) and the Joint Genome Institute (JGI). The Thomas Lab at University
of New Hampshire is a founding member of the DGC and, along with Indiana University,
Utah State University and Dartmouth College, has been a primary contributor to the
development and analysis of the Daphnia genome sequence.
The following chapters describe a series of projects undertaken to describe
genetic variation across the first draft Daphnia pulex genome. With many more Daphnia
genomes to be sequenced in the near future, this research provides a springboard for
further analysis of Daphnia genome evolution. A series of pipelines to systematically
scan the genome for a number of variant types are described. The computational
infrastructure developed for this project will be used for future analysis of D. pulex
genomic data.
10

CHAPTER I
SMALL NUCLEOTIDE POLYMORPHISMS
Background
SNPs and evolution
Small nucleotide polymorphisms (SNPs) are a fundamental form of genetic
variation within populations and are indispensable tools for genetic research. Allelic
variation associated with phenotypic characters can be used to physically map loci
responsible for traits of interest using SNPs as genetic markers (Lynch and Walsh 1998).
SNPs are widely used as molecular markers in association studies used for positional
cloning and medical diagnosis (Altshuler et al. 2008; Donnelly 2008; Hindorff et al.
2008). Additionally, SNPs are important for population studies and evolutionary
research, as SNP patterns (haplotypes) are the basis of tracking gene flow, population
structure and biogeography of populations (Tishkoff and Kidd 2004; Novembre et al.
2008; Gilbert et al. 2007; Lynch and Ritland 1999; Anderson and Weir 2007; Nei 1987;
Weir 1996). For the purposes of this study, patterns of SNPs across the genome are used
to consider recent evolutionary forces acting on the genome.
While the ultimate source of genetic variation is mutation, the maintenance and
sorting of variation in a population involves the combined processes of genetic drift,
11

natural selection and recombination. The patterns of nucleotide polymorphism over a
genome help to identify the magnitude and localization of these important evolutionary
processes. For instance, regions of relatively low SNP density along a chromosome
("SNP deserts") may result from recent selective sweeps that reduce variation at a locus
(Cai et al. 2009; Andolfatto 2007). High rates of recombination, however, can lead to
regions of relatively high SNP density and low linkage disequilibrium within a genome
as higher crossover rates break up associations between alleles. Additionally, SNP
patterns may provide insights into underlying substitution biases and may, ultimately,
reflect mutational trends across a genome.
Observed levels of nucleotide polymorphism within species represent the fairly
recent mutational events that have persevered though evolutionary filters of drift and
selection. Their overall spectrum across the genome includes mutational events that range
from highly deleterious to beneficial, with most substitutions being of the nearly neutral
variety (Kimura 1983; Ohta 1992; Hughes 2008). Most of the polymorphisms detected in
modest population samples involve alleles of intermediate frequency since rare alleles (<
1%) are difficult to sample. While the present analysis includes alleles that range the
entire allele frequency spectrum of the population, it is not possible to infer the allele
frequencies by sampling a single or few diploid genomes (i.e. all SNP frequencies are
50% in this analysis). However, by considering SNPs in different categories of genome
function, we can begin to infer the recent evolutionary pressures acting on regions of the
genome.
12

Neutral theory and population genetics
Neutral theory posits that most polymorphisms within species and fixed
substitutions between species are the result of the random drift of nearly neutral
mutations, rather than of natural selection (Kimura 1983). This view of the predominance
of drift has persevered in the age of genomics, and underlies the statistical approaches to
discovering rare instances of recent selection in the genome (Nielsen 2005; Biswas and
Akey 2006; Tang et al. 2007). The relative role of drift and selection in shaping genome
sequences continues to be an important and dynamic debate that will continue into the
age of population genomics (Hahn 2008; Wagner 2008; Hughes 2008; Lynch 2007; Nei
2005; Bernardi 2007).
While neutral models of genetic evolution have been around since the Modern
Synthesis (Wright 1931), a formalized neutral theory for molecular evolution was
developed by Motoo Kimura, who modeled the dynamics of neutral mutations in finite
populations using math from diffusion theory (Kimura 1955, 1964). The Neutral Theory
emphasizes the effects of genetic drift over natural selection when considering the
turnover of neutral and nearly-neutral mutations in populations (Kimura 1983; Ohta
1992). The formalized theory, applied to molecular evolution by Kimura in the late 1960s
with elaborate mathematical justification (Kimura 1968; King and Jukes 1969; Kimura
and Ohta 1971), gained legitimacy after the empirical study of gene products showed
unexpectedly high levels of molecular variation within and between populations
(Zuckerkandl and Pauling 1965; Lewontin and Hubby 1966; Harris 1966). The traditional
school of thought had attributed intraspecific genetic diversity to balancing selection and
had assumed that natural selection maintained the bulk of measurable variation (Ford
13

1965; Mayr 1963; Dobzhansky 1955; Lerner 1954). Kimura promoted an alternative view
where mutations are rarely selected for, but instead are selected out (purifying selection)
or are selectively neutral. With many nearly-neutral mutations being lost or fixed
randomly, the continuous turnover of many mutations over time would be the basis for
most of the genetic diversity in populations (Kimura 1983; Ohta 1992). With the
proposition that nearly-neutral mutations might explain much of molecular evolution,
neutral theory was tagged as "non-darwinian", since Darwin had emphasized natural
selection as the main force responsible for evolutionary change. But Kimura recognized
natural selection as the main force for adaptation, stipulating that instances of positive
selection at the molecular level are rare compared to allele fluctuations due to drift. In
this sense, neutral theory is consistent with and fully integrates with neo-darwinism (Nei
2005).
Neutral theory does not suggest that most variants have equal fitness, but predicts
that the fixation of allele variants is largely determined by drift and not by weak
selection. For instance, an allele with mildly deleterious functional effects may still
evolve neutrally. The neutral theory emphasizes the role of drift over selection more than
neutrality of function. In fact, Kimura himself wrote that the theory may be better served
being called the "mutation-random drift theory" since functional neutrality is not a
prerequisite for fixation though drift (Kimura 1983, pg. xii). However, a fundamental
implication of neutral theory is the primacy of population size in establishing the relative
importance of drift and selection in evolving populations.
Eventual fixation of mutations by drift can occur even when there is a small
selective force (where fitness is increased or decreased by proportion, s) acting on an
14
allele as long as |s| < l/2Ne. Since the number of new mutants per generation is 2 Neu and
the rate of fixation is l/2Ne, it follows that the rate of substitution of a neutral allele (k) is
2 Neu. (1/2N), or k=jx. In other words, the rate of substitution is independent of population
size and equal to the neutral mutation rate (Kimura 1983). This makes intuitive sense
when you consider that in small populations there are fewer mutations that are each more
likely to be fixed. In larger populations, there are more mutations, but each is less likely
to be fixed. In other words, the probability of fixation in a small population increases
with the same magnitude that the number of mutations is reduced in small population.
Even assuming mutation-selection balance, we should not expect the same magnitude of
genetic variation in small and large populations, however. Since time to fixation is 4Ne
generations (Kimura and Ohta 1969), larger populations will, all things being equal, have
more standing variation at any given point in time. In a nutshell, these theoretical
expectations provide the null hypothesis from which we begin to study variation in
natural populations.
Because sequence diversity (n) is proportional to population size (Ne) and the
mutation rate (u), a population-mutation parameter that describes neutral sequence
diversity, 0, can be used to estimate effective population size (Ne) and mutation rate (u),
since 6 =2Neu. 9 must be inferred from observed levels of heterozygosity within
populations where theoretically ideal conditions are rarely met, so a number of estimators
have been proposed. For instance, silent site diversity (7ts), a measure of per site
heterozygosity, is calculated from synonymous sites of protein-coding genes to minimize
any purifying or adaptive selection that may interfere with a measure of 0. Recent
population bottlenecks will depress all measures of 0 across the genome, while variance
15

in 6 across loci within a genome is attributable to local changes in mutation rate and/or
recent localized selective pressures. Using these principles, the well-known HKA test
(Hudson et al. 1987) uses within and between species variation to test for selection across
multiple loci. If assuming a constant Ne among populations, loci that are outliers to the
correlation of divergence and polymorphism are candidate targets for positive (lower
polymorphism) or balancing (higher polymorphism) selection. In this way, the local
measures of polymorphism and divergence can be used to scan the genome for candidate
selective targets.
However unrealistic many of the assumptions of the model may be, population
genetic analysis begins with the standard neutral model. This model assumes a randomly
mating, demographically stable population where mutations are neutral across infinite
sites. These ideal conditions serve as a null model from which violations are detected and
other forces, such as local selection, mutation heterogeneity and recombination, are
proposed.
Most mutations are quickly lost in large and small populations, where the
probability of fixation of a neutral allele is equal to its initial frequency (1/2N in
diploids). While positive selection (s > 0) reduces the probability of a rapid initial exit of
a beneficial allele, most new mutations, neutral or beneficial, are eventually lost (-30%
chance of being lost in first generation!). Tightly linked nucleotide sites are transmitted
across generations as a unit depending on rate of recombination (c). Linkage causes
fixation rates of beneficial mutations to be lower and of deleterious alleles to be higher,
since beneficial alleles will spread slowly when inhibited by the baggage of their genetic
backgrounds, a phenomenon known as selective interference (Hill and Robertson 1966;
16

Birky and Walsh 1988; Comeron et al. 2008; Gordo and Campos 2006). Because drift
dominates selection as effective populations decrease in size, the range of mutations that
are effectively neutral is inversely proportional to Ne. In other words, selection can "see"
a greater range of s (hence a larger proportion of mutations) in larger populations (Lynch
2006; Yi 2006; Lynch 2007).
The frequency of meiotic recombination (c) within evolving populations controls
long-term genetic opportunities by modifying the effective number of independent
selective targets in the genome. For instance, the maintenance of neutral and/or beneficial
genetic combinations may be decoupled from the elimination of deleterious factors when
alleles are shuffled during meiosis. By constantly trading alleles, a sexual population of
individuals ensures that, over time, targets of negative selection are pressured
independently from targets of positive selection. Genetic hitchhiking of neutral and
deleterious alleles during selective sweeps increases the overall magnitude of drift within
infrequently recombining populations (i.e. asexual or self-fertilizing lineages). Even in
low recombining regions of fully sexual genomes, the increased role of hitch-hiking
(genetic "draft") reduces the efficiency of natural selection (Gillespie 2000; Gillespie
2004). In fact, Drosophila genomic regions with low levels of recombination show
elevated levels of replacement substitution and intron divergence (Haddrill et al. 2007) as
well as elevated gene expression levels, possibly due to the reduced efficacy of purifying
selection, leading to looser regulatory control (Haddrill et al. 2008).
D. pulex is an ideal system for testing neutral expectations in natural populations
because the D. pulex species complex contains well-studied populations distributed
globally in semi-isolated freshwater lakes and pond systems. These populations range in
17

effective size from tiny (where a handful of diapausing eggs found new populations every
season) to extremely large. The extensive history of ecological research on Daphnia
populations means that demographic and biological characteristics can be brought to bear
when analyzing population-genetic parameters. For instance, obligate asexual lineages of
D. pulex are expected to have increased deleterious mutation accumulation due to lack of
recombination and reduced Ne (Lynch 2008; Paland and Lynch 2006; Paland et al. 2005).
SNP studies
Over the past century, the neutralist-selectionist debate in molecular evolution has
swung back and forth. The relative influences of natural selection and genetic drift on
transient genomic features such as nucleotide diversity and gene duplication as well as
ancient, enduring products of evolution such as the genetic code (Koonin and Novozhilov
2008; Massey 2008; Sella and Ardell 2006; Freeland et al. 2000) and the molecular clock
(Wilson and Sarich 1969; Wilson et al. 1987; Hedges et al. 2003; Hedges and Kumar
2003; Ho and Larson 2006), have not been resolved with much certainty. Many of the
predictions of population genetic models have been supported by empirical data. For
instance, large populations tend to have more sequence diversity (Lynch 2006,
Supplemental Table 3; Tishkoff and Williams 2002; Wilhelm et al. 2007; Sauvage et al.
2007) and while relatively few allelic variants have conclusively been shown to have
beneficial (Tishkoff et al. 2007; Hoekstra et al. 2006) or deleterious effects (Palti et al.
2000), small populations tend to have more deleterious variation (Lohmueller et al. 2008;
Cruz et al. 2008), consistent with theory. Neutral theory has been, and remains, an
effective null hypothesis for studying molecular evolution. However, population genomic
18

analysis of polymorphism across multiple, related genomes will be the ultimate test of the
validity of many neutralist claims. The first population genomic studies have called into
question the assumption that most mutations are nearly neutral (Hahn 2007; Begun et al.
2007; Orr 2009; Cai et al. 2009). While the modern form of the neutralist-selectionist
debate is nuanced and a disagreement over degree rather than wholesale worldview, it
may be that "rampant nonneutrality", like that found in Drosophila (Fay et al. 2002;
Smith and Eyre-Walker 2002; Sawyer et al. 2003; Bierne and Eyre-Walker 2004; Shapiro
et al. 2007) makes the current neutral model unrealistic. However, some have questioned
the validity of popular comparative methods for detecting selection (Hughes 2007;
Hughes 2008). It remains to be seen what inferences will be made as variation data
accumulates for other genomes.
Many of the earliest eukaryotic genome projects were carried out on highly inbred
lab organisms (e.g. C. elegans, D. melanogaster, M. musculus) and species with naturally
low levels of polymorphism (e.g. H. sapiens). Because even moderate levels of
heterozygosity can confound de novo assembly, individuals chosen for genome
sequencing are often intentionally inbred. Even in cases where natural isolates are used
for genome projects, low polymorphism individuals are preferred. Genome projects that
possess natural levels of heterozygosity often produce lower quality assemblies (Holt et
al. 2002; Vinson et al. 2005; The French-Italian Public Consortium for Grapevine
Genome Characterization 2007), a significant problem for genomes from populations
with high Ne. Polymorphism data are often collected from skim sequencing of diverged
lineages after an initial high quality assembly is produced (Kasahara et al. 2007; The
Honeybee Genome Sequencing Consortium 2006). However, as the desire for broader
19

sampling of natural populations increase, more attention has been paid to detecting
variation inherent in the diploid genome projects themselves (Levy et al. 2007; Kim et al.
2007; Wheeler et al. 2008; Wang et al. 2008; Holt et al. 2002; Lynch 2008).
Not surprisingly, the deepest sampling of genome-wide diversity has been
collected from H. sapiens, where the International HapMap Consortium has generated a
database of over 3.9 million mapped SNPs from hundreds of individuals from
geographically diverse populations (Frazer et al. 2007). While the central objective for
the HapMap project is to develop SNP markers for biomedical studies, these data are a
boon to the evolutionary biologist (Manolio et al. 2008). Using the SNPs generated by the
HapMap project and other efforts (e.g. Perlegen, Hinds et al. 2005), studies have begun to
identify genomic regions under selective pressures by using a variety of newly developed
computational approaches (Voight et al. 2006; Williamson et al. 2007; Sabeti et al. 2006;
Tang et al. 2007; Sabeti et al. 2007; Wang et al. 2006; Cai et al. 2009; Hawks et al. 2007;
Wright and Gaut 2005; for reviews on genomic approaches for identifying selection, see
Nielsen 2005; Biswas and Akey 2006; Anisimova and Liberies 2007; Jensen et al. 2007;'
Thornton et al. 2007; Pavlidis et al. 2008). These and other recent studies have pioneered
a set of computational approaches that use the SNP and linkage disequilibrium data from
HapMap to model the nature of recent molecular evolution at sites across the entire
human genome. When variation and recombination rates are considered, haplotype sizes
and frequencies can be used to test for the signature of recent positive selection since
targets of a recent selective sweep will show up as large haplotype blocks that rise to high
frequency (Sabeti et al. 2002).
20

SNPs in protein-coding genes have been used to infer selective pressures across
the genome through an examination of the relative levels of silent and replacement
polymorphisms and rates of silent and replacement substitution between lineages (Liu et
al. 2008; Ellegren 2008). Relative levels of nuclear diversity at silent and replacement
site in protein-coding genes reflect the relative power of selection (Graur and Li 2000;
Nielsen 2005; Begun et al. 2007). Recent studies have attempted to use human
polymorphism data to estimate the distribution of fitness effects of new mutations (Boyko
et al. 2008).
While it takes substantial resources to apply population genetic tests on genomic
data sets, the promise of locating genomic regions under recent selection is an exciting
prospect to the evolutionary biologist. While much of the population genomic analysis is
being developed with the massive and well-curated effort of human SNP discovery, other
organisms traditionally favored by molecular evolutionary biologists have seen genomic
surveys of variation put to use for understanding recent evolution. Much of the
pioneering work on detecting natural selection using population genetic data was
developed on the Drosophila model system (Hudson et al. 1987; McDonald and
Kreitman 1991; Tajima 1989; Akashi 1995; Kreitman and Akashi 1995). Recently,
genome-wide SNP distributions were used to detect selection in Drosophila (Begun et al.
2007) and C. elegans (Cutter and Payseur 2003; Cutter et al. 2006).
Since the advent of whole genome sequencing, SNPs have been detected within
diploid genome assemblies (Levy et al. 2007; Wang et al. 2008), between lineages (The
Honeybee Genome Consortium; Lindblad-Toh et al. 2005; Kasahara et al. 2007; Cruz et
al. 2008; Wayne et al. 2007) and from ESTs (Cheng et al. 2004). New approaches for
21

estimating levels of polymorphism from ESTs (Long et al. 2007) and genome assemblies
(Hellmann et al. 2008; Lynch 2008) are being developed to cope with the influx of large
genomic data sets.
The increasing affordability of whole genome sequencing has expanded the
taxonomic sampling of established and non-traditional evolutionary model organisms. As
serious population genomic studies become possible, there is hope that the power to
relate population-level evolution to ecological circumstances has arrived. With a long
history of ecological research, the microcrustacean Daphnia pulex genome is a unique
resource for discovering ecologically relevant variation.
Daphnia variation
Daphnia pulex was chosen for whole genome sequencing based on its proven
utility as an ecological model organism. The potential to decipher ecologically relevant
genetic variation has been a selling point of the Daphnia model. Here, we outline a series
of steps used to detect SNPs in Daphnia pulex by generating conservative estimates of
variable sites on a scaffold-by-scaffold basis. Because the genomic DNA for the Daphnia
Genome Project was prepared from a clonal population started from a single, low-
heterozygosity individual, this study is equivalent to an assay of heterozygosity within an
individual daphniid. However, heterozygous sites within a diploid individual represent
segregating alleles of the larger population, and thus, with this first pass of SNP
detection, we are able to describe some patterns of genetic variation across the whole
genome of the species Daphnia pulex.
22

The source of the Daphnia genome sequence used in this study (clone TCO, "The
Chosen One") comes from a geographically isolated sexual, diploid population with
reduced long term effective population size relative to other populations (Omilian et al.
2008; M. Lynch, personal comm.) The TCO clone was chosen among natural isolates for
its relatively low heterozygosity, possibly attributable to its history of population
bottleneck. The population-genetic implications for a genome from a clade with a
considerably smaller long term effective population size invites future genome
comparisons with other D. pulex lineages. Using another natural isolate, TRO ("The
Rejected One"), we were able to compare relative levels of variation across the genome.
TRO was isolated from the core D. pulex group and is substantially diverged from TCO.
In order to identify small nucleotide polymorphisms (SNPs) within the Daphnia
pulex genome, a pipeline of analyses that uses the comparative assembly of whole
genome shotgun reads against reference scaffolds was developed to conservatively
estimate sites of true polymorphism within TCO, the clone of the Daphnia Genome
Project. This study offers a first pass of the genome-wide level of polymorphism and
identifies a large number of variable sites in the ecological model organism, Daphnia
pulex.
23

Methods
Comparative Assembly (TCP)
The Daphnia Genome Project produced 2.7 million reads with an average length
of 1011 base pairs (bp). The trace files containing the raw sequence reads were
downloaded from NCBI (http://www.ncbi.nih.gov/Traces/trace.cgi?) and trimmed for
vector and quality using the LUCY program (Chou and Holmes 2001). The output from
LUCY was trimmed using the Perl scripts lucyTrim and lucyTrimQual (Appendix C).
The LUCY program purges vector sequence and identifies optimal trimming points for
the 5' and 3' ends of each raw read based on quality score information. We used the
default LUCY parameters and the vector sequence of pUC 19 as input to LUCY.
Quality-trimmed TCO shotgun reads (~9X) were assembled against the 100
largest scaffolds (N50-100) of the latest Daphnia JAZZ assembly (Draft 1.0) using
AMOS Comparative Assembler (Pop et al. 2004) on Fedora 9 using a Dell Dimension
9200 with a 2.40 GHz Intel Core 2 Duo processor and 3 Gb RAM. After assigning each
shotgun read to a scaffold using a best blast hit filter, a 98% minimum pair-wise identity
cutoff was applied for the AMOS comparative assembly. Assembly information used to
detect SNPs was generated by AMOScmp output files for each scaffold assembly.
Steps were taken to minimize the contribution of highly paralogous regions in the
SNP analysis (through a coverage filter and best-blast assignments) and to include sites
with a low probability of sequencing error (quality trimming and double evidence
criteria). For these and other reasons, this analysis excludes up to a third of sites in the
N50. While exclusions were mostly due to undetermined sequence in the reference
scaffolds (Ns), the effects of sequencing error and poor sequence quality were minimized
24

with initial quality trimming and a rejection of ambiguous sites. Therefore, the SNP calls
reported here have a high probability of being true sites of allelic variation, but
underestimate the magnitude of genomic variation. A correction for undersampling is
discussed later.
In order to identify SNPs in the Daphnia pulex genome, a stringent set of criteria
for defining variable sites as true SNPs was implemented. The criteria are outlined below:
1. Trimming of raw sequence reads to improve average quality scores and purge ambiguous data and vector sequence.
2. Best blast hit filter to assign reads uniquely to scaffolds.
3. Assembly of trimmed reads to reference scaffolds with a minimum 98 percent pair-wise match requirement.
4. Rejection of sites with excessive coverage to minimize identification of variable sites due to paralogous misassembly.
5. Exclusion of variable sites that contain more than two types of nucleotides.
6. Counting only SNPs with at least two reads of each variant type of nucleotide.
Since the accuracy of the subsequent SNP analysis depends on the average quality
of the input sequence information, the reduction of information due to trimming gave us
more confidence for all SNP calls by minimizing low-quality base calls.
Based on the AMOS assembly and the delta file, the number of reads that occurred
at each base was calculated. The percent coverage across each scaffold of the reference
sequence was calculated using the Perl script avgCoverage.
A binomial probability distribution can be approximated by Poisson when N( x) is
large and p(x) is small. Assuming the absence of a strong cloning bias for a given
genomic region, the sequence coverage of reads in a shotgun genome project follows a
25

Poisson distribution. The probability (P) of a given nucleotide being sequenced JC times
based on an average genome coverage of X is given by :
X 1JT
P{x,A) e~AA;
xl
Using the estimated average coverage, we
calculated the expected coverage probability as a function
of x, the number of sequence reads at any base. Using this
distribution, we determined the value of x at which 99% of
the genome would be covered at least once. This defines
an upper bound to x, xmx- Regions where the coverage
exceeds this value are more likely to have extra coverage
due to the alignment of reads from paralogous regions from
elsewhere in the genome. These regions were therefore
excluded from further analysis. Simple sequence repeats
(homopolymers and micro satellites with 8 repeats or
greater) were excluded from our SNP analysis since
variation at simple sequence repeats are a unique category
of polymorphism that are being studied in a separate
analysis (Sung et al. in prep). Additionally, regions in
the scaffold where blocks of undetermined sequence are
located (represented by Ns) were also excluded.
SNP Pipeline
Reference Reads
Lucy Trim
Format reads to AMOS
(tarchive2amos)
Text formatted alignment of reads to reference (SeqAlignGenerator)
Apply SNP Criteria (coverageFiiter)
SNPs
Figure 1-1: Flowchart of SNP pipeline
26

A site-by-site list of the nucleotides that assembled to each location in each
reference scaffold was generated using the Java program, SNPfinder was generated. The
output includes the reference base and a list of nucleotides
that aligned to the reference at each site.
With the goal of identifying true SNPs, stringent criteria that minimized false
assignment due to paralogous assembly or sequencing error were implemented. The Perl
script SNPFilter generates data from loci with maximum and minimum numbers of
aligned nucleotides with user specified SNP criteria. For instance, additional criteria also
required that a SNP have at least two nucleotides of exactly two variant nucleotide types
in order to reduce SNP calls due to sequencing error. SNP determination was completed
by counting the number of base substitutions or indels per site. The output of the program
SNPFilter contains the SNP locations from our scaffold, the reference base call, and the
bases within the trimmed reads at each reference site.
Perl scripts to analyze SNP variation within the data were created. In order to
view SNP variation across the scaffolds a Perl script SNPvariationWindow was used,
which enables us to view variation at different window sizes. We analyzed our data using
a 100-100,000 bp window sizes. High, moderate and low SNP density regions we
examined to test for paralogy using BLAST against all the reference scaffolds.
The Perl script kindOfSNP outputted the totals of all SNP types (i.e. transitions,
transversions, and indels). Sequential SNPs were found using the script, clusterSNP. We
produced an output file that determined how many SNPs were in clusters of two, three,
four, etc.
27

Based on the window analysis, there were two classes of SNP bins, one with no
SNPs and one with SNPs. To test whether the two classes of SNP bins were randomly
distributed we tested for significance using a normal approximation for the number of
runs (r) where u.r is the mean and or is the standard deviation. Sokal and Rohlf (1981,
pgs. 782-787) proposed a runs test which calculates the standard deviation of r:
_r-/lr_ r-\lnln2l{nl + n2)\-l
Gr J\lnln2{2nln2 - nx - n2)]/[(ftj + z ^ ) 2 ^ + n2 -1)1
Here ni is the number of bins with SNPs andn2 is the number of bins with no SNPs. If ts
>1.96, then the distribution differs statistically from a random assortment of the two bin
classes.
Comparative Assembly (TRO)
Shotgun reads from D. pulex clone TRO (IX) were quality-trimmed and
assembled to the TCO draft assembly N50 scaffolds. Based on the preliminary
distribution of blast hits (Figure 1-2), average divergence of TRO reads was estimated at
4.5%. Using the expected distribution around this average, the minimum pair-wise
identity for comparative assembly was set at 90%. TRO reads were assigned to the N50
scaffolds using a best-blast test for unique placement and assembled using the
AMOScmp (described above).
28

0.07
0.06
0.05 >-c 0.04 <u 3
S" 0.03 u-
0.02
0.01
0
80 85 90 95 100
Percent Identity
Figure 1-2: Distribution of genetic identity of TRO reads mapped to the TCO assembly.
Analysis of the TRO-TCO comparative assembly was carried out using a
combination of custom scripts. Because of the low coverage, we considered sites
containing 2-4 X coverage to examine heterozygosity (within TRO) and 1-4X to measure
divergence (between TRO and TCO). Results are described below.
Results and Discussion
Pre-assembly quality control
LUCY trimming reduced the number of raw TCO shotgun reads from 2.7 to 2.5
million and cut our average sequence length to 774 bp (Table 1-1). The reduction of total
sequence information (28.6%) after vector and quality trimming is proportional to that of
other large data sets (unpublished data). Trimming the raw reads increased average
quality score to 40, reducing the expected probability of sequencing error to 0.0001 per
site.
29

Raw shotgun reads
LUCY-trimmed reads
# reads
2,724,771
2,542,760
avg. length
1,012
774
QS
31
40
Total sites
2,756,774,088
1,968,938,346
% reduction
n/a
28.6%
Table 1-1. Pre and post LUCY-treated data. Average quality scores (QS) improved nearly 10X.
Comparative Assembly (TCP vs. TCP)
Comparative assembly of 9X shotgun reads against N50 scaffolds of the Daphnia
JAZZ Assembly 1.0 produced 100 separate assemblies ranging from 6.6X to 9.9X
average coverage (Figure 1-3). Pverall, the comparative assemblies produced an average
coverage of 8.8X (Figure 1-4), slightly less than the predicted sequencing coverage of the
raw reads (9X). This is reasonable considering the error associated with estimating
genome size and other factors such as non-assembled reads reducing actual coverage,
contamination sequence (non-D. pulex DNA), and an edge effect which depresses
comparative assembly at the ends of scaffolds and near gaps between contigs.
Additionally, highly diverged alleles (>2% different) will fail to assemble. These factors
all contribute to depressing coverage in the comparative assembly.
General platykurtosis of the actual coverage distribution is mostly due to the
enrichment of low coverage sites (Figure 1-4, left tail), which may be due to single allele
assembly in some regions and possible paralagous assembly in others, although to a
lesser degree. While most N50 scaffolds assembled with normal average coverage, 4
scaffolds had particularly low coverage (scaffolds 30, 71, 93 and 98). These scaffolds
30

also have relatively high polymorphism levels (Figure 1-8). Our criteria may have
excluded a higher proportion of reads from these assemblies where allelic divergence was
» 2%.
f i W t w w v i r t Y i r w w w w i W i w r m ^ w ^ ^
Scaffold Number
Figure 1-3: Average coverage of assemblies ranged from -6.5X —9.9X
Actual
Poisson
0 1 2 3 4 5 6 7 8 9 10 11 12 13 14 15 16 17 18 19 20
Coverage
Figure 1-4. Frequency of coverage for all sites of N50 comparative assembly of TCO. (Average = 8.8X)
Scope of study
This analysis sampled roughly 40% of the 200 Mb Daphnia pulex genome after
discarding sites that failed to satisfy our criteria (Figure 1-5). Because we began the
31

analysis using the best assembled half of the genome (N50 scaffolds), there is reason to
believe that we sampled a biased set of sites, avoiding highly repetitive regions or areas
that failed to produce continuous stretches of unique sequence in the de novo assembly.
However, just over 50% of predicted genes are in the N50, indicating that the best half of
the assembly is not biased with respect to gene density.
no coverage
Figure 1-5. Breakdown of N50 sites under our criteria from the comparative assembly. We analyzed roughly 40% of the D. pulex genome ((200 Mb x 0.81 x 0.5)/200Mb). "Ns" refers to undetermined sequence in scaffolds. "Under" includes sites with 1-3X coverage, "Over" with >16X. "SS" refers to simple sequences with >8 repeats.
Magnitude of variation
The observed average heterozygosity for single base substitutions in TCO was
0.00101 per site across the genome. The average heterozygosity of TRO is much higher
at 0.0144 per site. This enormous difference in nucleotide diversity shows that
intraspecific lineages can range in natural levels of polymorphism by over an order of
32

magnitude. Average divergence between TCO and TRO at single nucleotide sites was
0.02499 per site. Single insertion-deletion polymorphisms contribute significant variation
in both clones, adding 0.000268 in TCO and 0.0155 in TRO. For all observed levels of
heterozygosity within TCO, the estimates are downwardly biased by at least 12.8%
(based on expected coverage) and 17.9% (adjusted for actual coverage), due to binomial
undersampling alone. For TRO, where only sites between 2-4X were used to estimate
heterozygosity, 11.4% undersampling is estimated.
SNP types
A majority of the polymorphisms detected in this analysis are single site
differences (68%, Figure 1-6). Base substitutions were classified into six types, according
to the base subtitutional matrix (Figure 1-7). Most indels were part of larger insertion-
deletion events. For the range of sequential indels detectable in this analysis, average
indel size was 3.5 bp.
Sequential Indel 46,988
Single Indel 24,435
Sequential Base 7630
Single Base 91,879
33

Figure 1-6. 170,932 polymorphic sites fall into 4 major categories.
purines
pyrimidines
transversions
c T Figure 1-7: Base substitution matrix.
34

Scaffold Number 51
era' c l-t
0 0
O U 3 ^ ^ 0 0 0 0 t o v J ^ ^ ^ 0 1 0 ^ C T i U 1 U n U 1 . P » * » 4 ^ 4 ^ 0 J U J W M M M I - - » > - » l - » l - - » 0 ^ 4 ^ M C 3 0 U 1 M ^ a i W O ^ J ^ l - > 0 0 0 1 M l D C r i U O O ^ J - t i l - ' O O U l M U 3 C h U J O v l * » l - »
1-1 CP
J2 c CD 3 0
^ O >-b 00 2 ^ f -+
v: ^3 ct> c« a4
v; t / i 0 P t±> £f> 0 P*
-n - 1 fl>
JO
c fD 3 O
< "En N
P/bp)
0
b 0 i->
p b 0 N>
O
b 0 OJ
0.004
J . J . L J . J » 1,
o o
O
o
HI! 1 1 I
1
r| II
rt> aq 3
3 tal ind
CD
;ingl
n> 3 CL
legrjie
3 tal
z: T>
.1 !£ 2

The frequency of small sequential indels (2-20 bps) across the genome follow a
negative exponential distribution (Figure 1-9). However, sequential indels are more
common than would be expected if each indel substitution occurred independently. For
instance, using the observed single indel frequency of 0.000268, the expected number of
sequential indels of size 2 would be 7. For sequential indel size 3, the expected number of
observation would be 0. It is therefore likely that most sequential indels arose from single
mutational events. The distribution of sequential indel substitutions observed in D. pulex
is similar to that observed in C. elegans (Solorzano et al. in prep). Sequential base
substitutions (Figure 1-10) are likewise thought to be part of larger mutational events.
There may be an ascertainment bias in the observed distribution of sequential SNPs since
the likelihood of detection is expected to decrease as larger segments fail to assemble
under our strict criteria. However, it is clear that sequential SNPs, especially indels, are a
prevalent class of polymorphism in the D. pulex genome (Figure 1-6).
10000
1000
o 100
! 10
11 ~ i — i — i — I — i — i — i — 3 — i — I — T s — ! — r ~ i — i — i — i — i — i
2 4 6 8 10 12 14 16 18 20 22 24 26 28 30 32 34 36 38
Sequential Indel Size
Figure 1-9: Distribution of sequential indels found within TCO.
36

10000
3jT 1000 ^ H L — — ————
j? 100 — ^ B | H 1: JLlJ 2 3 4 5 6
Sequential Sequence Size
Figure 1-10: Distribution of sequential base substitutions within TCO.
From an analysis of base substitutions, we found that roughly half are transitions
(Figure 1-11). Overall transition/transversion ratio (Ts/Tv) ranges from 0.468 to 1.196
across the scaffolds, for an average of 0.923 (Figure 1-12). If all base substitution types
occur at equal rates, the expected Ts/Tv should be 0.5 (2 types of transitions/4 types of
transversions, Figure 1-7). Transition bias (Ts/Tv >0.5) is widely observed among
metazoan nuclear DNA comparisons (Jiang and Zhao 2006; Cargill et al. 1999; Gojobori
et al. 1982; Collins and Jukes 1994; Lindblad-Toh et al. 2000; Rosenberg et al. 2003) and
thought to be driven by underlying chemical properties of DNA that favor transition
mutations, specifically the deamination of cytosine (Wakeley 1996). Zhao at el. (2006)
found Ts/Tv to be related to GC. A few studies have found no transitions bias, depending
on the type of sequences examined (Keller et al. 2007; Moriyama and Powell 1996).
•
37
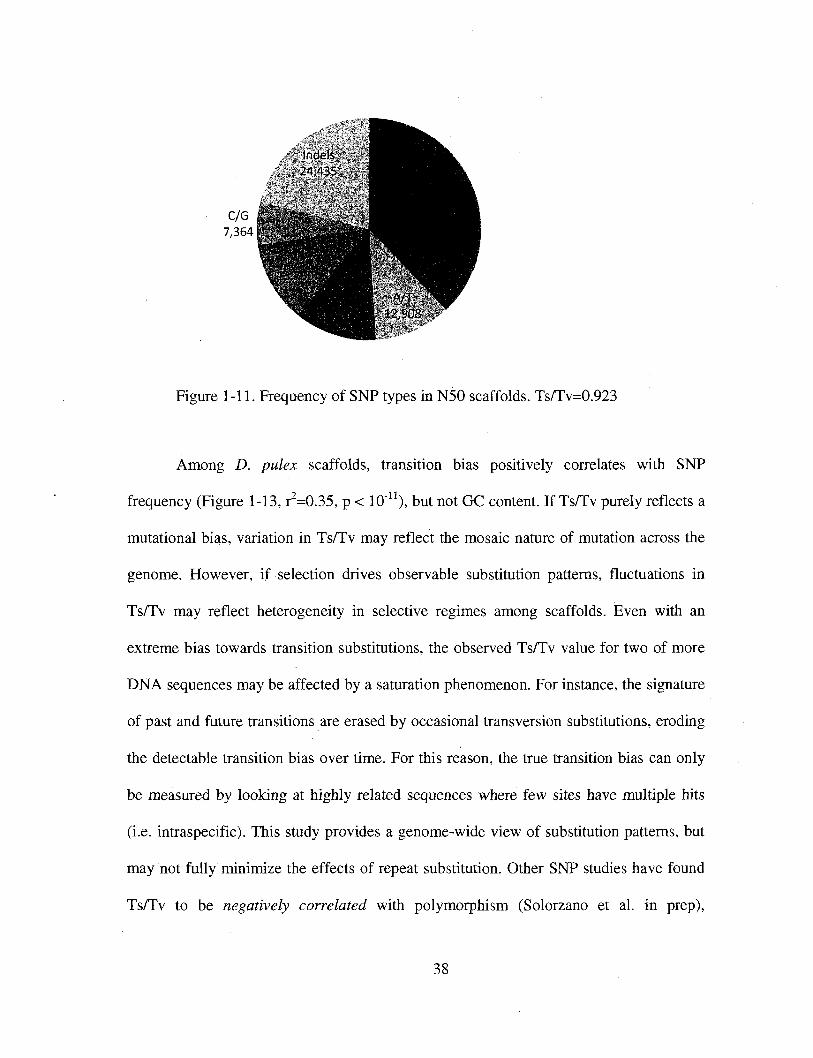
Figure 1-11. Frequency of SNP types in N50 scaffolds. Ts/Tv=0.923
Among D. pulex scaffolds, transition bias positively correlates with SNP
frequency (Figure 1-13, 1^=0.35, p < 10"11), but not GC content. If Ts/Tv purely reflects a
mutational bias, variation in Ts/Tv may reflect the mosaic nature of mutation across the
genome. However, if selection drives observable substitution patterns, fluctuations in
Ts/Tv may reflect heterogeneity in selective regimes among scaffolds. Even with an
extreme bias towards transition substitutions, the observed Ts/Tv value for two of more
DNA sequences may be affected by a saturation phenomenon. For instance, the signature
of past and future transitions are erased by occasional transversion substitutions, eroding
the detectable transition bias over time. For this reason, the true transition bias can only
be measured by looking at highly related sequences where few sites have multiple hits
(i.e. intraspecific). This study provides a genome-wide view of substitution patterns, but
may not fully minimize the effects of repeat substitution. Other SNP studies have found
Ts/Tv to be negatively correlated with polymorphism (Solorzano et al. in prep),
38

suggesting that high SNP regions may be older and influenced by the transversion-
saturation phenomenon. The positive correlation found here suggests other factors may
be at play (e.g. mutation heterogeneity, wide selection on substitution type).
l >
2 o to
5 £ 9 |
13 5 1 7 EJj 21 r=
25 %
29 :§
33 |
37 |
41 Efc
45 r |
49 |
53 Ejj 57 |
61 %
65 S
69 |
73 |
77 |
81 %
85 |
89 |
93 E=
97 |
0.2 0.4 0.6 0.8 1
Transition/Transversion Ratio (Ts/Tv)
1.2 1.4
Figure 1-12: Transition/transversion ratio (Ts/Tv) for TCO polymorphisms by scaffold.
39
0.003
0.0025
0.002 w
"5? 0.0015 Q.
z 0.001
0.0005
^%f—!***
~w «# *w® • • 1 ' • ! — 1 r — 1 , , j — - _ _ _ _ ,
0.4 0.5 0.6 0.7 0.8 0.9 1 1.1 1.2 1.3 1.4
Ts/Tv
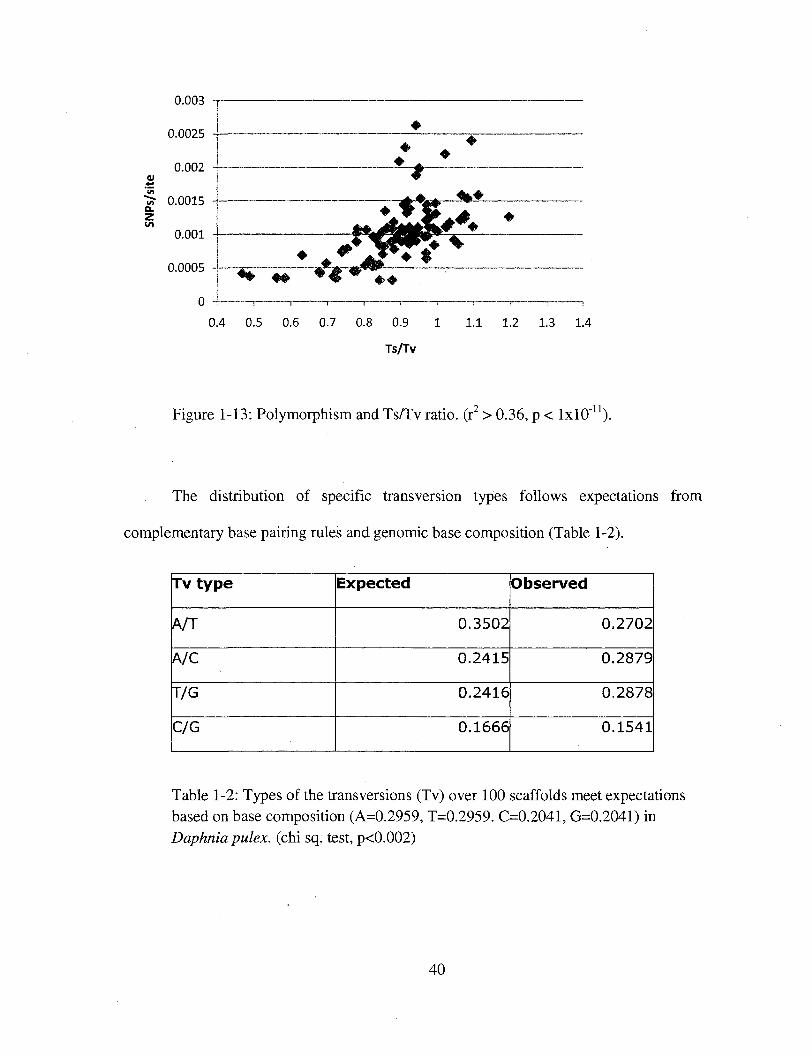
Figure 1-13: Polymorphism and Ts/Tv ratio, (r2 > 0.36, p < lxlO"11).
The distribution of specific transversion types follows expectations from
complementary base pairing rales and genomic base composition (Table 1-2).
Tv t y p e
A/T
A/C
T/G
C/G
Expected
0.3502
0.2415
0.2416
0.1666
Observed
0.2702
0.2879
0.2878
0.1541
Table 1-2: Types of the transversions (Tv) over 100 scaffolds meet expectations based on base composition (A=0.2959, T=0.2959. C=0.2041, G=0.2041) in Daphnia pulex. (chi sq. test, p<0.002)
40

Functional distribution
SNP types were examined separately in exons, introns and intergenic sequences
across the genome. Base substitutions and indels were more frequent in non-coding
sequence and transition bias was more pronounced in exons (Figure 1-14), a signature of
selection against replacement substitutions.
m Exon HBBE H H : . Elntron
H I ,- 3 Intergenic
SNPs/kb Indels/kb Ts/Tv
Figure 1-14. Frequency of base substitutions and indels in three major functional categories of sequence type (base substitutions/1 OOObp) and transition bias (Ts/Tv).
Overabundance of base substitutions in third positions (Figure 1-15) may result
from selection against replacement substitutions (Kimura 1977), which mostly occur at
second and first positions of codons. Replacement to silent substitution ratio (R/S) was
1.2, well below a neutral expectation of ~3, suggesting overall purifying selection in
protein-coding sequence among segregating alleles. Humans, C. elegans and cichlid fish
are estimated to have genome wide R/S of 0.8 (Liu et al. 2008), 1.3 (Solorzano et al. in
prep) and 1.54 (Loh et al. 2008), respectively. Evidence for purifying selection on
synonymous sites is mounting (Chamary et al. 2006; Parmley et al. 2006; Resch et al.
41

2007). Reis and Wernisch (2009) relate levels of codon usage bias (translational
selection) to expression levels in a pan-eukaryotic study.
60
50
40
% 30
20
10
0
Figure 1-15. Distribution of base substitutions in exons.
Physical distribution
In order to understand how polymorphism varies across regions of the genome,
data were analyzed on a scaffold-by-scaffold basis. Scaffolds varied in overall SNP
frequency from 0.32 SNPs/1000 bp to 2.63 SNPs/1000 bp (Figure 1-16). While no
scaffolds showed significantly low overall polymorphism levels, 5 scaffolds had
particularly high SNP rates (scaffolds 30, 44, 59, 64 and 98, Figure 1-16). Scaffold 30
and scaffold 64 were mapped to chromosomes 2 and 3, respectively, suggesting that high
SNP regions do not necessarily map to the same chromosomes.
The source of high relative rates of polymorphism within a genome can be boiled
down to few general possibilities. Mutation rates may be heterogeneous (Baer et al. 2007;
Fox et al. 2008; Gaffney and Keightley 2005; Malcolm et al. 2003; Wolfe et al. 1989).
42
Codon Position

Exceptionally high recombination rates would minimize polymorphism-clearing effects
of hitch-hiking (i.e. low linkage disequilibrium). Recent introgression of diverged
lineages may also leave a signature of high polymorphism in regions with the acquired
alleles (Castric et al. 2008). Additionally, balancing selection in low-recombining regions
would maintain high levels of polymorphism in a population (Charlesworth 2006;
Hedrick 2007). Interestingly, Lawniczak et al. (2008) recently reported a positive
relationship between polymorphism and expression variation. Further investigation of
high polymorphism regions of the D. pulex genome will examine these and other
contributing forces.
43

01 .fi
E 3 2 o (0 u L0
1
4
7
10
13
16
19
22
25
28
31
34
37
40
43
46
49
52
55
58
61
64
67
70
73
76
79
82
85
88
91
94
97
100
0.5 1.5 2
base substitutions/1000 bp
2.5
Figure 1-16. Scaffold-wide base substitution frequency. Min = 0.32/1000, Max = 2.63/1000 bp. Average frequency across N50 = 1.01/1000 bp. High polymorphism scaffolds in red.
44

Over half (59/100) of the largest scaffolds could be assigned to chromosomes
based on a combination of genetic map and paired-end data (Figure 1-17). While
scaffolds on chromosomes 2 and 3 have a higher average SNP frequency, the differences
are insignificant when variance is considered.
!
!
Scaffold j s s i
eihiir., i 2 3
e 1
I l l J J . . r l r l m M W «l HI i m «* «o n » w » * f « ? o
® 1 M12
Figure 1-17: Polymorphism on mapped scaffolds.
Recombination
Theory suggests that nucleotide diversity will positively correlate with
recombination rate as genetic hitch-hiking of neutral alleles (which reduces diversity) is
reduced by higher crossover frequencies (Smith and Haigh 1974; Begun and Aquadro
1992; Kaplan et al. 1989). Both purifying and adaptive selection will clear neutral
variation in low-recombining regions (Charlesworth et al. 1993; Hudson and Kaplan
45

1995). For those genomes with high quality genetic maps, evidence from many genomes
appear to support this (Beye et al. 2006; Payseur and Nachman 2002; Betancourt and
Presgraves 2002; Kulathinal et al. 2008). Some have suggested that the correlation of
diversity and recombination is due other factors such as the mutagenic effects of the
recombination process itself (Spencer et al. 2006; Bussell et al. 2005; Hellmann et al.
2003) or the co-variation of diversity and recombination with other variables. Even in
genomes where diversity correlates with recombination rate, divergence may not (Begun
et al. 2007). Recombination landscapes may evolve rapidly (Winckler et al. 2005;
Crawford et al. 2004; Ptak et al. 2005), therefore current recombination rates may be a
superior predictor of diversity, but not divergence. This would explain why both diversity
and divergence correlate with recombination when mapped at a fine scale (Kulathinal et
al. 2008; Noor 2008).
Cristescu et al. (2006) published the first genetic linkage map of D. pulex,
describing the segregation of 185 polymorphic microsatellite markers in 129 F2 progeny
of two divergent lineages. While their genetic map is not dense, their map assigned
markers to 12 linkage groups, presumably corresponding to the 12 chromosomes,
providing the platform to compare physical and genetic maps using the genome
assembly.
For the purposes of this study, scaffolds were assigned to linkage groups from
Cristescu et al. (2006) and, where two or more markers could be mapped to the same
scaffold, genetic distances (cM) were divided by physical distances (Mb) for an estimate
of recombination rate (cM/Mb) (see Appendix E). Estimates of average recombination
rate were extremely high compared to other mapped invertebrates (Beye et al. 2006;
46

Severson et al. 2002; Wicks et al. 2001; Yasukochi 1998), however an improved genetic
map for D. pulex is necessary for a robust analysis. The low density of markers (185) and
modest sampling of the F2 generation (129 individuals), combined with some problematic
genotyping issues (Cristescu, personal coram.), the first generation linkage map for D.
pulex has limited power to precisely measure recombination rates. For the regions of the
genome where recombination rates could be estimated, SNP frequencies were compared.
No correlation between recombination rate and polymorphism was detected (Figure 1-
18).
a z I/)
I
0.600
0.500 -f
0.400
0.300
£ 0.200 a z 0.100
0.000
1 1 * t~ -i I
i \
4F~
* • • 1 — - — _ _ _ _ _
_ _ _ J _
-
• '
: : —
"V
'
0.0 20.0 40.0 60.0
Recombination Rate (cM/Mb)
80.0 100.0
Figure 1-18: SNP frequency does not correlate with estimates of recombination rate in D. pulex. (r2< 10"5, p > 0.94)
Windows Analysis
Unitary single base substitutions and single indels within TCO and TRO were
examined across all scaffolds using a windows analysis of varying size (e.g. Figure 1-19).
Windows with and without SNPs were not randomly distributed within scaffolds based
47

on a runs test of the 1000 bp window output. Using 1000 bp windows, over 250 regions
of the genome were found to have unusually high numbers of consecutive windows
(>10kb) without SNPs (Appendix F). Low SNP density regions of the genome may result
from selective sweeps (Cai et al. 2009; Sabeti et al. 2002; Diller et al. 2002). Rampant
gene conversion among alleles may also lead to increased homozygosity, however the
scale of conversion is generally quite small (i.e. 1-500 bp, Chen et al. 2007; Xu et al.
2008). The low polymorphism regions detected in the D. pulex genome are >10kb
(Figure 1-20), have typical gene density and are not enriched for recent gene duplicates
or large gene families, which are thought to have increased rates of gene conversion
(Teshima and Innan 2003; Nei and Rooney 2005; Pan and Zhang 2007).
1.8
Q. .Q O O O «-( (A Q.
z l/>
1.2
1
0.8
0.6 0.4
0.2
0
500 1000 1500 2000 2500 3000 3500
1000 bp windows
Figure 1-19: Fine-scale windows analysis of SNP frequency across scaffold 1.
48

0.006
0.005
« 0.004
g" 0.003
z 0.002
0.001
~#~#- • * -
- * -
-<#-•-
- * -
0 4-
1839 1849 1859 1869
1000 bp windows
1879 1889
Figure 1-20: A ran of 1000 bp windows with 0 SNPs along scaffold 1.
Using the windows analysis, polymorphism levels in TCO and TRO were
compared. The following figures depict the difference in relative rates of single indels vs.
base substitutions in TCO vs. TRO (Figures 1-21 through 1-30). For example, the indel
rate is generally equal to base substitution rate in TRO, but relatively lower in TCO. TCO
polymorphism levels are consistently lower than TRO, but more highly variable across
scaffolds. Within each clone, rates of indel polymorphism often track with base
substitutions, as would be expected in a neutral model where polymorphism levels are
affected by evolutionary forces acting locally on genomic regions. However, many
regions exist where relative levels of indels and SNPs diverge significantly (see TCO,
scaffold 1, 6xl0"5bp). Both selective and mutational forces may explain such phenomena.
However, when indels and base substitutions diverge in magnitude, it is unlikely to be
due to sweeps in regions of high linkage disequilibrium, since all variant types would be
affected.
49

Polymorphism levels in TCO and TRO do not correlate globally, although some
local correlations exist. Considering the substantial time of divergence between TCO and
TRO, it may be unlikely that selective forces acting on a common ancestor would be
detectable. Therefore, while long-term, wide-net background (purifying) selection in both
lineages would be detectable as low-polymorphism regions in both, there should be little
expectation that polymorphism levels between the two lineages will track.
0.1
0.01
£ 0.001
0.0001 -
0.00001
t3^g^j^^£^ 10 15 20 25 30 35 40 45
Figure 1-21: Distribution of polymorphism across scaffold 1 in TRO (Base substitutions=Green, Indels=Purple) and TCO (Base substitutions=Blue, Indels=Red)
50

1
0.001
0.0001
0.00001
10 15 20 25 30 35 40
Figure 1-22: Distribution of polymorphism across scaffold 2 in TRO (Base substitutions=Green, Indels=Purple) and TCO (Base substitutions=Blue, Indels=Red)
0.01
0.001
0.0001
1E-05
10 15 20 25 30 35 40
Figure 1-23: Distribution of polymorphism across scaffold 3 in TRO (Base substitutions=Green, Indels=Purple) and TCO (Base substitutions=Blue, Indels=Red)
51
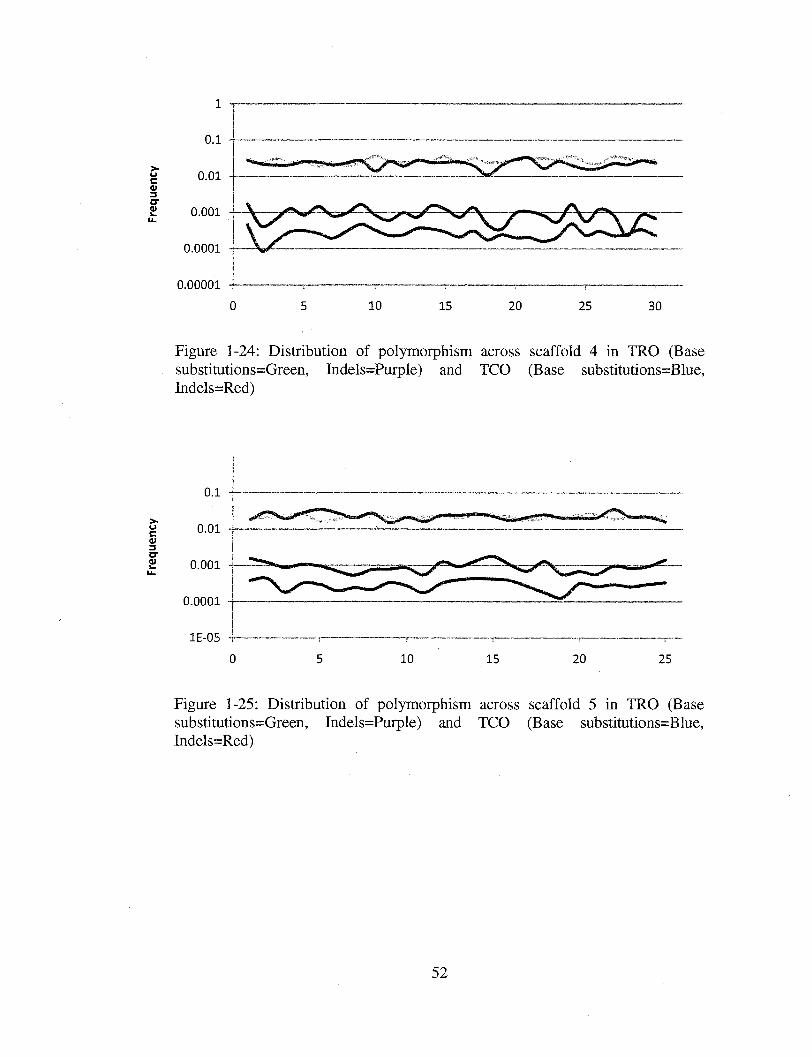
1
> • u c V 3 o-01
0.0001
0.00001
10 15 20 25 30
Figure 1-24: Distribution of polymorphism across scaffold 4 in TRO (Base substitutions=Green, Indels=Purple) and TCO (Base substitutions=Blue, Indels=Red)
u c 3
01
0.1
0.01
0.001
0.0001
1E-05
10 15 20 25
Figure 1-25: Distribution of polymorphism across scaffold 5 in TRO (Base substitutions=Green, Indels=Purple) and TCO (Base substitutions=Blue, Indels=Red)
52

>• u c 01 3 cr o>
0.0001
Figure 1-26: Distribution of polymorphism across scaffold 6 in TRO (Base substitutions=Green, Indels=Purple) and TCO (Base substitutions=Blue, Indels=Red)
>• u c 3 sr Ol
0.1
0.01
0.001
0.0001
1E-05
10 15 20 25
Figure 1-27: Distribution of polymorphism across scaffold 7 in TRO (Base substitutions=Green, Indels=Purple) and TCO (Base substitutions=Blue, Indels=Red)
53

0.1
>• c 3 er ai
0.01
0.001
0.0001
1E-05
10 15 20 25
Figure 1-28: Distribution of polymorphism across scaffold 8 in TRO (Base substitutions=Green, lndels=Purple) and TCO (Base substitutions=Blue, Indels=Red)
>-u c <D 3 ST CD
0.0001
1E-05
10 15 20 25
Figure 1-29: Distribution of polymorphism across scaffold 9 in TRO (Base substitutions=Green, Indels=Purple) and TCO (Base substitutions=Blue, Indels=Red)
54

>» u c 0) 3 CT V
0.0001
1E-05
10 15 20
Figure 1-30: Distribution of polymorphism across scaffold 10 in TRO (Base substitutions=Green, Indels=Purple) and TCO (Base substitutions=Blue, Indels=Red)
Comparative assembly (TCP vs TRO)
The comparative assembly of TRO produced a distribution with low average
coverage (Figure 1-31). Scaffold-by-scaffold analysis of TRO-TCO divergence at single
nucleotides ranged from ~ 2-4% (Figure 1-32). Scaffold-by-scaffold polymorphism levels
in TRO correlated with divergence from TCO (Figure 1-33), consistent with an overall
neutral mode of molecular evolution. However, TCO polymorphism levels did not. The
relatively low polymorphism and high variance in TCO may reduce the power to detect a
correlation, even if one exists. Additionally, reduced capacity for recombination can
magnify the diversity-cleansing power of genetic draft, making polymorphism levels
independent of divergence at the megabase scale. Polymorphism levels across the
genomes of TRO and TCO also failed to correspond in any way, suggesting that the
clones may have divergent recombinatorial landscapes and/or exposure to mutational and
selective pressures at the genomic scale. The low diversity and high variance of TCO
polymorphism values within scaffolds may cause scaffold-wide values to be unreliable.
55

•Actual
•Poisson
0 1 2 3 4 5 6 7 8 9 10
Coverage
Figure 1-31. Frequency of coverage for all sites of N50 comparative assembly of TRO. (Average = 0.53X)
56

0} X!
£ z
CD
1
4
7
10
13
16
19
22
25
28
31
34
37
40
43
46
49
52
55
58
61
64
67
70
73
76
79
82
85
88
91
94
97
100
0.005 0.01 0.015 0.02 0.025 0.03
Frequency
0.035 0.04 0.045
Figure 1-32: Estimates of nucleotide divergence between TRO and the TCO assembly.
57

E
Po
lym
orp
h*!
!
0.035
0.03
0.025
0.02
0.015
0.01
0.005
0
•
' ' • " * - # ! • • *
. _ _ _ _ _ _ _ — _ _ y ^ ^ _ r ^r*
rf * ^ • • •
• * f%
_.., J , , 1 , J
0.01 0.015 0.02 0.025 0.03
Divergence
0.035 0.04 0.045
Figure 1-33: Polymorphism in TRO correlates with divergence between TRO and TCO. (r2>0.40,p<l(T12)
Maximum Likelihood Analysis
To evaluate the accuracy of the overall estimate of TCO heterozygosity, the
results were compared to a maximum likelihood (ML) approach. Lynch (2008)
developed an analytical approach using ML to factor out problems with sequencing error
and under-sampling of alleles to estimate population-wide nucleotide diversity from base
calls and coverage patterns across the assembly of a diploid genome. Lynch used the SNP
data generated from this project as a test set for his approach. While the observed base
substitution frequency from this study (corrected for undersampling and including
sequential base substitutions) averaged 0.001290 substitutions/site, the ML corrected
estimate of average heterozygosity was 0.001237 with 95% support interval of
(0.001225, 0.001249).
58

Conclusion
Natural levels of genetic variation in evolving populations are traditionally
measured through population sampling at relatively few loci. With the advent of whole
genome sequencing of natural isolates, it has become feasible to quantify the distribution
and magnitude of genetic variation across the entire genome to infer evolutionary forces
acting on the population at large. This project uses the comparative assembly of shotgun
reads to a high quality reference genome to detect polymorphic site in the Daphnia pulex
genome. Analysis of roughly 100 million sites across the genome has not only provided a
wide glimpse of small genetic variation across the genomes of two divergent D. pulex
clones, but has suggested loci that have undergone recent evolutionary pressures. The
catalogue of variation reported here, including genomic regions with high and low SNP
levels, is now part of the genome annotation, which will aid in the evaluation of coding
function and contribution of allelic variation to Daphnia biology. These insights
contribute valuable information to the ecological and evolutionary study of the first
crustacean genome sequence, Daphnia pulex.
Acknowledgements
Morel Henley wrote many of the Perl scripts (Appendix C) used for the analysis.
Shilpa Kulkarni wrote the Java program SNPfinder. Way Sung wrote Perl scripts and
provided simple sequence positions. Sanjuro Jogdeo provided scaffold bridging data from
paired end reads and helped with the silent vs. replacement analysis. Karen Carleton
suggested the runs test. The Daphnia SNP project began as a class project under the
guidance of Profs. W. Kelley Thomas and R. Daniel Bergeron.
59

CHAPTER 2
PATTERNS OF VARIATION IN RECENTLY DIVERGED MITOCHONDRIAL
GENOMES OF DAPHNIA PULEX
Background
Mitochondrial genomes and evolution
Mitochondrial genomes are long established models of molecular evolution
(Brown et al. 1979, 1982; Ferris et al. 1981). Most animal mitochondrial genomes are
simple and streamlined, contain diverse functional domains, providing plentiful data in
easily characterized, circular genomes (Chen and Butow 2005; Boore 1999). The technical
simplicity of mitochondrial DNA analysis, minimal recombination and relative ease of
mitochondrial DNA isolation led to an early explosion of comparative sequence data for
the mitochondrial genomes of animals in the 1980s and 90s (Brown 1985; Thomas and
Wilson 1991; Kocher et al. 1989; Thomas et al. 1989; Thomas and Kocher 1993). These
genomes were popular sources of data for phylogenetic and population analysis (Avise et
al. 1987; Irwin et al. 1991; DeSalle et al. 1987). Phylogenetically broad analyses of
mitochondrial DNA revealed a rapid rate of base substitution relative to nuclear sequences
and an extreme bias toward transition substitutions (Brown et al. 1979; Denver et al.
2000). The legitimacy of using mitochondrial sequences for deep phylogenetic
60

comparisons has been questioned, in part due to the problematic qualities of mitochondrial
molecular evolution, such as substitution bias and rapid saturation (Curole and Kocher
1999; Hassanin et al. 2005; Blouin et al. 1998). Progress toward a mechanistic explanation
of mitochondrial genome evolution requires an understanding of population genetic
factors such as mutation, selection, demography and population size, all forces that
ultimately shape the DNA sequences from which many of our evolutionary inferences
originate.
Animal mitochondrial evolution is characterized by a high rate of transition
substitutions (Belle et al. 2005; Aquadro and Greenberg 1983; Tamura and Nei 1993). In
addition, many mitochondrial genomes have base compositional skew between the DNA
strands (i.e. G#C and/or A^T on the same strand, Perna and Kocher 1995; Frank and
Lobry; Asakawa et al. 1991; Andersson and Kurland 1991). If similar substitutional
processes are occurring on both strands, the Parity Rule 2 states that AT and GC skew will
be 0 (Sueoka 1995). While skew is observed locally in nuclear genomes, it is a global
feature of some mitochondrial sequences, especially mammals (Saccone et al. 2002).
Recent analysis of animal mitochondrial DNA has focused on understanding the
mechanisms responsible for the high rate of substitution and base compositional bias
between the two DNA strands (Niu et al. 2003). Current theory favors a strand-specific
mutation-driven model for base substitution, which proposes that directional mutation
drives the biases in stand composition and codon usage (Reyes et al. 1998; Tanaka and
Ozawa 1994). Because deamination of cytosines occurs asymmetrically on the two
strands, it is thought that the strand that spends more time single-stranded during
replication suffers more C—>T mutations (Bielawski and Gold 2002; Faith and Pollock
61

2003), although the single-strand exposure mechanism has been questioned (Yang et al.
2002; Rocha et al. 2006). This C-^T transition bias on one strand reduces the frequency of
C on one strand and G on the other. Replication is asymmetric in most vertebrate
mitochondrial DNA (Shadel and Clayton 1997; Clayton 2000, for exceptions see Reyes et
al. 2005), however in many invertebrate genomes (e.g. C. elegans, D. melanogaster), both
strands are replicated asymmetrically. These genomes tend to be extremely A+T rich
(Thomas and Wilson 1991; Clary and Wolstenholme 1987) and have less extreme GC
skew. However, largely ignored is the alternative explanation that selection contributes to
these patterns, a scenario consistent with the first direct analysis of mutation in
invertebrate mitochondrial genomes (Denver et al. 2000).
The mitochondrial genomes of Daphnia represent a significant opportunity to
expand our understanding of mitochondrial genome evolution. First, from the perspective
of ecology and population biology, Daphnia is one of the best characterized genera in
biology, providing both a context of population size and large numbers of lineages from
which to carry out polarized genome comparisons. Additionally, the complete sequence of
the Daphnia nuclear genome provides a catalog of relevant nuclear genes, such as genes
involved in mitochondrial function, repair, and inheritance. Ultimately, a rich
understanding of the role of these genes in mitochondrial evolution will shed light on
lineage specific rates and patterns of change.
The observed patterns of substitution between genomes are a product of mutational
forces and subsequent filtering by natural selection and drift. Many attempts have been
made to capture the underlying mode and tempo of mutation by measuring molecular
change at sites that are thought to undergo minimal selection (silent sites or non-coding
62

DNA). However, it is increasingly apparent that previously unimagined selective forces
are at play in surprising locations of genomes (Chamary et al. 2006; Svensson et al. 2006;
Chen and Blanchette 2007; Vavouri et al. 2007; Andolfatto 2005). Inconveniently,
mitochondrial genomes are famously devoid of many of the "non-functional" domains that
occur in nuclear genomes. But because of their relatively rapid level of nucleotide
substitution, a sufficient number of base changes can be observed between moderately
diverged genomes for an analysis of evolutionary divergence between closely-related
genomes.
In this study, the rate and pattern of nucleotide substitution in D. pulex
mitochondrial genomes are described and hypotheses are developed about relative roles of
selective and mutational determinants of observed substitution patterns.
Methods
The Daphnia Genome Project has provided deep sequence coverage of
mitochondrial DNA in two isolates of Daphnia pulex, TCO and TRO. For each data set,
genomic clones were aligned and assembled against a reference Daphnia pulex
mitochondrial (Crease 1999) genome sequence using AMOS Comparative Assembler
(Pop et al. 2004), providing 40-60X coverage of the mitochondrial genome for each strain.
The mitochondrial genome sequences, derived from the consensus of the clones, were
then aligned in ClustalW (Larkin et al. 2007) and compared, allowing for analysis of
substitution patterns among the three strains using MEGA 3.1 (Tamura et al. 2007).
Using TCO as an outgroup, the direction of substitutions in TRO and Crease was
inferred, allowing for polarization of a subset of the substitutions that occurred since the
63

common ancestor of TRO and Crease, assuming parsimony. In order to minimize the
effects of selection in our substitution analysis, 0-fold degenerate sites were removed from
the analysis. The expected number of substitutions from each base given the nucleotide
composition at 2 and 4-fold degenerate sites of protein-coding genes was calculated.
Results and Discussion
Based on analysis of 12s rRNA sequences from closely related species, TCO is
clearly an outgroup to TRO and Crease (Figure 2-1).
I TRO
• Crease
I TCO
D. obtusa
Figure 2-1: Using TCO as an outgroup, substitutions were polarized in TRO and Crease.
For the three complete Daphnia pulex mitochondrial genomes, we observed 233
single base substitutions (Appendix F) and a Ts/Tv ratio of 7.3:1, similar to congruent
studies in other invertebrates (Nardi et al. 2003; Coates et al. 2005) and vertebrates (Belle
64

et al. 2005). The proportion of substitutions in protein-coding sites (175/233) is roughly
equivalent to the proportion of protein-coding sites in the mitochondrial genome (72.2%).
Of the 58 substitutions not in protein-coding genes 11 were located in tRNA genes, 17 in
rRNA genes and 32 in putative non-coding DNA. Of the 175 substitutions in protein-
coding regions, 143 were synonymous and 32 nonsynonymous (4.5:1), indicative of the
strong purifying selection on mitochondrial protein-coding sequences. 57.1% were in
major strand genes, while 42.9% of protein-coding substitutions were in minor strand
encoded genes. A single codon among all protein-coding sites had a detectable double
substitution, evidence that the multiple hits can influence data from recently diverged
sequences.
To investigate the specific pattern of nucleotide change we identified the subset of
substitutions that could be polarized based on the relationship of the three genomes
compared. The matrix of 53 substitutions at 2- and 4- fold degenerate sites is consistent in
pattern and distribution with the overall dataset but reveals a significant bias toward
substitutions from G to A (Table 2-1). Our analysis of 2 and 4-fold degenerate sites in
Daphnia is consistent with that observed in Drosophila (Haag-Liautard et al. 2008)
vertebrates as well as with a mutational mechanism driving strand specific nucleotide
composition. G to A substitutions are observed twice as often as expected from a strand-
specific nucleotide composition model in both the major and minor protein-coding regions
(Table 2-1, chi square test, p=0.0017). This observation suggests that the probability of
any G on the major coding strand changing to an A is higher than the probability of an A
changing to a G.
65

Base To from! A
A
T 0
C 0
G 15
T
1
-
6
0
C
2
10
-
0
G
16
0
1
-
NC
.328
.309
.221
.144
Exp
17.4
16.4
11.7
7.6
Obs
20
10
6
17
Table 2-1: Ratio of Observed to Expected Substitutions from each nucleotide based on nucleotide composition (NC) of 2- and 4-fold sites on the major strand.
The observed bias towards G->A substitutions is consistent with repeated claims
that mutational and/or selective forces are driving base compositional differences between
the major and minor strands. However, observed substitution patterns at degenerate sites
are a proxy for underlying mutations and there is no direct evidence that directional
substitutions or strand bias are the result of an underlying mutational bias rather than a
selection. In fact, the mutation accumulation experiments in C. elegans suggest that
selection, rather than mutation, drives substitutional bias in the mitochondria of nematodes
(Denver et al. 2000).
Unlike the nuclear chromosomes, the replication of mitochondrial genomes within
a cell is not controlled such that all chromosomes replicate to completion before cell
division. While the dynamics of mitochondrial DNA inheritance remains a mystery, it is
clear that there exist serious bottlenecks, resulting in rapid fixation of new mutations.
Consequently, it must be assumed that there exists a replication race where the molecules
that are slower to replicate necessarily contribute less to the daughter population after cell
division. The repair of deaminated cytosines will necessarily delay replication of
molecules, selecting against molecules having deaminated sites compared to other
66

molecules with less damage. Therefore, the consequence of deamination of cytosine may
not be directional mutation but selection against molecules with sites prone to deamination
(Figure 2-2). To further evaluate the potential role of repair enzymes involved, we have
identified the key gene in the mitochondrial deamination repair pathway, uracil-DNA
glycosylase (UNG), in the D. pulex genome (Nilsen et al. 1997).
The directional mutation model suggests that GC skew is driven by a high
frequency of deamination on one strand. However, most animal genomes have a host of
DNA repair genes that operate in the mitochondria. It may be more likely that high rates
of deamination on one strand slow replication for stands with higher cytosine content. An
ongoing replication race would lead to selection for lower C on one strand. While the
current model is not mutually exclusive with the model proposed here, the distinction is
important for making predictions about the underlying mutational spectrum and the
evolutionary forces shaping the mitochondrial genome. Since Daphnia mutation
accumulation lines will be sequenced soon, a key prediction from our model is that a bias
towards G/C to A/T substitution, as reported here, will not be observed.
We show that substitution type is not proportional to nucleotide frequency when
comparing closely-related Daphnia pulex mitochondrial genomes. If mutation
accumulation experiments show that substitution patterns are proportional to base
frequency, it is likely that 2- and 4-fold sites in Daphnia pulex mitochondrial DNA
undergo substantial selective pressure and are not reliable measures of the underlying
baseline mutational spectrum.
67

selection directional mutation
T T
Figure 2-2.Dilatory mutation-selection model predicts biased substitution pattern (e.g. G/C -> A/T) due to natural selection against G/C regardless of underlying mutation pattern.
68

CHAPTER 3
INTRON GAIN/LOSS POLYMORPHISMS IN DAPHNIA PULEX
Background
Intron evolution
Spliceosomal introns are a defining characteristic of eukaryotic genomes and have
taxon-specific patterns of proliferation, extinction and structural evolution. However,
little is known about the evolutionary dynamics of introns in populations. The study of
intron evolution is central to understanding gene structure evolution and the origin of
genome and organismal complexity. Nevertheless, over thirty years after their discovery
(Berget et al. 1977; Chow et al. 1977; Gilbert 1978), and in spite of being widely studied
(Koonin 2006; Lynch 2002; Lynch 2007), the origin, function and evolutionary
consequences of introns are open questions. Analysis of intron gain and loss between
phylogenetically distant taxa has revealed long term trends in taxon-specific intron
proliferation and suggested general patterns of intron gain/loss across eukaryotes (Cho et
al. 2004; Carmel et al. 2007; Roy and Gilbert 2005; Belshaw and Bensasson 2006;
Coulombe-Huntington and Majewski 2007). These patterns include differences in rates
and mechanisms of turnover as well as spatial biases of gain/loss. For instance, some
studies report more intron loss towards the 3' end of genes and preferential loss of introns
between codons (phase 0 introns). Variation in gene family rates of gain/loss have also
69

been reported (Roy and Gilbert 2006; Jeffares et al. 2005). While these studies are
rigorous and expansive, they are limited to uncovering general trends between relatively
few, distant genomes. While some of the trends uncovered in these large analyses of
divergent taxa point to particular mechanisms of intron loss (e.g. reverse
transcription/gene conversion vs. genomic deletion) and gain (e.g. ectopic seeding, local
duplication), they may not be the most powerful or informative approaches for testing
specific hypotheses regarding the molecular mechanisms of intron loss and gain. For
instance, introns that are ectopically seeded will lose detectable homology rapidly after
speciation, making them impossible to detect. Additionally, broad phylogenetic
comparisons of intron positions rely on assumptions of character irreversibility (Dollo
parsimony, Farris 1977), a conservative view of intron evolution that may be unrealistic,
especially if cryptic, unoccupied "proto" splice sites play a large role in intron gain
(Sadusky et al. 2004; Lynch 2007). However, recent studies have indicated that intron
gain and loss may be studied at the population level, a prospect that will contribute power
for inferring gain/loss mechanisms. In one of the first examples of intraspecific intron
gain/loss polymorphisms, Llopert et al. (2002) uncovered a standing polymorphism for
intron loss/gain in a natural isolate of Drosophila teisseri, with evidence of loss through
genomic deletion with possible selective forces acting on the deletion allele. More
recently, Omilian et al. (2008) reported two novel intron gains segregating in Daphnia
pulex. The Llopert and Omilian studies suggest it is possible to discover intron gain/loss
soon after introduction of new alleles in a population, improving our ability to understand
the process of intron turnover in eukaryotes. In light of the Omilian study, this study used
a combination of genomic and population genetic resources to assay D. pulex for intron
70

turnover. The data reported here suggests that genome-wide population level studies may
be essential to understanding intron evolution. The results further underscore the
importance of comparing closely related genomes to understand the origin and evolution
of genomic variation.
In this study, the predicted intron-exon boundaries in the Daphnia pulex genome
(clone TCO) were used to detect the absence of introns in a second clone (TRO). The loci
with intron absences identified in this comparison were assayed for polymorphisms
across a panel of D. pulex populations at Indiana University. In all, 22 cases of putative
intron gain and 2 cases of intron loss are reported. The results further indicate that intron
turnover can be studied at the population level, at least in some taxa, and that a thorough
understanding of the evolutionary dynamics of introns awaits population genomic level
investigation.
Methods
Intron polymorphism was examined in Daphnia pulex using two genomic data
sets, TCO (9X), and TRO (IX), both from the Daphnia Genome Project. A Perl script
getIntronJunction.pl was written to extract and concatenate 50 bp before and after every
predicted intron of the TCO Assembly using the FrozenGeneCatalog_2007_07_03.gff
and Dap/m/a_pulex.fasta (http://genome.jgi-psf.org/Dappul/Dappul.download.ftp.html).
These 85,353 100 bp exon-exon hybrid sequences were queried against the TRO IX
shotgun reads using BLASTn < e"35, a threshold allowing alignment of 100 bp exon-exon
hybrid sequence from TCO against an "intronless" genomic clone from TRO with a
handful of mismatches. Putative intronless TRO clones were then aligned with the TCO
71
exon-exon hybrid, TCO parent gene sequence (containing intron) and other TRO clones
that hit the gene elsewhere, all using Sequencher. Alignments were examined and
adjusted by eye.
The alignments were used to design primers for amplification of the intron
absence regions in both TCO and TRO to confirm the in silico analysis. Primers were
designed in regions of perfect conservation between TRO and TCO, upstream and
downstream from the intron site. The primers were also used for the population assays
carried out at Indiana University, where these loci (TCO introns absent in TRO) were
assayed in 96 Daphnia (mostly D. pulex) isolates from across North America.
To test the hypothesis of intron origin through ectopic seeding, BLASTn was used
to search the TCO genome assembly for sequence homology to all introns involved in
gain/loss (n=34).
Results and Discussion
The recently assembled D. pulex genome (TCO) was used to survey intron
presence/absence in another D. pulex clone (TRO), for which there is substantial genomic
data (IX shotgun sequence). 34 genes with instances of intron absence were observed in
TRO. These putative intron gain/loss loci were then amplified in TCO, TRO as well as in
dozens of other D. pulex lineages. 4 were found to have upstream and downstream intron
absences (Table 3-1) and to rule out the processed pseudogenes, all cases with adjacent
losses were eliminated from further analysis. 24 loci are confirmed by direct PCR
analysis to be polymorphic for intron presence/absence within the D. pulex species.
72

An analysis of the DNA sequences flanking the TCO introns lost in TRO reveal
small, direct sequence duplications for 13 TCO introns (Figure 3-2). Although the exact
mechanism generating these duplications is unclear, they strongly suggest that these 13
TRO introns are recent gains.
To put the confirmed intron polymorphisms in a greater phylogenetic context,
primers were sent to IU to amplify and sequence putative gain/loss loci in a diverse panel
of Daphnia lineages (The "Big 96"). Through direct sequencing, the polymorphisms
were phylogenetically polarized using outgroups to the TRO/TCO clade. Additionally,
these loci were assayed across clones inside the TCO/TRO clade. 12/24 intron
polymorphisms were confirmed to be putative intron gains, while 2/24 cases are putative
losses based on a phylogenetic analysis of character state in the "Big 96". Most of the
gains have EST evidence from TCO, suggesting that the introns are actively spliced
(wfleabase.org/releasel/current_release/est). The introns appeared in conserved regions
of the alignment, and flanking sequences do not appear to contribute to the gained
introns, arguing for gain by the insertion of exogenous sequences. Interestingly, 5 loci
show independent intron insertions at the exact same sites (parallel gain), supporting the
proto-spice site theory of origin. 1 intron has significant homology to introns of other
genes, an observation consistent with an ectoptic seeding model of intron gain (Roy and
Gilbert 2006).
Over all, the intron presence/absence polymorphisms are in a functionally diverse
set of protein coding genes and do not appear to be biased towards intron phase or gene
location. However, it is notable that all genes found to have an intron polymorphism in D.
pulex have significant homology with other sequenced animals and appear to be highly
73

conserved genes (Table 3-1). A random set of genes from the D. pulex gene catalogue
would include many (>30%) genes without homology outside Daphnia. While there may
be an ascertainment bias contributing to this result, further investigation of these intron
polymorphisms will shed light on the distribution of intron turnover within the D. pulex
gene set.
The results of this study indicate that intron turnover in D. pulex is rapid and that
Daphnia may be a useful model for understanding intron evolution. Intron turnover at the
same site may be high even within genomes of the same species, making inferences
based on Dollo parsimony unreliable.
Although numerous broad phylogenetic comparisons have been employed to
measure taxon-specific rates of intron gain and loss in highly conserved genes, it is
possible that the assumptions of parsimony underlying these measurements are often
violated and/or not applicable when sampling a small biased set of genes (i.e. highly
conserved genes that can be aligned between different phyla or classes). This study is a
genome-wide assay of intron-exon boundaries in at the population scale. If extensive
intron gain/loss combined with rapid divergence of introns limits inference of intron
phylogeny between even moderately distant taxa, phylogenetically broad inferences of
intron turnover may be misled by a saturation phenomenon. Additionally, an
understanding of the mechanisms of intron gain and loss are improved by detecting intron
birth and death soon after the introduction of new alleles. The signature of gain or loss
may still be detectable when new alleles aren't fixed in the population. For instance, the
presence of small duplications flanking 13 of the intron positions discovered in this study
may indicate a mechanism of insertion (Figure 3-1). For instance, a staggered DNA break
74
followed by synthesis of a new strand leads to small target site duplications. The
observation of such features at the intron presence/absence sites suggests that some of the
polymorphisms may be result of ectopic or de novo intron gain.
This study is not a comprehensive analysis of intron turnover, but a conservative
genome-wide look at intron evolution in D. pulex. Our study is restricted to absences of
TCO introns in TRO, which were then investigated in a diverse panel of D. pulex
populations. Since a TRO assembly with gene predictions does not exist, exact intron
positions in TRO are unavailable for the reverse assay of TCO absences. Additionally,
only "perfect" absences are detected in TRO. For instance, a genomic deletion resulting
in 3n leftover bases in an intron leading to extension of an exon, like the Llopart (2002)
deletion, would have been identified in our data set. No such cases were discovered in
this analysis.
In addition, we are aware of the possibility of false positive intron absences in
TRO due to the recent insertion of a whole or partial pseudogene in TRO. However, none
of the genes involved in TRO intron absence (n=34) have evidence of a pseudogene copy
in TCO, meaning a pseudogene would have had to insert in TRO or be lost in TCO after
the divergence of the two strains. Although this cannot be ruled out, 30 of the 34 genes
with intron losses in TRO have up/down stream introns. Additionally, PCR amplification
should yield two different size products if both intron-containing and intron-lost paralogs
existed. However, for the genes that show evidence of heterozygosity for intron gain/loss
in TRO, it may be hard to distinguish between allelic vs. paralogous variation.
75

ACCAGGT.....ACCAGGT CAG CAG GGTACT GGTACT CAAATGAATGAAGGT CTAAATACTGAAAGT GGTAAGAA GGTAAGAA TAG.....TAG AGGTAAC AGTAAC TCAG.....TCAG ACCCACAAGG ACCCACAGG ATCATAG ATCATAGG AAAAACAGG AAAAACAGG ACAACTTACAGT ACAACTTACAGGT CAAGG CAAGG
Figure 3-1. Duplications at intron/exon boundaries in 13/30 TCO introns that are absent in TRO. Exonic sequence is black, intronic is red.
76

1
2
3
4
5
6
7
8
9
10
11
12
13
14
15
16
17
18
19
20
21
22 23
24
25
26
27
28
29
30
31
32
33
34
Gene
299809
300064
300174
210176
49696
220747
192333
308710
60686
320441
42116
305612
220780
306461
312878
310999
305001
324526
30917
309681
211626
318553 304027
54063
305669
305741
323635
58732
317361
313288
111110
230511
109145
197668
Location (scaffold: start-stop)
1:642148-644866
1:1735823-1738795
1:3884606-3897221
15:391013-394586
19:1131355-1132925
3:829775-831403
5:1937808-1940803
83:571471-573372
92:448210-451261
35:552343-560119
4:2813476-2817541
4:813051-817358
3:1275256-1279669
5:2453607-2454266
7:1370402-1380160
3:2381836-2386328
32:423509-424982
62:653445-655802
10:1512564-1514700
1:1652388-1656457
23:1173577-1177875
25:645321-648617 25:810711-812098
39:521867-526821
4:1820026-1822728
4:3053366-3058687
55:335765-344494
75:537505-538847
20:1017643-1021231
8:1690769-1695101
81:63490-64695
8:2032486-2034185
63:230454-232102
31:989787-993690
Intron size, # (TCO) 69,3
60,1
74,7
69,2
62,6
90,6
63,3
84,4
63,9
62, 14
76,2
85,11
88,9
119,2
61,3
94,5
85,5
102,4
65,2
61,5
91,5
70,9 63,5
202,5
65,3
106,12
177,3
67,1
62,5
67,12
276,1
233/59, 2/3 117/70, 5/6 63/66/64, 11/12/13
Function
Isocitrate dehydrogenase
Phosphodiesterase/endonuclease
Chromatin structure
Polyamine transporter
Bestrophin (macular dystrophy)
Proteasome activator activity
NADH-quinone oxidoreductase
Poorly characterized
Aldehyde dehydrogenase
Glutaminase
Histidine ammonia-lyase
Peptidase Ml
Poorly characterized
Complex 1 lyr
Na+/solute symporter
Transcription factor
Citrate lyase, beta subunit
Cvtoskeleton
H+/oligopeptide symporter
Puromycin-sensitive aminopeptidase
STE20-like serine/threonine kinase MST
Peroxidase/oxygenase Thioredoxin/protein disulfide isomerase
FOG: Immunoglobuhn C-2 Type/fibronectin type III domains Predicted polypeptide N-acetylgalactosaminyltransferase Uncharacterized conserved protein
Collagens (type IV and type XIII), and related proteins Zn finger proteins
Predicted E3 ubiquitin ligase
Glutamate-gated kainate-type ion channel receptor subunit GluR5 Protein kinase PKN/PRK1, effector,
Ribosomal protein S6e
Tyrosine phosphatase
Kinesin
Notes
0, P1, S
1,P2, S
0, PJ, S
1, P",R
1,P5
2,P6
l .P7
2,P»*
2,Py
1,S
0,H
1
1
0,H
2
1
0
1
1
0
1
0 2
1
1
1
1
2
1
2
0,H
H, psi
Psi
H, psi
Table 3-1. Intron absences in TRO relative to the same genes in TCO. Notes: 0,1,2 refer to intron phase; P-PCR confirmed; H-evidence of heterozygosity within TRO; psi- adjacent intron lost, possible processed pseudogene. *PCR result inconclusive. S- intron absence confirmed with sequencing. Pn refers to PCR products in Figure 1. The last four rows (bold) include genes with multiple intron absences in which we haven't ruled out processed pseudogene origination.
77

For the intron gains, most occur within an isolated clade (Oregon) of D. pulex, a
population possibly susceptible to mildly deleterious mutation accumulation due to a
prolonged period of bottleneck that magnified the power of genetic drift.
Acknowledgements
Mike Lynch, Kelley Thomas and Way Sung contributed to the conception of the
project (DGC meeting, July 2007). Wenli Li (Indiana University) sequenced the
polymorphic loci in the "Big 96" Daphnia collection. Way Sung wrote the Perl script
getlntronJuction.pl.
78

CHAPTER 4
GENE DUPLICATION IN DAPHNIA PULEX
Background
Gene duplication is an important source of genomic variation within eukaryotic
lineages (Ohno 1970; Graur and Li 2000; Lynch 2007). Segmental duplications that
include partial and entire protein-coding genes have been observed on the
microevolutionary scale (Redon et al. 2006; Zhang et al. 2005; Khaja et al. 2006). From
broader comparative analyses, it is clear that gene gain and loss cause fluctuations in
gene family sizes (Demuth et al. 2006; Hahn et al. 2007). The relative roles of positive
selection, purifying selection and drift on the retention and removal of new duplicates
remain in dispute and may vary among taxa. While examples of gene duplicates
contributing to adaptive evolution have been proposed (Nei and Rooney 2005; Irish and
Litt 2005; Beisswanger and Stephan 2008), the process of gene duplication and loss have
been treated like other stochastic mutational events and can be modeled as a neutral,
random process, with a rate estimated to be roughly equivalent to the probability of a
single nucleotide mutation (Lynch and Conery 2000). Under this view, the gene content
of a genome is the outcome of a long-term equilibrium of gene gain and loss, with
positive and negative selection affecting the retention of new duplicates at the margins,
depending on the magnitude of beneficial or deleterious effects. Assuming a steady-state
equilibrium of birth and death rates, the demography of duplicate genes can be inferred
79

from the contemporary gene catalogue. For example, using synonymous substitution rate
(Ks) between duplicates as an estimate for age, all eukaryotic genomes studied to date
show an exponential decay curve of retained duplications over time (Lynch and Conery
2002). However, whole and partial genome duplication events in the evolutionary past
may appear as large cohorts containing significant duplication peaks like those found in
vertebrates and Arabidopsis (Vandepoele et al. 2004; Zhang et al. 2004; Lynch and
Conery 2003; Maere et al. 2005).
Because all genes are thought to come from other genes, the mutational processes
leading to gene duplication are important for understanding evolution. Rates of unequal
crossing over, transposable element-mediated transfer and whole/partial genome
duplication are important factors determining the potential for gene duplication (Lynch
2007). As an ongoing, stochastic process, gene duplication seeds the genome with new
sequence whose fate is determined by evolutionary pressures of drift and selection. While
some gene duplicates are retained as functional copies, most duplications are lost through
drift, deletion and/or silencing via deleterious mutation accumulation (Lynch et al. 2001;
Lynch 2007). The fate of newly arisen gene duplicates has been given hefty theoretical
and empirical consideration (Lynch and Force 1999; Katju and Lynch 2003; Rastoni and
Liberies 2005; Moore and Purugganan 2003, 2005; Lynch and Katju 2004; Kondrashov
et al. 2002). Some evidence suggests that gene duplication can serve as a buffer for
deleterious mutation and contribute to genetic robustness (Hsiao and Vitkup 2008;
Nowak 1997; Wagner 1999; Gu et al. 2003), however most duplications are not retained.
If a new duplication allele arises in a population, current models entertain three
potential fates (Hurles 2004; Lynch 2007). Unlike a single gene whose function may be
80

essential, a new duplicate may initially escape the constraints of purifying selection.
Degenerative mutation may silence the duplicate, leading to nonfunctionalization.
However, freedom from intense purifying selection can, in rare instances, lead to new,
advantageous alleles, a process termed neofunctionization. In this way, new duplicates
can become test beds for evolutionary novelty. Numerous examples of
neofunctionalization have been reported (Zhang et al. 1998; Lynch 2007a; Escriva et al.
2006; Beisswanger and Stephan 2008). A third evolutionary fate of a new duplicate gene,
subfunctionalization, has been proposed. Subfunctionalization occurs when both the
parent and child gene undergo compromising mutations that split the functions of the
parent gene between the relatives. This Duplication-Degeneration-Complementation
model suggests a mechanism by which new evolutionary opportunities may arise even in
the presence of purifying selection (Force et al. 1999; Lynch and Force 2000).
Since the dawn of eukaryotic genomics, the simple observation has been made
that gene content does not correlate with organismal complexity. That a nematode and a
human both have roughly 20,000 protein-coding genes, begs an explanation for how the
chasm of organismal complexity is achieved. The study of recent gene duplications is a
tractable phenomenon for testing the evolutionary potential of new mutations. The
generation and fate of gene duplicates is certainly not deterministic, but depends on the
local and long-term population-genetic environment of populations. Here, we compare
the overall demography of the Daphnia pulex gene duplicate catalogue to other taxa and
attempt to summarize some general patterns of gene copy evolution in the recently
sequenced microcrustacean. We calculate estimates of non-synonymous substitution rate
(Ka) and synonymous substitution rate (Ks) for each gene pair. Ka and Ks calculations
81

(often referred to as dN and dS) are commonly used to infer a variety of evolutionary
phenomena such as substitution rate heterogeneity, magnitude of purifying or positve
selection and rapid gene evolution.
The Daphnia pulex genome appears to have an expanded number of genes
compared to other fully sequenced invertebrates (Table 4-1). This phenomenon may be
attributed to genome-wide duplication event(s) or from a higher rate of gene duplication
relative to loss. These hypotheses were tested by examining the distribution of gene
duplications over time using Ks as a proxy for time. Also, by examining gene duplicates
that appear to evolve rapidly and/or under positive selective pressure, candidate loci were
identified for further study of evolutionary significance. In addition, the demography of
gene duplicates was examined by testing two identity cutoffs (40 and 60%) and parsing
the data between an all-inclusive gene duplicate set (with large families) and single pair
gene duplicates (family size=2). Patterns of evolution between dispersed and tandem
duplicates and between cis and trans tandem duplicates are reported.
Taxon
D. pulex
C. elegans
A. mellifera
Drosophila*
A. gambiae
Gene number
>32,000
-20,000
17,000
13-16,000
~19,000
Reference
Colboume et al. In prep
Stein et al. 2003
Honey Bee Cons. 2006
Drosophila 12 Genomes 2007
Holt etal. 2002
Table 4-1: Estimated gene content of fully sequenced invertebrates. *Multiple Drosophila species have been fully sequenced.
82

Methods
To characterize the gene duplicate catalogue of Daphnia, we conducted a
"genome history" analysis, with a focus on highly related genes. In order to decipher
patterns of molecular evolution among these gene duplicates, we compared all protein
coding gene models (Frozen Gene Set vl . l , n=30,940) to each other using a modified
installation of Genome History (Conant and Wagner 2002). By analyzing substitution
patterns between gene copies and in the context of gene family assignments, we can
better understand the process of gene copy evolution in D. pulex. This study includes
other genomes for comparative insights. The entire gene catalogue from C. elegans, A.
thaliana and H. sapiens were downloaded from Ensemble (www.ensembl.org). For genes
with multiple splice variants, the largest gene was chosen.
Genome History (GH) detects and compares gene duplicates within a genome
using a set of user-specified parameters and input. Here is an outline of the process as it
was carried out on the Daphnia pulex vl . l gene set:
1. All predicted protein sequences were WU-gapped-BLASTPed against
eachother. Self hits were thrown out. Hits > e"10 proceed to next step.
2. Gene matches were aligned (ClustalW, Larkin et al. 2007) and minimum
alignment length (100 amino acids) and percent identity (40 or 60%) cutoffs are
applied. These strict settings minimized false relationships due to highly
conserved motifs and narrowed the focus of this study to recent gene duplicates
(Ks <1).
3. Each aligned gene pair was then backtranslated using the nucleotide gene file.
For each pair, Ka and Ks are calculated using the maximum likelihood, codon-
83

based model similar to Yang and Nielsen (2000). (For clarity, Ks means
"Substitutions / Silent Site" and Ka means "Substitutions / Replacement Site".)
Zhang et al. (2004) argue that a genomic analysis of gene duplicates should
include pairs with Ks values between 0.005 and 1 to avoid mistaking independently
assembled alleles of the same gene (Ks <0.005) and because accurate estimates of Ks are
increasingly difficult at higher Ks values. In fact, our analysis of multiple gene duplicate
pairs using 11 different analytical methods (Zhang et al. 2006) showed higher variance on
estimates as distances surpassed Ks » 1 . It should also be pointed out that the number of
duplicate pair comparisons within a family is often higher than the actual number of
duplication events since for any combination of genes there are n(n-l)/2 pairwise
comparisons.
For this analysis we removed splice variants and transposable element genes. We
also ran the same Ka and Ks calculations on a set of predicted pseudogenes generated
using PseudoPipe (Zhang et al. 2006).
Depending on the specific analysis, we chose to include or exclude exact copy
duplicates (Ks=0) and gene families >2. It was important not to take all estimates of Ka
and Ks at face value, but to consider the appropriateness of each estimate based on the
assumptions underlying each test and the information content of each measurement. For
example, a gene pair with one single non-synonymous substitution would not have a
meaningful Ka/Ks value. Likewise, a balance exists where more information about the
average mode of evolution can be gathered from diverged sequences up to a point at
which saturation makes substitution rate estimates unreliable.
84

Results and Discussion
After 30,940 predicted Daphnia pulex genes (vl.l frozen set) were run through
the pipeline, GH output 36,186 gene pairs from 11,862 different genes. This proportion is
higher than for many other vertebrate or invertebrate genomes, with a pronounced
overabundance of very similar gene pairs (Ks < 0.1) (Figure 4-2).
Gene conversion is known to reduce variation in some large gene families (Liao
1999) such as rRNAs (Arnheim et al. 1980;), RNU2 (Paveltiz et al. 1995), histones
(Coen et al. 1982), ubiquitin (Nenoi et al. 1998) as well as in non-coding repeat
sequences (Elder and Turner 1995). To test the possibility of sequence homogenization
among large families in D. pulex, average Ks for families of size 2, 3, 4-5, 6-99 and 100
were compared and not found to be significantly different (ANOVA, p=0.265). The
abundance of very similar gene pairs in D. pulex (Ks < 0.1) appears to be a consequence
of recent gene duplication rather than gene conversion in large gene families given the
lack of detectable correlation between gene family size and Ks.
Birth rates of gene duplicates were calculated using the number of single-pair
duplicates in the youngest cohort (Ks < 0.01), the baseline number of single copy genes
and the synonymous substitution rate (Ks), giving units of duplications/gene/Ks. Birth
rates of nematodes and humans were comparable to those found in earlier studies (Lynch
and Conery 2000, 2003). D. pulex appears to have a higher rate of gene duplication than
other animals studied to date (Lynch 2007, Table 8.1).
While the observed number of new duplicates can be used to estimate a birth rate,
it should be considered a downwardly biased estimate, since observed duplications may
85

represent a subset of events that rose to high frequency in the population, and were not
purged by selection.
D. pulex
C. elegans
H. sapiens
Tucker
0.0085
0.0030
0.0055
Lynch 2007
N/A
0.0028
0.0049
Table 4-2: Estimated birth rates for gene duplicates. Units are duplications/gene/Ks.
To test for the existence of gene duplicates where at least one member is evolving
under overall positive selection, we compared the synonymous and nonsynonymous
substitution rates between gene duplicates using the Ka/Ks test (Hurst 2002; Yang and
Bielawski 2000). Based on this analysis, we were also able to identify a subset of recently
duplicated genes that appear to be evolving in a positive mode (Ka/Ks > 2). We found
175 gene pairs with both a Ka/Ks >2 and at least ten nonsynonymous substitutions.
Functional analysis of positively evolving genes showed most to be of unknown function
and without a homolog in Genbank (67%).
This analysis takes a conservative approach (minimum 100 AA alignment and >
60% identity) and is not meant to be an all inclusive analysis of all detectable paralogs.
The power of the substitution analysis is in informing young gene pairs (Ks « 0.7). For
instance, ancient gene duplicates are highly saturated with synonymous substitutions and
are not as likely to play a role in recent genome evolution. Unlike other gene duplication
analyses (Lynch and Conery 2000; Zhang et al. 2004), we have not removed larger gene
families (n > 5) since the larger families, especially in Daphnia, are as much a part of the
86

recent evolutionary story as other pairs. However, we include an analysis in single pair
families to gauge the effect of large families. It has been argued that the stochastic
process of gene conversion biases larger families to smaller Ks values (Pan and Zhang
2007). This does not appear to be a detectable problem in the Daphnia gene set.
However, it cannot be ruled out that many recent or exact gene copies are in fact the
result of recent gene conversion and not recent gene duplication events. In fact, there is
some evidence that D. pulex may undergo biased gene conversion during mitotic
recombination as loss of heterozygosity (LOH) was observed on a short time scale in
asexually propagated mapping lines (Omilian et al. 2006). Recent analysis of the D. pulex
genes has also suggested high gene conversion rates (J. Colbourne, personal comm.)
With the recent revelation that the aphid genome has many recent duplicates as well, it
has been speculated that an expanded gene set may be related to an asexual reproductive
mode. However, more data are needed.
Because the D. pulex gene set was generated from a combination of automated
gene prediction algorithms and has not been manually and experimentally overhauled to
the degree of older genome projects, there may be some gene predictions that are not
actually protein coding genes. It has been estimated that over 20% of current human gene
predictions may in fact not be protein coding genes (Clamp et al. 2007). This analysis
takes the current predicted gene set at face value. However, there is reason to believe that
the current gene number (-30,000) for Daphnia is an underestimate. Considering the
relative phylogenetic isolation of Daphnia compared to other genome projects, it is not
surprising that many genes without homology exist. In addition, expression analysis has
recently been shown to support many ab initio models not yet included in the gene set.
87

Since D. magna (a distant relative of D. pulex) is in the process of being sequenced, all
D. pulex models could be compared to a draft assembly yielding valuable information
about gene model legitimacy (Figure 4-1). The current Daphnia pulex gene catalogue
with previously excluded genes (green and purple) is summarized below (Figure 4-1).
45000
40000
35000
o 30000
£ 25000
J 20000
S> 15000 t
10000
5000
0
m extra
•: no homology
K no non-Daphnia homology
• non-Daphnia homology
gene predictions w/ magna homology
Figure 4-1: Homology among predicted genes in D. pulex. This analysis uses the Frozen Gene Set for D. pulex Draft 1.0 (left, bar, blue and red only).
88

D. pulex 100 AA, 60% n=36,186
I ' ' ' ' I
H. sapiens 100AA, 60% n=10,276
C. elegans 100AA, 60% n=5165
A thaliana 100 AA, 60% n=27,188
Figure 4-2.Age distribution of gene duplicates at >60% AA identity.
Figures 4-2 and 4-3 depict the frequency distribution of all gene pairs for four
taxa plotted against their Ks values. The first panel (Figure 4-2) shows the distribution
using the 60%, 100 amino acid minimum, while the second (Figure 4-3) shows the
frequency distribution using the 40%, 100 amino acid identity. As would be expected, all
taxa show an enrichment of older duplicates in the 40% panel (Figure 4-3). However, D.
pulex (upper left quadrant of both panels) shows the smoothest decay curve using both
cutoffs. This suggests a steady birth/death turnover over time. H. sapiens, a vertebrate,
shows signs of ancient duplication activity when enriched for older duplicates (Figure 4-
3, upper right). C. elegans (lower left in both panels), shows a younger explosion of
duplication (Ks ~ 0.4), magnified in the first panel (Figure 4-2). C. elegans also appears
to maintain many ancient duplicates (Figure 4-3, lower left).
89

D. pulex 100AA,40% n=66502
0 35
0.30
0.25
>. 0.20. o c CD
| 0.16.
0.10-
H. sapiens 100AA, 40% n=64783
C. elegans 100 AA, 40% n=12570
A. thaliana 100 AA, 40% n=61633
Figure 4-3: Age distribution of gene duplicates at >40% AA identity.
A. thaliana clearly shows a spike in gene duplication at Ks ~ 0.75, most likely due
to an ancient polyploidization event (Maere et al. 2005). Overall, when comparing all
gene duplicate pairs, D. pulex shows a high rate of birth with the most steady decay of
duplicates, both in the panel enriched for recent duplicates (Figure 4-2) and with older
duplicates (Figure 4-3). Because the number of duplicate comparisons overestimates the
number of duplication events, single duplicate pairs (i.e. family size =2) were used to
estimate birth rates for the four taxa. Figures 4-4 and 4-5 show the age distribution of
single pair duplicates at the conservative (60% amino acid identity) and relaxed (40%)
cutoffs, respectively.
90

D. pulex 100 AA, 60% n=1437 (single pairs)
- P " " -1 ' '
Ks
>, 0.20 o
I 0.15 • <D
0.10-
H. sapiens 100AA, 60% n=962 (single pairs)
1 2 3 4 5
Ks
ST 0.15
C. elegans 100AA, 60% n=949 (single pairs)
0.40-
0.35-
0.30
0.25
& c § 0.20 cr
" - 0.15
0.10
0.05
0.00
A. thaliana 100 AA, 60% n=3634 (single pairs)
Ks
Figure 4-4: Distribution of single copy gene pairs. Average and median Ks values for single copy gene pairs are lower than for all gene pairs mostly due to a surplus of exact copy gene pairs.
Interestingly, using only single pair duplicates, the frequency distributions do not
change significantly at the two cutoffs. Additionally, duplicate explosions described
above are only apparent in A. thaliana when looking at single gene pairs. A. thaliana
shows an extreme surplus of near-exact duplicates in all panels.
91

D. pulex 100AA, 40% n=1141 (single pairs
025-
g. 0.20
C
I 0.15 d)
0.10-
H. sapiens 100AA,40% n=1165 (single pairs)
*n m t H M l H U l W ' l Ks
0.25.
> . 0.20. o c 05
I 0.15.
0 . 1 0 - *
0,05-1^,
o . o o - r ^ ^ ^ ^ ^ ^ ^ ^ W
C. elegans 100AA,40% n=843 (single pairs)
MMWfPHW^ 2 3
Ks
0.40'
0.35 •
0.30-
0.25-
| -£ o.isH
0.10
0.05
A. thaliana 100AA, 40% n=2578 (single pairs)
2 ' "I * " i <• ' I
3 4
Ks
Figure 4-5: Frequency distribution of single gene duplicates using 40%, 100 amino acid identity cutoff.
In order to evaluate the magnitude of selective pressure on gene duplicate cohorts,
the ratio of replacement substitution to silent substitution rate (Ka/Ks) was plotted against
age (Ks) for each gene duplicate pair. Without purifying or positive selection, the rate of
silent and replacement substitution are expected to be the same. Therefore, under a
neutral model of sequence evolution, Ka/Ks is expected to be around 1 (Nei and Kumar
2000; Yang and Bielawski 2000).
The Ka/Ks statistic employed here is an average value for an aligned portion of a
gene (>100 AA). Extreme recent selection on a small portion of sites in a gene would be
undetectable. Also, for any given gene pair, it is not possible to identify the gene under
92

selection without polarizing the analysis. For instance, if a single member of a gene
family is undergoing positive selection, it will show a high Ka/Ks when paired with all
members of its family.
Theories regarding the fate of gene duplicates predict that, on average, younger
gene duplicate pairs are expected to evolve with reduced selective pressure due to
redundancy (Wagner 2002). In fact, most genome-wide studies to date support this
generalization (Lynch and Conery 2003; Zhang et al. 2004), although some have
questioned the extent of relaxation (Kondroshov et al. 2002). D. pulex is no exception.
The majority of gene duplicates evolve with intense purifying selection (Ka/Ks « 1).
Single pair gene duplicates in the D. pulex genome were found to have larger ranges of
Ka/Ks at lower Ks values (Figure 4-6).
General patterns of evolution between gene pairs are depicted in Figures 4-6 - 4-
8. Single gene pairs (family size=2, Figures 4-6), all gene pairs (family sizes >1, Figure
4-7) and predicted pseudogenes (Figures 4-8) are plotted separately. Once disabled,
pseudogenes are expected to evolve neutrally. However, the signature of purifying
selection can be detected in young pseudogenes since they may have been functional for
a period of time after duplication (Figures 4-8). However, on average pseudogene pairs
have an elevated Ka/Ks values (Table 4-2). Additionally, when comparing pseudogenes
to real genes, a significant portion of the substitutions observed occurred in the real gene,
therefore giving the pattern of divergence between the pairs the signature of purifying
selection. Relative levels of purifying selection between gene-gene and pseudogene-gene
comparisons are therefore more informative. Dead-on-arrival duplicates are expected to
neutrally evolve, even at a young age.
93

1 -
co
"cB * 0.1
0.01
3 "m ' " m
' . m * - « • •
: •- "••: -s-^7S?PfB • . - - . . . - % * • * • • * . ? • • *
. - * • • • • J . - • : •
: . - . " -• •
• •
• * •
1 ' ' ' ' 1 " l 1 l l l I I I 1 1 " "
•
G i l • • k y f f
^ • S L " *ftJL *ai<Qt V i -V
. * • -
• I • • •
• •
1—1 1 1 1 11
IP
ftr to • 1
•
, , , 1
0.01 0.1
Ks
Figure 4-6: Selection intensity (Ka/Ks) and age of single gene pairs.
O.OH
. • . a • \* •
" ^ " * " • • i l l % _«— ff "•• . ' •
t . . " 1 1 1 1 1
0.01 - 1 1 r T ' T ' T ' f j
0.1 T
1
Ks
Figure 4-7: Selection intensity (Ka/Ks) and age of all gene pairs
94

J 0.1
o.oi 4
• - • • • i • tvrJ v - •
•"ST.
- , , , , . | M I , ! • ! ! ,
-i 1—i—rrrn 0.01 0.1
Ks
Figure 4-8: Selection intensity (Ka/Ks) and age of pseudogene-gene pairs.
Pseudogenes were compared to their closest living relative in the predicted
D. pulex gene catalogue. Pseudogene pairs are younger on average and show a
steeper decay in frequency when plotted along Ks (Figure 4-9). While this would
be expected if pseudogenes accumulate deleterious mutations rapidly (i.e. higher
death rate), there may be an ascertainment bias towards discovering younger
pseudogenes.
95

' A l l Gene-Gene Pairs
Gene-Pseudogene Pairs
«~» Single Gene-Gene Pairs
1
Figure 4-9: Distribution of Ks for gene pairs.
By comparing different ranges of Ks, comparative estimates were made between
all, single and pseudogene pairs (Table 4-3).
Ks
Avg median
Ka
avg median
Ka/Ks
avg median
N pairs
0<Ks<5
all pairs
single pairs
psi pairs
0.607
0.469
0.485
0.312
0.206
0.078
0.153
0.137
0.649
0.143
0.127
0.057
0.252
0.292
1.338
0.458
0.617
0.731
. 35520
1423
9274
.OK Ks < 5
all pairs
single pairs
psi pairs
0.632
0.554
0.622
0.331
0.278
0.125
0.159
0.148
0.497
0.151
0.139
0.0807
0.252
0.267
0.799
0.456
0.500
0.646
34105
1202
7234
.01 < Ks < 1
all pairs
single pairs
psi pairs
0.305
0.278
0.165
0.248
0.21
0.091
0.144
0.133
0.211
0.124
0.111
0.058
0.472
0.478
1.279
0.500
0.529
0.637
27594
1005
5857
Table 4-3: Average and median values for substitution analysis of all, single and pseudogene pairs and varying ranges of Ks.
0.45
0.4
0.35
0.3
£ 0.25 ai 3
u_
0.15 -
0.1 -
0.05
0
0 0.2 0.4
Ks
0.6 0.8
96

For Ks values 0-5 (Table 4-2, top), pseudogenes have a relatively high rate of
replacement substitution (Ka). Single pairs and pseudogenes tend to be younger than all
gene pairs.
Ks values that exclude exact copy duplicates (Ks >0.01, middle rows, Table 4-2)
show similar comparative values. However, when examining younger pairs (Ks <1,
bottom rows, Figure 4-2), values are considered more reliable. Median and average
values converge between values for all taxa at Ks <1, suggesting more normal
distributions of Ka and Ks.
Recent gene duplicates (K < 0.1) were functionally annotated using the JGI-
generated KOG report for the predicted gene set. When compared to all genes, recent
duplicates were enriched for post-translational modification and chromatin structure and
underrepresented in the general function category (Figure 4-10, chi sq. p=.023).
97

Translation, ribosomal structure and..
Transcription
Signal transduction mechanisms
Secondary metabolites biosynthesis,..
RNA processing and modification
Replication, recombination and repair
Posttranslational modification, protein..
Nucleotide transport and metabolism
Nuclear structure
Lipid transport and metabolism
Intracellular trafficking, secretion, and..
Inorganic ion transport and metabolism
General function prediction only
Function unknown
Extracellular structures
Energy production and conversion
Defense mechanisms
Cytoskeleton
Coenzyme transport and metabolism
Chromatin structure and dynamics
Cell wall/membrane/envelope biogenesis
Cell motility
Cell cycle control, cell division,..
Carbohydrate transport and metabolism
Amino acid transport and metabolism
W. All genes
MRecent Duplicates
0.05 0.1 0.15 0.2
Figure 4-10: Comparison of KOG classes all genes vs. recent duplicates (Ks < 0.1).
98

Tandem vs. dispersed gene duplicates in D. pulex genome
In order to gauge the effect of physical and spatial orientation of duplicate pairs
on patterns of evolution, duplicate pairs were classified into four groups: Tandem (< 20
kb apart) in cis (same coding strand), tandem in trans (on opposite strands), dispersed on
the same scaffold and dispersed on different scaffolds. A general pattern of decay in the
number of functional gene duplicates over time is apparent in all categories (Figure 4-11).
However, the tandem duplicates appear older on average (Ks >0.750), with trans
duplicates showing the largest signature of purifying selection (Ka/Ks=0.170, Table 4-4).
The relative youth of dispersed duplicates suggests that there may be more gene
conversion with these families- or that the general mechanism of gene duplication is
dispersive and tandem duplicates are special cases of co-regulated gene families.
Spatial relationship
Tandem-cis <20kb
Tandem-trans<20kb
Dispersed >20kb
Dispersed
N50 Tandem-cis <20kb
N50 Tandem-trans<20kb
N50 Dispersed >20kb
N50 Dispersed
Ks
0.770
0.750
0.597
0.597
0.932
0.961
0.826
0.909
Ka
0.166
0.127
0.136
0.154
0.175
0.128
0.142
0.172
Ka/Ks
0.216
0.170
0.228
0.258
0.188
0.133
0.172
0.189
# gene pairs
1704
363
2767
30663
1462
281
2622
19454
Table 4-4: Substitution analysis between gene duplicate pairs in four spatial categories among all gene pairs (top) and those in the N50 (bottom).
99

O 020J C
Gene duplicates Cis <20kb
Gene duplicates Same scaffold >20kb
IX o.mM
Gene duplicates Trans <20kb
Ks
Gene duplicates Different scaffolds
Ks
H 0) 3 O. (D
3
CO • o
W (D
a
Figure 4-11: Frequency distribution of all gene pairs along Ks in four spatial categories.
However, restricting the dispersed class to those from the best-assembled half of the
genome (N50=100 scaffolds) (Figure 4-12) brings average age (Ks) from 0.597 to 0.909 from
7793 dispersed, different scaffold gene pairs (Table 4-4). This suggests that many pairs involving
orphans (gene on micro-scaffolds) may be young. Although many scaffolds outside the N50 are
quite large (e.g. scaffold 200 = 184,404 bp), there are hundreds of scaffolds that contain single or
few protein-coding genes. Pan and Zheng (2008) estimate that 10-20% of genes in most
eukaryotes are in tandem. Daphnia meets this expectation. However, the observation that tandem
duplicates are older on average suggests that duplicate birth and/or gene conversion, forces that
would lead to pairs with low Ks, are not necessarily biased towards tandem genes.
100

0.40 T
0.35
0.30
0.25-
§ 0.20-
D. pulex 100 AA, 60% Tandem as N50, n=1462 pairs
0.40
0.35-
0.30
0.25 >. o m 0.20-cr
i t 0.15
0.10-
L.
D. pulex 100 AA, 60% Tandem trans N50, n=281 pairs
Ks Ks
D. pulex 100AA, 60% Same scaffold >20kb N50, n=2622 pairs
i t 0.15
D. pulex 100AA, 60% Different scaffolds N50, n=19454
Ks
Figure 4-12: Frequency distribution of N50 gene pairs along Ks in four spatial categories.
While cis and trans tandem duplicates have similar birth rates (0.00349 and
0.00391 duplications/gene/0.01 Ks, respectively), trans duplicates have higher initial
death rates. The retention of cis duplicates (Figure 4-13) is responsible for the expanded
number (> 5X) of cis vs. trans duplicates.
101
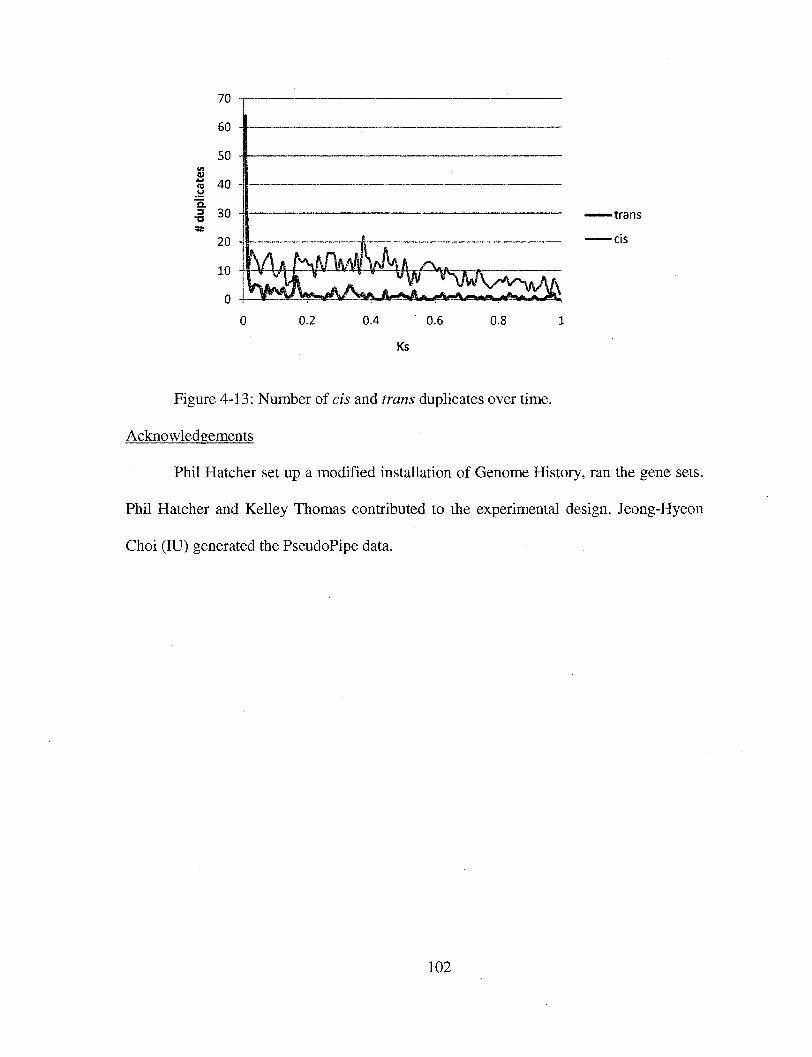
•trans
•cis
Figure 4-13: Number of cis and trans duplicates over time.
Acknowledgements
Phil Hatcher set up a modified installation of Genome History, ran the gene sets.
Phil Hatcher and Kelley Thomas contributed to the experimental design. Jeong-Hyeon
Choi (IU) generated the PseudoPipe data.
102
LIST OF REFERENCES
Akashi, H. Inferring weak selection from patterns of polymorphism and divergence at "silent" sites in Drosophila DNA. Genetics 139, 1067-76(1995). Altshuler, D., Daly, M.J. & Lander, E.S. Genetic Mapping in Human Disease. Science 322, 881-888(2008). Anderson, A.D. & Weir, B.S. A maximum-likelihood method for the estimation of pairwise relatedness in structured populations. Genetics 176, 421-40(2007). Andersson, G.E. & Kurland, C.G. An extreme codon preference strategy: codon reassignment. Mol Biol Evol 8, 530-44(1991). Andolfatto, P. Adaptive evolution of non-coding DNA in Drosophila. Nature 437, 1149-52(2005). Andolfatto, P. Hitchhiking effects of recurrent beneficial amino acid substitutions in the Drosophila melanogaster genome. Genome Res 17, 1755-62(2007). Anisimova, M. & Liberies, D.A. The quest for natural selection in the age of comparative genomics. Heredity 99, 567-79(2007). Aquadro, C.F. & Greenberg, B.D. Human mitochondrial DNA variation and evolution: analysis of nucleotide sequences from seven individuals. Genetics 103, 287-312(1983). Arnheim, N. et al. Molecular evidence for genetic exchanges among ribosomal genes on nonhomologous chromosomes in man and apes. Proc Natl Acad Sci US All, 7323-7(1980). Asakawa, S. et al. Strand-specific nucleotide composition bias in echinoderm and vertebrate mitochondrial genomes. J Mol Evol 32, 511-20(1991). Baer, C.F., Miyamoto, M.M. & Denver, D.R. Mutation rate variation in multicellular eukaryotes: causes and consequences. Nat Rev Genet 8, 619-31(2007). Begun, D J. & Aquadro, C.F. Levels of naturally occurring DNA polymorphism correlate with recombination rates in D. melanogaster. Nature 356, 519-20(1992). Begun, DJ. et al. Population genomics: whole-genome analysis of polymorphism and divergence in Drosophila simulans. PLoS Biol 5, e310(2007). Beisswanger, S. & Stephan, W. Evidence that strong positive selection drives neofunctionalization in the tandemly duplicated polyhomeotic genes
103

in Drosophila. Proc Natl Acad Sci USA 105, 5447-52(2008). 15. Belle, E.M. et al. An investigation of the variation in the transition bias
among various animal mitochondrial DNA. Gene 355, 58-66(2005). 16. Belshaw, R. & Bensasson, D. The rise and falls of introns. Heredity 96, 208-
13(2006). 17. Benfey, P.N. & Mitchell-Olds, T. From genotype to phenotype: systems
biology meets natural variation. Science 320, 495-7(2008). 18. Berget, S.M., Moore, C. & Sharp, P.A. Spliced segments at the 5' terminus
of adenovirus 2 late mRNA. Proc Natl Acad Sci USA 74, 3171-5(1977). 19. Bernardi, G. The neoselectionist theory of genome evolution. Proc Natl
Acad Sci USA 104, 8385-90(2007). 20. Betancourt, A J. & Presgraves, D.C. Linkage limits the power of natural
selection in Drosophila. Proc Natl Acad Sci USA99, 13616-20(2002). 21. Beye, M. et al. Exceptionally high levels of recombination across the honey
bee genome. Genome Res 16, 1339-44(2006). 22. Bielawski, J.P. & Gold, J.R. Mutation patterns of mitochondrial H- and L-
strand DNA in closely related Cyprinid fishes. Genetics 161, 1589-97(2002). 23. Bierne, N. & Eyre-Walker, A. The genomic rate of adaptive amino acid
substitution in Drosophila. Mol Biol Evol 21, 1350-60(2004). 24. Birky, C.W. & Walsh, J.B. Effects of linkage on rates of molecular
evolution. Proc Natl Acad Sci U S A 85, 6414-8(1988). 25. Biswas, S. & Akey, J.M. Genomic insights into positive selection. Trends
Genet 22, 437-46(2006). 26. Bjornerfeldt, S., Webster, M.T. & Vila, C. Relaxation of selective constraint
on dog mitochondrial DNA following domestication. Genome Res 16, 990-4(2006).
27. Blouin, M.S. et al. Substitution bias, rapid saturation, and the use of mtDNA for nematode systematics. Mol Biol Evol 15, 1719-27(1998).
28. Boore, J.L. Animal mitochondrial genomes. Nucleic Acids Res 27, 1767-80(1999).
29. Boyko, A.R. et al. Assessing the evolutionary impact of amino acid mutations in the human genome. PLoS Genet 4, el000083(2008).
30. Brown, W.M. The mitochondrial genome of animals. Molecular Evolutionary Genetics 95-130
31. Brown, W.M., George, M. & Wilson, A.C. Rapid evolution of animal mitochondrial DNA. Proc Natl Acad Sci USA76, 1967-71(1979).
32. Brown, W.M. et al. Mitochondrial DNA sequences of primates: tempo and mode of evolution. J Mol Evol 18, 225-39(1982).
33. Bussell, J.J. et al. Human polymorphism and human-chimpanzee divergence in pseudoautosomal region correlate with local recombination rate. Gene 368, 94-100(2006).
34. Bustamante, CD. et al. Natural selection on protein-coding genes in the human genome. Nature 437, 1153-7(2005).
35. Butlin, R. Population genomics and speciation. Genetica
104

(2008).doi:10.1007/sl0709-008-9321-3 36. Cai, J.J. et al. Pervasive Hitchhiking at Coding and Regulatory Sites in
Humans. PLoS Genet 5, el000336(2009). 37. Cargill, M. et al. Characterization of single-nucleotide polymorphisms in
coding regions of human genes. Nat Genet 22, 231-238(1999). 38. Castric, V. et al. Repeated adaptive introgression at a gene under multiallelic
balancing selection, PLoS Genet 4, el000168(2008). 39. Chamary, J.V., Parmley, J.L. & Hurst, L.D. Hearing silence: non-neutral
evolution at synonymous sites in mammals. Nat Rev Genet 7, 98-108(2006). 40. Charlesworth, D. Balancing selection and its effects on sequences in nearby
genome regions. PLoS Genet 2, e64(2006). 41. Charlesworth, J. & Eyre-Walker, A. The McDonald-Kreitman test and
slightly deleterious mutations. Mol Biol Evol 25,1007-15(2008). 42. Charlesworth, B., Morgan, M.T. & Charlesworth, D. The effect of
deleterious mutations on neutral molecular variation. Genetics 134, 1289-303(1993).
43. Chen, H. & Blanchette, M. Detecting non-coding selective pressure in coding regions. BMC Evol Biol 7 Suppl 1, S9(2007).
44. Chen, X.J. & Butow, R.A. The organization and inheritance of the mitochondrial genome. Nat Rev Genet 6, 815-825(2005).
45. Chen, J. et al. Gene conversion: mechanisms, evolution and human disease. Nat Rev Genet 8, 762-75(2007).
46. Cheng, T. et al. Mining single nucleotide polymorphisms from EST data of silkworm, Bombyx mori, inbred strain Dazao. Insect Biochem Mol Biol 34, 523-30(2004).
47. Chou, H.H. & Holmes, M.H. DNA sequence quality trimming and vector removal. Bioinformatics 17, 1093-104(2001).
48. Chow, L.T. et al. An amazing sequence arrangement at the 5' ends of adenovirus 2 messenger RNA. Cell 12, 1-8(1977).
49. Clamp, M. et al. Distinguishing protein-coding and noncoding genes in the human genome. Proc Natl Acad Sci USA 104, 19428-33(2007).
50. Clary, D.O. & Wolstenholme, D.R. Drosophila mitochondrial DNA: conserved sequences in the A + T-rich region and supporting evidence for a secondary structure model of the small ribosomal RNA. J Mol Evol 25, 116-25(1987).
51. Clayton, D.A. Transcription and replication of mitochondrial DNA. Hum Reprod 15 Suppl 2, 11-7(2000).
52. Coates, B.S. et al. Partial mitochondrial genome sequences of Ostrinia nubilalis and Ostrinia furnicalis. Int J Biol Sci. 1, 13-18(2005).
53. Coen, E., Strachan, T. & Dover, G. Dynamics of concerted evolution of ribosomal DNA and histone gene families in the melanogaster species subgroup of Drosophila. J Mol Biol 158,17-35(1982).
54. Colbourne, J.K. & Hebert, P.D. The systematics of North American Daphnia (Crustacea: Anomopoda): a molecular phylogenetic approach. Philos Trans
105

R Soc LondB Biol Sci 351, 349-60(1996). 55. Colbourne, J.K., Hebert, P.D. & Taylor, D.J. Evolutionary Origin of
Phenotypic Diversity in Daphnia. Molecular Evolution and Adaptive Radiation 163-188(2000).
56. Colbourne, J.K. et al. Sampling Daphnia's expressed genes: preservation, expansion and invention of crustacean genes with reference to insect genomes. BMC Genomics 8, 217(2007).
57. Collins, D.W. & Jukes, T.H. Rates of transition and transversion in coding sequences since the human-rodent divergence. Genomics 20, 386-96(1994).
58. Comeron, J.M., Williford, A. & Kliman, R.M. The Hill-Robertson effect: evolutionary consequences of weak selection and linkage in finite populations. Heredity 100, 19-31(2008).
59. Conant, G.C. & Wagner, A. GenomeHistory: a software tool and its application to fully sequenced genomes. Nucleic Acids Res 30, 3378-86(2002).
60. Conant, G.C. & Wagner, A. Asymmetric sequence divergence of duplicate genes. Genome Res 13, 2052-8(2003).
61. Coulombe-Huntington, J. & Majewski, J. Characterization of intron loss events in mammals. Genome Res 17, 23-32(2007).
62. Coulombe-Huntington, J. & Majewski, J. Intron loss and gain in Drosophila. Mol Biol Evol 24, 2842-50(2007).
63. Cousyn, C. et al. Rapid, local adaptation of zooplankton behavior to changes in predation pressure in the absence of neutral genetic changes. ProcNatl Acad Sci USA98, 6256-60(2001).
• 64. Crawford, D.C. et al. Evidence for substantial fine-scale variation in recombination rates across the human genome. Nat Genet 36, 700-6(2004).
65. Crease, T.J. The complete sequence of the mitochondrial genome of Daphnia pulex (Cladocera: Crustacea). Gene 233, 89-99(1999).
66. Cristescu, M.E.A. et al. A microsatellite-based genetic linkage map of the waterflea, Daphnia pulex: On the prospect of crustacean genomics. Genomics 88, 415-30(2006).
67. Cruz, F., Vila, C. & Webster, M.T. The legacy of domestication: accumulation of deleterious mutations in the dog genome. Mol Biol Evol 25, 2331-6(2008).
68. Curole & Kocher Mitogenomics: digging deeper with complete mitochondrial genomes. Trends Ecol Evol 14, 394-398(1999).
69. Cutter, A.D. & Payseur, B.A. Selection at linked sites in the partial selfer Caenorhabditis elegans. Mol Biol Evol 20, 665-73(2003).
70. Cutter, A.D., Baird, S.E. & Charlesworth, D. High nucleotide polymorphism and rapid decay of linkage disequilibrium in wild populations of Caenorhabditis remanei. Genetics 174, 901-13(2006).
71. Cutter, A.D., Wasmuth, J.D. & Washington, N.L. Patterns of molecular evolution in Caenorhabditis preclude ancient origins of selfing. Genetics 178, 2093-104(2008).
106

72. Dehal, P. et al. The draft genome of Ciona intestinalis: insights into chordate and vertebrate origins. Science 298, 2157-67(2002).
73. Demuth, J.P. et al. The evolution of mammalian gene families. PLoS ONE 1, e85(2006).
74. Denver, D.R. et al. High direct estimate of the mutation rate in the mitochondrial genome of Caenorhabditis elegans. Science 289, 2342-4(2000).
75. DeSalle, R. et al. Tempo and mode of sequence evolution in mitochondrial DNA of Hawaiian Drosophila. J MolEvol 26,157-64(1987).
76. Diller, K.C., Gilbert, W.A. & Kocher, T.D. Selective sweeps in the human genome: a starting point for identifying genetic differences between modern humans and chimpanzees. Mol Biol Evol 19, 2342-5(2002).
77. Dobzhansky, T. A review of some fundamental concepts and problems of population genetics. Cold Spring Harb Symp Quant Biol 20, 1-15(1955).
78. Dobzhansky, T. Nothing in Biology Makes Sense Except in the Light of Evolution. The American Biology Teacher 35, 125-129(1973).
79. Donnelly, P. Progress and challenges in genome-wide association studies in humans. Nature 456, 728-731 (2008).
80. Drosophila 12 Genomes Consortium Evolution of genes and genomes on the Drosophila phylogeny. Nature 450, 203-218(2007).
81. Dudycha, J.L. & Tessier, A.J. Natural Genetic Variation of Life Span, Reproduction, and Juvenile Growth in Daphnia. Evolution 53, 1744-1756(1999).
82. Dunn, C.W. et al. Broad phylogenomic sampling improves resolution of the animal tree of life. Nature 452, 745-9(2008).
83. Eads, B.D., Andrews, J. & Colbourne, J.K. Ecological genomics in Daphnia: stress responses and environmental sex determination. Heredity 100, 184-190(2007).
84. Elder, J.F. & Turner, B.J. Concerted evolution of repetitive DNA sequences in eukaryotes. Q Rev Biol 70, 297-320(1995).
85. Ellegren, H. Comparative genomics and the study of evolution by natural selection. Molecular Ecology 17, 4586-4596(2008).
86. Ellegren, H. & Sheldon, B.C. Genetic basis of fitness differences in natural populations. Nature 452, 169-75(2008).
87. Emerson, J.J. et al. Natural Selection Shapes Genome-Wide Patterns of Copy-Number Polymorphism in Drosophila melanogaster. Science 320, 1629-1631(2008).
88. Escriva, H. et al. Neofunctionalization in Vertebrates: The Example of Retinoic Acid Receptors. PLoS Genet. 2, el02(2006).
89. Eyre-Walker, A. The genomic rate of adaptive evolution. Trends in Ecology & Evolution 21, 569-575(2006).
90. Faith, J.J. & Pollock, D.D. Likelihood analysis of asymmetrical mutation bias gradients in vertebrate mitochondrial genomes. Genetics 165, 735-45(2003).
107

91. Farris, J. Phylogenetic analysis under Dollo's law. Syst. Zool. 26, 220-223(1977).
92. Fay, J.C., Wyckoff, G.J. & Wu, C. Testing the neutral theory of molecular evolution with genomic data from Drosophila. Nature 415, 1024-6(2002).
93. Feder, M.E. & Mitchell-Olds, T. Evolutionary and ecological functional genomics. Nat Rev Genet 4, 651-7(2003).
94. Fedorov, A. et al. Mystery of Intron Gain. Genome Res. 13, 2236-2241(2003).
95. Ferris, S.D., Wilson, A.C. & Brown, W.M. Evolutionary tree for apes and humans based on cleavage maps of mitochondrial DNA. Proc Natl Acad Sci USA 78, 2432-6(1981).
96. Force, A. et al. Preservation of duplicate genes by complementary, degenerative mutations. Genetics 151, 1531-45(1999).
97. Ford, E. Genetic Polymorphism. (Faber and Faber: London, 1965). 98. Fox, A.K., Tuch, B.B. & Chuang, J.H. Measuring the prevalence of regional
mutation rates: an analysis of silent substitutions in mammals, fungi, and insects. BMC Evol Biol. 8, 186(2008).
99. Frank, A.C. & Lobry, J.R. Asymmetric substitution patterns: a review of possible underlying mutational or selective mechanisms. Gene 238, 65-77(1999).
100. Frazer, K.A. et al. A second generation human haplotype map of over 3.1 million SNPs. Nature 449, 851-61(2007).
101. Freeland, S.J. et al. Early fixation of an optimal genetic code. Mol Biol Evol 17,511-8(2000).
102. Fumagalli, M. et al. Widespread balancing selection and pathogen-driven selection at blood group antigen genes. Genome Res (2008).doi:gr.082768.108
103. Gaffney, D.J. & Keightley, P.D. The scale of mutational variation in the murid genome. Genome Res 15, 1086-94(2005).
104. Gilbert, W. Why genes in pieces? Nature 271, 501(1978). 105. Gilbert, M.T.P. et al. The emergence of HIV/AIDS in the Americas and
beyond. Proc Natl Acad Sci USA 104, 18566-70(2007). 106. Gillespie, J.H. Genetic drift in an infinite population. The pseudohitchhiking
model. Genetics 155, 909-19(2000). 107. Gillespie, J.H. Population genetics: A Concise Guide. (Johns Hopkins
University Press: Baltimore, MD, 2004). 108. Gladyshev, E. & Meselson, M. Extreme resistance of bdelloid rotifers to
ionizing radiation. Proc Natl Acad Sci USA 105, 5139-44(2008). 109. Gladyshev, E.A., Meselson, M. & Arkhipova, I.R. Massive Horizontal Gene
Transfer in Bdelloid Rotifers. Science 320, 1210-1213(2008). 110. Gojobori, T., Li, W. & Graur, D. Patterns of nucleotide substitution in
pseudogenes and functional genes. Journal of Molecular Evolution 18, 360-369(1982).
111. Gordo, I. & Campos, P. Adaptive evolution in a spatially structured asexual
108

population. Genetica 127, 217-229(2006). 112. Graur, D. & Li, W. Fundamentals of Molecular Evoution. (Sinauer:
Sunderland, MA, 2000). 113. Green, P. Against a whole-genome shotgun. Genome Res 7, 410-7(1997). 114. Gregory, T.R. The Evolution of the Genome. (Elsevier Academic Press:
Boston, MA, 2005). 115. Gu, Z. et al. Role of duplicate genes in genetic robustness against null
mutations. Nature 421, 63-6(2003). 116. Haag-Liautard, C. et al. Direct estimation of the mitochondrial DNA
mutation rate in Drosophila melanogaster. PLoS Biol 6, e204(2008). 117. Haddrill, P.R. et al. Reduced efficacy of selection in regions of the
Drosophila genome that lack crossing over. Genome Biol. 8, Rl8(2007). 118. Haddrill, P.R., Waldron, F.M. & Charlesworth, B. Elevated levels of
expression associated with regions of the Drosophila genome that lack crossing over. Biol Lett (2008).doi: 10.1098/rsbl.2008.0376
119. Hahn, M.W. Toward a selection theory of molecular evolution. Evolution 62, 255-65(2008).
120. Hahn, M.W., Han, M.V. & Han, S. Gene family evolution across 12 Drosophila genomes. PLoS Genet 3, el97(2007).
121. Hairston, N.G. et al. Natural selection for grazer resistance to toxic cyanobacteria: evolution of phenotypic plasticity? Evolution 55, 2203-14(2001).
122. Harris, H. Enzyme polymorphisms in man. Proc R Soc Lond B Biol Sci 164, 298-310(1966).
123. Hassanin, A., Leger, N. & Deutsch, J. Evidence for multiple reversals of asymmetric mutational constraints during the evolution of the mitochondrial genome of metazoa, and consequences for phylogenetic inferences. Syst Biol 54, 277-98(2005).
124. Hawks, J. et al. Recent acceleration of human adaptive evolution. Proc Natl Acad Sci USA. 104, 20753-20758(2007).
125. Hebert, P.D.N, et al. Accelerated molecular evolution in halophilic crustaceans. Evolution 56, 909-26(2002).
126. Hedges, S.B. et al. A genomic timescale for the origin of eukaryotes. BMC Evol Biol 1,4(2001).
127. Hedrick, P.W. Balancing selection. CurrBiol 17, R230-l(2007). 128. Hellmann, I. et al. A neutral explanation for the correlation of diversity with
recombination rates in humans. Am J Hum Genet 72, 1527-35(2003). 129. Hellmann, I. et al. Population genetic analysis of shotgun assemblies of
genomic sequences from multiple individuals. Genome Res 18, 1020-9(2008).
130. Hill, W.G. & Robertson, A. The effect of linkage on limits to artificial selection. Genet Res 8, 269-94(1966).
131. Hill, W.G. & Robertson, A. Linkage disequilibrium in finite populations. TAG Theoretical and Applied Genetics 38, 226-231(1968).
109

132. Hillier, L.W. et al. Whole-genome sequencing and variant discovery in C. elegans. NatMeth 5, 183-188(2008).
133. Hindorff, L. et al. A Catalog of Published Genome-Wide Association Studies, www.genome.gov/26525384 (2008).
134. Hinds, D.A. et al. Whole-Genome Patterns of Common DNA Variation in Three Human Populations. Science 307, 1072-1079(2005).
135. Hiroaki Kakinuma & Hitoshi Sato Copy-number variations associated with autism spectrum disorder. (2008).at <http://www.futuremedicine.eom/doi/abs/10.2217/14622416.9.8.1143>
136. Ho, S.Y.W. & Larson, G. Molecular clocks: when times are a-changin'. Trends Genet 22, 79-83(2006).
137. Hoekstra, H.E. et al. A single amino acid mutation contributes to adaptive beach mouse color pattern. Science 313, 101-4(2006).
138. Holt, R.A. et al. The genome sequence of the malaria mosquito Anopheles gambiae. Science 298,129-49(2002).
139. Hsiao, T. & Vitkup, D. Role of duplicate genes in robustness against deleterious human mutations. PLoS Genet 4, el000014(2008).
140. Hudson, R.R. & Kaplan, N.L. Deleterious background selection with recombination. Genetics 141, 1605-17(1995).
141. Hudson, R.R., Kreitman, M. & Aguade, M. A Test of Neutral Molecular Evolution Based on Nucleotide Data. Genetics 116, 153-159(1987).
142. Hughes, A.L. Looking for Darwin in all the wrong places: the misguided quest for positive selection at the nucleotide sequence level. Heredity 99, 364-73(2007).
143. Hughes, A.L. Near neutrality: leading edge of the neutral theory of molecular evolution. Ann N YAcad Sci 1133, 162-79(2008).
144. Hurles, M. Gene duplication: the genomic trade in spare parts. PLoS Biol 2, E206(2004).
145. Hurst, L.D. The Ka/Ks ratio: diagnosing the form of sequence evolution. Trends Genet 18, 486(2002).
146. Ionita-Laza, I. et al. On the frequency of copy number variants. Bioinformatics 24, 2350-2355(2008).
147. Irish, V.F. & Litt, A. Flower development and evolution: gene duplication, diversification and redeployment. Curr Opin Genet Dev 15, 454-60(2005).
148. J C Avise et al. Intraspecific Phylogeography: The Mitochondrial DNA Bridge Between Population Genetics and Systematics. Annual Review of Ecology & Systematics 18,489-522(1987).
149. Jakobsson, M. et al. Genotype, haplotype and copy-number variation in worldwide human populations. Nature 451, 998-1003(2008).
150. Jeffares, D.C., Mourier, T. & Penny, D. The biology of intron gain and loss. Trends Genet 22, 16-22(2006).
151. Jensen, J.D., Wong, A. & Aquadro, C.F. Approaches for identifying targets of positive selection. Trends Genet 23, 568-77(2007).
152. Jiang, C. & Zhao, Z. Directionality of point mutation and 5-methylcytosine
110

deamination rates in the chimpanzee genome. BMC Genomics 7, 316(2006). 153. Jiang, C. & Zhao, Z. Mutational spectrum in the recent human genome
inferred by single nucleotide polymorphisms. Genomics 88, 527-34(2006). 154. Jorde, L.B., Watkins, W.S. & Bamshad, M.J. Population genomics: a bridge
from evolutionary history to genetic medicine. Hum Mol Genet 10, 2199-207(2001).
155. Juarez, P. et al. Evolution of snake venom disintegrins by positive darwinian selection. Mol Biol Evol 25, 2391-407(2008).
156. Kaplan, N.L., Hudson, R.R. & Langley, C.H. The "hitchhiking effect" revisited. Genetics 123, 887-99(1989).
157. Kasahara, M. et al. The medaka draft genome and insights into vertebrate genome evolution. Nature 447,714-719(2007).
158. Katju, V. & Lynch, M. The structure and early evolution of recently arisen gene duplicates in the Caenorhabditis elegans genome. Genetics 165,1793-803(2003).
159. Katju, V. & Lynch, M. On the formation of novel genes by duplication in the Caenorhabditis elegans genome. Mol Biol Evol 23, 1056-67(2006).
160. Kehrer-Sawatzki, H. & Cooper, D.N. Understanding the recent evolution of the human genome: insights from human-chimpanzee genome comparisons. Human Mutation 28, 99-130(2007).
161. Keller, I., Bensasson, D. & Nichols, R.A. Transition-transversion bias is not universal: a counter example from grasshopper pseudogenes. PLoS Genet 3, e22(2007).
162. Khaja, R. et al. Genome assembly comparison identifies structural variants in the human genome. Nat Genet 38, 1413-8(2006).
163. Kidd, J.M. et al. Mapping and sequencing of structural variation from eight human genomes. Nature 453, 56-64(2008).
164. Kim, J.H., Waterman, M.S. & Li, L.M. Diploid genome reconstruction of Ciona intestinalis and comparative analysis with Ciona savignyi. Genome Res 17, 1101-10(2007).
165. Kimura, M. Solution of a process of random genetic drift with a continuous model. Proc Natl Acad Sci USA41, 144-50(1955).
166. Kimura, M. Diffusion Models in Population Genetics. Journal of Applied Probability 1, 177-232(1964).
167. Kimura, M. Evolutionary rate at the molecular level. Nature 217, 624-6(1968).
168. Kimura, M. Preponderance of synonymous changes as evidence for the neutral theory of molecular evolution. Nature 267, 275-6(1977).
169. Kimura, M. The Neutral Theory of Molecular Evolution. (Cambridge University Press: Cambridge, 1983).
170. Kimura, M. & Ohta, T. The Average Number of Generations until Fixation of a Mutant Gene in a Finite Population. Genetics 61, 763-771(1969).
171. Kimura, M. & Ohta, T. Protein polymorphism as a phase of molecular evolution. Nature 229, 467-9(1971).
I l l

172. King, J.L. & Jukes, T.H. Non-Darwinian evolution. Science 164, 788-98(1969).
173. Kocher, T.D. et al. Dynamics of mitochondrial DNA evolution in animals: amplification and sequencing with conserved primers. Proc Natl Acad Sci U SA 86, 6196-200(1989).
174. Kondrashov, F.A. et al. Selection in the evolution of gene duplications. Genome Biol 3, RESEARCH0008(2002).
175. Koonin, E.V. The origin of introns and their role in eukaryogenesis: a compromise solution to the introns-early versus introns-late debate? Biol Direct 1, 22(2006).
176. Koonin, E.V. & Novozhilov, A.S. Origin and evolution of the genetic code: The universal enigma. IUBMB Life (2008).doi:10.1002/iub.l46
177. Kreitman, M. & Akashi, H. Molecular evidence for natural selection. Annual Review of Ecology & Systematics 26, 403-422(1995).
178. Kulathinal, R.J. et al. Fine-scale mapping of recombination rate in Drosophila refines its correlation to diversity and divergence. Proc Natl Acad Sci USA 105, 10051 -6(2008).
179. Kumar, S. & Hedges, S.B. A molecular timescale for vertebrate evolution. Nature 392, 917-20(1998).
180. Larkin, M.A. et al. Clustal W and Clustal X version 2.0. Bioinformatics 23, 2947-8(2007).
181. Lawniczak, M.K.N. et al. Genomic analysis of the relationship between gene expression variation and DNA polymorphism in Drosophila simulans. Genome Biol 9, R125(2008).
182. Lerner, I. Genetic Homeostasis. (Oliver and Boyd: Edinburgh, 1954). 183. Levy, S. et al. The diploid genome sequence of an individual human. PLoS
Biol 5, e254(2007). 184. Lewontin, R.C. & Hubby, J.L. A molecular approach to the study of genie
heterozygosity in natural populations. II. Amount of variation and degree of heterozygosity in natural populations of Drosophila pseudoobscura. Genetics 54, 595-609(1966).
185. Li, W., Yang, J. & Gu, X. Expression divergence between duplicate genes. Trends Genet 21, 602-7(2005).
186. Li, Y.F. et al. "Reverse ecology" and the power of population genomics. Evolution 62, 2984-94(2008).
187. Liao, D. Concerted evolution: molecular mechanism and biological implications. Am J Hum Genet 64, 24-30(1999).
188. Lindblad-Toh, K. et al. Large-scale discovery and genotyping of single-nucleotide polymorphisms in the mouse. Nat Genet 2A, 381-386(2000).
189. Lindblad-Toh, K. et al. Genome sequence, comparative analysis and haplotype structure of the domestic dog. Nature 438, 803-819(2005).
190. Liu, J. et al. Natural selection of protein structural and functional properties: a single nucleotide polymorphism perspective. Genome Biol 9, R69(2008).
191. Llopart, A. et al. Intron presence-absence polymorphism in Drosophila
112

driven by positive Darwinian selection. Proc Natl Acad Sci U S A 99, 8121-6(2002).
192. Loh, Y.E. et al. Comparative analysis reveals signatures of differentiation amid genomic polymorphism in Lake Malawi cichlids. Genome Biol 9, Rl 13(2008).
193. Lohmueller, K.E. et al. Proportionally more deleterious genetic variation in European than in African populations. Nature 451, 994-7(2008).
194. Long, A.D., Beldade, P. & Macdonald, S.J. Estimation of population heterozygosity and library construction-induced mutation rate from expressed sequence tag collections. Genetics 176, 711-4(2007).
195. Lynch, M. Ecological Genetics of Daphnia pulex. Evolution 37, 358-374(1983).
196. Lynch, M. The origins of eukaryotic gene structure. Mol Biol Evol 23, 450-68(2006).
197. Lynch, M. The Origins of Genome Architecture. (Sinauer: Sunderland, MA, 2007).
198. Lynch, V.J. Inventing an arsenal: adaptive evolution and neofunctionalization of snake venom phospholipase A2 genes. BMC Evol Biol. 7, 2(2007).
199. Lynch, M. The frailty of adaptive hypotheses for the origins of organismal complexity. Proc Natl Acad Sci U S A 104 SuppI 1, 8597-604(2007).
200. Lynch, M. Estimation of Nucleotide Diversity, Disequilibrium Coefficients, and Mutation Rates from High-Coverage Genome-Sequencing Projects. Mol Biol Evol 25, 2409-2419(2008).
201. Lynch, M. & Conery, J.S. The evolutionary fate and consequences of duplicate genes. Science 290, 1151-5(2000).
202. Lynch, M. & Conery, J.S. The evolutionary demography of duplicate genes. / Struct Funct Genomics 3, 35-44(2003).
203. Lynch, M. & Force, A. The probability of duplicate gene preservation by subfunctionalization. Genetics 154, 459-73(2000).
204. Lynch, M. & Katju, V. The altered evolutionary trajectories of gene duplicates. Trends Genet 20, 544-9(2004).
205. Lynch, M. & Richardson, A.O. The evolution of spliceosomal introns. Curr Opin Genet Dev 12, 701 -10(2002).
206. Lynch, M. & Ritland, K. Estimation of pairwise relatedness with molecular markers. Genetics 152,1753-66(1999).
207. Lynch, M. & Walsh, J.B. Genetics and Analysis of Quantitative Traits. (Sinauer: Sunderland, MA, 1998).
208. Lynch, M. et al. The probability of preservation of a newly arisen gene duplicate. Genetics 159, 1789-804(2001).
209. Lynch, M. et al. Localization of the genetic determinants of meiosis suppression in Daphnia pulex. Genetics 180, 317-27(2008).
210. Maere, S. et al. Modeling gene and genome duplications in eukaryotes. Proc Natl Acad Sci USA 102, 5454-9(2005).
113

211. Malaria Genomic Epidemiology Network A global network for investigating the genomic epidemiology of malaria. Nature 456, 732-737(2008).
212. Malcom, CM., Wyckoff, G.J. & Lahn, B.T. Genie mutation rates in mammals: local similarity, chromosomal heterogeneity, and X-versus-autosome disparity. Mol Biol Evol 20, 1633-41(2003).
213. Manolio, T.A., Brooks, L.D. & Collins, F.S. A HapMap harvest of insights into the genetics of common disease. J Clin Invest 118, 1590-605(2008).
214. Mardis, E.R. The impact of next-generation sequencing technology on genetics. Trends Genet 24, 133-41 (2008).
215. Mark Welch, D.B., Mark Welch, J.L. & Meselson, M. Evidence for degenerate tetraploidy in bdelloid rotifers. Proc Natl Acad Sci USA 105, 5145-9(2008).
216. Massey, S.E. A neutral origin for error minimization in the genetic code. J Mol Evol 67, 510-6(2008).
217. Mayr, E. Animal Species and Evolution. (Harvard University Press: 1963). 218. McCarroll, S.A. Extending genome-wide association studies to copy-number
variation. Hum. Mol. Genet. 17, R135-142(2008). 219. McCarroll, S.A. & Altshuler, D.M. Copy-number variation and association
studies of human disease. Nat Genet (2007). 220. McDonald, J.H. & Kreitman, M. Adaptive protein evolution at the Adh
locus in Drosophila. Nature 351, 652-4(1991). 221. McKay, J.K. & Stinchcombe, J.R. Ecological genomics of model
eukaryotes. Evolution 62, 2953-7(2008). 222. Mitchell-Olds, T., Willis, J.H. & Goldstein, D.B. Which evolutionary
processes influence natural genetic variation for phenotypic traits? Nat Rev Genet 8, 845-56(2007).
223. Moore, R.C. & Purugganan, M.D. The early stages of duplicate gene evolution. Proc Natl Acad Sci USA 100, 15682-7(2003).
224. Moore, R.C. & Purugganan, M.D. The evolutionary dynamics of plant duplicate genes. Curr Opin Plant Biol 8,122-8(2005).
225. Moriyama, E.N. & Powell, J.R. Intraspecific nuclear DNA variation in Drosophila. Mol Biol Evol 13, 261-77(1996).
226. Nardi, F. et al. The mitochondrial genome of the olive fly <i>Bactrocera oleae</i>: two haplotypes from distant geographical locations. Insect Molecular Biology 12, 605-611(2003).
227. Nei, M. Molecular Evolutionary Genetics. (Columbia University Press: New York, 1987).
228. Nei, M. Selectionism and neutralism in molecular evolution. Mol Biol Evol 22,2318-42(2005).
229. Nei, M. & Kumar, S. Molecular Evolution and Phylogenetics. (Oxford University Press: New York, 2000).
230. Nei, M. & Rooney, A.P. Concerted and birth-and-death evolution of multigene families. Annu Rev Genet 39, 121-52(2005).
231. Nenoi, M. et al. Higher frequency of concerted evolutionary events in
114

rodents than in man at the polyubiquitin gene VNTR locus. Genetics 148, 867-76(1998).
232. Newman, T.L. et al. A genome-wide survey of structural variation between human and chimpanzee. Genome Res. 15, 1344-1356(2005).
233. Nguyen, D. et al. Reduced purifying selection prevails over positive selection in human copy number variant evolution. Genome Res 18, 1711-23(2008).
234. Nilsen, H. et al. Nuclear and mitochondrial uracil-DNA glycosylases are generated by alternative splicing and transcription from different positions in the UNG gene. Nucleic Acids Res 25, 750-5(1997).
235. Niu, D., Lin, K. & Zhang, D. Strand Compositional Asymmetries of Nuclear DNA in Eukaryotes. Journal of Molecular Evolution 57, 325-334(2003).
236. Noor, M. Connecting recombination, nucleotide diversity and species divergence in Drosophila. Fly (Austin) 2, (2008).
237. Novembre, J. et al. Genes mirror geography within Europe. Nature 456, 98-101(2008).
238. Nozawa, M., Kawahara, Y. & Nei, M. Genomic drift and copy number variation of sensory receptor genes in humans. Proceedings of the National Academy of Sciences 104, 20421-20426(2007).
239. Ohno, S. Evolution by Gene Duplication. (Springer-Verlag: Berlin, 1970). 240. Ohta, T. The Nearly Neutral Theory of Molecular Evolution. Annual Review
of Ecology and Systematics 23, 263-286(1992). 241. Omilian, A.R. et al. Ameiotic recombination in asexual lineages of Daphnia.
ProcNatlAcadSciUSA. 103, 18638-18643(2006). 242. Omilian, A.R., Scofield, D.G. & Lynch, M. Intron Presence-Absence
Polymorphisms in Daphnia. Mol Biol Evol 25, 2129-2139(2008). 243. Orr, H.A. Testing Natural Selection. Scientific American 300, 44-51(2009). 244. Paland, S. & Lynch, M. Transitions to asexuality result in excess amino acid
substitutions. Science 311, 990-2(2006). 245. Paland, S., Colbourne, J.K. & Lynch, M. Evolutionary history of contagious
asexuality in Daphnia pulex. Evolution 59, 800-13(2005). 246. Palti, Y. et al. Detection of genes with deleterious alleles in an inbred line of
tilapia (Oreochromis aureus). Aquaculture 206, 151-164(2002). 247. Pan, D. & Zhang, L. Quantifying the major mechanisms of recent gene
duplications in the human and mouse genomes: a novel strategy to estimate gene duplication rates. Genome Biol 8, R 158(2007).
248. Pan, D. & Zhang, L. Tandemly arrayed genes in vertebrate genomes. Comp Fund Genomics 545269(2008).doi: 10.1155/2008/545269
249. Parmley, J.L., Chamary, J.V. & Hurst, L.D. Evidence for purifying selection against synonymous mutations in mammalian exonic splicing enhancers. Mol Biol Evol 23, 301-9(2006).
250. Pavelitz, T. et al. Concerted evolution of the tandem array encoding primate U2 snRNA occurs in situ, without changing the cytological context of the RNU2 locus. EMBO J14, 169-77(1995).
115

251. Pavlidis, P., Hutter, S. & Stephan, W. A population genomic approach to map recent positive selection in model species. Molecular Ecology Y7, 3585-3598(2008).
252. Payseur, B.A. & Nachman, M.W. Gene density and human nucleotide polymorphism. Mol Biol Evol 19, 336-40(2002). .
253. Perna, N.T. & Kocher, T.D. Patterns of nucleotide composition at fourfold degenerate sites of animal mitochondrial genomes. / Mol Evol 41, 353-8(1995).
254. Phillips, N. et al. Spontaneous Mutational and Standing Genetic (Co)Variation at Dinucleotide Microsatellites in Caenorhabditis briggsae and C. elegans. Mol Biol Evol (2008).doi:10.1093/molbev/msn287
255. Pollard, H.G., Colbourne, J.K. & Keller, W. Reconstruction of centuries-old Daphnia communities in a lake recovering from acidification and metal contamination. Ambio 32, 214-8(2003).
256. Ponjavic, J., Ponting, C.P. & Lunter, G. Functionality or transcriptional noise? Evidence for selection within long noncoding RNAs. Genome Res 17, 556-65(2007).
257. Pop, M. et al. Comparative genome assembly. Brief Bioinform 5, 237-48(2004).
258. Przeworski, M., Hudson, R.R. & Di Rienzo, A. Adjusting the focus on human variation. Trends in Genetics 16, 296-302(2000).
259. Ptak, S.E. et al. Fine-scale recombination patterns differ between chimpanzees and humans. Nat Genet 37, 429-34(2005).
260. Rastogi, S. & Liberies, D.A. Subfunctionalization of duplicated genes as a transition state to neofunctionalization. BMC Evol Biol 5, 28(2005).
261. Redon, R. et al. Global variation in copy number in the human genome. Nature 444, 444-454(2006).
262. Reis, M.D. & Wernisch, L. Estimating translational selection in Eukaryotic genomes. Mol Biol Evol msn272(2009).doi:10.1093/molbev/msn272
263. Resch, A.M. et al. Widespread Positive Selection in Synonymous Sites of Mammalian Genes. Mol Biol Evol 24, 1821-1831(2007).
264. Reyes, A. et al. Asymmetrical directional mutation pressure in the mitochondrial genome of mammals. Mol Biol Evol 15, 957-66(1998).
265. Reyes, A. et al. Bidirectional Replication Initiates at Sites Throughout the Mitochondrial Genome of Birds. /. Biol. Chem. 280, 3242-3250(2005).
266. Rocha, E.P.C., Touchon, M. & Feil, E.J. Similar compositional biases are caused by very different mutational effects. Genome Res 16, 1537-47(2006).
267. Rosenberg, M.S., Subramanian, S. & Kumar, S. Patterns of Transitional Mutation Biases Within and Among Mammalian Genomes. Mol Biol Evol 20, 988-993(2003).
268. Roy, S.W. & Gilbert, W. The evolution of spliceosomal introns: patterns, puzzles and progress. Nat Rev Genet 7, 211-21(2006).
269. Ruppert, E.E., Barnes, R.D. & Fox, R.S. Inverebrate Zoology: A Functional Evolutionary Approach. (Brooks Cole: 2003).
116

270. Sabeti, P.C. et al. Detecting recent positive selection in the human genome from haplotype structure. Nature 419, 832-7(2002).
271. Sabeti, P.C. et al. Positive natural selection in the human lineage. Science 312, 1614-20(2006).
272. Sabeti, P.C. et al. Genome-wide detection and characterization of positive selection in human populations. Nature 449, 913-8(2007).
273. Saccone, C. et al. Mitochondrial DNA in metazoa: degree of freedom in a frozen event. Gene 286, 3-12(2002).
274. Sadusky, T., Newman, A.J. & Dibb, N.J. Exon junction sequences as cryptic splice sites: implications for intron origin. CurrBiol 14, 505-9(2004).
275. Sauvage, C. et al. Single Nucleotide polymorphisms and their relationship to codon usage bias in the Pacific oyster Crassostrea gigas. Gene 406,13-22(2007).
276. Sawyer, S.A. et al. Bayesian analysis suggests that most amino acid replacements in Drosophila are driven by positive selection. / Mol Evol 57 Suppll, S 154-64(2003).
277. Sea Urchin Genome Sequencing Consortium et al. The Genome of the Sea Urchin Strongylocentrotus purpuratus. Science 314, 941-952(2006).
278. Sella, G. & Ardell, D.H. The coevolution of genes and genetic codes: Crick's frozen accident revisited. J Mol Evol 63, 297-313(2006).
279. Severson, D.W. et al. Linkage map organization of expressed sequence tags and sequence tagged sites in the mosquito, Aedes aegypti. Insect Mol Biol 11, 371-8(2002).
280. Shadel, G.S. & Clayton, D.A. Mitochondrial DNA maintenance in vertebrates. Annu Rev Biochem 66, 409-35(1997).
281. Shapiro, J.A. et al. Adaptive genie evolution in the Drosophila genomes. Proc Natl Acad Sci USA 104, 2271-6(2007).
282. Shianna, K.V. & Willard, H.F. Human genomics: In search of normality. Nature 444, 428-429(2006).
283. Small, K.S. et al. A haplome alignment and reference sequence of the highly polymorphic Ciona savignyi genome. Genome Biol 8, R41(2007).
284. Small, K.S. et al. Extreme genomic variation in a natural population. Proc Natl Acad Sci USA 104, 5698-703(2007).
285. Smith, N.G.C. & Eyre-Walker, A. Adaptive protein evolution in Drosophila. Nature 415, 1022-4(2002).
286. Smith, J.M. & Haigh, J. The hitch-hiking effect of a favourable gene. Genet Res 23, 23-35(1974).
287. Sokal, R. & Rohlf, F. Biometry. (W.H. Freeman and Company: San Francisco, 1981).
288. Solorzano, E. et al. Patterns of Variation in the Nuclear Genome of Caenorhabditis elegans. in prep
289. Spencer, C C A . et al. The influence of recombination on human genetic diversity. PLoS Genet 2, el48(2006).
290. Stein, L.D. et al. The genome sequence of Caenorhabditis briggsae: a
117

platform for comparative genomics. PLoS Biol 1, E45(2003). 291. Stinchcombe, J.R. & Hoekstra, H.E. Combining population genomics and
quantitative genetics: finding the genes underlying ecologically important traits. Heredity 100, 158-70(2008).
292. Stranger, B.E. et al. Population genomics of human gene expression. Nat Genet 39, 1217-24(2007).
293. Sueoka, N. Intrastrand parity rules of DNA base composition and usage biases of synonymous codons. JMol Evol 40, 318-25(1995).
294. Sung, W. et al. Simple sequence repeats in the Daphnia pulex genome, in prep
295. Svensson, O., Arvestad, L. & Lagergren, J. Genome-wide survey for biologically functional pseudogenes. PLoS Comput Biol 2, e46(2006).
296. Tajima, F. Statistical method for testing the neutral mutation hypothesis by DNA polymorphism. Genetics 123, 585-95(1989).
297. Tamura, K. & Nei, M. Estimation of the number of nucleotide substitutions in the control region of mitochondrial DNA in humans and chimpanzees. MolBiol Evol 10, 512-26(1993).
298. Tamura, K. et al. MEGA4: Molecular Evolutionary Genetics Analysis (MEGA) software version 4.0. Mol Biol Evol 1A, 1596-9(2007).
299. Tanaka, M. & Ozawa, T. Strand asymmetry in human mitochondrial DNA mutations. Genomics 22, 327-35(1994).
300. Tang, K., Thornton, K.R. & Stoneking, M. A New Approach for Using Genome Scans to Detect Recent Positive Selection in the Human Genome. PLoS Biol 5, el7l(2007).
301. Tenesa, A. et al. Recent human effective population size estimated from linkage disequilibrium. Genome Res 17, 520-6(2007).
302. Teshima, K.M. & Innan, H. The effect of gene conversion on the divergence between duplicated genes. Genetics 166, 1553-60(2004).
303. The French-Italian Public Consortium for Grapevine Characterization The grapevine genome sequence suggests ancestral hexaploidization in major angiosperm phyla. Nature 449, 463-467(2007).
304. The Honeybee Genome Sequencing Consortium Insights into social insects from the genome of the honeybee Apis mellifera. Nature 443, 931-949(2006).
305. Thomas, W.K. & Kocher, T.D. Sequencing of polymerase chain reaction-amplified DNAs. Methods Enzymol 224, 391-9(1993).
306. Thomas, W.K. & Wilson, A.C. Mode and tempo of molecular evolution in the nematode caenorhabditis: cytochrome oxidase II and calmodulin sequences. Genetics 128, 269-79(1991).
307. Thomas, W.K., Maa, J. & Wilson, A.C. Shifting constraints on tRNA genes during mitochondrial DNA evolution in animals. New Biol 1, 93-100(1989).
308. Thornton, K.R. et al. Progress and prospects in mapping recent selection in the genome. Heredity 98, 340-348(2007).
309. Tishkoff, S.A. & Kidd, K.K. Implications of biogeography of human
118

populations for 'race' and medicine. Nat Genet 36, S21-7(2004). 310. Tishkoff, S.A. & Williams, S.M. Genetic analysis of African populations:
human evolution and complex disease. Nat Rev Genet 3, 611-621(2002). 311. Tishkoff, S.A. et al. Convergent adaptation of human lactase persistence in
Africa and Europe. Nat Genet 39, 31-40(2007). 312. Tribolium Genome Sequencing Consortium The genome of the model beetle
and pest Tribolium castaneum. Nature 452, 949-955(2008). 313. Tsai, I.J. et al. Population genomics of the wild yeast Saccharomyces
paradoxus: Quantifying the life cycle. Proc Natl Acad Sci USA 105, 4957-62(2008).
314. Tuskan, G.A. et al. The Genome of Black Cottonwood, Populus trichocarpa (Torr. & Gray). Science 313, 1596-1604(2006).
315. Tuzun, E. et al. Fine-scale structural variation of the human genome. Nat Genet 37, 727-32(2005).
316. Ungerer, M.C., Johnson, L.C. & Herman, M.A. Ecological genomics: understanding gene and genome function in the natural environment. Heredity 100, 178-83(2008).
317. Vandepoele, K. et al. Major events in the genome evolution of vertebrates: paranome age and size differ considerably between ray-finned fishes and land vertebrates. Proc Natl Acad Sci USA 101, 1638-43(2004).
318. Vavouri, T. et al. Parallel evolution of conserved non-coding elements that target a common set of developmental regulatory genes from worms to humans. Genome Biol 8, R15(2007).
319. Vinson, J.P. et al. Assembly of polymorphic genomes: algorithms and application to Ciona savignyi. Genome Res 15, 1127-35(2005).
320. Voight, B.F. et al. A map of recent positive selection in the human genome. PLoSBiol 4, e72(2006).
321. Wagner, A. Neutralism and selectionism: a network-based reconciliation. Nat Rev Genet 9, 965-74(2008).
322. Wakeley, J. The excess of transitions among nucleotide substitutions: new methods of estimating transition bias underscore its significance. Trends in Ecology & Evolution 11, 158-162(1996).
323. Wang, E.T. et al. Global landscape of recent inferred Darwinian selection for Homo sapiens. Proc Natl Acad Sci USA 103, 135-40(2006).
324. Wang, J. et al. The diploid genome sequence of an Asian individual. Nature 456, 60-5(2008).
325. Ward, R. & Durrett, R. Subfunctionalization: How often does it occur? How long does it take? Theor Popul Biol 66, 93-100(2004).
326. Wayne, R.K. & Ostrander, E.A. Lessons learned from the dog genome. Trends Genet 23, 557-67(2007).
327. Weider, L.J. et al. Long-term genetic shifts in a microcrustacean egg bank associated with anthropogenic changes in the Lake Constance ecosystem. Proc Biol Sci. 264, 1613-1618(1997).
328. Wheeler, D.A. et al. The complete genome of an individual by massively
119

parallel DNA sequencing. Nature 452, 872-6(2008)'. 329. Wicks, S.R. et al. Rapid gene mapping in Caenorhabditis elegans using a
high density polymorphism map. Nat Genet 28, 160-4(2001). 330. Wildman, D.E. et al. Implications of natural selection in shaping 99.4%
nonsynonymous DNA identity between humans and chimpanzees: enlarging genus Homo. P roc Natl Acad Sci USA 100, 7181-8(2003).
331. Wilhelm, L. et al. Natural variation in SARI 1 marine bacterioplankton genomes inferred from metagenomic data. Biology Direct 2, 27(2007).
332. Williamson, S.H. et al. Localizing recent adaptive evolution in the human genome. PLoS Genet 3, e90(2007).
333. Wilson, A.C. & Sarich, V.M. A molecular timescale for human evolution. Proceedings of the National Academy of Sciences of the United States of America 63, 1088-1093(1969).
334. Wilson, A.C, Ochman, H. & Prager, E.M. Molecular time scale for evolution. Trends in Genetics 3, 241-247
335. Winckler, W. et al. Comparison of fine-scale recombination rates in humans and chimpanzees. Science 308, 107-11(2005).
336. Wolfe, K.H., Sharp, P.M. & Li, W.H. Mutation rates differ among regions of the mammalian genome. Nature 337, 283-5(1989).
337. Wright, S. Evolution in Mendelian populations. 1931. Bull Math Biol 52, 241-95; discussion 201-7(1990).
338. Wright, S.I. & Gaut, B.S. Molecular population genetics and the search for adaptive evolution in plants. Mol Biol Evol 22, 506-19(2005).
339. Xu, S. et al. Gene conversion in the rice genome. BMC Genomics 9, 93(2008).
340. Yang, Z. PAML 4: Phylogenetic Analysis by Maximum Likelihood. Mol BiolEvol24, 1586-1591(2007).
341. Yang & Bielawski Statistical methods for detecting molecular adaptation. Trends Ecol Evol 15, 496-503(2000).
342. Yang, Z. & Nielsen, R. Estimating synonymous and nonsynonymous substitution rates under realistic evolutionary models. Mol Biol Evol 17, 32-43(2000).
343. Yang, M.Y. et al. Biased incorporation of ribonucleotides on the mitochondrial L-strand accounts for apparent strand-asymmetric DNA replication. Cell 111, 495-505(2002).
344. Yasukochi, Y. A Dense Genetic Map of the Silkworm, Bombyx mori, Covering All Chromosomes Based on 1018 Molecular Markers. Genetics 150, 1513-1525(1998).
345. Yi, S.V. Non-adaptive evolution of genome complexity. Bioessays 28, 979-82(2006).
346. Young, J.M. et al. Extensive copy-number variation of the human olfactory receptor gene family. Am J Hum Genet 83, 228-42(2008).
347. Zhang, J. The drifting human genome. Proc Natl Acad Sci USA 104, 20147-8(2007).
120

348. Zhang, Z. & Kishino, H. Genomic background predicts the fate of duplicated genes: evidence from the yeast genome. Genetics 166, 1995-9(2004).
349. Zhang, P., Min, W. & Li, W. Different age distribution patterns of human, nematode, and Arabidopsis duplicate genes. Gene 342, 263-8(2004).
350. Zhang, L. et al. Patterns of segmental duplication in the human genome. Mol Biol Evol 22, 135-41(2005).
351. Zhang, Z. et al. KaKs_Calculator: Calculating Ka and Ks Through Model Selection and Model Averaging. Genomics, Proteomics & Bioinformatics 4, 259-263(2006).
352. Zhang, Z. et al. PseudoPipe: an automated pseudogene identification pipeline. Bioinformatics 22, 1437-9(2006).
353. Zhang, C. et al. A whole genome long-range haplotype (WGLRH) test for detecting imprints of positive selection in human populations. Bioinformatics 22, 2122-8(2006).
354. Zhao, H. et al. The study of neighboring nucleotide composition and transition/transversion bias. Science in China Series C: Life Sciences 49, 395-402(2006).
355. Zuckerkandl, E. & Pauling, L. Evolutionary divergence and convergence in proteins. Evolving Genes and Proteins 97-166(1965).
121
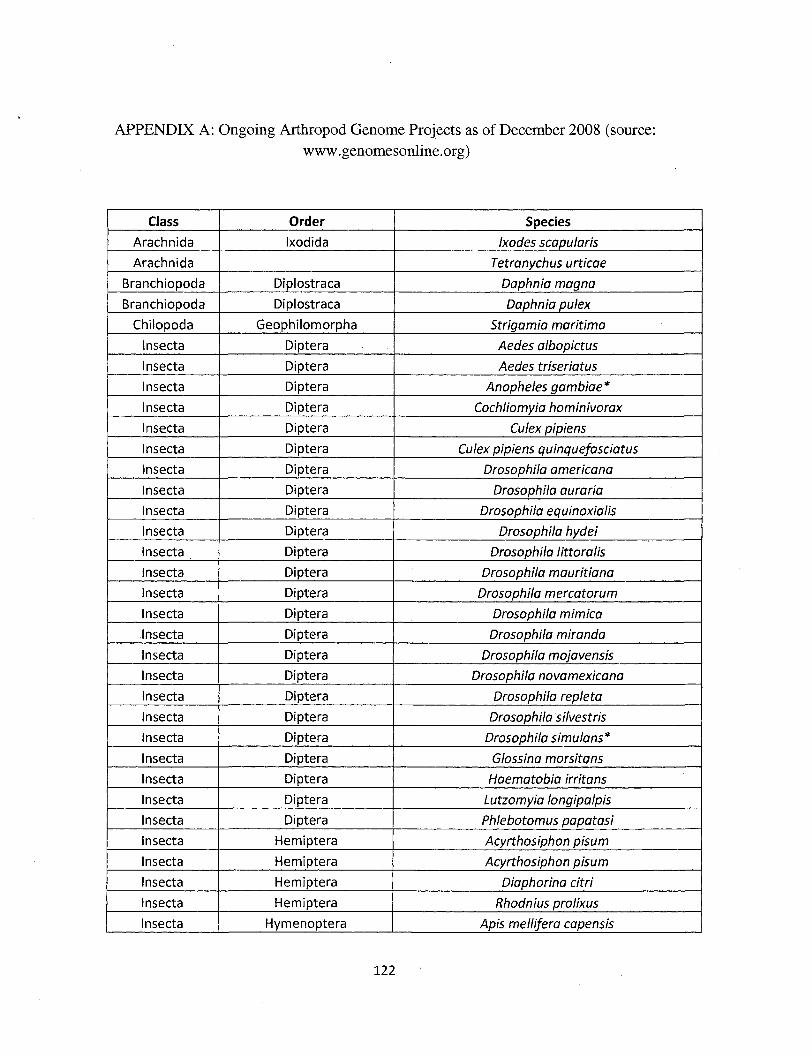
APPENDIX A: Ongoing Arthropod Genome Projects as of December 2008 (source: www. genomesonline. org)
Class
Arachnida
Arachnida
Branchiopoda
Branchiopoda
Chilopoda
Insecta
Insecta
Insecta
Insecta
Insecta
Insecta
Insecta
Insecta
Insecta
Insecta
Insecta
Insecta
Insecta
Insecta
Insecta
Insecta
Insecta
Insecta
Insecta
Insecta
Insecta
Insecta
Insecta
Insecta
Insecta
Insecta
Insecta
Insecta
Insecta
Order
Ixodida
Diplostraca
Diplostraca
Geophilomorpha
Diptera
Diptera
Diptera
Diptera
Diptera
Diptera
Diptera
Diptera
Diptera
Diptera
Diptera
Diptera
Diptera
Diptera
Diptera
Diptera
Diptera
Diptera
Diptera
Diptera
Diptera
Diptera
Diptera
Diptera
Hemiptera
Hemiptera
Hemiptera
Hemiptera
Hymenoptera
Species
Ixodes scapularis
Tetranychus urticae
Daphnia magna
Daphnia pulex
Strigamia maritima
Aedes albopictus
Aedes triseriatus
Anopheles gambiae*
Cochliomyia hominivorax
Culex pipiens
Culex pipiens quinquefasciatus
Drosophila americana
Drosophila auraria
Drosophila equinoxialis
Drosophila hydei
Drosophila littoralis
Drosophila mauritiana
Drosophila mercatorum
Drosophila mimica
Drosophila miranda
Drosophila mojavensis
Drosophila novamexicana
Drosophila repleta
Drosophila silvestris
Drosophila simulans*
Glossina morsitans
Haematobia irritans
Lutzomyia longipalpis
Phlebotomus papatasi
Acyrthosiphon pisum
Acyrthosiphon pisum
Diaphorina citri
Rhodnius prolixus
Apis mellifera capensis
122

Insecta
Insecta
Insecta
Insecta
Insecta
Insecta
Insecta
Insecta
Insecta
Malacostraca
Merostomata
Hymenoptera
Hymenoptera
Hymenoptera
Hymenoptera
Lepidoptera
Lepidoptera
Lepidoptera
Lepidoptera
Phthiraptera
Amphipoda
Xiphosura
Apis mellifera scutellata
Nasonia giraulti
Nasonia longicornis
Nasonia vitripennis
Bicyclus anynana
Heiicoverpa armigera
Heliothis virescens
Spodoptera frugiperda
Pediculus humanus corporis
Jassa slatteryi
Limulus polyphemus
123

APPENDIX B: Fully sequenced eukaryotic genomes (as of December 2008)
Phylum
Apicomplexa
Apicomplexa
Apicomplexa
Apicomplexa
Apicomplexa
Apicomplexa
Apicomplexa
Arthropoda
Arthropoda
Arthropoda
Arthropoda
Arthropoda
Arthropoda
Arthropoda
Arthropoda
Arthropoda
Arthropoda
Arthropoda
Arthropoda
Arthropoda
Arthropoda
Arthropoda
Arthropoda
Ascomycota
Ascomycota
Ascomycota
Ascomycota
Ascomycota
Ascomycota
Ascomycota
Ascomycota
Ascomycota
Ascomycota
Ascomycota
Ascomycota
Species
Babesia bovis
Theileria annulata
Theileria parva
Cryptosporidium hominis
Cryptosporidium parvum
Plasmodium yoelii yoelii
Plasmodium falciparum
Drosophila pseudoobscura
Bombyx mori
Aedes aegypti
Apis mellifera
Bombyx mori
Anopheles gambiae
Drosophila melanogaster
Drosophila ananassae
Drosophila erecta
Drosophila grimshawi
Drosophila persimilis
Drosophila sechellia
Drosophila virilis
Drosophila willistoni
Drosophila yakuba
Tribolium castaneum
Candida albicans
Kluyveromyces waltii Fusarium (Gibberella) graminearum
(zeae)
Vanderwaltozyma polyspora
Magnaporthe grisea
Pichia stipitis
Aspergillus niger
Aspergillus (Emericella) nidulans
Aspergillus oryzae
Aspergillus fumigatus
Candida glabrata
Debaryomyces hansenii var. hansenii
Sequencing
Sanger
Sanger
Sanger
Sanger
Sanger
Sanger
Sanger
Sanger
Sanger
Sanger
Sanger
Sanger
Sanger
Sanger
Sanger
Sanger
Sanger
Sanger
Sanger
Sanger
Sanger
Sanger
Sanger
Sanger
Sanger
Sanger
Sanger
Sanger
Sanger
Sanger
Sanger
Sanger
Coverage
l l x
lOx
5x
9.1x
5.9x
8x
7-8x
3x
lOx
8.9x
10.6x
7.9x
4.1x
4.9x
8x
8.4x
9.1x
7.3x
10.9x
8x
lOx
7.8x
7x
7.5x
13x
9x
10.5x
8x
9.7x
124

Ascomycota
Ascomycota
Ascomycota
Ascomycota
Ascomycota
Ascomycota
Ascomycota
Ascomycota
Bacillariophyta
Baciilariophyta
Basidiomycota
Basidiomycota
Basidiomycota
Basidiomycota
Basidiomycota
Chlorophyta
Chlorophyta
Chlorophyta
Chordata
Chordata
Chordata
Chordata
Chordata
Chordata
Chordata
Chordata
Chordata
Chordata
Chordata
Chordata
Chordata
Chordata
Chordata
Chordata
Chordata
Cnidaria
Microsporidia
Nematoda
Nematoda
Nematoda
Nematoda
Kluyveromyces lactis
Yarrowia lipolytica
Ashbya (Eremothecium) gossypii
Neurospora crassa
Schizosaccharomyces pombe
Saccharomyces cerevisiae
Podospora anserina
Trichoderma (Hypocrea) virens
Thalassiosira pseudonana
Phaeodactylum tricornutum
Ustilago maydis
Cryptococcus neoformans
Phanerochaete chrysosporium
Laccaria bicolor
Malassezia globosa
Chlamydomonas reinhardtii
Ostreococcus lucimarinus
Ostreococcus tauri
Homo sapiens
Homo sapiens
Homo sapiens
Pan troglodytes
Monodelphis domestica
Macaca mulatto
Gallus gallus
Canis lupus familiaris
Danio rerio
Tetraodon nigroviridis
Rattus norvegicus
Ciona intestinalis
Mus musculus
Takifugu rubripes
Homo sapiens
Ornithorhynchus anatinus
Homo sapiens
Nematostella vectensis
Encephalitozoon cuniculi
Brugia malayi
Caenorhabditis briggsae
Caenorhabditis elegans
Meloidogyne hapla
Sanger
Sanger
Sanger
Sanger
Sanger
Sanger
Sanger
Sanger
Sanger
Sanger
Sanger
Sanger
Sanger
Sanger
Sanger
Sanger
lllumina
lllumina
Sanger
Sanger
Sanger
Sanger
Sanger
Sanger
Sanger
Sanger
Sanger
Sanger
Sanger
454
Sanger
Sanger
Sanger
Sanger
Sanger
Sanger
11.4x
lOx
4.2x
lOx
8x
lOx
14x
9.6x
lOx
12.5x
10.5x
9.9x
7x
lOx
34x
7.5x
3.6x
6x
6.6x
7.6x
6X
8.2x
5x
6x
7.8x
lOx
10.4x
125

Placozoa
Streptophyta
Streptophyta
Streptophyta
Streptophyta
Streptophyta
Streptophyta
Streptophyta
Streptophyta
Trichoplax adhaerens.
Vitis vinifera
Populus balsamifera trichocarpa
Oryza sativa ssp. japonica
Oryza sativa L ssp. indica
Oryza sativa ssp. japonica
Arabidopsis thaliana
Physcomitrella. patens patens
Vitis vinifera L
Hemiselmis andersenii
Giardia lamblia (intestinalis)
Phytophthora sojae
Phytophthora ramorum
Paramecium tetraureiia
Leishmania infantum
Tetrahymena thermophila
Leishmania major
Trypanosoma cruzi
Trypanosoma brucei
Dictyostelium discoideum
Entamoeba histolytica
Cyanidioschyzon merolae
Guillardia theta
Monosiga brevicollis
Sanger
Sanger
Sanger
Sanger
Sanger
454, Sanger
Sanger
Sanger
Sanger
Sanger
Sanger
Sanger
Sanger
Sanger
Sanger
8x
8.4x
7.5x
lOx
6x
l l x
7x
13x
5x
12.5x
8.1x
126

APPENDIX C: Selected list of scripts
AMOScmpScript: A shell script that we wrote in order to change the parameters in AMOScmp from command line options instead of going into AMOS scripts to change the parameters. The output produced is congruent to the AMOScmp output. This script uses a Perl script called changeAMOScmp which actually does the revision to the AMOScmp script.
avgCoverage: Determines the number of sites that have a certain coverage. The script looks at every site in the output of deltaOut and determines how many nucleotide reads are at that site. If the number of nucleotides is less that the input number the list keeping track of that number of nucleotides is incremented.
coverageFilter: Determines the SNPs in the data. The coverageMin number is the minimum number of nucleotide reads that you require at a certain location while the coverageMax is the maximum number that you allow. It will also take into consideration a SNP has to have at least two nucleotides of each change in base and only two at a particular location.
kindOfSNP : Determines is the SNP is a transition, transversion, or indel. Then the amount of each is output.
reduceAlignment: A shell script reduces the Alignment in the delta file to an assembly delta file. The process was accomplished by a series of Perl scripts we combined to call reduceAlignment. First, we pulled a list of the contig read ids from the "contig file". Then we retrieved the sequence id number from the fasta file. We could then obtain a list of the sequence numbers that were in the contig file. The sequence numbers includes the entire header of the fasta file. We only want the internal ids from that file, so we pulled those from the file. Our next step was to copy the sequences from the delta file that have the same internal ids as we found from the contig file. This allowed us to focus only on the data that was used in the assembly.
runTurboShilya Runs the programs and scripts involved in producing the site by site analysis of the scaffold. Requires SeqAlignGenerator, align-summary, getRefPosnBase, and combineRefDelta
SNPcluster. The SNPcluster script determines how many SNPs are next to each other. The script will output the number of SNPs that are in pairs, three of a kind and so on. These are broken into base substitutions and indels as well.
SNPvariationWindow: Given the particular window size specified in the input, it will divide the scaffold into sections of that window size and determine how many SNPs are in each section.
127

APPENDIX D: Scaffold statistics from TCO comparative assembly
Scaffold
1
2
3
4
5
6
7
8
9
10
11
12
13
14
15
16
17
18
19
20
21
22
23
24
25
26
27
28
29
30
31
32
33
34
scaffold size
4193030
3740169
3777634
3075709
2511979
2406117
2324446
2335496
2251199
2169786
2187803
2218424
1912767
1680605
1740524
1679881
1546548
1446981
1465945
1424641
1469790
1403856
1354378
1335609
128S025
1248150
1252696
1197646
1263923
1199123
1161896
1144766
1099917
1101474
Analyzed
Sites
3686992
3304942
3272538
2594574
2143091
2011168
1982890
2027666
1878670
1903562
1906664
1688893
1541253
1437347
1419358
1230636
1353977
1271770
1265241
1208836
1114730
1113202
1103788
1143516
1078929
984029
977220
1055397
962985
843259
826921
957687
825750
880715
Overl6
120481
109786
104178
106714
77416
100416
69169
59329
73292
63411
59557
111437
69229
64743
65650
54023
46705
55128
35872
37282
47965
38181
41831
43944
47791
49651
36230
40688
42814
16945
80761
39349
42094
61750
Under4
166558
180232
160113
142788
126828
108857
118615
87794
113438
97277
99768
118871
102128
91095
78484
112613
76937
80005
71014
61755
101328
81149
76977
61061
66620
72203
96317
44473
67350
153502
54947
56273
93903
63876
Ns
134351
67038
166658
164678
107558
139657
100981
116993
138752
61190
71371
260747
153469
52857
138583
243591
40002
19691
70669
88173
167706
131383
99036
64346
70202
107553
107814
36468
157881
132450
157227
65501
104234
74795
single
base
subs
3232
3476
3630
2398
2074
2228
1870
1810
2482
1763
1644
1122
1682
924
1261
1003
1141
1610
1310
892
1312
505
1151
1054
1499
946
818
744
751
2028
311
1068
925
280
segmental
base subs
271
284
275
238
163
204
177
150
205
184
116
62
143
89
76
77
128
146
104
73
118
88
98
118
156
74
67 •
49
73
175
24
70
95
24
single
indels
966
1003
1064
707
627
591
527
578
629
487
481
360
442
307
329
337
419
376
398
253
311
190
302
278
364
191
189
236
233
515
110
300
220
169
segmental
indels
1981
2370
2330
1332
1415
936
1172
1118
1547
802
1045
414
875
220
694
609
638
764
855
620
612
34
686
627
849
261
179
428
406
1503
92
804
443
18
# genes
622
681
714
623
386
643
363
408
397
521
402
444.
425
370
319
306
425
439
201
279
278
242
230
248
283
207
179
217
243
197
172
153
195
196
128

35
36
37
38
39
40
41
42
43
44
45
46
47
48
49
50
51
52
53
54
55
56
57
58
59
60
61
62
63
64
65
66
67
68
69
70
71
72
73
74
75
1097241
1192092
1048454
1091505
1058928
1086000
1051352
1066612
1050224
1043815
945371
1027350
944016
945889
913200
887758
914909
860121
870110
841328
869239
847024
797877
747206
761483
757983
749149
748003
734086
750253
729016
8093S3
727487
677430
678846
733211
677205
652215
586677
640712
626918
904048
857438
842200
899433
917167
753848
825328
938275
929886
756163
672128
773699
822221
743661
716210
703997
728310
714797
753715
616648
635821
697989
621483
537429
530254
623917
687439
657645
579675
548938
518273
608088
547407
376119
461089
548958
381899
562459
428353
570197
509653
20751
63516
39440
25936
29606
44463
26189
37412
27149
57771
24793
43406
24564
26764
53319
30760
18789
33215
32227
29306
32097
21518
36256
34110
48364
55069
21679
18308
28470
23232
50143
35390
29108
45891
44619
18134
25607
20522
34165
15839
37145
62577
71774
84452
61462
53952
100715
94974
41472
44955
99379
88507
55576
40312
89931
65895
67122
54487
47735
35657
86886
77279
62387
49092
56910
101888
39563
27339
40950
48399
76492
64260
35104
40537
57516
48311
49488
117355
36454
38011
29163
31955
87649
175037
49731
84018
38045
152112
76672
31504
31346
84363
121190
129910
36280
58795
55337
63167
95042
47823
35046
83259
99693
43160
72667
92850
61701
25004
2302
20060
58057
71440
66042
120475
85179
164151
111613
100863
117650
21666
68479
12690
35512
338
937
1224
312
1139
990
1642
910
1361
1740
657
804
731
1400
892
322
740
304
648
670
915
372
283
827
1168
675
714
777
923
1442
706
328
509
540
363
612
570
687
265
631
390
28
125
116
14
107
84
90
71
130
94
48
72
38
112
36
38
67
16
57
44
80
31
14
70
77
50
63
71
75
105
59
19
47
42
24
83
48
76
20
47
22
166
236
227
148
276
188
262
238
349
271
155
259
236
191
221
131
225
118
185
129
146
121
107
160
192
212
252
215
210
200
122
125
155
93
99
143
72
128
89
154
130
60
421
357
81
489
409
655
546
1027
630
223
557
441
387
428
82
502
145
368
103
250
118
40
328
451
409
460
668
545
373
328
95
217
170
79
155
174
214
8
370
318
165
'325
156
159
167
196
177
155
155
196
169
168
156
164
130
135
156
157
131
161
109
103
129
122
93
142
180
125
127
120
137
136
174
86
95
191
90
174
88
61
121
129

76
77
78
79
80
81
82
83
84
85
86
87
88
89
90
91
92
93
94
95
96
97
98
99
100
624867
611871
576004
589484
560210
679555
564057
642089
554210
551187
533890
522205
518914
666227
518052
522894
500392
480070
501917
476616
444560
482554
511364
475394
471848
542033
514226
445137
492148
479410
455608
444288
476155
410834
362597
415471
451500
456354
460195
446539
396583
410032
317305
383115
371763
274339
417908
311261
390091
423196
12687
22083
55889
25561
29002
19756
11316
15559
10337
16661
25880
22756
14617
15148
19883
20906
28643
11682
25938
13757
42732
12289
6661
26075
10702
40838
35473
32688
28498
29518
34696
31963
22553
41817
40014
34452
26366
24186
23055
26369
31637
37212
71643
22383
36904
31202
19543
68609
43508
23554
15020
23111
34662
30026
13718
157638
64677
119919
74171
103385
44407
10560
8073
157689
21533
60031
17319
56662
56671
35136
74959
23920
108706
6026
8392
658
511
323
171
331
203
185
431
451
128
639
719
478
256
440
535
215
411
122
212
169
446
650
360
433
61
32
45
6
24
14
4
39
16
10
54
43
46
12
36
50
12
38
2
9
21
30
49
33
40
171
144
90
80
111
82
69
126
105
49
140
169
130
100
148
102
63
93
58
63
54
112
114
112
125
401
324
136
45
127
39
22
276
314
31
311
428
304
85
458
169
30
120
12
43
31
228
• 238
228
228
86
108
105
134
92
91
64
105
47
84
128
139
96
71
96
104
75
68
95
80
95
95
90
91
102
130

o OJ
o_ Q . I I N J
o OJ
i n O OJ
l - > h - * l - 1 l - ' O J O 0 N J I - >
in n OJ
in n QJ
(A n DJ
2 . 2 . 9 - 2 . 2 . 2 . 2 . 2 . 0 0 - 0 - 0 - 0 - 0 - 0 . 0 . 0 - ^
I I I I I I I N J N J N J h-»
2 . a .
o_ O .
i/i i n r> n QJ ID
I I I 1 ID ID ID
i n w o o CD QJ
O O
0 - 0 . 0 . 0 . I I I
oo oo oo u i
a. a . a . I I I w w w
in o QJ
a.
i n i n
I a. I
i n i n i n r> o n Qj QJ QJ
3: 3; 4; o_ 2. 2. Q . O - Q .
(/i i n in o n n DJ DJ a>
0 . 0 - 0 -
i n i n i n n o o QJ QJ QJ
3 3 3 2. 2. 2. a . a . o .
I I I I ! I
i n i n i n o r> n 0J DJ Q)
=fi 31 =ft 2 . 2 . 2 . a . a . a .
O J 0 0 0 0 O 0 O J O J N J N J N J N J I - » l - » h - » l - » l - ' l - > l - 1 £
10514;
o
1248646
oo (JO in en ID 00
1051139
Ui ID no •t* J> NJ
835104
Ul ID oo J> J> NJ
813165
0 0 l-> M w o si OJ si gj OJ J > P ° w w ^ N J s i £ N J s i -P"
OJ OJ O I D OJ N J s i OJ J > <Xi 0 0 I D W N J s j 0 0 N J M
OJ J> OJ SI oo CD
S| NJ en SI
NJ O OJ cn J> J>
OJ •t» OJ cn
l-» OJ CTl I D s i O J >
0 0 CO
(-> 0 0 I D 0 0
N J I - * •&> O J NJ
s l - > o
cn oo I D NJ U l OJ
l-» J > NJ s i M W
I D J > N J M S i H> oo i-» cn M Cn cn
NJ H> N J I D cn NJ ID s i ID OJ cn NJ s i 00
NJ
cn J > J >
M J> M O ID OJ s i
N J cn u i
ID oo
o I D J> 0 0 o
O J NJ O J >
00 J> o J > s i
OJ OJ NJ O M I - 1
N J U I cn H-» ID IO s i NJ
N J OJ l-»
oo N J s i O
N J J > 0 0 OJ 0 0 OJ
t o
NJ l-i NJ ID SI NJ cn OJ O J I D s i CD cn o
NJ NJ OJ NJ h-> s i 0 0 c n
131
i-> ID sj NJ M cn
NJ i-> On on J> i->
NJ OJ cn cn cn NJ
NJ (-> J> si NJ OJ
64311
NJ Ul 00 ID J> UI
cn UI cn sj J> si
OJ oo t-> ID OJ OJ
M J> o o J> J>
SI si 00 Ul I-* OJ
NJ oo cn ID cn cn
NJ OJ OJ J> si J>
00 OJ NJ o ID NJ
Ul I-1
cn NJ i-» NJ
1196293
oo i-1 NJ ID
00 OJ cn o
i-» ID si H> NJ O
Ui OJ l-» l-> J> Ul
H> cn Ul Ul cn VD
H-> H> h-» * . N J . - . h->
oo cn oo .** s i H I D
! - > L n N j V J b o 0 0 l - ' s i
oo uo o cn
J > NJ oo NJ
O J M S I
I D
to cn cn i-» s i Ln
J > N J
m NJ
s i b
O J 0 J O 0 0 0 l D l D U l J > J > l D l O l O J > J > J > NJ NJ
O 00 00
H1
ID NJ OJ 00 00 si
NJ NJ si Ul ID Ul 00
J> P"1
^ 00
OJ m NJ l-1 NJ H»
Ul 00 ID cn si Ul
cn J> J> VD J> oo
si ^ ^
OO °° °° S on oo o ^ *> g cn OJ S oo si ° oo o h-> NJ NJ OJ ID ID 00 00 00 oo OJ OJ ID ID ID sj ID ID 00 OJ OJ
OJ J> NJ ID OJ Cn Ul NJ Ul OJ
J> en Ul i-»
i-> 00 NJ OJ J> o U l <J3 O cn
OJ Ul 00 NJ cn JS Ul
J> o NJ o cn o l->
OJ 00 NJ Ul NJ si
Ul Ul oo ui o o si
o ID OJ OJ
cn ID oo
J> OJ oo O Ul NJ NJ OJ Ul O NJ si cn ui si O I-1 Ul H in w
NJ NJ J> M Ul 00 ID J>
cn h-» J> H> NJ 00 NJ NJ si J> Ul Ul Ul ID
si 00
oo oo
NJ H* 00 OJ oo Ul J>
Ul oo cn Ul NJ si
SI 00 l-» ID 00 f-»
J> oo SI ID Ul cn
Ul o LD cn cn oo
NJ s| J> Ul o 00
Ul o NJ o Ul Ul
NJ VD Ul oo OJ cn
NJ si Ul o si Ul
NJ l£> h-1 J> cn SI
O-l-> NJ NJ
NJ
p
p i-1 o si
o o 00
OJ
h-1
oo
p
OJ NJ
Q. }->• si si
OJ ID
H1
cn In
p
NJ NJ
Q. O 00 NJ
OJ ID
I-'
po NJ
O
NJ l->
Q. l-» J> ID
O OJ
JS si
O
SI NJ
O
H1
si NO
NJ SI 00
O I-1 cn si
o_ O 00 si
O Ul
p bo
o b si
Q. l-» l-» cn
si OJ
ID
i-1
p i-1
JS
cn
Q . i-» OJ ID
J> 00
OJ
o SI
p
J> NJ
a. o JA 00
NJ 00
OJ
cn 00
p t-1 o 00
Q.
l-> 00
l-> 00
bo
J> oo i-1
o b cn o
Q.
J> Ul
Ul OJ
NJ NJ sj
O i-> l-» CD
Ul Ul
OJ OJ
ID
O
l-»
cn
o_ i-» o Ul
p OJ
p cn
o b 00
Q. l-> O cn
J> OJ
lo
OJ
cn sj
o b oo 00
i-> oo NO
o Ul
cn
Ul
o b cn cn
Q . i-» oo J>
Ul
io
si o Ul SI
p
o J>
o Ul 00
ID
J> Ul si
O
oo Ul
l-» o OJ
i-1
si
NJ NJ b
o i-1 NJ cn
l-» SI J>
NJ cn cn
p
OJ
o
Q . i-i cn OJ
SI
O
bo
o i-> si OJ
TOO
P
Ul Ul
I-1 Ul cn
p
00 J>
Q.
OJ O
Ul
in
i-1
Ul
cn
O
OJ J>
T60
P NJ
in
NJ OJ OJ
o b VD SI
Q. O O si
NJ
cn NJ
J> p cn
p
o J>
801P
NJ 00 Ul
NJ O 00
o b si cn
i-» OJ cn
NJ 00 Ul
NJ
o
o b si cn
Q-o SI Ul
p OJ
si
cn
p
o OJ
Q. I-" J> SI
NJ O
NJ Ul si
O
J> OJ
Q. O J> si
cn
OJ
p b oo i->
cn ID ID
ID si
bo
h-» O J NJ OJ N J OJ N J J > O J O 0 0 s i
t n N J s j 0 0 J > H-»
O O O O O O
b b i-* f-» b b oo I D o o s i u i o u i o J> cn oo
NJ
cn cn
i-»
J> o bo
i-»
Ul
cn
i->
H1
Ul
cn
H>
NJ 00 00
l-»
o cn
i->
NJ O 00
OJ
NJ O j>
00
H1
si cn
OJ
NJ Ul si
OJ
l-» 00 i->
NJ
NJ
cn
NJ
oo *> NJ
NJ
NJ OJ si
NJ
OJ O CO
NJ
NJ 00 j>
NJ
OJ si i-i
NJ
€ CX
9
Q - C L Q . Q . Q . C L O I-1 O O !-> l-» 1= M oo cn si NJ cn l o U l O J I D I D J > N J
o bo
>
I O CD S f t r-+ o *
cr •<:
CO
n '
3*
S2

00 NJ
in
o OJ =fc o Q.
i 1 ID H>
00 ID l-» V ) CD O
4* O l->
oo (JO CD
in O CU - h -Hi
o a. •
i oo ID
00 H> I-1 M NJ O
On
*. NJ 00 On vl
in
n CD —h -+i
o a. • i
CD 00
J> On O NJ ID H>
J> 00 O vl <D O
In
n a> —h —fl
o Q.
i 1 CD NJ
51836
i-> NJ J> CD J> ID
in O OJ -+> —h o a.
•
i On 00
On I-4 OH On l-> J>
CD 00 on CD CD ID
in O cu —h —h O CL
i 1 On 00
NJ CO ID 00 00 CD
On H* On UJ
oo o
in O DJ -*i —h O CL
i
I
on OO
i-1
ID 00 J> 00 CD
NJ CO ID O O O
in r> cu -+» —* o a.
g
'*. ID
On CO O 00 on O
CD I-* I-* ID v] O
in
r> cu —h —h o 1
'*. ID
90586
on 00 O NJ Vl
(-»
in
n cu —h —H o a. i
CD
J> on CD vl <£> 00
J> 00
oo vi ID 00
in
n a> - h —h o CL 1
'* 00
M
on J> 00
on uo
oo vl ID ID vl J>
in
n cu - h -+» o CL
i
1
4* oo
K-> NJ O NJ O vj
NJ On 4*
(-> CD 4*
in O CU —h —h o CL 1
'* NJ
H> 00 NJ CD O ID
CD vl 4=» l-» C7* J>
in
r> cu — h —h O a.
i i
4* NJ
H-* l-» M On OD CD
l-i 00 NJ OO I-1
on
in O
a> - h -+> o Q. I 1
oo ID
On 00 ID NJ 00 CD
1016558
in O CU —h -+» o 1 1
oo ID
J> NJ 00 NJ
on on
on 00 ID i-» vl
o
in
o cu - h —*1
o a. i 00 ID
00 -•J ID 4* on oo
J> NJ Vl OD vl l-»
in
o cu - h -+l
o Q. 1 1 00 ID
NJ 00 4* ID J>
oo
00 vl ID
oo NJ vl
in
r> CU —h —h o CL 1 1 00 ID
on 4* vl
o
NJ 00 j >
vl
on on
in
r> cu -tl —h O a. i 00 NJ
00 VI vl h-» ID OO
J> vl l-> M O o
in n cu —h - * • »
o CL 1 00 NJ
NJ ID On NJ 00 00
oo vj CD 00 00 00
in
n a> —p o Q.
i 1 00 NJ
NJ
on 00 CD 00 VI
NJ ID
on M 00
(-»
in n cu —h —h o CL 1 1
oo NJ
NJ J>
-P> CD ID VI
NJ
on 00 •1^
oo <D
in o cu -+! —h o Q.
• 1 00
o
VI
*» H> VI
co o
oo 00
oo vl V| ID
in
n cu -+^ —h O CL
I 1 NJ ID
NJ NJ on NJ 00 vl
J> NJ 4* vl vl O
in O CU •jj —h O a. 'NJ J>
I-' J> NJ 00
on M
NJ v| NJ h-1
on O
l-» o o vl CD
NJ 00
00 vl
00 o J>
vl NJ 00
ID l-»
NJ • V I N J ^ ^ P O ^ N J O O O on H> ID s^n
On t-» on o CD NJ J> O
OD CD oo On
CD ID ID On
on J>
on 00 h-» CD ID on NJ on on H-* vl on
J> H> NJ CD vl O NJ ID vl M NJ U1
J> ID 00 J> on oo H» Vl 00 ID
NJ vl OO NJ 00 on
ID 00 oo i-i ID CD O O vj O
H> l-» H» J> ID NJ
, i-i. KD ID ID ID J> vl NJ OO 00 ID
ID 00 ID
00 vl
on 00
bo
H> M NJ ID OD ID NJ O
00 On ID t. O O 00
H> On On vl M *
oo
J> J> NJ NJ J> 00 00 M on b i-1 b
l-> o CD
4=" NJ vl 00 00 NJ 00 CD ID NJ On o On 00
H oo p b p ai b " CD ^ U1
NJ J> J> Ol NJ M
bo b-i J>
vi on NJ oo H> O o ^ | j > j > h - > l - » o n o n o n o n o n C D C D C D C D N J O H>
a a a a a a a a a a a a a a a a a a a a a a a a a a H ' ^ O O O l - » l - ' O O l - i l - » l - i O I - > O O O O O I - i l - > O O O I - ' f - » l D C D v l 0 n k D I - ' 0 0 O 0 0 O 0 0 v | i D v l 0 0 N J J > 0 0 l D 0 0 J > 0 0 l - > O 0 0 v l ( - i J > J > 4 ^ C D J > l - » 0 n J > v | O N J 0 0 O t - 1 J > N J O 0 0 0 n N J 0 n J > J > C D 0 0
^ CD
45. 00
00
4s.
00
NJ
I-1 NJ
00
O J>
t"1
NJ on J>
OO
l-i 1—»
ID
NJ
K->
t-1
in vl
4 * 0 O 0 O 0 0 N J 0 O 0 O [ - i 0 0 0 0 0 n ( » U l W J > ' j > M p f o M U l U 1
on 00
l-» on on h-» NJ ID vl NJ J> ID ID NJ O oo on io j> b b oo 00
J> 4> S) M K i> W W NJ g on b h-» b ;. .
J > N J v l 0 O 0 O N J 0 0 v l C D V D N J 0 n O 0 n 0 0 J > t - » b o l - » b h - » a i b v i
r j NJ *> *> )» CD NJ NJ [jy bo CD *>
p p p o o o o o p o o p p p p p p p o p p o o p p p b b N j b b b b M b l j l ^ b b N J f - > b b b f - i b i - i i - > b o n b i - ' < D N J 0 O C D 4 i v l 0 O 0 O C O O O O n v l v l O O O O 4 5 > - I ^ C D 0 n 0 J N J N J | - - l C D 0 0 4 ^ 0 n v l J > C D C D 0 D C D 0 n i - > H » v l O V D N J O 0 0 C D O 0 0 N J O l D l - > 0 D N J 0 0

APPENDIX F: Windows analysis: Regions with no SNPs.
scaffold
66
17
18
34
39
4
10
16
81
1
2
3
7
8
11
14
51
63
94
1
10
10
26
29
45
70
1
5
8
9
9
9
14
21
27
start
732001
184001
648001
1005001
544001
1281001
1349001
1307001
322001
4144001
3534001
3578001
656001
134001
1527001
1492001
79001
68001
380001
2271001
296001
400001
261001
8001
261001
19001
1860001
710001
481001
226001
921001
1383001
1088001
363001
970001
Stop
761000
207000
669000
1026000
565000
1301000
1369000
1327000
342000
4163000
3553000
3597000
675000
153000
1546000
1511000
98000
87000
399000
2289000
314000
418000
279000
26000
279000
37000
1877000
727000
498000
243000
938000
1400000
1105000
380000"
987000
Length
28999
22999
20999
20999
20999
19999
19999
19999
19999
18999
18999
18999
18999
18999
18999
18999
18999
18999
18999
17999
17999
17999
17999
17999
17999
17999
16999
16999
16999
16999
16999
16999
16999
16999
16999
133

scaffold
47
57
61
88
5
6
7
8
11
15
26
33
49
56
65
70
1
8
8
9
9
10
13
13
14
15
15
22
31
34
35
35
36
39
start
641001
17001
42001
381001
2394001
1935001
1539001
1235001
1637001
1133001
141001
962001
309001
240001
170001
38001
3914001
1772001
2138001
1099001
1251001
317001
446001
1492001
446001
340001
1275001
565001
363001
577001
765001
881001
505001
405001
stop
658000
34000
59000
398000
2410000
1951000
1555000
1251000
1653000
1149000
157000
978000
325000
256000
186000
54000
3929000
1787000
2153000
1114000
1266000
332000
461000
1507000
461000
355000
1290000
580000
378000
592000
780000
896000
520000
420000
length
16999
16999
16999
16999
15999
15999
15999
15999
15999
15999
15999
15999
15999
15999
15999
15999
14999
14999
14999
14999
14999
14999
14999
14999
14999
14999
14999
14999
14999
14999
14999
14999
14999
14999
134

1
1
3
4
5
6
6
8
10
11
12
13
20
22
27
27
28
29
35
38
45
50
52
56
57
61
65
71
79
85
90
92
95
95
96
2
3
4
4
5
5
1407001
1829001
1413001
2188001
345001
753001
1370001
289001
89001
1786001
945001
831001
395001
1040001
1126001
1141001
149001
661001
470001
293001
309001
863001
322001
499001
161001
680001
64001
241001
211001
464001
257001
402001
148001
198001
326001
2841001
2472001
120001
2481001
846001
1919001
1421000
1843000
1427000
2202000
359000
767000
1384000
303000
103000
1800000
959000
845000
409000
1054000
1140000
1155000
163000
675000
484000
307000
323000
877000
336000
513000
175000
694000
78000
255000
225000
478000
271000
416000
162000
212000
340000
2854000
2485000
133000
2494000
859000
1932000
13999
13999
13999
13999
13999
13999
13999
13999
13999
13999
13999
13999
13999
13999
13999
13999
13999
13999
13999
13999
13999
13999
13999
13999
13999
13999
13999
13999
13999
13999
13999
13999
13999
13999
13999
12999
12999
12999
12999
12999
12999
135

5
6
8
9
10
11
11
14
14
14
16
17
19
19
19
21
22
26
27
29
31
34
37
38
38
45
50
53
62
68
70
72
87
87
96
1
2
2
3
4
7
2329001
288001
244001
1119001
1963001
1719001
1953001
93001
588001
864001
661001
1061001
444001
648001
922001
1037001
269001
396001
703001
546001
311001
380001
727001
731001
1005001
527001
719001
266001
94001
187001
55001
334001
136001
496001
169001
2330001
720001
1574001
1964001
1003001
1324001
2342000
301000
257000
1132000
1976000
1732000
1966000
106000
601000
877000
674000
1074000
457000
661000
935000
1050000
282000
409000
716000
559000
324000
393000
740000
744000
1018000
540000
732000
279000
107000
200000
68000
347000
149000
509000
182000
2342000
732000
1586000
1976000
1015000
1336000
12999
12999
12999
12999
12999
12999
12999
12999
12999
12999
12999
12999
12999
12999
12999
12999
12999
12999
12999
12999
12999
12999
12999
12999
12999
12999
12999
12999
12999
12999
12999
12999
12999
12999
12999
11999
11999
11999
11999
11999
11999
136

10
10
11
12
13
14
14
14
15
16
17
18
19
22
22
22
23
24
26
27
28
30
31
31
32
34
35
35
35
35
36
38
38
38
39
40
41
50
50
52
53
906001
1136001
2135001
799001
1051001
610001
726001
1063001
1472001
1241001
1381001
1054001
311001
433001
504001
520001
•J.061001
975001
585001
1092001
27001
1028001
169001
968001
1034001
1078001
230001
436001
856001
934001
264001
277001
874001
983001
739001
270001
695001
141001
704001
367001
639001
918000
1148000
2147000
811000
1063000
622000
738000
1075000
1484000
1253000
1393000
1066000
323000
445000
516000
532000
1073000
987000
597000
1104000
39000
1040000
181000
980000
1046000
1090000
242000
448000
868000
946000
276000
289000
886000
995000
751000
282000
707000
153000
716000
379000
651000
11999
11999
11999
11999
11999
11999
11999
11999
11999
11999
11999
11999
11999
11999
11999
11999
11999
11999
11999
11999
11999
11999
11999
11999
11999
11999
11999
11999
11999
11999
11999
11999
11999
11999
11999
11999
11999
11999
11999
11999
11999
137

57
68
70
73
78
79
80
87
90
94
1
1
2
2
3
3
3
3
4
4
4
5
5
5
5
6
6
6
6
9
10
10
10
10
12
14
14
16
16
17
17
276001
174001
547001
265001
98001
147001
114001
475001
189001
458001
1959001
2073001
2192001
3226001
206001
232001
1268001
3665001
867001
2712001
3016001
973001
1044001
1843001
2255001
217001
1110001
1257001
2205001
566001
881001
1024001
1763001
1823001
1822001
1001001
1545001
1187001
1223001
846001
1131001
288000
186000
559000
277000
110000
159000
126000
487000
201000
470000
1970000
2084000
2203000
3237000
217000
243000
1279000
3676000
878000
2723000
3027000
984000
1055000
1854000
2266000
228000
1121000
1268000
2216000
577000
892000
1035000
1774000
1834000
1833000
1012000
1556000
1198000
1234000
857000
1142000
11999
11999
11999
11999
11999
11999
11999
11999
11999
11999
10999
10999
10999
10999
10999
10999
10999
10999
10999
10999
10999
10999
10999
10999
10999
10999
10999
10999
10999
10999
10999
10999
10999
10999
10999
10999
10999
10999
10999
10999
10999
138

18
18
21
23
25
26
26
26
31
31
34
34
35
35
36
37
37
38
38
47
47
50
51
51
53
56
58
67
70
71
72
75
76
83
85
86
88
89
97
100
37001
1165001
1281001
419001
714001
379001
422001
539001
266001
449001
269001
857001
410001
732001
1052001
199001
750001
567001
609001
481001
494001
308001
99001
418001
545001
257001
672001
55001
394001
550001
322001
115001
222001
199001
178001
508001
360001
12001
313001
85001
48000
1176000
1292000
430000
725000
390000
433000
550000
277000
460000
280000
868000
421000
743000
1063000
210000
761000
578000
620000
492000
505000
319000
110000
429000
556000
268000
683000
66000
405000
561000
333000
126000
233000
210000
189000
519000
371000
23000
324000
96000
10999
10999
10999
10999
10999
10999
10999
10999
10999
10999
10999
10999
10999
10999
10999
10999
10999
10999
10999
10999
10999
10999
10999
10999
10999
10999
10999
10999
10999
10999
10999
10999
10999
10999
10999
10999
10999
10999
10999
10999
139
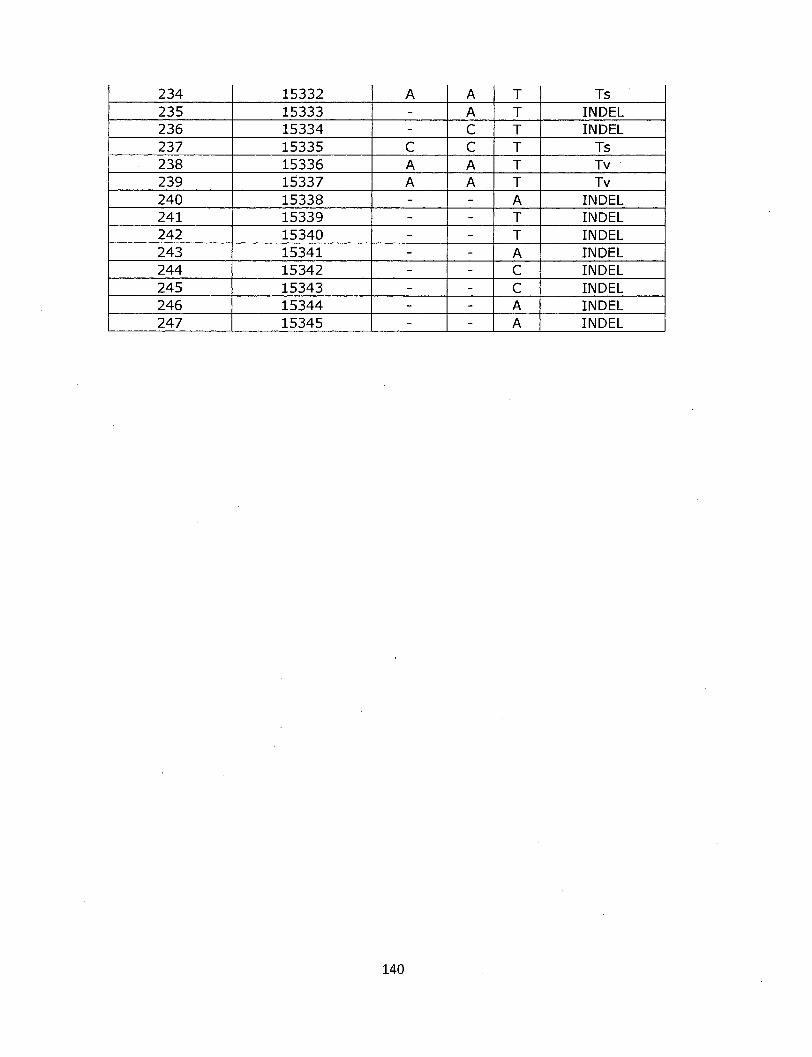
234 235 236 237 238 239 240 241 242 243 244 245 246 247
15332 15333 15334 15335 15336 15337 15338 15339 15340 15341 15342 15343 15344 15345
A -
-
C A A -
-
-
--
-
-
-
A A C C A A -
-
-
--
-
-
-
T T T T T T A T T A C C A A
Ts INDEL INDEL Ts Tv Tv
INDEL INDEL INDEL INDEL INDEL INDEL INDEL INDEL
140

APPENDIX H: KOG annotations of D. pulex gene duplicates with Ks/Ks > 2
#N/A Beta-transducin family (WD-40 repeat) protein Beta-tubulin folding cofactor D C-type lectin Carbonic anhydrase Chromatin assembly factor-I Cytoplasmic exosomal RNA helicase SKI2, DEAD-box superfamily E3 ubiquitin ligase Enolase-phosphatase E-l Focal adhesion tyrosine kinase FAK, contains FERM domain Nucleolar GTPase/ATPase pl30 Predicted esterase of the alpha-beta hydrolase superfamily (Neuropathy target esterase), contains cAMP-binding domains RNA polymerase II, large subunit Serine carboxypeptidases Serine proteinase inhibitor (KU family) with thrombospondin repeats Traf2- and Nck-interacting kinase and related germinal center kinase (GCK) family protein kinases Translation initiation factor 4F, ribosome/mRNA-bridging subunit (eIF-4G) Trypsin Uncharacterized conserved protein Uncharacterized conserved protein H4 von Willebrand factor and related coagulation proteins
141

APPENDIX I: Intron absences in TRO
• • • I
i r- Joss-; ,-teSriS*ST'-
*«4
Figure 34: PCR amplification of putative intron polymorphisms in TRO and TCO, Absences are observed by smaller PCR products in TRO (left in each pair).
142


![The critical importance of defined media conditions in Daphnia magna nanotoxicity studies [Open Access]](https://static.fdokumen.com/doc/165x107/6313f21dc32ab5e46f0ca6d1/the-critical-importance-of-defined-media-conditions-in-daphnia-magna-nanotoxicity.jpg)