Miscanthus: Genetic Resources and Breeding Potential to Enhance Bioenergy Production
467
Genetic Improvement of Bioenergy Crops
Transcript of Miscanthus: Genetic Resources and Breeding Potential to Enhance Bioenergy Production

Genetic Improvement of Bioenergy Crops

Editor
Genetic Improvement of Bioenergy Crops
123
Wilfred Vermerris

Editor
University of Florida Gainesville, FL USA
ISBN: 978-0-387-70804-1 e-ISBN: 978-0-387-70805-8 DOI: 10.1007/978-0-387-70805-8 Library of Congress Control Number: 2008930840 © 2008 Springer Science+Business Media, LLC All rights reserved. This work may not be translated or copied in whole or in part without the written permission of the publisher (Springer Science+Business Media, LLC, 233 Spring Street, New York, NY 10013, USA), except for brief excerpts in connection with reviews or scholarly analysis. Use in connection with any form of information storage and retrieval, electronic adaptation, computer software, or by similar or dissimilar methodology now known or hereafter developed is forbidden. The use in this publication of trade names, trademarks, service marks, and similar terms, even if they are not identified as such, is not to be taken as an expression of opinion as to whether or not they are subject to proprietary rights.
Cover illustration: The poplar image was provided by Dr. Brian Stanton (GreenWood Resources) and the sorghum image was provided by Dr. Ana Saballos (University of Florida).
Printed on acid-free paper
springer.com
Wilfred Vermerris

Preface
Several factors have contributed to this change. Global climate change, once a hotly debated topic, appears to have become accepted as a real phenomenon with potentially catastrophic consequences for both the environment and the global economy. The change in perception of global climate change is the result of intense research and effective communication of that research by many people, including the 2007 Nobel Peace Prize laureates, the United Nations International Panel on Climate Change (IPCC) and former United States vice-president Al Gore. Other developments that have contributed to this awareness include the devastating impact of hurricane Katrina in 2005, massive forest fires in the western and southeastern United States due to prolonged drought, and the realization that weather patterns in many parts of the world in the recent years seem more erratic. In addition, crude oil prices, which have been stable for decades between US$25 and $35 per barrel, are now closer to US$80 per barrel, and on January 4, 2008 hit the much-dreaded price of US$100 per barrel. This increase in the oil price is indicative of the fact that oil reserves are finite, while global demand for oil will continue to rise. Given that oil is used on a global scale but that oil production is controlled by a limited number of countries, individual countries have very little influence of oil prices. This book was written with the belief that energy production and use based on the ‘business-as-usual’ model are not sustainable in the future, due to the impact on the climate, the growing world population, and the fact that oil reserves are finite. Bioenergy is not a magic solution to the world’s energy needs, but it has the potential to contribute significantly to these needs, when used in combination with conservation programs and other sources of alternative energy.
Bioenergy is receiving increasing attention in science, politics, industry and the media. As a result, bioenergy is no longer an obscure topic pursued by ideologists striving for a green economy in which everyday luxuries have to be sacrificed. Instead, the bioeconomy is touted as a new economic model that offers green growth, i.e. economic opportunities that rely on sustainable, environmentally-friendly production and consumption.

vi Preface
This book is divided into two parts. Part I provides background information on bioenergy production and includes a description of the current practice for ethanol production from grain, what the processing options are when lignocellulosic biomass is used, what lignocellulosic biomass is and how it is synthesized in the plant, and how you can chemically characterize and evaluate biomass. Part I also contains a primer on plant breeding and genetics for those readers that are unfamiliar with these topics. Part II provides an overview of a number of important bioenergy crops. Each chapter covers one crop or a group of related crops, and describes the biology, crop use and crop potential, genetic strategies and plant breeding efforts as they relate to bioenergy production. The focus of this book is on so-called biomass crops, where carbohydrates provide the main source of energy. This can be either in the form of sugar used directly in microbial fermentation or in form of cell wall polysaccharides that are processed to fermentable sugars or that are used in thermo-chemical processing (syngas, co-firing). Oil crops for the production of bio-diesel are not covered in this book, largely because the chemistry and processing are very different, and this would likely have resulted in a lack of focus. While bioenergy is of global interest, many of the chapters have a focus on production in the United States. This is the result of several recent initiatives in this country that have led to a stimulus of research on genetic improvement and bioprocessing and that have also resulted in the construction of many new processing plants. The selection of crops represented in Part II is based on the potential for large-scale bioenergy production, and on the presence of active crop improvement programs with a focus on bioenergy. Obviously, some crops not represented in this book may become suitable bioenergy crops in the future, especially after several years of research and breeding. The book is designed for use as a textbook for a course on bioenergy production at the graduate student level. At the University of Florida this book is used for a course with the same name as the book, offered through the department of Agronomy, and open to students from other departments in the plant sciences, as well as students in chemical and biological engineering with an interest in learning
In order for bioenergy to become a reality, a lot of elements need to be put in place. This includes the infrastructure to harvest, transport and process biological materials, the infrastructure to distribute the fuels and green chemical feedstocks produced from these materials, and the vehicles and down-stream processes that use the bioenergy. At the base of this bioenergy production chain are the plant feedstocks. At the time of this writing, the two main sources of bioenergy are corn starch in the United States and sugar from sugar cane in Brazil. Given the anticipated increase in the demand for bioenergy, and the concern that food and feed security are at risk if corn starch and sugar continue to be the main feedstocks, the consensus is that lignocellulosic biomass is a better feedstock for the long term. At this time, the technology to produce fuels from these feedstocks is not mature, and the feedstocks themselves have not been developed for bioenergy production per se. Bioenergy production can therefore become much more efficient if both the feedstocks and the processing technology are optimized. The main focus of this book is on the genetic strategies that are available for improving bioenergy crops that can be used for the production of ethanol and other chemical derived from lignocellulosic biomass.

Preface vii more about feedstock composition and modification. This three-credit course covers more or less one chapter per week, and is supplemented with articles from the primary literature. While this book is written as a text book, it will also be of interest for researchers at academic institutions, government research facilities, and private industry as well as for policy makers in the bioenergy area. As the editor of this book, I would like to thank the chapter authors for their valuable contributions, Randi Wheeler for her assistance with the editing and reference formatting, Miguel Castillo and Nesbit Tyler for proofreading chapters, and Jinnie Kim and Jillian Slaight at Springer for their encouragement and flexibility. This book would not have been possible without the support at home from Lauren and Deirdre. I am grateful for their patience, especially when the writing took place on evenings and in weekends. This book is dedicated to my (currently) 7-year old daughter Deirdre, as a representative of the next generation that will have to face the consequences of the energy-related and environmental choices the current generation makes. Wilfred Vermerris Gainesville, FL, USA Spring 2008

Contents
Preface ........................................................................................................................v
Contributors............................................................................................................xix
Part I
1. Why Bioenergy Makes Sense ..............................................................................3Wilfred Vermerris 1.1 Introduction ...................................................................................................3 1.2 Energy Sources..............................................................................................3 1.2.1 Coal.....................................................................................................5 1.2.2 Oil .......................................................................................................5 1.2.3 Natural Gas .........................................................................................6 1.2.4 Nuclear Energy ...................................................................................6 1.2.5 Hydroelectric Energy..........................................................................7 1.2.6 Solar Energy .......................................................................................7 1.2.7 Wind Energy.......................................................................................8 1.2.8 Tidal Energy .......................................................................................8 1.2.9 Wave Energy.......................................................................................9 1.2.10 Geothermal Energy .............................................................................9 1.2.11 Bioenergy............................................................................................9 1.3 Photosynthesis: Capturing Solar Energy in Chemical Bonds......................12 1.3.1 C3 Photosynthesis .............................................................................12 1.3.2 C4 Photosynthesis .............................................................................14
1.3.2.1 The NADP+-Malic Enzyme Variant ....................................15 1.3.2.2 The NAD+-Malic Enzyme Variant.......................................16 1.3.2.3 The Phosphoenolpyruvate Carboxykinase Variant ..............17 1.3.2.4 Biosynthesis of Biofuel Feedstocks from
Photosynthate.......................................................................18

x Contents
1.4 Alternative Energy to Meet Future Global Energy Needs...........................19 1.4.1 Reducing Global Carbon Emissions .................................................19 1.4.2 Political and Economic Motivations for Using Alternative
Energy ...............................................................................................24 1.5 Initiatives Around the World to Stimulate Bioenergy Production...............26 1.6 Bioenergy, Oil Companies, and Car Manufacturers....................................29 1.7 Concerns About Bioenergy .........................................................................31 1.7.1 Food Versus Fuel ..............................................................................31 1.7.2 Negative Net Energy Balance ...........................................................32 1.7.3 Soil Depletion ...................................................................................33 1.7.4 Contribution to Net CO2 Emissions ..................................................34 1.7.5 Biofuels Prolong the Power of the Oil Companies ...........................35 1.7.6 Ethanol is an Uneconomical Fuel .....................................................36 1.8 Conclusions .................................................................................................37 References............................................................................................................39
2. A Primer on Genetics, Genomics and Plant Breeding ....................................43 Wilfred Vermerris 2.1 Introduction .................................................................................................43 2.2 DNA, Genes and Genomes..........................................................................43 2.3 Genetic Variation ........................................................................................47 2.4 Molecular Markers ......................................................................................49 2.4.1 Definition and Use ............................................................................49 2.4.2 The Polymerase Chain Reaction .......................................................49 2.4.3 RFLPs ...............................................................................................51 2.4.4 CAPS Markers ..................................................................................52 2.4.5 RAPD Markers .................................................................................52 2.4.6 SSR or Microsatellite Markers..........................................................52 2.4.7 SSLP Markers ...................................................................................53 2.4.8 SSCP Markers...................................................................................53 2.4.9 AFLP® Markers ................................................................................53 2.4.10 SNP Markers.....................................................................................54 2.5 Genetic Maps...............................................................................................54 2.6 Gene Identification and Isolation ................................................................56 2.6.1 Isolation of Mutants ..........................................................................56 2.6.2 Insertional Mutagenesis ....................................................................57 2.6.3 Map-Based Cloning ..........................................................................58 2.6.4 The Candidate-Gene Approach.........................................................59 2.6.5 Gene Identification Based on Differential Gene Expression ............59
2.6.5.1 Differential Display .............................................................60 2.6.5.2 Subtractive Hybridization ....................................................60 2.6.5.3 cDNA-AFLP® ......................................................................61 2.6.5.4 Microarrays ..........................................................................61 2.6.5.5 High-Throughput cDNA Sequencing ..................................61
2.7 Plant Breeding Principles ............................................................................62 2.7.1 Identification and Combination of Genetic Variation.......................62 2.7.2 Quantitative Traits ............................................................................63

Contents xi
2.7.3 Selection ...........................................................................................64 2.7.3.1 Bulk Method ........................................................................65 2.7.3.2 Single-Seed Descent Method ...............................................65 2.7.3.3 Mass Selection .....................................................................66 2.7.3.4 Pedigree Method ..................................................................66 2.7.3.5 Backcross Method................................................................67
2.7.4 Testing and Evaluation .....................................................................68 2.7.5 Cultivar Production...........................................................................69 2.8 Genetic Engineering ....................................................................................69 References............................................................................................................71
3. Production of Ethanol from Grain ...................................................................75 Nancy N. Nichols and Rodney J. Bothast 3.1 Introduction .................................................................................................75 3.2 Ethanol Fermentation Processes..................................................................75 3.2.1 Initial Handling of Grain...................................................................78 3.2.2 Conversion of Starch to Fermentable Sugars....................................78 3.2.3 Ethanol Fermentation........................................................................80 3.2.4 Ethanol Recovery..............................................................................80 3.2.5 Stillage Processing............................................................................81 3.3 New Developments .....................................................................................81 3.3.1 Milling and Separation Technologies ...............................................81 3.3.2 New Enzymes and Yeast Strains ......................................................82 3.3.3 New Corn Hybrids ............................................................................83 3.3.4 Co-product Quality and Utilization...................................................83 3.3.5 Conversion of Non-starch Polymers .................................................84 3.4 Conclusion...................................................................................................84 References............................................................................................................84
4. Composition and Biosynthesis of Lignocellulosic Biomass.............................89 Wilfred Vermerris 4.1 Introduction .................................................................................................89 4.2 Lignocellulosci Biomass is Composed of Plant Cell Walls.........................89 4.3 Carbohydrate Nomenclature........................................................................91 4.3.1 The +/− -Nomenclature.....................................................................91
4.3.3 The R, S-Nomenclature.....................................................................92 4.4 Cellulose......................................................................................................96 4.4.1 Cellulose Structure............................................................................96 4.4.2 Cellulose Biosynthesis ......................................................................98 4.5 Hemicellulose............................................................................................102 4.5.1 Xyloglucans ....................................................................................103 4.5.2 Xylans .............................................................................................104
4.5.2.1 Arabinoxylans ....................................................................104 4.5.2.2 Glucuronoarabinoxylans ....................................................105 4.5.2.3 4-O-Methyl-Glucuronoxylans............................................106
4.3.2 The L/D -Nomenclature .....................................................................92

xii Contents
4.5.3 Mixed-Linkage Beta-Glucans.........................................................106 4.5.4 Mannans..........................................................................................106 4.5.5 Hemicellulose Biosynthesis ............................................................107
4.5.5.1 The Nucleotide Sugar Interconversion Pathway................108 4.5.5.2 Biosynthesis of Hemicellulosic Polysaccharides ...............111 4.5.5.3 Xyloglucan Modification ...................................................115
4.6 Pectins .......................................................................................................116 4.7 Lignin and Hydroxycinnamic Acids..........................................................117 4.7.1 Biosynthesis of Monolignols and Hydroxycinnamic Acids............117 4.7.2 Monolignol Transport .....................................................................120 4.8 Cell Wall Proteins .....................................................................................125 4.9 Cell Wall Architecture...............................................................................126 4.10 Cell Wall-Related Databases .....................................................................128 4.11 Conclusion.................................................................................................129 References..........................................................................................................129
5. Selection of Promising Biomass Feedstock Lines Using High-Throughput Spectrometric and Enzymatic Assays.......................................143 Mark F. Davis, Ed Wolfrum and Tina Jeoh 5.1 Introduction ...............................................................................................143 5.2 Integrating Spectroscopy and Multivariate Statistical Data Analysis
for High-Throughput Cell Wall Chemical Analysis..................................143 5.3 Near Infrared (NIR) Spectroscopy ............................................................145 5.3.1 Description of Instrumentation .......................................................145 5.3.2 Applications and Results.................................................................146
5.3.2.1 Qualitative Data Analysis (Classification).........................146 5.3.2.2 Quantitative Data Analysis (Prediction) ............................147
5.4 Pyrolysis-Molecular Beam-Mass Spectrometry ........................................148 5.4.1 Description of Instrumentation .......................................................148 5.4.2 Applications and Results.................................................................150
5.4.2.1 Estimates of Lignin Composition and Structure ................150 5.4.2.2 Detection of Quantitative Trait Loci ..................................152 5.4.2.3 Chemical Compositional Changes after Pretreatment
and Biological Conversion .................................................152 5.4.2.4 Screening for Unintended Effects ......................................154
5.5 Enzyme Accessibility in Biomass .............................................................154 5.5.1 Probing for Enzyme Accessibility in Biomass................................154 5.5.2 Applications and Results.................................................................155 References..........................................................................................................157
6. Current Technologies for Fuel Ethanol Production from Lignocellulosic Plant Biomass.........................................................................161 Yulin Lu and Nathan S. Mosier 6.1 Introduction ...............................................................................................161 6.2 Feedstock Pretreatment Strategies.............................................................163
4.7.3 Monolignol Oxidation and Polymerization.....................................121

Contents xiii
6.2.1 Neutral/Controlled-pH Pretreatment...............................................165 6.2.1.1 Steam Explosion ................................................................165 6.2.1.2 Liquid Hot Water Pretreatment..........................................165 6.2.1.3 Controlled-pH Pretreatment ...............................................166
6.2.2 Acid-Based Pretreatment ................................................................166 6.2.2.1 Dilute Acid Pretreatment ...................................................166 6.2.2.2 Concentrated Acid Pretreatment ........................................167
6.2.3 Alkaline-Based and Other Pretreatments ........................................167 6.2.3.1 Lime ...................................................................................167 6.2.3.2 Ammonia Fiber Expansion ................................................168
6.3 Enzymatic Hydrolysis: Liberating Monosaccharides ................................168 6.4 Ethanol Fermentation: Strain Development for Sugar
Co-fermentation.........................................................................................171 6.4.1 Saccharomyces cerevisiae ..............................................................171 6.4.2 Zymomonas mobilis ........................................................................173 6.4.3 Escherichia coli ..............................................................................174 6.5 Ethanol Recovery: Distillation and Dehydration.......................................175 6.6 Perspectives on Advanced Biochemical Conversion Technologies ..........176 Acknowledgements............................................................................................177 References..........................................................................................................177
Part II
7. Genetic Improvement of Corn for Lignocellulosic Feedstock Production ........................................................................................................185 Natalia de Leon and James G. Coors 7.1 Indtroduction .............................................................................................185 7.2 Botanical Description of Corn...................................................................186 7.2.1 Corn Anatomy.................................................................................186 7.2.2 Corn Origin and Habiat...................................................................187 7.2.3 Corn Reproduction and Biology .....................................................188 7.2.4 Genome Structure and Organization...............................................190 7.3 Management and Bioprocessing................................................................191 7.3.1 Cultivation Practices .......................................................................191 7.3.2 Biomass Yield Potential..................................................................193 7.3.3 Biomass Processing ........................................................................195 7.4 Utilization of Corn Stover as a Source of Biomass ...................................196 7.5 Genetics .....................................................................................................198 7.5.1 Sources of Genetic Variation ..........................................................198 7.5.2 Use of Genetic Variation ................................................................199 7.6 Current Research Efforts and Future Outlook ...........................................201 References..........................................................................................................202
8. Development and Utilization of Sorghum as a Bioenergy Crop ..................211 Ana Saballos 8.1 Introduction ...............................................................................................211 8.2 Botanical Description of Sorghum ............................................................212

xiv Contents
8.2.1 Biology of Reproduction.................................................................214 8.3 Management ..............................................................................................215 8.3.1 Agronomic Considerations .............................................................215 8.3.2 Pests and Diseases ..........................................................................217
8.3.2.1 Insect Pests.........................................................................218 8.3.2.2 Diseases .............................................................................220
8.3.3 Harvest and Processing Systems.....................................................221 8.4 Current Status and Future Prospects..........................................................223 8.5 Genetic Improvement of Sorghum ............................................................225 8.5.1 Genetic Resources...........................................................................225
8.5.1.1 Natural Variation ...............................................................225 8.5.1.2 Mutants ..............................................................................226 8.5.1.3 Transformation...................................................................226 8.5.1.4 Sorghum Genomics............................................................227
8.5.2 Breeding Methods...........................................................................228 8.5.3 Traits of Interest for Improvement..................................................230
8.5.3.1 Yield...................................................................................231 8.5.3.2 Stress Resistance................................................................234 8.5.3.3 Moisture Content and Juice Extraction Efficiency.............236 8.5.3.4 Conversion Efficiency of the Starch ..................................236 8.5.3.5 Cell Wall Composition.......................................................236 8.5.3.6 Sugar Concentration...........................................................237
8.6 Conclusions ...............................................................................................238 Acknowledgements............................................................................................238 References..........................................................................................................239
9. Genetic Improvement of Sugarcane (Saccharum spp.) as an Energy Crop............................................................................................249 Thomas L. Tew and Robert M. Cobill 9.1 Introduction ...............................................................................................249 9.2 Botanical Description of Sugarcane ..........................................................249 9.2.1 Taxonomy .......................................................................................249 9.2.2 Sugarcane Cultivation and Harvest.................................................251 9.2.3 Sugarcane Anatomy........................................................................252 9.2.4 Early Breeding Efforts ....................................................................254 9.2.5 Genetic Improvement......................................................................255 9.3 Production Statistics ..................................................................................255 9.3.1 Worldwide Production Statistics.....................................................255 9.3.2 U.S. Production Statistics ...............................................................256 9.4 Energy Potential of Sugarcane ..................................................................256 9.4.1 Yield Potential ................................................................................256 9.4.2 Actual Yields ..................................................................................257 9.5 Sugarcane as an Energy Crop....................................................................257 9.5.1 Sugar as a Feedstock.......................................................................258 9.5.2 Sugarcane Fiber as a Feedstock ......................................................258
9.5.2.1 Composition of Sugarcane .................................................258

Contents xv
9.5.2.2 Boiler Fuel and Cogeneration ............................................259 9.5.2.3 Cellulosic Ethanol and Gasification...................................260
9.6 Energy Cane Breeding Strategies ..............................................................262 9.6.1 The Sugar Model (Status Quo) .......................................................262
9.6.1.1 Breeding for Sugar Yield and Improved Sugar Content...............................................................................262
9.6.1.2 Sugarcane Breeding in Brazil.............................................263 9.6.2 Sugar and Fiber Model....................................................................264
9.6.2.1 Type I Energy Cane Definition ..........................................264 9.6.2.2 Genetic Base Broadening...................................................264 9.6.2.3 Caribbean and U.S. Experience .........................................265
9.6.3 Fiber-only Model (Type II Energy Cane) ......................................266 9.6.3.1 Type II Energy Cane Definition.........................................266 9.6.3.2 Breeding Within Saccharum Strictly for Fiber
Content...............................................................................266 9.6.3.3 Related Genera and Intergeneric Hybridization.................267
9.7 Looking to the Future ................................................................................267 Acknowledgements............................................................................................268 References..........................................................................................................268
10. Miscanthus: Genetic Resources and Breeding Potential to Enhance Bioenergy Production ......................................................................................273 John Clifton-Brown, Yu-Chung Chiang and Trevor R. Hodkinson 10.1 Introduction ...............................................................................................273 10.2 Botanical Description of Miscanthus.........................................................274 10.3 Agronomic Characteristics and Bioprocessing..........................................279 10.4 Production and Utilization.........................................................................281 10.5 Why use Miscanthus? ...............................................................................282 10.6 Genetics .....................................................................................................283
10.6.1 Using Genetic Variation for Breeding ..........................................284 10.6.2 Traits of Interest............................................................................287
10.6.2.1 Drought Tolerance.........................................................287 10.6.2.2 Frost Tolerance and Low Temperature Growth.............288 10.6.2.3 Flowering Time .............................................................288 10.6.2.4 Composition ..................................................................288 10.6.2.5 Propagation....................................................................289 10.6.2.6 Pests and Disease...........................................................289
10.7 Future Outlook ..........................................................................................290 Acknowledgements............................................................................................290 References..........................................................................................................290
11. Improvement of Switchgrass as a Bioenergy Crop .......................................295 Joe Bouton 11.1 Introduction ...............................................................................................295 11.2 Rationale for using Switchgrass as a Bioenergy Crop...............................296
9.5.3 Energy Output/Input Ratio..............................................................261

xvi Contents
11.3 Botanical Description of Switchgrass........................................................296 11.4 Management ..............................................................................................297 11.5 Bioprocessing ............................................................................................299 11.6 Breeding and Cultivar Development .........................................................300
11.6.1 Traits and Breeding Methodology ................................................300 11.6.2 Population Improvement ..............................................................301 11.6.3 Hybrids .........................................................................................302
11.7 Genomics and Transformation ..................................................................303 11.7.1 Genomics and Trait Mapping .......................................................304 11.7.2 Tissue Culture and Transformation ..............................................305
11.8 Future Outlook and Conclusions ...............................................................305 Acknowledgements............................................................................................306 References..........................................................................................................306
12. Improvement of Perennial Forage Species as Feedstock for Bioenergy ....................................................................................................309 William F. Anderson, Michael D. Casler and Brian S. Baldwin 12.1 Introduction ...............................................................................................309 12.2 Reed Canarygrass ......................................................................................310
12.2.1 Botanical Description ...................................................................310 12.2.2 Management and Bioprocessing...................................................311 12.2.3 Genetics and Breeding..................................................................311 12.2.4 Future Outlook for Reed Canarygrass ..........................................312
12.3 Alfalfa........................................................................................................313 12.3.1 Botanical Description ...................................................................313 12.3.2 Management and Bioprocessing...................................................314 12.3.3 Genetics and Breeding..................................................................314 12.3.4 Future Outlook for Alfalfa............................................................316
12.4 Wildrye......................................................................................................316 12.4.1 Botanical Description ...................................................................316 12.4.2 Management and Bioprocessing...................................................317 12.4.3 Genetics and Breeding..................................................................317 12.4.4 Future Outlook for Wildrye ..........................................................317
12.5 Big Bluestem .............................................................................................318 12.5.1 Botanical Description ...................................................................318 12.5.2 Management and Bioprocessing...................................................319 12.5.3 Genetics and Breeding..................................................................319 12.5.4 Future Outlook for Big Bluestem .................................................320
12.6 Bermudagrass ............................................................................................321 12.6.1 Botanical Description ...................................................................321 12.6.2 Management and Bioprocessing...................................................322 12.6.3 Genetics and Breeding..................................................................323 12.6.4 Future Outlook for Bermudagrass ................................................328
12.7 Napiergrass................................................................................................328 12.7.1 Botanical Description ...................................................................328 12.7.2 Management and Bioprocessing...................................................329

Contents xvii
12.7.3 Genetics and Breeding..................................................................330 12.7.4 Future Outlook for Napiergrass ....................................................333
12.8 Eastern Gamagrass ....................................................................................333 12.8.1 Botanical Description ...................................................................333 12.8.2 Management and Bioprocessing...................................................334 12.8.3 Genetics and Breeding..................................................................334 12.8.4 Future Outlook for Eastern Gamagrass ........................................335
12.9 Summary ...................................................................................................336 Acknowledgements............................................................................................337 References..........................................................................................................337
13. Genetic Improvement of Willow (Salix spp.) as a Dedicated Bioenergy Crop ................................................................................................347 Lawrence B. Smart and Kimberly D. Cameron 13.1 Introduction ...............................................................................................347 13.2 Botanical Description of Willow (Salix) ...................................................348
13.2.1 Taxonomy of Species Developed as Bioenergy Crops.................348 13.2.2 Willow Habitat and Growth..........................................................349
13.3 Cultivation, Harvesting, and Processing of Shrub Willow........................349 13.3.1 Establishing Willow Bioenergy Crop Plantations ........................349 13.3.2 Willow Crop Management ...........................................................352 13.3.3 Willow Biomass Harvesting, Transport, and Storage...................355 13.3.4 Processing and Conversion of Willow Biomass
to Electricity, Heat, and Transportation Fuels ..............................357 13.4 Breeding and Selection of Improved Shrub Willow
Varieties for Bioenergy .............................................................................359 13.4.1 Pollination, Hybridization, and Seedling
Propagation of Willows ................................................................359 13.4.2 Genetics of Traits Important for Improved
Performance of Willow as a Bioenergy Crop ...............................362 13.4.3 Current Breeding Efforts for the Development of
Shrub Willow as an Energy Crop .................................................363 13.4.3.1 Breeding Programs in Sweden.......................................363 13.4.3.2 Breeding Programs in the United Kingdom...................364 13.4.3.3 Breeding Programs in North America ...........................365
13.4.4 Analysis and Genetic Modification of the Willow Genome.........369 13.4 Future Outlook ..........................................................................................370 Acknowledgements............................................................................................370 References..........................................................................................................370
14. Genetic Improvement of Poplar (Populus spp.) as a Bioenergy Crop.........377 John M. Davis 14.1 Introduction ...............................................................................................377 14.2 Botanical Description of Poplar (Populus)................................................378
14.2.1 Taxonomy of Populus ..................................................................378 14.2.2 Propagation and Silviculture.........................................................380

xviii Contents
14.2.3 Use of Poplar for Bioenergy .........................................................383 14.3 Genetic Improvement ................................................................................385
14.3.1 Genetic Parameters for Bioenergy Traits......................................386 14.3.2 Whole-Genome Sequence: The “Parts List” for
Genetic Improvement ...................................................................388 14.3.3 Trait Mapping in Pedigrees and Populations ................................389 14.3.4 Transgenic Alteration of Gene Expression...................................390
14.4 Conclusions ...............................................................................................393 Acknowledgements............................................................................................393 References..........................................................................................................393
15. Southern Pines: A Resource for Bioenergy....................................................397 Gary F. Peter 15.1 Introduction ...............................................................................................397 15.2 Botanical Description of Pines: Southern Yellow Pines............................398
15.2.1 Taxonomy of Species Developed for Plantation Forestry ............398 15.3 Management, Harvesting, Transportation and Bioprocessing
15.3.1 Current Southern Pine Growing Systems for Traditional Forest Products...........................................................400
15.3.2 Southern Pine Harvesting and Transport ......................................403 15.3.3 Silvicultural Research for Short-Rotation Bioenergy
Plantings .......................................................................................403 15.3.4 Traditional Pulp and Paper Bioprocessing Methods,
Existing Infrastructure, and Integrated Forest Biorefineries.........404 15.3.5 Stand-Alone Facilities for Converting Southern Pines to
Energy and Fuels ..........................................................................405 15.4 Life History and Life Cycle of Southern Pines .........................................406 15.5 Genetics and Breeding of Southern Pine ...................................................407
15.5.1 Genetic Diversity..........................................................................407 15.5.2 Pollination, Breeding, and Propagation of Southern Pines...........408 15.5.3 Genetic Improvement of Growth, Disease Resistance,
and Wood Properties in Loblolly and Slash Pine .........................411 15.5.4 Biotechnology in Southern Pines..................................................413
15.6 Future Outlook ..........................................................................................414 Acknowledgements............................................................................................414 References..........................................................................................................414
List of Abbreviations .............................................................................................421
Index .......................................................................................................................423
of Southern Pines ......................................................................................400

Contributors
William F. Anderson U.S. Department of Agriculture – Agricultural Research Service, Crop Genetics and Breeding Research Unit, 115 Coastal Way, Tifton, GA31793, USA [email protected] Brian S. Baldwin Department of Plant and Soil Sciences, Box 9555, Mississippi State University, Starkville, MS 39762, USA [email protected] Rodney J. Bothast Southern Illinois University-Edwardsville, National Corn-to-Ethanol Research Center, Edwardsville, IL 62025, USA [email protected] Joe Bouton Samuel Roberts Noble Foundation, Forage Improvement Division, 2510 Sam Noble Parkway, Ardmore, OK 73401 USA [email protected] Kimberly D. Cameron Department of Environmental and Forest Biology, State University of New York College of Environmental Science and Forestry, 246 Illick Hall, 1 Forestry Drive, Syracuse, NY 13210, USA [email protected] Michael D. Casler U.S. Department of Agriculture – Agricultural Research Service, U.S. Dairy Forage Research Center, 1925 Linden Drive West, Madison, WI 53708, USA [email protected]

xx Contributors Yu-Chung Chiang Department of Life Sciences, National Pingtung University of Science and Technology, 1 Shuefu Rd., Neipu, Pingtung 912, Taiwan [email protected] John Clifton-Brown Plant Breeding and Crop Genetics, Institute of Grassland and Environmental Research, Plas Gogerddan, Aberystwyth, Dyfed SY23 3EB, UK [email protected] Robert M. Cobill U.S. Department of Agriculture – Agricultural Research Service, Sugarcane Research Unit, 5883 USDA Road, Houma, LA, USA [email protected] James G. Coors Department of Agronomy, University of Wisconsin–Madison, 1575 Linden Drive, Madison, WI 53706, USA [email protected] Mark F. Davis National Bioenergy Center, National Renewable Energy Laboratory, 1617 Cole Boulevard, Golden, CO 80401, USA [email protected] John M. Davis School of Forest Resources & Conservation, University of Florida, 328 Newins-Ziegler Hall, Gainesville, FL 32611, USA [email protected] Natalia de Leon Department of Agronomy, University of Wisconsin–Madison, 1575 Linden Drive, Madison, WI 53706, USA [email protected] Trevor R. Hodkinson Department of Botany, School of Natural Sciences, University of Dublin, Trinity College, Dublin D2, Ireland [email protected] Tina Jeoh
GeoSynFuels, LLC, 14818 W. 6th Ave #A1, Golden, CO 80401, USA [email protected]

Contributors xxi Yulin Lu Department of Agricultural and Biological Engineering, Laboratory of Renewable Resources Engineering, Purdue University, 225 S. University Street, West Lafayette, IN 47907, USA [email protected] Nathan S. Mosier Department of Agricultural and Biological Engineering, Laboratory of Renewable Resources Engineering, Purdue University, 225 S. University Street, West Lafayette, IN 47907, USA [email protected] Nancy N. Nichols U.S. Department of Agriculture – Agricultural Research Service, National Center for Agricultural Utilization Research, 1815 N. University Street, Peoria, IL 61604, USA [email protected] Gary F. Peter School of Forest Resources & Conservation, University of Florida, 326 Newins-Ziegler Hall, Gainesville, FL 32611, USA [email protected] Ana Saballos Department of Agronomy, Purdue University, 915 W. State Street, West Lafayette, IN 47907, USA [email protected] Lawrence B. Smart Department of Environmental and Forest Biology, State University of New York College of Environmental Science and Forestry, 246 Illick Hall, 1 Forestry Drive, Syracuse, NY 13210, USA [email protected] Thomas L. Tew U.S. Department of Agriculture – Agricultural Research Service, Sugarcane Research Unit, 5883 USDA Road, Houma, LA, USA [email protected] Ed Wolfrum National Bioenergy Center, National Renewable Energy Laboratory, 1617 Cole Boulevard, Golden, CO 80401, USA [email protected] Wilfred Vermerris Genetics Institute and Agronomy department, University of Florida, Cancer & Genetics Research Complex, 1376 Mowry Road, Gainesville, FL 32610, USA [email protected]

Part I

1 Why Bioenergy Makes Sense
Wilfred Vermerris
Genetics Institute and Agronomy department, University of Florida, Gainesville, FL, USA, [email protected]
1.1 Introduction
Bioenergy is currently receiving considerable international attention in politics and the media. But what exactly is bioenergy, how is it produced, and what is the poten-tial contribution of bioenergy towards future energy needs? These questions need to be examined in the context of global energy resources. The first chapter of this book is a general introduction that provides the context for the other chapters in this book. Topics include an overview of conventional and alternative energy sources, the rationale for developing and using bioenergy, the mechanism behind storing solar energy in plant biomass, initiatives in various parts of the world to stimulate bioenergy production and use, how the automobile manu-facturers and oil companies are handling the changing energy landscape, and what critics of bioenergy have to say. Sources listed in the text are recommended for a more in-depth treatise of these topics. As indicated in the Preface, this book was written based on the notion that the ‘business-as-usual’ model for energy production and use is not sustainable, that alternative sources of energy need to be used, and that bioenergy can play a signifi-cant role in supplying that energy. This view is not shared by everybody, as dis-cussed in Section 1.7. While it is the intention to present information as objectively as possible, given the premise of the book, this is one section where that was some-what challenging.
1.2 Energy Sources
Meeting global energy needs in the future has become a main topic of discussion, for several reasons. The simplest one is the fact that the world population is still growing
W. Vermerris (ed.), Genetic Improvement of Bioenergy Crops, DOI: 10.1007/978-0-387-70805-8_1, © Springer Science+Business Media, LLC 2008

4 Vermerris from the current 6.6 billion people, to a projected stable level of 9 billion in 2050 (Population Institute 2008). That means a 50% increase in the population in just over 40 years. The majority of this population growth is expected to occur in Africa, India and Southeast Asia. Concurrent with this increase in the world population is the increase in the standard of living in several countries with large populations, notably China and India, each with more than 1 billion people. As the standard of living in these countries goes up, so does the need for energy in the form of fuels for automo-biles, farm equipment, trucks, and airplanes, and electricity to heat, cool and light houses, offices and factories. Fossil fuels – coal, oil, and natural gas – currently supply 86% of the world’s energy (Table 1.1), but fossil fuels represent a finite resource that will be used up in the foreseeable future. So the only way the increase in demand for energy can be met, is through the use of alternative energy sources. The question therefore is not if we should develop alternative energy sources, or whether alternative energy is eco-nomically competitive with fossil fuels, but how we can use alternative energy in a way that is sustainable both economically and ecologically. As will be discussed in Section 1.4, there are pressing reasons why this switch should happen sooner rather than later.
Table 1.1. Fossil fuels: Current use, energy contribution, estimated reserve, length of time the recoverable reserves are projected to last, and monetary value per unit of energy
Source Current use1 Energy (TW) (% of total)2
Reserve3 Time4 (years)
Value5
(US$ –1) Coal 5.88×10¹² kg 3.8 (25%) 9.05×10¹⁴ kg 154 2.30 Oil 4.85×10¹² l 5.6 (38%) 1.94×10¹⁴ l 40 15.60 Natural gas 2.91×10¹² m3 3.5 (23%) 1.76×10¹⁴ m3 60 7.32 Total 12.9 (86%)
1,2 Data for 2005 from the Energy Information Administration. TW = TeraWatt = 1012 W http://www.eia.doe.gov/emeu/iea/wec.html 3 Averages of estimates of recoverable reserves, summarized by the Energy Information
Administration Oil and natural gas: http://www.eia.doe.gov/emeu/international/reserves.xls Coal: http://www.eia.doe.gov/pub/international/iea2005/table82.xls) 4 Time the recoverable reserves will last at current use rates. The estimate is based on divid-
ing the reserve (column 1) by the current use (column 3). This estimate does not reflect changes in total use, new technologies that affect energy efficiency, contribution of alter-native energy, or new technologies that enable access to additional reserves
5 Based on Dale (2007) and February 2008 market prices provided by Energy Information Administration (www.eia.doe.gov)
In order to put the discussion on bioenergy in a broader perspective, the different sources of energy and their use will be presented first. Conventional energy sources are the fossil fuels (coal, oil and natural gas), but also include hydroelectric and nuclear power, because these two energy sources are each already responsible for providing 6% of the world’s energy. Alternative energy, as the name implies, refers to energy that is different from conventional energy and includes a diverse collection of energy sources: solar energy, wind energy, tidal energy, wave energy, geothermal
GJ

Why Bioenergy Makes Sense 5
energy, and bioenergy. Together, these sources currently supply less than 1% of the world’s energy. Renewable energy is energy from sources that are replenished. This includes all the abovementioned alternative energy sources, as well as hydro-electric power.
1.2.1 Coal
Coal is formed from plant material (predominantly wood) over a period of millions of years, during which the biomass was subjected to high pressure and temperature. The term ‘coal’ comprises different types of material, with anthracite coal and lignite coal forming the extremes. Anthracite coal is largely composed of carbon, has a high energy density, and burns relatively cleanly, whereas lignite coal (brown coal) is heterogeneous in structure and composition due to ash and water content. Depending on the origin, coal may also contain small amounts of sulfur, which during combus-tion will result in the formation of noxious sulfur oxides that contribute to poor air quality and smog. Coal is generally burned in electricity-generating power plants. The energy generated from burning the coal is captured by heating water. The steam is then used to propel a turbine that generates electricity. Even if clean technology is used during the burning of coal (for example with the use of scrubbers that will eliminate particulate matter and sulfur oxides), burning of coal leads to the net emis-sion of carbon dioxide (CO2) into the atmosphere, because the carbon originated from underground sources. Global coal reserves are vast (Table 1.1), with China and the United States representing the top two coal-producing countries. Coal is not a convenient source of transportation fuels, although attempts to produce liquid fuels from coal have been made since the development of the Fisher-Tropsch process in the 1920’s. This involves the formation of a synthesis gas (‘syngas’) containing hydrogen (H2) and carbon monoxide (CO), the latter produced via partial oxidation of coal, that is led over a chemical catalysts to form liquid fuels. In World War II, Germany and Japan produced fuels using this method. More recently, South Africa has produced diesel fuels from coal.
1.2.2 Oil
Oil, or technically speaking, crude oil, is formed from zooplankton deposits in an-cient sea beds. The high pressure and temperature to which these deposits were sub-jected over a period of millions of years resulted in the conversion of membrane lipids to oil, which is a combination of many different long-chain hydrocarbons with a variety of functional groups. The term petroleum refers to crude oil and natural gas (see Section 1.2.3), which are often found and recovered together. Crude oil is proc-essed in oil refineries, where several fractions are generated for various applications, such as kerosene for jet engines, gasoline and diesel fuel for trucks and cars, oil for heating home furnaces, and tar residues for asphalt. The majority (68% in the U.S.) of the liquid fractions are burned as transportation fuel. Burning of oil-based prod-ucts also leads to the net emission of CO2, as well as the formation of nitrous oxides (NOx) because of the high temperature during combustion (90–100°C) that will oxi-dize nitrogen present in the atmosphere. NOx can give rise to poor air quality (smog)

6 Vermerris and acid rain. Catalytic converters common on modern cars reduce NOx emissions drastically. The largest oil reserves, by far, are in the Middle East, notably Saudi Arabia, Iran, Iraq, Kuwait, and the United Arab Emirates. Canada and Russia also have substantial reserves (data from EIA; see footnote 3 in Table 1.1). Canada and Venezuela also have vast reserves of tar sands, mixtures of sand or clay, water, and extra heavy crude oil (only deposits under active development are included in the estimates in Table 1.1). The recovery of oil from tar sands is very energy intensive relative to oil below the surface. The fourteen-member Organization of Oil Export-ing Countries (OPEC; www.opec.org), founded in 1960, plays a major role in deter-mining world oil output and pricing.
1.2.3 Natural Gas
Natural gas consists primarily of methane (CH4) and exists naturally in rocks beneath Earth’s surface, often associated with oil deposits. Natural gas is thought to have originated from decomposing plant and animal matter that was transformed into relatively simple compounds as a result of bacterial decay, pressure, and high tem-peratures. Natural gas is used on a large scale for heating, cooking, lighting, indus-trial processes, and can be also used as a transportation fuel. This requires the gas to be pressurized or liquefied. Liquefied natural gas (LNG) was successfully introduced as a relatively clean transportation fuel in New Delhi, India to reduce air pollution. Natural gas can also be converted to syngas for the production of liquid fuels via the abovementioned Fisher-Tropsch process. The global reserves of natural gas are large (Table 1.1), although not all sites are easily accessible. The removal of natural gas carries the risk of ground settling, and in areas with moderate to high population densities, this has been known to cause cracks in buildings, and even small earth-quakes. While natural gas is considered the cleanest of the three fossil fuels, burning natural gas also contributes to the net emission of CO2.
1.2.4 Nuclear Energy
Nuclear energy is based on the property of certain atoms, notably uranium-235 (235U), to undergo nuclear fission when a neutron of one 235U atom collides with the nucleus of a different 235U atom. During this process the nucleus splits, and two new nuclei are formed (for example, cesium-145 and rubidium-90), along with additional neutrons that can initiate a chain reaction, and a considerable amount of heat. The heat is captured by water, and the resulting steam is used to drive a turbine, much like in a coal-fired power plant. Modern nuclear power plants are considered very efficient. An additional benefit of using nuclear energy for electricity generation is that it does not contribute to net CO2 emissions. Uranium ore contains primarily the isotope 238U. Generating the fuel for a nuclear reactor requires increasing the content of 235U from approximately 0.7% to 3–5%. Several enrichment methods exist, including derivatization to uranium hexafluoride (UF6), followed by centrifugation. There are only 439 nuclear reactors in the world, with the U.S., France, Japan, Russia and South Korea representing the main producers. The contribution of nu-

Why Bioenergy Makes Sense 7
clear energy varies from country to country. France generates 79% of its energy from nuclear energy, whereas in the U.S. it is 30% (EIA 2005a). Approximately 96% of the world’s recoverable uranium ore – an estimated total of 2 × 10⁶ Mg – is present in 10 countries: Australia, Canada, Kazakhstan, South Africa, Brazil, Namibia, Uz-bekistan, U.S., Niger and Russia (ENS 2008). In addition, the energy content of 235U is large: the global reserves of uranium ore contain the energy equivalent of 28 × 109
Mg coal, which, according to the European Nuclear Society (ENS 2008), is ‘enough to operate the current number of nuclear power plants for several decades’. Nuclear energy thus represents a powerful energy resource, but it is not a renewable resource, and despite the high energy content of 235U (on a mass-basis), the reserves would last decades, not centuries. In addition, nuclear energy produces radioactive waste that is highly toxic and that can be used in nuclear weapons (e.g. plutonium). The nuclear waste has an extremely long half-life, thus requiring storage in secure locations. The nuclear reactor itself and the radioactive waste it generates, pose security risks to the general population, and the waste transport and storage pose a health risk. Given these risks, the use of nuclear energy is monitored by the International Atomic En-ergy Agency (IAEA; www.iaea.org). Nuclear energy is used to power submarines and spacecraft, but is not a suitable fuel for automobiles.
1.2.5 Hydroelectric Energy
Hydroelectric power is based on capturing potential energy that is released as water falls down. The falling water propels a turbine, which generates electricity. Generat-ing hydroelectric power is accomplished with the use of large – often artificial – lakes in which water from local rivers is stored before it is released through a dam that houses the turbines. Hydroelectric energy does not generate any emissions dur-ing its production, nor does it produce waste. The creation of large artificial lakes may, however, result in serious ecological damage. The largest producers of hydroe-lectric energy are Canada, the U.S., Brazil, Russia and Norway (EIA 2005b). The contribution of hydroelectric energy toward total energy use is highest in Canada and Norway. The Three Gorges Dam in the Yangtze River in China is the largest hydro-electric dam ever built, with an anticipated energy generating capacity of 22.5 GW per year. Its construction has required the relocation of 1.5 million people, and has major impact on the ecology of the surrounding areas.
1.2.6 Solar Energy
Solar energy refers to energy from the sun, in the form of either heat or light. Heat can be captured by black bodies, for example water-filled tanks or pipes that are placed on a roof top to warm water for showers and baths. Parabola-shaped mirrors can be used to focus solar radiation on an object placed inside the mirror so that it will heat up. This is an effective way to heat small amounts of water in remote (but sunny) locales. Photovoltaic cells are made of compounds that generate electrical current from the photons they capture. Well-known applications of photovoltaics are the solar panels on satellites in space, and, closer to home, pocket calculators. One concern about the use of solar energy is that it cannot be generated during the night,
8 Vermerris and that on cloudy days it is inefficient at best. Future applications may also involve heating trapped air, and forcing it through a turbine as it rises. Regardless of the exact application, the key to the successful use of solar energy is storage. The batteries needed to power a residential home during the night would have to be very large and would therefore be expensive. Consider, for example, that the batteries used to keep computers and other sensitive equipment operating for 10–30 m during a power blackout cost US$200–500. The most attractive solution that would address the solar energy storage concerns involves sending excess electricity generated from solar energy into the existing power grid. This will require electricity meters that can keep track of electricity generation versus consumption. Such meters are currently in development, but it will take time before the electricity infrastructure is fully adapted to accommodate photovoltaics. The price of photovoltaics has come down considerably, which is expected to boost their more widespread adoption.
1.2.7 Wind Energy
Wind energy can be converted to electricity with the use of a wind-propelled turbine. Wind energy works best in locations that are known to be windy throughout the entire year, which generally means locations near or in a sea. For example, windmills have become a common site in Germany and Denmark. Germany is the world leader in wind energy generation, with a 22-GW capacity, supplying 6% of its electricity in 2007. Denmark supplies 20% of its electricity with wind energy (3.1-GW capacity in 2007). Wind energy in the U.S. has grown rapidly, with 16.8 GW of capacity in 2007 (GWEC 2008). Wind turbines are available in different designs, but the three-bladed vertical turbine is the most common. The efficiency of wind turbines increases with size. The largest wind turbines are 198 m tall, have a diameter of 126 m, and gener-ate 6 MW of power (www.enercon.de). In the ideal situation, the electricity gener-ated by wind turbines is fed directly into the electricity grid, but the variable output as a result of unpredictable weather conditions makes projecting output somewhat challenging. Generation of wind energy does not contribute to greenhouse gas emis-sions. There is some resistance to wind energy, as a result of the perceived sight and noise ‘pollution’ resulting from large, and arguably unattractive, objects. There are also some concerns about the impact on wild life (birds, bats, and marine life in case wind turbines are placed in the sea). In most cases, the exact placement of the wind turbines can alleviate some of these concerns, and relative to the ecological impact of a typical conventional power plant, the ecological impact from wind turbines is small.
1.2.8 Tidal Energy
Tidal energy is most similar to hydroelectric power, in that it relies in the movement of water as a result of tidal movements. It can be used in places that do not have mountains, but that are located along a sea shore, and involves capturing the water with a barrage, which is a dam that holds the turbines. There are only about twenty sites in the world where tidal power stations could be built. This is a function of requiring a large enough difference in the water level between high and low tide, the

Why Bioenergy Makes Sense 9
total volume of water that passes through the barrage, and the feasibility of con-structing a barrage, which depends on access roads, ecological impact, and marine traffic considerations. Tidal energy shares with solar energy the drawback that the energy is generated only during part of the day. For tidal energy generation that amounts to approximately 10 h per day. The largest tidal power station in the world (240 MW) is in the Rance estuary in northern France. Marine current turbines represent an alternative means of generating energy from the flow of water. These turbines can be compared to underwater-windmills, and are driven by flowing water, either associated with the tide, or naturally occurring fast ocean currents. The impact on marine life is considered small, given that the turbines are stationary and rotate more slowly than the propellers of ships. Several companies are developing and marketing technology for tidal power generation.
1.2.9 Wave Energy
Wave energy is related to tidal energy in that it uses energy from the sea. Waves are generated by wind blowing over open water, especially along the shore line. The energy of oscillating water can be converted to electricity via a turbine. The first commercial operation based on wave energy is at the isle of Islay (UK). The device is called LIMPET (for Land Installed Marine Powered Energy Transformer), is made by the company Wavegen (www.wavegen.co.uk), and has a 500-kW capacity. As waves enter the chamber of the energy transformer, they raise the water level and compress air. The compressed air drives a turbine regardless of the direction of the airflow, so that the air that is pulled into the chamber as the water level goes down, also drives the turbine.
1.2.10 Geothermal Energy
Geothermal energy is based on the release of heat from the Earth’s mantle in places where the mantle is not very thick. This typically means places with volcanic activity or geysers. Iceland is a country that uses geothermal energy to generate hot water to heat houses. The water is pumped through pipes that are connected to hot water radiators inside the house. An alternative option to capture this energy is to pump water down into a hot region underground, let it get heated up, and then pump up the hot water or capture the steam. The steam can be used to drive a steam turbine con-nected to an electric generator. While geothermal energy is clean and convenient, only a few places in the world have easy access to this source of energy.
1.2.11 Bioenergy
Bioenergy refers to energy produced from biological materials, specifically photo-synthetic organisms. Photosynthesis is the process that green plants and algae use to convert solar energy into chemical energy (Section 1.3). Photosynthesis relies on the synthesis of sugars from atmospheric CO2 and water (H2O) from the soil (terrestrial plants) or the surrounding water (aquatic plants and algae). The chemical building blocks can be used in the organism’s metabolism, either for growth or for oxidation

10 Vermerris (energy production). When plants or algae are harvested and processed, the energy stored in the chemical bonds can be released and converted to other forms of energy, as discussed below. During this process, CO2 is released, but unlike the burning of fossil fuels, the use of bioenergy does not contribute to a net emission of CO2, be-cause the carbon was only recently fixed. The production of bioenergy, however, does result in CO2 emissions during harvesting, transportation and processing of the feedstocks (see also Section 1.7). The oldest use of bioenergy is the burning of wood or other plant biomass to heat and light caves, and later on huts and houses. In many developing countries, this use of bioenergy supplies 35–70% of the energy (Sims et al. 2006). This process can be used more efficiently on a large scale in the form of co-generation, which refers to the use of plant biomass in facilities that also use coal. This will be discussed in more detail in Chapters 9 and 13–15. In the U.S., this is currently the most common use of bioenergy, representing 54% of the bioenergy used. Bioenergy is currently the only alternative energy source able to conveniently supply liquid transportation fuels. This can be achieved in several different ways. Plants can be used as a source of fermentable sugars for the production of ethanol or, depending on the choice of the microbial strain used for fermentation, other low-molecular weight alcohols. These alcohols can be used as fuels for internal combus-tion engines. The ethanol is blended with gasoline. E10 and E85 are fuels that consist of 10% and 85% ethanol, respectively. The higher-percentage ethanol blends require the use of specialized engines, nowadays common in so-called flexible fuel vehicles or FFV’s. These vehicles contain parts that are less prone to corrosion. Furthermore, the air : fuel ratio is automatically optimized for the fuel that is in the tank. The fermentable sugars needed for the production of ethanol can be obtained from soluble sugars in the juice of sweet sorghums (Chapter 8), sugar cane (Chapter 9), or crops such as sugar beets or sweet potatoes. The fermentable sugars can also be generated via hydrolysis of starch from maize, sorghum or wheat grain (Chapter 3), or from the hydrolysis of cellulose and hemicellulose present in the plant cell wall. Ethanol derived from cell walls is referred to as cellulosic ethanol (Chapters 6–15). An alternative method for the production of liquid fuels is through the use of syngas obtained from gasifying plant biomass, resulting in a mixture of primarily hydrogen (H2), carbon monoxide (CO), CO2, water, and light hydrocarbons. The exact ratios depend on temperature, pressure, and the use of air, oxygen and steam (Hamelinck and Faaij 2006). Various (low-molecular weight) compounds, including methanol and ethanol, can be produced from syngas with the use of chemical cata-lysts. Lipids derived from algae (Thomas-Hall et al. 2008), as well as oils derived from oil crops (e.g. canola, soybeans, castor beans, sunflower, oil palms) and processed vegetable oil from the food industry (Murugesan et al. 2008), can be used as a feed-stock for the production of biodiesel. Oils and lipids are esters of glycerol and three or two fatty acids, respectively. In lipids, the third fatty acid chain is substituted by a phosphate group. The processing of oils and lipids to biodiesel involves trans-esterification using a base catalyst and a low-molecular weight alcohol (methanol or ethanol). In commercial processes, the base catalyst is methoxide (CH3O−), generated

Why Bioenergy Makes Sense 11
by dissolving sodium hydroxide or potassium hydroxide in methanol. This process results in the formation of glycerol, and methyl esters of fatty acids (or ethyl esters if ethanol is used) that can be used as a substitute for or additive to petroleum-based diesel fuel. A detailed description of biodiesel production is provided by Van Gerpen (2006). A third use of plant biomass is the generation of electricity via fuel cells. Fuels cells generate electricity from coupled oxidation and reduction reactions that occur in separate compartments. Ethanol (Minteer 2006) or methanol (Dunwoody et al. 2006) produced from fermentation or chemical catalysis can be fed into the anode (negative pole) of a fuel cell, while air or oxygen are fed into the cathode (positive pole). Elec-trolysis on the surface of a catalyst layer in the anode of the fuel cell oxidizes the ethanol or methanol to CO2 and H2O. The electrons that are generated during the oxidation are used to reduce oxygen at the cathode, resulting in the formation of H2O. An electric current is generated as a result of this process, and this electricity can be used to power electric motors for automotive or stationary purposes. The cathode and anode in the fuel cell are separated by a membrane that allows small ions (e.g. protons, hydroxide ions) to pass, so that the net charge of the system is zero. A challenge with fuel cell technology is that the membranes are often some-what permeable to the alcohol fuels, which reduces efficiency. While ethanol has a higher energy density for applications in fuel cells, the oxidation of ethanol is not as efficient as the oxidation of methanol. In order for this technology to become eco-nomically feasible, the chemical catalysts and the composition of the membranes need to be optimized. The ultimate fuel cell technology is based on the use of hydrogen instead of alco-hols to generate the electrons needed to reduce oxygen. The use of hydrogen as a fuel for automobiles would then generate water as the only emission. Several car manufacturers have developed prototypes that can run on hydrogen fuel cells. Unfor-tunately, few hydrogen ‘gas stations’ exist yet and safe hydrogen storage technology requires further development. The production of hydrogen from water is not yet practically feasible, in part because of the high cost of photovoltaics. Hydrogen pro-duced via catalytic steam-reforming of ethanol produced from biomass has been proposed as an alternative to electrolysis of water (Ramírez de la Piscina and Homs 2006), but this process has to be streamlined to reduce energy input requirements. While many alternative energy sources exist, and while research efforts are likely to improve their efficiency and reduce their cost of production, only bioenergy is currently able to conveniently supply liquid transportation fuels that are compatible with the existing fleet of motor vehicles. Therefore, given that oil supplies 38% of global energy (Table 1.1), and that the majority of this oil is used for transportation, bioenergy has the potential to have a large contribution towards energy needs in the immediate future. The next section describes how photosynthetic organisms convert sun light to into chemical energy; it can be easily skipped by those readers interested in the more general energy discussion, which continues in Section 1.4 with the reasons for ex-ploring alternative energy sources.

12 Vermerris 1.3 Photosynthesis: Capturing Solar Energy in Chemical Bonds
Photosynthesis is the process by which plants and algae capture light energy from the sun to fix carbon dioxide (CO2) used to generate sugars, which then form the build-ing blocks for many metabolites. Photosynthesis includes two distinct processes. The first step is the generation of the energy and reducing power. This is achieved with the use of photosystem I and photosystem II in the thylakoid membranes of the chloroplast, the organelle present in green plant tissues and algae. The photosystems rely on the pigment chlorophyll to generate electrons when light energy is absorbed. The electrons are used to generate energy in the form of ATP (adenosine triphos-phate; see Fig. 2.1), and reducing power in the form of NAD(P)H (nicotinamide adenine dinucleotide (phosphate)). A good description of how the photosystems function is provided by Malkin and Niyogi (2000) and will not be discussed as part of this chapter. The second step in photosynthesis is CO2 fixation, which involves a series of biochemical reactions. The two most common mechanisms to fix carbon are C3 and C4 photosynthesis. In C3 photosynthesis the CO2 reacts with a three-carbon molecule as the first step towards the synthesis of sugars, whereas in C4 photosynthesis the CO2 reacts with a four-carbon molecule. The processes of C3 and C4 photosynthesis are schematically represented in Figs. 1.1–1.4, and discussed in more detail below in order to provide the background information for the discussion on CO2 emissions in Section 1.4, as well as for several crop-specific chapters in the second part of the book. For the sake of being complete, a third mechanism for photosynthesis is Cras-sulacean acid metabolism (CAM), which is employed by cactuses and succulents in desert environments. Since those plants are not (widely) used for the production of bioenergy, CAM will not be discussed in this chapter.
1.3.1 C3 Photosynthesis
The C3 carbon fixation cycle is also referred to as the Calvin cycle. The reactions of the Calvin cycle take place in the chloroplast and are described in detail by Malkin and Niyogi (2000). The Calvin cycle consists of 13 steps that can be grouped in three phases: a car-boxylation phase, a reduction phase, and regeneration phase, schematically repre-sented in Fig. 1.1. The carboxylation phase is represented by the first reaction, in-volving CO2 and ribulose 1,5-bisphosphate (RuBP; 1.1). The resulting six-carbon product, 2'-carboxy-3-keto-D-arabinitol-1,5-bisphosphate, is unstable and is cleaved immediately in two molecules 3-phosphoglycerate (3-PGA; 1.2). The enzyme Rubisco (ribulose 1,5-bisphosphate carboxylase oxygenase), arguably the most abundant protein on Earth, catalyzes the reaction of CO2 with RuBP. In plants this enzyme consists of eight large (L) and eight small (S) subunits, with molecular weights of 56 kDa and 14 kDa, respectively. In most plants, the L subunit is encoded by a chloroplast gene, whereas the S subunit is encoded by a nuclear gene. After translation (see Chapter 2), the S subunit is transported from the cytosol into the chloroplast. The catalytic domain of Rubisco is located in the large subunit.

Why Bioenergy Makes Sense 13
OH
PO
O
O
OH
OP
OPO
OHO
PO
OPO
OH
1.1
1.13
1.12
1.11
1.10
1.6
1.5
1.4
1.3
1.2
3 CO23 H2O
6 ATP
6 ADP
6 NADPH
6 NADP
3x
1x
6x
6x
6x
1x 1.4
1x 1.4
1x 1.4
OPO
OH
1x 1.4
1.5
H 2OP i
3 ATP 3 ADP
CH2O-P
O
HHO
OHH
OHH
CH2O-P
CH2OH
O
HHO
OHH
OHH
CH2O-P
CH2O-P
O
HHO
OHH
OHH
CH2O-P
H2OPi
OHH CHO
OHH
OHH
CH2O-P
CH2O-P
O
HHO
OHH
OHH
CH2O-P
OHH
CHO
O
OHH
OHH
CH2O-P
CH2O-P
O
OHH
OHH
CH2O-P
CHO
OH
OHH
OHH
CH2O-P
H
CH2OH
O
HHO
OHH
CH2O-P
CHO
O
OHH
OHH
CH2O-P
CH2OH
O
HHO
OHH
CH2O-P
1x
1x 1.4
1.71x
1.81x
1.91x
1x
1x
1.9*1x
1x
1x
1.132x
1.4*
1.51.61.7
Glucose-6-phosphate
Glucose-1-phosphateUDP-Glucose
Sucrose
Fructose
GlucoseOR
StarchCell Wall Polysaccharides
Fig. 1.1. Schematic representation of the Calvin cycle and reactions that generate feedstocks for bioenergy production. Individual compounds are labeled with a bold number that matches the numbering in the text. The stoichiometry of the reactions is also indicated. For example, ‘3× 1.1’ means three molecules of ribulose 1,5-bisphosphate. Note that individual molecules of glyceraldehyde 3-phosphate (1.4) enter the cycle at several different points, indicated by ‘1× 1.4’. The glyceraldehyde 3-phosphate molecule labeled 1.4* is generated in a separate round of synthesis. P stands for phosphate. This figure is based on Malkin and Niyogi (2000).

14 Vermerris In order to balance the reactions of the Calvin cycle, it is easiest to consider the carboxylation reaction starting with three molecules of RuBP, that react with three molecules of CO2, resulting in six molecules 3-PGA. During the reductive phase, the six molecules 3-PGA are converted via two reactions into six molecules of glyceral-dehyde 3-phosphate (GAP; 1.4), with 1,3-bisphosphoglycerate (1.3) as intermediate. The enzymes involved in these two steps are phosphoglycerate kinase (PGK) and glyceraldehyde 3-phosphate dehydrogenase (G3PD). The phosphate residues re-quired for the PKG-catalyzed reaction are supplied by ATP (one ATP molecule per 3-PGA molecule). The G3PD-catalyzed reduction requires the use of one NADPH molecule per molecule 1,3-bisphosphoglycerate. The regeneration phase consists of 10 steps and ultimately results in the synthe-sis of three RuBP molecules from five of the six GAP molecules generated via the carboxylation and reduction phases. The remaining GAP molecule is used in meta-bolic reactions outside of the Calvin cycle. Five of the six GAP molecules are used consecutively in a series of reactions that start with the isomerization of GAP to dihydroxyacetone phosphate (DHAP; 1.5), catalyzed by triose phosphate isomerase (TPI). An aldolase generates fructose 1,6-bisphosphate (1.6) from DHAP and a sec-ond GAP molecule. Removal of a phosphate residue, catalyzed by fructose-1,6-bisphosphatase, results in the formation of fructose 6-phosphate (1.7). Fructose 6-phosphate, reacts with the third GAP molecule. The resulting nine-carbon sugar is cleaved into a four-carbon sugar, erythrose 4-phosphate (1.8), and a five-carbon sugar, xylulose 5-phosphate (1.9). This reaction is catalyzed by a transketolase. The erythose 4-phosphate reacts with DHAP, formed from the third GAP by the enzyme TPI, to form sedoheptulose 1,7-bisphosphate (1.10). Removal of one phosphate group by sedoheptulose-1,7-bisphosphatase results in the formation of sedoheptulose 7-phosphate (1.11). This seven-carbon sugar reacts with the fourth GAP molecule. The resulting ten-carbon sugar is cleaved by a transketolase resulting in the forma-tion of ribose 5-phosphate (1.12) and xylulose 5-phosphate (1.9*). This xylulose 5-phosphate molecule and the one generated from the reaction of fructose 6-phosphate with GAP (number 3) are converted to ribulose 5-phosphate (1.13) by phosphopen-tose epimerase. Ribose 5-phosphate (1.12) is also converted to ribulose 5-phosphate (1.13) by phosphopentose isomerase. The three ribulose 5-phosphate molecules are then converted to ribulose 1,5-bisphosphate (1.1) by the enzyme phospho-ribulokinase with the use of three ATP molecules, and this completes the cycle.
1.3.2 C4 Photosynthesis
C4 photosynthesis is common in grasses adapted to (sub)tropical climates, including the monocot species maize (Zea mays L.), sorghum (Sorghum bicolor (L) Moench;), sugar cane (Saccharum spp.), Miscanthus and switchgrass (Panicum virgatum L.). In contrast, rice (Oryza sativa L.), also a grass, is a C3 plant. Amaranth (Amaranthus spp.) is an example of a dicot plant that uses C4 photosynthesis. The higher temperatures in the (sub)tropical climates have two consequences: 1) the oxygenase activity of Rubisco starts to dominate over the carboxylation reaction, making photosynthesis less effective, and 2) there is a greater differential in humidity between the leaf and the surrounding air. As a consequence, when the stomata are

Why Bioenergy Makes Sense 15
open in order to allow CO2 uptake, water vapor from inside the leaf tends to go out. This can then lead to dehydration and drought stress. The distinguishing feature of C4 photosynthesis is that CO2 and water exchange are independent, because they are physically separated from each other. In the spe-cies listed above, this is achieved by the so-called Kranz anatomy (‘Kranz’ is Ger-man for crown), in which bundle sheath cells surround the vascular tissue in the leaf, and mesophyll cells surround the bundle sheath cells. CO2 is first concentrated in mesophyll cells, where it reacts with water to form bicarbonate (HCO3
–), which then reacts with phosphoenolpyruvate (1.14) to form the four-carbon acid (hence C4) oxaloacetate (1.15). Depending on the species, oxaloacetate is converted to either malate or aspartate, and it is this compound that is transported into a neighboring bundle sheath cell. In the bundle sheath cell, the four-carbon acid is decarboxylated. The CO2 that is regenerated during this reaction is fed into the Calvin cycle, as de-scribed in Section 1.3.1, whereas the C3 acid that remains is recycled: it goes back to the mesophyll cell where it can react with another bicarbonate molecule. The physi-cal location of the bundle sheath cells results in reduced oxygen levels, minimizing the photorespiration activity of Rubisco. Some C4 species do not have the Kranz anatomy, but have instead separated CO2 concentration (in vacuoles) from photosyn-thesis (in the chloroplast). There are three main variants of the C4 pathway that appear to have arisen inde-pendently during the course of evolution (reviewed by Osborne and Beerling (2006)). These variants are named after the bundle sheath enzymes that release the CO2, and are therefore referred to as NADP+-malic enzyme, NAD+-malic enzyme and PEP carboxykinase C4 photosynthesis, with the C4 acid being malate, aspartate and aspartate, respectively. The differences between these three variants of C4 photo-synthesis are described below and displayed in Figs. 1.2–1.4.
1.3.2.1 The NADP+-Malic Enzyme Variant
In this variant, present in maize (Chapter 7), sorghum (Chapter 8), sugar cane (Chap-ter 9), and Miscanthus (Chapter 10), and displayed schematically in Fig. 1.2, the cytosolic enzyme PEP carboxylase in the mesophyll cell catalyzes the reaction of bicarbonate and phosphenolpyruvate (1.14). The resulting oxaloacetate (1.15) is reduced to malate (1.16) by the chloroplast enzyme NADP+-malate dehydrogenase. Malate is then transported into the chloroplast of the neighboring bundle sheath cell where it is reduced to pyruvate (1.17) by NADP+-malic enzyme, with release of CO2. The CO2 is fed into the Calvin cycle, and the pyruvate is transported to the chloro-plast of the mesophyll cell, where it is converted to phosphoenolpyruvate by pyru-vate-orthophosphate dikinase (PPDK). Phosphoenolpyruvate is then exported to the cytosol, where it can react again with bicarbonate.

16 Vermerris
PO
O O
O
OO
O O
HO
OO
O O
O
O O
HO
OO
O O
O
O O
NADPH NADP+NADP+
NADPH
ATPPi
AMPPPi
CO2Calvincycle
PO
O O
cp cp
bundle sheath cellmesophyll cell
1.15
1.14 1.14 1.17 1.17
1.161.16
CO2 HCO3-
Pi
Fig. 1.2. Schematic representation of the NADP+-malic enzyme variant of C4 photosynthesis. The chloroplast (cp) is indicated by the dotted line. The cell wall separating mesophyll and bundle sheath cell by the double solid lines. Solid arrows represent reactions, dotted arrows transport.
1.3.2.2 The NAD+-Malic Enzyme Variant
This variant, present in millets (Pennisetum spp.), and displayed schematically in Fig. 1.3, starts out the same way as described above for the NADP+-malic enzyme variant, but the oxaloacetate (1.15) is not converted to malate (1.16), but to aspartate (1.18) by the enzyme aspartate aminotransferase. The amino group is donated via a coupled reaction in which glutamate (1.19) is converted to α-ketoglutarate (1.20). Aspartate is then transported to the mitochondrion of the bundle sheath cell, where it is converted to oxaloacetate (1.15), malate (1.16) and pyruvate (1.17) and CO2. The conversion of aspartate to oxaloacetate is also catalyzed by aspartate aminotrans-ferase, but in this case the amino group is transferred from aspartate to α-ketoglutarate (1.20*). The conversion from oxaloacetate to malate is catalyzed by a mitochondrial NADP+-malate dehydrogenase, and the conversion of malate to pyru-vate and CO2 is carried out by NAD+-malic enzyme. The CO2 is transferred to the chloroplast, where it enters the Calvin cycle, and the pyruvate is converted to alanine (1.21) by the enzyme alanine aminotransferase. This reaction involves transfer of the amino group from glutamate (1.19*), leading to the formation of α-ketoglutarate (1.20*). Alanine is transported to the mesophyll cell where it gets taken up by the chloroplast, converted back to pyruvate by alanine aminotransferase, and the pyruvate is converted to phosphoenolpyruvate by PPDK. The phosphoenolpyruvate is then exported to the cytosol, where it can react with another bicarbonate molecule.

Why Bioenergy Makes Sense 17
PO
O O
O
OO
O O
NH3
OO
O O
NH3
OO
O O
O
OO
O O
HO
OO
O O
O
O O
NH3
O O
O
O O
NH2
O
O
O O
NH3
O O
O O
O
O
O
PO
O O
NADP+
NADPH
CO2
Calvincycle
ATPPi
AMPPPi
bundle sheath cellmesophyll cell
NADH NAD+
cpcp
mt
1.15
1.14
1.18 1.18 1.15
1.161.17
1.211.211.171.14
1.19 1.20
1.19*
1.20*
CO2 HCO3-
Pi
1.20* 1.19*
Fig. 1.3. Schematic representation of the NAD+-malic enzyme variant of C4 photosynthesis. The chloroplast (cp) and mitochondrion (mt) are indicated by the dotted lines. The cell wall separating mesophyll and bundle sheath cell by the double solid lines. The numbering of compounds is consistent with Fig. 1.2. Solid arrows represent reactions, dotted arrows trans-port.
1.3.2.3 The Phosphoenolpyruvate Carboxykinase Variant
This variant, present in switchgrass (Chapter 11), and displayed schematically in Fig. 1.4, is very similar to the NAD+-malic enzyme type described above, but the aspar-tate (1.18) is converted back to oxaloacetate (1.15) in the cytosol of the bundle sheath cell. Oxaloacetate is then converted to phosphoenolpyruvate (1.14) by phos-phoenolpyruvate carboxykinase. The CO2 that is released is transported to the chloroplast of the bundle sheath cell, and the phosphoenolpyruvate is returned to the cytosol of the mesophyll cell where it can react with another bicarbonate molecule. In this variant, there is an additional CO2-generating reaction in the mitochon-drion of the bundle sheath cell. This reaction involves the oxidation of malate (1.16; generated from oxaloacetate in the mesophyll cell’s chloroplast) to pyruvate (1.17*). The pyruvate is subsequently converted alanine (1.21), which is transferred to the mesophyll cell, converted back to pyruvate (1.17) and phosphoenolpyruvate (1.14), the same way as described in Section 1.3.2.2. The oxidation of malate generates NADH, and through an electron transfer reaction, ATP can be generated. This ATP can be used for the carboxykinase reaction that is used to generate phosphenolpyruvate.

18 Vermerris So this second reaction may exist in order to supply the ATP needed for the main reaction.
PO
O O
O
OO
O O
NH3
OO
O O
NH3
OO
O O
O
OO
O O
HO
OO
O O
O
O O
NH3
O O
O
O O
NH3
O O
PO
O OCO2 HCO3
-
ADP
ATP
CO2
Calvincycle
bundle sheath cellmesophyll cell
NADHNAD+
cp
cp mt
1.15
1.14
1.18 1.18 1.15
1.16
1.17*
1.211.21
1.171.14
1.20
1.19
PO
O O
1.14
O
OO
O O
1.15
HO
OO
O O
1.16
ATPPi
AMPPPi
CO2
1.19
1.20
1.19
1.20
ADPATPPi
NADH NAD+
Fig. 1.4. Schematic representation of the phosphoenolpyruvate carboxykinase of C4 photosyn-thesis. The chloroplast (cp) and mitochondrion (mt) are indicated by the dotted lines. The cell wall separating mesophyll and bundle sheath cell by the double solid lines. The numbering of compounds is consistent with Figs. 1.2 and 1.3. Solid arrows represent reactions, dotted ar-rows transport.
1.3.2.4 Biosynthesis of Biofuel Feedstocks from Photosynthate
Photosynthesis results in the formation of sugars that provide the building blocks for many different metabolites in the plant, as represented in Fig. 1.1. The glyceralde-hyde 3-phosphate (1.4) molecule that is shunted away from the Calvin cycle can form fructose 6-phosphate (Fru-6-P; 1.6) after conversion to DHAP (1.5) and reac-tion with a second molecule 1.4* generated during the next round of the Calvin cy-cle. Fru-6-P can be converted to glucose 6-phosphate (Glc-6-P) by glucose 6-phosphate isomerase, which in turn can be converted to glucose 1-phosphate (Glc-1-P) by phosphoglucomutase. The plant can synthesize starch (Chapter 3) from poly-

Why Bioenergy Makes Sense 19
merization of ADP-glucose (ADP-Glc) generated from Glc-1-P by ADP-Glc pyro-phosphorylase. Glucose-1-P can also be converted to the nucleotide sugar UDP-glucose (UDP-Glc) by the enzyme UDP-Glc pyrophosphorylase. UDP-Glc is the precurors of cellulose and several other nucleotide sugars that can ultimately get incorporated in cell wall polysaccharides (Chapter 4). Sucrose, the major carbohy-drate source in sweet sorghum (Chapter 8) and sugar cane (Chapter 9), is formed from either Glc-1-P and fructose by the enzyme sucrose synthase, or from glucose and fructose by the enzyme invertase. A detailed description of these reactions is provided by Dennis and Blakeley (2000). Fatty acids used for the production of biodiesel are synthesized from the photosynthesis intermediate 3-phosphoglycerate (1.2 – Fig. 1.1), which gets converted to pyruvate (1.17) and ultimately to acetyl-Coenzyme A. This is described in detail by Somerville et al. (2000).
1.4 Alternative Energy to Meet Future Global Energy Needs
As was evident from the presentation of different energy sources (Section 1.2), fossil fuels are finite resources that will eventually be used up. So the main driving force behind the development of alternative energy sources is – or should be – the combi-nation of global population growth and increasing standard of living. But there are additional reasons for exploring alternative energy that make this a more pressing issue than would be warranted solely based on available reserves. The main reasons for expediting the development of alternative energy are related to the climate, en-ergy security, and national economies – in that order.
1.4.1 Reducing Global Carbon Emissions
The atmosphere surrounding Earth consists largely of nitrogen (78%) and oxygen (21%), but contains small amounts of other gases, including argon (Ar), neon (Ne), helium (He), hydrogen (H2), water vapor, CO2, CH4, nitrous oxide (NO2), ozone (O3) and man-made halogenated compounds (chlorocarbons, chlorofluorocarbons, hydro-fluorocarbons). Among the gases listed above, CO2, CH4, NO2, O3, and the halo-genated compounds are called greenhouse gases, because they retain a portion of the heat from both the incoming solar radiation and from the radiation reflected from Earth’s surface. Greenhouse gases absorb and emit energy in the form of infrared (IR) light. The wavelength of IR light is between 800 and 10,000 nm (visible light is in the 400–800 nm range). The stretch- and bend vibrations of molecular bonds are associated with different energy levels. If we represent a molecular bond as a spring between two balls (represented the atoms), it is easy to imagine that it costs energy to extend or bend the spring, whereas (some of) this energy is released as the spring returns to its relaxed state. In the case of molecular bonds, the energy transition associated with different vibrations is equal to the energy of photons in the infrared range of the spectrum. The exact energy can be calculated with Formula 1.1:

20 Vermerris
Where h = Planck’s constant [6.626 ×10⁻³⁴ J s] c = speed of light (3 × 10⁸ m s–1) λ = wavelength [m] ν = frequency [s–1] The energy that is absorbed by the molecule can be emitted in the form of pho-tons, or passed on to other molecules via collisions, increasing their kinetic energy, and thus raising the temperature. While the term ‘greenhouse gases’ generally has a negative connotation, it is important to realize that their presence in Earth’s atmos-phere has enabled the existence of life as we know it, by raising the temperature 34°C above what would be the normal surface temperature purely based on the posi-tion of Earth in the solar system (–19°C).
Fig. 1.5. Annual global CO2 emissions in the period 1800-2004. One Gt (Gigatonne) equals 1012 kg. Data from EIA.
In the discussion about greenhouse gases, CO2 generally draws most of the atten-tion, because it is the most abundant greenhouse gas (63%), and the greenhouse gas with the fastest rising concentration, even though methane is more effective at trap-ping heat. Historically, there has been a very good correlation between surface tem-perature and CO2 levels in the atmosphere. This has been established through direct measurements in the recent past, whereas analysis of ice cores at the polar regions
cE = h (1.1) λ = hν
has provided clues about the climate in the more distant past (Marland et al. 2007).

Why Bioenergy Makes Sense 21
The Industrial Revolution, which started around 1850 as a result of the large-scale use of coal to power steam engines, and which later led to the development of the internal combustion engine, initiated a steady rise in the amount of energy used per capita. This reflected an overall change in society which, in addition to increased mobility, also led to advances in science, medical technology, and farming practices. As a consequence, the global population started to grow rapidly, while at the same time the standard of living increased. The overall effect of the combined effects of population growth and increasing standards of living is that CO2 emissions have rapidly increased since 1850 (Fig. 1.5), raising the CO2 concentration from 280 ppm prior to the Industrial Revo-lution to 380 ppm in 2005 (Raupach et al. 2007). Consistent with the historically tight correlation between CO2 levels in the atmosphere and surface temperature, this has resulted in an increase in the average surface temperatures on Earth. This effect is referred to as global warming. A more accurate term is global climate change, because it reflects the fact that not all places on Earth experience warming, and also captures changes in precipitation that results from the change in temperature. The International Panel on Climate Change (IPCC) is an organization operating under auspices of the United Nations (UN) that has monitored changes in patterns of precipitation, surface temperature (both land and sea), size and movement of gla-ciers, and size of the polar ice caps. The data are collected and interpreted by scien-tists from differnt disciplines, and IPCC reports are distributed to governments through political channels. The most recent report, prepared by Working Group II was released in April 2007 (Adger et al. 2007). The technical summary of this report includes the following statements: ‘It is likely that anthropogenic warming has had a discernible influence on many physical and biological systems. Impacts due to al-tered frequencies and intensities of extreme weather, climate and sea-level events are very likely to change. Some large-scale climate events have the potential to cause very large impacts, especially after the 21st century. Iimpacts of climate change will vary regionally but, aggregated and discounted to the present, they are very likely to impose net annual costs which will increase over time as global temperatures in-crease.’ It is clear that these statements reflect a certain degree of uncertainty, exac-erbated by political influences on the discussions, but that there is, nonetheless, rea-son for serious concern. The potential consequences of global climate change have been the subject of the book and movie ‘An Inconvenient Truth’ by former U.S. Vice-President Al Gore (Gore 2006), who, together with the IPCC, received the 2007 Nobel peace prize. Gore and the IPCC describe the changes that are occurring and that are likely to occur as the climate changes, including enhanced rates of melting of polar ice in the arctic zone (Arctic Ocean and ice coverage on Greenland) and ice sheets in Antar-tica, higher sea levels as a result of melting polar ice and expansion of water due to higher temperatures, the potential for more frequent and more severe hurri-canes/typhoons across the Atlantic and Pacific Oceans as a result of warmer sea-water, less precipitation in areas that are already arid or semi-arid (the southwestern United States, southern and western Australia, southern Africa, northeastern Brazil), less snow on mountain tops and more precipitation in the form of rain, and receding glaciers, resulting in changes in seasonal water levels of snow-fed rivers. In addition,

22 Vermerris the higher CO2 levels in the atmosphere will result in higher levels of carbonic acid (H2CO3) in the oceans, and therefore in acidification of the oceans and seas. The full consequences of these changes in the ecosystem on human societies are not easy to predict, but scenarios include flooding of low areas, more damage from storms, and shifts in climate zones that will affect agricultural production. This is a result of a combined impact of altered precipitation, changes in temperature, and the occurrence of pests and pathogens that were normally not of concern. Diseases af-fecting humans may also spread beyond their current boundaries. The acidification of the oceans will impact marine life in ways that are hard to predict because of the still limited understanding of this ecosystem. It is also likely that terrestrial and ma-rine species will become extinct as their habitats change. As a result of the efforts by IPCC, Al Gore, and many other organizations study-ing the climate, global climate change is now widely accepted as a human-induced phenomenon, as opposed to it ‘merely’ being a consequence of variation in the shape of Earth’s orbit around the sun or from variation in the position of Earth’s axis of rotation. This has stimulated discussions on how to mitigate climate change, includ-ing the Kyoto Protocol. The Kyoto Protocol is a series of agreements among 174 nations aimed at reduc-ing greenhouse gas emissions. The name of this protocol reflects the location of the 3rd Conference of the Parties held on 11 December 1997 where the protocol was first formulated under the United Nations Framework Convention on Climate Change (UNFCCC). Formal activation of the Kyoto Protocol required the participa-tion of at least 55 nations that together were responsible for more than 55% of global CO2 emissions. This was achieved on 16 February 2005. Countries that have signed and ratified the Kyoto Protocol fall in two classes – the developed countries (36, plus the European Union as its own entity) and the developing countries (137) – with each class agreeing to a different set of targets. As of January 2008, and running through 2012, developing countries have to reduce their greenhouse gas emissions by a collective average of 5.2% below their 1990 levels. The fact that the reduction is a collective average means that variation in greenhouse gas reductions among different countries is expected and accommodated. The developing countries monitor and report their emissions, but have no obligation to reduce emissions. When devel-oping countries, however, deploy clean technologies, they get carbon credits that they can trade. This mechanism is meant to act as an incentive for developing coun-tries to invest in clean technologies. The expectation is that execution of the Kyoto Protocol results in the deployment of new technologies that help reduce greenhouse gas emissions. If this is considered too costly, or if a country had already invested heavily in clean technology prior to 1990 (such as Japan), a trade system allows countries that produce excess CO2 to buy carbon credits from countries that produce less CO2 than they are allowed under the Kyoto Protocol. The carbon credits can be bought from one of several financial ex-changes. In addition, a country can get credits for investing in projects which reduce emissions in developing countries under the so-called Clean Development Mecha-nism (CDM), or for investing in a project that reduces emissions in another devel-oped country under the Joint Implementation (JI) provision. Non-compliance to the Kyoto Protocol targets requires a country to make up the difference between actual

Why Bioenergy Makes Sense 23
and targeted reductions, plus an additional 30%. This is essentially a financial pen-alty. In December 2007, the ‘Bali roadmap’ was developed during the Conference of the Parties to the UNFCCC and the Meeting of the Parties of the Kyoto Protocol, in an attempt to extend the Kyoto Protocol beyond 2012. There is considerable concern over the fact that global greenhouse gas emissions turned out to be higher than esti-mated in the 1990’s, due to higher than anticipated growth rates in developing coun-tries (Raupach et al. 2007). The effectiveness of the Kyoto Protocol is debatable. One major issue is that the United States, the world’s largest contributor to greenhouse gas emissions, has signed, but not ratified the agreement. One of the reasons behind this decision is the fact that China, as the (currently) second largest producer of greenhouse gas emis-sions, is considered a developing country, and as such not required to reduce emis-sions. The same applies to India. As a consequence, the view of the U.S. government is that the costs associated with implementation of the Kyoto Protocol would repre-sent an unfair economic disadvantage. The lack of participation of the U.S. combined with China’s and India’s lack of obligation then raises the question if global emis-sions can actually be curbed by implementing the Kyoto Protocol, and even if they could, if it is a cost-effective way of doing so. The challenge in answering these questions is that all forecasts have to be made based on ‘best-guess’ scenarios. Proponents of the Kyoto Protocol claim that as with most technologies, the initial commitment is the first step towards effective implementation at a more rapid pace than envisioned, as new and efficient technologies are developed. Examples include the development of a wave of new technologies that have their roots in the space programs that started in the 1960’s (computers, rechargeable batteries, satellite com-munication and navigation), the development of hybrid cars (discussed in more detail in Section 1.6), and high-throughput DNA sequencing technology as a result of the decision to sequence the human genome (discussed in Chapter 2). Some proponents argue that we simply cannot fathom the full scope of the changes that can result from global climate change, as a result of limited understanding of how the global ecosys-tem is balanced. It is unclear if disturbing the ecological balance will result in a re-balancing or in complete turmoil, but in either case, it is unclear what the timeframe would be – years, decades, or centuries. Some economic models argue in favor of implementation of the Kyoto Protocol. This includes the Stern Review (Stern 2006), a study on the economic impacts of climate change sponsored by the UK government. The conclusion of the Stern Re-view is that 1% of global gross domestic product (GDP) is required to be invested in order to mitigate the effects of climate change, whereas failure to do so has the risk of a recession worth up to 20% of global GDP. De Leo et al. (2004) also argued in favor of greenhouse gas reductions based on economic modeling. They claimed that the cost of implementing the Kyoto Protocol would be offset by associated benefits of improved human health, and by not having to spend money on rectifying damage to the environment and agricultural production systems that would result from global climate change. Opponents of the Kyoto protocol argue that the cost of implementation does not outweigh the benefits. In his book ‘Cool It’, author and self-proclaimed skeptical

24 Vermerris environmentalist Lomborg argues that the debate on global climate change is domi-nated by selective representation of the facts and irrational fears (Lomborg 2007). He argues that if we are, for example, concerned about damage caused by massive floods or hurricanes, exemplified by hurricane Katrina in New Orleans in 2005, it would be more effective, economical, and expedient to develop government policies that limit the construction of houses and office buildings in areas prone to flood, rather than to implement the Kyoto Protocol. Likewise, if we are concerned about the spread of diseases as climate zones shift, it is more effective to invest in pest control strategies. Lomborg (2007) argues that the cost-benefit ratio is much more favorable with modest reductions in CO2 emissions, and instead recommends significant in-vestments in the development and implementation of clean technologies, including bioenergy. Both sides accuse each other of being biased in their assumptions and analyses, and this debate is likely to continue for some time. Nonetheless, despite the dis-agreement on the best course of action, it is encouraging that global climate change is no longer an obscure topic, but instead part of global discussion. This will likely result in the willingness of societies across the globe to invest in methods to mitigate climate change, whether that is through the Kyoto Protocol, by supporting research on and development of alternative energy, or other efforts aimed at reducing emis-sions. 1.4.2 Political and Economic Motivations for Using Alternative Energy
In addition to concerns about the limited supplies of fossil fuels and the effect their use has on the global climate, use of alternative energy has the advantage of reducing the political and economic dependence on imported fossil fuels. The discussion that follows focuses on oil, as the primary source of liquid transportation fuels. In addi-tion, the geopolitical situation as it relates to oil is more complicated due to the more limited supplies (relative to coal) and the location of the reserves. In 2007, the United States, with a population of 295 million people, used 542 × 109 liter gasoline. This represents approximately 25% of the global oil consumption. The high fuel consumption reflects the large distances traveled by car, truck and airplane due to the large size of the country, the (on average) low population density, the high economic activity, and the limited availability of public transportation. Fur-thermore, the prices of automobiles and gasoline in the U.S. have historically been appreciably lower than in many other parts of the world, making cars with large engines but poor fuel economy feasible. Even though there are active oil fields in primarily Texas, Alaska and the Gulf of Mexico, together accounting for 0.3 × 10⁹ liter crude oil in 2006, the vast majority of the oil is imported. According to the EIA, a total of 587 × 109 liter crude oil was imported in 2006, with oil imports coming from Canada (18%), Mexico (15%), Saudi Arabia (14%), Venezuela (11%), and Nigeria (10%). The high fuel consumption combined with the realization that the country depends heavily on imported oil have made energy security a major priority in U.S. politics. The 25-member European Union (EU-25; 460 million people) uses 656 × 109
liter crude oil per year. This high level of oil consumption is a reflection of the large

Why Bioenergy Makes Sense 25
and overall affluent population. Per-capita gasoline consumption is lower than in the U.S. due to lower rates of car ownership, which is the result of the high tax on cars and fuels, adequate public transportation, and urban infrastructures that predate automobiles. A considerably amount of oil (17%) is available from EU (primarily Norwegian) oil fields in the North Sea, but the majority of the oil is imported from Russia (30%), Saudi Arabia (11%) and Libya (9%) (EC 2005). Japan, another indus-trialized nation (127 million people) imported 243 × 109 l crude oil in 2006 (IEA 2008). China is rapidly increasing its consumption of oil, at an annual rate of more than 10%. This is a reflection of China’s large population (1.3 billion people) combined with rapid economic growth. China relies in part on its own oil reserves. In 2007, China imported 142 × 109 l crude oil, representing approximately 50% of its total oil consumption. Approximately 16% of the imported oil came from Saudi Arabia. The International Energy Agency (IEA) calculated that in 2006, China and India (1 bil-lion people) consumed 8% and 4% of the world oil, respectively. These countries are projected to increase their use of oil in the future. In 2030 their use of world oil could be as high as 18% and 8%, respectively, but could be several percentage points lower, depending on policies governing population growth, economic development and energy use (IEA 2007). Without change in energy policy, by 2030 greenhouse gas emissions from China will be as high as the current emission of greenhouse gases from the whole world (Zeng et al. 2008). These data illustrate the dependence on imported oil, which has both economic and political consequences. The oil crisis of the 1970’s represents the classic exam-ple demonstrating the economic reliance on imported oil is. This crisis resulted from reduced oil exports by oil-producing countries organized in OPEC, and led to a world-wide recession. As global economies have grown since then, and have become even more dependent on international trade, an oil crisis similar to the one in the 1970’s would have an even bigger economic impact. The vast majority of oil reserves are in the Middle-East, a region not known for its political stability as illustrated by the ongoing conflicts in that region. Venezuela and Nigeria, two other major oil-producing countries, generate similar political con-cerns. As a consequence, being dependent on these countries for energy carries a certain risk. In their book ‘Zoom’, Carson and Vaitheeswaran (2007) also blame the political and military obligation of the U.S. to Saudi Arabia for the political power of oil. In 1945, King Ibn Saud of Saudi Arabia, then a largely undeveloped country, agreed to supply inexpensive oil to the U.S. and to allow U.S. military bases on its territory, in exchange for technology, investments, and military protection. The per-ception is that failure on the part of the U.S. to honor this commitment jeopardizes the availability of oil. It is not surprising that the current oil price – around US$100 per barrel (159 l) – is at a historic high after sharp increases since 2005. This is the result of higher de-mand, limited output, geopolitical tensions, and, to some extent, a weak U.S. dollar (the currency oil is traded in). If liquid transportation fuels would, however, be produced locally, that is, within the country or region where they are needed, and if that involved developing an industry that could produce and process the biological feedstocks and the supporting

26 Vermerris infrastructure, then the reduced political dependence would have the added benefit of stimulating local economies. This is referred to as the ‘bio-economy’. The Council for Agricultural Science and Technology (CAST) commentary entitled ‘Conver-gence of Agriculture and Energy’ (CAST 2006) summarizes the economic impact of ethanol plants on rural economies in the U.S: A (typical) 400-million liter ethanol plant represents an economic impact of close to US$600 million, assuming modest prices of both corn grain and ethanol. The profitability of ethanol production is a function of the price of the feedstock and the price of fossil fuels as well as processing and operation costs (McAloon et al. 2000; Shapouri and Gallagher 2005; Tyner and Taheripour 2007). Economic models have been developed to provide a life cycle analysis of biofuels, taking into account the various inputs and outputs of the production process. Two examples of such models are GREET (Greenhouse Gases, Regulated Emissions, and Energy Use in Transportation; Argonne National Laboratory 2007) and BESS (Biofuels Energy Systems Simulator; Liska et al. 2007). The outcome of models like this depends on the quality (accuracy) of the input data and the boundaries, in other words, where the line is drawn when considering the inputs. This will be discussed further in Sections 1.7.2 and 1.7.4. Fossil fuels play a role in the economics of biofuels, as they supply some of the energy needed to make biofuels, whereas high oil prices (and therefore gasoline prices) make biofuels more competitive as a transportation fuel. Ethanol has been subsidized in the U.S. since 1978 with a Volumetric Ethanol Excise Tax Credit (VEETC) that is currently US$0.13 l–1 (US$0.51 gallon–1), and varies other subsidies exist (Tyner 2007). These subsidies were initially meant to protect farm income, but are now seen as an incentive towards energy security and climate change mitigation. As biofuels start to gain economic importance, it may make sense to let market forces determine the price of ethanol. This has the risk that the ethanol industry col-lapses in case of a sharp decline in oil prices. Tyner (2007) outlined several policy alternatives that would ensure a stable biofuel industry in the long term.
1.5 Initiatives Around the World to Stimulate Bioenergy Production
Brazil is often mentioned as a success story in the discussion about biofuels, with an annual production of 21.3 × 10⁹ l ethanol from nearly half of the country’s sugar cane crop (see also Chapter 9). The use of ethanol as an alternative transportation fuel started during the oil crisis of the 1970’s, a time when the sugar industry was also struggling. This required heavy government subsidies, distributed through the PROALCOOL program, to provide low-interest loans to stimulate the ethanol indus-try and to lower the price of ethanol at the pump. In addition, the government man-dated that gasoline was blended with >22% ethanol (Hofstrand 2007). Brazil contin-ued to use ethanol when the oil prices came down in the 1980’s and 1990’s, resulting in Brazil becoming independent of foreign oil in 2005. Energy policy in the U.S. is set at the federal level by the President, the Secretar-ies (cabinet members) and Congress. Individual states can develop their own energy

Why Bioenergy Makes Sense 27
policies, with California being a well-known example of setting standards that often exceed federally mandated targets. Biofuels, especially ethanol, are receiving considerable attention because they can be used as liquid transportation fuels. Ethanol was introduced on a large scale as a replacement for the oxygenating (smog-reducing) agent methyl tertiary-butyl ether (MTBE), a ground-water pollutant, but is now promoted as an alternative fuel. In 2007, the U.S. produced 21 × 109 l ethanol (Renewable Fuels Association 2008; see also Chapter 3). The U.S. Department of Energy (U.S. DOE) and the U.S. Depart-ment of Agriculture (USDA) are currently the most involved in the development of bioenergy in general, and biofuels in particular. Several recent studies have shaped the research on bioenergy. In 2005, the USDA came out with what is referred to as ‘the billion ton study’ (Perlack et al. 2005), a report on the feasibility of producing 1.3 billion tons (1.2 × 10⁹ Mg) of dry biomass per year in order to meet the goal of replacing 25% of the gasoline with biofuels by 2025 (Smith et al. 2004), or 30% of the gasoline (based on 2004 consumption) by 2030 (U.S. DOE 2006). The latter initiative would require close to 200 × 109 l ethanol. According to Perlack et al. (2005), production of such a volume of biomass is feasible, but it will require large-scale production of bioenergy crops – selected based on regional soils and climates – and use of land currently not in production. The ‘roadmap’ published by U.S. DOE (2006) entitled ‘Breaking the Biological Barriers to Cellulosic Ethanol’ outlined technology development (plants and microbes) needed to enable biofuels to replace 30% of the gasoline by 2030. The most ambitious plan to increase ethanol produc-tion was proposed by President Bush in his State-of-the-Union address (Bush 2007): reducing gasoline consumption in the U.S. by 20% in 10 years. This would require the production of approximately 133 × 109 l ethanol by 2017, representing a five-fold increase relative to current production. Both the U.S. DOE and the USDA operate several research facilities. The two U.S. DOE research facilities with the strongest focus on bioenergy are the National Renewable Energy Laboratory (NREL) in Golden, CO (www.nrel.gov) and Oak Ridge National Laboratories (ORNL) in Oak Ridge, TN (www.ornl.gov). The Agri-cultural Research Service (ARS) of the USDA has many research sites across the country, often associated with large state universities. The USDA National Center for Utilization Research in Peoria, IL (www.ncaur.usda.gov) is focused heavily on biomass processing. In 2007, three national bioenergy research centers were funded by the U.S. DOE to carry out the research agenda outlined in the 2006 roadmap. The three centers are the DOE BioEnergy Science Center led by ORNL, the DOE Great Lakes Bioenergy Research Center led by the University of Wisconsin (Madison, WI), and the DOE Joint BioEnergy Institute led by Lawrence Berkeley National Laboratory (Berkeley, CA). All three centers have extensive collaborative arrange-ments with several other universities, national laboratories and companies. For fur-ther details see: http://www.science.doe.gov/News_Information/News_Room/2007/ Bioenergy_Research_Centers/index.htm. In addition, both the USDA and the U.S. DOE fund individual research programs in academic, government, and private labo-ratories that are focused on generating knowledge or development of new technolo-gies related to bioenergy production. The USDA and the U.S. DOE work together on formulating new research objectives in the Biomass Research and Development

28 Vermerris Initiative (BR&Di; http://www.brdisolutions.com/default.aspx). A technical advisory committee with representatives from private industry, government laboratories and academic institutions provides input and feedback on the research agenda. The National Aeronautics and Space Administration (NASA) has relied on alter-native energy for its spaceships since the inception of the space program in the 1960’s. The knowledge NASA developed may also be of use for alternative energy solutions on Earth, especially through NASA’s Glenn Research Center in Cleveland, OH. In addition to government programs, private industry is investing heavily in al-ternative energy. This includes biotechnology companies developing enhanced feed-stocks and industrial enzymes, companies specializing in the development and con-struction of bioprocessing facilities, and automobile manufacturers developing engines that can run efficiently on biofuels (see also Section 1.6). The European Union (EU) is also actively stimulating the use of bioenergy. The European Commission is largely in charge of formulating the policies related to bioenergy. The European Commission is the executive branch of the European Un-ion, responsible for proposing legislation, implementing decisions, and upholding the Union's treaties. The European Comission is elected for a period of five years and consists of a president and 26 commissioners from different EU member states. Directive 2003/30/EC (EU 2003) from the European Commission sets a mini-mum percentage of biofuels (according to energy contents) to replace diesel or gaso-line for transportation, and places an obligation on EU member states to ensure that starting in 2005 these biofuel quotas are met. The proposed schedule for the manda-tory biofuel share is: 2% in 2005, and increasing gradually to 5.75% in 2010. The goal is to have biofuels supply 20% of the transportation fuel by the year 2020. Unlike in the U.S., where ethanol is the primary biofuel, in the EU biodiesel has a considerably larger market share (82%) than ethanol. This is a reflection of the higher proportion of vehicles with diesel engines in the EU (an average of 50% of the passenger cars, and 70% of the trucks), the geography, which limits the choice of crops that can be grown, and the investment climate. The production of biodiesel is relatively straightforward, whereas the technology to produce ethanol from lignocel-lulosic biomass (Chapter 6) is not yet mature and will require substantial investment in research and development. Biodiesel is produced by 185 processing plants, with addditional plants under construction, offering a capacity of 10.2 × 10⁶ Mg in 2007. The main feedstock for these plants is canola seed (oilseed rape; Brassica napus L). In 2006, 60% of all canola seed was used for biodiesel production, with Germany as the leading pro-ducer, followed by France, Italy, and the Czech Republic. Ethanol is produced from sugar beets (direct fermentation of sugars), and from wheat, barley and maize (fer-mentable sugars from hydrolysis of starch). These crops are grown primarily for other uses (sugar, food, feed, industrial processes) and less than 1% of the total pro-duction is directed towards ethanol (EC 2006). With the current rate of substitution, the estimated market share of biofuels in 2010 will only be 4.2%, indicating that additional support is necessary to achieve the goal (Bolter et al. 2007). The Biomass Action Plan (COM 2005) outlines how bio-mass use in the EU could more than double by 2010, while respecting environmental

Why Bioenergy Makes Sense 29
limits. The Biomass Action Plan was followed up with another communication, ‘An EU Strategy for Biofuels’ (COM 2006), which included a series of market-based, legislative, and research measures to boost the production of biofuels. The plan fo-cuses on the use of forest products, agricultural products and waste as a source of bioenergy. The use of biofuels in the EU is further stimulated with tax incentives and tax exemptions. Efforts to mitigate climate change in China were described in a recent report by Zeng et al. (2008). This includes the development of Dongtan Eco-city, the world’s first carbon-neutral city outside Shanghai. This new city is powered with renewable energy, and transportation is based on convenient public transit and bicycles. China aims to drastically increase its energy contributions from hydroelectric, nuclear, biomass, wind and solar power by 2020.
1.6 Bioenergy, Oil Companies and Car Manufacturers
The success of alternative fuels is heavily dependent on demand by consumers. De-mand in turn is affected by price and availability. The price is a function of produc-tion costs, both of the feedstock and the processing. The availability is a function of infrastructure and will require new distribution chains compared to the current gaso-line network. In the recent years oil companies have shown an awareness of the energy chal-lenge. While they initially seemed to consider alternative fuels as a competing prod-uct, they now appear to be morphing into energy companies, as opposed to oil com-panies, and are actively investing in alternative energy. For example, in February 2007 British Petroleum (BP) established the US$500-million Energy Biosciences Institute (EBI) in partnership with the University of California, Berkeley, Lawrence Berkeley National Laboratory and the University of Illinois at Urbana-Champaign. Research at the EBI is meant to enhance the production and processing of bioenergy crops. Oil company Chevron has several research collaborations with U.S. universi-ties, notably Texas A&M University, and the University of California–Davis. This company is also heavily advertising in the popular press to increase public awareness of the energy challenge (www.willyoujoinus.com). Oil company Royal Dutch/Shell has invested in the Iogen cellulosic ethanol plant in Ottawa, Canada (www.iogen.ca), and uses this partnership in its advertising campaign. ExxonMobil has not been very vocal about its support of alternative energy, but this company is one of the sponsors (along with General Electric, Toyota and Schlumberger) of the Global Climate and Energy Project (GCEP) at Stanford University (www.gcep.stanford.edu), which ‘seeks to develop new ways of supplying energy to a growing world population in a way that protects the environment’. In 2007, oil company CococoPhillips and Tyson Foods formed an alliance to produce biodiesel from beef, pork and chicken fat. In addition, ConocoPhillips and Archer Daniels Midland, a company traditionally in-volved in the production of biochemicals and fuels from agricultural products, have agreed to collaborate on the development of renewable transportation fuels from biomass. The alliance intends to commercialize the thermo-chemical conversion of

30 Vermerris lignocellulosic biomass into ‘biocrude’ (pyrolysis oil, bio-oil); and the refining of this oil to produce transportation fuel. The investments of the oil companies are significant from the perspective of academic research, but still relatively small compared to the budget available for oil exploration, such as from the tar sands in Canada, or deep-sea drilling in the Gulf of Mexico. For example, ConocoPhillips advertises it has spent US$2 billion over five years to explore deep-sea drilling, substantially more than BP’s US$500 million investment in the EBI over a period of 10 years. So while the oil companies’ appear interested in alternative energy, the current scale of investment suggests that these companies consider ‘business as usual’ (i.e. petroleum) as their main source of reve-nue for the foreseeable future. The increases in oil prices have stimulated car manufacturers to develop engines that are more fuel efficient. In Japan and Europe, where gasoline is heavily taxed and roads are congested, cars tend to be smaller than in the United States. European car manufacturers offer diesel engines in most of their models, because diesel fuel is less expensive and offers better fuel economy than the typical gasoline-powered engine. Japanese automakers Honda and Toyota were the first to offer hybrid vehicles: cars that run on a combination of battery-powered electricity and gasoline. Cars manufactured in the United States are traditionally larger and not as fuel efficient as the average European and Japanese car. Fuel economy standards in the U.S. are governed by the federal government and stipulated by the so-called Corpo-rate Average Fuel Economy (CAFE) standards. CAFE standards are defined as the sales-weighted average fuel economy of a manufacturer's fleet of current model year passenger cars or light trucks with a gross vehicle weight rating of 3,856 kg (8,500 pounds) or less, manufactured for sale in the United States. In other words, it is ac-ceptable to produce vehicles with poor fuel economy as long as there are enough vehicles produced (and sold) with a high enough fuel economy to make up the dif-ference. The car manufacturing business in the U.S. initially saw alternative fuels such as E85 as a way to meet CAFE standards. Due to fuel economy credits, the benefit of flexible-fuel vehicles (FFV’s) that can run on both gasoline and ethanol was biggest in large vehicles, such as sport utility vehicles and trucks. As a consequence, the auto manufacturers converted the large engines in these vehicles first. While this obvi-ously did not contribute much towards reduced fuel use, their efforts also resulted in the production of smaller FFV’s. In addition, there are now several hybrid vehicles that use a combination of gasoline and electric power. New engine technology enabled FFV’s to actually have better performance on ethanol than on gasoline, in part because of ethanol’s higher octane level. The ability to market vehicles as environmentally responsible further stimulated the production and sale of FFV’s. As part of large marketing campaigns, some of the car manufac-turers are sponsoring marketing activities aimed at increasing consumer awareness of alternative fuels. An example is the ‘Live Green, Go Yellow’ campaign (www.livegreengoyellow.com), sponsored by General Motors (GM; Detroit, MI), in which GM has teamed up with local gas stations in several major cities in the U.S. to promote the use of E85. Ford Motor Company (Detroit, MI) has teamed up with renewable energy company VeraSun Energy (Brookings, SD) to help build the

Why Bioenergy Makes Sense 31
‘Midwest Ethanol Corridor’ by expanding the availability of E85 fuel in the Midwest region of the U.S. The National Ethanol Vehicle Coalition (http://www.e85fuel.com) provides information on how to expand the availability and use of ethanol in the United States.
1.7 Concerns About Bioenergy
While the use of bioenergy has many advantages, as outlined in the previous sec-tions, not everybody agrees that developing bioenergy in general, and ethanol as a transportation fuel in particular, is the best solution for the short or long term. Some of these concerns are discussed below.
1.7.1 Food Versus Fuel
One of the biggest concerns associated with the production of ethanol is related to its current reliance on starch from corn and wheat. This is perceived as a competition between fuel and food. There is a direct effect, as grain is converted from use as food (and feed) to fuel, and an indirect effect, as bioenergy crops displace land used for food production. The combined effect is that there is a relative shortage of food crops, with price increases for food and reduced exports as a consequence. Given the still widespread hunger in the world, it is considered unethical to convert food crops to fuel. Cassman and Liska (2007) pointed out that with the rise in biofuel production, the price of commodity crops switched from being dictated by their value as food to being dictated by their value as fuel, that this happened in a very short period (2006–2007), and that it was unexpected, largely due to the recent sharp increase in the oil price. For example, in the CAST (2006) commentary, the oil price was projected to be US$53–63 per barrel up until 2010, whereas we are currently dealing with prices of over US$100 per barrel and no sign of declining prices. As a consequence of the increased demand for grain as feedstock for fuels, food exports originating from developed countries have already diminished or are likely to diminish in the future. The increased demand for biofuel feedstocks in developed countries has also generated a lucrative global market, which can lead to a switch from food production to feedstock production in developing nations. In order to maintain food production, tropical rainforests or other fragile ecosystems will likely be converted to farmland (see also Section 1.7.4). Cassman and Liska (2007) argue that even though the higher food prices may increase the risk of hunger in the short term, there is the long-term prospect of more investment in food security at the local and regional level, especially in developing countries, through better research, education, and infrastructure. The U.S. National Corn Growers Association (www.ncga.com) has addressed some of the concerns related to the use of food crops for fuels. Their main argument is that the majority of the corn grain in the U.S. (47%) is used as animal feed and is not suitable for human consumption. While ethanol production has shifted some of the corn starch away from animal feed, the majority of corn starch is still used as

32 Vermerris feed, and the production of ethanol from corn grain generates substantial amounts of animal feed as a byproduct (Chapter 3), reducing the impact of using corn grain for biofuel production on feed supplies. Furthermore, the NGCA projects that the in-creases in efficiency of corn production as a result of plant breeding and improved management practice will be able to satisfy increasing demand for biofuels, given that the market for traditional corn products has been stable for some time. The CAST (2006) commentary and Cassman and Liska (2007) expressed some concern over the potential to increase corn grain yields in the future, though, especially at the rate considered necessary to sustain the anticipated demand for biofuels. The ‘food vs. fuel’ debate should become less of an issue as cellulosic ethanol produced from biomass becomes the primary feedstock for ethanol. This is likely to have its own major impacts on agricultural practice, as outlined in the CAST (2007) commentary, in which the lack of funding for long-term studies on the sustainability of cropping systems is raised as a main concern (see also Sections 1.7.3 and 1.7.4). For the short term, however, grain will remain the main feedstock for ethanol, and the consequences on food prices and food distribution will need to be considered carefully. But this should be done in the context of global food and energy produc-tion, whereby use of grain for other non-food applications, especially as a source of feed for the relatively inefficient production of meat is taken into consideration. Historically, there is a tight correlation between increasing standard of living and increasing consumption of animal products, and the question is whether that can be sustained as the population of the developing countries almost doubles in the next 40 years.
1.7.2 Negative Net Energy Balance
Some opponents of biofuels claim that the production of ethanol and biodiesel from biological materials is associated with a net negative energy balance (Pimentel and Patzek 2005). In other words, it costs more energy to produce ethanol than the en-ergy the fuel provides, and producing biofuels is therefore equivalent to wasting energy. These claims are based on economic analyses that take into consideration the energy used to produce ethanol or biodiesel. This does not only include the energy used for the conversion of the feedstock to biofuel, but also the energy associated with the construction of the processing facility (steel, cement), the cultivation of the crop on the farm land (irrigation, fertilizer, pesticides), labor, and transportation fuel used during production of the feedstock and fuel. According to these calculations, the net energy balance of ethanol from corn starch was –29%. For switchgrass and wood the energy balance was calculated to be –50% and –57%, whereas biodiesel production from soybean and sunflower oil had an energy balance of –27% and –118%, respectively. The analysis by Pimentel and Patzek (2005) has drawn criticism for several dif-ferent reasons. One argument has been the use of outdated input costs, or the fact that co-products generated during ethanol production were not properly accounted for in the analysis (Farrell et al. 2006). Particularly in the case of switchgrass (Panicum virgatum L; see Chapter 11), which is a relatively new crop for which only limited production data existed in 2005, projections had to be based on small-scale experi-

Why Bioenergy Makes Sense 33
mental plots. Schmer et al. (2008) reported the first farm-scale economic analysis of switchgrass grown on marginal cropland for the production of ethanol. These authors reported that switchgrass produced 540% more renewable energy than the nonre-newable energy that was consumed to generate the ethanol, while greenhouse gas emissions were 94% lower than estimated greenhouse gas emissions for the produc-tion of an equivalent volume of gasoline. Wesseler (2007) considered the analysis by Pimentel and Patzek (2005) flawed based on a number of arguments. First of all, he questioned whether the cost of pro-duction of the crops should be taken into consideration in the first place, given that this would be a more or less fixed cost regardless of the end use of the product. In other words, the land would be cultivated no matter what, and the energy associated with its cultivation would be used no matter what, even if the corn starch would be used for human consumption instead, as Pimentel and Patzek (2005) advocate. Fur-thermore, Wesseler (2007) questioned where the line should be drawn in terms of input cost and input energy, the so-called model boundaries, and argued that Pimen-tel and Patzek (2005) set their boundaries too wide, thus inflating the energy input requirements. Instead, Wesseler proposed to base the energy balance on the cost/energy differential between use of the feedstock for biofuels and use of the feedstock for other purposes. Under that scenario, the energy balance is either posi-tive (corn, soybean, sunflower) or considerably less negative (switchgrass, wood). A different perspective was offered by Dale (2007), who argued that the very concept of net energy balance was wrong and misleading, because it considers all energy inputs equally. Dale pointed out that the cost of equivalent amounts of energy from different sources (coal versus natural gas versus petroleum versus electricity) can differ as much as twelve-fold, and reflects the value we place on different forms of energy (Table 1.1). Dale further pointed out that each energy source has its strengths and limitations, as evidenced by the fact that most modern automobiles can only run on petroleum-based fuels as opposed to coal or electricity. So energy is valued by the services it provides, not by the energy value per se, and that should be reflected in the discussion. Dale (2007) also criticized the Pimentel and Patzek (2005) for not making the comparison with conventional fuels. For example, the net energy balance associated with the production of electricity from coal is –200% because of the energy losses that occur during the conversion. And when the production of ethanol and gasoline are compared using the net energy balance calculation, based on data by Farrell et al (2006), gasoline has a net energy balance of –18% versus ethanol of +27%. Instead of the net energy balance, Dale proposed the development of alternative energy metrics that take into consideration the capacity of biofuels to displace gaso-line or petroleum-based diesel, their contribution towards greenhouse gases, and the efficiency of land use associated with biofuel production versus other uses.
1.7.3 Soil Depletion
A concern associated with the use of lignocellulosic biomass as a feedstock for bio-fuels is that it is agronomically unsustainable. This fear stems from the fact that the first source of lignocellulosic biomass will be corn stover (the vegetative biomass

34 Vermerris remaining after the grain harvest). Corn stover is generally left behind on the field to prevent erosion and to return organic matter to the soil, ensuring long-term soil fertil-ity and good yields. Removal of biomass would, however, deprive the soil of organic carbon and cause yield losses over time. A study by Maskina et al. (1993) indicated that returning 0, 50, 100, or 150% of the crop of the previous year resulted in soil organic matter contents of 24.7, 25.3, 26.2 and 27.4 g kg–1, respectively. Perhaps more importantly, removal of stover reduced the yield of grain and biomass for sev-eral years running, even if all residues were returned to the field in years following removal. Wilhelm et al. (2004) summarized a large body of literature on the impacts of crop residue removal and cultivation practices in the Midwest region of the U.S on erosion, soil fertility, and soil structure. They concluded that soil depletion represents a serious risk and requires adequate preventative measures. While they consider harvest of stover for biofuel production feasible, Wilhelm et al. (2004) recommend that the exact amount of stover harvested be determined based on regional yield, climate and cultural practice. Johnson et al. (2006) calculated the amount of stover needed to maintain soil organic carbon levels under various cultivation practices. Wilhelm et al. (2007) pointed out that those levels are higher than the levels recom-mended for erosion control, and that this should receive adequate consideration in projecting the amount of biomass available for ethanol production. Leaving some of the stover behind would obviously reduce the yield of biomass, and therefore reduce the overall efficiency of biofuel production. The development of maize that produces more biomass and/or that produces more fermentable sugars on a dry-weight basis would address this concern. This will be discussed in detail in Chapter 7. While maize is likely to remain an important crop, especially in the U.S., and therefore an abundant source of lignocellulosic biomass, several other crops may turn out to be more efficient in terms of their biomass potential, as will be discussed in Chapters 8–15.
1.7.4 Contribution to Net CO2 Emissions
One of the perceived benefits of the use of bioenergy is the reduction in greenhouse gas emissions relative to the use of fossil fuels, as bioenergy crops fix atmospheric CO2 which is released when the biofuels produced from them are burned, after which it can be fixed again. In contrast, the use of fossil fuels adds ‘old’ carbon to the at-mosphere. Farrell et al. (2006) calculated that the use of ethanol produced from lig-nocellulosic ethanol reduced greenhouse gas emissions by 88%, and projected that would get even lower as new technologies were developed. Schmer et al. (2008) reported a 94% reduction in greenhouse gas emissions for a farm-scale switchgrass-to-ethanol project. Note that there is still a net emission of greenhouse gases associ-ated with the production of biofuels, as biofuel production requires energy imputs in the form of transportation by truck, as well as heat for pretreatment and distillation. Two recent articles described some unexplored effects of biofuel production on greenhouse gas emissions. Searchinger et al. (2008) investigated the impact of higher prices for feedstocks for biofuels on land use. Based on a world-wide agricultural model, they projected that the production of corn for ethanol would result in the

Why Bioenergy Makes Sense 35
conversion of forest land and grassland to cropland to displace the cropland dedi-cated to biofuels. The conversion of forest and grassland releases carbon into the atmosphere as a result of burning or decomposition. Alternatively, if no additional cropland is used for biofuel production, there will be a relative shortage of food crops, which drives up the price, and stimulates deforestation and conversion of grass land around the world. As a consequence, the greenhouse gas balance is only positive if the use of land for biofuel production results in a net increase of CO2 sequestration relative to the original land use. Taking the effect of land use in con-sideration, Searchinger et al. (2008) estimated that the production of ethanol from corn grain would result in almost twice as much greenhouse gas emissions as the use of gasoline. These authors warn that the use of good cropland for biofuel production will probably exacerbate global climate change, and therefore argue for restrictions on the use of cropland, and the use of agricultural waste products as a source of bio-fuels. Fargione et al. (2008) considered several scenarios of biofuel production, both biodiesel and ethanol, in several agricultural production systems around the world. They also conclude that the production of biofuels is likely to result in a net emission of greenhouse gases as land use changes, and argue for the use of degraded and abandoned agricultural land for feedstock production. To some extent, the same criticisms that applied to the analyses by Pimentel and Patzek (2005) ( see Section 1.7.2) apply to the analyses by Searchinger et al. (2008) and Fargione et al. (2008). These analyses are based on current production statistics with data on bioprocessing plants that do not reflect the most recent designs, with data on fossil fuels that do not take into consideration that future exploration of deep sea oil and tar sands will likely be considerably more cost- and energy intensive, and with biofuel feedstocks derived from crops that have been bred for uses other than biofuels. As will become evident from Chapters 7–15 of this book, exploring the largely untapped genetic potential of crop plants will result in much more efficient bioenergy crops that will not require land use changes to the extent projected in these two analyses. Obviously, even if biofuel production would not require conversion of grass lands and forests, population growth will, both directly as cities expand, and indirectly, as more land is put into production for the production of food, feed, fibers, and energy. An integrated agricultural production system in which crops can provide more than one end product may off-set some of the concerns about changes in land use.
1.7.5 Biofuels Prolong the Power of the Oil Companies
Biofuels are used in traditional vehicles that were designed to run on petroleum-based fuels. Even though biofuels are becoming more wide-spread, they will likely remain a small component of the fuel used in any one country. For example, in the United States, the ambitious 30 × ’30 program (see Section 1.5) would still only replace 30% of the energy with bio-based energy, and is based on 2004 consumption data. In 2030 this is likely to be less than 30% due to population growth. As a conse-quence, the production of biofuels can be considered as a factor that extends the use of petroleum-based fuels, rather than one that results in the gradual phasing out of those fuels. People that oppose biofuels for this reason argue that it would be better

36 Vermerris to develop alternative engine technologies that do not rely on petroleum-based fuels. They advocate electric vehicles, powered by solar energy or electricity generated with bio-based energy, nuclear power, or clean coal technologies, as well as vehicles running on hydrogen. While hydrogen is considered to be the ultimate fuel in terms of its emissions, it will take some time for the auto manufacturers to offer (affordable) hydrogen en-gines and for distributors to set up the infrastructure for hydrogen generation, storage and distribution. So, given that purchasing a car is a significant investment for most people, the reality is that traditional internal combustion engines will remain preva-lent in the foreseeable future. China and India may form exceptions to this view. These two countries have the potential to not follow the same trajectory as the estab-lished economies of developed countries. Since they have not yet established a dense infrastructure for traditional gasoline, they could develop infrastructures based on the latest and cleanest technologies, either imported or developed locally, which may include hydrogen. Obviously, this may seem an idealistic view in light of the recent introduction of Tata Motors’ ‘Nano’ car for the equivalent of US$2,500 (www.tatamotors.com). Nonetheless, for the developed countries, biofuels can be considered as a transi-tion from petroleum-based fuels to alternative fuels used in combination with differ-ent engine technologies. Marketing of biofuels improves public awareness of the risks associated with the use of oil, and may therefore make hydrogen and electric vehicles more appealing when that technology matures. In the meantime, as stated by Cassman and Lisak (2007), biofuel use does replace a proportion of the petroleum-based fuel, and can therefore contribute to reducing gasoline consumption, especially in combination with more fuel-efficient engines. In both developing and developed countries, market principles of supply and demand, combined with governmental energy policies will likely govern the devel-opment of alternative fuels and engines. The fact remains that oil is a finite resource and that the global population is growing, so the increased need for energy will drive up the price of oil, if not soon, then certainly later.
1.7.6 Ethanol is an Uneconomical Fuel
This criticism refers to the fact that ethanol has a lower energy content than gasoline. On a mass-basis, the energy density of ethanol 68% of the energy density of gaso-line, and on a volume-basis it is 71% (Davis 2006). As a consequence, the distance traveled on a tank of ethanol is shorter compared to gasoline. This prompted the October 2006 cover article of U.S.-based Consumer Reports ‘The Ethanol Myth’, and the title ‘Ethanol, Schmethanol’ for a September 2007 article in the newspaper The Economist. The latter article argued for the development of alcohols with longer carbon chains, such as butanol. An overview of the properties of ethanol (E85) as a transportation fuel was pro-vided by Davis (2006). The actual fuel economy is slightly better than would be expected solely based on the energy density, because ethanol burns more cleanly (and thus more efficiently), and the engines of FFV’s can adjust the timing of the ignition, contributing further to performance improvement. The octane rating of

Why Bioenergy Makes Sense 37
ethanol is 10% higher than that of gasoline, resulting is an engine that runs more smoothly. Combined, these features could reduce the fuel economy penalty from 29% to 14%. As a result of the more efficient combustion of ethanol, engines run-ning on E85 emit less CO, NOx and particulates relative to gasoline. Emissions of the irritant acetaldehyde are, however, higher. Finally, engines that can take full advan-tage of E85 can produce up to 25% more power. Thus, by reducing engine size, it is possible to get the same power output, while also improving fuel economy. In conclusion, claims that ethanol as a fuel is uneconomical appear exaggerated. The latest generation of FFV’s, in which engine size is adjusted for increased power output, should experience minimal reduction in fuel economy relative to the compa-rable gasoline engine.
1.8 Conclusions
It is clear that the global energy challenge will not be met with the business-as-usual scenario, because of the finite supplies of fossil fuels, the effect the use of these fuels has on the climate, and the fact that the demand for energy increases with a growing and more prosperous world population. A global challenge, such as meeting future energy demands, requires a global solution. In the ideal case, energy policies will be integrated with global health poli-cies, global food production, and global natural resource management (specifically water and tropical rainforests). This is obviously a major political challenge, as evi-dent from the Kyoto Protocol negotiations. When considering new energy policies, it is important to realize the power of the established energy infrastructure (oil-producing countries, oil companies, car manufacturers). A switch to alternative en-ergy sources will likely be met with resistance due to the impact on local economies that rely heavily on the established energy infrastructure, unless new job opportuni-ties are created locally as a result of the switch. It is highly unlikely that the global energy challenge can be met with one single solution such as bioenergy. Even with the production of a billion tons of dry biomass (Perlack et al. 2005), the U.S. would still not be able to replace all of the oil used for transportation fuels, let alone coal and natural gas. Instead, all alternative energy sources need to be further explored and developed. Furthermore, the effects of con-servation efforts should not be ignored. Replacing incandescent light bulbs with fluorescent light bulbs, the development of more fuel-efficient engines, urban plan-ning that incorporates energy-efficient houses, public transit and bicycle lanes, and the use of teleconferencing as opposed to air travel are relatively simple solutions with large impacts on energy use, and incorporating these principles in growing economies in developing countries may reduce the energy need per capita in the future. In addition, the price of fossil fuels should be more reflective of the true cost. Copulos (2007) estimated that the hidden cost of oil dependence – oil-related defense expenditures, loss of domestic investment, loss of government revenues, and the cost of disruptions in oil supply – amounts to US$2.83 l–1. Such a price adjustment will provide a more level playing field for energy alternatives.

38 Vermerris It is also important to further develop systems that place an economic value on maintaining tropical rainforests as carbon sinks and sources of biodiversity. Coun-tries with large forests currently get a carbon credit in the cap-and-trade schemes under the Kyoto Protocol. As long as the economic value of (rain)forests per se are set properly and are periodically updated to reflect new trends such as increases in fuel and food costs, market principles may represent the most effective means of conservation. Monitoring may present a challenge, although this should be less of an issue with satellite imaging. A more idealistic approach was recently suggested by Barnes et al. (2008), with the creation of an Earth Atmospheric Trust that distributes a fraction of the revenues from cap-and-trade schemes for greenhouse gases in the form of a per-capita payment to all people on Earth, thus linking efforts to mitigate climate change with efforts to fight poverty. Bioenergy in general, and biofuels in particular, are receiving considerable atten-tion and have become the topic of intense debate. Environmental benefits, especially minimal CO2 emissions relative to fossil fuels, have been the major argument for developing and using biofuels. It is becoming clear, however, that large-scale pro-duction and use of bioenergy has major economic and ecological consequences due to the altered land use, harvesting practice, the construction of new processing facili-ties, and the need for new infrastructures. As a result, the environmental benefit is not automatic, but depends on crop selection, crop management, and how the pro-duction of bioenergy crops changes land and crop use. The rather large discrepancies between different reports on the long-term consequences of bioenergy production stem from uncertainties about the model assumptions and model boundaries. This is not surprising, given that energy needs are a global matter, and that energy policy has global – and therefore complex – consequences. Developing more refined mod-els based on the latest technologies and on agricultural studies that span 5–10 years, as proposed in the CAST (2007) commentary, would provide a better mechanism to evaluate different production strategies. It is important to realize that analyses on the impacts of biofuel production are based heavily on current production schemes in the U.S., with the majority of the ethanol derived from corn starch. Although it is not necessarily obvious from the titles of some of the critical publications, production of biofuels from lignocellulosic biomass or sugars extracted from the juice of sugar cane or sweet sorghum is often regarded in a much more positive light. A lot of misconceptions could be avoided if the origin of biofuels was indicated more clearly. The economic analyses of the use of lignocellulosic biomass or sugar-producing crops is hampered by the fact that there are at best limited data available on these crops, because cellulosic ethanol production is new, and only Brazil has successfully implemented large-scale ethanol production from sugar cane. In addition to not having an established processing scheme for lignocellulosic biomass to incorporate into models, the development of biomass crops specifically for bioenergy applications is still in its infancy. However, as the chapters in Part II of this book will illustrate there is a tremendous genetic potential that is largely untapped. I am optimistic that utilization of this genetic po-tential will be able to address many of the concerns raised by critics of bioenergy.

Why Bioenergy Makes Sense 39
References
Adger, N., Aggarwal, P., Agrawala, S., Alcamo, J., Allali, A. et al. (2007) A report accepted by Working Group II of the Intergovernmental Panel on Climate Change. http://www.ipcc-wg2.org.
Argonne National Laboratory (2007) Greenhouse Gases, Regulated Emissions, and Energy Use in Transportation (GREET) computer model. Argonne, Illinois. http://www.transpor-tation.anl.gov/software/GREET/publications.html
Barnes, P., Constanza, P, Hawken, P, Orr, D., Ostrom, E, umana, A., and Young, O. (2008) Creating an earth atmospheric trust fund. Science 319, 724. http://earthinc.org/earth_ atmospheric_trust.php
Bolter, I., Bacovsky, D., and Wörgetter, M. (2007) Biofuels in the European Union: An over-view on the European biofuels policy. IEA Task 39 Report T39-B7. http://www.blt. bmlfuw.gv.at/projekte/BLT_072713/Biofuels_in_the_EU/index.htm
Bush, G.W. (2007) State of the Union Address. 23 January 2007. www.whitehouse.gov/ stateoftheunion/2007/initiatives/sotu2007.pdf
Carson, I., and Vaitheeswaran, V.V. (2007) Zoom: The Global Race to Fuel the Car of the Future. Twelve, New York, NY, p. 336.
Cassman, K.G., and Liska, A.J. (2007) Food and fuel for all: realistic or foolish? Biofuels Bioprod. Bioref. 1, 18–23.
CAST (2006) Council for Agricultural Science and Technology. Convergence of Agriculture and Energy. Implications for Research and Energy. QTA2006-3. http://www.cast-science.org/
CAST (2007) Council for Agricultural Science and Technology. Convergence of Agriculture and Energy: II. Producing Cellulosic Biomass for Biofuels. QTA2007-2. http://www.cast-science.org/
COM (2005) Communication from the Commission. Biomass Action Plan. 7 December 2005. http://ec.europa.eu/energy/res/biomass_action_plan/doc/2005_12_07_comm_biomass_action_plan_en.pdf
COM (2006) Communication from the Commission. An EU Strategy for Biofuels. 8 February 2006. http://europa.eu.int/comm/agriculture/biomass/biofuel/com2006_34_en.pdf
Copulos, M.R. (2007) The hidden cost of imported oil – an update. National Defense Council Foundation. www.ndcf.org
Dale, B.E. (2007) Thinking clearly about biofuels: ending the irrelevant ‘net energy’ debate and developing better performance metrics for alternative fuels. Biofuels Bioprod. Bioref. 1, 14–17.
Davis, G.W. (2006) Using E85 in vehicles. In: S. Minteer (Ed.) Alcoholic Fuels. Taylor and Francis, Boca Raton, FL. pp. 137–152.
De Leo, G.A., Rizzi, L., Caizzi, A., and Gatto, M. (2004) The economic benefits of the Kyoto Protocol. Nature 413, 478–479.
Dennis, D. T., and Blakeley, S.D. (2000) Carbohydrate metabolism. In: B.B. Buchanan, W. Gruissem, and R.L. Jones (Eds.) Biochemistry and Molecular Biology of Plants, John Wiley & Sons Inc, Somerset, NJ. pp. 630–675.
Dunwoody, D.C., Chung, H., Haverhals, L., and Leddy, J. (2006) Current status of direct methanol fuel cell technology In: S. Minteer (Ed.) Alcoholic Fuels. Taylor and Francis, Boca Raton, FL. pp. 155–190.
EC (2005) European Commission, Energy, EU Crude Oil Imports. http://ec.europa.eu/energy/ oil/crude/index_en.htm
EC (2006)Biofuels in the European Union: An agricultural perspective. http://ec.europa.eu/ agriculture/publi/fact/biofuel/2007_en.pdf
EIA (2005a) http://www.eia.doe.gov/neic/brochure/infocard01.htm

40 Vermerris EIA (2005b) http://www.eia.doe.gov/emeu/international/RecentHydroelectricGenerationKilo-
watthours. xls ENS (2008) http://www.euronuclear.org/info/encyclopedia/u/uranium-reserves.htm EU (2003) Directive 2003/30/EC of the European Parliament and of the Council. On the
promotion of the use of biofuels or other renewable fuels for transport. 8 May 2003. http://ec.europa.eu/energy/res/legislation/doc/biofuels/en_final.pdf
Fargione, J., Hill, J., Tilman, D., Polasky, S., and Hawthorne, P. (2008) Land clearing and the biofuel carbon debt. ScienceExpress, 7 February 2008. Science DOI: 10.1126/science. 1152747
Farrell, A.E., Plevin, R.J., Turner, B.T., Jones, A.D., O'Hare, M., and Kammen1, D.M (2006) Ethanol can contribute to energy and environmental goals. Science 311, 506–508. Correc-tion published in Science 312, 1748.
Gore, A. (2006) An Inconvenient Truth: The Planetary Emergency of Global Warming and What We Can Do About It. Rodale, New York, NY. p. 325.
GWEC (2008) Global installed wind power capacity (MW) – regional distribution. Global Wind Energy Council. http://www.gwec.net/uploads/media/gwec-table-2008.pdf
Hamelinck, C. and Faaij, A.P.C. (2006) Production of methanol from biomass. In: S. Minteer (Ed.) Alcoholic Fuels. Taylor and Francis, Boca Raton, FL. pp.7–50.
Hofstrand, D. (2007) http://www.extension.iastate.edu/agdm/articles/hof/HofJune07.html IEA (2007) World Energy Outlook 2007 Edition. International Energy Agency. p.600 IEA (2008) Oil Market Report for OECD Countries. International Energy Agency.
http://omrpublic.iea.org/trade/Ct_cr_ov.pdf Johnson, J.M.F., Allmaras, R.R., and Reicosky, D.C. (2006) Estimating source carbon from
crop residues, roots and rhizodeposits using the national grain-yield database. Agron. J. 98, 622–636.
Liska, A.J., Yang, H., Walters, D.T., Bremer, V., Erickson, G., Klopfenstein, G., Koelsch, R., Kenney, D., Tracey, P., and Cassman, K.G. (2007) A user-friendly simulation tool for es-timating carbon credits for corn-ethanol systems. 23rd International Fuel Ethanol Work-shop and Expo, 28 June 2007, St. Louis, MO. http://www.bess.unl.edu/
Lomborg, B. (2007) Cool It. The Skeptical Environmentalist’s Guide to Global Warming. A.A. Knopf, New York, NY. p. 253.
Malkin, R, and Niyogi, K. (2000) Photosynthesis In: B.B. Buchanan, W. Gruissem, and R.L. Jones (Eds.) Biochemistry and Molecular Biology of Plants, John Wiley & Sons Inc, Som-erset, NJ. pp. 568–628.
Marland, G., Boden, T.A., and Andres, R. J. (2007) Global, regional, and national CO2 emis-sions. In: Trends: A Compendium of Data on Global Change. Carbon Dioxide Information Analysis Center, Oak Ridge National Laboratory, U.S. Department of Energy, Oak Ridge, TN, USA.
Maskina, M., Power, J., Doran, J., and Wilhelm, W. (1993) Residual effects of non-till crop residues on corn yield and nitrogen uptake, Soil Sci. Soc. Am. J. 57, 1555–1560.
McAloon, A., Taylor, F., Yee, W., Ibsen, K., and Wooley, R (2000) Determining the cost of producing ethanol from corn starch and lignocellulosic feedstock. National Renewable Energy Laboratory, Golden, CO. http://www.nrel.gov/docs/fy01osti/28893.pdf
Minteer, S. (2006) Direct ethanol fuel cells. In: S. Minteer (Ed.) Alcoholic Fuels. Taylor and Francis, Boca Raton, FL. pp. 191–202.
Murugesan, A., Umarani, C., Subramanian, R., and Nedunchezhian, N. (2008) Bio-diesel as an alternative fuel for diesel engines – a review. Ren. Sustain. Energy Rev. (in press). http://dx.doi.org/10.1016/j.rser.2007.10.007
Osborne, C.P. and Beerling, D.J. (2006) Nature’s green revolution: the remarkable evolution-ary rise of C4 plants. Phil. Trans. R. Soc. B 361, 173–194.

Why Bioenergy Makes Sense 41
Perlack, R.D., Wright, L.L., Turhollow, A., Graham, R., Stokes, B., and Erbach, D. (2005) Biomass as Feedstock for a Bioenergy and Bioproducts Industry: The Technical Feasibil-ity of a Billion-Ton Annual Supply. Tech. Rep. ORNL/TM-2006/66, Oak Ridge National Laboratory, Oak Ridge, TN. http://feedstockreview.ornl.gov/pdf/billion_ton_vision.pdf.
Pimentel, D., and Patzek, T.W. (2005) Ethanol production using corn, switchgrass and wood; biodiesel production using soybean and sunflower. Nat. Resources Res. 14, 65–76.
Population Institute (2008) http://www.populationinstitute.org/cms/modules/PopIssues/front/ lib/pdf.php?id=5
Ramírez de la Piscina, P., and Homs, N. (2006) Etanol reformation to hydrogen. In: S. Minteer (Ed.) Alcoholic Fuels. Taylor and Francis, Boca Raton, FL. pp. 233–248.
Raupach, M.R., Marland, G., Ciais, P., Le Quéré, C., Canadell, J.G., Klepper, G., and Field, V.B. (2007) Global and regional drivers of accelerating CO2 emissions. Proc. Natl. Acad. Sci. USA 104, 10288–10293.
Renewable Fuels Association (2008). http://www.ethanolrfa.org/industry/statistics/ Schmer, M.R., Vogel, K.P., Mitchell, R.B., and Perrin, R.K. (2008) net energy of cellulosic
ethanol from switchgrass. Proc. Natl. Acad. Sci. USA 105, 464–469. Searchinger, T., Heimlich, R., Houghton, R.A., Dong, F., Elobeid, A. et al. (2008) Use of U.S.
croplands for biofuels increases greenhouse gases through emissions from land use change. Science Express 7 February 2008. Science DOI: 10.1126/science.1151861
Shapouri, H., and Gallagher, P. (2005) USDA’s 2002 Ethanol Cost-of-Production Survey. USDA Office of the Chief Economist and Office of Energy Policy and New Uses. Agri-cultural Economic Report 841. http://www.usda.gov/agency/oce/reports/energy/USDA_ 2002_ETHANOL.pdf
Sims, R.E.H., Hastings, A., Schladmadinger, B., Taylor, G., and Smith, P. (2006) Energy crops: current status and future prospects. Global Change Biol. 12, 2054–2076.
Somerville, C., Browse, J., Jaworski, J.G., and Ohlrogge, J.B. (2000) Lipids. In: B.B. Bu-chanan, W. Gruissem, and R.L. Jones (Eds.) Biochemistry and Molecular Biology of Plants, John Wiley & Sons Inc, Somerset, NJ. pp. 456–527.
Stern, N. (2006) Stern review on the economics of climate change. http://www.hm-treasury.gov.uk/independent_reviews/stern_review_economics_ climate_ change/ sternre-view_index.cfmw
Thomas-Hall, S.R., Stephens, E., Marx, U., Mussgnug, J.H., Posten, C., Kruse, O., and Hank-amer, B. (2008) Second generation biofuels: High-efficiency microalgae for biodiesel pro-duction. BioEnergy Res. 1.
Tyner, W.E. (2007) Policy alternatives for the future biofuels industry. J. Agric. Food Ind. Org. 5.
Tyner, W.E. and Taheripour, F. (2007) Renewable energy policy alternatives for the future. Amer. J. Agr. Econ. 89, 1303–1310.
U.S. DOE. (2006) Breaking the biological barriers to cellulosic ethanol: a joint research agenda, DOE/SC-0095, U.S. Department of Energy Office of Science and Office of Effi-ciency and Renewable Energy (www.doegenomestolife.org/biofuels/).
Van Gerpen (2006) Biodiesel production. In: P. Ranalli (Ed.) Improvement of Crop Plants for Industrial End Uses. Springer, New York, NY. pp. 281–290.
Wesseler, J. (2007) Opportunities (‘costs’) matter: A comment on Pimentel and Patzek “Etha-nol production using corn, switchgrass and wood; biodiesel production using soybean and sunflower”. Energy Policy 35, 1414–1416.
Zeng, N., Ding, Y., Pan, J., Wang, H., and Gregg, J. (2008) Climate change – the Chinese challenge. Science 319, 730–731.
Smith, J.R., Richards, W., Acker, D., Flinchbaugh, B., Hahn, R., Heck, R., Horan, B.,
Role in Ensuring U.S. Energy Independence—A Blueprint for Action. http://www.25x25.org/storage/25x25/documents/Blueprint.pdf
Keppy, G., Rider, A., Villwock, D., Wyant, S., and Shea, E. (2004) 25 x 25: Agriculture’s

Wilhelm, W.W., Johnson, J.M.F., Hatfield, J.L., Voorhees, W.B., and Linden, D.R. (2004) Crop and soil productivity response to corn residue removal: A literature review, Agron. J. 96, 1–17.
Wilhelm, W.W., Johnson, J.M.F., Karlen, D.L., and Lightle, D.T. (2007) Corn stover to sus-tain soil organic carbon further constrains biomass supply. Agron. J. 99, 1665–1667.
42 Vermerris
2 A Primer on Genetics, Genomics and Plant Breeding
Wilfred Vermerris
Genetics Institute and Agronomy department, University of Florida, Gainesville, FL, USA, [email protected]
2.1 Introduction
The focus of this book, as the title indicates, is on the genetic improvement of bio-energy crops. Chapter 4 deals with the biochemistry and genetics of cell wall biosyn-thesis, and Chapters 7–15 focus on individual crops, with an emphasis on the breed-ing strategies that can be employed to improve these crops for bioenergy production. These chapters are written with the assumption the reader has basic knowledge of plant genetics and plant breeding. In order to make this book accessible to a broad audience, this primer is intended to provide basic background information on plant molecular genetics and plant breeding. The chapter is written for an audience with basic knowledge of biology and chemistry. Textbooks that offer a more detailed and extensive treatise on the various topics are referenced throughout the text. It should be possible to read the main Sections (2.2, 2.3, etc.) independently from each other.
2.2 DNA, Genes and Genomes
The way living organisms function, look, and behave, is referred to as the phenotype, abbreviated as P. The phenotype is the result of the genetic make-up or genotype (G) of that organism and the impact of the environment (E) it is in. For example, when considering the genetics of height, seeds from dwarf mutants will generally produce plants that are shorter than the plants that develop from seeds of normal (so-called wild-type) non-dwarf plants. The impact of the environment is illustrated by consid-ering seeds that develop into tall plants in environments with good soil and irriga-tion, but that would develop into appreciably shorter plants if those same seeds were planted in poor soil, or if they received only limited amounts of water.
W. Vermerris (ed.), Genetic Improvement of Bioenergy Crops, DOI: 10.1007/978-0-387-70805-8_2, © Springer Science+Business Media, LLC 2008

44 Vermerris The genotype of an individual is determined by the DNA sequence of its genome, and to some extent by the way that DNA is accessed. The genome is the complete collection of hereditary information, organized in chromosomes. So, DNA – deoxy-ribonucleic acid – provides a blueprint for the way an organism functions and inter-acts with its environment. DNA is formed through the polymerization of four de-oxynucleotides: dATP (2.1; Fig. 2.1), dTTP, dCTP and dGTP, which are triphosphates of the sugar 2-deoxyribose linked to the base adenine (A), thymine (T; 2.2), guanine (G; 2.3) and cytosine (C; 2.4), respectively. A and G are purines and T and C are pyrimidines. The combination of sugar and base is called a nucleoside, and the combination of nucleoside and one or more phosphate groups is called a nucleo-tide. The phosphate groups are esterified to the hydroxyl group on C5 of the deoxy-ribose, whereas the purine or pyrimidine base is attached to C1. Note the free hy-droxyl group on C3.
N
NN
N
N
O
HOH
HH
HH
OPO
O-
O
Base
O
HO
HH
HH
PO
O
O-
N N
N
ON
NN
N
O
N
N N
O
O
H H
H
H
H
H
H
H
Base
O
HOH
HH
HH
NH
O
ON
O
OHOH
HH
HH
HO
2.1
2.62.5
2.4
2.3
2.2
2.7
OP-O
O-
O
P
O-
O
OPO
O-
O
OP-O
O-
O
P
O-
O
Fig. 2.1. Structure of deoxyadenosinetriphosphate (dATP; 2.1), thymine (2.2), guanine (2.3) and cytosine (2.4). The wavy bonds represent the bond to 2-deoxyribose. The dashed lines represent hydrogen bonds. Two nucleotides are linked via a phosphodiester bond (2.5). The sugar ribose (2.6) and the pyrimidine uracil (2.7) are specific for RNA.

A Primer on Genetics, Genomics and Plant Breeding 45
Formation of a chemical bond between two nucleotides occurs via a phosphodi-ester bond, as shown in structure 2.5. This involves nucleophilic attack by the 3' hydroxyl group of one nucleotide on the alpha-phosphate group of another nucleo-tide, which is energetically driven by the release of pyrophosphate (PPi). Hence, polymers of nucleotides will consist of a backbone made of the sugar 2-deoxyribose and phosphate groups. The purine or pyridine base will then protrude from the back-bone. The backbone is typically drawn in the 5'–3' direction. DNA located in the 5' direction relative to a given location (nucleotide) is referred to as ‘upstream’, whereas DNA in the 3' direction is referred to as ‘downstream’. DNA is generally present as a double-stranded helical structure, as determined by the work of James Watson, Francis Crick, Rosalind Franklin and Maurice Wilkins. Watson, Crick and Wilson received the 1962 Nobel Prize in Physiology and Medicine for this work (Franklin died in 1958). The second strand runs in an anti-parallel direction relative to the first strand, in such a way that A and T residues of opposite strands are paired, as are C and G residues. The two DNA strands are held together by hydrogen bonds: two hydrogen bonds are formed between A and T residues, whereas three hydrogen bonds are formed between C and G residues. As a consequence, the anti-parallel DNA strand can be considered as a mirror image of the other strand. The length of double-stranded (ds) DNA is measured in basepairs (bp), with long stretches (such as genes) generally measured in kilobaspairs (kbp or kb), chromosomes in megabase-pairs (Mbp or Mb; 106 bp) and whole (plant) genomes in Gigabasepairs (Gbp or Gb; 109 bp). Chromosomes are discreet and typically very long stretches of DNA. Prior to cell division the chromosomes are condensed to ensure that they can be physically moved and divided among the daughter cells. The condensation is achieved with the help of histone proteins that serve as spools around which the DNA is wrapped. A segment of 146 bp of DNA wrapped around a group of eight histones is called a nucleosome. This stage of condensation can be visualized as beads on a strand. The resulting sring of nucleosomes is condensed into a 30-nm diameter solenoid fiber, which in turn is condensed to a 300-nm diameter chromatin fiber. Somatic cells contain a maternal and paternal copy of each chromosome. The number of chromosomes in somatic cells is designated as 2n, where n is the haploid number, equal to the number of chromosomes in a gamete. The number of chromo-somes in a given genome is indicated by x. A diploid has two copies of each chromo-some, and is designated as 2x. Polyploids are individuals that contain more than two copies of each chromosome. Triploids (3x), tetraploids (4x), hexaploids (6x) and octaploids (8x) are not uncommon among plants. The chromosome configuration in the somatic cells of a hexaploid can be represented as 2n = 6x, whereas in the gamete it would be n = 3x. Autoploids are polyploids that contain multiple copies of the same set of chromosomes, whereas in alloploids the chromosomes are derived from two or more different (but similar) genomes. Genes are discreet units of DNA that generally encode one product, although exceptions exist. Expression of genes through transcription, post-transcriptional processing and, in many cases also translation, results in biochemically functional molecules that affect metabolism or gene expression itself.

46 Vermerris Transcription of genes results in the synthesis of pre-messenger RNA’s (pre-mRNA’s), where RNA is the abbreviation for ribonucleic acid. RNA is different from DNA in that the sugar molecule is ribose (2.6) instead of 2-deoxyribose. Ribose contains a hydroxyl group on C2. Furthermore, RNA does not contain thymine, but instead uracil (2.7), which can basepair with adenine. The pre-mRNA is effectively an RNA copy of the coding strand of the DNA and is synthesized by an RNA poly-merase. The RNA polymerase recognizes the site of gene expression as a result of transcription factors that are associated with a gene’s promoter, a DNA sequence ranging from 300 bp to several kb in length located at the 5' end of the gene. The promoter contains a series of short DNA sequences that are recognized by specific transcription factors. Transcription factors are often under developmental control, or are activated in response to specific environmental cues, and thus regulate gene ex-pression. The transcription factor complex allows the RNA polymerase to bind to the transcription start site, after which the gene can be transcribed. The resulting pre-mRNA includes the coding sequence (exons) that stipulate the amino acid sequence of the protein encoded by the gene, non-coding introns that separate the exons, as well as untranslated regions (UTRs) upstream and downstream of the exons that often have a regulatory function. The 5' end of the mRNA contains a cap, consisting of 7-methylguanosine residue that prevents premature degradation of the mRNA, assists with the transport of the mRNA out of the nucleus, and enhances translation. The 3' end of many mRNA’s contains a stretch of up to several hundred adenine residues, a so-called poly-A tail. Transcription of different classes of genes results in RNA molecules that are the actual functional gene product. This includes the genes encoding ribosomal RNA (rRNA) and transport RNA (tRNA), both of which are involved in the process of translation, as well as small nuclear ribonucleoproteins (snRNPs) involved in splic-ing. Recently, it has become clear that certain small RNA molecules can also play important functions in the regulation of gene expression. Two classes of 21–24-nucleotide long RNA molecules, microRNA’s (miRNA’s) and small interfering RNAS’s (siRNA’s) are known. The miRNA’s, first discovered in the nematode Caenorhabditis elegans (Lee et al., 1993), can basepair with a short stretch of com-plementary sequence in protein-encoding mRNA’s, which will result in repression of translation or cleavage of the mRNA. The discovery of this process has resulted in the identification of many novel miRNA genes encoding RNA molecules that are partially self-complementary. The resulting double-stranded hairpin structures are cleaved by specific enzymes to generate the functional miRNA’s. The siRNA’s also induce degradation of a target mRNA through basepairing with a target sequence (Elbashir et al., 2001). They are not encoded by a separate gene, but instead originate from the target gene itself, as first described by Hamilton and Baulcombe (1999). The siRNA-based mechanism of RNA degradation is called RNA interference (RNAi). The siRNA molecules can also affect gene expression epigenetically, by altering DNA methylation patterns. More detailed information on miRNA’s and siRNA’s can be found in the reviews by Dugas and Bartel (2004), Kidner and Mar-tienssen (2005) and Jones-Rhoades et al. (2006). Translation is the process by which ribosomes – large organelles consisting of rRNA and proteins that are present along the endoplasmic reticulum inside the cyto-

A Primer on Genetics, Genomics and Plant Breeding 47
sol – move along the mRNA. Initiation of translation occurs when the small subunit of the ribosome (in plants the 40S-unit) binds near the AUG start codon, a three-nucleotide unit of translation located near the 5' end of the mRNA. An initiator tRNA, charged with the amino acid methionine (Met) at its 3' end, contains an anti-codon of three complementary nucleotides that allow it to basepair to the AUG start codon inside the acceptor- or A-site in the small subunit of the ribosome. This base-pairing between the start codon and the tRNAMet anticodon allows the large ribo-somal subunit (in plants the 60S-unit) to bind to the small subunit, resulting in a functional ribosome. The RNA inside this ribosome is read codon-by-codon, with each codon getting matched by the anticodon of a tRNA molecule charged with a specific amino acid. The tRNAMet moves from the A-site to the neighboring peptide- or P-site, which opens up the A-site for the next tRNA. The methionine is transferred to the amino acid on this new tRNA via formation of a peptide bond. The empty tRNA is ejected from the P-site, and the tRNA with the two amino acids is tranferred to the P-site. A third tRNA moves in the A-site based on the codon on the mRNA, and the process continues until a stop codon (UGA, UAA, UAG) is encountered, which signals the ribosomal subunits to dissociate. Translation results in the formation of a protein that is catalytically active, or that may need to be further processed (post-translational processing). Processing can include cleavage, glycosylation (addition of sugar molecules), dimerization (associa-tion with a second protein, either the same or different), or association with a non-protein co-factor such as a metal ion. More detailed information on the topics presented in this section can be found in the many textbooks that are available, including the ones by Brown (2004), Hartl and Jones (2005), and Lewin (2008).
2.3 Genetic Variation
Genetic variation results from changes in DNA sequence and is the basis for evolu-tion. In the simplest case, variation in DNA sequence will result in variation in the amino acid sequence of the protein encoded by that gene. The variation in amino acid sequence in turn can affect the way the protein folds, and therefore how it func-tions. Amino acid changes can also impact the active site of an enzyme, either by modifying its shape, which may impact substrate specificity, by altering a critical amino acid involved in catalysis, or by changing the way a co-factor is bound. In the latter two cases the kinetic properties will likely be affected. Variation in regulatory sequences (promoters, upstream activating sequences) can affect the ability of a transcription factor or other regulatory protein to bind to that particular sequence. As a consequence, the spatio-temporal regulation of that gene, i.e. where and when the gene is expressed, is altered. DNA sequence variation may also alter the way a pre-mRNA is spliced, so that the transcript size and sequence are different. This will most likely affect the amino acid sequence of the protein encoded by that gene, but it may also affect the half-life of the mRNA, and/or the efficiency of its transport into the cytosol. Finally, the stability and subcellular localization of mRNA is determined in part by sequence motifs in the 5' and 3' untranslated regions of the mRNA, so that

48 Vermerris variation in these regions can affect the half-life (and therefore abundance), as well as the subcellular targeting of the mRNA. DNA sequence variation can be the result of chemical agents that modify the DNA, including alkylating agents such as diethyl sulfate (DES) or ethylmethyl sul-phonate (EMS), which typically result in point mutations. Exposure to high-energy radiation such as X-rays or gamma rays can cause breaks in the chromosomes or result in deletions. Biological sources of sequence variation are mistakes made by DNA polymerases during DNA replication, and recombination between homologous DNA sequences on two sister chromatids during meiosis. Transposable elements and retrotransposons (discussed in more detail in Section 2.6.2) are mobile genetic ele-ments that are largely responsible for the variation in genome size and sequence among different but related plant species. We refer to different variants of the same gene as alleles. Two alleles of the same gene or locus encode the same protein or RNA, but the level of expression, the ki-netic properties, or the substrate specificity may vary. It is important to realize that the overall function of the protein encoded by two different alleles of the same gene is not different. For example, most people will perceive the chemical 4S-(–)-carvone as a mint-scented compound. Approximately 10% of the population associates this compound with the smell of pears, a phenomenon referred to as anosmia. Anosmia can be the result of a different allele for the gene that encodes the receptor for this compound. The term null allele refers to an allele that is not functional, usually as a result of a mutation. Null alleles are either not transcribed, or the transcribed mRNA is recognized as defective and is degraded (nonsense-mediated mRNA degradation; reviewed by Maquat and Carmichael (2001) and Wilusz et al. (2001)), or any pro-teins that result from the translation of the mRNA are unable to perform their normal function. When an individual is homozygous at a given locus, the paternal and maternal alleles are identical, and that individual is referred to as a homozygote. When the paternal and maternal alleles are not identical, the individual is a heterozygote. Alleles are not to be confused with genes that are part of a multi-gene family. In that case, two DNA sequences within the genome of one specific individual may be very similar, but these two genes represent two distinct genetic loci, i.e. the genes reside at a different position in the genome, and are likely to be regulated differen-tially. Homologs are genes with similar DNA sequences and that encode proteins with the same or similar function. If these two sequences are present within a single genome, they two genes are paralogs. If paralogs are the result of genome duplica-tion, they are referred to as paleologs. Paralogs will often display some differences in their expression patterns (tissue-specificicty, developmental regulation, induced by specific environmental conditions). Orthologs are related sequences in two different species that will often have a common ancestor. In the case of orthologs, the function and expression pattern are generally very similar.

A Primer on Genetics, Genomics and Plant Breeding 49
2.4 Molecular Markers
2.4.1 Definition and Use
As we will see in the section on plant breeding (Section 2.7), exploitation of genetic variation is the basis for crop improvement. Variation in gene content, gene expres-sion and gene functionality can be used to generate novel genotypes with, ideally, superior performance. Since traits of interest – for example, vigor, cold tolerance, disease resistance – have a genetic basis, it is helpful to associate superior genetic performance with specific genetic variation. Molecular markers can be considered as tools to localize and visualize genetic variation among a group of plants, and can be used to associate that genetic variation with a trait of interest. Once the markers have been placed on genetic maps (Section 2.5), they are also helpful for gene cloning (Section 2.6). Current high-throughput genetic analyses enable the genotypic analysis of many individuals at many genetic loci in a short amount of time. Below follows an over-view of the molecular markers that are commonly used. Many of these markers rely on a method called the polymerase chain reaction (PCR), which will be discussed next.
2.4.2 The Polymerase Chain Reaction
The ability to clone DNA was revolutionized by the development of the polymerase chain reaction (PCR). This is an in vitro method for the amplification of specific regions of DNA PCR was developed in 1984 by Dr. Kary Mullis and co-workers (Saiki et al., 1985), who was awarded (half of) the 1993 Nobel Prize in Chemistry for this work. The breakthrough that made PCR possible was the use of a heat-stable DNA poly-merase for the synthesis of DNA. The polymerases are typically isolated from a thermophilic archaebacterium, such as Thermus aquaticus (Taq), Thermococcus gorgonarius (Tgo), or Thermus thermophilus (Tth). These polymerases are primer- and template-dependent, i.e. they require a nucleotide with a free 3' OH group that is part of a short, double-stranded DNA structure, to which they will add a new nucleo-tide that complements the nucleotide on the template strand. The primers are de-signed by the researcher and custom-synthesized commercially. A typical primer is an oligonucleotides (‘oligo’s’) of 18–25 residues, which in most cases ensures that a unique site in the genome of the species of interest is targeted. Exceptions may be oligo’s that bind to repetitive sequences or that bind to a conserved sequence in a gene that is part of a multi-gene family. PCR involves three steps, as shown in Fig. 2.2: (i) denaturation, performed at 94°C, to melt (separate) the two DNA strands of the template, (ii) primer annealing, performed at 45–70°C depending on the length and GC-content of the primer, and (iii) extension, performed at 72°C (or a temperature recommended by the manufac-turer of the enzyme), during which the DNA delineated by the primers is synthesized by the polymerase. This process is repeated 20–40 times, and during each cycle each template strand is duplicated. Consequently, there is an exponential amplification of

50 Vermerris the target DNA, so that PCR based on pico- or nanogram quantities of template DNA will result in enough product to perform further manipulations (sequencing, cloning, transfection).
Fig. 2.2. Schematic representation of the polymerase chain reaction. The two strands of the template DNA are represented by the white and black bars. The upper (forward) and lower (reverse) primers are indicated by a hatched and solid white arrow, respectively. The 5´ and 3´ refer to the corresponding hydroxyl groups on the ribose residue in the DNA backbone, and indicate the directionality of the DNA. DNA polymerases synthesize DNA in the 5´ to 3´ direction.
Step 3: primer extension (72°C)
5’ 3’ 5’ 3’
5’ 3’
5’ 3’ 5’ 3’
5’ 3’
5’ 3’
5’ 3’
5’ 3’
5’ 3’ 5’
5’
3’
3’
5’ 3’
5’ 3’ 5’
Step1: denaturation (94°C)
Step 2: primer annealing (50–70°C)
Next round…..
3’

A Primer on Genetics, Genomics and Plant Breeding 51
Given the expense of the enzyme, PCR is performed in small volumes (10–50 μl) in a thermal cycler, which is a machine specifically designed for this process. PCR conditions typically need to be optimized empirically in order to obtain highly spe-cific products and a reasonable yield. Varying the annealing temperature of the prim-ers, the total number of cycles, and the concentrations of primers, nucleotides, and the cofactor Mg2+ will generally allow the identification of suitable amplification conditions. A variant of PCR is reverse transcriptase- (RT-) PCR. In this case the template for PCR is not genomic DNA, but complementary DNA (cDNA). cDNA is gener-ated from mRNA with the use of a reverse transcriptase. Reverse transcriptases are enzymes that enable retroviruses to generate a DNA product from an RNA template. The reverse transcriptases most commonly used for this application are isolated from Avian Myeloblastosis Virus (AMV) or Moloney Murine Leukemia Virus (MMLV). The thermostable Tth DNA polymerase from the archaebacterium Thermus thermo-philus has also RT activity when manganese chloride (MnCl2) is supplied, allowing RT-PCR to be performed with a single enzyme. RT-PCR is used for (semi-) quanti-tative analyses of gene expression. Gene cloning efforts sometimes benefit from the use of cDNA, because the cDNA’s do not contain introns. Therefore, the cDNA sequence is more informative in determining the gene product.
2.4.3 RFLPs
Restriction Fragment Length Polymorphisms (RFLPs) rely on the detection of DNA sequence variation with the use of restriction enzymes, and visualization of the polymorphism with the use of a labeled DNA probe. RFLPs represented the first DNA markers (Botstein et al., 1980), and provided a much better representation of genetic variance than the protein-based isozyme markers that were prior to that time. RFLP protocols start with the digestion of (typically) genomic DNA obtained from individual plants within a population and their progenitors. The DNA is di-gested with the use of restriction endonucleases, enzymes that cut the DNA at or near specific recognition sites – generally a palindromic sequence – along the chromo-somes. The choice of restriction enzyme has to be determined empirically each time a new parent is used. The DNA is then separated with the use of agarose gel electro-phoresis, and transferred to a nylon membrane (Southern blot). During the subse-quent hybridization, a radioactive or chemically labeled probe – in this case a short (<1 kb) fragment of genomic DNA with a known map location – will hybridize to the matching DNA on the membrane. The site of hybridization is visualized by ex-posing the washed membrane to X-ray film (autoradiography). Since the blot gener-ally contains DNA from the progenitors, the genotype of the individuals in the popu-lation can be assigned based on which RFLP allele is present. RFLPs are co-dominant markers. This means that both classes of homozygotes (A1A1 and A2A2) as well as the heterozygotes (A1A2) can be identified in the population. An example of the use of RFLPs to map genes in maize can be found in the article by Burr et al. (1988)

52 Vermerris 2.4.4 CAPS Markers
Cleaved Amplified Polymorphic Sequences (CAPS) are DNA fragments amplified with PCR that do or do not contain a specific restriction site (Konieczny and Ausubel, 1993). As such, CAPS can be considered as a PCR-based variant of the RFLP marker. When using CAPS, PCR is performed with primers flanking a restric-tion site. The PCR fragment is then digested with the restriction enzyme, and the products are separated on an agarose gel. Presence of the restriction site will result in a cleaved PCR product, visible as two fragments in the gel, versus one fragment for the uncleaved PCR product that does not contain the restriction site. CAPS markers are co-dominant, with the heterozygous individuals represented by three fragments in the gel. An example of the use of a CAPS marker to identify a mutant allele of sor-ghum can be found in Bout and Vermerris (2003).
2.4.5 RAPD Markers
Randomly Amplified Polymorphic DNA (RAPD) is a PCR-based method that was independently conceptualized by Williams et al. (1990), Welsh and McClelland (1990) and Caetano-Anollés et al. (1991). This method uses a single short oligonu-cleotide primer in a PCR at relatively low annealing temperatures (35–47°C). PCR products will be generated when the primer anneals to the genomic DNA in opposite orientation (‘head to tail’, on opposite strands of the DNA) and within a distance that can be reasonably covered by the thermostable DNA polymerase, up to approaxi-mately 2–3 kb, but generally shorter. DNA sequence variation will prevent proper annealing of the primer, thereby eliminating a PCR product. The PCR products are separated and visualized on an agarose gel. Typically, multiple products are ob-served, with a subset representative of one of the parents. The products that segregate in the population in a Mendelian fashion are genotyped based on the parental geno-type. RAPDs are dominant markers, so that heterozygotes can not be distinguished as an individual group. RAPDs have been found to be very sensitive to experimental conditions, and while reproducibility tends to be good within one laboratory, labora-tory-to-laboratory variation tends to limit the utility of RAPD. Grattapaglia and Sederoff (1994) reported on the application of RAPD markers to map traits in Euca-lyptus.
2.4.6 SSR or Microsatellite Markers
Simple Sequence Repeats (SSR), also known as Inter Simple Sequence Repeat (ISSR) or microsatellite markers are PCR-based markers that rely on the detection of variation in the number of dinucleotide- or trinucleotide repeats present among indi-viduals (Taramino and Tingey, 1996). The PCR is performed with two primers, one on each side of the stretch of nucleotide repeats. The PCR products are visualized after electrophoresis through a high-percentage (3–4% w/v) agarose gel or a poly-acrylamide gel. Size polymorphisms of 4–10 basepairs can be identified, as long as the PCR products are appropriately small. SSR markers are co-dominant; heterozy-gotes can be identified because they will generate both parental fragments. In most

A Primer on Genetics, Genomics and Plant Breeding 53
cases the map location of SSR markers is known. Senior et al. (1996) reported the development of SSR markers in maize (Zea mays L.) based on DNA sequences in publicly available databases.
2.4.7 SSLP Markers
Simple Sequence Length Polymorphism markers are conceptually similar to SSR markers, in that size differences in PCR products obtained from different individuals are visualized on agarose or polyacrylamide gels. The variation in size is, however, due to small insertions or deletions (indels) in the target sequence, as opposed to variation in the number of repeated di- or trinucleotides. An example of the use of SSLP markers to map a gene in Arabidopsis can be found in Ryals et al. (1997). SSLP markers are co-dominant markers.
2.4.8 SSCP Markers
Single-Stranded DNA Conformation Polymorphism (SSCP) markers are PCR-based markers that rely on sequence variation that impacts the conformation of single-stranded DNA molecules obtained by denaturing the PCR products (Orita et al., 1989; Beier, 1993). Sequence variation can be due to nucleotide changes, small in-sertions or deletions, or variation in the number of di- or trinucleotide repeats. The procedure involves heating the PCR products to 94°C for several minutes to make them single stranded. Rapid cooling of the denatured DNA fragments prevents rean-nealing. The single-stranded DNA molecules are separated on a polyacrylamide gel. Visualization of the products is accomplished with either silver staining or, when radioactively labeled nucleotides are used during PCR, via autoradiography. SSCP markers are co-dominant. An example of the development of SSCP markers in two pine species can be found in Plomion et al. (1999).
2.4.9 AFLP® Markers
Amplified Fragment Length Polymorphism (AFLP®) is a PCR-based method that was first developed by Vos et al. (1995). The method is a registered trademark of Keygene N.V. (Wageningen, the Netherlands). The method relies on the digestion of DNA with two restriction enzymes, one enzyme that cuts frequently, and one en-zyme that cuts infrequently (a function of the size of the enzyme’s recognition se-quence). Restriction-site-specific adaptors are then ligated on the genomic DNA fragments. PCR is performed with primers complementary to the adaptor sequence. This is generally done in two subsequent rounds of amplification, a preamplification to generate adequate amounts of template, followed by a selective amplification in which primers are used that are complementary to the adaptor sequence at the 5' end, but that contain an additional one or two nucleotides at the 3' end. The many DNA fragments that are generated this way are visualized on a polyacrylamide gel. The visualization is typically based on the use of a radioactively labeled nucleotide fol-lowed by autoradiography. Alternatively, silver staining can be used to visualize the DNA (Chalhoub et al., 1997). Sequence variation at the restriction sites and at the

54 Vermerris target sites for the primers used during the selective amplification contribute to polymorphisms. As a consequence, the AFLP® technique is a powerful method to identify polymorphisms between individuals. While the initial preparation of the DNA template is somewhat labor intensive, a benefit is that a different set of DNA fragments from the same initial pool can be accessed simply by changing the selec-tive nucleotide(s) in the second round of PCR. The method does require well-developed molecular biology skills and more laboratory equipment than is common for most of the other marker protocols. Vuylsteke et al. (1999) developed an AFLP®-based linkage map of maize.
2.4.10 SNP Markers
Single Nucleotide Polymorphisms (SNP) markers are PCR-based markers that detect genetic variation at the nucleotide level (Lindblad-Toh et al., 2000; Syvanen, 2001). This is considered the most powerful type of marker available at the current time. The method relies on a highly specific PCR reaction in which one of the primers (either the forward or reverse primer) is designed in such a way that PCR will only be successful if there is a perfect match with the template sequence. The second primer is designed in such a way that it will anneal at a temperature above the an-nealing temperature of the allele-specific primer. As a consequence, a divergent genetic variant that contains a different nucleotide at the critical location will not result in amplification. SNP markers are dominant markers, but the use of specific primers that match each of the known alleles will enable accurate genotyping of both alleles at a given locus. Ching et al. (2002) used SNP markers to study genetic diver-sity in elite maize inbred lines.
2.5 Genetic Maps
Nuclear DNA in plants is organized in linear structures, the chromosomes. As a consequence, alleles at different genetic loci do not always segregate independently in the next generation. Alleles of genes located on the same chromosome are more likely to be inherited together than alleles of genes located on different chromo-somes. This phenomenon is referred to a genetic linkage. Recombination through crossing-over during meiosis I is responsible for the disruption of the original (paren-tal) combination of alleles. Crossing-over involves physical contact, and the breaking and rejoining of homologous chromosomes. In other words, there is an exchange between the paternal and maternal copy of the chromosome, resulting in a new com-bination of alleles. Recombination is more likely to occur when two loci are rela-tively far apart, and will happen only occasionally between tightly linked loci. The linkage between loci can be exploited for the generation of genetic maps. The traditional genetic maps were based on mutant phenotypes (seed color, fruit color, leaf shape, leaf stripes, dwarfism, etc.). In this case mutations at several differ-ent loci are combined in the same plant (through crossing), and the plant carrying these mutations is crossed with a wild-type (normal) plant. The resulting F1 progeny is self-pollinated to produce an F2 population. The generation of the F2 population

A Primer on Genetics, Genomics and Plant Breeding 55
will have allowed recombination to occur, and the F2 plants can be scored for the various mutant phenotypes. Assuming the F2 population is adequately large, it will be apparent that mutations at linked loci will most commonly be inherited together. The percentage of recombinants (apparent by the presence of only one of the two mutations in one individual) provides an indication of the distance between the loci. The genetic distance is measured in centiMorgan (cM). A distance of 5 cM between two loci means that there is a 5% probability of a crossing-over event between those two loci in a single generation. A distance of 50 cM means the two loci are not linked. The advent of molecular markers, discussed in Section 2.4, has facilitated the construction and use of linkage maps, because there are only a limited number of mutations with visual phenotypes, and it can be quite labor intensive to combine them in one parent plant. Molecular markers can be used for the construction of linkage maps as long as the two parents are polymorphic for a given marker. Physical maps refer to genetic maps that are based on actual DNA sequence. The first stage is typically the placement of a gene on a bacterial artificial chromosome (BAC). A BAC is a bacterial replicon (vector) containing a large-insert (>100 kb) of plant genomic DNA that can be propagated in bacterial cells, usually E. coli lab strains. Most (plant) genomes sequenced to date were based on a combination of-BAC-end sequencing and ‘shotgun sequencing’ of short (1–3 kb) overlapping DNA fragments. The sequencing of BAC ends enables the establishment of a minimal BAC tiling path spanning an entire chromosome, and the short sequences obtained from the shotgun sequencing are assembled into contiguous stretches of DNA (‘con-tigs’) and placed on individual BACs. Although the addition of the shotgun sequenc-ing is computationally more intense, it drastically expedited the sequencing of the human genome (Venter et al., 2001) relatively to the original BAC-based sequencing approach (Lander et al., 2001). The sequencing reaction is typically performed using the traditional dideoxy-sequencing method developed by Sanger and colleagues. This method relies on chain termination when a dideoxynucleotide (ddNTP) is in-corporated in DNA strand that is being copied by a DNA polymerase based on the template strand. In addition, one of the (regular) nucleotides is radioactively labeled. The sequencing products are then separated using polyacrylamide gel electrophore-sis, and visualized via autoradiography. The use of fluorescently labeled ddNTPs in combination with capillary electrophoresis led to a major improvement of sample throughput. Several new, high-throughput sequencing methods have been developed in the recent past. This includes Massively Parallel Signature Sequencing (MPSS; Brenner et al., 2000). This method has evolved to the Solexa platform marketed by Illumina, Inc. (San Diego, CA). Approximately 1 Gb of sequence can be collected as short 930–40 nt) sequence reads in a single experiment. An alternative sequencing tech-nology is 454 sequencing (Margulies et al., 2005). The average sequence read length is currently 220 nucleotides, but this is expected to increase. It is possible to se-quence 30 million nucleotides in a single experiment with this technology. The equipment is marketed by Roche (Indianapolis, IN). A third method is referred to as SOLiD (Sequencing by Oligonucleotide Ligation Detection), developed by Applied

56 Vermerris Biosystems (Foster City, CA). This process results in an average read length of 35 nucleotides, with up to 3 Gb of sequence generated per run. The availability of a species’ genome sequence makes it possible to link the ge-netic map (based on recombination distances) and the physical map (measured in basepairs). The relationship between the distance based on linkage maps and the distance based on physical maps is not constant, because the probability of recombi-nation between loci is constrained by the intrinsic physical and chemical properties of DNA and chromosomes. For example, when considering three linked loci, calcu-lating the genetic distance involves accounting for the so-called double recombi-nants. They originate from two cross-over events, one event between each of the adjacent loci. If the three loci are tightly linked, the physical dimensions of the chromosome will obstruct the crossover, a phenomenon known as interference and the number of double recombinants will be lower than would be expected based on adding the distance between the two pairs of loci.
2.6 Gene Identification and Isolation
In order to understand the genetic basis of traits of interest, it is often helpful to iden-tify and isolate the gene or genes that confer those traits. This will eventually enable the direct selection of individuals with the desired genetic make-up. A number of strategies are available to identify genes of interest, as discussed below.
2.6.1 Isolation of Mutants
Mutants have genetic defects that result in complete or partial loss of gene function, or that result in the gene being expressed at a different developmental stage or in a different tissue. The basis for a mutant phenotype is a mutation in the DNA. Mutant phenotypes are of great help in the identification of genes that are involved in a proc-ess of interest, such as a biochemical pathway, a disease response, or a hormone-controlled process. Forward genetics refers to the identification of novel genes based on the identifi-cation of mutants in which the process of interest is disrupted or no longer func-tional. For example, if we are interested in understanding lignin biosynthesis (see Chapter 4), we can learn what genes are involved in lignin biosynthesis by studying mutants that produce less lignin. Once we identify the gene that is mutated in that mutant, we know it has to play a role in lignin biosynthesis. Reverse genetics refers to the identification of gene function when we know the sequence of a particular gene, but do not know what its role is. By identifying a mutant in which the gene of interest is disrupted, and by studying its phenotype, we can infer the function of that gene. For example, if we disrupt a gene and the result-ing plants make white instead of purple flowers, we know that the gene we disrupted is somehow involved in the formation of a red pigment in the flowers. For gene identification purposes the most convenient way to generate mutants is through insertional mutagenesis (see Section 2.6.2), but the chemical and physical agents listed before are also of value when insertional mutagenesis is not possible.

A Primer on Genetics, Genomics and Plant Breeding 57
2.6.2 Insertional Mutagenesis
Insertional mutagenesis is based on the insertion of a known sequence, referred to as a tag, in the gene of interest. Depending on whether the tag is a transposable element or T-DNA, the method of cloning genes is referred to as transposon tagging or T-DNA tagging (Walbot, 1992). Transposable elements (transposons), are mobile ge-netic elements that were first discovered in maize (Zea mays L.) by the late Dr. Bar-bara McClintock (McClintock, 1947), who won the 1983 Nobel Prize in Medi-cine/Physiology for her pioneering research. The three major transposable element systems in maize are Activator (Ac)/ Dissociation (Ds), Supressor mutator (Spm)/ defective Suppressor mutator (dSpm) and Robertson’s Mutator (MuDR)/ Mu. The Spm/dSpm system is also known as Enhancer (En)/ Inhibitor (I). All of these trans-poson systems are two-element systems: the first element – Ac, Spm (En), MuDR – is the autonomous element which encodes the transposase enzyme necessary for trans-position, and the second element is the non-autonomous element, which can only transpose in the presence of an active autonomous element. In addition to these transposable element systems, the maize genome contains many other transposable elements, as well as retrotransposons. The latter class of mobile elements replicate through an RNA intermediate. The other species in which transposable elements are commonly used for cloning purposes is snapdragon (Antirrhinum majus). The ele-ments in this species are called Tam, where Tam1 is the autonomous element and Tam2 is the non-autonomous element. Several additional Tam elements have been identified (reviewed by Schwarz-Sommer et al., 2003). The Ac and Spm (En) sys-tems have also been used in species that do normally not harbor transposable ele-ments themselves, including the model plant Arabidopsis, tomato (Lycospersicon esculentum) and tobacco (Nicotiana tabacum). T-DNA is DNA transferred by the soil borne pathogen Agrobacterium tumefa-ciens. This bacterium transfers T-DNA, which is harbored on the bacterium’s tumor-inducing (Ti) plasmid, to cells of the host plant via wound sites. The T-DNA then integrates in the genome of the plant, in a more or less random fashion. If the T-DNA inserts into a gene, the gene will likely loose its normal function. The principle of Agrobacterium-mediated transformation of plants has been reviewed by Gelvin (2000, 2003). There are two strategies to use insertional mutagenesis for cloning purposes. One is the direct tagging approach. In this case a mutant, for example a spontaneous or chemically induced mutant, has already been identified, but no information on the nature of the mutated gene is available. The mutant is then crossed with a wild-type line carrying an active transposable element, and the F1 progeny is screened for the presence of a plant with the mutant phenotype. Such a mutant will only be identified if the wild-type allele of the gene of interest has been mutated, presumably as the result of an insertion. The second approach that can be taken is the random tagging method. This method is based on the principle that the insertion elements can insert in any gene, so that all of the genes controlling the trait of interest can be uncovered as long as the mutation is not lethal. Since most mutations are recessive, meaning that both the maternal and paternal copies of the gene need to be defective in order to see a mutant

58 Vermerris phenotype, the screening is typically performed using F2 families in which mutations will segregate. Given the relative low mutation rate (1:10,000–1:1,000,000), large populations of plants need to be screened. Therefore, an efficient method of screen-ing has to be available in order to identify mutants of interest. Once an insertional mutant with the desirable phenotype has been obtained, the cloning strategy is similar, regardless whether transposons or T-DNA were used. In the direct tagging strategy, the mutant is crossed with a wild-type plant to produce F1 progeny. Since most mutations are recessive, the F1 progeny is self pollinated to produce F2 progeny. The plants of the F2 population are scored for the presence of the mutation. DNA is isolated from these plants, as well as from the wild-type sib-lings. In the case of the random tagging strategy, DNA is isolated from the mutant and the wild-type siblings from the same family. Under both scenarios, the isolated DNA is then used to identify the insertion element that is likely the cause of the mutation. There are several methods available to do this, including the use of the traditional Southern blot hybridized with a radioactive or chemically labeled probe that will hybridize to the insertion element (Fedoroff et al., 1984; Tan et al., 1997), methods based on PCR (Liu et al., 1995; Frey et al., 1997; Ribot, 1998; Settles et al., 2004), or plasmid rescue (Behringer and Medford, 1992; Meyer et al., 1996). All of these methods will ultimately result in the isolation of the DNA adjacent to the inser-tion element, which is typically the gene of interest. Sequencing of this DNA fol-lowed by homology searches in the large public sequence databases, such as Gen-Bank (accessible via http://www.ncbi.nlm.nih.gov) can then provide information on the identity and function of the gene of interest. The function will ultimately need to be tested with additional experiments.
2.6.3 Map-Based Cloning
Map-based cloning strategies work best with species with completely sequence ge-nomes. At this time plant genomes that have been sequenced include the model plant Arabidopsis thaliana (The Arabidopsis Genome Initiative, 2000), rice (Oryza sativa; International Genome Sequencing Project, 2005), poplar (Populus trichocarpa; Tuskan et al., 2006) and sorghum (http://www.phytozome.net/sorghum), with the maize genome sequence expected to be complete in the spring of 2008. When using map-based cloning, the first step after identifying a mutant of inter-est is mapping the mutation. This is achieved by crossing the mutant with a wild-type plant that has a different genetic origin. This will generate an F1 population, which, is self pollinated to produce a segregating F2 population. The mutants and wild-type plants are identified in this F2 population, DNA is isolated, followed by the determi-nation of the genotype of these plants at a large number of genetic loci across the genome. Genotyping is generally performed with molecular markers (Section 2.4). Map-ping the mutation involves identifying the molecular marker(s) that are associated with the presence of the mutation. If the mutation is closely linked to a particular marker, the mutant plants will show predominantly the marker allele from the mutant parent, whereas the wild-type plants will show the marker allele from the wild-type parent. Once the precise map location has been determined, the gene sequence can be

A Primer on Genetics, Genomics and Plant Breeding 59
obtained based on the available genome sequence. The map interval to which the mutation has been mapped generally contains many different genes. Some of these genes can be discarded based on their known or deduced function. The other will have to be tested through expression analysis or sequencing. Introduction of a wild-type copy of the gene into a mutant plant via transformation (Section 2.8) and show-ing that the transformed plants have a wild-type phenotype is proof that the right gene has been identified. An example of a gene cloned based on its map position can be found in Franke et al. (2002).
2.6.4 The Candidate-Gene Approach
The candidate-gene approach (Pflieger et al., 2001) became possible after the estab-lishment of large DNA and protein databases. When using this approach, a mutant of interest is characterized chemically or physiologically, and based on the knowledge of the pathway most likely affected by the mutation, a candidate gene is proposed. The candidate gene is defined as the gene that, if it were defective, would cause the observed mutant phenotype. Once such a candidate gene has been proposed, the sequence databases can be searched in an attempt to identify DNA or protein se-quences from the candidate gene. If the DNA sequence is available in a database, PCR can be used to obtain the gene from the mutant. After sequencing the gene, sequence comparison between the gene from the mutant and the sequence in the database (or better yet, the sequence obtained from the wild-type progenitor of the mutant) can reveal whether the candidate gene is the gene that is responsible for the mutation. If no mutations are identified during the sequence comparison, additional sequence, especially from the upstream regulatory elements, needs to be obtained in order to exclude the candidate gene from further consideration. If there is no evi-dence for mutations, a new candidate gene needs to be considered. This approach will also work if the sequence of the candidate gene is available from a different but related species, because of the high degree of sequence homology between related species. The efficiency of the candidate-gene approach can be improved considerably if comparisons between the mutant and a wild-type (progenitor) show differences in gene expression (observed via northern blots or RT-PCR), differences in enzyme activity, or differences in the amount of protein (observed via western blotting) (Bout and Vermerris, 2003). If differences are observed prior to the cloning of the candi-date gene, the evidence in support of the candidate gene being mutated and responsi-ble for the mutant phenotype is much stronger. It is, however, possible that the muta-tion has no impact on gene expression levels, but that the mutation results in reduced enzyme activity nonetheless.
2.6.5 Gene Identification Based on Differential Gene Expression
There are several methods for identifying and cloning genes that rely on variation in gene expression. The methods have in common that they assume that variation in phenotype – either two (nearly) identical plants in different environments or two different plants in the same environment – is the result of differential gene expres-

60 Vermerris sion. So when we can identify those genes that are expressed at a higher or lower level in one environment or in one of the plants, we infer that those genes must be responsible (in part) for the observed phenotype.
2.6.5.1 Differential Display
Differential display (Liang and Pardee, 1992) relies on the amplification of cDNA with arbitrary PCR primers, more or less analogous to the use of RAPD markers (Section 2.4.5). The PCR products are visualized on an agarose or polyacrylamide gel and fragments present in one of the samples are isolated, cloned, and sequenced. The cDNA sequence that is thus obtained may reveal gene function. This method is not widely used due to its high false-positive rate compared to some of the other methods that are available (see below), and what is perceived as poor reproducibility between laboratories.
2.6.5.2 Subtractive Hybridization
Subtractive hybridization (Sargent and Dawid, 1983) involves hybridization of cDNA obtained from two samples, a control and a treatment. Treatment is used here in the broad sense, as it could also refer to a comparison between mutant and wild type. The target or tester pool consists of cDNA’s representing genes up-regulated as a result of the ‘treatment’. A driver pool is used to eliminate those cDNA’s that represent genes that are not differentially expressed in the treatment- and control-samples. The driver pool is supplied in excess of the target pool. The hybridization occurs in solution. Different methods have been developed to obtain the pool of cDNA’s that represent the overexpressed genes (Sargent and Dawid, 1983, Hendricks et al., 1984; Duguin and Dinauer, 1990; Hara et al., 1991). One method relies on the labeling of the target cDNA with biotin. The biotinylated cDNA’s can be captured with the use of streptavidin-labeled paramagnetic beads. With the use of a magnet, the beads can be captured, and the resulting supernatant containing the undesirable cDNA’s can be discarded. Another method is PCR-based (Diatchenko et al., 1996) and relies on the ligation of short linker sequences to the target cDNA fragments. Because of the excess of driver cDNA’s, after hybridization the cDNA’s representing genes expressed at similar levels in both pools are present as het-erodimers (hybridization between complementary driver and target cDNA) and homodimers (hybridization between complementary driver cDNA’s). Amplification with primers specific for the adapter sequence on the target cDNA’s will result in products representing overexpressed genes. By swapping target and driver pools, genes underexpressed as a result of the treatment can be identified. It is important to realize that this method is only suitable for the comparison of one treatment and one control, and not for the analysis of gene expression over time. Shi et al. (2006) used subtractive hybridization to identify differentially expressed genes in a maize brown midrib mutant.

A Primer on Genetics, Genomics and Plant Breeding 61
2.6.5.3 cDNA-AFLP®
This method, first described by Bachem et al. (1996), is based on the same principle as the AFLP® technique described in Section 2.4.9. The major difference is that in this application double stranded cDNA is used, instead of genomic DNA. The prod-ucts are separated on a polyacrylamide gel and visualized using autoradiography. A major benefit of this method is that it allows the monitoring of gene expression over time, for example to evaluate gene expression during a developmental time course, or to assess the impact on gene expression of a treatment, such as a hormone applica-tion, change in temperature or light regimen.
2.6.5.4 Microarrays
Microarrays (Schena et al., 1995), also known as gene chips, are a high-throughput hybridization method to evaluate the expression of many genes. For certain species, whole-genome arrays are available, that offer the opportunity to evaluate the expres-sion of all genes of that species at the moment the tissue or organs of interest were harvested. The method is based on hybridization of labeled cDNA pools to target DNA on a small (several cm2) glass slide. The DNA is deposited in nanoliter drop-lets using a set of metal pins that are dipped in DNA solutions representing different genes. The hybridization is performed with two pools of labeled cDNA’s represent-ing contrasting samples (mutant versus wild type, susceptible versus resistant, treat-ment versus control, etc.). Each pool has its own fluorescent label. Cy3 and Cy5, which upon excitation with UV light emit green and red fluorescence, respectively, are the most commonly used dyes. After the hybridization, the fluorescence at each spot on the slide is measured. When Cy3 and Cy5 are used, equal levels of gene expression in the two samples results in yellow fluorescence. Overexpression of a gene in the sample prepared with Cy5-label will result in green fluorescence, whereas underexpression of a gene will result in green fluorescence. Microarrays are powerful tools to study gene expression, but due to the large number of genes that are being monitored, it is important to control those factors that may result in changes in gene expression, but that are not related to the process of interest. Mi-croarrays require sophisticated and expensive equipment, and the hybridizations are typically performed in specialized facilities. Unlike most of the other methods de-scribed in this section, the printing of the slides requires a priori knowledge of the gene sequence, though not necessarily of the gene function. Wayne and McIntyre (2002) used a combination of microarray analysis and QTL mapping to identify candidate genes in fruit flies (Drosophila melanogaster).
2.6.5.5 High-Throughput cDNA Sequencing
New technology developed as a result of the genome sequencing efforts, has signifi-cantly reduced the effort and expense associated with sequencing. As a consequence, it has now become feasible to evaluate gene expression based on cDNA sequencing. This was first based on the sequencing of expressed sequence tags (ESTs). An EST is a short (300–500 nucleotide) sequence obtained from sequencing the 3' or 5' end of

62 Vermerris a cDNA clone in a library that consists of cDNA’s cloned in a plasmid or bacterio-phage vector. The sequencing reaction is typically performed using the traditional dideoxy-sequencing method developed by Sanger and colleagues (see Section 2.5). The basis for expression profiling using EST libraries is the assumption that highly expressed genes will produce high levels of mRNA, so that cDNA libraries will contain more copies representing those genes. With the development of the new, high-throughput technologies described in Section 2.5, expression profiling as a tool to identify the basis for variation in pheno-types has been taken to a whole new level.
2.7 Plant Breeding Principles
2.7.1 Identification and Combination of Genetic Variation
The goal of plant breeding is the development of genetic variants of herbaceous and woody crop species with new and improved phenotypes. This is achieved primarily by the generation of new combinations of existing genetic variation created by muta-tions. The following example is provided to illustrate the basis of plant breeding. If we consider gene A with two different alleles (A1 and A2), and we cross two diploid plants that are homozygous (containing identical alleles at this locus) for contrasting alleles, A1A1and A2A2, the F1 progeny will be heterozygous (one copy of each allele; A1A2), but the F2 progeny derived from self-pollinating the F1 plants will represent three genotypic classes: A1 A1, A1A2, and A2.A2 If we now add a second gene B, also with two alleles (B1 and B2), there are nine (32)different genotypes in the F2 genera-tion: A1A1B1B1, A1A1B1B2, A1A1B2B2, A11A2B1B1, A1A2B1B2, A1A2B2B2, A2B1B1, A2 A2B1B2, A2 A2B2B2. Consequently, when the total number of genes is considered – for plants estimated to be between 20,000 and 50,000 – and when additional alleles are considered (for example, A1A2 × A3A4), the number of possible genetic combina-tions approximates infinity. The challenge is to identify the most desirable individu-als from within the population of different genotypes. Plant breeding begins with the evaluation of parents for traits of interest. This can be height, maturity, yield, chemical composition of the oil, starch or fibers, tolerance to drought, heat, or cold, and resistance to pests and diseases. In general parents are selected for mating because they each have several non-complementary attractive characteristics. For example, one parent may be resistant to a specific fungal disease and yield a lot of grain, whereas another parent yields high biomass and is resistant to an insect pest. In the ideal case some of the progeny from these two parents will display all four favorable traits, without compromises to the overall performance. Several excellent textbooks exists that describe the principles and practice of plant breeding in detail, including Poehlman (1987), Fehr (1987a,b) and Hallauer and Miranda (1988).

A Primer on Genetics, Genomics and Plant Breeding 63
2.7.2 Quantitative Traits
Quantitative traits such as, for example, weight, height and yield, show a continuum in values because they tend to be controlled by multiple independent genetic loci. In addition, they are influenced by the environment. In the case of plant height, factors such as, for example, rainfall and soil mineral concentrations will determine the actual height of an individual plant. If we plot the distribution of the values for a quantitative trait, we ideally observe a normal distribution with mean μ and variance σ2. This variance is the total vari-ance, or phenotypic variance, and is designated as σp
2. The phenotypic variance σp2
can be divided in a genetic component σg2, an environmental component σg
2 and variance due to genotype × environment interactions σge
2. This latter term reflects the fact that the best-performing genotype in one environment may not be the best-performing genotype in a different environment. The genetic variance σg
2 can be further divided in variance due to additive (σA
2), dominance (σD2), and epistatic (σI
2) effects. Additive genetic variance is heritable, whereas dominance and epistatic variance are not. Dominance effects depend on the interaction of two alleles at a locus, and epistatic effects depend on the interaction between alleles at different loci. These interactions are unpredictable when crosses are made and genomes recombine. In contrast, additive effects reflect the contribution of an allele per se. The heritability (h2) of a trait is defined as the ratio of the genetic variance over the phenotypic variance. In other words, it expresses how much of the observed phenotypic variance is attributable to genetic factors. This particular definition (For-mula 2.1) is referred to as broad-sense heritability, whereas heritability in the narrow sense is the ratio of additive genetic variance over the phenotypic variance (Formula 2.2).
The individual variance components are calculated from measurements of the quantitative trait of interest within populations generated through specific crosses (half-sib, full-sib populations). A detailed overview of heritability, including defini-tions and calculation methods, is provided by Holland et al. (2003). The identification of genes controlling quantitative traits is more complex than the identification of genes controlling traits that are inherited in a qualitative or dis-crete manner, such as, for example, flower color. A quantitative trait locus (QTL; this is also the abbreviation for the plural, quantitative trait loci), defined as a genetic locus delineated by two molecular markers on a genetic map and affecting a quanti-tative trait of interest, can be identified in an F2 population generated from two pa-rental lines that differ as much as possible from each other with respect to the trait of
h2 = σA
2
σp2 (2.2)
h2 = σg
2
σp2 (2.1)

64 Vermerris interest. By evaluating a large F2 population (at least several hundred individuals) one ensures that so many recombination events between the two parental genomes are represented, that the two parental genomes have essentially been shuffled. The individual plants in the F2 population are evaluated for the trait of interest, and their genotypes are established with the use of genetic and/or molecular markers. One of several possible statistical analyses is performed to identify associations between the trait of interest and specific alleles at various genetic loci (Coffman et al., 2003). In the simplest scenario, all individuals with high values for the trait share a particular allele at a given locus, and the individuals with low values for the trait share the other allele at that locus. The F2 population should be evaluated in several locations and/or years to sepa-rate the genetic and environmental effects on the trait. The QTL is then mapped to a region of the chromosome. Oftentimes, several QTL are identified for a given quan-titative trait, each representing a portion of the variance for the trait. A dense marker map will help narrow down any chromosomal regions of interest as much as possi-ble. The identification of a QTL will often lead to the identification of a candidate gene at that position. When the genome sequence is available, one or more candidate genes can be identified relatively easily and evaluated further. When the genome sequence is not (yet) available, map-based cloning using, for example, BACs can be considered, as long as the map interval is small enough and sufficient resources are available. Further background on the theory and application of QTL mapping, can be found in the review by Doerge (2002). An excellent reference on quantitative genet-ics in general is the book by Falconer and Mackay (1996).
2.7.3 Selection
Once suitable parents have been identified and crossed, selection of favorable re-combinants typically starts in the F2 progeny, which will be segregating for many traits, and therefore show a large degree of phenotypic variation. Based on the exam-ple of allelic combinations in the previous section, it is critical to plant a large popu-lation to ensure individual plants with the desired combination of traits can be identi-fied. Several selection methods exist, as will be discussed below. The goal of each of these methods is to develop a cultivar (see Section 2.7.5), which is novel genetic material (germplasm) with enhanced properties for a given geographic region and a given end-use. The challenge is to identify individual plants that express desirable traits, and to propagate them in such a way that an entire population derived from a selected individual is phenotypically uniform. This generally means creating plants that are homozygous at many loci. Such lines are referred to as inbred lines. An attractive feature of inbred lines is that the majority of the genetic variance is due to additive genetic variance. Selection is complicated by the fact that most agronomic traits are influenced by the environment. It is therefore impossible to distinguish (in one field) those indi-viduals that have a superior genotype, but that are negatively affected by the local environment, from those individuals that have an inferior genotype, but that enjoyed favorable environmental conditions. As a consequence, when we select plants with

A Primer on Genetics, Genomics and Plant Breeding 65
desirable characteristics from a population, the mean value of these selected indi-viduals for a quantitative trait of interest will typically be higher than the mean of the population derived from intermating the selected individuals. The term ‘genetic gain’ (G or ΔG), also referred to as ‘response to selection’ (R), expresses the change in the population mean between the offspring and their parents as a function of the selection differential (designated S, D or ΔP). This parameter is calculated as the difference in the mean between the selected parents and the overall parental population. G is a function of the narrow sense heritability, as shown in Formula 2.3:
2.7.3.1 Bulk Method
This method is a very straightforward procedure to generate inbred lines in self-pollinating or outcrossing species. The segregating F2 population is planted and pollinated. The F3 seeds from these plants are harvested in bulk (i.e. all seeds are together in one big bag). A sample of the F3 seed is planted and the F4 seeds from these plants are harvested in bulk. A sample of the F4 seed is planted to generate F5 seed. During the generation advancement, natural selection is expected to remove those plants from the population that do not have the desired traits. For example, when the goal is to develop insect-resistant lines, selection in the presence of the insect pest will increase the representation in the population of insect-resistant plants, whereas susceptible plants are eliminated. A sample of the F5 seed is planted, but now seed from individual F5 plants is harvested. The progeny rows, which at this stage represent inbred lines, are evaluated for the traits of interest. The rows that do not look desirable are discarded, whereas individual selected rows are harvested in bulk. The selected lines are subjected to extensive testing at multiple locations and in multiple years, and the lines with the best overall performance are bulked up for release. One of the disadvantages of this method is that off-season- or greenhouse nurseries are only feasible if the same selection conditions can be achieved as in the targeted production area; this is often not the case.
2.7.3.2 Single-Seed Descent Method
In contrast to the bulk method discussed in the previous section, the single-seed descent (SSD) method is suitable for use in off-season- or greenhouse nurseries. A distinguishing feature of this method is that it separates the inbreeding phase of line development from the selection phase. Since no selection is applied during the in-breeding phase, the use of off-season- or greenhouse nurseries enables the breeder to make more rapid progress. The most common strategy in the SSD method is referred to as the single-seed procedure. A segregating F2 population is grown. One F3 seed from each plant in the
G = h2 S (2.3)

66 Vermerris population is harvested and the seeds are bulked. In addition, one seed per plant is harvested individually and kept in reserve. During the next season, the bulked F3 seed is planted and the procedure from the first season is repeated. This process is repeated until the level of inbreeding is such that an adequate level of homozygosity (apparent based on uniformity) has been achieved. Individual plants are then har-vested, typically in the F5 generation. The rows grown from these individual plants are evaluated for the traits of interest. Selections among rows are made, and the seeds from individual rows are harvested and bulked. The seeds from these selected rows are subjected to extensive testing across multiple locations and during multiple years to identify the lines with the best overall performance. Each of the lines can be traced to a single plant in the F2 population. A variation of this method is the multi-seed procedure, in which not one, but two or three seeds are harvested from a single plant, and all seeds are bulked, without maintaining a reserve. This procedure avoids under-representation of certain genotypes as a result of poor seed germination.
2.7.3.3 Mass Selection
Mass selection refers to the selection of those plants from a segregating population that express a trait above a certain threshold. It is the oldest method of selection, applied in prehistoric times as humans transitioned from reliance on hunting and gathering to agriculture as a means of subsistence. It is typically used in self-pollinating species. As an example, when selecting for height, a breeder could use mass selection to obtain seeds from only those plants that exceed a specific height. The seeds from these selected plants is bulked and planted in the next season. The same selection scheme is then applied. As long as the trait under selection has a high enough herita-bility, the population average will change in the desired direction as a result of the applied selection. The process is continued until an adequate level of homozygosity has been achieved. At that point, seeds from individual plants are planted in a row, the rows are evaluated for the traits of interest, and the seeds from individual rows are harvested and bulked. After extensive testing the best-performing lines can be released. Mass selection is most effective in self-pollinating species, because the degree of homozygosity increases with each generation. The procedure is, however, also used in cross-pollinating species, but in this case the level of homozygosity depends on the allelic frequencies. The more diverse the parents were, and the larger the population of selected individuals, the longer it will take to achieve homozygo-sity. When using mass selection, it is important that the trait under selection is ex-pressed. As a consequence, the use of greenhouse- or off-season nurseries may not be feasible.
2.7.3.4. Pedigree Method
The pedigree method is applicable to self-pollinating species and to cross-pollinating species that do not have self-incompatibility. The method distinguishes itself from the above-described methods in that from the very beginning the evaluation of se-lected plants is based on the progeny. The procedure begins with selection of indi-

A Primer on Genetics, Genomics and Plant Breeding 67
vidual plants from within a segregating F2 population. Seeds from the selected plants are harvested (but not bulked) and planted in individual rows during the next season. The rows are evaluated: the poor-performing rows are discarded, and the best F3 plants in the best rows are selected. The seed from each selected plant is planted in an individual row. If more than one plant was selected in the previous generation, the progeny rows that are derived from the same F2 plant are referred to as a family. Selection involves identifying the best families, the best rows within a selected fam-ily, and then the best plant(s) within the selected rows. The process is repeated until an adequate level of homozygosity has been achieved, typically until the F5 or F6 generation. This is apparent from a low level of within-row variation. The best rows from the selected families are then harvested in bulk and subjected to extensive test-ing. As with several of the other methods, the use of greenhouse- or off-season nurs-eries is only feasible if proper selections can be made. This method tends to also require considerably more space than the other methods, because of the need to plant families early on in the inbreeding and selection process. The selection of families and rows within families is most effective when performed consistently by the same individual. Figure 8.4 in the chapter on sorghum provides a nice schematic represen-tation of the pedigree method.
2.7.3.5 Backcross Method
Backcrossing refers to the introgression of one or a limited number of desired alleles from one parent – the donor – into the genome of an acceptor parent. The acceptor parent is generally desirable because of its overall performance, but the supposition is that the performance can be further enhanced if one or two specific alleles are introgressed. Common applications of backcrossing include the introduction of race-specific alleles for resistance genes, in order to enhance disease resistance in particu-lar geographic areas, or the introduction of a mutant allele or transgene that enhances a trait of interest. The acceptor is also referred to as the recurrent parent, since it is used as a parent for several consecutive generations. The initial cross is made between the acceptor as the female and the donor as the male. The resulting F1 progeny is heterozygous at all loci and the nuclear DNA is made up of 50% of the maternal parent and 50% of the paternal parent. The F1 is again crossed with the recurrent parent (as female). Sev-enty-five percent of the DNA in the genome of the BC1 progeny resulting from this cross is from the recurrent parent, and 25% from the donor. The progeny is now segregating 1:1 for the allele of interest, so only half the plants carry the desired allele. If the desired allele is dominant, progeny carrying the allele can be identified based on their phenotype (assuming the phenotype is visible or can be assayed con-veniently). If the allele is recessive, all BC1 plants will look identical. Selection of the plants carrying the desirable allele will now have to be achieved with the help of a linked molecular marker that can distinguish the two alleles. If no marker is avail-able, selection of the desired allele can be achieved by self-pollinating the BC1 plants. The progeny of the heterozygous BC1 plants will segregate for the trait of interest, whereas the progeny of the wild-type sibling BC1 plants will be homozy-gous wild-type for the trait of interest. The BC1S1 plants expressing the trait of inter-

68 Vermerris est can be backcrossed again to the recurrent parent. All BC2 progeny generated this way are now heterozygous, and can be backcrossed again. Self-pollinations are used again to recover the desired allele. This process typically continues until six back-crosses have been made. At that time, the genome of the progeny consists, on aver-age, of 99% of the recurrent parent’s genetic material, and 1% of the donor parent’s. This is considered a near-isogenic line (NIL), which is genetically similar enough to the recurrent parent to evaluate the impact of the introgressed allele on the perform-ance of the recurrent parent. In the above scheme the extra self-pollination used to uncover the desired reces-sive allele did not contribute towards elimination of parental DNA. When time is a limiting factor, and when the desired allele is introgressed into a relatively small number of donor lines, an alternative approach can be used. The segregating progeny in the BC1 generation are individually identified and then self-pollinated and back-crossed. The progeny from both the self-pollination and the backcross are planted the next season. The self progeny segregating for the trait of interest are identified. These plants were derived from a heterozygous parent. The corresponding backcross progeny – segregating 1:1 for the desired allele – is identified and used for further backcrossing, but is also self-pollinated. This process is continued until an adequate number of backcrosses have been made. Occasionally, an additional allele conferring an undesirable trait is introgressed along with the desirable allele. This is referred to as linkage drag. Eliminating the undesired allele will require screening of a large backcross population in order to identify recombination events between the two linked alleles. The use of closely linked molecular markers on both sides of the desired allele can be used to select for recombination events early on in the backcrossing scheme, thereby greatly expedit-ing the efficiency.
2.7.4 Testing and Evaluation
All of the methods described above generate lines that need to be evaluated for their overall performance prior to their release as cultivars. Extensive testing generally involves growing the material at multiple locations representative of the target pro-duction areas. The locations typically differ in their environment (soil type, soil fertility, precipitation, temperature, disease incidence). The impact of the weather is evaluated by testing the lines in the same locations over multiple years. Field data are collected throughout the growing season. This involves observations on germination date, germination rate, chlorosis (leaf yellowing), pest and disease tolerance, lodging, specific phenotypic characteristics (e.g. anatomy, morphology, tillering, color), and ultimately yield (grain, biomass, or both). If desired, the chemical composition and/or other product characteristics (for example, properties during processing) of the harvested material can be evaluated as well. All these data are analyzed statisti-cally and used to determine the best-performing lines in a given environment (loca-tion, year), and, more importantly, the best-performing lines across locations and years. The performance can be based on individual characters or on a composite that is based on weighted contributions of individual characters.
A Primer on Genetics, Genomics and Plant Breeding 69
While the F5 or F6 generation is typically chosen for extensive testing, some breeding programs employ early-generation testing in the F3 generation. This has the advantage that the potential of selected plants can be evaluated early on in the proc-ess, but this procedure does require substantial resources (land, labor).
2.7.5 Cultivar Production
A cultivar is a group of plants with distinct, uniform and stable characteristics. This means a cultivar has certain unique features (for example, color, appearance, compo-sition), that there is minimal genetic variation between individual plants in the group, and that reproduction leads to uniform progeny with predictable phenotypes. Culti-vars are also known as varieties. Several different types of cultivars exist, depending on the mode of reproduction and the way the cultivar was generated. Clonal cultivars represent plants that are propagated asexually, through the use of tubers, cuttings, rhizomes, bulbs, grafts, or tissue culture. If the clones were derived from a single parent plant, they are geneti-cally identical. Line cultivars of self- or cross-pollinated species are propagated through self-pollination or sib-mating and are genetically very uniform, although some genetic variation can typically not be avoided. Open-pollinated cultivars of cross-pollinated crops are generated by allowing plants that are genetically closely related pollinate each other. There is more genetic variation among the individual plants that make up these cultivars than in the two classes of cultivars described above. Synthetic cultivars (Syn1) are obtained from intercrossing a specific set of clones or lines, mostly in an unsupervised setting. As a consequence, the resulting seed is the result of a mix of cross-, sib- and self-pollinations. It is not possible to reproduce Syn1 cultivars by open-pollination of Syn1 plants. Open-pollination of Syn1 plants results in Syn2 plants, which can be distributed as cultivars as long as they are adequately uniform. The term F1 hybrid is most often used to refer to culti-vars obtained from crossing two inbred lines, although they can also be obtained from crossing an inbred line with an open-pollinated or synthetic cultivar, or from crossing two different clones. F1 hybrids are popular because of the hybrid vigor they typically display. The genetic basis for this phenomenon is not fully understood, but is associated with heterozygosity at many loci. Seed producers also like F1 hybrids, because self- pollination or sib-mating results in a loss of uniformity, making these plants unattractive as a source of seed for the next growing season. Cultivars are generally developed by seed companies, universities, research insti-tutes and then registered with a national or international agency that ensures the cultivar is unique. The cultivars are propagated by seed production companies, coop-erative agreements between producers and distributors, or individual producers under licensing agreements, and then distributed for commercial production.
2.8 Genetic Engineering
The term genetic engineering refers to the introduction of foreign DNA into an indi-vidual plant of interest. ‘Foreign’ refers to DNA that was not part of that plant’s

70 Vermerris original genetic make-up. The foreign DNA can be a gene isolated from the same species, but it can also be a gene from a different species, related or entirely unre-lated. It is, for example, possible to introduce and express a human gene in a plant. The size of the DNA that is transferred is variable. It can be a gene fragment, a single gene, a few genes, large fragments of DNA (up to several 100 kb), and even artificial chromosomes. One of the applications of genetic engineering, both in fundamental genetics research and in commercial applications, is the modification of the expression of native plant genes. Down-regulation can be achieved via the expression of an an-tisense copy of the gene, which results in the transcription of the opposite strand of the gene. The hybrid formed when the mRNA from the transgene encounters the native mRNA is targeted for degradation. The small RNA molecules that are gener-ated during this process, result in further repression of gene expression. Since the discovery of the siRNA’s, a more common strategy is to introduce a construct that contains two short stretches of DNA from the target gene, cloned in opposite orienta-tion from each other and separated by a DNA spacer. Expression of this construct results in the formation of a hairpin structure that is targeted for degradation. This then als results in the down-regulation of the target gene. Overexpression is possible by introducing a transgene under control of a strong promoter. Attempts to overex-press a gene sometimes result in co-supprression. In this case the exact opposite occurs: the gene is down-regulated. This process is also mediated by small RNA’s. Plant genetic engineering is generally achieved through one of two mechanisms: Agrobacterium-mediated transformation, or biolistics-based transformation using a so-called particle gun with which DNA-coated gold or tungsten particles are deliv-ered into the cell. In both cases transformed cells, i.e. cells that have taken up the DNA construct, need to be selected among the large number of cells that have not been transformed. For this reason a selectable marker is introduced along with the gene(s) of interest. The selectable marker can be a gene that confers antibiotic resis-tance or herbicide resistance, allowing transformed cells to grow on a growth me-dium that contains an antibiotic or herbicide, respectively. Tissue culture is used to generate new plants from the transformed cells. The new plantlets are then trans-ferred to soil and allowed to acclimate to conditions with lower humidity than the tissue culture environment. The surviving plants are tested for the presence of the complete construct and for expression of the target gene(s). The growth of transgenic plants on farm land is governed by government regula-tions to avoid ‘escape’ of transgenes. This refers to the distribution of the transgene among non-transgenic crop plants of the same species, or among wild relatives of that species. There is a fear that pollen from transgenic crops carrying an herbicide resistance gene will fertilize a related species that is considered a weed, thus creating progeny that can no longer be eradicated by the herbicide the crop plants were resis-tant to. Another concern is so-called horizontal gene transfer, whereby transgenes conferring antibiotic resistance could be taken up by intestinal bacteria and result in antibiotic-resistant bacteria in the intestines of humans and animals. While there is some evidence for horizontal gene transfer, in most cases the probability of that happening is considered very small. Different governments have different policies for dealing with these risks, so that transgenic crops are acceptable in some countries

A Primer on Genetics, Genomics and Plant Breeding 71
while unacceptable in other countries. Bioenergy crops are generally not meant for human consumption, making it more likely that transgenic technology will be ac-ceptable for these applications.
References
Arabidopsis Genome Initiative (2000) Analysis of the genome sequence of the flowering plant Arabidopsis thaliana. Nature 408, 796–815.
Bachem, C.W.B., Van der Hoeven, R.S., De Bruijn, S.M., Vreugdenhil, D., Zabeau, M. and Visser, R.G.F. (1996) Visualization of differential gene expression using a novel method of RNA fingerprinting based on APFLP: Analysis of gene expression during potato tuber development. Plant J. 9, 745–753.
Behringer, F.J. and Medford, J.I. (1992) A plasmid rescue technique for the recovery of plant DNA disrupted by T-DNA insertion. Plant Mol. Biol. Rep. 10, 190–198.
Beier, D. R. (1993) Single-strand conformation polymorphism (SSCP) analysis as a tool for genetic mapping. Mammal. Genome 4, 627–631.
Botstein, D., White, R.L., Skolnick, M., and Davis, R.W. (1980) Construction of a genetic linkage map in man using restriction fragment length polymorphisms. Am. J. Hum. Genet. 32, 314–331.
Bout, S. and Vermerris, W. (2003) A candidate gene-approach to clone the sorghum Brown midrib gene encoding caffeic acid O-methyltransferase. Mol. Genet. Genomics 269, 205–214.
Brenner, S., Johnson, M., Bridgham, J., Golda, G., Lloyd, D.H. et al. (2000) Gene expression analysis by Massively Parallel Signature Sequencing (MPSS) on microbead arrays. Nature Biotechnol. 18, 630–634.
Brown, T.A. (2004) Genomes 2. John Wiley & Sons, Oxford, UK. 520pp. Burr, B., Burr, F.A., Thompson, K.H., Albertson, M.C. and Stuber, C.W. (1988) Gene map-
ping with recombinant inbreds in maize. Genetics 118, 519–526. Caetano-Anollés, G., Bassam, B.J. and Gresshoff, P.M. (1991) DNA amplification fingerprint-
ing using very short arbitrary oligonucleotide primers. Bio/Technology 9, 553–557. Chalhoub, B.A., Thibault, S., Laucou, V., Rameau, C., Höfte, H. and Cousin, R. (1997) Silver
staining and recovery of AFLP amplification products on large denaturing polyacrylamide gels. Bio/Technology 22, 216–218.
Ching, A., Caldwell, K.S., Jung, M., Dolan, M., Smith, O.S., Tingey, S., Morgante, M. and Rafalski, A.J. (2002) SNP frequency, haplotype structure and linkage disequilibrium in elite maize inbred lines. BMC Genetics 3, 19.
Coffman, C.J., Doerge, R.W., Wayne, M.L. and McIntyre L.M. (2003) Intersection tests for single marker QTL analysis can be more powerful than two marker QTL analysis BMC. Genetics 4, 10.
Diatchenko, L., Lau, Y-F.C., Campbell, A.P., Chenchik, A., Moqadam, F., Huang, B., Lukyanov, S., Lukyanov, K., Gurskaya, N., Sverdlov, E.D. and Siebert, P.D. (1996) Sup-pression subtractive hybridization: A method for generating differentially regulated or tis-sue-specific cDNA probes and libraries. Proc. Natl. Acad. Sci. USA 93, 6025–6030.
Doerge, R.W. (2002) Mapping and analysis of quantitative trait loci in experimental popula-tions. Nature Rev. Genet. 3, 43–53.
Dugas, D.V. and Bartel, B. (2004) MicroRNA regulation of gene expression in plants. Current Opin. Plant Biol. 7, 512–520.
Duguin, J.L. and Dinauer, M.C. (1990) Library subtraction of in vitro cDNA libraries to identify differentially expressed genes in scrapie infection. Nucleic Acids Res. 18, 2789–2792.

72 Vermerris
Falconer, D.S., and Mackay, T.F.C. (1996) Quantitative Genetics, 4th edition, Longman, Longman House, UK. 457 pp.
Fedoroff, N.V., Furtek, D. and Nelson, O.E. (1984) Cloning of the bronze locus in maize by a simple and generalizable procedure using the transposable controlling element Activator (Ac). Proc. Natl. Acad. Sci. USA 81, 3825–3829.
Fehr, W.R. (1987a) Principles of Cultivar Development. Vol. 1. Theory and Technique. Mac-millan, New York, NY. 539pp.
Fehr, W.R. (1987b) Principles of Cultivar Development. Vol. 2. Crop Species. Macmillan, New York, NY. 760pp.
Franke, R., Humphreys, J.M., Hemm, M.R., Denault, J.W., Ruegger, M.O., Cusumano, J.C. and Chapple, C. (2002) The Arabidopsis REF8 gene encodes the 3-hydroxylase of phenylpropanoid metabolism. Plant J. 30, 33–45.
Frey, M., Chomet, P., Glawischnig, E., Stettner, C., Grün, S., Winklmair, A., Eisenreich, W., Bacher, A., Meeley, R.B., Briggs, S.P., Simcox, K. and Gierl, A. (1997) Analysis of a chemical plant defense mechanism in grasses. Science 277, 696–699.
Gelvin, S.B. (2000) Agrobacterium and plant genes involved in T-DNA transfer and integra-tion. Ann. Rev. Plant Physiol. Plant Mol. Biol. 51, 223–256.
Gelvin, S.B. (2003) Agrobacterium-mediated plant transformation: The biology behind the “gene-jockeying” tool. Microbiol. Mol. Biol. Rev. 67, 16–37.
Grattapaglia, D. and Sederoff, R. (1994) Pseudo-testcross: Mapping strategy and RAPD mark-ers. Genetics 137, 1121–1137.
Hallauer, A.R. and Miranda, J.B. (1988) Quantitative Genetics in Maize Breeding. 2nd edi-tion, Iowa State University Press, Ames, IA. 468pp.
Hamilton, A.J. and Baulcombe, D.C. (1999) A species of small antisense RNA in posttrans-criptional gene silencing in plants. Science 286, 950–952.
Hara, E., Kato, T., Nakada, S., Sekiya, L. and Oda, K. (1991) Subtractive cDNA cloning using oligo (dT)30-latex and PCR: isolation of cDNA clones specific to undifferentiated human embryonal carcinoma cells. Nucleic Acids Res. 19, 7097–7104.
Hartl, D.L. and Jones, E.W. (2005) Genetics: Analysis of Genes and Genomes, 6th edition. Jones and Bartlett, Boston, MA. 854pp.
Hendricks, S.M., Cohen, D.I., Nielsen, E.L. and Davis, M.M. (1984) Isolation of cDNA clones encoding T cell-specific membrane associated proteins. Nature 308, 149–153.
Holland, J.B., Nyquist, W.E. and Cervantes-Martinez, C.T. (2003) Estimating and interpreting heritability for plant breeding: an update. Plant Breed. Rev. 22, 9111.
International Rice Genome Sequencing Project (2005) The map-based sequence of the rice genome. Nature 436, 793–800.
Jones-Rhoades, M.W., Bartel, D.P. and Bartel, B. (2006) MicroRNAs and their regulatory roles in plants. Ann.Rev. Plant Biol. 57, 19–53.
Kidner, C.A. and Martienssen, R.A. (2005) The developmental role of microRNA in plants. Curr. Opin. Plant Biol. 8, 38–44.
Konieczny, A. and Ausubel, F. (1993) A procedure for mapping Arabidopsis mutations using co-dominant ecotype-specific PCR-based markers. Plant J. 4, 403–410.
Lander, E.S., Linton, L.M., Birren, B., Nusbaum, C., Zody, M.C., Baldwin, J. et al. (2001) Initial sequencing and analysis of the human genome. Nature 409, 860–921.
Lee, R.C., Feinbaum, R.L. and Ambros, V. (1993). The C. elegans heterochronic gene lin-4 encodes small RNAs with antisense complementarity to lin-14. Cell 75, 843–854.
Lewin, B. (2008) Genes IX, Jones and Bartlett, Boston, MA. 892pp. Liang, P. and Pardee, A.B. (1992) Differential display of eukaryotic messenger RNA by
means of the polymerase chain reaction. Science 257, 967–971.
Elbashir, S.M., Harborth, J., Lendeckel, W., Yalcin, A., Weber, K., and Tuschl, T. (2001)
Duplexes of 21-nucleotide RNAs mediate RNA interference in cultured mammalian cells. Nature 411: 428–429.

A Primer on Genetics, Genomics and Plant Breeding 73
Warrington, J., Patil, N., Hudson, T.J. and Lander, E.S. (2000) Large-scale discovery and genotyping of single-nucleotide polymorphisms in the mouse. Nature Genet. 24, 381–386.
Liu, Y-G., Mitsukawa, N., Oosumi, T. and Whittier, R.F. (1995) Efficient isolation and map-ping of Arabidopsis thaliana T-DNA insert junctions by thermal asymmetric interlaced PCR. Plant J. 8, 457–463.
Margulies, M., Egholm, M., Altman, W.E., Attiya, S., Bader, J.S. et al. (2005) Genome se-quencing in microfabricated high-density picolitre reactors. Nature 437, 376–380.
Maquat L.E. and Carmichael G.G. (2001) Quality control of mRNA function. Cell 104, 173–176.
McClintock, B. (1947) Cytogenetic studies of maize and Neurospora, Carnegie Inst. Wash. Year Book 46, 146–152.
Meyer, K., Cusumano, J.C., Somerville, C. and Chapple, C.C.S. (1996) Ferulate-5-hydroxylase from Arabidopsis thaliana defines a new family of cytochrome P450-dependent monooxygenases. Proc. Natl. Acad. Sci. USA 93, 6869–6874.
Orita, M., Suzuki, Y., Sekiya, T. and Hayashi, K. (1989) Rapid and sensitive detection of point mutations and DNA polymorphisms using the polymerase chain reaction. Genomics 5, 874–879.
Pflieger S., Lefebvre V. and Causse, M. (2001) The candidate gene approach in plant genetics: a review. Mol. Breed. 7, 275–291.
Plomion, C., Hurme, P., Frigerio, J-M., Ridolfi, M., Pot, D., Pionneau, C., Gallardo, F., David, H., Neutelings, G., Campbell, M., Canovas, F.M., Savolainen, O., Bodénes, C. and Kremer, A. (1999) Developing SSCP markers in two Pinus species. Mol. Breed. 5, 21–31.
Poehlman, J.M. (1987) Breeding Field Crops. 3rd edition, Van Nostrand Reinhold, New York. pp. 451–507.
Ribot, E.M. (1998) Rapid amplification of transposon ends for the isolation, cloning and sequencing of transposon-disrupted chromosomal genes. BioTechniques 24, 16–20.
Ryals, J., Weymann, K., Lawton, K., Freidrich, L., Ellis, D., Steiner, H.Y., Johnson, J., De-laney, T.P., Jesse, T., Vos, P. and Uknes, S. (1997) The Arabidopsis NIM1 protein shows homology to the mammalian transcription factor inhibitor IκB. Plant Cell 9, 425–439.
Saiki, R. K., Scharf, S., Faloona, F., Mullis, K. B., Horn, G. T., Erlich, H. A. and Arnheim, N. (1985) Enzymatic amplification of ß-globin genomic sequences and restriction site analy-sis for diagnosis of sickle cell anemia. Science 230, 1350–1354.
Sargent, T.D. and Dawid, I.B. (1983) Differential gene expression in the gastrula of Xenopus laevis Science 222, 135–139.
Schena, M., Shalon, D., Davis, R.W. and Brown, P.O. (1995) Quantitative monitoring of gene expression patterns with a complemetary DNA microarray . Science 270, 467–470.
Schwarz-Sommer, Z., Davies, B. and Hudson, A. (2003) An everlasting pioneer: the story of Antirrhinum research. Nature Rev. Genet. 4, 656–664.
Senior, M.L., Chin, E.C.L., Lee, M., Smith, J.S.C. and Stuber, C.W. (1996) Simple sequence repeat markers developed from maize sequences found in the GENBANK database: map construction. Crop Sci. 36, 1676–1683.
Settles, A.M., Latshaw, S. and McCarty, D.R. (2004) Molecular analysis of high-copy inser-tion sites in maize. Nucleic Acids Res. 32, e54.
Shi, C., Koch, G., Ouzunova, M., Wenzel, G., Zein, I. and Lübberstedt, T. (2006) Comparison of maize brown-midrib isogenic lines by cellular UV-microspectrophootometry and com-parative transcript profiling. Plant Mol. Biol. 62, 697–714.
Syvanen, A.C. (2001) Accessing genetic variation: genotyping single nucleotide polymor-phisms. Nature Rev. Genet. 2, 930–942.
Tan, B.C., Schwartz, S.H., Zeevaart, J.A.D. and McCarty, D.R. (1997) Genetic control of abscisic acid biosynthesis in maize. Proc. Natl. Acad. Sci. USA 94, 12235–12240.
Lindblad-Toh, K., Winchester, E., Daly, M., Wang, D., Hirschhorn, J.N., Laviolette, J.P., Ardlie, K., Reich, D.E., Robinson, E., Sklar, P., Shah, N., Thomas, D., Fan, J.B., Gingeras, T.,

74 Vermerris Taramino, G. and Tingey, S. (1996) Simple sequence repeats for germplasm analysis and
mapping in maize. Genome 39, 277–287. Tuskan, G.A., DiFazio, S., Jansson, S., Bohlmann, J., Grigoiev, I.et al. (2006) The genome of
black cottonwood, Populus trichocarpa (Torr. & Gray). Science 313, 1596–1604. Vos, P., Hogers, R., Bleeker, M., Reijans, M., Van de Lee, T., Hornes, M., Frijters, A., Pot, J.,
Peleman, J., Kuiper, M. and M. Zabeau. (1995) AFLP: a new technique for DNA finger-printing. Nucleic Acids Res. 23, 4407–4414.
Venter, C.J., Adams, M.D., Myers, E.W., Li, P.W., Mural, R.J., et al. (2001) The sequence of the human genome. Science 291, 1304–1351.
Vuylsteke, M., Mank, R., Antonise, R., Bastiaans, E., Senior, M.L., Stuber, C.W., Melchinger, A.E., Lübberstedt, T., Xia, X.C., Stam, P., Zabeau, M. and Kuiper, M. (1999) Two high-density AFLP® linkage maps of Zea mays L.: analysis of distribution of AFLP markers. Theor. Appl. Genet. 99, 1432–2242
Walbot, V. (1992) Strategies for mutagenesis and gene cloning using transposon tagging and T-DNA insertional mutagenesis. Ann. Rev. Plant Physiol. Plant Mol. Biol. 43, 49–82.
Wayne, M.L. and McIntyre, L.M. (2002) Combining mapping and arraying: an approach to candidate gene identification. Proc. Natl. Acad. Sci. USA 99, 14903–14906.
Welsh, J. and McClelland, M. (1990) Fingerprinting genomes using PCR with arbitrary prim-ers. Nucleic Acids Res. 18, 7213–7218.
William, J.K.G., Kubelik, A.R., Livak, K.J., Rafalski, J.A. and Tingey, S.V. (1990) DNA polymorphisms amplified by arbitrary primers are useful as genetic markers. Nucleic Acid Res. 18, 6531–6535.
Wilusz C.J., Wang W., and Peltz, S.W. (2001) Curbing the nonsense: the activation and regu-lation of mRNA surveillance. Genes Dev 15, 2781–2785.
3
Production of Ethanol from Grain
Nancy N. Nichols1 and Rodney J. Bothast2
1 National Center for Agricultural Utilization Research, Agricultural Research Service, U.S. Department of Agriculture,* 1815 North University Street, Peoria, IL 61604, [email protected]
2 Southern Illinois University-Edwardsville, National Corn-to-Ethanol Research Center, 400 University Park Drive; Edwardsville, IL, [email protected]
3.1 Introduction
World ethanol production and use of ethanol as motor fuel is increasing. In the United States, rapid growth is evidenced by 21 billion liters (5.6 billion U.S. gallons) of new annual production capacity under construction in 2008, in addition to annual production capacity of 30 billion liters (7.8 billion gallons) at 139 existing facilities (Renewable Fuels Association). In the U.S., the major feedstock for ethanol produc-tion is corn grain, which accounts for approximately 97% of ethanol production. Sorghum accounts for 2%, and the remaining 1% is produced from other crops, bev-erage/juice waste, food processing waste, etc. Ethanol production consumes ap-proximately 20% of the U.S. corn crop and 15% of U.S. sorghum production (USDA 2007; National Grain Sorghum Producers). Ethanol is produced from sugarcane in South America, where Brazil accounts for most production. Other grains (wheat, barley, and rice) and in some cases corn are used for ethanol production in Canada, Europe, and Asia.
3.2 Ethanol Fermentation Processes
The process for fermentation of starch to ethanol is similar for all grains: starch, a glu-cose polymer (see Chapter 1), is converted enzymatically to glucose, followed by fer-mentation of glucose to ethanol (Fig. 3.1). The corn kernel contains approximately 70% starch on a dry weight basis; along with protein, fat and oil, and fiber (Watson 2003). *Mention of trade names or commercial products in this article is solely for the purpose of providing specific information and does not imply recommendation or endorsement by the U.S. Department of Agriculture
W. Vermerris (ed.), Genetic Improvement of Bioenergy Crops, DOI: 10.1007/978-0-387-70805-8_3, © Springer Science+Business Media, LLC 2008

76 Nichols and Bothast
glucoseC6H12O6
2 pyruvic acidCH3COCOOH
2 acetaldehydeCH3CHO
2 ethanolCH3CH2OH
2 ATP2 NADH + 2 H+
2 ADP + Pi2 NAD+ 2 NAD+2 NADH + 2 H+2 CO2
pyruvatedecarboxylase
alcoholdehydrogenase
glycolysisalpha-amylaseglucoamylase
starch
Fig. 3.1. Conversion of starch to ethanol.
Table 3.1. Composition of grainsa
Starch (% d.b.)
Protein (% d.b.)
Lipids (% d.b.)
Dietary fiber (% d.b.)
Barley 50–65 10–12 2–3 19.3–22.6 Corn 64–78 9 4 13.4 Sorghum 56–77 7.3–15.6 0.5–5.2 10.1 Wheat 53–72 8.3–19.3 1.9 14.6
aMacGregor and Fincher (1993); Watson (2003); Shelton and Lee (2000); Serna-Saldivar and Rooney (1995); Bechtel et al. (1964); Lineback and Rasper (1988); Hicks et al. (2005)
Table 3.2. Ethanol yield from grains
Grain Yield (l Mg–1) Barley – hulleda, b 243–285 Barley – hullessb 338 Corn – wet milla 395 Corn – dry grindc 410 Sorghuma 402 Wheata 389
aShapouri and Salassi (2006) bHicks et al. (2005) cEthanol yield has increased to 417 l Mg–1 (2.8 U.S. gallons bushel–1) at new dry-grind facili-ties (Shapouri 2007)
Corn starch is bonded to gluten protein and stored in the endosperm. Oil is stored in the germ. Fiber is present in the endosperm and germ and in the tip cap, the site of attachment to the kernel. The pericarp, which covers the kernel, consists of arabi-noxylan fiber and a wax coating. The composition of grains is shown in Table 3.1, and approximate alcohol yields are presented in Table 3.2. Grain composition and ethanol yield can vary significantly due to genotype and environmental effects. Iden-tification and development of high-performing cultivars for ethanol production from grains is an area of active research (Hucle and Chibbar 1996; Ingledew 1999; Zhan et al. 2003; Hicks et al. 2005; Rosenberger 2005; Swanston and Newton 2005; Corredor et al. 2006; Taylor et al. 2006).

Production of Ethanol from Grain 77
Corn
Enzyme
Enzyme
Yeast
Corn
Enzyme
EnzymeYeast
Mill
Liquify Liquify
Steep
Saccharify& Ferment
(SSF)
Distill Distill
Ferment
Saccharify
Dehydrate Dehydrate
Solids Solids
ETHANOL ETHANOL
DRY GRIND
CO2
CO2
Oil
DistillersDry
Grains
CornGlutenFeed
CornGlutenMeal
GlutenSeparation
Degerm /Defiber Fibers
WET MILL
Dry Dry
Fig. 3.2. The wet mill and dry grind processes of ethanol production. Reproduced from Nich-ols et al. (2006).
In this chapter, the two industrial processes for production of ethanol from corn are discussed, with consideration of other grains. Further discussion of ethanol pro-duction from sorghum can be found in reviews by Taylor et al. (2006) and Dahlberg (2007). The two methods for production of ethanol by fermentation are the wet mill and dry grind processes (Fig. 3.2). A similar term, dry milling, describes the frac-tionation of grains for food use. Most corn ethanol plants and all of the new produc-tion capacity in the U.S. use the dry grind process. In 2006, 82% and 18% of ethanol was produced at dry grind facilities and wet mills, respectively (Renewable Fuels Association). Likewise, ethanol production from small grains is generally carried out by a dry grind process.
The biological basis for and basic steps in fermentation at dry grind and wet mill ethanol plants are the same. Grain is treated to make the starch accessible, followed by conversion of starch to fermentable sugars and yeast fermentation of sugars to ethanol. The primary differences between wet milling and dry grind are in the method of grain processing upfront, and in the products generated from the process (Fig. 3.2). Corn wet mills use an initial soak and separation step to isolate starch from other kernel components, and typically produce a number of valuable products in addition to ethanol (Johnson and May 2003). Dry grind facilities process whole ground kernels and, in general, produce only two products: ethanol, which is recov-ered by distillation, and the fermentation residuals, which are sold as livestock feed and are referred to as distillers’ dry grains with solubles (DDGS) (Kelsall and Lyons 2003). Dry grind facilities have lower capital and operating expenses than wet mills.

78 Nichols and Bothast 3.2.1 Initial Handling of Grain
In the dry grind process, corn kernels are separated from chaff and other debris, and then milled to coarse flour. The desired particle size maximizes the accessibility of starch granules to solution while allowing unfermented particles to be easily sepa-rated from liquid at the end of the process. Typically, hammer mills are used to grind corn, and hammer or roller mills may be used for smaller grains. Some U.S. facilities process both corn and sorghum. Since ethanol yield from sorghum grain is nearly the same as yield from corn, cost and availability dictate which grain is used (Dahlberg 2007). At facilities that process both corn and sorghum, the grains are usually milled together.
In wet milling, the kernel is fractionated into separate components, and only the starch fraction from the endosperm enters the ethanol fermentation process. The wet fractionation process relies on steeping to isolate kernel fractions, and recovers a relatively pure starch stream. Corn kernels are hydrated by soaking (steeping) in 0.12–0.20% sulfurous acid at 52°C for 24–48 h. The steep is carried out in a series of tanks, with counter-current recycle of liquid from tanks holding corn that has been steeping the longest to tanks with increasingly “newer” kernels. Steeping is controlled by addition of sulfur dioxide with water to the oldest corn as it nears the end of the steeping process. An uncontrolled but important aspect of the wet mill steep is the growth of bacteria in tanks holding the newer corn, where the sulfurous acid concentration is lower. The bacteria, predominantly members of the lactic acid group of Gram-positive bacteria, produce lactic acid in the early steep tanks. The combination of lactic acid and sulfurous acid softens kernels and causes them to swell, and solubilization of the protein matrix results in release of starch granules (Hull et al. 1996; Dailey et al. 2000). A method to greatly reduce steep time and SO2 concentrations, using protease enzymes, has been developed (Johnston et al. 2003).
After steeping, starch is separated from germ, fiber, and gluten protein. This separation of kernel components is the basis for the additional products made at wet mills. The germ is recovered based on density and processed for recovery of corn oil. Fiber is separated by screening, washed to remove residual starch, and combined with residuals from steepwater, germ extraction, and distillation columns. The result-ing mixture is corn gluten feed, a low-protein animal feed. Starch and gluten protein are separated by centrifugation. The starch stream is diverted to ethanol production or other end use, and gluten protein is dried and marketed as corn gluten meal, a high-protein poultry feed. The steep liquid can also be sold as feed or for use as a fermentation ingredient.
3.2.2 Conversion of Starch to Fermentable Sugars
Starch is stored in the grain endosperm, where it occurs as crystalline granules chemically bound to protein. The starch granules are hollow and have a hydrophobic core and pores extending from the surface to the center (Nichols et al. 2008). Starch is a large, insoluble, linear or branched polymer of D-glucose. Amylose is linear starch with α-(1,4)-linkages between D-glucose molecules, and amylopectin is a

Production of Ethanol from Grain 79
branched molecule containing both α-(1,4)- and α-(1,6)-linkages (Power 2003; see also Chapter 1). Both the ratio of amylose to amylopectin and the size of granules vary in starches from different sources. These characteristics determine starch melt-ing temperature and physical properties, and influence the utility of various starches for food and commercial applications (Shelton and Lee 2000; Tester et al. 2004).
arches are presented in Table 3.3. The process of hydrolyzing starch to fermentable sugars uses a combination of
heat and enzymes (Power 2003). First, starch granules are hydrated in aqueous suspension. This process of swelling the starch granules, called gelatinization, cre-ates a viscous solution. Next, the starch is partially hydrolysed to dextrins (water-soluble oligosaccharides) by addition of the enzyme alpha-amylase (EC 3.2.1.1) and heating with 110°C or higher steam in a jet cooker. Alpha-amylase, an endohy-drolase, cleaves internal α-D-(1,4)-glucosidic linkages. This process, called lique-faction, reduces the viscosity of the solution. Additional alpha-amylase is added and the mash is further liquefied at 80–90°C. In the final step, saccharification, the mix-ture is cooled to 32°C and the pH is reduced to 4.5–5.0. The dextrins are hydrolyzed to glucose and maltose, a glucose α-(1,4)-dimer, by glucoamylase (EC 3.2.1.3). Glucoamylase hydrolyzes α-D-(1,4)-glycosidic linkages at non-reducing chain ends, and also has some ability to hydrolyze linkages at amylopectin branch points. Other enzymes in addition to amylases are sometimes used to enhance starch conversion. Pullulanase hydrolyzes starch branch points and decreases isomaltose formation, and proteases increase starch accessibility by acting on the starch-protein matrix. Xylanases and cellulases degrade plant xylans and cellulose, and are useful for reducing viscosity. Although xylanases and cellulases are not typically added to corn starch fermentations, customized enzyme mixtures may be used to reduce vis- cosity in fermentation of other grains (Ingledew et al. 1999; Li et al. 2007). Use of beta-glucanases for viscoscity reduction has proven critical to use of hulless barley as an ethanol feedstock (Hicks et al. 2005). Reduction of viscosity facilitates han-dling of slurries, allows higher solids loadings, and decreases energy use, because heat transfer and pumping are impacted by high viscosity (Meredith 2003).
Table 3.3. Starch gelatinization temperature ranges of various feedstocksa
Gelatinization range (°C) Corn Standard 62–72 High amylose 1 67–>80 High amylose 2 Barley Rye Rice (polished) Sorghum (milo) Wheat
67–>80 52–59 57–70 68–77 68–77 58–64
aReproduced with permission from Kelsall and Lyons (2003)
Gelatinization temperatures of grain st

80 Nichols and Bothast
In the dry grind process, the fermenting yeast Saccharomyces cerevisiae, which is also known as brewer’s yeast or baker’s yeast (Ingledew 1999), is added at the same time as glucoamylase, and saccharification and fermentation are carried out in the same tank. In this process, termed simultaneous saccharification and fermenta-tion (SSF), glucose is converted to ethanol as quickly as it is released by the action of glucoamylase. The low level of free glucose limits somewhat the growth of micro-bial contaminants, and reduces osmolarity.
In the wet milling process, starch is first converted to glucose, followed by a separate fermentation step. The relatively pure starch stream generated in the wet mill process means that it is also practical to produce and purify other products. So, corn wet mills may produce amino acids, vitamins, citric acid, and/or lactic acid by fermentation, using other microorganisms. Some mills also divert part of the starch stream to production of vitamins, enzymes, pharmaceuticals, nutraceuticals, films, solvents, or pigments. Alternatively, starch is sold as a dried or modified starch prod-uct, or converted enzymatically to corn syrup or other sweeteners including high fructose corn syrup.
3.2.3 Ethanol Fermentation
Ethanol fermentation is generally carried out by Saccharomyces cerevisiae. The glucose fermentation pathway is illustrated in Fig. 3.1. Glucose is metabolized through the Embden-Meyerhoff pathway to pyruvate (see Chapter 1). Conversion of pyruvate to acetaldehyde and reduction of acetaldehyde to ethanol completes the fermentation (Russell 2003). One glucose molecule is converted to two ethanol and two CO2 molecules. The theoretical yield of ethanol is 0.51 g per g of glucose con-sumed, and in addition 0.49 g of CO2 is produced. Some production facilities capture CO2 for sale.
Approximately 90–93% of the theoretical yield is obtained under production con-ditions, because some glucose is diverted to production of yeast cell mass, glycerol, and other fermentation side-products (Ingledew 1999). Some loss of yield is due to contaminating microbes. Lactic acid bacteria in particular can inhibit the yeast etha-nol fermentation by competing for glucose and trace nutrients, and by producing lactic and acetic acids, which can inhibit yeast growth and metabolism (Naren-dranath et al. 1997; 2001; Connelly 1999; Bayrock and Ingledew 2004). The process relies on low pH levels (approximately 4) and ethanol produced during the fermenta-tion to suppress growth of contaminants. However, ethanol fermentations are not sterile operations, and some microbial contamination is tolerated. Fermentations are generally operated in batch mode to prevent contaminating microbes from overtak-ing the fermentation. Some ethanol production plants use penicillin or virginiamycin to control contamination (Bayrock et al. 2003). In severe cases when fermentations stall, tanks are emptied and cleaned in an attempt to remove contaminating microbes.
3.2.4 Ethanol Recovery
The fermentation stage lasts approximately 40–60 h and typically yields ethanol concentrations of 12% (w/v) or higher. Ethanol is distilled from the mash to near-

Production of Ethanol from Grain 81
azeotropic (96%) ethanol from which no more water can be removed via distillation. The azeotrope is dehydrated to near-anhydrous (99.5%) ethanol with molecular sieves (Bibb Swain 2003), typically zeolites, that efficiently and selectively adsorb water from mixtures. The near-anhydrous ethanol is then blended with 3–5% gaso-line or with higher-chain alcohols from the fermentation – so-called fusels – as dena-turant. This makes fuel ethanol exempt from beverage alcohol taxes. The residual material (stillage) consists of yeast cells, fermentation by-products, and unfermented portions of the corn, both in solution and small solids in suspension.
3.2.5 Stillage Processing
In wet milling, residual material from distillation columns is incorporated into corn gluten feed as described earlier in this chapter. At the dry grind facility, the residual stillage left after distillation of ethanol is separated into soluble and suspended solid (cake) fractions by centrifugation. The liquid fraction is termed thin stillage. Ap-proximately one third of the thin stillage is backset into the process in order to de-crease use of process water. New research is focusing on increasing the amount of backset by first sending the thin stillage to a digestor. The remaining thin stillage is concentrated and mixed with the cake. The mixture is sold directly as animal feed termed wet distillers grains (WDG), or dried for shipping. Drying the feed, while energy-intensive, allows for longer-term storage and sale of the feed (DDGS) beyond local livestock operations. Due to the relatively high fiber content of WDG and DDGS, these feed products are most suitable as feed for ruminant animals (beef and dairy cattle).
3.3 New Developments
Although production of ethanol from starch is a mature industry, there are a number of improvements still to be made in the process. Research is underway aimed at adding some of the biorefinery capabilities of the wet mill to the dry grind plant model. Dry grind facilities have lower capital and operating costs than wet mills, but typically produce only ethanol and DDGS. New technologies added to the dry grind process will reduce water and energy consumption, generate coproducts, and de-crease dependence on the sale of ethanol and DDGS (Rausch and Belyea 2006).
3.3.1 Milling and Separation Technologies
New technologies aimed at recovering additional products are being developed for use at dry grind ethanol plants. These technologies would serve to add some of the “biorefinery” capacity, in operation at wet mills, to the traditional grind process. In the Quick Germ and Quick Germ-Quick Fiber processes, kernels are hydrated in water for 3–12 h, then coarsely ground and incubated for 2–4 h with alpha-amylase and glucoamylase (Rausch and Belyea 2006). As soluble carbohydrates are released,
the germ (Quick Germ process) or germ and pericarp fiber (Quick Germ-Quick Fiber process) can be recovered by density the specific gravity of the slurry increases and

82 Nichols and Bothast separation. Enzymatic milling (E-milling) incorporates use of protease enzymes along with alpha- and glucoamylases to also obtain fine fiber from the endosperm. Products obtained from corn E-milling are ethanol, corn oil, purified fiber, and DDGS with higher protein and much lower fiber content (Rausch et al. 2006). Tradi-tional DDGS has approximately 28% protein and 11% acid detergent fiber, while DDGS obtained from E-milling has 58% protein and 2% acid detergent fiber. Other dry grind modifications include the following commercial processes: Rennessen, Cereal Process Technologies, BFRAC™, and Hydromilling™ (Jessen 2006a;b; Lewis 2006; Lohrmann 2006). The new technologies have been introduced at pilot or larger scale at dry grind facilities.
Potential advantages of modified corn processing systems compared to the tradi-tional dry grind process include higher fermentation rates and ethanol concentrations, and increased processing capacity, because nonfermentable materials do not enter the reactors (Singh et al. 2005). Removal of pericarp fiber prior to fermentation in-creases reactor capacity by 6–8%, and decreases the amount of residual material (DDGS) to recover and dry at the end of the process, which results in energy cost savings. Additionally, the DDGS obtained by modified dry grind processes could have greater market potential, because DDGS with lower fiber content could be fed to nonruminants (e.g. swine, poultry). Similar logic has been suggested with respect to removal of bran prior to fermentation of sorghum grain (Corredor et al. 2006).
3.3.2 New Enzymes and Yeast Strains
New enzymes and processing technologies may reduce or eliminate the need for heating in conversion of starch to glucose (Galvez 2005). Cold hydrolysis uses en-zymes that efficiently bind to starch granules and hydrolyze raw starch in its native form, rather than relying on jet-cooking to liquefy (solubilize) starch and facilitate enzymatic hydrolysis (Shetty et al. 2005; Lewis 2006; Robertson et al. 2006; Wil-liams 2006). Elimination of the jet cooking requirement significantly reduces energy consumption and equipment costs, and increases ethanol yield and concentration. However, loss of yield may occur due to microbial contamination because the feed-stock is not heated, and higher enzyme cost and enzyme loading also impact the no-cook process.
Industrial yeast strains must grow and ferment under the relatively harsh condi-tions typical of fuel ethanol production, including low pH, temperature that is not stringently controlled, osmotic stress, and presence salts and organic acids (Ingledew 1999). Improved yeast strains are sought that tolerate ethanol and other stresses and produce higher ethanol concentrations (Casey and Ingledew 1986; D’Amore et al. 1990; You et al. 2003; Alper et al. 2006; Fujita et al. 2006). Other desirable im-provements are strains with reduced glycerol production (Bideaux et al. 2006) and strains that can degrade polymeric starch in addition to monomeric glucose (Shigechi et al. 2004; Khaw et al. 2006). Development of improved strains and careful control of fermentation conditions will allow fermentation of higher substrate concentrations (high-gravity fermentations; Jones and Ingledew 1994; Thomas and Ingledew 1990; Thomas et al. 1994). High-gravity fermentations result in increased ethanol concen-

Production of Ethanol from Grain 83
trations and decreased energy use, because smaller fermentation tanks can be used and there is less water to be removed during product recovery.
3.3.3 New Corn Hybrids
Corn hybrids tailored for ethanol production yield 2–5% more ethanol than bulk commodity corn (Bothast and Schlicher 2005). For the wet milling process, hybrids with high extractable starch (HES) have a larger portion of starch accessible to ex-traction. Similarly, hybrids developed for the dry grind industry have high total fer-mentables (HTF), meaning starch plus the small amount of free glucose, fructose, maltose, and sucrose present in kernels. Other improved hybrids include transgenic corn with high oil and high free lysine content, developed for introduction into a modified dry-grind ethanol process (Jessen 2006a). In addition, hybrids with starch-hydrolyzing activity are being developed (Craig et al. 2004). As discussed in Section 3.2, grain composition varies with variety and growth environment, and efforts are aimed at developing high-yielding cultivars for ethanol production. Factors affecting ethanol yield from sorghum have been identified and include starch content and liquefaction speed, viscosity, tannin content, and protein digestibility (Wu et al. 2007). A comparison of ethanol yield and fermentation efficiency in sorghum showed variability even when comparing sorghums with high-starch content (Dahl-berg 2007).
Work to identify and develop improved hybrids for ethanol production has been accompanied by efforts to optimize agronomic practices and understand the effect of environmental conditions on ethanol yield. In general, field management that optimizes corn crop yield also maximizes extractable starch and total fermentables. Corn hybrid development has also been accompanied by, or perhaps driven by, development of methods for rapid screening of kernel traits. Predictive models, based on near infrared (NIR) spectroscopic analysis for HES and HTF, are being developed that can be used at point-of-delivery to predict the potential of corn for ethanol production (Bothast and
3.3.4 Co-product Quality and Utilization
Several topics related to quality of feed co-products are being addressed by research-ers. As described above, DDGS with increased protein and decreased fiber content can be obtained by modified milling methods. Fiber can also be removed from con-ventional DDGS (Srinivasan et al. 2005). Consistency of nutritional content and labeling is another important concern, and work to improve the handling qualities (“flowability”) of DDGS is ongoing (Rosentrater and Muthukumarappan 2006). Methods to remove phosphorous and other elements from DDGS are also needed, because the amount of DDGS that can be fed to animals could be limited by the phosphate excreted in animal waste (Rausch et al. 2006). Alternate uses for DDGS are also being developed, including use as a de-icer and as a fertilizing and weed-suppressing mulch.
Schlicher 2005). This whole-grain methodology is a useful adaptation of established NIR technology that is widely used in laboratories to predict, for example, the protein and moisture content of grains (see also Chapter 5).

84 Nichols and Bothast
In addition to isolation of valuable fractions of the corn kernel and production of higher-quality feed products, other new co-products are being pursued. Corn fiber gum, an emulsifier, can be extracted from corn pericarp fiber (Singh et al. 2000; Yadav et al. 2007). Oil extracted from corn fiber contains phytosterols, which have cholesterol-lowering activity (Moreau et al. 1998; Buchanan et al. 2003). Zein, the major protein present in corn, has potential use in films, coatings, and plastics appli-cations, and development of economical methods for extraction of zein and formula-tion of products is an area of active research (Lawton 2003; Padua et al. 2005).
3.3.5 Conversion of Non-starch Polymers
In order to significantly displace use of petroleum with renewable fuels for transpor-tation, non-starch plant materials must be utilized for ethanol production. Cellulose and hemicellulose from agricultural residues (stover, straw, hulls), waste products (paper, wood chips), and energy crops (grasses, softwoods) can also be converted to ethanol. Targeted improvement of several energy crops is described in later chapters of this book. Significant progress has been made toward resolving the technical chal-lenges related to conversion of lignocellulosic biomass (Hahn-Hägerdal et al. 2006). Ongoing research is addressing the need for better and cheaper pretreatment methods and enzymes for saccharification of cellulose and hemicellulose, and robust ferment-ing microbes able to ferment sugar mixtures with high productivity (see Chapter 6). Improved process technologies and infrastructure for collecting and handling feed-stocks are also being developed.
3.4 Conclusion
Starch crops will continue to be a major feedstock for ethanol production. As pro-duction of renewable fuels increases, use of grains as feedstocks is increasing in several regions of the world. Although corn is the primary feedstock for ethanol production in the U.S., interest in alternative starch crops and cellulosic biomass is on the rise, especially in areas where crops with a shorter growing season or reduced water use are desirable, and low-cost feedstocks are available. Developments includ-ing improved hybrids, fermenting strains, and conversion enzymes, new co-products, and addition of new technologies to ethanol production facilities will continue to increase productivity of ethanol processes.
References
Alper, H., Moxley, J., Nevoigt, E., Fink, G.R. and Stephanopoulos, G. (2006) Engineering yeast transcription machinery for improved ethanol tolerance and production. Science 314, 1565–1568.
Bayrock, D.P. and Ingledew, W.M. (2004) Inhibition of yeast by lactic acid bacteria in con-tinuous culture: Nutrient depletion and/or acid toxicity? J. Ind. Microbiol. Biotechnol. 31, 362–368.

Production of Ethanol from Grain 85
Bayrock, D.P., Thomas, K.C. and Ingledew, W.M. (2003) Control of Lactobacillus contami-nants in continuous fuel ethanol fermentations by constant or pulsed addition of penicillin. G. Appl. Microbiol. Biotechnol. 62, 498–502.
Bechtel, W.G., Geddes, W.F. and Gilles, K.A. (1964) Carbohydrates. In: I. Hlynka (Ed.), Wheat: Chemistry and Technology. American Association of Cereal Chemists, St. Paul, MN, pp. 277–352.
Bibb Swain, R.L. (2003) Development and operation of the molecular sieve: An industry standard. In: P.J. White and L.A. Johnson (Eds.), The Alcohol Textbook, 4th ed. Notting-ham University Press, Nottingham, U.K., pp. 337–341.
Bideaux, C., Alfenore, S., Cameleyre, X., Molina-Jouve, C., Uribelarrea, J.-L. and Guillouet, S.B. (2006) Minimization of glycerol production during the high-performance fed-batch ethanolic fermentation process in Saccharomyces cerevisiae, using a metabolic model as a prediction tool. Appl. Environ. Microbiol. 72, 2134–2140.
Bothast, R.J. and Schlicher, M.A. (2005) Biotechnological processes for conversion of corn into ethanol. Appl. Microbiol. Biotechnol. 67, 19–25.
Buchanan, C.M., Buchanan, N.L., Debenham, J.S., Shelton, M.C. and Wood, M.D. (2003) Methods of separating corn fiber lipid fraction from corn fiber. U.S. Patent 6,589,760.
Casey, G.P. and Ingledew, W.M. (1986) Ethanol tolerance in yeasts. Crit. Rev. Microbiol. 13, 219–280.
Connelly, C. (1999) Bacterial contaminants and their effects on alcohol production. In: K.A. Jacques, T.P. Lyons and D.R. Kelsall (Eds.), The Alcohol Textbook, 3rd ed. Nottingham University Press, Nottingham, U.K., pp. 317–334.
Corredor, D.Y., Bean, S.R., Schober, T. and Wang, D. (2006) Effect of decorticating sorghum on ethanol production and composition of DDGS. Cereal Chem. 83, 17–21.
Craig, J.A., Batie, J., Chen, W., Freeland, S.B., Kinkima, M. and Lanahan, M.B. (2004) Ex-pression of starch hydrolyzing enzymes in corn. In: M. Tumbleson (Ed.), Proceedings of the Corn Utilization and Technology Conference. National Corn Growers Association and Corn Refiners Association, Indianapolis.
Dahlberg, J. (2007) An overview of U.S. sorghum starch and ethanol production. In: Proceed-ings of the Fifth International Starch Technology Conference, University of Illinois, Ur-bana, IL, pp. 50–55.
Dailey, O.D. Jr., Dowd, M.K. and Mayorga, J.C. (2000) Influence of lactic acid on the solubi-lization of protein during corn steeping. J. Agric. Food. Chem. 48, 1352–1357.
D’Amore, T., Panchal, C.J., Russell, I. and Stewart, G.G. (1990) A study of ethanol tolerance in yeast. Crit. Rev. Biotechnol. 9, 287–304.
Fujita, K., Matsuyama, A., Kobayashi, Y. and Iwahashi, H. (2006) The genome-wide screen-ing of yeast deletion mutants to identify the genes required for tolerance to ethanol and other alcohols. FEMS Yeast Res. 6, 744–750.
Galvez, A. (Jan. 2005) Analyzing cold enzyme starch hydrolysis technology in new ethanol plant design. Ethanol Producer Magazine, BBI International, Grand Forks, ND.
Hahn-Hägerdal, B., Galbe, M., Gorwa-Grauslund, M.F., Lidén, G. and Zacchi, G. (2006) Bio-ethanol – the fuel of tomorrow from the residues of today. Trends Biotechnol. 24, 549–556.
Hicks, K.B., Flores, R.A., Taylor, F., McAloon, A.J., Moreau, R.A., Johnston, D., Senske, G.E., Brooks, W.S. and Griffey, C.A. (2005) Hulless barley: A new feedstock for ethanol. In: Proceedings of the 15th Annual EPAC Ethanol Conference, Cody, WY.
Hucle, P. and Chibbar, R.N. (1996) Variation for starch concentration in spring wheat and its repeatability relative to protein concentration. Cereal Chem. 73, 756–758.
Hull, S.R., Peters, E., Cox, C. and Montgomery, R. (1996) Composition of corn steep water during experimental steeping. J. Agric. Food Chem. 44, 3521–3527.

86 Nichols and Bothast Ingledew, W.M. (1999) Alcohol production by Saccharomyces cerevisiae: A yeast primer. In:
K.A. Jacques, T.P. Lyons and D.R. Kelsall (Eds.), The Alcohol Textbook, 3rd ed. Notting-ham University Press, Nottingham, U.K., pp. 49–87.
Ingledew, W.M., Thomas, K.C., Hynes, S.H. and McLeod, J.G. (1999) Viscosity concerns with rye mashes used for ethanol production. Cereal Chem. 6, 459–464.
Jessen, H. (Oct. 2006a) Quality traits: Linking the chain from farmer to producer. Ethanol Producer Magazine, BBI International, Grand Forks, ND.
Jessen, H. (Oct. 2006b) Expanding fractionation horizons from food to fuel. Ethanol Producer Magazine, BBI International, Grand Forks, ND, pp. 70–75.
Johnson, L.A. and May, J.B. (2003) Wet milling: The basis for corn biorefineries. In: P.J. White and L.A. Johnson (Eds.), Corn: Chemistry and Technology, 2nd ed. American As-sociation of Cereal Chemists, St. Paul, MN, pp. 449–494.
Johnston, D.B., Singh, V. and Eckhoff, S. (2003) Use of enzymes to reduce steep time and SO2 requirements in a maize wet-milling process. U.S. patent 6,566,125.
Jones, A.M. and Ingledew, W.M. (1994) Fuel alcohol production: Optimization of temperature for efficient very-high-gravity fermentation. Appl. Environ. Microbiol. 60, 1048–1051.
Kelsall, D.R. and Lyons, T.P. (2003) Grain dry milling and cooking procedures: Extracting sugars in preparation for fermentation. In: P.J. White and L.A. Johnson (Eds.), The Alco-hol Textbook, 4th ed. Nottingham University Press, Nottingham, U.K., pp. 9–21.
Khaw, T.S., Katakura, Y., Koh, J., Kondo, A., Ueda, M. and Shioya, S. (2006) Evaluation of performance of different surface-engineered yeast strains for direct ethanol production from raw starch. Appl. Microbiol. Biotechnol. 70, 573–579.
Lawton, J.W. (2003) Zein: A history of processing and use. Cereal Chem. 79, 1–18. Lewis, S.M. (2006) BPX™ and BFRAC™: Innovation in biorefining. In: M. Tumbleson,
(Ed.), Corn: Nature’s Sustainable Resource. Proceedings of the Corn Utilization and Technology Conference, Dallas, TX.
Li, M., Teunissen, P, Konieczny-Janda, G., Hicks, K.B., Johnston, D.B., Nghiem, J. and Shetty, J.K. (2007) Production of ethanol and DDGS from barley containing reduced beta-glucan and phytic acid. In: Proceedings of the Fifth International Starch Technology Con-ference, University of Illinois, Urbana, IL, pp. 34–41.
Lineback, D.R. and Rasper, V.F. (1988) Wheat carbohydrates. In: Y. Pomerantz (Ed.), Wheat: Chemistry and Technology, 3rd ed. American Association of Cereal Chemists, St. Paul, MN, pp. 277–372.
Lohrmann, T. (Fourth Quarter 2006) Rethinking ethanol coproducts. Distillers Grains Quar-terly, BBI International, Grand Forks, ND, pp. 23–24.
MacGregor, A.W. and Fincher, G.B. (1993) Carbohydrates of the barley grain. In: A.W. MacGregor and R.S. Bhatty (Eds.), Barley: Chemistry and Technology. American Asso-ciation of Cereal Chemists, St. Paul, MN, pp. 73–130.
Meredith, J. (2003) Understanding energy use and energy users in contemporary ethanol plants. In: P.J. White and L.A. Johnson (Eds.), The Alcohol Textbook, 4th ed. Nottingham University Press, Nottingham, U.K., pp. 355–361.
Moreau, R.A., Hicks, K.B. Nicolosi, R.J. and Norton, R.A. (1998) Corn fiber oil. Its prepara-tion and use. U.S. Patent 5,843,499.
Narendranath, N.V., Hynes, S.H., Thomas, K.C. and Ingledew, W.M. (1997) Effects of lactobacilli on yeast-catalyzed ethanol fermentations. Appl. Environ. Microbiol. 63, 4158–4163.
Narendranath, N.V., Thomas, K.C. and Ingledew, W.M. (2001) Effects of acetic acid and lactic acid on the growth of Saccharomyces cerevisiae in a minimal medium. J. Ind. Mi-crobiol. Biotechnol. 26, 171–177.
Nichols, N.N., Dien, B.S., Bothast, R.J. and Cotta, M.A. (2006) The corn ethanol industry. In: S. Minteer (Ed.), Alcoholic Fuels. CRC Press, Boca Raton, FL, pp. 59–78.

Production of Ethanol from Grain 87 Nichols, N.N., Monceaux, D.A. Bothast, R.J. and Dien, B.S. (2008) Production of ethanol
from corn and sugarcane. In: J.D. Wall, C.S. Harwood and A.L. Demain (Eds.), Bio-energy. ASM Press, Washington, DC. pp. 3–15.
Padua, G.W., Rakotonirainy, A.M. and Ha, T.T. (2005) Method of manufacturing improved corn zein resin films, sheets, and articles. U.S. Patent 6,849,113.
Power, R.F. (2003) Enzymatic conversion of starch to fermentable sugars. In: K.A. Jacques, T.P. Lyons and D.R. Kelsall (Eds.), The Alcohol Textbook, 4th ed. Nottingham University Press, Nottingham, U.K., pp. 23–32.
Rausch, K.D. and Belyea, R.L. (2006) The future of coproducts from corn processing. Appl. Biochem. Biotechnol. 128, 47–86.
Robertson, G.H., Wong, D.W.S., Lee, C.C., Wagschal, K., Smith, M.R. and Orts, W.J. (2006) Native or raw starch digestion: A key step in energy efficient biorefining of grain. J. Ag-ric. Food Chem. 54, 353–365.
Rosenberger, A. (2005) Identification of top-performing cereal cultivars for grain-to-ethanol operations. Zuckerindustrie 130, 697–701.
Rosentrater, K.A. and Muthukumarappan, K. (2006) Corn ethanol coproducts: Generation, properties, and future prospects. Int. Sugar J. 108, 648–657.
Russell, I. (2003) Understanding yeast fundamentals. In: K.A. Jacques, T.P. Lyons and D.R. Kelsall (Eds.), The Alcohol Textbook, 4th ed. Nottingham University Press, Nottingham, U.K., pp. 85–119.
Serna-Saldivar, S. and Rooney, L.W. (1995) Structure and chemistry of sorghum and millets. In: D.A.V. Dendy (Ed.), Sorghum and Millets: Chemistry and Technology. American As-sociation of Cereal Chemists, St. Paul, MN, pp. 69–124.
Shapouri, H. (2007) Personal communication. U.S. Department of Agriculture Office of the
Shapouri, H. and Salassi, M. (2006) The economic feasibility of ethanol production from sugar in the United States. Report from the U.S. Office of Energy Policy and New Uses, U.S. Office of the Chief Economist, U.S. Department of Agriculture, and Louisiana State University.
Shelton, D.R. and Lee, W.J. (2000) Cereal carbohydrates. In: K. Kulp and J.G. Ponte, Jr. (Eds.), Handbook of Cereal Science and Technology, 2nd ed. Marcel Dekker, New York, pp. 385–415.
Shetty, J.K., Lantero, O.J. and Dunn-Coleman, N. (2005) Technological advances in ethanol production. Int. Sugar J. 107, 605–610.
Shigechi, H., Koh, J., Fujita, Y., Matsumoto, T., Bito, Y., Ueda, M., Satoh, E., Fukuda, H. and Kondo, A. (2004) Direct production of ethanol from raw corn starch via fermentation by use of a novel surface-engineered yeast strain codisplaying glucoamylase and α-amylase. Appl. Environ. Microbiol. 70, 5037–5040.
Singh, V., Doner, L.W., Johnston, D.B., Hicks, K.B. and Eckhoff, S.R. (2000) Comparison of coarse and fine corn fiber gum yields and sugar profiles. Cereal Chem. 77, 560–561.
Singh, V., Johnston, D.B., Naidu, K., Rausch, K.D., Belyea, R.L. and Tumbleson, M.E. (2005) Comparison of modified dry-grind processes for fermentation characteristics and DDGS composition. Cereal Chem. 82, 187–190.
Srinivasan, R., Moreau, R.A., Rausch, K.D., Belyea, R.L., Tumbleson, M.E. and Singh, V. (2005) Separation of fiber from distillers dried grains with solubles (ddgs) using sieving and elutriation. Cereal Chem. 82, 528–533.
Swanston, J.S. and Newton, A.C. (2005) Mixtures of UK wheat as an efficient and environ-mentally friendly source for bioethanol. J Ind. Ecol. 9, 109–126.
Taylor, J.R.N., Schober, T.J. and Bean, S.R. (2006) Novel food and non-food uses for sor-ghum and millets. J. Cereal Sci. 44, 252–271.
Tester, R.F., Karkalas, J. and Qi, X. (2004) Starch-composition, fine structure, and architec-ture. J. Cereal Sci. 39, 151–165.
Chief Economist.

88 Nichols and Bothast Thomas, K.C., Hynes, S.H. and Ingledew, W.M. (1994) Effects of particulate materials and
osmoprotectants on very-high-gravity ethanolic fermentation by Saccharomyces cere-visiae. Appl. Environ. Microbiol. 60, 1519–1524.
Thomas, K.C. and Ingledew, W.M. (1990) Fuel alcohol production: Effects of free amino nitrogen on fermentation of very-high-gravity wheat mashes. Appl. Environ. Microbiol. 56, 2046–2050.
USDA (2007) Crop Production 2006 Summary. United States Department of Agriculture, National Agricultural Statistics Service.
Watson, S.A. (2003) Description, development, structure, and composition of the corn kernel. In: P.J. White and L.A. Johnson (Eds.), Corn: Chemistry and Technology, 2nd ed. Ameri-can Association of Cereal Chemists, St. Paul, MN, pp. 69–106.
Williams, J. (Jan. 2006) Break it down now. Ethanol Producer Magazine, BBI International, Grand Forks, ND.
Wu, X., Zhao, R., Bean, S.R., Seib, P.A., McLaren, J.S., Madl, R.L., Tuinstra, M., Lenz, M.C. and Wang, D. (2007) Factors impacting ethanol production from grain sorghum in the dry-grind process. Cereal Chem. 84, 130–136.
Yadav, M.P., Fishman, M.L., Chau, H.K., Johnston, D. and Hicks, K.B. (2007) Molecular characteristics of corn fiber gum and their influence on its emulsifying properties. Cereal Chem. 84, 175–180.
You, K.M., Rosenfield, C.-L. and Knipple, D.C. (2003) Ethanol tolerance in the yeast Sac-charomyces cerevisiae is dependent on cellular oleic acid content. Appl. Environ. Micro-biol. 69, 1499–1503.
Zhan, X., Wang, D., Tuinstra, M.R., Bean, S.R., Seib, P.A. and Sun, X.S. (2003) Ethanol and lactic acid production as affected by sorghum genotype and location. Ind. Crops Prod. 18, 245–255.

4 Composition and Biosynthesis of Lignocellulosic Biomass
Wilfred Vermerris
Genetics Institute and Agronomy department, University of Florida, Gainesville, FL, USA, [email protected]
4.1 Introduction
As alluded to in Chapters 1 and 3, the large-scale production of ethanol and other green chemical feedstocks will rely heavily on the processing of lignocellulosic biomass. The processing efficiency of lignocellulosic biomass depends on its chemi-cal composition. This chapter will focus on what lignocellulosic biomass is, how the different constituents of lignocellulosic biomass are synthesized and assembled in a highly functional composite – the cell wall – and what is known about the genetics and biochemistry of cell wall biosynthesis.
4.2 Lignocellulosic Biomass is Composed of Plant Cell Walls
A distinguishing feature of plant cells relative to mammalian cells is the presence of a rigid cell wall that surrounds the lipid bilayer cell membrane. There are many dif-ferent cell types in plants, each with its own unique shape and structural features. Examples include the thick-walled sclerenchyma cells that provide structural sup-port, the long, thin xylem vessels that conduct water and minerals, the long phloem cells that transport sugars (phloem), the wax-coated, interlocked epidermal cells that protect the plant against invasion by pathogens, the bundle sheath cells, aerenchyma cells and stomata that enable photosynthesis and photorespiration, and the small, undifferentiated meristematic cells that develop into specific cell types depending on their location (shoot apex or root). Given that removal of the plant cell wall (with hydrolytic enzymes) from these different cell types results in the formation of a globular protoplast (except for the xylem vessles, which have undergone pro-grammed cell death to become functional), we can conclude that the cell wall is the major determinant of cell shape.
W. Vermerris (ed.), Genetic Improvement of Bioenergy Crops, DOI: 10.1007/978-0-387-70805-8_4, © Springer Science+Business Media, LLC 2008
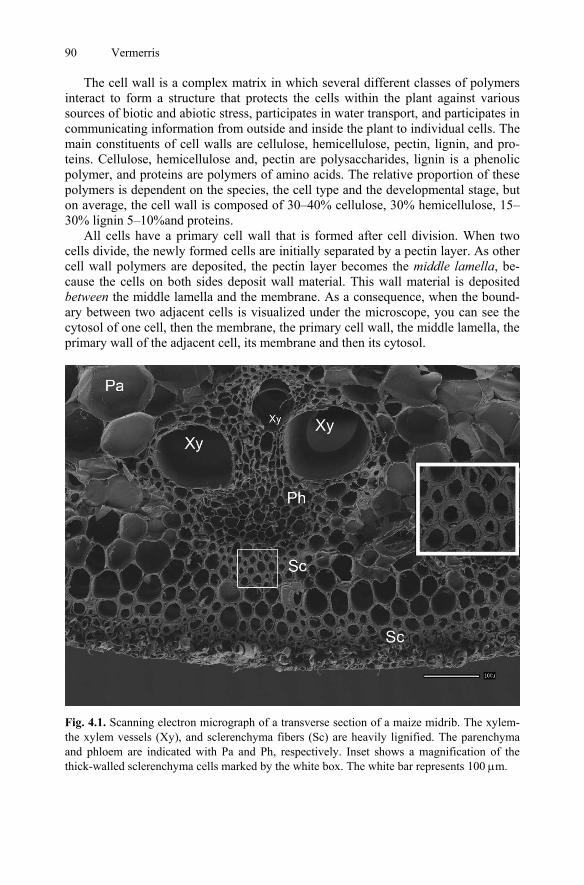
90 Vermerris The cell wall is a complex matrix in which several different classes of polymers interact to form a structure that protects the cells within the plant against various sources of biotic and abiotic stress, participates in water transport, and participates in communicating information from outside and inside the plant to individual cells. The main constituents of cell walls are cellulose, hemicellulose, pectin, lignin, and pro-teins. Cellulose, hemicellulose and, pectin are polysaccharides, lignin is a phenolic polymer, and proteins are polymers of amino acids. The relative proportion of these polymers is dependent on the species, the cell type and the developmental stage, but on average, the cell wall is composed of 30–40% cellulose, 30% hemicellulose, 15–30% lignin 5–10%and proteins. All cells have a primary cell wall that is formed after cell division. When two cells divide, the newly formed cells are initially separated by a pectin layer. As other cell wall polymers are deposited, the pectin layer becomes the middle lamella, be-cause the cells on both sides deposit wall material. This wall material is deposited between the middle lamella and the membrane. As a consequence, when the bound-ary between two adjacent cells is visualized under the microscope, you can see the cytosol of one cell, then the membrane, the primary cell wall, the middle lamella, the primary wall of the adjacent cell, its membrane and then its cytosol.
Fig. 4.1. Scanning electron micrograph of a transverse section of a maize midrib. The xylem-the xylem vessels (Xy), and sclerenchyma fibers (Sc) are heavily lignified. The parenchyma and phloem are indicated with Pa and Ph, respectively. Inset shows a magnification of the thick-walled sclerenchyma cells marked by the white box. The white bar represents 100 μm.
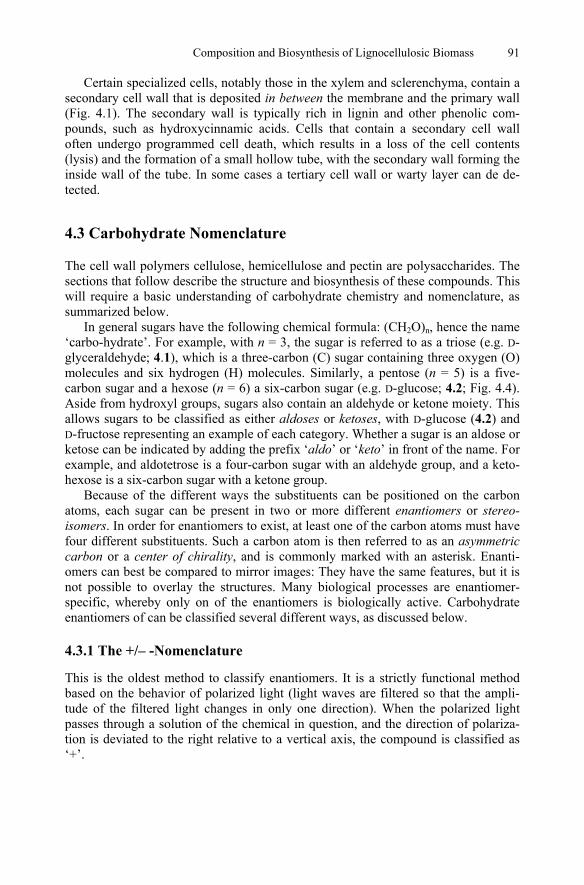
Composition and Biosynthesis of Lignocellulosic Biomass 91
Certain specialized cells, notably those in the xylem and sclerenchyma, contain a secondary cell wall that is deposited in between the membrane and the primary wall (Fig. 4.1). The secondary wall is typically rich in lignin and other phenolic com-pounds, such as hydroxycinnamic acids. Cells that contain a secondary cell wall often undergo programmed cell death, which results in a loss of the cell contents (lysis) and the formation of a small hollow tube, with the secondary wall forming the inside wall of the tube. In some cases a tertiary cell wall or warty layer can de de-tected.
4.3 Carbohydrate Nomenclature
The cell wall polymers cellulose, hemicellulose and pectin are polysaccharides. The sections that follow describe the structure and biosynthesis of these compounds. This will require a basic understanding of carbohydrate chemistry and nomenclature, as summarized below. In general sugars have the following chemical formula: (CH2O)n, hence the name ‘carbo-hydrate’. For example, with n = 3, the sugar is referred to as a triose (e.g. D-glyceraldehyde; 4.1), which is a three-carbon (C) sugar containing three oxygen (O) molecules and six hydrogen (H) molecules. Similarly, a pentose (n = 5) is a five-carbon sugar and a hexose (n = 6) a six-carbon sugar (e.g. D-glucose; 4.2; Fig. 4.4). Aside from hydroxyl groups, sugars also contain an aldehyde or ketone moiety. This allows sugars to be classified as either aldoses or ketoses, with D-glucose (4.2) and D-fructose representing an example of each category. Whether a sugar is an aldose or ketose can be indicated by adding the prefix ‘aldo’ or ‘keto’ in front of the name. For example, and aldotetrose is a four-carbon sugar with an aldehyde group, and a keto-hexose is a six-carbon sugar with a ketone group. Because of the different ways the substituents can be positioned on the carbon atoms, each sugar can be present in two or more different enantiomers or stereo-isomers. In order for enantiomers to exist, at least one of the carbon atoms must have four different substituents. Such a carbon atom is then referred to as an asymmetric carbon or a center of chirality, and is commonly marked with an asterisk. Enanti-omers can best be compared to mirror images: They have the same features, but it is not possible to overlay the structures. Many biological processes are enantiomer-specific, whereby only on of the enantiomers is biologically active. Carbohydrate enantiomers of can be classified several different ways, as discussed below.
4.3.1 The +/– -Nomenclature
This is the oldest method to classify enantiomers. It is a strictly functional method based on the behavior of polarized light (light waves are filtered so that the ampli-tude of the filtered light changes in only one direction). When the polarized light passes through a solution of the chemical in question, and the direction of polariza-tion is deviated to the right relative to a vertical axis, the compound is classified as ‘+’.

92 Vermerris 4.3.2 The L/D -Nomenclature
The L/D-nomenclature was developed by the German chemist Emil Fischer in the 1920’s. In order to determine whether a sugar molecule has the L- or D-conformation, the following steps are taken, as represented in Fig. 4.2 for the triose D-glyceraldehyde (4.1): 1. The structure is displayed with the carbon chain in vertical position, with the C1
carbon at the top. 2. The vertical bonds are projected to the back, and the horizontal bonds to the
front. 3. Projection of this structure on a flat surface will show the hydroxyl group on the
left (L; for laevis, Latin for ‘left’) or the right (D, for dexter, ‘right’). 4. The asymmetric carbon that is the furthest away from C1 determines the configu-
ration for the whole molecule, even though additional asymmetric carbon atoms may be present. This atom is referred to as the configurational atom.
Note that, by convention, the D and L are written in small capital letters.
HOCH2OH
O
HOH
HOH2C
O
HOH
HOH2C
O
H
HH
H1
*
4.1 Fig. 4.2. Projection of D-glyceraldehyde according to the L/D nomenclature. Carbon atom 1 (C1), which has the highest degree of substitution is marked. The asterisk indicates the asym-metric carbon or chiral center.
4.3.3 The R, S-Nomenclature
This nomenclature was developed more recently and can be applied more univer-sally. The system was devised by Robert Cahn (Royal Institute of Chemistry, Lon-don), Christopher Ingold (University College, London), and Vladimir Prelog (Swiss Federal Institute of Technology, Zurich) in the 1950's, and is thus called the Cahn-Ingold-Prelog or CIP convention. In this case the asymmetric carbon is drawn so that the functional group with the lowest mass bound to it is facing towards the rear. The three remaining groups are then facing the viewer. These three groups are now ranked based on their mass, with the atom connected to the asymmetric carbon being the primary determinant, and the atoms attached to it the secondary determinant (in cases where the primary atom is the same). In the example in Fig. 4.3, the hydroxyl group ranks higher than the carbonyl group (the double bonded oxygen counts as two oxygen atoms), which in turn ranks higher than the alcohol moiety. The carbon has the R (rectus, right) conformation if the functional groups are positioned in such a way that they decrease in rank in a clockwise rotation. Consequently, if the rank

Composition and Biosynthesis of Lignocellulosic Biomass 93
decreases in a counterclockwise rotation, the carbon has the S (sinister, left) confor-mation. It is important to realize that there is no relationship between the three nomencla-tures: A compound classified as ‘L’ based on the Fischer nomenclature can be either ‘S’ or ‘R’.
HOHC
HO
CH2OHHO
CH2OH
O
H
H 1
*HOHC
HO
CH2OH
R
Fig. 4.3. The R, S nomenclature applied to D-glyceraldehyde.
Sugars in an aqueous solution are generally in equilibrium between an open-chain structure and one or more ring structures. The ring can be formed through an intra-molecular reaction that involves the aldehyde or ketone group on C1, resulting in a cyclic hemi-acetal. In hexoses, this can occur in two ways. A six-atom ring can be formed when the hydroxyl group on C5 attacks C1, whereas a five-atom ring results from the reaction between the hydroxyl group on C4 and C1. The six-atom and five-atom ring structures are referred to as pyranose and furanose, respectively. Pentoses generally form a five-membered ring after formation of a hemi-acetal be-tween C1 and the hydroxyl group on C4. The nucleophilic attack of the hydroxyl group on C1 can occur from two direc-tions: above or below (see Fig. 4.4). The new center of chirality generated by hemi-acetal ring closure is called the anomeric center. The two stereoisomers are referred to as anomers, and differ from each other based on the position of the hydroxyl group on C1. The two anomers are designated ‘α’ and ‘β’ according to the configu-rational relationship between the anomeric carbon and a specified anomeric refer-ence atom, which is the configurational atom of the linear chain using the Fischer projection (Section 4.3.2). In the α-anomer, the exocyclic oxygen atom at the ano-meric center is placed cis (on the same side) in the Fischer projection relative to the oxygen attached to the anomeric reference atom, whereas in the β-anomer these oxygen atoms are in a trans-configuration. Anomers are not to be confused with epimers, which differ in the placement of a substituent on the carbon atoms other than C1 and thus represent different compounds. For example, mannose (4.3 – Fig. 4.5) is the C2 epimer of glucose. The pyranose ring is not planar, but can form chair [C] conformation, whereby the substituents on the C-atoms are placed either in the axial or equatorial position relative to the plane through the largest number or atoms, namely C2, C3, C5 and the O. The notations 1C4 and 4C1 refer to the two possible conformation of the pyranose chair structure. In 1C4, C1 lies above the plane and C4 below, whereas it is flipped in 4C1. The 1C4 conformation is the most prevalent because of the energetically favor-able placement of the hydroxyl and –CH2OH substituents at the equatorial position, which minimizes steric hindrance (‘crowding’). For furanoses the envelope [E] con-

94 Vermerris formation is used. The Haworth projection is commonly used and is a somewhat simpler method to represent the conformation of the ring structures (see Fig. 4.4). A sugar molecule in aqueous solution will be in equilibrium between the open-chain structure, the α- and β-furanose and the α- and β-pyranose ring structures. This is possible because the ring can reopen to form the linear chain, by reversing the semi-acetal formation. Once the sugar is linked to another sugar by a linkage involv-ing C1, as is the case in disaccharides and polysaccharides, the ring can no longer open. The terminal sugar of a polysaccharide will still be able to open up. The open-ing of the ring creates an aldehyde group on C1 that is able to reduce copper under alkaline conditions, a classic assay to determine the presence of (reducing) sugars in an unknown sample. This terminal sugar is therefore referred to as the reducing end of the chain.
HC
OHH
HHO
OHH
OHH
CH2OH
O
H
HO
H
HO
H
OH
OHHH
OH
O
H
HO
H
HO
H
H
OHHOH
OH
OHC
OHH
HHO
OHH
OHH
HOH2C
O
CH2OHH
OH
H
OHH
OH
H
HO
OH
H
H
H OH
OH HO
H O
HOH2C
H
OH
H
OHH
OHH
OHH O
CH2OH
H
OH
H
OHH
OHH
O
OH
H
CH2OH
H
OH
H
OHH
OHH
O
H
OH
HHO
CH2OH
H
OH
H
H OH
OH HO
HHO
CH2OHH
H OH
OH HOH
HHO
CH2OH
O
HH
H OH
OH H
HO
H
HOH2COH
O
H
4.2
1
6
H OH
O
HO
H
HO
H
H
HOH2CH
HO
H H
O
HO
OH
HO
H
H
HOH2CH
HO
Fig. 4.4. Different conformations of D-glucose in an aqueous solution. The formation of the α- and β-pyranose (top) and α- and β-furanose rings (bottom) from the flat projection are shown. Both the Haworth and chair/envelope conformations are shown.
The exact distribution between these conformations depends on the balance be-tween the 1,3-diaxial interaction (steric hindrance) between the substituents on posi-tions 2 (C1), 4 (C3) and 6 (C5) on the ring, and dipole-dipole interactions between

Composition and Biosynthesis of Lignocellulosic Biomass 95
the OH-group on the anomeric carbon (C1) and the adjacent oxygen in the ring. The axial placement of the hydroxyl group on the anomeric carbon is favorable in terms of the dipole-dipole interaction with the oxygen atom in the ring (the electric charge vectors cancel each other out), but this tends to create steric hindrance with the sub-stituents on C3 and C5. Therefore, the exact distribution between the different con-formations depends on the relative positions of the substituents on the carbon back-bone of the sugar molecule and is unique for each sugar. Figure 4.4 shows the different conformations for the sugar D-glucose and their relative distributions in an aqueous solution. The different sugar molecules are often referred to using a three-letter code. The following hexoses and pentoses (followed by their abbreviation) are common in the plant cell wall: glucose (Glc; C6; 4.2 in Fig. 4.4), mannose (Man; C6; 4.3 in Fig. 4.5), galactose (Gal; C6; 4.4), xylose (Xyl: C5; 4.5), arabinose (Ara; C5; 4.6 and 4.7) and fucose (Fuc; C5; 4.8). When necessary, the pyranose and furanose conformation can be indicated by adding an italic p or f. For example, Arap and Araf represent the pyranose and furanose conformation of arabinose, respectively. Uronic acids are oxidized sugars with a carboxyl group (COOH) on the 6-position as opposed to the hydroxyl group. A prefix is used to indicate the origin of a given uronic acid. Thus, glucuronic acid is the uronic acid derived from glucose and is abbreviated as GlcA (4.9). Similarly, GalA is galacturonic acid, derived from galactose.
H
O
H
HO
H
HO
OH
H
HHOH
OH
O
OH
H
H
HO
H
H
OHHOH
OH
O
H
HO
H
HO
H
OH
OHHH
C
O
H
O
H
HO
H
H
OHHOH
OH
O
H
HO
H
HO
H
OHH
OH
1
41'
4'
4.10
H
OH
HO
OH
HO
H
H
O
H
HO
H
HO
H
H
OHH
H
OH
4.2 4.3
O
OH
H
H
HO
H
OH
OHH
H
H
O O
4.9
4.7
4.5
4.64.5
OHO
OH
H
OH
OH
HCH3
H
H
H
HO
Fig. 4.5. Common cell wall sugars. Shown are the monomers β-D-glucopyranose (4.2), β-D-mannopyranose (4.3), β-D-galactopyranose (4.4), β-D-xylopyranose (4.5), β-L-arabinopyranose (4.6), α-L-arabinofuranose (4.7), L-fucose (4.8), α-D-glucuronic acid (4.9) and the dimer cellobiose (4.10).

96 Vermerris 4.4 Cellulose
4.4.1 Cellulose Structure
Cellulose is considered the most abundant biopolymer on Earth. It is a chain of β-(1,4)-linked D-glucopyranoses. It makes up 15–30% of the primary cell wall and as much as 50–60% of the secondary cell wall. Close examination of plants cell walls, for example with the use of electron microscopy or atomic force microscopy (AFM), shows how cellulose is present as microfibrils. AFM is a technique that measures attractive and repulsive forces between a very small (1-nm) scanning probe tip and the sample surface to generate a 3-D image of a complex sample surface at high resolution. Ding and Himmel (2006) used AFM to obtain high-resolution images of the primary wall of parenchyma cells in the stem of mature, field-grown maize plants. Their observations revealed the presence of parallel microfibrils with a di-ameter of 3 × 5 nm. Microfibrils on the cell surface could aggregate into randomly arranged macrofibrils ranging in diameter between 50 and 250 nm (Fig. 4.6A). Ding and Himmel (2006) define the microfibril as a structural unit thought to consist of an elementary fibril of on average thirty-six β-(1,4)-linked D-glucan chains bound together through hydrogen bonds, and that may be associated with additional non-cellulosic polysaccharides (Fig. 4.6B).
Fig. 4.6. (A) Atomic force microscope image of a primary wall of maize parenchyma cell, show-ing ordered microfibrils in parallel orientation, and randomly oriented macrofibrils on the sur-face, (B) Schematic representation of a cellulose elementary fibril, and (C) macrofibril, proposed based on experimental data. The straight lines reflect crystalline cellulose Iβ, whereas the wavy lines reflect subcrystalline and non-crystalline β-D-glucan chains. Images reprinted with permis-sion from Ding and Himmel (2006). Copyright 2006 American Chemical Society.
The microfibrils can be several hundred micrometer in length. Individual β-(1,4)-D-glucan chains are several thousand glucose units long and therefore limited in

Composition and Biosynthesis of Lignocellulosic Biomass 97
length, but because the chains do not all start and end at the same place, the length of the elementary fibril that these chains form can be considerable. Within the elementary fibril the β-(1,4)-D-glucan chains run in parallel direction. As a consequence, the reducing and non-educing ends are in the same orientation relative to each other. Two glucose units are linked such that they are rotated almost 180° with respect to each other. In other words, when looking at a glucan chain strand from the side, the position of the ring-oxygen alternates between the front and the back. This means that the repeating unit in cellulose is not glucose but the β-(1,4)-linked dimer of D-glucopyranose, cellobiose (4.10). Cellulose can be present in different forms. Natural cellulose has a crystalline structure that is referred to as cellulose I. Its detailed structure has been determined with the use of X-ray diffraction (reviewed by Zugenmaier (2001)). There are two co-existing phases, cellulose Iα (triclinic) and cellulose Iβ (monoclinic), that are present in different proportions depending on the species. In plants, cellulose Iβ is the predominant form, whereas in algae cellulose Iα is more common. The terms triclinic and monoclinic refer to geometry of the crystal. A monoclinic crystal has three unequal crystal axes, two of which intersect obliquely (i.e. they are not perpen-dicular) while perpendicular to the third. A triclinic crystal has three unequal crystal axes intersecting at oblique angles. Determining the detailed crystal structure of cellulose Iα (Nishiyama et al. 2003) and Iβ (Nishiyama et al. 2002) was aided by the observation that cellulose I in certain species consist of predominantly one form. Both forms were shown to have a highly regular structure in which there is maximal hydrogen bonding between adjacent strands of cellulose. The two cellulose I con-formations differ in how neighboring D-glucan chains are positioned relative to each other. The neighboring chains in cellulose Iα are displaced in the same direction. If we imagine looking at a cross section and we look down the chain axis, chain III is displaced upwards relative to chain II the same way chain II is displaced upwards relative to chain I. In contrast, in cellulose Iβ the chain displacement varies. Chain I and chain II are displaced relative to each other the same way as in Cellulose Iα, but chain III is displaced downwards relative to chain II. The observed transition be-tween cellulose Iα and Iβ may occur through a slippage mechanism (Nishiyama et al. 2003). The term cellulose II refers to the thermodynamically more stable structure with an antiparallel arrangement of the strands and some inter-sheet hydrogen-bonding. Cellulose II contains two different types of anhydroglucose (A and B) with different backbone structures; the chains consist of -A-A- or -B-B- repeat units (Zugenmaier 2001; Langan et al. 2005). This form of cellulose is not very common in nature, but it is produced naturally by certain organisms (Saxena and Brown 2005). Paracrystalline cellulose – also referred to as amorphous cellulose – is less regu-lar in structure because the adjacent strands do not align as well, resulting in a less rigid structure. Paracrystalline cellulose is accessible to water molecules and the hydrated cellulose is soft and flexible. Biophysical data, however, suggest that even crystalline cellulose contains regions that are not as highly ordered (Šturcová et al. 2004). These regions are referred to as subcrystalline. In the model of the elementary fibril proposed by Ding and Himmel (2006) (Fig. 4.6B), only the six β-D-glucan

98 Vermerris chains in the core are represented as crystalline, based on structural information of cellulose obtained with nuclear magnetic resonance (NMR) by Ha et al. (1998) and Vietor et al. (2002).
4.4.2 Cellulose Biosynthesis
Cellulose is formed by the enzyme cellulose synthase. This is a membrane-bound enzyme made up of six subunits that form a rosette structure, referred to as a termi-nal complex (TC) (Mueller and Brown 1980) that catalyzes the following reaction:
UDP-Glucose (4.16 in Fig. 4.12) is the nucleotide sugar uridine-diphospho-glucose. The cellulose strands are extruded by a set of six cellulose synthase complexes (CSCs), each responsible for six strands of glucans. Hence the presence of 36 glucan chains in one microfibril (Fig. 4.6B). The fact that UDP-Glc is the substrate for cel-lulose presented a challenge, given that cellobiose is the repeat unit of cellulose. Understanding of the mechanism of biosynthesis required detailed knowledge of the enzymatic action of cellulose synthase. While the rosette structure of cellulose syn-thase had been known for a long time based on electron microscopy imaging (e.g. Brown and Montezinos 1976; Mueller and Brown 1980), the biochemical characteri-zation of this enzyme turned out to be very challenging. This was in part because the membrane-bound location of cellulose synthase and the low in vitro activity made it difficult to subject this protein to classic biochemical approaches, such as purifica-tion, kinetic studies, and amino acid sequencing (Pear et al. 1996). These challenges also hampered the cloning of the cellulose synthase gene. The first plant gene encoding cellulose synthase was cloned from cotton (Gos-sypium hirsutum). This plant species was chosen because developing fibers in the cotton boll consist almost entirely of cellulose. Furthermore, cellulose synthesis in these fibers occurs in a synchronized manner. Pear et al. (1996) generated a cDNA library from the developing seed and the created an expressed sequence tag (EST) collection by sequencing 300–400 nucleotides from randomly selected cDNA frag-ments. Among the ESTs in the collection were two clones with homology to a short region of the then recently obtained cellulose synthase (celA) gene from the bacte-rium Acetobacter xylinum (Saxena et al. 1990). The corresponding cDNA clones were referred to as CelA1 and CelA2 and shown to be highly expressed in developing fibers. The two clones were 70–80% homologous at the nucleotide level and had slightly different expression patterns The cDNA’s were expressed in E. coli and after purification and blotting of the recombinant proteins to a nitrocellulose membrane, Pear et al. (1996) showed that the recombinant proteins were able to bind radio-labeled UDP-glucose, the substrate for cellulose. This, along with the sequence ho-mology of these two genes with several other bacterial cellulose synthase genes, provided strong evidence that these clones encoded cellulose synthase. Homology searches in sequence databases revealed the existence of rice (Oryza sativa) and
UDP-Glucose + cellulosen UDP + cellulosen+1

Composition and Biosynthesis of Lignocellulosic Biomass 99
Arabidopsis thaliana ESTs encoding putative cellulose synthase genes. This was also confirmed in a later report by Cutler and Somerville (1997). Comparison with the bacterial cellulose synthases showed that a set of four short domains (five to seven amino acids in length; labeled U-1 through U-4) were highly conserved (70–80%) among all species, whereas sequence similarity outside these domains was very limited. U1, U2, and U3 contained a conserved aspartyl (D) resi-due and U4 the conserved signature sequence QXXRW. These features had been proposed to be involved in substrate binding and/or catalysis in processive glycosyl transferases (Saxena et al. 1995). The amino acid one-letter code used in the signa-ture sequence translates as follows: Q, glutamine (Gln); R, arginine (Arg); W, tryp-tophan (Trp), while X stands for any single residue. The predicted plant cellulose synthases contained a plant-specific domain and a so-called hypervariable domain (HVR) that showed divergence among the available plant sequences (Pear et al. 1996). The signature sequence was shown to be part of a globular structure predicted to be located in the cytosol. Hydropathy plots (displaying hydrophobic and hydro-philic domains) suggested that the N- and C-termini contain two and six predicted membrane-spanning domains, respectively (Pear et al. 1996). The first genetic proof demonstrating the function of the cellulose synthase gene came from studies by Arioli et al. (1998) on the Arabidopsis radial swelling1 (rsw1) mutant. This mutant displayed a temperature-sensitive phenotype, whereby the roots became swollen when the plants were grown at 31°C (Baskin et al. 1992). This re-sponse mimicked the phenotype resulting from treatment of seedlings with synthetic cellulose synthase inhibitors. Arioli et al. (1998) showed that the rsw1 phenotype was caused by a disassembly of cellulose-synthesizing rosettes, leading to the accu-mulation of a noncrystalline β-(1,4)-linked glucan. Map-based cloning of the RSW1 gene revealed a high degree of homology to the CelA genes of cotton (Pear et al. 1996). The molecular basis for the mutant phenotype was a point mutation in the rsw1 mutant allele that caused an amino acid change, thus altering the functionality of the enzyme. Transformation of the rsw1 mutant with a wild-type copy of the RSW1 gene resulted in a normal phenotype. This is considered proof that the correct gene had been identified. The RSW1 gene encodes a 3.8 kb mRNA that encodes a 122-kDa protein containing the conserved signature sequence D,D,D,QXXRW pre-sent in processive glycosyl transferases (Saxena et al. 1995). The comma’s spacing the D’s represent arbitrary intervening lengths between the conserved domains U1, U2, U3 and U4. Based on its specific sequence, it is a member of the Family 2 of inverting nucleotide-diphospho-sugar glycosyltransferases (Campbell et al. 1997). The deduced amino acid sequence of the cellulose synthase enabled predictions about the enzymatic function of the protein, especially concerning the mechanism behind the incorporation of UDP-glucose as the substrate, when cellobiose, with its D-glucose residues rotated 180° with respect to each other, is the repeat unit of cellu-lose. Carpita and Vergara (1998) presented a diagram of cellulose biosynthesis based on a model proposed by Koyama et al. (1997) in which two catalytic sites within the cellulose synthase enzyme bind two UDP-glucosyl residues simultaneously. The two catalytic sites are positioned 180° with respect to each other, and in this model the conserved aspartyl residues are responsible for the glycosyl transferase reaction, which involves hydrolysis of the phosphate ester bond and formation of a glycosidic

100 Vermerris bond with the glucosyl residue at the non-reducing end of the growing cellulose chain. Since the initial cloning of the cotton and Arabidopsis cellulose synthase genes, homologs from many other species have been identified, enabling a major research effort aimed at elucidating the biosynthesis of cellulose. The developments have been summarized in a number of excellent general review articles by Delmer (1999), Carpita et al. (2001), Perrin (2001), Doblin et al. (2002), Brown (2004), Richmond (2000), Saxena and Brown (2005) and Somerville (2006). With the availability of whole-genome sequences and large gene expression databases, it became clear that all plant species contain many genes with homology to cellulose synthase (Holland et al. 2000; Richmond and Somerville 2000). These genes can be classified in gene families based on gene structure and the presence of conserved motifs. The genes encoding cellulose synthase are referred to as CesA genes, whereas genes with homology are referred to as cellulose synthase-like (Csl) genes. Richmond and Somerville (2000) proposed a group of six Csl gene families, named CslA through CslE and CslG. With the completion of the rice genome se-quence, this was expanded to a group of eight Csl families (Hazen et al. 2002). Based on a comparison of the rice and Arabidopsis genomes, these authors con-cluded that the CslF and CslH families were specific for rice and other grasses, whereas the CslB and CslG families were specific for dicots. The availability of the genome sequence combined with forward and reverse genetics approaches (see Chapter 2) has enabled functional analyses of the different members of the gene families. While electron micrographs revealed that the rosette structure of the cellulose-synthesizing terminal complex is made up of six subunits (Mueller and Brown 1980), molecular genetic analysis revealed that these six sub-units represent three different proteins, and that these three proteins differed between the primary and secondary wall. The catalytic subunits CesA4, CesA7 and CesA8 form a functional CSC in the secondary cell wall of Arabidopsis. CesA7 is encoded by the IRREGULAR XYLEM3 (IRX3) gene (Taylor et al. 1999), whereas CesA8 and CesA4 are encoded by the IRX1 (Taylor et al. 2000) and the IRX5 gene (Taylor et al. 2003), respectively. The irx mutants were identified during a forward genetics screen for secondary cell wall mutants among a population of chemically induced Arabidopsis mutants. Plants with collapsed xylem were considered as putative mutants. Taylor et al. (2003) showed that the IRX1, IRX3 and IRX5 genes were co-expressed in the same tissues. Further-more, immuno-precipitation experiments indicated that all three catalytic subunits were required to form a functional TC. Tanaka et al. (2003) showed that similar sets of genes were present in other plants. It is not entirely clear how the different cata-lytic subunits interact, but Kurek et al. (2002) showed that the zinc finger present at the N-terminus of cellulose synthase enables the formation of cross-linking disulfide bonds between different subunits. In the primary wall of Arabidopsis, the subunits of the CSC are CesA1, CesA3, and CesA6. Arabidopsis CesA1 is encoded by the RSW1 gene (Arioli et al. 1998) and CesA6 by the PROCUSTE1 (PRC1) gene (Fagard et al. 2000). Mutants resistant to the (crystalline) cellulose synthase inhibitor isoxaben, ixr1-1, 1-2, and 2-1, corre-spond to mutations in the CesA3 and CesA6 genes, respectively (Scheible et al. 2001;

Composition and Biosynthesis of Lignocellulosic Biomass 101
Desprez et al. 2002). The role of the CesA2 and CesA3 genes was investigated in Arabidopsis by down-regulation of these genes using antisense contructs (Burn et al. 2002). Reduction of CesA3 activity resulted in slightly reduced cellulose deposition and smaller cell size. Interestingly, overexpression of CesA3 was unable to comple-ment the rsw1 mutation, suggesting distinct functions of CesA1 and CesA3. The role of CesA2 in cellulose synthesis did not become clear from these experiments, since only a weak temperature-sensitive reduction in internode length was observed. A null mutation in the CesA2 gene reported by Chu et al. (2007) resulted in a severe dwarf phenotype. Persson et al. (2007) performed a genetic study involving CesA1, CesA3 and CesA6. They determined that null mutations caused by T-DNA insertions in the CesA1 and CesA3 genes were lethal (the previously identified rsw and ixr mutations were not necessarily null alleles), as a result of defective pollen. Since the prc1-1 null allele of the CesA6 gene did not result in a lethal phenotype (Fagard et al. 2000), Persson et al. (2007) hypothesized that CesA6, CesA2, CesA5 or CesA9 were functionally redundant, further substantiated by sequence similarity. A T-DNA inser-tion allele of CesA2, which most closely resembles CesA6 in terms of gene expres-sion, resulted only in slightly reduced growth of dark-grown seedlings. The differ-ence with the mutant phenotype reported by Chu et al. (2007) was attributed to the different genetic background. A prc1-1 cesa2 double mutant, however, was short, had swollen roots and stems, and the cell adhesion was affected. These results are in support of functional redundancy of CesA2 and CesA6. Since this double mutant was still able to produced pollen, unlike the cesa1 and cesa3 mutants, Persson et al. (2007) were further able to show that CesA9 could compensate for the loss of CesA2 and CesA6 in the pollen. Consequently, a cesa2-cesa6-cesa9 triple mutant was le-thal. More detailed analyses of expression patterns of the CesA2, -5, -6, and -9 genes suggested that the CesA complex in the primary wall has a different composition depending on the developmental stage and tissue. This conclusion is consistent with the experiments by Desprez et al. (2007). These authors used a biochemical approach to visualize the physical interaction between different catalytic subunits and showed that the CSC in the primary wall always contains CesA1 and CesA3. Their data also showed that CesA6 physically interacts with both of these catalytic units, and that CesA2 and CesA5 can compete with CesA6. Ding and Himmel (2006) proposed a model for the arrangement of the six CesA subunits in a rosette structure (Fig. 4.7). Seven rosettes could form a honeycomb array in the cell membrane that could be responsible for the formation of the ma-crofibril. The precise arrangement of the catalytic subunits still needs to be verified experimentally. The role of the enzyme sucrose synthase (EC 2.4.1.13) in cellulose biosynthesis has been under investigation for some time. Sucrose synthase catalyzes the formation of fructose and UDP-Glc (4.11) from sucrose and has traditionally been implicated in the biosynthesis of starch (reviewed by Fernie et al. 2002). This enzyme could, how-ever, also be responsible for the generation of UDP-glucose as the substrate for cel-lulose. Amor et al. (1995) showed how in cotton, at least half of the available sucrose synthase was tightly associated with the cell membrane. This led these authors to speculate a role of sucrose synthase as part of a multi-enzyme complex responsible for the biosynthesis of cellulose.

102 Vermerris
Fig. 4.7. (A) Model of cellulose synthase involving different catalytic subunits. (B) Oraganiza-tion of cellulose synthase in rosettes consisting of 36 catalytic subunits. Images reprinted with permission from Ding and Himmel (2006). Copyright 2006 American Chemical Society.
Salnikov et al. (2001) provided further evidence supporting this hypothesis by local-izing sucrose synthase to sites of cellulose synthesis in developing tracheary ele-ments of Zinnia elegans cell cultures. Transgenic down-regulation of sucrose syn-thase genes in cotton resulted in developing seeds that were fiberless (Ruan et al. 2003). While this indicates sucrose synthase is important for fiber production, it is not clear whether the lack of fiber formation is the result of reduced availability of UDP-Glc, the substrate for cellulose, a general disturbance of hexose metabolism, or a lack of osmotic potential to drive fiber cell expansion. Recent experiments with T-DNA insertion mutants of Arabidopsis revealed that the six sucrose synthase genes in this species vary in their expression patterns, but that at least two sucrose synthase genes are expressed in each organ that was examined (Bieniawska et al. 2007). Mu-tant plants lacking individual isoforms did not display obvious growth phenotypes, and did not differ significantly from wild-type plants in starch, sugar and cellulose content, seed weight or seed composition under the growth conditions employed. Even several double mutants were indistinguishable from wild-type plants. These data indicate that more than one sucrose synthase isoform is able to supply UDP-Glc for cellulose synthesis in Arabidopsis, or that UDP-Glc can also be synthesized via invertase-mediated hydrolysis of sucrose. The opposite strategy, transgenic up-regulation of sucrose synthase expression in tobacco was employed by Coleman et al. (2006). The resulting transgenic plants did not produce more cellulose per cell, suggesting that UDP-Glc is not the limiting factor in cellulose accumulation in to-bacco. Taken together, the results from these experiments indicate that sucrose syn-thase and cellulose synthase may be associated in some species or organs, but that this does not appear to be a universal mechanism. Furthermore, direct evidence for such an association still needs to be obtained.
4.5 Hemicellulose
Cellulose microfibrils in the cell wall interact with another major class of polysac-charides: hemicellulose. The name hemicellulose is not very accurate, but reflects the

Composition and Biosynthesis of Lignocellulosic Biomass 103
fact that this fraction of the wall behaves differently from cellulose – it can be re-leased by incubation in acid or alkaline solution – and has a different structure from cellulose. While cellulose is a universal compound of plant cell walls, hemicellulose shows more variation among different classes of plants. In fact, one way to classify the orders of the angiosperms in the plant kingdom is by distinguishing them based on the composition and structure of their hemicellulose (Dahlgren 1989). The exact composition of hemicellulose can also vary as a function of the developmental stage of the plant. The different classes of hemicellulose are discussed below.
4.5.1 Xyloglucans
Xyloglucans (XyGs) are the predominant hemicellulosic polysaccharide in dicoty-ledonous angiosperms. Non-commelinoid monocots (including orchids and lilies) also contain xyloglucan as the main hemicellulosic polysaccharide. XyGs are linear chains of β-(1,4)-linked D-glucopyranose residues on which various side chains can be attached. The most common substituent is α-D-xylose linked to the O-6 position (the oxygen molecule on C6) of the first three of four glucose residues. The resulting repeat unit is written as ‘XXXG’, where G stands for an unsubstituted glucose resi-due (Fig. 4.8). The second and third xylose residue may be substituted on the O-2 position with an α-(1,2)-linked galactopyranosyl residue. This is indicated by the letter L. The galactose residue on the third xylose is sometimes substituted with an α-(1,2)-linked L-fucopyranosyl residue, designated as F. Substitution of the xylose residue with α-L-arabinose is designated as A.
H
O
H
O
H
HO
H
H
OHHOH
OH
O
H
H
HO
H
OHH
O
1
41'
4'H
O
H
O
H
HO
H
H
OHHO
O
O
H
HO
H
HO
H
OHH
O
1
41'
4'
O
H
HO
H
HOH
OHH
H
H
O
H
HO
H
HO H
OH
H
H
O
H
HO
H
HOH
OHH
H
H
O
HOH
H
OH
H
HO
H
HO
O
H
OH
H
OH
OH
HH
H3C
H
X F GX
1
6'
2 1'
2'
1
L-fucose
D-galactose
D-xylose
D-glucose
D-xylose
Fig. 4.8. Schematic representation of fuco-galacto-xyloglucan, displaying the XXFG repeat unit, which consists of four D-glucopyranose residues (G; rotated 180° with respect to each other), with substitutions of α-(1,6)-linked D-xylopyranose on glucose residues 1 and 2 (X), and α-(1,2)-L-fucose-β-(1,2)-D-galactose-β-(1,6)-D-xylose on glucose residue 3 (F). The rele-vant carbon atoms of the sugar residues are labeled.
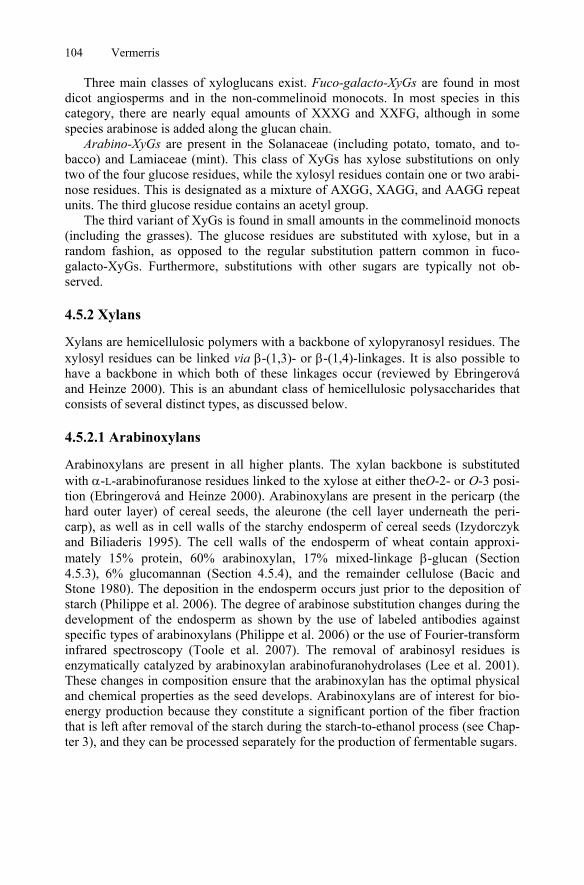
104 Vermerris Three main classes of xyloglucans exist. Fuco-galacto-XyGs are found in most dicot angiosperms and in the non-commelinoid monocots. In most species in this category, there are nearly equal amounts of XXXG and XXFG, although in some species arabinose is added along the glucan chain. Arabino-XyGs are present in the Solanaceae (including potato, tomato, and to-bacco) and Lamiaceae (mint). This class of XyGs has xylose substitutions on only two of the four glucose residues, while the xylosyl residues contain one or two arabi-nose residues. This is designated as a mixture of AXGG, XAGG, and AAGG repeat units. The third glucose residue contains an acetyl group. The third variant of XyGs is found in small amounts in the commelinoid monocts (including the grasses). The glucose residues are substituted with xylose, but in a random fashion, as opposed to the regular substitution pattern common in fuco-galacto-XyGs. Furthermore, substitutions with other sugars are typically not ob-served.
4.5.2 Xylans
Xylans are hemicellulosic polymers with a backbone of xylopyranosyl residues. The xylosyl residues can be linked via β-(1,3)- or β-(1,4)-linkages. It is also possible to have a backbone in which both of these linkages occur (reviewed by Ebringerová and Heinze 2000). This is an abundant class of hemicellulosic polysaccharides that consists of several distinct types, as discussed below.
4.5.2.1 Arabinoxylans
Arabinoxylans are present in all higher plants. The xylan backbone is substituted with α-L-arabinofuranose residues linked to the xylose at either theO-2- or O-3 posi-tion (Ebringerová and Heinze 2000). Arabinoxylans are present in the pericarp (the hard outer layer) of cereal seeds, the aleurone (the cell layer underneath the peri-carp), as well as in cell walls of the starchy endosperm of cereal seeds (Izydorczyk and Biliaderis 1995). The cell walls of the endosperm of wheat contain approxi-mately 15% protein, 60% arabinoxylan, 17% mixed-linkage β-glucan (Section 4.5.3), 6% glucomannan (Section 4.5.4), and the remainder cellulose (Bacic and Stone 1980). The deposition in the endosperm occurs just prior to the deposition of starch (Philippe et al. 2006). The degree of arabinose substitution changes during the development of the endosperm as shown by the use of labeled antibodies against specific types of arabinoxylans (Philippe et al. 2006) or the use of Fourier-transform infrared spectroscopy (Toole et al. 2007). The removal of arabinosyl residues is enzymatically catalyzed by arabinoxylan arabinofuranohydrolases (Lee et al. 2001). These changes in composition ensure that the arabinoxylan has the optimal physical and chemical properties as the seed develops. Arabinoxylans are of interest for bio-energy production because they constitute a significant portion of the fiber fraction that is left after removal of the starch during the starch-to-ethanol process (see Chap-ter 3), and they can be processed separately for the production of fermentable sugars.

Composition and Biosynthesis of Lignocellulosic Biomass 105
4.5.2.2 Glucuronoarabinoxylans
Glucuronoarabinoxylans (GAXs) are similar to arabinoxylans in that they contain a xylan-based backbone with arabinose substitutions, but they also contain α-D-glucuronic acid (α-D-GlcA) substitutions on the xylan backbone. GAXs represent the predominant hemicellulosic polysaccharide in commelinoid monocots, where they make up 20–30% of the cell wall. In species belonging to that order, the α-L-arabinose residues are linked to the xylose residue on the O-3 position. The α-D-GlcA residue is attached to the O-2 position of the xylan backbone. The arabinose unit can be further substituted with the hydroxycinnamic acid ferulic acid. This com-pound is esterified to the O-5 position (Fig. 4.9). The feruloylated arabinose residues are spaced approximately 50 xylose residues apart (Carpita and Mccann 2000). The degree of substitution of GAXs also varies as a function of plant development. The highest degree of substitution in maize coleoptiles (etiolated sprouts) was observed during maximal growth (Carpita and Whittern 1986), whereas removal of arabinosyl residues occurred as cell elongation ceased (Carpita and Gibeaut 1993; Suzuki et al. 2000). The lower degree of substitution is thought to allow the formation of hydro-gen bonds between GAX and cellulose, resulting in a more rigid cell wall. The feru-loyl substitution on the arabinosyl residues allows the formation of cross-linking diferulate bridges and oxidative coupling with lignin (Iiyama et al. 1990; 1994). In fact, the ferulate substituents have been proposed to act as nucleation sites for lignin in the cell walls of grasses (Hatfield et al. 1998). Myton and Fry (1994) showed that in cell cultures of tall fescue grass (Festuca arundinacea), the feruloyl substitution takes place inside the cell, as opposed to in the cell wall.
O
H
O
H
O
H
H
OHH
H
OO
H
O
H
HO
H
H
OHH
H
O
H
O
H
O
H
H
OHH
H
O
H
O
H
HO
H
H
OH
H
H
OH
OH
HO
H
H
OH
H
OH
OH
HO
H
H
O
O
H
HO
H
HOH
OHH
H
O
OH
OCH3
OH
Oferulate
D-glucuronic acid
L-arabinose
2'
3
1'
41'
1
14'
1'
4'
4
1
1'
5'
3
Fig. 4.9. Schematic representation of glucuronoarabinoxylan, displaying a backbone of β-(1,4)-linked D-xylopyranose residues (rotated 180° with respect to each other), with substitu-tions of α-(1,2)-D-glucuronic acid and α-(1,3)-linked L-arabinofuranose residues. One of the arabinose residues is feruloylated at the O-5 position. The relevant carbon atoms of the sugar residues are labeled.
GAXs are also present in dicots and non-commelinoid monocots, albeit in small amounts (~5%). In these species the α-L-arabinose residue is linked to either O-2 or

106 Vermerris O-3 of the xylan residue, whereas the α-D-GlcA is always linked to O-2 (Zablackis et al. 1995). Understanding the structure and biosynthesis of GAXs is critical for bioenergy research, given their abundance in the cell walls of grasses, which as a group, repre-sent a major source of lignocellulosic biomass.
4.5.2.3 4-O-Methyl-Glucuronoxylans
This class of hemicellulosic polysaccharides is primarily found in dicots, and is es-pecially abundant in the secondary cell walls of hardwood species. This polysaccha-ride consists of a β-(1,4)-linked D-xylan backbone substituted with 4-O-methyl-α-D-glucuronic acid residues. Approximately 10% of the xylosyl residues are substituted. Their abundance varies considerably depending on the species (Timell 1967; Jacobs and Dahlman 2001).
4.5.3 Mixed-Linkage Beta-Glucans
Mixed linkage β-glucans are unique to the order of Poales within the commelinoid monocots. The order of Poales includes the grasses, such as maize, rice, sorghum, wheat, and ryegrass. This polysaccharide is present in the primary cell wall and con-sists of D-glucose residues with no further substitution. The building blocks are cel-lotriose and cellotetraose units in a ratio of 2:1. The glucose residues within the cel-lotriose and cellotetraose units are linked by β-(1,4)-linkages, but the linkages between the cellotriose and cellotetraose units are β-(1,3)-linked. This latter linkage creates turns in the chain, so that the spatial structure of the polymer looks like a corkscrew. The corkscrew is interrupted every 50 residues by an oligomer of four or more β-(1,4)-linked D-glucose residues (Carpita and McCann 2000). Given that this class of hemicellulosic polysaccharides is predominantly present in the primary cell wall and is largely degraded as the plant matures, this polymer is considered of limited value for bioenergy production.
4.5.4 Mannans
Mannans are hemicellulosic polysaccharides with a backbone containing mannose residues. They can be present as glucomannans (Fig. 4.10), galactomannans and galacto-
β-(1,4)-linked D-mannosyl residues D-galactosyl residues linked via an α-
(1,6) bond. Glucomannans and galactoglucomannans have a backbone containing both glucose and mannose residues. In the case of galactoglucmannans, the backbone is substituted with α-(1,6)-linked D-galactosyl residues. These polysaccharides are found in many different plant species, but typically in small amounts. There are two exceptions. In softwood species (galacto)glucomannans (Fig. 1.9) are the primary hemicellulosic polysaccharide, accounting for as much as 16–18% of the woody cell wall (Maeda et al. 2000). The glucosyl-to-mannosyl ratio is approximately 1:3 and approximately 50% of the hydroxyl groups on C2 or C3 of the D-mannosyl residues of the backbone are acetylated (Maeda et al. 2000). In these species, the other main
glucomannans. In the case of galactomannans the that make up the backbone are substituted with

Composition and Biosynthesis of Lignocellulosic Biomass 107
hemicellulosic polysaccharide is arabino-(4-O-methylglucurono)-xylan (Jacobs and Dahlman 2001). The other exception is formed by those species that synthesize ga-lactomannans as storage polysaccharides. These mannans are deposited in the en-dosperm of seeds from, for example, guar (Cyamposis tetragonoloba), locust bean (Ceratonia siliqua) and coconut palm (Cocus nucifera) (Dhugga et al. 2004). Since in general this class of hemicellulosic polysaccharides is not very abundant relative to XyG and GAX, they are generally considered of limited value for bio-energy production. The presence of glucomannans in softwoods should, however, be taken into consideration for the bioprocessing of softwoods.
OH
O
HRO
RO
HH
H
OHHO
O
H
O
H
RO OR
H
HH
OH
O
HRO
RO
HH
H
HO
O
H
O
H
RO OR
H
HH
O
H
OH
O
HRO
H
HOR
H
HO
O
H
H
RO
H
ORH
OH
14
1'
4'
O
O
HO H
H
OH
H
OH
H
HOR = CH3CO or H
D-glucose
D-glucose
D-mannose
D-mannose
D-mannose
D-mannose
D-galactose
1'
1'
4
4
4'
4'
1
1
3
2
3'2'
6'
6'
H
O
HO H
H
OH
H
OH
H
HO
H
1
1
D-galactose
Fig. 4.10. Schematic representation of glucomannans, an abundant hemicellulosic polysaccha-ride found in softwood species. The backbone consists of β-(1,4)-linked D-glucosyl and D-mannosyl residues in a ratio of 1:3. Subsequent sugar residues in the backbone are rotated 180° with respect to each other. Some of the residues are substituted with α-(1,6)-linked D-galactosyl residues. Approximately 50% of the hydroxyl groups on C2 and C3 are acetylated, indicated by the R. The relevant carbon atoms of the sugar residues are labeled.
4.5.5 Hemicellulose Biosynthesis
The biosynthesis of most of the hemicellulosic polysaccharides is relatively poorly understood. Efforts to elucidate key steps in hemicellulose sugars were initially hampered by the lack of convenient and accurate methods to determine the structure and composition of hemicellulose. Once such methods were available, genetic ap-proaches became feasible, especially with the availability of whole-genome se-quences for several plant species (Somerville et al. 2004). In particular, the model plant Arabidopsis thaliana turned out to be very useful to identify genes involved in

108 Vermerris XyG biosynthesis. This plant is small and has a short generation time, so that many individual plants can be grown in a relatively small space such as a greenhouse. There are several distinct steps in the biosynthesis of hemicellulosic polysaccha-rides. The first step is the biosynthesis of the different monomeric sugars that are incorporated in the polymers (Seifert 2004). In many cases those sugars can also be present in pectin. Once the sugars have been generated, they need to be linked to other sugars, forming either the backbone or the side chains. Finally, in the case of xyloglucans, the initial polysaccharide can be modified by chain-altering enzymes known as xyloglucan endotransglycosylase/hydrolases (XTHs) (Darley et al. 2001; Rose et al. 2002). This class of enzymes enables cell expansion and cell wall differ-entiation. While cellulose synthesis takes place at the interface of cell membrane and cell wall, the biosynthesis of hemicellulosic polysaccharides occurs predominantly in the Golgi apparatus. This organelle is located in the cytosol and is the site of many bio-chemical processes. The polysaccharides are secreted in vesicles that split off of the cisternae of the Golgi apparatus, in particular the trans-Golgi network (TGN). The vesicles merge with the membrane, thereby purging their contents in the developing cell wall (Dhugga 2005).
4.5.5.1 The Nucleotide Sugar Interconversion Pathway
The different substrates for hemicellulosic polysaccharides are generated via the nucleotide sugar interconversion pathway (Fig. 4.11). As the name implies, the sugar moieties are modified while they are part of a nucleotide sugar (see Chapter 2 for a description of nucleotides), generated as products of photosynthesis and gluconeo-genesis. The two precursors for the different sugars are uridine diphosphate-D-glucose (UDP-Glc; 4.16), synthesized by sucrose synthase (see Section 4.4.2) and guanidine diphosphate-D-mannose (GDP-Man; 4.11), synthesized from fructose-6-phosphate via a series of enzymatic reactions involving phosphomannose isomerase (PMI), phosphomannomutase (PMM), and GDP-D-mannose pyrophosphorylase (GPM) (reviewed by Reiter and Vanzin (2001) and Seifert (2004)). As shown in Fig. 4.11, GDP-Man is the precursor for GDP-L-galactose (GDP-Gal; 4.12), GDP-L-fucose (GDP-Fuc; 4.15) and GDP-L-gulose. Figure 4.12 shows the interconversion of UDP-Glc to UDP-L-rhamnose (UDP-Rha; 4.17), UDP-D-glucuronic acid (UDP-GlcA; 4.18), UDP-L-xylose (UDP-Xyl; 4.19), UDP-Gal (4.20), UDP-D-galacturonic acid (UDP-GalA; 4.21), UDP-L-arabinose (UDP-Ara; 4.22) and UDP-D-apiose (UDP-Api; 4.23). The sugar apiose is present in the pectic polysaccharide rhamnogalacturonan II (see Section 4.6). Several of the enzymes of the nucleotide sugar interconversion pathway were identified based on the analysis of mutants with altered hemicellulose composition. The first analysis of this nature was reported by Reiter et al. (1993), who described the generation of a class of mutants called mur (for murum, Latin for wall) obtained after mutagenesis of seeds with ethyl methanesulfonate (EMS). Monomeric sugars representative of hemicellulose were obtained via acid hydrolysis, derivatized to alditol acetates and quantified using gas chromatography. Among the 5,200 plants analyzed, 38 mutants were identified, five of which were allelic to each other and

Composition and Biosynthesis of Lignocellulosic Biomass 109
O
H
HO
H
HO
OH
GDP
HHH
OH
O
O
H
HO
OH
GDP
HH
H3C
H
O
O
OH
H
OH
GDP
HCH3
H
H
OHO
OH
H
OH
GDP
HCH3
H
H
H
OGDP
HO
H
HH
HO
HO
H
OH
H
4.11 4.154.144.13
4.12
a
c
b b
Fig. 4.11. Nucleotide sugar interconversion pathway I. Conversion of GDP-Man (4.11) to GDP-Gal (4.12) and GDP-Fuc (4.15) via GDP-4-keto-6-deoxy-D-mannose (4.13) and GDP-4-keto-6-deoxy-L-galactose (4.14). The enzymes involved are (A) GDP-D-mannose-4,6-dehydratase (GMD), (B) GDP-4-keto-6-deoxy-D-mannose 3,5-epimerase-4-reductase (GER), and (C) GDP-D-mannose 3,5-epimerase (GME).
showed a severe reduction in the sugar L-fucose in aerial parts of the plants (2% of wild-type levels). In roots there was a 40% reduction. The mur1 mutant, representa-tive of this group, was a dwarf and displayed reduced tensile strength, which were attributed to changes in the physico-chemical properties of xyloglucan or the pectic polysaccharide rhamnogalacturonan II (see Section 4.6), which also contains fucosy-lated residues. Further analysis of the mur mutants resulted in the classification of 23 mur mutants representing 11 independent loci (Reiter et al. 1997). The mur mutants were either lacking a particular sugar, such as fucose in the aerial parts of mur1, or they showed reductions in a particular sugar (fucose: mur2, mur3; arabinose: mur4, mur 6, mur7; rhamnose: mur8). Analysis of the mutants mur9, mur10 and mur11 revealed complex changes in multiple sugars.
The subsequent steps toward the biosynthesis of L-Fuc involve a 3,5 epimeriza-tion (the axially placed substituents on C3 and C5 switch to equatorial placement, and vice versa), and the oxygen on C4 is reduced to a hydroxyl group. These two reactions are catalyzed by one enzyme, a bifunctional GDP-4-keto-6-deoxy-D-mannose 3,5-epimerase-4-reductase named GER1 (Bonin and Reiter 2000). While the formation of GDP-L-galactose also involves the 3,5-epimerization of GDP-D-mannose, this reaction is catalyzed by a separate enzyme named GDP-D-mannose 3,5-epimerase (GME; Wolucka et al. 2001).
Bonin et al. (1997) cloned the MUR1 gene and demonstrated it encodes GDP-D-mannose-4,6-dehydratase (GMD). This enzyme catalyzes the formation of GDP-4-keto-6-deoxy-D-mannose (4.13), which represents the first of three conversions that lead to the formation of L-fucose. Lack of this enzyme in the mur1 mutant explains the reduced L-fucose levels in the leaves (Freshour et al. 2003). Bonin et al. (1997) specu-lated on the existence of a second dehydratase gene that is root-specific. They did indeed identify a cDNA clone that showed a high degree of homology to the MUR1 gene. A detailed expression analysis of this gene, named GMD1, confirmed the prefer-ential expression in roots, with the exception of the root tip (Bonin et al. 2003).

110 Vermerris
O
H
HO
H
HO
H
UDP
OHHH
OH
OUDP
H
HO
H
H3C
H
HO
OH
H
HO
OH
H
H
HO
H
UDP
OHHH
OH
O
OH
H
H
HO
H
UDP
OHHH
OO
O
H
HO
H
HO
H
UDP
OHHH
OO
O
H
HO
H
HO
H
UDP
OHH
H
H
O
OH
H
H
HO
H
UDP
OHH
H
H
4.17
4.224.19
4.18
4.16
4.21
4.20
O
OH
H
UDP
OHH
H
H
HO
4.23
CO2
CO2
b
c,g
f
e
d
g
a
Fig. 4.12. Nucleotide sugar interconversion pathway II. Conversion of UDP-Glc (4.16) to UDP-Rha (4.17), UDP-GlcA (4.18), UDP-Xyl (4.19), UDP-Gal (4.20), UDP-GalA (4.21), UDP-Ara (4.22) and UDP-Api (4.23). Enzymes involved are (A) rhamnose biosynthetic en-zyme (RHM), (B) UDP-Glc dehydrogenase (UGD), (C) UDP-Xyl synthase (UXS), (D) UDP-Glc epimerase (UGE), (E) UDP-GlcA epimerase (GAE), (F) UDP-Xyl epimerase (UXE), and (G) UDP-Api/UDP-Xyl synthase (AXS).
UDP-D-glucose can be oxidized to UDP-GlcA by the enzyme UDP-D-glucose dehydrogenase (UGD; EC 1.1.1.22). The enzyme was first isolated from suspension cultures of French bean (Phaseolus vulgaris L.) and co-purified with alcohol dehy-drogenase (ADH) (Robertson et al. 1996). These authors proposed the existence of a bifunctional enzyme exhibiting both UGD and ADH activity. Kärkönen and Fry (2006) investigated the bifunctionality of UGD in maize mutants in which both ADH1 and ADH2 were defective. Single and double adh mutants had normal cell walls, and leaf extracts displayed UGD activity at wild-type levels. These results indicate that UGD activity is not the result of ADH. Homology searches provided evidence for the presence of at least two UGD genes in maize (Kärkönen et al. 2005), and kinetic analyses indicated the existence of three UGD isoenzymes (Kärkönen and Fry 2006). Decarboxylation of UDP-GlcA by UDP-D-xylose synthase (UXS; EC 4.1.1.35) results in the formation of UDP-Xyl (Kobayashi et al. 2002). In Arabidopsis UXS enzymes are encoded by a six-member gene family (Reiter and Vanzin 2001; Harper and Bar-Peled 2002). UXS is also known as UDP-D-glucuronic acid decarboxylase, and is abbreviated as AUD or SUD to indicate whether the enzyme is membrane-anchored or soluble, respectively. The SUDs contain an N-terminal signal peptide that allows transport of the enzyme into to the Golgi complex. Pattathil et al. (2005) proposed that this diversity among the UXS enzymes enables the plant to spatially regulate specific xylosylation events. UDP-D-xylose can also be synthesized via a

Composition and Biosynthesis of Lignocellulosic Biomass 111
different mechanism, which involves the enzyme UDP-D-apiose/UDP-D-xylose synthase (AXS). This enzyme is also responsible for the formation of UDP-Api. In both cases UDP-GlcA is the substrate. The formation of UDP-Xyl involves a decar-boxylation reaction, whereas the formation of UDP-Api involves a decarboxylation reaction and a rearrangement of the carbon skeleton to a pentose. Mølhøj et al. (2003) identified two genetically redundant AXS genes in the Arabidopsis genome based on sequence homology with the UXS genes. Recombinant AXS1 protein was able to catalyze the formation of both UDP-Api and UDP-Xyl. The conversion of UDP-Glc to UDP-Gal is catalyzed by UDP-D-glucose 4-epimerase (UGE; EC 5.1.3.2). Arabidopsis contains five UGE genes (Barber et al. 2006) that differ among each other in terms of cellular localization and kinetic prop-erties. This is likely a reflection of the need for different isoforms in different meta-bolic situations. Mutations in the UGE4 gene, such as in the Arabidopsis root epi-dermal bulger1 (Baskin et al. 1992) and root hair defective1 (Schiefelbein and Somerville 1990) result in chemical changes in both arabinogalactan proteins (see Section 4.8) and xyloglucans (Seifert et al. 2002). Related to the UGE’s that form UDP-Gal are 4-epimerases involved in the bio-synthesis of UDP-GalA and UDP-Ara from UDP-GlcA and UDP-Xyl, respectively. The former class of enzymes is referred to as UDP-D-glucuronic acid 4-epimerase (GAE). There are six GAE genes in Arabidopsis (Reiter and Vanzin 2001) based on sequence homology with bacterial genes known to encode enzymes with this activ-ity. These genes encode membrane-anchored proteins that are likely targeted to the Golgi complex. Mølhøj et al. (2004) cloned the Arabidopsis GAE1 gene, which to-gether with GAE6 is the most highly expressed, and determined the catalytic proper-ties of the GAE1 protein based on heterologous expression of GAE1 in the fungus Pichia pastoris. This indicated that GAE specifically converted UDP-GlcA. There was no apparent activity against UDP-Glc and UDP-Xyl. This is consistent with the finding that UDP-D-xylose 4-epimerase (UXE) is responsible for the formation of UDP-Ara from UDP-Xyl. The Arabidopsis mur4 mutant is arabinose-deficient as a result of a mutation in the UXE1 gene (Burget et al. 2003). UDP-L-rhamnose is formed from UDP-Glc by three subsequent steps that involve UDP-D-glucose 4,6-dehydratase, UDP-4-keto-6-deoxy-D-glucose 3,5-epimerase, and UDP-4-keto-L-rhamnose 4-keto-reductase activity. These three steps are catalyzed by a single rhamnose biosynthetic enzyme named RHM. Three RHM genes have been identified in Arabidopsis (Reiter and Vanzin 2001). A mutation in one of these three genes, RHM2, results in the mucilage modified4 phenotype, in which pectins (see Section 4.6) in the mucilage surrounding the seed coat of germinating seeds as well as seed coat development are affected (Usadel et al. 2004). RHM1 was shown to be a UDP-L-rhamnose synthase (Diet et al. 2006), and All three RHM proteins were shown to exhibit the abovementioned enzyme activity based on heterologous expres-sion studies in the yeast Saccharomyces cerevisiae (Oka et al. 2007).
4.5.5.2 Biosynthesis of Hemicellulosic Polysaccharides
The biosynthesis of the hemicellulosic polysaccharides involves enzymes that gener-ate the backbone, and enzymes involved in the substitution of the backbone. The

112 Vermerris backbone of hemicellulosic polysaccharides is catalyzed by processive glycosyl transferases, most of which, if not all, appear to be encoded by the cellulose syn-thase-like (Csl) genes mentioned in Section 4.4.2. The involvement of multigene families in both of these processes presents a major challenge when the role of indi-vidual family members is being investigated. The sequence homology among mem-bers of the same family, and often among members of different families, makes transgenic down-regulation of single genes difficult. Since the completion of the genome sequence of Arabidopsis (Arabidopsis Genome Initiative 2000) and the generation of T-DNA insertion mutants, the individual role of members of gene families can also be investigated based on reverse genetics approaches. One compli-cation of this approach is that some of the genes within a family have overlapping function, so that double mutants or triple mutants need to be generated before one can associate a phenotype with the loss of a particular gene. The involvement of cellulose synthase-like enzymes in the biosynthesis of hemi-cellulosic polysaccharides was first demonstrated by Dhugga et al. (2004) for man-nan synthases in guar (Cyamopsis tetragonolobus L.). The seeds of this species ac-cumulate galactomannans as their main reserve polysaccharide. Dhugga et al. (2004) identified 15 expressed sequence tags (ESTs) with homology to cellulose synthase or cellulose synthase-like (Csl) genes available from sequence databases. One of these ESTs corresponded to a cDNA whose abundance mirrored mannan synthesis activ-ity. This cDNA was homologous to members of the CeslA family. The function of this gene was confirmed showing that heterologous expression in somatic embryos of soybean (Glycine max) resulted in de novo mannan synthase activity. Sequence analysis indicated that the Arabidopsis CslA9 gene was the most closely related to the mannan synthase gene from guar. This was confirmed by Liepman et al. (2005), who used heterologous expression of several Csl genes in cell cultures of fruit fly (Drosophila melanogaster), which normally do not make hemicellulose. Depending on whether GDP-mannose, GDP-glucose or both were present as a substrate, expres-sion of AtCslA9 resulted in the accumulation of β-mannan, β-glucan, or a mixed β-linked-glucomannan polymer. The authors concluded that AtCeslA9 is a β-glucomannan synthase. The AtCslA2 and AtCslA7 genes were also shown to encode enzymes with mannan synthase activity, although their enzymatic properties were slightly different from each other and from AtCslA9. Liepman et al. (2007) investi-gated CslA genes from a diverse set of plant species and demonstrated that they all encode glucomannan synthases. Based on gene expression analyses, mannans func-tion not only as cell wall polysaccharides or as storage carbohydrates in seeds, but are also involved in other cellular processes, such as pollen tube growth and embryo development. The rice CslF gene family encodes enzymes that catalyze the biosynthesis of mixed-linkage β-glucans (Burton et al. 2006). The role of the CslF family was estab-lished based on the presence of a quantitative trait locus (QTL) for mixed-linkage β-glucan content in ungerminated barley seeds. Since barley and rice (as well as other grass species) have a common ancestor, it was possible to identify a syntenic region in the rice genome based on the molecular markers flanking the barley QTL. This region in rice contained six CslF genes. In order to prove the function of these genes, Burton et al. (2006) transformed Arabidopsis, which normally does not make mixed-

Composition and Biosynthesis of Lignocellulosic Biomass 113
linkage β-glucans, with the rice CslF genes. Plants transformed with the rice CslF2 gene were shown to synthesize mixed-linkage β-glucans, and leaf extracts displayed enzymatic activity consistent with the presence of mixed-linkage β-glucan synthases. The amount of mixed-linkage β-glucans that was synthesized was low, however, leading Burton et al. (2006) to speculate that additional factors may be required to synthesize these polysaccharides in quantities observed in grasses. The β-(1,4)-glucan backbone of xyloglucans is synthesized by the cellulose syn-thase-like C family (Cocuron et al. 2007). These researchers used nasturtium (Tropaeolum majus) seeds to identify the gene, because during seed maturation this species synthesizes large amounts of xyloglucans as reserve polysaccharide. Se-quencing of a cDNA library representing the maturing seed resulted in the identifica-tion of a single member from the CslC family. The Arabidopis ortholog CSLC4 showed a high degree of homology to this gene and was shown to be coordinately expressed with other genes known to be involved in xyloglucan biosynthesis. In addition, heterologous expression of the nasturtium CslC gene in the yeast Pichia pastoris resulted in the synthesis of β-(1,4)-glucan.
The CslD family initially appeared to be involved in root hair formation in both Arabidopsis and rice. This was based on the observation that the Arabidopsis ko-jak/csld3 mutant (Favery et al. 2001; Wang et al. 2001) and the rice csld1 mutant (Kim et al. 2007) have no or very short root hairs. Analysis of Arabidopsis csld5 T-DNA insertion mutants, however, revealed a much more complex phenotype (Bernal et al. 2007). Stem and root growth were significantly reduced, stems contained less xylan, and in vitro activity of both xylan synthase and homogalacturonan synthase (see Section 4.6) was reduced. Based on the high degree of sequence similarity with rice CslF proteins, and the fact that the csld5 mutant is more susceptible to isoxaben (see Section 4.4.2), Bernal et al. (2007) speculated that CslD proteins are possibly involved in the biosynthesis of non-crystalline β-glucans. The substitution of the glycan backbone of the hemicellulosic polysaccharides is catalyzed by non-processive glycosyl transferases. This class of enzymes is encoded by a large gene family (Coutinho and Henrissat 1999; Coutinho et al. 2003a,b). Among the first genes shown to be involved in the substitution of the backbone was the Arabidopsis fucosyltransferase1 (AtFUT1) gene, identified by Perrin et al. (1999) based on the amino acid sequence of a fucosyltransferase from pea epicotyls. At-FUT1 encodes a fucosyl transferase responsible for adding α-(1,2)-linked L-fucose to D-galactosyl residues on the D-glucan chain of xyloglucans. Analysis of sequence data available for Arabidopsis revealed the existence of nine genes with homology to AtFUT1 (Sarria et al. 2001). Vanzin et al. (2002) showed that mur2 was a mutant
The role of the dicot-specific CslB and CslG families is not clear at this time. The phylogenetic analysis performed by Hazen et al. (2002) places these two families closest to the CslE family. Nobles and Brown (2004) performed a phylogenetic analysis that also included Csl genes from cyanobacteria, unicellular organisms that contain cellulose synthases that are not organized in rosettes. They concluded that the plant CslG, CslB and CslE families are evolutionarily most closely related to the cyanobacterial cellulose synthases, and that they likely encode β-glucosyl-transferases that are involved in the synthesis of a polysaccharide backbone that is not cellulose. It is possible that the CslE family encodes xylan synthases.

114 Vermerris allele of the AtFUT1 gene. The mur2 mutant still contained 50% of wild-type levels of L-fucose, suggesting that one or more of the AtFUT homologs could compensate for the loss of function of AtFUT1. Galactosyl residues are added to xyloglucan through the action of galactosyl-transferases. Madson et al. (2003) showed that the MUR3 gene encodes a galactosyl-transferase that adds a β-(1,2)-D-galactosyl residue specifically to the third xylose residue within the XXXG core structure of xyloglucan. The addition of xylose residues to the β-(1,4)-glucan backbone of xyloglucans is catalyzed by β-xylosyltransferases. Their existence was first shown by Faik et al. (2002), who used an in vitro assay in which cello-oligosaccharides of five or more glucose residues could be xylosylated when isolated microsomal membranes from pea epicotyls and 14C-labeled UDP-xylose were added. Characterization of the puri-fied protein allowed Faik et al. (2002) to search the Arabidopis genome for putative α-xylosyltransferase genes. This resulted in the identification of two xylosyl trans-ferase genes, AtXT1 and AtXT2 (Cavalier and Keegstra 2006). Expression of these genes in insect cells (which do not synthesize xyloglucans), allowed these research-ers to examine substrate preferences. They showed that these two enzymes preferen-tially added the first xylosyl residue to the fourth glucosyl residue (counting from the reducing end) when cellopentaose (five glucose residues) or cellohexaose (six glu-cose residues) were used as acceptor. Both enzymes were able to add a second xylo-syl residue to GGXGGG; in this case the xylosyl residue was added to the third glu-cosyl residue. Neither enzyme was capable of adding the third xylosyl residue in vitro. It is unclear whether this is a limitation of the in vitro assay, or whether there are additional xylosyltransferases. The substitution of xylans in the secondary wall with glucuronic acid residues is catalyzed by glucuronyltransferases. Analysis of the Arabidopsis fragile fiber8 (fra8) mutant indicated that both cellulose and xylan content were reduced, whereas xy-loglucan and pectin content were increased (Zhong et al. 2005). More detailed analy-sis of the xylan fraction in the mutant revealed that the substitution of xylan with glucuronic acid residues was specifically affected by the mutation. The substitution with 4-O-methylglucuronic acid residues was unaffected. These observations sug-gested that the FRA8 gene is likely to encode a glucuronyltransferase. The selective impact on glucuronic acid residues could be attributed to a second glycosyl trans-ferase specific for 4-O-methyl glucuronic acid. An alternative explanation, consistent with the traditional view that methylation occurs after transfer of the glucuronyl residues, is that this methylation is not efficient enough to methylate every single residue. Under this scenario, the reduced amount of glucuronoxylans in the fra8 mutant would then result in a methylation overcapacity and therefore in a higher ratio of methylated to unmethylated glucuronic acid residues. This latter explanation was considered more likely by Peña et al. (2007), who performed further studies on the fra8 mutant, in conjunction with the irregular xylem8 (irx8) and irx9 mutants of Arabidopsis (Brown et al. 2005). The xylan chain length in the irx9 mutant is re-duced relative to the wild type. The IRX9 protein is also a glycosyl transferase, but Peña et al. (2007) were unable to discern whether this enzyme functions as a β-xylosyl transferase, responsible for adding xylose residues to the nascent xylan chain, or a glucuronyl transferase. The irx8 mutant contains fewer xylan chains, and

Composition and Biosynthesis of Lignocellulosic Biomass 115
the chains that are present lack a specific tetrasaccharide ‘primer’ at the reducing end that appears to be necessary for the biosynthesis of xylans. IRX8 is a glycosyl trans-ferase of a different family than IRX9, and shows similarity to known galacturonyl transferases. Peña et al. (2007) proposed that IRX8 catalyzes the addition of an α-D-GalA residue to O4 of the reducing xylose residue of the tetrasaccharide primer.
4.5.5.3 Xyloglucan Modification
The primary cell wall is a dynamic structure in which both synthesis and disassembly occur. This allows the cell to expand, to assume a specific shape, or to modify cell-to-cell adhesion properties, for example as part of abscission. As discussed in Sec-tion 4.5.1, xyloglucans are the main hemicellulosic polysaccharide in dicots and non-commelinoid monocots, where they are physically associated with cellulose, and as such contribute to tensile strength. Cell expansion and differentiation would not be possible if the primary cell wall was a fixed, rigid structure. In order to enable cell wall expansion and differentiation, the cell needs to be able to rearrange the xyloglu-can network. This is made possible by the xyloglucan endotransglycosy-lase/hydrolases (XTHs; EC 2.4.1.207). This class of enzymes was first identified by Smith and Fry (1991) and Nishitani and Tominaga (1992), who referred to the enzyme as xyloglucan endotransglycosy-lase (XET) and endoxyloglucan transferase (EXT), respectively. As the names indi-cate, this activity involves endolytic cleavage (i.e. cleavage within the chain) of the backbone, forming a transient polysaccharide-enzyme complex that catalyzes the linkage of the reducing end of the cleaved xyloglucan to the non-reducing end of another xyloglucan polymer. Around that same time Farkas et al. (1992) and Fanutti et al. (1993) described how a xyloglucanase (xyloglucan-specific endo-(1,4)- β-D-glucanase) from nasturtium seeds, known to reduce xyloglucan chain length by hy-drolytic cleavage of the backbone, also exhibited endo-transglycosylation activity under certain conditions. Cloning of the genes encoding enzymes with XET activity (Okazawa et al. 1993) revealed sequence homology to genes encoding xylogluca-nases (de Silva et al. 1993), suggesting the enzymes displaying these two activities belonged to the same class of proteins. Rose et al. (2002) proposed a unifying nomenclature for this class of enzymes. The enzyme itself is now referred to as XTH, but the activity can be specified as XET or xyloglucan endohydrolase (XEH). The ‘XTH World’ web site (http://labs.plantbio.cornell.edu/XTH/) has been established to aid in the establish-ment of a consistent nomenclature. Rose et al. (2002) classified the 33 XTH genes identified in the Arabidopsis genome in three groups based on their phylogenetic relationships, gene structure, and characteristic amino acid motifs. Whenever en-zymes are encoded by large gene families, the question arises what the role is of each individual member of the family. In order to address this question, Becnel et al. (2006) generated transgenic plants in which the coding sequence of the 33 XTH genes was replaced with the β-glucuronidase (GUS) reporter gene. Such a construct is abbreviated as XTH::GUS. Gene expression could be visualized by incubating the tissue in a solution containing a chromogenic substrate for GUS (such as 4-methylumbelliferyl β-D-glucuronide; Gallagher 1992), which results in the formation

116 Vermerris of a blue color. All organs showed XTH::GUS expression and most were found to express multiple XTH::GUS genes. Different XTH genes displayed diverse and dis-tinct expression patterns, but since multiple genes were expressed in each organ, there was extensive overlap in XTH expression patterns. Becnel et al. (2006) hy-pothesized that the contribution xyloglucan makes to wall properties of specific tissues or organs is determined by the combinatorial action of different XTHs. A detailed overview of these and other modification reactions that hemicellulosic polymers can undergo is provided by Fry (2004).
4.6 Pectins
Pectins are branched, hydrated polymers rich in D-galacturonic acid. They affect the pore size of the wall (porosity), the charge (and hence the ion binding capacity, and the ability to bind charged cell wall proteins), as well as the pH of the wall. The middle lamella formed after cell division is largely made of pectins. Pectins are thought to influence cell-to-cell contact. A detailed description of pectins can be found in Carpita and McCann (2000). There are three types of pectic polymers. Homogalacturonan (HGA) are long polymers (up to 100 nm) of α-(1,4)-linked D-galacturonic acid. A portion of the carboxyl residues is methyl esterified, which affects the properties of the polymer in terms of its charge and ion-binding capacity, and hence the porosity and viscosity. Rhamnogalacturonan I (RG I) is a contorted, rod-like molecule made of a repeating disaccharide (-2)-α-D-rhamnose-(1,4)-α-D-galacturonic acid-(1-). A portion of the carboxyl groups are acetylated. There are additional substitutions possible with ara-binan, galactan, and arabinogalactan side chains. Rhamnogalacturonan II (RG II) is a very complex HGA molecule. These molecules can dimerize around boron resi-dues. The sugar apiose (4.23) is important in the dimerization of RG II (Mølhøj et al. 2003). The biosynthesis of pectins is complex and not yet understood very well. The nucleotide sugar interconversion pathway generates the sugar monomers for pectins, and as discussed in Section 4.5.5.1, mutations in genes that affect the biosynthesis of the sugar monomers often result in changes in pectin. Recent advances (with a focus on dicot species) were reviewed by Scheller et al. (2007). The backbone of HGA is likely controlled by one or more CSL enzymes, and the substitution of the backbone is likely controlled by the same transferases used for the biosynthesis of the hemicel-lulosic polysaccharides, or by transferases that are similar, but that are encoded by a separate set of genes specific for pectin biosynthesis. Given that on a weight-basis pectins are a relatively minor compound of plant cell walls, especially in the grasses, they are of limited interest for bioenergy applica-tions. Since fruits tend to be rich in pectin, one exception is the use of industrial fruit waste as a source of fermentable sugars for ethanol production. A challenge associ-ated with the use of pectins as a source of fermentable sugars is that hydrolysis of pectins releases many different sugars, which would require a host of microbial en-zymes to enable conversion to ethanol. This is a daunting task, given the challenge to

Composition and Biosynthesis of Lignocellulosic Biomass 117
engineer yeast strains that can metabolize sugars other than glucose and sucrose (see Chapter 6).
4.7 Lignin and Hydroxycinnamic Acids
Lignin is a phenolic polymer that provides a hydrophobic surface to water-conducting cells and that provides structural rigidity needed for mechanical support. Lignin is very important for bioenergy applications. Lignin is an energy-dense com-pound as a result of the many carbon-carbon linkages that can be oxidized. There-fore, biomass with high lignin content is desirable when considering biomass for co-generation purposes. In contrast, lignin can negatively affect the yield of fermentable sugars obtained after enzymatic saccharification, by shielding cellulose and by pro-viding a surface that cellulolytic enzymes adsorb to irreversibly (see Chapter 6). The genetics and biochemistry of lignin biosynthesis have been the topic of intense scien-tific research during the past 15 years, which is summarized below.
4.7.1 Biosynthesis of Monolignols and Hydroxycinnamic Acids
As will be discussed in Section 4.7.2, the phenolic polymer lignin is formed via oxidative coupling of monolignols. Figure 4.13 shows a schematic representation of the monolignol biosynthetic pathway. This pathway is based primarily on experi-mental data from Arabidopsis (reviewed by Humphreys and Chapple (2002)). The pathway is depicted here with the amino acid L-phenylalanine (4.24), generated via the shikimate pathway (reviewed by Herrmann and Weaver (1999)), as the precursor. While L-phenylalanine is also the precursor to several other phenolic compounds, including flavonoids, lignans, stilbenes, and coumarins (Vermerris and Nicholson 2006), it is often included in the biosynthetic pathway leading to monolignols, be-cause down-regulation of the biosynthetic steps following the conversion of L-phenylalanine has been shown to result in changes in lignin content and/or lignin subunit composition (Sewalt et al. 1997). The first conversion is the deamination of L-phenylalanine by the enzyme phenylalanine ammonia lyase (PAL; EC 4.3.1.5) and leads to cinnamic acid (4.25). Cinnamic acid is subsequently hydroxylated by cinnamic acid 4-hydroxylase (C4H; EC 1.14.13.11) to p-coumaric acid (4.27). In graminaceous species, such as maize and sorghum, this compound can also result from the deamination of L-tyrosine (4.26). In vitro assays with recombinant enzyme demonstrated that the catalytic activity towards tyrosine and phenylalanine resides in the same enzyme (Roesler et al. 1997). p-Coumaric acid is converted to p-coumaroyl Coenzyme A (4.28) by the enzyme 4-coumaric acid:CoA ligase (4CL; EC 6.2.1.12). p-Coumaroyl-CoA under-goes two types of modifications: reduction of the carboxyl group on the propane side-chain to an alcohol, and substitution of the phenyl ring. The reduction of p-coumaroyl-CoA to p-coumaryl aldehyde (4.29) is catalyzed by the enzyme cin-namoyl-CoA:NADP oxidoreductase (CCR; EC 1.2.1.44). This enzyme was initially purified from soybean cultures (Wegenmayer et al. 1976), and was later isolated from lignifying cambium of eucalypt (Eucalyptus gunnii) (Goffner et al. 1994). The

118 Vermerris
OCoA-S
OH
O
OH
OH
OH
O
OH
OH
OH
O
OH
OH
OH
OCH3
OCH3
HO OCH3
HO OCH3
O
OH
OH
OH
H3CO OCH3
H3CO OCH3
O
HOOH
O
O
O
HO
O
HO
O
HOOH
OO
OH
O
HO
O
HOOH
OO
OH
O
HOOH
O
OO
HO OH
OH
OCoA-S
OH
OCH3
OCoA-S
OH
OH
4.32
4.28
4.354.334.31
4.34
4.394.374.29
4.36
4.41
4.30 4.424.404.38
f
g
g
f
f
h
d d
e ee e
i j
i j
OHO
4.25
OHO
OH
4.27
OHO
4.24
NH2
OHO
NH2
OH
4.26
a
a
b
c
O
OH
OCH3
HO
4.43k
Fig. 4.13. Monolignol biosynthetic pathway. Compound names are listed in the text. The letters refer to the following enzymes [followed by their abbreviation]: (a) phenyla-lanine/tyrosine ammonia lyase [PAL/TAL], (b) cinnamate 4-hydroxylase [C4H], (c) 4-cinnamate CoA ligase [4CL], (d) cinnamoyl-CoA reductase [CCR], (e) cinnamyl alcohol dehydrogenase [CAD] (f) hydroxycinnamoyl-CoA:shikimate/quinate hydroxy-cinnamoyl transferase [HCT], (g) p-coumaroyl-CoA 3'-hydroxylase [C3'H], (h) caffeoyl-CoA O-methyltransferase [CCoAOMT], (i) coniferyl aldehyde/coniferyl alcohol 5-hydroxylase [F5H (C5H)], (j) coniferaldehyde/coniferyl alcohol O-methyltransferase [COMT], and (k) conifer-aldehyde/ sinapaldehyde dehydrogenase.

Composition and Biosynthesis of Lignocellulosic Biomass 119
reaction catalyzed by CCR is considered the committed step towards the biosynthesis of monolignols (Lacombe et al. 1997). p-Coumaryl aldehyde can be reduced to p-coumaryl alcohol (4.30) by the enzyme cinnamyl alcohol dehydrogenase (CAD; EC 1.1.1.195). The substitution of the phenyl ring with hydroxyl and methyl groups begins with the hydroxylation of C3. This is a conversion that requires the formation of the ester of p-coumaroyl-CoA with D-quinate (4.31) or shikimate (4.32) catalyzed by the enzyme hydroxycinnamoyl-CoA shikimate/quinate hydroxy-cinnamoyl transferase (HCT; Hoffmann et al. 2003). The hydroxylation of this ester intermediate is cata-lyzed by p-coumaroyl-CoA 3′-hydroxylase (C3′H; EC 1.14.14.1; Schoch et al. 2001; Franke et al. 2002a,b). The resulting quinate or shikimate ester (4.33; 4.34) is subse-quently hydrolyzed by the same HCT, resulting in caffeoyl-CoA (4.35).Caffeoyl-CoA is methylated by the enzyme caffeoyl-CoA O-methyltransferase (CCoA-OMT; EC 2.1.1.104), leading to feruoyl-CoA (4.36). CCoA-OMT had been implicated in disease responses based on its induction in carrot (Daucus carota) cell suspension cultures that were treated with elicitors (Kühnl et al. 1989). A more general role of CCoA-OMT in phenylpropanoid metabolism was proposed after Ye et al. (1994) demonstrated that the CCoA-OMT gene was up-regulated during the in vitro devel-opment of lignified tracheary elements derived from Zinnia elegans mesophyl cells. Feruoyl-CoA is subsequently reduced to coniferaldehyde (4.37) by CCR, analogous to the reduction of p-coumaroyl CoA to p-coumaryl aldehyde. Coniferaldehyde can be reduced to coniferyl alcohol (4.38) by the enzyme cin-namyl alcohol dehydrogenase (CAD; EC 1.1.1.195). Alternatively, the enzyme coniferyl aldehyde/coniferyl alcohol 5-hydroxylase (C5H; 1.14.13), also known by its historic name ferulic acid 5-hydroxylase (F5H; Humphreys et al. 1999), can cata-lyze the hydroxylation of C5 which results in the formation of 5-hydroxyconiferyl aldehyde (4.39). C5H is also able to form 5-hydroxyconiferyl alcohol (4.40) from coniferyl alcohol (4.79). Substrate specificity of recombinant F5H was evaluated by Humphreys et al. (1999) and Osakabe et al. (1999). Their analyses revealed that F5H had much higher activity towards coniferaldehyde and coniferyl alcohol than against ferulic acid (4.43). Methylation of 5-hydroxyconiferyl aldehyde and 5-hydroxyconiferyl alcohol by the enzyme 5-hydroxyconiferaldehyde/5-hydroxyconiferyl alcohol O-methyltransferase results in sinapaldehyde (4.41) and sinapyl alcohol (4.42), respectively. The enzyme catalyzing this step is known by the historic but inaccurate name caffeic acid O-methyl transferase (COMT; EC 2.1.1.68). Thus, in the current depiction of the path-way, COMT is responsible for the methylation of the hydroxyl group on C5, whereas CCoA-OMT is responsible for methylation of the hydroxyl group on C3. This ex-plains why mutations in the COMT gene, such as in the maize brown midrib3 mutant (Vignols et al. 1995) and the sorghum brown midrib26 mutant (Bout and Vermerris 2003), result in reductions in lignin units derived from sinapyl alcohol, and not in lignin subunits derived from coniferyl alcohol. As described above, sinapyl alcohol can be synthesized via methylation of 5-hydroxyconiferyl alcohol (4.40) by COMT. An alternative route is via the reduction of sinapaldehyde (4.41) by CAD. Aspen (Populus tremuloides) and several other angiosperm trees contain the enzyme sinapyl alcohol dehydrogenase (SAD; Li et al.

120 Vermerris 2001). This enzyme was identified based on the appearance of a distinct class of hybridizing fragments during the screening of an aspen xylem cDNA library with an aspen CAD probe. Purified recombinant SAD was shown to have a 60-fold higher affinity for sinapaldehyde than for coniferaldehyde. In several herbaceous angio-sperms, CAD is encoded by a multigene family. Examples include Arabidopsis (Raes et al. 2003; Goujon et al. 2003a), rye grass (Lolium perenne; Lynch et al. 2002), rice (Oryza sativa; Tobias and Chow 2005) and maize (Guillaumie et al. 2007). At-tempts to determine the role of individual CAD genes in species that contain a CAD multi-gene family relied on the study of mutants in which individual genes were down-regulated Based on such studies in Arabidopsis, the biosynthesis of coniferyl alcohol and sinapyl alcohol appears to be catalyzed by a combination of isoforms, some of which have a preference towards one of the substrates. The combination of isoforms varies depending on the developmental stage and the tissue (Sibout et al. 2003). Similar observations were reported for maize (Guillaumie et al. 2007). It is likely, but has yet to be confirmed, that this is also the case in other species with multiple CAD genes. Loblolly pine (Pinus taeda L.), like most gymnosperms, makes only guaiacyl lignin, and does so with only one CAD gene (Mackay et al. 1995; 1997). In Norway-spruce (Picea abies), there is evidence for a small CAD gene family that appears distinct from the angiosperm CAD genes (Schubert et al. 1998). Experimental evidence suggests that the p-coumaroylation of sinapyl alcohol (Ralph et al. 1994) occurs prior to their incorporation into lignin (Lu and Ralph 1999). The gene encoding the acyl transferase responsible for this reaction has not yet been identified. The biosynthesis of ferulic acid (4.43) was originally thought to be catalyzed by the enzymes p-coumaric acid acid 3-hydroxylase (C3H) and caffeic acid O-methyltransferase (COMT) as part of monolignol biosynthesis. This was, however, contradicted by the biochemical and genetic evidence supporting 3-hydroxylation at the level of the D-quinate or shikimate ester of p-coumaroyl-CoA (4.31 and 4.32, respectively; Schoch et al. 2001; Franke et al. 2002a,b). Instead, in Arabidopsis fer-ulic acid is synthesized from coniferaldehyde (4.37) by coniferaldehyde dehydro-genase encoded by the REDUCED EPIDERMAL FLUORESCENCE1 (REF1) gene (Nair et al. 2004). In Arabidopsis, this same enzyme is also responsible for the bio-synthesis of sinapic acid from sinapaldehyde. This biosynthesis of ferulic acid and/or sinapic acid from their corresponding aldehydes is likely to exist in several other species, based on the fact that extracts from leaves displayed aldehyde dehydro-genase activity (Nair et al. 2004).
4.7.2 Monolignol Transport
The polymerization of lignin occurs in the plant cell wall, so the monolignols need to be transported from the cytosol, where they are synthesized, to the cell wall. There is evidence that in several species, including conifers and Arabidopsis, the monolignols are glycosylated prior to storage and transport, which would reduce their toxicity and make them less reactive. The enzymes responsible for the glycosylation reaction are UDP-glucosyltransferases (UGT’s; EC 2.4.1.111) that generate coniferin (coniferyl

Composition and Biosynthesis of Lignocellulosic Biomass 121
alcohol 4-O-glucoside) and syringin (sinapyl-4-O-glucoside) from coniferyl alcohol (4.38) and sinapyl alcohol (4.42), respectively (Lim et al. 2001). Prior to polymeriza-tion these glucosides need to be converted to the corresponding aglycones by spe-cific glucosidases, such as coniferin β-glucosidase (EC 3.2.1.126). The Arabidopsis genome contains more than 100 UGT genes. In order to deter-mine which of these UGTs were capable of forming either glucosides – involving a linkage between glucose and the hydroxyl group on C4 of the phenylpropanoid – or glucose esters – involving an ester linkage between the carboxyl group of hydroxycin-namic acids and the hydroxyl group of glucose – cDNA’s or genomic clones represent-ing 36 Arabidopsis genes were expressed in E. coli, and the activity of the resulting recombinant proteins against 11 different intermediates from the monolignol biosyn-thetic pathway was assayed (Lim et al. 2001). This analysis identified three genes encoding UGTs catalyzing the formation of cinnamate glucose esters and two genes – UGT72E2 and UGT72E3 – encoding UGTs that catalyze the formation of cinnamate glucosides. The recombinant protein obtained from expression of the UGT72E gene showed activity towards both coniferyl alcohol and sinapyl alcohol, whereas the UGT72E3 recombinant protein only showed activity towards sinapyl alcohol.
4.7.3 Monolignol Oxidation and Polymerization
In the cell wall the monolignols are converted to monolignol radicals through the action of peroxidases (EC 1.11.1.7) and/or laccases (EC 1.10.3.2). Both of these classes of enzymes are able to generate monolignol radicals. Peroxidases use hydro-gen peroxide (H2O2) as electron acceptor to oxidize the donor, thereby forming the oxidized donor and water. Mechanistically, hydrogen peroxide oxidizes the active site of the peroxidase enzyme, and upon binding of the substrate in the active site, the substrate becomes oxidized and the enzyme returns to its reduced state. Laccases use diphenols or related compounds as electron donors, and oxygen as the acceptor, thereby forming the oxidized donor and water. There has been some controversy regarding which class of enzyme is involved in lignification. Histochemical studies of lignifying tissues with a chromogenic sub-strate only resulted in oxidation of the substrate in the presence of H2O2 (Harkin and Obst 1973). This observation, combined with the broad distribution of peroxidases in the plant kingdom, and the more limited distribution of laccases, led Higuchi (1985) to propose a dominant role of peroxidases in lignification. Laccases were subsequently shown to be present and active in lignifying tissues of various plant species, including sycamore maple (Acer pseudoplatanus; Sterjiades et al. 1993) and loblolly pine (Bao et al. 1993). So while both laccases and peroxi-dases can generate monolignol radicals, it remains unclear whether there is a prefer-ence for one or the other as a function of the species, the tissue, the developmental stage, or the environmental conditions. Both peroxidases and laccases are encoded by large multigene families (Raes et al. 2003), which has made it difficult to study the specific role of these enzymes in lignification. Transgenic approaches have been used to down-regulate or over-express laccase and peroxidase genes. Down-regulation of three laccase genes in poplar (Populus trichocarpa) using antisense technology did not have an impact on

122 Vermerris lignin content or composition, but down-regulation of one of these laccase genes did result in alterations in xylem cell wall structure and an increase in the level of soluble phenolics (Ranocha et al. 2002). Similarly, a mutation in an Arabidopsis laccase gene resulted in irregularly shaped xylem cells (Brown et al. 2005). In contrast, down-regulation of an anionic peroxidase gene from hybrid aspen (Populus sieboldii × P. gradidentata) via an antisense construct resulted in reduced lignin content and a reduction in G-residues in the lignin (Li et al. 2003a). Expression analysis of three known maize peroxidase genes, referred to as ZmPox1–3, indicated that ZmPOX2 was likely the predominant peroxidase (de Obeso et al. 2003). Even though ZmPox3 was expressed at low levels in lignifying tissues (de Obeso et al. 2003), Guillet-Claude et al. (2004) localized this gene to a quantitative trait locus (QTL) associated with lignin content and silage digestibility. Caparrós-Ruiz et al. (2006) identified a five-member laccase gene family in maize, but they concluded that only one of these, ZmLac3, could play a role in lignification, most likely in response to wounding. Given that most plants synthesize several different monolignols and that these monolignols can be linked to each other in a number of different ways, the question arises how the plant is able to control lignin subunit composition and the distribution of inter-unit linkages. The prevailing view is that lignin subunit composition is de-termined predominantly by the flux of monolignols. For example, in grasses, p-coumaryl alcohol (4.30) is secreted early in the lignification process, resulting in the relatively high abundance of H-residues in cell walls that have just begun to lignify. Coniferyl alcohol (4.38) and sinapyl alcohol (4.42) are secreted into the cell wall later on (Terashima et al. 1993). Enzymatic oxidation of monolignols by peroxidases and/or laccases leaves a radical electron on the oxygen atom on C4. Given the aromatic nature of mono-lignols, the radical electron can be delocalized. This results in the establishment of several reactive sites in the molecule, as indicated for p-coumaryl alcohol in Fig. 4.14.
O
OH
O
OH
O
OH
O
OH
O
OH
..
.
.
.OH
OH
laccase
peroxidase
Fig. 4.14. Enzymatic oxidation of monolignols, such as p-coumaryl alcohol shown above, gives rise to several reactive sites, indicated by the delocalized radical electron (black dot). The β-carbon has the highest electron density and is most reactive.
As a consequence, when two monolignol radicals react, several different chemical bonds can be formed between them, and this is reflected in the structure of lignin. The most common interunit linkage in lignin is the β-O-4 linkage (4.44; Fig. 4.15).

Composition and Biosynthesis of Lignocellulosic Biomass 123
Other coupling modes include: β-β′ (4.45), β-5 (4.46), and the dibenzodioxocin linkage (4.47; Karhunen et al. 1995; Ralph et al. 2004b). In plants that accumulate substantial amounts of 5-hydoxyconiferyl alcohol (4.40) as a result of reduced activ-ity of the enzyme caffeic acid O-methyltransferase, the benzodioxane linkage (4.48) has been identified. This is a linkage between two subunits involving a β-O-4′ and an α-O-5′ bond (Ralph et al. 2001; Marita et al. 2003; Morreel et al. 2004b). A β-1 linkage is possible when a monolignol radical couples with a β-O-4 linked end-unit in the lignin. The quinone methide that is formed after formation of the β-1 linkage can re-aromatize via water addition and subsequent loss of a glyceraldehyde 2-aryl ether, leading to structure 4.49. Alternatively, instead of an addition reaction with water, the quinone methide can re-aromatize through a reaction involving the α-OH group, leading to the spirodienone 4.50 (Ralph et al. 2004b).
R1
O
O
R1
R3
R4
HO
HO
O
O
R1
R2
O
R2
R1
O
R3
HO
O R1
R2
OHHO
OR3
R4
O
O
OR3
R4
OR1
R2
O
O
R1
R3
R4
O O
R3R3
OH
OR1
R2
4.44
4.52
4.45
4.514.49
4.46 4.47
4.48
R1
O
OCH3
O
O
OH OH
OH
HO
HO
OH
HO OH
OH
O
R1
R2 O
HO
O
R3 R4
4.50
Ar
OH
Fig. 4.15. Different linkages can be formed between monolignol radicals. The substituents R1 through R4 can be hydrogen atoms or methoxyl groups, depending on the origin of the mono-lignol. ‘Ar’ stands for aryl (aromatic ring structure). Wavy bonds indicate unspecified linkages to the larger lignin polymer.

124 Vermerris The structure of lignin, with a predominance of interunit linkages involving the β-carbon, is consistent with a model in which monolignol radicals are added to the growing polymer via end-wise addition (as opposed to a bulk polymer). The 5-5′ (4.51) and the 5-O-4′ (4.52) linkages are present in only small amounts, and tend to originate from the incorporation of preformed oligomers (Ralph et al. 2004b). Structures in the lignin that are derived from coniferyl and sinapyl alcohol (4.38, 4.42) are referred to as guaiacyl (G) and syringyl (S) residues, respectively. In cer-tain species, p-coumaryl alcohol (4.30) can also serve as a monolignol, giving rise to p-hydroxyphenyl (H) residues. In the tissue of normal plants, in particular the grasses, H-units make up only a small proportion (<5%) of the lignin. H-residues are, however, commonly identified in compression wood of gymnosperms in response to gravitropic stress (Higuchi 1985). The Arabidopsis ref8 mutant makes predominantly H-lignin as a result of a mutation is an extreme dwarf that is unable to produce seed (Franke et al. 2002b). A characteristic feature of sinapyl alcohol in maize and other grasses is the pres-ence of p-coumarate esters (4.27) on the γ-carbon (Ralph et al. 1994). The presence of the ester enhances (or enables) the incorporation of sinapyl alcohol into the growing lignin polymer in the cell walls of maize and presumably other grasses, and can be-come incorporated in the lignin polymer (Ralph et al. 2004a). The related hydroxy-cinnamic acid ferulic acid (4.43) can also become incorporated into lignin (Ralph 2004a). Ferulic acid esterified to glucuronoarabinoxylans in grasses (see Section 4.5.2.2) can crosslink two polysaccharide chains, but is also hypothesized to act as a nucleation site for lignification and would thus serve as a chemical link between lig-nin and hemicellulose. Ferulic acid may play a similar role in fruits and vegetables (Bunzel and Ralph 2006), and the cell walls of gymnosperms (Carnachan and Harris 2000). Ferulic acid can dimerize and become integrated into lignin just like the other monolignols (Bunzel et al. 2004). The lignin of transgenic poplar (Populus tremula × Populus alba) with low levels of cinnamoyl-CoA reductase activity was shown to accumulate low levels of ferulic acid (Leplé et al. 2007; Ralph et al. 2008). High-resolution structural analysis of lignin using 2-dimensional nuclear mag-netic resonance (2D-NMR) has revealed the incorporation of several other com-pounds that are not traditionally considered as monolignols (Fig. 4.16). An example is the monolignol precursor coniferaldehyde (4.37), which is present in small quanti-ties in ‘normal’ lignin and as such responsible for the dark red coloration of lignified tissues after incubation in acid phloroglucinol (Wiesner reaction; Vermerris et al. 2002). This compound is, however, abundantly present in the lignin of mutant and transgenic angiosperm plants with reduced activity of the enzyme cinnamyl alcohol dehydrogenase (Pillonel et al. 1991; Halpin et al. 1994; Ralph et al. 1998; 2001). In addition, sinapyl aldehyde (4.41; Pillonel et al. 1991), dihydroconiferyl alcohol (4.53; Ralph et al. 2001), p-hydroxy-3-methoxybenzaldehyde (vanillin; 4.54; Kim et al. 2003; Morreel et al. 2004a), p-hydroxybenzoate (4.55; Landucci et al. 1992; Morreel et al. 2004a), and acetylated monolignols (4.56; Ralph 1996) have been observed. Many of these compounds were typically first observed in mutants or transgenic plants in which one of the monolignol biosynthetic genes was down-regulated, but they are typically present in small quantities in the lignin of wild-type plants (Morreel et al. 2004a).

Composition and Biosynthesis of Lignocellulosic Biomass 125
OH
O OH
OCH3
OH
OH
OH
O
OCH3
H
OCH3
OH
O
O
4.564.554.544.53 Fig. 4.16. Compounds other than the traditional monolignols that have been identified in lignin. Figure 4.13 shows some of the other alternative lignin monomers mentioned in the text.
The distribution of interunit linkages appears to be under chemical control. Based on in vitro formation of dehydrogenation polymers (DHPs), the distribution of inter-unit linkages is affected by the local concentration of monolignol radicals (Syrjanen and Brunow 2000), the presence of polysaccharides (Terashima et al. 1996), proteins (McDougall et al. 1996), and lignin (Guan et al. 1997). When DHPs were formed in the presence of isolated primary cell walls of maize, the resulting lignin polymer resembled native maize lignin very closely (Grabber et al. 1996). The model in which lignin polymerization is considered to be under chemical control is referred to as the ‘random coupling’ model, or, more accurately, the ‘combinatorial coupling’ model. According to this model, lignin has little predetermined structure to it. From a biological point of view this is to the plant’s advantage when it comes to the role lignin plays in defense against pathogens and insect pests. An invading organism would have to develop a host of hydrolytic enzymes in order to effectively dissolve the barrier created by lignified tissue (Denton 1998). An opposing view on the polymerization of lignin was proposed by Gang et al. (1999). They reasoned that an abundant and important polymer like lignin should be under biological control, in a manner analogous to several other biological polymers, including cellulose, chitin, and proteins. They postulated the existence of proteins that stipulated which interunit linkages were formed. Experimental evidence in sup-port of several different versions of this model (Davin and Lewis 2000; 2005a,b) has always been indirect, and has not been able to adequately explain the lack of optical activity of lignin (Freudenberg 1965; Ralph et al. 1999; Akiyama et al. 2000; Mor-reel et al. 2004a). Furthermore, genetic and biochemical proof supporting the in-volvement of proteins in establishing the structure of lignin is still lacking, despite the fact that the need for such experiments has been expressed several times (e.g. Hatfield and Vermerris 2001; Boerjan et al. 2003), and despite the fact that such experiments are now considered routine in Arabidopsis.
4.8 Cell Wall Proteins
The cell wall contains structural and non-structural proteins. The structural proteins in the cell wall are, as the name implies, an integral part of the cell wall. They can be

126 Vermerris classified as hydroxyproline-rich glycoproteins (HRGPs), glycine-rich proteins (GRPs), proline-rich proteins (PRPs), and arabinogalactan proteins (AGPs). The names of these different classes of proteins reflect the abundance of certain amino acids or, in the case of AGP’s, fact that they are glycosylated. For comprehensive reviews of these different classes, see Carpita (1996) and Cassab (1998). Non-structural proteins include a large variety of enzymes that are involved in biosynthesis or rearrangement of cell wall polymers, such as peroxidases, hydrolases and transferases, as discussed in the previous sections dealing with specific poly-mers. Expansins form an interesting class of non-structural cell wall proteins. These 25–28 kDa glycoproteins facilitate cell expansion during growth by loosening the cell wall (Cosgrove and Li 1993), have been implicated in the drought response of maize seedlings (Wu et al. 1996), and appear to be involved in abscission, and the response to submergence, light, and stress (Cosgrove et al. 2002). Expansins can be classified as α- and β-expansins. The α-expansins (EXPAs) are grass pollen-specific and are likely to facilitate pollen tube penetration by loosening the cell walls in the style (Cosgrove et al. 1997). The β-expansins (EXPBs) are overall similar in se-quence but contain N-linked glycosylation motifs absent in the EXPAs. Most of the β-expansins are present in vegetative tissues, but there is a subgroup of pollen-expressed EXPBs that are referred to as group-1 grass pollen allergens and that are responsible for hay fever and seasonal asthma (Cosgrove et al. 2002). The expansin-mediated mechanism of cell wall loosening is uncertain, but does not appear to involve enzymatic action. Based on the crystal structure of the maize EXPB1 protein, Yennawar et al. (2006) proposed a model in which expansins weaken the non-covalent adhesion between cellulose and arabinoxylans. This relaxes the structure of the cell wall and allows expansion. Subsequent reassociation of the glycan chains after expansion restores cell wall strength. The expansins are encoded by large multigene families in maize. In comparison with Arabidopsis, maize and rice contain approximately the same number of EXPA genes, but considerably more EXPB genes. This is likely a reflection of the different composition of the cell wall in grasses (Cosgrove et al. 2002). Of interest for bioenergy applications is the fact that expansins have been shown to enhance the action of cellulolytic enzymes used to degrade cellulose in plant cell walls (Cosgrove 2001).
4.9 Cell Wall Architecture
All of the different cell wall polymers described in the previous sections are not simply secreted in the extracellular space, but make up a complex network (matrix) with an intricate structure. The composition and architecture of the cell wall varies between cell types and developmental stages, enabling cells to function optimally during the course of their life span. We are only just beginning to understand the structure of cell walls, and how this affects their function, based on a combination of high-resolution imaging (e.g. Ding and Himmel 2006), identification of cell wall gene networks (reviewed by Yong et al. 2005), the study of mutants with altered expression of cell wall-related genes (reviewed by Somerville 2006), and, when

Composition and Biosynthesis of Lignocellulosic Biomass 127
feasible, activity assays (see review by Fry (2004)) or functional assays (e.g. Desprez et al. 2007). These efforts are challenging, because of the variation in cell wall archi-tecture among different species and among different tissue types. Herbaceous angiosperm species can be classified into two groups based on the composition and architecture of the primary cell wall, as outlined by Carpita and Gibeaut (1993). The Type I cell wall is found in most angiosperms including Arabi-dopsis, as well as in noncommelinoid monocots such as orchids and lillies. They contain about equal amounts of cellulose and cross-linking xyloglucans (XyGs), with various minor amounts of arabinoxylans, glucomannans, and galactoglucomannans. XyGs occur in two distinct locations in the wall: binding tightly to exposed faces of glucan chains in the cellulose microfibrils, and spanning the distance between adja-cent microfibrils or simply twining with other XyGs to space and lock the microfi-brils into place. The cellulose-XyG framework of Type I walls is embedded in a pectin matrix consisting predominantly of homogalacturonans (HGAs) and rhamno-galacturonan I (RG I). These pectic polysaccharides can be esterified to other cell wall polymers to lock them in place. Some Type I walls also contain several types of structural proteins that may interact with the pectin network, or that could form in-termolecular bridges with other proteins without necessarily binding to the polysac-charide components. The plasma membrane of a cell is tightly associated with the pectin matrix of the wall, and several interactive membrane surface proteins, includ-ing arabinogalactan proteins and receptor-like kinases interact with this matrix. The Type II cell wall is found in grasses and other commelinoid monocots. The primary cell walls in these species contain cellulose microfibrils of the same struc-ture as those of the Type I wall, but glucuronoarabinoxylans (GAX’s) are the princi-pal polymers that interlock the microfibrils. Unbranched GAX’s can hydrogen bond to cellulose or to each other. The attachment of arabinose and glucuronic acid side groups to the xylan backbone of GAXs prevents the formation of hydrogen bonds, diminishing the extent of cross-linking between two unbranched GAX chains or GAX to cellulose. Type II walls have small amounts of XyG, but these XyGs contain neither arabinose nor fucose. In general, Type II walls are pectin-poor; but with the exception of the lack of fucose, these pectins are similar in structure to those of di-cots. Type II walls have extensive interconnecting networks of phenylpropanoids that form primarily when cells stop expanding. In the non-lignified walls the princi-pal hydroxycinnamate is ferulic acid, whereas in the lignified walls both ferulic and p-coumaric acid are found. Given the complexity of the cell wall, the genetic and biochemical control of cell wall architecture will likely involve many genes. There are several mutants in which cell wall architecture, tissue organization, or cell shape are affected, thus offering a view of the kinds of mechanisms involved in establishing the final product. The lion’s tail (lit), sabre (sab), short root (shr), and cobra (cob) mutants were identified during a mutant screen for altered root morphology (Benfey et al. 1993) and dis-played altered growth and cell expansion in root tissue. The cob mutant, as well as the rice brittle culm1 (bc1; Li et al. 2003b) and maize brittle stalk2 (bk2; Ching et al. 2006; Sindhu et al. 2007) mutants have mutations in a gene encoding a glycosyl-phosphatidyl-inositol (GPI)-anchored membrane protein. These proteins are synthe-sized in the Golgi complex and secreted in the cell wall, where they are attached to a

128 Vermerris phospholipid molecule at the C-terminal ω-attachment site. Additional characteristic features include a conserved cysteine-rich domain, an N-terminal secretion signal sequence, and a predicted cellulose binding site (Roudier et al. 2002). The precise function of these proteins remains, however, uncertain and may differ among dicots and monocots based on the mutant phenotypes. The roots of the cobra mutant look like the head of the snake with the same name, resulting from abnormal anisotropic cell expansion during root development. Furthermore, the cob root contains fewer and improperly oriented cellulose microfibrils (Roudier et al. 2005). In contrast, the roots of the rice bc1 and maize bk2 mutants look normal, but these plants are brittle and snap when mechanical pressure is applied. This phenotype appears to be associ-ated with changes in the ratio of lignin and cellulose, either as a result of altered cellulose deposition (Ching et al. 2006) or a disruption in the mechanism that coor-dinates lignin and cellulose deposition throughout growth and development (Sindhu et al. 2007). Arabidopsis contains twelve COBRA paralogs (Roudier et al. 2002), whereas rice and maize contain nine and eight Cobra-like (Cobl) genes, respectively (Li et al. 2003b; Brady et al. 2007), and it is therefore possible that mutations in some of these other genes result in more similar phenotypes between Arabidopsis, maize and rice. Analyses of lignified secondary cell walls, especially in woody species, are com-plicated because of the recalcitrance of lignin to chemical degradation. Several meth-ods to determine composition exist and will be discussed in Chapter 5. Determining the architecture of secondary cell walls is particularly challenging. Immunogold labeling of different lignin structures, followed by visualization under electron mi-croscopy (Joseleau and Ruel 1997) indicated variation in lignin structure in the sec-ondary cell wall. Two new tools that may be of value are laser microdissection (re-viewed by Nelson et al. (2006)), which enables the analysis of individual cells or cell types without ‘contaminating’ neighboring cells, and tissue imaging/profiling using Fourier transform infrared spectroscopy (Carpita et al. 2001) or MALDI-TOF mass spectrometry (Robinson et al. 2007; MALDI-TOF stands for ‘matrix assisted laser desorption ionization time of flight ). These profiling techniques rely on a grid-based, systematic compositional analysis of a tissue section.
4.10 Cell Wall-Related Databases
The progress in genomics has enabled the development of several useful resources to access information on genes related to cell wall biosynthesis. The CAZy database (Carbohydrate Active eZymes; Coutinho and Henrissat 1999) describes the families of structurally-related catalytic and carbohydrate-binding modules (or functional domains) of enzymes that degrade, modify, or create glycosi-dic bonds. It can be accessed via the Internet (www.cazy.org). For each class of enzymes – glycoside hydrolyses, glycosyl transferases, polysaccharide lyases, carbo-hydrate esterases, and enzymes with carbohydrate binding modules – a description is provided that details enzyme function, catalytic activity, and classification. The Cell Wall Navigator database (Girke et al. 2004; accessible via the Internet: http://bioinfo.ucr.edu/projects/Cellwall/index.pl) was developed to consolidate
’
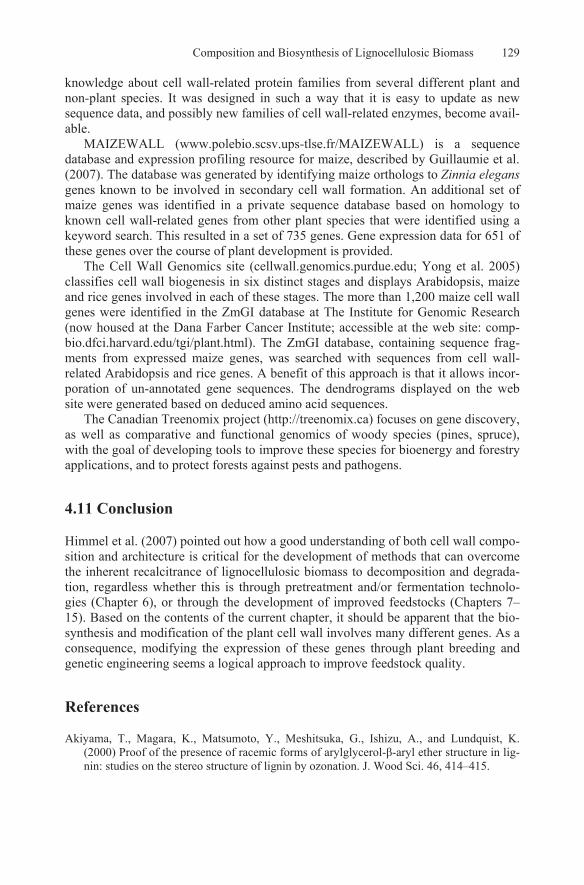
Composition and Biosynthesis of Lignocellulosic Biomass 129
knowledge about cell wall-related protein families from several different plant and non-plant species. It was designed in such a way that it is easy to update as new sequence data, and possibly new families of cell wall-related enzymes, become avail-able. MAIZEWALL (www.polebio.scsv.ups-tlse.fr/MAIZEWALL) is a sequence database and expression profiling resource for maize, described by Guillaumie et al. (2007). The database was generated by identifying maize orthologs to Zinnia elegans genes known to be involved in secondary cell wall formation. An additional set of maize genes was identified in a private sequence database based on homology to known cell wall-related genes from other plant species that were identified using a keyword search. This resulted in a set of 735 genes. Gene expression data for 651 of these genes over the course of plant development is provided. The Cell Wall Genomics site (cellwall.genomics.purdue.edu; Yong et al. 2005) classifies cell wall biogenesis in six distinct stages and displays Arabidopsis, maize and rice genes involved in each of these stages. The more than 1,200 maize cell wall genes were identified in the ZmGI database at The Institute for Genomic Research (now housed at the Dana Farber Cancer Institute; accessible at the web site: comp-bio.dfci.harvard.edu/tgi/plant.html). The ZmGI database, containing sequence frag-ments from expressed maize genes, was searched with sequences from cell wall-related Arabidopsis and rice genes. A benefit of this approach is that it allows incor-poration of un-annotated gene sequences. The dendrograms displayed on the web site were generated based on deduced amino acid sequences. The Canadian Treenomix project (http://treenomix.ca) focuses on gene discovery, as well as comparative and functional genomics of woody species (pines, spruce), with the goal of developing tools to improve these species for bioenergy and forestry applications, and to protect forests against pests and pathogens.
4.11 Conclusion
Himmel et al. (2007) pointed out how a good understanding of both cell wall compo-sition and architecture is critical for the development of methods that can overcome the inherent recalcitrance of lignocellulosic biomass to decomposition and degrada-tion, regardless whether this is through pretreatment and/or fermentation technolo-gies (Chapter 6), or through the development of improved feedstocks (Chapters 7–15). Based on the contents of the current chapter, it should be apparent that the bio-synthesis and modification of the plant cell wall involves many different genes. As a consequence, modifying the expression of these genes through plant breeding and genetic engineering seems a logical approach to improve feedstock quality.
References
Akiyama, T., Magara, K., Matsumoto, Y., Meshitsuka, G., Ishizu, A., and Lundquist, K. (2000) Proof of the presence of racemic forms of arylglycerol-β-aryl ether structure in lig-nin: studies on the stereo structure of lignin by ozonation. J. Wood Sci. 46, 414–415.

130 Vermerris Amor, Y., Haigler, C.H., Johnson, S., Wainscott, M., and Delmer, D.P.A (1995) Membrane-
associated form of sucrose synthase and its potential role in synthesis of cellulose and cal-lose in plants. Proc. Natl. Acad. Sci. U.S.A. 92, 9353–9357.
Arabidopsis Genome Initiative (2000) Analysis of the genome sequence of the flowering plant Arabidopsis thaliana. Nature 408, 796–815.
Arioli, T., Peng, L., Betzner, A.S., Burn, J., Wittke, W., Herth, W., Camilleri, C., Höfte, H., Plazinski, J., Birch, R., Cork, A., Glover, J., Redmond, J., and Williamson, R.E. (1998) Molecular analysis of cellulose biosynthesis in Arabidopsis. Science 279, 717–720.
Bacic, A., and Stone, B. A. (1980) A (1→ 3)- and (1→ 4)-linked β-cell walls of wheat. Carbohydr. Res. 82, 372–377.
Bao, W., O'Malley, D.M., Whetten, R., and Sederoff, R.R. (1993) A laccase associated with lignification in loblolly pine xylem. Science 260, 672−674.
Barber, C., Rösti, J., Rawat, A., Findlay, K., Roberts, K., and Seifert, G.J. (2006) Distinct properties of the five UDP-D-glucose/UDP- D-galactose 4-epimerase isoforms of Arabi-dopsis thaliana. J. Biol. Chem. 281, 17276–17285.
Baskin, T.I., Betzner, A.S., Hoggart, R., Cork, A., and Williamson, R.E. (1992) Root mor-phology mutants in Arabidopsis thaliana. Aust. J. Plant Physiol. 19, 427.
Becnel, J., Natarajan, M., Kipp, A., and Braam, J. (2006) Developmental expression patterns of Arabidopsis XTH genes reported by transgenes and Genevestigator. Plant Mol. Biol. 61, 451–467.
Benfey, P.N., Linstead, P.J., Roberts, K., Schiefelbein, J.W., Hauser, M.T., and Aeschabacher, R.A. (1993) Root development in Arabidopsis: four mutants with dramatically altered root morphogenesis. Development 119, 57–70.
Bernal, A.J., Jensen, K.J., Harholt, J., Serensen, S., Moller, I., Blaukopf, C., Johansen, B., de Lotto, R., Pauly, M., Scheller, V.H., and Willats, W.G.T. (2007) Disruption of ATCSLD5 results in reduced growth, reduced xylan and homogalacturonan synthase activity and al-tered xylan occurrence in Arabidopsis. Plant J. 52, 791–802.
Bieniawska, Z., Barratt, D.H.P., Garlick, A.P., Thole, V., Kruger, N.J., Martin, C., Zrenner, R., and Smith, A.M. (2007) Analysis of the sucrose synthase gene family in Arabidopsis. Plant J. 49, 810–828.
Boerjan, W., Ralph, J., and Baucher, M. (2003) Lignin biosynthesis. Annu. Rev. Plant Biol. 54, 519–546.
Bonin, C.P., Potter, I., Vanzin, G.F., and Reiter, W.D. (1997) The MUR1 gene of Arabidopsis thaliana encodes an isoform of GDP-D-mannose-4, 6-dehydratase, catalyzing the first step in the de novo synthesis of GDP-L-fucose. Proc. Natl. Acad. Sci. U.S.A. 94, 2085–2090.
Bonin, C.P., and Reiter, W.D. (2000) A bifunctional epimerase-reductase acts downstream of the MUR1 gene product and completes the de novo synthesis of GDP-L-Fucose in Arabi-dopsis. Plant J. 21, 445–454.
Bonin, C. P.; Fresjpir. G.; Hahn, M. G.; Vanzin, G. F., and Reiter, W.-D. (2003) The GMD1 and GMD2 genes of Arabidopsis encode isoforms of GDP-D-Mannose 4, 6-dehydratase with cell type-specific expression patterns. Plant Physiol. 132, 883–892.
Bout, S., and Vermerris, W. (2003) A candidate gene-approach to clone the sorghum Brown midrib gene encoding caffeic acid O-methyltransferase. Mol. Genet. Genomics 269, 205–214.
Brady, S.M., Song, S., Dhugga, K.S., Rafalski, J.A., and Benfey, P.N. (2007) Combining expression and comparative evolutionary analysis. The COBRA gene family. Plant Physiol. 143, 172–187.
Brown, D.M., Zeef, A.H., Ellis, J., Goodacre, R., and Turner, S.R. (2005) Identification of novel genes in Arabidopsis involved in secondary cell wall formation using expression profiling and reverse genetics. Plant Cell 17, 2281–2295.
d-glucan in the endosperm

Composition and Biosynthesis of Lignocellulosic Biomass 131
Brown, Jr. R.M. (2004) Cellulose structure and biosynthesis: what is in store for the 21st century? J. Polym. Sci. 42, 487–495.
Brown, Jr., R.M., and Montezinos, D. (1976) Cellulose microfibrils: visualization of biosyn-thetic and orienting complexes in association with the plasma membrane. Proc. Natl. Acad. Sci. U.S.A. 73, 143–147.
Bunzel, M., and Ralph, J. (2006) NMR characterization of lignins isolated from fruit and vegetable insoluble dietary fiber. J. Agric. Food Chem. 54, 8352–8361.
Bunzel, M., Ralph, J., Lu, F., Hatfield, R.D., and Steinhart, H. (2004) Lignins and ferulate-coniferyl alcohol cross-coupling products in cereal grains. J. Agric. Food Chem. 52, 6496–6502.
Burget, E.G., Verma, R., Mølhøj, M., and Reiter, W.-D. (2003) The biosynthesis of L-Arabinose in plants: molecular cloning and characterization of a Golgi-localized UDP-D-xylose 4-epimerase encoded by the MUR4 gene of Arabidopsis. Plant Cell 15, 523–531.
Burn, J.E., Hocart, C.H., Birch, R.J., Cork, A.C., and Williamson, R.E. (2002) Functional analysis of the cellulose synthase genes CesA1, CesA2, and CesA3 in Arabidopsis. Plant Physiol. 129, 797–807.
Burton, R.A., Wilson, S.M., Hrmova, M., Harvey, A.J., Shirley, N.J., Medhurst, A., Stone, B.A., Newbigin, E.J., Bacic, A., and Fincher, G.B. (2006) Cellulose synthase–like CslF genes mediate the synthesis of cell wall (1,3;1,4)-ß-D-glucans. Science 311, 1940–1942.
Campbell, J.A., Davies, G.J., Bulone, V., and Henrissat, B. (1997) Biochem. J. 326, 929–939. Caparrós-Ruiz, D., Fornalé, S., Civardi, L., Puigdoménech, P., and Rigau, J. (2006) Isolation
and characterisation of a family of laccases in maize. Plant Sci. 171, 217–225. Carnachan, S.M., and Harris, P.J. (2000) Ferulic acid is bound to the primary cell walls of all
gymnosperm families. Biochem. System. Ecol. 28, 865–879. Carpita, N. (1996) Structure and biogenesis of the cell walls of grasses. Annu. Rev. Plant
Physiol. Plant Mol. Biol. 47, 445–476. Carpita, N.C., and Gibeaut, D.M. (1993) Structural models of primary cell walls in flowering
plants: consistency of molecular structure with the physical properties of the walls during growth. Plant J. 3, 1–30.
Carpita, N.C., and McCann M.C. (2000) The cell wall. In: B.B. Buchanan, W. Gruissem and R.L. Jones (Eds.), Biochemistry and Molecular Biology of Plants. J. Wiley and Sons, Somerset, NJ, pp. 52–108.
Carpita, N., Tierney, M., and Campbell, M. (2001) Molecular biology of plant cell wall: searching for the genes that define structure, architecture and dynamics. Plant Mol. Biol. 47, 1–5.
Carpita, N., and Vergara, C. (1998) A recipe for cellulose. Science 279,672–673. Carpita, N.C., and Whittern, D. (1986) A highly substituted glucuronoarabinoxylan from
developing maize coleoptiles. Carbohydr. Res. 146, 129–140. Cassab, G.I. (1998) Plant cell wall proteins. Annu. Rev. Plant Physiol. Plant Mol. Biol. 49,
281–309. Cavalier, D.M., and Keegstra, K. (2006) Two xyloglucan xylosyltransferases catalyze the
addition of multiple xylosyl residues to cellohexaose. J. Biol. Chem. 281, 34197–34207. Ching, A., Dhugga, K.S., Appenzeller, L., Meeley, R., Bourett, T.M., Howard, R.J., and
Rafalski, A. (2006) Brittle stalk 2 encodes a putative glycosylphosphatidylinositolan-chored protein that affects mechanical strength of maize tissues by altering the composi-tion and structure of secondary cell walls. Planta 224, 1174–1184.
Chu, Z., Chen, H., Zhang, Y., Zhang, Z., Zheng, N., Yin, B., Yan, H., Zhu, L., Zhao, X., Yuan, M., Zhang, X., and Xie, Q. (2007) Knockout of the AtCESA2 gene affects micro-tubule orientation and causes abnormal cell expansion in Arabidopsis. Plant Physiol. 143, 213–224.

132 Vermerris Cocuron, J.C., Lerouxel, O., Drakakai, G., Alonso, A.P., Liepman, A.H., Keegstra, K., Raik-
hel, N., and Wilkerson, C.G. (2007) A gene from the cellulose synthase-like C family en-codes a ß-1, 4 glucan synthase. Proc. Natl. Acad. Sci. U.S.A. 104, 8550–8555.
Coleman, H.D., Ellis, D.D., Gilbert, M., and Mansfield, S.D. (2006) Up-regulation of sucrose synthase and UDP-glucose pyrophosphorylase impacts plant growth and metabolism. Plant Biotechnol. J. 4, 87–101.
Cosgrove, D.J. (2001) Enhancement of accessibility of cellulose by expansins, US Patent 6326470.
Cosgrove, D.J., Bedinger, P., and Durachko, D.M. (1997) Group 1 allergens of grass pollen as cell wall-loosening agents. Proc. Natl. Acad. Sci. U.S.A. 94, 6559–6564.
Cosgrove, D.J., and Li, Z.C. (1993) Role of expansin in cell enlargement of oat coleoptiles. Plant Physiol. 103, 1321–1328.
Cosgrove, D.J., Li, L.C., Cho, H.T., Hoffmann-Benning, S., Moore, R.C., and Blecker, D. (2002) The growing world of expansins. Plant Cell Physiol. 43, 1436–14444.
Coutinho, P.M., Deleury, E., Davies, G.J., and Henrissat, B. (2003a) An evolving hierarchical family classification of glycosyltransferases. J. Mol. Biol. 328, 307–317.
Coutinho, P.M. and Henrissat, B. (1999) Carbohydrate-active enzymes: an integrated database approach. In: H.J. Gilbert, G. Davies, B. Henrissat and B. Svensson (Eds.), Recent Ad-vances in Carbohydrate Bioengineering. The Royal Society of Chemistry. Cambridge, UK, pp. 3–12.
Coutinho, P.M., Stam, M., Blanc, E., and Henrissat, B. (2003b) Why are there so many carbo-hydrate-active enzyme-related genes in plants? Trends Plant Sci. 8, 563–565.
Cutler, S., and Somerville, C. (1997) Cellulose synthesis: cloning in silico. Curr. Biol. 7, R108–R111.
Dahlgren, G. (1989) An updated angiosperm classification. Bot. J Linn. Soc. 100, 197–204. Darley, C.P., Forrester, A.M., McQueen-Mason, S.J. (2001) The molecular basis of plant cell
wall extension. Plant Mol. Biol. 47, 179–195. Davin, L.B., and Lewis, N.G. (2000) Dirigent proteins and dirigent sites explain the mystery
of specificity of radical precursor coupling in lignan and lignin biosynthesis. Plant Physiol. 123, 453–461.
Davin, L.B., and Lewis, N.G. (2005a) Lignin primary structures and dirigent sites. Curr. Opin. Biotechnol. 16, 1–9.
Davin, L.B., and Lewis, N.G. (2005b) Dirigent phenoxy radical coupling: advances and chal-lenges. Curr. Opin. Biotechnol. 16, 1–9.
de Obeso, M., Caparro-Ruiz, D., Vignols, F., Puigdomenech, P., and J. Rigau (2003) Charac-terisation of maize peroxidases having differential patterns of mRNA accumulation in re-lation to lignifying tissues. Gene 309, 23–33.
de Silva, J., Jarman, C.D., Arrowsmith, D.A., Stronach, M.S., Chengappa, S., Sidebottom, C., and Reid, J.S.G. (1993) Molecular characterization of xyloglucan-specific endo-(1-4)-ß-D-glucanase (xyloglucan endo-transglycosylase) from nasturtium seeds. Plant J. 3, 701–711.
Delmer, D.P. (1999) Cellulose biosynthesis: Exciting times for a difficult field of study. Annu. Rev. Plant Physiol. Plant Mol. Biol. 50, 245–276.
Denton, F.R. (1998) Beetle juice. Science 281, 1285. Desprez, T., Juraniec, M., Crowell, E., Jouy, H., Pochylova, Z., Parcy, F., Höfte, H., Gonneau,
M., Vernhettes, S. (2007) Organization of cellulose synthase complexes involved in pri-mary cell wall synthesis in Arabidopsis thaliana. Proc. Natl. Acad. Sci. U.S.A. 104, 15572–15577.
Desprez, T., Vernhettes, S., Fagard, M., Refregier, G., Desnos, T., Aletti, E., Py, N., Pelletier, S., and Höfte, H. (2002) Resistance against herbicide isoxaben and cellulose deficiency caused by distinct mutations in same cellulose synthase isoform CESA6. Plant Physiol. 128, 482–490.

Composition and Biosynthesis of Lignocellulosic Biomass 133
Dhugga, K.S. (2005) Plant Golgi cell wall synthesis: from genes to enzyme activities. Proc. Natl. Acad. Sci. U.S.A. 102, 1815–1816.
Dhugga, K.S., Barreiro, R., Whitten, B., Stecca, K., Hazebroek, J., Randhawa, G.S., Dolan, M., Kinney, A.J., Tomes, D., Nichols, S., and Anderson, P. (2004) Guar seed ß-mannan synthase is a member of the cellulose synthase super gene family. Science 303, 363–366.
Diet, A., Link, B., Seifert, G.J., Schellenberg, B., Wagner, U., Pauly, M., Reiter, W.-D., and Ringli, C. (2006) The Arabidopsis root hair cell wall formation mutant lrx1 is suppressed by mutations in the RHM1 gene encoding a UDP-L-rhammnose synthase. Plant Cell 18, 1630–1641.
Ding, S.-Y. and Himmel, M.E. (2006) The maize primary cell wall microfibril: a new model derived from direct visualization. J. Agric. Food Chem. 54, 597–606.
Doblin, S., Kurek, I., Jacob-Wilk, D. and D. P. Delmer (2002) Cellulose biosynthesis in plants: from genes to rosettes. Plant Cell Physiol. 43, 1407–1420.
Ebringerová, A., and Heinze, T. (2000) Xylan and xylan derivatives – biopolymers with valu-able properties. 1. Naturally occurring xylans structures, isolation procedures and proper-ties. Macromolec. Rapid Comm. 21, 542–556.
Fagard, M., Desnos, T., Desprez, T., Goubet, F., Refregier, G., Mouille, G., McCann, M., Rayon, C., Vernhettes, S., and Hofte, H. (2000) PROCUSTE1 encodes a cellulose syn-thase required for normal cell elongation specifically in roots and dark-grown hypocotyls of Arabidopsis. Plant Cell 12, 2409–2424.
Faik, A., Price, N.J., Raikhel, N.V., and Keegstra, K. (2002) An Arabidopsis gene encoding an α-xylosyltransferase involved in xyloglucan biosynthesis. Proc. Natl. Acad. Sci. U.S.A. 99, 7797–7802.
Fanutti, C., Gidley, M.J., and Reid, J.S.G.(1993) Action of a pure xyloglucanendo-transglycosylase (formerly called xyloglucan-specificendo-(1,4)-β-D-glucanase) from the cotyledons of germinated nasturtium seeds. Plant J. 3, 691– 700.
Farkas, V., Sulova, Z., Stratilova, E., Hanna, R., and Maclachlan, G. (1992) Cleavage of xyloglucan by nasturtium seeed xyloglucanase and transglycosylation to xyloglucan sub-unit oligosaccharides. Arch. Biochem. Biophys. 298, 365–370.
Favery, B., Ryan, E., Foreman, J., Linstead, P., Boudonck, K., Steer, M., Shaw, P., and Dolan, L. (2001) KOJAK encodes a cellulose synthase-like protein required for root hair cell morphogenesis in Arabidopsis. Genes Dev. 15, 79–89.
Fernie, A.R., Willmitzer, L., and Trethewey, R.N. (2002) Sucrose to starch: a transition in molecular. Plant Physiol. Trends Plant Sci. 7, 35–41.
Franke, R., Hemm, M.R., Denault, J.W., Ruegger, M.O., Humphreys, J.M., and Chapple, C. (2002a) Changes in the secondary metabolism and deposition of an unusual lignin in the REF8 mutant of Arabidopsis. Plant J. 30, 47–59.
Franke, R., Humphreys, J.M., Hemm, M.R., Denault, J.W., Ruegger, M.O., Cusumano, J.C., and Chapple, C. (2002b) The Arabidopsis REF8 gene encodes the 3-hydroxylase of phenylpropanoid metabolism. Plant J. 30, 33–45.
Freshour, G., Bonin, C.P., Reiter, W.D., Albersheim, P., Darvill, A.G., and Hahn, M.G. (2003) Distribution of fucose-containing xyloglucans in cell walls of the mur1 mutant of Arabi-dopsis. Plant Physiol. 131, 1602–1612.
Freudenberg, K. (1965) Lignin: its constitution and formation from p-hydroxycinnamyl alco-hols. Science 148, 595–600.
Fry, S.C. (2004) Primary cell wall metabolism: tracking the careers of wall polymers in living plant cells. New Phytol. 161, 641–675.
Gallagher, S.R., (1992) GUS Protocols: Using the GUS Gene as a Reporter of Gene Expres-sion. Academic Press, San Diego.
Gang, D.R., Costa, M.A., Fujita, M., Dinkova-Kostova, A.T., Wang, H.-B., Burlat, V., Martin, W., Sarkanen, S., Davin, L.B., and Lewis, N.G. (1999) Regiochemical control of mono-

134 Vermerris
lignol radical coupling: a new paradigm for lignin and lignan biosynthesis. Chem. Biol. 6, 143–151.
Girke, T., Lauricha, J., Tran, H., Keegstra, K., and Raikhel, N. (2004) The cell wall navigator database. A systems-based approach to organism-unrestricted mining of protein families involved in cell wall metabolism. Plant Physiol. 136, 3003–3008.
Goffner, D., Campbell, M.M., Campargue, C., Clastre, M., Borderies, G., Boudet, A., and Boudet, A.M. (1994) Purification and characterization of cinnamoyI-CoA: NADP oxi-doreductase in Eucalyptus gunnii. Plant Physiol. 106, 625–632.
Goujon, T., Sibout, R., Eudes, A., MacKay, J., and Jouanin, L. (2003a) Genes involved in the biosynthesis of lignin precursors in Arabidopsis thaliana. Plant Physiol. Biochem. 41, 677–687.
Goujon, T., Sibout, R., Pollet, B., Maba, B., Nussaume, L., Bechtold, N., Lu, F., Ralph, J., Mila, I., Barrière, Y., Lapierre, C., and Jouanin, L. (2003b) A new Arabidopsis thaliana mutant deficient in the expression of O-methyltransferase impacts lignins and sinapoyl es-ters. Plant Mol. Biol. 51, 973–989.
Grabber, J.H., Ralph, J., Hatfield, R.D., Quideau, S., Kuster, T., and Pell, A.N. (1996) Dehy-drogenation polymer – cell wall complexes as a model for lignified grass walls. J. Agric. Food Chem. 44, 1453–1459.
Guan, S.-Y., Mlynár, J., and Sarkanen, S. (1997) Dehydrogenative polymerization of coniferyl alcohol on macromolecular lignin templates. Phytochem. Anal. 45, 911–918.
Guillaumie, S., San-Clemente, H., Deswarte, C., Martinez, Y., Lapierre, C., Murigneux, A., Barrière, Y., Pichon, M., and Goffner, D. (2007) MAIZEWALL. Database and develop-mental gene expression profiling of cell wall biosynthesis and assembly in maize. Plant Physiol. 143, 339–363.
Guillet-Claude, C., Birolleau-Touchard, C., Manicacci, D., Rogowsky, P.M., Rigau, J., Murigneux, A., Martinant, J.P., and Barrière, Y. (2004) Nucleotide diversity of the ZmPox3 maize peroxidase gene: relationships between a MITE insertion in exon 2 and variation in forage maize digestibility. BMC Genet. 5, 1–11.
Ha, M.A., Apperley, D.C., Evans, B.W., Huxham, M., Jardine, W.G., Vietor, R.J., Reis, D., Vian, B., and Jarvis, M.C. (1998) Fine structure in cellulose microfibrils: NMR evidence from onion and quince. Plant J. 16, 183–190.
Halpin, C., Knight, M.E., Foxon, G.A., Campbell, M.M., Boudet, A.M., Boon, J.J., Chabbert, B., Tollier, M.-T., Schuch, W. (1994) Manipulation of lignin quality by downregulation of cinnamyl alcohol dehydrogenase. Plant J. 6, 339–350.
Harkin, J.M., and Obst, J.R. (1973) Lignification in trees: indication of exclusive peroxidase participation. Science 180, 296–298.
Harper, A., and Bar-Peled, M. (2002) Biosynthesis of UDP-xylose. Cloning and characteriza-tion of a novel Arabidopsis gene family, UXS, encoding soluble and putative membrane-bound UDP-glucuronic acid decarboxylase isoforms. Plant Physiol. 130, 2188–2198.
Hatfield, R. D., Ralph, J., and Grabber, J. H. (1998) Cell wall cross-linking by ferulates and diferulates in grasses. J. Sci. Food Agric. 79, 403–407.
Hatfield, R., and Vermerris, W. (2001) Lignin formation in plants: the dilemma of linkage specificity. Plant Physiol. 126, 1351–1357.
Hazen, S.P., Scott-Craig, J.S., and Walton, J.D. (2002) Cellulose synthase-like genes of rice. Plant Physiol. 128, 336–340.
Herrmann, K.M., and Weaver, L.M. (1999) The shikimate pathway. Annu. Rev. Plant Physiol. Plant Mol. Biol. 50, 473–503.
Higuchi, T. (1985) Biosynthesis of lignin. In: T. Higuchi (Ed.), Biosynthesis and Biodegrada-tion of Wood Components. Orlando, Academic Press, pp. 141–160.

Composition and Biosynthesis of Lignocellulosic Biomass 135
Himmel, M.E., Ding, S.Y., Johnson, D.K., Adney, W.S., Nimlos, M.R., Brady, J.W., and Foust, T.D. (2007) Biomass recalcitrance: engineering plants and enzymes for biofuels production. Science 315, 804–807.
Hoffmann, L., Maury, S., Martz, F., Geoffroy, P., and Legrand, M. (2003) Purification, clon-ing, and properties of an acyltransferase controlling shikimate and quinate ester intermedi-ates in phenylpropanoid metabolism. J. Biol. Chem. 278, 95–103.
Holland, N., Holland, D., Helentjaris, T., Dhugga, K.S., Xoconostle-Cazares, B., Delmer, D.P. (2000) A comparative analysis of the plant cellulose synthase (CesA) gene family. J. Plant Physiol. 123, 1313–1323.
Humphreys, J.M., and Chapple, C. (2002) Rewriting the lignin road map. Curr. Opin. Plant Biol. 5, 224–229.
Humphreys, J.M., Hemm, M.R., and Chapple, C. (1999) New routes for lignin biosythesis defined by biochemical characterization of recombinant ferulate 5-hydroxylase, a multi-functional cytochrome P450-dependent monooxygenase. Proc. Natl. Acad. Sci. U.S.A. 96, 10045–10050.
Iiyama, K. and Wallis, A. F. A. (1990) Determination of lignin in herbaceous plants by an improved acetyl bromide procedure. J
Iiyama, K.; Lam, T. B., and Stone, B. A. (1994) Covalent cross-links in the cell wall. Plant Physiol. 104, 315–320.
Izydorczyk, M.S., and Biliaderis, C.G. (1995) Cereal arabinoxylans: advances in structure and physiochemical properties. Carbohydr. Polym. 28, 33–48.
Jacobs, A., and Dahlman, O. (2001) Characterization of the molar masses of hemicelluloses from wood and pulps employing size exclusion chromatography and matrix-sssisted laser desorption ionization time-of-flight mass spectrometry. Biomacromolecules. 2, 894–905.
Joseleau, J.-P. and Ruel, K. (1997) Study of lignification by noninvasive techniques in grow-ing maize internodes. Plant Physiol. 114, 1123–1133.
Karhunen, P., Rummakko, P., Sipilä, J., and Brunow, G. (1995) The formation of dibenzodi-oxocin structures by oxidative coupling. A model reaction for lignin biosynthesis. Tetra-hedron Lett. 36, 4501–4504.
Kärkönen, A., and Fry, S.C. (2006) Novel characteristics of UDP-glucose dehydrogenase activities in maize: non-involvement of alcohol dehydrogenases in cell wall polysaccha-ride biosynthesis. Planta 223, 858–870.
Kärkönen, A., Murigneux, A., Martinant, J.P., Pepey, E., Tatout, C., Dudley, B.J., and Fry, S.C. (2005) UDP-glucose dehydrogenases of maize: a role in cell wall pentose biosynthe-sis. Biochem. 391, 409–415.
Kim, C.M., Park, S.H., Il, J.B., Park, S.H., Piao, H.L., Eun, M.Y., Dolan, L., and Han, C.D. (2007) OsCSLD1, a cellulose synthase-like D1 gene, is required for root hair morphogene-sis in rice. Plant Physiol. 143, 1220–1230.
Kim, H., Ralph, J., Lu, F., Ralph, S.A., Boudet, A.M., MacKay, J.J., Sederoff, R.R., Ito, T., Kawai, S., Ohashi, H., and Higuchi, T. (2003) NMR analysis of lignins in CAD-deficient plants. Part 1. Incorporation of hydroxycinnamaldehydes and hydroxybenzaldehydes into lignins. Org. Biomol. Chem. 1, 268–281.
Kobayashi, M., Nakagawa, H., Suda, I., Miyagawa, I. and Matoh, T. (2002) Purification and cDNA cloning of UDP- -xylose sythase) from pea seedlings. Plant cell Physiol. 43, 1259–1265.
Koyama, M., Helbert, W., Imai, T., Sugiyama, J., Henrissat, B. (1997) Parallel-up structure evidences the molecular directionality during biosynthesis of bacterial cellulose. Proc. Natl. Acad. Sci. U.S.A. 94, 9091–9095.
Kühnl, T., Koch, U., Heller, W., and Wellmann, E. (1989) Elicitor induced S-adenosyl-L-methionine: caffeoyl-CoA 3-O-methyltransferase from carrot cell suspension. Plant Sci. 60, 21–25.
dd-glucuronate carboxy-lyase (UDP-
ournal of the Science of Food and Agriculture. J. Sci. Food Agric. 51, 145–161.

136 Vermerris Kurek, I., Kawagoe, Y., Jacob-Wilk, D., Doblin, M., Delmer, D. (2002) Dimerization of cot-
ton fiber cellulose synthase catalytic sub-units occurs via oxidation of the zinc-binding domains. Proc. Natl. Acad. Sci. U.S.A. 99, 11109–11114.
Lacombe, E., Hawkins, S., Van Doorsselaere, J., Piquemal, J., Goffner, D., Poeydomenge, O., Boudet, A.-M., and Grima-Pettenati, J. (1997) Cinnamoyl CoA reductase, the first com-mitted enzyme of the lignin branch biosynthetic pathway: cloning, expression and phy-logenetic relationships. Plant J. 11, 429–441.
Landucci, L.L., Deka, G.C., and Roy, D.N. (1992) A 13C NMR study of milled wood lignins from hybrid Salix clones. Holzforsch. 46, 505–511.
Langan, P., Sukumar, N., Nishiyama, Y., and Chanzy, H. (2005) Synchrotron X-ray structures of cellulose Iß and regenerated cellulose II at ambient temperature and 100 K. Cellulose 12, 551–562.
Lee, S., Sharma, Y., Lee, T.K., Chang, M., and Davis, K.R. (2001) Lignification induced by Pseudomonas harboring avirulent genes on Arabidopis. Mol. Cells 12, 25–31.
Leplé, J.-C., Dauwe, R., Morreel, K., Storme, V., Lapierre, C., Pollet, B., Naumann, A., Kang, K.-Y., Kim, H., Ruel, K., Lefebvre, A., Joseleau, J.-P., Grima-Pettenati, J., De Rycke, R., Andersson-Gunneras, S., Erban, A., Fehrie, I., Petit-Conil, M., Kopka, J., Polle, A., Mes-sens, E., Sundberg, B., Mansfield, S.D., Ralph, J., Pilate, G., and Boerjan, W. (2007). Down regulation of cinnamoyl-coenzyme A reductase in poplar: Multiple-level phenotyp-ing reveals effects on cell wall polymer metabolism and structure. Plant Cell 19, 3669–3691.
Li, L., Cheng, X.F., Leshkevich, J., Umezawa, T., Harding, S.A., and Chiang, V.L. (2001) The last step of syringyl monolignol biosynthesis in angiosperms is regulated by a novel gene encoding sinapyl alcohol dehydrogenase. Plant Cell 13, 1567–1585.
Li, Y., Kajita, S., Kawai, S., Katayama, Y., and Morohoshi, N. (2003a) Down-regulation of an anionic peroxidase in transgenic aspen and its effect on lignin characteristics. J. Plant Res. 116, 175–182.
Li, Y., Qian, Q., Zhou, Y., Yan, M., Sun, L., Zhang, M., Fu, Z., Wang, Y., Han, B., Pang, X., Chen, M., and Li, J. (2003b) BRITTLE CULM1, which encodes a Cobra-like protein, af-fects the mechanical properties of rice plants. Plant Cell 15, 2020–2031.
Liepman, A.H., Nairn, C.J., Willats, W.G.T., Sorensen, I., Roberts, A.W., and Keegstra, K. (2007) Functional genomic analysis supports conservation of function among cellulose synthase-likeA gene family members and suggests diverse roles of mannans in plants. Plant Physiol. 143, 1881–1893.
Liepman, A.H., Wilkerson, C.G., and Keegstra, K. (2005) Expression of cellulose synthase-like (Csl) genes in insect cells reveals that CslA family members encode mannan syn-thases. Proc Natl Acad Sci U.S.A. 102, 2221–2226.
Lim, E.K., Li, Y., Parr, A., Jackson, R., Ashford, D.A., and Bowles, D.J. (2001) Identification of glucosyltransferase genes involved in sinapate metabolism and lignin synthesis in Arabidopsis. J. Biol. Chem. 276, 4344–4349.
Lu, F., and Ralph, J. (1999) Detection and determination of p-coumaroylated units in lignin. J. Agric. Food Chem. 47, 1988–1992.
Lynch, D., Lidgett, A., McInnes, R., Huxley, H., Jones, E., Mahoney, N., and Spangenberg, G. (2002) Isolation and characterisation of three cinnamyl alcohol dehydrogenase homologue cDNAs from perennial ryegrass (Lolium perenne L.), J. Plant Physiol. 159.
MacKay, J.J., Liu, W., Whetten, R., Sederoff, R.R., and O'Malley, D.M. (1995) Genetic analysis of cinnamyl alcohol dehydrogenase in loblolly pine: single gene inheritance, mo-lecular characterization and evolution. Mol. Gen. Genet. 247, 537–545.

Composition and Biosynthesis of Lignocellulosic Biomass 137
MacKay, J.J., O'Malley, D.M., Presnell, T., Booker, F., Campbell, M.M., Whetten, R.W., and Sederoff, R.R. (1997) Inheritance, gene expression, and lignin characterization in a mutant pine deficient in cinnamyl alcohol dehydrogenase. Proc. Natl. Acad. Sci. U.S.A. 94, 8255–8260.
Madson, M., Dunand, C., Li, X., Verma, R., Vanzin, G.F., Caplan, J., Shoue, D.A., Carpita, N.C., and Reiter, W.D. (2003) The MUR3 gene of Arabidopsis encodes a xyloglucan ga-lactosyltransferase that is evolutionarily related to animal exostosins. Plant Cell 15, 1662–1670.
Maeda, Y.; Awano, T.; Takabe, K., and Fujita, M. (2000) Immunolocalization of glucoman-nans in the cell wall of differentiating tracheids in Chamaecyparis obtusa. Protoplasma B213, 148–156.
Marita, J., Vermerris, W., Ralph, J., and Hatfield, R.D. (2003) Variations in the cell wall composition of maize brown midrib mutants. J. Agric. Food Chem. 5, 1313–1321.
McDougall, G.J., Stewart, D., and Morrison, I.M. (1996) Tyrosine residues enhance cross-linking of synthetic proteins into lignin dehydrogenation products. Phytochem. Anal. 41, 43–47.
Mølhøj, M., Verma, R., and Reiter, W.D. (2003) The biosynthesis of the branched-chain sugar D-apiose in plants: functional cloning and characterization of a UDP-D -apiose/UDP-D-xylose synthase from Arabidopsis. Plant J. 35, 693–703.
Mølhøj, M., Verma, R., and Reiter, W.-D. (2004) The biosynthesis of D-galacturonate in plants. Functional cloning and characterization of a membrane-anchored UDP-D-glucuronate 4-epimerase from Arabidopsis. Plant Physiol. 135, 1221–1230.
Morreel, K., Ralph, J., Kim, H., Lu, F., Goeminne, G., Ralph, S., Messens, E., and Boerjan, W. (2004a) Profiling of oligolignols reveals monolignol coupling conditions in lignifying popular xylem. Plant Physiol. 136, 3537–3549.
Morreel, K., Ralph, J., Lu, F., Goeminne, G., Busson, R., Herdewijn, P., Goeman, J.L., Van der Eycken, J., Boerjan, W., and Messens, E. (2004b) Phenolic profiling of caffeic acid O-methyltransferase-deficient poplar reveals novel benzodioxane oligolignols. Plant Physiol. 136, 4023–4036.
Mueller, S.C., and Brown, Jr., R.M. (1980) Evidence for an intramembrane component associ-ated with a cellulose microfibril synthesizing complex in higher plants. J. Cell Biol. 84, 315–326.
Myton, K.E., and Fry, S.C. (1994) Intraprotoplasmic feruoylation of arabinoxylans in Festuca arundinacea cell cultures. Planta 193, 326–330.
Nair, R.B., Bastress, K.L., Ruegger, M.O., Denault, J.W., and Chapple, C. (2004) The Arabi-dopsis thaliana REDUCED EPIDERMAL FLUORESCENCE1 gene encodes an aldehyde dehydrogenase involved in ferulic acid and sinapic acid biosynthesis. Plant Cell 16, 544–554.
Nishitani, K., and Tominaga, R. (1992) Endo-xyloglucan transferase, a novel class of glyco-syltransferase that catalyzes transfer of a segment of xyloglucan molecule to another xy-loglucan molecule. J. Biol. Chem. 267, 21058–21064.
Nishiyama, Y., Langan, P., and Chanzy, H. (2002) Crystal structure and hydrogen-bonding system in cellulose Iß from synchrotron x-ray and neutron fiber diffraction. J. Am. Chem. Soc. 124, 9074–9082.
Nishiyama, Y., Sugiyama, J., Chanzy, H., and Langan, P. (2002) Crystal structure and hydro-gen bonding system in cellulose Iβ, from synchrotron X-ray and neutron fiber diffraction. J. Am. Chem. Soc. 124, 9074–9082.
Nishiyama, Y., Langan, P., and Chanzy, H. (2003) Crystal structure and hydrogen-bonding system in cellulose Iα from synchrotron X-rayand neutron fiber diffraction. J. Am. Chem. Soc. 125, 14300–14306.
Nelson, T., Tausta, S.L., Gandotra, N., and Liu, T. (2006) Laser microdissection of plant tissue: What you se is what you get. Ann. Rev. Plant Biol. 57, 181–201.

138 Vermerris Nobles, D.R., and Brown, Jr., M.R. (2004) The pivotal role of cyanobacteria in the evolution
of cellulose synthases and cellulose synthase-like proteins. Cellulose 11, 437–448. Oka, T., Nemoto, T., and Jigami, Y. (2007) Functional analysis of Aradibopsis thaliana
RHM2/MUM4, a multidomain protein involved in UDP-D-glucose to UDP-L-rhamnose conversion. J. Biol. Chem. 282, 5389–5403.
Okazawa, K., Sato, Y., Nakagawa, T., Asada, K., Kato, I., Tomita, E., and Nishitani, K. (1993) Molecular cloning and cDNA sequencing of endoxyloglucan transferase, a novel class of glycosltransferase that mediates molecular grafting between matrix polysaccha-rides in plant cell walls. J. Biol. Chem. 268, 25364–25368.
Osakabe, K., Tsao, C.C., Li, L., Popko, J.L., Umezawa, T., Carraway, D.T., Smeltzer, R.H., Joshi, C.P., and Chiang, V.L. (1999) Coniferyl aldehyde 5-hydroxylation and methylation direct syringyl lignin biosynthesis in angiosperms. Proc. Natl. Acad. Sci. U.S.A. 96, 8955–8960.
Pattathil, S., Harper, A.D., and Bar-Peled, M. (2005) Biosynthesis of UDP-xylose: characteri-zation of membrane-bound ATUXS2. Planta 221, 538–548.
Pear, J.R., Kawagoe, Y., Schreckengost, W.E., Delmer, D.P., and Stalker, D.M. (1996) Higher plants contain homologs of the bacterial celA genes encoding the catalytic subunit oif cel-lulose synthase. Proc. Natl. Acad. Sci. U.S.A. 93, 12637–12642.
Peña, M.J., Zhong, R., Zhou, G.-K., Richardson, E.A., O'Neill, M.A., Darvill, A.G., York, W.S., and Ye, Z.-H. (2007) Arabidopsis irregular xylem8 and irregular xylem9: implica-tions for the complexity of glucuronoxylan biosynthesis. Plant Cell 19, 549–563.
Perrin, R.M. (2001) Cellulose: how many cellulose synthases to make a plant? Curr. Biol. 11, R213–R216.
Perrin, R.M., DeRocher, A.E., Bar-Peled, M., Zeng, W., Norambuena, L., Orellana, A., Raik-hel, N.V., and Keegstra, K. (1999) Xyloglucan fucosytransferase, an enzyme involved in plant cell wall biosynthesis. Science 284, 1976–1979.
Persson, S., Paredez, A., Carroll, A., Palsdottir, H., Doblin, M., Poindexter, P., Khitrov, N., Auer, M., and Somerville, C.R. (2007) Genetic evidence for three unique components in primary cell-wall cellulose synthase complexes in Arabidopsis. Proc. Natl. Acad. Sci. U.S.A. 104, 15599–15571.
Philippe, S., Saulnier, L., and Guillon, F. (2006) Arabinoxylan and (1 → 3), (1 → 4)-ß-D-glucan deposition in cell walls during wheat endosperm development. Planta 224, 449–461.
Pillonel, C., Mulder, M.M., Boon, J.J., Forster, B., and Binder, A. (1991) Involvement of cinnamyl-alcohol dehydrogenase in the control of lignin formation in Sorghum bicolor L. Moench. Planta 185, 538–544.
Raes, J., Rohde, A., Christensen, J.H., Van de Peer, Y., and Boerjan, W. (2003) Genome-wide characterization of the lignification toolbox in Arabidopsis. Plant Pysiol. 133, 1051–1071.
Ralph, J. (1996) An unusual lignin from Kenaf. J. Nat. Prod. 59, 341–342. Ralph, J., Bunzel, M., Marita, J.M., Hatfield, R.D., Lu, F., Kim, H., Schatz, P.F., Grabber,
J.H., and Steinhart, H. (2004a) Peroxidase-dependent cross-linking reactions of p-hydroxycinnamates in plant cell walls. Phytochemistry Rev. 3, 79–96.
Ralph, J., Hatfield, R.D., Piquemal, J., Yahiaoui, N., Pean, M., Lapierre, C., and Boudet, A.M. (1998) NMR characterization of altered lignins extracted from tobacco plants down-regulated for lignification enzymes cinnamyl alcohol dehydrogenase and cinnamyl-CoA reductase. Proc. Natl. Acad. Sci. U.S.A. 95, 12803–12808.
Ralph, J., Kim, H., Lu, F., Grabber, J.H., Leplé, J.-C., Berrio-Sierra, J., Mir Derikvand, M., Jouanin, L., Boerjan, W., and Lapierre, C. (2008) Identification of the structure and origin of a thioacidolysis marker compound for ferulic acid incorporation into angiosperm lignins (and an indicator for cinnamoyl CoA reductase deficiency). Plant J. 53, 368–379.

Composition and Biosynthesis of Lignocellulosic Biomass 139
Ralph, J., Lapierre, C., Marita, J.M., Kim, H., Lu, F., Hatfield, R.D., Ralph, S., Chapple, C., Franke, R., Hemm, M.R., Van Doorsselaere, J., Sederoff, R.R., O'Malley, D.M., Scott, J.T., Mackay, J.J., Yahiaoui, N., Boudet, A.M., Pean, M., Pilate, G., Jouanin, L., and Boer-jan, W. (2001) Elucidation of new structures in lignins of CAD- and COMT-deficient plants by NMR. Phytochem. Anal. 57, 993–1003.
Ralph, J., Lundquist, K., Brunow, G., Lu, F., Kim, H., Schatz, P.F., Marita, J.M., Hatfield, R.D., Ralph, S.A., Christensen, J.H., and Boerjan, W. (2004b) Lignins: natural polymers from oxidative coupling of 4-hydroxyphenylpropanoids. Phytochemistry 3, 29–60.
Ralph, J., Peng, J., Lu, F., Hatfield, R.D., and Helm, R.F. (1999) Are lignins optically active? 47, 2991–2996.
Ralph, J., Quideau, S., Grabber, J.H., and Hatfield, R.D. (1994) Identification and synthesis of new ferulic acid dehydromers present in grass cell walls. J. Chem. Soc.. Perkin Trans. 1,23, 3485–3498.
Ranocha, P., Chabannes, M., Chamayou, S., Danoun, S., Jauneau, A., Boudet, A.M., and Goffner, D. (2002) Laccase down-regulation causes alterations in phenolic metabolism and cell wall structure in poplar. Plant Physiol. 129, 145–155.
Reiter, W.-D., Chapple, C., and Sommerville, C.R. (1997) Mutants of Arabidopsis thaliana with altered cell wall polysaccharide composition. Plant J. 12, 335–345.
Reiter, W.-D., Chapple, C.C.S., and Somerville, C.R. (1993) Altered growth and cell walls in a fucose-deficient mutant of Arabidopsis. Science 261, 1032–1035.
Reiter, W.-D. and Vanzin, G.F. (2001) Molecular genetics of nucleotide sugar interconversion pathways in plants. Plant Mol. Biol. 47, 95–113.
Richmond, T. (2000) Higher plant cellulose synthases. Genome Biol. 1,reviews 3001.1–3001.6.
Richmond, T.A., and Somerville, C.R. (2000) The cellulose synthase superfamily. J. Plant Physiol. 124, 495–498.
Robertson, D., Smith, C. and Bolwell, G. P. (1996) Inducible UDP-glucose dehydrogenase from French bean (Phaseolus vulgaris L.) locates to vascular tissue and has alcohol dehy-drogenase activity. Biochem. J. 313, 311–317.
Robinson, S., Warburton, K., Seymour, M., Clench, M., Thomas-Oates, J. (2007) Localization of water-soluble carbohydrates in wheat stems using imaging matrix-assisted laser desorp-tion ionization mass spectrometry. New Phytol. 173, 438–444.
Roesler, J., Krekel, F., Amrhein, N., and Schmid, J. (1997) Maize phenylalanine ammonia-lyase has tyrosine ammonia-lyase activity. Plant Physiol. 113, 175–179.
Rose, J.K., Braam, J., Fry, S.C., and Nishitani, K. (2002) The XTH family of enzymes in-volved in xyloglucan endotransglucosylation and endohydrolysis: Current perspectives and a new unifying nomenclature. Plant Cell Physiol. 43, 1421–1435.
Roudier, F., Fernandez, A.G., Fujita, M., Himmelspach, R., Borner, G.H.H., Schindelman, G., Song, S., Baskin, T.I., Dupree, P., and Wasteneys, G.O. (2005) COBRA, an Arabidopsis extracellular glycosyl-phosphatidyl inositolanchored protein, specifically controls highly anisotropic expansion through its involvement in cellulose microfibril orientation. Plant Cell 17, 1749–1763.
Roudier, F., Schindelman, G., DeSalle, R., and Benfey, P.N. (2002) The COBRA family of putative GPI-anchored proteins in Arabidopsis. A new fellowship in expansion. Plant Physiol. 130, 538–548.
Ruan, Y.-L., Llewellyn, D.J., and Furbank, R.T. (2003) Suppression of sucrose synthase gene expression represses cotton fiber cell initiation, elongation, and seed development. Plant Cell 15, 952–964.
Salnikov, V.V., Grimson, M.J., Delmer, D.P., and Haigler, C.H. (2001) Sucrose synthase localizes to cellulose synthesis sites in tracheary elements. Phytochem. 57, 823–833.

140 Vermerris Sarria, R., Wagner, T.A., O'Neill, M.A., Faik, A., Wilkerson, C.G., Keegstra, K., and Raikhel,
N.V. (2001) Characterization of a family of Arabidopsis genes related to xyloglucan fuco-syltransferase1. Plant Physiol. 127, 1595–1606.
Saxena, I.M., and Brown, Jr., R.M. (1995) Identification of a second cellulose synthase gene (acsAII) in Acetobacter xylinum. J. Bacteriol. 177, 1419.
Saxena, I.M., Brown, Jr. M.R., Fevre, M., Geremia, R.O., and Henrissat, B. (1995) Multido-main architecture of β-glycosyl transferases: Implications for mechanism of action. J. Bac-teriol. 177, 1419–1424.
Saxena, I.M., Lin, F.C. and Brown, Jr., R.M. (1990) Cloning and sequencing of the cellulose synthase catalytic subunit gene of Acetobacter xylinum. Plant. Mol. Biol. 15, 673–683.
Saxena, I.M., and Brown, Jr., R. M. (2005) Cellulose biosynthesis: Current views and evolv-ing concepts. Ann. Bot. 96, 9–21.
Scheible, W.-R., Eshed, R., Richmond, T., Delmer, D., and Somerville, C. (2001) Modifica-tions of cellulose synthase confer resistance to isoxaben and thiazolidinone herbicides in Arabidopsis ixr1 mutants. Proc. Natl. Acad. Sci. U.S.A. 98, 10079–10084.
Scheller, H.V., Jensen, J.K., Sorensen, S.O., Harholt, J., and Geshi, N. (2007) Biosynthesis of pectin. Physiol. Plant. 129, 283–295.
Schiefelbein, J.W., and Somerville, C.R. (1990) Genetic control of root hair development in Arabidopis thaliana. Plant Cell 2, 699–710.
Schoch, G., Goepfert, S., Morant, M., Hehn, A., Meyer, D., Ullmann, P., and Werck-Reichhart, D. (2001) CYP98A3 from Arabidopsis thaliana is a 3'-hydroxylase of phenolic esters, a missing link in the phenylpropanoid pathway. J. Biol. Chem. 276, 36566–36574.
Schubert, R., Sperisen, C., Müller-Starck, G., La Scala, S., Ernst, D., Sandermann, Jr., H., and Häger, K.-P. (1998) The cinnamyl alcohol dehydrogenase gene structure in Picea abies (L.) Karst.: genomic sequences, Southern hybridization, genetic analysis and phylogenetic relationships. Trees 12, 453–463.
Seifert, G.J. (2004) Nucleotide sugar interconversions and cell wall biosyntthesis: how to bring the inside to the outside. Curr. Opin. Plant Biol. 7, 277–284.
Seifert, G.J., Barber, C., Wells, B., Dolan, L., and Roberts, K. (2002) Galactose biosynthesis in Arabidopsis: genetic evidence for substrate channeling from UDP-D-galactose into cell wall polymers. Curr. Biol. 12, 1840–1845.
Sewalt, V.J.H., Ni, W., Blount, J.W., Jung, H.G., Masoud, S.A., Howes, P.A., Lamb, C., and Dixon, R.A. (1997) Reduced lignin content and altered lignin composition in transgenic tobacco down-regulated in expression of L-phenylalanine ammonia-lyase or cinnamate 4-hydroxylase. Plant Physiol. 115, 41–50.
Sibout, R., Eudes, A., Pollet, B., Goujon, T., Mila, I., Granier, F., Seguin, A., Lapierre, C., and Joouanin, L. (2003) Expression pattern of two paralogs encoding cinnamyl alcohol dehy-drogenases in Arabidopsis. Isolation and characterization of the corresponding mutants. Plant Physiol. 132, 848–860.
Sindhu, A., Langewisch, T., Olek, A., Multani, D.S., McCann, M.C., Vermerris, W., Carpita, N.C., and Johal, G. (2007) Maize Brittle stalk2 encodes a COBRA-like protein expressed in early organ development but required for tissue flexibility at maturity. Plant Physiol. 145, 1444–1459.
Smith R.C., and Fry S.C. (1991) Endotransglycosylation of xyloglucans in plantcell-suspension cultures. Biochem. J. 279, 529–535.
Somerville, C., Bauer, S., Brininstool, G., Facette, M., Hamann, T., Milne, J., Osborne, E., Parezdez, A., Persson, S., Raab, T., Vorwerk, S., and Youngs, H. (2004) Towards a sys-tems approach to understanding plant cell walls. Science 306, 2206–2211.
Somerville, C. R. (2006) Cellulose synthesis in higher plants. Annu. Rev. Cell Dev. Biol. 22, 53–78.

Composition and Biosynthesis of Lignocellulosic Biomass 141
Sterjiades, R., Dean, J.F.D., Gamble, G., Himmelsbach, D.S., and Eriksson, K.-E.L. (1993) Extracellular laccase and peroxidases from sycamore maple (Acer pseudoplatanus) cell suspension cultures. Reactions with monolignols and lignin model compounds. Planta 190, 75–87.
Šturcová, A., His, I., Apperley, D.C., Sugiyama, J., Jarvis, M.C. (2004) Structural details of crystalline cellulose from higher plants. Biomacromolecules 5, 1333–1339.
Suzuki, K., Kitamura, S., Kato, Y., and Itoh, T., (2000) Highly substituted glucuronoarabi-noxylans (hsGAXs) and low-branched xylans show a distinct localization pattern in the tissues of Zea may L. Plant Cell Physiol. 41, 948–959.
Syrjanen, K., and Brunow, G. (2000) Regioselectivity in lignin biosynthesis: the influence of dimerization and crosscoupling. J. Chem. Soc. Perkin. Trans. I 1, 183–187.
Tanaka, K., Murata, K., Yamazaki, M., Onosato, K., Miyao, A., and Hirochika, H. 2003. Three distinct rice cellulose synthase catalytic sub-unit genes required for cellulose syn-thesis in the secondary wall. Plant Physiol. 133: 73–83.
Taylor, N. G., Scheible, W. R., Cutler, S., Somerville, C. R., and S. R. Turner, (1999) The irregular xylem3 locus of Arabidopsis encodes a cellulose synthase required for secondary cell wall synthesis. Plant Cell 11, 769–779.
Taylor, N.G., Howells, R.M., Huttly, A.K., Vickers, K., and Turner, S.R. (2003) Interactions among three distinct CesA proteins essential for cellulose synthesis. Proc. Natl. Acad. Sci. U.S.A. 100, 1450–1455.
Taylor, N.G., Laurie, S., and Turner, S.R. (2000) Multiple cellulose synthase catalytic subunits are required for cellulose synthesis in Arabidopsis. Plant Cell 12, 2529–2539.
Terashima, N., Atalla, R.H., Ralph, S.A., Landucci, L.L., Lapierre, C., and Monties, B. (1996) New preparations of lignin polymer models under conditions that approximate cell well lignification: I. Synthesis of novel lignin polymer models and their structural characteriza-tion by 13C NMR. Holzforsch. 49, 521–527.
Terashima, N., Fukushima, K., He, L.-F., and Takabe, K. (1993) Comprehensive model of the lignified plant cell wall. In: H.G. Jung, D.R. Buxton, R.D. Hatfield, and J. Ralph (Eds.), Forage cell wall structure and digestibility. Madison, WI, ASA-CSSA-SSSA, pp. 247–270.
Timell, T.E. (1967) Recent progress in the chemistry of wood hemicelluloses. Wood Sci. Technol. 1, 45–70.
Tobias, C.M., and Chow, E.K. (2005) Structure of the cinnamyl-alcohol dehydrogenase gene family in rice and promoter activity of a member associated with lignification. Planta 220, 678–688.
Toole, G.A., Wilson, R.H., Parker, M.L., Wellner, N.K., Wheeler, T.R., Shewry, P.R., and Mills, E.N.C. (2007) The effect of environment on endosperm cell-wall development in Triticum aestivum during grain filling: an infrared spectroscopic imaging study. Planta 225, 1393–1403.
Usadel, B., Kuschinsky, A.M., Rosso, M.G., Eckermann, N., and Pauly, M. (2004) RHM2 Is involved in mucilage pectin synthesis and is required for the development of the seed coat in Arabidopsis. Plant Physiol. 134, 286–295.
Vanzin, G.F., Madson, M., Carpita, N.C., Raikhel, N.V., Keegstra, K., and Reiter, W.D. (2002) The mur2 mutant of Arabidopsis thaliana lacks fucosylated xyloglucan because of a lesion in fucosyltransferase AtFUT1. Proc. Natl. Acad. Sci. U.S.A. 99, 3340–3345.
Vermerris, W., and Nicholson, R. (2006) Phenolic Compound Biochemistry. Springer, Dordrecht, The Netherlands, 276 pp.
Vermerris, W., Thompson, K.J., and McIntyre, L.M. (2002) The maize Brown midrib1 locus affects cell wall composition and plant development in a dose-dependent manner. Heredity 88, 450–457.

142 Vermerris Vietor, R.J., Newman, R.H., Ha, M.A., Apperley, D.C., and Jarvis, M.C. (2002) Conforma-
tional features of crystal-surface cellulose from higher plants. Plant J. 30, 721–731. Vignols, F., Rigau, J., Torres, M.A., Capellades, M., and Puigdomenech, P. (1995) The
brown-midrib3 (bm3) mutation in maize occurs in the gene encoding caffeic acid O-methyl transferase. Plant Cell 7, 407–416.
Wang, X., Cnops, G., Vanderhaeghen, R., De Block, S., Van Montagu, M., and Van Lijsebet-tens, M. (2001) AtCSLD3, a cellulose synthase-like gene important for root hair growth in Arabidopsis. Plant Physiol. 126, 575–586.
Wegenmayer, H., Ebel, J., and Grisebach, H., (1976) Enzymic synthesis of lignin precursors: purification and properties of a cinnamoyl-CoA: NADPH reductase from cell suspension cultures of soybean (Glycine max L.), Eur. J. Biochem. 65, 529–536.
Wolucka, B.A., Persiau, G., Van Doorsselaere, J., Davey, M.W., Demol, H., Vandekerckhove, J., Van Montagu, M., Zabeau, M., and Boerjan, W. (2001) Partial purification and identifi-cation of GDP-mannose 3, 5-epimerase of Arabidopsis thaliana, a key enzyme of the plant vitamin C pathway. Proc. Natl. Acad. Sci. U.S.A. 98, 14843–14848.
Wu, Y., Sharp, R.E., Durachko, D.M., and Cosgrove, D.J. (1996) Growth maintenance of the maize primary root at low water potentials involves increases in cell-wall extension prop-erties, expansin activity, and wall susceptibility to expansins. Plant Physiol. 111, 765–772.
Ye, Z.-H., Kneusel, R.E., Matern, U., and Varner, J.E. (1994) An alternative methylation pathway in lignin biosynthesis in Zinnia. Plant Cell 6, 1427–1439.
Yennawar, N.H., Li, L.C., Dudzinski, D.M., Tabuchi, A., and Cosgrove, D.J. (2006) Crystal structure and activities of EXPB1 (Zea m 1), a ß-expansin and group-1 pollen allergen from maize. Proc. Natl. Acad. Sci. U.S.A. 103, 14664–14671.
Yong, W., Link, B., O'Malley, R., Tewari, J., Hunter, C.T., Lu, C.A., Li, X., Bleecker, A.B., Koch, K.E., McCann, M.C., McCarty, D.R., Staiger, C., Thomas, S.R., Vermerris, W., and Carpita, N.C. (2005) Genomics of plant cell wall biogenesis. Planta 221, 747–751.
Zablackis, E., Huang, J., Muller, B., Darvill, A.G., and Albersheim, P. (1995) Characterization of the cell-wall polysaccharides of Arabidopsis thaliana leaves. Plant Physiol. 107, 1129–1138.
Zhong, R., Peña, M.J., Zhou, G.-K., Nairn, C.J., Wood-Jones, A., Richardson, E.A., Morrison, III W.H., Darvill, A.G., York, W.S., and Ye, Z.-H. (2005) Arabidopsis fragile fiber8, which encodes a putative glucuronyltransferase, is essential for normal secondary wall synthesis. Plant Cell 17, 3390–3408.
Zugenmaier, P. (2001) Conformation and packing of various crystalline cellulose fibers. Prog. Polym. Sci. 26, 1341–1417.

5 Selection of Promising Biomass Feedstock Lines Using High-Throughput Spectrometric and Enzymatic Assays
Mark F. Davis,1 Ed Wolfrum1 and Tina Jeoh2
1 National Bioenergy Center, National Renewable Energy Laboratory, Golden, CO 80401, [email protected]
2 GeoSynFuels, LLC, Golden, CO 80401
5.1 Introduction
Development of high-quality, dedicated biomass feedstocks requires an understand-ing of the chemical, anatomical and physical traits of plants that make biomass more amenable to chemical and biological processing. The availability of sequenced plant genomes, such as Arabidopsis, rice, and Populus, helps create the genomic resources needed to improve biomass characteristics so that they become more amenable to conversion for fuels and chemicals in future biorefineries. The need for high-throughput/high-information assays increases when one con-siders that multiple pretreatment options and multiple bioconversion organisms are expected to be developed in the future. High-throughput cell wall chemistry determi-nations, as described in this chapter, that can be easily integrated with high through-put bioconversion assays are essential. Ideally, these same methodologies will be able to determine chemical composition in pretreated materials and bioconversion residues.
5.2 Integrating Spectroscopy and Multivariate Statistical Data Analysis for High-Throughput Cell Wall Chemical Analysis
Biomass composition can have a significant impact on pretreatment and bioconver-sion. Increasing amounts of a major component such as cellulose (higher glucose yield), lignin (higher heating value) or other composition factors may be important. For example, during dilute acid pretreatment, the ratio of syringyl/guaiacyl lignin monomers (S/G ratio) and lignin content has an effect on xylose release (Davison et al. 2006). Other studies have established that lignin content before dilute acid
W. Vermerris (ed.), Genetic Improvement of Bioenergy Crops, DOI: 10.1007/978-0-387-70805-8_5, © Springer Science+Business Media, LLC 2008

144 Davis, Wolfrum and Jeoh
Improving the accessibility of cellulose to cellulase enzymes is an important aspect of modifying secondary cell wall structure. Biomass characteristics that act as barriers to biodegradation include hemicellulose content (Kim et al. 2003), lignin content (Draude et al. 2001), lignin composition (Davison et al. 2006), and cellulose morphology (Hayashi et al. 1997). In the secondary cell wall, hemicelluloses are thought to associate tightly with celluloses, thus possibly impeding enzyme access to the cellulose (Knappert et al. 1980; Irwin et al. 2003). Hemicelluloses are also thought to form rigid bridges between neighboring cellulose microfibrils, which prevent the association of the microfibrils to larger fibrils and limit cellulose accessi-bility (Duchesne et al. 2001). The amount of lignin contained in the wood cell wall may also influence the accessibility of the cellulose fraction to the cellulolytic en-zymes. The composition of the lignin fraction, specifically the S/G ratio, has been implicated in pulping ease and biodegradability of woody biomass, where a lower ratio of syringyl lignin is more favorable (Davison et al. 2006). Identifying the chemical changes occurring at a cellular level in heterogeneous biomass materials will increase our understanding of the chemical reactions needed to (1) improve pretreatment process and (2) design cell walls with traits that are more amenable to biomass conversion. Most spectroscopic methods can be used for phenotyping. When combined with multivariate statistical analysis, these methods can be used to detect altered pheno-types that are invisible to the human eye (McCann and Carpita 2005). In general, spectral fingerprints provide information related to global metabolic or chemical changes in a group of samples (Gidman et al. 2003). Libraries of spectral phenotypes can be created based on the analysis of genetic variants and mutants with known chemical composition. These can be used to assign putative gene function based on spectral signatures. Spectroscopic analysis methods, while powerful, are limited due to the cell wall chemistry measurements. These measurements require that a calibra-tion data set be created using traditional analytical methods. The sample chemistry must lie within the boundaries of the established population in order to accurately measure chemical composition. As such, calibrations or spectral signatures must be developed for all possible circumstances. Multivariate statistical techniques are typically used for the analysis of spectro-scopic data. These techniques roughly fall into two categories: classification and calibration. The goal of multivariate classification techniques is the classification, or sorting, of samples into discrete categories based on differences in the spectra. For classification, no knowledge of the chemistry or biology of the samples under study is necessary. The goal of multivariate calibration techniques is the prediction of one or more specific chemical or physical properties of a sample based on its spectrum. Such predictions require the correlation of spectral features with compositional in-formation derived from traditional analytical techniques. General descriptions of
pretreatment has a significant effect on glucan conversion to ethanol (Vinzant et al. 1997). Numerous factors, including chemical composition, can affect enzymatic conversion after pretreatment (Yang and Wyman 2004; Laureano-Perez et al. 2005) including the removal of cell wall components such as xylan, which affect enzyme binding after acid hydrolysis (Jeoh et al. 2007). Recently, Chen and Dixon (2007) showed that lignin modification can affect the yields of fermentable sugars.
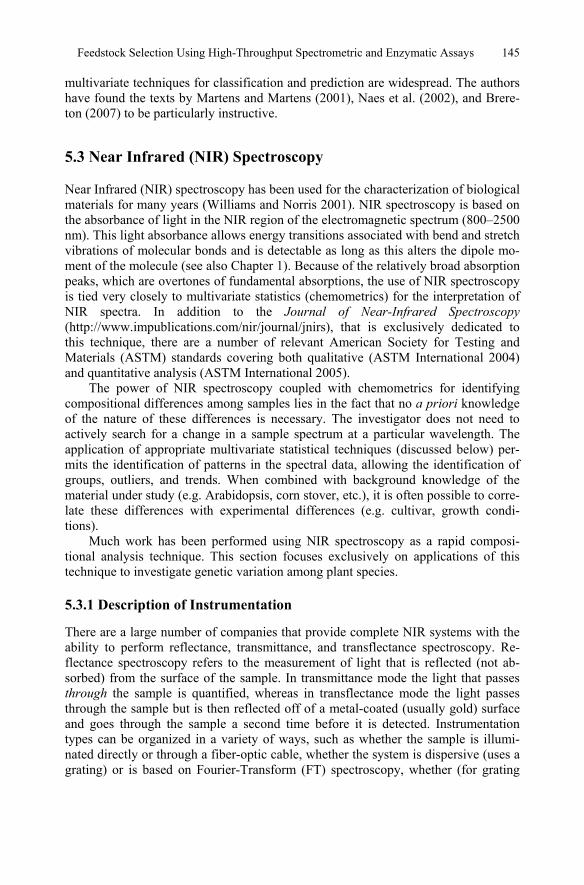
Feedstock Selection Using High-Throughput Spectrometric and Enzymatic Assays 145
multivariate techniques for classification and prediction are widespread. The authors have found the texts by Martens and Martens (2001), Naes et al. (2002), and Brere-ton (2007) to be particularly instructive.
5.3 Near Infrared (NIR) Spectroscopy
Near Infrared (NIR) spectroscopy has been used for the characterization of biological materials for many years (Williams and Norris 2001). NIR spectroscopy is based on the absorbance of light in the NIR region of the electromagnetic spectrum (800–2500 nm). This light absorbance allows energy transitions associated with bend and stretch vibrations of molecular bonds and is detectable as long as this alters the dipole mo-ment of the molecule (see also Chapter 1). Because of the relatively broad absorption peaks, which are overtones of fundamental absorptions, the use of NIR spectroscopy is tied very closely to multivariate statistics (chemometrics) for the interpretation of NIR spectra. In addition to the Journal of Near-Infrared Spectroscopy (http://www.impublications.com/nir/journal/jnirs), that is exclusively dedicated to this technique, there are a number of relevant American Society for Testing and Materials (ASTM) standards covering both qualitative (ASTM International 2004) and quantitative analysis (ASTM International 2005). The power of NIR spectroscopy coupled with chemometrics for identifying compositional differences among samples lies in the fact that no a priori knowledge of the nature of these differences is necessary. The investigator does not need to actively search for a change in a sample spectrum at a particular wavelength. The application of appropriate multivariate statistical techniques (discussed below) per-mits the identification of patterns in the spectral data, allowing the identification of groups, outliers, and trends. When combined with background knowledge of the material under study (e.g. Arabidopsis, corn stover, etc.), it is often possible to corre-late these differences with experimental differences (e.g. cultivar, growth condi-tions). Much work has been performed using NIR spectroscopy as a rapid composi-tional analysis technique. This section focuses exclusively on applications of this technique to investigate genetic variation among plant species.
5.3.1 Description of Instrumentation
There are a large number of companies that provide complete NIR systems with the ability to perform reflectance, transmittance, and transflectance spectroscopy. Re-flectance spectroscopy refers to the measurement of light that is reflected (not ab-sorbed) from the surface of the sample. In transmittance mode the light that passes through the sample is quantified, whereas in transflectance mode the light passes through the sample but is then reflected off of a metal-coated (usually gold) surface and goes through the sample a second time before it is detected. Instrumentation types can be organized in a variety of ways, such as whether the sample is illumi-nated directly or through a fiber-optic cable, whether the system is dispersive (uses a grating) or is based on Fourier-Transform (FT) spectroscopy, whether (for grating

146 Davis, Wolfrum and Jeoh systems) the light source is dispersed before or after interacting with the sample (pre-dispersive vs. post-dispersive), and whether the grating is fixed or movable. In addi-tion, each type has its own advantages and disadvantages, and it is not the purpose of this chapter to suggest which instrument would be most appropriate for a given application. The major manufacturers of NIR instrumentation include Analytical Spectral Devices (Boulder, CO), FOSS (Hillerød, Denmark), Thermo (formerly Perkin-Elmer; Waltham, MA), Perten (Springfield, IL), Brimrose (Baltimore, MD), Shimadzu (Kyoto, Japan) , Polychromix (Wilmington, MA), Carl Zeiss (Oberko-chen, Germany) and Büchi (Flawil, Switzerland). Most of these instruments include dedicated software for performing multivariate statistical analyses, but stand-alone packages are available including Unscrambler (Camo; Oslo, Norway), PLS_Toolbox, (Eigenvector research, Inc.; Wenatchee, WA), Pirouette (Infometrix; Inc.; Bothell, WA), SIMCA-P (Umetrics AB; Umeå, Sweden), SAS (SAS, Inc.; Research Traingle Park, NC), SPSS (SPSS, Inc.; Chicago, IL), and S-Plus (Insight-ful; Seattle, WA). In addition, a number of packages for the open-source statistical software R are available. One important advantage of NIR spectroscopy is that minimal sample prepara-tion is necessary. Samples are typically milled to 1–2 mm so that the reflectance spectrum is representative of the composition as opposed to the texture, and then dried to minimize the impact of absorption bands from water. Samples are some-times extracted prior to analysis. This extraction step adds time to the analysis pro-cedure but can often be helpful in differentiating between structural and nonstruc-tural variations. There is a wide variety of sample presentation strategies, with some instruments including a device to reproducibly hold and present the sample, while others require the user to address sample presentation issues. High-throughput sample analysis can be achieved by combining NIR spectroscopy with suitable laboratory robotics sys-tems.
5.3.2 Applications and Results
In the following two sections, we first discuss multivariate analysis techniques used for classification and predictions and then discuss applications of NIR spectroscopy coupled with these techniques relevant to biomass feedstocks.
5.3.2.1 Qualitative Data Analysis (Classification)
The most widely used multivariate classification technique is principal component analysis (PCA). This statistical method relies on the projection of data points on a new set of (orthogonal) axes that were defined in such a way that variation between groups is maximized, while variation within groups is minimized. Background on PCA and other multivariate statistical techniques, such as discriminant analysis and partial least squares (PLS), is provided by Martens and Martens (2001), Naes et al. (2002), and Brereton (2007). PCA can dramatically reduce the dimensionality of the spectral data. This is achieved by defining a small set (<10) of new variables that are linear combinations of correlated original variables (absorbance at a given wave-

Feedstock Selection Using High-Throughput Spectrometric and Enzymatic Assays 147
length). The data can be visualized in a PCA score plot in which the calculated val-ues for (typically) two principal components (PCs) are plotted for a group of sam-ples. The basis for the separation of the samples can be determined based on a so-called PC loading, which displays the importance of individual variables that con-tribute to a given PC. Variables with positive coefficients are positively correlated, and are negatively correlated with variables that have negative coefficients. Thus, PCA is able to identify subtle differences in the NIR spectra that are impossible to distinguish visually. For example, Munck et al. (2001) used transmittance and reflec-tance NIR spectroscopy to discriminate among barleys with and without a specific gene coding for high lysine content (lys3a). They demonstrated that PCA of NIR spectra could not only discriminate between the two lines, but could also identify which barleys were grown in the field and which were grown in a greenhouse. This illustrates that no a priori knowledge of the sample spectra was necessary. The au-thors attempted to assign compositional differences among the samples (measured using conventional analytical methods) to specific differences in the NIR spectra. Subsequent work by this group (Munck et al. 2004) used these same techniques to differentiate among different barley mutants. Recent work by Xie et al. (2007) investigated the ability to discriminate between non-transgenic and transgenic tomato plants using NIR scans of whole fruit. They used PCA, discriminant analysis (DA, using Mahalanobis distance), and partial-least-squares discriminant analysis (PLS-DA) of whole-fruit NIR scans. They inves-tigated a variety of spectral pretreatment methods prior to classification and showed that all three techniques could successfully classify samples.
5.3.2.2 Quantitative Data Analysis (Prediction)
The use of NIR spectroscopy for the prediction of physical or chemical properties of transgenic materials requires the use of a primary calibration standard. The utility of this method is that once the calibration equation is developed, it is possible not only to identify outliers in future populations, but also to determine whether the outlier is abnormally high or low in composition of the constituent of interest. The previously mentioned work of Munck et al. (2001) also demonstrated the use of PLS to predict protein and amide content and the amide/nitrogen ratio from the NIR spectra of mutant barley seeds. These properties were measured independ-ently using traditional wet chemistry methods. They built PLS models both from the full NIR spectra and also from subsets or intervals of the full spectra, but saw no significant difference between the models. Yamada et al. (2006) used transmittance NIR spectroscopy of acetone-extracted and pelletized stem wood samples of transgenic aspen trees to predict Klason total lignin, lignin S/G ratio, cellulose, and xylan content, again measured independently using traditional wet chemistry methods. The authors were unable to develop suit-able correlations with thin wafers of the extracted stem wood samples due to insuffi-cient signal intensity of the transmittance spectra. Alves et al. (2006) used NIR spec-troscopy to build a model for the p-hydroxyphenyl/guaiacyl (H/G) ratio in the wood of maritime pine (Pinus pinaster Ait.) .The H/G ratios were determined using ana-lytical pyrolysis (see Section 5.3 of this chapter). In this work, the authors extracted

148 Davis, Wolfrum and Jeoh the pinewood samples with water and acetone prior to both analytical pyrolysis and NIR spectroscopy. In another study of transgenic and non-transgenic tomato plants, Xie et al. (2007) correlated NIR spectral scans of freshly-picked tomato-plant leaves with spectroscopic measurements of chlorophyll content, independently measured using a commercial absorption-based chlorophyll meter. They demonstrated the ability to predict the chlorophyll content of the leaves using NIR spectroscopy and also dem-onstrated the ability to classify transgenic and non-transgenic plants using PLS-DA of the NIR spectra. No sample pretreatment was performed prior to NIR analysis
5.4 Pyrolysis-Molecular Beam-Mass Spectrometry
Mass spectrometry is a fast technique to identify pure compounds or to analyze the composition of complex mixtures. Mass spectrometry has high sensitivity and the added advantage of high specificity. The method relies on the generation of ions followed by the separation of these ions in an electromagnetic field based on the mass-to-charge (m/z) ratio of the ions (Wood 2006). Mass spectrometry is a power-ful method for analyzing plant cell wall chemistry and biopolymer structure (Meuzelaar et al. 1974, 1982, 1984; Hartley and Haverkamp 1984; Boon et al. 1986; Evans and Milne 1987; Aries et al. 1988; Simmleit and Schulten 1989; Faix et al. 1992). MALDI-TOF techniques (MALDI-TOF: matrix assisted laser desorption ionization – time of flight) can be used to determine lignin and hemicellulose struc-ture (Jacobs et al. 2002, 2003; Lerouxel et al. 2002; Reale et al. 2004). Analytical pyrolysis – the controlled thermal degradation of polymers or mix-tures of compounds under anoxic conditions – responds to changes in molecular and cellular structure and metabolite levels and has been successfully used to classify microbes and other unicellular organisms (Goodacre 1994; Smedsgaard and Frisvad 1996; Goodacre et al. 1998; Van Baar 2000). Pyrolysis combined with gas chroma-tography and mass spectrometry (PyGCMS) has been used to measure lignin content and determine changes in lignin structure in biomass materials (Martin et al. 1979; Obst 1983; Faix, et al. 1994; Izumi et al. 1995; Terron et al. 1995; Ohi et al. 1997; Del Rio et al. 2001; Greenwood et al. 2002; Rodrigues et al. 2001; Sonoda et al. 2001). Pyrolysis, in combination with molecular beam mass spectroscopy (PyMBMS) has been used to determine the composition of herbaceous materials by monitoring the wood decay (Agblevor et al. 1994; Kelley et al. 2002, 2004). PyMBMS will be described in more detail in the next section.
5.4.1 Description of Instrumentation
Our laboratory has developed a rapid, reliable, high throughput analysis by coupling a commercially available pyrolyzer and autosampler (Frontier LTD) with a custom-built molecular beam mass spectrometer that is capable of analyzing 48 plant sam-ples per hour. Cell wall chemistry analysis is performed on ~4 mg of plant material (sample sizes down to 0.1 mg can be analyzed if needed). The system does not sepa-rate individual components using chromatography but collects the total ion current so

Feedstock Selection Using High-Throughput Spectrometric and Enzymatic Assays 149
that all the chemical information is contained in a single mass spectrum to increase throughput. The pyrolysis mass spectra provide a fingerprint of the cell wall chemis-try that can be used to obtain quantitative chemical information. Mass spectral data analysis comprises the following methods: (1) using multivariate statistical methods to select cell wall chemistry phenotypes that significantly differ from cell wall chem-istry of controls, (2) developing PLS calibrations for well-characterized materials for which traditional wet chemical analyses are available (3) estimating changes in con-centration or structure of cell wall components from peak intensities.
Ground samples (~4 mg) are weighed into stainless steel sample cups and pyro-lyzed at 500°C using helium carrier gas flowing at 2.0 L/min (at standard tempera-ture and pressure). The transfer line connecting the pyrolysis unit to the molecular beam mass spectrometer (MBMS) is heated to approximately 300°C. The pyrolysis vapors are expanded through a 400 micron ruby sampling orifice that is mated di-rectly to the faceplate of the MBMS. Mass spectral data from m/z 30 to 450 are ac-quired using 22.5 eV electron impact ionization (1 eV = 1.6 10–19 J). Using this sys-tem, both light gases and heavy tars are sampled simultaneously and in real time. The mass spectrum of the pyrolysis vapor provides a rapid, semi-quantitative depic-tion of the molecular fragments.
Fig. 5.1. Principal component 1 (PC1) versus principal component 2 (PC2) scatter plot of lignin variability as a function of distance from the pith for 7 hybrid poplars. Values connected by lines represent technical replicates of the same sample and indicate the typical error of the pyrolysis vapor MBMS analysis.
Chemical phenotypes are sensitive to sampling methodology. We have investi-gated several sampling methods including whole-stem segments of smaller trees and plants, leaf punches from herbaceous and woody plants, and increment cores of older trunks that are ground and homogenized before taking a representative sample. Mul-
-4
-3
-2
-1
0
1
2
3
-5 -4 -3 -2 -1 0 1 2 3 4 5
PC1
PC2
Ring 1Ring 2Ring 3Ring 4Ring 5Ring 6Ring 7
Decreasing LigninDecreasing Lignin

150 Davis, Wolfrum and Jeoh tiple ramets of transgenic lines have been analyzed to assess plant-to-plant variability and environmental effects on cell wall chemistry traits in poplar and Eucalyptus. A study on the chemical composition variability in Populus revealed that less variation in lignin content occurs when sampled as a function of tree height compared to the amount of variation from the pith to the bark. Figure 5.1 shows the plot of the PC1 vs. PC2 scores of the pyrolysis vapor mass spectra showing a higher lignin content in the earlier growth years, which levels out after year three. Lignin values determined directly from peak intensity mass spectra showed that the variation in lignin content was ~ 4% across the stem. The S/G ratio measured from the pyrolysis spectra reached a maximum in the third year (data not shown). No apparent association between diameter of the tree and variation in lignin content was found for different heights or rings. Changes in lignin content and structure indicate a possible change in cell wall chemistry as the plant transitions from the juvenile to mature phase.
5.4.2 Applications and Results
In the following sections, we will discuss a number of applications of pyrolysis mo-lecular beam mass spectrometry for the investigation of biomass feedstocks, consid-ering both quantitative and qualitative applications.
5.4.2.1 Estimates of Lignin Composition and Structure
Methods have been developed to measure lignin content in hardwoods and to deter-mined the abundance of syringyl and guaiacyl monomers directly from the peak intensities in the mass spectra. Figure 5.2. shows the pyMBMS spectra of two hybrid poplar trees with different S/G ratios (as determined using thioacidolysis). The spec-trum shown in Fig. 5.2A is from a Populus trichocarpa × Populus deltoides clone with a measured S/G ratio of 2.5, whereas the spectrum shown in Fig. 5.2B is from a P. deltoides × P. nigra clone with a measured S/G ratio of 1.1. The pyrolysis mass spectrum of hardwoods contains unique peaks that can be assigned to syringyl and guaiacyl lignin units. Some of these assigned peaks arising from lignin are shown in Table 5.1 (Boon et al. 1987; Evans and Milne 1987; Meuzelaar et al. 1982). Close examination of the spectra shown in Figs. 5.2A and 5.2B indicates that the peaks assigned to syringyl units in Table 5.1 are more intense in the spectrum of the hybrid poplar wood with an S/G ratio 2.5 than the sample with an S/G ratio of 1.1. The intensity of m/z 124, 137, 138, 150, 164 and 178 was summed to estimate the number of guaiacyl monomers and m/z 154, 167, 168, 182, 194 and 210 summed to estimate the number of syringyl monomers of the lignin. Using this method to estimate the S/G ratio, a correlation of 0.89 was found between thioacidolysis S/G values and the ratio of the summed intensities. S/G ratios can be determined in min-utes to screen hundreds of transgenic samples in a day as shown in Fig. 5.2C. Similar protocols estimate lignin content in both hardwoods and softwoods.

Feedstock Selection Using High-Throughput Spectrometric and Enzymatic Assays 151
Fig. 5.2. Use of analytical pyrolysis to rapidly determine lignin content and composition in the cell walls of natural hybrids and transgenics A. Total ion current mass spectrum of a P. tricho-carpa × P. deltoides wood sample with an S/G ratio of 2.5. B. Total ion current mass spectrum of a P. deltoides × P.nigra wood sample with an S/G ratio of 1.1. C. Estimated S/G ratios in wood samples from a population of transgenic poplars. Two untransformed controls are in-cluded to illustrate the natural S/G ratio. Analytical pyrolysis can determine the S/G ratios of ~45 samples per hour.
0 100 200 300m/z
0 100 200 300m/z
S/G=2.5
S/G=1.1 00.5
11.52
2.53
3.54
pyM
BM
S es
timat
ed S
/G ra
tio
Controls transgenic poplar lines
A
B
C
0 100 200 300m/z
0 100 200 300m/z
S/G=2.5
S/G=1.1 00.5
11.52
2.53
3.54
pyM
BM
S es
timat
ed S
/G ra
tio
Controls transgenic poplar lines
0 100 200 300m/z
0 100 200 300m/z
S/G=2.5
S/G=1.1 00.5
11.52
2.53
3.54
pyM
BM
S es
timat
ed S
/G ra
tio
Controls transgenic poplar lines
A
B
C
m/z Assignment Precursor 94 phenol H, S, G
120 vinylphenol H 124 guaiacol G 137 ethylguaiacol, homovanillin, coniferyl
alcohol G
138 methylguaiacol G 150 vinylguaiacol G 154 syringol S 164 allyl-+propenyl guaiacol G 167 ethylsyringol, syringylacetone,
propiosyringone S
168 4-methyl-2,6-dimethoxyphenol S 178 coniferyl aldehyde G 180 coniferyl alcohol, syringylethene S, G 182 syringaldehyde S 194 4-propenylsyringol S 208 sinapylaldehyde S 210 sinapylalcohol S
Table 5.1. Peak assignments in mass spectra of lignified samples

152 Davis, Wolfrum and Jeoh 5.4.2.2 Detection of Quantitative Trait Loci
PyMBMS has been used to determine the cell chemistry of ~1000 loblolly pine sam-ples, and the results of the cell wall chemistry phenotyping have been used to iden-tify eight quantitative trait loci (QTL) for cell wall chemistry (Tuskan et al. 1999; Sewell et al. 2002; Brown et al. 2003). An advantage of the mass spectrometry-based approach is that peak intensities are estimates of the concentration of various cell wall components and can be used as phenotypes in QTL studies (for example, see Sewell et al. (2002). By using intensities as phenotypes, no a priori knowledge of cell wall chemistry is assumed and chemical species not included in PLS-based cell wall chemistry models can be identified and assigned to a biological (or biochemi-cal) function.
5.4.2.3 Chemical Compositional Changes after Pretreatment and Biological Conversion
Processing of lignocellulosic biomass for conversion to ethanol generally requires thermochemical pretreatment (see Chapter 6). This alters the composition and struc-ture of the biomass. Representative mass spectra of switchgrass (Panicum virgatum L.; see Chapter 11) pretreated under acidic and basic conditions are shown in Fig. 5.3. The mass spectral peaks associated with xylan (m/z 114) are greatly re-duced as a result of the acid hydrolysis pretreatment, whereas the switchgrass mate-rial remaining after base pretreatment is similar to the untreated switchgrass.
Fig. 5.3. Analytical pyrolysis spectra of (A) switchgrass pretreated at 190°C with 0.07 g/g H2SO4 for 10 min, and (B) switchgrass pretreated at 190°C with 0.07 g/g NaOH for 10 min. The mass-to-charge ratio (m/z) is plotted along the horizontal axis, the signal intensity (in arbitrary units) along the vertical axis.

Feedstock Selection Using High-Throughput Spectrometric and Enzymatic Assays 153
A regression of the mass spectra obtained from switchgrass treated with base catalyst shows a good correlation with total sugar yields, including sugar released after enzymatic hydrolysis. A PLS1 model using three principal components, shown in Fig. 5.4, explains 99% of the variance in the sugar yields using 90% of the mass spectral information. The regression coefficients indicate that sugar yields increase upon the removal of pentoses (m/z 85, 115) and phenolic compounds (m/z 120, 137, 150 and 180) derived from lignin, p-coumarate, and ferulate. High-throughput pyro-lysis may serve as an additional screen to minimize the number of pretreated samples that need to be tested in downstream enzymatic screens, which would be more time consuming (up to days).
Fig. 5.4 A. PLS1 regression model to predict sugar yields obtained from enzymatic saccharifi-cation of switchgrass treated with a base catalyst, based on pyrolysis vapor mass spectra. The model was based on three principal components that together explained 90% of the mass spectral variance B. Regression coefficients; m/z values with negative regression coefficients represent compounds that limit sugar yields.

154 Davis, Wolfrum and Jeoh 5.4.2.4 Screening for Unintended Effects
Cell wall chemical composition of three Populus lines which had been genetically modified to express the Cry3A or Cry3B2 protein of Bacillus thuringiensis (Bt) were compared. These Bt proteins are insecticidal and are meant to reduce insect damage to the trees, and ideally they should not impact the metabolism, growth, or develop-ment of the transgenic plants in any way. Evaluation of the PyMBMS data showed that there were no noticeable differences in chemical composition between the trans-genic and control lines for any of the studied clones (Davis et al. 2006).
5.5 Enzyme Accessibility in Biomass
From the enzymatic hydrolysis standpoint, one of the most important factors that determine the overall bioenergy crop potential of any biomass is the ease of depoly-merizing the structural carbohydrate components (hemicellulose and cellulose) of the plant cell wall. Since soluble cell-wall-degrading glycosyl hydrolases, such as cellu-lases and hemicellulases, interact with their substrates (cellulose and hemicellulose, respectively) at the solid/liquid interface, a key consideration in improving enzy-matic digestibility of a biomass substrate is to improve physical access for the en-zyme to its target substrate. In lignocellulosic biomass, cellulose is the primary source of readily fermentable glucose. A key strategy to improve yields of ferment-able sugars from biomass is to alter the cell wall structure to physically improve cellulase access to cellulose.
5.5.1 Probing for Enzyme Accessibility in Biomass
The enzymatic accessibility of the cellulose fraction of the plant cell wall can be directly assessed using cellulase enzymes. In the simplest form, a saccharification assay using commercial cellulase preparations can show the difference in cellulase digestibility between samples. Although a useful means of comparing overall di-gestibilities of samples, this method does not provide the level of detail that may be required to assess the effects of subtle changes in the cell wall on cellulase accessi-bility to cellulose. A recently established method uses a purified cellulase of known specificity to probe the effect of plant cell wall alterations on cellulase accessibility. Trichoderma reesei Cel7A, a cellulose-reducing, end-specific cellobiohydrase (Barr et al. 1996) is a valuable ‘reagent’(Jeoh et al. 2007) in this regard. T. reesei Cel7A, a soluble cellu-lase enzyme, binds to and hydrolyzes cellulose at the reducing ends of the polysac-charide. Assessing changes in Cel7A adsorption concurrently with changes in cellu-lose hydrolysis rates indicates the relative changes in access to the cellulose fraction by this cellulase. To track the adsorption of the purified T. reesei Cel7A in a biomass substrate, the enzyme is labeled in vitro with a commercially available fluorophore such as the Alexa Fluor available from Invitrogen (Carlsbad, CA). The probing experiments can be conducted in sealed microtiter plates or polypropylene Eppendorf tubes (Fig. 5.5).

Feedstock Selection Using High-Throughput Spectrometric and Enzymatic Assays 155
Pre-determined ratios of the cellulase probe and biomass are incubated with good mixing. At the end of the incubation period, the suspension is filtered through a 1.0-µm glass fiber filter. The solids retained in the filter contain biomass with adsorbed cellulases, whereas the filtrate contains solubilized sugars and some unbound cellu-lase. The solids are resuspended in water and analyzed for the concentration of bound cellulase, whereas the filtrate is analyzed for soluble reducing sugars as a measure of the extent of cellulose digestion. Note that the filter can trap enzymes, which can result in artificially lower concentrations of unbound cellulase measured in the soluble fraction. The fluorescence emission intensity of the solids fraction reflects the contribu-tions from the fluorophore associated with the adsorbed cellulases and from the intrinsic autofluorescence of the biomass itself. The addition of reaction concentra-tions of biomass to standard dilutions of cellulases of the calibration standards is necessary to negate the background autofluorescence in the measured samples.
Fig. 5.5. Experimental scheme for probing cellulase accessibility of biomass using fluores-cence-labeled T. reesei Cel7A.
5.5.2 Applications and Results
Varying severities of dilute-sulfuric acid pretreatment of corn stover were used to produce samples with 67–97 % of the hemicellulose fraction removed. This set of samples was probed with purified, fluorescence-labeled T. reesei Cel7A for 5 days at 38°C. The results demonstrated that decreasing levels of residual hemicellulose in
Incubate filter
1. Assay filtrate for reducing sugars 2. Re-suspend solid fraction and transfer to 96-well plate.
Known fluorescent en-zyme concentrations (Standard Curve) in triplicates

156 Davis, Wolfrum and Jeoh corn stover reduces cellulase accessibility to cellulose (Fig. 5.6). However, this effect was only apparent in the samples with greater than 5% hemicellulose content. Probing field-dried, dilute-acid pretreated corn stover samples with a fluores-cence-labeled, purified T. reesei Cel7A showed that increased enzymatic digestibility of biomass could be achieved by removing the hemicellulose fraction, which is thought to act as a barrier preventing access to cellulose. Measuring changes in physical or chemical properties such as porosity, surface area, and the chemical composition of biomass are indirect means of assessing the impact of pretreatment on the enzymatic digestibility of a biomass sample.
Fig. 5.6 A. The extent of cellulose hydrolysis in PCS by T. reesei Cel7A after 120 h, and B. the concentration of bound T. reesei Cel7A (plotted as µmol Cel7A per gram of remaining cellulose) at 1 h with respect to the xylan content of the sample. The dashed lines represent the extent of hydrolysis (17.8 ± 0.33 %) and bound Cel7A concentration (0.044 ± 0.013 µmol g–1) on raw corn stover under the same reaction conditions. The xylan content of raw corn stover was 24.1%.

Feedstock Selection Using High-Throughput Spectrometric and Enzymatic Assays 157
Empirical correlations obtained from such measurements often depend on the nature and history of the substrate or the measurement methods, resulting in conflict-ing conclusions from different research groups. Based on our studies, we have identi-fied two important questions to ask in determining the effect of pretreatment on biomass: (1) whether or not the cellulose fraction is made more accessible to the cellulase enzymes and (2) whether or not the cellulose itself has been rendered into a more digestible morphology. Increasing surface area or porosity, or changing the chemistry of biomass, may have little or no impact on enzyme digestibility unless these criteria are met. We found that these questions can be addressed effectively by directly probing the biomass structure with purified cellulase enzymes.
References
Agblevor, F.A., Evans, R.J., and Johnson, K.D. (1994) Molecular-beam mass-spectrometric analysis of lignocellulosic materials I. Herbaceous biomass. J. Anal. Appl. Pyrolysis 30, 125–144.
Alves, A., Schwanninger, M., Pereira, H., and Rodrigues, J. (2006) Calibration of NIR to assess lignin composition (H/G ratio) in maritime pine wood using analytical pyrolysis as the reference method. Holzforschung 60, 29–31.
Aries, R., Gutteridge, C.S., Laurie, W.A., Boon, J.J., and Eijkel, G.B. (1988) A pyrolysis-mass spectrometry investigation of pectin methylation. Anal. Chem. 60, 1498–1502.
ASTM International. (2004) Standard practice for near infrared qualitative analysis. pp. 1–8. ASTM International, West Conshohocken, PA.
ASTM International. (2005) Standard practices for infrared multivariate quantitative analysis. pp. 1–29. ASTM International, West Conshohocken, PA.
Barr, B.K., Hsieh, Y.L., Ganem, B., and Wilson, D.B. (1996) Identification of two function-ally different classes of exocellulases. Biochemistry 35, 586–592.
Boon, J.J., Dupont, L.M., and De Leeuw, J.W. (1986) Characterization of a peat bog profile by Curie point pyrolysis-mass spectrometry. Peat Water 215–239.
Boon, J.J., Pouwels, A.D., and Eijkel, G.B. (1987) Pyrolysis high-resolution gas chromatogra-phy-mass spectrometry studies on beechwood: capillary high-resolution mass spectrome-try of a beech lignin fraction. Biochem. Soc. Trans. 15,170–174.
Brereton, R.G. (2007) Applied Chemometrics for Scientists. Wiley and Sons. Brown, G.R., Bassoni, D.L., Gill, G.P., Fontana, J.R., Wheeler, N.C., Megraw, R.A., Davis,
M.F., Sewell, M.M., Tuskan, G.A., and Neale, D.B. (2003) Identification of quantitative trait loci influencing wood property traits in loblolly pine (Pinus taeda L.) III. QTL verifi-cation and candidate gene mapping. Genetics 164, 1537–1546.
Davis, M.F., Tuskan, G.A., Payne, P., Tschaplinski, T.J., and Meilan, R. (2006) Assessment of Populus wood chemistry following the introduction of a Bt toxin gene. Tree Physiol. 26, 557–564.
Davison, B.H., Drescher, S.R., Tuskan, G.A., Davis, M.F., and Nghiem, N.P. (2006) Variation of S/G Ratio and Lignin Content in a Populus Family Influences the Release of Xylose by Dilute Acid Hydrolysis. Appl. Biochem. Biotechnol. 130, 427–435.
Del Rio, J.C., Speranza, M., Gutierrez, A., Martinez, M. J., and Martinez, A.T. (2001) Identi-fication of residual lignin markers in eucalypt kraft pulps by Py-GC/MS. J. Anal. Appl. Pyrolysis 58–59, 425–439.
Draude, K.M., Kurniawan, C.B., and Duff, S.J.B. (2001) Effect of oxygen delignification on the rate and extent of enzymatic hydrolysis of lignocellulosic material. Bioresource Tech-nol. 79, 113–120.
Chen, F., and Dixon, F.A. (2007) Lignin modification improves fermentable sugar yields for
biofuel production. Nature Biotechnol. 25, 759–761.

158 Davis, Wolfrum and Jeoh Duchesne, I., Hult, E., Molin, U., Daniel, G., Iversen, T., and Lennholm, H. (2001) The influ-
ence of hemicellulose on fibril aggregation of kraft pulp fibres as revealed by FE-SEM and CP/MAS C-13-NMR. Cellulose 8, 103–111.
Evans, R.J., and Milne, T.A. (1987) Molecular Characterization of the Pyrolysis of Biomass .1. Fundamentals. Energy & Fuels 1, 123–137.
Faix, O., Bremer, J., Meier, D., Fortmann, I., Scheijen, M.A., and Boon, J.J. (1992) Charac-terization of tobacco lignin by analytical pyrolysis and Fourier transform-infrared spec-troscopy. J. Anal. Appl. Pyrolysis 22, 239–259.
Faix, O., Stevanovic-Janezic, T., and Lundquist, K. (1994) The lignin of the diffuse porous angiosperm tree Triplochiton scleroxylon K. Schum with low syringyl content. J. Wood Chem. Technol. 14, 263–278.
Gidman, E., Goodacre, R., Emmett, B., Smith, A.R., and Gwynn-Jones, D. (2003) Investigat-ing plant-plant interference by metabolic fingerprinting. Phytochem. 63, 705–710.
Goodacre, R. (1994) Characterization and quantification of microbial systems using pyrolysis mass spectrometry: Introducing neural networks to analytical pyrolysis. Microbiol. Europe 2, 16–22.
Goodacre, R., Timmins, E.M., Burton, R., Kaderbhai, N., Woodward, A.M., Kell, D.B., and Rooney, P.J. (1998) Rapid identification of urinary tract infection bacteria using hyper-spectral whole-organism fingerprinting and artificial neural networks. Microbiology UK 144, 1157–1170.
Greenwood, P.F., van Heems, J.D., Guthrie, E.A., and Hatcher, P.G. (2002) Laser micropyro-lysis GC-MS of lignin. J. Anal. Appl. Pyrolysis 62, 365–373.
Hartley, R.D. and Haverkamp, J. (1984) Pyrolysis-mass spectrometry of the phenolic constitu-ents of plant cell walls. J. Sci. Food Agric. 35, 14–20.
Hayashi, N., Sugiyama, J., Okano, T., and Ishihara, M. (1997) Selective degradation of the cellulose I-alpha component in Cladophora cellulose with Trichoderma viride cellulase. Carbohydr. Res. 305, 109–116.
Irwin, D.C., Cheng, M., Xiang, B.S., Rose, J.K.C., and Wilson, D.B. (2003) Cloning, expres-sion and characterization of a family-74 xyloglucanase from Thermobifida fusca. Eur. J. Biochem. 270, 3083–3091.
Izumi, A., Kuroda, K., Ohi, H., and Yamaguchi, A. (1995) Structural analysis of lignin by pyrolysis-gas chromatography (III) Comparative studies of pyrolysis-gas chromatography and nitrobenzene oxidation for the determination method of lignin comosition in hard-wood. Kami Pa Gikyoshi 49, 1339–1346.
Jacobs, A., Lundqvist, J., Stalbrand, H., Tjerneld, F., and Dahlman, O. (2002) Characterization of water-soluble hemicelluloses from spruce and aspen employing SEC/MALDI mass spectrometry. Carbohydr. Res. 337, 711–717.
Jacobs, A., Palm, M., Zacchi, G., and Dahlman, O. (2003) Isolation and characterization of water-soluble hemicelluloses from flax shive. Carbohydrate Research 338, 1869–1876.
Jeoh, T., Ishizawa, C., Davis, M.F., Himmel, M.E., Adney, W.S., and Johnson, D.K. (2007) Cellulase digestibility of pretreated biomass is limited by cellulose accessibility. Biotech-nol. Bioeng. 98, 112–122.
Kelley, S.S., Jellison, J., and Goodell, B. (2002) Use of NIR and pyrolysis-MBMS coupled with multivariate analysis for detecting the chemical changes associated with brown-rot biodegradation of spruce wood. FEMS Microbiol. Lett. 209, 107–111.
Kelley, S.S., Rowell, R. M., Davis, M., Jurich, C.K., and Ibach, R. (2004) Rapid analysis of the chemical composition of agricultural fibers using near infrared spectroscopy and pyro-lysis molecular beam mass spectrometry. Biomass & Bioenergy 27, 77–88.
Kim, T. H., Kim, J.S., Sunwoo, C., and Lee, Y.Y. (2003) Pretreatment of corn stover by aque-ous ammonia. Bioresource Technol. 90, 39–47.

Feedstock Selection Using High-Throughput Spectrometric and Enzymatic Assays 159
Knappert, D., Grethlein, H., and Converse, A. (1980) Partial Acid-Hydrolysis of Cellulosic Materials as a Pretreatment for Enzymatic-Hydrolysis. Biotechnol. and Bioeng. 22, 1449–1463.
Laureano-Perez, L., Teymouri, F., Alizadeh, H., and Dale, B.E. (2005) Understanding factors that limit enzymatic hydrolysis of biomass. Appl. Biochem. Biotechnol. 121, 1081–1099.
Lerouxel, O., Choo, T.S., Seveno, M., Usadel, B., Faye, L., Lerouge, P., and Pauly, M. (2002) Rapid structural phenotyping of plant cell wall mutants by enzymatic oligosaccharide fin-gerprinting. Plant Physiol. 130, 1754–1763.
Martens, H., and Martens, M. (2001) Multivariate Analysis of Quality: An Introduction. John Wiley and Sons.
Martin, F., Saiz- Jimenez, C., and Gonzalez-Vila, F.J. (1979) Pyrolysis-gas chromatography-mass spectrometry of lignins. Holzforschung 33, 210–212.
McCann, M.C., and Carpita, N.C. (2005) Looking for invisible phenotypes in cell wall mu-tants of Arabidopsis thaliana. Plant Biosyst. 139, 80–83.
Meuzelaar, H. L. C., Haverkamp, J., and Hileman, F. (1982) Pyrolysis-mass spectrometry of recent and fossil biomaterials. In Techniques and Instrumentation in Analytical Chemistry Vol. 3, Elsevier, Amsterdam, pp. 293.
Meuzelaar, H.L.C., Haverkamp, J., and Hileman, F. (1984) Pyrolysis mass spectrometry of complex organic materials. Science 226, 268–274.
Meuzelaar, H.L.C., Kistemaker, P.G., and Posthumus, M A. (1974) Recent advances in pyro-lysis mass spectrometry of complex biological materials. Biomed. Mass Spectrom. 1, 312–319.
Munck, L., Møller, B., Jacobsen, S., and Søndergaard, I. (2004) Near infrared spectra indicate specific mutant endosperm genes and reveal a new mechanism for substituting starch with (1→3, 1→4)-ß-glucan in barley. J. Cereal Sci. 40, 213–222.
Munck, L., Pram Nielsen, J., Moller, B., Jacobsen, S., Sondergaard, I., Engelsen, S.B., Nor-gaard, L., and Bro, R. (2001) Exploring the phenotypic expression of a regulatory pro-teome-altering gene by spectroscopy and chemometrics. Anal. Chimica Acta 446, 171–186.
Naes, T., Isaksson, T., Fearn, T., and Davies, T. (2002) A User-Friendly Guide to Multivariate Calibration and Classification. IM Publications, Chichester, UK, 344pp.
Obst, J.R. (1983) Analytical pyrolysis of hardwood and softwood lignins and its use in lignin-type determination of hardwood vessel elements. J. Wood Chem. Technol. 3, 377–397.
Ohi, H., Yasuta, Y., Izumi, A., and Kuroda, K. (1997) Structural analysis of lignin by pyroly-sis-gas chromatography (V) Analysis of lignin in tropical hardwoods. Kami Pa Gikyoshi 51, 1213–1223.
Reale, S., Di Tullio, A., Spreti, N., and De Angelis, F. (2004) Mass spectrometry in the bio-synthetic and structural investigation of lignins. Mass Spectrom. Rev. 23, 87–126.
Rodrigues, J., Graca, J., and Pereira, H. (2001) Influence of tree eccentric growth on syrin-gyl/guaiacyl ratio in Eucalyptus globulus wood lignin assessed by analytical pyrolysis. J. Anal. Appl. Pyrolysis 58–59, 481–489.
Sewell, M., Davis, M., Tuskan, G., Wheeler, N., Elam, C., Bassoni, D., and Neale, D. (2002) Identification of QTLs influencing wood property traits in loblolly pine (Pinus taeda L.) II. Chemical wood properties. Theor. Appl. Genetics 104, 214–222.
Simmleit, N., and Schulten, H.-R. (1989) Characterization of plant materials by pyrolysis-field ionization mass spectrometry Part II. Thermal degradation products of spruce needles. Chemosphere 18, 1855–1869.
Smedsgaard, J., and Frisvad, J.C. (1996) Using direct electrospray mass spectrometry in tax-onomy and secondary metabolite profiling of crude fungal extracts. J. Microbiol. Methods 25, 5–17.

160 Davis, Wolfrum and Jeoh Sonoda, T., Ona, T., Yokoi, H., Ishida, Y., Ohtani, H., and Tsuge, S. (2001) Quantitative
analysis of detailed lignin monomer composition by pyrolysis-gas chromatography com-bined with preliminary acetylation of the samples. Anal. Chem. 73, 5429–5435.
Terron, M.C., Fidalgo, M.L., Galletti, G.C., and Gonzalez, A.E. (1995) Comparative study of the lignin composition of seven Chilean woods using Py-GC-MS. Biotechnology in the pulp and paper industry: Recent advances in applied and fundamental research. pp. 381–384. The International Conference on Biotechnology in the Pulp and Paper Industry, Vi-enna, Austria.
Tuskan, G., West, D., Bradshaw, H.D., Neale, D., Sewell, M., Wheeler, N., Megraw, B., Jech, K., Wiselogel, A., Evans, R., Elam, C., Davis, M., and Dinus, R. J. (1999) Two high-throughput techniques for determining wood properties as part of a molecular genetics analysis of hybrid poplar and loblolly pine. Appl. Biochem. Biotechnol. 77–79, 55–65.
van Baar, B.L.M. (2000) Characterization of bacteria by matrix-assisted laser desorption/ ionisation and electrospray mass spectrometry. FEMS Microbiol. Rev. 24, 193–219.
Vinzant, T.B., Ehrman, C.I., Adney, W.S., Thomas, S.R., and Himmel, M.E. (1997) Simulta-neous saccharification and fermentation of pretreated hardwoods – Effect of native lignin content. Appl. Biochem. Biotechnol. 62, 99–104.
Williams, P., and Norris, K. (2001) Near-Infrared Technology in the Agricultural and Food Industries. American Association of Cereal Chemists.
Wood, K.V. (2006) Mass spectrometry. In: W. Vermerris and R.L. Nicholson (Eds.), Pheno-lic Compound Biochemistry, Springer, Dordrecht, pp. 197–210
Xie, L., Ying, Y., and Ying, T. (2007) Quantification of chlorophyll content and classification of nontransgenic and transgenic tomato leaves using visible near-infrared diffuse reflec-tance spectroscopy. J. Agric. Food Chem 55, 4645–4650
Yamada, T., Yeh, T.F., Chang, H.M., Li, L.G., Kadla, J.F., and Chiang, V.L. (2006) Rapid analysis of transgenic trees using transmittance near-infrared spectroscopy (NIR). Holz-forschung 60, 24–28.
Yang, B., and Wyman, C.E. (2004) Effect of xylan and lignin removal by batch and flow-through pretreatment on the enzymatic digestibility of corn stover cellulose. Biotechnol. Bioeng. 86, 88–95.
.

6 Current Technologies for Fuel Ethanol Production
Yulin Lu and Nathan S. Mosier
Agricultural and Biological Engineering Department, Laboratory of Renewable Resources Engineering, Purdue University, West Lafayette, IN 47906
6.1 Introduction
Fossil fuels provide the majority of the energy needs for our global economy, of which approximately 69% goes into the transportation fuel sector (Administration 2007). Additionally, the supply of petroleum is predicted to peak within the next few decades before seriously declining over the course of this century (Campbell and Laherrere 1998; Grant 2005). Meanwhile, serious environmental problems such as global warming are arising from the accumulation of the greenhouse gases from the burning of fossil fuels. In addition, unstable supply and uneven geographical distri-bution of petroleum resources exacerbate political tension between countries that have huge or growing demands for energy supplies. Therefore, it is critical to de-velop alternative ways for production of fuels and chemicals. Among the many alter-native energy technologies (e.g. solar and wind energy technologies, etc.), biocon-version of lignocellulosic plant biomass to fuel ethanol is well suited for supplying large quantities of liquid transportation fuels to meet increasing societal energy needs in a sustainable manner (Lynd et al. 1991, 1999; Sheehan and Himmel 1999; Wyman 1999, 2003).
Lignocellulosic plant biomass from agricultural and forestry wastes (e.g. corn stalk and fiber, wood chips, and switchgrass) is a highly abundant source of organic matter that is renewable annually as a result of photosynthesis. Utilization of ligno-cellulosic plant biomass for fuel ethanol production will not only provide a signifi-cant fraction of fuels for use in the transportation sector, but also help reduce the emission of global warming gases by a substantial amount (Farrell et al. 2006). One study estimated that use of bioethanol could reduce net carbon dioxide emissions from vehicles by 90% when used as 95% blend with gasoline in light duty vehicles, compared with reformulated gasoline; the 95% blend could also reduce sulfur oxide emission by 60–80% (Sheehan and Himmel 1999). A more recent life cycle study by
W. Vermerris (ed.), Genetic Improvement of Bioenergy Crops, DOI: 10.1007/978-0-387-70805 -8_ 6 , © Springer Science+Business Media, LLC 2008
from Lignocellulosic Plant Biomass

162 Lu and Mosier
Wang et al. (Wang 2005) at Argonne National Laboratory (Argonne, IL) claimed an 86% reduction of greenhouse gas (GHG) emission per gallon of lignocellulosic etha-nol when displacing an energy-equivalent amount of gasoline, which indicates that large-scale substitution of petroleum-based fuels with lignocellulosic fuel ethanol would significantly contribute to reducing greenhouse gas emissions.
Lignocellulosic plant biomass, either in its native form or in any of the various partially modified forms, is an extremely complex substrate both chemically and physically. In nature, lignocellulose is broken down over weeks or longer by a multi-tude of microorganisms. Because the substrates are extremely complex and recalci-trant, there are many microorganisms involved in this depolymerization process and they secrete a mixture of enzymes that act in a concerted manner. Thus, understand-ing of the biological degradation of lignocellulosic materials and correspondingly developing fuels and chemicals production processes represent a major scientific challenge. The research efforts of the past 30 years have resulted in great advances in the technology for producing fuel ethanol from lignocellulosic materials based upon better understanding of the diversity in the composition of lignocellulosic plant bio-mass (Carpita 1996), refinement of a variety of pretreatment processes optimized for improving cellulosic substrate reactivity (Mosier et al. 2005b; Wyman et al. 2005), development of highly efficient, thermostable cellulases (Himmel et al. 1999), and development of recombinant microorganisms capable of cofermenting mixed streams of sugars to ethanol (Ho et al. 1998; Ingram et al. 1999; Zhang et al. 1995). Based on these currently available technologies, a typical process scheme has been developed for the utilization of lignocellulosic plant biomass for fuel ethanol produc-tion, consisting of sequential steps of physical, chemical, and biological processes as depicted in Fig. 6.1. In this chapter, we will present a concise review of these tech-nologies: feedstock pretreatment strategies, enzymatic hydrolysis processes, ethanol cofermentation utilizing both hexose and pentose, and ethanol recovery operations. At the conclusion of this chapter, we will present our perspectives on advanced bio-chemical conversion technologies which will require collaborative efforts between biological engineers and plant biologists.

Current Technologies for Lignocellulosic Fuels 163
Fig. 6.1. A simplified generic process scheme for fuel ethanol production from lignocellulosic feedstocks. Solid arrows represent flow of solid streams, and dotted arrows represent flow of liquid streams; enzymatic hydrolysis and ethanol co-fermentation steps can be consolidated into a single step, referred to as simultaneous saccharification and fermentation (SSF).
6.2 Feedstock Pretreatment Strategies
The prerequisite step for utilizing lignocellulosic biomass to produce ethanol is hy-drolysis, i.e. depolymerization of the plant cell wall polysaccharides cellulose and hemicellulose to monomeric sugars. However, due to the recalcitrant structural char-acteristics of the complex substrate, the enzymatic hydrolysis of untreated native lignocellulosic biomass normally reaches no higher than 20% yield of monomeric glucose (with the exception of a few very high enzyme-loading investigations) at low rates that require more than 48 h to achieve these yields (Mosier et al. 2005b). There-fore, to improve the overall economics of the process through higher yields in shorter times, the substrate reactivity has to be improved. This is achieved by applying pre-treatment processes to the lignocellulose.
As defined by the biomass program at the U.S. Department of Energy (U.S. DOE 2005) pretreatment “… in the context of enzymatic hydrolysis is essentially mild (in contrast to concentrated-acid or high-temperature dilute-acid hydrolysis) thermo-chemical treatment to hydrolyze hemicellulose and possibly solubilize some of the lignin. In addition to releasing sugars from the hemicellulose, this also breaks away the protective sheath from around the cellulose, making it more vulnerable to enzymatic hydrolysis”. Pretreatment causes numerous physical and chemical changes to lignocel-lulose, many of which are not well understood (Mosier et al. 2005b). Figure 6.2
LignocellulosicFeedstockHandling
Pretreatment EnzymaticHydrolysis
EthanolCoFermentation
XyloseGlucose
Lignin-BasedPower
Generation
Distillation &Dehydration
Steam/Power Supply
Ethanol asTransportation
Fuel
SSF
CellulaseProduction
Stea
m/P
ower
Sup
ply

164 Lu and Mosier
illustrates a simplified model of the action of pretreatment on lignocellulosic sub-strates. Pretreatment can remove hemicellulose (Weil et al. 1994), disrupt the phys-ico-chemical interations between lignin and plant cell wall polysaccharides (Chang and Holtzapple 2000), partially depolymerize lignin, and/or alter the crystallinity of cellulose (Mcmillan 1994).
An effective pretreatment is characterized by the following characteristics (Mcmillan 1994; Mosier et al. 2005b; Weil et al. 1994): the pretreatment process has to be energetically efficient, i.e. the energy input/cost must be minimized, sugar loss due to degradation during pretreatment should be minimized, whereas the conversion yields and hydrolysis rates by subsequent enzymatic hydrolysis should be maxi-mized. In some current pretreatment technologies liberated monomeric pentose is degraded, thus lowering final amount of pentose available for subsequent fermenta-tion, as well as generating furfural which inhibits microbial fermentation. To be better adapted to a more consolidated bioprocess (Lynd et al. 2005, 1999), the pre-treated materials should not contain high amounts of inhibitory compounds that will disturb the desired cell metabolism/physiological function; if any catalysts/chemicals are employed in the pretreatment process, they should be environmentally benign, and the usage amount should be reduced to limit the cost as well. Meanwhile, no further washing or neutralization process should be needed before subsequent enzy-matic hydrolysis and fermentation.
Fig. 6.2. Schematic representation of the effects of pretreatment on lignocellulosic plant bio-mass.
Prevalent pretreatment techniques can be divided into the following main catego-ries: neutral/controlled-pH pretreatments, acid-based pretreatments, alkaline-based pretreatments, and others that do not fall into the above categories. The different methods will be discussed in more detail below.
Pretreatment
LigninCelluloseHemicellulose
Pretreatment
LigninCelluloseHemicellulose
LigninCelluloseHemicellulose
LigninCelluloseHemicellulose

Current Technologies for Lignocellulosic Fuels 165
6.2.1 Neutral/Controlled-pH Pretreatment
6.2.1.1 Steam Explosion
Steam explosion might be the pretreatment technology closest to commercialized use. Several pilot-scale facilities were built for testing its efficiency (e.g. Iogen, Ottawa, Canada) (Iogen). Steam explosion pretreatment typically subjects lignocellu-lose to temperatures between 160 and 260°C (corresponding pressures of 100–700 psia; psia = pounds per square inch absolute; atmospheric pressure is 14.5 psi) with saturated steam for a period of tens of seconds to several minutes, followed by a flashing process to explosively release the steam. This results in an explosive disrup-tion of the lignocellulose material, thus “opening up” the substrate to increase di-gestibility (Mosier et al. 2005b).
The resulting sugars from steam explosion are concentrated in the liquid stream, compared with those from other pretreatment processes (Brownell et al. 1986). How-ever, the severe conditions employed in this process can cause substantial mono-meric xylose degradation, and form large quantities of fermentation-inhibiting com-pounds, such as furfural and 5-hydroxymethylfurfural (HMF). The formation of these degradation products lower the yield of fermentable sugars obtained from the pretreated material, and more importantly, these compounds are inhibitory to micro-bial fermentations at concentrations as low as 0.25% (w/w) (Palmqvist and Hahn-Hägerdal 2000).
6.2.1.2 Liquid Hot Water Pretreatment
Liquid hot water pretreatment is very similar to steam explosion, the major differ-ence being the explosive decompression of steam explosion pretreatment is replaced by controlled cooling to keep the water in the liquid phase throughout the process (Weil et al. 1994). Hemicellulose can be completely hydrolyzed to soluble oligosac-charides and monomeric sugars by liquid hot water pretreatment alone, without any chemical addition. Pressured reactors are used to keep the water in the liquid state at high reaction temperatures. Termed as “uncatalyzed solvolysis” by Mok and Antal (Mok and Antal 1992), various biomass samples have been pretreated with com-pressed, liquid water. Process times vary between 5 and 30 min with a temperature range of 200–230°C. Greater than 90% yields of monomeric xylose can be recovered with a post-hydrolysis step (4% H2SO4 at 121°C for 1 h) (Mok and Antal 1992).
The liquid hot water pretreatment is attractive in that it eliminates the use of ex-pensive chemicals/catalysts to facilitate the hemicellulose depolymerization; subse-quently, there is no need for neutralization or chemical recovery after the pretreat-ment. The resulting pretreated materials are reported to be highly digestible by the following enzymatic saccharification step (Mosier et al. 2005c; Weil et al. 1998).

166 Lu and Mosier
6.2.1.3 Controlled-pH Pretreatment
In liquid hot water pretreatment, acetic acids and other organic acids are liberated as a result of the cleavage of O-acetyl and uronic acid substitution on hemicellulose by the action of water. These acids help catalyze further hemicellulose solubilization. They also may degrade the resulting monomeric sugars to furfural, which may have negative effects on the subsequent fermentation. With careful addition of base or buffer, controlled pH hydrothermolysis can maintain the pH of the liquid phase be-tween 5.5 and 7.0 during the whole process, thus minimizing the formation of degra-dation products. Thus controlled pH liquid hot water is a modified version of hot water pretreatment which provides greater control of the chemical reactions that occur during pretreatment (Weil et al. 1998).
Optimization of pH controlled liquid hot water pretreatment on different ligno-cellulosic substrates, such as yellow poplar sawdust, corn fiber and corn stover, has been reported (Mosier et al. 2005a; Weil et al. 1997, 1998). Optimized conditions subject lignocellulose to temperatures between 140 and 220°C for 10–30 min. while maintaining a pH between 5 and 7. An optimized controlled pH liquid hot water pretreatment process will maximize the solubilization of the hemicellulose fraction as liquid soluble oligosaccharides while minimizing the formation of monomeric sugars. The minimization of complete hydrolysis to monosaccharides minimizes the subsequent degradation of these sugars to various aldehydes during pretreatment. By controlling the depolymerization of hemicellulose, the major xylose containing product is soluble xylan oligosaccharides. These oligosaccharides must be subse-quently hydrolyzed to fermentable sugars by enzymes or acids.
6.2.2 Acid-Based Pretreatment
6.2.2.1 Dilute Acid Pretreatment
Various dilute mineral acids have been used for lignocellulosic biomass pretreat-ment: hydrochloric acid (Goldstein and Easter 1992), phosphoric acid (Um et al. 2003), nitric acid and sulfuric acid (Lloyd and Wyman 2005; Um et al. 2003). Among them, dilute sulfuric acid hydrolysis has been most extensively studied and holds the promise as a leading hydrolysis technology because of its effectiveness and low cost (Mcmillan 1994).
Typical operation conditions are 0.5–1.4% (w/w) sulfuric acid, 100–250 g/L biomass solid-loading, and a residence time between 3–12 min, at 165–195°C (Mcmillan 1994). As the dilute acid hydrolysis takes place in harsh operational con-ditions (high temperature and pressure), a non-negligible reaction is the degradation of monomeric sugar: from xylose to furfural, and from glucose to 5-hydroxymethyl furfural (HMF). Often, increasing the reaction temperature is more effective in im-proving maximum xylose yield than increasing the acid catalyst concentration (Sae-man 1945).

Current Technologies for Lignocellulosic Fuels 167
6.2.2.2 Concentrated Acid Pretreatment
Under acidic conditions, β-1,4-glycosidic bonds within the cellulosic polymeric chain are cleaved by the addition of water, forming short fragments of cellulosic chains that will undergo further hydrolysis. When treated with a concentrated min-eral acid, such as concentrated sulfuric acid or supersaturated hydrochloric acid, the cellulose portion becomes a highly swollen and easily hydrolysable structure. The concentrated acid disrupts the hydrogen bonding between cellulose chains, convert-ing it to a completely amorphous state. Once the cellulose has been decrystallized, it forms a homogeneous gel with the acid (Goldstein and Easter 1992). Dilution with water at modest temperatures provides complete and rapid hydrolysis to glucose, with little degradation. In the case of concentrated sulfuric acid, a sulfuric acid-cellulose addition compound, called “amyloid”, is formed in the form of (C6H10O5 · 4H2O · H2SO4)n. The reaction condition for concentrated sulfuric acid hydrolysis is 62% sulfuric acid at 40°C for 1 h (Bungay 1981).
However, concentrated acid hydrolysis is not an economically viable process, mainly due to the large quantities of acids needed for the process and the acid dis-posal/recycling problem after hydrolysis. Thus, minimizing the use of sulfuric acid and recycling the acid cost-effectively are critical factors in the economic feasibility of the process (Torget et al. 2000). Also, because of the very high acid concentration, there is special requirement for the reactor tanks materials to prevent corrosion (Tor-get et al. 2000).
6.2.3 Alkaline-Based and Other Pretreatments
Alkaline-based pretreatments typically operate at lower temperatures and pressures, compared to the above-mentioned types of pretreatment. The major effect of this pretreatment on the substrate is the removal of lignin from the polysaccharides, thus improving the digestibility of the pretreated material. Representative processes in-clude lime pretreatment and ammonia fiber/freeze expansion (AFEX) pretreatment (Dale et al. 1996; Teymouri et al. 2005).
6.2.3.1 Lime
Lime pretreatment removes the lignin fraction from the polysaccharide fraction, thus making the remaining polysaccharides vulnerable to enzyme digestion. With regard to process operation, different conditions are employed for different types of cellu-losic materials: 100°C for 13 h for corn stover, 150°C for 6 h with 14 atm for poplar wood, and 100°C for 2 h for switchgrass (Mosier et al. 2005b). The addition of oxy-gen to the reaction mixture can greatly improve delignification, especially when treating high lignin content woods like poplar (Mosier et al. 2005b).

168 Lu and Mosier
6.2.3.2 Ammonia Fiber Expansion
In ammonia fiber/freeze expansion (AFEX) process, a 5–15% ammonia solution flows through a column reactor that is packed with biomass at 1 mL/cm2 for 14 min at temperatures between 160 and 180°C (Mosier et al. 2005b). Similar to lime pre-treatment, AFEX breaks the lignin-polysaccharide linkages, thus increasing the rate of subsequent enzyme digestion. With the large extent of lignin removal, a major natural hurdle to enzyme attack is taken away.
Other available pretreatments are described in a series of critical reviews (Mcmillan 1994; Mosier et al. 2005b), like physical comminution, organic solvent soaking, etc. Readers are encouraged to read those reviews for a deeper understand-ing of the subject.
6.3 Enzymatic Hydrolysis: Liberating Monosaccharides
In nature, microorganisms account for more than 90% of all cellulosic biomass de-composition, of which fungi account for 80% of this total (Shimada and Takahashi 1991). Therefore, fungi represent a rich natural resource for isolating cellulolytic enzymes. Not surprisingly, the first high-efficiency cellulase mixture for laboratory and commercial applications was isolated from the fungus Trichoderma reesei in 1950 (Reese et al. 1950). Since then, the cellulase system from T. reesei remains the most extensively studied, best understood and most efficient for hydrolyzing cellu-losic biomass (Teeri 1997; Teeri et al. 1998).
The cellulase system from Trichoderma reesei contains of three major enzyme components: endoglucanase (EG; EC 3.2.1.4), cellobiohydrolase (CBH; EC 3.2.1.91), and β-glycosidase (EC 3.2.1.21). Multiple enzymes of each type are pro-duced and secreted by T. reesei. Other minor enzyme components may also provide cooperation in cellulose hydrolysis. Evidence suggests that these enzymes act syner-gistically (Henrissat et al. 1985; Din et al. 1994). A generally accepted model is shown in Fig. 6.3. The exo-enzymes (CBH) act on the ends of the cellulose chain and release β-cellobiose as the end product; endo-enzymes (EG) randomly attack the internal O-glycosidic bonds, resulting in glucan chains of different lengths; and the β-glycosidases act specifically on the β-cellobiose disaccharides and produce glucose (Beguin and Aubert 1994).

Current Technologies for Lignocellulosic Fuels 169
Non-reducing End Reducing End
Cellulose Microfibril
CBH II CBH IEG
β-G
CellobioseGlucose
Synergism of Cellulolytic Enzyme Systems (T. reesei)
Non-reducing End Reducing End
Cellulose Microfibril
CBH II CBH IEG
β-GNon-reducing End Reducing End
Cellulose Microfibril
CBH II CBH IEG
β-G
CellobioseGlucose
Synergism of Cellulolytic Enzyme Systems (T. reesei)
Fig. 6.3. A schematic representation showing the synergistic action of cellulolytic enzymes from the wood-degrading fungus T. reesei.
Structurally, cellulases typically have two separate domains: a catalytic domain (CD) and a cellulose binding module (CBM), which are linked by a flexible linker region. In T. reesei, the CBM is comprised of approximately 35 amino acids, and the linker region is rich in serine and threonine (Divne et al. 1998). Many studies have shown the importance of CBM presence to overall cellulase activity, in particular towards insoluble substrate (Teeri et al. 1998). It is generally regarded that the CBMs enhance cellulase activity by increasing local concentration of the CDs on substrate surface (Teeri et al. 1998). It has also been suggested that the CBMs has some dis-ruptive effect on the surface microfibrils (Linder and Teeri 1997). Most CBMs have a “β-jelly-roll structure” of two β-sheets, with either a planar hydrophobic surface that settles binding to crystalline region or a deep cleft that allows binding to a single polysaccharide molecule (Boraston et al. 2004).
The nature of the lignocellulosic substrate changes during the time course of en-zymatic hydrolysis (Wang et al. 2006). Initially, amorphous non-crystalline regions are attacked, because they are more accessible and easier to be hydrolyzed. After the

170 Lu and Mosier
initial hydrolysis stage, as the percentage of crystalline regions in the substrate rises, the enzymatic hydrolysis rate falls rapidly. Such observed kinetic behavior correlates to the high-crystalline nature of the bulk of cellulose fraction, and inaccessibility of the glycosidic bonds is the key rate-limiting factor for the slow-down of enzymatic hydrolysis. Besides the recalcitrance of the substrate, there are a few factors that limit cellulase efficiency during the course of the hydrolysis process, which include end-product inhibition, thermal deactivation of the native protein, non-specific bind-ing to lignin (Yang and Wyman 2004), and irreversible adsorption of the enzymes to the heterogeneous substrate.
Mechanistically, the reactions catalyzed by cellulases are suggested to involve general acid-base catalysis by a carboxylate pair at the enzyme active site. One resi-due acts as a general acid and protonates the oxygen of the O-glycosidic bond; at the same time, the other residue acts as a nucleophile. Depending on the distance be-tween the two carboxylic groups, either inverting (~10 Å distances) or retaining (~5 Å-distances) mechanisms are present in cellulases (Withers 2001).
To reduce the enzyme cost in the production of fuel ethanol from lignocellulosic biomass, two aspects need be addressed: optimization of the fermentation process for cellulases production, and development of a more efficient cellulase-based catalysis system. The cellulase research group at the National Renewable Energy Laboratory (Golden, CO), led by Dr. Michael Himmel, has worked on various aspects on devel-oping advanced cellulase systems (Himmel et al. 1997). They suggest that improve-ment on the specific activity of cellulases (expressed as filter paper units (FPU)/mg protein) is the key to a large reduction in enzyme cost. “Cocktails” of cellulase en-zymes (both from T. reesei or other hosts, both fungal and bacterial) can be screened by high-throughput activity assays, which may lead to engineered cellulases systems with defined composition, higher degrees of synergism, and improved specific activ-ity on target biomass substrates. One notable example was a binary-enzyme system containing one enzyme from a thermophilic bacterial strain and one from a fungal strain that resulted in a 40% increase in degree of synergism and a 30% increase in the amount of reducing-sugar released (Baker et al. 1998). Additionally, protein engineering and directed evolution are powerful tools that can facilitate the devel-opment of more efficient thermophilic cellulases (Baker et al. 2005).
Besides cellulases, hemicellulases are another group of polysaccharide degrading enzymes that are specific to the hemicellulose substrate. As a heterogeneous, branched polymer, hemicelluloses require enzyme activities specific to as many as 21 different bonds (Collins et al. 2005; Polizeli et al. 2005; Shallom and Shoham 2003). Thus, a consortium of hemicellulases is needed for a complete breakdown of hemicellulose. Endo-1,4-xylanases are needed for hydrolyzing the backbone 1,4-β-linked xylose residues; acetylxylan esterases participate in cleavage of the acetyl ester bonds; and β-D-xylosidases are utilized for the hydrolysis of xylan oligomers through exo-type attack. Similar to cellulases, xylanases have separate catalytic domains and carbohydrate binding modules (CBMs). The current structure/function relationship have been developed from high-resolution crystal structure investiga-tions and in-depth catalytic analysis (Divne et al. 1998; Teeri 1997; Teeri et al. 1998). Synergism and concerted action among xylanases enhance the effectiveness in het-ero-polymeric xylan hydrolysis. It has been observed that β-xylosidases remove the

Current Technologies for Lignocellulosic Fuels 171
short-chain oligosaccharides, minimizing the end product inhibition of exo-xylanases; thus, overall xylan hydrolysis efficiency is increased (Polizeli et al. 2005). Also, by adding acetylxylan esterases, acetic acids will be liberated and a less-acetylated xylan is uncovered for greater accessibility to endoxylanase action (Poli-zeli et al. 2005).
6.4 Ethanol Fermentation: Strain Development for Sugar Co-fermentation
Industrial processes that involve fermentation, such as fuel ethanol production from lignocellulose, require robust microorganisms with high productivity (i.e. convert all the mixed sugars at high rates), high tolerance to ethanol or inhibitory compounds inherent to the substrate, and resistance to contamination by undesired microorgan-isms. Since no naturally existing microbial strains have all of these characteristics, improvements of desirable properties have been made to a host of microorganisms, ranging from yeast (Saccharomyces cerevisiae, Pichia stipitis), to Zymomonas mobi-lis, to Escherichia coli. Summarized below are some of the advantages, disadvan-tages, major breakthroughs, and hurdles yet remaining in the development of indus-trial microorganisms well suited for producing fuel ethanol from lignocellulosic biomass.
6.4.1 Saccharomyces cerevisiae
S. cerevisiae has been the workhorse microorganism for ethanol fermentation in the beverage and fuel ethanol industries. Thousands of years of experience in working with S. cerevisiae have made it the ideal host for the development of a fermentative organism for lignocellulosic ethanol production. An advantage of S. cerevisiae over bacteria (e.g. Z. mobilis and E. coli) is that it has high ethanol tolerance and operates at low-pH fermentation conditions, thus minimizing the potential for contamination (Dien et al. 2003). Wild-type and existing industrial strains of S. cerevisiae can read-ily ferment glucose, mannose, and fructose, as well as disaccharides like sucrose and maltose to ethanol. However, they are not able to ferment pentoses (e.g. xylose and arabinose), which represent up to 40% of total biomass carbohydrates. Since the utilization of the pentose sugar stream contributes significantly to the overall process economics, it is desirable to manipulate wild-type S. cerevisiae to broaden its sub-strate range. As a result, recombinant DNA technologies and metabolic engineering have been applied to S. cerevisiae.
To ferment xylose to ethanol in S. cerevisiae, the xylose flux needs to be incorpo-rated in the pentose phosphate pathway. This incorporation requires two steps: the reaction from xylose to xylitol catalyzed by xylose reductase (XR), and the reaction from xylitol to xylulose catalyzed xylitol dehydrogenase (XDH). These two enzymes were found to enable xylose fermentation in yeasts like P. stipitis and Candida she-hatae. Therefore, it seemed logical that expression of XR and XDH in S. cerevisiae would also enable the entry of xylose into the pentose phosphate pathway.

172 Lu and Mosier Prior to incorporating xylose into the cell’s central metabolism, the pentose sugar
has to be transported into the cell through the membrane. Since no transporters spe-cific to xylose have been reported in S. cerevisiae, it is believed that the facilitated diffusion of xylose is carried out by glucose transporters. However, glucose trans-porters have a much higher affinity to glucose (Hahn-Hägerdal et al. 1994). There-fore, when both glucose and xylose are present in the fermentation medium, glucose will be preferentially transported and fermented to ethanol; while the transport of xylose is normally delayed until the majority of the glucose is consumed. This delay limits simultaneous fermentation of mixed stream of sugars. The resulting increased fermentation time poses the risk of higher capital costs (higher fermentation tank volume) and greater potential for bacterial contamination. Research on specific xy-lose transporters in native xylose-fermenting yeasts revealed the existence of two distinct types: one is of low-affinity and analogous to glucose transporters in S. cere-visiae, and the second type is of high affinity and coupled with a proton symport. Expression of the high-affinity types in S. cerevisiae has not been successful to date (Hahn-Hägerdal 2001).
Ho and colleagues from Purdue University developed a recombinant S. cerevisiae strain that is capable of co-fermenting glucose and xylose (Ho et al. 1998). The over-all strategy relied on the expression of xylose reductase (XR) and xylitol dehydro-genase (XDH) genes from P. stipitis, and amplification of the xylulokinase (XK) gene from S. cerevisiae. The native host was a high-ethanol-tolerant yeast strain Sac-charomyces 1400 (a product of fusion between Saccharomyces diastaticus and Sac-charomyces uvarum), and the strain was transformed with a high-copy-number yeast-E. coli shuttle plasmid (pLNH) generated by ligating a three-gene cassette containing KK, AR, and KD genes (which are modified XK, XR, and XDH genes, respectively), into plasmid pUCKm10. The antibiotic selectable marker on the plas-mid was used to identify the pLNH transformants. The resulting strain pLNH33 was shown to be able to ferment a 52.8 g/L glucose and 56.3 g/L xylose mixture resulting in an ethanol concentration of 47.9 g/L after 36 h. The ethanol yield from this ex-periment (for data up to 24 h) reached 90% of the theoretical yield (Krishnan et al. 1999). Integration of these genes into the yeast chromosomes (polyploid) resulted in a stable transformant that did not require the use of antibiotics to maintain selective pressure (Ho et al. 1998).
Ho and colleagues attributed the good performance of this strain to the highly ef-fective promoters (from the alcohol dehydrogenase and pyruvate kinase genes) con-trolling the expression of the XDH, XR and XK genes (Ho et al. 1998). As a result, the expression of these heterologous genes did not require the presence of xylose for induction, and was not repressed by the presence of glucose. In addition, the use of antibiotic (kanamycin and ampillin) resistance genes provided ease of transforming robust diploid/polyploid industrial yeast strains. However, it should be noted that approximately 10 g/L glycerol was formed at the end of the fermentation, which is an undesirable byproduct. Knocking out that pathway may help improve the final ethanol yield. It is also known that for yeast metabolism glycerol formation helped re-establish the system’s redox balance.
Hahn-Hägerdal’s group from Lund University in Sweden (Walfridsson et al. 1997) employed the same idea of the “XR + XDH” route and constructed vectors

Current Technologies for Lignocellulosic Fuels 173
expressing XR:XDH activities at different levels (ranging from 17.5 to 0.06). It was found that when the XR:XDH activity ratio was 17.5, 0.82 g xylitol/g-xylose was formed (ethanol concentration at 6.65 g/L), whereas at a ratio of 0.06, no xylitol was detected and ethanol concentration increased to about 7.45 g/L. The authors postu-lated that the main reason for an improved ethanol yield with a decreased ratio of XR:XDH activity was that the reaction equilibrium was changed and the redox im-balance had been partially addressed. Noteworthy here is that the fermentation oc-curred over approximately 50 h, with a starting feed composition of 20 g/L glucose and 20 g/L xylose in a synthetic complete minimum medium. Therefore, it was equivalent to approximately 74% of theoretical ethanol yield. Compared to the work by Ho et al. (Ho et al. 1998), this study relied on a different Saccharomyces host strain (S. cerevisiae H158) that did not contain a recombinant xylulokinase gene. The XR and XDH genes were, however, under control of the alcohol dehydrogenase promoter, which is a strong glycolytic promoter. Though the results were not quite satisfying in terms of the fermentation profile, the profound consequences of ma-nipulating XR:XDH ratios may lead to further improvements by identifying other rate-limiting enzymes in the pentose fermentation process (Karhumaa et al. 2007).
Ho’s work discussed above represents a classic example of the early efforts in metabolic engineering, which may be more appropriately regarded as genetic engi-neering. Such approaches were based on known facts of native xylose-fermenting microorganisms, by expressing heterologous enzymes into native Saccharomyces species to generate recombinant strains with an acquired xylose fermenting pathway. The success potential of such approaches, however, is strongly dependent on host strain selection, plasmid design strategy, and plasmid stability. These studies did not take advantage of modeling tools for mapping the whole xylose fermentation path-way in recombinant S. cerevisiae strains, and quantification of intracellular fluxes.
Based upon the concept of inverse metabolic engineering, Stephanopoulos and his group developed a recombinant S. cerevisiae strain with improved xylose fer-menting ability (Jin et al. 2005). The host strain was S. cerevisiae YS1020 (contains XR+XDH genes), and it was transformed with a genomic DNA library of P. stipitis (CBS5774). The fast-growing transformants were screened out by serial transfer on xylose minimal medium, based on the assumption that genes increasing xylose up-take likewise increase cell growth rate on xylose. The PsTAL1 gene, encoding a transaldolase, was then overexpressed in the YSX3 strain (contains XR+XDH+XK genes), and the resulting YSX3-TAL1M strain exhibited 14-times higher transaldo-lase activity. Compared to the control strain, the xylose uptake rate of YSX3-TAL1 doubled; however, the specific ethanol productivity was only increased by 70%. This might be because the selection criteria was intended for maximizing growth rate under aerobic conditions, instead of anaerobic fermentation conditions for ethanol accumulation.
6.4.2 Zymomonas mobilis
Z. mobilis has also been advocated as a biocatalyst for lignocellulosic fuel ethanol production. Unlike S. cerevisiae, Z. mobilis utilizes the Entner-Doudoroff pathway

174 Lu and Mosier
(instead of the Embden-Meyerhoff-Parnas pathway, i.e. glycolysis) anaerobically to produce ethanol from sugars. Since only one mole of ATP is generated per mole of sugar consumed, glucose metabolism is very high to compensate for the low energy yield, leading to high ethanol productivity. Compared to traditional yeast fermenta-tion, Z. mobilis can achieve 5–10% higher yields and up to five-fold higher volumet-ric productivity (Lawford 1988).
Similar to S. cerevisiae, Z. mobilis can only ferment hexoses to ethanol, and thus is not able to ferment xylose. Recombinant strains of Z. mobilis were metabolically engineered to ferment xylose to ethanol. One of the first successes led by Zhang and coworkers at National Renewable Energy Laboratory expressed four heterologous E. coli enzymes: xylose isomerase (XI), xylose kinase (XK), transketolase (TKT), and transaldolase (TAL) into a host Z. mobilis strain (Zhang et al. 1995). XI and XK convert xylose into xylulose-4-phosphate, which can be further converted to inter-mediates of the Entner-Doudoroff pathway. The recombinant Z. mobilis CP4 (pZB5) was able to grow on mixed glucose and xylose media and reach a 95% ethanol yield within 30 h (Zhang et al. 1995). The major hurdles to industrial adaptation of recom-binant Z. mobilis are relative unfamiliarity with bacterial ethanol fermentation in the industry, the potential for contamination due to the need to maintain the fermentation at neutral pH, and lower cell hardiness compared to yeast.
6.4.3 Escherichia coli
Transformation of E. coli for ethanol production was among the very first successful examples of metabolic engineering (Dien et al. 2003). Wild type E. coli can ferment a broad spectrum of sugars to mixed acids (e.g. lactic acid, acetic acid and formic acid), while ethanol is a minor product. The metabolic pathway employed by E. coli is different from that of S. cerevisiae and Z. mobilis: pyruvate is converted to acetyl-CoA which is further reduced to acetate and ethanol, therefore only half of the theo-retical ethanol yield can be achieved with E. coli when compared to the pyruvate decarboxylase (PDC) ethanol pathway in Z. mobilis. Some early efforts by Brau and coworkers (Brau and Sahm 1986) in overexpressing Z. mobilis PDC genes did shift the balance towards ethanol production. However, low ethanol tolerance was ob-served due to an insufficient alcohol dehydrogenase (ADH) level. Continuing work confirmed that by simultaneously overexpressing PDC and ADH genes, a high level of final ethanol concentration can be achieved. Ingram and colleagues constructed a portable ethanol production cassette (PET) and opened up possibilities for engineer-ing different organisms for ethanol production. ATCC11303 (E. coli B) strain ap-peared to be the best host for integrating the PET vector, producing over 1,000 mM ethanol from hemicellulose hydrolysate sugars (Ingram et al. 1998, 1999). However, the public perception with potential pathogenity of E. coli makes it difficult to adapt such a process to the fuel ethanol industry. Meanwhile, use of the spent biomass from E. coli as an animal feed ingredient has not been thoroughly evaluated (Dien et al. 2003).

Current Technologies for Lignocellulosic Fuels 175
6.5 Ethanol Recovery: Distillation and Dehydration
Under ideal conditions, an ethanol and water mixture can be separated based on their difference in volatility. Because ethanol is more volatile than water (ethanol vapor-izes at 78°C whereas water vaporizes at 100°C), upon heating the ratio of ethanol-to-water in the vapor phase will become greater than that in the liquid phase. Therefore, in an ideal distillation column separation, the overhead product will be mainly etha-nol and stillage water will be the main bottom product. An azeotropic mixture of ethanol (95.6%). and water (4.4%) will be reached upon completion of distillation operation, which is determined by the difference in the boiling points between water and ethanol (Fair 2001). Because the ethanol-water mixture from fermentation is far from being ideal, the actual ethanol recovery process is a multistage, highly inte-grated process (Wankat 1988).
In a lignocellulosic fuel process, upon completion of the fermentation, the liquor consists of a mixed stream of solids and liquids. Distillation and molecular sieve dehydration operations have to be used to recover a pure ethanol product from to produce fuel-grade ethanol (>99.5%). The fermentation beer is preheated with flash vapor from the pretreatment reactor (Aden et al. 2002; Kwiatkowski et al. 2006). The beer is then fed into a beer column, which removes CO2 out of the top and about 90% of water out of the bottom, while the majority of the ethanol is removed from a vapor side-draw and fed to a rectification column (Aden et al. 2002). The product from the rectification column is an azeotropic mixture at an optimal point that can not be further improved by distillation operations. Therefore, effluent from the recti-fication column is fed to a dehydration separation unit, typically a vapor phase mo-lecular sieve adsorption unit operation. Molecular sieves are crystalline metal alumi-nosilicates (zeolites) with a 3-D porous structure of silica and tetrahedral alumina (Kresge and Dhingra 2004). Zeolite materials can strongly and preferentially adsorb water from vapor mixtures, thus they are able to remove the remaining 4.4% water content in the azeotropic mixture from the rectification column.
Minimization of total energy input is a critical requirement for an economic de-sign of an ethanol distillation/dehydration system. Within the past 40 years, installa-tion of multistage, pressure distillation systems have reduced energy consumption by 50%, compared to the earlier all-atmospheric pressure systems (Madson 2003). In modern molecular sieve dehydration systems, “pressure swing adsorption” is em-ployed to remove the water content: a relatively high pressure is applied at the water removal stage and a relatively low pressure is applied at the desiccant regeneration stage. Therefore, operation temperature can be kept almost constant, and the heat of adsorption can be effectively stored and further supplied to the regeneration stage (Swain 2003).
An alternative to molecular sieve material is corn grits (Ladisch and Dyck 1979). Corn grits can selectively remove water from an azeotropic mixture and are advanta-geous in that the materials are biorenewable, of low cost, and easily disposable. However, a major drawback of the corn grits is its mechanical stability over a long period of time (Beery and Ladisch 2001).

176 Lu and Mosier
6.6 Perspectives on Advanced Biochemical Conversion Technologies
The above sections reviewed the currently available technologies for fuel ethanol production from lignocellulosic plant biomass. These technologies are achievements of many years of persistent, innovative, and collaborative R&D efforts by research-ers worldwide in the biofuels field. Many of these technologies have been optimized systematically and therefore represent the most advanced technology platforms cur-rently available for implementation to biorefinery scales. In 2007, the U.S. Depart-ment of Energy announced US$385 million in federal funding for six biorefinery projects over a period of 4 years. When fully operational, these biorefinery plants are expected to produce more than 130 million gallons (493 million liter) of lignocellu-losic ethanol per year.
However, current technologies are still of relatively high processing cost, and the many factors that impede a highly efficient lignocellulosic ethanol process are not yet well understood. A true competitive process without needs for federal subsidy has to be developed to eventually replace large volumes of transportation fuels that are currently produced from petrochemical sources.
There are multiple process configurations for biorefineries, with separation hy-drolysis and fermentation (SHF) and simultaneous saccharification and fermentation (SSF) currently being the most common. Though there are differing opinions on the process economics of SHF vs. SSF (Lynd et al. 1996; Wingren et al. 2003), it is clear that integrating multiple reaction steps into a single step would allow substantial improvement in process economics and efficiency (Lynd et al. 1996). Consolidated bioprocessing (CBP), which accomplishes cellulase production, enzymatic hydroly-sis, and ethanol fermentation in one step, may be the ideal process configuration for future biorefineries. To achieve CBP, it is necessary to engineer a single microorgan-ism or a consortium of mixed-culture microbes. Clostridium thermocellum and Sac-charomyces spp. are of particular interest (Fujita et al. 2004, 2002; Lynd et al. 1996).
In terms of novel catalyst development, a biomimetic approach using syn-thetic/hybrid catalysts mimicking cellulases structurally or mechanistically could be promising (Shimada and Takahashi 1991). The question is whether one can apply the principles of enzyme-catalyzed cellulose hydrolysis to the invention of novel syn-thetic molecules which possess a similar high catalytic ability, without the draw-backs of natural enzymes. Here, developments in the understanding of structure and catalytic mechanism of cellulolytic enzyme systems, as well as rapid progress in biomimetic chemistry, make this approach a possibility (Arai and Ogiwara 1976; Arai et al. 1975; Breslow 1995; Kiefer et al. 1972; Kirby 1994; Lu and Mosier 2007; Motherwell et al. 2001; Oleary 1984).
One other area that has only recently received much attention is the genetic basis of plant cell wall recalcitrance. There are possibilities and opportunities for plant breeding and/or genetic modifications to substantially improve enzymatic digestibil-ity or efficacy of pretreatment to lower the cost of generating fermentable sugars from lignocellulosic materials (Himmel et al. 2007; Sticklen 2006). A systems ap-proach to understanding the biosynthesis of plant cell wall components has begun to yield insights into the molecular basis for recalcitrance to enzymatic hydrolysis (Lerouxel et al. 2006; Somerville et al. 2004; Yong et al. 2005). Of particular interest

Current Technologies for Lignocellulosic Fuels 177
has been the biosynthesis of lignin. Mutations affecting lignin synthesis have been shown to improve cellulose digestibility by cellulases in maize (Marita et al. 2003) and poplar (Hu et al. 1999). As this field continues to develop, it is hoped that better understanding of the interaction between plant cell wall structure and processing performance will yield improved crops that are tailor-made for advanced thermo-chemical and biological processing technologies to yield fuels and chemicals in a low-cost, efficient, and sustainable manner.
Acknowledgements
The authors would like to thank Arun Athmanathan, Scott Stella, and Elizabeth Ca-sey for their helpful suggestions on preparing the manuscript.
References
Aden, A.M.R., Ibsen, K., Jechura, J., Neeves, K., Sheehan, J., and Wallace, B. (2002). Ligno-cellulosic biomass to ethanol process design and economics utilizing co-current dilute acid prehydrolysis and enzymatic hydrolysis for corn stover. NREL/TP-510-32438, 36–39.
Administration, E.I. (2007). Basic Petroleum Statistics. http://www.eia.doe.gov/neic/quick-facts/quickoil.html.
Arai, K., and Ogiwara, Y. (1976). Studies on hydrolysis reaction of model substances of cellu-lose in presence of polymer catalysts .5. Heterogeneous hydrolysis of fibrous cellulose in presence of polyvinyl alcohol-co-vinylsulfonic acid). Makromol Chem. 177, 367–373.
Arai, K., Ogiwara, Y., and Ise, N. (1975). Studies on hydrolysis reaction of model substances of cellulose in presence of a polymeric catalyst .4. Michaelis-menten type catalytic behav-ior of polyvinyl alcohol co-vinyl sulfonic acid). Makromol Chem. 176, 2871–2881.
Baker, J.O., Ehrman, C.I., Adney, W.S., Thomas, S.R., and Himmel, M.E. (1998). Hydrolysis of cellulose using ternary mixtures of purified celluloses. Appl. Biochem. Biotechnol. 70–72, 395–403.
Baker, J.O., McCarley, J.R., Lovettt, R., Yu, C.H., Adney, W.S., Rignall, T.R., Vinzant, T.B., Decker, S.R., Sakon, J., and Himmel, M.E. (2005). Catalytically enhanced endocellulase Cel5A from acidothermus cellulolyticus. Appl. Biochem. Biotechnol. 121, 129–148.
Beery, K.E., and Ladisch, M.R. (2001). Adsorption of water from liquid-phase ethanol-water mixtures at room temperature using starch-based adsorbents. Ind. Eng.Chem. Res. 40, 2112–2115.
Beguin, P., and Aubert, J.P. (1994). The biological degradation of cellulose. FEMS Microbiol. Rev. 13, 25–58.
Boraston, A.B., Bolam, D.N., Gilbert, H.J., and Davies, G.J. (2004). Carbohydrate-binding modules: fine-tuning polysaccharide recognition. Biochem J. 382, 769–781.
Brau, B., and Sahm, H. (1986). Cloning and expression of the structural gene for pyruvate decarboxylase of Zymomonas mobilis in Escherichia coli. Archiv. Microbiol. 144, 296–301.
Breslow, R. (1995). Biomimetic chemistry and artificial enzymes – Catalysis by design. Acc. Chem. Res. 28, 146–153.
Brownell, H.H., Yu, E.K.C., and Saddler, J.N. (1986). Steam-explosion pretreatment of wood – effect of chip size, acid, moisture-content and pressure-drop. Biotechnol. Bioeng. 28, 792–801.
Bungay, H.R. (1981). Energy, The Biomass Options. Chapter 7, "Fractionation and Pretreat-ment". John Wiley & Sons, New York. 347pp.

178 Lu and Mosier
Campbell, C.J., and Laherrere, J.H. (1998). Preventing the next oil crunch – The end of cheap oil. Sci. Am. 278, 77–83.
Carpita, N.C. (1996). Structure and biogenesis of the cell walls of grasses. Annu. Rev. Plant Physiol. Plant Mol. Biol. 47, 445–476.
Chang, V.S., and Holtzapple, M.T. (2000). Fundamental factors affecting biomass enzymatic reactivity. Appl. Biochem. Biotechnol. 84–86, 5–37.
Collins, T., Gerday, C., and Feller, G. (2005). Xylanases, xylanase families and extremophilic xylanases. FEMS Microbiol. Rev. 29, 3–23.
Dale, B.E., Leong, C.K., Pham, T.K., Esquivel, V.M., Rios, I., and Latimer, V.M. (1996). Hydrolysis of lignocellulosics at low enzyme levels: Application of the AFEX process. Bioresource Technol. 56, 111–116.
Dien, B.S., Cotta, M.A., and Jeffries, T.W. (2003). Bacteria engineered for fuel ethanol pro-duction: current status. Appl. Microbiol. Biotechnol. 63, 258–266.
Din, N., Damude, H.G., Gilkes, N.R., Miller, R.C., Warren, R.A.J., and Kilburn, D.G. (1994). C-1-C-X revisited – Intramolecular synergism in a cellulase. Proc. Natl. Acad. Sci. USA 91, 11383–11387.
Divne, C., Stahlberg, J., Teeri, T.T., and Jones, T.A. (1998). High-resolution crystal structures reveal how a cellulose chain is bound in the 50 angstrom long tunnel of cellobiohydrolase I from Trichoderma reesei. J. Mol. Biol. 275, 309–325.
Fair, J.R. (2001). Distillation. Kirk-Othmer Encyc. Chem. Technol. 8, 739–785. Farrell, A.E., Plevin, R.J., Turner, B.T., Jones, A.D., O'Hare, M., and Kammen, D.M. (2006).
Ethanol can contribute to energy and environmental goals. Science 311, 506–508. Fujita, Y., Ito, J., Ueda, M., Fukuda, H., and Kondo, A. (2004). Synergistic saccharification,
and direct fermentation to ethanol, of amorphous cellulose by use of an engineered yeast strain codisplaying three types of cellulolytic enzyme. Appl. Environ. Microbiol. 70, 1207–1212.
Fujita, Y., Takahashi, S., Ueda, M., Tanaka, A., Okada, H., Morikawa, Y., Kawaguchi, T., Arai, M., Fukuda, H., and Kondo, A. (2002). Direct and efficient production of ethanol from cellulosic material with a yeast strain displaying cellulolytic enzymes. Appl. Envi-ron. Microbiol. 68, 5136–5141.
Goldstein, I.S., and Easter, J.M. (1992). An improved process for converting cellulose to ethanol. TAPPI J. 75, 135–140.
Grant, L. (2005). When will the oil run out? Science 309, 52–54. Hahn-Hägerdal, B., Jeppsson, H., Skoog, K., and Prior, B.A. (1994). Biochemistry and physi-
ology of xylose fermentation by yeasts. Enzyme Microb. Technol. 16, 933–943. Hahn-Hägerdal, W.C., Gardonyi, M., van Zyl, W.H., Cordero Otero, R.R., and Jonsson, L.J.
(2001). Metabolic engineering of Saccharomyces cerevisiae for xylose utilization. Adv Biochem. Eng. Biotechnol. 73, 53–84.
Henrissat, B., Driguez, H., Viet, C., and Schulein, M. (1985). Synergism of cellulases from Trichoderma-Reesei in the degradation of cellulose. Bio-Technol. 3, 722–726.
Himmel, M.E., Adney, W.S., Baker, J.O., Elander, R., McMillan, J.D., Nieves, R.A., Sheehan, J.J., Thomas, S.R., Vinzant, T.B., and Zhang, M. (1997). Advanced bioethanol production technologies: a perspective. ACS Sym. Ser. 666, 2–45.
Himmel, M.E., Ding, S.Y., Johnson, D.K., Adney, W.S., Nimlos, M.R., Brady, J.W., and Foust, T.D. (2007). Biomass recalcitrance: Engineering plants and enzymes for biofuels production. Science 315, 804–807.
Himmel, M.E., Ruth, M.F., and Wyman, C.E. (1999). Cellulase for commodity products from cellulosic biomass. Curr. Opin. Biotech. 10, 358–364.

Current Technologies for Lignocellulosic Fuels 179
Ho, N.W.Y., Chen, Z.D., and Brainard, A.P. (1998). Genetically engineered Sacccharomyces yeast capable of effective cofermentation of glucose and xylose. Appl. Environ. Micro-biol. 64, 1852–1859.
Hu, W.J., Harding, S.A., Lung, J., Popko, J.L., Ralph, J., Stokke, D.D., Tsai, C.J., and Chiang, V.L. (1999). Repression of lignin biosynthesis promotes cellulose accumulation and growth in transgenic trees. Nature Biotechnol. 17, 808–812.
Ingram, L.O., Aldrich, H.C., Borges, A.C.C., Causey, T.B., Martinez, A., Morales, F., Saleh, A., Underwood, S.A., Yomano, L.P., York, S.W., Zaldivar, J., and Zhou, S.D. (1999). En-teric bacterial catalysts for fuel ethanol production. Biotechnol. Prog. 15, 855–866.
Ingram, L.O., Gomez, P.F., Lai, X., Moniruzzaman, M., Wood, B.E., Yomano, L.P., and York, S.W. (1998). Metabolic engineering of bacteria for ethanol production. Biotechnol. Bioeng. 58, 204–214.
Iogen Corporation (2005) Iogen Technology Makes it Possible. http://www.iogen.ca/cellulose _ethanol/what_is_ethanol/process.html.
Jin, Y.S., Alper, H., Yang, Y.T., and Stephanopoulos, G. (2005). Improvement of xylose uptake and ethanol production in recombinant Saccharomyces cerevisiae through an in-verse metabolic engineering approach. Appl. Environ. Microbiol. 71, 8249–8256.
Karhumaa, K., Fromanger, R., Hahn-Hägerdal, B., and Gorwa-Grauslund, M.F. (2007). High activity of xylose reductase and xylitol dehydrogenase improves xylose fermentation by recombinant Saccharomyces cerevisiae. Appl. Microbiol. Biotechnol. 73, 1039–1046.
Kiefer, H.C., Klotz, I.M., Scarpa, I.S., and Congdon, W.I. (1972). Catalytic accelerations of 1012-fold by an enzyme-like synthetic polymer. Proc. Natl. Acad. Sci. USA 69, 2155–2159.
Kirby, A.J. (1994). Enzyme mimics. Angew. Chem. 33, 551–553. Kresge, C.T., Dhingra, S.S. (2004). Molecular Sieves. Kirk-Othmer Encyclopedia of Chemi-
cal Technology 16, 811–853. Krishnan, M.S., Ho, N.W.Y., and Tsao, G.T. (1999). Fermentation kinetics of ethanol produc-
tion from glucose and xylose by recombinant Saccharomyces 1400(pLNH33). Appl. Bio-chem. Biotech. 77–9, 373–388.
Kwiatkowski, J.R., Mcaloon, A.J., Taylor, F., and Johnston, D.B. (2006). Modeling the proc-ess and costs of fuel ethanol production by the corn dry-grind process. Indust. Crops Prod. 23, 288–296.
Ladisch, M.R., and Dyck, K. (1979). Dehydration of ethanol – New approach gives positive energy-balance. Science 205, 898–900.
Lawford, H.G. (1988). A new approach to improving the performance of zymomonas in con-tinuous ethanol fermentations. Appl. Biochem. Biotech. 17, 203–219.
Lerouxel, O., Cavalier, D.M., Liepman, A.H., and Keegstra, K. (2006). Biosynthesis of plant cell wall polysaccharides – a complex process. Curr. Opin. Plant Biol. 9, 621–630.
Linder, M., and Teeri, T.T. (1997). The roles and function of cellulose-binding domains. J. Biotechnol. 57, 15–28.
Lloyd, T.A., and Wyman, C.E. (2005). Combined sugar yields for dilute sulfuric acid pre-treatment of corn stover followed by enzymatic hydrolysis of the remaining solids. Biores. Technol. 96, 1967–1977.
Lu, Y.L., and Mosier, N.S. (2007). Biomimetic catalysis for hemicellulose hydrolysis in corn stover. Biotechnol. Progr. 23, 116–123.
Lynd, L.R., Cushman, J.H., Nichols, R.J., and Wyman, C.E. (1991). Fuel ethanol from cellu-losic biomass. Science 251, 1318–1323.
Lynd, L.R., Elander, R.T., and Wyman, C.E. (1996). Likely features and costs of mature biomass ethanol technology. Appl. Biochem. Biotech. 57-8, 741–761.
Lynd, L.R., van Zyl, W.H., McBride, J.E., and Laser, M. (2005). Consolidated bioprocessing of cellulosic biomass: an update. Curr. Opin. Biotechnol. 16, 577–583.
180 Lu and Mosier
Lynd, L.R., Wyman, C.E., and Gerngross, T.U. (1999). Biocommodity engineering. Biotech-nol. Progr. 15, 777–793.
Madson, P.W. (2003). Ethanol distillation: the fundamentals. The Alcohol Textbook 4th Edi-tion. Nottingham University Press, University of Nottingham, England. 446pp.
Marita, J.M., Vermerris, W., Ralph, J., and Hatfield, R.D. (2003). Variations in the cell wall composition of maize brown midrib mutants. J. Agric. Food Chem. 51, 1313–1321.
McMillan, J.D. (1994). Pretreatment of lignocellulosic biomass. ACS Symp. Ser. 566, 292–324.
Mok, W.S.L., and Antal, M.J. (1992). Uncatalyzed solvolysis of whole biomass hemicellulose by hot compressed liquid water. Ind. Eng. Chem. Res. 31, 1157–1161.
Mosier, N., Hendrickson, R., Ho, N., Sedlak, M., and Ladisch, M.R. (2005a). Optimization of pH controlled liquid hot water pretreatment of corn stover. Biores. Technol. 96, 1986–1993.
Mosier, N., Wyman, C., Dale, B., Elander, R., Lee, Y.Y., Holtzapple, M., and Ladisch, M. (2005b). Features of promising technologies for pretreatment of lignocellulosic biomass. Biores. Technol. 96, 673–686.
Mosier, N.S., Hendrickson, R., Brewer, M., Ho, N., Sedlak, M., Dreshel, R., Welch, G., Dien, B.S., Aden, A., and Ladisch, M.R. (2005c). Industrial scale-up of pH-controlled liquid hot water pretreatment of corn fiber for fuel ethanol production. Appl. Biochem. Biotechnol. 125, 77–97.
Motherwell, W.B., Bingham, M.J., and Six, Y. (2001). Recent progress in the design and synthesis of artificial enzymes. Tetrahedron 57, 4663–4686.
Oleary, S. (1984). Aromatic sulfonates and the hydrolysis of 2-(Para-Nitrophenoxy)Tetrahydropyran. Canad. J. Chem. 62, 1320–1324.
Palmqvist, E., and Hahn-Hägerdal, B. (2000). Fermentation of lignocellulosic hydrolysates. I: inhibition and detoxification. Biores. Technol. 74, 17–24.
Polizeli, M.L.T.M., Rizzatti, A.C.S., Monti, R., Terenzi, H.F., Jorge, J.A., and Amorim, D.S. (2005). Xylanases from fungi: properties and industrial applications. Appl. Microbiol. Biotechnol. 67, 577–591.
Reese, E.T., Siu, R.G.H., and Levinson, H.S. (1950). The biological degradation of soluble cellulose derivatives and its relationship to the mechanism of cellulose hydrolysis. J. Bac-teriol. 59, 485–497.
Saeman, J.F. (1945). Kinetics of wood saccharification – Hydrolysis of cellulose and decom-position of sugars in dilute acid at high temperature. Industr. Eng. Chem. 37, 43–52.
Shallom, D., and Shoham, Y. (2003). Microbial hemicellulases. Curr. Opin. Microbiol. 6, 219–228.
Sheehan, J., and Himmel, M. (1999). Enzymes, energy, and the environment: A strategic perspective on the U.S. Department of Energy's research and development activities for bioethanol. Biotechnol Progr. 15, 817–827.
Shimada, M., and Takahashi, M. (1991). Wood and cellulosic chemistry. In: Biodegradation of Cellulosic Materials. (D.N.-S. Hon and N. Shiraishi, Eds.) Marcel. Dekker, New York. P. 621.
Somerville, C., Bauer, S., Brininstool, G., Facette, M., Hamann, T., Milne, J., Osborne, E., Paredez, A., Persson, S., Raab, T., Vorwerk, S., and Youngs, H. (2004). Toward a systems approach to understanding plant-cell walls. Science 306, 2206–2211.
Sticklen, M. (2006). Plant genetic engineering to improve biomass characteristics for biofuels. Curr. Opin. Biotechnol. 17, 315–319.
Swain, R.L.B. (2003). Development and operation of the molecular sieve: an industry stan-dard. The Alcohol Textbook 4th Edition. Nottingham University Press, University of Not-tingham, England. 446pp.

Current Technologies for Lignocellulosic Fuels 181
Teeri, T.T. (1997). Crystalline cellulose degradation: New insight into the function of cello-biohydrolases. Trends Biotechnol. 15, 160–167.
Teeri, T.T., Koivula, A., Linder, M., Wohlfahrt, G., Divne, C., and Jones, T.A. (1998). Trichoderma reesei cellobiohydrolases: why so efficient on crystalline cellulose? Bio-chem. Soc. Trans. 26, 173–178.
Teymouri, F., Laureano-Perez, L., Alizadeh, H., and Dale, B.E. (2005). Optimization of the ammonia fiber explosion (AFEX) treatment parameters for enzymatic hydrolysis of corn stover. Bioresource Technol. 96, 2014–2018.
Torget, R.W., Kim, J.S., and Lee, Y.Y. (2000). Fundamental aspects of dilute acid hydroly-sis/fractionation kinetics of hardwood carbohydrates. 1. Cellulose hydrolysis. Ind. Eng. Chem. Res. 39, 2817–2825.
Um, B.H., Karim, M.N., and Henk, L.L. (2003). Effect of sulfuric and phosphoric acid pre-treatments on enzymatic hydrolysis of corn stover. Appl. Biochem. Biotechnol. 105, 115–125.
U. S. DOE (2005). Pretreatment. http://www1.eere.energy.gov/biomass/pretreatment.html. Walfridsson, M., Anderlund, M., Bao, X., and Hahn-Hägerdal, B. (1997). Expression of dif-
ferent levels of enzymes from the Pichia stipitis XYL1 and XYL2 genes in Saccharomy-ces cerevisiae and its effects on product formation during xylose utilisation. Appl. Micro-biol. Biotechnol. 48, 218–224.
Wang, L.S., Zhang, Y.Z., Gao, P.J., Shi, D.X., Liu, H.W., and Gao, H.J. (2006). Changes in the structural properties and rate of hydrolysis of cotton fibers during extended enzymatic hydrolysis. Biotechnol. Bioeng. 93, 443–456.
Wang, M. (2005). The debate on energy and greenhouse gas emissions impacts of fuel etha-nol. Energy Systems Division Seminar, Argonne National Laboratory, University of Chi-cago. www.transportation.anl.gov/pdfs/TA/347.pdf.
Wankat, P.C. (1988). Equilibrium staged separations: separations in chemical engineering. Elsevier. New York, 707pp.
Weil, J., Sarikaya, A., Rau, S.L., Goetz, J., Ladisch, C.M., Brewer, M., Hendrickson, R., and Ladisch, M.R. (1997). Pretreatment of yellow poplar sawdust by pressure cooking in wa-ter. Appl. Biochem. Biotech. 68, 21–40.
Weil, J., Westgate, P., Kohlmann, K., and Ladisch, M.R. (1994). Cellulose pretreatments of lignocellulosic substrates. Enzyme Microb. Technol. 16, 1002–1004.
Weil, J.R., Sarikaya, A., Rau, S.L., Goetz, J., Ladisch, C.M., Brewer, M., Hendrickson, R., and Ladisch, M.R. (1998). Pretreatment of corn fiber by pressure cooking in water. Appl. Biochem. Biotechnol. 73, 1–17.
Wingren, A., Galbe, M., and Zacchi, G. (2003). Techno-economic evaluation of producing ethanol from softwood: Comparison of SSF and SHF and identification of bottlenecks. Biotechnol Progr. 19, 1109–1117.
Withers, S.G. (2001). Mechanisms of glycosyl transferases and hydrolases. Carbohydr. Polym. 44, 325–337.
Wyman, C.E. (1999). Biomass ethanol: Technical progress, opportunities, and commercial challenges. Annu. Rev. Energy Env. 24, 189–226.
Wyman, C.E. (2003). Potential synergies and challenges in refining cellulosic biomass to fuels, chemicals, and power. Biotechnol Progr. 19, 254–262.
Wyman, C.E., Dale, B.E., Elander, R.T., Holtzapple, M., Ladisch, M.R., and Lee, Y.Y. (2005). Coordinated development of leading biomass pretreatment technologies. Biore-source Technol. 96, 1959–1966.
Yang, B., and Wyman, C.E. (2004). Effect of xylan and lignin removal by batch and flow-through pretreatment on the enzymatic digestibility of corn stover cellulose. Biotechnol. Bioeng. 86, 88–95.

182 Lu and Mosier
Yong, W.D., Link, B., O'Malley, R., Tewari, J., Hunter, C.T., Lu, C.A., Li, X.M., Bleecker, A.B., Koch, K.E., McCann, M.C., McCarty, D.R., Patterson, S.E., Reiter, W.D., Staiger, C., Thomas, S.R., Vermerris, W., and Carpita, N.C. (2005). Genomics of plant cell wall biogenesis. Planta 221, 747–751.
Zhang, M., Eddy, C., Deanda, K., Finkestein, M., and Picataggio, S. (1995). Metabolic engi-neering of a pentose metabolism pathway in ethanologenic Zymomonas mobilis. Science 267, 240–243.


Part II

7 Genetic Improvement of Corn for Lignocellulosic Feedstock Production
Natalia de Leon1 and James G. Coors2 1 University of Wisconsin, Department of Agronomy, 1575 Linden Drive, Madison, WI
53706, [email protected] 2 University of Wisconsin, Department of Agronomy, 1575 Linden Drive, Madison, WI
53706, [email protected]
7.1 Introduction
Starch from corn, also referred to as maize (Zea mays L. ssp. mays), is currently the predominant source of biofuels in the United States (U.S.), as discussed in Chapter 2. While corn starch is likely to remain an important feedstock for ethanol, the demand for corn as a source of feed and food both within the U.S. and on a global scale is expected to limit the amount of ethanol that can be produced from starch. Corn stover, the vegetative residues remaining after the grain harvest, can, however, be used as a lignocellulosic feedstock for ethanol production. Given the large produc-tion area of corn, stover is currently the most abundant source of lignocellulosic biomass in the U.S. and has been recognized as the most promising source of bio-mass for the bioenergy industry in the near-term. Corn is an extremely diverse species, both genetically and phenotypically, and therefore able to adapt to a broad range of soil and environmental conditions world-wide. Until relatively recently, improvement of corn used as a forage for animals focused on increasing grain yield as a way to elevate the energy content of the over-all forage. Significant progress has been made to improve biomass yield and stover cell-wall traits, primarily as they relate to ruminant animal nutrition. Research is just now being developed to address the potential use of these materials for the biofuel industry. This chapter will focus on how corn can be improved to make it a better feedstock for ethanol and other green chemicals.
W. Vermerris (ed.), Genetic Improvement of Bioenergy Crops, DOI: 10.1007/978-0-387-70805 -8_7, © Springer Science+Business Media, LLC 2008

186 de Leon and Coors
7.2 Botanical Description of Corn
7.2.1 Corn Anatomy
The Poaceae (or Gramineae) form a large and extensive family of plants which com-prises approximately 10,000 species grouped in 600–700 different genera (Renvoize and Clayton 1992; Mathews et al. 2000). In addition to corn, this family includes important food and feed species such as wheat (Triticum aestivum L.), rice (Oryza sativa L.), barley (Hordeum vulgare L.) and oats (Avena sativa L.). Corn is a mem-ber of the Panicoideae subfamily. Other members of this subfamily are important biomass-producing species such as sorghum (Sorghum ssp.; Chapter 8), sugarcane (Saccharum spp.; Chapter 9), Miscanthus spp. and hybrids; Chapter 10), switchgrass (Panicum virgatum L.; Chapter 11) and pearl millet (Pennisetum glaucum (L.) R. Br.). Among other commonalities, all of these species share the unique physiological C4 photosynthetic pathway (Osborne and Beerling, 2006; see also Chapter 1).
As a member of the Poaceae family, corn shares many morphological similarities with other grasses. A characteristic feature is the series of modified structural units – referred to as phytomers –, that make up the plant. Each phytomer consists of a sec-tion of the axis including a node, an internode, an attached leaf and an axillary bud. The different parts that encompass the phytomers are modified depending on whether they are located in the vegetative or reproductive morphological regions, but the basic components remain the same throughout the plant. Grasses usually have conspicuous nodes in the stem and one leaf in each of those nodes. In corn, leaves are sessile and composed of a somewhat flexible leaf blade and a rigid leaf sheath that surrounds the stem internode. Leaves maintain a distichous arrangement along the main stem, i.e. two consecutive leaves are on the opposite side of the stem. Corn, sorghum and sugarcane are the only species within their subfamily to have solid internodes (as opposed to hollow ones), which represents a large proportion of the overall biomass produced by these plants (Jacobsen et al. 1992; Kiesselbach 1999).
As is common in other grasses, corn tends to form branches at every node and adventitious roots at the base of its internodes. Terminal inflorescences are normally formed in all elongated stems and branches. Grass flowers are produced in spikelets with each flower enclosed between the lemma and palea. Two glumes are formed at the base of each spikelet. Functional staminate (male) flowers are formed in the tassel located at the top of the main stem. Functional pistillate (female) flowers are developed in the ears that develop from lateral branches. Ear formation induces ter-mination of most lateral branches except tillers. Tillers are branches that arise from the lowermost nodes underneath the soil surface and may take roots. They tend to be genotype specific and are more common under low planting density. If a plant forms tillers, they generally form terminal staminate inflorescences, but they can also form terminal pistillate inflorescences or a mix of pistillate and staminate inflorescences depending on the variety, planting density and environmental conditions (de Leon and Coors 2002).
The pistillate inflorescence of corn is morphologically remarkable and differenti-ates this species from other related grasses. The ear of corn is generally composed of one hundred or more polystichously arranged cupules that are hidden from view by

Genetic Improvement of Corn for Lignocellulosic Feedstock Production 187
the kernels. Four to ten or more ranks of cupules can be found in a single ear. The tendency to produce spikelets in pairs (one sessile and one pedicelate) and the ability of each spikelet to retain two flowers also differentiates the maize and sorghum spe-cies from the other members of the Panicoideae subfamily (Kiesselbach 1999) and is one of the reasons why these species are an economically important source of feed and food worldwide.
The leaves (husks) formed in the branch that sustains the pistillate inflorescence are wider than the main stalk leaves. The typical distichous distribution of leaves changes to a polystichous positioning as they approach the pistillate inflorescence and the nearby shank due to the process of twisting and condensation of the lateral branch internodes (Iltis 2006).
Under adequate field conditions, plant emergence will occur approximately 5 days after planting the seed. Cooler or extremely dry conditions, however, can delay this process for about 14 days or more. A fully grown corn hybrid plant in the so-called Corn Belt of the U.S., which includes Iowa, Indiana, Illinois, Ohio as well as parts of South Dakota, Nebraska, Kansas, Minnesota, Wisconsin, Michigan, Missouri, and Kentucky, generally produces between 18 and 22 leaves on the main stalk. Plant height can vary considerably depending on the variety and region of adaptation. Heights for standard commercial corn hybrids grown in these locations can range from 2.5 to 3 m. A typical corn plant in the central U.S. Corn Belt silks – indicating that the pistillate inflorescence is ready for fertilization – approximately 65 days after emergence and reaches full maturity, on average, 115 days after emer-gence. Photoperiod-insensitive plants or late tropical material when grown during the summer in temperate regions such as the northern Corn Belt can reach up to 3–4 m in height and will rarely flower.
7.2.2 Corn Origin and Habitat
It is now widely accepted that corn was domesticated from Mexican teosinte (Zea mays ssp. parviglumis) between 7,500 and 12,000 years ago (Doebley and Iltis 1980; Iltis and Doebley 1980). The primary habitat of this annual teosinte is in the Balsas River valley region of southern Mexico and the initial steps of domestication of this species are likely to have occurred within this region (Wilkes 1985).
Corn is a very versatile crop species capable of growing worldwide between ap-proximately 50° North and 50° South latitude. Corn is grown in regions located from sea level to over 3,000 m in elevation, and in low-land tropical, sub-tropical and temperate climates. The species is very susceptible to low temperatures, so in tem-perate areas of the world it is commonly planted in the spring when soil temperatures reach between 10 and 12°C.
Plant development is highly influenced by temperature and photoperiod. Corn is a short-day plant, i.e. it flowers faster under short-day conditions. Development is also accelerated by higher temperatures. The production of dry matter by corn is strongly associated with the ability of these plants to intercept sunlight and to use that energy for the process of photosynthesis. It is well accepted that the longer the life cycle of this plant, the greater its grain yield potential. In Northern latitudes,

188 de Leon and Coors
however, the hybrid life cycle is highly affected by the increased risk of exposure to early frost (Troyer 2001).
Due to the many divergent types and the wide range of climate conditions where corn is grown, generation times can vary significantly for this crop. In the U.S., corn maturities range from 80 relative maturity (RM) in northern areas of North Dakota, Minnesota, Wisconsin, Michigan and Maine to 125 RM in Texas, Louisiana, Missis-sippi and parts of Georgia and Florida (Troyer 2001).
7.2.3 Corn Reproduction and Biology
Corn is a monoecious annual plant. The pollination, fertilization, and kernel devel-opment of this plant follows a standard pattern for chasmogamous grasses (i.e. hav-ing open flowers) pollinated by wind. A distinctive feature of corn, however, is that pollen is produced entirely in the staminate inflorescences whereas eggs are pro-duced entirely in the pistillate inflorescences. This mechanism likely evolved as a means to promote outcrossing (Stebbins 1957; Li et al. 1997; Le Roux and Kellogg 1999). In breeding programs and genetic research self-pollinations are commonly performed by controlling pollen movement through hand-pollinations.
The development of corn inflorescences and their fertilization have been the sub-ject of extensive evaluation (Bonnet 1948; Cheng et al. 1983; Cutler and Cutler 1948; Dumasa and Mogensen 1993; Veit et al. 1993; Sundberg and Orr 1996; Kies-selbach 1999). Briefly, in the development of the ear, a single megasporocyte (spore mother cell) in the ovule of each functioning flower forms four spores via meiosis, each with a nucleus containing ten chromosomes (haploid chromosome number). Only one of the four spores will follow further division, the other three degenerate. After the remaining spore undergoes three additional divisions without wall forma-tion, the eight-nucleate embryo-sac is formed. Two of these eight nuclei migrate to the center of the sac and stay in close proximity of each other. They are called the polar nuclei. At the chalazal end of the embryo-sac (i.e. opposite the micropyle) , the cytoplasm becomes organized around each of the three nuclei that will give rise to the antipodal cells. Before the embryo sac is fully mature, these cells will undergo further division until approximately 30 or more antipodal cells are formed. At the micropylar end of the embryo sac the egg apparatus starts developing. This apparatus consists of three cells. The middle one will enlarge and form the egg cell, while the two adjacent ones will become the synergids.
Each spore mother cell in the anthers of the tassel (microsporocyte) forms four spores via meiotic division, each spore containing ten chromosomes. Each spore then divides again to form a generative nucleus and a vegetative or tube nucleus. The generative nucleus divides once more to give rise to two sperm cells. Therefore, each mature pollen grain in corn contains a male gametophyte consisting of three haploid cells. Once the tassel is entirely emerged from the upper leaf sheath, pollen shed begins from the middle of the central spike of the tassel, followed by the other branches. Pollen grains are held in anthers that open up under favorable environ-mental conditions. Pollen shed normally begins 2–3 days before silk emergence and can continue for several days afterward depending on weather conditions. Pollen

Genetic Improvement of Corn for Lignocellulosic Feedstock Production 189
grains are very light and can be moved considerable distances by the wind. However, they are only viable for approximately 1–2 h after dehiscence (Luna et al. 2001).
Each ovule (future kernel) has its own silk that grows out of the husk at the tip of the immature ear. The silks are covered with microscopic hairs that help capture and secure the pollen grains. Within minutes after landing on the silk, pollen grains ger-minate and a pollen tube grows down the silk towards the ovule (future kernel). Generally, a single pollen grain reaches the micropyle. This pollen tube will grow between the cells of the nucellus at a speed of approximately 1 cm h–1 (Dupuis and Dumas, 1989). The entire process from pollen germination to fertilization takes
Once the pollen grain reaches the interior of the embryo-sac, the two sperm are
released. The nucleus of one sperm fertilizes the egg to form the zygote. The zygote now contains the diploid chromosome count in the cell nucleus (2n = 20). The other sperm will fuse with the two polar nuclei to form the triploid endosperm nucleus to complete the widely observed phenomenon of double-fertilization.
The fertilized egg develops into the embryo. After numerous free nuclear divi-sions in the endosperm of the embryo-sac, the primary endosperm nucleus develops into the triploid endosperm which makes the bulk of the mature kernel. The kernel, therefore will consist of the embryo, the endosperm and the pericarp, or transformed ovary wall, surrounding the kernel.
The embryo consists of a short stem. On the superior end of this stem the scutel-lum and coleoptile leaves are attached, along with a number of foliage leaf primor-dia. On the opposite end of this stem a primary seminal root and several lateral semi-nal root primordia are commonly found. After planting occurs, the seed starts absorbing water and the process of germination begins. The embryo develops into a seedling, sustained by the energy provided by the endosperm which is digested and absorbed by the scutellum. The embryo’s short stem will develop into the plant’s main stalk. In addition to the embryo’s leaf primordia, additional leaves develop in the mature plant. Adventitious roots develop at the base of each internode of the main stalk. These roots will represent the major component of the overall root sys-tem in the mature plant.
During the initial stages of development, dry matter accumulation in the corn plant is relatively slow. Under favorable environmental conditions, however, the rate of plant growth increases drastically as more leaves are exposed to sunlight until near maturity (Ritchie et al. 1996). A staging system is utilized to identify the different developmental phases of the plant. They are divided into two main phases, the vege-tative (V) and the reproductive (R) stages. VE identifies the emergence, VT is tassel-ing, and all other vegetative stages are indicated by the letter V followed by a nu-merical value. This value corresponds to the uppermost leaf that is present at any given time whose leaf collar is visible. There are six reproductive stages identified which refer mostly to the development of the kernel and its components. Those are named R1 silking, R2 blister, R3 milk, R4 dough, R5 dent and R6 physiological maturity (Ritchie et al. 1996).
Physiologically, as a C4 Kranz photosynthetic plant type, corn presents competi-tive advantages over species that use the more common C3 pathway. As discussed in Chapter 1, the C4 pathway is fundamentally more efficient than the C3 because the
12–24 h.

190 de Leon and Coors
first photosynthetic step of the C4 comprises a carbon-concentrating mechanism. Furthermore, C4 plants have the ability to conduct the gas exchange required for photosynthesis with their stomata nearly closed, therefore reducing water loss to the environment and making the plant well-suited for warm and dry environmental con-ditions (Osborne and Beerling 2006). Water deficiency can affect corn yield at any plant developmental stage, but drought conditions during flowering and pollination, grain filling and vegetative development are the three most critical times (in that order) when insufficient soil moisture and other environmental stresses can cause severe reductions in biomass and grain production performance (Shaw 1988).
7.2.4 Genome Structure and Organization
The genome of corn has 10 pairs of chromosomes that together contain approxi-mately 2.5 gigabasepairs (Gbp) of DNA. Recent comparative analysis of five dupli-cated regions of its genome has demonstrated that this species underwent a whole genome duplication (tetraploidization) event that occurred more than 4.8 million years ago (Mya). This involved the cross of two diploid species whose common ancestor diverged approximately 12 Mya, almost concomitantly with the split from the sorghum progenitor (Gaut and Doebley 1997; Swigonova et al. 2004). Neverthe-less, corn has not maintained the homeologous chromosomes resulting from the genome duplication. The polyploidization event was instead followed by a substan-tial process of rearrangement and diploidization primarily by removing the dupli-cated centromeric regions and restructuring at least one of the genes of the duplicated genomic regions. Several genetic re-arrangements have been demonstrated to have occurred during the process of corn diploidization (Gaut et al. 2000; Messing et al. 2004; reviewed by Paterson et al. (2007)).
Large-scale genome differences between different corn inbred lines were first identified through cytogenetics studies (Brown 1949; McClintock et al. 1981). Sub-sequent chromosomal studies and sequence-based assessment of this material have also documented the abundance of repetitive DNA in the corn genome. These repeti-tive DNA segments originated from transposition events and are likely the main contributors of the expansion of grass species with large genomes (Laurie and Ben-nett 1985; Lee et al. 2002; Kato et al. 2004; Buckler et al. 2006; Messing and Dooner 2006). The multiplication of retro-transposons, comprising approximately 50% of the corn genome is a relatively recent phenomenon that took place approximately 5 Mya (Morgante 2006).
A startlingly high level of allelic variation has been observed in the comparison of sequence and expression levels among corn lines, including variation on the con-tent of gene fragments, variation in repetitive elements surrounding those genes, and variation in gene expression levels likely due to the presence of transposons and repetitive DNA (Springer and Stupar 2007). A recent comparison of the DNA se-quence variation of five random regions of the corn genome in B73 and Mo17, two of the most widely used inbred lines in the U.S. Corn Belt, showed that more than 50% of the compared sequences were not shared between the two lines (Brunner et al. 2005). This survey also indicated that the lack of colinearity in intergenic regions,
Genetic Improvement of Corn for Lignocellulosic Feedstock Production 191
and the dissimilarities in genic content appear to be due to recent transposition activ-ity of several different families of retro-elements.
The combination of these variants is expected to provide a wider collection of al-leles in the hybrid produced by crossing these highly variable lines. This may, in turn, involve novel allelic interactions providing hybrids with a potentially enhanced performance compared to the progenitor inbred lines (Springer and Stupar 2007).
7.3 Management and Bioprocessing
7.3.1 Cultivation Practices
Corn is widely cultivated throughout the world. China and the U.S. are the two largest corn producing countries in the world, responsible for approximately 20% and 40% of the 635,000 Mg of corn grain produced worldwide in 2005, respectively. In 2005, corn in China occupied over 45 million ha, whereas in the U.S. the production was concentrated on 30 million ha that same year (FAOSTAT 2007). The combined production of Brazil, Argentina, Mexico, India, France, Indonesia and South Africa – the next seven largest corn producing countries – represent 18% of the production worldwide. Mechanization, improved agronomic practice and the introduction of more adapted varieties will likely increase the production potential of countries such as China.
In the U.S. Corn Belt, corn is grown as a row-crop, primarily from uniform hy-brid seed. In this area, ideal planting conditions for corn occur between the second half of April and first half of May. Improved technologies such as the use of more efficient planting equipment, implementation of time-saving management practices and development of hybrids with enhanced tolerance to sub-optimal growing condi-tions, diseases and pests have encouraged a trend towards earlier planting dates dur-ing the last several decades (Lauer 2001; Lauer et al. 2001; Kucharik 2006).
Earlier planting practices permit higher yield potential because later maturing corn varieties, which have a higher yield potential, can be used confidently. Delaying planting usually translates into lower grain yields and higher grain moistures (Gupta 1985; Joseph et al. 1999). Early planting is not as critical for corn planted for silage purposes. However, research conducted in the state of Wisconsin has demonstrated that lower dry matter yields were observed when corn was planted during the second half of May (Darby and Lauer 2002).
The primary use of corn biomass to-date has been as animal feed in the form of silage. Close to 8% of the corn harvested in the U.S. in 2006 was used for silage (USDA, 2007). Corn for silage is harvested at approximately 65% moisture and includes both the stover and the grain portion of the plant. Corn stover collected as a feedstock for the biofuel industry, on the other hand, is harvested at physiological maturity. Since only the stover will likely be used as a source of biomass for biofuel production, this delayed harvest allows for reduced moisture content of the stover and complete filling and maturation of the grain to be commercialized as a co-product.

192 de Leon and Coors One of the primary impediments to widespread adoption of lignocellulosic re-
sources as raw materials for the biofuel production industry is the relatively high cost associated with harvesting, handling and storing this material. In addition to the high moisture content retained primarily in the stalks of corn stover even at physiological maturity, another drawback of biomass in general, and corn stover in particular, is the low dry bulk density of the harvested material (Montross et al. 2002; as cited by Atchison and Hettenhaus (2003)). Restrictions on the minimal density that can be achieved for this material constrain the ability to economically transport it long dis-tances from the field to biorefineries. Alternatives such as compaction, chemical treatment and reduction of particle sizes are being evaluated to improve transporta-tion efficiency (Shinners et al. 2007a).
Several prototypes have been suggested for the collection of stover material after grain harvesting. Conventional forage and hay harvesting equipment have been shown to be able to collect only about 30–40% of the total available biomass in most conditions, primarily due to the difficulty to gather the shredded stover (Graham et al. 2007; Shinners et al. 2007a). One of these studies indicated that collecting wet stover immediately after grain harvest resulted in enhanced harvesting rate and yield compared to dry stover collection. The wet stover presented lower losses and a more uniform final product when ensiled, compared to when stored in dry bale outdoors (Shinners et al. 2007a).
A single-pass grain combine modified to collect the stover has been shown to be a promising harvesting technology, as it can efficiently collect large amounts of corn stover as well as the grain (Hoskinson et al. 2007; Shinners et al. 2007b). Research utilizing this harvest technology suggests that harvesting corn stover at an approxi-mate height of 40 cm from the soil provides the best feedstock quality and adequate harvesting conditions (Hoskinson et al. 2007). Collecting plant material below this height increased stover water content and the concentration of unwanted soil and other foreign material in the feedstock sample, which resulted in higher transporta-tion costs and a lower-quality feedstock.
Environmental concerns regarding the use of corn and corn stover for liquid fuel production include erosion, loss of soil organic matter, and high water and nitrogen requirement, and have been systematically discussed elsewhere (Sheehan et al. 2004; Wilhelm et al. 2004; Kim and Dale 2005; Mosier et al. 2005a; von Blottnitz and Curran 2007). If no cover crops are utilized, extreme caution will have to be taken to ensure that appropriate amounts of corn stover are left in the field for erosion control, and maintenance of suitable soil organic matter levels in order to preserve the long term productivity of soil. The precise amount could be better determined utilizing models for water and wind erosion, for example, such as the newest versions of the universal soil loss equation (RUSLE2) and the wind erosion equation (WEQ2) de-veloped by the United States Department of Agriculture (USDA) and widely used by the Natural Resource Conservation Service (NRI 2003). A wider adoption of no-till management practices would potentially increase the amount of collectible stover, depending on soil types (Blanco-Canqui et al. 2006; Graham et al. 2007). Tilling can cause depletion of soil organic material which is an important measure of soil qual-ity. Studies have shown, however, that a very significant portion of the soil organic matter comes from roots compared to above-ground biomass (Gale and Cambardella

Genetic Improvement of Corn for Lignocellulosic Feedstock Production 193
2000; Andrews 2006). Therefore, more research is necessary to determine the appro-priate amount and time of stover collection for proper soil management and preser-vation.
Environmental conditions and the adoption of specific agronomic practices such as planting date and tilling regimes affect the ability of the corn crop to withstand disease and pest pressure. Gray leaf spot, caused by the fungus Cercospora zeae-maydis Tehon and E.Y. Daniels, and Northern leaf blight caused by the fungus Exse-rohilum turcicum (Pass.) K.J. Leonard and E.G. Suggs (previously called Helmithosporium turcicum), are two of the most damaging diseases affecting corn in the U.S. In recent history, with the increased use of reduced and no-tillage agro-nomic practices, both diseases have become a significant problem mainly in more humid corn growing regions (Smith and White 1988; Ward et al. 1999; White 1999; Carson 2006; Crous et al. 2006). Controlling these diseases typically involves the combination of resistant hybrid utilization, crop rotation, and possibly tillage or fungicide application (Munkvold 1997). Eyespot, a fungal disease caused by the fungus, Kabatiella zeae Narita and Y. Hirats is another damaging disease that affects corn in the U.S. Like the two abovementioned fungal diseases, Eyespot is also fa-vored by high humidity and the presence of residue from previous corn crops. This disease, however, is also favored by long periods of cool weather during the growing season. Thus, it is a larger problem in the northern regions of the U.S. Corn Belt (Reifschneider and Arny 1983; Smith and White 1988; White 1999).
Among the most important pests affecting corn, European corn borer, caused by Ostrinia nubilalis (Hübner) and Fall armyworm caused by Spodoptera frugiperda (J.E. Smith) in the Southern regions of the Corn Belt produce significant damage to the corn crop worldwide (Buendgen et al. 1990; Melchinger et al. 1998a; Clark et al. 2007). European corn borer contributes to grain yield losses by increasing stalk lodg-ing and ear breakage propensity as well as by affecting the translocation system of the plant and therefore reducing its photosynthetic capacity (Jarvis et al. 1982; Klenke et al. 1986; Bohn et al. 2000). Fall armyworm is more common in the south-western area of the Corn Belt and can cause severe leaf feeding damage and direct injury to the ear. This pest is able to attack corn plants at all stages of development, but it is normally more severe on later planted crops prior to silking. Insect-resistant transgenic corn hybrids expressing insecticidal Bacillus thuringiensis (Bt) proteins are currently available and widely used for the control of these pests.
7.3.2 Biomass Yield Potential
In 2005, the average whole-plant yield of corn used for silage was 15.6 Mg dry mat-ter ha–1 (6.3 tons dry matter per acre), assuming 65% average moisture at harvest (NASS 2007). The grain portion represents approximately 50% of the dry matter (Coors 1996; Frey et al. 2004).
Since grain is highly digestible, forage corn improvement programs in the U.S. up until the early 1990’s emphasized an increase in grain yield as a means to increase the energy content of the overall forage. Significant progress has been made since then in improving biomass yields and stover cell-wall characteristics, as they relate

194 de Leon and Coors
to ruminant animal nutrition (Frey et al. 2004). Information relating results from these breeding efforts to the potential utilization of these plant resources as biomass feedstock, however, is just now becoming available. One of the first studies evaluat-ing this relationship demonstrated that corn inbreds developed for silage purposes are well suited as feedstock material (Lorenz and Coors 2006). This is due primarily to the higher overall biomass yield of these forage varieties, as well as their ferment ability and carbohydrate composition.
Fig. 7.1. Relationship between stover yield (Mg ha–1) and grain yield (Mg ha–1) in an evalua-tion conducted in 1991, 1992 and 1993 in two different locations within each of two maturity zones, (A) early trial, and (B) late trial in the state of Wisconsin. Fifteen hybrids were evalu-ated for the early trial (100RM or earlier) and 18 for the late trial (more than 100RM). Sepa-rate grain yield and stover evaluations were grown on adjacent plots for this experiment. Note that scales differ between plots. (adapted from Coors (1996)).

Genetic Improvement of Corn for Lignocellulosic Feedstock Production 195
Theoretical ethanol production for this germplasm has been estimated from C5 and C6 carbohydrate concentration using near infrared reflectance spectroscopy (NIRS) in research conducted with the National Renewable Energy Laboratory (NREL) in Golden, CO (Hames et al. 2003; see also Chapter 5). Theoretical ethanol potential was poorly correlated with fermentability, as measured by an in-vitro ru-minal fermentation method (Weimer et al. 2005; Lorenz and Coors 2006) suggesting that conversion efficiency is as important, if not more important, as carbohydrate concentration in determining feedstock quality.
Grain yield in corn has been increasing historically at a rate of approximately 0.1 ton ha–1 yr–1 since the introduction of single hybrid varieties in the 1960’s. Interest-ingly, although correlations between corn grain yield and stover yield have tended to be positive, they have been generally low (Wolf et al. 1993; Pedersen 1996). For example, a study conducted during three years in which 15 hybrids were evaluated in an early maturity zone and 18 hybrids in a late maturity zone in the state of Wiscon-sin demonstrated that the correlation between grain and stover yield was negligible in both maturities (Fig. 7.1; Coors 1996).
7.3.3 Biomass Processing
With the improvement of collection technologies and steady yield increases, ap-proximately 256 million dry tons per year of corn stover is estimated to become available in the U.S. by the year 2030 (Perlack et al. 2005). Just recently, the U.S. Department of Energy (DOE) has announced its support for the development of six commercial-scale lignocellulosic bio-refineries. Two of the six will be at least par-tially based on corn stover as their feedstock source (Service 2007).
Significant genetic variation for cell-wall degradability, composition and ana-tomical structure has been observed within and between grasses (Grabber et al. 2004). Among grass species, a substantial number of genetic/genomic studies of cell-wall composition have been conducted in corn (Barrière et al. 2003, 2004; Marita et al. 2003; Grabber et al. 2004; Ralph et al. 2004; Grabber 2005; Jung and Casler, 2006a,b).
The conversion from lignocellulosic material to liquid fuel involves a multi-step process including pretreatment, enzymatic hydrolysis, and fermentation. Pretreat-ment is a crucial first step that opens up the tightly structured cell wall to allow the access of hydrolytic enzymes to the cellulose and hemicellulose. Numerous different promising pretreatment methods and enzymatic hydrolysis approaches to process the lignocellulosic material have been extensively reviewed in recent literature (Laure-ano-Perez et al. 2005; Mosier et al. 2005b; Wyman et al. 2005; Zeng et al. 2006; see also Chapter 6). Nevertheless a particular conversion technology has not yet been established to produce biofuel from agricultural feedstocks on a commercial scale and thus specific desirable biochemical profiles have not been reported. It is well accepted that cellulose and lignin concentrations are important quality parameters for plant breeders and plant biologists to utilize in regard to efficiency of biomass con-version (Vogel and Jung 2001). However, associations between lignin and cell-wall digestibility have been shown to be quite variable and complex (Barrière et al. 2003). Other cell-wall properties such as ferulate cross-linkages, hydrophobicity and the

196 de Leon and Coors
specific composition of lignin have been also shown to have an important effect on the ability to process these materials (Jung and Deetz 1993; Grabber et al. 2004; Ralph et al. 2004; Barrière et al. 2005).
Phenotypic selection for lower fiber and lignin concentration and increased fiber digestibility in corn stover has been successful in improving forage quality (Wolf et al. 1993; Barrière et al. 2003; Frey et al. 2004). Analytical technologies appropriate for evaluating biomass conversion to biofuel are generally expensive and time-consuming. NIRS prediction equations for traits such as neutral detergent fiber (NDF), acid detergent fiber (ADF), in-vitro true digestibility (IVTD), starch, and protein have been used for high-throughput corn silage sample analysis and are widely used for breeding purposes (Coors and Lauer 2000). In the U.S., NREL has developed the only NIRS model that can be applied to calculate the bioenergy value of corn stover. The total ethanol yield predicted with this method is based on the assumption of complete conversion of the polysaccharides in the feedstock, which is unlikely to be achieved with current technologies (Hames et al. 2003). Development of new NIRS prediction equations that take into account the actual conversion effi-ciency of different lignocellulosic sources would be a significant step towards identi-fying and further improving feedstocks.
7.4 Utilization of Corn Stover as a Source of Biomass
In 2007 corn was grown on over 36 million ha in the U.S. The USDA and the DOE forecast that approximately 20% of the billion dry tons of biomass that will be needed annually in this country by 2030 to replace 30% of the currently used trans-portation fuel will likely come from corn stover (Perlack et al. 2005).
The utility of corn stover as a feedstock will ultimately depend not only on yield potential, but also composition, and, more specifically, on structural carbohydrates that form the cell-wall matrix. In corn stover, cellulose represents approximately 37% of the total dry mass. The hemicellulose, comprised of xylans, arabinan, man-nan and galactan represents about 28%, while lignin makes up approximately 18% of the total corn stover dry mass (Aden et al. 2002).
There is relatively little known regarding the extent of genetic diversity for fac-tors influencing suitability of corn stover as a feedstock. Some information can be gleaned from past work with corn silage (see reviews of Coors and Lauer (2000), Allen et al. (2003), and Barrière et al. (2003)).
One of the main factors differentiating corn from other sources of feedstock is the presence of a strong sink (ear) that constantly imports carbon and nitrogen assimi-lates during the process of grain filling and thereby alters stover composition (Coors et al. 1997; Hirel et al. 2005). Approximately 70% of the nitrogen removed by corn plants harvested for silage purposes is located in the grain portion at different levels of nitrogen fertilization (Randall and Vetsch 2003). Producing grain, therefore, is significantly more energetically costly than producing stover. An economic evalua-tion will have to be conducted to assess the relative contribution of grain production in addition to biomass (stover) production relative the cost of producing purely

Genetic Improvement of Corn for Lignocellulosic Feedstock Production 197
stover. If the grain portion was eliminated from this equation, more biomass could likely be produced with reduced nitrogen inputs.
An evaluation of forage yield and quality of corn cultivars developed in different eras since the 1930’s has shown that whole-plant yield per unit area has increased at a rate of 1.4% per year, and the vast majority of this increase is attributable to an increase in grain yield at a rate of 2.4% per year, versus stover yield at a rate of 0.7% per year (Lauer et al. 2001). Over the last 70+ years, attention has been mostly fo-cused on increasing grain yield in corn, and the forage quality increases are appar-ently due to the increased proportion of grain rather than increased quality of the stover per se. As higher and higher planting densities were adopted, forage yield and the concentration of cell-wall components such as lignin, cellulose and hemicellu-lose, may have increased in forage corn, while the quality of this whole-plant bio-mass, measured as digestibility, has decreased over time (Graybill et al. 1991; Cuomo et al. 1998). This may be due to a lowering of the harvest index (grain-to-stover ratio) as planting densities increased. The study by Lauer et al. (2001) showed that stover NDF and in vitro digestibility has remained historically unchanged when evaluated for stover per se at a uniform planting density.
Fig. 7.2. Corn stover neutral detergent fiber (NDF) disappearance as a function of time in rumen fluid for six corn varieties, including a brown-midrib hybrid (F657 bm3), a normal grain hybrid (P33A14), a Leafy hybrid (TMF113Lfy) and cycles 0, 1 and 2, C0, C1 and C2, respectively, of the high quality Wisconsin Quality Synthetic (WQS) silage corn population (adapted from Justen (2004)).
198 de Leon and Coors Forage quality and yield can be improved utilizing conventional cultivar devel-
opment strategies such as those described by Frey et al. (2004). Improved varieties have achieved nearly the same level of NDF digestion in rumen fluid, which can be defined as a measure of the cell-wall fermentability, as that observed in varieties carrying the low-lignin brown midrib3 mutation (Justen 2004; Fig. 7.2).
The four known brown midrib mutations in corn have drastic effects on lignin composition and concentration (see Section 6.5.2 and Chapter 4), and corn silage produced from brown midrib varieties has significantly increased dry matter and NDF digestibility compared to normal isolines. However, agronomic limitations are commonly associated with brown midrib hybrids due to their reduced lignin concen-tration (Cherney et al. 1991; Barrière and Argillier 1993; Coors and Lauer 2000; Allen et al. 2003; Pedersen et al. 2005).
Maximizing biomass production per unit area may be the most efficient near-term strategy for improving corn as a feedstock for the biofuel industry (Lorenz and Coors 2006; Kirkpatrick et al. 2006).
7.5 Genetics
7.5.1 Sources of Genetic Variation
Corn is considered the world’s most diverse crop at the molecular and phenotypic levels. Fortunately, breeders and geneticists have a number of good resources to utilize and evaluate this diversity. For example, a set of 303 corn lines have recently been identified and collected that capture nearly 85% of the extensive genetic varia-tion present in corn (Liu et al. 2003). These lines represent an extremely valuable tool in the study of endogenous sources of genetic variation and the association of genetic markers to specific traits of interest through the utilization of linkage disequi-librium.
The corn genome is in the process of being sequenced (Chandler and Brendel 2002; Wessler 2006), and expected to be available in the spring of 2008. In addition, the Maize Genetics and Genomics Database (MaizeGDB – http://www.maizeGDB.org) is a publicly maintained database which holds current information about genetic and genomic resources for this species, including several genetic, cytogenetic and physi-cal mapping resources, mutant stocks, thousands of markers and bacterial artificial chromosomes (BACs) as well as a collection of more than 400,000 expressed se-quence tags (ESTs) (Zhao et al. 2006; Lawrence et al. 2007). An extensive database with bioinformatic analysis and gene expression information for more than 700 puta-tive cell-wall biosynthesis- and assembly-related genes in corn has recently been developed (Guillaumie et al. 2007b).
Significant genetic variation in forage quality in silage corn has been reported by a number of researchers as reviewed by Coors and Lauer (2000), Allen et al. (2003), and Barrière et al. (2003). There is, however, little information on genetic variability of stover composition at physiological maturity. Lundvall et al. (1994) performed compositional analyses of stems and leaves samples from a wide array of corn inbred lines collected one to two weeks after anthesis and stems at physiological maturity,

Genetic Improvement of Corn for Lignocellulosic Feedstock Production 199
which is when feedstock would typically be harvested for conversion to ethanol. Significant variation for in vitro digestible dry matter (IVDDM) and cell-wall com-ponent concentrations was reported among the 45 inbred lines. Stems harvested at physiological maturity had IVDDM values that range from 578 g kg–1 for inbred line Mo17 to 262 g kg–1 for line L289. NDF concentrations of stems harvested at physio-logical maturity ranged from 510 g kg–1 to 791 g kg–1. There was a low correlation between quality traits when measured at the two maturity stages (Lundvall et al. 1994).
Quantitative trait loci (QTL) studies have been conducted to identify genomic re-gions of particular importance for silage quality and cell-wall components in specific tissue types (Lübberstedt et al. 1997a,b, 1998; Falkner et al. 2000; Méchin et al. 2001; Cardinal et al. 2003; Cardinal and Lee 2005; Krakowsky et al. 2005, 2006). Many of these QTL were found to be in close proximity to candidate genes for cell-wall carbohydrate biosynthesis (Cardinal et al. 2003; Krakowsky et al. 2005, 2006, Ralph et al. 2004). In some cases QTL associated with cell-wall digestibility in in-breds have been identified in hybrids derived from those inbreds (Méchin et al. 2001). This provides a means to select for these traits at the inbred-per-se level in early stages of selfing in a hybrid-based corn breeding program. In many instances, however, these QTL studies have identified regions that explain no more than 10–15% of the phenotypic variation observed for those traits. In addition, some of those QTL were inconsistent across different populations and/or environments. Therefore, utilizing this information for marker-assisted selection remains a challenging task (Melchinger et al. 1998b).
Genetic engineering of forage digestibility and conversion requires an accurate understanding of the biosynthetic pathways leading to lignin, cellulose, and hemicel-lulose. Although several genes involved in these biochemical pathways, especially the lignin biosynthetic pathway, have been identified and cloned from different plant species, including corn (Baucher et al. 1998; Whetten et al. 1998; Boerjan et al. 2003), experimental results suggest that even when key steps in the lignin pathway are modified or knocked-down, the resulting phenotypes are sometime unpredictable due primarily to the ability of these plants to form altered subunits and chemical bonds that are integrated in lignin (Hu et al. 1999; Hatfield and Vermerris 2001; Grabber 2005). Also, background-dependent genetic interactions have been observed in the expression of many cell-wall composition traits, demonstrating a wide range of penetrance and expression of these traits (Boerjan et al. 2003).
7.5.2 Use of Genetic Variation
Yield and quality attributes of forage species such as sorghum, switchgrass, reed canarygrass, alfalfa, and bermudagrass have been significantly improved through breeding and genetic enhancement (Hopkins et al. 1993; McLaughlin et al. 1999; Jung and Lamb 2003; Anderson 2005; Casler 2005; Missaoui et al. 2005; Casler and Jung 2006; see also Chapters 8, 11 and 12). There has also been significant progress towards a better understanding of the molecular basis of corn forage quality, primar-ily as it relates to animal nutritional characteristics (Barrière et al. 2003).

200 de Leon and Coors Conventional breeding techniques, well-known mutations in genes involved in
the lignin biosynthetic pathway, and the manipulation of genes involved in the bio-synthesis of cellulose and hemicellulose are now being used to alter the cell-wall composition of corn stover (Frey et al. 2004; Ralph et al. 2004; Torney et al. 2007). Four naturally-occurring brown midrib mutations (bm1, bm2, bm3 and bm4) have been identified and characterized in corn (Halpin et al. 1998; Vermerris and Boon 2001; Vermerris et al. 2002; Marita et al. 2003; Fontaine et al. 2003; Barrière et al. 2004; Guillaumie et al. 2007a). These are recessive alleles that alter the lignin con-centration and/or composition of the plant. The bm mutant plants are typically identi-fied by the presence of a red-brown coloration in the corn stalks and leaves (Marita et al. 2003).
Several brown midrib mutants have been utilized in the nutritional enhancement of corn (Cherney et al. 1991; Barrière and Argillier 1993). The bm3 allele has been shown to be the most efficient mutation in terms of enhancing cell-wall digestibility in corn (Barrière et al. 2003). Unfortunately, the agronomic performance of these low-lignin mutations has been disappointing due to the relatively low growth rates of these plants as well as increased lodging, and low grain or forage yield (Coors and Lauer 2000; Allen et al. 2003). Nonetheless, because of their excellent nutritional properties, primarily NDF digestibility, there are now commercially viable bm3 hybrids that are marketed for specific use as silage.
Increasing biomass production can be challenging (Horton 2000; Richards 2000). An efficient method for improving overall biomass production would likely involve increasing photosynthetic efficiency per unit area by increasing tolerance to plant-to-plant competition, drought resistance and possibly the adoption of alternative plant morphologies. Characteristics such as leaf number, increased lateral branch forma-tion (including tillering), morphology and capacity to re-grow after early summer cutting should be all considered options by breeders and geneticists (Sakamoto and Matsuoka 2004; Sakamoto et al. 2005; Torney et al. 2007).
Corn plants carrying the dominant Leafy1 (Lfy1) trait have been shown to gener-ate extra nodes and leaves on the main stalk above the ear, lower ear positioning and highly lignified stalks (Shaver 1983). Lfy1 plants also tended to mature earlier than their wild type counterparts according to Dijak et al. (1999). The Lfy1 locus has been reported to be located on the long arm of chromosome 3 of corn (Cai et al. 2000). Expression of this gene depends to some extent on the genetic background of the carrying line (Shaver 1983). An extensive evaluation of Lfy1 hybrids for silage pro-duction conducted by Dwyer et al. (1998) demonstrated that, on average across dif-ferent environments and years, these materials out-performed normal corn hybrids for total forage yields. Compared to normal hybrids, carbohydrate levels during anthesis and grain-filling in the portion of the plant above the ear were two times higher in Lfy1 hybrids.
It may be possible to increase plant biomass in corn by altering lateral branch formation. Genes such as grassy tiller1 (gt1) and teosinte branched1 (tb1) have been linked to the activation of lateral meristems and reduced apical dominance in corn (Doebley et al. 1997; Colasanti 2001). Proliferations of numerous long tillers and increased above-ground biomass production have been observed in plants homozy-gous for gt1 and tb1 mutations (Shaver 1967; Doebley et al. 1995). The gt1 allele is a
Genetic Improvement of Corn for Lignocellulosic Feedstock Production 201
naturally-occurring mutation that was reportedly discovered in the corn nursery of E. G. Anderson in 1948. Plants homozygous for the gt1 mutation display a proliferation of long lateral branches that can vary in size and number depending on the genetic background (Tracy and Everett 1982). The gt1 allele also improves the re-growth potential of these plants after early-season cuttings by producing multiple stalks and thus extra biomass.
7.6 Current Research Efforts and Future Outlook
Current research efforts follow the vision that, in addition to the extraordinary impor-tance of corn as a commodity crop, this plant species is also an excellent model sys-tem for studying biomass production potential. The ability to develop specialized corn varieties with increased biomass production and bioconversion efficiency is essential for the future development of a dedicated, renewable bio-energy industry. Corn stover is a copious agricultural residue in the U.S. and a promising feedstock for liquid fuel production with a current annual availability of 75 million dry tons (Perlack et al. 2005). One of the main advantages of using corn stover as feedstock is the possibility of separately commercializing the lignocellulosic material along with grain as a high-value co-product.
The most achievable short-term objectives are to substantially increase corn biomass production by modifying plant architecture, density tolerance, drought toler-ance, and nutrient acquisition. This will, in turn, probably increase photosynthetic efficiency per unit area (Torney et al. 2007). In the conversion of corn stover to etha-nol, research will need to focus on the identification of germplasm sources that have the ability to increase overall biomass (especially stover) production without signifi-cantly depleting grain production for human consumption, animal feed and export markets. The ability to accurately, precisely, and efficiently measure plant biomass conversion to bioenergy is a crucial first step towards the overall genetic improve-ment of corn and other crops for feedstock production. Compositional attributes of corn required for ruminant nutrition are probably similar enough to the elements needed to use this plant material as feedstock for energy conversion to allow plant breeders to begin their work developing source germplasm.
The essential questions for the future are whether plant breeders can change the architecture of the corn plant to transform it from a primarily grain-producing plant to a biomass-producing plant, and if so, whether altered morphology will direct fewer resources to the pistillate inflorescence and more to whole-plant biomass pro-duction (i.e. decreasing the harvest index). Or will it be possible to increase overall biomass and photosynthetic area, while also increasing, or at least maintaining grain yield potential (Lorenz et al. 2007)? The economic consequences of these alternative outcomes will likely determine the future prospects for corn as a feedstock for biofu-els.
Corn is an excellent experimental system for genetic analyses and modification, primarily for the translational analysis of organisms with larger genomes (Lawrence and Walbot 2007). Corn genetics benefits from an array of private and public re-sources (Zhao et al. 2006; Lawrence et al. 2007). Numerous tools such as high-

202 de Leon and Coors
throughput reverse genetic strategies, efficient methods for tagging and cloning, efficient genetic transformation techniques and diverse gene expression profiling platforms are currently available for this species, and the full sequencing of the corn genome will be completed in the near future (Chandler and Brendel 2002; Wessler 2006). Corn is a species that has great potential to be immediately useful in produc-ing lignocellulosic biomass and at the same time the most appropriate representative of the monocot crop model system for other dedicated bioenergy grass crops such as switchgrass and Miscanthus.
References
Aden, A., Ruth, M., Ibsen, K., Jechura, J., Neeves, K., Sheehan, J., Wallace, B., Montague, L., Slayton, A. and Lukas, J. (2002) Lignocellulosic biomass to ethanol process design and economics utilizing co-current dilute acid prehydrolysis and enzymatic hydrolysis for corn stover. NREL/TP-510-32438 (http://www.nrel.gov/docs/fy02osti/32438.pdf).
Allen, M.S., Coors, J.G. and Roth, G.W. (2003) Corn Silage. In: D.R. Buxton, J.H. Harrison and R.E. Muck (Eds.) Silage Science and Technology. ASA, CSSA, and SSSA, Madison, WI.
Anderson, W.F. (2005) Development of a forage bermudagrass (Cynodon sp.) core collection. Grassland Sci. 51, 305–308.
Andrews, S.S. (2006) Crop Residue removal for biomass energy production: Effects on soils and recommendations. Soil Quality National Technology Development Team USDA-Natural Resource Conservation Service http://soils.usda.gov/sqi/management/files/AgFo-rum_Residue_White_Paper.pdf
Atchison, J.E. and Hettenhaus, J.R. (2003) Innovative methods for corn stover collecting, handling, storing and transporting. National Renewable Energy, Golden, Colorado.
Barrière, Y., Alber, D., Dolstra, O., Lapierre, C., Motto, M., Ordas, A., Van-Waes, J., Vlas-minkel, L., Welcker, C. and Monod, J.P (2005) Past and prospects of forage maize breed-ing in Europe. I. The grass cell wall as a basis of genetic variation and future improve-ments in feeding value. Maydica 50, 259–274.
Barrière, Y., Guillet, C., Goffner, D. and Pichon, M. (2003) Genetic variation and breeding strategies for improved cell wall digestibility in annual forage crops. A review. Anim. Res. 52, 193–228.
Barrière, Y., Ralph, J., Méchin, V., Guillaumie, S., Grabber, J.H., Argillier, O., Chabbert, B. and Lapierre, C. (2004) Genetic and molecular basis of grass cell-wall degradability. II. Lessons from brown-midrib mutants. C.R. Biologies 327, 847–860.
Barrière, Y.A. and Argillier, O. (1993) Brown mid-rib mutants of maize: A review. Agrono-mie 13, 865–876.
Baucher, M., Monties, B., Van Montagu, M. and Boerjan, W. (1998) Biosynthesis and genetic engineering of lignin. Crit Rev Plant Sci 17, 125–197.
Blanco-Canqui, H., Lal, R., Post, W.M., Izaurralde, R.C. and Owens, L.B. (2006) Corn stover impacts on near-surface soil properties of no-till corn in Ohio. Soil Sci. Soc. Am. J. 70, 266–278.
Boerjan, W., Ralph, J. and Baucher, M. (2003) Lignin biosynthesis. Annu. Rev. Plant Biol. 54, 519–546.
Bohn, M., Schulz, B., Kreps, R., Klein, D., Melchinger, A.E. (2000) QTL mapping for resis-tance against the European corn borer (Ostrinia nubilalis H.) in early maturing European dent germplasm. Theor. Appl. Genet. 101, 907–917.
Bonnet, O.T. (1948). Ear and tassel development in maize. Ann. Mo. Bot. Gard. 35, 269–287.

Genetic Improvement of Corn for Lignocellulosic Feedstock Production 203
Brown, W.L. (1949) Numbers and distribution of chromosome knobs in United States maize. Genetics 34, 524–536.
Brunner, S., Fengler, K., Morgante, M., Tingey, S. and Rafalski, A. (2005) Evolution of DNA sequence nonhomologies among maize inbreds. Plant Cell 17, 343–360.
Buckler, E.S., Gaut, B.S. and McMullen, M.D. (2006) Molecular and functional diversity of maize. Curr. Opin. Plant Biol. 9, 172–176.
Buendgen, M.R., Coors, J.G., Grombacher, A.W. and Russell, W.A. (1990) European corn borer resistance and cell wall composition of three maize populations. Crop Sci. 30, 505–510.
Cai, H., Yuyama, N., Ogawa, N., Gao, Z., Yamao, K., Yazaki, S. and Terada, Y. (2000) De-velopment of DNA markers closely link to leafy trait in maize (Zea mays L.). Plant and Animal Genome VIII Conference, San Diego, CA. Poster 243.
Cardinal, A.J. and Lee, M. (2005) Genetic relationships between resistance to stalk-tunneling by the European corn borer and cell-wall components in maize population B73×B52. Theor. Appl. Genet. 111, 1–7.
Cardinal, A.J., Lee, M. and Moore, K.J. (2003) Genetic mapping and analysis of quantitative trait loci affecting fiber and lignin content in maize. Theor. Appl. Genet. 106, 866–874.
Carson, M.L. (2006) Response of a maize synthetic to selection for components of partial resistance to Exserohilum turcicum. Plant Dis. 90, 910–914.
Casler, M.D. (2005) Ecotypic variation among switchgrass populations from the northern USA. Crop Sci. 45, 388–398.
Casler, M.D. and Jung, H.G. (2006) Relationships of fibre, lignin, and phenolics to in vitro fibre digestibility in three perennial grasses. Anim. Feed Sci. Tech. 125, 151–161.
Chandler, V.L. and Brendel, V. (2002) The maize genome sequencing project. Plant Physiol. 130, 1594–1597.
Cheng, P.C., Greyson, R.I. and Walden, D.B. (1983). Organ initiation and the development of unisexual flowers in the tassel and ear of Zea mays. Am. J. Bot. 70, 450–462.
Cherney, J.H., Cherney, D.J.R., Akin, D.E. and Axtell, J.D. (1991) Potential of brown-midrib, low lignin mutants for improving forage quality, Adv. Agron. 46, 157–198.
Clark, P.L., Molina-Ochoa, J., Martinelli, S., Skoda, S.R., Isenhour, D.J., Lee, D.J., Krumm, J.T. and Foster, J.E. (2007) Population variation of the fall armyworm, Spodoptera frugiperda, in the western hemisphere. J. Insect Sci. (on-line: http://www.insectscience.org /7.05/i1536-2442-2007-05.pdf
Colasanti, J. (2001) Some observations on the grassy tillers (gt1) mutant. Maize Genet. News Lett. 75, 2–3.
Coors, J.G. (1996) Findings of the Wisconsin corn silage consortium. Proceedings of the 58th Cornell Nutrition Conference for Feed Manufacturers, 22–24 October 1997. Rochester, NY. Cornell University Press, Ithaca, NY. pp. 20–28.
Coors, J.G., Albrecht, K.A., and Bures, E.J. (1997) Ear-fill effects on yield and quality of silage corn. Crop Sci. 37, 243–247.
Coors, J.G. and Lauer, J.G. (2000) Silage Corns. In: A.R. Hallauer (Ed.) Specialty Corns, 2nd edition. CRC Press, Boca Raton, FL, pp. 347–392.
Crous, P.W., Groenewald, J.Z., Groenewald, M., Caldwell, P., Braun, U. and Harrington, T.C. (2006) Species of Cercospora associated with grey leaf spot of maize. Stud. Mycol. 55, 189–197.
Cuomo, G.J., Redfern, D.D. and Blouin, D.D. (1998) Plant density effects on tropical corn forage mass, morphology and nutritive value, Agron. J. 90, 93–96.
Cutler, H.C. and Cutler, M.C. (1948) Studies on the structure of the maize plant. Ann. Mo. Bot. Gard. 35, 301–316.
Darby, H.M. and Lauer. J.G. (2002) Planting date and hybrid influence on corn forage yield and quality. Agron. J. 94, 281–289.

204 de Leon and Coors
de Leon, N. and Coors, J.G. (2002) Twenty-four cycle of mass selection for prolificacy in the Golden Glow maize population. Crop Sci. 42, 325–333.
Dijak, M., Modarres, A.M., Hamilton, R.I., Dwyer, L.M., Stewart, D.W., Mather, D.E. and Smith, D.L. (1999) Leafy reduced-stature maize hybrids for short-season environments. Crop Sci. 39, 1106–1110.
Doebley, J. and Iltis, H.H. (1980). Taxonomy of Zea (Gramineae) I. Sub-generic classification with key to taxa. Am. J. Bot. 67, 982–993.
Doebley, J., Stec, A. and Hubbard, L. (1997) The evolution of apical dominance in maize. Nature 386, 485–488.
Doebley, J., Stec, A. and Gustus, C. (1995) teosinte branched1 and the origin of maize: evi-dence for epistasis and the evolution of dominance. Genetics 141, 333–346.
Dumasa, C. and Mogensen, H.L. (1993) Gametes and fertilization: maize as a model system for experimental embryogenesis in flowering plants. Plant Cell 5, 1337–1348.
Dupuis, I. and Dumas, C. (1989) In vitro pollination as a model for studying fertilizatoin in maize (Zea mays L.). Sex. Plant Reprod. 2, 265–269.
Dwyer, L.M., Stewart, D.W. and Glenn, F. (1998) Silage yields of leafy and nor-mal hybrids. 53rd Proceedings of Annual Corn and Sorghum Research Conference, Chicago, IL. American Seed Trade Association, Washington, DC, pp. 193–216.
Falkner, L.K., Coors, J.G., Ostrander, B.M., Kaeppler, S.M. and Hatfield, R.D. (2000) Lax leaf maize: Modified cell wall composition and nutritional value. J. Food Agric. Sci. 80, 255-262.
Fontaine, A.S., Briand, M. and Barrière Y. (2003) Genetic variation and QTL mapping of para-coumaric and ferulic acid contents in maize stover at silage harvest. Maydica 48, 75–84.
Food and Agriculture Organization of the United Nations (FAOSTAT) (2007) http://faostat.fao.org/site/336/DesktopDefault.aspx?PageID=336, August 2007.
Frey, T., Coors, J.G., Shaver, R.D., Lauer, J.G., Eilert, D.T. and Flannery, P.J. (2004) Selec-tion for silage quality in the Wisconsin quality synthetic population and related maize populations. Crop Sci. 44, 1200–1208.
Gale, W.J. and Cambardella, C.A. (2000) Carbon dynamics of surface residue and root de-rived carbon to soil organic matter under no-till. Soil Sci. Soc. Am. J. 64, 190–195.
Gaut, B.S. and Doebley J.F. (1997) DNA sequence evidence for the segmental al-lotetraploid origin of maize. Proc. Natl. Acad. Sci. U.S.A. 94, 6809–6814.
Gaut, B.S., d'Ennequin, M.L.T., Peek, A.S. and Sawkins. M.C. (2000) Corn as a model for the evolution of plant nuclear genomes. Proc. Natl. Acad. Sci. U.S.A. 97, 7008–7015.
Grabber, J.H. (2005) How do lignin composition, structure, and cross-linking affect degrad-ability? A review of cell wall model studies. Crop Sci. 45, 820–831.
Grabber, J.H., Ralph, J., Lapierre, C. and Barrière, Y. (2004) Genetic and molecular basis of grass cell-wall degradability. I. Lignin-cell wall matrix interactions. C.R. Biologies 327, 455–465.
Graham, R.L., Nelson, R., Sheehan, J., Perlack, R.D. and Wright, L.L. (2007) Current and potential U.S. corn stover supplies. Agron. J. 99, 1–11.
Graybill, J.S., Cox, W.J. and Otis, D.J. (1991) Yield and quality of forage maize as influenced by hybrid, planting date and plant density. Agron. J. 83, 559–564.
Guillaumie, S., Pichon, M., Martinant, J.P., Bosio, M., Goffner, D. and Barrière, Y. (2007a). Differential expression of phenylpropanoid and related genes in brown-midrib bm1, bm2, bm3, and bm4 young near-isogenic maize plants. Planta 226, 235–250.
Guillaumie, S., San-Clemente, H., Deswarte, C., Martinez, Y., Lapierre, C., Murigneux, A., Barrière, Y., Pichon, M. and Goffner, D. (2007b) MAIZEWALL. Database and develop-mental gene expression profiling of cell wall biosynthesis and assembly in maize. Plant Physiol. 143, 339–363.

Genetic Improvement of Corn for Lignocellulosic Feedstock Production 205
Gupta, S.C. (1985) Predicting corn planting dates for moldboard and no-till till-age systems in the Corn Belt. Agron. J. 77, 446–455.
Halpin, C., Holt, K., Chojecki, J., Oliver, D., Chabbert, B., Monties, B., Edwards, K., Bara-kate, A. and Foxon G.A. (1998) Brown-midrib maize (bm1) – a mutation affecting the cinnamyl alcohol dehydrogenase gene. Plant J. 14, 545–553.
Hames, B.R., Thomas, S.R., Sluiter, A.D., Roth, C.J. and Templeton, D.W. (2003) Rapid biomass analysis: new tools for compositional analysis of corn stover feedstocks and proc-ess intermediates from ethanol production. Appl. Biochem. Biotechnol. 105–108, 5–16.
Hatfield, R. and Vermerris, W. (2001) Lignin formation in plants. The dilemma of linkage specificity. Plant Physiol. 126, 1351–1357.
Hirel, B., Martin, A., Terce-Laforgue, T., Gonzalez-Moro, M.B. and Estavillo, J.M. (2005) Physiology of maize I: A comprehensive and integrated view of nitrogen metabolism in a C4 plant. Physiol. Plant. 124, 167–177.
Hopkins, A.A., Vogel, K.P. and Moore, K.J. (1993) Predicted and realized gains from selec-tion for in vitro dry matter digestibility and forage yield in switchgrass. Crop Sci. 23, 253–258.
Horton, P. (2000) Prospects for crop improvement through the genetic manipulation of photo-synthesis: morphological and biochemical aspects of light capture. J. Exp. Bot. 51, 475–485.
Hoskinson, R.L., Karlen, D.L., Birrell, S.J., Radtke, C.W. and Wilhelm, W.W. (2007) Engi-neering, nutrient removal, and feedstock conversion evaluations of four corn stover har-vest scenarios. Biomass Bioenergy 31, 126–136.
Hu, W.J., Harding, S.A., Lung, J., Popko, J.L., Ralph, J., Stokke, D.D., Tsai, C.J. and Chian, V.L. (1999) Repression of lignin biosynthesis promotes cellulose accumulation and growth in transgenic trees. Nature Biotech 17, 808–812.
Iltis, H.H. (2006) Origin of polystichy in maize. In: J.E. Staller, R.H. Tykot and B.F. Benz (Eds.), Histories of Maize: Multidisciplinary Approaches to the Prehistory, Linguistics, Biogeography, Domestication and Evolution of Maize. Elsevier, Burlington, MA, pp. 21–51.
Iltis, H.H. and Doebley, J. (1980) Taxonomy of Zea (Gramineae) II. Sub-specific categories in the Zea mays complex and a generic synopsis. Am. J. Bot. 67, 994–1004.
Jacobsen, K.R., Fisher, D.G., Maretzki, A., Moore, P.H. (1992) Developmental changes in the anatomy of the sugarcane stem in relation to phloem unloading and sucrose storage. Bot Acta 105, 70–80.
Jarvis, J.L., Clark, R.L. and Guthrie, W.D. (1982) Effect of second generation European corn borer on resistance of maize to Diplodia maydis. Phytopathology 72, 1149–1152.
Joseph, G., Lauer, J.G., Carter, P.R., Wood, T.M., Diezel, G., Wiersma, D.W., Rand, R.E. and Mlynarek M.J. (1999) Corn hybrid response to planting date in the northern Corn Belt. Agron. J. 91, 834–839.
Jung, H.G. and Deetz, D.A. (1993) Cell wall lignification and degradability. In: H.G. Jung, D.R. Buxton, R.D. Hatfield and J. Ralph (Eds.), Forage Cell Wall Structure and Digesti-bility. ASA – CSSA – SSSA Madison, Wisconsin. pp. 315–346.
Jung, H.G. and Lamb, J.F.S. (2003) Identification of lucerne stem cell wall traits related to in vitro neutral detergent fibre digestibility. Anim. Feed Sci. Technol. 110, 17–29.
Jung, H.G. and Casler, M.D. (2006a) Maize stem tissues: Cell wall concentration and compo-sition during development. Crop Sci 46, 1793–1800.
Jung, H.G. and Casler, M.D. (2006b) Maize stem tissues: Impact of development on cell wall degradability. Crop Sci 46, 1801–1809.

206 de Leon and Coors
Justen, B.A. (2004) Digestion kinetics and vitreousness in breeding Maize (Zea mays L.) for silage yield and nutritional quality. M.S. Thesis. University of Wisconsin-Madison. Madi-son, WI.
Kato, A., Lamb, J.C. and Birchler, J.A. 2004. Chromosome painting using repetitive DNA sequences as probes for somatic chromosome identification in maize. Proc. Natl. Acad. Sci. U.S.A. 101, 13554–13559.
Kiesselbach, T.A. (1999) The Structure and Reproduction of Corn. 50th Anniversary Edition. Cold Spring Harbor, NY.
Kim, S. and Dale, B. (2005) Life cycle assessment of various cropping systems utilized for producing biofuels: Bioethanol and biodiesel. Biomass Bioenergy 29, 426–439.
Kirkpatrick, K.M., Lamkey, K.R., Scott, M.P., Moore, K.J., Haney, L.J., Coors, J.G., Lorenz, A.J. (2006) Identification and characterization of maize varieties with beneficial traits for biobased industries. International Plant Breeding Symposium, Mexico City, Mexico. p. 127 http://www.cimmyt.org/english/docs/proceedings/IPBS06-Abstracts.pdf.
Klenke, J.R., Russell, W.A. and Guthrie W.D. (1986) Grain yield reduction caused by second generation European corn borer in BS9 corn synthetic. Crop Sci. 26, 859–863.
Krakowsky, M.D., Lee, M. and Coors, J.G. (2005) Quantitative trait loci for cell-wall compo-nents in recombinant inbred lines of maize (Zea mays L.) I: stalk tissue. Theor. Appl. Genet. 111, 337–346.
Krakowsky, M.D., Lee, M. and Coors, J.G. (2006) Quantitative trait loci for cell-wall compo-nents in recombinant inbred lines of maize (Zea mays L.) II: leaf sheath tissue. Theor. Appl. Genet. 112, 717–726.
Kucharik, C.J. (2006) A multidecadal trend of earlier corn planting in the central USA. Agron. J. 98, 1544–1550.
Lauer, J.G. (2001) Earlier planting dates for corn: Real progress or an effect of global warm-ing. Wisconsin Crop Manager 8, 83–85.
Lauer, J.G., Coors, J.G. and Flannery, P.J. (2001) Forage yield and quality of corn cultivars developed in different eras. Crop Sci. 41, 1449–1455.
Laureano-Perez, L., Teymouri, F., Alizadeh, H. and Dale, B.E. (2005) Under-standing factors that limit enzymatic hydrolysis of biomass. Appl. Biochem. Biotechnol. 124, 1081–1099.
Laurie, D.A. and Bennett, M.D. 1985. Nuclear DNA content in the genera Zea and Sorghum. Intergeneric, interspecific and intraspecific variation. Heredity 55, 307–313.
Lawrence C.J. and Walbot V. (2007) Translational genomics for bioenergy production from fuelstock grasses: Maize as the model species. Plant Cell 19, 2091–2094
Lawrence, C.J., Schaeffer, M.L., Seigfried, T.E., Campbell, D.A. and Harper, L.C. (2007) MaizeGDB's new data types, resources and activities. Nucleic Acids Res. 35, D895–D900.
Le Roux, L.G. and Kellogg, E.A. (1999) Floral development and the formation of unisexual spikelets in the Andropogoneae (Poaceae). Am. J. Bot. 86, 354–366.
Lee, J.H., Arumuganathan, K., Kaeppler, S.M., Park, S.W., Kim, K.Y., Chung, Y.S., Kim, D.H. and Fukui, K. (2002). Variability of chromosomal DNA contents in maize (Zea mays L.) inbred and hybrid lines. Planta 215, 666–671.
Li, D., Blakey, C.A., Dewald, C. and Dellaporta, S.L. (1997) Evidence for a common sex determination mechanism for pistil abortion in maize and in its wild relative Tripsacum. Proc. Natl. Acad. Sci. U.S.A. 94, 4217–4222.
Liu, K., Goodman, M., Muse, S., Smith, J.S., Buckler, E. and Doebley, J. (2003) Genetic structure and diversity among maize inbred lines as inferred from DNA microsatellites. Genetics 165, 2117–2128.
Lorenz, A. and Coors, J.G. (2006) Characterization and analysis of maize traits beneficial to the lignocellulosic ethanol industry. The ASA-CSSA-SSSA International Annual Meet-ings, Indianapolis, IN http://crops.confex.com/crops/2006am/techprogram/P26831.HTM

Genetic Improvement of Corn for Lignocellulosic Feedstock Production 207
Lorenz, A., Gustafson, T., de Leon, N. and Coors, J. (2007) Breeding maize for total biomass production: Examination of harvest index and the relationship between stover yield and grain yield. The ASA-CSSA-SSSA International Annual Meetings. New Orleans, LA http://a-c-s.confex.com/a-c-s/2007am/techprogram/P32731.HTM
Lübberstedt, T., Melchinger, A.E., Schon, C.C., Utz, H.F. and Klein, D. (1997a) QTL map-ping in testcrosses of European flint lines of maize: I. Comparison of different testers for forage yield traits. Crop Sci. 37, 921–931.
Lübberstedt, T., Melchinger, A.E., Klein, D., Degenhardt, H. and Paul, C. (1997b) QTL map-ping in testcrosses of European flint lines of maize: II. Comparison of different testers for forage quality traits. Crop Sci. 37, 1913–1922.
Lübberstedt, T., Melchinger, A.E., Fähr, S., Klein, D., Dally, A. and Westhoff, P. (1998) QTL mapping in testcrosses of European flint lines of maize: III. Comparison across popula-tions for forage quality traits. Crop Sci. 38, 1278–1289.
Lundvall, J.P., Buxton, D.R., Hallauer, A.R. and George, J.R. (1994) Forage quality variation among maize inbreds: in vitro digestibility and cell-wall components. Crop Sci 34, 1672–1678.
Luna V.S., Figueroa, M.J., Baltazar, M.B., Gomez, L.R., Townsend, R. and Schoper, J.B. (2001) Maize pollen longevity and distance isolation requirements for effective pollen control. Crop Sci. 41, 1551–1557
Marita, J.M., Vermerris, W., Ralph, J. and Hatfield, R.D. (2003) Variations in the cell wall composition of maize brown midrib mutants. J. Agric. Food Chem. 51, 1313–1321.
Mathews, S., Tsai, R.C. and Kellogg, E.A. (2000) Phylogenetic structure in the grass family (Poaceae): Evidence from the nuclear gene phytochrome B. Am. J. Bot. 87, 96–107.
McClintock, B., Kato, Y. and Blumenshein, A. (1981) Chromosome constitution of races of maize. Colegio de Postgraduados, Chapingo, Mexico.
McLaughlin, S., Bouton, J., Bransby, D., Conger, B., Ocumpaugh, W., Parrish, D., Taliaferro, C., Vogel, K. and Wullschleger, S. (1999) Developing Switchgrass as a Bioenergy Crop. In: J. Janick (Ed.), Perspectives on New Crops and New Uses. ASHS Press, Alexandria, VA. pp. 282–299.
Méchin, V., Argillier, O., Hebert, Y., Guingo, E., Moreau, L., Charcosset, A. and Barrière, Y. (2001) Genetic analysis and QTL mapping of cell wall digestibility and lignification in si-lage maize. Crop Sci. 41, 690–697.
Melchinger, A.E., Kreps, R., Spath, R., Klein, D. and Schulz, B. (1998a) Evaluation of early-maturing European maize inbreds for resistance to the European corn borer. Euphytica 99, 115–125.
Melchinger, A.E., Utz, H.F. and Schon, C.C. (1998b) QTL mapping using different testers and independent population samples in maize reveals low power of QTL detection and large bias in estimates of QTL effects. Genetics 149, 383–403.
Messing, J. and Dooner, H.K. (2006) Organization and variability of the maize genome. Curr. Opin. Plant Biol. 9, 157–163.
Messing, J., Bharti, A.K., Karlowski, W.M., Gundlach, H., Kim, H.R., Yu, Y., Wei, F., Fuks, G., Soderlund, C.A., Mayer, K.F.X. and Wing, R.A. (2004) Sequence composition and genome organization of maize. Proc. Natl. Sci. Acad. U.S.A. 101, 14349–14359.
Missaoui, A.M., Fasoula, V.A. and Bouton, J.H. (2005) The effect of low plant density on response to selection for biomass production in switchgrass. Euphytica 142, 1–12.
Montross, M.D., Prewitt, R., Shearer, S.A., Stombaugh, T.S., McNeil, S.G. and Sokhansanj, S. (2002) Economics of collection and transportation of corn stover. ASAE Paper 036081 presented at the Annual International Meeting of the American Society of Agricultural Engineers, Las Vegas, NV. 27–31 July 2003. ASAE, St. Joseph, MI.

208 de Leon and Coors
Morgante, M. (2006) Plant genome organisation and diversity: the year of the junk! Curr. Opin. Biotechnol. 17, 168–173.
Mosier, A.R., Halvorson, A.D., Peterson, G.A., Robertson, G.P. and Sherrod, L. (2005a) Measurement of net global warming potential in three agroecosystems. Nutrient Cycl. in Agroecosyst. 72, 67–76.
Mosier, N., Wyman, C., Dale, B., Elander, R., Lee, Y.Y., Holtzapple, M. and Ladisch, M. (2005b) Features of promising technologies for pretreatment of lignocellulosic biomass. Bioresource Technol. 96, 673–686.
Munkvold, G. (1997) Controlling gray leaf spot in field corn. Integ. Crop Manag. 478, 87–89. NASS (2007) United States Department of Agriculture. Crop Production 2007 Summary.
http://usda.mannlib.cornell.edu/usda/nass/CropProd//-2000s/2007/CropProd-02-09-2007.pdf.
NRI (2003) National Resource Inventory – Soil Erosion http://www.nrcs.usda.gov/technical/ land/nri03/SoilErosion-mrb.pdf.
Osborne, D.P. and Beerling, D.J. (2006) Nature’s green revolution: The remarkable evolution-ary rise of C4 plants. Philos. Trans. R. Soc. London B. Biol. Sci. 361, 173–194.
Paterson, A.H., Freeling, M. and Sasaki, T. (2007) Gains of knowledge: Genomics of model cereals. Genome Res. 15, 1643–1650.
Pedersen, J.F. (1996) Annual forages: New approaches for C-4 forages. In: J. Janick (Ed.), Progress in New Crops. ASHS Press, Alexandria, VA, pp. 246–251.
Pedersen, J.F., Vogel, K.P. and Funnell, D.L. (2005) Impact of reduced lignin on plant fitness. Crop Sci. 45, 812–819.
Perlack, R.D., Wright, L.L., Turhollow, A.F., Graham, R.L., Stokes, B.J. and Erbach, D.C. (2005) Biomass as feedstock for a bioenergy and bioproduct industry: The technical feasi-bility of a billion-ton annual supply, U.S. DOE and USDA, April 2005.
Ralph, J., Guillaumie, S., Grabber, J.H., Lapierre, C. and Barrière, Y. (2004) Genetic and molecular basis of grass cell-wall degradability. III. Towards a forage ideotype. C.R. Biologies 327, 467–479.
Randall, G. and Vetsch, J. (2003) Assessing soil N availability using the Illinois nitrogen soil test for corn after soybeans http://sroc.cfans.umn.edu/research/soils/researchresults/ 2002/Assessing%20Soil%20N%20Availability.pdf
Reifschneider, F.J.B. and Arny, D.C. (1983) Yield loss of maize caused by Kabatiella zeae. Phytopathology 73, 607–609.
Renvoize, S.A. and Clayton, W.D. (1992) Classification and evolution of grasses. In: G.P. Chapman (Ed.), Grass Evolution and Domestication. Cambridge University Press, Cam-bridge, UK, pp. 3–37.
Richards, R.A. (2000) Selectable traits to increase crop photosynthesis and yield of grain crops. J. Exp. Bot. 51, 447–458.
Ritchie, S.W., Hanway, J.J. and Benson, G.O. (1996) How a corn plant develops. Special Report No. 48. Iowa State University, Cooperative Extension Service, Ames, IA.
Sakamoto, T. and Matsuoka, M (2004) Generating high-yielding varieties by genetic manipu-lation of plant architecture. Curr. Opin. Biotechnol. 15, 144–147.
Sakamoto, T., Morinaka, Y., Ohnishi, T., Sunohara, H., Fujioka, S., Ueguchi-Tanaka, M., Mizutani, M., Sakata, K., Takatsuto, S., Yoshida, S., Tanaka, H., Kitano, H. and Matsu-oka, M. (2005) Erect leaves caused by brassinosteroid deficiency increase biomass pro-duction and grain yield in rice. Nat. Biotechnol. 24, 105–109.
Service, R.F. (2007) Cellulosic ethanol: Biofuel researchers prepare to reap a new harvest. Science 315, 1488–1491.
Shaver, D.L. (1967) Perennial maize. J. Heredity 58, 270–273.

Genetic Improvement of Corn for Lignocellulosic Feedstock Production 209
Shaver, D.L. (1983) Genetics and breeding of maize with extra leaves above the ear. 38th Proceedings of Annual Corn and Sorghum Research Conference. Chicago, IL. American Seed Trade Association, Washington, DC, pp. 161–180.
Shaw, R.H. (1988) Climate requirement. In: G.H. Sprague and J.W. Dudley (Eds.), Corn and Corn Improvement. American Society of Agronomy, Madison, WI, pp. 609–638.
Sheehan, J., Aden, A., Paustian, K., Killian, K., Brenner, J., Walsh, M. and Nelson, N. (2004) Energy and environmental aspects of using corn stover for fuel ethanol. J. Ind. Ecol. 7, 117–146.
Shinners, K.J., Adsit, G.S., Binversie, B.N., Digman, M.F., Muck, R.E. and Weimer, P.J. (2007b) Single-pass split-stream harvest of corn grain and stover. Transactions of the ASABE 50, 255–363.
Shinners, K.J., Binversie, B.N., Muck, R.E. and Weimer, P.J. (2007a) Comparison of wet and dry corn stover harvest and storage. Biomass Bioenergy 31, 211–221.
Smith, D.R. and White, D.G. (1988) Diseases of corn. In: G.F. Sprague and J.W. Dudley (Eds.), Corn and Corn Improvement, 3rd Edition. American Society Agron, Madson, WI. pp. 687–766.
Springer, N.M. and Stupar, R.M. (2007) Allelic variation and heterosis in maize: How do two halves make more than a whole? Genet. Res. 17, 264–275.
Stebbins, G.L. (1957) Self-fertilization and population variability in higher plants. Am. Natu-ral. 91, 337–354.
Sundberg, M.D. and Orr, A.R. (1996) Early inflorescence development in Zea mays L. and race Chapalotte (Poaceae). Am. J. Bot. 83, 1255–1265.
Swigonova, Z., Lai, J., Ma, J., Ramakrishna, W., Llaca, V., Bennetzen, J.L. and Messing, J. (2004) Close split of sorghum and maize genome progenitor. Genome Res. 14, 1916–1923.
Torney, F., Moeller, L., Scarpa, A. and Wang, K. (2007) Genetic engineering approaches to improve bioethanol production form maize. Curr. Opin. Biotech. 18, 193–199.
Tracy, W.F. and Everett, H.L. (1982) Variable penetrance and expressivity of grassy tillers, gt. MNL 56, 77–78.
Troyer, A.F. (2001) Temperate corn: Background, behavior, and breeding. In: A.R. Hallauer (Ed.). Specialty Corns, 2nd Edition. CRC Press, Boca Raton, FL, pp. 393–466.
Veit, B., Schmidt, R.J., Hake, S. and Yanofsky, M.F. (1993) Maize floral development: New genes and old mutants. Plant Cell 5, 1205–1215.
Vermerris W. and Boon J.J. (2001) Tissue-specific patterns of lignification are disturbed in the brown midrib2 mutant of maize (Zea mays L.). J. Agric. Food Chem. 49, 721–728.
Vermerris, W., Thompson, K.J. and McIntyre, L.M. (2002) The maize Brown midrib1 locus affects cell wall composition and plant development in a dose-dependent manner. Heredity 88, 450–457.
Vogel, K.P. and Jung, H.G. (2001) Genetic modification of herbaceous plants for feed and fuel. Crit. Rev. Plant Sci. 20, 15–49.
von Blottnitz, H. and Curran, M.A. (2007) A review of assessments conducted on bioethanol as a transportation fuel from a net energy, greenhouse gas, and environ-mental life cycle perspective Cleaner Prod. 15, 607–619.
Ward, J.M.J., Stromberg, E.L., Nowell, D.C. and Nutter, F.W. Jr. (1999). Gray leaf spot: a disease of global importance in maize production. Plant Dis. 83, 884–895.
Weimer P.J., Dien, B.S., Springer, T.L. and Vogel, K.P. (2005). In vitro gas production as a surrogate measure of the fermentability of cellulosic biomass to ethanol. Appl. Microbiol. Biotechnol. 67, 52–58.
Wessler, S.R. (2006) Genomic studies and molecular genetics: Part 2. Maize genomics, the maize community welcomes the maize genome sequencing project. Curr. Opin. Plant Biol. 9, 147–148.
210 de Leon and Coors
Whetten, R.W., Mackay, J.J. and Seferoff, R.R. (1998) Recent advances in understanding lignin biosynthesis. Annu. Rev. Plant Physiol. Plant Mol. Biol. 49, 585–609.
White, D.G. (1999) Compendium of Corn Diseases, 3rd edition. American Phytopathological Society, St. Paul, MN.
Wilhelm, W.W., Johnson, J.M.F., Hatfield, J.L., Voorhees, W.B. and Linden, D.R. (2004) Crop and soil productivity response to corn residue removal: A literature review. Agron. J. 96, 1–17.
Wilkes, H.G. (1985) Teosinte: The closest relative of maize revisited. Maydica 30, 209–223. Wolf, D.P., Coors, J.G., Albrecht, K.A., Undersander, D.J. and Carter, P.R. (1993) Forage
quality of maize genotypes selected for extreme fiber concentrations. Crop Sci. 33, 1353–1359.
Wyman, C.E., Dale, B.E., Elander, R.T., Holtzapple, M., Ladisch, M.R. and Lee, Y.Y. (2005) Coordinated development of leading biomass pretreatment technologies. Bioresource Technol. 96, 1959–1966.
Zeng, M., Mosier, N.S., Huang, C.-P., Sherman, D.M. and Ladisch, M.R. (2006) Microscopic examination of changes of plant cell structure in corn stover due to hot water pretreatment and enzymatic hydrolysis. Biotechnol. Bioeng. 97, 265–278.
Zhao, W., Canaran, P., Jurkuta, R., Fulton, T., Glaubitz, J., Buckler, E., Doebley, J., Gaut, B., Goodman, M., Holland, J., Kresovich, S., McMullen, M., Stein, L. and Ware, D. (2006) Panzea: a database and resource for molecular and functional diversity in the maize ge-nome. Nucleic Acids Res. 34, D752–D757.

8 Development and Utilization of Sorghum as a Bioenergy Crop
Ana Saballos
Department of Agronomy, Purdue University, West Lafayette, IN 47907, USA, [email protected]
8.1 Introduction
Sorghum is not a newcomer crop. World-wide, it is the fifth most important cereal crop, after wheat rice, corn, and barley. Sorghum is unique in that is can grow in some of the harshest environments, where many other crops cannot be produced. It is highly resistant to drought, but can also withstand water logging much better than most of the other cereals. Sorghum’s large root system allows it to obtain nutrients from poor soils or, when fertilizers are applied, to use those nutrients very effi-ciently. Even though the species originated from semi-arid regions of Africa, it has been adapted to a wide variety of climates, including temperate and humid environ-ments. Ironically, it may have been its superior tolerance to the marginal environments, common in many developing countries that hindered its wider adoption in the devel-oped countries, as sorghum was labeled a poor-man’s crop. Additional factors that contributed to an underutilization of sorghum were the lower nutritional value of the grain and the lower yield compared to corn under good growing conditions. Although breeding efforts have produced dramatic improvements in grain and forage sorghum varieties, the amount of resources invested in the study of the crop have traditionally been minuscule compared to those invested in many other species. As a consequence, most of the abundant genetic diversity of cultivated and wild sorghums remains untapped. The renewed interest in biofuel production offers the possibility to exploit the useful traits of this species. Sorghum represents an ideal dedicated energy crop, as grain quality is now considered less important, and con-cerns about the environmental cost of high-input agriculture and food security grow. The lower need for fertilizers and pesticides may make it an ecologically attractive crop, especially when combined with conservation-agriculture production systems.
W. Vermerris (ed.), Genetic Improvement of Bioenergy Crops, DOI: 10.1007/978-0-387-70805 -8_8, © Springer Science+Business Media, LLC 2008

212 Saballos Furthermore, since sorghum can grow on marginal lands, it will not compete with human food production.
8.2 Botanical Description of Sorghum
The genus Sorghum is composed of C4 cane grasses found worldwide. Cultivated sorghum (S. bicolor spp. bicolor (L.) Moench) belongs to the subgenus Sorghum, which also contains two wild species, S. halepense and S. propinquum. The species S. halepense (Johnsongrass) was originally introduced to the U.S. as a forage crop, but soon became feral. Depending on the variety, S. bicolor is cultivated for its grain, its high-sugar stem juice, or its stover (vegetative biomass) (Fig. 8.1), which is an indication of the phenotypic diversity in this species. All S. bicolor varieties are cane grasses with heights that can range from 0.5 to 6 m. Each stem produces a panicle which comes in a great variety of architectures (Fig. 8.2). Most grain types have been selected to produce a single compact or semi-compact panicle. There are, however, tillering types able to produce multiple pani-cles, either from tillers from basal nodes or branches that develop from stem nodes (see also Chapter 7). The sorghum stem can be juicy or dry, and the sweet sorghum types accumulate sugars in the sap, similar to sugarcane (Chapter 9). The forage varieties produce profuse tillers, with a higher ratio of leaves to stem than the grain and sweet varieties. The stems of forage varieties are slender, 0.5–3.5 m tall, and the panicles tend to be open. S. bicolor wild races (S. bicolor ssp. verticilliflorum and S. bicolor ssp. drum-mondii) are found in all of Africa. Four main races of S. bicolor ssp. verticilliflorum are described: arundinaceum, virgatum, aethiopicum and verticilliflorum. All the races can intermate among each other and with the cultivated types. Based on the morphological characteristics and ecology of the wild races, the verticilliflorum race is considered the most likely ancestor of the cultivated races. This parental race is distributed widely in the savannah zone of eastern and southern Africa. Doggett (1988) and Smith and Frederiksen (2000), provide a detailed discussion on the classi-fication and geographical distribution of the sorghum races. There is evidence of domestication of sorghum going back at least 5,000 years, and possibly longer, although this is the topic of an ongoing debate (Kimber 2000). Nowadays, sorghum is cultivated in every continent besides Antarctica (Fig. 8.3). Its adaptive capacity is evident in the wide range of climates that constitute its cultiva-tion area.

Development and Utilzation of Sorghum as a Bioenergy Crop 213
Fig. 8.1. Main types of cultivated S. bicolor. A. Grain sorghum adapted to combine harvest. B. Sudangrass, a forage sorghum. C. Sweet sorghum. The white scale bar represents 10 cm.
Fig. 8.2. Diversity in panicle architecture of sorghum.

214 Saballos
Fig. 8.3. Distribution of sorghum growing area, 1999–2001. From Bantilan et al. (2004), Reproduced with permission from ICRISAT.
8.2.1 Biology of Reproduction
In temperate climates, sorghum behaves like an annual crop, whereas in tropical regions, most sorghum varieties will continue to produce tillers after the main pani-cle is harvested, allowing for a second (ratoon) harvest. Adaptation of the species to agricultural systems has resulted in selection for annuality. Wild races are often perennials or biennials. The introgression of the perennial behavior into improved varieties is an intriguing possibility. The average crop cycle length is 4 months. In regions with an optimal climate, it is possible to produce multiple crops per year, either from seed (replanting) or from the ratoon. Sorghum is propagated by seeds. The inflorescence has both male and female organs, and most of the seeds in the panicle will be the result of self fertilization, with a degree of outcrossing that ranges from 5 to 30%. Male sterility systems facili-tate the production of sorghum hybrids. Genetic-cytoplasmic male sterility is used in commercial hybrid production (Rooney 2000). Single-gene male sterility results from homozygosity at one of six male sterility (ms) loci (Ayyangar 1942; Ayyangar and Ponnaiya 1937; Barabas 1962; Karper and Stephens 1936; Stephens 1937). Male sterility is expressed differently depending on the locus, from no pollen production to total absence of anthers. The ms3 system is widely used in research and plant breed-ing programs. Cultivated sorghum will produce fully fertile hybrids when intercrossed to spe-cies within the Sorghum subgenus. Attempts to produce hybrids with the subgenera Parasorghum, Heterosorghum, Chaetosorghum and Stiposorghum have been largely unsuccessful. The basic chromosome number in the genus Sorghum is five. Species within the genus have multiples of that basic number. There is some evidence of ancient ge-nome duplication in the ancestor of the Sorghum subgenus (Gomez et al. 1997). Although it is possible that the species S. bicolor and S. propinquum are in fact an-

Development and Utilzation of Sorghum as a Bioenergy Crop 215
cient tetraploids, genetically they behave like diploids, with n = 10. The perennial species S. halepense is a tetraploid (2n = 4x = 40).
8.3. Management
It is difficult to present a general management strategy for sorghum. Cultivation of the crop is very region-specific, and the species is produced in a very wide range of climates and soil conditions. In this chapter the focus will be on the basic principles for production of sorghum for syrup and biomass. Detailed information on agro-nomic practices can be found in House (1985), Doggett (1988), Taylor (1988), Smith and Frederiksen (2000) and Martin et al. (2006).
8.3.1 Agronomic Considerations
Soils: Sorghum can be successfully grown in a wide range of soils with pH ranging from 5.5 to 8.5. Although maximum yields are obtained in fertile, well-drained soils, adequate production can be obtained in saline, acidic, alkaline and poor drainage conditions. Soil temperatures (at 5 cm depth) of 21°C or above are optimal for ger-mination. In temperate climates, low soil temperature in the spring presents a serious constraint on sorghum production, since it reduces the germination percentage and increases the incidence of fungal damping-off disease in the seedlings. In soils with low pH, high levels of aluminum can be a problem, but resistant germplasm is avail-able. Fertilizer: Sorghum is considered very efficient at utilizing nutrients from the soil because of its large fibrous root system. In poor soils, sorghum responds well to fertilizers, but in medium- to high-fertility soils sorghum tends to be less responsive to fertilizer application than corn. This is more pronounced in landraces and forage sorghum varieties, which have been selected for more stable yield over a wide range of conditions. The specific amount of nutrients necessary will be dependent on the soil characteristics, but as a general rule, the recommended fertilizer application for forage corn will be more than sufficient for sorghum. Nitrogen: Nitrogen can be supplied as organic manure or chemical fertilizer. The application should be at the time of planting. No increase in yield was observed with split applications. The rate of application can vary from 40 to 160 kg ha–1 depending on soil fertility. Sorghum is very efficient at utilizing organic nitrogen, and rotation with legume crops can supply substantial amounts of nitrogen credits, up to 112 kg ha–1 following a good stand of alfalfa, to a minimum of 17 kg ha–1 for soybean (Tay-lor 1988). Care must be taken to avoid excess nitrogen, as this will cause excess stalk elongation, with reduction in sugar concentration in the stem juice, and increased incidence of lodging. Phosphorus: Response to phosphorus occurs only in soils with very low levels of available phosphorus, and only in regions where yield potential is not limited by rainfall. At medium soil phosphorus levels, the yield response to phosphorus applica-tion is small. In acid soils with low levels of available phosphorus, starter applica-tions at planting are more efficient.

216 Saballos Potassium: Studies on forage sorghum have shown that removal of potassium is much greater when biomass is harvested compared to just grain harvest. In addition, potassium availability has been shown to be important for sugar accumulation in sugarcane and sugar beets, and is therefore likely to also play a role in sweet sor-ghum. Therefore, special attention should be paid to the levels of available potassium in the soil when considering biomass production systems. Potassium is essential for sturdy stalks, and while lodging is influenced by many factors, proper potassium availability can help minimize lodging. Potassium can be applied as a pre-plant broadcast or as a starter application at planting. Li et al. (2004) recommend the ap-plication of a basal application of organic fertilizer (manure or compost) over chemi-cal fertilizer at a recommended rate of 60 Mg ha–1. Water requirements: For optimal production, 320–400 mm of water is required. This is just one quarter of the water needed for the production of sugarcane, and half to two-thirds of that needed for corn (Pedersen and Rooney 2004). The reported water requirement is for the production of high-quality plant juice for syrup produc-tion, in which taste characteristics are important. However, for ethanol production the most important parameter is the total soluble carbohydrate yield. It has been reported that sucrose and starch content are higher in drought-stressed stems than in well-watered control stems, and this increase results in equal sugar yield despite the reduction in plant growth (Massacci et al. 1996). In this particular study, the plants were rain-fed during the first month of growth, and relied on residual soil moisture during the remainder of the season. Seedlings and plants in the vegetative growth stage are tolerant to drought. They arrest development during dry spells and resume growth when moisture is available. Moisture is, however, critical for grain develop-ment. Water deficiency during the period from booting to grain filling can cause abortion of the young spikelets, flowers and poor grain filling (Doggett 1988). Soil preparation: In general, preparation of soil includes plowing and harrow-ing. Plowing can be done in the fall or just before planting. Sorghum is also suitable for no-till farming. Studies on a sweet sorghum cultivar found no consistent differ-ences in biomass yield under no-till and tillage conditions (Greene 1997). The suit-ability of grain sorghum for no-tillage farming has also been well documented. In-creases in grain sorghum yield in dry-lands during the last 30 years have been partially due to the adoption of no-tillage conservation practices (Unger and Baum-hardt 1999). Benefits of no-tillage practice have been reported for continuous sor-ghum, wheat-sorghum, and legume-sorghum rotations (Norwood 1994). The yield increment is likely due to the higher water content at deeper levels of the soil profile in no-till soils. In addition, there is an increase in the soil organic matter (SOM) content, an important factor to consider when producing crops in which most of the above-ground biomass is removed (Potter et al. 1997). Planting date: Sorghum should be planted when the soil temperature at 5-cm depth is at least 15°C. Water regimen and length of growing season should be taken in account when selecting the planting date. Seed preparation: Seed should be of good quality, without small, shriveled or broken kernels. A germination test can be conducted to determine the sowing rate necessary to obtain a full stand. The seed may be treated with a broad-spectrum fungicide such as Captan, to reduce seed rot and seedling blight. This is especially

Development and Utilzation of Sorghum as a Bioenergy Crop 217
important in cool, wet soils. If preemergence herbicides are going to be used to con-trol weeds, it may be necessary to treat the seed with safeners, used as seed-dressing. Safeners will protect the sorghum seedling from injury due to certain pre-emergence herbicides. Method and rate of seeding: The sorghum seed is small, and should not be planted excessively deep. Soil coverage of 2.5–3.5 cm is adequate in most soils. The method and rate of planting recommended in the literature vary according to the use of the crop. For forage sorghums used in pasture, a grin drill or broadcast seeder can be used, at a rate of 33 kg seed ha–1, assuming 90% germination rate. For silage production, planting in rows spaced 76–100 cm facilitates harvesting. The seed is then planted at a rate of 7–11 kg ha–1. Doggett (1988) suggested a spacing of 60 cm between rows and 30 cm between plants for the planting of sweet sorghum for syrup production. Closer spacing may result in increased lodging and less syrup yield on a per-tonne biomass basis. For sweet sorghum production in Kentucky, the ideal seed-ing rate for most sweet sorghum varieties is 9–12 seeds m–1 that are thinned to 6–10 plants m–1 (Bitzer 1997). Thinning to the desired density is done when the plants are 20–25 cm tall. At this stage, the plants have established their root system and the losses due to damping-off are minimal. Undersander et al. (1990) recommended a planting rate of 11–17 kg ha–1 using a corn planter or a grain drill. Final plant density should be adjusted to the particular conditions of the zone. In dry regions and sandy soils with little water retention capacity, the lower end of the recommended range is most suitable. Weed Control: The growth of the plant is slow during the young seedling stage. Weed control is most important during this period. Weed control can be done by mechanical means such as hoeing or cultivation, or with the use of herbicides. Both pre-emergence and post-emergence herbicides are available for sorghum. After the plants have reached 20 cm, the growth accelerates and they can compete well with annual weeds. A good stand should produce a full canopy that will shade out most weeds.
8.3.2 Pests and Diseases
The pests and diseases prevalent in the sorghum crop will depend on the specific region where it is cultivated and the production system used. Despite the apparent abundance of possible insect pests, sorghum is a very resilient crop, and in most areas insects never become a serious problem. Good cultural practices, adequate management of soil fertility and water, and the use of good-quality seed is often enough to avoid excessive damage. Pests and diseases can often be effectively con-trolled with the use of chemical agents, but these compounds can also harm natural enemies and increase the production cost of the crop. Resistant populations of aphids, greenbug, spider mites and other insects have developed as a result of heavy chemical control. Concerns over environmental impact should also be considered when choosing a crop protection strategy. Monoculture, continuous culture of grass species and no-tillage practice favor increases in the population of damaging organ-isms. When possible, an integrated pest and disease management approach should be used. Rotation with legumes and other non-grassy plants is an effective way to

218 Saballos reduce the populations of pests with limited host range, long life cycle and limited capacity to move from one field to another. Alternate host elimination by means of weed control is important to reduce food sources and overwintering habitats of pests. Johnsongrass is host for many sorghum pests, and its control is highly beneficial for an integrated pest management program. Detailed information on sorghum pests and diseases can be found in Doggett (1988), Frederiksen and Odvody (2000) and Smith and Frederiksen (2000). A brief discussion of the most common and most serious pests and diseases is provided below.
8.3.2.1 Insect Pests
Seed and seedling pests: In the Americas, wireworms, (larvae of beetles of the family Elanteridae) false wireworms (larvae of beetles of the family Tenebrionidae), red imported fire ant (Selenopsis invicta), white grubs (Phyllophaga spp.), cut worms (species of the family Noctuidae), corn rootworms (Diabrotica spp.), yellow sugar-cane aphid (Sipha flava), and chinch bug (Blissus leucopterus) are common insect pest can damage planted seed and young plants. In Africa and Asia, mole crickets (Gryllotalpa), army worm (Spodoptera spp.), locust (Locusta migratoria, Schisto-cerca gregaria) grasshoppers (Oedaleus senegalensis, Aliopus simulatrix) and sor-ghum shoot-fly (Antherigona soccata) represent a serious problem. Cultural control: Rotation of sorghum with a non-grassy crop is one of the most effective strategies to deal with seed and seedling pests. Fast germinating, vigorous seedlings can escape or tolerate better the attack of insect pests. Early planting can also contribute to escape, as the plants will pass the vulnerable stage before the pest population reaches high numbers. However, planting should be done after the soil reaches adequate temperature, as cold, wet seed is more susceptible to fungal attack. Chemical control: Seed dressing with an insecticide and a fungicide is recom-mended to improve stand. Some systemic insecticides, applied to the seed or furrow, are effective at protecting the germinating plants and young seedlings from aphids and chinchs. When soil pests are abundant, a granular or liquid insecticide should supplement the seed treatment. Pest of leaves and stems: Yellow sugarcane aphid (Sipha flava) and greenbug aphid (Schizaphis graminum) often infest the whorl and underside of leaves. They suck the plant sap and inject toxins and are also vectors for diseases such the Maize Dwarf Mosaic Virus. Molds can grow in the honeydew they produce. Although larger plants tolerate aphids better than seedlings, heavy infestations can result in reduced grain yield and increased susceptibility to lodging. Young stem borer larvae (Diatraea saccharalis, D. lineolatus, D. grandiosella, Eoreuma loftini) feed on leaves, and mature larvae bore into the stem. Infestation can result in retarded plant growth and increased lodging. Spider mites (Oligonychus pratensis) are commonly a secondary pest after natural enemies have been destroyed by the application of insec-ticides. Heavy spider mite infestation can cause lodging and failure to fill seed. Cultural control: Aphids are the target of many natural enemies. Where natural insect populations have not been destroyed by chemical applications, adequate fertil-ity and water control are often enough to manage the damage due to aphids. Excess nitrogen fertilization should be avoided, because it will cause the plants to become

Development and Utilzation of Sorghum as a Bioenergy Crop 219
more succulent and attractive to sucking insects. Early planting is helpful in the control the stem borers. Destruction or removal of the stubble is beneficial for reduc-ing the population the following year. Hot, dry weather and drought-stressed plants favor the rapid increase of spider mite populations. Good water management and avoiding planting sorghum near small grains reduces the damage due to spider mites. Chemical control: Aphid infestation does not usually require chemical control, but many insecticides are effective if needed. Granulated formulations can be applied to the whorl to control early infestation of stem borer. Greenbugs and spider mites have developed resistance to many insecticides. Application of insecticides should be considered only if the pest populations have reached the economic damage threshold. Some organophosphorous insecticides can still be used to control greenbugs. Pest of panicles: The most important pests of panicles and developing grain are the sorghum midge (Stenodiplosis sorghicola), followed by caterpillars such those of the Helicoverpa and Nola genera. Occasionally, sap-sucking insects such as false chinch (Nysius raphanus), blue bug (Calidea dregii), southern green stinkbug (Neza-ra viridula) and cluster bug (Agonoscelis pubescens) can build up in to large popula-tions from nearby pastures and cause severe damage. Cultural control: Sorghum midge overwinters in spikelets of host grasses. Elimi-nation of Johnsongrass is important to reduce next year’s abundance of the insect. Varieties and hybrids with early and uniform maturity can escape heavy infestations from midges and sap-sucking insects. Varieties with loose panicles are less damaged by caterpillars. Chemical control: Caterpillar infestation is mostly controlled by natural mortal-ity. Monitoring should be used to determine the need for insecticide application. To determine the threshold for sorghum midge, crop development, yield potential and pest abundance need to be assessed. The level of economic damage caused by panicle-feeding insects is dependent on whether the grain is an important product. If sugar or lignocellulosic biomass are the main products, these pests may not be as problematic as they are in the case grain is the main product. Genetic control of insect pests: Lines with varying degree of resistance to shoot fly, stem borer and sorghum midge are available. There are sorghum hybrids and varieties with resistance to greenbug. Both biotype-specific and non-specific reac-tions have been reported, and several genomic regions partially responsible for them have been mapped (Agrama et al. 2002; Katsar et al. 2002; Nagaraj et al. 2005). Resistance to shoot fly, yellow sugarcane aphid and spotted stem borer has been identified in wild relatives. Due to the low level of resistance found against caterpil-lars, transgenic approaches are an interesting possibility for the control of stem bor-ers and root worms. Since Bt toxins have been proven effective in corn and cotton, their use in combination with naturally occurring tolerance genes and other novel insect resistance agents such as protease inhibitors and plant lectins, could provide a means to reduce the use of chemical pesticides. Sharma et al. (2005) offer a good review on the status of plant host resistance to insects.

220 Saballos 8.3.2.2 Diseases
As a globally grown crop, sorghum is exposed to many pathogenic microorganisms. Many organism able to cause disease are in practical terms of minor importance, and good agronomic practice and selection of adapted genotypes are usually enough to avoid serious damage. Here the focus will be the diseases considered of major eco-nomic importance, primarily for the production of grain. Anthracnose (Colletotricum graminicola): It is probably the most important disease in humid sorghum growing areas, causing leaf blight and stalk rot. It can cause over 50% grain yield loss. The major source of inoculum is the sorghum de-bris, in which sclerotia can survive for up to 18 months. The pathogen develops in leaves, stalks and panicles, causing rapid death of the tissue. The disease is spread from plant to plant by splashing of rain water. Most commercial hybrids carry resis-tance genes to this disease. The pathogen population is composed of several races, and the useful life of a resistant gene will depend on the changes on the pathogen population. Resistant germplasm to anthracnose has been identified in several collec-tions (Marley and Ajayi 2002; Erpelding and Louis 2004; Erpelding et al. 2005; Erpelding and Prom 2006; Wang et al. 2006; Erpelding and Wang 2007; Prom et al. 2007). In many instances, the expression of the resistance shows genotype × envi-ronment interactions. A genetic study on a collection of resistant germplasm identi-fied at least five independent genes that confer resistance in either dominant or reces-sive fashion (Mehta et al. 2005). Several molecular markers linked to resistance have been identified (Klein et al. 2001; Singh et al. 2006). Anthracnose can be avoided by growing the sorghum in dry environments, which are not favorable to the disease. The use of resistant hybrids and varieties, combined with crop rotations, is the most effective way to control the disease. Stalk rot: Charcoal stalk rot (Macrophomina phaseolina) is more prevalent in drought-stressed plants. Infection causes rotting at the base of the stalk, which results in increased susceptibility to lodging. Fusarium rot (Fusarium spp.) is similar to charcoal rot, but more common in cooler regions. Sterile plants and those with post-flowering drought resistance like the ‘stay-green’ trait have better tolerance to stalk rot diseases. Many commercial hybrids contain good level of resistance to charcoal rot. There are fewer commercial lines with Fusarium resistance, although genetic sources have been identified. The inheritance mode of resistance from different germplasm sources indicates the existence of multiple resistance genes (Bramel-Cox and Claflin 1989; Tenkouano et al. 1993; Waniska et al. 2001; Tesso et al. 2004, 2005; Reddy et al. 2008). Recently, there have been reports of increased resistance from sorghum lines genetically modified for reduced lignin content (Funnell 2006). Viral diseases: Several Potyviruses – Maize Dwarf Mosaic Virus, Johnsongrass Mosaic Virus, and Sugarcane Mosaic Virus – are the most common and important viral pathogens of sorghum. Their symptoms are difficult to distinguish because of the different reaction of cultivars to these viruses and the possible mix of strains that can be present is the field. Symptoms include stunting, chlorosis, reduction in plant weight, and, therefore, a reduction in yield (Frederiksen 2000). A MDMV epidemic occurred in Texas in 1967, due to the use of extremely susceptible cultivars and the appearance of a new biotype of greenbug, a vector of the virus. Since then, the re-

Development and Utilzation of Sorghum as a Bioenergy Crop 221
lease of resistant lines has dramatically lowered the losses from this disease. The resistance has been durable probably because the virus population is maintained in perennial grasses, infecting anew the crop every year. Therefore, there is little pres-sure for pathogen population shift. Foliar diseases: There are a number of foliar diseases that affect sorghum. Many cause unsightly lesions in the leaves, but usually the grain yield losses are small unless highly susceptible genotypes were planted (Frederiksen 2000). Foliar diseases are more important in forage sorghums. It is possible that in biomass production systems, they will become more prominent. Genetic resistance and tolerance will play a major role in maintaining disease control, as low input levels are paramount in maintaining an economically viable crop. Among the most common foliar disease in sorghum are the grey leaf spot (Cercospora spp), leaf blight (Setosphaeria turcica), oval leaf spot (Ramulispora sorghicola), rust (Puccinia purpurea) and downy mil-dew (Peronosclerospora sorghi). Multiple genomic regions for resistance to foliar pathogens have been identified, and some of them are used in commercial lines (Patil-Kulkarni et al. 1972; Rana et al. 1976; Gowda et al. 1995; Borovkova et al. 1998; Kamala et al. 2002; McIntyre et al. 2004; Wang et al. 2006; Prom et al. 2007). Diseases of panicles: Ergot (Claviceps africana) has traditionally affected mostly hybrid seed production, because the pathogen primarily infects male-sterile panicles. Conidia of the anamorph (Sphacelia sorghi) infect through the stigma and replace the ovary with fungal mass. A sweet fluid (honeydew) exudes from the floret and carries the spores of the fungus. The honeydew is produced from the sugars in the plant sap. The large metabolic demands of the pathogen nearly exhaust the phloem translocations (Bogo 2001). The susceptible period for infection of florets begins when stigmas are extruded and ends when fertilization occurs. A short sus-ceptible period can contribute to reduction in infection (Bandyopadhyay et al. 1998). Most of the identified sources of resistance appear to use escape mechanism by effi-cient pollination. This kind of resistance is not very effective for the hybrid seed production. A study on the role of pollen quantity and viability on the percentage of ergot infection found low values of correlation between the pollen traits and the disease percentage, suggesting that there are other genetic factors that influence the resistance to the disease (Parh et al. 2006). Physiological resistance has been identi-fied in cultivated sorghum as well as in wild relatives, and in several instances the resistance is expressed in both male-fertile as well as male-sterile hybrids of the lines (Dahlberg et al. 2001; Reed et al. 2002). The high concentration of sucrose observed in the honeydew of infected sweet sorghum cultivars may inhibit secondary sporula-tion of the fungus (Bogo et al. 2004). The sucrose is converted to oligosaccharides with spore-germination inhibiting properties. Since secondary sporulation in vivo seems to be a principal cause of epidemics, the sweet sorghum trait may help reduce the percentage of infected plants in the field, although this has not been confirmed.
8.3.3 Harvest and Processing Systems
Historically, sorghum has been cultivated for three distinct applications: Grain, for-age, and syrup production. Each system has resulted in the development of lines with characteristics optimized for their end use. From a bioenergy perspective, sorghum

222 Saballos can be use to feed three processing streams: grain starch, which has more or less the same value as corn starch for the production of ethanol, high-sugar stem juice that can be use directly for fermentation, and the dry bagasse left after juice extraction that can be used as lignocellulosic feedstock for fermentation or directly as boiler fuel (see Fig. 8.5). Grain sorghum: Grain sorghums (milos) have a high panicle-to-green-biomass ratio, with dwarf, low-tillering hybrids suitable for combine harvest. The average grain yield for sorghum in the U.S. in 2006 was 3.52 ton ha–1 (56.2 bushels per acre) (http://usda.mannlib.cornell.edu/ usda/current/CropProd/CropProd-11-09-2007.pdf). Since production of ethanol from sorghum grain involves the same processes as the production from corn (see Chapter 2), according to the National Sorghum Growers Association they can be used together in the same plant. The yield potential of sor-ghum stover after grain harvest is similar that of to corn: An estimated 4 ton dry stover ha–1 could be harvested using a hay-baler. In areas of high grain sorghum production, the stover left after harvest could thus be a significant source of lignocel-lulosic biomass. Forage sorghums: Forage types are traditionally referred to as sorghum, sudangrass or sorghum sudangrass hybrids. They can display abundant tillering and some types are perennial or semiperennial in warmer regions. Green biomass is the main prod-uct, usually harvested before the grain reaches maturity. Biomass digestibility and total yield are the main considerations for cultivar selection. The yield of forage sorghum varies widely depending on the genotype used and ranges from 28 to 50 ton ha–1. Sudangrass has thin stems and is very leafy. It can be harvested multiple times during the growing season to produce green chop, silage or hay. In contrast, forage sorghums have larger stalks, higher dry matter yield, but limited regrowth capacity. They are better utilized as silage, since the thicker stems delay drying. Sorghum × sudangrass hybrids have intermediate texture and yield potential, and can be used for silage or to produce coarse hay. For silage production, the stems, leaves and imma-ture panicles are cut and chopped simultaneously, and ensiled immediately. For hay production, the plants are harvested at late vegetative growth, and left in the field to dry for over a week before baling them (Bolsen et al. 1983; Pedersen and Fritz 2000; Moyer et al. 2004). Forage sorghums have high yield potential, and could play a role in energy pro-duction from lignocellulosic biomass. Research on the development of improved cultivar and hybrids of biomass sorghums have produced promising results with reported yield of 30 ton/ha (Rooney et al. 2007). The production of ethanol from sorghum bagasse or stover follows the processing scheme for lignocellulosic bio-mass, as described in Chapter 5. Sweet sorghums: The name refers to varieties that have high concentrations of solu-ble sugars in the plant sap. They are used for the production of syrup, alcoholic bev-erages, crystal sugar and stalks for fresh consumption depending on where they are cultivated. So far sweet sorghums are the variants that have generated the most inter-est in terms of ethanol production. They have been considered a possible biomass feedstock since the seventies (Nathan 1978), either alone or as a complement of sugarcane production to supplement year-round feedstock to ethanol plants (Tew and Cobill 2006). The interest in bioenergy production from sweet sorghum stems from
Development and Utilzation of Sorghum as a Bioenergy Crop 223
the easy accessibility of readily fermentable sugars combined with very high yield of green biomass. Yields vary with location and variety from 20 to 120 ton ha–1. Total soluble solid concentration and composition also vary according with the genotype used. In all varieties, the main carbohydrate is sucrose, with variable amounts of reducing sugars and starch. The proportion of the latter is an important consideration for syrup and sugar production, but is the total soluble carbohydrate concentration and biomass yield that will dictate the ethanol production potential of a variety. Typically, sweet sorghum varieties have low grain yield, but recently varieties with more balanced grain/sugar production have been developed in China and India (Li et al. 2004; Reddy et al. 2007a). These varieties can be used as a dual-purpose crop with the grain harvested for human or animal consumption, or as a dedicated energy crop with the grain used for the production of starch-based ethanol. After extraction of the juice, the bagasse can be used as lignocellulosic feedstock. Several scenarios have been proposed for the harvest and processing of sweet sorghum. Most commonly, the saccharine juice is the main product obtained and fed into the ethanol production process. The stalks are harvested with a cane harvester, the panicles removed, and then the stems are transported to a mill where they are crushed, allowing extraction of the juice. Plants designed to process sugarcane to ethanol can easily use sweet sorghum as feedstock, with the sugars extracted from the juice getting fermented by yeast to produce ethanol. Some researchers have proposed alternatives to the above mentioned sugarcane model for ethanol production. In-field juice extraction and fermentation systems, and solid state fermentation of chopped stalks are possible (Li et al. 2004; Kundiyana et al. 2006). Harvesting of sweet sorghum with a forage chopper results in better bio-mass density compared to harvesting with a cane harvester, thus facilitating trans-port. However, the chopped stalks showed a rapid decline in sugar concentration compared to the stalks harvested whole (Keating et al. 2004).
8.4 Current Status and Future Prospects
Pilot plants that can process sorghum juice are being built in the U.S. An example is the Tampa Bay Area Ethanol Consortium (Florida), which is building a scale-up pilot plant demonstration facility to demonstrate the production, harvest, transporta-tion, storage, handling and conversion of multiple feedstocks, among them sweet sorghum, to enable stable, year-round production. Their production target is 8 mil-lion liter yr–1 (http://www.nrcs.usda.gov/technical/grants.html). The state of Texas has launched an initiative to develop alternate biofuel sources. Sorghum figures prominently as one of the major grain and cellulosic feedstocks under consideration. The interest stems partially from the anticipated irrigation water savings that the switch from corn to sorghum would bring to the state, about 2.4x 10¹² gallons of water if irrigated corn were converted to irrigated sorghum. State Universities serve as a bridge between the state and the private industry. Texas Bio-Energy Marketing Associates, in south Texas, is planning the construction of five plants with sweet sorghum as their major feedstock. The target production is 47 million liter per plant per year (http://www.seco.cpa.state.tx.us/re_ethanol
224 Saballos _plants.htm). Gulf Ethanol Corp. is also pursuing the use of sorghum as feedstock for cellulosic ethanol. Among its plans are the construction of a ethanol plant in east Texas and possible international partnership with Uruguay to produce both feedstock for ethanol production and production facilities in that country. (http://www.gulfethanolcorp.com ). In China, India, South America and the Philippines sweet sorghum juice is used to produce ethanol on a small to medium scale. Many research projects are looking into the production of improved varieties and efficient processing to meet the de-mand. In India, sweet sorghum researchers at the International Crops Research Insti-tute for the Semi-Arid Tropics (ICRISAT) (Patancheru, AP), have identified several sources of germplasm with high sugar content, which have been used to generate parent lines for hybrid production (Reddy et al. 2007b). Rusni Distilleries Pvt. is an enterprise based on pioneering technology of ethanol production from sweet sor-ghum. ABI-ICRISAT supports this initiative through breeder’s seed supply and agriculture extension. In China, the Ministry of Agriculture, together with FAO’s Technical Coopera-tion Program, is establishing sweet sorghum pilot farms in Shandong and Shaanxi provinces (http://www.fao.org/ag/magazine/0202sp2.htm). Breeding programs aimed at the production of varieties and hybrids with high sugar and grain yield have al-ready produced very promising varieties (Li et al. 2004). Pilot scale plants are evalu-ating production technologies (http://www.wip-munich.de/downloads/dissemination/ selected_publications/Bioethanol_complex.pdf). The Philippines recently signed a US$1.3 billion deal with U.K.-based NRG Chemical Engineering to build biofuel refineries and plantations. Among the plans is the construction of two 300,000 ton sweet-sorghum-to-ethanol plants (http://biopact.com/2007/05/philippines-in-us13-billion-biofuel.html).The goverment is also conducting planting trials of sweet sorghum varieties developed by ICRISAT to test for adaptability to the area (http://biopact.com/2007/03/capiz-region-to-trial-high-yield-sweet.html). Although the saccharine juice is the most readily available product for fermenta-tion, it is important to consider the lignocellulosic residue left after the stalk milling. On paper the bagasse contains 3–5 times the energy of the juice sugars. Therefore, an efficient method to transform that energy into a usable form would increase the prof-itability of the crop. Some ways to take advantage of the lignocellulisic biomass include the use of the bagasse as a boiler fuel to power the ethanol distillery, the production of pellets for use in coal burning plants, use as animal feed, or the pro-duction of paper, charcoal or activated coal production. Throughout utilization of the sugar content in the plant for ethanol production would involve the hydrolysis of the cellulose and hemicellulose polymers. The com-position of the cell wall heavily influences the efficiency of the hydrolysis process. Lignin in particular has been shown to drastically impede cellulolytic enzymes (Chang and Holtzapple 2000; Draude et al. 2001; Charles et al. 2003; Palonen et al. 2004; Yang and Wyman 2004). Advances in pretreatment and saccharification strategies have improved the economic balance of converting the lignocellulosic material to sugars (National Renewable Energy Laboratory 2001). Optimization of

Development and Utilzation of Sorghum as a Bioenergy Crop 225
the cell wall composition through genetics has the potential to further improve the sugar yield and lower the production costs.
8.5 Genetic Improvement of Sorghum
8.5.1 Genetic Resources
8.5.1.1 Natural Variation
Landraces and wild relatives represent a major source of genetic variation and their conservation and evaluation is therefore of paramount importance for any plant breeding effort. Landraces of sorghum are found in many regions of Africa, Asia, Europe and the Americas, and represent the primary gene pool. Many useful traits have been identified by screening collections of landraces. Although exotic germ-plasm has made important contributions to the development of the improved culti-vars (Rosenow and Dahlberg 2000), full exploitation of their potential has been hampered in sorghum improvement programs because many of the landraces possess characteristics considered undesirable in grain sorghum, such as tallness and late maturity. Breeding programs aimed at improving sorghum for bioenergy production, however, can take advantage of those traits, as they are not as much restricted by grain quality considerations. Wild S. bicolor accessions are present in Africa and Asia. All the wild and culti-vated S. bicolor races readily intercross and produce fertile offspring. Hybrids from crosses with other species within the subgenus Sorghum are also common, and there is evidence that S. halepense may have originated from such crosses. Therefore, all species within the subgenus Sorghum are capable of contributing genes to cultivated sorghum, and constitute the secondary gene pool. In addition, wild relatives from the subgenera Chaetosorghum, Heterosorghum, Parasorghum, and Stiposorghum pre-sent in Africa, Asia, Australia and the Americas form the tertiary gene pool. Inter-specific crosses have been largely unsuccessful. This is due to barriers in the fertili-zation process (Hodnett et al. 2005), or abortion of the hybrid embryo due to the breakdown of the endosperm. Recently it has been demonstrated that incompatible pollen-pistil interaction can be overcome by using a female parent homozygous recessive for the Iap (inhibition of alien pollen) gene (Price et al. 2006). Using this system, it was possible to produce embryos from crosses between S. bicolor×S. an-gustum, S. bicolor × S. nitidum and S. bicolor × S. macrospermum. Embryo rescue and in vitro culture are often necessary to circumvent the problem of endosperm breakdown. Approximately 32,390 S. bicolor and 729 Sorghum spp. entries are registered in the Germplasm Resource Information Network (GRIN, available at: http://www.ars-grin.gov), and are freely available upon request for research and breeding purposes. ICRISAT hosts a large collection of cultivated and wild sorghum entries. With 36,774 accessions conserved from 91 countries, the ICRISAT Gene Bank now serves as a major repository of sorghum germplasm (available at: http://www.icrisat.org/ sorghum/Project1/pfirst.asp). The Sorghum World Collection, composed of

226 Saballos representative sorghum genotypes from every continent is hosted by ICRISAT. As part of the FAO International Network of Ex Situ Collections, ICRISAT designated over 80% of the sorghum collection to the auspices of FAO/CGIAR. The agreement covers collections held by ICRISAT prior to December 1993, when the Convention on Biological Diversity (CBD) affirmed sovereign rights of national governments over their natural resources. Though the designated germplasm will continue to be readily available to all, every recipient of germplasm has to sign a Material Transfer Agreement (MTA) to ensure the recipient does not file intellectual property rights for it. The availability of germplasm acquired after December 1993 is subject to condi-tions imposed by the source country. Much of the germplasm available via GRIN and ICRISAT is characterized for important morpho-agronomic characters and both collections provide searchable databases of the relevant information on the entries. China also possesses a Chinese Sorghum Germplasm diversity collection, with over 10,000 entries (http://icgr.caas.net.cn/ cgris_english.html). The majority of those entries are not present in the ICRISAT or U.S. collections. China is the country of origin of many of the sweet stem sorghums, and several promising varieties have been identified and utilized in sweet sorghum improvement programs for the produc-tion of sugar, wine and industrial ethanol. Several smaller collections are maintained in a number of African countries. Highly drought-resistant sorghums from the Nige-rian Sahelian zone (sand-dune sorghums), of interest as possible donors of drought-resistance genes, are present in the African collections. (Obilana and Harkness 1985, in Bantilan et al. 2004; Zongo et al. 1993). Most of those entries are also maintained at the ICRISAT collections.
8.5.1.2 Mutants
In addition to natural variation, mutants contribute to genetic diversity. Collections of mutants are available at several research institutions. Both naturally occurring and induced mutants have been identified. Induction of mutations can be achieved by diethyl sulfate (DES), ethyl methanesulfonate (EMS) or colchicine treatment of the seeds or pollen (Beraho and Olembo 1971; Mohan and Axtell 1975; Jenks et al. 1992). Mutants obtained through somaclonal variation have also been reported (Cai et al. 1990). Of particular interest for cellulosic ethanol production are the brown midrib (bmr) mutants, initially generated and identified by Porter et al. (1978) in a population of EMS treated plants. These mutants will be discussed in further detail in Section 8.5.3.5.
8.5.1.3 Transformation
Sorghum is considered a recalcitrant species for tissue culture and transformation (Zhu et al. 1998). Although research on transformation of sorghum began over 20 years ago, the progress has been slower than with other crops, but plant generation following tissue culture has been successful with certain explants (Masteller and Holden 1970; Ma et al. 1987; Cai and Butler 1990; Kaeppler and Pedersen 1997). Transformation of sorghum cell has been obtained by electroporation of protoplasts (Battraw and Hall 1991) and particle bombardment of cells (Hagio et al. 1991), but

Development and Utilzation of Sorghum as a Bioenergy Crop 227
subsequent regeneration of sorghum plants was not achieved. The first transgenic sorghum plants were obtained using particle bombardment of immature embryos and immature inflorescences (Casas et al. 1997). Several researchers have since reported successful sorghum transformation with the particle bombardment system coupled to a selectable marker (Zhu et al. 1998; Tadesse et al. 2003), but these systems tend to be hampered by low reproducibility and low efficiency. Agrobacterium-mediated transformation turned out to be relatively efficient for sorghum. The first report on the inoculation of sorghum meristematic tissue came from Godwin and Chikwamba (1994). Herbicide resistance and visual markers have been used to identify transfor-mants (Zhao et al. 2000; Gao et al. 2005;). Increases in the efficiency of transforma-tion and regeneration were achieved by using the ‘super binary’ vector system, short subculture intervals, and improvements of the tissue culture media (Zhao et al. 2000; Howe et al. 2006). Recently, transformation using the standard binary plasmids has been optimized, demonstrating that practical transformation efficiencies can be ob-tained without the use of the ‘super binary’ system (Gao et al. 2005).
8.5.1.4 Sorghum Genomics
The first partial genetic map was constructed by Hulbert et al. (1990) using genes and random genomic fragments from maize. Chittenden et al. (1994) published the first complete genetic linkage map of sorghum, using 276 RFLP loci mapped on a population derived from a cross between S. bicolor and S. propinquum. Conservation of genome sequences between the cereals (Moore et al. 1995) allows for the use of molecular markers from other cereal species in studies of the sorghum genome. RFLP, AFLP, SSR and morphological markers have been successfully used to pro-duce saturated maps (Berhan et al. 1993; Woo et al. 1994; Boivin et al. 1999; Bhattramakki et al. 2000; Klein et al. 2000; Menz et al. 2002;). As a result of these efforts high-density sorghum genetic maps are available for evolutionary, genetic diversity, and QTL studies (Bowers et al. 2003; Menz et al. 2004; Feltus et al. 2006). In addition to the maps of the nuclear genome, some information on the ribosomal and mitochondrial genomes is available (Chase and Pring 1985; Dang and Pring 1986). Due to its importance as cereal crop in many parts of the world, sorghum has been the subject of interest for genetics studies for close to a century (Smith and Frederiksen 2000). Thanks to the combined effort of hundred of researchers, we now have abundant resources available for the development of improved germplasm. The DFCI Sorghum Gene Index (http://compbio.dfci.harvard.edu/tgi/cgi-bin/tgi/gimain. pl?gudb=sorghum) contains over 20,029 sorghum Tentative Consensus sequences (TC). In the Sorghum Assembled Genomic Island (SAMI) database (http://magi.plantgenomics.iastate.edu), users can access over 80,000 contigs assem-bled from methyl-filtered genome sequences. Genetic and physical maps of sorghum and other cereals can be browsed and compared via the Gramene website (http:/www.gramene.org). Furthermore, the sorghum genome (inbred line Tx623) has recently been sequenced as part of a Community Sequencing Program (CSP) by the Department of Energy Joint Genome Institute (JGI) and the draft sequence is publicly available (http:/www.phytozome.net/sorghum). This site contains links to

228 Saballos information present in several other databases, thus providing a great tool for the discovery and manipulation of useful genes.
8.5.2 Breeding Methods
Since sorghum is a mainly self-pollinated species, selection of pure lines from out-standing plants in the field is the oldest method of plant improvement that has been applied to the crop. Spontaneous mutations and a proportion of crosses between different varieties and wild relatives increased the genetic diversity within the culti-vated types. In the U.S., the focus of the efforts was to develop short, photoperiod insensitive varieties adapted to combine harvest (Rosenow and Dahlberg 2000). The need for these characteristics has restricted the use of exotic germplasm in the sor-ghum improvement programs. Conversion programs in universities and private sec-tor have been of great utility in increasing the use tropical lines. However, the ge-netic diversity of the improved lines is still lower than that of lines from the World Collection (Menz et al. 2004). Exotic sorghums are known to possess many genes that contribute to abiotic and biotic stress resistance and yield increase. Development of sorghum lines for bio-mass production is not restricted by some of the factors that have hampered their use in grain sorghum. Tall, photoperiod-sensitive sorghums are likely to play an impor-tant role in increasing the biomass yield of the crop. The abundant information on QTL can facilitate the introgression and stacking of specific traits into promising backgrounds. Plant breeders interested in the production of biomass genotypes are in an advantageous position to access and use the great genetic variability available in the crop. Many plant improvement strategies can be successfully used in sorghum. Pure line selection by the pedigree method is facilitated due to the self-pollinated nature of the crop (Fig. 8.4A). The first step in a program is to create a genetically diverse population by crossing two or more diverse lines with desirable characteristics. Hy-bridization can be accomplished with the use of a male sterility system or by manu-ally avoiding self pollination of the flower through pollen removal or inactivation from the plant that is to be used as female parent. Manual emasculation, hot water treatment and plastic bag methods can be successfully used to produce crosses. After the female flower becomes receptive, pollen from the male parent is applied and the panicle must be covered to avoid contamination from unwanted pollen. The pedigree method can be used to produce either open-pollinated cultivars or improved inbred parents for hybrid production (see Chapter 6). The existence of the ms3 system allows for population improvements and mass selection strategies, even though those methods are more commonly used in cross-pollinated species. For this purpose, at least one of the parents in the initial cross must possess the male sterility gene. The selfed progeny of the F1 is then grown in an isolation field, and only the seeds from male sterile plants are harvested in bulk. This process is repeated for several generations before inbreeding and selection begin, at which point fertile plants are selfed to begin the production of uniform lines. The extended period of obligate outcrossing allows for more thorough recombination of the parental genes, useful to break linkage drag and to obtain novel combinations of alleles.

Development and Utilzation of Sorghum as a Bioenergy Crop 229
Production of commercial hybrid seed is possible using the genetic-cytoplasmic system (Fig. 8.4B). A male-sterile A-line results when the plant has male-sterile cytoplasm and no restorer gene in the nucleus. A-lines are maintained by fertilizing
Fig. 8.4. Illustration of some of the commonly employed methods in sorghum breeding. A. Pedigree method. B. Hybrid production using the genetic-cytoplasmic male sterility system. C. Creation of new A and B pairs. SC: Sterile cytoplasm. FC Fertile cytoplasm. NR genome that does not possesses a fertility restoration gene. R: Fertility restoration gene.

230 Saballos with the pollen of a genetically identical B-line that possesses the fertile cytoplasm, and is therefore able to produce pollen. The resulting progeny, since it will still have the male sterile cytoplasm and no restorer gene, will be an A-line. Hybrids are pro-duced by crossing the A-line with a genetically unrelated line possessing the fertility restoring gene (R-line). The progeny from this cross will be fertile hybrid plants with the phenotypic advantages of heterosis. If the genetic-cytoplasmic system is to be used, each pure line in the program needs to be evaluated for its B or R reaction by crossing it with a known A-line. New A and B pairs can be created from B-lines by backcrossing (Fig 8.4C). R-lines can be improved by any of the methods used to improve pure lines. Since the creation of new A-lines is time- and resource consum-ing, most commercial programs maintain a stock of A-lines and focus the improve-ment on the R-lines. Each promising R-line is test-crossed to the A-lines to test for their combining ability. Detailed information on breeding methods can be found in Fehr (1991), House (1985), Doggett (1988), and Smith and Frederiksen (2000).
8.5.3 Traits of Interest for Improvement
Many factors, from net biomass yield to biomass composition, can influence the cost-effectiveness of the transformation of sorghum into usable energy. Figure 8.5 summarizes the production and processing of the biomass and the crop characteris-tics that can be improved through plant breeding.
Fig. 8.5. Schematic representation of sorghum-to-ethanol processing and yield factors.

Development and Utilzation of Sorghum as a Bioenergy Crop 231
8.5.3.1 Yield
Yield is a complex trait and the result of the collective activity of almost every gene present in the plant (Wallace and Yan 1998). While it is not possible to designate any given gene as a ‘yield gene’, there are characteristics that will determine the maxi-mum biomass yield potential of a plant under optimal growing conditions. Those factors, not including stress resistance genes, are covered in this section. Height, photoperiod sensitivity and maturity: The height of the plant is deter-mined by the interplay of the internode length and the number of nodes it produces before flowering. The rate of node production (measured as the number of leaves produced per day) does not differ much between genotypes (Sieglinger 1936), and so it is mostly the length of the vegetative growing period that will determine the num-ber of nodes. Studies on the inheritance of height have resulted in the identification of several genes with strong influence in both internode length and duration of the growing period. Total biomass yield is positively correlated to plant height in many grass and non-grass species, including corn (Chapter 7), Miscanthus (Chapter 10), switchgrass (Chapter 11), and alfalfa (Chapter 12). Typical correlation coefficients for plant height and biomass for grasses are between 0.45 and 0.86 (Alam et al. 2001; Venuto 2006; Freeman et al. 2007). Biomass is also influenced by factors such as stem thickness and number of stems per plant. Since there are concerns that tall plants are more prone to lodging, it is important to aim for a balance between plant biomass production and standability. Four major genes that directly control height in sorghum have been known since the 1950s (Quinby and Karper 1954). The genes affect internode length, and were designated Dwarfing (Dw) 1–4. The Dw genes have partial dominance for tallness, and their effects are additive in nature. Sorghum genotypes with dominant Dw alleles at all four loci can be over 4 m tall, while cultivars with recessive dw alleles at all four loci tend to be only 0.45–0.6 m tall. QTL studies have confirmed the presence of a few loci with large effects on height. Lin et al. (1995) mapped six QTL for height in an interspecific sorghum population. As a tropical plant from semi-arid regions, sorghum is a short day plant (Curtis 1968). In its regions of origin, the end of the rainy season is signaled by shorter days, which induces a switch from vegetative to reproductive growth (Doggett 1988). In temperate regions, tropical accessions will generally not flower with more than 12 h of daylight. Adaptation of these tropical sorghums to long days occurred by selection of spontaneous photoperiod-insensitive mutants in U.S. This led to the discovery of the Maturity (Ma) genes, with Ma1 most commonly used to manipulate maturity. A plant possessing this gene in its recessive form will be photoperiod insensitive, be-having under long-day conditions as it would under short days.

232 Saballos
Fig. 8.6. Photoperiod-sensitive sorghums. Background left, a photoperiod-sensitive landrace from India. Background right, a tall photoperiod-insensitive landrace from India. Foreground, Dwarf and semi-dwarf photoperiod-insensitive cultivars.
Besides Ma1, additional maturity genes influence the time of floral initiation. Quinby, described four main genes that interacted to produce many maturity pheno-types (Quinby and Karper 1961; Quinby 1966, 1967, 1973). More recently, Rooney (1999) described two novel Ma genes – Ma5 and Ma6 – identified in an Argentinean breeding line. Extreme lateness occurs when there is at least one dominant allele at each of those loci. In general, the dominant form of the genes causes lateness, but the different loci interact. In addition, temperature influences the expression of the genes, particularly ma4, which behaves as Ma4 under high temperatures (Quinby 1967; Quinby et al. 1973). It is important to point out that most of the information regarding photoperiod and maturity genes comes from studies of U.S. sorghums, which have a rather narrow genetic base. Sorghums cultivated in higher latitudes from other parts of the world (e.g. China) have evolved to flowering under long-day conditions due to perhaps genetic changes in other (Maturity) genes. The photope-riod-sensitivity trait is interesting in terms of biomass production, as plants will con-tinue to grow during the entire growing season (Fig. 8.6). Grain yield: The major contributor to increased grain yield in improved varieties has been a change in the source/sink balance (Doggett 1988). Tall tropical sorghums partition less than half the dry matter (DM) made after heading to the grain. In con-trast, in the dwarf cultivars the majority of the assimilates are partitioned to the grain.

Development and Utilzation of Sorghum as a Bioenergy Crop 233
It would be expected that green biomass production would be negatively correlated to grain production. Breeding efforts to produce dual-purpose sorghum have been successful, however, in creating genotypes with high grain and biomass yield (Li et al. 2004; Reddy et al. 2007a). Photosynthetic activity capacity: Sorghum is known to have a higher photosyn-thetic rate than many other crops, and a greater efficiency of dry matter production relative to water usage (Downes 1970; Massacci et al. 1996; Steduto et al. 1997; Dercas and Liakatas 2007). There are differences in photosynthetic rate between sorghum races that reflect their natural habitat. Steduto et al. (1997) reported that some sweet sorghum cultivars have higher photosynthetic rate than grain sorghums. Drought-resistant sorghums maintain a higher photosynthetic rate under low-water conditions (Premachandra et al. 1995). Selection for high DM accumulation may be an indirect selection for increased photosynthetic activity, but there is a lack of in-formation about molecular markers that can be used for direct selection or the genes involved in the trait. Tillering and perennial habit: Some sorghum genotypes can partially compen-sate low plant density by producing multiple basal tillers able to produce a panicle. This characteristic is highly beneficial in places where the crop is harvested manu-ally, but it has been discouraged in grain sorghum production in developed countries unless the panicles produced on the tillers reach maturity at the same time that the main panicle. For biomass production, basal tillering ability may be useful for yield stability. While basal tillers can theoretically increase stalk yield, the effect of the number of stalks per plant on individual stalk weight, sugar concentration in the juice and juice extractability needs to be investigated. When sweet sorghum is grown for syrup production, high plant density results in lower syrup yield per hectare (Doggett 1988). Hence, the production system will likely dictate the usefulness of increased tillering ability. QTL that control the number of basal tillers have been mapped. Hart et al. (2001) identified two major QTL for number of basal tillers per plant in a population of recombinant inbred lines (RILs) derived from a tillering and a non-tillering sorghum cultivar. In two different environments, the QTL explained 48.9–65.5% of the varia-tion. Paterson et al. (1995) identified four genomic regions that control the number of tillers in S. halepense. The QTL showed minimal environmental effects, and thus should be useful in introgressing high tillering ability. Most perennial sorghum species are characterized by the production of rhizomes. Several studies have identified genes and genomic regions that influence the devel-opment of rhizomes in S. propinquum and S. bicolor (Paterson et al. 1995; Jang, et al. 2006). Lodging: Root or stem lodging is undesirable because it decreases biomass yield (harder to harvest) and biomass quality due to rot. In many cereal crops, reduction of lodging has been achieved by reduction of stem height. However, there are indica-tions that other traits besides height are important to determine susceptibility to lodg-ing. Hondroyianni et al. (2000) determined that resistance to stem lodging in maize is mostly determined by the strength of the stem rind. Other morphological characteris-tics that may influence susceptibility to lodging are panicle weight and size of the root system. Stay-green plants maintain integrity of the stem tissue after panicle

234 Saballos development, and generally have better resistance to stem rots. QTL for stay-green are also linked to resistance to stem lodging (Woodfin, et al. 1988, Haussmann et al. 2002)
8.5.3.2 Stress Resistance
Crops are subject to many stresses with the potential to lower yield. While stress tolerance has a genetic basis, the specific conditions of each growing zone will de-termine what genes will render a genotype adapted to the area. Biotic Stresses: These include diseases, insect pests and weeds. Most of the information on this topic relevant for grain sorghum production is applicable to bio-mass sorghum. Anthracnose can severely reduce plant grow and total yield, and resistance to this disease will likely be an important trait in biomass production. Pest of panicles and grain may produce constraints in seed production. Diseases and pests that increase lodging have negative impact both reducing the yield of biomass and making the harvest difficult. In this context, resistance to Charcoal and Fusarium rot and stem-boring caterpillars is of great importance. Transgenic approaches using the Bt toxins for protection against stem borers need to be carefully considered. Even though they are likely to be effective, there is a high risk of transferring the trans-genes to wild sorghum relatives that are present in almost all sorghum growing areas (Ejeta and Grenier 2005). Abiotic stresses: As with biotic stresses, abiotic stresses are very site-specific. Since one of possible niches for biomass crops are marginal lands, resistance to drought, acid or alkaline soils, and efficiency of nutrient uptake and utilization are important traits to be considered. Drought: In many places of the world, drought is the major constraint to agricul-ture. Drought tolerance is a broad term that encompasses many characteristics that help the plant survive and produce seed under limited moisture conditions. Some of these characteristics, such as reduction of leaf area, reduction of plant size, reduction of stomatal conductance and earliness are negatively related to biomass production and have limited usefulness for improving biomass crops. Other drought tolerance adaptations, like the accumulation of osmolites to decrease osmotic potential and presence osmoprotectants can increase the chances of plant survival in extreme con-ditions, but have not shown practical increase of yield under field experiments (Ser-raj and Sinclair 2002; Blum 2005). Dehydration avoidance mechanisms involving enhanced capture of soil moisture by means of deeper roots may have the added benefit of increasing the amount of SOM left in the soil after aerial biomass removal. However, large root system represents a competitive sink for photosynthates and may decrease the amount of aerial biomass. Presence of cuticular wax increase re-flectance of light, resulting in decreased water use by means of reduced cuticular conductance and transpiration (Holmes and Keiller 2002). The timing of drought stress needs to be taken in account when selecting the drought tolerance characteris-tic to be enhanced, as some of the mechanisms are different for pre- and post-flowering drought resistance. Very little is known about the genetics mechanisms controlling drought toler-ance. Ekanayake and Garrity (1985) reported polygenic inheritance of root characters

Development and Utilzation of Sorghum as a Bioenergy Crop 235
is in rice. The long root and high root numbers are controlled by dominant alleles and thick root tip by recessive alleles. Overexpression of genes implicaded in wax production have resulted in increased resistance to drought in other plant species (Aharoni et al. 2004; Zhang et al. 2005).Dehydrins are proteins induced by osmotic stress and proposed to play a role in protecting the cell against the effects of desicca-tion. Wood and Goldsborough, (1997) characterized one of the genes encoding de-hydrins in sorghum. QTL studies for pre-flowering drought resistance identified several loci linked to the trait under both mild and severe drought stress (Tuinstra et al. 1996). Four QTL linked to the stay-green trait in sorghum have been identified (Xu et al. 2000, Haussmann et al. 2002, Sanchez et al. 2002) and their individual effect on various components of the stay-green trait have been investigated (Harris et al. 2007). Marginal soils: Acid soils are an important constrain to agriculture because about 50% of the potentially arable soils are acidic (Kochian et al. 2004). The pri-mary concerns in acidic soils are aluminum (Al) and manganese (Mn) toxicities and lowered phosphorus (P) availability (Troeh and Thompson 2005). Magalhaes et al. (2004) identified a single locus (AltSB) linked to Al tolerance in highly resistant culti-vars. Multiples alleles of this gene were identified in Sorghum accessions of diverse origins (Caniato et al. 2007). In addition to the allelic effects of this gene, variation in the level of Al tolerance in nearly isogenic lines from crosses between resistant lines and Al-sensitive line as the recurrent parent suggested that more genes are involved in Al tolerance in sorghum. Tolerance to low P availability can be divided in to efficiency in P utilization and recycling, and increased P acquisition. In Arabidopsis some of the genes involved in both mechanism have been identified, and could serve as a model for studies in cere-als (Poirier et al. 1991, Trull and Deikman 1998). Root traits such as organic acid release, rhizosphere acidification, root hair length and density, and root penetration are linked to increased P uptake (Kochian et al. 2004, a review). Alkaline and saline soils are usually a problem in arid and semi-arid regions. In humid regions, alkaline soils may occur if the parent material of the soil was rich in calcium. Iron (Fe) deficiency is the main problem related to alkaline soils. Genetic variability for low Fe tolerance is available in sorghum (Krishnasamy et al. 2006). In the Graminaceae family, the degree of tolerance to Fe deficiency is correlated with the capacity to produce and secrete the deoxymugineic acid family of compounds into the rhizosphere under low Fe supply conditions (Takagi et al. 1984; Römheld and Marschner 1986; Mihashi and Mori 1989; Singh et al. 1993). In addition, high concentration of soluble salts in the soil makes it difficult for the plants to absorb water (Troeh and Thompson 2005). The resulting water deficit simu-lates that of drought. Sorghum, as a species adapted to semi-arid regions, is also considered moderately tolerant to saline soils. Screening of the sorghum collections for genetic variation on this trait could possible result in the identification of line with superior tolerance to saline soils.

236 Saballos 8.5.3.3 Moisture Content and Juice Extraction Efficiency
Very little information on the genetics of the moisture content in sorghum is avail-able. Swanson and Parker (1931) reported a single gene (d) for juicy stems, recessive to dry stems, referred to as pithy (D). However, continuous variation in the amount of extractable juice is observable in the juicy genotypes and inbred progeny of juicy × dry lines, arguing for the existence of more genes controlling the trait. Proportion of rind vs. pith and rind hardness is likely to influence the amount and efficiency of juice extraction. The processing of the biomass will dictate what characteristics will be considered useful. In stover-only collection systems it is likely that dry-stem genotypes will be favored, as lower moisture content will facilitate the transport and storage. In sweet sorghum production, a balance between ease of transport and effi-ciency of extraction needs to be found.
8.5.3.4 Conversion Efficiency of the Starch
Physical and chemical characteristics of the starch differ among sorghum genotypes. These differences are reflected in the yield and efficiency of conversion of the starch to ethanol. The starch digestibility of waxy genotypes has been reported to be higher than that to normal starch. (Rooney and Pflugfelder 1986).The use of the waxy muta-tion has been hindered by the associated yield penalty. Wu et al. (2007) conducted extensive studies on the starch characteristics of a broad range of sorghum genotypes and their relation to ethanol production capacity. Significant differences in ethanol yield and conversion efficiency were found among the genotypes studied. In agree-ment with the previous studies on digestibility, waxy sorghums showed increased efficiency in the conversion to ethanol. The authors attributed this increased effi-ciency to the lower content of amylose-lipid complexes in waxy starch. Other major factors they identified having negative correlation to the ethanol production are con-densed tannins, high mash viscosity due to protein matrix, low-protein digestibility and brown seed color.
8.5.3.5 Cell Wall Composition
Stover collected at the end of the growing season from grain sorghum, or the bagasse left after the juice extraction of sweet sorghum consists largely of cell walls. The composition of the cell wall is therefore of importance when considering the produc-tion of cellulosic ethanol (see also Chapters 3, 4, and 5). The bmr mutants are cur-rently the best known cell wall mutants of sorghum. Enzymatic saccharification of the stover of some of the bmr mutants results in enhanced yields of fermentable sugars, and may reduce the need for harsh pretreatments and allow lower enzyme loadings to be used in commercial settings (Vermerris et al. 2007). While there have been reports on deleterious effects resulting from certain bmr mutations, such as lodging and yield penalties (Pedersen et al. 2005), studies with breeding lines con-taining the bmr mutations indicate that negative effects can be compensated by breeding (Saballos, unpublished results).

Development and Utilzation of Sorghum as a Bioenergy Crop 237
Knowledge of the genes underlying the bmr trait will facilitate its incorporation into enhanced biomass lines. Since different genes may have specific effects on the cell wall composition and general plant characteristics, this also will facilitate the creation of lines tailored to different processes. At least four different genes confer-ring the bmr phenotype (Bittinger et al. 1981; Saballos et al. 2005). To date, only the gene behind the bmr12 allelic group has been identified. Bout and Vermerris (2003) reported that the bmr12, bmr18 and bmr26 mutants contained mutations in the COMT gene that created premature stop codons. The identification of the gene al-lowed the development of allele-specific molecular markers. The bmr6 mutant has been investigated in some detail. Histochemical reactions (Bucholtz et al. 1980), analytical pyrolysis (Pillonel et al. 1991; Suzuki et al. 1997), and enzymatic activity studies (Pillonel et al. 1991) are consistent with reductions in the activity of the en-zyme cinnamyl alcohol dehydrogenase (CAD). In sorghum, CAD is encoded by a family of genes, presumably with different spatio-temporal contributions to the over-all lignification process (Saballos et al. 2007). Studies on the expression of the dif-ferent members of the family are currently being used to determine the specific gene responsible for the bmr6 trait.
8.5.3.6 Sugar Concentration
Sweet sorghum varieties are a source of easily fermentable sugars. The main carbo-hydrate in the sorghum juice is sucrose (~89%) followed by simple sugars such as glucose and fructose (~8%) and starch (~3%) (Sherwood 1923). In practical terms for biofuel production, the concentration of the juice sugars is more relevant than their relative composition. There is a wide variation in the Brix value (1° Brix repre-sents 1 g soluble solids in 100 ml water) between sweet sorghum cultivars. Several studies have investigated the genetic control of sugar accumulation in the juice. Ay-yangar et al. (1936) suggested a single dominant gene conferring the non-sweet char-acter. Later studies, however, provided support for the existence of multiple genes with additive effects (Li et al. 2004). When a non-sweet sorghum is crossed with a sweet sorghum, the average Brix reading among the F1 progeny is higher than the non-sweet parent, but lower than the mid-parent value. This was explained by as-suming that some of the genes conferring the non-sweet character have partial domi-nance and this may also explain the observations from the earlier studies. The sugar levels in the juice of the F2 progeny followed a normal distribution, with transgres-sive segregation at both ends of the curve (Li et al. 2004; Saballos, unpublished data). Such a distribution is consistent with the trait being controlled by multiple genes. The fact that multiple genes control the trait opens the possibility that superior geno-types with advantageous combinations of genes can be obtained via crossing and selection. In fact, progenies derived from both sweet × sweet and sweet × non-sweet crosses contain lines with significantly higher sugar content that the parents (Natoli et al. 2002; Li et al. 2004; Saballos, Ejeta and Vermerris, unpublished data). The presence of multiple loci controlling sugar accumulation in the stalk is also consis-tent with genetic studies performed on sugarcane (Ming et al. 2002).

238 Saballos A number of studies have focused on enzymes involved in sugar metabolism to identify the physiological basis for the accumulation of sugar (Tarpley et al. 1994; Hoffmann-Thoma et al. 1996). These studies did, however, not reveal correlations between activities of specific enzymes (e.g. sucrose synthase, sucrose phosphate synthase, invertase) and the higher stem sugar concentration in sweet vs. non-sweet varieties. QTL studies combined with high-throughput gene expression assays will expedite the process of breeding for high sugar concentration by aiding in the selec-tion of the more favorable alleles in breeding populations, and may help identify the genes underlying the trait.
8.6. Conclusions
Sorghum is well positioned to play a major role in the biofuel field. Its resilient na-ture can allow us to take advantage of suboptimal lands while minimizing the amount of inputs necessary for its cultivation. It is a versatile crop, with three distinct product streams, all of which can be used for biofuel production. In that respect, it can be used under current technologies without requiring modification of existing facilities, as in the production of grain ethanol; with some adaptation of the produc-tion systems, as with the production of ethanol from the saccharine juice, or as ligno-cellulosic feedstock for emerging saccharification-and-fermentation technologies. The abundant genetic information accumulated from over 100 years of research and the extensive existing collections of germplasm are readily available to breeding programs. Proven breeding methods in conjunction with new biotechnology ap-proaches will expedite the production of improved bioenergy lines. The direction of development of the ethanol industry, especially that of the grow-ers and processors segment, will determine what plant traits will be deemed most relevant. In general, traits like disease and insect resistance, tolerance to poor soils and drought, and agronomic traits like standability are likely to be important under any production scenario. Photoperiod sensitivity, vegetative biomass yield, cell wall characteristics have to be considered in grain-stover, bagasse-sugar or lignocellulosic feedstock production systems. Sugar content and juice production are obvious traits of importance in system where the saccharine juice is one of the products. Grain yield is currently the main objective in most sorghum breeding programs and will continue to be important in grain ethanol and dual-purpose systems.
Acknowledgements
I am grateful for the mentorship of Dr. Gebisa Ejeta and the helpful discussions with Terry Lemming. Funding for some of the research described in this chapter was provided by United States Agency for International Development (USAID), Purdue University Agricultural Research Programs, and Purdue Research Foundation.

Development and Utilzation of Sorghum as a Bioenergy Crop 239 References
Aharoni, A., Dixit, S., Jetter, R., Thoenes, E., van Arkel, G., and Pereira, A. ( 2004) The SHINE clade of AP2 domain transcription factors activates wax biosynthesis, alters cuticle properties, and confers drought tolerance when overexpressed in Arabidopsis. Plant Cell 16, 2463–2480
Agrama, H., Widle, G., Reese, J., Campbell, L., and Tuinstra, M. (2002) Genetic mapping of QTLs associated with greenbug resistance and tolerance in Sorghum bicolor. Theor. Appl. Genet. 104, 1373–1378.
Alam, S., Ali, A., Qamar, I. A., Arshad, M., and Sheikh, S. (2001) Correlation of economi-cally important traits in Sorghum bicolor varieties. J. Biol. Sci. 1, 330–331.
Ayyangar, G. N. R. (1942) The description of crop plant characters and their ranges of varia-tion. IV. Variability of Indian sorghum. Indian J. Agric. Sci. 12, 528–563.
Ayyangar, G. N. R., and Ponnaiya, B. W. X. (1937) The occurrence and inheritance of ear-heads with empty anther sacs in sorghum. Curr. Sci. 8, 116.
Ayyangar, G., Ayyar, M., Rao, V., and NambiarA. (1936) Mendelian segregation for juiciness and sweetness in sorghum stalk. Madras Agric. J. 24, 247.
Bandyopadhyay, R., Frederickson, D. E., McLaren, N. W., Odvody, G. N., and Ryley, M. J. (1998) Ergot: A new disease threat to sorghum in the Americas and Australia. Plant Dis. 82, 356–367.
Bantilan, M. C. S., Deb, U. K., Gowda, C. L. L., Reddy, B. V. S., Obilana, A. B., and Even-son, R. E. (2004) Sorghum Genetic Enhancement: Research Process, Dissemination and Impacts. International Crops Research Institute for the Semi-Arid Tropics, Patancheru, Andhra Pradesh, India.
Barabas, Z. (1962) Observation of sex differentiation in sorghum by use of induced male- 195, 257–259.
Battraw, M., and Hall, T. C. (1991) Stable transformation of Sorghum bicolor protoplasts with chimeric neomycin phosphotransferase II and ß-glucuronidase genes. Theor. Appl. Genet. 82, 161–168.
Beraho, E. K., and Olembo, R. J. (1971) Albino and nonpolyploid mutants induced by colchi-cine in sorghum. J. Hered. 62, 376–379.
Berhan, A. M., Hulbert, S. H., Butler, L. G., and Bennetzen, J. L. (1993) Structure and evolu-tion of the genomes of sorghum bicolor andZea mays. Theor. Appl. Genet. 86, 598–604.
Bhattramakki, D., Dong, J., Chhabra, A. K., and Hart, G. E. (2000) An integrated SSR and RFLP linkage map of Sorghum bicolor (L.) Moench. Genome 43, 988–1002.
Bittinger, T. S., Cantrell, R. P., Axtell, J. D. (1981) Allelism tests of the brown-midrib mutants of sorghum. J. Hered. 72, 147–148
Bitzer, M. J. (1997) Production of Sweet Sorghum for syrup in Kentucky. University of Ken-tucky Cooperative Extension Service, Lexington, KY.
Blum, A. (2005) Drought resistance, water-use efficiency, and yield potential—are they com-patible, dissonant, or mutually exclusive? Aust. J. Agric. Res. 56, 1159–1168.
Bolsen, K. K., H. Ilg, R. V. Pope, M. A. Hinds, and Hoover, J. (1983) Whole-plant forage, grain, or non-heading sorghum silages, cornlage, and feed flavor supplements for growing cattle. Kansas Agric. Exp. Sta. Rep. Progr. 427, 46–52.
Bogo, A. (2001) Biochemical physiopathology or some ergot fungi and other honeydew-producing plant parasites. Ph.D Thesis, Imperial College of Science, Technology and medicine, London, UK.
Bogo, A., Mantle, P. G., and Harthmann, O. E. L. (2004) Screening of sweet sorghum acces-sions for inhibition of secondary sporulation and saccharide measurements in honeydew of Claviceps africana. Fitopatol. Bras. 29, 86–90.
sterile mutants. Nature

240 Saballos Boivin, K., Deu, M., Rami, J. F., Trouche, G., and Hamon, P. (1999) Towards a saturated
sorghum map using RFLP and AFLP markers. Theor. Appl. Genet. 98, 320–328. Borovkova, I. G., Jin, Y., and Steffenson, B. J. (1998) Chromosomal Location and Genetic
relationship of leaf rust resistance genes Rph9 and Rph12 in Barley. Phytopathology. 88, 76–80.
Bout, S., and Vermerris, W. (2003) A candidate-gene approach to clone the sorghum Brown midrib gene encoding caffeic acid O-methyltransferase. Mol. Genet. Genomics. 269, 205–214.
Bowers, J. E., Abbey, C., Anderson, S., Chang, C., Draye, X., Hoppe, A. H., Jessup, R., Lemke, C., Lennington, J., Li, Z., Lin, Y., Liu, S.,. Luo, L., Marler, B., Ming, R., Mitchell., Qiang, D., Reischmann, K., Schulze, S., Skinner, D., Wang, Y., Kresovich, S., Schertz, K., Paterson, A. (2003) A high-density genetic recombination map of sequence-tagged sites for sorghum, as a framework for comparative, structural and evolutionary ge-nomics of tropical grains and grasses. Genetics 165, 367–386.
Bramel-Cox, P. J., and Claflin, L. E. (1989) Selection for resistance to Macrophomina phaseo-lina and Fusarium moniliforme in sorghum. Crop Sci. 29, 1468–1472.
Bucholtz, D. L., Cantrell, R. P., Axtell, J. D., and Lechtenberg, V. L. (1980). Lignin biochem-istry of normal and brown midrib mutant sorghum. J. Agric. Food Chem. 28, 1239–1241.
Cai, T., and Butler, L. (1990) Plant regeneration from embryogenic callus initiated from im-mature inflorescences of several high-tannin sorghums. Plant Cell, Tissue and Organ Cul-ture 20, 101–110.
Cai, T., Ejeta, G., Axtell, J. D., and Butler, L. G. (1990) Somaclonal variation in high tannin sorghums. Theor. Appl. Genet. 79, 737–747.
Caniato, F. F., Guimarães, C. T., Schaffer, R. E., Alves, V.M.C., L. Kochian V., Borém, A., Klein, P. E., and Magalhaes J. V. (2007) Genetic diversity for aluminum tolerance in sor-ghum. Theor. Appl. Genet. 114, 863–876.
Casas, A. M., Kononowicz, A. K., Haan, T. G., Zhang, L., Tomes, D. T., Bressan, R. A., and Hasegawa, P. M. (1997) Transgenic sorghum plants obtained after microporjectile bom-bardment of immature inflorescences. In Vitro Cell Dev. Biol. Plant. 33, 92–100.
Chang, V. S., and Holtzapple, M. T. (2000) Fundamental factors affecting biomass enzymatic reactivity. Appl. Biochem. Biotechnol. 84, 5–38.
Charles, N., Mansfield, S. D., Mirochnik, O., and Duff, S. J. B. (2003) Effect of oxygen delig-nification operating parameters on downstream enzymatic hydrolysis of softwood sub-strates. Biotechnol. Progr. 19, 1606–1611.
Chase, C. D., and Pring, D. R. (1985) Circular plasmid DNAs from mitochondria of Sorghum bicolor. Plant Mol. Biol. 5, 303–311.
Chittenden, L. M., Schertz, K. F., Lin, Y. R., Wing, R. A., and Paterson, A. H. (1994) A de-tailed RFLP map of Sorghum bicolor x S. propinquum, suitable for high-density mapping, suggests ancestral duplication of Sorghum chromosomes or chromosomal segments. Theor. Appl. Genet. 87, 925–933.
Curtis, D. L. (1968) The relation between the date of heading of nigerian sorghums and the duration of the growing season. J. Appl. Ecol. 5, 215–226.
Dahlberg, J. A., Bandyopadhyay, R., Rooney, W. L., Odvody, G. N., and Madera-Torres, P. (2001) Evaluation of sorghum germplasm used in US breeding programmes for sources of sugary disease resistance. Plant Pathol. 50, 681–689.
Dang, L. H., and Pring, D. R. (1986) A physical map of the sorghum chloroplast genome. Plant Mol. Biol. 6, 119–123.
Dercas, N., and Liakatas, A. (2007) Water and radiation effect on sweet sorghum productivity. Water Resour. Manag. 21, 1585–1600.
Doggett, H. (1988) Sorghum, 2nd edition. Wiley, New York.

Development and Utilzation of Sorghum as a Bioenergy Crop 241
Downes, R. W. (1970) Effect of light intensity and leaf temperature on photosynthesis and transpiration in wheat and sorghum. Aust. J. Biol. Sci. 23, 775–782.
Draude, K. M., Kurniawan, C. B., and Duff, S. J. B. (2001) Effect of oxygen delignification on the rate and extent of enzymatic hydrolysis of lignocellulosic material. Biores. Technol. 79, 113–120.
Ejeta, G., and Grenier, C. (2005) Sorghum and its weedy hybrids. In: Gressel, J, (ed.), Crop Ferality and Volunteerism, CRC Press, Taylor and Francis Group, USA. pp. 123–135
Ekanayake, I. J., and Garrity, D. P. (1985) Root pulling resistance in rice: Inheritance and association with drought tolerance. Euphytica 34, 905–913
Erpelding, J., and Prom, L. (2006) Variation for anthracnose resistance within the sorghum germplasm collection from Mozambique, Africa. J. Plant Pathol. 5, 28–34.
Erpelding, J., and Wang, M. (2007) Response to anthracnose infection for a random selection of sorghum germplasm. Plant Pathol. J. 6, 127–133.
Erpelding, J. E., and Louis, K. (2004) Evaluation of Malian sorghum germplasm for rsistance against anthracnose. Plant Pathol. J. 3, 65–71.
Erpelding, J. E., Prom, L. K., and Rooney, W. L. (2005) Variation in anthracnose resistance within the Sudanese sorghum germplasm collection. Plant Genet. Res. Newsl. 141, 11–14.
Fehr, W. R. (1991) Principles of Cultivar Development. Theory and Technique, 2nd edition. Volume 1. Iowa State University, Ames, Iowa.
Feltus, F., Hart, G., Schertz, K., Casa, A., Kresovich, S., Abraham, S., Klein, P., Brown, P., and Paterson, A. (2006) Alignment of genetic maps and QTLs between inter- and intra-specific sorghum populations. Theor. Appl. Genet. 112, 1295–1305.
Frederiksen, R. A. (2000) Diseases and disease management in Sorghum, In: C. W. Smith, and R. A. Frederiksen, (Eds.), Sorghum: Origin, History, Technology and Production. John Wiley, New York, pp. 497–533.
Frederiksen, R. A., and Odvody, G., eds. (2000) Compendium of Sorghum Diseases 2nd edi-tion. APS Press, St. Paul, MN.
Freeman, K. W., Girma, K., Arnall, D. B., Mullen, R. W., Martin, K. L., Teal, R. K., and Raun, W. R. (2007) By-plant prediction of corn forage biomass and nitrogen uptake at various growth stages using remote sensing and plant height. Agron J. 99, 530–536.
Funnell, D. L. (2006) Reaction of sorghum lines genetically modified for reduced lignin con-tent to infection by Fusarium and Alternaria spp. Plant Dis. 90, 331–338.
Gao, Z. S., Jayaraj, J., Muthukrishnan, S., Claflin, L., and Liang, G. H. (2005) Efficient ge-netic transformation of sorghum using a visual screening marker. Genome 48, 321–333.
Godwin, I., and Chikwamba, R. (1994) Transgenic grain sorghum (Sorghum bicolor) plants via Agrobacterium In: R. J. Henry, and J. A. Ronalds (Eds.), Improvement of Cereal Qual-ity by Genetic Engineering. Plenum Press, New York. pp. 47–53.
Gomez, M. I., Nurul Islam-Faridi, M., Woo, S. S., Schertz, K. F., Czeschin, D., Zwick, M. S., Wing, R. A., Stelly, D. M., and Price, H. J. (1997) Fish of a maize SH 2-selected sorghum BAC to chromosomes of Sorghum bicolor. Genome 40, 475–478.
Gowda, P. S. B., Xu, G. W., Frederiksen, R. A., and Magill, C. W. (1995) DNA markers for downy mildew resistance genes in sorghum. Genome 38, 823–826.
Greene, D. (1997) Biomass Yield and Chemical Composition of Sorghum and Rye Double-cropped on Marginal Land. Thesis, Purdue University, West Lafayette, IN.
Hagio, T., Blowers, A. D., and Earle, E. D. (1991) Stable transformation of sorghum cell cultures after bombardment with DNA-coated microprojectiles. Plant Cell Rep. 10, 260–264.
Harris, K., Subudhi, P.K., Borrell, A., Jordan, D., Rosenow, D., Nguyen, H., Klein, P., Klein, R., and Mullet, J. (2007) Sorghum stay-green QTL individually reduce post-flowering drought-induced leaf senescence. J. Exp. Bot. 58, 327–38.

242 Saballos Hart, G. E., Schertz, K. F., Peng, Y., and Syed, N. H. (2001) Genetic mapping of Sorghum
bicolor (L.) Moench QTLs that control variation in tillering and other morphological char-acters. Theor. Appl. Genet. 103, 1232–1242.
Haussmann, B., Mahalakshmi, V., Reddy, B., Seetharama, N., Hash, C., and Geiger, H. (2002) QTL mapping of stay-green in two sorghum recombinant inbred populations. Theor. Appl. Genet. 106, 133–142.
Hodnett, G. L., Burson, B. L., Rooney, W. L., Dillon, S. L., and Price, H. J. (2005) Pollen-pistil interactions result in reproductive isolation between Sorghum bicolor and divergent sorghum species. Crop Sci. 45, 1403–1409.
Hoffmann-Thoma, G., Hinkel, K., Nicolay, P., and Willenbrink, J. (1996) Sucrose accumula-tion in sweet sorghum stem internodes in relation to growth. Physiol. Plant. 97, 277–284.
Holmes, M. G., and Keiller, D.R. (2002) Effects of pubescence and waxes on the reflectance of leaves in the ultraviolet and photosynthetic wavebands: a comparison of a range of spe-cies. Plant Cell Environ. 25, 85–93.
Hondroyianni, D. K., Papakosta, A. A., Gagianas, K. A., and Tsatsarelis, E. (2000) Corn stalk traits related to lodging resistance in two soils of differing salinity. Maydica 45, 125–134.
House, L. R. (1985) A Guide to Sorghum Breeding, 2nd edition. International Crops Research Institute for the Semi-Arid Tropics, Andhra Pradesh, India.
Howe, A., Sato, S., Dweikat, I., Fromm, M., and Clemente, T. (2006) Rapid and reproducible Agrobacterium-mediated transformation of sorghum. Plant Cell Rep. 25, 784–791.
Hulbert, S. H., Richter, T. E., Axtell, J. D., and Bennetzen, J. L. (1990) Genetic mapping and characterization of sorghum and related crops by means of maize DNA probes. Proc. Natl. Acad. Sci. USA 87, 4251–4255.
Jang, C., Kamps, T., Skinner, D., Schulze, S., Vencill, W., Paterson, A. (2006) Functional classification, genomic organization, putatively cis-acting regulatory elements, and rela-tionship to quantitative trait loci, of sorghum genes with rhizome-enriched expression. Plant Physiol. 1148–1159.
Jenks, M. A., Rich, P. J., Peters, P. J., Axtell, J. D., and Ashworth, E. N. (1992) Epicuticular wax morphology of bloomless (bm) mutants in Sorghum bicolor. Int. J. Plant Sci. 153, 311–319.
Kaeppler, H. F., and Pedersen, J. F. (1997) Evaluation of 41 elite and exotic inbred sorghum genotypes for high quality callus production. Plant Cell Tissue Organ Cult. 48, 71–75.
Kamala, V., Singh, S. D., Bramel, P. J., and Rao, D. M. (2002) Sources of resistance to downy mildew in wild and weedy sorghums. Crop Sci. 42, 1357-1360.
Karper, R. E., and Stephens, J. C. (1936). Floral abnormalities in sorghum. J. Hered. 27, 183–194.
Katsar, C. S., Paterson, A. H., Teetes, G. L., and Peterson, G. C. (2002) Molecular analysis of sorghum resistance to the greenbug (Homoptera: Aphididae). J. Econ. Entomol. 95, 448–457.
Keating, B. A., Webster, A. J., Hoare, C. P., and Sutherland, R. F. (2004) Observations of the harvesting, transporting and trial crushing of sweet sorghum in a sugar mill. 2004 Confer-ence of the Australian Society of Sugar Cane Technologists, 4–7 May 2004, Brisbane, Queensland, Australia,.
Kimber, C. T. (2000) Origins of comesticated sorghum and its early diffusion to India and China, In: C. W. Smith, and R. A. Frederiksen (Eds.), Sorghum: Origin, History, Technol-ogy and Production. John Wiley, New York, pp. 3–98.
Klein, P. E., Klein, R. R., Cartinhour, S. W., Ulanch, P. E., Dong, J., Obert, J. A., Morishige, D. T., Schlueter, S. D., Childs, K. L., Ale, M., and Mullet, J. E. (2000) A high-throughput AFLP-based method for constructing integrated genetic and physical maps: progress to-ward a sorghum genome map. Genome Res. 10, 789–807.

Development and Utilzation of Sorghum as a Bioenergy Crop 243
Klein, R. R., Rodriguez-Herrera, R., Schlueter, J. A., Klein, P. E., Yu, Z. H., and Rooney, W. L. (2001) Identification of genomic regions that affect grain-mould incidence and other traits of agronomic importance in sorghum. Theor. Appl. Genet. 102, 307–319.
Kochian, L. V., Hoekenga, O. A., and Pineros, M. A. (2004) How do crops plants tolerate acid soils? Mechanisms of aluminum tolerance and phosphorus efficiency. Annu. Rev. Plant Biol. 55, 459–493
Krishnasamy, R., Jegadeeswari, D., Surendran, U., Sudhalakshmi, C. (2006) Screening of sorghum (Sorghum bicolor) genotypes. 18th World Congress of Soil Science, 9–15 July 2006, Philadelphia, PA.
Kundiyana, D., Bellmer, D., Huhnke, R., and Wilkins, M. (2006) “Sorganol”: Production of Ethanol from Sweet Sorghum. 2006 American Society of Agricultural and Biological En-gineers Annual International Meeting, Portland, Oregon.
Li, G., Gu, W., and Chapman, K. (2004) Sweet Sorghum. China Agricultural Science and Technology Press, Beijing, China.
Lin, Y. R., Schertz, K. F., and Paterson, A. H. (1995) Comparative analysis of QTLs affecting plant height and maturity across the poaceae, in reference to an interspecific sorghum Population. Genetics 141, 391–411.
Ma, H., Gu, M., and Liang, G. H. (1987) Plant regeneration from cultured immature embryos of Sorghum bicolor (L.) Moench. Theor. Appl. Genet. 73, 389–394.
Magalhaes, J. V., Garvin, D. F., Wang, Y., Sorrells, M. E., Klein, P. E., Schaffert, R. E., Li, L., and Kochian, L. V. (2004) Comparative mapping of a major aluminum tolerance gene in sorghum and other species in the Poaceae. Genetics 167, 1905–1914
Marley, P. S., and Ajayi, O. (2002) Assessment of anthracnose resistance (Colletotrichum graminicola) in sorghum (Sorghum bicolor) germplasm under field Conditions in Nigeria. J. Agric. Sci. 138, 201–208.
Martin, J., Waldren, R., and Stamp, D. (2006) Principles of Field Crop Production 4th edition. Pearson Prentice Hall, Upper Saddle River, N.J.
Massacci, A., Battistelli, A., and Loreto, F. (1996) Effect of drought stress on photosynthetic characteristics, growth and sugar accumulation of field-grown sweet sorghum. Funct. Plant Biol. 23, 331–340.
Masteller, V. J., and Holden, D. J. (1970) The growth of and organ formation from callus tissue of sorghum. Plant Physiol. 45, 362–364.
McIntyre, C. L., Hermann, S. M., Casu, R. E., Knight, D., Drenth, J., Tao, Y., Brumbley, S. M., Godwin, I. D., Williams, S., Smith, G. R., and Manners, J. M. (2004) Homologues of the maize rust resistance gene Rp1-D are genetically associated with a major rust resis-tance QTL in sorghum. Theor. Appl. Genet. 109, 875–883.
Mehta, P. J., Wiltse, C. C., Rooney, W. L., Collins, S. D., Frederiksen, R. A., Hess, D. E., Chisi, M., and TeBeest, D. O. (2005) Classification and inheritance of genetic resistance to anthracnose in sorghum. Field Crops Res. 93, 1–9.
Menz, M. A., Klein, R. R., Mullet, J. E., Obert, J. A., Unruh, N. C., and Klein, P. E. (2002) A high-density genetic map of Sorghum bicolor (L.) Moench based on 2926 AFLP®, RFLP and SSR markers. Plant Mol. Biol. 48, 483–499.
Menz, M. A., Klein, R. R., Unruh, N. C., Rooney, W. L., Klein, P. E., and Mullet, J. E. (2004) Genetic diversity of public inbreds of sorghum determined by mapped AFLP and SSR markers. Crop Sci. 44, 1236–1244.
Mihashi, S., and Mori, S. (1989) Characterization of mugineic acid Fe transporter in Fe-deficient barley roots using the multicompartment transport box method. Biol. Metals 2, 146–154.
Ming, R., Wang Y., Draye, X. Moore, P. Irvine J., and Paterson A. (2002) Molecular dissec-tion of complex traits in autopolyploids: mapping QTLs affecting sugar yield and related traits in sugarcane. Theor. Appl. Genet. 105, 332–345.

244 Saballos Mohan, D. D., and Axtell, J. D. (1975) Diethyl sulfate induced high lysine mutants in sor-
ghum. Proceedings of the 9th Biennial Grain Sorghum Research and Utilization Confer-ence, Lubbock, TX.
Moore, G., Devos, K. M., Wang, Z., and Gale, M. D. (1995) Cereal genome evolution: Grasses, line up and form a circle. Curr. Biol. 5, 737–739.
Moyer, J. L., Fritz, J. O., and Higgins, J. J. (2004) Trends in forage yield and nutritive value of Sorghum spp. Agron. J. 96, 1453–1458
Nagaraj, N., Reese, J. C., Tuinstra, M. R., Smith, C. M., St. Amand, P., Kirkham, M. B., Kofoid, K. D., Campbell, L. R., and Wilde, G. E. (2005) Molecular mapping of sorghum genes expressing tolerance to damage by greenbug (Homoptera: Aphididae). J. Econ. En-tomol. 98, 595–602.
Nathan, R. A. (1978) Fuels from Sugar Crops: Systems Study for Sugarcane, Sweet Sorghum, and Sugar Beets. University Press of the Pacific, Honolulu, HI.
National Renewable Energy Laboratory (2001) Fostering the Bioeconomic Revolution.in Biobased Products and Bioenergy: An Environmental Approach. Produced for the Board by the National Renewable Energy Laboratory, Golden, CO.
Natoli, A., Gorni, C., Chegdani, F., Ajmone Marsan, P., Colombi, C., Lorenzoni, C., and Marocco, A. (2002) Identification o QTLs associated with sweet sorghum quality. May-dica 17, 311–322.
Norwood, C. (1994) Profile water distribution and grain yield as affected by cropping system and tillage. Agron. J. 86, 558-563.
Palonen, H., Tjerneld, F., Zacchi, G., and Tenkanen, M. (2004) Adsorption of purified Tricho-derma reesei cellulases and their catalytic domains to steam pretreated softwood and iso-lated lignin. J. Biotechnol. 107, 65–72.
Parh, D. K., Jordan, D. R., Aitken, E. A. B., Gogel, B. J., McIntyre, C. L., and Godwin, I. D. (2006) Genetic Components of variance and the role of pollen traits in sorghum ergot re-sistance. Crop Sci. 46, 2387–2395.
Paterson, A. H., Schertz, K. F., Lin, Y., Liu, S., and Chang, Y. (1995) The weediness of wild ing dispersal and persistence of Johnsongrass,
Sorghum halepense (L.). Proc. Natl. Acad. Sci. USA. 92, 6127–6131. Patil-Kulkarni, B. G., Puttarudrappa, A., Kajjari, N. B., and Goud, J. V. (1972) Breeding for
rust resistance in sorghum. Indian Phytopathol. 25, 166–168. Pedersen, J., and Fritz, J. (2000) Forages and Fodder, In: C. W. Smith, and R. A. Frederiksen,
(Eds.), Sorghum: Origin, History, Technology and Production. John Wiley, New York, pp. 797–810.
Pedersen, J. F., and Rooney, W. L. (2004) Sorghum. In: L.E. Mosher, B. L. Burton, and L. E. Sollenberger (Eds.), Warm-Season (C4) Grasses. ASA/CSSA/SSSA, Madison. WI.
Pedersen, J., Vogel, K., and Funnell, D. (2005) Impact of reduced lignin on plant fitness. Crop Sci. 45, 812–819.
Pillonel, C., Moulder, M., Boon, J., Foster, B., and Binder, A. (1991) Involvement of cinna-myl-alcohol dehydrogenase in the control of lignin formation in Sorghum bicolor L. Moench. Planta 185, 538–544.
Poirier, Y., Thoma, S., Somerville, C., and Schiefelbein, J. (1991) Mutant of arabidopsis deficient in xylem loading of phosphate. Plant Physiol. 97, 1087–1093.
Porter, K. S., Axtell, J. D., Lechtenberg, V. L., and Colenbrander, V. F. (1978) Phenotype, fiber composition, and in vitro dry matter disappearance of chemically induced brown midrib (bmr) mutants of sorghum. Crop Sci. 18, 205–208.
Potter, K. N., Jones, O. R., Torbert, H. A., and Unger, P. W. (1997) Crop rotation and tillage effects on organic carbon sequestration in the semiarid southern Great Plains. Soil Sci. Am. J. 162, 140–147.
hay-type
f
plants: Molecular analysis of genes influenc

Development and Utilzation of Sorghum as a Bioenergy Crop 245
Premachandra, G. S., Hahn, D. T., Rhodes, D., and Joly, R. J. (1995) Leaf water relations and solute accumulation in two grain sorghum lines exhibiting contrasting drought tolerance. J. Exp. Bot. 46, 1833.
Price, H. J., Hodnett, G. L., Burson, B. L., Dillon, S. L., Stelly, D. M., and Rooney, W. L. (2006) Genotype Dependent Interspecific Hybridization of Sorghum bicolor. Crop Sci. 46, 2617–2622.
Prom, L. K., Erpelding, J. E., and Montes-Garcia, N. (2007) Chinese sorghum germplasm evaluated for resistance to downy mildew and anthracnose. Comm. Biometry Crop Sci. 2, 26–31.
Quinby, J., and Karper, R. E. (1954) Inheritance of height in sorghum. Agron. J. 46, 211–216. Quinby, J. R. (1966) Fourth maturity gene locus in sorghum. Crop Sci. 6, 516–518. Quinby, J. R. (1967) The maturity genes of sorghum. Adv. Agron. 19, 267–305. Quinby, J. R. (1973) The genetic control of flowering and growth in sorghum. Adv. Agron.
25, 125–162. Quinby, J. R., Hesketh, J. D., and Voigt, R. L. (1973) Influence of temperature and photope-
riod on floral initiation and leaf number in sorghum. Crop Sci. 13, 243–246. Quinby, J. R., and Karper, R. E. (1961) Inheritance of duration of growth in the milo group of
sorghum. Crop Sci. 1, 8–10. Rana, B. S., Tripathi, D. P., and Rao, N. G. (1976) Genetic analysis of some exotic x Indian
crosses in sorghum. XV. Inheritance of resistance to sorghum rust. Indian J Genet Plant Breed 36, 244–249.
Reddy, S. P., Fakrudin, B. S., Rajkumar, Punnuri, S. M., Arun, S. S., Kuruvinashetti, M. S., Das, I. K., and Seetharama, N. (2008) Molecular mapping of genomic regions harboring QTLs for stalk rot resistance in sorghum. Euphytica. 159, 191–198.
Reddy, B., Ramesh, S., Reddy, P. S., Ashok Kumar, A. A., Sharma, K. K., Karuppan Chetty, S. M., and Palaniswamy, A. R. (2007a) Sweet Sorghum: Food, Feed, Fodder and Fuel Crop. International Crops Research Institute for the Semi-Arid Tropics. Patancheru , An-dhra Pradesh, India.
Reddy, B. V. S., Kumar, A. A., and Ramesh, S. (2007b) Sweet sorghum: A Water Saving Bioenergy Crop, In: International conference on Linkages between Energy and Water Management for Agriculture in Developing Countries. International Crops Research Insti-tute for the Semi-Arid Tropics. ICRISAT Campus, Hyderabad, India.
Reed, J. D., Ramundo, B. A., Claflin, L. E., and Tuinstra, M. R. (2002) Analysis of resistance to ergot in sorghum and potential alternate hosts. Crop Sci. 42, 1135–1138.
Römheld, V., and Marschner, H. (1986) Evidence for a specific uptake system for iron phyto-siderophores in roots of grasses. Physiol. 70, 175–180
Rooney, L. W., and Pflugfelder, R. L. (1986) Factors affecting starch digestibility with special emphasis on sorghum and corn. J. Anim. Sci. 63, 1607–1623
Rooney, W. L. (1999) Genetic control of a photoperiod-sensitive response in Sorghum bicolor (L.) Moench. Crop Sci. 39, 397–400.
Rooney, W. L. (2000) Genetics and Cytogenetics, In: C. W. Smith, and R. A. Frederiksen, (Eds.), Sorghum: Origin, History, Technology and Production, John Wiley, New York, pp. 261-307.
Rooney, W., Blumenthal, J., Bean, B., and Mullet, J. (2007) Designing sorghum as a dedicated bioenergy feedstock. Biofuels Bioprod. Bioref. 1, 147–157.
Rosenow, D. T., and Dahlberg, J. A. (2000) Collection, conversion, and utilization of sor-ghum. In: C. W. Smith, and R. A. Frederiksen, (Eds.), Sorghum: History, Technology and Production, John Wiley, New York, pp. 309–328.
Saballos, A., Vermerris, W., and Ejeta, G. (2005) Allelic variation among brown midrib mu-tants of sorghum. 50th ASA-CSSA-SSSA International Annual Meetings. 6–10 November 2005,, Salt Lake City, UT.

246 Saballos Saballos, A., Ejeta, G., and Vermerris, W. (2007) Genome-enabled analysis of the CAD gene
family in sorghum. XIth Cell Wall Meeting. 12–17 August 2007, Copenhagen, Denmark. Sanchez, A.C., Subudhi, P.K., Rosenow, D.T., and Nguyen, H.T., (2002) Mapping QTLs
associated with drought resistance in sorghum (Sorghum bicolor L. Moench) Plant Mol. Biol. 48, 713–726.
Serraj, R., and Sinclair, T. R. (2002) Osmolyte accumulation: Can it really help increase crop yield under drought conditions? Plant Cell Environ. 25, 333–341
Sharma, H. C., Reddy, B. V. S., Dhillon, M. K., Venkateswaran, K., Pampapathy, G., Folk-ertsma, R., Hash, C. T., and Sharma, K. K. (2005) Host plant resistance to insects in sor-ghum: Present status and need for future research. Int. Sorghum Millet Newsl. 46, 36–43.
Sherwood, S. P. (1923) Starch in sorghum juice. Ind. Eng. Chem. 15, 727–728. Sieglinger, J. B. (1936). Leaf number of sorghum stalks. J. Amer. Soc. Agron. 28, 636. Singh K., Chino M., Nishizawa N.K., Ohata T., and Mori, S. (1993) Genotypic variation
among Indian graminaceous species with respect to phytosiderophore secretion. In: Ran-dall R. J., Delhaize, E., Richards R.A., and Munns, R. (Eds.) Genetic Aspects of Plant Mineral Nutrition. Kluwer Academic Publishers, Dordrecht, the Netherlands. pp. 335–339
Singh, M., Chaudhary, K., and Boora, K. S. (2006) RAPD-based SCAR marker SCA 12 linked to recessive gene conferring resistance to anthracnose in sorghum [Sorghum bicolor (L.) Moench]. Theor. Appl. Genet. 114, 187–192.
Smith, C. W., and Frederiksen, R. A. (2000) Sorghum: Origin, History, Technology and Pro-duction, John Wiley, New York.
Steduto, P., Katerji, N., Puertos-Molina, H., Unlu, M., Mastrorilli, M., and Rana, G. (1997) Water-use efficiency of sweet sorghum under water stress conditions Gas-exchange inves-tigations at leaf and canopy scales. Field Crops Res. 54, 221–234.
Stephens, J. C. (1937) Male sterility in sorghum: Its possible utilization in production of hy-brid seed. J. Am. Soc. Agron. 29, 690–6906.
Suzuki, S., Lam, T. B., and Liyama, K. (1997) 5-Hydroxyguaiacyl nuclei as aromatic constitu-ents of native lignin. Phytochem. 46, 695–700.
Swanson, A. F., and Parker J. H. (1931) Inheritance of smut resistance and juiciness of stalk in the sorghum cross Red Amber x Feterita. J. Hered. 22, 55
Tadesse, Y., Sági, L., Swennen, R., and Jacobs, M. (2003) Optimisation of transformation conditions and production of transgenic sorghum (Sorghum bicolor) via microparticle bombardment. Plant Cell Tissue Organ Cult. 75, 1–18.
Takagi, S., Nomoto, K., and Takemoto, T. (1984) Physiological aspect of mugineic acid, a possible phytosiderophore of graminaceous plants. J. Plant Nutr. 7, 469–477.
Taylor, R. W. (1988) Grain Sorghum: A Manual for Production and Marketing. University of Delaware, Cooperative Extension Service, Newark, DE.
Tarpley, L., Lingle, S., Vietor, D., Andrews, D., and Miller, F. (1994) Enzymatic control of nonstructural carbohydrate concentrations in stems and panicles of sorghum. Crop Sci. 34, 446–452.
Tenkouano, A., Miller, F. R., Frederiksen, R. A., and Rosenow, D. T. (1993) Genetics of nonsenescence and charcoal rot resistance in sorghum. Theor. Appl. Gen. 85, 644–648.
Tesso, T., Claflin, L. E., and Tuinstra, M. R. (2004) Estimation of combining ability for resis-tance to fusarium stalk rot in grain sorghum. Crop Sci. 44, 1195–1199.
Tesso, T. T., Claflin, L. E., and Tuinstra, M. R. (2005) Analysis of stalk rot resistance and genetic diversity among drought tolerant sorghum genotypes. Crop Sci. 45, 645–652.
Tew, T., and Cobill, R. (2006) Evaluation of sweet sorghum as a complementary bioenergy crop to sugarcane in Louisiana. J. Am. Soc. Sugar Cane Technol. (serial online) 26, 57. http://www.assct.org/journal/journal.htm
Troeh, F. R., and Thompson, L. M. (2005) Soils and Soil Fertility. Blackwell Publishing. Oxford, UK.

Development and Utilzation of Sorghum as a Bioenergy Crop 247
Trull M. C., and Deikman J. (1998) An Arabidopsis mutant missing one acid phosphatase isoform. Planta 206, 544–50.
Tuinstra, M. R., Grote, E. M., Goldsbrough, P. B., and Ejeta, G. (1996) Identification of quantitative trait loci associated with pre-flowering drought tolerance in sorghum. Crop Sci. 36, 1337–1344
Undersander, D. J., Lueschen, W. E., Smith, L. H., Kaminski, A. R., Doll, J. D., Kelling, K. A., and Oplinger E. S. (1990) Sorghum for Syrup, In: Alternative Field Crops Manual. University of Wisconsin-Extension, University of Minnesota, Center for the Alternative Plants and Animal Products and the Minnesota Extension Services, Madison, WI; Waseca, MN.
Unger, P. W., and Baumhardt, R. L. (1999) Factors related to dryland grain sorghum yield increases: 1939–1997. Agron J. 91, 870–875.
Venuto, B. C. (2006). Producing biomass from sorghum x sudangrass hybrids, American Forage and Grassland Conference, 10–14 March 2006, San Antonio, Texas.
Vermerris, W., Saballos, A., Ejeta, G., Mosier, N. S., Ladisch, M. R., and Carpita, N. C. (2007) Molecular breeding to enhance ethanol production from corn and sorghum stover. Crop Sci. 47: S142–S153
Wallace, D. H., and Yan, W. (1998) Plant breeding and whole-system crop physiology: im-proving adaption, maturity and yield. CAB International, Wallingford, UK.
Wang, M. L., Dean, R., Erpelding, J., and Pederson, G. (2006) Molecular genetic evaluation of sorghum germplasm differing in response to fungal diseases: Rust (Puccinia purpurea) and anthracnose (Collectotrichum graminicola). Euphytica. 148, 319–330.
Waniska, R. D., Venkatesha, R. T., Chandrashekar, A., Krishnaveni, S., Bejosano, F. P., Jeoung, J., Jayaraj, J., Muthukrishnan, S., and Liang, G. H. (2001) Antifungal proteins and other mechanisms in the control of sorghum stalk rot and grain mold. J. Agric. Food. Chem. 49, 4732–4742.
Woo, S.-S., Jiang, J., Gill, B. S., Paterson, A. H., and Wing, R. A. (1994) Construction and characterization of bacterial artificial chromosome library of Sorghum bicolor. Nucl. Ac-ids Res. 22, 4922–4931.
Wood, A. J., and Goldsbrough, P. B. (1997) Characterization and expression of dehydrins in water-stressed Sorghum bicolor. Physiol. Plant. 99, 144–152.
Woodfin C. A., Rosenow D. T., and Clark L. E. (1988) Association between the stay green trait and lodging resistance in sorghum. In: Agronomy Abstracts, ASA, Madison, Wiscon-sin.
Xu, W., Subudhi, P. K., Crasta, O. R., Rosenow, D. T., and Mullet, J. E. (2000) Molecular mapping of QTLs conferring stay-green in grain sorghum (Sorghum bicolor L. Moench). Genome 43, 461–469.
Wu, X., Zhao, R., Bean S. R., Seib, P. A., McLaren, J. S., Madl, R. L., Tuinstra, M., Lenz, M. C., and Wang, D. (2007) Factors impacting ethanol production from grain sorghum in the dry-grind process. Cereal Chem. 84, 130–136
Yang, B., and Wyman, C. E. (2004) Effect of xylan and lignin removal by batch and flow-through pretreatment on the enzymatic digestibility of corn stover cellulose. Biotechnol. Bioeng. 86, 88–98.
Zhang, J. Y., Broeckling, C. D., Blancaflor, E. B., Sledge, M. K., Sumner L. W., and Wang, Z. Y. (2005) Overexpression of WXP1, a putative Medicago truncatula AP2 domain-containing transcription factor gene, increases cuticular wax accumulation and enhances drought tolerance in transgenic alfalfa (Medicago sativa). Plant J. 42, 689–707
Zhao, Z.-Y., Cai, T., Tagliani, L., Miller, M., Wang, N., Pang, H., Rudert, M., Schroeder, S., Hondred, D., Seltzer, J., and Pierce, D. (2000) Agrobacterium-mediated sorghum trans-formation. Plant Mol. Biol. 44, 789–798.

248 Saballos Zhu, H., Muthukrishnan, S., Krishnaveni, S., Wilde, G., Jeoung, J. M., and Liang, G. H.
(1998) Biolistic transformation of sorghum using a rice chitinase gene. J. Genet. Breed. 52, 243–252.
Zongo, J.-D., Gouyon, P. H., and Sandmeier, M. (1993) Genetic variability among sorghum accessions from the Sahelian agroecological region of Burkina Faso. Biodivers. Conserv. 2, 627–636.


9 Genetic Improvement of Sugarcane (Saccharum spp.) as an Energy Crop
Thomas L. Tew1 and Robert M. Cobill2
1 USDA–ARS, Sugarcane Research Unit, Houma, LA, USA, [email protected] 2 USDA–ARS, Sugarcane Research Unit, Houma, LA, USA, [email protected]
9.1 Introduction
Sugarcane (Saccharum spp.) is a large-stature perennial grass that is cultivated in approximately 80 nations in tropical, semi-tropical, and subtropical regions of the world, primarily for its ability to store high concentrations of sucrose in the stem. Approximately 70% of the world’s sugar supply in the form of sucrose originates from sugarcane.
Sugarcane is among the most efficient crops in the world in converting energy from sunlight into chemical energy that is usable as a fuel source. Recognition of sugarcane as an important energy crop was recently heightened by the advent of large-scale sugarcane-based ethanol production in Brazil.
This chapter discusses the unique advantages of sugarcane as a renewable resource for the production of biofuels, and addresses the opportunities and challenges associated with energy cane breeding within already-existing sugarcane breeding programs. To better understand sugarcane as an energy crop and to facilitate the development of a well-focused and effective genetic improvement program, three distinctive energy cane types are presented in this chapter. They include sugarcane (primarily sugar), Type I energy cane (sugar and fiber), and Type II energy cane (primarily fiber). Breeding strategies for each of these types will be discussed.
9.2 Botanical Description of Sugarcane
9.2.1 Taxonomy
Sugarcane belongs to the tribe Andropogoneae, and to the subtribe Saccharinae. Sugarcane geneticists have adopted the term ‘Saccharum complex’, originally coined
W. Vermerris (ed.), Genetic Improvement of Bioenergy Crops, DOI: 10.1007/978-0-387-70805 -8_9, © Springer Science+Business Media, LLC 2008

250 Tew and Cobill
Six species have traditionally been included in the Saccharum genus by sugar-cane geneticists:
• S. officinarum (x = 10, 2n = 80; sweet chewing cane found in native gardens in New Guinea and other South Pacific islands)
• S. robustum (x = 10, 2n = 60, 80; putative ancestor of S. officinarum found most commonly on river banks in the same region)
• S. edule (2n = 60–80, produces aborted tassels, a delicacy in the same region)
• S. barberi (2n = 111–120, semi-sweet Indian cane) • S. sinense (2n = 81–124, semi-sweet Chinese cane) • S. spontaneum (x = 8, 2n = 40–128, wild cane found throughout Asia)
Of these, S. edule, S. barberi, and S. sinense are likely of natural interspecific and/or intergeneric origin and should probably be relegated to horticultural group status (Daniels and Roach 1987; D’Hont et al. 2002). Irvine (1999) proposed further reduc-ing the number of Saccharum species to two, namely S. spontaneum and S. officina-rum, the latter encompassing all remaining species and interspecific hybrids.
More recently, Brown et al. (2007) analyzed 30 accessions from five species (S. barberi, S. officinarum, S, robustum, S. sinense and S. spontaneum), using sugarcane simple sequence repeat (SSR) markers and multivariate statistical methods. Their analysis supported S. robustum as being an ancestor of S. officinarum. Both S. bar-beri and S. sinense appeared to be much less related to the main Saccharum germ-plasm pool than had been shown in earlier molecular marker investigations, suggest-ing that introgression from other genera may have occurred.
The center of diversity of S. officinarum is the island of New Guinea where many accessions were collected in the late 1800’s (Daniels and Roach 1987). More recent expeditions occurred in 1921, 1928, 1951, 1957, 1976, 1977, and 1984, as shown in the USDA-ARS Germplasm Resources Information Network (GRIN; www.ars-grin.gov/cgi-bin/npgs/html/tax_site_acc.pl?MIA%20Saccharum%20officinarum). The ori-gins of S. officinarum are closely associated with the activities of humans as S. officinarum is a cultivated or garden species with no members found in the wild (Sreenivasan 1987). From the viewpoint of sugarcane breeders, a practical descrip-tion of S. officinarum is that the species possesses often-colorful large-diameter stalks, broad leaves, short internodes, high sugar content, low fiber content, and is relatively intolerant to the more sub-tropical environments where sugarcane is com-mercially grown, especially those where freezes can occur.
The species S. spontaneum is far more genetically diverse than S. officinarum, is highly polymorphic, and extends from the equator to the foothills of the Himalayas, from Indonesia and Japan through the Indian subcontinent, extending to the Mediter-ranean and northeast Africa. The greatest diversity and lowest chromosome forms of
by Mukherjee (1957) to describe a subset of genera within Saccharinae closely enough related to Saccharum to have contributed to its genetic background. Genera within the Saccharum complex include Erianthus, Miscanthus (see Chapter 10), Narenga, Saccharum and Sclerostachya (Amalraj and Balasundaram 2005). Using DNA sequences to assess the inter-relationships of genera within the Saccharum complex, Hodkinson et al. (2002), concluded that Saccharum and Miscanthus are more closely allied to each other than they are to other genera.

Genetic Improvement of Sugarcane (Saccharum spp.) as an Energy Crop 251
S. spontaneum have been found and collected in India (Panje and Babu 1960). Geno-types vary from short, grassy-appearing narrow-leafed types with no stalk, to large-stature types over 5 m in height and 3 cm in stalk diameter. Saccharum spontaneum is highly adaptable and able to survive a wide range of abiotic stresses, including droughts, floods, saline conditions, and freezing temperatures (Mukherjee 1950). While regarded as wild canes high in fiber and low in sugar, some S. spontaneum accessions possess a significant level of sugar with Brix levels (percent soluble so-lids) as high as 20% (Sugimoto et al. 2002). Because of its aggressive rhizomatous habit and its ability to propagate via seed dispersal, it is regarded as a noxious weed in several nations, including the U.S.A.
World collections of Saccharum are located at Kannur, Kerala State and Coimba-tore, Tamil Nadu State, India under the stewardship of the Sugarcane Breeding Insti-tute (http://sugarcane-breeding.tn.nic.in/genresources.htm); and at the National Germ-plasm Repository (http://www.ars-grin.gov/cgi-bin/npgs/html/site_holding .pl? MIA) in Miami, Florida, USA, under the stewardship of the Subtropical Horticultural Re-search Station, USDA-ARS (http://www.ars.usda.gov/Main/docs. htm?docid =10134).
9.2.2 Sugarcane Cultivation and Harvest
Predating modern-day breeding efforts, three traditionally recognized species within Saccharum were used for sugar production, namely S. officinarum (New Guinea), S. barberi (India) and S. sinense (China). A few select S. officinarum genotypes, com-monly referred to as chewing canes or noble canes (thick, colorful stalks), were widely distributed throughout the world and became the predominant source of re-fined sugar well into the early 1900’s. Diseases such as sugarcane mosaic began to ravage the crop on a worldwide scale in the early 1900’s and compelled growers to adopt more genetically diverse interspecific hybrids (Saccharum spp.) that were being developed by sugarcane breeders.
Sugarcane is an asexually propagated crop. Stem sections (also known as seed cane, seedpieces or setts) or ‘topped’ whole stems are planted in rows, from which axillary buds (also known as lateral buds or eyes) emerge. Propagation ratios from a seed cane field to a commercially planted field can range from as low as 1:3 to great-er than 1:15, depending on such variables as seed cane age, variety, cutting and planting methods (hand versus mechanical for either or both), and planting rate. Planting rate itself ranges from one to more than three stem sections (side-by-side) per row. Row widths are typically about 1.5 m, but substantial deviations from this norm are not uncommon. The first crop, referred to as the plant crop or plant cane, is harvested from as few as 8 months post-winter growth (Louisiana) to more than 24 months (Costa Rica, Hawaii, Peru) after planting.
Following the plant crop, anywhere from one to several ratoon (a.k.a. stubble, re-growth) crops are harvested. In most areas, ratoon crops are harvested at annual inter-vals, highest sugar yields being obtained from an extended warm growing season fol-lowed by a cooler and drier natural ripening period when energy partitioning shifts from growth toward sucrose storage in the stem tissue. Although in some regions first-ratoon yields are higher than plant-crop yields, biomass yields generally trend down-ward from one ratoon to the next. Therefore, costs associated with planting are

252 Tew and Cobill
weighed against projected reduced yields per additional ratoon, in order to determine an optimum number of ratoon crops (Salassi and Breaux 2005). As will be discussed later, sugarcane bred and managed as an energy crop would be expected to sustain a greater number of ratoons than sugarcane managed to maximize sucrose production.
Physiological and environmental factors affecting growth rate in a sugarcane crop have been comprehensively described in the literature (Clements 1980; James 2004). As in any large-stature grass, temperature and sunlight are critical to growth rate. Following emergence, a primary stalk originates from the bud, followed by a flush of secondary and tertiary stalks (tillers) that are generally larger than the pri-mary in diameter, and that contribute the vast majority of the final cane weight at harvest. Occasionally, a few large succulent stalks (a.k.a. suckers, bull shoots) will occur well into the growing season in some cultivars. These are considered to be undesirable in a short term crop (8–12 months) because they are very low in sucrose while adding significantly to the final cane weight at harvest. Stalks elongate most rapidly at 2–3 months physiological age, sometimes at rates exceeding 2.5 cm per day. Even in more tropical environments, the elongation rates of stalks taper off rather sharply from 3 to 7 months age to about 1.2 cm per day, then decline gradually (1.2–0.8 cm) to about 20 months age (Clements 1980).
The average number of millable stalks in a cane field varies considerably from one location to the next. In more temperate environments where varieties with high stalk populations are favored, it is not uncommon for commercial fields to have more than 100,000 millable stalks per hectare at harvest.
9.2.3 Sugarcane Anatomy
Sugarcane stalks (stems) are composed of two distinct fractions: the outer rind (r) fraction consisting of the epidermis (e) and several layers of tough, thick-walled sclerenchyma cells, and inner pith fraction largely consisting of thin-walled storage parenchyma (p) cells (Fig. 9.1). Vascular bundles (vb) are interspersed throughout the stalk, numerous and small in the rind fraction, and few and large in the pith frac-tion (Moore 1987).
Fig. 9.1. Cross section of the internode of a sugarcane stem (Moore, 1987).

Genetic Improvement of Sugarcane (Saccharum spp.) as an Energy Crop 253
In areas of low rainfall, sugarcane must be irrigated. It is estimated that 2 Mg of water must be applied to the crop per kg sugar produced. The energy input required for irrigation can have a substantial negative impact on the energy balance associated with harvesting biomass for energy purposes from sugarcane (Mrini et al. 2001).
At harvest, ripening may be encouraged by imposing stress on the crop in the form of water deprivation (where possible), nitrogen reduction, or application of plant growth regulators or chemical ripeners, such as glyphosate applied at low rates. Where the yield of total solids is more important than the yield of sucrose, imposing such stresses on the crop would be discouraged. A crop of 70 Mg ha–1, for example, may require per hectare100 kg N, 60 kg P2O5 and 300 kg K2O (Coombs 1984).
To the grower, flowering in sugarcane is usually considered to be an undesirable event in the production of sugar or total biomass (Berding and Hurney 2005). Once induced to flower, sugarcane stalks are transformed from a growth mode to a repro-ductive mode. However, early in the reproductive stage, flowering may serve as a ripener. Photosynthates normally used for vegetative growth are partitioned into additional sucrose storage, temporarily increasing sugar content. Thus, in some in-stances, flowering may positively impact final sugar yield.
To the geneticist, flowering is essential in order to recombine alleles and create the variation needed to develop new higher yielding cultivars (Stevenson 1965; James 1980). In more tropical regions, breeding stations have been established in niche environments where sugarcane flowers the most abundantly. In more temper-ate environments, photoperiod facilities are necessary to induce flowering for breed-ing purposes. Since sugarcane responds as an intermediate-day plant until floral induction occurs, and more as a short-day plant through floral initiation, photoperiod regimes are designed accordingly. In Louisiana, for example, a constant daylength of 12.5 h. is imposed for 30 days, followed by a 1-min per day descent for 60 days until the daylength reaches 11.5 h.
The sugarcane inflorescence (also known as tassel or arrow) is a panicle. Gener-ally, panicles in S. officinarum are relatively long and often exhibit a reddish hue. By contrast, panicles in S. spontaneum are much smaller, and have a white appearance. The main axis (rachis) has smaller axes (rachilla) of the first order, which, in turn have axes of the second and third order. Spikelets come in pairs on the complex branches of the panicle, one basal and one pedicillate. Each spikelet contains a single flower, and has long tufts of hair at its base, which imparts a silky appearance to the entire panicle (Moore and Nuss 1987; Fig. 9.2). The sugarcane flower consists of three anthers and two feathery appearing stigmas.
In certain sugarcane genotypes, anthers may shed no viable pollen; in other geno-types anthers may shed abundant pollen. Breeders have taken advantage of this wide variation in pollen shedding to arbitrarily assign breeding canes as either males or females. Tassels are collected, and most crosses are arranged at the anthesis stage of floral development, when the anthers first become visible. Tassels normally remain receptive for about 4 days. Once fertilization occurs, it takes from 3 to 5 weeks for the seed to mature.

254 Tew and Cobill
Fig. 9.2. Diagram of portion of mature raceme of sugarcane inflorescence showing the ar-rangement of sessile and pedicellate spikelets and the callus hairs (after Engard and Larsen 1948).
The seed of sugarcane is a true fruit, and as in other grasses is properly described as a caryopsis. The seed is narrow and ovate-to-oblong (approximately 0.5 mm in length). Comprised of the entire spikelet, with the tufts of hair at its base, harvested sugarcane seed has a very fluffy appearance, and is more often referred to as ‘fuzz’ than seed.
9.2.4 Early Breeding Efforts
The first indication that sexual reproduction was possible in sugarcane was reported by J. W. Parris in Barbados in 1858 (Stevenson 1965). By the late 1880’s, evaluation of seedlings from sugarcane tassels was simultaneously underway in Java and Bar-bados. The early history of sugarcane breeding, starting with the work of Soltwedel in Java and Harrison and Bovell in Barbados, was reviewed by Mangelsdorf (1946) and Stevenson (1965).
It was the pioneering work of Dutch breeders in Indonesia (Island of Java) that allowed the genetic improvement of sugarcane to take a leap forward. Dutch breed-ers successfully hybridized S. officinarum × S. spontaneum, and found that resultant hybrid (F1) progeny were substantially more robust than either parent. Furthermore, it became apparent that when S. officinarum clones were used as the female parent, progeny tended to be more robust and higher in sucrose content than when S. spon-

Genetic Improvement of Sugarcane (Saccharum spp.) as an Energy Crop 255
taneum clones were used as the female parent. Reciprocal differences in vigor were eventually explained by the cytological phenomenon of a high frequency of ‘2n + n’ progeny in S. officinarum (female) × S. spontaneum (male) crosses (Bremer 1923). Later studies not only confirmed Bremer’s early work, but demonstrated that the 2n + n phenomenon often persisted in the BC1 and in some instances BC2 generations, when S. officinarum was used as the female parent (Bhat and Gill 1985).
9.2.5 Genetic Improvement
Interspecific hybrid varieties that resulted from early breeding activity in Indonesia (e.g. POJ 2364, POJ 2878), India (e.g. Co 206, Co 213), and to a lesser extent in the West Indies (Barbados and Guyana), formed the genetic foundation of modern sug-arcane breeding programs. Sugarcane programs have reported sugar yield gains in the order of 1–2% per year (Edmincrease is attributable to genetics. Rates of genetic improvement in sugarcane are consistent with those that have been made in other crops.
In its present form, sugarcane (Saccharum spp.; 2n = 100–130) is a genetically complex crop, its genomic makeup resulting from highly successful interspecific hybridization efforts primarily involving S. officinarum and S. spontaneum. While most of the genomic composition of sugarcane is from S. officinarum (D'Hont et al. 1996) most of the genetic diversity is thought to be contributed by S. spontaneum, since it is by far the more genetically diverse of the two species (Lima et al. 2002). Genetic work done on sugarcane through conventional and molecular approaches was recently summarized (Ming et al. 2006). Through continued genetic improve-ment, sugarcane has become one of the world’s most efficient crops in collecting solar energy and converting it into chemical energy.
9.3 Production Statistics
9.3.1 Worldwide Production Statistics
It has been reported that, on a fresh weight basis, a larger mass of sugarcane is har-vested and transported for processing than any other crop in the world, at nearly 1.3 billion tonnes (1,300 Mt) in 2005 (see FAOSTAT production data; http://faostat.fao.org/site/567/default.aspx). Cane production in Brazil alone reached 420 Mt in 2005, from which 27.8 Mt of sugar and 16.4 billion liters of ethanol were produced (see Table 9.1). The fibrous residue, called bagasse, is used by most sugar mills to produce heat and steam for the operation of the mills. Some mills also gen-erate electricity (referred to as co-generation), and sell the excess to public utilities thus making sugarcane an already major energy crop.
é et al. 2005), and have shown that most of this

256 Tew and Cobill
Table 9.1. Sugarcane production from nations that produced more than 1 million tonnes (MT; 106 Mg) sugar in 2005
Area harv.
Cane harv.
Cane FrWt
Bagasse DryWt Sugar
Sugar for Mol-asses
Nation (×103 ha)
(×106 Mg)
(Mg ha-1)
(×106
Mg) (×106 Mg)
(×106 Mg)
(×103 Mg)
Brazil 5,792 420.1 72.5 27.3 27.82 26.72 12.0 India 3,600 232.3 64.5 15.1 20.60 7.9 P.R.China 1,578 88.7 56.2 5.77 8.70 2.3 Mexico 650 45.1 69.4 2.93 5.47 1.8 Australia 434 38.3 88.1 2.49 5.46 1.2 Thailand 1,033 49.6 48.0 3.22 5.16 2.1 U.S.A. 391 25.8 66.0 1.68 2.91 2.0 Pakistan 974 47.2 48.5 3.07 2.81 1.4 S. Africa 428 21.7 50.8 1.41 2.52 0.9 Colombia 426 39.9 93.5 2.59 2.46 0.5 Indonesia 435 25.5 58.6 1.66 2.44 1.4 Argentina 305 19.3 63.3 1.26 2.17 0.7 Philippines 369 31.0 84.0 2.02 2,14 0.9 Guatemala 190 18.0 94.7 1.17 1.85 0.5 Cuba 517 12.5 24.2 0.81 1.17 0.4 Egypt 205 16.3 79.7 1.06 1.17 0.6
FrWt = fresh weight; harv. = harvested
9.3.2 U.S. Production Statistics
In the U.S. in 2006, the sugarcane production area added up to 377,000 ha with pro-duction in Florida (164k), Louisiana (176k), Texas (19k), and Hawaii (18k). Cane and cane sugar production in the U.S. in 2006 were estimated at 27 × 106 Mg and 3.5 × 10⁶ Mg, respectively.
Following the lead of Brazil, several countries are investigating cane as a dedi-cated energy crop for the production of ethanol. Within the U.S., in addition to Flo-rida, Louisiana, Texas and Hawaii where sugarcane is already being grown, Califor-nia and states in the southeastern U.S. are also exploring cultivation of cane as a dedicated energy crop for the production of ethanol.
9.4 Energy Potential of Sugarcane
9.4.1 Yield Potential
The biomass potential of any crop is set by its relative photosynthetic efficiency. Like other economically important large-stature grasses, which include maize (Zea mays; Chapter 7) and sorghum (Sorghum bicolor; Chapter 8), sugarcane is a C4 plant (see Chapter 1). The C4 concept was first made known (Kortschak et al. 1965) and
ethanol
DryWt = 50% of FrWT for bagasse

Genetic Improvement of Sugarcane (Saccharum spp.) as an Energy Crop 257
the pathway elucidated (Hatch and Slack 1966) by plant physiologists conducting their research on sugarcane in Hawaii and Australia, respectively. The theoretical maximum net efficiency of the photosynthetic process of converting solar energy into biomass in C4 plants is estimated to be 6–7%; by comparison, photorespiration in C3 plants leads to maximum efficiency of around 3%. The relative advantage of C4 plants over C3 plants is latitude dependent: the more tropical the environment, the greater the advantage.
At maximum efficiency, the theoretical upper limit for above-ground sugarcane biomass (total solids) production was estimated to be 140 Mg ha–1yr–1 (Loomis and Williams 1963). Of course, maximal efficiencies are not even closely approached in the real world for such reasons as incomplete canopy closure early in the crop cycle, suboptimum sunlight and temperature conditions during a significant portion of the crop cycle, suboptimum water and nutrient conditions in the soil, and losses from crop pests.
9.4.2 Actual Yields
In highly managed experimental plots in both Australia and Hawaii, biomass yields have reached about half the theoretical maximum (Moore et al. 1997). Researchers in Australia studied radiation interception and biomass accumulation in sugarcane grown under irrigated tropical conditions (Muchow et al. 1994). Maximum biomass production for the crop on a dry-matter basis was estimated at 72 Mg ha–1 and the maximum fresh-weight yield at 201 Mg ha–1.
In Hawaii, in a 60-ha field harvested at 24-months age, fresh weight yield of the crop was 190 Mg ha–1yr–1, while recoverable sugar yield was 24 Mg ha–1yr–1 (Os-good 2003). Assuming that an equal amount of fiber (on a dry-weight basis) was harvested from this crop, the above-ground biomass (soluble and insoluble solids) that was processed was in the range of 50 Mg ha–1yr–1. Hawaii, which grows a 2-year crop, normally harvests about 200 Mg cane ha–1 (100 Mg ha–1yr–1), which represents about 60 Mg total solids ha–1 (30 Mg ha–1yr–1).
There are several countries where cane yields approach 100 Mg ha–1yr–1. The av-erage fresh-weight yield of sugarcane on a worldwide basis is approximately 65 Mg ha–1yr–1. This translates to roughly 17 Mg total solids (8 Mg sugar, 9 Mg DW fiber ha–1yr–1, and overlooks the leafy trash component which is either burned or left to decompose in the field.
9.5 Sugarcane as an Energy Crop
As will have become apparent from the previous sections, sugarcane is a crop that can be used both for its sugar – the traditional use – and, due to its large stature, also for its fiber. This section will describe how sugarcane is used under these two differ-ent scenarios, whereas Section 9.6 will describe different strategies for genetic im-provement depending on the way the sugar cane is intended to be used.

258 Tew and Cobill
9.5.1 Sugar as a Feedstock
When sugarcane is brought to the mill for processing, separation of juice from fiber is done by one of two systems, milling or diffusion. Both require that the cane be broken down to such an extent that most of the storage cells are ruptured. In milling, once the cane is chopped and shredded with revolving knives, the juice is expelled from the fiber by passing the mat of cane between sets of hydraulically loaded, grooved, cylindrical rollers set in tandem. During the process, a generous amount of water is distributed onto the fiber to assist in washing out the soluble solids. In diffu-sion, cane is shredded to a point that the cell rupture index exceeds 90%. As in the mill system, water is generously applied to wash out the soluble solids. In both sys-tems, the dilute juice is collected for further processing.
To obtain refined sucrose, the juice must be purified, clarified, and concentrated. Once the juice (syrup) is supersaturated, it is ‘seeded’ with crystalline sugar, causing granulation to spontaneously occur. Centrifugation then separates raw sugar (A-strike) from uncrystallized syrup (A-molasses). Following initial centrifugation, the molasses is re-centrifuged, yielding additional raw sugar (B-strike). The B-molasses is again centrifuged, yielding C-strike sugar, which is recycled and used in the crys-tallization process. The remaining syrup becomes a marketable by-product, referred to as blackstrap molasses.
As the world’s largest producer of sugarcane, Brazil assumed leadership in the conversion of sugar into ethanol. The creation of the Brazilian Alcohol Program (PROALCOOL) occurred in 1975 with the intent of producing anhydrous alcohol to be blended with gasoline. Despite the success of PROALCOOL from 1975 to 1985, opposition to the heavy subsidies imposed on the public to support this fledgling industry in the face of declining oil prices led to a drastic drop in ethanol production and usage in light vehicles in Brazil over the next 15 years. However, since 2001, there has been a boom in ethanol production in Brazil, driven by sharply rising oil prices and the advent of flex-fuel vehicles (Walter et al. 2006).
In Brazil, to produce ethanol from sugar, the stream of cane juice is directed to fermentation vats. For about 8 h, yeast ferments the sugar in the juice to a 6–10% ethanol brew (see also Chapters 3 and 6). The ethanol is distilled in stages to greater than 99% purity, denatured, loaded into tanker trucks and delivered to fuel distribu-tors. Brazil has been at the forefront in achieving a large-scale sugarcane-based etha-nol industry that is commercially competitive.
9.5.2 Sugarcane Fiber as a Feedstock
9.5.2.1 Composition of Sugarcane
Discussion of sugarcane as an energy crop, especially from a fiber perspective, re-quires a basic understanding of the contribution of each of the following compo-nents, (1) millable cane stalks, (2) tops and green leaves, and (3) dead and dry leaves. In his monograph, ‘The Energy Cane Alternative’, Alexander (1985) reported that, on a fresh-weight (FW) basis, sugarcane in Puerto Rico consisted of 69% millable stalks, 17% green immature cane tops and leaves, and 14% dry leaves (trash). Bee-

Genetic Improvement of Sugarcane (Saccharum spp.) as an Energy Crop 259
harry (1996) reported similar data (69% stalks: 21% green tops and leaves: 10% leafy trash) for cane grown in Mauritius. Crop age, variety, extent of flowering, and other variables can alter this 70:30 stalk to non-stalk ratio of aboveground plant parts in sugarcane.
When sugarcane is harvested for its sucrose content, it is highly desirable to mi-nimize the amount of tops and leaves carried to the mill since they reduce the effi-ciency of harvesting, transporting, and processing. Early on, sugarcane farmers rec-ognized that a highly efficient method of removing the leafy component of the crop without adversely affecting sugar yield was to burn the field. Since the 1980’s, with increased mechanization and heightened environmental and public health concerns related to sugarcane burning, green cane harvesting (harvesting without burning) has become an increasingly common practice. Whereas there are important benefits associated with green cane harvesting, such as erosion and weed control, the leafy residue (leaf litter) adversely affects the following crop when left in the field (Rich-ard 1999; Viator et al. 2006).
On a world-wide basis, clean mature stalks of sugarcane consist of approximately 13% sugar (>90% sucrose), 12% fiber, 75% water, and a small fraction of ash. However, even within a specific sugar industry of the world, this ratio can deviate widely, depending on such variables as maturity and condition of the crop at harvest, time of year, sunlight, temperature, soil conditions, and variety. To illustrate this, in Louisiana, a relatively temperate climate for sugarcane culture, sugar content may be as low as 8% when harvesting begins in the early fall, but reach as high as 15% dur-ing the 100-day harvest campaign that is concluded by year’s end in advance of possible freezes. Green cane tops and leaves consist of 20–25% solids (largely fiber) and 75–80% water. By contrast, dry leaves consist of about 80% fiber and 20% wa-ter (Beeharry 1996).
When sugarcane is milled, the fibrous residue, bagasse, is repeatedly washed and pressed to remove all soluble solids. It reaches about a 50:50 fiber-to-water ratio as it leaves the mill to be either used directly as a fuel source in boilers to internally power the mill, or stored for future use.
9.5.2.2 Boiler Fuel and Cogeneration
Apart from energy derived from sugar and molasses, sugarcane has traditionally played a far greater role as an energy crop than may have been realized by the casual observer. Sugarcane bagasse (fibrous residue) is the primary fuel source used in boilers, making most sugarcane mills effectively energy self-sufficient. In many instances, excess heat generated from bagasse is converted to electricity (co-generation) and sold to local utilities. To illustrate the role of bagasse within the U.S., two examples follow.
Before sugarcane production began to precipitously decline in Hawaii, the sugar industry annually processed about 8 × 10⁶ Mg cane from 80,000 ha (40,000 har-vested ha) from which about 1 × 10⁶ Mg sugar was produced. In 1978, from 2.6 × 10⁶ Mg bagasse (1.3 × 10⁶ Mg dry wt.) burned in boilers, 15.4 PJ (= 1015 J) of heat (384 GJ ha–1 at 60% efficiency) was also produced. That year, sugar mills supplied 42%, 38%, 23%, and 2% of the total electricity generated on Hawaii’s four sugar

260 Tew and Cobill
islands of Hawaii, Kauai, Maui, and Oahu, respectively. As recently as 1987, Hawaii,ssugar factories supplied 400 GWh of energy, or 10% of the consumer energy demandto the public grid system (Payne 1991). Currently, the largest biomass cogeneration facility in the U.S. operates in Palm Beach County, Florida, USA. The New Hope Power Partnership energy facility, owned by Florida Crystals, has 140 MW installed generating capacity, and operates year around. During a typical 12-month period, the facility will process and burn 0.86 × 10⁶ Mg of bagasse. This is approximately 50% of the total fuel for the facility on a weight basis, and 48% on a heat basis, the remaining originating from wood waste. The bagasse is produced from the adjacent Florida Crystals Okeelanta Sugar Mill and Refinery, which processes sugarcane from up to 36,000 ha of fields that surround the mill and power facility (Stephen Clarke (Director of Industrial R&D, Florida Crystals Corporation), personal communication).
9.5.2.3 Cellulosic Ethanol and Gasification
Irvine and Benda (1979) determined that bagasse produced in Louisiana consisted of approximately 36% cellulose, 28% hemicellulose, 20% lignin, 13% other organics, and 2% ash on a dry weight basis. More recently, the U.S. Department of Energy (http://bioenergy.ornl.gov/papers/misc/biochar_factsheet. html) compared the feed-stock characteristics of sugarcane bagasse, corn stover, sweet sorghum, switchgrass, miscanthus, and lesser related energy crops. In comparison to other large-stature grasses, sugarcane ranked relatively high in terms of cellulose (32–48%), low in hemicellulose (19–24%), and high in lignin (23–32%).
Jenkins et al. (1998) found that, on a dry-weight basis, sugarcane fiber produced 19.0 MJ kg–1, compared with 18.1 MJ kg–1 for switchgrass fiber. McKendry (2002) reported sugarcane fiber with a heating value of 19.4 MJ kg–1, compared with 17.4 MJ kg–1 for switchgrass fiber. In the above-mentioned U.S. Department of Energy report, the heating values of sugarcane (18.1 MJ kg–1), switchgrass (18.3 MJ kg–1) and miscanthus (17.1–19.4 MJ kg–1) were superior to that of sweet sorghum (15.4 MJ kg–1). These findings suggest that sugarcane bagasse, an important by-product that sugar processors around the world have utilized for many decades, is a relatively efficient plant fuel source, when compared with other large-stature grasses.
For cellulosic ethanol production, cultivars containing relatively high levels of cellulose would be preferred over those with relatively high levels of lignin. How-ever, lignin is of considerable importance, because of its greater energy content and thus, its role as a combustible fuel source. In addition, lignin plays an important role in structurally supporting the crop so that it doesn’t easily lodge in the field and become difficult to harvest. Thus, the benefits of lignin will need to be balanced against its negative effect on the efficiency of cellulosic ethanol production, in an energy cane breeding and selection program.
One often-overlooked advantage that bagasse has over some other cellulosic sources is that, because it has been thoroughly washed, it is a relatively clean prod-uct, low in extraneous matter, and essentially devoid of natural inhibitors. Studies designed to investigate the feasibility of producing ethanol from excess post-harvest residue are underway (Dawson and Boopathy 2007).

Genetic Improvement of Sugarcane (Saccharum spp.) as an Energy Crop 261
Within the U.S., the cellulosic ethanol industry is expected to rapidly expand as technology improves. A 5.3 million liter per year demonstration-scale facility, sup-ported with funds from the U.S. Department of Energy, is expected to be operational by end of year 2007 in Jennings, Louisiana, under the ownership of Verenium (http://www.verenium.com), producing cellulosic ethanol from excess sugarcane bagasse and specially-bred sugarcane cultivars high in fiber content. Gasification technology is a thermo-chemical process in which a feedstock such as bagasse, is converted into a mixture of gases, including methane. The first large-scale attempt to integrate a gasifier into a sugarcane mill was recently performed in Brazil (Pellegrini and de Oliveira 2007).
9.5.3 Energy Output/Input Ratio
Sugarcane fares favorably with respect to energy balance. Energy output/input (O/I) ratios have been variously reported for sugarcane cultivated, harvested, and milled for its sugar content. Table 9.2 displays reported energy inputs and outputs from sugarcane producing countries of the world.
Table 9.2. Energy inputs and outputs of some sugarcane producing regions (GJ ha–1). See Mrini et al. (2001) for data sources.
Aus- tralia 1978
Brazil 1986
India 1987
Mor- occo 2001
Thai- land 1983
USA FL 1992
USA HI 1978
USA LA 1980
Outputs 592.0 336.4 512.1 359.0 220.9 472.8 626.3 305.9 Inputs 190.4 100.0 179.5 200.0 80.3 209.2 189.1 168.6 Ratio 3.1 3.4 2.4 1.8 2.7 2.3 3.3 1.8
More recently, Macedo et al. (2004) reported that the average O/I ratio is in ex-cess of 8:1 in Brazil when sugarcane is processed for ethanol production. Brazil has become considerably more energy efficient and yields have improved substantially since 1986. We anticipate that O/I ratios above 2:1 would be easily attainable in any current sugarcane-growing area within the U.S., were the sugarcane crop to be grown and processed primarily for ethanol production. Even though Pimentel and Patzek (2007) reported far less favorable O/I ratios for sugarcane grown in Brazil and the U.S., they concede that the net energy balance for sugarcane grown in these coun-tries is positive. Given the broad consensus that sugarcane has a positive energy balance, perhaps a greater focus should be placed on net energy output rather than on the O/I ratio itself.

262 Tew and Cobill
9.6 Energy Cane Breeding Strategies
Figure 9.3 shows the different types of sugarcane that will be further discussed in this section, and how they differ in their composition. Traditional sugarcane is grown primarily for the sugar, as discussed in Section 9.5.1. In the case of energy canes, the vegetative biomass is an important product, and this is either a by-product, in the case of the Typ I energy canes (Section 9.6.2), or the main product, in the case of the Type II energy canes (Section 9.6.3).
Fig. 9.3. Variation in use and composition among sugarcane and Type I and Type II energy canes.
9.6.1 The Sugar Model (Status Quo)
9.6.1.1 Breeding for Sugar Yield and Improved Sugar Content
In most major sugarcane producing areas of the world, gains in sugar yield have closely paralleled gains in cane yield (Simmonds 1976; Tew 1987; Hogarth et al. 1997; Moore et al. 1997). In an experiment that compared all major commercial varieties grown in Barbados during the period of 1930–1985, Kennedy (2000) showed that gains from breeding and selection for cane yield were in the order of 1 Mg yr–1, whereas there was no increase in sugar quality over the same period. In spite of its relatively high heritability, progress for sucrose content as a character has been rather limited. The lack of improvement of sugar content in more tropical varie-
Genetic Improvement of Sugarcane (Saccharum spp.) as an Energy Crop 263
ties can be attributed, at least in part, to relatively low genetic variability for this character in mature cane as compared to cane yield (Hogarth et al. 1981).
In most genetic studies that have partitioned sucrose yield into its component parts (Miller 1977; Kang et al. 1983; Milligan et al. 1990), authors have similarly concluded that (1) cane yield is generally more important than sucrose content in determining sucrose yield, and (2) stalk population is more important than stalk weight in determining cane yield. Thus, genetic improvement of sucrose yield will likely continue to be most effectively accomplished by selecting for cane yield through increasing stalk population, provided that sucrose content is not compro-mised.
In more temperate environments such as in Argentina and Louisiana, where sug-arcane was initially poorly adapted, early improvements in sugar yield were more attributable to improved sucrose content than to improvements to cane yields (Breaux 1984; Cuenya and Mariotti 1986). In Louisiana, for example, recoverable sucrose content during the 1940’s was 7.85% and 11.24% some 50 years later during the 1990’s. By directly comparing cultivars from different eras within a single test, Lingle et al. (2006) confirmed that the improvement in sucrose content in the Louisi-ana sugar industry over this 50-year period is largely genetically based. The genetic advantage of early-maturing cultivars is most obvious at the outset of the harvest season in more temperate environments where cane must be harvested in advance of possible freezing conditions.
9.6.1.2 Sugarcane Breeding in Brazil Brazil is the largest and most efficient sugar producer in the world, cost of produc-tion approximates $200 Mg–1 (versus >$400 Mg–1 in the U.S.). Sugarcane in Brazil is cultivated on over 6 million hectares (2.4% of Brazil’s arable land), an area relatively small, compared with soybeans (21 M ha) and corn (14 M ha). Future expansion (3 million additional hectares by 2010) is projected to occur largely on existing pasture-land. Brazil’s production of 16 billion liters of ethanol in 2006 represented 38% of the world’s total, second only to the U.S. corn-based ethanol industry. In 2007, it is projected that about 50% of the sucrose extracted from sugarcane in Brazil will be converted into refined sugar, and 50% will be converted into ethanol (USDA 2007; http://www.ers.usda.gov/briefing/sugar/sugarpdf/EthanolDemandSSS249.pdf).
The Brazilian sugar industry relies on production of extractable sugars for the production of ethanol. For the time being, sugarcane improvement programs in Bra-zil continue to be focused on breeding higher yielding sugarcane with quality com-ponents similar to those of current cultivars. The industry would prefer to be in a position to quickly shift from ethanol toward refined sugar production, vice versa, depending on economics. Its proponents contend that becoming dependent on so-called low-sugar, high-fiber energy canes would reduce that flexibility. Sugarcane has the unique advantage of being a large-stature grass exceptionally high in sucrose content; why should this advantage not continue to be exploited? Furthermore, unless a breeding program is significantly increased in size, any decision to develop distinctive high-fiber energy cane cultivars in addition to sugarcane cultivars would mean diluting an ongoing sugarcane-breeding program (W. Burnquist, personal

264 Tew and Cobill
communication). To be sure, Brazil’s ethanol yields on a per-hectare basis have increased dramatically since 1986 as a result of genetic and technological improve-ments (Xavier 2007).
Brazil recognizes that bagasse will likely play an increasing role in the perform-ance of sugarcane as an energy crop. With existing sugarcane, Macedo (2005) esti-mated that excess bagasse (30%), together with leafy trash (50% of total produced by crop) could yield about 34 additional liters of ethanol per Mg of cane harvested.
Although the sugar model has worked well for Brazil, their experience is not uni-versally applicable. In the U.S. there is less incentive to convert sugar to ethanol because the market value of sugar, relative to ethanol, is greater than in Brazil. At present, sugar-based ethanol from sugarcane is not cost competitive with starch-based ethanol from corn (Shapouri et al. 2006). Even in Hawaii, where biomass yields from sugarcane are as high as anywhere in the world and where the crop is harvested year-around, it is more economical to import ethanol from thousands of miles away rather than to locally produce it.
At the time of this writing, the best-case scenario in the U.S. is to continue to produce sugar from sugarcane, but also to explore opportunities that exist for prof-itably producing ethanol from molasses, excess sugar, and excess bagasse. While continuing to process sugarcane for sugar, it may be more profitable to produce ethanol from molasses than to sell molasses and more profitable to produce cellu-losic ethanol from excess bagasse than to use this by-product in any other manner, once the infrastructure is in place to accomplish this.
9.6.2 Sugar and Fiber Model
9.6.2.1 Type I Energy Cane Definition
Type I energy cane as defined herein is a cane that is selected, and cultivated to maximize both its sugar and fiber components. Alexander (1985) was a strong pro-ponent of this model. He believed that by relaxing the stringent standard set on fiber content, canes could be selected that were substantially more energy efficient than current varieties. He argued that, with a reorientation of cane management involving (1) utilization of biomass-oriented genotypes, (2) utilization of the whole plant in-cluding tops and leaves that have traditionally been burned just prior to harvest, and (3) growth orientation from planting to harvest, biomass yields could be in the range of 2–3-fold that of present expectations.
9.6.2.2 Genetic Base Broadening
Genetic improvement of sugarcane for increased energy efficiency and adaptability to a wider range of environments is considered by many geneticists as synonymous with ‘genetic base broadening,’ i.e. utilization of wild Saccharum germplasm, par-ticularly S. spontaneum, in sugarcane breeding programs (Ming et al. 2006). Utiliza-tion of S. spontaneum clones in the early 1900’s provided the foundation on which most sugarcane breeding programs have subsequently built (Roach 1978). Since the 1960’s, utilization of wild germplasm became an integral part of some breeding

Genetic Improvement of Sugarcane (Saccharum spp.) as an Energy Crop 265
programs, most notably in Australia (Berding and Roach 1987), Barbados (Walker 1972), India (Panje 1972), Taiwan (Shang et al. 1969), Louisiana (Dunckelman and Breaux 1972; Legendre and Burner 1995), and Hawaii (Heinz 1967). The basis for these more recent efforts to introgress genes from S. spontaneum included (1) an awareness of the limited genetic base of sugarcane, (2) a perceived reduction in the rate of genetic gains that were earlier realized, and (3) a desire to acquire increased tolerance or resistance to specific biotic and abiotic stresses (Berding and Roach 1987).
Advantages of early-generation hybrids include greater overall cane and biomass yields, extended ratooning ability, and greater tolerance to such abiotic stresses as floods, droughts, low fertility, and cold temperatures. Additional benefits contributed by this germplasm include new genes for resistance to diseases and pests.
The longest sustained base broadening efforts have occurred in Australia, Barba-dos, and Louisiana (Ming et al. 2006). In Australia, ‘QN 66-2008’, a BC3 progeny of S. spontaneum accession, Mandalay, has produced 22 Australian cultivars, among them, ‘Q 138’, ‘Q 154’, and ‘Q 158’, which have achieved substantial commercial use (Nils Berding, personal communication). In Barbados, cultivars ‘B 79474’ (BC2 derivative of ‘S 49’), ‘B 80251’ (BC2 derivative of ‘Moentai’ and ‘SES 84/58’), and ‘B 881607’ (BC1 derivative of ‘SES 289A’), all recent derivatives of S. spontaneum accessions, achieved commercial status (Rao and Kennedy 2004). In Louisiana, cultivar ‘LCP 85-384’, a BC4 derivative from S. spontaneum ‘US 56-15-8’, was planted to greater than 90% of the total cane area at its peak in 2004 (Gravois et al. 2006). Basic derived cultivars released subsequent to LCP 85-384 include HoCP 95-988 (BC3), HoCP 96-540 (BC5), L 97-128 (BC5), L 99-226 (BC5), and L 99-233 (BC5). Another product of the basic breeding effort in Louisiana is ‘TUCCP 77-42’, a BC1 derivative which was bred in the U.S. but selected in Argentina, eventually becoming the leading cultivar in that country (Tew 2003).
For those with an ongoing basic breeding program in place, it is expected that Type I energy cane candidates can be identified in more advanced selection stages, without the need to maintain a separate energy cane breeding and selection program.
9.6.2.3 Caribbean and U.S. Experience
Alexander (1991) described a Type I energy cane variety of particular interest in Puerto Rico, namely US 67-22-2, an early-generation hybrid with an unusually ex-pansive canopy ideally suited for the foliar interception of sunlight. This genotype had a highly prolific stalk population (135,000–210,000 stalks ha–1), and deep root system. Ratoon regrowth of US 67-22-2 was outstanding; it produced from 20–30 Mg dry matter ha–1yr–1, and did not decrease in yield from plant cane through eight ratoons, benefiting from its modest rhizomatous growth habit. At 13% fiber and 8% sucrose in a high-nitrogen regime where stalks, tops, and leaves were collected, this variety was reported to have total soluble solids yields well in excess of standard commercial varieties in Puerto Rico (Samuels 1986).
High-fiber sugarcane genotypes were released for energy purposes in the U.S. in 2007. In Louisiana, three high-fiber sugarcane varieties, namely L 79-1002 (F1 hy-brid from CP 52-68 × Tainan S. spontaneum), HoCP 91-552, and Ho 00-961 were

266 Tew and Cobill
released as high-fiber sugarcane cultivars. The latter two clones, developed at the USDA-ARS Sugarcane Research Unit, approach the sugar yields of current commer-cial standards, but they are about 16% in fiber content, thus fitting the Type I classi-fication.
9.6.3 Fiber-Only Model (Type II Energy Cane)
9.6.3.1 Type II Energy Cane Definition
Type II energy cane is defined as cane that is bred, selected, and cultivated primarily or solely for its fiber content. It is expected that Type II energy cane cultivars would have particular appeal in environments more temperate than current sugarcane grow-ing regions, where freezing of above-ground tissue is not only expected, but desired in order to achieve desiccation prior to harvest. Type II energy canes would be used as a feedstock source for generation of electricity and for production of cellulosic ethanol.
9.6.3.2 Breeding Within Saccharum Strictly for Fiber Content As in the fiber and sugar model, the fiber-only model involves utilization of germ-plasm outside the traditional sugarcane germplasm pool, specifically Saccharum spontaneum, but to an even greater extent, and in earlier generations.
Legendre and Burner (1995) observed that first-generation (F1) hybrid progeny produced the highest fresh weight and dry matter yield. In their study, backcrossing (F1 to BC3) to elite commercial parents resulted in a marked reduction of many im-portant yield components, including overall solids content, fiber content, and stalk number. Jackson (1994) evaluated yield components of a population of F1 (Saccha-rum officinarum or commercial variety × S. spontaneum) and F1 × F1 clones for 3 years (plant and two ratoon crops). Stalk number and fiber content were positively correlated, as were stalk weight and sugar content. Sugar yield was more closely associated with stalk weight and sugar content than with stalk number, but became more closely associated with stalk number with successive ratoon crops. Sugar con-tent was positively correlated (r = 0.55) with cane yield in the plant crop but was negatively correlated (r = –0.20) with cane yield by the second ratoon crop, illustrat-ing the importance of measuring yield beyond the plant crop before assessing the performance of clones.
In reviewing data from the second clonal stage of selection (5-m plots) involving progeny derived from basic crosses, R.M. Cobill (unpublished data) found that total solids content is much more closely correlated with fiber content than with Brix (total soluble solids). This suggests that genetic gains in total solids should occur faster when the focus is on increasing fiber content.
The breeding program in Barbados has recently responded to a call for high-fiber ‘fuel canes’ for electricity production. Vigorous Type II energy canes, exceptionally high in fiber content (> 30%), are being evaluated on a large scale. Results thus far look promising, as these genotypes are yielding high-grade bagasse in terms of fuel value (Kennedy 2005). In addition to energy canes that better fit the Type I mold,

Genetic Improvement of Sugarcane (Saccharum spp.) as an Energy Crop 267
Mauritius is also actively pursuing Type II energy canes for the production of elec-tricity (Kishore Ramdoyal, personal communication).
Cultivar L 79-1002, a Type II energy cane developed at Louisiana State Univer-sity and released in 2007, is expected to be grown primarily for its fiber content. Harvesting prior to the onset of freezing temperatures, Giamalva et al. (1984) re-ported fresh-weight cane yields in mechanically harvested plant and ratoon plots of L 79-1002 planted at Shreveport, Louisiana of 151 gross (103 net) and 229 gross (177 net) Mg ha–1, respectively, where ‘gross’ is the sum of stalks, leaves, and tops. Brix and fiber levels in the stalks of L 79-1002 in this test were approximately 12% and 28%, respectively. Type II energy cane varieties such as L 79-1002 can be cropped in environments more temperate than current sugarcane growing areas, particularly where freezing of above-ground tissue is desired in order to achieve desiccation prior to harvest.
9.6.3.3 Related Genera and Intergeneric Hybridization
Outside of Saccharum, two other genera have received considerable attention from sugarcane breeders, namely Erianthus and Miscanthus, both of which may have been involved in the origin of the Saccharum genus. Among the species in the Erianthus genus, E. arundinaceus (Rez.) Jeswiet has received the greatest attention because of its large stature. On its own merits, E. arundinaceus has been considered as a viable energy crop. It is high in dry matter content, as high as 47% (Matsuo et al. 2006), and has produced dry matter yields as high as 127 Mg ha–1 in test plots, more than two-fold the dry matter yield of sugarcane and energy cane (Stricker et al. 1993). Erianthus arundinaceus has a number of other traits desired by sugarcane breeders, including excellent ratoon yields, a deep and extensive root system, tolerance to droughts and floods, and resistance to diseases of importance in sugarcane (Berding and Roach 1987). Erianthus arundinaceus × Saccharum spp. hybrids have been achieved and validated through the BC1 generation toward Saccharum. From the BC1 stage, it should be possible to exploit genes of value from E. arundinaceus in energy cane breeding programs (Cai et al. 2005).
The attributes of Miscanthus are treated in Chapter 10. Among its positive attrib-utes, of greatest interest to the cane breeder is its superior overwintering ability in temperate climates. Intergeneric hybrids between Saccharum and Miscanthus have been achieved by sugarcane breeders interested in extending the range of adaptation of sugarcane and energy cane. The most concerted effort to introgress desirable genes from Miscanthus into Saccharum occurred in Taiwan. Lo et al. (1986) re-ported making 209 cross combinations and achieving 64,075 seedlings of F1, BC1, BC2 and BC3 progenies. The highest fresh weight yields obtained from these crosses approached 175 Mg ha–1yr–1.
9.7 Looking to the Future
After reviewing responses to a questionnaire the authors sent out to sugarcane breed-ers around the world, it was apparent that the definition of energy cane varies widely,

268 Tew and Cobill
depending on current and future industry expectations, crop limitations imposed by the environment, and a host of other variables. For the sake of simplicity, we have described three types of energy canes, namely the Sugar Model (conventional sugar-cane), the Sugar and Fiber Model (Type I energy cane), and the Fiber Model (Type II energy cane).
Using the sugar model, Brazil has had great success in the past 30 years, follow-ing the inception of their sugarcane-based ethanol industry. Ethanol yields on a per-hectare basis in Brazil have increased dramatically over the past 30 years and further substantial increases have been projected. Colombia appears to be following the footsteps of Brazil, with a rapid escalation of ethanol production occurring there as well.
The level of success of Type I and Type II energy canes remains to be seen. From physiological, agronomic, and genetic viewpoints, it would seem reasonable that energy efficient cultivars should be more easily obtainable within either of these models than within the conventional sugarcane model. Perhaps further improvements in cane processing and cellulosic ethanol conversion technologies may be necessary before high-fiber energy canes will have a substantial impact. We anticipate that the larger cellulosic ethanol industry, independent of cane, will drive further technologi-cal improvements.
Meanwhile sugarcane breeders cannot afford to take a wait-and-see stance, as technology breakthroughs continue to occur. Cane breeding is a long-term process, especially when exploitation of exotic germplasm is involved.
Perhaps the most far-reaching change in the energy cane picture, certainly within the U.S., will be the development of Type II canes with increased overwintering ability. Toward this end, utilization of Saccharum germplasm from more extreme climates, intergeneric hybridization with Miscanthus, and genetic modification (in-sertion of cold tolerance genes) could result in a crop that has a far wider range of adaptation than presently exists.
Acknowledgements
Appreciation is extended to Drs. Edward Richard, Jr., Sarah Lingle, Barry Glaz (USDA-ARS) and Kenneth Gravois (Louisiana State University) for their helpful suggestions in the preparation of this manuscript.
References
Alexander, A.G. (1985) The Energy Cane Alternative. Sugar Series, Vol. 6. Elsevier, Amsterdam.
Alexander, A.G. (1991) High energy cane. In: J.H. Payne (Ed.), Cogeneration in the Cane Sugar Industry. Elsevier, New York, pp. 233–242.
Amalraj, V.A. and Balasundaram, N. (2005) On the taxonomy of the members of ‘Saccharum complex’. Genet. Resour. Crop Evol. 53, 35–41.
Beeharry, R.P. (1996) Extended sugarcane biomass utilisation for exportable electricity pro-duction in Mauritius. Biomass Bioenergy 11, 441–449.
Genetic Improvement of Sugarcane (Saccharum spp.) as an Energy Crop 269
Berding, N. and Roach, B.T. (1987) Germplasm collection, maintenance, and use. In: D.J. Heinz (Ed.), Sugarcane Improvement Through Breeding. Elsevier, New York, pp. 143–210.
Berding, N. and Hurney, A.P. (2005) Flowering and lodging, physiological-based traits affect-ing cane and sugar yield. Field Crops Res. 92, 261–275.
Bhat, S.R. and Gill, S.S. (1985) The implications of 2n gametes in nobilization and breeding of sugarcane. Euphytica 34, 377–384.
Breaux, R.D. (1984) Breeding to enhance sucrose content of sugarcane in Louisiana. Field Crops Res. 9, 59–67.
Bremer, G. (1923) A cytological investigation of some species and species hybrids within the genus Saccharum. Genetica 5, 97–148, 273–326.
Brown, J.S., Schnell, R.J., Power, E.J., Douglas, S.L. and Kuhn, D.N. (2007) Analysis of clonal germplasm from five Saccharum species: S. barberi, S. robustum, S. officinarum, S. sinense and S. spontaneum. A study of inter- and intra species relationships using microsa-tellite markers. Genet. Res. Crop Evol. 54, 627–648.
Cai, Q., Aitken, K.S., Deng, H.H., Chen, X.W., Fu, C., Jackson, P.A. and McIntyre, C.L. (2005) Verification of the introgression of Erianthus arundinaceus germplasm into sugar-cane using molecular markers. Plant Breed. 124, 322–328.
Clements, H.F. (1980) Sugarcane Crop Logging and Crop Control: Principles and Practices. University Press of Hawaii, Honolulu.
Coombs, J. (1984) Sugar-cane as an energy crop. Biotechnol. Genetic Engin. Rev. 1, 311–345. Cuenya, I. and Mariotti, J.A. (1986) Selection of sugarcane for quality components and ripen-
ing ability. Proc. Int. Soc. Sugar Cane Technol. 19, 429–439. Daniels, J. and Roach, B.T. (1987) Taxonomy and evolution. In: D.J. Heinz (Ed.), Sugarcane
Improvement Through Breeding. Elsevier, New York, pp. 7–84. Dawson, L. and Boopathy, R. (2007) Use of post-harvest sugarcane residue for ethanol pro-
duction. Bioresour. Technol. 98, 1695–1699. D'Hont, A., Grivet, L., Feldmann, P., Rao, P.S., Berding, N. and Glaszmann, J.C. (1996)
Characterization of the double genome structure of modern sugarcane cultivars (Saccha-rum spp.) by molecular cytogenetics. Mol. Gen. Genet. 250, 405–413.
D'Hont, A., Paulet, F. and Glaszmann, J.C. (2002) Oligoclonal interspecific origin of 'North Indian' and 'Chinese' sugarcanes. Chromosome Res. 10, 253–262.
Dunckelman, P.H. and Breaux, R.D. (1972) Breeding sugarcane varieties for Louisiana with new germplasm. Proc. Int. Soc. Sugar Cane Technol. 14, 233–239.
Engard, C.J. and Larsen, N. (1948) Floral development in sugarcane. Hawaii Agric. Exp. Stn. Biennial Rep. 1946–1948, pp. 125–132.
Giamalva, M.J., Clarke, S.J. and Stein, J.M. (1984) Sugarcane hybrids of biomass. Biomass 6, 61–68.
Gravois, K.A., Bischoff, K.P. and Kimbeng, C.A. (2006) The rise and fall of a monoculture. Sugar J. 69, 18–20.
Hatch, M.D. and Slack, C.R. (1966) Photosynthesis in sugarcane leaves: a new carboxylation reaction and the pathway of sugar formation. Biochem. J. 101, 103–111.
Heinz, D.J. (1967) Wild Saccharum species for breeding in Hawaii. Proc. Int. Soc. Sugar Cane Technol. 12, 1037–1043.
Hodkinson, T.R., Chase, M.W. and Renvoize, S.A. (2002) Characterization of a genetic re-source collection for Miscanthus (Saccharinae, Andropogoneae, Poaceae) using AFLP and ISSR PCR. Ann. Bot. 89, 627–636.
Hogarth, D.M., Wu, K.K. and Heinz, D.J. (1981) Estimating genetic variance in sugarcane using a factorial cross design. Crop Sci. 21, 21–25.
Edmé, S.J., Miller, J.D., Glaz, B., Tai, P.Y.P. and Comstock, J.C. (2005) Genetic contribution to yield gains in the Florida sugarcane industry across 33 years. Crop. Sci. 45, 92–97.

270 Tew and Cobill
Hogarth, D.M., Cox, M.C. and Bull, J.K. (1997) Sugarcane improvement: past achievements and future prospects. In: M.S. Kang (Ed.), Crop Improvement for the 21st Century. Re-search Signpost, Trivandrum, India, pp. 29–56.
Irvine, J.E. and Benda, G.T.A. (1979) Genetic potential and restraints in Saccharum as an energy source. Symposium on Alternate Uses of Sugarcane for Development in Puerto Rico. San Juan, P.R. (26 Mar 1979).
Irvine, J.E. (1999) Saccharum species as horticultural classes. Theor. Appl. Genet. 98, 186–194.
Jackson, P. (1994) Genetic relationships between attributes in sugarcane clones closely related to Saccharum spontaneum. Euphytica 79, 101–108.
James, N.I. (1980) Sugarcane. In: W.R. Fehr and H.H. Hadley (Eds.), Hybridization of Crop Plants. Am. Soc. Agron., Madison, pp. 617–629.
James, G.L. (2004) Sugarcane. Blackwell, Oxford. Jenkins, B.M., Baxter, L.L., Miles Jr., T.R. and Miles, T.R. (1998) Combustion properties of
biomass. Fuel Proces. Technol. 54, 17–46. Kang, M.S., Miller, J.D. and Tai, P.Y.P. (1983) Genetic and phenotypic path analysis and
heritability in sugarcane. Crop Sci. 23, 643–647. Kennedy, A.J. (2000) Building parental populations with very high sucrose content through
recurrent selection. Breeding and Germplasm Workshop. Int. Soc. Sugar Cane. Technol. Barbados (http://www.issct.org/bridabs.htm).
Kennedy, A.J. (2005) Breeding improved cultivars for the Caribbean by utilization of total biomass production. Proc. Int. Suc. Sugar Cane Tech. 25, 491–499.
Kortschak, H.P., Hartt, C.E. and Burr, G.O. (1965) Carbon dioxide fixation in sugarcane leaves. Plant Physiol. 40, 209–213.
Legendre, B.L. and Burner, D.M. (1995) Biomass production of sugarcane cultivars and early-generation hybrids. Biomass Bioenergy 8, 55–61.
Lima, M.L.A., Garcia, A.A.F., Oliveira, K.M., Matsuoka, S., Arizono, H., de Sousa, C.L. and de Sousa, A.P. (2002) Analysis of genetic similarity detected by AFLP and coefficient of parentage among genotypes of sugar cane (Saccharum spp.). Theor. Appl. Genet. 104, 30–38.
Lingle, S.L., Tew, T.L., Viator, R.P. and Johnson, R.M. (2006) How much has recurrent selection increased sucrose yield in sugarcane? CCSA 51st Annual Meeting. Sect. 57-4 (abstract).
Lo, C.C., Chen, Y.H., Huang, Y.J. and Shih, S.C. (1986) Recent progress in Miscanthus nobi-lization program. Proc. Int. Soc. Sugar Cane Technol. 19, 514–521.
Loomis, R.S. and Williams, W.A. (1963) Maximum crop productivity: an estimate. Crop. Sci. 3, 67–72.
Macedo, I.C., Leal, M.R.L.V. and da Silva, J.E.A.R. (2004) Assessment of greenhouse gas emissions in the production and use of fuel ethanol in Brazil. Sao Paulo. (http://www.unica.com.br/i_pages/files/pdf_ingles.pdf).
Macedo, I.C. (2005) Sugar Cane’s Energy – Twelve Studies on Brazilian Sugar Cane Agri-business and its Sustainability, UNICA, Brazil.
Mangelsdorf, A.J. (1946) Sugar-cane breeding in Hawaii. Part I – 1778–1920. Hawaii. Plant. Rec. 50, 141–160.
Matsuo, K., Chuenpreecha, T., Matsumoto, N. and Ponragdee, W. (2006) Eco-physical char-acteristics of Erianthus spp. and yielding abilities of three forages under conditions of cat-tle feces application. JIRCAS Working Report No. 30.
McKendry, P. (2002) Energy production from biomass (part 1): overview of biomass. Biore-source Technol. 83, 37–46.
Miller, J.D. (1977) Combining ability and yield component analyses in a five-parent diallel cross in sugar cane. Crop Sci. 17, 545–547.

Genetic Improvement of Sugarcane (Saccharum spp.) as an Energy Crop 271
Milligan, S.B., Gravois, K.A., Bischoff, K.P. and Martin, F.A. (1990) Crop effects on broad-sense heritabilities and genetic variances on sugarcane yield components. Crop Sci. 30, 344–349.
Ming, R., Moore, P.H., Wu, K.K., D’Hont, A., Tew, T.L., Mirkov, T.E., da Silva, J., Schnell, R.J., Brumbley, S.M., Lakshmanan, P., Jifon, J., Rai, M., Comstock, J.C., Glaszmann, J.C. and Paterson, A.H. (2006) Sugarcane improvement through breeding and biotechnology. Plant Breed. Rev. 27, 17–118.
Moore, P.H. (1987) Anatomy and morphology. In: D.J. Heinz (Ed.), Sugarcane Improvement Through Breeding. Elsevier, New York, pp. 85–142.
Moore, P.H. and Nuss, K.J. (1987) Flowering and flower synchronization. In: D.J. Heinz (Ed.), Sugarcane Improvement Through Breeding. Elsevier, New York, pp. 273–311.
Moore, P.H., Botha, F.C., Furbank, R. and Grof, C. (1997) Potential for overcoming physio-biochemical limits to sucrose accumulation. In: B.A. Keating and J.R. Wilson (Eds.), In-tensive Sugarcane Production: Meeting the Challenges Beyond 2000. CAB Int., Walling-ford, U.K., pp. 141–155.
Mrini, M., Senhaji, F. and Pimentel, D. (2001) Energy analysis of sugarcane production in Morocco. Environ. Develop. Sustain. 3, 109–126.
Muchow, R.C., Spilman, M.F., Wood, W.W. and Thomas, M.R. (1994) Radiation interception and biomass accumulation in a sugarcane crop under irrigated tropical conditions. Aus. J. Agr. Res. 45, 3–49.
Mukherjee, S.K. (1950) Search for wild relatives of sugarcane in India. Int. Sugar J. 52, 261–262.
Mukherjee, S.K. (1957) Origin and distribution of Saccharum. Bot. Gaz. 119, 55–61. Osgood, R.V. (2003) Cane planter, sugarcane yield and record yield. Sugar J. 66, 7. Panje, R.R. and Babu, C.N. (1960) Studies in Saccharum spontaneum. Distribution and geo-
graphical association of chromosome numbers. Cytologia 25, 152–172. Panje, R.R. (1972) The role of Saccharum spontaneum in sugarcane breeding. Proc. Int. Soc.
Sugar Cane Technol. 14, 217–223. Payne, J.H. (1991) Cogeneration in the cane sugar industry. Elsevier, New York. Pellegrini, L.F. and de Oliveira Jr., S. (2007) Exergy analysis of sugarcane bagasse gasifica-
tion. Energy 32, 314–327. Pimentel, D. and Patzek, T. (2007) Ethanol production: energy and economic issues related to
U.S. and Brazilian sugarcane. Nat. Resour. Res. 16, 235–242. Rao, P.S. and Kennedy, A. (2004) Genetic improvement of sugarcane for sugar, fibre and
biomass. Ministry of Agriculture and Rural Development, Barbados, National Agric. Conf. [http://www.agriculture.gov.bb/default.asp?V_DOC_ID=1639].
Richard Jr., E.P., (1999) Management of chopper harvester-generated green cane trash blan-kets: a new concern for Louisiana. Proc. Inter. Soc. Sugar Cane Technol. 23, 52–62.
Roach, B.T. (1978) Utilization of Saccharum spontaneum in sugarcane breeding. Proc. Int. Soc. Sugar Cane Technol. 16, 43–58.
Salassi, M.E. and Breaux, J.B. (2005) Allocation of sugarcane planting costs in 2005. Staff Report No. 2005-01. LSU AgCenter, Baton Rouge. [http://www.agecon.lsu.edu/Exten-sion_Pubs/Allocation%20of%20Sugarcane%20Planting%20Costs%20in%202005.pdf].
Samuels, G. (1986) Growing sugarcane as a renewable energy crop. Soil and Crop Sci. Soc. Fla. Proc. 45, 103–105.
Shang, K.C., Juang, P.Y., Chu, T.L. and Huang, S.T. (1969) A study on the transmission of some important characteristics of Taiwan originated wild cane Saccharum spontaneum L. Proc. Int. Soc. Sugar Cane Technol. 13, 968–974.
Shapouri, H., Salassi, M. and Fairbanks, J.N. (2006) The economic feasibility of ethanol production from sugar in the United States. OEPNU/OCE/USDA/LSU Report.

272 Tew and Cobill [http://louisianalawnandgarden.org/NR/rdonlyres/0EF2C03C-1C69-455E-AB51-C16D165C2F41/28608/EthanolSugarFeasibilityReport3Julyreleasedcopy.pdf].
Simmonds, N.W. (1976) Sugarcane. In: N.W. Simmonds (Ed.) Evolution of Crop Plants. Longmans, London, pp. 104–108.
Sreenivasan, T.V. (1987) Cytogenetics. In: D.J. Heinz (Ed.), Sugarcane Improvement Through Breeding. Elsevier, New York, pp. 211–253.
Stevenson, G.C. (1965) Genetics and Breeding of Sugar Cane. Longman, London. Stricker, J.A., Prine, G.M., Anderson, D.L., Shibles, D.B. and Riddle, T.C. (1993) Energy
from crops: production and management of biomass/energy crops on phosphatic clay in central Florida. Circular 1084. Fla. Coop. Ext. Serv., U. Florida. [http://edis.ifas.ufl. edu/EH213].
Sugimoto, A., Ponragdee, W., Sansayawichai, T., Kawashima, T., Thippayarugs, S., Suriyaphan, P., Matsuoka, M., Lerdprasertrat, K. and Pramanee, P. (2002). Collecting and evaluating of wild relatives of sugarcane as breeding materials of new type sugarcane cul-tivars of cattle feed in northeast Thailand. JIRCAS Working Report 55–60.
Tew, T.L. (1987) New varieties. In: D.J. Heinz (Ed.), Sugarcane Improvement Through Breeding. Elsevier, New York, pp. 559–594.
Tew, T.L. (2003) World sugarcane variety census – year 2000. Sugar Cane International March/April, pp. 12–18.
Viator, R.P., Johnson, R.M., Grimm, C.C. and Richard Jr., E.P. (2006) Allelopathic, autotoxic, and hormetic effects of postharvest sugarcane residue. Agron J. 98, 1526–1531.
Walker, D.I.T. (1972) Utilization of noble and Saccharum spontaneum germplasm in the West Indies. Proc. Int. Soc. Sugar Cane Technol. 14, 224–232.
Walter, A., Dolzan, P. and Piacente, E. (2006) Biomass energy and bio-energy trade: historic developments in Brazil and current opportunities. Country Report: Brazil – Task 40 – Sus-tainable Bio-energy Trade; Securing Supply and Demand. State University of Campinas, Campinas, Brazil.
Xavier, R.M. (2007) The Brazilian ethanol experience. Competitive Enterprise Institute, Washington DC. [http://www.cei.org/pdf/5774.pdf].

10 Miscanthus: Genetic Resources and Breeding Potential to Enhance Bioenergy Production
John Clifton-Brown,1 Yu-Chung Chiang2 and Trevor R. Hodkinson3
1
2 Department of Life Sciences, National Pingtung University of Science and Technology, Pingtung, Taiwan 912
3 Botany Department, School of Natural Sciences, Trinity College Dublin, Dublin 2, Ireland
10.1 Introduction
W. Vermerris (ed.), Genetic Improvement of Bioenergy Crops, DOI: 10.1007/978-0-387-70805 -8_10, © Springer Science+Business Media, LLC 2008
Bioenergy and Biorenewables Programme, Institute of Biological, Environmental & Rural Sciences (IBERS) Aberystwyth University, Gogerddan Aberystwyth, SY233EB
The genus Miscanthus Anderss. comprises about a dozen grass species that are closely related to sugarcane. Two tall species in particular – M. sacchariflorus (Maxim.) Hack and M. sinensis Anderss. and their hybrids – are receiving consider-able attention as potential bioenergy crops because of their ability to produce very high yields of biomass, with heights up to 7 m and predicted dry matter yields under optimal conditions as high as 45 Mg ha–1 yr–1. Miscanthus is also attractive because it is perennial. This means the plants translocate minerals to the rhizomes at the end of the growing season, reducing the amount of fertilizer needed to obtain good bio-mass yields. An additional attractive feature of Miscanthus is that it is adapted to a wide range of climates and soils, a reflection of the wide geographic adaptation of several Miscanthus species in East Asia, the region of origin of this genus. Photosyn-thesis in Miscanthus has been shown to be much less sensitive to cool weather than other C4 species, such as maize. Despite these promising features, growing and processing Miscanthus for bio-energy production is still in its infancy. Genetic improvement of Miscanthus is feasi-ble, especially because of the great and largely untapped genetic diversity, but is complicated by the fact that it is not easy to make controlled crosses. Furthermore, establishment of sterile Miscanthus hybrids relies on the preparation and planting of rhizomes with the use of custom-built farm machinery, and this process is labor intensive and therefore costly. This chapter will provide a detailed description of the taxonomy and origin of Miscanthus, and of the opportunities and challenges associated with improving Mis-canthus as a dedicated bioenergy crop.

274 Clifton-Brown, Chiang and Hodkinson
10.2 Botanical Description of Miscanthus
The name Miscanthus derives from the Greek mischos (pedicel) referring to its inflo-rescence that has spikelets borne in pairs with both being pedicellate, and anthos referring to ‘flower’. Miscanthus species are all perennials with erect cane-like stems up to 7 m tall (in M. lutarioriparius L. Liu ex Renvoize & S. L. Chen), generally growing from a rhizomatous base, but sometimes tufted. The inflorescence is termi-nal and consists of a cluster of plumose racemes bearing awned or awnless, paired spikelets. The inflorescence axis may be short and the inflorescence subdigitate with long racemes (as commonly found in M. sinensis) or the axis may be long and bear short racemes (as commonly found in M. floridulus (Labill.) Warb. ex K. Schum. & Lauterb.). Taxonomically, Miscanthus is classified with several other species of high eco-nomic value such maize (Chapter 7), sorghum (Chapter 8) and sugarcane (Chapter 9), in the predominantly tropical grass tribe Andropogoneae. Within this tribe it is placed in subtribe Saccharinae (Clayton and Renvoize 1986; Hodkinson et al. 2002a) which also contains Eriochrysis P. Beauv., Eulalia Kunth, Eulaliopsis Honda, Ho-mozeugus Stapf., Imperata Cyr., Lophopogon Hack., Microstegium Nees, Pogo-natherum P. Beauv., Polytrias Hack., Saccharum L. (sugarcane) and Spodiopogon Trin. Miscanthus species are unusual among the Andropogoneae because they pos-sess bisexual paired spikelets (both with hermaphrodite florets). Other Andropo-goneae have paired spikelets but, with the exception of a few genera such as Ischae-mum L. and Schizachyrium Nees, one of these is usually male or sterile. Miscanthus sensu lato (s.l.: in a broad sense) contains approximately 14–20 spe-cies (Hodkinson et al. 1997; Scally et al. 2001), but its genetic limits have been re-evaluated using molecular phylogenetics (Hodkinson et al. 2002a). DNA sequence (Hodkinson et al. 2002a) and fingerprinting (Hodkinson et al. 2002b) data showed that many species included in Miscanthus s.l. are more closely allied to other genera than Miscanthus. On the basis of these and other recent taxonomic analyses (Chen and Renvoize 2006; Ibaragi 2003; Ibaragi and Oshashi 2004), Miscanthus sensu stricto (s.s.) can be defined as containing approximately 11–12 species:
• M. floridulus (Labill.) Warb. • M. intermedius (Honda) Honda • M. longiberbis Nakai • M. lutarioparius • M. oligostachyus Stapf. • M. paniculatus (B. S. Sun) Renvoize & S. L. Chen • M. sacchariflorus (Maxim.) Hack. • M. sinensis Anderss. • M. tinctorius (Steud.) Hack. • M. transmorrisonensis Hayata • the hybrid M. ×giganteus Greef & Deuter ex Hodkinson and Renvoize • Miscanthus sinensis ssp. condensatus (Hackel) T. Koyama

Miscanthus: Genetic Resources and Breeding Potential 275
The latter species is sometimes recognized at specific rank as M. condensatus. All these species are characterized by a basic chromosome number of 19. The other species previously included in Miscanthus are better placed in several other genera including Diandranthus L. Liu, Miscanthidium Stapf and Sclerostachya A. Camus (Hodkinson et al. 2002a) and have differing basic chromosome numbers (Hodkinson et al. 2002c). Taxonomists disagree about the stability of certain phenotypic traits used in diag-nosis such as hair length and leaf size (Ibaragi and Oshashi 2004; Lee 1964a,b,c) and synonymy is a large problem in the genus. To illustrate the problem of synonymy, we can study the list of species names given in ‘The International Plant Names In-dex’ (IPNI 2007). Over 60 Miscanthus species are listed but we recognize only 11–12 of these to be valid names under Miscanthus s.s. Molecular DNA characters have therefore provided a suitable alternative to morphological traits in taxonomy (Hod-kinson et al. 2002a,b) and are helping to resolve other taxonomic issues such as synonymy.
Miscanthus s.s. is native to eastern or south-eastern Asia (Fig. 10.1) and pre-sumably originated somewhere in this broad area. Its natural geographic range ex-tends from northeastern Siberia, 50°N in the temperate zone to Polynesia 22°S, in the tropical zone, westwards to central India and eastwards to Polynesia. It is therefore found in a wide range of climatic zones and biomes. For example, in the Taiwanese islands, Miscanthus species are widely distributed from the coast up to high moun-tain areas above 3,000 m in elevation. They are widely adapted to different habitats from agricultural grasslands, dry grassland and even wet, saline, and polluted land
Three Miscanthus species have been identified as having the highest potential for biomass production (Jones and Walsh 2001). These are M. ×giganteus, M. sacchari-florus, and M. sinensis. Miscanthus ×giganteus has been wrongly called M. sinensis ‘Giganteus’, M. giganteus, M. ogiformis Honda and M. sacchariflorus var. brevibar-bis (Honda) Adati. It is sometimes confused with M. sacchariflorus as this species is so variable in morphology. Miscanthus ×giganteus Greef et Deuter (Greef and Deu-ter 1993) is an illegitimate name under the rules of the International Code of Botani-cal Nomenclature (Greuter et al. 2000) because a type was not specified nor a Latin description given (Hodkinson and Renvoize 2001). Hodkinson and Renvoize (2001) rectified this by providing a type specimen and Latin description and correctly pub-lished the name as Miscanthus ×giganteus Greef et Deuter ex Hodkinson & Renvo-ize. They chose to keep the species epithet ‘×giganteus’ to prevent confusion in the literature but have updated the authority accordingly. The origin and history of M. ×giganteus is discussed later in the genetics section of this chapter. Several subspecies of M. sacchariflorus and M. sinensis have been described and a high number of varieties and horticultural cultivars of these two species have also been described (Hodkinson et al. 2002b; IPNI 2007). Miscanthus sacchariflorus and M. sinensis can hybridize (Adati and Shiotani 1962; Hodkinson et al. 2002c) and form a species complex. This complex is considered to be the source of high yielding plants suitable for biomass production. Miscanthus floridulus can also achieve high biomass and may be suitable for more southerly regions of the northern hemisphere.

276 Clifton-Brown, Chiang and Hodkinson (Chiang 1993). Selection in these habitats has resulted in various ecotypes (Chou et al. 2001). Some Miscanthus species such as M. floridulus generally grow best at sea level in tropical conditions but others such as M. paniculatus can tolerate temperate and/or high altitude conditions up to altitudes of up to 3,100 m on dry mountain slopes in Guizhou, Sichuan and Yunnan of China (Chen and Renvoize 2006).
Fig. 10.1. Geographical distribution of the major Miscanthus species. M. intermedius is not shown but, like M. oligostachyus and M. tinctorius, is endemic to Japan. The distribution of M. ×giganteus is not fully known but can potentially be found in regions where M. sinensis and M. sacchariflorus overlap (sympatry).
The species M. sinensis has a number of well-documented, morphologically distinct intra-specific taxa. Miscanthus sinensis var. sinensis (Fig. 10.2A) of the Chinese mainland and Japan, has morphological similarity to the related species M. sinensis ssp. condensatus of Taiwan (Fig. 10.2E; see above for a discussion of the taxonomic status of condensatus). Taxa that are distributed in high mountains (var. transmorrisonensis) (Fig. 10.2C), middle-elevation grasslands (var. formosanus)
M. xgiganteus
M. sacchariflorus
M. sinensis
M. longiberbis
M. paniculatus
M. lutarioriparius
M. floridulus
M. transmorrisonensis
M. tinctorius
M. oligostachyus
(potentially occurs in the sympatric zoneof M. sacchariflorus and M. sinensis)

Miscanthus: Genetic Resources and Breeding Potential 277
(Fig. 10.2B), and low elevation wastelands (var. glaber) (Fig. 10.2D) in Taiwan have been described (Hsu 1978). The morphological distinction of Miscanthus sinensis taxa (the M. sinensis complex) could have been caused by range expansion during the postglacial recolonization.
Fig. 10.2. Leaf blade, sheath and ligule of A. M. sinensis var. sinensis, B. M. sinensis var. formosanus, C. M. sinensis var. transmorrisonensis, D. M. sinensis var. glaber, E. M. sinensis ssp. .
Miscanthus is a perennial rhizomatous grass which produces a crop of bamboo-like stems annually. Stands of M. sacchariflorus in China which are cut annually have remained productive for 30 years since the establishment of a cellulose indus-try. Stands of M. sinensis in Japan are harvested for forage and for thatching up to the present day.
condensatus
Using DNA sequencing variations to reconstruct the phylogeny of Miscanthus is a powerful tool to identify the species or infrageneric taxa (Chou et al. 2001; Hod-kinson et al. 2002a; Chiang et al. 2003). Figure 10.3 shows the inferred phylogeny of the M. sinensis complex in Taiwan reconstructed using nucleotide sequences of the non-coding region between trnL and trnF genes of the chloroplast DNA (cpDNA). The monophyly of M. sinensis complex is demonstrated in Fig. 10.3.

278 Clifton-Brown, Chiang and Hodkinson The oldest stands in Europe, of the productive clone M. ×giganteus were estab-lished in the 1960’s in Denmark (U. Jørgenson, pers. comm.). However, consistent annual yield series are not available until biomass trials were established in the late 1980’s and early 1990’s. Data from many European trials indicate that M. ×gigan-teus yields reach a plateau, depending on the site’s environmental conditions, after 2–4 years following establishment. Few trials established in the early 1990’s have been monitored for periods long enough (>10 years) to determine the long term pro-ductive persistence. Yield series from the few trials measured for 10 years or more indicate there is a gradual reduction in productivity in some stands (Jørgenson un-
Fig. 10.3. Neighbor-joining tree, based on Kimura’s (1980) two-parameter distance, of the trnL-trnF intergenic spacer of cpDNA of the Miscanthus sinensis complex in Taiwan. Note: M. condensatus is also known as M. sinensis ssp. .
The basic chromosome number in Miscanthus s.s. is 19 (Adati and Shiotani 1962) and its chromosomes, like other members of Andropogoneae, are small (1–2 μm) in comparison to some other grass tribes. Meiotic and mitotic metaphase chro-mosome photographs of M. floridulus, M. sacchariflorus, M. sinensis, and M. ×gi-ganteus can be seen in Linde-Laursen (1993), Hodkinson and Renvoize (2001), and Hodkinson et al. (2002c). Cytogenetic studies indicate that the basic chromosome number 19 could result from the hybridization of two parental lineages with 10 and 9
condensatus
published; Clifton-Brown et al. 2007). Long-term measurements of other cultivars of Miscanthus are currently unpublished.

Miscanthus: Genetic Resources and Breeding Potential 279
chromosomes, respectively (Adati and Shiotani 1962), but this hypothesis remains to be adequately tested. Miscanthus species range in ploidy from diploid to hexaploid, but are normally diploid or tetraploid (Hodkinson et al. 2001). Miscanthus sinensis is normally diploid (Lafferty and Lelley 1994). However, natural and artificially in-duced polyploids of M. sinensis do exist (Matumura et al. 1985). This has resulted in some polyploid M. sinensis varieties such as the triploid variety known as ‘Goliath’. Miscanthus sacchariflorus is commonly tetraploid, but there are examples of the whole range of ploidy up to hexaploid in this species (Hodkinson et al. 1997). The highly productive M. ×giganteus is an allopolyploid hybrid containing genomes from M. sacchariflorus (as maternal parent) and M. sinensis (Hodkinson et al. 2002c). It could have originated from a cross between an allotetraploid M. sacchariflorus and a diploid M. sinensis (Greef and Deuter 1993; Linde-Laursen 1993; Hodkinson et al. 2002c).
10.3 Agronomic Characteristics and Bioprocessing
In the wild, Miscanthus reproduces through seeds and spreads through lateral rhizo-matous creep. In disturbed environments new clonal plants will result from splitting rhizomes and stem bases. To date, field establishment of Miscanthus through direct sowing has been found unreliable in Europe. This may be due to relatively high thermal requirements for seed germination (typical of a tropical species) and very low seed weight, which means the seed has very little reserve carbohydrates to sus-tain germination in sub-optimal environments. In Europe, most experimental work has concentrated on M. ×giganteus and therefore the agronomic methodologies are mainly developed for this clone. Protocols for planting M. ×giganteus are available online (DEFRA 2001). In brief, the rhizomes are harvested in late winter from ma-ture plants. The rhizomes are divided into pieces using semi-automatic methods to produce propagules between 15 and 50 g fresh weight. Post division, these are kept refrigerated to prevent root growth which would result in the rhizomes clumping together. In the UK efficient machinery has been developed to plant rhizomes at rates above 1 ha h–1 (Fig. 10.4) at a densities varying between 1 and 2 plants m–2 into a well produced tilth (as is standard for sowing cereals). After planting, weeds are typically controlled by the application of a soil-acting herbicide to prevent the germination of weed seedlings. Depending on the weed burden in the soil, it would be normal to apply a further herbicide application pre-emergence in the second year following establishment. The local site conditions and management have a strong impact on the establishment success. At many locations substantial yields can be harvested after the second growing season. In northern Europe the yield building phase lasts typically 3–4 years as the rhizome biomass increases and growth becomes more vigorous. Current practice is to harvest in spring time when the plant has had sufficient time to senesce, translocate nutrients and dry out (Jørgensen 1997). Concurrent yield losses occur with the ripening process. We found average yield loss was 33% of peak autumn yield (Lewandowski et al. 2003). Standard grass management machinery has been found suitable to mow, swath and large bale Miscanthus in northern Europe

280 Clifton-Brown, Chiang and Hodkinson (DEFRA 2001). Practical moisture contents at harvest vary from 20–50% depending on local climatic conditions, genotype and ripening time before harvest. Where needed, accelerated drying in the swath has been achieved by mowing with a mower that breaks the stems every 10 cm and these break points release trapped water.
Fig. 10.4. Planting M. ×giganteus rhizomes (inset) in the UK with a custom-built rhizome planter (Photo of planter courtesy of Steve Croxton, Bical).
Estimates of yield potentials of above-ground biomass for M. ×giganteus in the European Union (EU25) have been made using MISCANMOD (Clifton-Brown et al. 2004; Stampfl et al. 2007). This is a spreadsheet model developed for the prediction of above-ground biomass production from Miscanthus. In brief, it is a physio-logically-based production model where radiation interception and radiation use efficiency (Monteith 1977) are specifically parameterized for M. ×giganteus (Clifton-Brown et al. 2000). To run MISCANMOD a moderate number of crop-specific parameters are combined with climate and soil data. Figure 10.5 was pro-duced from monthly values of European climate data on a 0.5 × 0.5 degree grid, but for model simulations these monthly values were linearly interpolated to produce daily values to drive crop processes determining yield on a daily time step. Peak autumn yield is assumed to occur when the mean air temperature falls below 10°C as crop growth virtually stops at that point (Clifton-Brown and Jones 1997).

Miscanthus: Genetic Resources and Breeding Potential 281
Fig. 10.5. Predicted harvestable Miscanthus yield (Mg DM ha–1) showing national boundaries in the European Union (EU25 shown here). Yield estimates were interpolated from 0.5 × 0.5 climate and soil grids.
10.4 Production and Utilization
Miscanthus is typically large-baled and transported to an industrial facility where the bales may be stored for use on demand. Currently, most Miscanthus in Europe is used in combustion. Straw-burning power stations have been used successfully to combust Miscanthus (e.g. Elean Power Station, Ely, UK). Pure biomass-burning power stations in the UK receive high financial incentives through a scheme of re-newable obligation certificates (ROC). In the short term, while infrastructure to fire biomass is developing, co-combustion with coal is being pioneered by several power generators in the UK: Drax (6,000 MW; Yorkshire, UK) and Aberthaw (operated by npower renewables; 1,500 MW; South Wales, UK).

282 Clifton-Brown, Chiang and Hodkinson Miscanthus development in Europe is being undertaken by a number of coopera-tives. One of the earliest and best known development companies is Bical, which started in 1998. Bical’s business strategy has been to establish contracts between farmers/land owners and power companies. The importance of favorable government policy has been key to the success of this business. Such business is largely depend-ent on favorable grants and subsidies along the whole bioenergy chain as long as fossil fuel prices remain low. The subsidy structure is gradually changing as scale increases. For example, in the UK, the energy crops scheme paid growers £948 ha–1 up to 2006, and it was lowered in 2007 to about £800 ha–1. Bical is currently estab-lishing further business in several continental European countries where predicted Miscanthus yields are high (Fig. 10.4). Other companies with slightly different busi-ness models are also emerging in Europe. A report commissioned by the UK government in 2005 made a number of rec-ommendations to advance the implementation of biomass energy (Gill et al. 2005). This report recommends that each government department should publish ambitious carbon targets for 2010 and 2020 for the use of renewable heat, electricity and com-bined heat and power (CHP) in its buildings, with the direct use of renewable energy being preferred to the indirect use of renewable energy by way of contracts with electricity suppliers. Targets should include schools, hospitals and other buildings in public ownership. The authors argue that this would help public awareness of the technology, would ‘prove principle’ at a variety of different scales and should lead to considerable rural development. In the coming years we also envisage that Miscanthus will provide an important feedstock for second-generation fuels such as ethanol. The recent increase in the U.S. maize prices is attributed to the increasing demand of maize for bio-ethanol produc-tion (Vidal 2007). Miscanthus is expected to provide a cheaper, more sustainable source of cellulose than annual crops such as maize.
10.5 Why Use Miscanthus?
Miscanthus, like maize, has C4 photosynthesis (see Chapter 1). In theory this should increase the efficiency of radiation, nutrient and water utilization (Monteith 1978; Long 1983) above those of C3 plant species. In practice M. ×giganteus often ex-ceeded expectations in physiological studies (Beale and Long 1995; 1997; Beale et al. 1999). Naidu et al. (2003) sought the reasons for the high levels of photosynthesis at low temperature. They discovered that M. ×giganteus could maintain 80% higher photosynthetic quantum yields when grown at 14/11ºC (day/night) than maize. This study showed that the two enzymes involved in photosynthesis, pyruvate orthophos-phate dikinase (PPDK) and Rubisco, were unaffected by low temperatures in M. ×giganteus but were decreased >50% and >30%, respectively, in maize grown under the same conditions. Further in vivo experimentation led to the conclusion that main-tenance of high photosynthetic rates in M. ×giganteus at low temperature, in contrast to Z. mays, is most likely the result of different properties of Rubisco and/or PPDK, reduced susceptibility to photoinhibition, and the ability to maintain high levels of leaf absorptance (the ratio of absorbed to incident radiation) during growth at low

Miscanthus: Genetic Resources and Breeding Potential 283
temperature (Naidu and Long 2004). Recently, an analysis of the temperature effects on fluorescence from Miscanthus indicates that Miscanthus has an alternative sink to CO2 assimilation for photosynthetic reducing equivalents. Farage et al. (2006) postu-late that oxygen reduction occurs via a Mehler reaction, which could act as a mecha-nism for protection of Photosystem II from photo-inactivation and damage.
In addition to increasing energy ratios, perenniality results in significant envi-ronmental benefits. These include erosion control, prevention of leaching (Christian and Riche 1998) and the locking up of more carbon in the rhizosphere (Beuch et al. 2000; Foereid et al. 2004; Hansen et al. 2004). The current limitations with Miscanthus are mostly associated with the high establishment costs of sterile triploid genotypes, which must be propagated vegeta-tively (tissue culture or rhizome division). Considerable progress has been made recently in Europe on reducing the costs of clonal propagation through rhizomes and consequently, costs keep falling each year with increasing planting scales. A further limitation in the eyes of industry is that Miscanthus is a grass, and not a tree. Grasses have typically higher ash contents than woody species. In Miscanthus ×giganteus typical ash contents are 2% depending to some extent on local site condi-tions and the harvest time. At this level the ash content causes some slagging and fouling of standard wood-burning boilers. Since considerable genetic variation in ash content has been found (Lewandowski et al. 2003), selective breeding will certainly reduce ash content.
10.6 Genetics
The genetic resources of Miscanthus have been reviewed in Hodkinson et al. (2001) and are also discussed thoroughly in a series of publications (Hodkinson et al. 2002a,b,c). Studies using DNA sequences from the internal transcribed spacer region of nuclear ribosomal DNA (nrITS) and the plastid (chloroplast) tRNA-leucine (trnL) intron and trnL-F intergenic spacer regions elucidated species inter-relationships in the genus, but were generally unable to resolve many differences between cultivars and varieties of Miscanthus. Isozyme analysis has been applied to assess genetic
From the physiological research described above, it would seem that Miscanthus productivity would exceed that of maize. This is not always the case, since many agronomic factors impact yield. A recent paper describing side-by-side trials on several candidate energy crop species in Germany showed that a variety of ‘energy’ maize had higher energy yields per hectare than M. ×giganteus. These higher yields were achieved, however, at a relatively high input level (Boehmel et al. 2008) and consequently, upon calculation of the energy output:input ratio, Miscanthus was far better than maize. Current estimates of the energy ratio for Miscanthus ×giganteus range between 22 (Lewandowski and Schmidt 2006) and 50 (Lewandowski, pers. comm.), depending on the agronomic methods used. The overall energy ratio is ob-viously sensitive to the productive lifespan. Current estimates vary between 10 and 30 years (Lewandowski et al. 2000). To our knowledge there are no continuously monitored trials older than 15 years, making it impossible at present to make com-plete ‘crop life-span’ analyses of the energy ratio.

284 Clifton-Brown, Chiang and Hodkinson diversity within Miscanthus species (Chou et al., 1987; 1999; von Wuehlisch et al. 1994); and DNA markers were applied by Greef et al. (1997), who used amplified fragment length polymorphisms (AFLP®; Vos et al. 1995) to assess variation in three Miscanthus species. Hodkinson et al. (2002b) used AFLP® and inter-SSR PCR (ISSR) to generate over 1,000 polymorphic markers. The markers distinguished species, infraspecific taxa (varieties and cultivars) and putatively clonal material. They were useful for assessing the species status of certain taxa, such as M. conden-satus and M. yakushimanum, that were not found to be distinct from M. sinensis. Miscanthus transmorrisonensis, an endemic from Taiwan, was however, clearly different from M. sinensis. Iwata et al. (2005) also used AFLP® on Miscanthus to investigate the genetic structure of M. sinensis ssp. condensatus populations on Mi-yake Island, which was devastated by a volcanic eruption in 2000, and they identi-fied three regional groups. This is one of only a few studies that have assessed ge-netic variation in natural populations of Miscanthus.
The plastid genome variation of Miscanthus has also been assessed using DNA sequences of the trnL-F region (Hodkinson et al. 2002a,b,c). A number of different plastid DNA types (haplotypes) could be identified, and these were used to assess phylogenetic relationships of species (Hodkinson et al. 2002a) and the maternal origin of M. ×giganteus (Hodkinson et al. 2002b,c). Plastid DNA is generally mater-nally inherited in grasses and M. ×giganteus was shown to have the plastid type of M. sacchariflorus. The allotriploid M. ×giganteus therefore inherited its plastid DNA – and presumably, by extrapolation, its mitochondrial DNA – from an M. sacchari-florus lineage and its nuclear genomes from both M. sacchariflorus and M. sinensis.
10.6.1 Using Genetic Variation for Breeding
Breeding Miscanthus as an energy crop is in its infancy compared to food crop spe-cies. Miscanthus breeding in Europe for biomass started in the early 1990’s at Tin-plant (Magdeburg, Germany) and a small amount of work was carried out in Sweden at Svalöf Weibull (B. Anderson, personal communication). A Miscanthus breeding program at Aberystwyth (Wales, UK) and Plant Research International (Wage-ningen, the Netherlands), funded by the UK Department for Environment, Food and Rural Affairs (DEFRA), started in April 2004, building on a strong tradition of breeding in perennial rye grass, clover and cereals. Currently we are aware of several new Miscanthus-for-energy breeding programs in the USA and France, which have
The origin and genetic variation of allopolyploid M. ×giganteus have been stud-ied using DNA sequence variation, DNA fingerprinting (AFLP® and ISSR-PCR) and molecular cytogenetic methods (Hodkinson et al. 2002b,c). The allopolyploid origin of M. ×giganteus was shown by nrITS DNA sequencing. Two alleles of the nrITS were discovered in the PCR products of M. ×giganteus. Cloning of these products revealed that one matched M. sinensis and the other matched M. sacchariflorus. The molecular cytogenetic techniques florescent in situ hybridization (FISH) and ge-nomic in situ hybridization (GISH) were then applied to investigate genome organi-zation in Miscanthus, but were unable to differentiate between different parental genomes present in M. ×giganteus, indicating that the two genomes are extremely similar at the repetitive DNA level.

Miscanthus: Genetic Resources and Breeding Potential 285
been stimulated by the recent demands for cutting dependency on fossil fuels and reducing carbon emissions. These new breeding programs are putting a high priority on collection and characterization of diverse germplasm. The wide latitudinal (and altitudinal) distribution of Miscanthus in the Far East (Fig. 10.2) means that it can tolerate a broad range of climates. It should, therefore, be possible to breed varieties for a very wide range of climates world wide. There are many generic issues associated with the collection of germplasm. Firstly, it is necessary to comply with the requirements of the Convention on Bio-logical Diversity (CBD), which was ratified at the Rio de Janeiro World Summit in 1992 and came into force in 1993. This international agreement gives sovereignty to each country over its genetic resources. Other countries wishing to use genetic re-sources endemic to another country must establish partnerships with institutions in the country where germplasm is sought. These partners seek approval from their relevant national or regional authority on the collaboration. Secondly, plants col-lected in the Far East and transferred to other countries are subject to quarantine. There are strict standard operating procedures for the preparation and movement of live plant material between countries. Many of the procedures established by the sugarcane community are applicable to Miscanthus. Quarantined material is subject to testing and inspection by a government approved plant pathologist before it can be released.
Fig. 10.6. Evaluation of phenotypic variability in a wide range of accessions at Aberystwyth. A, B M. sacchariflorus, C. M. sinensis and D. M ×giganteus. Photo taken October 2007.

286 Clifton-Brown, Chiang and Hodkinson In the UK, collection of Miscanthus genetic resources has been ongoing over the past decade (a series of contracts from DEFRA, see Acknowledgements). A national collection of Miscanthus was established as a collaborative project between the Royal Botanic Gardens at Kew and the Agricultural Development Advisory service (ADAS) at Arthur Rickwood. This has been added to at Aberystwyth by germplasm from other sources. Accessions have been planted in nursery fields. Huge phenotypic diversity in a whole suite of traits which are important for both yield and quality has been identified within M. sinensis, which is the most ubiquitous species in Asia (see Fig. 10.1). Miscanthus sacchariflorus has a more limited geographical distribution than M. sinensis (see Fig. 10.1). Nonetheless there is considerable phenotypic varia-tion. Figure 10.6A shows an erect, tall growing, late flowering, thick-stemmed M. sacchariflorus from Japan. These are very desirable traits, but the stem density is too low to achieve really high yields. Figure 10.6B shows a thin-stemmed, short M. sacchariflorus with early senescence. Intermediate phenotypes could be very desir-able for high biomass production. Figure 10.6C shows an early flowering M. sinensis accession from northern Japan (Hokkaido). It has a low canopy height, but its flow-ering stems increase overall plant height by about one third. This genotype has rela-tively narrow stems, which are in part compensated by high stem densities. While yield is limited by the early flowering at Aberystwyth, the quality of the biomass from this genotype (EMI # 15, see Lewandowski et al. (2003)) is good due to its low ash content at harvest. The border to this plot (Fig. 10.6D) shows the hybrid M. ×giganteus which is taller than the non-hybrid plants. Synchronization of flowering between different accessions proves a big challenge for making wide crosses. In M. sinensis flowering time of ten different M. sinensis accessions was accurately predicted by thermal time at five locations in Europe (Clifton-Brown and Lewandowski 2000a). This confirms observations by others that M. sinensis species are day neutral. Flowering induction time in M. sacchariflorus is more complex. Some genotypes appear day length-sensitive, and others appear to require similar conditions to M. sinensis.
0
10
20
30
40
50
60
13/07
20/07
27/07
03/08
10/08
17/08
24/08
31/08
07/09
14/09
21/09
28/09
05/10
12/10
Date in 2006
Flo
we
rin
g (
%)
Fig. 10.7. Percentage flowering of 248 Miscanthus accessions at Aberystwyth during 2006.

Miscanthus: Genetic Resources and Breeding Potential 287
10.6.2 Traits of Interest
10.6.2.1 Drought Tolerance
In addition to phenotyping germplasm, considerable effort in Europe and Taiwan has been invested in assessment of variation at the genetic level. Published studies such as discussed above for taxonomic discrimination of distinct genetic groups can also inform breeders of certain wide crosses which would be interesting to attempt. Molecular techniques currently used in breeding of many crop species are likely to accelerate breeding. Since Miscanthus breeding has been limited, the development of the molecular resources is in its infancy compared to main crops such as wheat. Mapping the genome for interesting traits can be approached in a variety of ways. At Aberystwyth we are developing genetic maps to study flowering time and certain quality traits, including the identification of quantitative trait loci (QTL; see Chapter 6). Molecular markers such as simple sequence repeats (SSRs), single nucleotide polymorphisms (SNPs) and AFLP®s are being used in associating genetic differ-ences with the phenotypes with a view to gene discovery. The breeding program at Aberystwyth is taking a two-pronged approach, namely improving M. sinensis and using improved M. sinensis in interspecific crosses such as the one which gave rise to M. ×giganteus. To evaluate progeny from crosses, seed are sown under glasshouse conditions and the seedlings are transplanted as spaced plants on grids in the field. Trials with M. sinensis typically require 3 years to reach a mature phenotype in a temperate climate. The speed at which outstanding/high per-forming genotypes can be identified limits the rate of breeding progress. Early mor-phometric selection (linking the phenotype of young plants with mature ones) is not reliable. There appears to be an excellent opportunity to use marker-assisted selec-tion. Outstanding individuals are cloned, and planted as plots to test for stand yield, which requires up to 3 years. The breeding cycle for Miscanthus would be compara-ble to perennial ryegrass (Lolium perenne L.), which is typically 15 years.
Miscanthus being a C4 plant has higher water use efficiency than plants with C3 photosynthesis (Beale et al. 1999). However, long periods of drought are serious since they limit the amount of biomass that can be produced and in very extreme cases can lead to plant death when soils are shallow or sandy. Studies in Germany in 1999 during a summer dry spell showed that M. ×giganteus had almost no stomatal control of water loss (Clifton-Brown et al. 2002). In Europe, temperatures during the summer of 2003 were five standard deviations warmer than average and unprece-dented water deficits occurred (Ciais et al. 2005). As anticipated, some stands of M. ×giganteus growing on light sandy soil in central Germany were killed (K.-U. Schwarz and J. Greef, personal communication). Clifton-Brown et al. (2002) also reported considerable genotypic variation in stomatal conductance under drought. One M. sinensis hybrid genotype retained a completely green canopy throughout the drought and this was attributed to strong stomatal regulation of water loss during periods of water deficit. Within the Miscanthus genetic base there is considerable potential to breed genotypes with superior drought tolerance at the same time as maintaining high productivity.

288 Clifton-Brown, Chiang and Hodkinson 10.6.2.2 Frost Tolerance and Low Temperature Growth
Since C4 grasses are of tropical origin, much research effort has focused on the influ-ence of low temperatures (including frost and chilling) on growth. Frost tolerance can be divided into two categories: (i) frost tolerance associated with the over-wintering rhizome in winter, and (ii) frost tolerance of newly emerging shoots in spring. In the early 1990’s several field trials established with M. ×giganteus in Europe failed to survive during the first winter following establishment (Ziegenhagen et al. 1995). Pude et al. (1997) associated the over-winter death of the M. ×giganteus plants to late autumn senescence at a number of sites in Germany. Clifton-Brown and Lewandowski (2000b) quantified significant genotypic variation in the tempera-tures at which young rhizomes were killed and discovered that M. ×giganteus was more susceptible to low temperatures than a M. sinensis hybrid. The temperatures required to initiate growth from the overwintering rhizome and the effects of frost on the newly emerged leaves in spring were reported by Farrell et al. (2006). Considerable genotypic variation in the thermal responses of leaf expan-sion rate of plants already growing was reported by Clifton-Brown and Jones (1997). Useful genotypic variation has been identified in all these temperature-related traits and we have used models to quantify the impact of several of these traits on potential productivity. Resulting information is used to inform breeding decisions.
10.6.2.3 Flowering Time
As shown in Fig. 10.7, there is considerable genotypic variation in flowering time in Miscanthus. Early flowering shortens the effective length of the growing season, thus reducing the quantity that a particular genotype can produce. At many northern sites M. ×giganteus does not flower before the onset of the autumn frosts. Where flower-ing does not occur before the autumn frosts, the onset of senescence and remobiliza-tion of nutrients appears less efficient. Which can result in higher ash contents. Higher ash contents are naturally associated with higher offtakes of growth elements such as nitrogen (N), phosphorus (P) and potassium (K). Late flowering has also been asso-ciated with higher over-winter losses of plants in the first year following planting. We know that flowering time has a very pivotal role in determining the quantity and quality of the harvested biomass and is therefore the subject of a new research pro-posal sponsored by the UK Biotechnology and Biological Sciences Research Council (BBSRC).
10.6.2.4 Composition
The optimum composition of harvested biomass depends on the application to which the biomass is to be put. For combustion it is essential to minimize the moisture, ash and mineral contents because these reduce boiler efficiency (Lewandowski and Ki-

Miscanthus: Genetic Resources and Breeding Potential 289
cherer 1997). For fermentation the organic composition (e.g. lignin, cellulose, hemi-cellulose) will change the total efficiency of conversion from solid to other fuel for-mats. Significant variation in lignin, hemicellulose and cellulose has been recently determined within the SUPERGEN project (funded by the UK Engineering and Physical Sciences Research Council, EPSRC; Hodgson et al., unpublished data). The composition of the harvested biomass is influenced by the harvest time, the genotype, the fertilizer inputs and weather in the months preceding harvest. Harvest time is probably the most important factor, since ripening ensures the death and detachment of leaves (which contain much ash) and allows translocation of the nutri-ents to the overwintering rhizome. Ripening has the benefit of increasing the overall nutrient use efficiency by retaining nutrients within the rhizosphere. Fertilization with a chloride-rich fertilizer (such as potassium chloride) had the highly undesirable effect of raising the Cl content (Clifton-Brown 2007), which upon combustion would lead to acidification and reduced boiler life.
10.6.2.5 Propagation
The emerging Miscanthus industry is currently relying on tissue culture of initial stocks of very high yielding genotypes (usually triploid hybrids) selected from the breeding program. This is followed by rhizomatous propagation to establish near- homogenous fields. These methods are expensive, and high yields and high fossil fuel prices are required to make this economically viable. Establishment from seed is an attractive option, because it has the potential to lower costs considerably. Chris-tian et al. (2005) found that whilst direct seeding (they tested encapsulation, but this did not improve on naked seed) was successful in terms of established plant popula-tion, the methods require further evaluation and refinement before they can be re-garded as alternatives to current commercial methods. More effort is needed to iden-tify genotypes and climates where seed propagation is a viable option.
10.6.2.6 Pests and Diseases
In general, Miscanthus is a robust species with relatively few pests and diseases and exceptional stress tolerance. Indeed Taiwanese and Japanese sugarcane breeders have often hybridized Saccharum with Miscanthus in attempts to increase disease resistance in sugarcane (James 2004). In Asia, Miscanthus spp. are often damaged by stem-boring insects (probably lepidopteran stem borers) which use the internodes to breed their young. If the popu-lations of these insects become very abundant then significant yield losses can occur (JCB, personal observation). Outside Asia there have been reports of several fungal pathogens including Fusa-rium (Thinggaard 1997) and Miscanthus blight (Leptosphaeria spp. and its conidial state Stagonospora spp.) (O'Neill and Farr 1996). These could lead to economic losses, but to date prevalence has been low. The cereal leaf aphid, Rhopalosiphum maidis (Fitch), has been recorded in the UK feeding on Miscanthus spp. It appears to be a problem more in glasshouses than in the field. A large Asian aphid, Melanaphis sorini, has been moving with the horti-
,

290 Clifton-Brown, Chiang and Hodkinson cultural trade in Miscanthus world wide (Halbert 2002) and has been recently re-ported in the UK (Hammon et al. 2006). There are fears that the increased areas of Miscanthus spp. could exacerbate one of the main aphid-transmitted viruses in wheat, particularly the luteovirus Barley Yellow Dwarf Virus (BYDV), by providing more overwintering hosts in key locations (Huggett et al. 1999). Christian et al. (1994) reported on BYDV in Miscanthus. This was an in vitro experiment and to our knowledge this virus has not been observed in the field.
10.7 Future Outlook
The need for non-fossil fuel energy is clear and policies in many countries are now stimulating the development of renewable energy sources, of which biomass is one important contributor to the future renewable energy mix. In selecting an energy crop the ‘bottom line’ will be the energy yield per hectare and the energy output:input ratio. Miscanthus can score highly on both counts. Since Miscanthus is an indige-nous species to such a wide geographic range in Asia, it is reasonable to believe that breeding and selection will provide suitable ‘climate- and soil-matched’ genotypes for most agricultural climates in the world. The current challenges are to find methods to screen germplasm rapidly for the traits that are discussed in the above sections and to create hybrids from parents displaying these traits. Miscanthus for energy is still at an early stage of develop-ment, but experience so far has shown Miscanthus fields for energy may indeed become a common sight.
Acknowledgements
JCB would like to thank Drs. John Valentine and Iain Donnison at Aberystwyth for supporting this work and Prof. Mike Jones for helping with much of the work that we have reported on. This work has benefited from research undertaken under Euro-pean Union contracts JOUB-0069 and AIR-CT92-0294 and DEFRA contracts NFO426 and NFO436. Funding from EPSRC in the UK supports the SUPERGEN initiative. Thanks to Steve Renvoize and Mark Chase who supervised the postdoc-toral work of Trevor Hodkinson (funded by MAFF QA3580 grant) that has been summarized as part of this review.
References
Adati, S. and Shiotani, I. (1962) The cytotaxonomy of the genus Miscanthus and its phylo-genic status. Bull. Fac. Agric. Mie University 25, 1–24.
Beale, C.V. and Long, S.P. (1995) Can perennial C4 grasses attain high efficiencies of radiant energy conversion in cool climates? Plant Cell Env. 18, 641–650.
Beale, C.V. and Long, S.P. (1997) Seasonal dynamics of nutrient accumulation and partition-ing in the perennial C4 grasses Miscanthus×giganteus and Spartina cynosuroides. Bio-mass Bioenergy. 12, 419–428.

Miscanthus: Genetic Resources and Breeding Potential 291
Beale, C.V., Morison, J.I.L. and Long, S.P. (1999) Water use efficiency of C4 perennial grasses in a temperate climate. Agric. Forest Meteorol. 96, 103–115.
Beuch, S., Boelcke, B. and Belau, L. (2000) Effect of the organic residues of Miscanthus × giganteus on the soil organic matter level of arable soils. J. Agron. Crop Sci.-Z. Acker Pflanzenb. 184, 111–119.
Boehmel, C., Lewandowski, I. and Claupein, W. (2008) Comparing annual and perennial energy cropping systems with different management intensities. Agric. Syst. 96, 224–236.
Chen, S.L. and Renvoize, S.A. (2006) Miscanthus. Flora of China 22, 581–583. Chiang, Y.C. (1993) The biochemical tolerance of Miscanthus floridulus populations to lead.
Master’s thesis, Faculty of Sciences, Department of Botany, National Taiwan University, Taipei.
Chiang, Y.C., Schaal, B.A., Chou, C.H., Huang, S., and Chiang, T.Y. (2003) Contrasting selection modes at the ADH1 locus in outcrossing Miscanthus sinensis vs. inbreeding Mis-canthus condensatus (Poaceae). Am. J. Bot. 90, 561–570.
Chou, C.H., Hwang, S.Y, Chang F.C. (1987) Population study of Miscanthus floridulus (La-bill.) Warb. Bot. Bull. Acad. Sin. 28, 247–281.
Chou, C.H., Chiang, Y.C. and Chiang, T.Y. (1999) Within- and between-individual length heterogeneity of the rDNA-IGS in Miscanthus sinensis var. glaber (Poaceae): phyloge-netic analyses. Genome 42, 1088–1093.
Chou, C.H., Chiang, T.Y., Chiang, Y.C. (2001) Towards an integrative biology research: a case study on adaptive and evolutionary trends of Miscanthus populations in Taiwan. Weed Biol. Manag. 1, 81–88.
Christian, D.G., Lamptey, J.N.L., Forde, S.M.D. and Plumb, R.T. (1994) First report of barley yellow dwarf luteovirus on Miscanthus in the United Kingdom. Eur. J. Plant Pathol. 100, 167–170.
Christian, D.G. and Riche, A.B. (1998) Nitrate leaching losses under Miscanthus grass planted on a silty clay loam. Soil Use Manag. 14, 131–135.
Christian, D.G., Yates, N.E. and Riche, A.B. (2005) Establishing Miscanthus sinensis from seed using conventional sowing methods. Ind. Crops Prod. 21, 109–111.
Ciais, P., Reichstein, M., Viovy, N., Granier, A., Ogee, J., Allard, V., Aubinet, M., Buchmann, N., Bernhofer, C., Carrara, A., Chevallier, F., De Noblet, N., Friend, A.D., Friedlingstein, P., Grunwald, T., Heinesch, B., Keronen, P., Knohl, A., Krinner, G., Loustau, D., Manca, G., Matteucci, G., Miglietta, F., Ourcival, J.M., Papale, D., Pilegaard, K., Rambal, S., Seufert, G., Soussana, J.F., Sanz, M.J., Schulze, E.D., Vesala, T. and Valentini, R. (2005) Europe-wide reduction in primary productivity caused by the heat and drought in 2003. Nature 437, 529–533.
Clayton, W.D. and Renvoize, S.A. (1986) Genera graminum, grasses of the world. Kew Bull. Add. Ser. 13, 1–389.
Clifton-Brown, J.C. and Jones, M.B. (1997) The thermal response of leaf extension rate in genotypes of the C4-grass Miscanthus: an important factor in determining the potential productivity of different genotypes. J. Exp. Bot. 48, 1573–1581.
Clifton-Brown, J.C. and Lewandowski, I. (2000a) European Miscanthus Improvement (FAIR3 CT- 96-1392), Final Report, Chapter 9. Mapping the Most Suitable Climatic Zones for Different Miscanthus Genotypes in Europe. University of Hohenheim.
Clifton-Brown, J.C. and Lewandowski, I. (2000b) Overwintering problems of newly estab-lished Miscanthus plantations can be overcome by identifying genotypes with improved rhizome cold tolerance. New Phytol. 148, 287–294.
Clifton-Brown, J.C., Neilson, B.M., Lewandowski, I. and Jones, M.B. (2000) The modelled productivity of Miscanthus x giganteus (GREEF et DEU) in Ireland. Ind. Crops Prod. 12, 97–109.

292 Clifton-Brown, Chiang and Hodkinson Clifton-Brown, J.C., Lewandowski, I., Bangerth, F. and Jones, M.B. (2002) Comparative
responses to water stress in stay-green, rapid- and slow senescing genotypes of the bio-mass crop, Miscanthus. New Phytol. 154, 335–345.
Clifton-Brown, J.C., Stampfl, P. and Jones, M.B. (2004) Miscanthus biomass production for energy in Europe and its potential contribution to decreasing fossil fuel carbon emissions. Global Change Biol. 10, 509–518.
Clifton-Brown, J.C., Breuer, J. and Jones, M.B. (2007) Carbon mitigation by the energy crop, Miscanthus. Global Change Biol. 13, 2296–2307.
DEFRA (2001) Planting and Growing Miscanthus – Best Practice Guidelines. DEFRA. Farage, P., Blowers, D., Long, S. and Baker, N. (2006) Low growth temperatures modify the
efficiency of light use by photosystem II for CO2 assimilation in leaves of two chilling-tolerant C-4 species, Cyperus longus L. and Miscanthus x giganteus. Plant Cell Env. 29, 720–728.
Farrell, A.D., Clifton-Brown, J.C., Lewandowski, I. and Jones, M.B. (2006) Genotypic varia-tion in cold tolerance influences yield of Miscanthus. Ann. Appl. Biol. 149, 337–345.
Foereid, B., de Neergaard, A. and Hogh-Jensen, H. (2004) Turnover of organic matter in a Miscanthus field: effect of time in Miscanthus cultivation and inorganic nitrogen supply. Soil Biol. Biochem. 36, 1075–1085.
Gill, B., MacLeod, N., Clayton, D., Cowburn, R., Roberts, J. and Hartley, N. (2005) Biomass Task Force. Report to (UK) Government. http://www.defra.gov.uk/farm/crops/indus-trial/energy/biomass-taskforce/pdf/btf-finalreport.pdf.
Greef, J.M. and Deuter, M. (1993) Syntaxonomy of Miscanthus x giganteus GREEF et DEU. Angew. Bot. 67, 87–90.
Greef, J.M., Deuter, M., Jung, C. and Schondelmaier, J. (1997) Genetic diversity of European Miscanthus species revealed by AFLP fingerprinting. Genetic Res. Crop Evol. 44, 185–195.
Greuter, W., McNeill, J., Barrie, F.R., Burdet, H.M., Demoulin, V., Figueiras, S., Nicolson, D.H., Silva, P.C., Skog, J.E., Trehane, P., Turland, J. and Hawksworth, D.L. (2000) Inter-national Code of Botanical Nomenclature (Saint Louis Code). Koeltz Scientific Books, Königstein.
Halbert, S.E. (2002) Pest alert; Asian Miscanthus aphid Melanaphis sorini. Triology 41, DPI/ FDACS.
Hammon, R., Reid, S., Matthews, L. and Eyre, D. (2006) Melanaphis sorini. DEFRA plant pest notice 44. www.defra.gov.uk/plant/pestnote/2006/melanaphis.pdf
Hansen, E.M., Christensen, B.T., Jensen, L.S. and Kristensen, K. (2004) Carbon sequestration in soil beneath long-term Miscanthus plantations as determined by C-13 abundance. Bio-mass Bioenergy 26, 97–105.
Hodkinson, T.R., Renvoize, S.A. and Chase, M.W. (1997) Systematics in Miscanthus. Aspect. Appl. Biol. 49, 189–198.
Hodkinson, T.R., Chase, M.W. and Renvoize, S.A. (2001) Genetic resources of Miscanthus. Aspect. Appl. Biol. 65, 239–248.
Hodkinson, T.R. and Renvoize, S. (2001) Nomenclature of Miscanthus ×giganteus (Poaceae). Kew Bull. 56, 759–760.
Hodkinson, T.R., Chase, M.W., Lledo, M.D., Salamin, N. and Renvoize, S.A. (2002a) Phy-logenetics of Miscanthus, Saccharum and related genera (Saccharinae, Andropogoneae, Poaceae) based on DNA sequences from ITS nuclear ribosomal DNA and plastid trnL in-tron and trnL-F intergenic spacers. J. Plant Res. 115, 381–392.
Hodkinson, T.R., Chase, M.W. and Renvoize, S.A. (2002b) Characterization of a genetic resource collection for Miscanthus (Saccharinae, Andropogoneae, Poaceae) using AFLP and ISSR PCR. Ann. Bot. 89, 627–636.
Hodkinson, T.R., Chase, M.W., Takahashi, C., Leitch, I.J., Bennett, M.D. and Renvoize, S.A. (2002c) The use of DNA sequencing (ITS and trnL-F), AFLP, and fluorescent in situ hy-bridization to study allopolyploid Miscanthus (Poaceae). Am. J. Bot. 89, 279–286.

Miscanthus: Genetic Resources and Breeding Potential 293
Hsu, C.C. (1978) Gramineae (Poaceae). In: H.L. Li, T.S. Liu, T.C. Huang, T. Koyama, and C.E. DeVol (Eds.) Flora of Taiwan, 1st edition, Vol. V. pp. 372–783, Epoch Publishing Co., Ltd., Taipei, Taiwan.
Huggett, D.A.J., Leather, S.R., and Walters, K.F.A. (1999) Suitability of the biomass crop Miscanthus sinensis as a host for the aphids Rhopalosiphum padi and Rhopalosiphum maydis, and its susceptibility to the plant luteovirus Barley Yellow Dwarf Virus. Agric. Forest Entomol. 1, 143–149.
Ibaragi, Y. (2003) The taxonomy of Diandranthus (Poaceae). Act Phytotax. Geobot. 54, 1364–7565.
Ibaragi, Y. and Oshashi, H. (2004) A taxonomic study of Miscanthus section Kariyasua (Gramineae). J. Japan. Bot. 79, 4–22.
IPNI (2007) The Plant Names Project. International Plant Names Index. http://www.ipni.org. Iwata, H., Kamijo, T. and Tsumura, Y. (2005) Genetic structure of Miscanthus sinensis ssp.
condensatus (Poaceae) on Miyake Island: implications for revegetation of volcanically devastated sites. Ecol. Res. 20, 233–238.
James, G. (2004) Sugarcane. Blackwell, Oxford. Jones, M.B. and Walsh, M. (2001) Miscanthus – for Energy and Fibre. James and James
(Science Publishers), London. 206pp. Jørgensen, U. (1997) Genotypic variation in dry matter accumulation and content of N, K and
Cl in Miscanthus in Denmark. Biomass Bioenergy 12, 155–169. Kimura, M.J. (1980) A simple method for estimating evolutionary rates of base substitutions
through comparative studies of nucleotide sequences. Mol. Evol. 16, 111–120. Lafferty, J. and Lelley, T. (1994) Cytogenetic studies of different Miscanthus species with
potential for agricultural use. Plant Breed. 113, 246–249. Lee, Y.N. (1964a) Taxonomic studies on the genus Miscanthus: relationships among the
section, subsection and species, part 1. J. Japan. Bot 39, 196–205. Lee, Y.N. (1964b) Taxonomic studies on the genus Miscanthus: relationships among the
section, subsection and species, part 2. J. Japan. Bot 39, 257–265. Lee, Y.N. (1964c) Taxonomic studies on the genus Miscanthus: relationships among the
section, subsection and species, part 3. J. Japan. Bot. 39, 289–298. Lewandowski, I. and Kicherer, A. (1997) Combustion quality of biomass: practical relevance
and experiments to modify the biomass quality of Miscanthus x giganteus. Eur. J. Agro. 6, 163–177.
Lewandowski, I., Clifton-Brown, J.C., Scurlock, J.M.O. and Huisman, W. (2000) Miscanthus: European experience with a novel energy crop. Biomass Bioenergy 19, 209–277.
Lewandowski, I., Clifton-Brown, J.C., Andersson, B., Basch, G., Christian, D.G., Jørgensen, U., Jones, M.B., Riche, A.B., Schwarz, K.-U., Tayebi, K. and Teixeira, F. (2003) Envi-ronment and harvest time affects the combustion qualities of Miscanthus genotypes. Agron. J. 95, 1274–1280.
Lewandowski, I. and Schmidt, U. (2006) Nitrogen, energy and land use efficiencies of miscan-thus, reed canary grass and triticale as determined by the boundary line approach. Agric. Ecosyst. Env. 112, 335–346.
Linde-Laursen, I.B. (1993) Cytogenetic analysis of Miscanthus 'Giganteus', an interspecific hybrid. Hereditas 119, 297–300.
Long, S.P. (1983) C4 photosynthesis at low temperature. Plant Cell Env. 6, 345–363. Matumura, M., Hasegawa, T. and Saijoh, Y. (1985) Ecological aspects of Miscanthus sinensis
var. condensatus, M. x sacchariflorus, and their 3x-, 4x-hybrids. 1. Process of vegetative spread. Research Bulletin of the Faculty of Agriculture, Gifu University 50, 423–433.
Monteith, J.L. (1977) Climate and the efficiency of crop production in Britain. Phil. Trans Royal Soc. B281, 277–294.
294 Clifton-Brown, Chiang and Hodkinson
Monteith, J.L. (1978) Reassessment of the maximum growth rates for C3 and C4 crops. Ex-perim. Agric. 14, 1–5.
Naidu, S.L., Moose, S.P., AL-Shoaibi, A.K., Raines, C.A. and Long, S.P. (2003) Cold toler-ance of C4 photosynthesis in Miscanthus ×giganteus: adaptation in amounts and sequence of C4 photosynthetic enzymes. Plant Physiol. 132, 1688–1697.
Naidu, S.L. and Long, S.P. (2004) Potential mechanisms of low-temperature tolerance of C-4 photosynthesis in : an in vivo analysis. Planta 220, 145–155.
O'Neill, N.R. and Farr, D.F. (1996) Miscanthus blight, a new foliar disease of ornamental grasses and sugarcane incited by Leptosphaeria sp., and its anamorphic state Stagono-spora sp. Plant Dis. 80, 980–987.
Pude, R., Franken, H., Diepenbrock, W. and Greef, J.M. (1997) Ursachen der Auswinterung von einjährigen Miscanthus-Beständen. Pflanzenbauwissenchaften 1, 171–176.
Scally, L., Hodkinson, T. and Jones, M.B. (2001) Origins and Taxonomy of Miscanthus. In: M.B. Jones and M. Walsh (Eds.) Miscanthus – for Energy and Fibre, pp. 1–9. James and James (Science Publishers), London.
Stampfl, P., Clifton-Brown, J.C. and Jones, M.B. (2007) European-wide GIS-based modelling system for quantifying the feedstock from Miscanthus and the potential contribution to re-newable energy targets. Global Change Biol. 13, 2283–2295.
Thinggaard, K. (1997) Study of the role of Fusarium in the field establishment problem of Miscanthus. Acta Agric. Scand. 47, 238–241.
Vidal, J. (2007) Biofuel demand to push up food prices. The Guardian (UK Newspaper), guardian.co.uk/environment ...#8805.
von Wuehlisch, G., Deuter, M. and Muhs, H.-J. (1994) Identifizierung verschiedener Miscanthus sorten mittels isoenzymen. J. Agron. Crop Science. 172, 247–254.
Vos, P.R., Hogers, R., Bleeker, M., Reijans, M., van de Lee, T., Hornes, M., Frijters, A., Pot, J., Kuiper, M. and Zabeau, M. (1995) AFLP: a new technique for DNA fingerprinting. Nucl. Acids Res. 23, 4407–4414.
Ziegenhagen, B., Junge, R. and Muhs, H.-J. (1995) Effects of frost temperatures on early growth of Miscanthus "Giganteus". In: P. Chartier, A.A.C.M. Beenackers, and G. Grassi, (Eds.) Biomass for Energy, Environment, Agriculture and Industry, pp. 565–574. Elsevier, Oxford.
Miscanthus ×giganteus

11 Improvement of Switchgrass as a Bioenergy Crop
Joe Bouton
Samuel Roberts Noble Foundation, Forage Improvement Division, Ardmore, OK 73402, [email protected]
11.1 Introduction
Switchgrass (Panicum virgatum L.) is a widely adapted, perennial C4 grass native to the prairies of North America. Switchgrass was identified by the United States De-partment of Energy (DOE) as its main herbaceous, dedicated energy crop because of its potential for high fuel yields, environmental enhancement characteristics, and ability to grow well on marginal cropland without heavy fertilizing or intensive man-agement. Methods for establishing and managing the crop are well documented and no more difficult than other perennial warm-season grasses. Switchgrass is grown currently for hay, pasture, and conservation uses, but for bioenergy production it will be used mainly as a feedstock for ethanol. Although named cultivars are available, when compared to other high value forages, the species is barely removed from the wild from a crop improvement standpoint. Therefore, potential exists to improve the grass as a biofuel feedstock through breeding, biotechnology, and management re-search. Switchgrass is a highly self-incompatible, out-crossing species, therefore, con-ventional breeding methodologies currently include population improvement with the eventual development of synthetic cultivars, and the possible production of F1 hybrid cultivars. The main traits of interest for switchgrass improvement are yield, improved seedling establishment, and increased feedstock quality. The use of ge-nomic and transgenic technologies is new, and still in the initial stages for the grass. Microsatellite markers are being developed, and an initial framework map and map-ping population are publicly available. Effective modes of tissue culture regeneration are documented, and transformation was successfully achieved using both micropro-jectile bombardment and Agrobacterium protocols. Recent grant awards should continue to advance genomics and transgenic information available to solidify its role as the major dedicated herbaceous energy crop in the USA.
W. Vermerris (ed.), Genetic Improvement of Bioenergy Crops, DOI: 10.1007/978-0-387-70805 -8_11, © Springer Science+Business Media, LLC 2008

296 Bouton 11.2 Rationale for Using Switchgrass as a Bioenergy Crop
The Bioenergy Feedstock Development Program (BFDP) was begun at the DOE’s Oak Ridge National Laboratory in 1978 (McLaughlin and Kszos 2005). For over 25 years, this program sought to select the most promising plant species for use as bio-energy feedstocks. As a result of this process, switchgrass was chosen as the main herbaceous crop for future research due to its high yield, perennial nature, its soil and wildlife enhancing ability, ability to be established from seed, its status as a native grass, and its adaptability to poor soils and marginal cropland. The BFDP-sponsored switchgrass research projects resulted in a reduction of its projected production costs by 25% mainly from documenting the highest yielding, currently available cultivars on a regional basis, from management research that optimized harvest methods and timing, and from fertility studies that minimized nitrogen fertilization (McLaughlin and Kszos 2005). The BFDP-sponsored breeding research developed improved switchgrass cultivars with higher yields. Other re-search on high carbon sequestration in the crop’s below ground biomass also dem-onstrated other indirect but positive benefits for growing the grass. A recent, and extremely important report, was an on-farm evaluation of switch-grass as cellulosic ethanol crop as grown in North and South Dakota and Nebraska (Schmer et al. 2008). Switchgrass was managed as a biomass crop on marginal crop-land on 10 farms in the region. There was great variation in both precipitation and temperature, resulting in yield variation of 5.2–11.1 Mg ha–1. However, switchgrass produced 540% more renewable energy than consumed, produced 93% more bio-mass yield and equivalent net energy when compared to human-made prairies, and its estimated greenhouse gas emissions were 94% lower than that of gasoline. Since this study was initiated in 2000, and genetics and management techniques have been improved since that time, the authors concluded that the energy sustainability and biofuel yield of switchgrass would be further enhanced if this same study was con-ducted today. Finally, due to the high price of oil and tightening supplies of gasoline, the eco-nomic value of switchgrass has increased substantively (Bouton 2007). This situation has opened the door for increased investment into the genetic improvement of the crop as a basic feedstock for the still developing biofuel industry.
11.3 Botanical Description of Switchgrass
Switchgrass is an erect C4 perennial grass that can reach up to 3.0 m in height (Moser and Vogel 1995; Vogel 2004). Most switchgrass genotypes are caespitose (i.e. they grow in small dense clumps) and possess short rhizomes that allow it to form a loose sod over time. It is native and widely adapted to North America, being found grow-ing in the continent from 20° north latitude to almost 60° north latitude (Moser and Vogel 1995) and east of 100° west longitude (Vogel 2004). It is a predominant com-ponent of the North American prairies, and along with indiangrass (Sorghastrum nutans (L.) Nash), and big bluestem (Andropogon gerardii Vitman), compose the “big three” grasses due to their composing the greatest percentage of the species

Improvement of Switchgrass as a Bioenergy Crop 297
found in tall-grass prairies. It is therefore currently seeded and managed as native range or as a component of conservation reserve program (CRP) lands. However, it is also grown as a monoculture for use as highly managed pasture or hay. Switchgrass is an out-crossed species that is highly self-incompatible (Vogel 2004). It possesses a diffuse panicle type seedhead with its spikelets positioned at the end of long branches (Moser and Vogel 1995). Spikelets are two-flowered. The second floret is fertile and this is where the seed is produced, whereas the second is staminate. The lemma and palea are indurate (hard) and adhere tightly to the true seed or caryopsis. Switchgrass possesses a basic chromosome number of 9, and somatic chromo-some numbers range from 2n = 2x = 18 to 2n = 12x = 108 (Hopkins et al. 1996). Among collected ecotypes, tetraploids (2n = 4x = 36) and octoploids (2n = 8x = 72) predominate. There are some reports, however, of naturally occurring hexaploids (2n = 6x = 54) and aneuploids (Brunken and Estes 1975; Moser and Vogel 1995; Hop-kins et al. 1996). Taxonomically, switchgrass is divided into two predominant ecotype groups: lowland and uplands (Brunken and Estes 1975; Porter 1966; Vogel 2004). Lowlands are tall, coarse plants with exceptional biomass yields, and generally found in wet areas with mild winter temperatures. Lowlands are predominantely tetraploids. Up-lands, in contrast, are shorter in stature than lowlands, lower in biomass, mainly collected in drier, colder zones, and are mainly octoploids, although there are some upland tetraploids. Further sub-dividing these groupings (sub-ecotypes) into northern uplands, southern uplands, northern lowlands, and southern lowlands is also reported based on latitudinal adaptation (Casler et al. 2004). Finally, using chloroplast DNA, two distinct cytotypes were also described, L and U, that similarly matched the low-land (L) or upland (U) classifications (Hultquist et al. 1996). Analysis of the se-quence alignments of the chloroplast intron trnL(UAA) in 34 switchgrass accessions revealed a deletion of 49 nucleotides (Δ350–399) in this intron that also appeared to be specific to lowland accessions (Missaoui et al. 2006). These distinct cytotypes should be useful as a DNA marker for the classification of upland and lowland switchgrass germplasm, especially since DNA can be extracted directly from the seed without having to spend time and resources on growing plants, and also to de-termine hybrids between upland and lowland germplasm.
11.4 Management
Like most warm season perennial prairie grasses, switchgrass is difficult to establish from seed due to high seed dormancy, competition from grassy weeds during estab-lishment, and uncontrolled sowing depth which normally results in the seeds getting planted too deep (Moser and Vogel 1995). However, management plans are known and easily available (Moser and Vogel 1995; Vogel 2004; Ball et al. 2007). Switchgrass can tolerate a wide range of soil conditions; from sands to heavy clays and pH values from below 5 to above 7 (Moser and Vogel 1995). It can also produce more yield with limited fertility (only 75 kg N ha–1 applied in this trial) than other warm-season grasses in areas such as the southern Great Plains region of the

298 Bouton USA (Fig. 11.1). The higher yield of the lowland cultivar Alamo compared with the upland cultivar Blackwell also demonstrates the higher yield of the lowland com-pared with the upland types. Another advantage of switchgrass is its better seasonal yield distribution especially for higher spring yields which would be useful to the livestock industry. However, like most high yielding grasses, liming and fertilization will dramatically increase its overall yield (Moser and Vogel 1995). Switchgrass is seeded either in monoculture or in mixtures although its produc-tion is highest as a highly managed monoculture (Moser and Vogel 1995). It is gen-erally sown using a grassland drill and weeds are controlled with labeled pre- and post-emergent herbicides (Moser and Vogel 1995; Vogel 2004).
Fig. 11.1. Annual dry matter yield (kg ha–1) of several warm season grasses at Ardmore, Okla-homa. From J. Rogers, unpublished, Samuel Roberts Noble Foundation.
Cropping with glyphosate-tolerant (a.k.a. Roundup Ready®) soybeans (Glycine max L.) the year before spring planting was recently reported to be a good approach to establishing the crop (Mitchell et al. 2005). Since seedling emergence can be poor due to high seed dormancy, seed is priced and seeded on a pure live seed (PLS) ba-
Improvement of Switchgrass as a Bioenergy Crop 299
sis. PLS is calculated by multiplying percent seed purity by percent germination. The recommended PLS for sowing switchgrass is approximately 5–6 kg PLS ha–1 (Ball et al. 2007). When used in a mixture, it should not be planted as more than 20% of the overall mixture by seed number. Switchgrass does not perform well when harvested too frequently. Therefore, 1–2 cut harvests per annum is usually employed (Moser and Vogel 1995; Vogel 2004). Its yield also varies by region due to rainfall distribution with economic production confined to areas receiving greater than 450 mm of rainfall (Moser and Vogel 1995). Non-irrigated, maximum 1-year yields were reported to be 34.6 Mg ha–1 in replicated performance trials in Alabama, but more commonly, multi-year annual yields were in the range of 9.5–23.0 Mg ha–1 (McLaughlin and Kszos 2005). With irrigation, maximum yields can be more consistently achieved. When managed as pasture and as a component of native range or CRP land, switchgrass is not particularly limited in performance by biotic pests (Ball et al. 2007). This situation will surely change as it produced over large acreages in mono-culture. Herbage feeders such as grasshoppers (Acididae family) and diseases such as panicum mosaic virus, spot blotch (Helminthosporium sativa Pam.), and rust diseases (causal agents Uromyces graminicola Burn. and Puccinia graminis) are already reported to be a problem for growing the species (Moser and Vogel 1995; Vogel 2004). More recently, Bipolaris oryzae was found to be a potential new dis-ease of switchgrass (Krupinsky et al. 2004). It is also bothersome that better estab-lishment is achieved on fumigated land, indicating the crop may be more limited by other biotic pests than previously thought (Bouton 2002). However, at this stage, insecticides and fungicides are currently not used to any extent when establishing and managing switchgrass.
11.5 Bioprocessing
Switchgrass will be processed mainly as a cellulosic feedstock for ethanol production although co-firing with coal is also a possibility (McLaughlin and Kszos 2005). However, at this writing, no one cellulosic process has emerged as a clear bio-processing leader. Some of the first demonstration-scale plants to be funded through the DOE are based on fermentation technologies, although thermo-chemical proc-esses are also being used (http://www.energy.gov/news/4827.htm). As with all bulky biofuel crops, there are many questions surrounding harvest, baling, storage, and transport of the switchgrass biomass (Bransby et al. 1996). In the initial stages, no special equipment is anticipated for harvesting the crop, as conven-tional forage equipment is projected to be used (McLaughlin and Kszos 2005). The main question is whether to use haying or green chopping type equipment. Since most are anticipating using hay equipment, then the question becomes whether to package as large round bales or large square bales? Large square bales have the advantage of ease of stacking for both transport and storage at the pro-cesssing plant. However, round-baling equipment is currently more common among grass farmers in the USA.

300 Bouton Storage and transportation are also important issues for consideration, due to the bulky nature of the harvested crop. If conventional hay making equipment is used, then care must be taken to keep the product out of the weather. This is usually done via storage in pole barns or simply by stacking bales on tires outside and covering them with plastic or tarps. It would seem to be more advantageous to package as square bales rather than round ones, due to the ease of stacking square bales on a flatbed trailer,. However, chopping a dried standing crop into smaller particles via silage type equipment would also allow packing of large amounts of biomass into covered piles on-farm. In that case a front-end loader would be used to place and pack this pile into an open-top trailer with sides that can then be covered during transporting.
11.6 Breeding and Cultivar Development
Although biomass yields for switchgrass vary depending on cultivar, year, and loca-tion (McLaughlin and Kszos 2005), breeding, biotechnology, and management re-search offer a great potential to improve yield, as well as other traits that are ex-pected to add value to its use as a biofuel feedstock. There is also a relatively short list of switchgrass cultivars, and approximately 30% of these do not even require seed production under certification (Alderson and Sharp 1995). The main cultivars in use today are Alamo, Blackwell, Cave-in-Rock, Dacotah, Forestburg, Kanlow, Ne-braska 28, Shawnee, Summer, Sunburst, Pathfinder, and Trailblazer (Berdahl and Redfearn 2007). One can then draw the obvious conclusion that the species is barely removed from the wild from a crop-improvement standpoint, especially when com-pared to corn (Zea mays L.; Chapter 7) and other high-value forage crops such as alfalfa (Medicago sativa L.).
11.6.1 Traits and Breeding Methodology
Previously, the main traits of interest for switchgrass improvement were yield, im-proved seedling establishment, and increased forage digestibility (Vogel 2004). For bioenergy use, high biomass yield and better digestibility will continue to be high priority traits. However, yield must be achieved with low inputs of fertilizer and water, while new cultivars should also possess proper pest resistances especially for the splot blotch, rusts, and virus diseases mentioned above (Section 11.4). Changing cell wall digestibility via increasing neutral detergent fiber (NDF) content and reduc-ing acid detergent lignin (ADL) is likewise possible, leading to an improved biomass feedstock for both fermentation and combustion use (Casler and Boe 2003). Significant phenotypic variation exists within and between existing cultivars and ecotype collections for yield as well as forage quality parameters such as digestibility (Lemus et al. 2002; Casler and Boe 2003; Das et al. 2004; Vogel 2004; Casler 2005). Heritability for biomass yield and digestibility is good, allowing most researchers to predict and/or demonstrate adequate gain from selection, especially when selec-tion was based on half-sib family performance (Talbert et al. 1983; Taliaferro et al. 1999; Vogel 2004; Missaoui et al. 2005a).

Improvement of Switchgrass as a Bioenergy Crop 301
Initial cultivar development centered on accession or ecotype collections that were screened in field trials for performance and geographic adaptation. Seed would be directly increased, followed by the release of the best accession population as a new cultivar (Vogel 2004). Cultivars such as Blackwell and Nebraska 28 were re-leased in this manner. However, since switchgrass is a cross-pollinated perennial species, recent breeding methodologies include population improvement with the eventual development of synthetic cultivars, and the possible production of F1 hybrid cultivars (Taliaferro et al. 1999).
11.6.2 Population Improvement
The basic approach for population improvement is to identify superior individuals from adapted parental populations and inter-mate these to produce the next genera-tion of the population, or to use the selected individuals for producing an experimen-tal synthetic for testing and eventual release as a cultivar (Taliaferro et al. 1999; Vogel 2004; see also Chapter 2). To accomplish this, a parental source such as re-leased cultivars, elite breeder germplasm, regional ecotype collections, or plant in-troductions (PI) are screened for specific traits. Selected individuals are then inter-mated (generally with the polycross procedure) to produce half-sib progeny for test-ing or compositing into breeders seed of an experimental synthetic germplasm. Supe-rior genotypes from these germplasm sources are therefore identified based on their clonal (phenotypic) and/or half-sib progeny (genotypic) performance for the vari-ous traits. This screening and selection may be done on a recurrent basis for at least two cycles. Strain crossing is also used to composite several unique germplasm sources into a single parental germplasm. Recurrent selection in switchgrass can therefore be accomplished on a phenotypic or genotypic basis, based either on a plant’s own performance or the performance of its progeny, respectively (Taliaferro et al. 1999; Vogel 2004). Poor correlation of a plant’s first year’s yield to that of subsequent years indicates the need to base a plant’s phenotypic performance on mature plant yield (probably during the second year). The use of progeny testing (genotypic) to assess a plant’s breeding value is likewise a must. As an example, a population improvement approach based on the above princi-ples was used to develop adaptive, high-yielding switchgrass cultivars for use in bioenergy crop production systems in the southeastern USA (Bouton 2002). The original effort was initiated by randomly selecting 1,000 genotypes from the Alamo and Kanlow cultivars and space planting these into a honeycomb design (Fasoulas and Fasoula 1995; Missaoui et al. 2005b). This design was used because of its ability to remove the effects of micro-environmental variation during assessment of indi-vidual plants by comparing its performance to the neighboring plants in a surround-ing circle (Fig. 11.2). Moving this circle across the nursery allows all plants to be assessed in this manner. The initial data demonstrated that genetic variances for yield were high, especially for the Alamo population, indicating good potential to increase yield within these populations (Bouton 2002). Cuttings of each of these superior genotypes were clonally multiplied in the greenhouse and used in a polycrossing program to produce half-sib progeny of each, and to assess their seed yield. The

302 Bouton highest seed-yielding genotypes were half-sib progeny tested over locations and years. The highest yielding genotypes based on the progeny tests were then selected for inclusion into a new replicated polycross to generate experimental synthetic cul-tivars. Initial performance results of these experimentals demonstrated up to a 33% yield enhancement over Alamo and Kanlow parents when tested over years and locations in Georgia (Bouton 2002; 2004).
Fig. 11.2. Switchgrass plants established in honeycomb design. A plant in the center of the circle is compared to the plants in the surrounding circle.
11.6.3 Hybrids
Switchgrass is highly self-incompatible as a result of two systems that insure cross-pollinated seed is produced. One system is active during pre-fertilization with a sys-tem similar to the S-Z incompatibility system, and the other is a post-fertilization system that prevents inter-mating across ploidy levels (Martinez-Reyna and Vogel 2002). High levels of heterosis were observed when single cross hybrids were made from specific, clonally replicated genotypes (Taliaferro et al. 1999). Clonal replica-tion using tissue culture is also possible for large-scale production of the individual genotypes, which should allow their use in a commercially viable seed production program (Conger 2002). These three characteristics demonstrate the potential for developing high-yielding single-cross hybrids of switchgrass.

Improvement of Switchgrass as a Bioenergy Crop 303
To scale up for commercial seed production using this approach, thousands of switchgrass plantlets are produced through tissue culture of the lower stem nodes from highly self-incompatible parent plants with previous history of high heterosis (Fig. 11.3). These clones are brought to field-ready status within a period of three months. Two superior parent plants propagated in this manner are then placed into isolated breeding blocks with the resultant seed being exclusively F1 hybrids.
Fig. 11.3. Node propagation in switchgrass. The photo on the left shows stem nodes initially placed onto media, whereas the photo on the right shows seedling proliferation from nodes after 6 weeks on media.
11.7 Genomics and Transformation
Genomics research received great public attention with the successful completion of the human genome sequencing project. Plant species soon followed suit, with crops such as rice being sequenced and used as the reference species for the grasses. Se-quencing data, combined with high-throughput machinery and data analysis (e.g. bioinformatics), allows determinations of gene expression (Brummer et al. 2007). From this understanding, new and innovative methods for improving forage and bioenergy crops will evolve. Transgenics involve the movement of specific and useful genes into the crop of choice and is sometimes referred to as genetic engineering (Brummer et al. 2007). Scientists using this approach have already shown success in introducing genes which make many important row crops resistant to insects, viruses, and herbicides. It has also been very useful in creating unique plants that allow basic research to be conducted on physiological and biochemical pathways. Although the use of genomics for basic research purposes is not controversial, there has been great controversy surrounding the use of transformation for forage crop improvement, especially when transferring genes between two unrelated organ-isms (Brummer et al. 2007). This has created a very costly regulatory climate, to go along with inherent costs of obtaining freedom to operate for using the gene and the

304 Bouton enabling technologies. Therefore, cultivar development in forage grasses now in-cludes the new and evolving areas of genomic and transgenic technologies. How-ever, limitations for using the technologies revolve around cost (they are much more expensive than the conventional selection and breeding), freedom to operate for relevant patents, an intense regulatory process, and even public perception of the value and risk of the traits. All these issues will need to be considered before em-barking on an improvement program for any crop, but especially an out-crossing, native species like switchgrass. To this end, McLaughlin and Kszos (2005) summa-rized the preliminary genomics and transgenics research supported by the BFPD for their potential use in switchgrass improvement programs. However, only limited reports are available on switchgrass genomics and transgenics. This is probably because the crop has only been recently investigated in terms of crop improvement.
11.7.1 Genomics and Trait Mapping
Studies on genetic variation via molecular markers (Gunter et al. 1996; Huang et al. 2003; Missaoui et al. 2006) indicated that upland and lowland ecotypes fell into their distinctive ecotype classes regardless of ploidy level. Extensive genetic variation and polymorphism between upland and lowland switchgrass types, as well as within each type, were also observed. Finally, a relatively high genetic identity within popula-tions, and limited evidence of recent hybridizations between the lowland and upland populations, were found. Genomic tools for switchgrass are also limited and need to be developed. There are currently no reports of trait mapping in switchgrass. An EST database and ge-nomic microsatellites are being developed for switchgrass (Tobias et al. 2005) and are a good source of molecular markers. The only publicly available switchgrass genetic map is the tetraploid (2n = 4x = 36) cross between a genotype from the low-land cultivar Alamo and one from the upland cultivar Summer (Missaoui et al. 2005c). It possesses only 102 RFLP markers distributed over eight homoeology groups, but does provide a limited framework map for future mapping. It was also inferred from these results that segregation distortion is very common in switchgrass. Furthermore, the genomic constitution of this species is likely to be an autotetraploid with high degree of preferential pairing between homologous chromosomes (Mis-saoui et al. 2005c). For the future, it will be necessary to construct useable genetic maps of switchgrass and to make them available for the mapping of value-added traits as part of breeding programs. Establishing the relationship of the switchgrass genome with that of rice, for which the genome sequence is available, is also a good approach. The mapping population reported by Missaoui et al. (2005c) was recently ex-panded in size and is currently maintained at the Samuel Roberts Noble Foundation. Microsatellite markers developed from conserved grass (CG), tall fescue (TF) and switchgrass ESTs were assessed on parents and a subset of this mapping population (Saha et al. 2007). The primer amplification varied significantly with 78% of the CG primers and 14% of the TF-EST-SSRs producing clean SSR-type amplification prod-ucts in switchgrass population. On average, each primer pair produced 1.7 fragments. Only 42% of the amplified fragments from both marker systems fell within the ex-

Improvement of Switchgrass as a Bioenergy Crop 305
pected size range (105–450 bases) and the remaining 58% were fragments with higher molecular weight. Polymorphism rates were higher in TF-EST-SSRs (86%) compared to CG-EST-SSRs (79%). Loci segregating in the switchgrass mapping population were grouped as loci segregating from the female parent (55%), the male parent (24%), and both parents (21%).
11.7.2 Tissue Culture and Transformation
Conger (2002) reported on a 10-year BFDP project whose main objective was to develop biotechnology systems useful for switchgrass improvement. In the report, effective modes of regeneration were documented, and the lowland cultivars Alamo and Kanlow were found to be much easier to regenerate from tissue culture than the upland cultivars Blackwell, Cave-in-Rock, and Trailblazer. The most effective method of micro-propagation for clonal replicates for hybrid seed production (see Section 11.6.3 on “Hybrids”) was from the axillary shoots of the lower nodes (Fig. 11.3). Finally, a suspension culture system to regenerate plants by somatic embyro-genesis was developed, and transformation was successfully achieved using both microprojectile bombardment and Agrobacterium protocols. These findings indicate good success can be achieved for future transgenic approaches in switchgrass (McLaughlin and Kszos 2005). In fact, transformation projects with a goal of down-regulation of genes in the lignin pathway are currently underway in several grasses including switchgrass (Wang et al. 2008), using approaches documented previously for the cool-season grass tall fescue, Festuca arundinacea Schreb. (Chen et al. 2003). These projects have the potential to increase the value of switchgrass as a feedstock, especially for fermentation bioprocesses due to ease of digestion of the cellulose and hemicellulose that is normally blocked by lignin.
11.8 Future Outlook and Conclusions
We must also change how we power our automobiles. We will increase our research in better batteries for hybrid and electric cars, and in pollution-free cars that run on hydrogen. We’ll also fund additional research in cutting-edge methods of producing ethanol, not just from corn, but from wood chips and stalks, or switch grass. Our goal is to make this new kind of ethanol practical and competitive within six years. George W. Bush, 2006 State of the Union address (http://www.whitehouse.gov/ news/releases/2006/01/20060131-10.html ). The above quote from the President of the United States, along with the success of the former BFPD program (McLaughlin and Kszos 2005), has positioned switch-grass as one of the major herbaceous bioenergy crops in the USA. Similarly, a recent grant announcement from the DOE-USDA biomass genomics research program includes several projects with switchgrass as the main species (http://genomicsgtl.energy.gov/research/DOEUSDA/) that should likewise advance the improvement of this grass from one of a minor forage crop to one that could rival other major crops in terms of genetics and breeding information.

306 Bouton All biofuel industries will be local, and the primary feedstock grown in a region will be the one capable of fitting a particular region’s current situation. Therefore, for those regions currently growing corn, it will be corn. For areas where timber is grown extensively, the feedstock of choice will be wood chips. For the Great Plains region of the USA, this means herbaceous perennial grasses are the crops of choice due to the importance of and grower’s experience with the current grass-based live-stock systems. Finally, its adaptation throughout most of North America, along with its alternate use for animal pasture and hay production, means the crop has potential for use as a secondary biofuel feedstock in regions where it is not the primary feed-stock. For example, corn farmers would plant corn on their best land and this would be the primary biofuel crop, but they may also plant switchgrass on their more mar-ginal lands as a secondary biofuel crop and/or an alternative hay, pasture, or wildlife habitat crop. The future for switchgrass as a dedicated energy crop is therefore bright, with up to 15 × 106 ha projected to be planted by 2030 in order to meet DOE goals (Bouton 2007).
Acknowledgements
Appreciation is extended to David Bransby (Auburn University), Ken Vogel (USDA-ARS), Mike Casler (USDA-ARS), and Ali Missaoui (University of Georgia) for past discussions on switchgrass improvement and management, to James Rogers and Hem Bhandari (The Samuel Roberts Noble Foundation) for supplying figures and photos for this chapter, and to Donald Wood, Jason Strickland, Jenny Wood (University of Georgia) and Brian Motes (The Samuel Roberts Noble Foundation) for their technical assistance.
References
Alderson, J. and Sharp, W.C. (1995) Grass Varieties in the United States. CRC Press, Inc., Boca Raton, Florida.
Ball, D.M, Hoveland, C.S., and Lacefield, G.D. (2007) Southern Forages, 4th edition. Interna-tional Plant Nutrition Institute, Norcross, Georgia.
Berdahl, J.D. and Redfearn, D.D. (2007) Grasses for arid and semiarid areas. In: R.F. Barnes, C.J. Nelson, K.J. Moore, and M. Collins (Eds.) Forages, 6th Edition, Volume II – The Sci-ence of Grassland Agriculture, Blackwell Publishing, Ames, Iowa, pp. 221–244.
Bouton, J.H. (2002) Bioenergy crop breeding and production research in the southeast. ORNL/SUB-02-19XSV810C/01. (Available online at http://bioenergy.ornl.gov/pdfs/ TMUniv_Georgia_final_report.pdf ). Verified 8 June 2007.
Bouton, J.H. (2004) Improving switchgrass as a bioenergy crop for the southeastern USA. pp. 348–351. Proc. American Forage and Grassland Council (Volume 13). 12–16 June 2004. Roanoke, Virginia.
Bouton, J.H. (2007) The economic benefits of forage improvement in the United States. Euphytica 154, 263–270.

Improvement of Switchgrass as a Bioenergy Crop 307
Bransby, D.I., Sladden, S.E., and Downing, M. (1996) Yield effects on bale density and time required for commercial harvesting and baling of switchgrass. (Available at http://bioenergy.ornl.gov/papers/bioen96/bransby.html). Verified 14 June 2007.
Brummer, E.C., Bouton, J.H., and Sledge, M. (2007) Biotechnology and molecular approaches to forage improvement. In: R.F. Barnes, C.J. Nelson, K.J. Moore, and M. Collins (Eds.) Forages, 6th Edition, Volume II – The Science of Grassland Agriculture, Blackwell Pub-lishing, Ames, Iowa, pp. 439–451.
Brunken, J.N. and Estes, J.R. (1975) Cytological and morphological variation in Panicum virgatum L. Southwestern Naturalist 19, 379–385.
Casler, M.D. (2005) Ecotypic variation among switchgrass populations from the northern USA. Crop Sci. 45, 388–398.
Casler, M.D. and Boe, A.R. (2003) Cultivar x environment interactions in switchgrass. Crop Sci. 43, 2226–2233.
Casler, M.D., Vogel, K.P., Taliaferro, C.M., and Wynia, R.L. (2004) Latitudinal adaptation of switchgrass populations. Crop Sci. 44, 293–303.
Chen, L., Auh, C., Dowling, P., Bell, J., Chen, F., Hopkins, A., Dixon, R.A., and Wang, Z. (2003) Improved forage digestibility of tall fescue (Festuca arundinacea) by transgenic down-regulation of cinnamyl alcohol dehydrogenase. Plant Biotechnol. J. 1, 437–449.
Conger, B.V. (2002) Development of in-vitro systems for Switchgrass (Panicum virgatum). Final Report for 1992–2002. ORNL/SUB-02-11XSY161/01. (Available online at http://bioenergy.ornl.gov/pdfs/ornlsub_02_11xsy16101.pdf ). Verified 4 June 2007.
Das, M.K., Fuentes, R.G., and Taliaferro, C.M. (2004) Genetic variability and trait relation-ships in switchgrass. Crop Sci. 44, 443–448.
Fasoulas, A.C. and Fasoula, V.A. (1995) Honeycomb selection designs. In: J. Janick (Ed.) Plant Breeding Reviews. Volume 13. John Wiley & Sons, New York, pp. 87–139.
Huang, S., Su, X., Haselkorn, R., and Gornicki, P. (2003) Evolution of switchgrass (Panicum virgatum L.) based on sequences of the nuclear gene encoding plastid acetyl –CoA car-boxylase. Plant Sci. 164, 43–49.
Lemus, R., Brummer, E.C., Moore, K.J., Molstad, N.E., Burras, C.L., and Barker, M.F. (2002) Biomass yield and quality of 20 switchgrass populations in southern Iowa, USA. Biomass Bioenerg. 23, 433–442.
Martinez-Reyna, J.M. and Vogel, K.P. (2002) Incompatibility systems in switchgrass. Crop Sci. 42, 1800–1805.
McLaughlin, S.B. and Kszos, L.A. (2005) Development of switchgrass (Panicum virgatum) as a bioenergy feedstock in the United States. Biomass Bioenerg. 28, 515–535.
Missaoui, A.M., Boerma, H.R., and Bouton, J.H. (2005a) Genetic variation and heritability of phosphorus uptake in Alamo switchgrass grown in high phosphorus soils. Field Crops Res. 93, 186–198.
Missaoui, A.M., Fasoula, V.A., and Bouton, J.H. (2005b) The effect of low plant density on response to selection for biomass production in switchgrass. Euphytica 142, 1–12.
Hopkins, A.A., Taliaferro, C.M., Murphy, C.D., and Christian, D’Ann. (1996) Chromosome numbers and nuclear DNA content of several switchgrass populations. Crop Sci. 36, 1192–1195.
Hultquist, S.J., Vogel, K.P., Lee, D.J., Arumuganathan, K., and Kaeppler, S. (1996) Chloroplast DNA and nuclear DNA content variations among cultivars of switchgrass, Panicum virgatum L. Crop Sci. 36, 1049–1052.
Gunter, L.E., Tuscan, G.A., and Wullschleger, S.D. (1996) Diversity of switchgrass based on RAPD markers. Crop Sci. 36, 1017–1022.
Krupinsky J.M., Berdhal J.D., Schoch C.L., and Rossman A.Y. (2004) Leaf spot on switchgrass (Panicum virgatum), symptoms of a new disease caused by Bipolaris oryzae. Can. J. Plant Path. 26, 371–378.

308 Bouton
Moser, L.E. and Vogel, K.P. (1995) Switchgrass, big bluestem, and indiangrass. In: R.F.
Barnes, D.A. Miller, and C.J. Nelson (Eds.) Forages, Vol. 1, An Introduction to Grassland Agriculture. Iowa State University Press, Ames, Iowa, pp. 409–420.
Porter, C.L. (1966) An analysis of variation between upland and lowland switchgrass, Pani-cum virgatum L., in central Oklahoma. Ecology 47, 980–992.
Saha, M.C., Chekhovskiy, K., Narasimhamoorthy, B., and Bouton, J.H. (2007) Cross-species amplification of microsatellite markers in switchgrass. p. 75. Proc. of 29th Symposium on Biotechnology for Fuels and Chemicals, 29 April–2 May 2007, Denver, CO (Available on-line at http://www.simhq.org/meetings/29symp/29fuelsdraft_WEB.pdf ). Verified 4 June 2007.
Schmer, M.R., Vogel, K.P., Mitchell, R.B., and Perrin, R.K. (2008) Net energy of cellulosic ethanol from switchgrass. Proc. Natl. Acad. Sci. USA 105, 464–469.
Talbert, L.E., Timothy, D.H., Burns, J.C., Rawlings, J.O., and Moll, R.H. (1983) Estimates of genetic parameters in switchgrass. Crop Sci. 23, 725–728.
Taliaferro, C.M., Vogel, K.P., Bouton, J.H., McLaughlin, S.B., and Tuskan, G.A. (1999) Reproductive characteristics and breeding improvement potential of switchgrass. In: R.P. Overend and E. Chornet. (Ed.) Biomass – A Growth Opportunity in Green Energy and Value Added Products. Proc. Fourth Biomass Conference of the Americas, Oakland, CA. 29 August—2 September, 1999. Elsevier Science Ltd., Kidlington, Oxford, UK, pp. 147–153.
Tobias, C.M., Twigg, P., Hayden, D.M., Vogel, K.P., Mitchell, R.M., Lazo, G.R., Chow, E.K., and Sarath, G. (2005) Analysis of expressed sequence tags and the identification of asso-ciated short tandem repeats in switchgrass. Theor. Appl. Genet. 111, 956–964.
Vogel, K.P. (2004) Switchgrass. In: L.E. Moser, B.L. Burson, and L.E. Sollenberger (Eds.) Warm-season (C4) Grasses. American Society of Agronomy. Madison, Wisconsin, pp. 561–588.
Wang, Z.Y., Bell, J., Cheng, X., Ge, Y., Ma, X., Wright, E., Xi, Y., Xiao, X., Zhang, J., and Bouton, J. (2008) Transgenesis in forage crops. Proc. Symposium for Molecular Breed-ing of Forage and Turf. 30 June–6 July 2007, Sapporo, Japan (in Press).
Missaoui, A.M., Paterson, A.H., and Bouton, J.H. (2005c) Investigation of genomic organiza-tion in switchgrass (Panicum virgatum L.) using DNA markers. Theor. Appl. Genet. 110, 1372–1383.
Missaoui, A.M., Paterson, A.H., and Bouton, J.H. (2006) Molecular markers for the classifica-tion of switchgrass (Panicum virgatum L.) germplasm and to assess genetic diversity in three synthetic switchgrass populations. Genet. Resources Crop Evol. 53(6), 1291–1302.
Mitchell, R., Vogel, K., Anderson, B., and McAndrew, T.J. (2005) Renovating pastures with glyphosate tolerant soybeans. Plant Management Network. (Available online at http://www.plantmanagementnetwork.org/sub/fg/brief/2005/renovate/glyphosate.pdf). Verified 12 June 2007.

12 Improvement of Perennial Forage Species as Feedstock for Bioenergy
William F. Anderson,1 Michael D. Casler2 and Brian S. Baldwin3 1 USDA-ARS, Crop Genetics and Breeding Research Unit, Tifton, GA,
[email protected] 2 USDA-ARS, U.S. Dairy Forage Research Center, Madison, WI,
[email protected] 3 Plant and Soil Sciences, Mississippi State University, Starkville, MS,
12.1 Introduction
Both native and non-native forage species other than switchgrass are less commonly considered as potential lignocellulosic feedstocks for bioenergy in the United States. These species hold potential as bioenergy feedstocks because of the experience and infrastructure that is already in place for management and harvest, and in certain areas of the country they have greater yield potential than switchgrass or other feed-stocks. The forage grasses consist of temperate cool-season (most commonly C3) grasses as well as tropical or sub-tropical warm-season (C4) grasses. Some legume species may also play a significant role in supplying useful bioenergy feedstocks. Most have been researched and used as a pasture or hay crop and are currently grown over millions of hectares of fertile as well as Conservation Reserve Program (CRP) land throughout the United States. Research on genetic variability and breeding systems has revealed great potential in improving these crops for bioenergy. How-ever, research on the majority of these species has only recently begun concerning the potential as a renewable energy resource. The largest hurdles for forage crops to become a significant portion of the biomass needed for renewable energy are the current high price for these hays (as feed for livestock) and the high water and fertil-izer inputs needed for production. This chapter will not attempt to address all of the 10,000 species of grasses, of which 47% are C4 (Sage et al. 1999) or the numerous perennial forage legumes, but will be limited to those considered to have the greatest potential of contributing to the billions of tons of biomass needed for replacement of fossil fuels over the coming years. A mixture of cool-season grasses and legumes constitute pasture and hay crops of the temperate north and western mountain areas of the United States (United States Department of Agriculture (USDA) Plant hardiness zones 3–6). Tall fescue grass (Festuca arundinacea Schreb.), timothy grass (Phleum pratense L.), orchardgrass
W. Vermerris (ed.), Genetic Improvement of Bioenergy Crops, DOI: 10.1007/978-0-387-70805 -8_12, © Springer Science+Business Media, LLC 2008

310 Anderson, Casler and Baldwin (Dactylis glomerata L.), smooth bromegrass (Bromus inermis Leyss.), and reed canarygrass (Phalaris arundinacea L.) are the predominant pasture grasses and al-falfa (Medicago sativa L.) and the clovers (Trifolium spp.) are the primary legumes of the eastern temperate, Northwest and California coastal regions. Numerous native rangeland species predominate in the inter-mountain regions. Of these species, al-falfa, reed canarygrass and the wildryes (Leymus spp.) are currently being investi-gated as potential lignocellulosic feedstocks. These species will be discussed in Sec-tions 12.2–12.4. Warm-season (C4) grasses are particularly adapted to the warmer climates of the United States (Plant hardiness zones 7–9). Yields of these grasses can be upwards of 20–30 Mg ha–1 depending upon moisture and soil fertility. A number of native spe-cies have been used for livestock grazing, but the majority of the managed pastures in the southern U.S. are non-native bermudagrass (Cynodon spp.) and bahiagrass (Paspalum notatum L.). Napiergrass (Pennisetum purpureum), which is a significant forage for much of the tropical world, has also been introduced and improved for use as a forage for parts of Florida, though little is currently grown for that purpose. Some of these species, as well as big bluestem and eastern gamagrass, are being evaluated for their potential as bioenergy crops and will be discussed in Sections 12.5–12.8.
12.2 Reed Canarygrass
12.2.1 Botanical Description
Two Phalaris species are used extensively for forage production: reed canarygrass (P. arundinacea L.) in cool, humid, temperate climates, and phalaris (P. aquatica L.) in Mediterranean climates. Within this genus, interest in bioenergy feedstock produc-tion is focused on reed canarygrass. This species has a circumglobal distribution in the northern hemisphere, occupying many habitats within North America, Europe, and Asia (Anderson 1961). It is best adapted to low-lying areas subject to short-term flooding. In North America, it is highly vilified as an opportunist that has taken ad-vantage of sedimentation and nutrient loading in wetlands to colonize and form vast monocultures within these ecosystems (Green and Galatowitsch 2001; Maurer and Zedler 2002). Reed canarygrass is a long-lived perennial that can reproduce sexually by seed that is readily dispersed by a highly efficient shattering mechanism, and asexually by rhizomes or axillary buds on lower stem nodes. Both seed and rhizomes can live for long periods of time, with effective dormancy mechanisms that contribute to the longevity of the species. Reed canarygrass has two cytotypes, the widely-distributed tetraploid (2n = 4x = 28) and a hexaploid (2n = 6x = 42), which originated on the Iberian Peninsula (McWilliam and Neal-Smith 1962). Nearly all reed canarygrass cultivars are derived from the tetraploid form. Reed canarygrass is highly self-incompatible and wind-pollinated, with extremely low rates of self-pollination, mak-ing it relatively easy to manipulate by hybridization.

Improvement of Perennial Forage Species as Feedstock for Bioenergy 311
12.2.2 Management and Bioprocessing
Reed canarygrass can be planted in spring or late summer, typically in clean and firm seedbeds. Seedlings grow very slowly and establishment is a long, slow process that requires diligent and patient management during the establishment year (Buxton and Wedin 1970). Due to slow establishment rates, maximum production of reed canary-grass stands is not achieved until the second or third year of production and spring seedings are more effective than late summer seedings at reducing the yield produc-tion lag due to establishment. Annual weeds are the biggest impediment to successful establishment, requiring frequent clipping to maintain an open canopy and minimize the effects of competition (Sheaffer et al. 1990). Interest in reed canarygrass as a bioenergy crop derives from its status as a highly persistent and long-lived temperate grass with relatively high biomass yield potential (Wright 1990; Buxton and Anderson 1992). Its superior drought and water-logging tolerance confer adaptation to a wide range of soil types, habitats, and management systems. It has a deep and profuse root system that contributes to its wide range of stress tolerances (Bennett and Doss 1960). Reed canarygrass is also widely adapted to a range of harvest managements and nitrogen (N) fertility levels (Decker et al. 1967; Marten et al. 1979; Marten and Hovin 1980). It responds well to N applica-tions, either as inorganic fertilizer, manure, or sewage effluent. Maximum biomass production is achieved under a two-harvest management system (Marten et al. 1979; Marten and Hovin 1980). Biomass yields generally range from about 10–15 Mg ha–1 on a dry-matter basis.
12.2.3 Genetics and Breeding
Traditional breeding techniques have been used to take advantage of its high self-incompatibility and natural cross pollination. Crosses can be easily made by mutual pollination without emasculation in the glasshouse or the field. Glasshouse crossing is accomplished with potted plants that have been placed in glass-covered cold frames during late autumn and early winter for floral induction, before transfer to the glasshouse and gradual increase in both temperature and daylength (Casler and Hovin 1985). Field crossing is accomplished with large (1-m diameter × 2-m height) crossing bags supported by frames made from PVC pipes, allowing sufficient seed for yield trials of hybrids. Commercial cultivars are synthetics, typically originating from 5 to 20 clones, largely because insufficient research has been conducted on hybrid seed production systems, which could be facilitated by asexual propagation of parental clones (Casler and Hovin 1980). The largest known germplasm collection is present at the United States Dairy Forage Research Center at Madison, WI where USDA-Agricultural Research Service (ARS) maintains over 900 accessions. The USDA-National Plant Germplasm System (NPGS) lists 106 plant introductions (USDA-ARS, National Genetic Resources Program 2007). Because of its outcrossing and polyploid nature, individual populations of reed canarygrass contain large reservoirs of genetic variability. Compared to most tem-perate grasses, reed canarygrass contains a relatively large amount of variability for morphological traits, such as leaf width, leaf angle, leaf rigidity, stem diameter, and

312 Anderson, Casler and Baldwin number of nodes, some of which can be used as a predictor of biomass production (Casler and Hovin 1985). Considerable ecotypic variation exists within reed canary-grass (Sachs and Coulman 1983), presumably related to habitat differentiation and natural selection. In North America, there is a long history of introduction from European reed canarygrass populations, beginning in the 1890s and rapidly spreading throughout temperate climatic zones (Sheaffer and Marten 1995; Carlson et al. 1996). The spread of European germplasm throughout temperate North America combined with the morphological similarity of North American and European forms, have obscured any ability to distinguish native from introduced types. A study of amplified frag-ment length polymorphic (AFLP®) DNA markers (see Chapter 6) of reed canary-grass cultivars developed by North American and European breeding programs re-vealed some differences among cultivars, but no overall difference between North American and European cultivars (Fig. 12.1). These results suggest that European germplasm has likely contributed to the development of most North American culti-vars, largely as selections made from old pastures that have likely undergone many years of natural selection. Because of its importance as a pasture grass, most efforts to develop improved populations or cultivars have focused on solving problems related to agronomic performance or livestock utilization. The most intensive and sustained efforts in breeding reed canarygrass, by far, have been to develop new cultivars with reduced and/or modified alkaloid profiles (Marten 1989). Tryptamine and β-carboline alka-loids are harmful to livestock, causing cancer, hair loss, diarrhea, and other disorders. These compounds are simply inherited by two genes that control their presence or absense from plant tissues (Marum et al. 1979). Gramine (3-(dimethylamino methyl)-indole), which is synthesized only in the double recessive genotype, causes loss of appetite and reduced intake. New cultivars of reed canarygrass have reduced gramine concentrations and no tryptamine or β-carboline alkaloids. The implications of reduced and/or modified alkaloid profiles on ecological fitness, including potential reductions in resistance to feeding by insects, have not been studied.
12.2.4 Future Outlook for Reed Canarygrass
There is considerable potential to improve reed canarygrass as a dedicated bioenergy crop. Seedling vigor and establishment potential can be improved by selection and breeding (Casler and Undersander 2006). There is considerable genetic variation for biomass yield (Sachs and Coulman 1983) and for quality traits that relate to fermen-tation characteristics of plant biomass (Marum et al. 1979). Breeding reed canary-grass as a dedicated bioenergy crop holds some distinct advantages over breeding for pasture production, most notably the ability to ignore alkaloid profiles or to utilize plants with high concentrations of alkaloids as a potential aid in reducing insect herbivory. The status of reed canarygrass as an ‘invader’ or ‘invasive species’ will be a significant impediment to deployment of dedicated bioenergy cultivars of this species, requiring management programs to eliminate or minimize spread of seed into local wetlands and to educate the public on the value of using a diverse array of bioenergy crops to meet the growing demands for biomass in the energy industry.

Improvement of Perennial Forage Species as Feedstock for Bioenergy 313
Human resources are the largest limitation to future progress, with only one reed canarygrass breeding program still active in North America (USDA-ARS, Madison, WI), reduced from its zenith of six different breeding programs in the late 1970’s.
Fig. 12.1. Scatterplot of the first two dimensions of the matrix of 103 amplified fragment length polymorphic (AFLP®) DNA markers scored on 205 reed canarygrass plants representing
a different symbol (Data provided by M. D. Casler).
12.3 Alfalfa
12.3.1 Botanical Description
Alfalfa (Medicago sativa L.) is an important perennial forage legume and is consid-ered a potential feedstock for production of renewable fuels (Samac et al. 2006). The United States produces the most alfalfa in the world with over 9.3 million hectares
15 cultivars, each cultivar represented by

314 Anderson, Casler and Baldwin harvested in 2003 (USDA-NASS, Agricultural Statistics 2004) with California, South Dakota, and Wisconsin leading the way in production. Alfalfa can be grown from very cold northern plains to high mountain valleys, from rich temperate agricul-tural regions to Mediterranean climates. The lifespan of alfalfa ranges from 3 to 12 years, but most fields are harvested for only 4 years before fields are reestablished. Alfalfa is native to the Middle East, primarily Iran. It was introduced to the United States in the 1700’s and 1800’s and is now found throughout the continent (Russelle 2001). Cultivated alfalfa is a tetraploid (2n = 4x = 32) with polysomic inheritance which complicates the genetic analysis required for mapping. Alfalfa has perfect flowers and is naturally cross-pollinated by bees, tolerates relatively little inbreeding, and can be vegetatively propagated by stem cuttings.
12.3.2 Management and Bioprocessing
Alfalfa can be sown in spring or fall, and grows best in fertile, well-drained soils at near neutral pH. The deep root system and nitrogen-fixing ability with soil bacterium Sinorhizobium meliloti enables alfalfa to produce adequate yields under less than optimum soil moisture or nitrogen fertility. Some of the fixed nitrogen is returned to the soil for subsequent or companion crops (Samac et al. 2006). Alfalfa requires a great deal of potassium. Seeding rates are 13–20 kg ha–1 in northern regions and a rate of 22 kg ha–1 in the South. It is harvested two to three times a year and yields will vary from 3.4 Mg ha–1 yr–1 dry matter (North Dakota) to 18.4 Mg ha–1 yr–1 (Ari-zona) with an average of 7.8 Mg ha–1 yr–1 (USDA-NASS, Agricultural Statistics 2004). Cultivation, harvesting and storing technologies are well established. Herbi-cides are used to control weeds and glyphosate-resistant alfalfa has been developed, but is not yet sold. Leaves and stems can be easily separated using shaking screens (Arinze et al. 2003). Leaves contain between 260 and 300 g kg–1 protein and are used as feed, whereas the stems, which contain 100–120 g kg–1 protein, would be consid-ered the co-product for biofuels (Arinze et al. 2003). Leaf meal has been shown to be an excellent replacement of alfalfa hay or soybean meal for dairy cattle, and alfalfa leaves contain other secondary metabolites beneficial for human nutrition and food production (Samac et al. 2006).
12.3.3 Genetics and Breeding
The alfalfa flower is normally cross-pollinated by insects (McGregor 1976). For breeding purposes the perfect flowers have to be emasculated prior to pollination or, alternatively, male-sterile plants must be used as females. The flower must be tripped by moving the wing and keel pedals relative to the stigma, which releases the sta-mens and pistil. Numerous methods of crossing have been tried (Barnes and Ste-phenson 1971). Most alfalfa cultivars are synthetic cultivars. Individual plants with desirable genes are considered parents and are composited via replicated random mating (allowing all possible crosses with all possible parents) in isolation into the first-generation synthetic seed (Syn1). After a cultivar release, each further genera-tion of seed increase of the synthetic is then done in isolation and random mating is assumed. Available diploid subspecies have been used for development of cultivated

Improvement of Perennial Forage Species as Feedstock for Bioenergy 315
alfalfa as they are cross-fertile with cultivated alfalfa and have simplified the analy-ses required for developing diploid maps. The introgression of M. falcata into M. sativa increased the genetic variation and the range of adaptation of this crop to temperate climates of all continents (Rumbaugh et al. 1988). Nine highly diverse, distinct germplasm sources were introduced into North America from different re-gions of the world (Barnes et al. 1977). Nearly 3,200 Medicago accessions are listed in the NPGS, of which 950 are M. sativa (USDA-ARS, National Genetic Resources Program 2007). Most of the improvements in alfalfa over the last decades have been in insect- and disease resistance, improved ability to overwinter in cold climates, and fall dor-mancy. Disease resistance is important because it improves the usefulness of alfalfa on poorly drained soils, and during wet years. Fall dormancy is a major characteristic of alfalfa varieties. More dormant varieties have reduced growth in the fall, a re-sponse due to low temperatures and reduced day lengths. Non-dormant varieties exhibit winter growth activity, and are therefore grown in long-seasoned environ-ments such as Mexico, Arizona, and Southern California, whereas dormant lines are grown in the Upper Midwest, Canada, and the Northeast. Increases in overall alfalfa biomass yield would benefit the crop for use as a biofuel feedstock. Individual stem diameter is heritable and controlled by genes that act in an additive fashion (Volenec et al. 1987; Marquez-Ortiz et al. 1999). Genetic improvements for stem size and foliar disease resistance are reported to be present in European land races (Barnes et al. 1977). When comparing these biomass-type alfal-fas to hay-type alfalfa under two management systems, the large-stem genotypes had 37% higher yield of cell wall polysaccharides than the forage hay genotypes and the theoretical potential ethanol yield doubled under a biomass management system (Lamb et al. 2007). Generally, as stems mature, protein content decreases and carbohydrate content increases (Dien et al. 2006). At maturity, stems make up as much as 80% of the total dry matter and neutral detergent fiber (NDF), which generally estimates the percent-age of total fiber (cellulose, hemicellulose and lignin) increases due to increases in xylem tissue (Jung and Engels 2002). The composition of the major cell wall poly-saccharides and lignin has been studied extensively for different alfalfa maturity levels and under different growth environments (Samac et al. 2006). Although ge-netic differences in chemical composition of alfalfa stem cell walls have been small, there have been enough observable changes in genotypes selected for divergent con-tents of Klason lignin, cellulose and xylan (Lamb and Jung 2004) to conclude that cell wall compositions can be significantly changed through recurrent selection (Sa-mac et al. 2006). Different pretreatment methods were performed on alfalfa fiber to maximize the release of fermentable sugars (Sreenath et al. 1999; Ferrer et al. 2002) for eventual conversion to ethanol (Sreenath et al. 2001). Alfalfa stems were reported to be more recalcitrant to dilute acid pretreatment than grasses (Dien et al. 2006), and syngas yields were reported to be greater during pyrolysis for alfalfa stems than for reed canarygrass or eastern gamagrass (Boateng et al. 2006). Methods for genetic transformation of alfalfa have been developed and used to alter alfalfa for production of valuable co-products and improved digestion (Samac et al. 2006). Genetic maps of alfalfa have been published (Brummer et al. 1993; Kiss et

316 Anderson, Casler and Baldwin al. 1993; Echt et al. 1994). The study of barrel medic (Medicago truncatula Gaert-ner) as a model species, which has a high degree of DNA sequence homology with alfalfa, has led to over 189,000 expressed sequence tags (ESTs), sequencing of thou-sands of unique genes, and mapping of genes that may be useful for the development of markers for cell wall conversion (Samac et al. 2006).
12.3.4 Future Outlook for Alfalfa
Alfalfa is grown widely throughout the United States and has potential for providing a dual crop consisting of a highly nutritious protein source from leaves for animal feed or human nutritional supplements and a stem fraction to be used as a source of fermentable sugars to produce ethanol. Unlike grasses, alfalfa can supply its own nitrogen and enrich the soil. Commercial production for biorefining has not yet been developed, however, and before this can become a reality, higher-yielding cultivars need to be developed.
12.4 Wildrye
12.4.1 Botanical Description
The cool-season C3 wild ryes are being considered as a potential bioenergy feedstock for the western United States (Larson – personal communication). Basin wildrye (Leymus cinereus (Scribn. & Merr.) Á. Löve) is the largest native perennial grass in the Rocky Mountain and Intermountain regions, and the larger giant wildrye (L. condensatus (C. Presl) Á. Löve) is native to California (Dewey 1984). Basin wild rye grows in large vigorous stands in lush, high-mountain valleys, riparian areas, foot-hills, and hollows, but also grows on some of the harshest sites in the Great Basin region. It grows from British Columbia south to the east of the Sierra Nevada in California and eastward throughout the Intermountain and Rocky Mountain regions to eastern portions of Montana, Wyoming, and Colorado (Barkworth and Atkins 1984). Another closely related but morphologically divergent species, beardless wildrye Leymus triticoides (Buckley) Pilg., has aggressive rhizomes, is adapted to harsh, cold and desert climates and ranks among the most salt-tolerant grasses of the world. Optimal growth occurs on silt and clay soils, but the wildryes are also tolerant of sandy textured soil (Wasser 1982). The wildryes are adapted to mean annual pre-cipitation zones of 25–50 cm (Wasser 1982) and grow at elevations of 300–2,750 m. They hold potential as an alternative crop for many irrigation systems challenged by salinity and declining water supplies in the western United States (Larson et al. 2006). The species are naturally outcrossed and highly self-sterile (Jensen et al. 1990). The basic Leymus genome is composed of seven chromosomes (Dewey 1984). More than half of L. cinereus are allotetraploid (2n = 4x = 28); octoploids and dodecaploids also occur (Larson et al. 2006).

Improvement of Perennial Forage Species as Feedstock for Bioenergy 317
12.4.2 Management and Bioprocessing
Leymus species are propagated by seed and established in the early spring or late fall (Alderson and Sharpe 1994). They are planted with a disc or deep furrow drill to a depth of 0.5–2 cm in fine-textured soils at between 5 and 7 kg ha–1. Bromoxynil may be necessary to suppress broadleaf weeds during establishment. They are most often grazed or cut for hay after the second year of establishment. Yields of 3–20 Mg ha–1 have been reported for the various species from tests ranging from New Mexico north to Canada, and west to Idaho, Utah, and California (Jefferson et al. 2002; 2004; Lauriault et al. 2005; Benes et al. 2005) with minimal input and relatively unim-proved germplasm. Released cultivars of basin wild rye include ‘Magnar’ and ‘Trailhead’ with other improved germplasm being released (USDA-NRCS 1998). Management procedures have yet to be developed for bioprocessing.
12.4.3 Genetics and Breeding
The main benefits of wildryes for biofuels are the yield potential of the crop in the western and intermountain regions, their potential for improvement through inter-specific crossing and their close relationship to both wheat and barley. The sod-forming L. triticoides has been observed growing in close proximity to L. cinereus at disturbed sites, but separated under natural circumstances based on adaptability (Lar-son et al. 2006). F1 hybrids derived from some initial crosses of these two species were very robust and showed an extremely heterotic combination f tall plant height (some greater than 2 m), large stems and leaves from L. cinereus and a vigorous proliferation of tillers and rhizomes from L. triticoides (Larson – personal communi-cation). Genetic maps of this hybrid are being developed and relevant traits are being identified with QTL (Wu et al. 2003; Larson et al. 2006; Larson and Mayland 2007). Molecular genetic maps were constructed for two full-sib Leymus populations, TTC1 (164 clones) and TTC2 (170 clones), and QTL were identified that control numerous traits including plant height, rhizome proliferation, flowering, seed shattering, seed germination, salt tolerance, NDF (total fiber content), acid detergent fiber (ADF; estimates cellulose and lignin), crude protein, and virtually all of the macro- and micro-minerals (Larson et al. 2006; Larson and Mayland 2007). Several strong NDF and ADF QTL showed good homology between the mapping populations based on early spring forage. Current Leymus molecular resources come from L. chinensis (Jin et al. 2006) and L. cinereus and include over 11,000 ESTs which identified 300 SSRs, and a 5× BAC library (Larson, unpublished). Useful genetic stocks include two independent sets of wheat-mammoth wildrye (Leymus racemosus (Lam.) Tzvelev) chromosome addition/substitution lines, which provide a valuable resource for genetic and physical mapping (Qi et al. 1997; Kishii et al. 2004).
12.4.4 Future Outlook for Wildrye
The potential of the wildryes as a biofuel feedstock is primarily restricted to the mountain and intermountain areas of the western United States where other species

318 Anderson, Casler and Baldwin are not well adapted. There is a great deal of genetic variability available through intra- and inter-specific breeding and efforts on molecular mapping of the genus are well underway. Management and bio-processing methods will need to be developed, and the yield potential needs to increase to enable concentrated production for an energy-producing facility.
12.5 Big Bluestem
12.5.1 Botanical Description
Big bluestem (Andropogon gerardii Vitman), a single species, belongs to the sub-family Panicoideae and tribe Adropogoneae. A race known as sand bluestem (some-times referred to as A. hallii Hack) is occasionally reported in the literature. It is distinguished by the presence of extensive rhizomes which are truncated in big blue-stem. Researchers have shown that cross pollination of sand and big bluestem is possible and the progeny are completely fertile (Peters and Newell 1961), indicating a single species. Big bluestem is a warm-season (C4), perennial, native grass that once dominated the tall-grass prairie of North America (Weaver 1968; Gould and Shaw 1983). A bunch-type grass reaching 1–3 m in height depending on water and nutrient avail-ability, the plant develops deep roots (Stubbendieck et al. 1991). Root depths are reported to be 1.3 m during the establishment year, up to 2.7 m once established. Among the most dominant features of big bluestem are its short, tough rhizomes (contrasting it with the individuals identified as sand bluestem). While big/sand bluestem can be propagated by crown divisions, most large-area establishment is from seed. It is considered a late successional grass that grows best in and tends to dominate rich, sandy soils, but also persist on sandy or clay loams (Weaver 1968). The original range of big bluestem is reported to be similar to switchgrass (Panicum virgatum L.; see Chapter 11) from central Mexico north to Canada (Gould and Shaw 1983). This wide north-to-south range causes substantial variation in duration of growing season depending on plant origin. Photoperiod governs onset and cessation of growth and flowering. It is considered a short-day plant, with jointing and flower-ing initiated by decreasing day length in late summer. Photoperiod strongly governs growth. Moving individuals from southern areas to more northerly locations causes southern individuals to remain actively growing later into the shorter season than those individuals from populations native to that area. Conversely, northern popula-tions moved farther south will cease to grow early in the growing season, even though conditions remain suitable for growth (Newell 1968; Waller and Lewis 1979). Big bluestem has a base chromosome number of 10 (Gould 1968), with two cyto-types: hexaploid (2n = 6x = 60) and enneaploid (2n = 9x = 90) (Norrmann et al. 1997). While enneaploids exist in the wild, examination of ten widely used cultivars has determined all to be hexaploid (Riley and Vogel 1982; Vogel 2000). Populations of big bluestem depend on cross pollination by wind for seed production. Controlled self-pollinations of big bluestem result in less than 5% seed set. Seed production

Improvement of Perennial Forage Species as Feedstock for Bioenergy 319
under the best conditions is limited to about 50–60% of the visible florets (Norrmann et al. 1997).
12.5.2 Management and Bioprocessing
Like most of the North-American native species, big bluestem is notoriously slow to establish from seed. Seedlings are often overlooked in a field during establishment because of the dominance of annual grassy weeds. Conventional wisdom would suggest that ideal planting should occur in the spring to allow maximum growth during that first year. However, soil temperature for ideal growth is 25°C (Hsu et al. 1985; Delucia et al. 1992), indicating a slight delay in planting coupled with a timely broad spectrum herbicide application may be more desirable. Maximum biomass production of big bluestem is not achieved until 3–4 years after sowing. The in-creased yield is derived from culms arising from the rhizome growth of the crown. Spring burning of the first-year crop and residual weedy chaff may be useful in in-creasing subsequent growth and biomass yield. Burning big bluestem in early or late spring can increase forage production by 52–70%, respectively, over unburned con-trol plots (Mitchell et al. 1994). Big bluestem is considered to be good forage for all livestock, especially early in the growing season when the plant biomass consists predominantly of leaves (Red-fearn and Nelson 2003). While considered nutritious during spring and summer, it becomes less digestible as stem elongation commences during the onset of flowering during late summer. As a grass species, big/sand bluestem shows potential for biofuel. This species has shown greater in vitro fermentability than other warm-season grass species (Jung and Vogel 1992). As a result, potential for production of ethanol and value-added chemicals via consolidated bioprocessing (a direct fermentation process; see Chapter 6) may offer this species a distinct advantage over acid hydrolysis, saccharification and fermentation of switchgrass (Weimer and Springer 2007). Cost of production is also a factor when determining feasibility of a biofuel crop. When analyzing cost of production of big bluestem and switchgrass for yield and economic feasibility from a biofuel perspective; switchgrass was faster to establish, but by the second year, big bluestem became the most productive species. Comparing cost of processing for bio-oil, big bluestem was determined to be less expensive than switchgrass and produced more bio-oil from pyrolysis. The returns on investment from big bluestem (US$19.38 Mg–1) also exceeded switchgrass (US$10.47 Mg–1) (Tiffany et al. 2006). Cost of biomass production can vary by location. In Iowa, cost of production of big bluestem was intermediate to switchgrass – the least expensive to produce – and alfalfa or reed canarygrass, which were the most expensive (Hallam et al. 2001).
12.5.3 Genetics and Breeding
The past and indeed, current breeding of native species of North America, is focused on improved cultivars selected primarily for increased forage/nutritional value for grazing (Mitchell et al. 2003; 2005 Vogel and Mitchell 2003; Vogel et al. 2006a;b). Although big bluestem was once the dominant species on the Great Plains (Weaver

320 Anderson, Casler and Baldwin 1968; Gould and Shaw 1983), most of that area was plowed up and converted to row crops during the 19th century westward population expansion of the U.S. Remnant stands, occurring in cemeteries, along railroad right-of-ways and other fallow areas, can be exploited for their genetic diversity. Germplasm collections of big bluestem were extensive in the 1970’s at many of the Plant Materials Centers (PMC) of the U.S. Natural Resources Conservation Service (NRCS) and Plant Introduction Cen-ters of ARS. Fiscal constraints have caused many of these collections to be plowed under. However, relatively large big bluestem resources for the south-central and southeastern U.S. are located at Elsberry Plant Materials Center (Elsberry, MO) and at the USDA-NRCS Jimmy Carter Plant Materials Center (Americus, GA), respec-tively. There are 450 accessions of big bluestem collected from native stands throughout the southeast at Americus and 370 accessions from the south-central U.S. at Elsberry. A smaller collection still exists at Rose Lake PMC (East Lansing, MI) containing 106 accessions from southern Indiana to northern Michigan. Gametophytic self-incompatibility in big bluestem makes cross pollination the rule (Norrmann et al. 1997), thus enhancing genetic variability of the species. Classi-cal breeding techniques take advantage of this incompatibility to produce crosses among groups of desirable genotypes by isolating them from others. Isolation can come from actual pollen containment via bags of various sizes or by physical dis-tance from native stands. The polyploid nature of the species also serves to retain substantial genetic variability. Unlike switchgrass, in which the cytotypes are geneti-cally isolated from one another (Martínez-Reyna and Vogel 2002; see also Chapter 11), big bluestem cytotypes freely crosspollinate. This generates viable aneuploid individuals from the native hexa- and enneaploid populations (Norrmann et al. 1997; Norrmann and Keeler 2003). Such pollen transfer indicates gene flow is occurring from each group, suggesting a single species. Big bluestem can be vegetatively propagated from crown divisions or rhizome cuttings, allowing collection and clonal propagation of new germplasm without de-struction of the existing stand. While classical breeding strategies are useful in big bluestem improvement, the recalcitrant nature of seed germination and seedling survival challenges progress. There are a limited number of improved varieties available on the market. Some selections of big bluestem that have been released were derived from limited parental base, but most improved cultivars are generally synthetic composites of 20–60 mother plants selected for their improved characteristic and propagated one to three generations (Vogel et al. 2006a,b). Examples of big bluestem cultivars (and location of release) include: ‘Bison’ (ND); ‘Bonilla’ (SD); ‘Niagara’ (NY); ‘Rountree’ (IA); ‘Champ’ (NE/IA); ‘Pawnee’, ‘Goldstrike’, ‘Goldmine’, ‘Bonanza’ (NE); ‘Kaw’ (KS); ‘Earl’ and ‘Chet’ (TX).
12.5.4 Future Outlook for Big Bluestem
Difficulty in planting and establishment of big bluestem limits its wide acceptance. Seed requires processing to remove hairs or specialty drills to be planted. Other issues that limit big bluestems as a biofuel feedstock center around weed control. Enhanced weed control, especially of annual grasses, might allow sufficient big
Improvement of Perennial Forage Species as Feedstock for Bioenergy 321
bluestem establishment to warrant fertilizer application during the first year, further enhancing first-year yield. Cultivar testing over larger and additional areas is needed. Management schemes need to be devised to exploit maturity similar to those used in the southern U.S. with soybean. It might be desirable to plant an early maturing (northern) cultivar at a southern location. While a producer might compromise yield to some extent, he/she would be able to harvest earlier in the season, but after the crop had gone dormant. Research indicates that delayed harvest of standing grasses offers a substantial advantage in terms of biofuel quality, i.e. reduction of ash, sulfur, phosphate, and nitrogen compounds (Muir et al. 2001; Baldwin and Cossar 2005; Cassida et al. 2005; Adler et al. 2006). Standability (ability to remain erect into the winter) then becomes a vital concern. Variation for erectness is present in big blue-stem and selection for individuals that resist late season lodging would also be desir-able. Two factors may make the biggest difference in big bluestem’s increased produc-tion area. The first is that this species produces twice the biomass per unit of applied nitrogen than either switchgrass or indiangrass (Sorghastrum nutans (L.) Nash) (Perry and Baltensperger 1979). With the costs of nitrogen fertilizer increasing, it seems nitrogen use efficiency will become increasingly important. Second, prelimi-nary research utilizing consolidated bioprocessing (Weimer and Springer 2007) indicates that big bluestem is a superior feedstock, and may offer accelerated devel-opment for big bluestem in the biofuels arena. The fact that big bluestem is endemic to North America also works in its favor when considering expanding the production area in the U.S.
12.6 Bermudagrass
12.6.1 Botanical Description
Bermudagrass and stargrass consist of a number of species under the genus Cynodon that are geographically widely distributed throughout the world but that occur most abundantly in tropical and sub-tropical regions of Africa to Southeast Asia where they most likely originated (Taliaferro et al. 2004). They are perennial in nature and go through a winter dormancy period. Cynodon taxonomy was most recently revised by Harlan et al. (1970a). In regard to potential use as feedstocks for bioenergy, the widely adapted and variable bermudagrass forage genotypes within C. dactylon (L.) Pers. var. dactylon and the highly productive coarse stargrass (C. nlemfuënsis Vanderyst var. nlemfuënsis) are the primary species used in selection programs, but, desirable traits may exist among the other species. Bermudagrass possess rhizomes and the taxon is highly variable, being further characterized into three major races by Harlan and de Wet (1969). They distinguish the tropical and temperate races by their adaptation characteristics, where the temperate race is much more winter hardy. The seleucidus race has a greater potential of contributing genes for higher biomass due to the coarse robust growth habit and cold tolerance.

322 Anderson, Casler and Baldwin The bermudagrass taxa exist in tropical regions to as far north as the 53°N lat and at elevations from sea level to 3,000 m (Harlan and de Wet 1969), whereas star-grasses are more limited to tropical or semi-tropical regions that do not reach tem-peratures below –6°C (Mislevy et al. 1989a;b). One of the factors contributing to the lack of cold tolerance in stargrass is the fact that most genotypes lack rhizomes. The introduction of bermudagrass to the New World most likely occurred soon after the arrival of Columbus and spread throughout southern Colonial America and became an important pasture grass in the early 19th century (Burton and Hanna 1995). Plant collections have been made from northern climates as far north as Michigan, but the most productive and persistent genotypes remain in the southern United States. The first collections of stargrass were reported for use in crossing and selection in the 1930’s (Burton 1951). The poor freeze tolerance of stargrass limits its use to the southern part of Florida, but it is very important to Central and South America (between 23°N and 23°S and elevation of <5,000 m). Most species are relatively drought tolerant (Burton et al. 1954), but require at least 500 mm yr–1 rain-fall for persistence and good production. The base chromosome number of x = 9 has been confirmed (Forbes and Burton 1963; Harlan et al. 1970b). The species are primarily diploid or tetraploid in nature, with just a few hexaploids reported (Taliaferro et al. 2004). Hybridization among parents of different ploidy levels produces triploids and pentaploids (Taliaferro et al. 2004; Anderson 2005). Species of the genus Cynodon have perfect flowers and are generally considered to be outcrossing due to self-incompatibility (Burton and Hart 1967). Flowers bear one pistil and three anthers. Self-compatibility has ranged from 0.5 to 10% in various studies (Taliaferro et al. 2004), but a few genotypes within the core collection (Anderson 2005) were observed to have high levels of selfed seed (unpublished data). Successful production of hybrid cultivars are generally attributed to the cross pollinating nature of the taxa.
12.6.2 Management and Bioprocessing
Most improved hybrid bermudagrass cultivars are propagated vegetatively using so-called sprigs, which consist of roots, stems, stolons and/or rhizomes. This allows for clonal maintenance of the hybrids and takes advantage of hybrid vigor (Burton 1956). Methods of establishing sprigged bermudagrass were established in the 1950’s and remain relatively unchanged (Taliaferro et al. 2004). There are also some seeded cultivars that can be sown by drilling or broadcasting (Taliaferro et al. 2004). Once established, bermudagrass pastures have been known to persist for decades, especially clonally propagated hybrids such as ‘Coastal’ (Burton 1948), which was first developed in 1943 and which is found on many pastures in the Southern U.S. today. In order for bermudagrass to be established successfully by sprigs or seed, it is important to minimize weeds and to supply the stand with adequate nutrients. While there are only a limited number of herbicides available for pastures, some phenoxy herbicides can control broadleaf weeds, whereas others have been developed to con-trol sedges and crabgrass (Taliaferro et al. 2004). Bermudagrass and stargrass require a relatively high nutrient availability for high yields. Most of the studies on nutrient

Improvement of Perennial Forage Species as Feedstock for Bioenergy 323
requirements were conducted in the 1940’s and 1950’s on the cultivar ‘Coastal’. From these studies a recommendation of up to 448 kg (N) ha–1 and a ratio of 4-1-2 to 4-1-4 N-P2O5-K2O should be applied on sandy loam soils with a pH of at least 5.5 (Taliaferro et al. 2004). Although bermudagrass is a major pasture for the Southern U.S., millions of hectares are harvested as hay. Methods for cutting, drying and packaging biomass are well established and are reviewed by Taliaferro et al. (2004). Varieties, clipping rates, and climate all affect the quality of the hay for livestock feed. For high-quality hay, bermudagrass and stargrass are recommended to be cut every 4–5 weeks, when digestibility is high and crude protein production is maximized. Biomass yields, however, increase with longer intervals (Burton et al. 1963). Some of the quality parameters, such as NDF, ADF and dry matter digestibility (DMD), are negatively affected by rain, high humidity and maturity of the hay. These genetic and manage-ment effects will likely affect conversion efficiency of the cell wall to sugars for fermentation as well. Rumen dry matter digestibility is considered to be a good pre-dictor of conversion efficiency to sugars used for fermentation to ethanol due to the similarity in the types of enzymes used to break down the cell wall components. Though ‘Common’ bermudagrass from selection of naturally occurring biotypes was utilized as a forage grass throughout the 19th and into the 20th century, no ex-tensive breeding efforts were started until the 1930’s. The first major bermudagrass cultivar to be developed was ‘Coastal’ (Burton 1948). Many sprigged and seeded cultivars have been developed and released since then. The cultivars were released based on improvements in yield, cold tolerance, rumen digestibility or adaptability to soil or water constraints (Taliaferro et al. 2004). More recent releases of ‘Tifton 85’ (Burton et al. 1993) and ‘Midland 99’ (Taliaferro et al. 2002) have raised the bar on yield, forage quality and adaptability. Yields will vary depending upon location, climate, soil conditions and management. Yields in the eastern U.S. tend to be higher (Table 12.1). In a comparison with ‘Alamo’ switchgrass and ‘Merkeron’ napiergrass, ‘Tifton 85’ bermudagrass produced more dry biomass than switchgrass over a 6-year period at three locations in Georgia (Table 12.2) (Bouton 2002). The plants in this test were fertilized twice with 34 kg N ha–1 and harvested in mid and late summer. The high biomass production potential of bermudagrass is offset by the reliance on high fertility (primarily N and K) and high soil moisture. The crop is tolerant of long periods of drought, however, and is very persistent.
12.6.3 Genetics and Breeding
Early efforts in breeding of bermudagrass were directed at developing superior clonally propagated F1 hybrids. This was performed by controlled crosses, utilizing the strong self-incompatibility of bermudagrass plants. Parental lines were planted in close proximity in isolated field plots or by placing detached floriferous shoots of respective plants together in a container of water, isolated from other plants (Taliaf-erro et al. 2004). Full-sib seed from mutual pollination were then planted and se-lected plants were clonally propagated for testing or used for subsequent crosses. Breeding for seeded varieties requires characterization of potential clonal parental lines for inflorescence characteristics that allow for proper inflorescence maturity for

324 Anderson, Casler and Baldwin sufficient out-crossing to produce seed. Multiple parents may be used to develop synthetics in isolated open-pollinated nurseries.
Table 12.1. Average yields (Mg dry matter ha–1) over years of selected bermudagrass cultivars tested in the southern United States
Location Years Cultivars Coastal Tifton 85 Russell Midland 99 aOverton, TX 1997–2002 7.81 12.04 bRaymond, MS 1995–1999 8.33 9.79 bNewton, MS 1995–1999 9.23 9.54 cArdmore, OK 1996–2003 9.49 10.12 8.76 8.96 dFairhope, AL (irrig.) 2005–2006 16.50 23.26 14.82 dFairhope, AL (dry) 2005–2006 13.75 22.14 13.81 eTifton, GA 2003–2005 16.11 19.37 19.34 eCalhoun, GA 2003–2005 17.93 25.00 21.91 eGriffin, GA 2003–2005 16.38 18.38 18.55 fShorter, AL 1992–1994 21.89 22.69 22.90 Data courtesy of the following sources: aGerald W. Evers, Texas A&M Univ. Agricultural Research and Extension Center, Overton, Texas (from Proceedings Amer. Forage and Grass. Conf., 2001, Arkansas) bMississippi Forage Crop Variety Trials Information Bulletin 356, 1999 cJerrry L. Baker – NF21 Forage Yields 2003 at Noble Foundation, Ardmore, OK dPersonal communication – Mike Davis, Auburn University eJohn Andrae – Dept. of Entomology, Clemson University fhttp://www.aces.edu/dept/forages/bermudagrass/russell_bermuda.htm Vogel and Jung (2001) presented strategies to modify plants for the optimal use as feedstocks for biofuels. They state that besides traits such as cellulose and lignin concentration, other traits that affect recalcitrance be determined. Reduction in recal-citrance has historically been measured by digestion of dry matter by ruminant mi-crobes for improving forage quality. Breeding for improved quality for forages, as defined as increased animal production per unit dry matter, began in the 1960’s. This became possible when in vitro laboratory techniques were devised to improve effi-ciency of evaluating material for forage quality (Tilley and Terry 1963; Monson et al. 1969). Broad sense heritability (h2) estimates for in vitro dry matter digestibility (IVDMD) ranged from 0.27 to 0.69 (Burton and Monson 1972) and breeding efforts resulted in a number of cultivars with improved forage quality (Burton 1972; Taliaf-erro and Richardson 1980; Burton and Monson 1984; 1988; Eichhorn et al. 1986; Burton et al. 1993). The first bermudagrass forage with improved quality, ‘Coastcross-1’ (Burton 1972), was a hybrid derived from a cross between ‘Coastal’ and a C. nlemfuënsis var. robustus (Harlan et al. 1970a) plant introduction from Kenya. The changes in bio-

Improvement of Perennial Forage Species as Feedstock for Bioenergy 325
degradation of specific cell wall types between ‘Coastcross-1’ (CC 1) and ‘Coastal’ were studied via histochemical techniques (Akin et al. 1990). They reported that the parenchyma bundle sheaths of CC 1 displayed less UV absorbance, indicative of lower levels of phenolic acid esters than in ‘Coastal’. This suggested that reduced levels of these compounds contributed to improved cell wall degradation. In another highly digestible cultivar, ‘Tifton 85’ (Burton et al. 1993), the ratio of ether- to ester-linked phenolic acids was lowered, resulting in improved bioconversion (Mande-bvu et al. 1999a;b). Despite the higher cell wall content (as evidenced by the higher NDF and ADF values) of ‘Tifton 85’ bermudagrass relative to ‘Coastal’, the cell wall of ‘Tifton 85’ was more digestible. The concentration of esterified ferulic acid was similar for 3- and 6-week old ‘Tifton 85’ (11.6 and 10.0 g kg–1, respectively) and ‘Coastal’ (10.6 and 10.6 g kg–1, respectively), but the concentration of etherified ferulic acid was lower for ‘Tifton 85’ (6.2 and 4.9 g kg–1, respectively) than for Coastal (8.1 and 7.6 g kg–1, respectively) (Mandebvu et al. 1999b). In a similar study, Hatfield et al. (1997) concluded that the higher digestibility of ‘Tifton 85’ over ‘Coastal’ bermudagrass was due to lower lignin content and lower levels of cross-linked polysaccharides resulting from the lower levels of ether-linked ferulates.
Table 12.2. Yields of ‘Tifton 85’ bermudagrass, ‘Alamo’ switchgrass, and ‘Merkeron’ napier-grass at three locations in Georgia from 1996 to 2001 (Mg dry matter ha–1). From: Final Re-port for 1996–2001; Bioenergy Crop Breeding and Production Research in the Southeast, ORNL/SUB-02-19XSV810C/01 (J.H. Bouton, University of Georgia)
1996 1997 1998 1999 2000 2001 Average Athens Bermudagrass (Tifton 85) 9.3 24.9 16.6 13.9 18.5 22.6 17.6 Switchgrass (Alamo) 6.7 21.4 16.6 19.0 11.0 22.1 16.1 Napiergrass (Merkeron) 23.8 32.1 33.6 39.6 19.2 16.3 27.5 Tifton Bermudagrass (Tifton 85) 9.9 15.8 24.3 15.5 19.2 20.4 17.5 Switchgrass (Alamo) 6.3 13.8 21.6 17.7 16.6 21.8 16.3 Napiergrass (Merkeron) 41.6 30.8 39.8 17.9 24.9 13.3 28.1 Midville Bermudagrass (Tifton 85) 11.8 24.2 22.1 12.5 17.2 17.6 Switchgrass (Alamo) 6.8 15.4 17.7 4.2 13.1 11.5 Napiergrass (Merkeron) 20.1 48.9 45.9 20.1 18.6 25.6 LSD (5%) for Midville 2.0 5.0 5.2 3.0 4.2
Recently studies have been conducted to evaluate some of the released cultivars for bio-conversion using enzymatic hydrolysis with ferulic-acid esterase and cellu-lases. One study did not reveal significant differences between genotypes in the amounts of phenolic acids (Anderson et al. 2005), but a second study supported that ‘Tifton 85’ has higher levels of ester-linked phenolic acids than either ‘Coastal’ or ‘Coastcross II’ (CCII) (Anderson et al. 2008). The data suggest that the superior

326 Anderson, Casler and Baldwin forage quality of the ‘Coastcross’ lines and ‘Tifton 85’ translate into higher conver-sion efficiency to sugars and ultimately to ethanol. It appears, however that different genes are involved in the reduction of recalcitrance for these two bermudagrass cul-tivars. The ‘Coastcross’ lines have lower levels of phenolic acid esters in the paren-chyma bundle sheaths than ‘Coastal’, whereas ‘Tifton 85’ appears to have more ester-bound phenolic acids that are more easily released with esterases. Though the USDA-NPGS maintains 328 accessions (USDA-ARS, National Ge-netic Resources Program 2007), the largest known collections of diverse Cynodon germplasm are found at Oklahoma State University (Stillwater, OK) and the USDA-ARS breeding program in Tifton, GA. Oklahoma State University has had an active bermudagrass breeding program and currently maintains over 700 accessions that includes plant introductions from around the world, current cultivars and breeding lines (Yanqi Wu – personal communication). The USDA-ARS forage breeding pro-gram at Tifton, GA maintains over 700 accessions, most of which originated from African collections (Taliaferro et al. 2004). The collection began with collection trips in the 1930’s and also includes past and present breeding lines. From the full Tifton collection a very diverse forage bermudagrass core collection with 175 plant intro-ductions was developed through phenotypic and ploidy level evaluations (Anderson 2005). This collection has been analyzed for fiber components and IVDMD (Ander-son 2006). There was significant variation among entries for IVDMD (483–710 g kg–1), NDF (643–773 g kg–1) and acid detergent fiber ADF (241–345 g kg–1). IVDMD was negatively correlated with NDF (R2 = –0.86) and ADF (R2 = –0.58). ADF and NDF were correlated (R2 = 0.71), but entries such as ‘Tifton 68’ had very high digestibility despite moderately high NDF and ADF. A smaller but diverse group of entries was selected from within the core collection for evaluation of bio-mass-to-ethanol conversion using a dilute-acid pretreatment followed by simultane-ous saccharification and fermentation (SSF). The 50 bermudagrass lines varied for both ethanol production (105–167 mg g–1 DM) and pentose released (133–222 mg g–
1 DM). The common bermudagrass cultivars produced more ethanol but less pentose sugars than the switchgrass control (Table 12.3).
Table 12.3. Ethanol production and pentose residue of bermudagrass and switchgrass after dilute acid hydrolysis and simultaneous saccharification and fermentation (SSF) with yeast strain Saccharomyces cerevisiae D5A. Data courteously supplied by Bruce Dien (USDA-ARS, Peoria, IL)
When compared with other potential bioenergy feedstock grasses, bermudagrass had higher conversion efficiency to ethanol. Using dilute-acid pretreatment followed by SSF (Anderson et al. 2008), bermudagrass produced more ethanol than a mid-maturity switchgrass check (Table 12.3) and more than either napiergrass (Pennise-
Entry Ethanol production [mg/g]1 Pentose residue [mg/g]1 Tifton 85 159.7a 182.8c Coastcross II 156.5a 198.8b Coastal 145.9b 171.0d Switchgrass 116.2c 206.3a
1Means with the same letter are not significantly different (α = 0.05)

Improvement of Perennial Forage Species as Feedstock for Bioenergy 327
tum purpureum) or giant reed (Arundo donax) (Table 12.4). It is important to note that the bermudagrass lines ‘Coastal’ and ‘Tifton 85’ were sampled at 12 weeks, which is past the prime harvest period of 4–6 weeks that ensures the best forage quality, yet it resulted in more ethanol than the tall bunch grasses. In addition, it is noteworthy that in contrast to what was observed for the bunch grasses, bermuda-grass stem and leaf tissue converted equally well (Table 12.4). Very little research has been conducted to determine genetic differences of the forage grasses for thermo-chemical conversion of biomass to energy. Thermo-chemical procedures involve gasification followed by either biological or catalytic conversion of the resultant synthesis gas to methanol and/or ethanol. This process may be more flexible with respect to feedstock, and may provide higher ethanol yields per ton (>400 l) than the hydrolysis-based procedures, and at lower costs (<US$0.25 l–1) than corn ethanol (Bransby 2006). One study indicated that there is no difference between leaf and stems of ‘Coastal’ and ‘Tifton 85’ bermudagrass for production of syngas (Boateng et al. 2007).
Table 12.4. In vitro dry matter digestibility (IVDMD), neutral detergent fiber (NDF), acid detergent fiber (ADF), acid detergent lignin (ADL) and ethanol production of leaf and stem tissues of 12-week old bermudagrass (Cynodon sp.), mature napiergrass (Pennisetum pur-pureum) and giant reed (Arundo donax) grown at Tifton, GA. 2004. Adapted from Anderson et al. (2008)
Species Genotype Tissue IVDMD1
[%] NDF1
[%] ADF1
[%] ADL1
[%] Ethanol [mg/g]1
Cynodon sp.
Tifton 85 Leaf 47.1c 77.6g 35.0abc 2.93a 139.6a
Cynodon sp.
Tifton 85 Stem 49.2c 77.5g 37.2cd 4.04b 141.1a
Cynodon dactylon.
Coastal Leaf 35.4e 77.0fg 33.7ab 3.85b 121.7b
Arundo donax
Cicily Leaf 54.1b 67.6ab 36.7bcd 3.82b 109.0bc
Pennisetum purpureum
Merkeron Leaf 58.5a 69.4bc 36.0abcd 3.04a 106.7bc
Pennisetum purpureum
Merkeron Stem 43.5d 74.2def 48.1ef 6.95c 105.3c
Pennisetum purpureum
N 190 Leaf 46.8c 73.0de 38.3d 3.53ab 96.7cd
Arundo donax
Fitzgerald Leaf 52.4b 65.5a 33.7a 4.14b 84.8d
Pennisetum purpureum
N 190 Stem 35.9e 74.1def 49.1f 7.90d 84.0d
Arundo donax
Fitzgerald Stem 22.6g 75.4efg 49.9f 8.98e 47.2e
Arundo donax
Cicily Stem 29.0f 71.9cd 45.9e 8.67e 44.2e
1Means with the same letter are not significantly different (α = 0.05)

328 Anderson, Casler and Baldwin 12.6.4 Future Outlook for Bermudagrass
There is great potential for further improvements of bermudagrass for yield and bio-conversion due to the tremendous diversity within the Cynodon taxa (Taliaferro et al. 2002). Increased knowledge of the genetic differences of cell wall components among diverse grass germplasm will help in determining specific genes of interest, and together with the development of molecular maps associated with these traits for marker-assisted selection (MAS), it will provide methods for genetic improvement of biomass species. Further histochemical and spectrophotometric evaluations will be needed on diverse germplasm to determine more specific compositional differences within specific cell types for mechanisms involved with decreased recalcitrance of grass cell walls that would facilitate increased efficiency of conversion of cellulose and hemi-cellulose portions of the dry matter to hexose and pentose sugars for fer-mentation (see Chapter 4). Genetic improvements of bermudagrass for conversion to ethanol through fermentation will likely coincide with forage quality improvements. This can help both the biofuel and forage industries and give growers marketing options for their hay. The current price of good-quality hay (US$40 – $50 Mg–1), and the relatively high requirements of nitrogen fertilizer and water may, however, limit biomass available for bioenergy to older, lower-quality feedstock.
12.7 Napiergrass
12.7.1 Botanical Description
Napiergrass (Pennisetum purpureum (L.) Schum.) is a major forage crop in the wet tropics of the world. It has the potential to produce more dry matter per unit time than most other grasses (Hanna et al. 2004). Napiergrass is in the tribe Paniceae of the Poaceae (Panicoideae) family (Bogdan 1977). It is indigenous to equatorial Af-rica in areas of rainfall exceeding 1,000 mm. There is great variability with the spe-cies and naturally cross-pollination has occurred (Bogdan 1977; Skerman and Riveros 1990). Napiergrass is a bunch-type grass that produces robust, creeping rhizomatous plants that has a perennial growth habit in the tropics and subtropics and forms bamboo-like clumps that grow up to 7 m in height. The species grows best in regions with hot temperatures (30–35°C) (Ferraris 1978); growth stops when tem-peratures are below 10°C (Bogdan 1977). Frost will kill leaves and above-ground stems, but the underground parts will resume growth at the beginning of the spring if the soil does not freeze. Napiergrass is thus adaptable to USDA hardiness zones 8 and 9 (Hanna et al. 2004). Napiergrass has wide adaptation to diverse soil conditions, but is best adapted to deep, well-drained, fertile soils. This species also has substan-tial drought tolerance due to its deep fibrous root system, but it responds to irrigation and it will produce large amounts of biomass when fertilized, particularly with N (Skerman and Riveros 1990). Napiergrass is a short-day plant that flowers when day length is 11 h or less, and there appears to be an interaction between day length and temperature. At Tifton, GA less than 5% of the accessions flower during an 11-h day. Plants tend to remain vegetative and leafy during long days, but as days become

Improvement of Perennial Forage Species as Feedstock for Bioenergy 329
shorter the proportion of stem tissue increases and the plants change to a reproduc-tive stage (Hanna et al. 2004). Napiergrass is a cross-pollinated allopolyploid with 2n = 4x = 28 chromosomes (Hanna 1981) with the genome formula A'A' BB. The A'A' genome is homologous to the AA genome of pearl millet (Pennisetum glaucum (L.) R. Br.). The A' genome chromosomes are larger than the B genome chromosomes. The B genome supplies the genes controlling perennial growth habit. Napiergrass sets few seed, partially due to self-incompatibility and the fact that a single genotype or clone may occupy a large area. Stigmas are exerted before pollen is shed, which enforces cross-pollination and simplifies crossing and producing hybrids (Hanna et al. 2004).
12.7.2 Management and Bioprocessing
Napiergrass is generally propagated by stems and rhizomes, because most genotypes do not produce large numbers of seed. In adition, plants from seed tend to not breed true, grow slowly and are weak. Rapid multiplication and dissemination of superior germplasm is possible with vegetative propagation, but it is more labor-intensive and costly and can predispose clonal material to disease (Boonman 1993). Although some developments in mechanization for establishing napiergrass have reduced labor inputs (Sollenberger et al. 1990), there is still a need for improved mechanization for harvesting planting material and the planting process itself. Perhaps methods used in the sugarcane industry can be adapted. Woodard et al. (1985) reported that tall napiergrass is easily established from stem cuttings, especially from the lower stalk (less mature). Maximum planting depths should not exceed 10 cm. The number of shoots that emerged from stem cuttings increased as the stems were cut into shorter pieces due to apical dominance, i.e. the buds at nodes at either end of the cutting tended to begin growth while buds at nodes between the outer nodes remained dor-mant. Many studies have focused on the effects of fertilizer on yield and forage quality (Hanna et al. 2004). Under optimum experimental conditions, high fertilizer input and a year-round growing season, napiergrass is capable of producing 70–85 Mg ha–1 yr–1 DM (Vicente-Chandler et al. 1959). Under more realistic farm practices, total DM accumulation can range from 5–10 Mg ha–1 yr–1 in unfertilized swards, and from 15–30 Mg ha–1 yr–1 in well-fertilized pastures (Bogdan 1977; Skerman and Riveros 1990). Woodard and Prine (1990) recommended annual N-P-K fertilizer rates of 225-25-90 kg ha–1 for the released line ‘Merkeron’. Highest yields are obtained un-der long growing seasons and warm temperatures. Napiergrass responds very well to high N fertilization levels. In Florida napiergrass (PI 300086) was fertilized with 330 kg N ha–1 yr–1 and harvested at a 3-cm stubble every 6, 8, 12, and 24 weeks during a 24-week period (Calhoun and Prine 1985). Averaged across two years, yield in-creased from approximately 20–40 Mg ha–1 yr–1 as the harvest interval was increased from 6 to 24 weeks. The effect of the harvesting interval varies by genotype, but in general long harvest intervals increases DM production and aids persistence (Woodard and Prine 1991; Hanna et al. 2004). Harvesting can be accomplished using conventional silage choppers with large heads if the plants are planted in spaced

330 Anderson, Casler and Baldwin rows. Older material may require more heavy-duty equipment such as used in the sugarcane industry. The most desirable characteristic of napiergrass is its yield potential, probably the highest among the forage grasses (Bogdan 1977; Schank and Hanna 1995). Research has shown that napiergrass consistently produces more DM than other grasses and legumes (Vicente-Chandler et al. 1974; Hoshino et al. 1979; Tergas and Urrea 1985). Cultivar ‘Merkeron’ yielded 27.1 Mg ha–1 versus 17.6 Mg ha–1 for ‘Tifton 85’ ber-mudagrass and 14.8 Mg ha–1 for ‘Alamo’ switchgrass when averaged over 6 years and three locations in Georgia (Table 12.2) when applying a total of 168 kg ha–1 N and harvesting twice during the year. Note that yields of napiergrass were signifi-cantly lower in 2001 and to a lesser extent in 2000. Yields of napiergrass lines tested in southern and central Florida, grown on a range of soil and cultural practices in-cluding sewage effluent and phosphate mining sites, were between 30 and 60 Mg ha–
1 yr–1 (Prine et al. 1997). Napiergrass yields in northern areas of the South have ranged from the 20 to 30 Mg ha–1 yr–1 (Prine et al. 1991). Cultivars of napiergrass are all propagated vegetatively. Alcantara et al. (1980) list a number of napiergrass cultivars. Burton (1989) selected ‘Merkeron’ with im-proved yield and disease resistance from a cross between a high-yielding clone and a dwarf leafy clone. Reynolds and Sini (1976) produced superior genotypes by inter-crossing various napiergrasses. Grof (1969) selected improved genotypes from an open-pollinated progeny of a napiergrass cultivar. Hanna and Monson (1988) se-lected a semi-dwarf genotype from the F2 progeny of ‘Merkeron’, which was re-leased as ‘Mott’ (Sollenberger et al. 1988). A more recent publication by Xavier et al. (1995) listed additional cultivars available in Brazil.
12.7.3 Genetics and Breeding
Napiergrass is known to possess genetic improvement potential through the avail-ability of diverse genetic clones that can be recombined through traditional cross-breeding. This could lead to much higher sustainable yields than already attained, reducing the production area needed for biomass feedstocks and reducing transport costs. Extensive breeding and yield evaluations were performed in Florida during the 1980’s. Germplasm varies for cold tolerance (survived –18°C at Tifton, GA) which makes it possible to extend the use of this plant into the subtropics. Accessions vary in their ability to retain leaves after frost. The 100-accession napiergrass nursery at Tifton, GA was rated for leaf retention in mid-February after killing frosts in mid-December. On a rating scale of 1 (complete leaf retention) to 5 (no leaf retention), over 30% of the clones have a rating of less than 3. Most of these clones are dwarf or semi-dwarf, but some are erect, robust types (Hanna et al. 2004). Interspecific crosses with pearl millet further increases genetic variability yield, pest resistance, and other desirable traits, such as methane yield resulting from anaerobic fermenta-tion reactions (Schank et al. 1993; Hanna et al. 1984). Leaf/stem ratios varied be-tween 0.12 and 0.87 in the nursery. The range of NDF within the Tifton nursery ranged from 653 to 844 g kg–1 (unpublished data). Napiergrass exhibits progyny (i.e. the stigma is receptive before the anthers re-lease pollen); stigmas are exerted over a 3–4 day period, beginning at the top of the

Improvement of Perennial Forage Species as Feedstock for Bioenergy 331
inflorescence. The anthers are exerted later for a similar length of time. This allows crossing to take place by placing glassine bags possessing pollen from the male par-ent over the receiving female inflorescence (Hanna et al. 2004). Due to the sufficient fertility to produce viable hybrid seed, napiergrass is condu-cive to genetic improvement through breeding and has been crossed with annual pearl millet for improved quality. The interspecific hybrid is a triploid (AA = B ge-nomes) with 2n = 3x = 21 chromosomes (seven chromosomes from pearl millet and 14 chromosomes from napiergrass). Triploid hybrids resulting from the interspecific cross are usually highly variable because of the heterozygosity of napiergrass, even if the pearl millet parent is an inbred (Hanna et al. 2004). Fertility can be induced in the sterile triploid hybrid by doubling the chromosome number to produce a male and female fertile hexaploid with 2n = 6x = 42 chromosomes. The hexaploid interspecific hybrid has potential as a seed- as well as vegetatively-propagated biomass feedstock if seedling vigor and persistence can be improved. Schank and Diz (1991) reported on stable seed-propagated interspecific hybrids that combined yield and quality of the hybrid with the convenience of seed production. The hexaploid can be back-crossed to pearl millet to produce vigorous 2n = 4x = 28 plants (AAA'B genomes). These hybrids can be quite leafy and high in quality, similar to pearl millet, due to the extra A genome. They are completely male- and female-sterile, perennial like the triploid, and must therefore be vegetatively propagated. The largest collection of napiergrass germplasm is present at the nursery in Tifton, GA where over 100 plant introductions from around the world and breeding line material from intra- and inter-specific crosses are maintained (Hanna et al. 2004). Napiergrass was also successfully crossed with Pennisetum squamulatum Fre-sen., an apomictic species, to produce partially seed-fertile apomictic interspecific hybrids at Tifton, GA (Hanna et al. 2004). It should be possible through continued backcrossing to transfer the gene(s) controlling apomixis to napiergrass. Apomixis could be used to produce true-breeding, seed-propagated cultivars in napiergrass and the pearl millet × napiergrass interspecific hexaploid hybrids regardless of the het-erozygosity of the cultivars. The potential exists to alter cell wall components conducive to the breakdown and conversion to ethanol. Preliminary analysis of the napiergrass cultivar ‘Merk-eron’ revealed a significant release of fermentable sugars after ferulic acid esterase pretreatment followed by cellulase (Table 12.5), although it still needs to be investi-gated whether compounds that inhibit conversion to ethanol were released (Anderson et al. 2005). In a separate study leaves were separated from stems in two napiergrass genotypes and analyzed for conversion to ethanol using a standard SSF method (Ta-ble 12.4). Variability existed between the two genotypes and to a lesser extent be-tween the leaf and stem portions. To some extent the variation was correlated to NDF content. Digestibility and fiber analyses have been performed on the 100-accession napiergrass nursery located at Tifton, GA that includes interspecific hybrids with P. glaucum and P. squamulatum. Mature stalks were sampled over two years; leaf and stem were separated and analyzed separately for in vitro dry matter digestibility (IVDMD), NDF, ADF and acid detergent lignin (ADL). Values for IVDMD were generally higher for leaves (Table 12.6). NDF, ADF and ADL were higher for stems
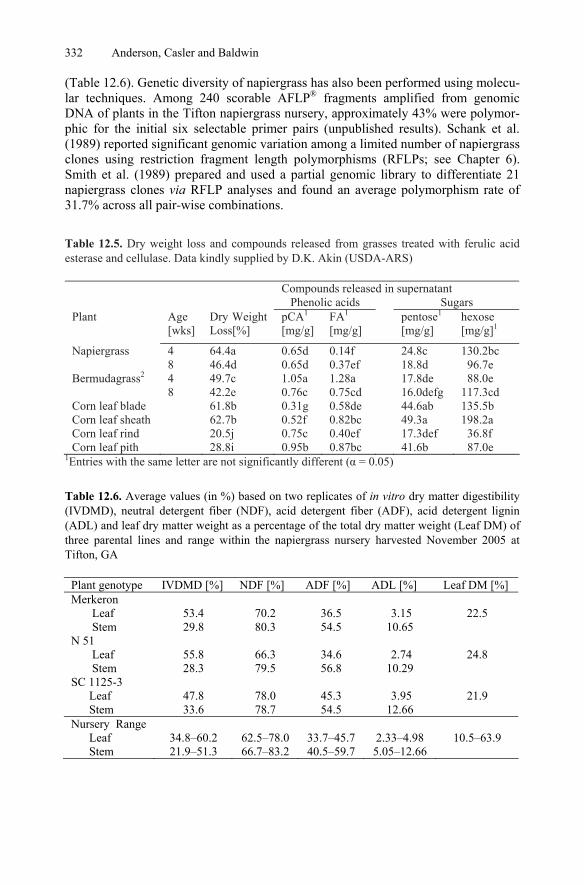
332 Anderson, Casler and Baldwin (Table 12.6). Genetic diversity of napiergrass has also been performed using molecu-lar techniques. Among 240 scorable AFLP® fragments amplified from genomic DNA of plants in the Tifton napiergrass nursery, approximately 43% were polymor-phic for the initial six selectable primer pairs (unpublished results). Schank et al. (1989) reported significant genomic variation among a limited number of napiergrass clones using restriction fragment length polymorphisms (RFLPs; see Chapter 6). Smith et al. (1989) prepared and used a partial genomic library to differentiate 21 napiergrass clones via RFLP analyses and found an average polymorphism rate of 31.7% across all pair-wise combinations.
Table 12.6. Average values (in %) based on two replicates of in vitro dry matter digestibility (IVDMD), neutral detergent fiber (NDF), acid detergent fiber (ADF), acid detergent lignin (ADL) and leaf dry matter weight as a percentage of the total dry matter weight (Leaf DM) of three parental lines and range within the napiergrass nursery harvested November 2005 at Tifton, GA
Plant genotype IVDMD [%] NDF [%] ADF [%] ADL [%] Leaf DM [%] Merkeron Leaf 53.4 70.2 36.5 3.15 22.5 Stem 29.8 80.3 54.5 10.65 N 51 Leaf 55.8 66.3 34.6 2.74 24.8 Stem 28.3 79.5 56.8 10.29 SC 1125-3 Leaf 47.8 78.0 45.3 3.95 21.9 Stem 33.6 78.7 54.5 12.66 Nursery Range Leaf 34.8–60.2 62.5–78.0 33.7–45.7 2.33–4.98 10.5–63.9 Stem 21.9–51.3 66.7–83.2 40.5–59.7 5.05–12.66
Table 12.5. Dry weight loss and compounds released from grasses treated with ferulic acid esterase and cellulase. Data kindly supplied by D.K. Akin (USDA-ARS)
Compounds released in supernatant Phenolic acids Sugars Plant Age
[wks] Dry Weight Loss[%]
pCA1 [mg/g]
FA1
[mg/g] pentose1
[mg/g] hexose [mg/g]1
Napiergrass 4 64.4a 0.65d 0.14f 24.8c 130.2bc 8 46.4d 0.65d 0.37ef 18.8d 96.7e Bermudagrass2 4 49.7c 1.05a 1.28a 17.8de 88.0e 8 42.2e 0.76c 0.75cd 16.0defg 117.3cd Corn leaf blade 61.8b 0.31g 0.58de 44.6ab 135.5b Corn leaf sheath 62.7b 0.52f 0.82bc 49.3a 198.2a Corn leaf rind 20.5j 0.75c 0.40ef 17.3def 36.8f Corn leaf pith 28.8i 0.95b 0.87bc 41.6b 87.0e
1Entries with the same letter are not significantly different (α = 0.05)

Improvement of Perennial Forage Species as Feedstock for Bioenergy 333
12.7.4 Future Outlook for Napiergrass
Napiergrass has great potential as a biofuel feedstock primarily because of its high yield potential. Though most of the dry weight of the plant is stem, genetic variabil-ity appears to be present to alter either leaf/stem ratios or stem cell wall components or both to make it more amenable to degradation. If thermo-chemical processes are used, then yield and ash content become the primary genetic traits to alter. More research is required if the biomass needs to be dried prior to trabsport and bioproc-essing. Improving leaf retention to enhance crop drying in the field prior to harvest may be essential. Developing seeded varieties with or without apomixis should be possible through hybridization with related annual and perennial species. Cold toler-ance should be improved to enable growth in northern hardiness zone 8 and into zone 7. The fact that flowering is day-length sensitive may be an advantage. Cross-ing and seed production could be accomplished in southern areas of Florida or Texas (hardiness zone 9), while the inability to outcross and set seed in climate zones 7 and 8 would reduce invasiveness of the crop and direct all nutrient sinks to vegetative production. Tremendous genetic variability exists in germplasm within the United States to accomplish many of these goals. External sources of germplasm may also be available.
12.8 Eastern Gamagrass
12.8.1 Botanical Description
Eastern gamagrass (Tripsicum dactyloides L.) shares the same subtribe as maize (Zea mays; Chapter 7). It is a native perennial warm-season bunchgrass of the eastern United States extending from central Texas to southeastern Nebraska and central Iowa and east to the Atlantic Ocean. Eastern gamagrass ranges in height from 1 to 3 m (USDA-NRCS 2006). It is highly palatable for grazing, which may be the primary reason it has been overgrazed, resulting in reduced native stands (Kindiger and De-wald 1997). Leaves are 30–95 mm long and 1–6 mm wide. Plants will reproduce vegetatively from proaxes, which are similar to knotty rhizomes. It forms seed from racemes which are 30–50 mm long. Gamagrass does best in well-drained soils with a pH range of 5.1–7.5 (USDA-NRCS 2006). It is monoecious with both male and female flowers on the raceme. The top three-quarter of the raceme is made up of male flowers and the bottom one-quarter of female flowers (Springer and Dewald 2004). Seed set is low and generally has a low germination rate. One exception is a mutant form which is gynomonoecious (Dewald and Dayton 1985). This mutant was identified in 1981 at the USDA-NRCS Plant Materials Center (Springer and Dewald 2004) and shown to be the result of a recessive mutation (Dewald et al. 1987). This mutant has been used to produce hybrids with a 20–25-fold increase in seed set (Springer and Dewald 2004). Eastern gamagrass is predominatly diploid (2n = 2x = 36) and tetraploid, but only the diploids are sexual and cross-pollinated, whereas the tetraploids are apomictic (Burson et al. 1990).

334 Anderson, Casler and Baldwin 12.8.2 Management and Bioprocessing
The primary reason limiting the use of eastern gamagrass as a forage or bioenergy feedstock is the difficulty of obtaining good establishment (Springer et al. 2004). Most often up to 15 kg ha–1 of fungicide-treated seed are planted in the early spring using similar methods and sowing equipment as used for maize and established methods of weed control are used after planting (USDA-NRCS 2006). It is necessary to break seed dormancy by either moist scarification (i.e. placing seeds in warm, moist containers), removing the cupule, or applying hydrogen peroxide (USDA-NRCS 2006). However, winter planting of non-scarified seed has been recom-mended (USDA-NRCS 2006). Factors limiting yield are primarily water availability (800 mm optimum) and nitrogen fertilization (224 kg N ha–1). Yields are maximized when harvesting at 6-week intervals, two or three times per year (Dewald et al. 2004). Yields have ranged from 6 to 16 Mg ha–1 (USDA-NRCS 2006). The grass is cut, dried and baled similar to most forage species when used as hay. Most research, however, has focused on eastern gamagrass as a grazing forage. The energy-profit ratio of using eastern gamagrass in the Conservation Reserve Program for biocrude was determined to be similar to using big bluestem or indian-grass (Nelson et al. 1994). One attractive aspect of eastern gamagrass is the low nitrogen and phosphate uptake levels compared to other warm-season grasses (Esquivel et al. 2000), which would be an advantage in direct combustion or pyroly-sis. When left in the field to leach nutrients, however, eastern gamagrass lodges and looses biomass (USDA-NRCS 2006). Breeding efforts should focus on improved yields, lower inputs and reduced lodging.
12.8.3 Genetics and Breeding
The female florets mature much faster than the male florets on the same inflores-cence (Dewald and Kindiger 2000). Methods used for pollinations of eastern gama-grass are described by Dewald and Kindiger (1994). Emasculations are often per-formed to reduce pollen contamination. This is achieved by removing the terminal male section of the inflorescence and then covering the lower female portion with pollination bags (Kindiger and Dewald 1997). The work of Kindiger and Dewald (1997) helped identify methods of transferring genes between the sexual diploids and apomicitic tetraploids. They found that triploids and hexaploids were useful cyto-types to introgress and transfer desirable alleles across species and reproductive barriers, and that these crossing schemes could help discover and utilize the diversity within the genus. A great deal of genetic variability exists within the Tripsicum species as it has only been recently domesticated. Cultivar and germplasm releases began in 1988 with the sexual diploid ‘Pete’ and have been followed by a number of apomictic tetraploids (USDA-NRCS 2006). The latest cultivar,‘Verl’, was released in 2005 by the USDA-ARS with the Oklahoma Agricultural Experiment Station and USDA-NRCS (Springer et al. 2006). ‘Verl’ is a fertile triploid (2n = 3x = 54) that was pro-duced by crossing a gynomonoecious diploid (2n = 2x = 36) with a tetraploid (2n =

Improvement of Perennial Forage Species as Feedstock for Bioenergy 335
4x = 72). It has excellent seed production, but is susceptible to maize billbug and southern cornstalk borer (USDA-NRCS 2006). Blakey et al. (2007) provided an excellent review of Tripsicum genetics and provide a comparison with maize. The major emphasis in early studies on eastern gamagrass was to transfer the gene(s) conferring apomixis into maize and to deter-mine the genetics of the trait. Currently, gynomonecious sex form 1 (gsf1) is the only phenotypic trait placed on the Tripsicum genetic map and Goldman (2006) has de-veloped a PCR-based marker for the presence of this trait in Tripsicum breeding stocks. A Tripsicum genetic map has been constructed (Lawrence et al. 2005), which will help in future work on targeting traits of interest for MAS in eastern gamagrass. The USDA-ARS Southern Plains Range Research Station (SPRRS), Woodward, OK (36° 25' N, 99° 24' W, elevation 586 m) has maintained a large vegetative collec-tion of eastern gamagrass since 1976 that holds presently about 400 accessions. This collection consists of wild germplasm collected throughout the eastern half of the U.S. as well as experimental lines developed at the SPRRS. The accessions include diploid types that undergo sexual reproduction, and triploid and tetraploid types that reproduce by apomixis. It also contains plants that are homozygous for the recessive gynomonoecious gsf1 allele (Springer – personal communication). Tropical acces-sions are present within the USDA-NGRP. An in vitro ruminal (IVR) digestion assay for estimation of ethanol production was first tested with switchgrass, big bluestem and eastern gamagrass (Weimer et al. 2005). This method greatly reduces time and expense in evaluating feedstocks for ability to ferment to ethanol. Eastern gamagrass gave the best fit in a linear regres-sion between gas production from IVR and ethanol production (R2 = 0.824). This method along with the traditional IVDMD and in vitro organic matter digestibility (IVOMD) methods were used in a second study that evaluated eastern gamagrass, big bluestem and what is referred to a sand bluestem at multiple locations over three years (Weimer and Springer 2007). They reported that big bluestem had higher fer-mentability than either eastern gamagrass or sand bluestem, but that yields were higher for eastern gamagrass over locations (6.0–7.9 Mg ha–1) than either big blue-stem (3.9–4.5 Mg ha–1) or sand bluestem (5.9–6.4 Mg ha–1). There were, however, significant environmental effects on fermentability, as well as significant varietal differences. Both ‘Pete’ and ‘Verl’ had superior ruminal fermentation abilities (Weimer and Springer 2007). Another significant development from the study was the apparent success of calibrating near infrared spectroscopy (NIR; see Chapter 5) with both in vitro fermentative gas production and in vitro digestibility from standard IVDMD and IVOMD. The much faster and more efficient NIR technique would greatly enhance breeding and selection efforts for improving these grasses for con-version to ethanol.
12.8.4 Future Outlook for Eastern Gamagrass
Eastern gamagrass is a native grass that has been genetically improved to a limited extent for use as forage. Recent advances in breeding mechanisms, the great amount of genetic variability and cross compatibility between sexual and apomictic types suggest that there is great potential of improving the species as a bioenergy feed-
336 Anderson, Casler and Baldwin stock. If feedstock material is be harvested from CRP land, the use of native species may be an advantage to producers and land owners. Though the use of molecular genetics for developing markers for MAS is currently limited to the gsf1 gene, it should be possible to use information from the Tripsicum map and information from the closely related maize genome to develop molecular tools for the improvement of the Tripsicum species.
12.9 Summary
In the United States a tremendous area is currently planted with perennial grasses and legumes used for forage. Planting, maintenance, harvest techniques and equip-ment are well established for both native and introduced species. Genetic improve-ments for yield and cell wall degradation have been achieved in many species, with potential for improvement in all species that are suitable as biomass feedstocks. In many cases yield is comparable to switchgrass or other proposed feedstocks, but sufficient water and soil fertility is often required for superior production. Exploitation of perennial species is being driven by these species’ ability to season-ally scavenge nutrients from their above-ground biomass and store them in their crown during the winter months to be remobilized in the spring for rapid growth. Producing these grasses for quality forage requires timely harvest to maintain high digestibility, low fiber, high crude protein, and high mineral content. Delaying har-vest of perennial grasses results in above ground biomass that is higher in fiber and lower in minerals and proteins than material harvested during the growing season (Perry and Baltensperger 1979; Griffin and Jung 1983; Forwood and Magai 1992). While switchgrass has myopically dominated research on biomass conversion for ethanol production, other species merit research, because basing such massive pro-duction on a single species bears inherent risks. The warm-season grass species dis-cussed in this chapter merit attention, especially with regard to particular agronomic characteristics. Probably the greatest shortcoming as a potential feedstock is the competition for use. The great majority of production area is used for grazing, with the remainder used for hay production (especially alfalfa). The profit obtained by growers in the form of cattle gains or hay for forage currently drives the market. Possibly the best scenario lies with alfalfa in which a separation of leaves and stems could provide higher value to the crop than its current value. Feedstock for biofuel will provide a secondary market for the perennial grasses, especially when forage land is not man-aged for the required quality needed as forage, or when climate prevents harvesting at the appropriate time. Napiergrass, however, is the one grass reviewed in this chapter that has potential as a dedicated bioenergy feedstock. It is currently not an important forage in the U.S., but high yields have been obtained in many areas into the USDA hardiness zone 7. Sufficient intra- and inter-specific genetic variability appears to be present to further improve yields. Leaf retention and plant characteristics will need to be altered to adapt to methods of harvest that could reduce moisture and mineral content once the crop has senesced. If processing requires cell wall breakdown to fermentable

Improvement of Perennial Forage Species as Feedstock for Bioenergy 337
sugars, genes from brown midrib pearl millet should be transferable to napiergrass. Cold tolerance and low inputs for production are two further traits requiring im-provements.
Acknowledgments
We want to thank Dr. Steve Larson (USDA ARS Forage and Range Research Lab, Utah State University, Logan, UT) for correspondence and unpublished information, Dr. C. Corley Holbrook (USDA ARS, Crop Genetics and Breeding Research Unit, Tifton, GA) and Dr. Wayne W. Hanna (Universtiy of Georgia, Tifton, GA) for inter-nal reviews.
References
Adler, P.R., Sanderson, M.A., Boateng, A.A., Weimer, P.J., and Jung, H.G. (2006) Biomass yield and biofuel quality of switchgrass harvested in fall or spring. Agron. J. 98,1518–1525.
Akin, D.E., Ames-Gottfred, N., Hartley, R.D., Fulcher, R.G., and Rigsby, L.L. (1990) Mi-crospectrophotometry of phenolic compounds in bermudagrass cell walls in relation to rumen microbial digestion. Crop Sci. 30,396–401.
Alcantara, P.B., Alcantara, V.D.B.G., and Almeida, J.E.D. (1980) Studies on 25 prospective varieties of elephantgrass (Pennisetum purpureum Schum.). Bol. Ind. Anim. 37,279–302.
Alderson, J., and Sharpe, W.C. (1994) Grass varieties in United States. Agriculture Handbook No. 170. USDA, SCS, Washington, DC.
Anderson, D.E. (1961) Taxonomy and distribution of the genus Phalaris. Iowa State J. Sci. 36,1–96.
Anderson, W.F. (2005) Development of a forage bermudagrass (Cynodon sp.) core collection. Grassland Sci. 51,305–308.
Anderson, W.F. (2006) Digestibility and fiber of a forage bermudagrass core collection. ASA-CSSA-SSSA International Meetings Nov. 12–16, http://a-c-s.confex.com/crops/2006am/ techprogram/P21742.HTM.
Anderson, W.F., Dien, B.S., Brandon, S.K., and Peterson, J.D. (2008) Assessment of bermu-dagrass and bunch grasses as feedstock for conversion to ethanol. Appl. Biochem. Bio-technol. 14,13–12.
Anderson, W.F., Peterson, J.D., Akin, D.E., and Morrison, W.H., III. (2005) Enzyme pre-treatment of grass lignocellulose for potential high-value co-products and an improved fermentable substrate. Appl. Biochem. Biotechnol. 121–124,303–310.
Arinze, E.A., Schoenau, G.J., Sokhansanj, S., and Adapa, P. (2003) Aerodynamic seperation and fractional drying of alfalfa leaves and stems – A review and new concept. Drying Technol. 21,1669–1698.
Baldwin, B.S., and Cossar, R.D. (2005) Yield of four warm-season grasses and post frost losses due to weathering. (Proc.) 4th Eastern Native Grass Symposium. The University of Kentucky Department of Forestry, 3–6 October 2004, Lexington, KY. pp. 31–36.
Barkworth, M.E., and Atkins, R.J. (1984) Leymus hochst. (Gramineae: Triticeae) in North America: Taxonomy and distribution. Amer. J. Bot. 71,609–625.
Barnes, D.K., and Stephenson, M.G. (1971) Relative efficiences of four self-pollination tech-niques in alfalfa. Crop. Sci. 11,131–132.
338 Anderson, Casler and Baldwin Barnes, D.K., Bingham, E.T., Murphy, R.P., Hunt, O.J., Beard, D.F., Skrdla, W.H., and Teu-
ber, L.R. (1977) Alfalfa germpalsm in the United States: Genetic vulnerability, use, im-provement, and maintenance. U.S. Department of Agriculture, Tech. Bull. 1571, Washing-ton, DC. pp. 1–21.
Bennett, O.L. and Doss, B.D. (1960) Effect of soil moisture level on root distribution of cool-season forage species. Agron. J. 52,204–207.
Blakey, C.A., Costich, D., Sokolov, V., and Islam-Faridi, M.N. (2007) Tripsicum genetics: From observations along a river to molecular genomics. Maydica 52,81–99.
Boateng, A.A., Jung, H.G., and Adler, P.R. (2006) Pyrolysis of energy crops including alfalfa stems, reed canarygrass, and eastern gamagrass. Fuel 85,2450–2457.
Boateng, A.A., Anderson, W.F., and Phillips, J.G. (2007) Bermudagrass for biofuels: Effect of two genotypes on pyrolysis product yield. Energ. Fuel. 21,1183–1187.
Bogdan, A.V. (1977) Tropical pasture and fodder crops. Tropical agriculture series. Longman Group Ltd., London, UK.
Boonman, J.G. (1993) East Africa’s grasses and fodders: Their ecology and husbandry. Klu-wer Academic Publishers. London, England.
Bouton, J.H. (2002) Bioenergy crop breeding and production research in the southeast – Final report for 1996–2001, Oak Ridge Nat. Lab. Report ORNL/SUB-02-19XSV810/01.
Brummer, E.C., Bouton, J.H., and Kochert, G. (1993) Development of an RFLP map in dip-loid alfalfa. Theor. Appl. Genet. 86,329–332.
Burson, B.L., Voigt, P.W., Sherman, R.A., and Dewald, C.L. (1990) Apomixis and sexuality in eastern gamagrass. Crop Sci. 30,86–89.
Burton, G.W. (1951) Intra- and inter-specific hybrids in bermudagrass. J. Hered. 42,153–156. Burton, G.W. (1956) Utilization of heterosis in pasture plant breeding. In G.J. Neale (ed.)
Proc. Int. Grassl. Congr., 7th, Palmerston, North, NZ. 6–12 Nov. 1956. Wright and Car-man, Wellington, NZ. pp. 3–12.
Burton, G.W. (1972) Registration of ‘Coastcross-1’ bermudagrass. Crop Sci. 12,125. Burton, G.W. (1989) Registration of ‘Merkeron’ napiergrass. Crop Sci. 29,1327. Burton, G.W., DeVane, E.H. and Carter, R.L. (1954) Root penetration, distribution and activ-
ity in southern grasses measured by yields, drought symptoms and P32 uptake. Agron. J. 46,229–233.
Burton, G.W., Gates, R.N. and Hill, G.M. (1993) Registration of ‘Tifton 85’ bermudagrass. Crop Sci. 33,644–645.
Burton, G.W., and Hanna, W.W. (1995) Bermudagrass. In R.F. Barnes et al. (eds.) Forages – An introduction to grassland agriculture. Vol. 1. Iowa State Univ. Press, Ames. pp. 421–429.
Burton, G.W., and Hart, R.H. (1967) Use of self-incompatibility to produce commercial see-propagated F1 bermudagrass hybrids. Crop Sci. 7,524–527.
Burton, G.W., Jackson, J.E. and Hart, R.H. (1963) Effects of cutting frequency and nitrogen on yield, in vitro digestibility, and protein, fiber, and carotene content of Coastal bermu-dagrass. Agron. J. 55,500–502.
Burton, G.W., and Monson, W.G. (1972) Inheritance of dry matter digestibility in bermuda-grass, Cynodon dactylon (L.) Pers. Crop 12,375–378.
Burton, G.W., and Monson, W.G. (1984) Registration of ‘Tifton 68’ bermudagrass. Crop Sci. 24,1211.
Benes, S.E., Basinal, L.M., Finch, C., and Gratten, S.R. (2005) Crop selection for IFDM systems. In Technical Advisor’s Manual, Managing Agricultural irrigation drainage water. A guide for developing integrated on form drainage management systems J.E. Ayars, T. Jacobsen and L. Basiral (eds.). Westside Resources Conservation District Chapter 5. pp. 1–7.
Bransby, D. (2006) Generating ethanol from alternative crop biomass. ASA-CSSA-SSSA International Meetings Nov. 12–16, http://crops.confex.com/crops/2006am/techprogram/ 24088.HTM.
Burton, G.W. (1948) Coastal bermudagrass. Cir. 10. revised Ga Agric. Exp. Stn., Athens. 21 p.

Improvement of Perennial Forage Species as Feedstock for Bioenergy 339
Burton, G.W., and Monson, W.G. (1988) Registration of ‘Tifton 78’ bermudagrass. Crop Sci. 28,187–188.
Buxton, D.R., and Anderson, I.C. (1992) Selection of herbaceous energy crops for production in double cropping systems. In Proc. Ann. Automotive Tech. Dev. Contractor’s Meeting. 28–31 Oct. 1991, Dearborn, MI. Soc. Automotive Eng., Warrandale, PA. pp. 709–712.
Buxton, D.R., and Wedin, W.F. (1970) Establishment of perennial forages. I. Subsequent yields. Agron. J. 62,93–97.
Calhoun, D.S., and Prine, G.M. (1985) Response of elephantgrass to harvest interval and method of fertilization in the cooler subtropics. Soil Sci. Soc. Fla. Proc. 44,112–115.
Carlson, I.T., Oram, R.N., and Surprenant, J. (1996) Reed canarygrass and other phalaris species. In L.E. Moser et al. (eds.) Cool-Season Forage Grasses. ASA-CSSA-SSSA, Madison, WI. pp. 569–604.
Casler, M.D. and Hovin, A.W. (1980) Genetics of vegetative stand establishment characters in reed canarygrass clones. Crop Sci. 20,511–515.
Casler, M.D., and Hovin, A.W. (1985) Forage yield prediction from morphological traits in reed canarygrass. Crop Sci. 25,783–787.
Casler, M.D., and Undersander, D.J. (2006) Selection for establishment capacity in reed ca-narygrass. Crop Sci. 46,1277–1285.
Cassida, K.A., Muir, J.P., Hussey, M.A., Read, J.C., Venuto, B.C., and Ocumpaugh, W.R. (2005) Biomass yield and stand characteristics of switchgrass in south central U.S. envi-ronments. Crop Sci. 45,673–681.
Decker, A.M., Jung, G.A., Washko, J.B., Wolf, D.D., and Wright, M.J. (1967) Management and productivity of perennial grasses in the northeast. I. Reed canarygrass. West Virginia Agric. Exp. Stn. Bull. 550T.
Delucia, E.H., Heckthorn, S.A., and Day, T.A. (1992) Effects of soil temperature on growth, biomass allocation and resource acquisition of Andropogon gerardii Vitman. New Phytol. 120,543–549.
Dewald, C.L., and Dayton, R.S. (1985) A prolific sex form variant of eastern gamagrass. Phytologia 57,156.
Dewald, C.L., and Kindiger, B. (1994) Genetic transfer of gynomonocy from diploid to trip-loid eastern gamagrass. Crop Sci. 34,1259–1262.
Dewald, C.L., and Kindiger, B. (2000) Genetic advances in eastern gamagrass seed produc-tion. In K. Moore and B. Anderson (eds.) Native Warm-Season Grasses: Research, Trends, and Issues. CSSA Special Publ. 30. CSSA. Madison, WI. pp. 123–132.
Dewey, D.R. (1984) The genomic system of classification as a guide to intergeneric hybridiza-tion with the perennial Triticeae. In J.P. Gustafson (ed.) Gene Manipulation in Plant Im-provement. Proc. 16th Stadler Genetics Symp. Columbia, MO. 19–21 March. Plenum, New York. pp. 209–279.
Dien, B.S., Jung, H.G., Vogel, K.P., Casler, M.D., Lamb, J.F.S., Iten, L. Mitchell, R.B., and Sarath, G. (2006) Chemical composition and response to dilute-acid pretreatment and en-zymatic saccharification of alfalfa, reed canarygrass, and switchgrass. Biomass Bioenerg. 30,880–891.
Echt, C.S., Kidwell, K.K., Knapp, S.J., Osborn, T.C., and McCoy, T.J. (1994) Linkage map-ping in diploid alfalfa (Medicago sativa). Genome 37,61–71.
Eichhorn, Jr., M.M., Oliver, W.M., Hallmark, W.B., Young, W.A., Davis, A.V., and Nelson, B.D. (1986) Registration of ‘Grazer’ bermudagrass. Crop Sci. 26,835.
Dewald, C.L., Burson., B.L., de Wet, J.M.J., and Harlan, J.R. (1987) Morphology, inheritence, and evolutionary significance of sex reversal in Tripsacum dactyloides (Poaceae). Am. J. Bot. 74,1055–1059
Esquivel, R.G., Williams, R.D., MacKown, C.T., and Lemunyon, J.L. (2000) Response of
perennial forages and a forb as filter strips for nitrogen and phosphorus removal. In East-ern Gamagrass Technology Update. USDA, NRCS Plant Materials Program. pp. 27–28, http://www.plant-materials.nrcs.usda.gov/pubs/mspmcpul204.pdf.

340 Anderson, Casler and Baldwin
Ferrer, A., Byers, F.M., Sulbaran-de-Ferrer, B., Dale, B.E., and Aiello, C. (2002) Optimizing
ammonia processing conditions to enhance susceptibility of legumes to fiber hydrolysis-alfalfa. Appl. Biochem. Biotech. 98,123–143.
Forbes, I., and Burton, G.W. (1963) Chromosome number and meiosis in some Cynodon species and hybrids. Crop Sci. 3,75–79.
Forwood, J.R., and Magai, M.M. (1992) Clipping frequency and intensity effects on big blue-stem yield, quality, and persistence. J. Range Manage. 45,554–559.
Goldman, J.J. (2006) High-throughput DNA extraction and allele specific PCR primers en-ables efficient screening of mutant (gsf) and wild type (GSF) alleles in eastern gamagrass. Crop Sci. 46,362–364.
Gould, F.W. (1968) Grass systematics. McGraw-Hill Book Co. New York, NY. Gould, F.W., and Shaw, R.B. (1983) Grass systematics. 2nd ed. Texas A&M Univ. Press,
College Station, TX. Green, E.K., and Galatowitsch, S.M. (2001) Differences in wetland plant community estab-
lishment with additions of nitrate-N and invasive species (Phalaris arundinacea and Ty-pha x glauca). Can. J. Bot. 79,170–178.
Griffin, J.L., and Jung, G.A. (1983) Leaf and stem forage quality of big bluestem and switch-grass. Agron. J. 75,723–726.
Grof, B. (1969) Elephant grass for warmer and wetter lands. Queensland Agric. J. 94,227–234. Hallam A., Anderson, I.C., and Buxton, D.R. (2001) Comparative economic analysis of per-
ennial, annual and intercrops for biomass production. Biomass Bioenerg. 21(6),407–424. Hanna, W.W. (1981) Method of reproduction in napiergrass and in the 3x and 6x alloploid
hybrids with pearl millet. Crop Sci. 21,123–126. Hanna, W.W., Chaparro, C.J., Mathews, B.W., Burns, J.C., Sollenberger, L.E. (2004) Peren-
nial Pennisetums. In L.E. Moser, B.L. Burson, L.E. Sollenberger (eds.) Warm-Season (C4) Grasses. American Society of Agronomy Monograph Series no. 45, Madison pp 503–535.
Hanna, W.W., Gaines, T.P., Gonzalez, B., and Monson, W.G. (1984) Effect of ploidy on yield and quality of pearl millet X napiergrass hybrids. Agronomy J. 76,969–971.
Hanna, W.W., and Monson, W.G. (1988) Registration of dwarf Tift-N75 napiergrass germ-plasm. Crop Sci. 28,870–871.
Harlan, J.R., and de Wet, J.M.J. (1969) Sources of variation in Cynodon dactylon (L.) Pers. Crop Sci. 9,774–778.
Harlan, J.R., de Wet, J.M.J., Huffine, W.W., and Deakin, J.R. (1970a) A guide to the species of Cynodon (Gramineae). Bull. B-673. Okla. Agric. Exp. Stn., Stillwater 37 p.
Harlan, J.R., de Wet, J.M.J., Rawal, K.M.., Felder, M.R., and Richardson, W.L. (1970b) Cyto-gentic studies in Cynodon L.C. Rich (Gramineae). Crop Sci. 10,288–291.
Hatfield, R.D., Mandebvu, P., and West, J. (1997) A comparison of Tifton 85 and Coastal bermudagrass cell walls. Annual Research Summary, U.S. Dairy Forage Research Center, Madison, WI.
Hoshino, M., Ono, S., and Sirikiratayanond, N. (1979) Dry matter production of tropical grasses and legumes and its seasonal change in Thailand. J. Japan. Soc. Grassl. Sci. 24,310–317.
Hsu, F.H., Nelson, C.J., and Matches, A.G. (1985) Temperature effects on germination of perennial warm season forage grasses. Crop. Sci. 25,215–220.
Jefferson, P.G., McCaughey, W.P., May, K., Woosaree, J., and MacFarlane, L. (2004) Poten-tial utilization of native prairie grasses from western Canada as ethanol feedstock. Cana-dian J. Plant Sci. 84,1067–1075.
Jefferson, P.G., McCaughey, W.P., May, K., Woosaree, J., MacFarlane, L., and Wright, S.M.B. (2002) Performance of American native grass cultivars in the Canadian Prairie Provinces. Native Plant J. 3,24–33.
Ferraris, R. (1978) The effect of photoperiod and temperature on the first crop and ratoon growth of Pennisetum purpureum Schum. Aust. J. Agric. Res. 29,941–950.

Improvement of Perennial Forage Species as Feedstock for Bioenergy 341
Jensen, K.B., Zhang, Y.F., and Dewey, D.R. (1990) Mode of pollination of perennial species of the Triticeae in relation to genomically defined genera. Can. J. plant Sci. 70,215–225.
Jin, H., Plaha, P., Park, J.Y., Hong, C.P., Lee, I.S., Yang, Z.H., Jiang, G.B., Kwak, S.S., Liu, S.K., Lee, J.S., Kim, Y.A., and Lim, Y.P. (2006) Comparative EST profiles of leaf and root of Leymus chinensis, a xerophilous grass adapted to high pH sodic soil. Plant Scie. 170,1081–1086.
Jung, H.G., and Engels, F.M. (2002) Alfalafa stem tissues: Cell-wall deposition, composition and degradability. Crop Sci. 42,524–534.
Jung, J.G., and Vogel, K.P. (1992) Lignification of switchgrass (Panicum virgatum) and big bluestem (Andropogon gerardii) plant parts during maturation and its effect on fiber de-gradability. J. Sci. Food Agric. 59,169–176.
Kindiger, B., and Dewald, C.L. (1997) The reproductive versatility of eastern gamagrass. Crop Sci. 37,1351–1360.
Kiss, G.B., Csanadi, G., Kalman, K., Kalo, P., and Okresz, L. (1993) Construction of a basic genetic map for alfalfa using RFLP, RAPD, isozyme and morphological markers. Mol. Gen. Genet. 238,129–137.
Lamb, J.F.S., and Jung, H.G. (2004) Environmental stability of stem quality traits in alfalfa. ASA,CSSA,SSSA Annual meetings, Seattle, WA, Oct 31–Nov 4, 2004 Abstr. 3885.
Lamb, J.F.S., Jung, H.G., Sheaffer, C.C., and Samac, D.A. (2007) Alfalfa leaf protein and stem cell wall polysaccharide yields under hay and biomass management systems. Crop Sci. 47,1407–1415.
Larson, S.R., and Mayland, H.F. (2007) Comparative mapping of fiber, protein, and mineral content QTLs in two interspecific Leymus wildrye full-sib families Mol. Breed. 20,331–347.
Larson, S.R., Wu, X., Jones, T.A., Jensen, K.B., Chatterton, N.J., Waldron, B.L., Robins, J.G., Bushman, B.S., and Palazzo, A.J. (2006) Comparative mapping of growth habit, plant height, and flowering QTLs in two interspecific families of Leymus. Crop Scie. 46,2526–2539.
Lauriault, L.M., Kirsey, R.E., and VanLeeuwen, D.M. (2005) Performance of perennial cool-season forage grasses in diverse soil moisture environments, Southern High Plains, USA. Crop Sci. 45,909–915.
Lawrence, C.J., Seigfried, T.E., and Brendel, V. (2005) The maize genetics and genomics database. The community resource for access to diverse maize data. Plant Physiol. 138,55–58.
Mandebvu, P., West, J.W., Froetschel, M.A., Hatfield, R.D., Gates, R.N., and Hill G.M. (1999a) Effect of enzyme or microbial treatment of bermudagrass forages before ensiling on cell wall composition, end products of silage fermentation and in situ digestion kinet-ics. Anim. Feed Sci. and Tech. 77,317–329.
Mandebvu, P., West, J.W., Hill, G.M., Gates, R.N., Hatfield, R.D., Mullinix, B.G., Parks, A.H., and Caudle, A.B. (1999b) Comparison of Tifton 85 and coastal bermudagrasses for yield, nutrient traits, intake, and digestion by growing beef steers. J. Anim. Sci. 77,1572–1586.
Marquez-Ortiz, J.J., Lamb, J.F.S., Johnson, L.D., Barnes, D.K., and Stucker, E.E. (1999) Heritibility of crown traits in alfalfa. Crop Sci. 39,38–43.
Marten, G.C. (1989) Breeding forage grasses to maximize animal performance. In D.A. Sleper et al. (eds.) Contributions from Breeding Forage and Turf Grasses. CSSA Special Publica-tion No 15, CSSA, Madison, WI. pp. 71–104.
Kishii, M., Yamada, T., Sasakuma, T., and Tsujimoto, H. (2004) Production of wheat-Leymus racemosus chromosome addition lines. Theor. Appl. Genet. 109,255–260.

342 Anderson, Casler and Baldwin Marten, G.C., Clapp, C.E., and Larson, W.E. (1979) Effects of municipal wastewater effluent
and cutting management on persistence and yield of eight perennial forages. Agron. J. 71,650–658.
Marten, G.C. and Hovin, A.W. (1980) Harvest schedule, persistence, yield, and quality inter-actions among four perennial grasses. Agron. J. 73,378–387.
Martínez-Reyna, J.M., and Vogel, K.P. (2002) Incompatibility systems in switchgrass. Crop Sci. 42,1800–1805.
Marum, P., Hovin, A.W., and Marten, G.C. (1979) Inheritance of three groups of indole alka-loids in reed canarygrass. Crop Sci. 19,539–544.
Marum, P., Hovin, A.W., Marten, G.C., and Shenk, J.S. (1979) Genetic variability for cell wall constituents and associated quality traits in reed canarygrass. Crop Sci. 19,355–360.
Maurer, D.A. and Zedler, J.B. (2002) Differential invasion of a wetland grass explained by tests of nutrients and light availability on establishment and clonal growth. Oecologia 131,279–288.
McGregor, S.E. (1976) Insect pollination of cultivated crop plants. USDA Agric. Handbook No. 496.
McWilliam, J.R., and Neal-Smith, C.A. (1962) Tetraploid and hexaploid chromosome races of Phalaris arundinacea L. Aust. J. Agric. Res. 13,1–9.
Mislevy, P., Brown, W.F., Caro-Costas, R., Vicente-Chandler, J., Dunavin, L.S., Hall, D.W., Kalmbacher, R.S., Overman, A.J., Ruelke, O.C., Sonada, R.M., Sotomayor-Rios, A., Stan-ley, Jr., R.L., and Williams, M.J. (1989a) ‘Florico’ stargrass. Circ. S-361. Fla. Agric. Exp. Stn., Gainesville.
Mislevy, P., Brown, W.F., Dunavin, L.S., Hall, D.W., Kalmbacher, R.S., Overman, A.J., Ruelke, O.C., Sonada, R.M., Stanley, Jr., R.L., and Williams, M.J. (1989b) ‘Florona’ star-grass. Circ. S-362. Fla. Agric. Exp. Stn., Gainesville.
Mitchell, R.B., Masters, R.A., Waller, S.S., Moore, K.J., and Moser, L.E. (1994) Big bluestem production and forage quality responses to burning date and fertilizer in tallgrass prairies. J. Prod. Agric. 7,355–359.
Mitchell, R.B., Vogel, K.P., Anderson, B.E., Klopfenstein, T.J., and Masters, R.A. (2003) Evaluation of four big bluestem populations under grazing. Agron. Abstr., 2–4 November 2003, Denver, CO.
Mitchell, R.B., Vogel, K.P., Klopfenstein, T.J., Anderson, B.E., and Masters, R.A. (2005) Grazing evaluation of big bluestems bred for improved forage yield and digestibility. Crop Sci. 45,2288–2292.
Monson, W.G., Lowry, R.S., and Forbes, Jr., I. (1969) In vitro nylon bag vs. two-stage in vitro digestion: Comparison of two techniques for estimating dry-matter digestibility of forages. Agron. J. 61,587–589.
Muir, J.P., Sanderson, M.A., Ocumpuaugh, W.R., Jones, R.M., and Reed, R.L. (2001) Bio-mass production of ‘Alamo’ switchgrass in response to nitrogen, phosphorus, and row spacing. Agron. J. 93,896–901.
Nelson, R.G., Langemeier, M.R., and Ohlenbusch, P.D. (1994) Herbaceous energy crop pro-duction feasibility using conservation reserve program acreage. In Proceedings of the An-nual Conference of the American Solar Energy Society. San Jose, CA. pp. 326–331.
Newell, L.C. (1968) Effects of strain source and management practice on forage yields of two warm-season prairie grasses. Crop Sci. 8,205–210.
Norrmann, G.L., and Keeler, K.H. (2003) Cytotypes of Andropogon gerardii Vitman (Poaceae): Fertility and reproduction of aneuploids. Bot. J. Linnean Soc. 141,95–103.
Norrmann, G.L., Quarin, C.L., and Keeler, K.H. (1997) Evolutionary implications of meiotic chromosome behavior, reproductive biology, and hybridization in 6x and 9x cytotypes of Andropogon gerardii (Poaceae). Am. J. Bot. 84,201–207.

Improvement of Perennial Forage Species as Feedstock for Bioenergy 343
Perry, L.J., and Baltensperger, D.D. (1979) Leaf and stem yields and forage quality of three N fertilized warm season grasses. Agron. J. 71,355–358.
Peters, L.V., and Newell, L.C. (1961) Hybridization between divergent types of big bluestem, Andropogon gerardii Vitman and sand bluestem, Andropogon hallii Hack. Crop Sci. 1,359–363.
Prine, G.M., Mislevy, P., Stanley, R.L., Jr., Dunavin, L.S., and Bransby, D.I. (1991) Field production of energycane elephantgrass and sorghum in southeastern United States. In D.L. Klass (ed.) Proc. Final Program of Conference on Energy from Biomass and Wastes XV. Paper No. 24, 8pp.
Prine, G.M., Stricker, J.A., and McConnell, W.V. (1997) Opportunities for bioenergy devel-opment in lower south USA. Proc. 3rd Biomass Conference of the America: Making a Business from Biomass in Energy, Environment, Chemicals, Fibers and Materials. 1,227–235.
Qi, L.L., Wang, S.L., Chen, P.D., Liu, D.J., Friebe, B., and Gill, B.S. (1997) Molecular cyto-genetic analysis of Leymus racemosus chromosomes added to wheat. Theor. Appl. Genet. 95,1084–1091.
Redfearn, D.D., and Nelson, C.J. (2003) Grasses for southern areas. In R.F. Barnes, C.J. Nel-son, M. Collins, K.J. Moore (eds.) Forages: Introduction to Grassland Agriculture, Black-well, Ames, IA, pp. 149–169.
Reynolds, S.G., and Sini, O.V. (1976) A comparison of local and hybrid elephantgrass. Alfan. Agric. Bull. 1,1–4.
Riley, R.D., and Vogel, K.P. (1982) Chromosome numbers of released cultivars of switch-grass, indiangrass, big bluestem, and sand bluestem. Crop Sci. 22,1082–1083.
Rumbaugh, M.D., Caddel, J.L., and Rowe, D.E. (1988) Breeding and quantitative genetics. In A.A. Hanson et al. (eds.) Alfalfa and Alfalfa Improvement, ASA-CSSA-SSSA, Madison, WI. pp. 777–808.
Russelle, M.P. (2001) Alfalfa. Amer. Sci. 89,252–261. Sachs, A.P.W. and Coulman, B.E. (1983) Variability in reed canarygrass collections from
Eastern Canada. Crop Sci. 23,1041–1044. Sage, R.F., Li, M., and Monson, R.K. (1999) The taxonomic distribution of C4 photosynthesis.
In R.F. Sage and R.K. Monson (eds.) C4 Plant Biology, Academic Press, New York. pp. 551–584.
Samac, D.A., Jung, H.G., and Lamb, J.F.S. (2006) Development of alfalfa (Medicago sativa L.) as a feedstock for production of ethanol and other bioproducts. In S. Minteer (ed.) Al-coholic Fuels, CRC Press, Boca Raton, FL. pp. 79–98.
Schank, S.C., and Diz, D.A. (1991) A seeded type of hybrid hexaploid elephantgrass with potential of livestock production in the tropics and subtropics. In Proc. Int. Conf. on Live-stock in the Tropics. 5–8 May 1991. Institute of Food and Agricultural Sciences, Univer-sity of Florida, Gainesville, FL. pp. A7–A13.
Schank, S.C., Diz, D.A., Bates, D.B., and Thompson, K.E. (1993) Genetic improvement of napiergrass and hybrids with pearl millet. Biomass Bioenerg. 5,35–40.
Schank, S.C., and Hanna, W.W. (1995) Usage of Pennisetum in Florida and the tropics. In Proc. Intl. Conf. on Livestock in the Tropics. 7–10 May 1995. Institute of Food and Agri-cultural Sciences, University of Florida, Gainesville, FL. pp. 1–13.
Schank, S.C., Smith, R.L., and Russo, S. (1989) Characterization of genetic variability among accessions and crosses of napiergrass, Pennisetum purpurem. Proc. XVI Int. Grassland Conf. pp. 341–342.
Sheaffer, C.C., and Marten, G.C. (1995) Reed canarygrass. In R.F. Barnes et al. (eds.) Forages Vol. I. An Introduction to Grassland Agriculture, Iowa State University Press, Ames, IA. pp. 335–343

344 Anderson, Casler and Baldwin Sheaffer, C.C. Marten, G.C., Rabas, D.L., Martin, N.P., and Miller, D.W. (1990) Reed ca-
narygrass. Minnesota Agric. Exp. Stn. Bull. 595. Skerman, P.J., and Riveros, F. (1990) Tropical Grasses. Plant production and protection series
23. FAO, Rome, Italy. Smith, R.L., Chowdhury, M.K.U., and Schank, S.C. (1989) Use of restriction-length polymor-
phism (RFLP) markers in genetics and breeding of napiergrass. Proc. Soil Crop Sci. Soc. Florida. 48,13–19.
Sollenberger, L.E., Prine, G.M., Ocumpaugh, W.R., Hanna, W.W., Jones, Jr. C.S., Schank, S.C., and Kalmbacher, R.S. (1988) ‘Mott’ dwarf elephantgrass-a high quality forage for the subtropics and tropics. Fla. Agric. Exp. Stn. Circ. S-356. Gainesville.
Sollenberger, L.E., Williams, M.J., and Jones, Jr., C.S. (1990) Vegetative establishment of dwarf elephantgrass: Effect of planting date, density, and location. Proc. Soil Crop Sci. Soc. of Fla. 50,47–51.
Springer, T.L., and Dewald, C.L. (2004) Eastern gamagrass and other Tripsacum species In L.E. Moser et al. (eds.) Warm-Season (C4) Grasses. Agron. Monogr. 45. ASA-CSSA-SSSA, Madison, WI.
Springer, T.L., Dewald, C.L., Sims, P.L., Gillen, R.L., Louthan, V.H., Cooper, W.J., Taliaf-erro, C.M., Maura, Jr., C., Pfafe, S., Wynia, R.L., Henry, J., Brukerhoff, S.B., Van de Grinten, M., Salon, P.R., Houck, Jr., M., and Esquivel, R.G. (2006) Registration of ‘Verl’ eastern gamagrass. Crop Sci. 46,477–478.
Sreenath, H.K., Koegel, R.G., Moldes, A.B., Jeffries, T.W., and Straub, R.J. (1999) Enzymatic saccharification of alfalfa fibre after liquid hot water pretreatment. Process Biochem. 35,33–41.
Sreenath, H.K., Koegel, R.G., Moldes, A.B., Jeffries, T.W., and Straub, R.J. (2001) Ethanol production from alfalfa fiber fractions by saccharification and fermentation. Process Bio-chem. 36,1199–1204.
Stubbendieck, J., Hatch, S.L., and Butterfield, C.H. (1991) North American Range Plants. University of Nebraska Press, Lincoln, NE.
Taliaferro, C.M., Anderson, J.A., Richardson, W.L., Baker, J.L., Coleman, S.W., Phillips, W.A., Sandage, L.J., Moyer, J.L., Hanson, T.L., Kallenbach, R.L., and Crawford, R.J. (2002) Registration of ‘Midland 99’ bermudagrass. Crop Sci. 42,2212–2213.
Taliaferro, C.M., and Richardson, W.L. (1980) Registration of ‘Hardie’ bermudagrass. Crop Sci. 20,413.
Taliaferro, C.M., Roquette, Jr., F.M., and Mislevy, P. (2004) Bermudagrass and stargrass. In L.E. Moser et al. (eds.) Warm-Season (C4) Grasses. Agron. Monogr. 45. ASA-CSSA-SSSA, Madison, WI. pp. 417–475.
Tergas, L.E., and Urrea, G.A. (1985) Effect of fertilization on the yield and nutritive value of tropical forages on an ultisol in Columbia. Trop.-Anim. Prod. (Mexico) 10,68–75.
Tiffany, D.G., Jordan, B., Deitrich E., and Vargo-Daggett, B. (2006) Energy and chemicals from native grasses: Production, transportation, and processing technologies considered in the northern Great Plains. Staff Paper P06-11. Dept. of Applied Economics. University of Minnesota, Minneapolis/St. Paul. Available at: www1.umn.edu/iree/pdfs. Accessed 12/4/2006.
Tilley, J.M.A., and Terry, R.A. (1963) A two-stage technique for in vitro digestion of forage crops. J. Br. Grassl. Soc. 18,104–111.
USDA-ARS, National Genetic Resources Program (2007) Germplasm Resources Information Network – (GRIN) National Germplasm Resources Laboratory, Beltsville, Maryland. http://www.ars-grin.gov/cgi-bin/npgs/html/tax_search.pl
USDA-NASS, Agricultural Statistics (2004) http://www.usda.gov/nass/pubs/agr04/04_ch6.pdf USDA-NRCS, (1998) Plant-materials.nrcs.usda.gov/pmc/MDPMC/rel97_contents.html.
USDA Natural Resources Conservation Service. National Plants Materials Center.


Improvement of Perennial Forage Species as Feedstock for Bioenergy 345
USDA-NRCS, (2006) Eastern gamagrass (Tripsicum dactyloides): A plant for forage, conser-vation, and bioenergy. http://directives.sc.egov.usda.gov/media/pdf/tn_b_74_a.pdf
Vicente-Chandler, J., Abruna, F., Caso-Costas, R., Figarella, J., Silva, S., and Pearson, R. (1974) Intensive grassland management in the humid tropics of Puerto Rico. Univ. Puerto Rico Bull. 233.
Vicente-Chandler, J., Silva, S., and Figarella, J. (1959) The effect of nitrogen fertilization and frequency of cutting on the yield and composition of three tropical grasses. Agron. J. 51,202–206.
Vogel, K.E. (2000) Improving warm-season forage grasses using selection, breeding and biotechnology. In K.J. Moore and B.E. Anderson (eds.) Native Warm-Season Grasses: Re-search Trends and Issues. CSSA Special Pub. No. 30, Madison, WI. pp. 83–106.
Vogel, K.E., and Jung, H.G. ( 2001) Genetic modification of herbaceous plants for feed and fuel. Crit. Rev. Plant Sci. 20,15–49.
Vogel, K.E., and Mitchell, R.B. (2003) Breeding big bluestem for improved performance by grazing livestock. Agron. Abstr. ASA-CSSA-SSSA, 2–6 November 2003, Denver, CO.
Vogel, K.E., Mitchell, R.B, Klopfenstein, T.J., and Anderson, B.E. (2006a) Registration of ‘Bonanza’ big bluestem. Crop Sci. 46,2313–2314.
Vogel, K.E., Mitchell, R.B., Klopfenstein, T.J., and Anderson, B.E. (2006b) Registration of ‘Goldmine’ big bluestem. Crop Sci. 46,2314–2315.
Volenec, J.J., Cherney, J.H., and Johnson, K.D. (1987) Yield components, plant morphology, and forage quality of alfalfa as influenced by plant population. Crop Sci. 27,321–326.
Waller, S.S., and Lewis, J.K. (1979) Occurrence of C3 and C4 photosynthetic pathways in North American grasses. J. Range Manage. 32,12–28.
Wasser, C.H. (1982) Ecology and culture of selected species useful in revegetating disturbed lands in the West. USDA FWS/OBS-8256. Washington, DC.
Weaver, J.E. (1968) Prairie Plants and Their Environment. University of Nebraska Press, Lincoln, NE.
Weimer, P.J., Dien, B.S., Springer, T.L., and Vogel, K.P. (2005) In vitro gas production as a surrogate measure of the fermentability of cellulosic biomass to ethanol. Appl. Microbiol. Biotechnol. 67,52–58.
Weimer, P.J., and Springer, T.L. (2007) Fermentability of eastern gamagrass, big bluestem, and sand bluestem grown across a wide variety of environments. Bioresource Technol. 98,1615–1621.
Woodard, K.R., and Prine, G.M. (1991) Forage yield and nutritive value of elephantgrass as affected by harvest frequency and genotype. Agron. J. 83,541–546.
Woodard, K.R., Prine, G.M., and Ocumpaugh, W.R. (1985) Techniques in the establishment of elephantgrass (Pennisetum purpureum Schum.). Soil Crop Sci. Soc. Fla. Proc. 44,216–221.
Wright, N.A. (1990) Screening of herbaceous species for energy crops on wet soils in Ohio. In J. Janick and J.E. Simon (eds.) Advances in New Crops. Proc. 1st Natl. Symp. New Crops. 23–26 October 1988, Indianapolis, IN. Timber Press, Portland, OR. pp. 263–267.
Wu, X.L., Larson, S.R., Hu, Z.M., Palazzo, A.J., Jones, T.A., Wang, R.R., Jensen, K.B., and Chatterton, N.J. (2003) Molecular genetic linkage maps for allotetraploid Leymus (Triticeae). Genome 46,627–646.
Xavier, D.F., de A. Botrel, M., Daher, R.F., Teixeira-Gomes, F., and Pereira, A.V. (1995) Caracterizaçâo morfológica e agronómicas de algumas cultivares de Capim-elefante. Documento N1 60, Empresa Brasileira de Pesquisa Agropecuaria (EMBRAPA), Brasil.
Woodard, K.R. and Prine, G.M. (1990) Propagation quality of elephant grass stems as affect
by the fertilization rate used on nursery plants. Soil Crop Sci. Soc Fla. Proc. 49,173–176.

13 Genetic Improvement of Willow (Salix spp.) as a Dedicated Bioenergy Crop
Lawrence B. Smart1 and Kimberly D. Cameron2
Department of Environmental and Forest Biology, State University of New York College of Environmental Science and Forestry, Syracuse, NY 13210 USA, [email protected], [email protected]
13.1 Introduction
Fast-growing woody crops are emerging as an attractive source of biomass, because they have the capability to meet many of the agronomic, environmental, and societal parameters associated with successful deployment as a source for energy. Willows, especially those that grow as shrubs with multiple small stems, have many of the characteristics desired in dedicated energy crops, making them an excellent feed-stock choice in a number of settings. Wide-scale cultivation of willow bioenergy crops in Europe over the last two decades has encouraged development of efficient mechanized planting and harvesting systems. Vigorous breeding programs have also been active in broadening the genetic base and increasing the yield of varieties that are deployed commercially. Unfortunately, the majority of the fast-growing varieties developed in Europe are highly susceptible to a debilitating insect pest in North America, highlighting the need for region-specific breeding and selection programs. Since 1986, researchers at the State University of New York College of Environ-mental Science and Forestry in Syracuse have been researching a willow cropping system for North America, including the development of genetically improved wil-low varieties. This program has involved assembling a large and diverse collection of willow clones, successfully performing controlled pollinations, and selecting new varieties with improved yield, pest and disease resistance across a range of sites in North America. Many of these varieties have been commercially deployed for use in bioenergy plantations in New York and elsewhere.
W. Vermerris (ed.), Genetic Improvement of Bioenergy Crops, DOI: 10.1007/978-0-387-70805 -8_13, © Springer Science+Business Media, LLC 2008

348 Smart and Cameron 13.2 Botanical Descripion of Willow (Salix)
13.2.1 Taxonomy of Species Developed as Bioenergy Crops
The subgenus Salix includes species that display traits considered to be more primitive, including production of greater than two stamens per flower and preva-lence of polyploid species. Generally, the species in the sections of this subgenus are medium- to large-sized trees or large shrubs, including species commonly found in riparian or wetland habitats of North America, such as S. alba, S. nigra, S. fragilis, and S. amygdaloides, and the common horticultural species, S. babylonica (weeping willow). The subgenus Longifoliae includes only a few species with the classic abil-ity to root sucker and form thickets of thin stems. In North America, S. interior in the east and S. exigua in the west are commonly found and grow vigorously, but are not suitable in bioenergy plantations, because root suckers emerge between and outside of planted rows. The subgenus Vetrix is the largest, most diverse taxon in the genus Salix, including mostly shrubs and small trees classified into many sections. Many species in this subgenus are being cultivated or have great potential as bioenergy crops with high biomass yield and good coppicing ability (Kuzovkina et al. 2008), including S. purpurea, S. viminalis, S. schwerinii, S. miyabeana, S. sachalinensis (syn. S. udensis), S. dasyclados, S. koriyanagi, S. eriocephala, and S. discolor (Fig. 13.1). Members of the subgenus Chamaetia are predominantely dwarf shrubs found in alpine habitats and in the arctic, thus are not suitable as potential bioenergy crops.
The genus Salix is very diverse, representing over 300 species (Argus 1997; Newsholme, 1992, Trybush et al. 2008) growing in the form of trees, shrubs, or dwarf shrubs with procumbent stems. The genus Salix is closely related to the genus Popu-lus. Both are in the family Salicaceae, division Magnoliophyta, class Magnoliopsida, subclass Dilleniidae. The taxonomy of the genus Salix is complicated and still under review. The traditional morphological characters used to characterize members of most plant genera are not reliable in Salix, polyploidy is not uncommon, and a num-ber of species are known to hybridize, making phenotypic characterization particu-larly difficult and definition based on reproductive isolation problematic. Taxono-mists have used a combination of up to 235 morphological characters to determine the phenetic distance between species (Argus 1997). Members of the genus Salix in North America are organized into four subgenera: Salix, Longifoliae, Vetrix, and Chamaetia, based on the classification of Argus (1997). The most extensive phy-logenetic analysis of species in the genus Salix completed to date was based on se-quence data of the gene for the large subunit of ribulose 1,5-bisphosphate carboxy-lase, oxygenase (Rubisco; see chapter 1) using 23 species from four genera of Salicaceae. The results from that study strongly suggest that the 19 Salix species analyzed resolve to form two distinct clades (Azuma et al. 2000). More extensive phylogenetic analysis is required, since this study represents only a small fraction of all the species in the genus.

Genetic Improvement of Willow (Salix spp.) as a Dedicated Bioenergy Crop 349
13.2.2 Willow Habitat and Growth
Willows have a wide distribution and are capable of thriving in a range of climate zones and soil types. Willows are indigenous to the arctic, temperate, sub-tropical and tropical regions of Europe, Asia, and North America, while there is one species, S. humboldtiana, native to South America. Willows are cultivated extensively around the world for bioenergy or environmental engineering, including the temperate re-gions of Europe, North America, Russia, China, New Zealand, and portions of South America. In North America, willows have been tested as a bioenergy crop across United States Department of Agriculture (USDA) hardiness zones three to seven in New York, Minnesota, Michigan, Vermont, New Jersey, Delaware, Pennsylvania, Maryland, North Carolina, Wisconsin, Québec, Ontario, Saskatchewan, and Alberta (Volk et al. 2006). In Europe, there is extensive cultivation of willow shrubs in Swe-den, the United Kingdom (U.K.), Ireland, and Denmark (Verwijst 2001).
Species of Salix are perennial and deciduous, which allows for recycling of nutri-ents to the soil when stems are harvested after leaf fall. Generally, willows are pio-neer species that are shade-intolerant and capable of colonizing disturbed sites. They tend to grow and compete well in riparian and wetland habitats, but in bioenergy plantations willow shrubs grow well without irrigation on upland and well-drained sites that receive regular rainfall throughout the growing season (Newsholme 1992). Individual plants have relatively short life spans for hardwood species of usually 40–60 years, but since most species are capable of vegetative propagation, a particular genotype can theoretically persist in a population for a much longer period of time as new plants are established as sprouts from detached twigs or branches. This property allows superior varieties to be scaled-up rapidly by planting dormant sections of stem that will quickly form roots and new shoots. A few species can also propagate from root suckers, but these are not used as a field crop, since the stems do not re-main confined to rows. Willows have evolved to respond vigorously to mammal browse or damage to stems by producing new stems from the root crown. In bio-energy plantations, when the stem biomass is harvested by cutting the stems near to the ground (the process of coppicing), the plants produce new, actively growing shoots from the established root system. This allows repeated harvests over many years, usually every three to four years, for at least twenty years before replanting is needed.
13.3 Cultivation, Harvesting, and Processing of Shrub Willow
13.3.1 Establishing Willow Bioenergy Crop Plantations
In many northern temperate agricultural regions, the downsizing of agricultural cul-tivation and livestock grazing has left significant areas of arable land available for other uses, either non-agricultural uses or the production of energy crops. In New York State, the peak of agricultural land use occurred in 1900, with over 226,000 farms utilizing 9.1 million of the 12.4 million ha in the state (U.S.D.A. National Agriculture Statistics Survey, http://www.nass.usda.gov). Currently, there are

350 Smart and Cameron
Fig. 13.1. Taxonomic organization of Salix species used in bioenergy and environmental engineering research and commercial applications.
The conversion of abandoned agricultural land, underutilized hay fields, or pas-ture back to cultivated field suitable for establishment of a willow bioenergy crop plantation can be a challenge due to the prevalence of perennial weeds and an accu-mulation of dormant weed seeds. Proper site preparation is critical to successful establishment. This will ensure optimum function of the mechanical planter, elimina-tion of weed competition, and the best possible soil structure and composition. Since planting is best accomplished in early spring, site preparation must start the summer before. In fields with standing vegetation that has not been cut during that growing
approximately 35,600 farms using only 3.1 million ha of land, including over 0.4 million ha that is currently used for low-value hay or pasture and that could be con-verted to the cultivation of dedicated energy crops (New York State Department of Agriculture and Markets, http://www.agmkt.state.ny.us/agfacts.html). Much of this land may not be suitable for the cultivation of field crops or vegetables, due to poor drainage conditions, limited fertility, or regular spring flooding. It is this type of land that is most likely to be planted with willow energy crops initially, especially with growing demand for corn and soybeans for biofuels and feed. While the establish-ment of a willow energy crop plantation is likely to remove that land from annual crop rotation for many years, most agricultural professionals and rural communities would find this preferable to non-agricultural land development, which has dramati-cally reduced the overall arable land base in the U.S.

Genetic Improvement of Willow (Salix spp.) as a Dedicated Bioenergy Crop 351
season, the field should be mowed, hayed, or cut with a brush hog, and the cut mate-rial should be removed. Once the existing vegetation has started to regrow, it should be killed with an application of one or more broad-spectrum contact herbicides, such as glyphosate or a mix of glyphosate with an herbicide targeted to kill particular recalcitrant weed species that may be present. Moldboard ploughing or ripping is recommended to break any hard pan or plow pan layers that might impair deep root-ing of the willow, and then the site should be worked with a disk harrow. Establish-ment of a cover crop during the season prior to planting willow can improve soil organic matter content and reduce soil erosion, especially on sloped sites. Previous work has demonstrated benefits of planting a winter rye (Secale cereale L.) cover crop in the fall, then disking the crop in the spring and planting through the residue (Volk 2002). Fields that were in annual agricultural crops the previous year can be prepared in the early spring before planting, as long as there is no abundance of perennial weeds.
Fig. 13.2. Equipment used for the cultivation of shrub willow bioenergy crops; the Salix Maskiner Step willow planter (left) and Coppice Resources Ltd. willow cutting head on a New Holland FX45 forage harvester (right).
Willow bioenergy crops are established by planting a section of dormant stem (usually one year old) into the soil, at which time it will produce roots and the dor-mant buds will emerge to form new stems. Willow fields are usually planted in a double-row arrangement at ~15,000 plants ha–1 (~6,100 plants ac–1), with 0.76 m (2.5 ft) between rows, 0.61 m (2 ft) between plants in a row, and 1.52 m (5 ft) spacing between double-rows to allow clearance for cultivation and harvesting machinery. Early mechanical planters adapted from vegetable transplant planters have been used to plant 20–25 cm cuttings. Advances by engineers at Salix Maskiner (now Salix-phere, Hedemora, Sweden, http://www.salix.se) produced the four-row Step willow planter as a tractor attachment (Fig. 13.2), which accepts 2–3 m whips and cuts them into 20-cm sections just before pushing them ~90% belowground with ~2 cm of the apical end of the stem section aboveground. Recently, a six-row planter, called the Woodpecker, has been developed and is being used by Lantmännen Agroenergi AB (Örebro, Sweden, http://www.agrobransle.se). A third willow planting machine, the four-row Egedal Energy Planter, has been developed through co-operation between Ny Vraa Bioenergi I/S and Egedal Maskinfabrik A/S (Tørrin, Denmark,

352 Smart and Cameron http://www.egedal.dk). Within several days after planting, the aboveground buds will break dormancy and produce new stems, while roots emerge from the belowground portions of the cutting. Cuttings require a certain amount of soil moisture to support continued root and shoot growth during this period, so drought conditions at the time of planting and over the following three weeks can be detrimental to the overall success of plantation establishment.
Planting stock, in the form of whips or cuttings, is produced in dedicated nurser-ies that are planted in denser spacing and harvested annually during the dormant season after leaf fall. Nursery beds are typically planted in single rows with 0.3–0.6 m (1–2 ft) spacing between plants and variable spacing between rows (1–2 m/3–7 ft) depending on harvest and management strategies and the dimensions of machinery being used. Regular irrigation and annual fertilization can be applied in order to maximize growth and cutting production. Stems can grow to be 4 m tall in a single season under these conditions, but must be trimmed to remove any portions that are larger than 3.2 cm or smaller than 0.8 cm in diameter to ensure loading and proper flow in the Step willow planter. Usually a single whip will yield 8–12 20-cm cutting equivalents, and since each plant produces multiple stems, typical yield is 25–35 cutting equivalents per plant, depending on the variety. Thus the annual harvest from 400–600 nursery bed plants is necessary to produce the planting stock for 1 ha of a willow bioenergy plantation (~15,000 cuttings). Since the maintenance of root and bud dormancy is extremely weak in excised willow stems, whips and cuttings must be stored frozen. However, temperatures typical of food storage freezers
me varieties of willow, so freezers must be set to run at –4 to –2°C (Volk et al. 2004a). It is also important to retain the mois-ture content in the stem tissue, so cuttings and whips must be stored in airtight pack-aging, such as plastic bags or wax-coated cardboard boxes. Once cuttings or whips are removed from the storage freezer, they should ideally be planted immediately, although, if kept cool and moist, they may be stored unfrozen for up to 12 days with-out significant loss of viability (Volk et al. 2004a).
13.3.2 Willow Crop Management
Pre-emergent herbicides are applied soon after planting to control weeds (Kopp et al. 1992), which is critical for successful plantation establishment. A mixture of simaz-ine and oxyfluorfen has proven effective on many soils in New York State. If weeds do become problematic, especially in the first two years, mechanical cultivation can be applied between the rows using a properly spaced multi-tine cultivator or a spe-cialized, multi-row rototiller, such as from Badalini Macchine Agricole (Rivarolo Mantovano, Italy). Alternatively, if grass weeds become a problem, most grass her-bicides may be applied over-the-top of a standing willow crop. Fusilade (fluazifop-P-butyl) has proven effective against grass weeds in New York, but herbicide choice and use must be matched with local weed populations and pesticide use restrictions.
At the end of the first (establishment year) growing season, plants are typically cut back (coppiced) close to the soil, which stimulates new growth with multiple stems the following spring. Coppicing can be accomplished using a sharp sickle bar mower attachment to a tractor, which cuts the stems at 4–8 cm above the ground.
(–20°C) reduce the viability of cuttings of so

Genetic Improvement of Willow (Salix spp.) as a Dedicated Bioenergy Crop 353
Although weed competition and drought are the greatest threats to willow estab-lishment, disease can be devastating to a standing crop. Of primary concern is rust disease caused by the fungus Melampsora epitea Thüm. (Fig. 13.3). The rust fungus attacks leaves, causing them to die and drop prematurely, in worst cases leading to major defoliation at mid- to late-season. In some willow species the fungus can also attack the stems, which can lead to death of the entire stool. The rust fungus requires an alternate host, thought to be a Larix species, for sexual recombination to occur. Rust disease development is dependent on cool, moist conditions early during the growing season and may be promoted by mild winter temperatures, which may allow for greater survival of spores over the winter. This disease has a major impact on willow bioenergy plantations in the U.K. Species used in bioenergy plantations that display particular susceptibility to rust include S. burjatica and S. viminalis in Europe and S. eriocephala in North America. Resistance to willow rust is under strong genetic control (Rönnberg-Wästljung and Gullberg 1999; Phillips 2002). Therefore, selection and breeding programs in Europe and the U.S. emphasize rust resistance as the primary control for this disease. In Northern Ireland it has been advantageous to establish willow bioenergy plantations using different willow varie-ties in mixtures, planted by continuously loading the mechanical planter with whips of several different varieties as it proceeds down a row. This strategy has success-fully slowed the spread of disease and reduced the overall impact of rust on willow plantations (McCracken and Dawson 1997; McCracken et al. 2001; McCracken et al. 2005). Other diseases have not had broad impact on bioenergy plantation yield, but may reduce cutting yield in nursery plantations. These include anthracnose tip blight on S. eriocephala caused by Colletotrichum spp. and willow scab caused by Physa-lospora miyabeana Fukushi (Smart, unpublished results). As long as stem canker or tip dieback diseases do not penetrate into the stool, they typically have only a minor impact, since buds just below the affected area will rapidly break dormancy and emerge to continue growing. The short-rotation harvest of willow regularly removes any slow-growing diseases localized to the upper portions of stems, reducing the potential impact on the stools.
A number of insect pests can influence the growth and productivity of willow bioenergy plantations. Perhaps primary among those are the Chrysomelid beetles, including Phratora vitellinae L. and Phratora vulgatissima L. (brassy and blue wil-low beetles, respectively) in the U.K. (Kendall and Wiltshire 1998) and Japanese beetle (Popillia japonica Newman, Fig. 13.3) and imported willow leaf beetle (Pla-giodera versicolora Laicharting) (Nordman et al. 2005) in the U.S. The adults of these species feed on leaf tissue and can decrease yield significantly in susceptible varieties (Hunter et al. 1996; Peacock et al. 2001). Stem-sucking insects can also
Establishment-year biomass production can be as high as 2.0–2.5 dry tonnes ha–1, but usually that biomass is not utilized, since it is not economical to collect for bio-energy. For some willow varieties, however, the first-year stems may be large enough to collect and use as planting stock. After the first coppice, stem biomass is harvested every three or four years for seven or more rotations. An alternative stra-tegy is to allow the plants to grow continuously for three consecutive years after planting and harvest stem biomass after the third growing season, thus avoiding the expense and loss of biomass incurred by first-year coppicing.

354 Smart and Cameron debilitate fast-growing willows, including giant willow aphid (Tuberolachnus salig-nus Gmelin) and black willow aphid (Pterocomma salicis L.) (Collins et al. 2001). Leaf aphids (Chaitophorus viminalis Monell) and gall-forming eriophyoid mites are also found on willows (Czesak et al. 2004), but do not have a major impact on growth.
Fig. 13.3. Uredinia of Melampsora rust on leaves of S. cordata × S. eriocephala (left) and Japanese beetle damage on S. dasyclados (right).
Species developed for bioenergy plantations in Sweden, including S. viminalis and hybrids with S. schwerinii, are particularly susceptible to potato leaf hopper (Empoasca fabae Harris) in the U.S. The symptom of infestation is ‘hopper-burn’, highlighted by curling of the young leaves and severe inhibition of internode elonga-tion (L.P. Abrahamson and R.F. Kopp, personal communication). Poplar and willow borer larvae (Cryptorhynchus lapathi L.) can be a serious threat to susceptible wil-low when they bore into and severely damage the stool and base of affected stems (Broberg et al. 2001). Salix eriocephala is particularly favored by the pine-cone gall midge, Rhabdophaga strobiloides Osten Sacken, whose larvae inhabit the shoot tip in early spring and disrupt stem development leading to formation of a pine cone-like structure at the end of the stem (Stanosz and Stanosz 2002). The larvae of willow sawfly (Nematus spp.) can cause major damage through leaf herbivory. Perhaps greater damage is caused by the willow stem sawfly (Janus abbreviatus Say), which can kill shoot tips early in the season during egg oviposition and then cause stem weakening and death as the larvae bore down as much as a meter from the shoot tip (Solomon and Randall 1978). This is particularly damaging in nursery beds for whip production, as it leads to extensive branching. Defoliating forest pests, such as gypsy moth (Lymantria dispar L.), forest tent (Malacosoma disstria Hübner) and Eastern tent (M. americanum Fabricius) caterpillars, and fall webworm (Hyphantria cunea Drury) can attack willow bioenergy plantations during periods of heavy local infesta-tions. Although insecticides can be used to avoid major crop losses, especially during the establishment year and the year after a harvest, in most instances the potential for some improvement in yield does not justify the costs of chemical treatment of these pests.
Since the cultivation of willow in bioenergy plantations is accomplished using clonally propagated planting stock, there is potential for major crop losses when a

Genetic Improvement of Willow (Salix spp.) as a Dedicated Bioenergy Crop 355
susceptible variety is damaged or killed by a disease or pest outbreak. Prior to wide-spread deployment, trials with new varieties should be accomplished to determine if any display susceptibility to regionally prevalent pests and pathogens. Despite suc-cessful testing in variety trials, deviations in the populations of pests, the virulence of pathogens, and unusual environmental conditions can occur over time that can over-whelm the defenses of particular varieties. Thus, in order to try to minimize the potential for major losses over the 20-plus year lifetime of a willow plantation, it is strongly advisable to plant a genetically diverse mixture of varieties (Volk et al. 2004b). In the U.K., this is accomplished though the planting of intimate mixtures of varieties along each row, as described above. In other settings, different varieties can be planted in blocks across a field consisting of several double-rows in each block. If a variety in a block does succumb to pest or pathogen attack, it is a straightforward matter to remove that variety and replace it with a resistant one.
13.3.3 Willow Biomass Harvesting, Transport, and Storage
Harvesting of willow is usually accomplished when the plants are dormant and must
on climatic conditions, the ground is likely to be frozen during winter harvesting operations, reducing the chances of soil compaction and rutting (formation of deep tire tracks) and allowing for improved handling of machinery. There are three differ-ent strategies for the harvest of shrub willow biomass. The first is accomplished using a self-propelled forage harvester equipped with a specialized or modified wil-low cutting head. The saws on the head cut the stems from a double row just above the soil (~8–10 cm), and they are directed to the feed rollers, which pull them into the harvester. The stems are chipped by the chopper blades of the forage harvester, which produce uniform chips of 5 cm or less. This dimension standard allows for good materials handling properties and flowability throughout the downstream logis-tical path. The forage harvester blows the chips out a chute into a wagon being towed or into a truck driving alongside the harvester.
Willow harvesting has been accomplished using reinforced Kemper corn harvest-ing heads, but these are not capable of cutting stems much larger than 4 cm in diame-ter and are susceptible to mechanical failure. Specialized willow cutting heads have been designed and built by Claas (Harsewinkel, Germany; http://www.claas.com) and Coppice Resources Ltd. (Doncaster, U.K., http://www.coppiceresources.com), which are more robust and which are capable of harvesting stems with diameters as large as 10 cm (L.P. Abrahamson and T.A. Volk, personal communication). These heads have been matched with Claas Jaguar and New Holland FX-series self-propelled forage harvesters (Fig. 13.2). These harvesters have the capability to move down a double row at speeds as high as 5–8 km h–1, with harvesting rates approach-ing 60 wet tons (h–1). A much smaller willow cut and chip harvester that attaches to a tractor, called the Bender, was designed and built by Salix Maskiner (now Salix-phere, Hedemora, Sweden). This head has the advantages that it an be attached to a ~140–200-hp tractor, i lightweight, and an be easily transported from site to site. This head uses a saw chain to cut the stems and large star wheels that pull the stems into the chipper. In practice, this harvester was not as robust in fields with large-
of the nutrients have been directed to the roots for storage until spring. Depending

356 Smart and Cameron diameter stems and the chip quality was less consistent that can be obtained using a forage harvester (L.P. Abrahamson, personal communication).
The second approach to willow harvesting is to cut stems without chipping them. The Empire 2000 self-propelled harvester, built by Steen Segerslatt who modified an International Harvester combine, cuts the stems using two circular saws, then directs them by conveyer to a bunk on the rear of the machine (Hartsough and Spinelli 2001). Once the bunk is full, the stems are dumped on the edge of the field. The Rodster and Bundler built by Salix Maskiner work in a similar fashion, except they are trailed behind a tractor. The Bundler bundles stems with twine before dumping them. A similar machine, called the NB Stemster, was designed by Johannes Falk (Nordic Biomass, Villerup Hovedgaard, Denmark) in both trailed and self-propelled versions. This machine maintains tight and parallel stacking in the bunk using chains that rotate the pile during harvesting. It dumps the stems when the bunk is full. The third approach is to produce billets, chunks of stem approximately 20–25 cm long, using a sugar cane harvester, such as one built by Case IH Austoft.
There are advantages and disadvantages to each harvesting strategy, which must be considered in light of the available market for biomass. The cut-and-chip ap-proach is more economical due to expeditious handling of the biomass. However, moisture content in chips is typically 45–50% by harvest weight, which then encour-ages the growth of wood-decaying fungi, degradation of the biomass, and reduced energy content per ton (Jirjis, 2005). This process proceeds over the period of stor-age. Thus, the production of chips during harvesting is best accomplished when the biomass will be used soon after delivery or when the chips will be stored in a chip pile with appropriate dimensions to avoid significant decay. The harvest of whole stems or billets allows for drying of the biomass on the edge of the field with little degradation and energy loss. However, significant processing and capital costs are incurred through the additional handling steps and machinery needed to pick up the stems or billets and chip them. In Europe, there is a growing market for industrial-grade wood pellets, produced by compressing finely ground wood into 0.5 × 1 cm cylinders. These have the advantage of greater bulk density – which lowers shipping costs–, improved longevity in storage, and easier materials handling properties (Vinterback 2004). While high-quality wood pellets (< 0.5% ash) have been used extensively for residential heating in North America, pellet makers have avoided using shrub willow biomass as a sole feedstock, since the mean ash content is ~1–2%, mainly due to the mineral content of the bark (Tharakan et al. 2003).
The window for harvesting opens immediately after senescence and leaf drop and continues until bud break in the spring. The shedding of leaves allows a great propor-tion of the nutrients to be recycled to the soil, especially the macronutrients nitrogen and phosphorus. A relatively small amount of these and other nutrients are stored in the stems, especially in bark, and are removed during harvest (Adegbidi et al. 2001; Adler et al. 2005; Tharakan et al. 2003). To replenish the soil and maintain vigorous growth, a modest amount of slow-release nitrogen fertilizer (100–160 kg N ha–1 as sulfur-coated urea or ammonium sulfate) is added in the spring after each harvest (Adegbidi et al. 2003). It is important to realize that the cultivation of shrub willow plantations is highly amenable to the addition of organic amendments or nutrients from waste streams, which can improve the net energy balance of the system (Abra-

Genetic Improvement of Willow (Salix spp.) as a Dedicated Bioenergy Crop 357
hamson et al. 1998; Keoleian and Volk 2005). The application of animal manure, effluent or biosolids from a wastewater treatment facility, or ash from wood-fired power plants can be applied to add nutrients while effectively managing waste streams that might otherwise compromise environmental quality (Labrecque et al. 1997; Perttu and Kowalik 1997; Adegbidi et al. 2003; Park et al. 2005; Dimitriou et al. 2006).
An important consideration for conversion efficiency is the accumulation of ele-ments that lead to slagging and corrosion of combustion and gasification chambers. This includes primarily alkali metals, silicon and chlorine. Analysis of willow bio-mass indicates that the concentrations of these elements is relatively low compared to other bioenergy feedstocks, such as grasses and straw (Adler et al. 2005).
13.3.4 Processing and Conversion of Willow Biomass to Electricity, Heat, and Transportation Fuels
Once willow chips are obtained, either simultaneous with harvest or via post-harvest chipping, there are a number of options for conversion. In Sweden, which boasts the most widespread and longest-running cultivation and use of willow for bioenergy, wood chips are most commonly burned in district heating plants that distribute hot water or steam among the buildings of a village or town (Larsson et al. 1998; Rosen-qvist et al. 2000; Hoffmann and Weih 2005; Wright 2006). There are approximately 15,000 ha of willow in cultivation and the chips harvested from approximately 1,200 farms are delivered to more than a dozen heating plants, which also use wood resi-dues as fuel. The district heating strategy has advantages in attaining overall conver-sion efficiencies close to 90%, when electricity is also generated in a combined heat and power (CHP) plant. Emissions from a single source plant are also easier to moni-tor and regulate than emissions from many smaller furnaces. Fuel is usually obtained within a ~80-km radius, since transportation costs become prohibitive over longer distances. A notable example of a successful project utilizing willow is the Enköping CHP plant in Sweden, which produces 45 MW of heat and 24 MW of electricity using willow harvested from 150 ha within 30 km of the plant, combined with other wood fuels (Wright 2006). There is also a wastewater treatment plant co-localized at the heating plant, which uses water from the dewatering of sludge to irrigate adjacent willow plantations, promoting greater yield (Dimitriou and Aronsson 2005).
Commercial willow biomass plantations are expanding in the U.K., in part to help meet a national goal of producing 10% of electricity from renewable sources by 2010 and to reduce carbon emissions by 20% by 2012 (Rosenqvist and Dawson 2005; Wright 2006). Current commercialization is aimed at co-firing wood with coal, which offers not only reductions in greenhouse gas emissions, but also in SO2, NOx, and mercury emissions. One of the facilities actively promoting willow cultivation is the largest coal power plant in England, Drax Power Station in Selby, North Yorkshire, where the goal is to attain 10% co-firing of biomass by 2009. The cultivation of willow for this market and for other power plants across England and Scotland is being man-aged by a number of specialized willow crop companies, including Renewable Fuels Ltd (a division of Lanthmännan), Renewable Energy Growers, Strawsons Energy, and Coppice Resources Ltd. (CRL) of (http://www.coppiceresources.com). Recently, CRL

358 Smart and Cameron
In the U.S., commercial demonstration of willow biomass production has inspired interest among power producers and growers, although there is currently a gap in the infrastructure linking the two. Approximately 200 ha of willow was planted in the late 1990’s by researchers at the SUNY College of Environmental Science and For-estry (SUNY-ESF) within short distance of the Dunkirk Power Plant, which has equipment to co-fire wood in one of their coal-fired boilers. Despite complete moni-toring and positive results of a test burn conducted in 2002, the operator of this facil-ity, NRG Energy Inc., has not initiated burning willow for commercial power pro-duction. Willow biomass has also been tested for co-firing at the Greenidge Power Plant in Dresden, NY, but the operator, AES Corporation, likewise has not engaged in extensive acquisition of willow fuel. In 2006, ~18 ha of willow were planted for commercial demonstration in the vicinity of the Lyonsdale Biomass 19 MW wood-fueled CHP plant in Lyons Falls, NY operated by Catalyst Renewables Corporation. Additional scale-up of willow acreage is planned to provide a reliable source of closed-loop woody biomass for this facility. Catalyst Renewables received grant funding in 2007 from New York State to install a pilot-scale commercial cellulosic ethanol facility using wood as a feedstock at the Lyonsdale Biomass plant. With funding from a New York State grant, Mascoma Corporation has broken ground on a pilot cellulosic ethanol plant in Rome, NY that will test willow biomass, paper sludge, and grass biomass as potential feedstocks. Other projects have been proposed in New York State that will use biomass, including willow, to fuel an associated CHP plants, rather than using natural gas.
As the use of ethanol as a transportation fuel increases dramatically in the US, conversion of lignocellulosic feedstocks will be necessary and the use of perennial energy crops will improve the environmental benefits (Hahn-Hägerdal et al. 2006). Willow biomass has been demonstrated to have great potential as a feedstock for biochemical conversion to ethanol when the wood chips are subjected to steam pre-treatment with dilute sulfuric acid as a catalyst (Eklund et al. 1995; Eklund and Zac-chi 1995; Kádár et al. 2007; Sassner et al. 2005; Sassner et al. 2006). SUNY-ESF researchers have proposed a simple hot-water extraction of willow chips to remove a portion of the hemicellulosic polysaccharides, which may then be concentrated and used for fermentation to ethanol (Blowers 2003; Liu et al. 2006). Either of these approaches will need to account for and incorporate steps to remove the inhibitors released or produced through pre-treatment, including acetic acid, furfural, 5-hydroxymethylfurfural, and lignin degradation products (Palmqvist et al. 1996; see
has been working with Biojoule (http://www.biojoule.co.uk/) to establish willow plan-tations for the production of biomass pellets using self-sufficient, mobile pelletizing modules for distribution by The Energy Crops Company (http://www.energy-crops.com/). Wood pellets have benefits for smaller scale heating applications, includ-ing stable and clean storage, ease of handling, and uniform particle dimensions. The growth and harvesting of willow to provide wood chips for heating applications has also been commercialized in Northern Ireland, partly because there is very little for-ested land in that part of the U.K. and also because willow offers opportunities for the utilization of sewage sludge as a fertilizer. Rural Generation has been active in manag-ing willow plantations in Northern Ireland and Ireland (http://www.ruralgeneration. com/).

Genetic Improvement of Willow (Salix spp.) as a Dedicated Bioenergy Crop 359
also Chapter 5), especially considering that willow is harvested and chipped without removal of the bark. Bark is known to contain a higher proportion of lignin and ex-tractives than wood alone (Adler et al. 2005; Serapiglia et al. 2008; Zapesochnaya et al. 2002).
The cultivation and conversion of willow biomass to bioenergy or biofuels has many positive environmental benefits, including: highly positive net energy ratios (Heller et al. 2004; Heller et al. 2003), lower greenhouse gas emissions than fossil fuels (Keoleian and Volk 2005), improved soil conservation (Volk et al. 2004b), greater agricultural landscape diversity (Berg 2002), increased soil and bird biodiver-sity (Minor et al. 2004; Dhondt et al. 2007), and improved nutrient management (Kuzovkina and Quigley 2005; Volk et al. 2006). Despite these advantages and the demonstration of technical feasibility in Europe and North America, willow for bio-energy production has not been adopted on a large-scale outside Sweden and the U.K., and even in Sweden the total acreage of willow has not increased for several years (Verwijst 2001). This is primarily because, just like with most lignocellulosic biomass crops, the cultivation, harvest, delivery, and conversion of willow is not yet economically viable or is only marginally viable without government subsidies, based on current market prices for woody biomass and the lack of accounting for the external costs of alternative fossil fuels, especially coal (Mitchell et al. 1999; Toivonen and Tahvanainen 1998; Keoleian and Volk 2005;Volk et al. 2006). In cases where the economics are demonstrated to be or potentially can be profitable, there are other barriers to adoption and continued cultivation of willow, including a lack of support systems for best agronomic practice (Helby et al. 2006), inadequate infrastructure, immature markets and economic policies, and lack of awareness of the benefits of the system, all of which penalize pioneer adopters (Hoffmann and Weih 2005; Rosenqvist and Dawson 2005; Ericsson et al. 2006). Obviously, increased market price for woody biomass can dramatically improve profitability, but so too can increased yield achieved through breeding and selection. Economic modeling predicts that a 20% improvement in yield will provide 13% reduction in the cost of biomass production in the U.S. (Tharakan et al. 2005).
13.4 Breeding and Selection of Improved Shrub Willow Varieties for Bioenergy
13.4.1 Pollination, Hybridization, and Seedling Propagation of Willows
Since the widespread cultivation of shrub willow crops specifically for the produc-tion of bioenergy or biofuels is a relatively new phenomenon, there has been little opportunity for plant breeding or domestication of desirable traits for those applica-tions in comparison to the long history of breeding of food crops. Based on this short period of domestication and the vast genetic diversity that is available, there is great opportunity to make rapid genetic gains in willow yields in the near-term. Controlled breeding of willows is a highly tractable proposition. Willows grow perennially and have a relatively short generation time, with flowers forming within 2–4 years after seed germination, depending on the species. For most species, catkins emerge from floral buds that are formed late in the growing season on the distal portions of the stems and remain dormant until early spring, at which time the catkins enlarge and

360 Smart and Cameron push the bud scale off. All members of the genus are dioecious, producing imperfect flowers on catkins, although rarely, in some species, catkins with both male and female flowers may be observed. Flowers are very simple with either two or more stamens or a single pistil subtended by a floral bract.
Excised dormant shoots with floral buds can be placed in water, nutrient solution, or moist soil to force bud break and catkin emergence. Viable pollen can be extracted from male flowers using toluene (Kopp et al. 2002) and stored at –20°C for several years, if not longer. Simple pollen germination tests on agar media can be accom-plished to verify pollen viability (Mosseler 1989; Kopp et al. 2002). Female flowers are receptive for 2–6 days after the lobes of the stigma become fully reflexed and can be pollinated by mechanical application of stored pollen using a fine paintbrush (Fig. 13.4) (Mosseler 1989; Kopp et al. 2002).
Fig. 13.4. Mechanical pollination of female willow flowers.
After successful pollination, seed maturation occurs over approximately 20–40 days, and typically at least 10–20 seeds can be collected per catkin (Mosseler 1990). Mature seeds have a short half-life of only 6–15 days at ca. 20°C, depending on the species (Karrenberg and Suter 2003), so it is best to sow them immediately on moist vermiculite or fine potting mix, but seeds may be stored at –20°C or –80°C for years if properly dried (Maroder et al. 2000; Daigle and Simpson 2002; Wood et al. 2003). After a few weeks of growth in a glasshouse, seedlings may then be transplanted to individual containers and eventually transplanted to the field, or they may be screened for incidence of disease while still in containers, so that only selected resis-tant plants are established in the field.
Since willows are propagated vegetatively, the goal of breeding and selection is straightforward: identify outstanding individuals (clones) through rigorous, repli-cated trials and then multiply them for establishment of cutting nursery beds and bioenergy plantations. Over the short history of genetic improvement of Salix as a bioenergy crop, selection of outstanding individuals has been accomplished from first-generation intraspecific crosses, from F1 hybrids produced by interspecific crosses, and from crosses of F1 interspecific hybrids back to one of the parental spe-

Genetic Improvement of Willow (Salix spp.) as a Dedicated Bioenergy Crop 361
cies. Interspecific hybridization in Salix does occur in nature, but is generally rare and occurs only among particular co-habitating species (Brunsfeld et al. 1992; Beis-mann et al. 1997; Hardig et al. 2000; Triest et al. 2000). However, through controlled pollination, many species are capable of hybridization (Fig. 13.5) (Argus 1974; Zsuffa et al. 1984; Mosseler 1989; Mosseler 1990; Kopp et al. 2001; Smart et al. 2005). While many interspecific hybrids display heterosis, which has led to rapid gains in yield, Gullberg (1993) argued strongly for a traditional long-term strategy of multi-generational inbreeding and recurrent selection of sub-lines of S. viminalis that could be used to generate intraspecific hybrids in a long-term breeding strategy.
Major gains in yield, disease, and pest resistance in the various willow breeding programs have been attained through interspecific hybridization through a single generation of breeding. Rigorous attempts at interspecific hybridization have demon-strated that crosses within subgenera are far more likely to succeed than crosses between members of different subgenera. In the breeding of willow bioenergy crops, efforts have focused on crosses among species within the subgenus Vetrix, with crosses between species in the same section being the most likely to produce viable seed (Fig. 13.5) (Kopp 2000). Barriers to hybridization can be based on incompati-bility between tetraploid and diploid species, such as between S. lucida and S. amyg-daloides (Mosseler 1990). There are also demonstrated pollen-pistil incompatibili-ties, with the stigma of S. eriocephala flowers displaying particularly strong inhibition of growth of pollen from other species (Mosseler 1989; Kopp 2000).
Fig. 13.5. Crossability relationships among Salix species bred as bioenergy crops in the sub-genus Vetrix.

362 Smart and Cameron 13.4.2 Genetics of Traits Important for Improved Performance of Willow as a Bioenergy Crop
In deciding what differences to measure among the progeny of controlled crosses, one must consider the characteristics that, if improved, would lead to greater net value as a bioenergy crop. The sum of these theoretically superlative traits represents the ideotype, the model clone for that particular application (Dickmann et al. 1994). Once the ideotype is defined, one must establish the degree to which phenotypic variation in those traits is under genetic control, and thus may be subject to genetic improvement over generations of breeding. A number of studies of heritabilities and genetic variances of biomass traits have been conducted for S. viminalis in Sweden and S. eriocephala in North America. Key traits that are indicative of biomass yield and vigor that have been measured in genetics studies include: stem number, height of the tallest stem, total stem area per plant, diameter of the tallest stem, date of bud burst, date of growth cessation, degree of sylleptic branching (growth of lateral buds without experiencing winter dormancy), wood density, rust incidence, and degree of insect damage. Since willow is established from clonally-propagated material, the selection of individuals from families with wide-ranging dominance and epistatic variance can be exploited. By measuring and analyzing progeny produced by facto-rial mating designs, one can estimate the proportions of additive, dominance, and epistatic variance that contribute to the genetic contributions to phenotypic variance. Based on these estimates, one can design a strategy for selection that will provided regular and rapid improvements in yield through breeding.
In S. viminalis, an 8×8 factorial mating design was used to examine the heritabil-ity of traits important for biomass yield on contrasting soil types (clay and sand) and with differing nutrient regimes. For all traits that were analyzed, there was a moder-ate to high proportion of additive variance, which suggests that a program based on recurrent selection and crosses will provide regular gains (Rönnberg-Wästljung et al. 1994; Rönnberg-Wästljung and Gullberg 1999). However, for the characters of weight and number of stems, there was a considerable contribution of epistatic vari-ance, which suggests that crosses between particular pairs of parents must be consid-ered (Rönnberg-Wästljung et al. 1994). Among a wide range of other characters that could contribute to the ideotype for S. viminalis, all were estimated to have a high proportion of additive variance, including sylleptic shoots, wood density, growth cessation, rust incidence, and insect damage (Rönnberg-Wästljung and Gullberg 1999). Narrow sense heritabilities were estimated to have an overall value of 0.18 (Rönnberg-Wästljung et al. 1994), although heritability estimates for dry matter content, insect susceptibility, rust incidence, growth cessation, and stem diameter were all relatively high with little genotype×environment interaction in differing nutrient regimes, indicating opportunity for improvement through breeding and se-lection (Gullberg and Ryttman 1993; Strong et al. 1993; Rönnberg-Wästljung and Gullberg 1999).
While breeding in Sweden has focused on S. viminalis, genetics studies in North America have utilized the native species S. eriocephala. Initial work based on only 20 clones provided estimates of broad-sense heritabilities for stem height, stem di-ameter, and biomass that were low, for stem number and branching that were moder-

Genetic Improvement of Willow (Salix spp.) as a Dedicated Bioenergy Crop 363
ate, and for moisture content and specific gravity that were high with no significant clone by site interactions (Lin and Zsuffa 1993). These results suggested that only limited gains were possible in breeding and selecting for height, stem diameter, or biomass yield.
13.4.3 Current Breeding Efforts for the Development of Shrub Willow as an Energy Crop
13.4.3.1 Breeding Programs in Sweden
Through the 1980’s and early 1990’s, shrub willow breeding was conducted primar-ily by three groups: a program at the Long Ashton Research Station in the U.K. based on a collection built by Kenneth Stott who was succeeded by Kevin Linde-gaard (Lindegaard and Barker 1997); an industrial program at Svalöf Weibull in Sweden led by Stig Larsson (Larsson 1997) who worked in cooperation with Urban
To expand upon this work in a North American willow, crosses were completed in 1998 at SUNY-ESF to generate 34 families based on a partial diallel design using 15 S. eriocephala parents from NY, PA, and Ontario for the purpose of studying the heritability of traits important for biomass yield (Cameron et al. 2008). From each family, up to 10 individuals were randomly selected and propagated in nursery beds. Cuttings were harvested from these nursery beds for the establishment of trials at two sites – Tully and in LaFayette, NY – in June 2000. Each site contained 329 clones, representing 314 progeny clones and the 15 parents, planted in four-plant plots in four randomized complete blocks. Rust incidence was scored in these trials near the end of the first growing season (October 2000), while height of the tallest stem, number of stems, and stem diameters were measured for the middle two plants in each plot at the end of the first post-coppice growing season (October 2001). While the narrow-sense heritability estimates for number of stems and total stem area per plant were low (0.16 and 0.19, respectively), the heritability estimates for rust inci-dence and height of the tallest stem were moderate (0.30 and 0.32, respectively) Cameron et al. 2008; These heritability estimates are similar to those for S. vimi-nalis (Rönnberg-Wästljung et al. 1994; Rönnberg-Wästljung and Gullberg 1999) and to broad-sense heritability estimates previously reported for S. eriocephala (Lin and Zsuffa 1993), except that in this study the heritability for stem height was estimated to be much higher. The major component of the genetic variance for all traits was additive variance, with some contribution of epistatic variance for number of stems and total stem diameter (Cameron et al. 2008). Additional studies were performed to test for any effect of inbreeding among progeny from second-generation crosses of S. eriocephala both in the field, in which height of the tallest stem, stem number, and stem diameters were measured, and in a greenhouse, in which stem height was measured (Phillips 2002). In no case was the performance of second-generation progeny produced by crossing unrelated F1 individuals significantly better than that of progeny from full-sib or half-sib crosses (Phillips 2002). As was concluded for S. viminalis, the results of studies involving the North American species S. eriocephala indicate that regular gains can be captured through recurrent selection with no ex-pected near-term effect of inbreeding depression.

364 Smart and Cameron Gullberg and colleagues at the Swedish University of Agricultural Sciences in Upp-sala (Gullberg 1993); and an academic program at University of Toronto in Ontario, Canada led by Louis Zsuffa (Zsuffa 1988). These programs were all selecting bio-energy varieties that displayed improved biomass yield, disease resistance, and pest resistance, while frost tolerance was of particular concern for the Swedish program and rust resistance for the U.K. program. All of these programs underwent transition in the mid-1990’s as Zsuffa and Gullberg retired the Long Ashton Research Station was closed down, and the U.K. willow collection was moved to Rothamsted.
In Sweden, varieties have been bred and released by the agricultural development firm Svalöf Weibull AB of Svalöf, while the willow cultivation enterprise based in Örebro was conducted by a division named Agrobränsle, now named Lantmännen Agroenergie. Breeding was initiated in 1987 after an extensive breeding population was assembled from collections of S. viminalis, S. dasyclados, and S. schwerinii from Scandinavia, across Russia, and central Europe (Åhman and Larsson 1994; Larsson 1997). By 1994, more than 46,000 seedlings had been produced from over 380 crosses (Åhman and Larsson 1994). The seedling plants were initially screened for rust incidence by growing them in potting mix in trays placed outside over the first growing season. Selections of as few as 5–10% of those seedlings were then propagated as cuttings for establishment of two successive observation trials in southern and northern Sweden. Those varieties that displayed improvements in im-portant traits, such as yield, growth form, frost tolerance, rust resistance, and insect resistance were planted together with reference varieties in yield trials consisting of 52-plant plots in three replicates on multiple sites distributed across the growing region of Sweden (Åhman and Larsson 1994). In comparison to the standard refer-ence variety L78183, which produced mean yields of 7.3–12.5 oven dry tonnes (odt) ha–1 yr–1 across two harvests on two sites, varieties produced through one round of breeding, including ‘Orm’, ‘Rapp’, ‘Jorr’, ‘Jorunn’, ‘Björn’, ‘Tora’, and ‘Loden’, displayed yield increases of 5–33% (Table 13.1) (Åhman and Larsson 1994; Larsson 1997; Larsson 1998). More recent crosses, many using some of the varieties listed above as parents, have produced new varieties, including ‘Torhild’, ‘Sven’, ‘Olof’, ‘Tordis’, ‘Inger’, and ‘Gudrun’. These newest varieties can produce 26–62% greater yields than L78183 (Lantmännen Agroenergie; www.agrobransle.se/index1,1.htm). As new plantations are established using these varieties, the average commercial yields in Sweden should increase from the rather disappointing levels reported for 1996–1998 of 3.8–4.3 odt ha–1 yr–1 from fields that were mostly not fertilized (Lars-son et al. 1998).
13.4.3.2 Breeding Programs in the United Kingdom
Breeding of willow bioenergy crops in the U.K. was initiated in 1996 using clones in the National Willow Collection (Stott 1984) in a collaborative project involving the Long Ashton Research Station, Svalöf Weibull, and Murray Carter (Lindegaard and Barker 1997). Using a common selection strategy similar to the one adopted by Svalöf Weibull, crosses focused on expanding the genetic base of European bio-energy varieties, including the use of S. burjatica (syn. S. dasyclados). In addition to selecting for high biomass yield and proper form, resistance to rust prevalent in the
,

Genetic Improvement of Willow (Salix spp.) as a Dedicated Bioenergy Crop 365
U.K.’s maritime climate has been a priority. Varieties that have been deployed or are in final yield trials include: ‘Endeavour’, ‘Discovery’, ‘Resolution’, ‘Terra Nova’, ‘Ashton Stott’, ‘Nimrod’, and ‘Quest’ (Table 13.1; I. Shield and S. Hanley, personal communication).
Table 13.1. Willow varieties bred and selected as commercial bioenergy crops
Variety epithet Species or species pedigree Svalöf Weibull ‘Orm’, ‘Jorr’, ‘Jorunn’ S. viminalis ‘Tora’, ‘Björn’ S. schwerinii × S. viminalis ‘Torhild’, ‘Tordis’ (S. schwerinii × S. viminalis) × S. viminalis ‘Sven’, ‘Olof’, ‘Asgerd’ S. viminalis × (S. schwerinii × S. viminalis) ‘Loden’, ‘Gudrun’ S. dasyclados ‘Inger’ S. triandra × S. viminalis UK (European) ‘Endeavour’ S. viminalis × S. schwerinii ‘Discovery’ S. schwerinii × (S. schwerinii × S. viminalis) ‘Resolution’ (S. vim. (S. schwer. × S. vim.)) × (S. vim. ×
(S. vim. × S. schwer.)) ‘Terra Nova’ (S. triandra × S. viminalis) × S. linderstipularis ‘Ashton Stott’ S. viminalis × S. burjatica ‘Nimrod’ (S. schwerinii × viminalis) × S. linderstipularis ‘Quest’ S. viminalis × (S. schwerinii × S. viminalis) SUNY-ESF ‘Fish Creek’, ‘Onondaga’, ‘Alle-gany’
S. purpurea
‘Millbrook’, ‘Oneida’ S. purpurea × S. miyabeana ‘Sherburne’, ‘Canastota’ S. sachalinensis × S. miyabeana ‘Otisco’, ‘Tully Champion’, ‘Owasco’
S. viminalis × S. miyabeana
13.4.3.3 Breeding Programs in North America
Willow breeding in North America was initiated at the University of Toronto and focused on species native to the region, including S. eriocephala, S. exigua, S. luci-da, S. amygdaloides, S. bebbiana, S. pellita, S. petiolaris, and S. discolor. Collections of these species were made across portions of southern Canada with some collections from the U.S. Extensive crosses were attempted starting in 1983, yielding important information about the ability to produce interspecific hybrids for these species (Mos-seler et al. 1988; Zsuffa 1988; Mosseler 1989; Mosseler 1990). A family screening trial was established in 1984 near Maple, ON with 38 families of seedlings. From this trial, 300 clones were selected and propagated as cuttings to establish four yield trials, three in Ontario and one at the Tully Genetics Field Station of SUNY-ESF in

366 Smart and Cameron Tully, NY. Based on those trials, 19 clones were selected and scaled-up for multiple regional yield trials across the northeast U.S., each with randomized complete block replication. These trials contained different combinations of six to as many as 19 willow clones in three or four replicate blocks, with some trials including hybrid poplar clones, new clones imported from Japan (designated as SX clones), and S. purpurea clones collected from natural stands in NY. The best five varieties from seven of those trials combined produced mean yields of 6.2–10.0 odt ha–1 yr–1 in the first harvest (Kiernan, Volk, Abrahamson and White, unpublished results). Consis-tently among the top five varieties across most sites were S. sachalinensis ‘SX61’, S. miyabeana ‘SX64’ and ‘SX67’, and the reference variety S. dasyclados ‘SV1’. A number of commercial varieties developed in Sweden were imported and grown at the Tully Genetics Field Station, but suffered severely impaired growth performance due to the feeding of potato leaf hopper (Empoasca fabae Harris) (R.F. Kopp and L.P. Abrahamson, unpublished results).
In order to develop varieties selected for conditions in North America with im-proved yield over the varieties selected from the Toronto program, SUNY-ESF initi-ated its own willow breeding program. One priority has been to assemble a large, diverse, and well-characterized collection of willows from which parents can be chosen for controlled pollinations. Collections of willows naturally established on wild or disturbed sites in the Northeast and Midwest U.S. began in 1994, with major collection efforts in 1995, 2000, and 2001. Molecular marker analyses have demon-strated that there is great genetic diversity and a relatively high degree of heterozy-gosity among the natural populations of S. purpurea and S. eriocephala in NY (Lin 2006). By 2007 the willow collection maintained at the Tully Genetics Field Station contained over 700 accessions representing more than 20 species and species hy-brids. The species with greatest representation in the collection include S. erio-cephala and S. purpurea. Additions to collection were obtained through contribu-tions of bred and native collections from U.S. and overseas collaborators and acquisition of commercial and horticultural varieties from nurseries. Techniques for controlled pollinations were established (Kopp et al. 2002), with the first crosses completed in 1998. Initially, approximately 75–100 crosses were attempted each year in order to gain an understanding of cross-pollination success and interspecies compatibility.
In 1998, 49 families were produced through controlled pollinations. These seed-lings were grown in potting mix in a greenhouse for one season, allowed to go dor-mant, were then propagated from small cuttings and planted in the field in Syracuse, NY in the summer of 1999. Thirty-four of those families were developed for a study of S. eriocephala genetics, described above, in which 10 seedling individuals were randomly selected from each family for propagation and establishment on two sites in 2000. Twenty-nine fast-growing individuals from other families produced in 1998 were chosen based on first-year post-coppice measurements of stem height in a fam-ily screening trial and were propagated and planted in nursery beds in 2000. Based on their height growth and vigor after the 2000 growing season, the 16 tallest varie-ties were selected to be incorporated into a selection trial in Tully, NY planted in May 2001 (designated the 2001 selection trial) using unrooted 25-cm cuttings in 40-plant double-row plots in a randomized complete block design with three blocks,

Genetic Improvement of Willow (Salix spp.) as a Dedicated Bioenergy Crop 367
together with four varieties collected from natural stands, and five reference varie-ties. Among the varieties bred in 1998 were progeny produced by crossing S. sa-chalinensis, S. purpurea, or S. dasyclados with S. miyabeana, while others were from intraspecific crosses of S. purpurea. The plants were coppiced after the first growing season, then harvested in February 2005 after three more growing seasons. The overall mean yield across all varieties was over 7 odt ha–1 yr–1. The yields of 12 varieties, including nine from the breeding program, surpassed that of ‘SV1’, the standard reference variety, which had a mean yield of 7.4 odt ha–1 yr–1. The top vari-ety in this trial was S. miyabeana ‘SX64’ with mean yield of 11.3 odt ha–1 yr–1, 53% greater than that of ‘SV1’. The top variety from the breeding program was 9870-23, which produced 35% more biomass than ‘SV1’.
Crosses completed in 1999 generated 46 families with more than 2,000 progeny that were transplanted in linear plots in a family screening trial at LaFayette Road Experiment Station in Syracuse, NY during the summer of 1999. Plants were cop-piced after the first growing season and then height of the tallest stem, stem number, and stem diameters were measured at the end of the second growing season post-coppice (Oct 2001). The top 15 individuals from four families with the highest mean total stem diameter per plant were selected to be included in a selection trial in Tully, NY, as well as another 22 progeny individuals selected from eight other families and four reference varieties. Small (12–17-cm) cuttings were rooted in potting mix in a greenhouse, and were then used to establish the trial in the spring of 2002 (desig-nated the 2002 selection trial) in four-plant plots in eight completely randomized blocks. Among the 82 new varieties tested in this trial are progeny of S. viminalis × S. miyabeana, S. purpurea × S. miyabeana, and S. sachalinensis × S. miyabeana interspecific crosses, as well as progeny of intraspecific crosses of S. purpurea. The plants were coppiced after the first growing season, then harvested biennially due to their high rate of growth and slightly closer spacing (0.6×0.9 m). There was some initial mortality in certain plots soon after planting, probably due to sensitivity to pre-emergent herbicide that was applied, so only plots with more than two surviving plants were included in yield calculations. The overall mean yield across all varieties after the second biennial harvest (January 2007) was 10.8 odt ha–1 yr–1 with 25 varie-ties producing yields greater than reference variety, ‘SV1’. The highest yielding variety, ‘Tully Champion’, an S. viminalis × S. miyabeana hybrid, produced 23.8 odt ha–1 yr–1, 77% greater than the yield of reference variety ‘SV1’, which produced 13.4 odt ha–1 yr–1. Varietal yields were highly correlated from the first to second rotation harvest, suggesting that measurements obtained from the first rotation can be used to select individuals for further testing and scale-up and are a reliable indicator of future yield.
Results of basic genetics studies, as well as empirical evidence from demonstra-tion plantings, indicate that there can be considerable genotype×environment interac-tions for traits important for yield (Rönnberg-Wästljung et al. 1994; Tahvanainen and Rytkonen 1999). Thus, while a variety may do very well in one testing location, it must be tested at multiple locations to determine if it is phenotypically plastic and can perform well across a variety of site properties or if its performance is dependent on particular soil, moisture, or other environmental conditions. In the SUNY-ESF breeding program, varieties are selected in a family screening trial, then in a selec-

368 Smart and Cameron
A major bottleneck in the implementation of shrub willow as a bioenergy crop is the scale-up of planting stock of superior varieties needed to establish thousands of acres of in a relatively short time period. In order to expedite this process, varieties selected in the SUNY-ESF breeding program have been scaled-up early on in the selection program into nursery beds maintained for cutting production. Each plant in an irrigated and fertilized nursery bed will typically produce 25–35 20-cm cutting equivalents annually within three years of establishment. This rate of scale-up can be accelerated through the use of micropropagation (Grönroos et al. 1989; Rocha 1991), if market demands warrant the added costs involved. In order to encourage commer-cial investment in willow cultivation, SUNY-ESF has taken steps to protect the intel-lectual property in elite varieties developed in the breeding program through applica-tion for plant patents. To date, U.S. plant patents have been issued for seven varieties. While many of these varieties will be used for biomass production, some varieties are also suited to other uses, such as streambank restoration, living snow-fences, riparian buffers, privacy hedges, or phytoremediation. While these are small-er niche markets, the price point for cuttings can be set higher, allowing for increased revenue that will support the establishment of commercial willow nurseries. SUNY-ESF has worked in conjunction with Double A Vineyards dba Double A Willow of Fredonia, NY, which has established a commercial nursery supplying willow plant-ing stock (whips and cuttings) to growers and landowners (http://www.doubleawillow.com). Sixteen varieties, most of which were produced in the SUNY-ESF breeding program are now available on the commercial market in NY (Table 13.1). By 2007, Double A Willow had established nursery beds with 350,000 plants, capable of producing over 10 million cutting equivalents annually
tion trial, and finally they are tested in regional yield trials planted in commercial double-row spacing. Based on performance in the 2001 and 2002 selection trials, as many as 25 new varieties were chosen for further testing in yield trials, including progeny from intraspecific S. eriocephala crosses, S. purpurea progeny, and inter-specific hybrids of S. purpurea, S. sachalinensis, and S. viminalis crossed with S. miyabeana. Unrooted 25-cm cuttings of 13 bred varieties, one variety of S. purpurea collected from a natural stand, and four reference varieties were planted in the spring of 2005 in 78-plant plots at a density of ~15,000 plants ha–1, in a completely random-ized block design with four replicate blocks in duplicate yield trials at Belleville and Tully, NY. In the spring of 2006, more yield trials using 24, 26, and 30 varieties total (including the 18 used in the 2005 yield trials) were established at sites in Ed-monton, AB, Waseca, MN, and Constableville, NY. In 2007 and 2008, additional trials incorporating as many as 30 varieties were planted in Saskatoon, SK; Montréal, QC; Middlebury, VT; Escanaba, MI; Delhi, NY and Fredonia, NY. As a standard procedure, the trials are coppiced after the establishment year growing season and chemical or mechanical weed management techniques are applied to ensure proper establishment. They will be harvested on a three-year rotation, with measurements collected from the middle 18 plants in each plot. Fertilizer, usually in the form of ammonium sulfate or sulfur-coated urea, is added at a rate of 100 kg N ha–1 early in the growing season after each coppice or harvest. Soil analysis and weather data are collected as feasible at each site, so that correlations can be made between site condi-tions and variety performance.

Genetic Improvement of Willow (Salix spp.) as a Dedicated Bioenergy Crop 369
once mature. As the market for shrub willow expands in North America, it will be necessary to dramatically expand the acreage of nurseries to supply the demand for cuttings.
13.4.4 Analysis and Genetic Modification of the Willow Genome
While the characterization of the poplar genome has advanced significantly, includ-ing determination of the complete genome sequence of Populus trichocarpa (Tuskan et al. 2006), analysis of the willow genome has progressed less rapidly. Significant work has been accomplished to produce genetic linkage maps of at least four differ-ent shrub willow pedigrees based on molecular marker technology that have allowed for the mapping of quantitative trait loci (QTL) for a number of important traits. The double pseudo-testcross approach has been used to map AFLP and RFLP markers in 87 progeny of a cross of S. viminalis × S. schwerinii ‘Björn’ with S. viminalis ‘78183’ and to identify QTL for height growth, stem diameter, height:diameter ratio, number of vegetative buds, and number of stems (Tsarouhas et al. 2002). A cross between the diploid S. viminalis ‘Jorunn’ and the frost-resistant, hexaploid S. dasy-clados ‘SW901290’ generated tetraploid F1 progeny, two of which were crossed to produce a population of 92 F2 individuals that were mapped using AFLP markers (Rönnberg-Wästljung et al. 2003). This population has since been used to map QTL for frost resistance, shoot phenological traits, insect damage, water use efficiency, and relative growth rate (Tsarouhas et al. 2004; Rönnberg-Wästljung et al. 2005, 2006; Weih et al. 2006). The double pseudo-testcross strategy was also used to de-velop a linkage map of S. viminalis based on 66 progeny of a cross of two full-sib individuals using microsatellite and AFLP markers (Hanley et al. 2002). This ap-proach was dramatically expanded to construct a linkage map based on a large popu-lation of progeny (n = 471) of a cross between two S. viminalis × (S. viminalis × S. schwerinii) hybrid sibs and using AFLP®, microsatellite, and single nucleotide polymorphisms (SNPs) (Hanley et al. 2006). By using many mapped poplar microsa-tellite markers that amplified loci in willow, mapping the sequences of a number of willow microsatellite loci to the poplar genome, and generating SNPs from unique poplar genes amplified from willow, Hanley et al. (2006) have effectively demon-strated that there is significant macrosynteny between the poplar and willow ge-nomes. Thus, there is great promise in applying knowledge gained from the intensive study of poplar to the genetic improvement of willow through marker assisted selec-tion and map-based cloning of genes underlying QTL, although the diversity and heterozygosity of willows complicates the translation of molecular marker technol-ogy from Populus to the genus Salix (Barker et al. 1999, 2003; Lin 2006).
While research expanding our understanding of the willow genome is gaining momentum from the study of Populus, protocols for the genetic modification of willows are not readily available. This currently limits the application of reverse genetics approaches for functional genomics research and the eventual development of improved varieties through genetic modification. In fact there have been only a few published reports of the in vitro regeneration of adventitious shoots from willow explants, including: from callus derived from leaf explants of S. exigua (Stoehr et al. 1989), from leaf explants of S. lucida (Xing 1995), and from immature inflorescen-

370 Smart and Cameron ces of S. nigra (Lyyra et al. 2006). While Agrobacterium-mediated transformation of callus of S. viminalis and S. lucida have been accomplished, plants could not be regenerated (Rocha 1991; Vahala et al. 1989). Attempts to transform S. alba using particle bombardment were also highly inefficient (Devantier et al. 1993). It appears that extensive additional work will be required to develop and optimize an efficient transformation system for fast-growing, hybrid or parental varieties of Salix.
13.5 Future Outlook
With rising prices for oil and natural gas and swelling grassroots interest in expand-ing the use of renewable and sustainable sources of energy, capital investment in and commercialization of green technologies has accelerated. Over the next decade, these drivers will stimulate efforts to dramatically scale-up production areas of fast-growing perennial bioenergy crops, including willow. While the infrastructure for willow cultivation and conversion is well established in Sweden, emerging markets for biomass in other parts of Europe, Canada, and the Northeast and Midwest U.S. will demand cooperation between academic researchers, industry, and policymakers to overcome hurdles in implementing efficient production, harvesting, consolidation, shipping, and conversion systems that are economically viable. Ongoing breeding, basic research into crop physiology, and incorporation of genome-based technology for the rapid development of improved varieties will be essential to ensuring the long-term viability of willow as a commodity bioenergy crop. The research advances and technology transfer accomplished by a relatively small group of scientists in recent years provides a solid foundation for expanded efforts in development of willow bioenergy crops and convincing justification for additional investment in an expanding willow crop enterprise.
Acknowledgements
This chapter is dedicated to Dr. Edwin H. White in recognition of his distinguished career in the study of willow and poplar. We are grateful to Dr. Lawrence P. Abra-hamson for critical review of this chapter, to Dr. Timothy Volk for ongoing collabo-rations and to Drs. Ian Shield and Steve Hanley for sharing unpublished information. Funding in support of willow breeding and selection at SUNY-ESF has been gener-ously provided by the U.S. Department of Agriculture, the U.S. Department of En-ergy, the U.S. Department of the Interior and the New York State Energy Research and Development Authority.
References
Abrahamson L.P., Robison D.J., Volk T.A., White E.H., Neuhauser E.F., Benjamin W.H., and Peterson J. M. (1998) Sustainability and environmental issues associated with willow bio-energy development in New York (U.S.A.). Biomass Bioenergy 15, 17–22.

Genetic Improvement of Willow (Salix spp.) as a Dedicated Bioenergy Crop 371
Adegbidi H.G., Briggs R.D., Volk T.A., White E.H., and Abrahamson L.P. (2003) Effect of organic amendments and slow-release nitrogen fertilizer on willow biomass production and soil chemical characteristics. Biomass Bioenergy 25, 389–398.
Adegbidi H.G., Volk T.A., White E.H., Abrahamson L.P., Briggs R.D., and Bickelhaupt D.H. (2001) Biomass and nutrient removal by willow clones in experimental bioenergy planta-tions in New York State. Biomass Bioenergy 20, 399–411.
Adler A., Verwijst T., and Aronsson P. (2005) Estimation and relevance of bark proportion in a willow stand. Biomass Bioenergy 29, 102–113.
Åhman I. and Larsson S. (1994) Genetic improvement of willow (Salix) as a source of bio-energy. Norw. J. Agric. Sci. 18S, 47–56.
Argus G.W. (1974) An experimental study of hybridization and pollination in Salix (willow). Can. J. Bot. 52, 1613–1619.
Argus G.W. (1997) Infrageneric Classification of Salix (Salicaceae) in the New World. Sys-tematic botany monographs, American Society of Plant Taxonomists, Ann Arbor, Mich., 121pp.
Azuma T., Kajita T., Yokoyama J., and Ohashi H. (2000) Phylogenetic relationships of Salix (Salicaceae) based on rbcL sequence data. Am. J. Bot. 87, 67–75.
Barker J.H., Pahlich A., Trybush S., Edwards K.J., and Karp A. (2003) Microsatellite markers for diverse Salix species. Molec. Ecol. Notes 3, 4–6.
Barker J.H.A., Matthes M., Arnold G.M., Edwards K.J., Åhman I., Larsson S., and Karp A. (1999) Characterization of genetic diversity in potential biomass willows (Salix spp.) by RAPD and AFLP analyses. Genome 42, 173–183.
Beismann H., Barker J.H.A., Karp A., and Speck T. (1997) AFLP analysis sheds light on distribution of two Salix species and their hybrid along a natural gradient. Mol. Ecol. 6, 989–993.
Berg A. (2002) Breeding birds in short-rotation coppices on farmland in central Sweden–the importance of Salix height and adjacent habitats. Agric. Ecosyst. Environ. 90, 265–276.
Blowers M.K. (2003) Xylan Extraction from Short Rotation Willow Biomass. M.S. thesis, State University of New York College of Environmental Science and Forestry, Syracuse, NY, 76pp.
Broberg C.L., Borden J.H., and Humble L.M. (2001) Host range, attack dynamics, and impact of Cryptorhynchus lapathi (Coleoptera: Curculionidae) on Salix (Salicaceae) spp. Can. En-tomol. 133, 119–130.
Brunsfeld S.J., Soltis D.E., and Soltis P.S. (1992) Evolutionary patterns and processes in Salix sect Longifoliae – Evidence from chloroplast DNA. Systematic Botany, 17, 239–256.
Collins C.M., Fellowes M.D.E., Sage R.B., and Leather S.R. (2001) Host selection and per-formance of the giant willow aphid, Tuberolachnus salignus Gmelin implications for pest management. Agric. Ecosyst. Environ. 3, 183–189.
Czesak M.E., Knee M.J., Gale R.G., Bodach S.D., and Fritz R.S. (2004) Genetic architecture of resistance to aphids and mites in a willow hybrid system. Heredity 93, 619–626.
Daigle B.I. and Simpson J.D. (2002) Seed viability of three Salix species after 24 months storage at two moisture contents and four temperatures. In: C.A. Thanos, T.L. Beardmore, K.F. Conner, and E.L. Tolentino Jr. (Eds.) Tree Seeds 2002, Annual Meeting of IUFRO Research Group for Seed Physiology and Technology, University of Athens Publications, Chania, Crete, Greece, pp. 40–45.
Devantier Y.A., Moffatt B., Jone C., and Charest P.J. (1993) Microprojectile-mediated DNA delivery to the Salicaceae family. Can. J. Bot. 71, 1458–1466.
Cameron K.D., Phillips I.S., Kopp R.F., Volk T.A., Maynard C.A., Abrahamson L.P., and
Smart L.B. (2008) Quantitative genetics of traits indicative of biomass production and het-erosis in 34 full-sib F1 Salix eriocephala families. Bioenerg. Res. 1, 80–90.

372 Smart and Cameron
Dickmann D.I., Gold M.A., and Flore J.A. (1994) The ideotype concept and the genetic im-provement of tree crops. Plant Breed. Rev. 12, 163–193.
Dimitriou I. and Aronsson P. (2005) Willows for energy and phytoremediation in Sweden. Unasylva 56, 47–50.
Dimitriou I., Eriksson J., Adler A., Aronsson P., and Verwijst T. (2006) Fate of heavy metals after application of sewage sludge and wood-ash mixtures to short-rotation willow cop-pice. Environ. Pollut. 142, 160–169.
willow prior to steam pretreatment. Bioresource Technol. 52, 225–229. Eklund R. and Zacchi G. (1995) Simultaneous saccharification and fermentation of steam-
pretreated willow. Enzyme Microbial Technol. 17, 255–259. Ericsson K., Rosenqvist H., Ganko E., Pisarek M., and Nilsson L. (2006) An agro-economic
analysis of willow cultivation in Poland. Biomass Bioenergy 30, 16–27. Grönroos L., von Arnold S., and Eriksson T. (1989) Callus production and somatic embryo-
genesis from floral explants of basket willow (Salix viminalis L). J. Plant Physiol. 134, 558–566.
Gullberg U. (1993) Towards making willows pilot species for coppicing production. Forest. Chron. 69, 721–726.
Gullberg U. and Ryttman H. (1993) Genetics of field resistance to Melampsora in Salix vimi-nalis. Eur. J. Forest Pathol. 23, 75–84.
Hahn-Hägerdal B., Galbe M., Gorwa-Grauslund M.F., Liden G., and Zacchi G. (2006) Bio-ethanol – the fuel of tomorrow from the residues of today. Trends Biotechnol. 24, 549–556.
Hanley S., Barker J.H.A., Ooijen J.W.V., Aldam C., Harris S.L., Åhman I., Larsson S., and Karp A. (2002) A genetic linkage map of willow (Salix viminalis) based on AFLP and mi-crosatellite markers. Theor. Appl. Genet. 105, 1087–1096.
Hanley S.J., Mallott M.D., and Karp A. (2006) Alignment of a Salix linkage map to the Popu-lus genomic sequence reveals macrosynteny between willow and poplar genomes. Tree Genetics Genomes 3, 35–48.
Hardig T.M., Brunsfeld S.J., Fritz R.S., Morgan M., and Orians C.M. (2000) Morphological and molecular evidence for hybridization and introgression in a willow (Salix) hybrid zone. Mol. Ecol. 9, 9–24.
Hartsough B. and Spinelli R. (2001) Recent reports on SRC harvesters in Europe, Final project report to Oak Ridge National Laboratory. University of California, Davis, CA, p. 27.
Helby P., Rosenqvist H., and Roos A. (2006) Retreat from Salix--Swedish experience with energy crops in the 1990s. Biomass Bioenergy 30, 422–427.
Heller M.C., Keoleian G.A., Mann M.K., and Volk T.A. (2004) Life cycle energy and envi-ronmental benefits of generating electricity from willow biomass. Renewable Energy, 29, 1023–1042.
Heller M.C., Keoleian G.A., and Volk T.A. (2003) Life cycle assessment of a willow bio-energy cropping system. Biomass Bioenergy 25, 147–165.
Hoffmann D. and Weih M. (2005) Limitations and improvement of the potential utilisation of woody biomass for energy derived from short rotation woody crops in Sweden and Ger-many. Biomass Bioenergy 28, 267–279.
Hunter T., Royle D.J., and Arnold G.M. (1996) Variation in the occurrence of rust (Melamp-sora spp) and other diseases and pests, in short-rotation coppice plantations of Salix in the British Isles. Ann. Applied Biol. 129, 1–12.
Dhondt A.A., Wrege P.H., Cerretani J., and Sydenstricker K.V. (2007) Avian species richness and reproduction in short-rotation coppice habitats in central and western New York. Bird Study 54, 12–22.
Eklund R., Galbe M., and Zacchi G. (1995) The influence of SO2 and H2SO4 impregnation of

Genetic Improvement of Willow (Salix spp.) as a Dedicated Bioenergy Crop 373
Kádár Z., Maltha S.F., Szengyel Z., Réczey K., and De Laat W. (2007) Ethanol fermentation
of various pretreated and hydrolyzed substrates at low initial pH. Appl. Biochem. Bio-technol. 137, 847–858.
Karrenberg S. and Suter M. (2003) Phenotypic trade-offs in the sexual reproduction of Sali-caeae from flood plains Am. J. Bot. 90, 749–754.
Kendall D.A. and Wiltshire C.W. (1998) Life-cycles and ecology of willow beetles on Salix viminalis in England. Eur. J. Forest Pathol. 28, 281–288.
Keoleian G.A. and Volk T.A. (2005) Renewable energy from willow biomass crops: Life cycle energy, environmental and economic performance. Crit. Rev. Plant Sci. 24, 385–406.
Kopp R.F. (2000) Genetic Improvement of Salix Using Traditional Breeding and AFLP Fin-gerprinting. Ph.D., SUNY College of Environmental Science and Forestry, Syracuse, NY, 175pp.
Kopp R.F., Abrahamson L.P., Nowak C.A., and White E.H. (1992) Pre-emergent herbicides for site preparation in Salix plantings. Forest. Chron. 68, 218–219.
Kopp R.F., Maynard C.A., Rocha de Niella P., Smart L.B., and Abrahamson L.P. (2002) Collection and storage of pollen from Salix using organic solvents. Am. J. Bot. 89, 248–252.
Kopp R.F., Smart L.B., Maynard C.A., Isebrands J.G., Tuskan G.A., and Abrahamson L.P. (2001) The development of improved willow clones for eastern North America. Forest. Chron. 77, 287–292.
Kuzovkina Y.A. and Quigley M.F. (2005) Willows beyond wetlands: Uses of Salix L. species for environmental projects. Water Air Soil Poll. 162, 183–204.
Kuzovkina Y.A., Weih M., Romero M.A., Charles J., Hurst S., McIvor I., Karp A., Trybush S., Labrecque M., Teodorescu T.I., Singh N.B., Smart L.B., and Volk T.A. (2008) Salix: Botany and Global Horticulture. In: J. Janick (Ed.) Horticultural Reviews, Vol. 34. John Wiley & Sons, Inc., Hoboken, NJ, 447–489.
Labrecque M., Teodorescu T.I., and Daigle S. (1997) Biomass productivity and wood energy of Salix species after 2 years growth in SRIC fertilized with wastewater sludge. Biomass Bioenergy 12, 409–417.
Larsson S. (1997) Commercial breeding of willow for short rotation coppice. Aspects Appl. Biol. 49, 215–218.
Larsson S. (1998) Genetic improvement of willow for short-rotation coppice. Biomass Bio-energy 15, 23–26.
Larsson S., Melin G., and Rosenquist H. (1998) Commercial harvest of willow wood chips in Sweden. In: H. Kopetz, T. Weber, W. Palz, P. Chartier, and G.L. Ferrero (Eds.) Tenth Eu-ropean Conference and Technology Exhibition: Biomass for Energy and Industry, Wurz-burg, Germany, pp. 200–203.
Lin J. (2006) Molecular Analysis and Assessment of the Genetic Diversity of Native and Natu-ralized Shrub Willows. Ph.D. dissertation, State University of New York College of Envi-ronmental Science and Forestry, Syracuse, NY, 174pp.
Lin J.Z. and Zsuffa L. (1993) Quantitative genetic parameters for seven characters in a clonal test of Salix eriocephala II. Genetic and environmental correlations and efficiency of indi-rect selection. Silvae Genet. 42, 126–131.
Lindegaard K.N. and Barker J.H.A. (1997) Breeding willows for biomass. Aspects Appl. Biol. 49, 155–162.
Liu S., Amidon T.E., Francis R.C., Ramarao B.V., Lai Y.-Z., and Scott G.M. (2006) From forest biomass to chemicals and energy: Biorefinery initiative in New York State. Ind Bio-technol 2, 113–120.
Lyyra S., Lima A., and Merkle S.A. (2006) In vitro regeneration of Salix nigra from adventi-tious shoots. Tree Physiol. 26, 969–975.
Jirjis R. (2005) Effects of particle size and pile height on storage and fuel quality of comminuted Salix viminalis. Biomass Bioenergy 28, 193–201.

374 Smart and Cameron Maroder H.L., Prego I.A., Facciuto G.R., and Maldonado S.B. (2000) Storage behaviour of
Salix alba and Salix matsudana seeds. Ann. Bot. 86, 1017–1021. McCracken A.R. and Dawson W.M. (1997) Growing short rotation coppice willow (Salix) in
clonal mixtures as a method of reducing the impact of rust disease caused by Melampsora epitea var. epitea. Eur. J. For. Pathol. 27, 319–328.
McCracken A.R., Dawson W.M., and Bowden G. (2001) Yield responses of willow (Salix) grown in mixtures in short rotation coppice (SRC). Biomass Bioenergy 21, 311–319.
McCracken A.R., Dawson W.M., and Carlisle D. (2005) Short-rotation coppice willow mix-tures and rust disease development. In: M.H. Pei and A.R. McCracken (Eds.) Rust Dis-eases of Willow and Poplar. CABI Publishing, Cambridge, MA, pp. 185–194.
Minor M.A., Volk T.A., and Norton R.A. (2004) Effects of site preparation techniques on communities of soil mites (Acari: Oribatida, Acari: Gamasida) under short-rotation for-estry plantings in New York, USA. Appl. Soil Ecol. 25, 181–192.
Mitchell C.P., Stevens E.A., and Watters M.P. (1999) Short-rotation forestry – operations, productivity and costs based on experience gained in the UK. For. Ecol. Manag. 121, 123–136.
Mosseler A. (1989) Interspecific pollen-pistil incongruity in Salix. Can. J. For. Res. 19, 1161–1168.
Mosseler A. (1990) Hybrid performance and species crossability relationships in willows (Salix). Can. J. Bot. 68, 2329–2338.
Mosseler A., Zsuffa L., Stoehr M.U., and Kenney W.A. (1988) Variation in biomass produc-tion, moisture content, and specific gravity in some North American willows (Salix L.). Can. J. For. Res. 18, 1535–1540.
Newsholme C. (1992) Willows: the genus Salix. Timber Press, Portland, OR, 224pp. Nordman E.E., Robison D.J., Abrahamson L.P., and Volk T.A. (2005) Relative resistance of
willow and poplar biomass production clones across a continuum of herbivorous insect specialization: Univariate and multivariate approaches. For. Ecol. Manag. 217, 307–318.
Palmqvist E., Hahn-Hägerdal B., Galbe M., and Zacchi G. (1996) The effect of water-soluble inhibitors from steam-pretreated willow on enzymatic hydrolysis and ethanol fermenta-tion. Enzyme Microbial. Technol. 19, 470–476.
Park B.B., Yanai R.D., Sahm J.M., Lee D.K., and Abrahamson L.P. (2005) Wood ash effects on plant and soil in a willow bioenergy plantation. Biomass Bioenergy 28, 355–365.
Peacock L., Hunter T., Turner H., and Brain P. (2001) Does host genotype diversity affect the distribution of insect and disease damage in willow cropping systems? J. Appl. Ecol. 38, 1070–1081.
Perttu K.L. and Kowalik P.J. (1997) Salix vegetation filters for purification of waters and soils. Biomass Bioenergy 12, 9–19.
Phillips I.S. (2002) Quantitative Genetics of Traits Predictive of Biomass Yield in First- and Second-Generation Salix Eriocephala. M.S., SUNY College of Environmental Science and Forestry, Syracuse, NY, 119pp.
Rocha S.P. (1991) Micropropagation and Agrobacterium Transformation of Willow (Salix lucida Muhl.). M.S. thesis, State University of New York College of Environmental Sci-ence and Forestry, Syracuse, NY, 73pp.
Rönnberg-Wästljung A.C., Åhman I., Glynn C., and Widenfalk O. (2006) Quantitative trait loci for resistance to herbivores in willow: field experiments with varying soils and cli-mates. Entomol. Exp. Appl. 118, 163–174.
Rönnberg-Wästljung A.C., Glynn C., and Weih M. (2005) QTL analyses of drought tolerance and growth for a Salix dasyclados x Salix viminalis hybrid in contrasting water regimes. Theor. Appl. Genet. 110, 537–549.
Rönnberg-Wästljung A.C. and Gullberg U. (1999) Genetics of breeding characters with possi-ble effects on biomass production in Salix viminalis (L.). Theor. Appl. Genet. 98, 531–540.

Genetic Improvement of Willow (Salix spp.) as a Dedicated Bioenergy Crop 375
Rönnberg-Wästljung A.C., Gullberg U., and Nilsson C. (1994) Genetic parameters of growth characteristics in Salix viminalis grown in Sweden. Can. J. For. Res. 24, 1960–1969.
Rönnberg-Wästljung A.C., Tsarouhas V., Semerikov V., and Lagercrantz U. (2003) A genetic linkage map of a tetraploid Salix viminalis x S. dasyclados hybrid based on AFLP mark-ers. For. Genetics 10, 185–194.
Rosenqvist H. and Dawson M. (2005) Economics of willow growing in Northern Ireland. Biomass Bioenergy 28, 7–14.
Rosenqvist H., Roos A., Ling E., and Hektor B. (2000) Willow growers in Sweden. Biomass Bioenergy 18, 137–145.
Sassner P., Galbe M., and Zacchi G. (2005) Steam pretreatment of Salix with and without SO2 impregnation for production of bioethanol. Appl. Biochem. Biotechnol. 121, 1101–1117.
Sassner P., Galbe M., and Zacchi G. (2006) Bioethanol production based on simultaneous saccharification and fermentation of steam-pretreated Salix at high dry-matter content. Enzyme Microbial Technol. 39, 756–762.
Smart L.B., Volk T.A., Lin J., Kopp R.F., Phillips I.S., Cameron K.D., White E.H., and Abra-hamson L.P. (2005) Genetic improvement of shrub willow (Salix spp.) crops for bioenergy and environmental applications in the United States. Unasylva 56, 51–55.
Solomon J.D. and Randall W.K. (1978) Biology and damage of the willow shoot sawfly in willow and cottonwood. Ann. Entomol. Soc. Am. 71, 654–657.
Stanosz J.C. and Stanosz G.R. (2002) Occurrence of willow pinecone galls induced by Rhab-dophaga strobiloides in a Salix clone evaluation trial. Great Lakes Entomol. 35, 97–100.
Stoehr M.U., Cai M.T., and Zsuffa L. (1989) In vitro plant-regeneration via callus-culture of mature Salix exigua. Can. J. For. Res. 19, 1634–1638.
Stott K. G. (1984) Improving the biomass potential of willow by selection and breeding. In: K. Perttu (Ed.), Ecology and Management of Forest Biomass Production Systems. Swedish University of Agricultural Science, Uppsala, Sweden, pp. 233–260.
Strong D.R., Larsson S., and Gullberg U. (1993) Heritability of host plant resistance to herbi-vory changes with gallmidge density during an outbreak on willow. Evolution 47, 291–300.
Tahvanainen L. and Rytkonen V.-M. (1999) Biomass production of Salix viminalis in south-ern Finland and the effect of soil properties and climate conditions on its production and survival. Biomass Bioenergy 16, 103–117.
Tharakan P.J., Volk T.A., Abrahamson L.P., and White E.H. (2003) Energy feedstock charac-teristics of willow and hybrid poplar clones at harvest age. Biomass Bioenergy 25, 571–580.
Tharakan P.J., Volk T.A., Lindsey C.A., Abrahamson L.P., and White E.H. (2005) Evaluating the impact of three incentive programs on cofiring willow biomass with coal in New York State. Energy Policy 33, 337–347.
Toivonen R.M. and Tahvanainen L.J. (1998) Profitability of willow cultivation for energy production in Finland. Biomass Bioenergy 15, 27–37.
Triest L., De Greef B., De Bondt R., and Van Slycken J. (2000) RAPD of controlled crosses and clones from the field suggests that hybrids are rare in the Salix alba-Salix fragilis complex. Heredity 84, 555–563.
Tsarouhas V., Gullberg U., and Lagercrantz U. (2002) An AFLP and RFLP linkage map and quantitative trait locus (QTL) analysis of growth traits in Salix. Theor. Appl. Genet. 105, 277–288.
Serapiglia M.J., Cameron K.D., Stipanovic A.J., and Smart L.B. (2008) High-resolution thermogravimetric analysis for rapid characterization of biomass composition and selection of shrub willow varieties. Appl. Biochem. Biotechnol. 145, 3–11.
Trybush S., Jahodová S., Macalpine W., and Karp A. (2008) A genetic study of a Salix germplasm resource reveals new insights into relationships among subgenera, sections, and species. Bioenerg. Res. 1, 67–79.

376 Smart and Cameron Tsarouhas V., Gullberg U., and Lagercrantz U. (2004) Mapping of quantitative trait loci
(QTLs) affecting autumn freezing resistance and phenology in Salix. Theor. Appl. Genet. 108, 1335–1342.
Tuskan G.A., DiFazio S., Jansson S., Bohlmann J., Grigoriev I. et al. (2006) The Genome of Black Cottonwood, Populus trichocarpa (Torr. & Gray). Science 313, 1596–1604.
Vahala T., Stabel P., and Eriksson T. (1989) Genetic transformation of willows (Salix spp.) by Agrobacterium tumefaciens. Plant Cell Rep. 8, 55–58.
Verwijst T. (2001) Willows: An underestimated resource for environment and society. Forest. Chron., 77, 281–285.
Vinterback J. (2004) Pellets 2002: the first world conference on pellets. Biomass Bioenerg., 27, 513–520.
Volk T.A. (2002) Alternative Methods of Site Preparations and Coppice Management During the Establishment of Short-Rotation Woody Crops. Ph.D. dissertation, SUNY College of Environmental Science and Forestry, Syracuse, NY, 284pp.
Volk T.A., Abrahamson L.P., Nowak C.A., Smart L.B., Tharakan P.J., and White E.H. (2006) The development of short-rotation willow in the northeastern United States for bioenergy and bioproducts, agroforestry and phytoremediation. Biomass Bioenergy 30, 715–727.
Volk T.A., Ballard B., Robison D.J., and Abrahamson L.P. (2004a) Effect of cutting storage conditions during planting operations on the survival and biomass production of four wil-low (Salix L.) clones. New Forests 28, 63–78.
Volk T.A., Verwijst T., Tharakan P.J., Abrahamson L.P., and White E.H. (2004b) Growing fuel: A sustainability assessment of willow biomass crops. Front. Ecol. Environ. 2, 411–418.
Weih M., Rönnberg-Wästljung A.C., and Glynn, C. (2006) Genetic basis of phenotypic corre-lations among growth traits in hybrid willow (Salix dasyclados x S. viminalis) grown un-der two water regimes. New Phytol. 170, 467–477.
Wood C.B., Pritchard H.W., and Lindegaard, K. (2003) Seed cryopreservation and longevity of two Salix hybrids. Cryo Letters 24, 17–26.
Wright L. (2006) Worldwide commercial development of bioenergy with a focus on energy crop-based projects. Biomass Bioenergy 30, 706–714.
Xing Z. (1995) Genetic Transformation and Regeneration of Willows (Salix spp). Ph.D. Dis-sertation, State University of New York College of Environmental Science and Forestry, Syracuse, NY, 130pp.
Zapesochnaya G.G., Kurkin V.A., Braslavskii V.B., and Filatova, N.V. (2002) Phenolic com-pounds of Salix acutifolia bark. Chem. Nat. Comp. 38, 314–318.
Zsuffa L. (1988) A review of the progress in selecting and breeding North American Salix species for energy plantations at the Faculty of Forestry, University of Toronto, Canada. Proc. of International Energy Agency Willow Breeding Symposium, Uppsala, Sweden, Aug. 31-Sept. 1, 1987, Dept. of Forest Genetics, Swedish University of Agricultural Sci-ences, Uppsala, Sweden, Research Notes 41, 41–51.
Zsuffa L., Mosseler A., and Raj, Y. (1984) Prospects for interspecific hybridization in willow for biomass production. In: K. Perttu (Ed.), Ecology and Management of Forest Biomass Production Systems. Swedish University of Agricultural Sciences, Uppsala, Sweden, pp. 261–281.

14 Genetic Improvement of Poplar (Populus spp.) as a Bioenergy Crop
John M. Davis
School of Forest Resources & Conservation, University of Florida, Gainesville, FL USA, [email protected]
14.1 Introduction
Populus spp. trees occupy a prominent position in many terrestrial forest ecosystems as well as our human social structure. In the autumn, aspens decorate the landscape with golden leaves providing relief against black-and-white checkered stems, scenes that have inspired generations of nature photographers. Cities and villages with names like “Aspen” and “Cottonwood” in the western U.S. are testament to the his-toric importance of poplars to rural communities and their economies. The columnar shape of the “Lombardi poplar” is a distinctive feature in many European gardens. The fragrant resin of balsam poplar signals springtime for many Canadians. There is renewed interest in the bioenergy applications of poplar genetics re-search that will enable the generation of feedstock for conversion of wood into trans-portation fuels or other energy sources. Poplar is particularly attractive in light of the already existing processing infrastructure that was established for the conversion of wood into pulp and paper products. Poplars have been touted as a “model” for forest tree genetic and physiological research, and as a potential bioenergy crop, based in part on the long, collaborative history of research on poplars that have revealed its potential utility as a short-rotation woody crop (Stettler et al. 1996; Bradshaw et al. 2000). More specifically, the genus Populus has the following characteristics: (1) Tremendous genetic and phenotypic (trait) diversity exists within the genus, a mani-festation of the outcrossing nature and high genetic load that exists in many forest tree genera; (2) Sexual compatibility among many species, allowing generation of species hybrids with combinations of traits not present in naturally occurring trees; (3) Ease of clonal propagation, facilitating the sharing and immortalization of useful genetic materials for the global poplar research community, as well as commercial growers of the material for bioenergy applications; and (4) Extraordinary growth rates in greenhouse trials and in field sites occupied by well-adapted genotypes,
W. Vermerris (ed.), Genetic Improvement of Bioenergy Crops, DOI: 10.1007/978-0-387-70805 -8_14, © Springer Science+Business Media, LLC 2008

378 Davis
facilitating easy measurement of many growth-related physiological traits for genetic analysis. By utilizing the assemblage of characteristics described above, collections of genotypes grown in a common environment have been used to screen for and iden-tify particular genotypes (clones) that have desirable characteristics, which in turn are clonally propagated for installation of plantations on similar sites. The scaling-up of clones that are well-tested in genetic screening trials is a tried-and-true method of tree improvement (White et al. 2007) that has been applied to improvement of pop-lars for manufacture of diverse products including high quality papers (Stanton et al. 2002; Robison et al. 2006). The genetic diversity present within the genus Populus has not been fully screened for bioenergy-relevant traits, which is a major driver for continued genetic research to identify useful clones. The recent availability of the genome sequence of poplar (Populus trichocarpa Torr & Gray genotype Nisqually-1; Tuskan et al. 2006) opens new doors to unlock-ing the genetic potential of poplars for use as bioenergy crops. In addition to provid-ing specific genetic information to enable “smart” breeding and selection alterna-tives, the straightforward genetic manipulation of poplars using Agrobacterium-mediated transformation creates a key research tool for proving function of individ-ual genes by associating specific genes with specific traits altered in the transgenic trees. Using poplar as an experimental system therefore provides the opportunity for researchers to better understand fundamental mechanisms of wood development (including the development of the vascular cambium and secondary cell walls), sea-sonal dormancy and the impact of natural adaptive variation on tree phenotype (Jans-son and Douglas 2007) and simultaneously enhance the translation of those funda-mental research questions into applications in genetic improvement for bioenergy traits.
14.2 Botanical Description of Poplar (Populus)
The genus Populus is closely related to the genus Salix (Chapter 13); both genera are in the family Salicaceae, division Magnoliophyta, class Magnoliopsida, subclass Dilleniidae. The key botanical features of the genus from the perspective of genetic improvement of bioenergy crops are the broad species diversity and ranges of adap-tability within the genus, the propagation methods that enable genetic variation to be fixed in clonal plantations, and the sexual compatibility of many species within the genus. These characteristics combine to generate abundant genetic and phenotypic diversity that can be harnessed in bioenergy plantations.
14.2.1 Taxonomy of Populus
The genus Populus L. is comprised of >20 to <90 species, depending on the author-ity being considered. Species classification can be a real challenge in poplars, in part due to the wide geographic distribution of many poplar species – members of the same species growing in dramatically different environments can appear distinct due to the plasticity of tree phenotypes. This can lead to the inappropriate assignment of

Genetic Improvement of Populus for Bioenergy 379
new species status. Additionally, the range of some poplar species overlap, creating geographic zones in which interspecific hybridization can occur. Without definitive visible or molecular markers to sort out the hybrids from the pure species, such as-semblies of trees can appear to be distinct from the parental species (thus adding a species where it does not belong), or to represent intermediate forms within a single species (thus subtracting a species where it does actually belong). Furthermore, pop-lars have a long history of vegetative propagation, clone cultivation and sharing among human populations, which can generate confusion in nomenclature over time.
Fig. 14.1. Intra- and inter-specific hybridization in Populus (from Zsuffa 1975).
The most generally accepted classification of poplars (Eckenwalder 1996) recog-nizes 29 species that are placed into five widely recognized sections: Aigeiros, Leu-coides, Populus (also called Leuce; Zsuffa 1975), Tacamahaca and Turanga (Fig. 14.1). The salient features of these widely recognized sections are outlined below. • Aigeiros. This section contains eastern cottonwood (P. deltoides) and European
black poplar (P. nigra), both important species used in interspecific hybridiza-tions with one another and with compatible species in section Tacamahaca.
• Leucoides. This section contains large-leaved poplars such as swamp cottonwood (P. heterophylla) native to the central and eastern U.S.
• Populus. The aspens are in this section, including the important Eurasian species white poplar (P. alba) and European aspen (P. tremula), as well as the important

380 Davis North American species bigtooth aspen (P. grandidentata) and trembling aspen (P. tremuloides).
• Tacamahaca. The balsam poplars are in this section, including the reference species for the genome sequencing effort, black cottonwood (P. trichocarpa), Japanese poplar (P. suaveolens, or P. maximowiczii) and narrowleaf cottonwood (P. angustifolia). Many species in this section are compatible with species in Ai-geiros with the resulting hybrids showing dramatic hybrid vigor.
• Turanga. The most important species in this section is P. euphratica, a species with high tolerance for extreme heat and poor soil conditions.
Many poplar hybrids have been given “hybrid designations” that are not neces-sarily intuitive based on the parental species, for example the naturally occurring P. balsamifera × P. deltoides hybrids are designated P. ×jackii Sarg. (common name: Jackii poplar). These designations are historically rooted and the more recent con-vention has been to designate hybrid families according to the parental species in-volved [(species used as female) × (species used as male)] with the actual parental genotypes being coded numerically. Progeny are then assigned additional numeric designations within the family.
14.2.2 Propagation and Silviculture
Poplars have a broad distribution in the northern hemisphere where they are fre-quently planted. Poplars are deciduous trees, tend to occupy moist sites, are generally shade intolerant, grow quickly into medium- to large-sized trees and (at least com-pared to other forest tree species) have a medium to relatively short life span. Because of the broad range of many species of poplars – P. balsamifera (balsam poplar) and P. tremuloides (trembling aspen) have transcontinental ranges – stand management systems and expected growth rates vary greatly depending on stand latitude, elevation, soil type, rainfall patterns and of course the genotypes in the stand. Poplars tend to grow best on soils with medium texture and good moisture-holding capacity. General features and site preferences for individual species are presented in detail for P. balsamifera, P. deltoides, P. grandidentata, P. hetero-phylla, P. tremuloides, P. trichocarpa and selected interspecific hybrids in Burns and Honkala (1990).
Almost all poplar species are dioecious (i.e. male and female reproductive struc-tures are produced on separate trees), with trees usually reaching sexual maturity when they are between 5 and 15 years of age. The dioecious character dictates cross-pollination, since self-pollination is not possible. The flowers are borne in catkins that undergo pollination between February and May and disperse seed between April and June the same year. Fruits are called capsules that contain seeds surrounded by tufts of silky hairs. When capsules rupture, many thousands of “cottony” seeds are released and carried windborne for long distances. Individual trees can yield 8,000 to 54 × 106 seeds per year (Burns and Honkala 1990).
Reproductive primordia are produced within the two, three or four most terminal buds in the upper branches of mature trees. It would be difficult to conduct crosses in the field given the need to use lift equipment for bagging, pollination, etc., and so the typical strategy is to remove branches from mature trees during the late winter, then

Genetic Improvement of Populus for Bioenergy 381
place them in pots containing moist sand on greenhouse benches. The branches pro-duce roots from the base and catkins elongate from the tips shortly thereafter, allow-ing the breeder to conduct crosses in the greenhouse. This allows the crossing to be done systematically and efficiently – a company called GreenWood Resources con-ducts over 4,000 crosses per year in this fashion (for more information, see http://www.greenwoodresources.com/resources/hybridization-slide-show.pdf).
Under natural conditions, seeds germinate quickly in moist soil. The capacity to germinate, however, is lost within a few days. Thus, the high seed production in poplars and the broad dispersal of those seeds has presumably been favored by natu-ral selection to increase the likelihood that a small percentage of them will land in a non-shaded (given the shade intolerance of poplars), moist environment. Seed can be artificially stored to maintain longevity if seed is the preferred method of propaga-tion (Tauer 1979).
A second method of reproduction – vegetative – has also apparently been favored by natural selection in the genus Populus. Members of the Populus (Leuce) section root readily from root sections, reflecting their tendency to spread by root suckering under natural conditions. By contrast, members of the Aigeiros and Tacamahaca sections root best from stem cuttings, reflecting the natural ability of broken branches to form roots and establish new individual trees downstream in riparian communities. Presumably both of these vegetative propagation mechanisms enhance the occupancy of desirable sites by genotypes that are successfully competing for site resources, since it effectively increases the number of trees representing particular genotypes. As tree number increases for a particular genotype, there would be a corresponding increase in seed and branch production, effectively increasing the frequency of that individual’s alleles in the population. Since gender identity is re-tained in the vegetatively propagated trees, this localized increase in genetically identical trees does not lead to self-fertilization and subsequent inbreeding depres-sion of progeny. Vegetative propagation is the rule rather than the exception when propagating poplars. Stem cuttings or shoot tips can be taken from actively growing trees, in which case they are called “greenwood” cuttings and are usually rooted under mist. For the rooting of shoot tips, typically the base of the cutting is either dipped in a commercial rooting hormone or left untreated, prior to being placed in small pots containing a peat moss-based potting soil mixture. Intermittent mist keeps the cutting from desiccating during the 5–15 day rooting interval. Stem cuttings without leaves do not require mist since there is little transpirational water loss during rooting. The stem cuttings that are used to propagate poplars in plantations are usually obtained from juvenile shoots that have undergone vegetative bud dormancy. Maintaining juvenility is important for propagating poplars from dormant stem cuttings, since rooting efficiency decreases with the physiological age of the tree. Therefore, poplar genotypes targeted for production plantations are typically maintained in stoolbeds that are cut annually to maintain basal sprouting from the tree base. Stem cuttings are collected from dormant “whips,” which are the long shoots produced from the base of each pruned tree. The ideal time to collect dormant cuttings is after the material has met chilling requirements (i.e. late winter), but when soil temperatures have not yet increased sufficiently for buds to elongate. Dormant cuttings containing one to

382 Davis
six lateral buds are obtained by sawing or hand-pruning along the length of the whips. When planted in either a greenhouse (Fig. 14.2) or the field, the base of the cutting produces roots and one of the buds will quickly establish apical control to yield a single-stemmed tree.
Fig. 14.2. A diverse hybrid poplar population vegetatively propagated using hardwood stem cuttings. Photo courtesy of Dr. Qibin Yu. Inset: hybrid poplar shoot tip (greenwood) cutting rooted under mist. Photo courtesy of Chris Dervinis.
Poplars are highly intolerant of shade and tend to colonize disturbed areas – they are pioneer species in an ecological sense. Poplar plantations achieve highest rates of survival, establishment and growth on agricultural sites with complete weed control in which they are grown free of other more shade- or competition-tolerant species. Depending on management objectives, planting density of poplars can range widely from (1×1) – (2×2) m2 spacings (for chipped biomass) to (3×4) – (8×8) m2 spacings (for cordwood and logs) (Dickmann and Stuart 1983).
The extent of insect and disease problems is highly dependent on the tree geno-type. A compendium of pest problems that occur on poplars has been assembled by Ostry et al. (1989). Prominent among foliar diseases are leaf rusts incited by Me-lampsora medusae (endemic to North America) and M. larici-populina (endemic to Eurasia). The most significant defoliator of poplars is the cottonwood leaf beetle (Crysomela scripta). The most economically and ecologically cost-effective method of pest control in poplar plantations has been appropriate deployment of resistant

Genetic Improvement of Populus for Bioenergy 383
genotypes. This avoids the economically and ecologically costly alternative of spray-ing insecticides or fungicides, which must realistically be applied aerially in tree plantations after the second or third year of growth, since the height of the canopy and space between branches precludes the use of ground-based sprayers.
Harvesting methods are usually divided into two classes, one in which the stems are cut and chipped in one operation, and a second in which stems are cut and trans-ported off-site for separate chipping and/or drying operations. Harvesting machinery for bioenergy plantations is often designed to handle both poplars and willows given the similarity of their silvicultural characteristics. Therefore, the review of harvesting equipment presented in Chapter 13 is highly relevant and will not be repeated here.
14.2.3 Use of Poplar for Bioenergy
Woody biomass crops such as poplar provide a great deal of flexibility in terms of harvesting time during the year. This is largely the result of the fact that trees are perennial species with a long life span, which have evolved to withstand decay. Trees in general compare favorably to annual herbaceous species that must be har-vested within a defined window of time and then either processed immediately, or require storage with the accompanying risk of decay. In contrast, poplars are essen-tially stored in the field. Furthermore, poplar bioenergy plantations (Fig. 14.3) can have significant envi-ronmental advantages. For example, soil cultivation is only required twice for a 6–8-year rotation, which reduces soil erosion associated with a requirement for annual cultivation. In addition, many municipalities have established poplar plantations for the treatment of municipal sewage effluent and for the containment of the leachate derived from municipal landfills (Stanton et al. 2002). Poplars contain much lower levels of fermentation-inhibiting extractives compared to softwood feedstocks such as pine (Chapter 15), thus the conversion efficiency of the biomass is correspond-ingly higher. The opportunities for genetic manipulation in poplar using the large assortment of approaches highlighted in Section 14.3 is a consequence of poplar having been the model tree system for genetics and physiology for the past few dec-ades. Realistic yields of poplar range between 5 and 20 Mg of biomass ha–1 yr–1 or 10–30 m3 ha–1 yr–1. This wide range reflects variation based on genotype, site, region and silvicultural treatment. Karacic et al. (2003) reported poplar yields in Sweden. The biomass yield measured as the mean annual increment ranged from 3.3 Mg ha–1 yr–1 for balsam polar in the north to 9.2 Mg ha–1 yr–1 for the hybrid poplar clone “Boe-lare”. Studies on poplar production in the U.S. have reported yields of 7.7 Mg ha–1 yr–1 for cottonwood grown in flood plains on former agricultural land in Mississippi (Stanturf et al. 2003), an average of 11 Mg ha–1 yr–1 for the Southeastern U.S. (de la Torre Ugarte et al. 2003), and an average of 12.5 Mg ha–1 yr–1 for the Pacific North-west plantations (Stanton et al. 2002). These numbers reflect yields that are reliably obtained in large operational settings. It is important to realize that experimental plots tend to generate upwardly biased estimates (Dickmann 2006), because the plots are more actively managed than typical on a commercial scale. To illustrate the ef-fect of intensive management, a study by Pontailler et al. (1999) reported biomass
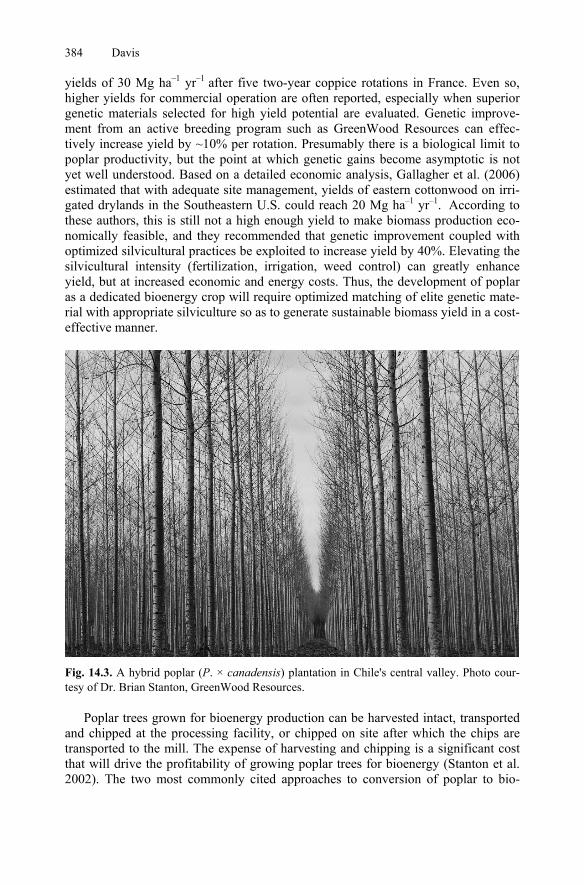
384 Davis
yields of 30 Mg ha–1 yr–1 after five two-year coppice rotations in France. Even so, higher yields for commercial operation are often reported, especially when superior genetic materials selected for high yield potential are evaluated. Genetic improve-ment from an active breeding program such as GreenWood Resources can effec-tively increase yield by ~10% per rotation. Presumably there is a biological limit to poplar productivity, but the point at which genetic gains become asymptotic is not yet well understood. Based on a detailed economic analysis, Gallagher et al. (2006) estimated that with adequate site management, yields of eastern cottonwood on irri-gated drylands in the Southeastern U.S. could reach 20 Mg ha–1 yr–1. According to these authors, this is still not a high enough yield to make biomass production eco-nomically feasible, and they recommended that genetic improvement coupled with optimized silvicultural practices be exploited to increase yield by 40%. Elevating the silvicultural intensity (fertilization, irrigation, weed control) can greatly enhance yield, but at increased economic and energy costs. Thus, the development of poplar as a dedicated bioenergy crop will require optimized matching of elite genetic mate-rial with appropriate silviculture so as to generate sustainable biomass yield in a cost-effective manner.
Fig. 14.3. A hybrid poplar (P. × canadensis) plantation in Chile's central valley. Photo cour-tesy of Dr. Brian Stanton, GreenWood Resources.
Poplar trees grown for bioenergy production can be harvested intact, transported and chipped at the processing facility, or chipped on site after which the chips are transported to the mill. The expense of harvesting and chipping is a significant cost that will drive the profitability of growing poplar trees for bioenergy (Stanton et al. 2002). The two most commonly cited approaches to conversion of poplar to bio-

Genetic Improvement of Populus for Bioenergy 385
energy are cellulosic conversion to ethanol (Chapter 6), and co-firing with coal in a co-generation process. Dickmann (2006) provided an interesting summary of the bioenergy situation when he wrote: “The operational breeding and silviculture that exists today, however, tends to lag behind the science that underpins it. This is a fact of life that will continue to exist until the demand for wood raw materials – espe-cially energy feedstocks – rises enough to allow the return on investments in SRWC (Short-Rotation Woody Crops) to be highly and reliably profitable. This is our cur-rent conundrum: we cannot employ the concept of SRWC to its fullest, because the resultant oversupply would cause the price of the raw material product to drop, ren-dering the enterprise unprofitable.” This statement highlights the importance of eco-nomic, political and social forces that are important drivers of the success of poplar for bioenergy, and that are largely independent of the science of using poplar for bioenergy.
14.3 Genetic Improvement
In order for traits to be improved genetically they must be heritable, i.e. controlled by genes. To determine if traits are heritable, traits are measured in genetic trials – sometimes called common garden experiments, since different genotypes are grown in the same environment – and genetic parameters are calculated for each trait or set of traits. Useful genetic parameters include broad-sense heritability, narrow-sense heritability (see Chapter 2), genetic correlation among traits, and the total levels of genetic and trait variation. The extent to which a trait is controlled by genes compared to the non-genetic (environmental) factors that influence traits is called heritability. Broad sense herita-bility is the proportion of total genetic variation that is due to all genetic effects, which is arguably the most appropriate heritability estimate to consider if the crop of interest will be deployed in plantation settings as rooted cuttings. Rooted cuttings are clones and capture all of the genetic effects intrinsic to the performance of the geno-type, including the additive effects of genes from the two parents, the dominance effects between the parental alleles and the epistatic interactions among loci that together condition the phenotype. Narrow sense heritability is the proportion of the additive genetic effects only, and is arguably the most appropriate heritability esti-mate to consider if the crop of interest will be deployed as seedlings. Since intra- and inter-specific hybridization is used to generate poplar seedlings in breeding pro-grams, and clonal propagation of selections is routine for deployment in plantations, both estimates of heritability are useful for different purposes. It is important to note that all heritability estimates are dependent on the specific tests in which they were calculated. For example, a carefully installed test on a uniform site would generate higher heritability estimates than a poorly installed test on a highly variable site, given the same genetic materials being tested in both cases. The environmental “noise” would be higher in the latter site, which would reduce the genetic “signal” of the trait. Therefore, heritability estimates from a number of different trials in which relevant genetic materials have been tested are typically used to guide breeding and selection efforts. Traits that are under exclusively environmental control with no

386 Davis
evidence of genetic variation would be best controlled by silvicultural practices, since breeding and selection are unlikely to drive trait values in a useful direction. Genetic correlations measure whether values for different traits tend to vary to-gether (positive correlation), in an opposite fashion (negative correlation) or are not related to one another (no correlation). Breeders use genetic correlations in practical ways. One can determine if selecting for one trait will provide gains in a second trait – this is useful information given that some traits are more difficult to measure than others. Given two positively correlated traits, you might choose to measure the easi-est trait only. From a molecular genetic perspective, positive genetic correlations suggest both traits are controlled by similar genes, whereas zero correlation indicates that the traits are controlled by different sets of genes. Negative correlations between desirable traits can be due to several causes, but essentially improving both traits boils down to more work for the breeder, either by screening more progeny, choos-ing different parents or using transgenic approaches. The total levels of genetic and trait variation in tests provide the range of values that can reasonably be attained through selection with that genetic material. Incorpo-ration of new genetic material by using different parents or species can increase variation if necessary.
14.3.1 Genetic Parameters for Bioenergy Traits
In recent years, several papers have been published that illustrate genetic variation in growth traits, and in wood quality characteristics in poplars. Growth traits affect the quantity of biomass, whereas wood quality traits can dictate the efficiency of bio-mass conversion to bioenergy.
Some recent studies highlight the power of using interspecific hybridization to generate and quantify heritable phenotypic variation in growth traits. Wullschleger et al. (2005) evaluated the relationships between total biomass and the distribution of biomass among various aboveground and belowground organ categories. Correla-tions among stem, branch, leaf, cutting, coarse and fine roots were all positive and significant, with the weakest correlations between the biomass of fine roots and that of other organs. This was true for both an F2 population (family 331) as well as a pseudo-backcross population (family 13). Similarly, plant height, stem circumfer-ence, stem volume and total aboveground biomass were all heritable, and were posi-tively and significantly correlated in family 331 grown on three field sites in Europe (Rae et al. 2008). This study also confirmed the heritability and positive genetic correlation between sylleptic branching and biomass accumulation. Sylleptic branches are produced by elongation of lateral buds from the current year’s shoots, creating a crown with numerous small lateral branches that generates far greater photosynthetic capacity than is present in shoots without sylleptic branches (Cooke et al. 2005). Sylleptic branching is common among species in section Tacamahaca and the syllepsis phenotype often segregates in hybrid families. These observations further illustrate the tremendous opportunities to genetically tailor poplar crown architecture to specific end uses through breeding and selection. Depending on the product class and spacing desired, genotypes can be selected and clonally propagated with assurance that the genetic characteristics are captured.

Genetic Improvement of Populus for Bioenergy 387
Lignin content is under moderate-to-strong genetic control, as indicated by the relatively high broad-sense heritability estimate of 0.9 with a range of 19.8% to 24.8% in four-year old P. deltoides grown at close spacing (2.5 × 2.5 m2; Klasnja et al. 2003). Alkali-extractable lignin content varied between 9.8% and 19.7% among 18 randomly selected clones from seven interspecific P. tremula × P. tremuloides families grown on two sites (Yu et al. 2001). Across-site genetic correlations for lignin content were also moderately high (0.78 ± 0.02), indicating relatively stable rankings of clones grown at two locations. Similarly, both narrow- and broad-sense heritability estimates for lignin content were > 0.5 in Eucalyptus globulus (Poke et al. 2006), suggesting that selecting for either high or low lignin content would be attainable in poplar as well as other deciduous forest tree genera. Abundance of lignin precursors and their soluble metabolic derivatives in inter-specific hybrid poplar is also under genetic control, with over half of the phenotypic variation explained by genetic factors (Morreel et al. 2006). Furthermore this study illustrated how allelic forms of genes inherited from the different parental species could be implicated in regulating levels of single compounds or sets of compounds. The content of flavonoids and other extractives varied significantly among tested P. tremuloides clones (Fernandez et al. 2002). These compounds are of importance because they can interfere with pulping as well as with the bioconversion to ethanol due to their inhibitory effects on the fermenting microorganisms and their hydropho-bic nature that results in gumming. While the range (1.2–3.4%) was modest in the young trees sampled, the heritability of extractive content indicated no effect of the environment in the P. deltoides samples (Klasnja et al. 2003). These and other stud-ies (reviewed by Dinus et al. (2001)) illustrate the potential for selecting clones from native species with reduced lignin and extractive content (for bioconversion to etha-nol) or elevated lignin (for combustion or gasification scenarios). These studies also indicated that it is feasible to generate interspecific hybrids optimized for bioenergy applications. The genetic variation in cellulose content has not been extensively evaluated in poplars. In another hardwood genus, Eucalpytus, however, cellulose content was shown to be under moderate genetic control, similarly to lignin content. In studies of Eucalyptus globulus, cellulose content among forty clones used as a calibration set for near-infrared (NIR) spectroscopy (Chapter 5) varied from 36.9 to 46.9%, and the heritability estimates for predicted cellulose contents at three field sites ranged from 0.32 to 0.57 (Raymond and Schimleck 2002). In Eucalyptus nitens, cellulose content among open-pollinated progeny from 40 parents selected from native forests ranged from 36.8 to 45.4% and narrow-sense heritability was 0.61 (Schimleck et al. 2004). Given the genetic variability for lignin content in poplar, and the similar genetic control of lignin and cellulose content in Eucalyptus, it is likely that there is also considerable genetic variation for cellulose in poplar.
Genetic correlations between wood quality and growth traits can be used to infer either positive, negative or no effect on growth when selecting for wood quality. These types of studies yield mixed results, with some reporting positive correlations, some negative, and some no correlation (Dinus et al. 2001). A recent study showed no significant correlation between growth (height and diameter) and wood density in 21 interspecific hybrid poplar clones grown at two locations (Zhang et al. 2003).

388 Davis
Eleven clones were within the Aigeiros section, six were crosses among Aigeiros and Tacamahaca, and one was an interspecific cross within Tacamahaca. The lack of genetic correlation implies that directional selection to either elevate or reduce wood density would have little effect on growth. More extensive field testing of diverse materials will be required to clarify genetic relationships among wood quality traits, and between wood quality traits and growth traits. The relatively high cost of meas-uring wood quality traits may be a factor that has limited their genetic dissection in the past. Hopefully the application of less expensive alternatives such as NIR spec-troscopy will promote a better understanding of the genetic architecture of bioenergy traits. The absence of clear, consistent positive or negative correlation trends in the literature would suggest that most wood quality traits are not strongly correlated with growth, which, if true, would imply that one could make good progress in selecting for high or low levels of particular wood component while not sacrificing growth. The improvement of a series of multiple traits in a tree breeding program should take into account the economic value of the traits, and this by definition must include processing costs (Via et al. 2004). Thus, the use of well-tested genetic materials on appropriate sites will always be important in developing plantations for bioenergy applications, but the establishment of dedicated bioenergy plantations of poplar will require that genotypes be paired with optimized conversion pipelines to maximize product yield and profit.
14.3.2 Whole-Genome Sequence: The “Parts List” for Genetic Improvement
The publication of the draft sequence of Populus (Tuskan et al. 2006) based on the genotype Nisqually-1 creates a new resource for bioenergy applications in that it contains all the genes to build a tree. Breaking the code requires more work than simply obtaining the DNA sequence itself – the process of decoding the genome sequence is called annotation (Stein 2001). Annotation has begun for genes involved in constructing poplar cell walls. In many cases the genes likely to be involved in conditioning particular bioenergy traits have already been identified in poplar or in annual crop plants based on previous studies. For example, the phenylpropanoid and monolignol biosynthetic pathways (Chapter 4) that control lignin composition and lignin quantity have been a subject of biochemical studies for many years. In these cases, the challenge in poplar is to identify the various alleles that control trait varia-tion within the species or interspecific pedigree of interest, since each gene may have many alleles within each species (Ingvarsson 2005; Gilchrist et al. 2006). Haplotype diversity within the reference genotype Nisqually-1 was 2.6 point mutations or small indels per 1,000 bases (Tuskan et al. 2006), reflecting the level of heterozygosity within the reference genotype whose genome was sequenced. The lignin biosynthetic pathway is comprised of about twice as many genes in poplar compared to Arabi-dopsis (Tuskan et al. 2006). Similarly, there are almost twice as many cellulose syn-thase genes in poplar (18) compared to the ten CesA genes in Arabidopsis (Djerbi et al. 2005; Chapter 4). Genes that condition plant responses to the hormones auxin and cytokinin, known to have dramatic effects on tree growth, development and architecture, have also

Genetic Improvement of Populus for Bioenergy 389
been annotated (Kalluri et al. 2007; Ramirez-Carvajal et al. 2008). In other cases, the genes involved in conditioning the traits of a particular poplar species are not known. A large-scale gene expression study performed on P. euphratica, which is highly drought and salt tolerant, identified 98% of its genes were shared by P. trichocarpa (the Nisqually-1 reference genome sequence). The authors suggested that it may be differential regulation of shared genes, as opposed to the evolution of brand-new suites of genes, that permits adaptation to extreme conditions in P. euphratica (Bro-sche et al. 2005). The challenge ahead is to determine the relationships between allelic variation and trait variation, so that the alleles conditioning traits of interest can be identified. Once important alleles have been identified, they can be tracked within breeding and selection programs using marker-assisted selection (Chapter 2). This promises to make breeding and selection more efficient, since parents and offspring with unde-sirable alleles (e.g. for growth) can be discarded prior to assessing traits in expensive field trials. In the bioenergy context, breeding lines of genotypes with extreme dif-ferences in biomass composition and crown architecture could be maintained sepa-rately to target various downstream conversion options. The overall goal is to iden-tify individuals with the greatest combination of desired alleles for clonal propagation and deployment.
14.3.3 Trait Mapping in Pedigrees and Populations
Genes that control variation in bioenergy traits can be charted in the genome using well-established genetic mapping procedures. Most bioenergy-related traits are quan-titative, meaning that they are typically either oligogenic (few to several loci regulate variation in the trait) or polygenic (many loci are involved) with a measurable effect of the environment on trait expression. Quantitative trait loci (QTL; Chapter 2) asso-ciated with variation in these traits can be identified using QTL mapping. When QTL are identified in a well-designed study, it reinforces that the trait is heritable, and simultaneously identifies a genomic region that contains the gene(s) involved.
QTL for stem height, stem circumference, stem volume, number of sylleptic branches and total aboveground biomass were recently identified (Rae et al. 2008) and these data complement earlier studies that identified QTL for aboveground, belowground, leaf, stem and coarse root biomass, as well as the proportion of bio-mass allocated aboveground to leaves and to stems, and allocated belowground, and belowground specifically to coarse roots, and into fine roots (Wullschleger et al. 2005). Interestingly, evidence was obtained for distinct locations of QTL for total biomass accumulation and QTL for the ratios of specific organ types relative to total biomass accumulation (Wullschleger et al. 2005). The proportions of plant organs relative to the overall biomass of the plant body are typically considered constant. Therefore, if the results reported by Wullschleger et al. (2005) are verified and con-firmed, the implication is that it would be possible to breed poplars for altered distri-bution of biomass to specific organs. This offers interesting opportunities for breed-ing efforts aimed at enhancing poplar for bioenergy applications.
Given the availability of the complete genome sequence for poplar, QTL can be converted into intervals of DNA sequence, within which candidate genes can be

390 Davis
identified. On its surface, this would seem to allow the immediate identification of genes that underlie QTL. However, in a typical mapping experiment in which ~100 DNA markers are applied to a family of ~100–300 individuals, the intervals of ge-nomic DNA that contain QTL are fairly large, typically containing around 100 or 200 genes. Identifying the specific gene whose alleles cause the variation in the trait would be very useful from a basic research perspective (to understand the mecha-nisms that control bioenergy traits) as well as an applied perspective (to track the alleles in the entire breeding population). There are several approaches to this diffi-cult problem of identifying the genes that actually underlie QTL and control trait variation. Genetic fine mapping involves the expansion of the mapping population to >1000 segregating progeny coupled with saturation of the locus with DNA markers, the logic being that increasing the number of meioses and markers will allow a tiny interval containing one or two genes to be identified. This approach was first launched in poplar to fine-map a Melampsora rust resistance locus in the pedigree within which it segregated as a Mendelian factor (Stirling et al. 2001). Fine mapping is laborious given the magnitude of the phenotyping effort for most bioenergy traits, and the requirement to generate and maintain large segregating populations of trees. Given the significant effort that would be required to clone each of several different QTL based on their positions in the genetic map, there are relatively few examples of fine mapping in poplar in the literature. Association or linkage disequilibrium map-ping takes advantage of historical, unrecorded recombination within a species, and may present a viable approach to identifying causative QTL in poplars (Neale and Savolainen 2004). On average, linkage disequilibrium decays within the span of a few hundred nucleotides in poplar, vastly shrinking (compared to QTL mapping) the interval of DNA that would be implicated if a genotype: phenotype association is found (Ingvarsson 2005). This approach is theoretically more efficient than fine mapping within a pedigree, since the complete phenotypic and genetic diversity of a poplar species can be captured and fine mapped in an association population of ~500 genotypes (Long and Langley 1999). Examples of association mapping in poplar are beginning to appear in the literature (Ingvarsson et al. 2006). Finally, transgenic poplar trees that harbor the equivalent of severe alleles (i.e. either strongly overpro-ducing or underproducing that gene’s messenger RNA) can provide important in-sights into molecular control mechanisms that may operate in natural or breeding populations of poplar. If a phenotypic effect on the bioenergy trait of interest is ob-served after transgenic alteration, it is considered strong evidence for that gene’s role in controlling the bioenergy trait. Transgenic manipulation is feasible in poplar and has become a core genetic technology for proving gene function in plant model sys-tems such as Arabidopsis. Used in conjunction with naturally occurring genetic vari-ants, transgenic manipulation can clarify the underlying causes of phenotypic varia-tion (Bohlenius et al. 2006).
14.3.4 Transgenic Alteration of Gene Expression
Transgenic manipulation of gene expression in poplar relies on Agrobacterium-mediated delivery of DNA into the poplar genome (see also Chapter 2). Most ex-periments reported in the literature use transgenic manipulation of poplar for reverse

Genetic Improvement of Populus for Bioenergy 391
genetic analysis. In reverse genetic analysis, the experiment is intended to test the phenotype that is generated when a specific gene sequence is altered in its expres-sion. The logic of reverse genetic analysis is that there are already many candidate genes implicated in controlling bioenergy traits, and these can be directly tested by mis-expressing them in transgenic poplar. The experiment boils down to a compari-son of transgenic and non-transgenic lines. Candidate genes have been identified in several ways. Genetic analysis in other plant systems such as Arabidopsis creates a list of candidate genes in poplar, since one would expect that many genes involved in cell wall development might be conserved in structure and function in Arabidopsis and poplar. Biochemical characterization of genes and enzymes in several important pathways, including those leading to biosynthesis of lignin, cellulose and starch, have been carried out historically in non-tree systems but are likely to have important aspects that are conserved in poplar, since it seems unlikely that entirely independent genetic mechanisms would evolve anew in individual plant lineages. Perusal of the poplar genome sequence allows the poplar versions of these genes to be identified and transgenically manipulated. Microarray experiments (Chapter 2) also generate lists of candidate genes based on the presence of messenger RNA in specific cell types at specific times in which that gene’s expression can be correlated with a known developmental process that is occurring simultaneously (Hertzberg et al. 2001). Several aspects of transgenic manipulation are appealing, including the ability to reduce as well as increase transcript abundance by comparing multiple transgenic lines generated using the same genetic construct (Strauss et al. 2004). Transgenic analysis in poplar requires ~1 year from vector construction to phenotypic analysis, and so the number of candidate genes that can be tested in a given period of time is limited mostly by labor (to carry out the transformation steps in tissue culture, and to carry out phenotypic analysis of specific transgenic lines and non-transgenic con-trols) and space requirements (to grow the transgenic and non-transgenic lines in the greenhouse). Comprehensive reviews of the literature on transgenic manipulation of wood composition in poplars are available (Boerjan et al. 2003; Li et al. 2006) and only selected work will be highlighted here. Transgenic manipulation of poplar growth was accomplished by enhancing bio-synthesis of the phytohormone gibberellin through overexpression of the gene en-coding GA 20-oxidase (Eriksson et al. 2000), indicating a potential role for trans-genic approaches to elevate poplar biomass accumulation and improve fiber properties by altering growth regulator biosynthesis. Increased growth mediated by enhanced nitrogen utilization may be the mechanism by which overexpression of a pine glutamine synthase gene increased growth in transgenic poplar trees (Jing et al. 2004). Although not necessarily predicted, enhanced growth was also observed un-der greenhouse conditions when lignin production was down-regulated by transgenic reduction of transcript encoding 4-coumarate: CoA ligase (4CL: Hu et al. 1999). Lignin was reduced dramatically relative to cellulose, with the most severe lines possessing about half of the lignin content of non-transgenic controls. This decrease is beyond that observed in interspecific hybrid pedigrees, and would be expected to increase the conversion efficiency of the biomass to ethanol. Transgenic manipula-tion is not limited to single genetic steps, but rather the feasibility of pathway engi-

392 Davis
neering was demonstrated in poplar by Li et al. (2003). These researchers introduced constructs that reduced 4CL transcript and enhanced production of coniferaldehyde 5-hydroxylase transcript, then identified specific lines expressing single transgenes or pairwise combination of the transgenes. The latter lines produced about half of the lignin of non-transgenic controls, and most importantly demonstrated a significant increase (64%) in the ratio of syringyl (more easily extractable) to guaiacyl (less easily extractable) ratios of the lignin subunits. A recent, very comprehensive study in which the gene encoding cinnamoyl CoA reductase (CCR) was reduced using a transgenic approach, showed dramatic reductions in lignin (to about half of non-transgenic levels), significantly improved pulping efficiency, but detectable and significant decreases in growth in the field (Leple et al. 2007). These studies show that direct reverse genetic manipulation of lignin biosynthesis is feasible in poplar by introducing constructs that encode enzymes in the monolignol biosynthetic pathway. Enhancement of biomass traits can also occur unexpectedly, which may not be surprising given our relatively limited understanding of how cell walls are assembled in plants. For example, elevated cellulose content was incited by overexpression of a xyloglucanase gene (Park et al. 2004). The mechanism by which cellulose increased is not clear, but could be due in part to the altered architecture of the cell wall envi-ronment that promoted altered deposition of cellulose.
A completely different transgenic approach called activation tagging was used to create a population of poplar lines for forward genetic analysis. In forward genetic analysis, it is the phenotype that drives the entire experiment. Forward genetic analy-sis does not presume that any particular gene causes the phenotype, and so the power of this approach is that it is not biased by the scientist’s choice of the transgene. Similar in concept to the forward genetic analysis of a QTL mapping experiment, activation tagging can reveal new, unexpected and/or previously unknown genes that play important roles in bioenergy traits. Activation tags are transcriptional enhancers that insert randomly in the genome, and their tendency to create dominant gain-of-function alleles is key in poplar, since tagged lines cannot be self-pollinated to reveal phenotypes for recessive alleles. A population of activation tagged poplar lines was created and screened for a dramatic dwarf growth phenotype in the greenhouse and in field plantings (Busov et al. 2003). The location of the tag in the genome adjacent to a gene encoding gibberellin 2-oxidase (GA 2-oxidase) was obtained using a me-thod called plasmid rescue, but with the genome sequence now available can be inferred by obtaining sequence adjacent to the tag and comparing it to the whole-genome assembly. The dwarf phenotype was recapitulated by overexpressing GA 2-oxidase in transgenic poplar, thereby establishing the genetic basis of the dwarf phe-notype. Further screening of populations designed for forward genetic analysis is warranted to enable discovery of novel genetic mechanisms conditioning bioenergy trait variation in poplar. Transgenic trees cannot be grown in field trials without specific governmental permits, so the direct value of transgenic poplar for bioenergy traits is not well un-derstood relative to interspecific hybrid families produced by traditional breeding. However, the limited experience with transgenic manipulation for lignin reduction has been encouraging with respect to significantly reduced energy cost for pulping (Pilate et al. 2002; Leple et al. 2007) and no measurable ecological effects on inter-
Genetic Improvement of Populus for Bioenergy 393
actions with insect pests or associated soil microbial communities (Pilate et al. 2002; Halpin et al. 2007). Transgenic manipulation is usually performed in a single poplar genotype that regenerates efficiently in the tissue culture protocols used for trans-genic plant production. Since that single poplar genotype may not be well adapted to the climatic and soil type conditions that are targeted for a bioenergy plantation, more comprehensive field testing of transgenes in diverse genetic backgrounds will be required to assess the usefulness of transgenic technology for bioenergy applica-tions. Notwithstanding the limited inferences we can make regarding the potential application of transgenic technology, it is abundantly clear that a transgenic approach is a scientifically powerful way to test and ultimately prove a causative relationship between gene structure and gene function.
14.4 Conclusions
Members of the genus Populus harbor abundant genetic variation for use in genetic improvement programs directed at bioenergy traits. The natural history features of poplar lend themselves to genetic improvement, with interspecific and intersectional hybridization enabling segregation of alleles previously fixed in the parental species, high fecundity allowing large families to be produced, clonal propagation by rooted cuttings permitting the capture of all genetic variation in a single step, and straight-forward production of transgenic trees for testing gene function. Phenotypic screen-ing of populations, pedigrees and species collections is certainly warranted to pro-mote discovery of new genes, pathways and mechanisms that control bioenergy traits. Transgenic manipulation is important to test function of genes, but also to understand and quantify the range of phenotypic variation that can be incited by genetic manipulation. The ability to rapidly test and deploy genotypes within a base of diverse, superior germplasm collection is quite powerful because it enables the pairing of specific traits with specific conversion technologies. Therefore, studies in which there is meaningful coupling of germplasm with specific conversion technolo-gies are required to capture the value of genetic improvement for bioenergy traits.
Acknowledgments
Work in my lab is supported by the Department of Energy, Office of Science, Office of Biological and Environmental Research (Grant No. DE-05-00OR22725).
References
Boerjan, W., Ralph, J. and Baucher, M. (2003) Lignin biosynthesis. Ann. Rev. Plant Biol. 54, 519–546.
Bohlenius, H., Huang, T., Charbonnel-Campaa, L., Brunner, A.M., Jansson, S., Strauss, S.H. and Nilsson, O. (2006) CO/FT regulatory module controls timing of flowering and sea-sonal growth cessation in trees. Science 312, 1040–1043.
Bradshaw, H.D., Jr., Ceulemans, R., Davis, J. and Stettler, R. (2000) Emerging model systems in plant biology: poplar (Populus) as a model forest tree. J. Plant Growth Regul. 19, 306–313.

394 Davis
Brosche, M., Vinocur, B., Alatalo, E.R., Lamminmaki, A., Teichmann, T. et al. (2005) Gene expression and metabolite profiling of Populus euphratica growing in the Negev desert. Genome Biol. 6, R101.
Burns, R.M. and Honkala, B.H. (1990) Silvics of North America: 1. Conifers 2. Hardwoods. Agriculture Handbook 654, USDA Forest Service, Washington, D.C., 877pp.
Busov, V.B., Meilan, R., Pearce D.W., Ma, C., Rood, S.B. and Strauss, S.H. (2003) Activation tagging of a dominant givverellin catabolism gene (GA 2-oxidase) from poplar that regu-lates tree stature. Plant Physiol. 132, 1283–1291.
Cooke, J.E.K., Martin, T.A. and Davis, J.M. (2005) Short-term physiological and developmen-tal responses to nitrogen availability in hybrid poplar. New Phytol. 167, 41–52.
de la Torre Ugarte, D.G., Walsh, M.E., Shapouri, H. and Slinsky, S.P. (2003). The economic impacts of bioenergy crop production on U.S. agriculture. February 2003. USDA Agricul-tural Economic Report No. 816.
Dickmann, D.I. and Stuart, K.W. (1983) The culture of poplars in eastern North America. University Publications, Michigan State University, 168pp.
Dickmann, D.I. (2006) Silviculture and biology of short-rotation woody crops in temperate regions: then and now. Biomass Bioenergy 30, 696–705.
Dinus, R.J., Payne, P., Sewell, M.M., Chiang, V.L. and Tuskan, G.A. (2001) Genetic modifi-cation of short rotation poplar wood: properties for ethanol fuel and fiber production. Crit. Rev. Plant Sci. 20, 51–69.
Djerbi, S., Lindskog, M., Arvestad, L., Sterky, F. and Teeri, T.T. (2005) The genome sequence of black cottonwood (Populus trichocarpa) reveals 18 conserved cellulose synthase (CesA) genes. Planta 221, 739–746.
Eckenwalder, J.E. (1996) Systematics and evolution of Populus. In: Stettler, R.F., Bradshaw, H.D. Jr., Heilman, P.E. and Hinckley, T.M. (Eds.), Biology of Populus and its implica-tions for management and conservation. NRC Research Press, Ottawa, Canada, pp. 7–32.
Eriksson, M.E., Israelsson, M., Olsson, O. and Moritz, T. (2000) Increased gibberellin biosyn-thesis in transgenic trees promotes growth, biomass production and xylem fiber length. Nat. Biotechnol. 18, 784–788.
Fernandez, M.P., Breuil, C. and Watson, P.A. (2002) Natural clonal variation of wood extrac-tives in Populus tremuloides. Can. J. For. Res. 32, 1192–1199.
Gilchrist, E.J., Haughn, G.W., Ying, C.C., Otto, S.P., Zhuang, J. et al. (2006) Use of ecotilling as an efficient SNP discovery tool to survey genetic variation in wild populations of Popu-lus trichocarpa. Mol. Ecol. 15, 1367–1378.
Halpin, C., Thain, S.C., Tilston, E.L., Guiney, E., Lapierre, C. amd Hopkins, D.W. (2007). Ecological impacts of trees with modified lignin. Tree Genetics Genomes 3, 101–110.
Hertzberg, M., Aspeborg, H., Schrader, J., Andersson, A., Erlandsson, R. et al. (2001) A transcriptional roadmap to wood formation. Proc. Natl. Acad. Sci. USA 98, 14732–14337.
Hu, W.-J., Harding, S.A., Lung, J., Popko, J.L., Ralph, J. et al. (1999) Repression of lignin biosynthesis promotes cellulose accumulation and growth in transgenic trees. Nat. Bio-technol. 17, 808–812.
Ingvarsson, P.K (2005) Nucleotide polymorphism and linkage disequilibrium within and among natural populations of European aspen (Populus tremula L., Salicaceae. Genetics 169, 945–953.
Ingvarsson, P.K., Garcia, M.V., Hall, D., Luquez, V. and Jansson, S. (2006). Clinal variation in phyB2, a candidate gene for daylength-induced growth cessation and bud set, across a latitudinal gradient in European aspen (Populus tremula). Genetics 172, 1845–1853.
Jansson, S. and Douglas, C.J. (2007) Populus: a model system for plant biology. Ann. Rev. Plant Biol. 58, 435–458.
Gallagher, T., Shaffer, B., and Rummer, B. (2006) An economic analysis of hardwood fiber production on dryland irrigated sites in the US Southeast. Biomass Bioenergy 30, 794–802.

Genetic Improvement of Populus for Bioenergy 395
Jing, Z.P., Gallardo, F., Pascual, M.B., Sampalo, R., Romero, J. et al. (2004) Improved growth in a field trial of transgenic hybrid poplar expressing glutamine synthetase. New Phytol. 164, 137–145.
Kalluri, U.C., DiFazio, S.P., Brunner, A.M. and Tuskan, G.A. (2007) Genome-wide analysis of Aux/IAA and ARF gene families in Populus trichocarpa. BMC Plant Biology 7, 59.
Klasnja, B., Kopitovic, S. and Orlovic, S. (2003) Variability of some wood properties of east-ern cottonwood (Populus deltoides Bartr.) clones. Wood Sci. Technol. 37, 331–337.
Leple, J.-C., Dauwe, R., Morreel, K., Storme, V., Lapierre, C. et al. (2007) Downregulation of cinnamoyl-coenzyme A reductase in poplar: multiple-level phenotyping reveals effects on cell wall polymer metabolism and structure. Plant Cell 19, 3669–3691.
Li, L.G., Lu, S.F. and Chiang, V. (2006) A genomic and molecular view of wood formation. Crit. Rev. Plant Sci. 25, 215–233.
Long, A.D. and Langley, C.H. (1999) The power of association studies to detect the contribu-tion of candidate gene loci to variation in complex traits. Genome Res. 9, 720–731.
Morreel, K., Geominne, G., Storme, V., Sterck, L., Ralph, J., Coppieters, W., Breyne, P., Steenackers, M., Georges, M., Messens, E. and Boerjan, W. (2006) Genetical metabolom-ics of flavonoid biosynthesis in Populus: a case study. Plant J. 47, 224–237.
Neale, D.B. and Savolainen, O. (2004) Association genetics of complex traits in conifers. Trends Plant Sci. 9, 325–330.
Ostry, M.E., Wilson, L.F., McNabb, H.S. Jr. and Moore, L.M. (1989) A guide to insect, dis-ease and animal pests of poplars. Agriculture Handbook 677, USDA Forest Service, 118pp.
Park, Y.W., Baba, K., Furuta, Y., Iida, I., Sameshima, K. et al. (2004). Enhancement of growth and cellulose accumulation by overexpression of xyloglucanase in poplar. FEBS Lett. 564, 183–187.
Pilate, G., Guiney, E., Holt, K., Petit-Conil, M., Lapierre, C. et al. (2002) Field and pulping performances of transgenic trees with altered lignification. Nat. Biotechnol. 20, 607–612.
Poke, F.S., Potts, B.M., Vaillancourt, R.E. and Raymond, C.A. (2006) Genetic parameters for lignin, extractives and decay in Eucalyptus globulus. Ann. For. Sci. 63, 813–821.
Pontailler, J.Y., Ceulemans, R. and Guittet, J. (1999) Biomass yield of poplar after five 2-year coppice rotations. Forestry 72, 157–163.
Rae, A.M., Pinel, M.P.C., Bastien, C., Sabatti, M., Street, N.R., Tucker, J., Dixon, C., Marron, N., Dillen, S.Y. and Taylor, G. (2008) QTL for yield in bioenergy Populus: identifying GxE interactions from growth at three contrasting sites. Tree Genet. Genomes 4, 97–112.
Ramirez-Carvajal, G.A., Morse, A.M. and Davis, J.M. (2008) Transcript profiles of the cyto-kinin response regulator gene family in Populus imply diverse roles in plant development. New Phytol. 177, 77–89.
Raymond, C.A. and Schimleck, L.R. (2002) Development of near infrared reflectance analysis calibrations for estimating genetic parameters for cellulose content in Eucalyptus globulus. Can. J. For. Res. 32, 170–176.
Robison, T.L., Rousseau, R.J. and Zhang, J. (2006) Biomass productivity improvement for eastern cottonwood. Biomass Bioenergy 30, 735–739.
Schimleck, L.R., Kube, P.D. and Raymond, C.A. (2004) Genetic improvement of kraft pulp yield in Eucalyptus nitens using cellulose content determined by near infrared spectros-copy. Can. J. For. Res. 34, 2363–2370.
Karacic, A., Verwijst, T., and Weih, M. (2003) Above-ground woody biomass production of short-rotation Populus plantations on agricultural land in Sweden. Scand. J. For. Res. 18, 427–437.
Li, L., Zhou, Y., Cheng, X., Sun, J., Marita, J.M., Ralph, J., and Chiang, V.L. (2003) Combi-natorial modification of multiple lignin traits in trees through multigene cotransformation. Proc. Natl. Acad. Sci. U.S.A. 100, 4939–4944.

396 Davis
Stein, L. (2001) Genome annotation: from sequence to biology. Nat. Rev. Genetics 2, 493–
503. Stettler, R.F., Bradshaw, H.D. Jr., Heilman, P.E. and Hinckley, T.M. (1996) Biology of Popu-
lus and its implications for management and conservation. NRC Research Press, Ottawa, Canada, 542pp.
Stirling, B., Newcombe, G., Vrebalov, J., Bosdet, I. and Bradshaw, H.D. Jr. (2001) Supressed recombinationaround the MXC3 locus, a major gene for resistance to poplar leaf rust. Theor. Appl. Genet. 103, 1129–1137.
Strauss, S.H., Brunner, A.M., Busov, V.B., Ma, C. and Meilan, R. (2004) Ten lessons from 15 years of transgenic research. Forestry 77, 455–465.
Tauer, C.G. (1979) Seed tree, vacuum and temperature effects on easter cottonwood seed viability during extended storage. For. Sci. 25, 112–114.
Tuskan, G.A., DiFazio, S., Jansson, S., Bohlmann, J., Grigoriev, I. et al. (2006) The genome of black cottonwood, Populus trichocarpa (Torr. & Gray). Science 313, 1596–1604.
Via, B.K., Stine, M., Shupe, T.F., So, C.-L. and Groom, L. (2004) Genetic improvement of fiber length and coarseness based on paper product performance and material variability – a review. IAWA J. 25, 401–414.
White, T.L., Adams, W.T. and Neale, D.B. (2007) Forest genetics. CABI Pub., Cambridge, MA, 692pp.
Wullschleger, S.D., Yin, T.M., DiFazio, S.P., Tschaplinski, T.J., Gunter, L.E., Davis, M.F. and Tuskan, G.A. (2005) Phenotypic variation in growth and biomass distribution for two advanced-generation pedigrees of hybrid poplar. Can. J. For. Res. 35, 1779–1789.
Yu, Q., Pulkkinen, P., Rautio, M., Haapanen, M., Alen, R., Stener, L.G., Beuker, E. and Ti-gerstedt, P.M.A. (2001) Genetic control of wood physicochemical properties, growth and phenology in hybrid aspen clones. Can. J. For. Res. 31, 1348–1356.
Zhang, S.Y., Yu, Q., Chauret, G. and Koubaa, A. (2003) Selection for both growth and wood properties in hybrid poplar clones. For. Sci. 901–908.
Zsuffa, L. (1975) A summary review of interspecific breeding in the genus Populus L. In: Proceedings, 14th Meeting of the Canadian Tree Improvement Association, Part 2. De-partment of Environment, Canadian Forestry Service, Ottawa, Canada, pp. 107–123.
Stanton, B. Eaton, J., Johnson, J., Rice, D., Schuette, B. and Moser, B. (2002) Hybrid poplar in the Pacific Northwest: the effects of market-driven management. J. For. 100, 28–33.
Stanturf, J., Gardiner, E. and Schoenholtz, S. (2003) Interplanting for bioenergy and riparian restoration in the southeastern USA. Proceedings from the Short Rotation Crops for Bio-energy, New Zealand, pp. 241–250.

15 Southern Pines: A Resource for Bioenergy
Gary F. Peter
University of Florida, School of Forest Resources and Conservation, Gainesville, FL, USA, [email protected]
15.1 Introduction
The southeastern United States has approximately 82 million hectares of timberlands (Smith et al. 2004) and annually produces 18% of the global supply of industrial roundwood and 25% of the global wood pulp, more industrial timber than any other country in the world (Prestemon and Abt 2002; FAO 2004). The over 15 million hectares of southern pine plantations, predominantly loblolly pine, Pinus taeda L., and slash pine, Pinus elliottii Englemn., comprise about half of the world’s industrial forest plantations (Wear and Greis 2002; Siry et al. 2006). Because of the magnitude of operations, the forest products industry is currently the largest producer of bio-energy in the U.S., producing substantial amounts of steam and electricity from the burning of this forest biomass, particularly bark and the lignin rich black liquor of chemical pulp and paper mills.
W. Vermerris (ed.), Genetic Improvement of Bioenergy Crops, DOI: 10.1007/978-0-387-7080 Science+Business Media, LLC 2008 5 -8_1 5 , © Springer
The well established tree improvement programs, growing systems, range of management regimes and excellent genetic resources make southern pine a strong candidate as a biomass source for converting into fuel and energy. Two main proc-essing strategies exist, one is an integrated forest biorefinery that produces bioenergy and biofuels in addition to cellulose-based products such as pulp and paper (Stuart 2006; Van Heiningen 2006; Chambost et al. 2007a,b; Towers et al. 2007). The other is to convert, in stand-alone dedicated facilities, southern pine biomass to heat and/or electricity through co-firing with coal or wood pellets or to bioenergy and biofuels using bioconversion or gasification.

398 Peter 15.2 Botanical Description of Pines: Southern Yellow Pines
15.2.1 Taxonomy of Species Developed for Plantation Forestry
In the Pinaceae family, the Piniodeae subfamily or Pinus genus is the largest and contains well over 100 species (Syring et al. 2005). A distinctive characteristic ofpines is the biennial appearance of cones. Even though, the Pinus genus is mono-phyletic, both character states and molecular markers support phylogenies with two distinct subgenera, Pinus (hard pines) and Strobus (soft or white pines) (Syring et al. 2005). Both subgenera can be further separated into two sections, with each section containing two to four subsections. For example, the Pinus subgenus is divided into the Pinus and Trifoliae sections. The Trifoliae section is proposed to be composed of four subsections: the Attenuatae, Australes, Ponderosae and Contortae (Price et al. 1998; Syring et al. 2005). The southern pines are found predominantly in the Trifo-liae section of the Pinus subgenus, with the majority being classified in the Australes subsection (Table 15.1). Randomly amplified polymorphic marker analysis of the North and Central American Australes and Oocarpae subsections, which contain many economically important species, show that longleaf, shortleaf and loblolly pine form one clade and slash pine and caribbean pine form another closely related clade (Dvorak et al. 2000).
Table 15.1. Summary of southern pine (Pinus) species
Subsection Species Common name Australes P. echinata Shortleaf pine Australes P. elliottii Slash pine Australes P. glabra Spruce pine Australes P. palustris Longleaf pine Australes P. pungens Table Mountain pine Australes P. rigidia Pitch pine Australes P. serotina Pond pine Australes P. taeda Loblolly pine Contortae P. virginiana Virginia pine Contortae P. clausa Sand pine
The southern pines are native to the Southeastern U.S., including Alabama, Arkan-sas, Georgia, Florida, Kentucky, Louisiana, Mississippi, North Carolina, Oklahoma, South Carolina, Texas, Tennessee, Virginia, and West Virginia. While some species like rrow natural ranges, many species have wide natural ranges spanning many states in the region (Fig. 15.1). Interestingly, biogeography studies suggest that after the most recent glacial period, approximately 10,000 years ago in the U.S., loblolly and longleaf pines repopulated the region from two refugia, one located in northern Mexico and the other in southern Florida (Schmidtling et al. 1999; 2000).
sand pine have relatively na

Southern Pines a Resource for Bioenergy 399
Fig. 15.1. Natural distribution maps for four southern pine species. The white areas indicate the natural range of these species. (Reproduced from http://esp.cr.usgs.gov/data/atlas/little/) Naturally occurring populations of southern pine are highly diverse. The wide geographic distributions of many of these species show that they are adapted to a variety of climate zones and soil types (Fig. 15.1). For example, shortleaf and lob-lolly pine grow in most southern states. Pines are monoecious, with male strobuli and female cones. Even though trees bear both types of flowers, they reproduce pre-domintantly by outcrossing. Evidence for outcrossing comes from the strong depres-sion observed after controlled inbreeding and the low levels of relatedness of indi-viduals detected in natural populations. In addition, the overlapping ranges of the various species lend themselves to natural hybridization. For example, there is some phenotypic evidence that in the western part of the range, loblolly pine may have hybridized with the closely related shortleaf pine, as these species commonly grow in mixed stands (Chen et al. 2004). In addition, longleaf pine naturally hybridizes with loblolly pine, producing Sonderegger pine (P. ×sondereggeri H.H. Chapm.), the only named hybrid between southern pine species. Thus, genetic differences account for an important part of the phenotypic diversity within these species. Four southern pine species, loblolly, longleaf, shortleaf, and slash, are the most important because of their broad natural ranges (Fig. 15.2). However, the majority of the ~15 million hectares of planted timberlands in the Southeastern U.S. were planted with just two species, loblolly and slash pine. Loblolly pine is considered a model for the study of gymnosperm species, not only because of its economic impor-

400 Peter tance, but also because of its well characterized reproduction and genetics (Lev-Yadun and Sederoff 2000).
Fig. 15.2. Images of mature trees of (A) slash pine, (B) longleaf pine, and (C) loblolly pine. (Photographs courtesy of G.L. Powell, University of Florida)
15.3 Management, Harvesting, Transportation and Bioprocessing of Southern Pines
15.3.1 Current Southern Pine Growing Systems for Traditional Forest Products
In the Southeastern U.S., over 50 years of research has been conducted towards the development of growing systems for industrial round wood from planted southern pines. This extensive body of research includes results related to all aspects of plan-tation forestry, including tree improvement, seed germination, nursery management, seedling survival, site preparation and establishment, initial planting density, com-peting vegetation control and fertilization, thinning, harvesting and log transporta-tion. The results, from sophisticated, large-scale field trials conducted on multiple sites across the Southeastern U.S. with both loblolly and slash pine, clearly demon-strate the importance of silvicultural treatments and genetic improvement in enhanc-ing tree growth and stand productivity. A number of recent reviews summarize these advances in the productivity of southern pine plantations (Fox et al. 2004; 2007b). In addition to the applied outcomes on which many of the growing systems have been

Southern Pines a Resource for Bioenergy 401
A main goal of the production ecology research on southern pines has been to identify the most important constraints to growth. In general, Southeastern soils are nutrient poor and many areas suffer from either too low or too high soil moisture content. Although the western part of the loblolly range is more limited by water availability than the eastern part of the range, the data support the general conclusion that chronic nitrogen and phosphorus limitations more significantly affect the growth of established stands rather than water availability (Colbert et al. 1990; Albaugh et al. 1998; Jokela and Martin 2000). This interpretation is supported by observations that low soil nutrients reduce both the inherent growth efficiency of various pine families and the leaf area index, which together reduce carbon fixation and thus primary productivity. In addition to nutrients, water and light availability, a number of important fun-gal pathogens and insect predators reduce survival and limit growth in southern pines. In plantations, the most damaging pathogen is Cronartium fusiforme, a rust-forming fungus. Slash pine is generally more susceptible to this rust pathogen than loblolly pine (Schmidt et al. 1988). Because of the susceptibility of slash and loblolly pine to fusiform rust, genetic resistance has been selected for in slash and loblolly tree improvement programs (see Section 15.3). Both species have similar sensitivi-ties to Fusarium subglutinans f. sp. pini (F. s. pini) or pitch canker, which is a necro-phyte (Dwinell et al. 1985). Pitch canker is an episodic disease, in part because it is a wound pathogen. Another pathogen that also occurs episodically is southern pine beetle, Dendroctonus frontalis, which attacks slash and loblolly pines only when they become susceptible after prolonged periods of drought stress or from over-stocking. In contrast to rust, slash pine is more resistant to predation by Nantucket tip moth, Rhyacionia frustrana, than loblolly pine. A number of trials have compared the survival and growth of loblolly and slash pine on a variety of soil types and different environmental conditions. Even though slash and loblolly pine are closely related and can hybridize, these studies show a number of important differences. It is generally agreed that slash pine is a less ag-gressive competitor than loblolly pine. Slash pine tends to grow better on nutrient-poor sites and its growth is not stimulated to the same extent as loblolly pine by high nitrogen and phosphorous availability (Colbert et al. 1990; Roth et al. 2007). Thus, slash pine tends to have greater nutrient use efficiencies. In addition, slash pine grows better than loblolly on flatwood sites with high ground water levels. However, growth in slash pine after a mid-rotation thinning is not stimulated to the same de-gree as loblolly pine.
developed, fundamental tree and stand level responses have also been characterized for fertilization (Jokela et al. 2004; Long et al. 2004; Martin and Jokela 2004; Al-baugh et al. 2006; Fox et al. 2007a). Moreover, because much of this research was conducted cooperatively between forest industry, universities, state and federal agen-cies, the results have been widely disseminated and implemented across large por-tions of the approximately 13 million hectares of operational plantation forests in the region, evidenced by the observation that most of the planted seedlings are genetically improved and surveys indicate that over 6 million hectares have been fertilized since 1969 (McKeand et al. 2003; Albaugh et al. 2007).

402 Peter
Table 15.2. Generic silvicultural regimes applied to loblolly pine, grown in South Georgia and Florida for mixed products – pulpwood, chip-n-saw, and sawtimber
Activity Low Moderate High Mechanical site preparation Spot rake,
bed Spot rake, bed Shear, spot rake,
bed Chemical site preparation None Yes Yes Machine planting Yes Yes Yes Herbicide Yes Yes Yes Post-planting Fertilization No 170–2801
DAP,2 Yr 3 280 DAP, Yr 3
Pre Thinning Fertilization 170 N, 28–56 P Yr 8–12
170–225 N, 28–56 P Yr 6–10
400 N 56 DAP Yr 6–8
Thinning 12–20 yrs 12–18 yrs 10–14 yrs Post Thinning Fertilization No No 200 N, 28 P Harvest 24–35 yrs 20–28 yrs 18–24 yrs
1. All amounts are in kg ha–1 2. Diammonium phosphate
The three different scenarios all include mechanical site preparation and chemical treatments to control competing vegetation. In addition, fertilizer is often applied once or twice early in the rotation. Once tree growth rate starts to level off, due prin-cipally to stand closure and inter-tree competition for resources, the stand is thinned. After 10–28 years of growth, depending on the quality of the site and intensity of fertilization, stands are thinned by removing about one half of the trees. The harvest-ed trees are sold mostly as pulpwood. The thinned plantation can be fertilized (mid-rotation) and the trees are harvested between ages 22–35 for solidwood depending on the site quality. Plantations for solidwood production are planted at 1,100–1,800 trees per hectare. The predominant planting stock is 1 year-old bare-root seedlings. Nurseries sow and grow seed in specialized beds with tightly controlled conditions for 8–12 months. After top pruning, lifting, and grading, 0.8–1.0 billion loblolly and slash
Silvicultural strategies for loblolly and slash pines vary from low to high inten-sity across the region, depending on the objective for the plantation and the amount of up-front investment that is available to be committed. Clearly, planting genetically superior seedlings and managing them more intensively (more inputs) promotes volume growth and shortens rotation times (Table 15.2). The main production objec-tive for loblolly and slash pine plantations has been to grow trees that can be con-verted into pulp and paper, wood composites and saw timber or solidwood products. The large price premium for sawlogs over pulpwood tends to drive management decisions. High survival and accelerating early growth is crucial for good economic returns on loblolly and slash pine plantations. Table 15.2 summarizes typical low-, medium- and high-intensity management regimes that might be used in the South-eastern U.S. with loblolly pine.

Southern Pines a Resource for Bioenergy 403
pine seedlings are sold annually for regeneration of Southeastern forests. Virtually all of the seed is genetically improved for growth and disease resistance, being col-lected from selected trees from tree improvement programs grown in seed orchards (see Section 15.4). Of these seedlings, greater than 70% are loblolly pine and about 30% are slash pine (McKeand et al. 2003). In 1998 and 1999, 65–80 million longleaf pine seedlings were sold each year across the Southeastern U.S., mainly in efforts to restore this species.
15.3.2 Southern Pine Harvesting and Transport
The harvesting and transportation of plantation grown southern pines is well estab-lished. Overall, harvesting and transportation are estimated to account for about two-thirds of the total delivered wood costs (Peter et al. 2007). In particular, harvesting costs represent the greatest proportion of the total delivered wood price. The most intensive public research on harvesting has led to the development of tools such as the Auburn Harvesting Analyzer (AHA) (Tufts et al. 1985). AHA is software that facilitates the balancing of various harvesting equipment. Typically, just the bole or stem is harvested for solidwood, pulp and paper and the tops less than or equal to 10 cm in diameter, as well as the branches are left on site. These forest residues still account for a significant proportion of the biomass. Currently, these decompose on site and release nutrients and carbon into the soils and may be important for sustain-ing productivity through multiple cycles. It is possible to remove them, but their low density means that it is still quite expensive to collect and transport them without some form of compaction or bundling. Although important public research on the efficiency of harvesting was conducted in the 1980’s and early 1990’s, research in this area has since fallen behind the rest of the world (Siry et al. 2006). Harvesting and transporting small-diameter trees is a significant cost barrier to growing and using southern pines for bioenergy. Because of the large number of stems, it takes longer to cut and haul them to trucks for transportation. One approach that has been developed to overcome some of these constraints is in the forest bun-dling or chipping operations.
15.3.3 Silvicultural Research for Short-Rotation Bioenergy Plantings
Only a few studies have been reported with southern pines (slash and sand pine) in short-rotation bioenergy style plantings. In general, short-rotation woody crops (SRWC) rely on planting large numbers of seedlings at high initial densities to maximize the yield of biomass at early ages. While typical initial densities of 1,300–1,800 trees per hectare are planted with rotations of 20–35 years for mixed product class harvesting (pulpwood, chip-n-saw, and solidwood), SRWC studies have fo-cused on planting more than 4,000 trees per hectare and harvesting at 8 years (Rockwood and Dippon 1989). The yield of biomass from these few early SRWC test plantings was rather low, but was done with first-generation material. It is ex-pected that additional future research with higher planting densities and second-generation materials will give higher yields in SRWC plantings. However, because southern pines do not regenerate by coppicing, it is less likely that these species are

404 Peter suited to SRWC regimes. Additionally, harvesting and transportation issues have not been worked out with small-diameter southern pine and this is also a significant issue.
15.3.4 Traditional Pulp and Paper Bioprocessing Methods, Existing Infrastructure, and Integrated Forest Biorefineries
A number of different technologies – combustion, pyrolysis, gasification and bio-conversion – can or have been used to process wood into heat, electricity and liquid fuel. Before describing the status of using these technologies with southern pine, it is important to frame this discussion with the well-established infrastructure in the forest products industry to process the woody stems of trees into solidwood, pulp, and paper products at industrial scales. The utility of southern pine biomass for large-scale production of solidwood, pulp and paper has already been established by the forest products industry. The southeastern states produce about 60% of the paper made in the USA. Thus, a prin-cipal advantage of using southern pine for bioenergy lies in the vast production ar-eas. These vast acreages contain large amounts of standing wood and residuals that are useful for conversion. Trees also have a number of important advantages over grass crops: (1) they have similar annual biomass growth rates, but require fewer inputs, (2) the woody stem has a higher density, which reduces transportation costs, a substantial barrier for all biomass crops, (3) year-round harvesting without the need to store the material for extended periods of time, (4) low ash contents, and (5) well established genetics and silvicultural methods that can increase the yield of wood. Because chemical pulp mills burn bark and waste wood in hog fuel boilers and burn the soluble carbohydrates and energy-rich lignin recovered from the pulping liquors in recovery boilers, the forest products industry is the leader in steam and power generation from biomass. For example, a Kraft chemical pulp and linerboard or carton board paper mill in the Southeastern U.S. generates about 60% of its power needs by burning waste wood and black liquor (Peter et al. 2007). It is estimated that the forest products industry in the U.S. generates more than 1.5 × 10¹² MJ yr–1, mostly from the burning of black liquor. The forest products industry is actively researching strategies to develop inte-grated forest biorefineries (Amidon 2006; Larson et al. 2006; Van Heiningen 2006; Chambost et al. 2007a,b; Towers et al. 2007). Research is under way to more effi-ciently convert the soluble carbohydrates, (principally hemicellulose) and lignin in the spent pulping liquors (black liquor) to electricity via gasification. Black liquor gasifiers, once developed and installed, are expected to enable mills to generate more than 100% of their power needs. The syngas produced by gasification can also be converted to other chemicals, including liquid fuels. Economic analysis of installing gasifiers in pulp and paper mills indicates that the potential returns on this capital investment would be substantially higher than traditional recovery boilers (Larson et al. 2006). An additional strategy under investigation is the extraction of the hemicel-luloses from the wood prior to pulping (Amidon 2006; Van Heiningen 2006). The recovered hemicelluloses are then hydrolyzed and fermented into ethanol or other chemicals. In this method, wood is pretreated, typically at elevated temperatures in

Southern Pines a Resource for Bioenergy 405
water or dilute acids (1–4%) to hydrolyze the short, amorphous hemicelluloses to oligomeric and monomeric sugars which efficiently leach from the wood chips, extracting 50% or more of the hemicelluloses away from the fibrous cellulose and lignin (Amidon 2006; Van Heiningen 2006). Hemicelluloses compose about 25% of the mass of wood. In contrast to angiosperm trees, southern pine hemicelluloses – galactoglucomannan, glucomannans, and arabinoglucuronoxylans – consist pre-dominantly of hexoses (see Chapter 4). Advances in chip leaching and or purification of sugars from black-liquor streams could create a large and potentially economically viable source of sugar for bioconversion into ethanol.
15.3.5 Stand-Alone Facilities for Converting Southern Pines to Energy and Fuels
Independent of the potential to generate electricity and liquid fuels from the existing forest products processing infrastructure, southern pine wood has been converted into energy in a number of different stand alone operations, including co-firing in coal burning plants to generate electricity, wood pellets for heat, wood gasifiers to generate gas, electricity, and liquid fuels and other chemicals, as well as wood-to-ethanol in bioconversion plants. Wood Pellets: Wood pellets are formed by pressing uniformly-sized wood dust through small sized holes (6–9 mm) in a die. The high pressures used elevate the temperature of the dried wood and plasticize the lignin, which glues the particles together. Typically wood pellets are burned for heat in pellet stoves or furnaces in single buildings. However, regulation in the European Union which mandated cer-tain percentages of electrical power come from renewable sources has led to plans for three wood pellet facilities (Alabama, Georgia, Florida) in the Southeastern U.S. For example in North Florida, Green Circle Energy is building the largest wood pellet manufacturing facility in the world (Kotra 2007). This facility is scheduled for completion in early 2008 and will use southern pine roundwood as a principal source. Co-firing with Coal: In one of the oldest energy applications, wood can substi-tute for up to 20% of the coal in the boiler of coal-burning power plants. The wood must be ground to a relatively fine size before co-firing. The main advantage of wood over coal is its cleaner emissions. The plants that operate with wood are gener-ally not utility-scale power generating facilities, as obtaining low cost, woody bio-mass at such large scales has been hampered by transportation costs, and citing such facilities needs to occur in relatively rural locations with adequate wood supplies. Wood Gasification to Energy and Chemical Facilities: Stand alone facilities that use gasification to convert wood into energy and power are planned in the Southeastern U.S. For example, in North Florida a facility that will produce electric-ity and gas will begin construction in 2008. Also in 2008, a facility that will produce ethanol from syngas will be completed in South Georgia. Bioconversion of Wood to Ethanol Facilities: Biological technologies have been developed for converting wood and other lignocellulosic material to ethanol. Currently, bioconversion has four unit operations: pretreatment, saccharification, fermentation, and distillation (see Chapter 6). Pretreatment steps increase the surface

406 Peter area of the wood and hydrolyze the bulk of the hemicelluloses into monosaccharides which diffuse away from the fibrous cellulose and lignin, thereby increasing the porosity of the wood and making it more accessible to digestion by cellulases. The fibrous cellulose and lignin material is then treated with cellulases that saccharify or degrade the cellulose to glucose. The sugars are converted to ethanol by yeast or bacteria during fermentation. The ethanol is concentrated by distillation. The remain-ing lignin is used as an energy source. While no large-scale bioconversion plants that use wood are operating in the Southeastern U.S., a plant in Japan that utilizes urban wood waste is operating under license. A new plant is under construction in Jennings, Louisiana, USA, by Verenium that will use primarily wood, including southern pine, as a source of biomass.
15.4 Life History and Life Cycle of Southern Pines
The life histories of pines has been reviewed recently (Keely and Zedler 1998). Compared with angiosperm tree species, pines are generally more tolerant of abioti-cally stressful sites. Tolerance of pines to nutrient poor sites and extreme conditions appears to be the rule. Pines are also more tolerant of drought, in part because tra-cheids are less prone to cavitate and they have wider safety margins than angio-sperms. Most pine species do not tolerate low-light environments, such as those observed under the canopy. Generally, loblolly and slash pine are considered pioneer species. After germination, the young seedlings grow rapidly and the trees become reproductive at modestly young ages. These characteristics help them aggressively colonize areas after disturbances such as fire, hurricanes, and flooding. In contrast, longleaf pine grows in areas more susceptible to fire. The seedlings spend a pro-longed time, up to 15 years, in a “grass” stage, where the root system grows but the shoot remains 1–2 feet tall. The grass stage helps longleaf pine resist frequent fires. The grass stage is prolonged in areas where strong competition from weeds exists. Once the seedlings get beyond the grass stage, longleaf grows fast because of its already well-developed root system. Today herbicide and fertilizer treatments are used to minimize the length of the grass stage after planting (Ramsey and Jose 2004). Southern pines are wind-pollinated species. Trees bear both male strobuli and female cones (Fig. 15.3). Male cones form on lateral shoots in subterminal clusters. The male strobuli are modified leaves called microsporophylls that form the micro-sporangia where the pollen grains develop (Gifford and Foster 1989). Female cones have more complex morphologies with a main branch having numerous lateral branches. A cone scale is composed of a lateral branch and a modified leaf or small bract. Female cones form on lateral branches at the top of the main vertical shoots. Southern pines have a 2 year pollination cycle. In the first year, pollen lands on the not fully-developed female cone and is retained in the pollen chamber and does not germinate. In spring of the second year the pollen germinates and fertilizes the egg. The resulting zygotic embryo develops and matures during the summer and seeds and cones dehisce and are ready for release or collection.

Southern Pines a Resource for Bioenergy 407
Fig. 15.3. Flowers of slash pine. (A) male strobuli and (B) female flowers. (Photographs courtesy of G.L. Powell, University of Florida) Pines have to two types of polyembryony (Gifford and Foster 1989). Primary polyembryony is when several fertilizations occur in the separate archegonia present in each ovule, giving rise to genetically distinct embryos. Secondary polyembryony, also called cleavage polyembryony, occurs when the embryos divide to form four genetically identical embryos within each archegonium. Only the most vigorous of these survives and matures to produce a single embryo per seed. In nature the reproduction of pines is strictly sexual. Pines can become repro-ductive as early as 6–8 years of age. Trees grown in seed orchards take advantage of this and are managed specifically for early induction of “flowering”.
15.5 Genetics and Breeding of Southern Pine
15.5.1 Genetic Diversity
On average, pines are among the most variable organisms with high genetic and phenotypic diversity (Ledig 1998). The large extant natural populations of southern pines are also genetically and phenotypically diverse (Gonzalez-Martinez et al. 2006). The natural population shows regional phenotypic differences related to local adaptations. For example, in loblolly pine the greatest genetic differences exist be-tween the western and eastern populations (Fig. 15.1). Genotypes from west of the Mississippi river delta tend to grow slower but are more drought tolerant than geno-types from east, which tend to grow faster but are more susceptible to drought. Alle-lic differences have been detected in the two populations, with the eastern population having greater diversity than the smaller western population. Evidence for genetic diversity comes from molecular markers (Al-Rabab'ah and Williams 2002; Brown et al. 2004) and quantitative genetic analysis of breeding populations at the provenance and family levels (Cornelius 1994; Dieters et al. 1995; Gwaze et al. 2005). Interest-

408 Peter ingly, the extensive natural populations that cover the south today grew back rela-tively recently after the Southeastern U.S. was mostly deforested for growing agri-cultural crops in the 19th century. However, there is still a high degree of natural diversity. Significant amounts of the genetic diversity within these populations have been archived (Namkoong 1997). The motivation for these wild germplasm collec-tions and archives was to get higher levels of productivity and disease resistance. Early tests of different seed sources and investigation of management techniques were led by Philip Wakeley of the U.S. Forest Service and reported in the classic text on planting southern pines (Wakeley 1954). Wakeley’s work laid the foundation for establishment in the 1950’s of three university-industrial cooperative tree improve-ment programs with the goal of genetically improving southern pines (Schmidtling et al. 2004). The tree improvement programs conducted extensive wild selections of pheno-typically superior trees and planted these wild selections in common gardens to iden-tify the best material with which to establish breeding programs and to test for the genetic control of economically important traits such as growth, form, and disease resistance. Mass selection was conducted with loblolly and slash pines to form large base breeding populations and establish the first orchards for deployment and breed-ing. These collections, estimated to be ~8,000 in loblolly pine, represent a rich set of trees across the range (McConnell 1980). For both loblolly and slash pine, two cycles of breeding, genetic testing and selection have been completed, and the third cycle is underway. However, southern pines are far from being domesticated species. Within family variability is still as high as that observed across families.
15.5.2 Pollination, Breeding, and Propagation of Southern Pines
All pines are diploid and contain 12 pairs of chromosomes (2n = 2x = 24). Polyploids are invariably aberrant (Mergen 1958) and thus don’t exist in natural or breeding populations. Even though southern pine strobuli and flowers are produced on the same tree and are capable of self pollination, several mechanisms maintain high rates of outcrossing. Male and female cones are well separated on the trees, with the fe-male cones developing higher up in the crown. Competition between embryos re-duces survival of selfed progeny because of negative effects from the high genetic loads that cause strong inbreeding depression (Remington and O'Malley 2000). In-breeding depression is observed by poor seed set, presumably due to embryo abor-tion, and if seed from self crosses do germinate, they tend to grow slowly and have form defects (Franklin 1969; 1972; Matheson et al. 1995; Williams and Savolainen 1996). Methods to accelerate the breeding of southern pines have been developed over the last 20 years. Current breeding practices rely almost exclusively on grafting young scion material from superior selections determined from genetic tests, onto the tops of reproductively competent trees in seed orchards. Sufficient numbers of top grafts need to be established to obtain adequate production of both male and female flowers (Perez et al. 2007). Male strobuli that have just completed development are collected prior to dehiscence and dried. The dry pollen is separated from the strobuli and is ready for use in pollinations and for long-term storage. Immature developing

Southern Pines a Resource for Bioenergy 409
female flowers are bagged prior to opening to prevent contamination. After the fe-male cones open and are receptive to pollination, pollen from the appropriate source is injected into the bag where pollination takes place (Fig. 15.4).
Fig. 15.4. (A) Pollination bags in the tops of slash pine seed orchard trees. (B) Pollination of a bagged female cone. (Photographs courtesy of G.L. Powell, University of Florida) After the 2-year reproductive cycle is complete and the seeds have matured, the cones are picked prior to complete dehiscence and opening. In loblolly pine the im-mature cones need to be removed by hand, but in slash pine they can be removed by shaking the tree. After collection, the cones are dried completely and the seed ex-tracted before storage. Prior to planting in containers or in nursery beds, seed are imbibed and stratified at 4°C for 20–40 days. Mechanized seed planters sow the seed in the nursery beds. The seedlings are grown with ample moisture and nutrients to maximize their size before planting in the field. Because of the compounding of growth that occurs in trees, vigorous and large seedlings grow faster into big trees. Compared with bare root seedlings, seedlings grown in containers have larger root systems and tend to grow faster after transplanting. However, the extra cost associ-ated with the containers is still difficult to justify for most growers. Currently, the majority of genetically improved seed comes from seed orchards. Seed orchards are the source for the vast majority (>95%) of the seed that is planted in commercial nurseries. Seed orchards are established with the top 10–35 selections from a cycle of tree improvement (McKeand et al. 2003). Consequently, orchards are often described as first or second generation. Seed orchards are typically managed to produce half-sib or open pollinated (OP) seed, but they can also be used to produce full-sib seed obtained by mass controlled pollination. The main advantage of OP seed is its low cost and ease of production. However, the gains in yield expected with OP seed from the genetic tests of the parents are not observed because of contamina-tion by pollen (typically 20%) from outside of the orchard. Compared with OP seed, seed produced by controlled pollination has the advantage of increased yield because there is no contamination by pollen from outside the orchard and only the best par-ents are used to make the full-sib families.

410 Peter In southern pines, an aggressive timeline for the breeding and testing cycle is 11–12 years (Fig. 15.5A). In the seed orchard example, breeding takes a minimum of 3 years and the longest phase is the genetic testing which requires 5 years in the field before reliable estimates of growth are acquired. An alternative to seed orchard pro-duction of seed is to generate planting stock with mass clonal propagation of elite selections. The advantages of clonal propagation are higher yields that can be ob-tained through clonal selection, compared with deployment of families. The second valuable use of somatic embryogenesis is the much faster deployment of genetically improved selections, as little as half the time of traditional seed orchards (Fig. 15.5B).
.
Fig. 15.5. Timeline for a pine breeding cycle and deployment with (A) a seed orchard, and (B) somatic embryogenesis. (Reproduced from Peter (2007) with permission of Pira Press) Southern pines can be clonally propagated by rooted cuttings and somatic em-bryogenesis (Nehra et al. 2005). Propagation by rooted cutting occurs by growing young hedge plants from which cuttings can be taken. Greenhouse systems have been developed that can induce high levels of rooting for loblolly and slash pine (LeBude et al. 2004; 2005). The main limitation of scaling rooted cuttings for com-mercial production is that when the hedge plants mature, they no longer produce cuttings that root efficiently. This maturation problem exists for many pine species, including radiata pine. Somatic embryogenesis is an alternative clonal propagation method that relies on inducing somatic embryos from zygotic embryos or vegetative tissues. In southern pines, somatic embryos have only been induced from young, early-stage zygotic embryos. Somatic embryogenesis has several advantages over rooted cuttings. First, early-stage embryos can be efficiently multiplied in a small laboratory to produce millions of embryos. Second, the early-stage embryos can be frozen and cryostored for extended periods of time, creating an almost limitless source for continued propagation. In southern pines, early-stage embryos are ma-tured on media containing abscisic acid and elevated osmoticum (Nehra et al. 2005). Although maturation and germination has been more difficult in southern pine than other conifers, successful protocols now exist for many commercially important

Southern Pines a Resource for Bioenergy 411
sources of germplasm. Companies in the forest products industry are developing varietal lines of elite germplasm that were selected and propagated by somatic em-bryogenesis. More importantly, some of these varietal lines of loblolly pine are now being commercially deployed in the Southeastern U.S.
15.5.3 Genetic Improvement of Growth, Disease Resistance, and Wood Properties in Loblolly and Slash Pine
All of the commercially important characteristics in southern pine are inherited as complex traits. Since complex traits are polygenic, tree improvement programs rely on recurrent selection based on predicted breeding values (White et al. 1993; 2007 McKeand and Bridgwater 1998). The focus of tree improvement has been growth, stem form, and fungal disease resistance. In each of the first two breeding cycles of loblolly pine, gains of 30–40% in stem volume were achieved (Li et al. 1999). Dur-ing this time the size of the breeding populations has decreased, so that it is becom-ing possible to envision breeding and selecting for wood property traits in addition to growth and disease resistance. Wood properties play an important role in the eco-nomic conversion of southern pines into pulp, paper, wood (Peter 2007; Peter et al. 2007) and presumably also bioenergy. Over the last 50 years of breeding southern pines, a tremendous amount of fun-damental and applied genetic information has been learned about growth, disease resistance and wood properties, (e.g., Schmidtling et al. 2004). This research focused on applying quantitative genetic theory to understand the genetic control of these traits and to improve volume growth and disease (rust) resistance of future genera-tions. In addition, significant fundamental advances in our understanding of the ge-netic control of wood properties have been gained. Overall growth and fungal dis-ease resistance show low levels of heritability; whereas wood properties show low to moderate heritability. All traits have adequate additive genetic variance, so tradi-tional breeding and selection is expected to lead to improvements for many genera-tions. Currently, loblolly and slash pine have only one breeding zone, because ge-netic by environmental interactions have not been found to be significant (McKeand et al. 2006). However, as the industry moves to deployment of full sibs and clones, genetic by environmental interactions may become more of a concern. Improving volume growth and yield are the primary focus of tree improvement programs (White et al. 1993; McKeand and Bridgwater 1998). Early tests showed that some Atlantic Coastal provenances have superior growth compared with many western provenances (Schmidtling et al. 2004). These tests led to the selection of superior genetic material that formed the basis of the breeding populations for lob-lolly and slash pine. Current genetic test designs use single-tree plots and high levels of control of the field environments, which reduce the size and time required for genetic testing. Quality growth data for loblolly and slash pine can be collected after five years, and the breeding values correlate well with those obtained from full rota-tions. Thus, breeders focus on selecting parents whose progeny have the fastest early growth rates. One caveat to this approach is that these fast growing trees are more aggressive competitors using site resources faster. However, in traditional mixed product rotations crown closure occurs after 5–8 years and thus the vast majority of
412 Peter the normal rotation occurs when the trees are competing with their neighbors for light, water and nutrients. This notion prompted the suggestion that breeders should consider developing ideotypes that could be used to select for stand-level productiv-ity rather than early individual tree growth (Martin et al. 2001). Additional ap-proaches to improve growth are underway. In particular, studies of the genetic con-trol of phenological traits such as seasonal initiation and cessation of terminal growth, crown architecture and nutrient use efficiency. In slash and loblolly pine, rust infection is the most economically important disease, because it typically infects young, fast growing trees, inducing galls that weaken the stem or bole and lead to death or unmerchantable wood. Consequently, rust is the most intensively studied disease in pines. Genetic resistance is particularly important in slash pine as it is naturally more susceptible than loblolly pine, and thus improving the genetic resistance against rust is a primary focus of slash pine breed-ing efforts. Large increases in rust resistance were made by incorporating into the breeding population resistant trees from natural stands of slash pine that were heavily infested with rust (Schmidt 2003; Vergara et al. 2004; 2007). This approach has improved slash pine resistance in the breeding population by 30%. Recent evidence suggests that a major gene controls resistance to rust in loblolly pine, suggesting gene-for-gene resistance (Li et al. 2006). Loblolly and slash pine also show complex inheritance of resistance to rust and pitch canker fungi, suggesting quantitative resis-tance exists within these species (Kayihan et al. 2005). Thus, improving quantitative resistance is also possible through breeding and selection. Although it is generally agreed that improving wood and fiber properties is an important goal for tree improvement, southern pine programs are not actively breed-ing for such quality improvements. A significant barrier to justifying even the incre-mental costs associated with measuring and breeding for these traits is that log buy-ers in the U.S. do not pay significant premiums for improved wood properties; rather they pay on a mass basis. Thus, it has been difficult for loblolly and slash pine breed-ing cooperatives to justify actually breeding and selecting for wood properties in addition to growth and disease resistance. Despite this barrier, significant research has been conducted into the genetic control of wood properties, in particular wood density and stiffness. Wood density is under moderate to high heritability in loblolly and slash pine (Hodge and Purnell 1993; Williams and Megraw 1994; Atwood et al. 2002). Strong correlations between juvenile and mature wood suggest that early selection can be used (Williams and Megraw 1994). In loblolly pine, growth and wood density are weakly negatively correlated, which suggests that it will be more difficult to improve both density and growth simultaneously. Wood stiffness is also moderately heritable in slash pine (Li et al. 2007). In a slash pine breeding population, wood stiffness and growth segregate independently and indices suggest that 15% gains in both growth and wood stiffness can be achieved in the next generation with selection for both traits (Li et al. 2007). Compared with wood density and stiffness, significantly less is known about the genetic control of wood chemical composition in loblolly and slash pine, even though these traits are of high interest for both chemical pulp production and bioconversion to ethanol. A recent report on loblolly pine indicated that wood chemical composition is under weak genetic control in

Southern Pines a Resource for Bioenergy 413
juvenile and mature wood, and was not or only weakly correlated with growth (Sykes et al. 2006).
15.5.4 Biotechnology in Southern Pines
The economic importance of loblolly pine, the excellent genetic materials developed by the tree improvement programs, the ease of studying wood characteristics and collecting developing secondary xylem have stimulated significant biotechnology research by both university and company scientists. For example, low to modest density genetic and physical maps have been created for the twelve chromosomes of loblolly pine (Sewell et al. 1999). The utility of these maps has been demonstrated by identifying regions of the chromosomes that contain quantitative trait loci (QTL) controlling wood properties, such as wood chemical composition, density, latewood content, and cellulose microfibril angle (Sewell et al. 2000; 2002; Brown et al. 2003). More recently, substantial genomic resources for loblolly pine have been devel-oped. For example, GenBank contains > 328,628 expressed sequence tags (ESTs) from loblolly pine, representing more than 16,000 unigenes, more than any other gymnosperm species. Major random EST sequencing has been done with cDNA synthesized from RNA isolated from various differentiating secondary xylem tissues (Kirst et al. 2003) and normal and treated root tissues (Lorenz et al. 2006). Interest-ingly, of the close-to-full-length unigenes identified in differentiating secondary xylem, most showed high similarity to sequences in Arabidopsis (Kirst et al. 2003), suggesting plant gene sequences have been strongly conserved across land plant evolution. In addition, a large loblolly pine resequencing project is underway and has discovered single nucleotide polymorphisms (SNP) in 8,000 of the current set of unigenes (Neale 2007). These SNPs will be used in association mapping studies to identify gene candidates that control disease resistance and wood properties. In a separate project the efficacy of SNPs will be investigated for marker assisted breed-ing and selection (Neale 2007). Even though the loblolly pine genome is rather large, 22 pg or 7 times the size of the mammalian genome, a 10 fold coverage bacterial artificial chromosome library is under construction, with the goal of some day gener-ating a genome sequence (Peterson 2007). An essential tool for research into the function of genes and for targeted tree improvement is genetic engineering. Methods have been developed to genetically transform loblolly pine. As with any plant species, stable genetic transformation requires a robust plant regeneration system. Transgenic plants have been reported from two types of regeneration systems. One is an organogenic method starting with mature zygotic embryos (Tang et al. 2001). The other uses early stage somatic em-bryos (Connett-Porceduu and Gulledge 2005). In both systems gene transfer is achieved by co-cultivation with Agrobacterium tumefacians. When somatic embryos are used, genetic transformation occurs quite efficiently, and thousands of independ-ent events can readily be achieved. Moreover, cryostorage of transformed early stage embryo lines after selection helps preserve them for future clonal propagation and field testing. A few field tests have been conducted with transgenic loblolly pine by ArborGen, LLC. For example, antisense lines with reduced expression of 4-

414 Peter coumarate Coenzyme A lyase (4CL), which was shown to reduce lignin levels in angiosperm trees (Hu et al. 1999), have been tested.
15.6 Future Outlook
Advanced generations of southern pines are growing on large areas in the southeast-ern U.S. However, the decline in competitiveness of the region’s pulp and paper industry has reduced the demand for smaller diameter “pulpwood”, which can now be used for bioenergy production. Growers are also looking to new markets, such as stand alone wood pellet and gasification facilities which are being built in the region and that will use southern pine biomass as a source for renewable bioenergy and biofuels. Clonal propagation methods, genetic engineering and fundamental genome-based research are all being applied to the goal of dramatically improving the gains per breeding cycle and accelerating the development and deployment of superior genotypes. These methods create the opportunity to tailor trees to improve the effi-ciency of their conversion into bioenergy and chemicals.
Acknowledgements
The author thanks Greg Powell for allowing his photographs to be published and Eric Jokela for review and input into the section on silviculture.
References
Albaugh, T. J., Allen, H. L., Dougherty, P. M., Kress, L. W. and King, J. S. (1998) Leaf area and above- and belowground growth responses of loblolly pine to nutrient and water ad-ditions. For. Sci. 44, 317–328.
Albaugh, T. J., Allen, H. L. and Fox, T. R. (2006) Individual tree crown and stand develop-ment in Pinus taeda under different fertilization and irrigation regimes. For. Ecol. Man-age. 234, 10–23.
Albaugh, T. J., Allen, H. L. and Fox, T. R. (2007) Historical patterns of forest fertilization in the southeastern United States from 1969 to 2004. Southern J. App. For. 31, 129–137.
Al-Rabab'ah, M. A. and Williams, C. G. (2002) Population dynamics of Pinus taeda L. based on nuclear microsatellites. For. Ecol. Manage. 163, 263–271.
Amidon, T. E. (2006) The biorefinery in New York: Woody biomass into commer-cial ethanol. Pulp Pap-Canada 107, 47–50. Atwood, R. A., White, T. L. and Huber, D. A. (2002) Genetic parameters and gains for growth
and wood properties in Florida source loblolly pine in the southeastern United States. Can. J. For. Res. 32, 1025–1038.
Brown, G. R., Bassoni, D. L., Gill, G. P., Fontana, J. R., Wheeler, N. C., Megraw, R. A., Davis, M. F., Sewell, M. M., Tuskan, G. A. and Neale, D. B. (2003) Identification of quantitative trait loci influencing wood property traits in loblolly pine (Pinus taeda L.). III. QTL verification and candidate gene mapping. Genetics 164, 1537–1546.

Southern Pines a Resource for Bioenergy 415
Brown, G. R., Gill, G. P., Kuntz, R. J., Langley, C. H. and Neale, D. B. (2004) Nucleotide diversity and linkage disequilibrium in loblolly pine. Proc. Natl. Acad. Sci. USA. 101, 15255–15260.
Chambost, V., Eamer, B. and Stuart, P. (2007a) Forest biorefinery: Getting on with the job. Pulp Pap-Canada 108, 19–22.
Chambost, V., Eamer, R. and Stuart, P. R. (2007b) Systematic methodology for identifying promising forest biorefinery products. Pulp Pap-Canada 108, 30–35.
Chen, J. W., Tauer, C. G., Bai, G. H., Huang, Y. H., Payton, M. E. and Holley, A. G. (2004) Bidirectional introgression between Pinus taeda and Pinus echinata: Evidence from mor-phological and molecular data. Can. J. For. Res. 34, 2508–2516.
Colbert, S. R., Jokela, E. J. and Neary, D. G. (1990) Effects of annual fertilization and sus-tained weed-control on dry-matter partitioning, leaf-area, and growth efficiency of juve-nile loblolly and slash pine. For. Sci. 36, 995–1014.
Connett-Porceduu, M. and Gulledge, J. (2005) Enhanced selection of genetically modified pine embryogenic tissue, MeadWestvaco Corporation, USA Patent 6,964,870.
Cornelius, J. (1994) Heritabilities and additive genetic coefficients of variation in forest trees. Can. J. For. Res. 24, 372–379.
Dieters, M. J., White, T. L. and Hodge, G. R. (1995) Genetic parameter estimates for volume from full-sib tests of slash pine (Pinus-elliottii). Can. J. For. Res. 25, 1397–1408.
Dvorak, W. S., Jordon, A. P., Hodge, G. P. and Romero, J. L. (2000) Assessing evolutionary relationships of pines in the Oocarpae and Australes subsections using RAPD markers. New Forest. 20, 163–192.
Dwinell, L. D., Barrowsbroaddus, J. B. and Kuhlman, E. G. (1985) Pitch canker – a disease complex of southern pines. Plant Dis. 69, 270–276.
FAO, U. N. (2004) Forest products yearbook, 2002. In Forestry Series No 37/FAO Statistics Series No. 179, Food and Agricultural Organization of the United Nations (FAO), Rome Italy, p. 243.
Fox, T. R., Allen, H. L., Albaugh, T. J., Rubilar, R. and Carlson, C. A. (2007a) Tree nutrition and forest fertilization of pine plantations in the southern United States. South. J. Appl For. 31, 5–11.
Fox, T. R., Jokela, E. J. and Allen, H. (2004) The evolution of pine plantation silviculture in the southern United States. In General Technical Report SRS-75, U.S. Department of Ag-riculture, Forest Service, Southern Research Station, Asheville, NC, pp. 63–82.
Fox, T. R., Jokela, E. J. and Allen, H. L. (2007b) The development of pine plantation silvicul-ture in the southern United States. J. For. 15, 337–347.
Franklin, E. C. (1969) Mutant forms found by self-pollination in loblolly pine. J. Heredity 60, 315–320.
Franklin, E. C. (1972) Genetic load in loblolly-pine. Am. Nat. 106, 262–268. Gifford, E. and Foster, A. (1989) Morphology and Evolution of Vascular Plants, W.H. Free-
man and Company, New York. Gonzalez-Martinez, S. C., Krutovsky, K. V. and Neale, D. B. (2006) Forest-tree population
genomics and adaptive evolution. New Phytol. 170, 227–238. Gwaze, D. P., Melick, R., Studyvin, C. and Coggeshall, M. (2005) Genetic control of growth
traits in shortleaf pine in Missouri. Southern J. App. For. 29, 200–204. Hodge, G. R. and Purnell, R. C. (1993) Genetic parameter estimates for wood density, transi-
tion age, and radial growth in slash pine. Can. J. For. Res. 23, 1881–1891. Hu, W. J., Harding, S. A., Lung, J., Popko, J. L., Ralph, J., Stokke, D. D., Tsai, C. J. and
Chiang, V. L. (1999) Repression of lignin biosynthesis promotes cellulose accumulation and growth in transgenic trees. Nat. Biotechnol. 17, 808–812.

416 Peter Jokela, E. J., Dougherty, P. M. and Martin, T. A. (2004) Production dynamics of intensively
managed loblolly pine stands in the southern United States: A synthesis of seven long-term experiments. For. Eco. Man. 192, 117–130.
Jokela, E. J. and Martin, T. A. (2000) Effects of ontogeny and soil nutrient supply on produc-tion, allocation, and leaf area efficiency in loblolly and slash pine stands. Can. J. For. Res. 30, 1511–1524.
Kayihan, G. C., Huber, D. A., Morse, A. M., White, T. L. and Davis, J. M. (2005) Genetic dissection of fusiform rust and pitch canker disease traits in loblolly pine. Theor. App. Gen. 110, 948–958.
Keely, J. and Zedler, P. (1998) Evolution of life histories in Pinus. In: Ecology and Biogeog-raphy of Pinus, (D. Richardson, Ed.) Cambridge University Press, Cambridge, England, pp. 219–250.
Kirst, M., Johnson, A. F., Baucom, C., Ulrich, E., Hubbard, K., Staggs, R., Paule, C., Retzel, E., Whetten, R. and Sederoff, R. (2003) Apparent homology of expressed genes from wood-forming tissues of loblolly pine (Pinus taeda L.) with Arabidopsis thaliana. Pro-ceed. Natl. Aca. Sci. USA 100, 7383–7388.
Kotra, R. (2007). Closing the energy circle. In November http://biomassmagazine.com/article.
Larson, E. D., Consonni, S., Katofsky, S., Iisa, K., and Frederick, W. J. (2006) Benefit assessment of gasification-based biorefining in the kraft pulp and paper industry, 4 volumes, De-partment of Energy, Washington D.C., U.S.A.
LeBude, A. V., Goldfarb, B., Blazich, F. A., Frampton, J. and Wise, F. C. (2005) Mist level influences vapor pressure deficit and gas exchange during rooting of juvenile stem cut-tings of loblolly pine. Hortscience. 40, 1448–1456.
LeBude, A. V., Goldfarb, B., Blazich, F. A., Wise, F. C. and Frampton, J. (2004) Mist, sub-strate water potential and cutting water potential influence rooting of stem cuttings of loblolly pine. Tree Phys. 24, 823–831.
Ledig, F. (1998) Genetic variation in Pinus. In D. Richardson (Ed.) Ecology and Biogeogra-phy of Pinus, Cambridge University Press, Cambridge, England, pp. 251–280.
Lev-Yadun, S. and Sederoff, R. (2000) Pines as model gymnosperms to study evolution, wood formation, and perennial growth. J. Plant Growth Reg. 19, 290–305.
Li, B. L., McKeand, S. and Weir, R. (1999) Tree improvement and sustainable forestry im-pacts of two cycles of loblolly pine breeding in the U.S.A. For. Gen. 8, 213–224.
Li, H., Ghosh, S., Amerson, H. and Li, B. L. (2006) Major gene detection for fusiform rust resistance using Bayesian complex segregation analysis in loblolly pine. Theo. App. Gen. 113, 921–929.
Li, X. B., Huber, D. A., Powell, G. L., White, T. L. and Peter, G. F. (2007) Breeding for im-proved growth and juvenile corewood stiffness in slash pine. Can. J. For. Res. 37, 1886–1893.
Long, J. N., Dean, T. J. and Roberts, S. D. (2004) Linkages between silviculture and ecology: examination of several important conceptual models. For. Ecol. Manage. 200, 249–261.
Lorenz, W. W., Sun, F., Liang, C., Kolychev, D., Wang, H. M., Zhao, X., Cordonnier-Pratt, M. M., Pratt, L. H. and Dean, J. F. D. (2006) Water stress-responsive genes in loblolly pine (Pinus taeda) roots identified by analyses of expressed sequence tag libraries. Tree Phys. 26, 1–16.
Martin, T. A., Johnsen, K. H. and White, T. L. (2001) Ideotype development in southern pines: Rationale and strategies for overcoming scale-related obstacles. For. Sci. 47, 21–28.
Martin, T. A. and Jokela, E. J. (2004) Developmental patterns and nutrition impact radiation use efficiency components in southern pine stands. Ecol. App. 14, 1839–1854.
Matheson, A. C., White, T. L. and Powell, G. R. (1995) Effects of inbreeding on growth, stem form and rust resistance in Pinus elliottii. Silvae Genet. 44, 37–46.
Biomass Magazine. jsp?article_ id=1331.

Southern Pines a Resource for Bioenergy 417
McConnell, J. L. (1980) The southern forest – past, present and future. In Proceedings of the Servicewide Workshop on Gene Resource Management, USDA Forest Service, Sacra-mento, CA, pp. 17–26.
McKeand, S., Mullin, T., Byram, T. and White, T. (2003) Deployment of genetically im-proved loblolly and slash pines in the South. J. For. 101, 32–37.
McKeand, S. E. and Bridgwater, F. E. (1998) A strategy for the third breeding cycle of lob-lolly pine in the Southeastern U.S. Silvae Genet. 47, 223–234.
McKeand, S. E., Jokela, E. J., Huber, D. A., Byram, T. D., Allen, H. L., Li, B. L. and Mullin, T. J. (2006) Performance of improved genotypes of loblolly pine across different soils, climates, and silvicultural inputs. For. Ecol. Manag. 227, 178–184.
Mergen, F. (1958) Natural polyploidy in slash pine. For. Sci. 4, 283–295. Namkoong, G. (1997) A gene conservation plan for loblolly pine. Can. J. For. Res. 27, 433–
437. Neale, D. B. (2007) Genomics to tree breeding and forest health. Curr. Opin. Gen. Dev. 17, 1–
6. Nehra, N. S., Becwar, M. R., Rottmann, W. H., Pearson, L., Chowdhury, K., Chang, S. J.,
Wilde, H. D., Kodrzycki, R. J., Zhang, C. S., Gause, K. C., Parks, D. W. and Hinchee, M. A. (2005) Forest biotechnology: Innovative methods, emerging opportunities. Vitro Cell. Dev. Biol.-Plant 41, 701–717.
Perez, A. M. M., White, T. L., Huber, D. A. and Martin, T. A. (2007) Graft survival and pro-motion of female and male strobili by topgrafting in a third-cycle slash pine (Pinus elliot-tii var. elliottii) breeding program. Can. J. For. Res. 37, 1244–1252.
Peter, G. (2007) Developments in Biological Fibre Treatment, Pira International, Surrey, UK, p. 89.
Peter, G., White, D., de la Torre, R., Singh, R. and Newman, D. (2007) The value of forest biotechnology: A cost modeling study with loblolly pine and kraft linerboard in the Southeastern USA. Internat. J. Biotech. 9, 415–435.
Peterson, D. (2007) Prestemon, J. P. and Abt, R. C. (2002) The Southern timber market to 2040. J. For. 100, 16–
22. Price, R., Liston, A. and Strauss, S. (1998) Phylogeny and systematics of Pinus. In: D. Rich-
ardson (Ed.) Ecology and Biogeography of Pinus, Cambridge University Press, Cam-bridge, UK, pp. 49–68.
Ramsey, C. L. and Jose, S. (2004) Growth, survival and physiological effects of hexazinone and sulfometuron methyl applied overtop of longleaf pine seedlings. South. J. Appl. For. 28, 48–54.
Remington, D. L. and O'Malley, D. M. (2000) Whole-genome characterization of embryonic stage inbreeding depression in a selfed loblolly pine family. Genetics 155, 337–348.
Rockwood, D. L. and Dippon, D. R. (1989) Biological and economic potentials of Eucalyptus-grandis and slash pine as biomass energy crops. Biomass 20, 155–165.
Roth, B. E., Jokela, E. J., Martin, T. A., Huber, D. A. and White, T. L. (2007) Genotype x environment interactions in selected loblolly and slash pine plantations in the Southeast-ern United States. For. Ecol. Manag. 238, 175–188.
Schmidt, R. A. (2003) Fusiform rust of southern pines: A major success for forest disease management. Phytopathology. 93, 1048–1051.
Schmidt, R. A., Miller, T., Holley, R. C., Belanger, R. P. and Allen, J. E. (1988) Relation of site factors to fusiform rust incidence in young slash and loblolly-pine plantations in the coastal-plain of Florida and Georgia. Plant Dis. 72, 710–714.
Schmidtling, R., Hipkins, V. and Carroll, E. (2000) Pleistocene refugia for longleaf and lob-lolly pine. J. Sust. For. 10, 349–354.
http://www.pine.msstate.edu.

418 Peter Schmidtling, R. C., Carroll, E. and LaFarge, T. (1999) Allozyme diversity of selected and
natural loblolly pine populations. Silvae Genet. 48, 35–45. Schmidtling, R. C., Robison, T. L., McKeand, S. E., Rousseau, R. J., Allen, H. L. and Gold-
farb, B. (2004) The role of genetics and tree improvement in southern forest productiv-ity.In: Gen. Tech. Rep. SRS–75, U.S. Department of Agriculture, Forest Service, Southern Research Station, Asheville, NC, pp. 97–108.
Sewell, M. M., Bassoni, D. L., Megraw, R. A., Wheeler, N. C. and Neale, D. B. (2000) Identi-fication of QTLs influencing wood property traits in loblolly pine (Pinus taeda L.). I. Physical wood properties. Theor. Appl. Genet. 101, 1273–1281.
Sewell, M. M., Davis, M. F., Tuskan, G. A., Wheeler, N. C., Elam, C. C., Bassoni, D. L. and Neale, D. B. (2002) Identification of QTLs influencing wood property traits in loblolly pine (Pinus taeda L.). II. Chemical wood properties. Theor. Appl. Genet. 104, 214–222.
Sewell, M. M., Sherman, B. K. and Neale, D. B. (1999) A consensus map for loblolly pine (Pinus taeda L.). I. Construction and integration of individual linkage maps from two outbred three-generation pedigrees. Genetics 151, 321–330.
Siry, J. P., Greene, W. D., Harris, T. G., Izlar, R. L., Hamsley, A. K., Eason, K., Tye, T., Baldwin, S. S. and Hyldahl, C. (2006) Wood supply chain efficiency and fiber cost – What can we do better? For. Prod. J. 56, 4–10.
Smith, W., Miles, P., Vissage, J. and Pugh, S. (2004). Forest Resources of the United States, 2002. Gen. Tech. Rept. NC-241, USDA Forest Service, North Central Research Station, St. Paul, MN, p. 137.
Stuart, P. (2006) The forest biorefinery: Survival strategy for Canada's pulp and paper sector? Pulp Pap-Canada 107, 13–16.
Sykes, R., Li, B. L., Isik, F., Kadla, J. and Chang, H. M. (2006) Genetic variation and geno-type by environment interactions of juvenile wood chemical properties in Pinus taeda L. Ann. For. Sci. 63, 897–904.
Syring, J., Willyard, A., Cronn, R. and Liston, A. (2005) Evolutionary relationships among Pinus (Pinaceae) subsections inferred from multiple low-copy nuclear loci. Am. J. Bot. 92, 2086–2100.
Tang, W., Sederoff, R. and Whetten, R. (2001) Regeneration of transgenic loblolly pine (Pinus taeda L.) from zygotic embryos transformed with Agrobacterium tumefaciens. Planta 213, 981–989.
Towers, M., Browne, T., Kerekes, R., Paris, J. and Tran, H. (2007) Biorefinery opportunities for the Canadian pulp and paper industry. Pulp Pap-Canada 108, 26–29.
Tufts, R., Landford, B., Greene, W. and Burrows, J. (1985) Auburn harvesting analyzer – a spreadsheet template to analyze balance, production rates, and costs. The Compl. 3, 14–15.
Van Heiningen, A. (2006) Converting a kraft pulp mill into an integrated forest biorefinery. Pulp Pap-Canada 107, 38–43.
Vergara, R., White, T. L., Huber, D. A. and Schmidt, R. A. (2007) Realized genetic gains of rust resistant selections of slash pine (Pinus elliottii var. elliottii) planted in high rust haz-ard sites. Silvae Genet. 56, 231–242.
Vergara, R., White, T. L., Huber, D. A., Shiver, B. D. and Rockwood, D. L. (2004) Estimated realized gains for first-generation slash pine (Pinus elliottii var. elliottii) tree improve-ment in the southeastern United States. Can. J. For. Res. 34, 2587–2600.
Wakeley, P. C. (1954) Planting the Southern Pines, U.S. Department of Agriculture Forest Service, Washington DC, p. 233.
Wear, D. and Greis, J. (2002) Southern forest resource assessment. In U.S. For. Serv. Gen. Tech. Rep. Asheville, NC, p. 635.
White, T., Adams, W. T. and Neale, D. B. (2007) Forest Genetics, CABI Publishing, Cam-bridge, MA, USA, p. 682.


Southern Pines a Resource for Bioenergy 419
White, T. L., Hodge, G. R. and Powell, G. L. (1993) An advanced-generation tree improve-ment plan for slash pine in the Southeastern United-States. Silvae Genet. 42, 359–371.
Williams, C. G. and Megraw, R. A. (1994) Juvenile mature relationships for wood density in Pinus taeda. Can. J. For. Res. 24, 714–722.
Williams, C. G. and Savolainen, O. (1996) Inbreeding depression in conifers: Implications for breeding strategy. For. Sci. 42, 102–117.

List of Abbreviations
*indicates standard unit according to the système international (SI). Multiples of a thousand are written with a comma prior to the last three digits, as in 16,000 (sixteen thousand).
Abbreviation Explanation bp basepair Length unit for DNA cv. cultivar Gb, Gbp gigabasepair 109 bp Gt Gigatonne 1012 kg GW GigaWatt 109 Watt; see definition of Watt h hour ha hectare 10,000 m2 J* Joule unit of energy. 1J = 1 kg m s-2 kb, kbp kilobasepair 1,000 bp kDa kiloDalton 103 atomic mass units kg* kilogram SI unit of mass l* liter SI unit of volume m meter SI unit of length Mb, Mbp Megabasepair 106 bp Mg Megagram 1 metric tonne; 1,000 kg MT Million tonne 109 kg
ppm parts per million unit of concentration s* second SI unit of time sp. species (singular) spp. species (plural) ssp. subspecies TW TeraWatt 1012 Watt; see definition of Watt var. variety W Watt unit of power (rate of energy generation or use).
1W = 1 J s–1 yr year
Pa* Pascal SI unit of pressure. 1 Pa = 1 N m-2

Index
A. hallii Hack, 318 Abbey, C., 227 Abrahamson L.P., 349, 352, 355, 359 Adams, M.D., 76 Aden, A., 188 Aden, A.M.R., 197 Adger, N., 43 Adney, W.S., 150, 166, 176, 192 Aeschabacher, R.A., 149 Aggarwal, P., 43 Agonoscelis pubescens, 219 Agrama, H., 219 Agrawala, S., 43 Aharoni, A., 235 Aitken, E.A.B., 221 Aitken, K.S., 267 Ajayi, O., 219 Akiyama, T., 147 Alam, S., 230 Alamo switchgrass, 323 Albaugh, T.J., 401 Albersheim, P., 128, 131 Albertson, M.C., 73 Alcamo, J., 43 Aldrich, H.C., 184 Alen, R., 387 Aletti, E., 123 Alexander, A.G., 258, 264 Alfalfa (Medicago sativa L.), 310
cross-pollination, 314–315 cultivation and harvesting, 314 description of, 313
genetic maps of, 315–316 lifespan of, 314
Alfenore, S., 104 Ali, A., 230 Aliopus simulatrix, 218 Alizadeh, H., 166, 189 Allali, A., 43 Alleles, 48 Allen, H.L., 401 Allmaras, R.R., 56 Alloploids, 45 Alonso, A.P., 135 Alper, H., 104, 195 Al-Rabab’ah, M. A., 407 Alternative energy, 4–5, 19
and global carbon emissions, 19–24 political and economic motivations for
usage of, 24–26 world usage, 26–29
Altman, W.E., 76 Alves, A., 169 Alves, V.M.C., 235 Ambros, V., 68 Amidon, T.E., 404, 405 Ammonia fiber/freeze expansion (AFEX)
process, 167, 168 Amor, Y., 123 Amorim, D.S. 193 Amplified fragment length polymorphism
(AFLP®) markers, 53–54 Amrhein, N., 139 Anderlund,M., 194

424 Index Anderson, P., 134 Anderson, S., 227 Andersson-Gunneras, S., 146 Andrews, D., 238 Andropogon gerardii Vitman), 318–319 Antal, M.J., 187 Antherigona soccata, 218 Anthracnose Anthracnose tip blight on willow,
220, 353 Antonise, R., 76 Aphid, 219 Apierre, C., 150 Appenzeller, L., 150 Apperley, D.C., 119, 120 Arabidopsis, 111, 113, 121, 124 Arabinogalactan proteins (AGPs), 126 Arabino-XyGs, 104 Arabinoxylans, 104 Arai, K., 198 Arai, M., 198 Ardlie, K., 76 Aries, R., 170 Arioli, T., 121 Arnall, D.B., 230 Arnheim, N., 71 Arrowsmith, D.A., 137 Arshad, M., 230 Arun, S.S., 220 Asada, K., 137 Ashford, D.A., 143 Aspen, 120 Atalla, R.H., 147 AtCslA genes, 112 AtFUT1 gene, 114 Attiya, S., 76 Atwood, R. A., 412 Aubert, J.P., 190 Auer, M., 123 Ausubel, F., 74 Autoploids, 45 AXS genes 111 Axtell, J.D., 226, 237 Ayyangar, 237 Ayyangar, G.N.R., 214 Bachem, C.W.B., 83 Bacher, A., 80 Bacic, A., 134 Bacillus thuringiensis (Bt) proteins, 193 Backcross method, 67
Bacovsky, D., 50 Bader, J.S., 76 Bahiagrass, 310 Bai, G.H., 399 Baker, J.O., 192 Baldwin, J., 76 Bandyopadhyay, R., 221 Bantilan, M.C.S., 226 Bao, W., 143 Bao, X., 194 Barabas, Z., 214 Barber, C., 133 Barley Yellow Dwarf Virus (BYDV) in
Miscanthus, 290 Barnes, P., 60 Bar-Peled, M., 132, 135 Barr, B.K., 176 Barratt, D.H.P., 123 Barreiro, R., 134 Barriere, Y., 144, 150 Barrowsbroaddus, J.B., 401 Bartel, B., 68 Bartel, D.P., 68 Basin wild rye, 316 Baskin, T.I., 121, 150 Bassam, B.J., 74 Bassoni, D.L., 407, 413 Bastiaans, E., 76 Bastress, K.L., 142 Batie, J., 105 Battistelli, A., 233 Battraw, M., 226 Baucher, M., 147 Bauer,S., 129, 148 Baulcombe, D.C., 68 Baumhardt, R.L., 216 Bayrock, D.P. I., 102 Bean, S.R., 98, 99, 104, 105, 236 Becnel, J., 138 Bedinger, P., 148 Beeharry, R.P., 259 Beerling, D, J., 37 Beery, K.E., 197 Beguin, P., 190 Behringer, F.J., 80 Beier, D.R., 75 Bejosano, F.P., 220 Bellmer, D., 223 Belyea, R.L., 103, 105 Benfey, P.N., 149, 150 Bennetzen, J.L., 227

Index 425 Beraho, E.K., 226 Berding, N., 265, 267 Berhan, A.M., 227 Bermudagrass, 310
description of, 320–322 hybrid cultivars, 322–323 yields of, 324
Bernal, A.J., 135 Berrio-Sierra, J., 146 Betzner, A.S., 121 Beuker, E., 387 BFPD program, 306 Bhat, S.R., 255 Bhattramakki, D., 227 Bibb Swain, R.L., 103 Bideaux, C., 104 Bieniawska, Z., 123 Big bluestem, 318–319
biomass production of, 319 genetic diversity of, 319–320
Biliaderis, C.G., 126 Binder, A., 146 Binder, A., 237 Bingham, M.J., 198 Biochem, J., 121 Bioenergy, 9–11
concerns about net CO2 emissions, 34–35 food and fuel, 31–32 negative net energy balance, 31–32 soil depletion, 33–34
oil companies and car manufacturers, 29–31
See also Energy sources Biofuel feedstocks from photosynthate
biosynthesis, 18–19 Biofuels, 35–36 Biomass feedstocks
cellulose hydrolysis in, 156–157 enzyme accessibility in, 154–155 qualitative data analysis, 146–148 See also Bioenergy
Birch, R., 121 Birch, R.J., 123 Birolleau-Touchard, C., 144 Birren, B., 76 Bito, Y., 104 Bittinger, T.S., 237 Bitzer, M.J., 217 Black willow aphid, 354 Blakeley, S.D., 41
Blanc, E., 135 Blancaflor, E.B., 235 Blaukopf, C., 135 Blecker, D., 148 Bleecker, A.B., 150 Bleeker, M., 75 Blissus leucopterus, 218 Blount, J.W., 139 Blowers, A.D., 226 Blue bug, 219 Blum, A., 234 Bodénes, C., 75 Boerjan, W., 131, 142, 145–147 Bogo, A., 221 Bohlmann, J., 80, 369, 378, 388 Boivin, K., 227 Bolam, D.N., 191 Bolsen, K.K., 221 Bolter, I., 50 Bonin, C.P., 131 Booker, F., 142 Boon, J., 237 Boon, J.J., 146, 170 Boora, K.S., 220 Boraston, A.B., 191 Borderies, G., 139 Borém, A., 235 Borges, A.C.C., 184 Borner, G.H.H., 150 Borovkova, I.G., 221 Borrell, A., 235 Bosio, M., 150 Bothast, R.J., 99, 100, 105 Botstein, D., 73 Boudet, A., 139 Boudet, A.M., 127, 139, 141, 144–146, 166 Boudonck, K., 135 Bourett, T.M., 150 Bout, S., 74, 237 Bowers, J.E., 227 Bowles, D.J., 143 Braam, J., 137–138 Brady, J.W., 150 Brady, S.M., 150 Brainard, A.P., 194 Bramel-Cox, P.J., 220 Brau, B., 196 Brazilian Alcohol Program
(PROALCOOL), 258 Breaux, R.D., 252, 263, 265 Bremer, G., 255

426 Index Bremer, J., 170 Bremer, V., 48 Brenner, S., 76 Brereton, R.G., 167 Breslow, R., 198 Bressan, R.A., 227 Brewer, M., 188 Bridgham, J., 76 Briggs, S.P., 80 Brininstool, G., 129, 148 Bro, R. 169 Broeckling, C.D., 235 Brooks, W.S., 101 brown midrib3 mutation, 198, 200 Brown, D.M., 135 Brown, G. R., 407, 413 Brown, J.S., 250 Brown, Jr., R.M., 120 Brown, P.O., 83 Brown, T.A., 122 Brownell, H.H., Yu, E.K.C., 187 Browse, J., 41 Brumbley, S.M., 221, 237 Brün, S., 80 Brunow, G., 127, 145, 147 Buchanan, C.M., 106 Buchanan, N.L., 106 Bulk method, 65 Bulone, V., 121 Bungay, H.R., 189 Bunzel, M., 146 Burget, E.G., 133 Burlat, V., 147 Burn, J., 121 Burn, J.E., 123 Burr, B., 73 Burr, F.A., 73 Burton, R., 170 Burton, R.A., 134 Bush, G.W., 49 Busson, R., 146 Butler, L.G., 227 Butler, L.J., 226 C3 Carbon fixation cycle, 12–13 C3 Photosynthesis, 12, 14
NAD+-Malic enzyme, 16–17 NADP+-Malic enzyme, 15–16C4 Kranz
photosynthetic plant type, corn, 189–190
CAD -gene family, 120
Caetano-Anollés, G., 74 Caffeic acid O- methyl transferase
(COMT), 119 Caffeoyl-CoA O-methyltransferase
(CCoA-OMT), 119 Cai, Q., 267 Cai, T., 226, 227 Caizzi, A., 45 Caldwell, K.S., 76 Calidea dregii, 219 Cameleyre, X., 104 Camilleri, C., 121 Campargue, C., 139 Campbell, C.J., 183 Campbell, J.A., 121 Campbell, L.R., 219 Campbell, M., 75, 122 Campbell, M.M., 139, 142 Canadell, J.G., 43 Canadian Treenomix project, 129 Candida shehatae, 171 Caniato, F.F., 235 Canovas, F.M., 75 Cantrell, R.P., 237 Caparrós-Ruiz, D., 144 Capellades,M., 141 Caplan, J., 136 Carbohydrate
L/D-nomenclature, 92 +/–-nomenclature, 91 R, S-nomenclature, 92–95
β-Carboline alkaloids and livestock, 312 Carmichael, G.G., 70 Carnachan, S.M., 146 Carpita, N.C., 127, 135, 136, 148, 149, 150,
166, 184 Carraway, D.T., 141 Carroll, A., 123 Carson, I., 45 Casas, A.M., 227 Casey, G.P., 104 Cassab, G.I., 148 Cassman, K.G., 48, 58 Casu, R.E., 221 Causey, T.B., 184 Causse,M., 81 Cavalier, D.M., 136, 198 CAZy database, 128 CCoA-OMT gene, 119 CCR. See Cinnamoyl CoA reductase Cell Wall Genomics site, 129 Cell Wall Navigator database, 128

Index 427 cellulose synthase-like (Csl) genes, 112 Cellulose
biosynthesis, 98–102 structure of, 96–98
Cercospora zeaemaydis, 193 Cervantes-Martinez, C.T., 85 Chabannes, M., 144 Chaetosorghum, 225 Chaitophorus viminalis Monell, 354 Chalhoub, B.A., 75 Chamayou, S., 144 Chambost, V., 397, 404 Chandrashekar, A., 220 Chang, C., 227 Chang, H.M., 169 Chang, M., 126 Chang, V.S., 186, 223 Chanzy, H., 119 Chapple, C. Chapple, C.C.S., 80, 130, 139, 141–142, 145 Charles, N., 223 Chase, C.D., 227 Chau, H.K., 106 Chaudhary, K., 220 Chen, H., 123 Chen, J.W., 399 Chen, M., 149 Chen, W., 105 Chen, X.W., 267 Chen, Z.D., 194 Cheng, M., 166 Cheng, X.F., 141, 144 Chengappa, S., 137 Chhabra, A.K., 227 Chiang, V.L., 141, 144, 169, 199 Chibbar, R.N., 98 Chikwamba, R., 227 Chin, E.C.L., 75 Chinese Sorghum Germplasm diversity
collection, 226 Ching, A., 76, 150 Chino, M., 235 Chisi, M., 220 Chittenden, L.M., 227 Cho, H.T., 148 Chomet, P., 80 Choo, T.S., 170 Christensen, J.H., 142, 145 Chromosomes in somatic cells, 45 Chrysomelid beetles, 353 Chu, Z., 123
Chung, H., 33 Ciais, P., 43 Cinnamoyl CoA reductase, 392 Cinnamoyl-CoA NADP oxidoreductase, 117 Cinnamyl alcohol dehydrogenase, 119 Civardi, L., 144 Claflin, L., 227 Claflin, L.E., 220, 221 Clastre, M., 139 Claviceps africana, 221 Cleaved amplified polymorphic sequences
(CAPS), 52 Clonal cultivars, 69 Clovers, 310 Cluster bug, 219 Cnops, G., 135 CO2 global emissions, 20 Coal, 5 Coastal bermudagrass, 324–326 Coastcross-1 bermudagrass, 324–326 Cobill, R., 221 Cobra-like (Cobl) genes, 128 Cocuron, J.C., 135 Coffman, C.J., 86 Cohen, D.I., 82 Colbert, S.R., 401 Coleman, H.D., 123 Colletotricum graminicola, 220 Collins, S.D., 220 Collins, T., 192 Comstock, J.C., 237 COMT gene, 119 Congdon, W.I., 198 Coniferaldehyde, 119 Coniferyl aldehyde/coniferyl alcohol
5-hydroxylase, 119, 392 Constanza, P., 60 Converse, A., 166 Coombs, J., 253 Copulos, M.R., 59 Cordero Otero, R.R., 194 Cork, A., 121 Cork, A.C., 123 Corn
anatomy of, 186–187 biomass processing, 195–196 biomass yield potential, 193–195 cultivation, 191–193 genetic improvement, 185 genetic variation, 198–201 genome structure and organization, 190–191

428 Index
kernels enzymatic milling (E-milling), 82 hybrids, 83 Quick Germ and Quick Germ-Quick
Fiber processes, 81 wet milling and dry grind process, 78
origin and habitat, 187–188 phenotypic selection, 196 pistillate inflorescence of, 186 reproduction and biology, 188–190 stover
and grain yield, 194 as source of biomass, 196–198
Cornelius, J., 407 Corredor, D.Y., 104 Cosgrove, D.J., 148 Costa, M.A., 99, 147, 196 Cottonwood leaf beetle, 382–383 coumarate Coenzyme A lyase (4CL),
413–414 p-Coumaric acid, 117 Cousin, R., 75 Coutinho, P.M., 135, 150 Cox, C., 100 Craig, J.A., 105 Crasta, O.R., 235 Crowell, E., 149 Crown gall disease on willow, 353 Cryptorhynchus lapathi L., 354 (Crysomela scripta), 382–383 Cuenya, I., 263 Curtis, D.L., 230 Cushman, J.H., 183 Cusumano, J.C., 80, 141 Cutler, S., 121 Cynodon genus, 321 D’Amore, T., 104 da Silva, J., 237 Dahlberg, J.A., 99, 221, 225, 228 Dahlgren G., 125 Dahlman, O., 128–129, 170 Dailey, O.D., Jr., 100 Dale, B., 188, 190 Dale, B.E., 166, 184, 188–190 Daly, M., 76 Dang, L.H., 227 Daniel, G., 166 Danoun, S., 144 Darley, C.P., 130 Darvill, A.G., 128, 131, 136
Das, I.K., 220 Dauwe, R., 146 Davey, M.W., 131 David,H., 75 Davies, B., 79 Davies, G.J., 121, 135, 191 Davin, L.B., 147 Davis, G.W., 58 Davis, K.R., 126 Davis, M., 170 Davis, M.F., 82, 166, 176, 386, 389, 407, 413 Davis, R.W., 73, 83 Davison, B.H., 166 Dawid,I. B., 82 de Angelis, F., 170 de Block, S., 135 de Bruijn, S.M., 83 de Leeuw, J.W., 170 de Leo, G.A., 45 de Rycke, R., 146 Dean, J.F.D., 143 Dean, R., 220, 221 Deanda, K., 184 Deb, U.K., 226 Debenham, J.S., 106 Decker, S.R., 192 Deikman J., 235 Deka, G.C., 146 Del Rio, J.C., 170 Delaney, T.P., 75 Deleury, E., 135 Delmer, D.P., 120, 122–123 Demol, H., 131 Denault, J.W., 141–142 Deng, H.H., 267 Dennis, D.T., 41 Denton, F.R., 147 Deoxyadenosinetriphosphate, 44 DeRocher,A.E., 135 DeSalle, R., 150 Desnos, T., 123 Desprez, T., 122, 149 Deswarte, C., 150 Deu, M., 227 Devos, K.M., 227 Dhillon, M.K., 219 Dhingra, S.S., 197 D’Hont, A., 237 Dhugga, K.S., 122, 130, 150 Di Tullio, A., 170 Diabrotica spp., 218

Index 429 Diatraea spp., 218 Dien, B.S., 99, 100, 188, 196 Diet, A., 133 Dieters, M.J., 407 DiFazio, S.P., 80, 369, 378, 386, 388, 389 Dinauer, M.C., 82 Ding, S.Y., 119, 150 Ding, Y., 51 Dinkova-Kostova, A.T., 147 Divne, C., 191 Dixit, S., 235 Dixon, R.A., 139 DNA
double-stranded helical structure, 45 polymerase, 49 sequence variation in, 47–48
Doblin, M., 122–123 Doerge, R.W., 86 DOE-USDA biomass genomics research
program, 306 Doggett, H., 212, 215–218, 230, 232 Dolan, L., 133, 135 Dolan, M., 76, 134 Doll, J. D., 217 Doner, L.W., 106 Dong, F., 56 Dong, J., 227 Doran, J., 56 Dougherty, P.M., 401 Douglas, S.L., 250 Dowd, M.K., 100 Downes, R.W., 233 Downy mildew Drakakai, G., 135 Draude, K.M., 166, 223 Draye, X., 227 Drenth, J., 221 Drescher, S.R., 166 Dreshel, R., 188 Driguez, H., 190 Driver pool, 60 Duchesne, I., 166 Dudley, B.J., 132 Dudzinski, D.M., 148 Duff, S.J.B., 166, 223 Dugas, D.V., 68 Duguin, J.L., 82 Dunand, C., 136 Dunn-Coleman, N., 104 Dunwoody, D.C., 33 Dupont, L.M., 170
Dupree, P., 150 Durachko, D.M., 148 Dvorak, W.S., 398 Dwarfing (Dw) genes for height in
sorghum, 231 Dwinell, L.D., 401 Dyck, K., 197 Eamer, B., 397, 404 Earle, E.D., 226 Easter, J.M., 189 Eastern gamagrass (Tripsicum dactyloides L.)
description of, 333 genetic variability of, 334–335 planting of, 334
Eastern tent caterpillars, 354 Ebringerová, A., 126 Eckermann, N., 133 Eckhoff, S.R., 106 Eddy, C., 184 Egholm, M., 76 Ehrman, C.I., 166, 192 Eijkel, G.B., 170, 172 Eisenreich,W., 80 Ejeta, G., 233, 237 Ekanayake, I.J., 234 Elander, R.T., 184, 188, 190, 192198 Ellis, D.D., 75, 123 Ellis, J., 135 Elobeid, A., 56 Emmett, B., 166 Empoasca fabae Harris, 354 Energy sources, 3–4
bioenergy, 9–11 coal, 5 geothermal energy, 9 hydroelectric energy, 7 natural gas, 6 nuclear energy, 6–7 oil, 5–6 solar energy, 7–8 tidal energy, 8–9 wave energy, 9 wind energy, 8
Engelsen, S.B., 169 Entner-Doudoroff pathway, 173–174 Erbach,D., 59 Erban, A., 146 Ergot, 221 Erickson, G., 48 Eriksson, K.-E.L., 143

430 Index Eriochrysis P. Beauv., 274 Eriophyoid mites, 354 Erlich, H.A., 71 Ernst, D., 142 Erpelding, J., 221 Erpelding, J.E., 220, 221 Escherichia coli, 174 Eshed, R., 122 Esquivel, V.M., 189 Ethanol as fuel, 36–37 Ethanol production
bermudagrass and switchgrass role in, 326 Escherichia coli by, 174 grain from
biochemical conversion technologies and, 176–177
DDGS production and, 83 distillation and dehydration, 175 fermentation processes, 75–76 non-starch polymers conversion, 84 recovery of, 80–81 Saccharomyces cerevisiae by, 80,
171–173 stillage processing, 80–81 wet mill and dry grind processes of, 77
Lignocellulosic plant biomass from, 161–163
Zymomonas mobilis by, 173–174 Eucalyptus globulus, 387 Eudes, A., 142 Eulalia Kunth, 274 Eulaliopsis Honda, 274 Eun, M.Y., 135 Evans, R.J., 170 Evenson, R.E., 226 Expansins, 126 EXPB genes, 126 Exserohilum turcicum, 193 Facette, M., 129, 148 Fagard, M., 122, 123 Faik, A., 135–136 Faix, O., 170 Fakrudin, B.S., 220 Fall webworm, 354 Faloona, F., 71 False chinch, 219 Fan, J.B., 76 Fanutti, C., 137 Fargione, J., 56 Farkas, V., 137
Farrell, A.E., 55 Favery, B., 135 Faye, L., 170 Fehr, W.R., 84, 230 Fehrie, I., 146 Feinbaum, R.L. 68 Felle, G., 192 Fernandez, A.G., 150 Fernie, A.R., 123 Ferulic acid 5-hydroxylase (F5H), 119 Ferulic acid biosynthesis, 120 Feruloyl-CoA, 119 Festuca arundinacea Schreb., 306, 309 Fidalgo, M.L., 170 Fincher, G.B., 134 Findlay, K., 133 Fink, G.R., 104 Finkeistein, M., 184 Fishman, M.L., 106 Flores, R.A., 101 Foliar diseases of sorghum, 221 Folkertsma, R., 219 Fontana, J.R., 407, 413 Forage grasses, 309 Forage sorghums, 222 Foreman, J., 135 Forest tent 354 Fornalé, S., 144 Forrester, A.M., 130 Forster, B., 146 Fortmann, I., 170 Fossil fuels, 4 Foster, B., 237 Foust, T.D. 150 Fox, T.R., 401 Franke, R., 141, 145 Frederiksen, R.A., 212, 215, 218, 220–221,
227, 230 Freeland, S.B., 105 Freeman, K.W., 230 Freidrich, L., 75 Freudenberg, K., 147 Frey, M., 80 Frigerio, J-M., 75 Frijters, A., 75 Frisvad, J.C., 170 Fritz, J.O., 221 Fritz, R.S., 221 Fromanger, R., 195 Fry, S.C., 127, 132, 137, 149 Fu, C., 267

Index 431 Fu, Z., 149 Fuco-galacto-xyloglucan, 103–104 Fujita, M., 147, 150 Fujita, Y., 104, 198 Fukuda, H., 104, 198 Fukushima, K., 144 Funnell, D.L., 220 Furbank, R.T., 123 Fusarium, fungal pathogens, 289 Fusilade (fluazifop-P-butyl) herbicide, 352 GAE genes, 111 Galactoglucomannans, 106–107 Galbe, M., 106, 198 Gale, M.D., 227 Gallardo, F., 75 Galletti, G.C., 170 Galvez, A., 104 Gamble, G., 143 Ganem, B., 176 Gang, D.R., 147 Gao, H.J., 191 Gao, P.J., 191 Gao, Z.S., 227 Gardiner, E., 383 Gardonyi, M., 194 Garlick, A.P., 123 Garrity, D.P., 234 Gatto, M., 45 GDP-4-keto-6-deoxy-D-mannose 3,
5-epimerase-4-reductase, 109 GDP-D mannose-4, 6-dehydratase, 109 GDP-D-mannose pyrophosphorylase, 108 Gelvin, S.B., 79 Gene identification and isolation
candidate-gene approach, 59 and differential gene expression, 59
cDNA-AFLP®, 61 differential display, 60 high-throughput cDNA sequencing,
61–62 microarrays, 61 subtractive hybridization, 60
and genetic maps, 54–56 genetic variation, 47–48 insertional mutagenesis, 57–58 map-based cloning strategies, 58–59 mutant isolation, 56 transcription, 46
Geoffroy, P., 141 Geothermal energy, 9
See also Energy sources Gerday, C., 192 Germplasm Resource Information Network
(GRIN), 225 Gerngross, T.U., 186 Geshi, N., 138 Giant willow aphid, 354 Gibberellin 2-oxidase (GA 2-oxidase), 392 Gibeaut, D.M., 127, 149 Gidley, M.J., 137 Gidman, E., 166 Gierl, A., 80 Gilbert, H.J., 191 Gilbert, M., 123 Gill, B.S., 227 Gill, G.P., 407, 413 Gill, S.S., 255 Gingeras, T., 76 Girke, T., 150 Girma, K., 230 Glaszmann, J.C., 237 Glawischnig, E., 80 Gledew, W.M., 102 Global warming, 21 Glover, J., 121 Glucomannans, 106–107 Glucuronoarabinoxylans (GAXs), 105–106 Glycine-rich proteins (GRPs), 126 Glynn, C., 369 Godwin, I., 227 Godwin, I.D., 221 Goeman, J.L., 146 Goeminne, G., 146 Goepfert, S., 141 Goetz, J., 188 Goffner, D., 139, 141, 144, 150 Gogel, B.J., 221 Golda, G., 76 Goldstein, I.S., 189 Gonneau, M., 149 Gonzalez, A.E., 170 Gonzalez-Vila, F.J., 170 Goodacre, R., 135, 166, 170 Goodell, B., 170 Gore, A., 43 Gorwa-Grauslund, M.F., 106, 195 Goubet, F., 122 Goud, J.V., 221 Goujon, T., 142 Gowda, C.L.L., 226 Gowda, P.S.B., 221

432 Index Grabber, J.H., 142, 146–147 Graca, J., 170 Graham, R., 59 Gramene website, 227 Gramine (3-(dimethylamino
methyl)-indole), 312 Granier, F., 142 grassy tiller1 (gt1), 200–201 Grattapaglia, D., 74 Greenbug aphid, 218 Greene, D., 216 Greenhouse gases, 20 Greenwood, P.F., 170 Gregg, J., 51 Grenier, C., 233 Gresshoff, P.M., 74 Grethlein, H., 166 Grey leaf spot, 221 Griffey, C.A., 101 Grigoiev, I., 80 Grigoriev, I., 369, 378, 388 Grima-Pettenati, J., 141, 146 Grimson, M.J., 123 Guan, S.-Y., 147 Guanidine diphosphate-D-mannose, 108 Guillaumie, S., 150 Guillet-Claude, C., 144 Guillon, F., 126 Guillouet, S.B., 104 Guimarães, C. T., 235 Gullberg, U., 362 Gunter, L.E., 386, 389 Guthrie, E.A., 170 Gutierrez, A., 170 Gutteridge, C.S., 170 Gwynn-Jones, D., 166 gynomonecious sex form 1 (gsf1), 335 Gypsy moth, 354 Ha, M.A., 120 Ha, T.T., 106 Haan, T.G., 227 Haapanen, M., 387 Häger, K.-P., 142 Hagio, T., 226 Hahn, D.T., 233 Hahn, M.G., 131 Hahn-Hägerdal, B., 187, 194–195 Haigler, C.H., 123 Hall, T.C., 226 Hallauer, A.R., 84
Hamann, T., 129, 148 Hamilton, A.J., 68 Hamon, P., 227 Han, B., 149 Han, C.D., 135 Hankamer,B., 32 Hanna, R., 137 Hara, E., 82 Harding, S.A., 135, 141, 199 Harholt, J., 135, 138 Harkin, J.M., 143 Harper, A.D., 132 Harris, K., 235 Harris, P.J., 146 Hart, G.E., 227 Hartley, R.D., 170 Harvey, A.J., 134 Hasegawa, P.M., 227 Hash, C.T., 219 Hatcher, P.G., 170 Hatfield, J.L., 56 Hatfield, R.D., 127, 142, 145–147, 199 Hauser, M.T., 149 Haverhals, L., 33 Haverkamp, J., 170 Hawken, P., Orr, D., 60 Hawkins, S., 141 Hawthorne, P., 56 Hayashi, K., 75, 166 Hazebroek, J., 134 Hazen, S.P., 122 He,L.-F., 144 Hehn, A., 141 Heimlich, R., 56 Heinze, T., 126 Helbert, W., 121 Helentjaris, T., 122 Helm, R.F., 147 Hemicellulose, 102
biosynthesis of, 107–116 mannans, 106–107 xylans, 104–106 xyloglucans (XyGs), 103–104
Hemm, M.R., 141, 145 Hendricks, S.M., 82 Hendrickson, R., 188 Henk, L.L., 188 Henrissat, B., 121, 135, 150, 190 Herbage feeders, 299 Herdewijn, P., 146 Hermann, S.M., 221

Index 433 Herrmann, K.M., 139 Herth, W., 121 Hess, D.E., 220 Heterosorghum, 225 Hexaploids, 45 Hicks, K.B. 106 Hicks, K.B., 101, 106 Higgins, J.J., 221 High-throughput cDNA sequencing, 61–62 Higuchi, T., 143, 166 Hileman, F., 170 Hill, J., 56 Himmel, M.E., 119, 166, 176, 183, 192 Himmelsbach, D.S., 143 Himmelspach, R., 150 Hirochika, H., 122 Hirschhorn, J.N., 76 His, I., 119 Ho, N., 188 Ho, N.W.Y., 194 Hocart, C.H., 123 Hodge, G.P., 398 Hodge, G.R., 378, 407 Hodnett, D.L., 225 Hoekenga, O.A., 235 Hoffmann, L., 141 Hoffmann-Benning, S., 148 Hoffmann-Thoma, 238 Höfte, H., 75, 121–123, 149 Hogers,R., 75 Hoggart, R., 121 Holden, D.J., 226 Holland, D., 122 Holland, J.B., 85 Holland, N., 122 Holley, A.G., 399 Holtzapple, M.T., 184, 186, 188, 190, 223 Homogalacturonan (HGA), 116 Homologs, 48 Homozeugus Stapf., 274 Homs, N., 33 Hondred, D., 227 Hoover, J., 221 Hoppe, A.H., 227 Horn, G.T., 71 Hornes, M., 75 Houghton, R.A., 56 Howard, R.J., 150 Howells, R.M., 122 Howes, P.A., 139 Hrmova, M., 134
Hsieh, Y.L., 176 Hu, W.J., 199 Huang, J., 128 Huang, Y.H., 399 Huber, D.A., 411 Hucle, P., 98 Hudson, A., 79 Hudson,T.J., 76 Huhnke, R., 223 Hulbert, S.H., 227 Hull, S.R., 100 Hult, E., 166 Humphreys, J.M., 139, 141 Hunter, C.T., 150 Hurme, P., 75 Huttly, A.K., 122 Huxley, H., 142 Hydroelectric energy, 7
See also Energy sources Hydroxycinnamic acids, 117 Hydroxycinnamoyl-CoA shikimate/quinate
hydroxy-cinnamoyl transferase, 119 5-Hydroxyconiferyl alcohol, 119 5-Hydroxyconiferyl aldehyde, 119 Hydroxyproline-rich glycoproteins
(HRGPs), 126 Hyphantria cunea Drury, 354 Hynes, S.H., 101, 102, 104 Iap (inhibition of alien pollen) gene, 225 Ibach, R. 170 Ibsen, K., 45, 197 Ichon, M., 150 ICRISAT, 225 Il, B., 135 Imai,T., 121 Imperata Cyr., 274 Ingledew, W.M., 98, 101, 102, 104 Ingram, L.O., 184 irregular xylem mutants, 114 Irwin, D.C., 166 Ise, N., 198 Ishida, Y., 170 Ishihara, M., 166 Ishizawa, C., 176 Ishizu, A., 147 Ito, J., 198 Itoh, T., 127, 166 Iversen, T., 166 Izumi, A., 170 Izydorczyk, M.S., 126

434 Index Jackson, P.A., 267 Jackson, R., 143 Jacobs, A., 129, 170 Jacobs, M., 227 Jacobsen, S., 169 Jacob-Wilk, D., 122 Jansson, S., 80, 369, 378, 388 Japanese beetle, 353 Jarman, C.D., 137 Jarvis, M.C., 119, 120 Jauneau, A., 144 Jaworski, J.G., 41 Jayaraj, J., 220, 227 Jechura, J., 197 Jeffries, T.W., 196 Jegadeeswari, D., 235 Jellison, J., 170 Jensen, K.J., 135 Jensen, J.K., 138 Jeoh, T., 176 Jeoung, J., 220 Jeoung, J.M., 226, 227 Jeppsson, H., 194 Jesse, T., 75 Jessen, H., 105 Jessup, R., 227 Jetter, R., 235 Jiang, J., 227 Jifon, J., 237 Jigami, Y., 133 Jin, Y., 221 Jin, Y.S., 195 Johal, G., 149 Johansen, B., 135 Johnson, D.K., 176 Johnson, J., 75 Johnson, J.M.F., 56 Johnson, L.A., 99 Johnson, M., 76 Johnson, S., 123 Johnsongrass Mosaic Virus, 220 Johnston, D., 101, 106 Johnston, D.B., 101, 106, 197 Jokela, E.J., 401 Joly, R.J., 233 Jones, A.D., 55 Jones, E., 142 Jones, E.W., 69 Jones, T.A., 190, 191 Jones-Rhoades, M.W., 68 Joouanin, L., 142
Jordan, D., 235 Jordan, D.R., 221 Jordon, A.P., 398 Jorge, J.A., 193 Joseleau, J.-P., 146 Joshi, C.P., 141 Jouanin, L., 142, 145, 146 Jouy, H., 149 Jung, H.G., 139 Jung, M., 76 Juraniec, M., 149 Jurich, C.K., 170 Kaderbhai, N., 170 Kadla, J.F., 169 Kajita, S., 144 Kajjari, N.B., 221 Kaminski, A.R., 217 Kammen1, D.M., 55 Kang, K.-Y., 146 Karhumaa, K., 195 Karim, M.N., 188 Karkalas, J., 101 Kärkönen, A., 132 Karlen, D.L., 56 Karper, R.E., 214, 230, 232 Katakura, Y., 104, 144 Katerji, N., 233 Kato, I., 137 Kato, T., 82 Kato, Y., 127 Kawagoe, Y., 120, 122 Kawaguchi, T., 198 Kawai, S., 144, 166 Keating, B.A., 223 Keegstra, K. 134, 198–136, 150 Kell, D.B., 170 Kelley, S.S., 170 Kelling, K.A., 217 Kelsall, D.R., 99 Kenney, D., 48 Khaw, T.S., 104 Khitrov, N., 123 Kidner, C.A., 68 Kiefer, H.C., 198 Kim, C.M., 135 Kim, H., 145 Kim, H., 145, 146, 166 Kim, J.S., 189 King, J.S., 401 Kinkima, M., 105

Index 435 Kinney, A.J., 134 Kipp, A., 138 Kirby, A.J., 198 Kirkham, M.B., 219 Kistemaker, P.G., 170 Kitamura, S., 127 Klein, P.E., 220, 227, 235 Klein, R.R., 220, 227, 235 Klepper, G., 43 Klopfenstein, G., 48 Klotz, I.M., 198 Knappert, D., 166 Kneusel, R.E., 141 Knight, D., 221 Knipple, D.C., 104 Koch, K.E., 150 Kochian, L.V., 235 Koelsch, R., 48 Kofoid, K.D., 219 Koh, J., 104 Kohlmann, K., 186 Kondo, A., 104, 198 Konieczny, A., 74 Konieczny-Janda, G., 101 Kononowicz, A.K., 227 Kopka, J., 146 Koyama, M., 121 Krekel,F., 139 Kremer, A., 75 Kresge, C.T., 197 Kresovich, S., 227 Kress, L.W., 401 Krishnasamy, R., 235 Krishnaveni, S., 220, 226, 227 Kruger, N.J., 123 Kruse, O., 32 Kubelik, A.R., 74 Kuhlman, E.G., 401 Kuhn, D.N., 250 Kuiper, M., 75, 76 Kundiyana, D., 223 Kuntz, R.J., 407, 413 Kurek, I., 122 Kurniawan, C.B., 166 Kurniawan, C.B., 223 Kuroda, K., 170 Kuruvinashetti, M.S., 220 Kuschinsky, A.M., 133 Kuster, T., 147 Kwiatkowski, J.R., 197 Kyoto Protocol, 22
La Scala, S., 142 Laccases, 121 Lacombe, E., 141 Ladisch, M.R., 184, 186, 188, 190, 197 Laherrere, J.H., 183 Lakshmanan, P., 237 Lam, T.B., 237 Lamb, C., 139 Lanahan, M.B., 105 Lander, E.S., 76 Landraces, 225 Landucci, L.L., 146, 147 Langan, P., 119 Langewisch, T., 149 Langley, C.H., 407, 413 Lantero, O.J. 104 Lapierre, C., 127, 142, 145–147 Larsson, S., 362 Laser, M., 186 Latimer, V.M., 189 Latshaw, S., 80 Laucou, V., 75 Laureano-Perez, L., 166, 189 Lauricha, J., 150 Laurie, S., 122 Laurie, W.A., 170 Laviolette, J.P., 76 Lawford, H.G., 196 Lawton, J.W., 106 Lawton, K., 75 Le Quéré, C., 43 Leaf aphids, 354 Leaf blight, 221 Leafy1 (Lfy1) trait, 200 Leddy, J., 33 Lee, C.C., 104 Lee, M., 75 Lee, R.C., 68 Lee, S., 126 Lee, T.K., 126 Lee, W.J., 101 Lee, Y.Y., 184, 188–190 Lefebvre, A., 146 Lefebvre,V., 81 Legrand, M., 141 Lemke, C., 227 Lennholm, H., 166 Lennington, J., 227 Lenz, M.C., 105, 236 Leong, C.K., 189 Leplé, J.-C., 146

436 Index Lerouge, P., 170 Lerouxel, O., 135, 170, 198 Leshkevich, J., 141, 144 Levinson, H., 190 Lewin, B., 69 Lewis, N.G., 147 Lewis, S.M., 104 Leymus genome, 316 Li, 233 Li, B.L., 216 Li, J., 149 Li, L., 141, 144 Li, L.C., 148 Li, L.G., 169 Li, M., 101 Li, P.W., 76 Li, X., 136, 150 Li, Y., 143, 144, 149 Li, Z., 227 Li, Z.C., 148 Liakatas, A., 233 Liang, G.H., 220, 226, 227 Liang, P., 82 Lidén, G., 106 Lidgett, A., 142 Liepman, A.H., 134, 135, 198 Lightle, D.T., 56 Lignin, 117
polymerization, random coupling model, 125
structural analysis of, 124 Lignocellulosic plant biomass, 161–164
acid-based pretreatment alkaline-based pretreatment, 167–168 concentrated acid based
pretreatment, 167 dilute acid pretreatment, 166 composition of, 89–91
neutral/controlled-pH pretreatment liquid hot water pretreatment, 165 steam explosion, 165
Lim, E.K., 143 Lime, 167 Lin, F.C., 120 Lin, Y., 227 Lin, Y.R., 227, 230 Lindblad-Toh, K., 76 Lindegaard, K., 235 Linden, D.R., 56 Linder, M., 191 Line cultivars, 69
Lingle, S., 238 Link, B., 133, 150 Linkage drag, 68
See also Plant breeding principles Linstead, P., 135 Linstead, P.J., 149 Linton, L.M., 76 Liquid hot water pretreatment, 165 Lisak, A.J., 48, 58 Liston, A., 225 Liu, H.W., 191 Liu, S., 227 Liu, W., 142 Liu, Y-G., 80 Livak, K.J., 74 Liyama, K., 237 Llewellyn, D.J., 123 Lloyd, D.H., 76 Lloyd, T.A., 188 Loblolly pine, 413 Locusta migratoria, 218 Lohrmann, T., 104 Lomborg, B., 45 Lophopogon Hack., 274 Loreto, F., 233 Lotto, R., 135 Louis, K., 220 Lovettt, R., 192 Lowlands switchgrass, 297 Lu, C.A., 150 Lu, F., 142, 145–147, 166 Lübberstedt, T., 76 Lueschen, W.E., 217 Lundquist, K., 145, 147 Lundqvist, J., 170 Lung, J., 199 Luo, L., 227 Lymantria dispar L., 354 Lynch, D., 142 Lynd, L.R., 183, 186, 198 Lyons, T.P., 99 M. larici-populina, 382 MacKay, J.J., 142, 145, 166 Maclachlan, G., 137 Madera-Torres, P., 221 Madl, R.L., 105, 236 Madson, M., 135, 136 Magalhaes J.V., 235 Magara, K., 147 Magill, C.W., 221

Index 437 Mahoney, N., 142 Maize Dwarf Mosaic Virus, 220 Maize Genetics and Genomics Database, 198 MAIZEWALL database, 129 Malacosoma. americanum Fabricius, 354 Malacosoma disstria Hübner, 354 Malkin, R., 34 Manicacci, D., 144 Mank, R., 76 Mannans, 106–107 Manners, J.M., 221 Mansfield, S.D., 123, 146, 223 Maquat, L.E., 70 Margulies, M., 76 Mariotti, J.A., 263 Marita, J., 199 Marita, J.M., 145, 146 Marland, G., 43 Marler, B., 227 Marley, P.S., 219 Marschner, H., 235 Martens, H., 168 Martens, M., 168 Martienssen, R.A., 68 Martin, C., 123 Martin, F., 170 Martin, F.A., 215 Martin, K.L., 230 Martin, W., 147 Martinant, J.P., 132, 144, 150 Martinez, A., 184 Martinez, A.T., 170 Martinez, M. J., 170 Martinez, Y., 150 Martz, F., 141 Marx, U., 32 Maskina, M., 56 Masoud, S.A., 139 Mass selection of plants, 66 Massacci, A., 233 Massacci, S., 214, 216 Masteller, V.J., 226 Mastrorilli, M., 233 Matern, U., 141 Matsumoto, T., 104 Matsumoto, Y., 147 Maury, S., 141 May, J.B., 99 Mayorga, J.C., 100 McAloon, A.J., 45, 101, 197 McBride, J.E., 186
McCann, M.C., 122, 138, 149, 150, 166 McCarley, J.R., 192 McCarty, D.R., 80, 150 McClelland, M., 74 McClintock, B., 79 McDougall, G.J., 147 McInnes, R., 142 McIntyre, C.L., 221, 267 McIntyre, L.M., 83, 86, 146 McKeand, S., 216 McLaren, J.S., 105, 236 McLeod, J.G. 101 Mcmillan, J.D., 188, 192 McQueen-Mason, S.J., 130 Medford, J.I., 80 Medhurst, A., 134 Meeley, R., 150 Meeley, R.B, 80 Megraw, R.A., 407, 413 Mehta, P.J., 220 Meier, D., 170 Melampsora epitea Thüm fungus
on willow, 353 Melampsora medusae, 382 Melchinger, A.E., 76 Menz, M.A., 227 Meredith, J., 101 Merkeron napiergrass, 323, 331 Meshitsuka, G., 147 Messens, E., 146 4-O-Methyl-Glucuronoxylans, 106 Meuzelaar, H.L.C., 170 Meyer, D., 141 Meyer, K., 80 Microarrays, 61 Microsatellite markers, see Simple
sequence repeats (SSR) Microstegium Nees, 274 Midland 99, 323 Mihashi, S., 235 Mila, I., 142 Miller, F., 238 Miller, F.R., 220 Miller, M., 227 Mills, E.N.C., 126 Milos, 222 Milne, T.A., 170 Milne, J., 129, 148 Ming, R., 227, 237 Minteer, S., 33 Mir Derikvand, M., 146

438 Index Miranda, J.B., 84 Mirkov, T.E., 237 Mirochnik, O., 223 Miscanthus blight, 289 Miscanthus spp., 273, 274
agronomic characteristics and bioprocessing, 279–280
description of, 274–279 drought tolerance and, 287–288 flowering time and composiyion of,
288–289 frost tolerance and low temperature
growth, 288 genetic resources of, 283–284 genetic variation for breeding, 284–287 geographical distribution of, 276 pests and diseases, 289–290 phenotypic variability in, 285 plastid genome variation of, 284 production and utilization, 281–282 propagation of, 289
Mitchell, R.B., 56 Mitsukawa, N., 80 Mixed linkage β-glucans, 106 Miyao, A., 122 Mlynár, J., 147 Mohan, D.D., 226 Mok, W.S.L., 187 Molecular markers
AFLP, 53, 54 CAPS, 52 PCR and, 49–51 RAPD, 52RFLPs, 51 SNP, 54 SSCP, 53SSLP, 53 SSR, 52–53
Mølhøj, M., 133 Molin, U., 166 Molina-Jouve, C., 104 Møller, B., 169 Moller, I., 135 Monceaux, D.A., 100 Monolignol
biosynthetic pathway, 116–118 oxidation and polymerization, 121–125 transport of, 120–121
Montes-Garcia, N., 221 Montezinos, D., 120 Montgomery, R., 100 Monti, R., 193 Monties, B., 147
Moore, G., 227 Moore, P.H., 237 Moore, R.C., 148 Morales, F., 184 Morant, M., 141 Moreau, R.A., 101, 105, 106 Morgante, M., 76 Mori, S., 235 Morikawa, Y., 198 Morohoshi, N., 144 Morreel, K., 146 Morreel, K., 146 Morrison, I.M., 147 Morrison, III W.H., 136 Mosier, N., 188, 190 Mosseler A., 361, 364, 365 Motherwell, W.B., 198 Mouille, G., 122 Moulder, M., 237 Moxley, J., 104 Moyer, J.L., 221 mucilage modified4 phenotype mutant, 111 Mueller, S.C., 120 Mulder, M.M., 146 Mullen, R.W., 230 Muller, B., 128 Müller-Starck, G., 142 Mullet, J., 235 Mullet, J.E., 227, 235 Mullis, K.B., 71 Multani, D.S., 149 Munck, L., 169 mur Mutants, 108–109 Mural, R.J., 76 Murata, K., 122 Murigneux, A., 132, 144, 150 Murugesan, A., 32 Mussgnug,J.H., 32 Muthukrishnan, S., 220, 226, 227 Muthukumarappan, 105 Myers, E.W., 76 Myton, K.E., 127 Nagaraj, N., 219 Nair, R.B., 142 Nairn, C.J., 134, 136 Nakada, S., 82 Nakagawa, T., 137 Napiergrass, 310
as biofuel feedstock, 333 description of, 328–329

Index 439
genetic diversity of, 332 genetic improvement of, 330–332 planting process of, 329–330
Narendranath, N.V., 102 Natarajan, M., 138 Nathan, R.A., 221 Natural gas, 6 Naumann, A., 146 Neale, D.B., 407, 413 Neary, D.G., 401 Nedunchezhian, N., 32 Neeves, K., 197 Nemoto, T., 133 Neutelings, G., 75 Neutral detergent fiber (NDF), 197 Nevoigt, E., 104 Newbigin, E.J., 134 Newman, R.H., 120 Newton, A.C., 98, 105 Nghiem, J. 101 Nghiem, N.P., 166 Nguyen, H., 235 Nguyen, H.T., 235 Ni,W., 139 Nichols, N.N., 99, 100 Nichols, R.J., 183 Nichols, S., 134 Nicholson, R., 139 Nicolosi, R.J 106 Nielsen, E.L., 82 Nielsen, J., 169 Nieves, R.A., 192 Nimlos, M.R., 150 Nishitani, K., 137 Nishiyama, Y., 119 Nishizawa N.K., 235 Nisqually-1 genotype, 388 Niyogi, K., 34 Norambuena,L., 135 Norgaard, L., 169 Norris, K., 167 Norton, R.A. 106 Norwood, C., 216 Nuclear energy as energy sources, 6–7 Nucleotide sugar interconversion pathway,
108–111 Null allele, 48 Nusbaum, C., 76 Nyquist, W.E., 85 Nysius raphanus, 219
Obert, J.A., 227 Obeso, M., 144 Obilana, A.B., 226 Obst, J.R., 143, 170 Octaploids, 45 Oda, K., 82 Odvody, G.N., 221 Odvody, J.V., 218 Oedaleus senegalensis, 218 Ogiwara, Y., 198 O’Hare, M., 55 Ohashi, H., 166 Ohata T., 235 Ohi, H., 170 Ohlrogge,J.B., 41 Ohtani, H., 170 Oil as energy sources, 5–6 Oka, T., 133 Okada, H., 198 Okano, T., 166 Okazawa, K., 137 Oleary, S., 198 Olek, A., 149 Olembo, R.J., 226 O’Malley, D.M. 142, 143, 145 O’Malley, R., 150 Omano, L.P., 184 Ona, T., 170 O’Neill, M.A., 135, 136 Onosato, K., 122 Onsson, L.J., 194 Oosumi, T., 80 Open-pollinated cultivars, 69 Oplinger E.S., 217 Orchardgrass (Dactylis glomerata L.),
309–310 Orellana,A., 135 Orita, M., 75 Ortholog, 48 Orts, W.J., 104 Osakabe, K., 141 Osborne, C.P., 37 Osborne, E., 129, 148 Ostrinia nubilalis, 193 Ostrom, E., 60 Oval leaf spot, 221 Padua, G.W., 106 Paleolog, 48 Palm, M., 170

440 Index Palmqvist, E., 187 Palsdottir,H., 123 Pampapathy, G., 219 Pan, J., 51 Panchal, C.J., 104 Pang, H., 227 Pang, X., 149 Panicum Mosaic Virus, 299 Paralog, 48 Parasorghum, 225 Parcy, F., 149 Pardee, A., 82 Paredez A., 123, 129, 148 Parh, D.K., 221 Park, H., 135 Parker J.H., 236 Parker, M.L., 126 Parr, A., 143 Paspalum notatum L., 310 Paterson, A.H., 227, 230, 233, 237 Patil, N., 76 Patil-Kulkarni, B.G., 221 Pattathil, S., 132 Patzek, T.W., 56 Pauly, M., 133 Pauly, M., 135, 170 Payton, M.E., 399 Pean, M., 127 Pean, M., 145, 146 Pear, J.R., 120 Pectins, 116–117 Pederson, G., 221, 236 Pedigree method, 66–67 Peleman, J., 75 Pell, A.N., 147 Pelletier, S., 123 Peltz, S.W., 70 Pennisetum purpureum (L.) Schum., 310 Peña, M.J., 136 Peng, J., 147 Peng, L., 121 Pennisetum squamulatum Fresen., 331 Pentose phosphate pathway, 171 Pepey, E., 132 Pereira, A., 235 Pereira, H., 169, 170 Perlack, R.D., 59 Peronosclerospora sorghi, 221 Peroxidase genes, 121 Perrin R.M., 135 Perrin, R.K., 56
Persiau, G., 131 Persson, S., 123, 129, 148 Peters, E., 100 Petit-Conil, M., 146 Peydomenge, O., 141 Pflieger,S., 81 Pflugfelder, R.L., 236 Pham, T.K., 189 Phenylalanine ammonia lyase (PAL), 117 Phenylpropanoid metabolism, CCoA-OMT
role in, 119 Phillippe, S., 126 Phosphodiester bond, 45 Phosphoenolpyruvate carboxykinase, 17–18 Phosphomannomutase (PMM), 108 Phosphomannose isomerase (PMI), 108 Photoperiod-sensitive sorghums, 228, 232 Photosynthesis, 12, 14 Phratora vitellinae L., 353 Phyllophaga spp., 218 Piao, H.L., 135 Picataggio, S., 184 Pichon, M., 150 Pierce, D., 227 Pilate, G., 145, 146 Pillonel, C., 146, 237 Pimentel, D., 56 Pine-cone gall midge, 354 Pineros, M.A., 235 Pionneau, C., 75 Piquemal, J., 127, 141, 146 Plagiodera versicolora Laicharting, 353–354 Plant breeding principles
backcross method, 67–68 bulk methods, 65 cultivar production, 69 genetic variants and, 62 mass selection, 66 pedigree method, 66–67 quantitative traits, 63–64 selection methods, 64–65 single-seed descent (SSD) method, 65–66 testing and evaluation, 68–69
Plant cell wall architecture for, 126–128 chemical analysis of, 143 multivariate statistical techniques, 144–145 near infrared (NIR) spectroscopy, 145 spectroscopic methods, 144 composition of, 89–91 databases for, 128–129

Index 441
lignin content and composition, 150–151 proteins, 125–126 sugars of, 95
Plant genetic engineering, 69–71 Plazinski, J., 121 Plevin, R.J., 55 Plomion, C., 75 Poaceae family, 186 Pochylova, Z., 149 Poehlman, J.M., 84 Pogonatherum P. Beauv., 274 Poindexter,P., 123 Poirier, Y., 235 Polasky, S., 56 Polizeli, M.L.T.M., 193 Polle, A., 146 Pollet, B., 142, 146 Polymerase chain reaction (PCR), 49–51 Polyploids, 45 Polytrias Hack., 274 Ponnaiya, B.W.X., 214 Popillia japonica Newman, 353–354 Popko, J.L., 141, 199 Poplar (Populus), 377
bioenergy and, 383–385 genetic variations, 389–390 traits, 386–388 transgenic alteration of, 390–393 draft sequence of, 388–389 genetic improvement of, 385–386 hybrid population of, 382, 384 intra-and inter-specific hybridization, 379 and silviculture, 380–383 taxonomy of, 378
Poplar and willow borer larvae, 354 Populus deltoids, 150 Populus. nigra, 150 Populus stipitis, 171 Porter, C.L., 226 Posten, C., 32 Posthumus, M A., 170 Pot, D., 75 Pot, J., 75 Potato leaf hopper, 366 Potato leaf hopper, 354, 366 Potter, I., 131 Potter, K.N., 216 Pouwels, A.D., 172 Powell, G.L., 378 Power, E.J., 250 Power, J., 56
Power, R.F., 101 Premachandra, G.S., 233 Presnell, T., 142 Price, N.J., 136 Price, R., 225 Pring, D.R., 227 Prior, B.A., 194 Pritchard H.W., 235 Proline-rich proteins (PRPs), 126 Prom, L.K., 220, 221 Protein translation, 47 PsTAL1 gene, 173 Pterocomma salicis L., 354 Puertos-Molina, H., 233 Puigdoménech, P., 141, 144 Pulkkinen, P., 387 Punnuri, S.M., 220 Puttarudrappa, A., 221 Py, N., 123 Pyrolysis-molecular beam-mass spectrometry
instrumentation for, 148–150 lignin composition and structure, 150–151 quantitative trait loci, detection of, 152–153 unintended effects, screening for, 154
Pyruvate decarboxylase (PDC) ethanol pathway in Z. mobilis, 174
Qamar, I.A., 230 Qi, X., 101 Qian, Q., 149 Qiang, D., 227 Quantitative trait locus (QTL), 63–64 Quantitative traits, 63 Quideau, S., 142, 147 Quinby, J., 230, 232 Raab, T., 129, 148 Raes, J., 142 Rafalski, J.A., 74, 76, 150 Rai, M., 237 Raikhel, N.V., 135, 136, 150 Raj, Y., 361, 364, 365 Rajkumar, 220 Rakotonirainy, A.M., 106 Ralph, J., 142, 146, 147, 166, 199 Ralph, S., 145 Ralph, S.A., 145, 147, 166 Rameau, C., 75 Rami, J.F., 227 Ramírez de la Piscina, P., 33 Ramulispora sorghicola, 221

442 Index Ramundo, B.A., 221 Rana, B.S., 221 Rana, G., 233 Randhawa, G.S., 134 Randomly amplified polymorphic DNA
(RAPD), 52 Ranocha, P., 144 Rao, N.G., 221 Rau, S.L., 188 Raun, W.R., 230 Raupach, M.R., 43 Rausch, K.D., 103, 105 Rautio, M., 387 Rawat, A., 133 Rayon, C., 122 Reale,S., 170 Reddy, B.V.S., 219, 226 Reddy, S.P., 220 Redmond, J., 121 REDUCED EPIDERMAL FLUORESCENCE1
(REF1) gene, 120 Reed canarygrass (Phalaris arundinacea L.)
bioprocessing, 311 breeding programs for, 313 description of, 310 genetics, 311–312
Reed, J.D., 221 Reese, E.T., 190 Reese, J.C., 219 Refregier, G., 122, 123 Reich, D.E., 76 Reicosky, D.C., 56 Reid, J.S.G., 137 Reijans, M., 75 Reischmann, K., 227 Reiter, W.D., 130, 131, 133, 135, 136 Renewable energy, 5 Restriction fragment length polymorphisms
(RFLPs), 51 Reverse transcriptase- PCR, 51 Rhabdophaga strobiloides Osten Sacken, 354 Rhamnogalacturonan I and II (RG I
and II), 116 Rhamnose biosynthetic enzyme (RHM), 111 Rhizome planter, 280 Rhodes, D., 233 Rhopalosiphum maidis (Fitch), 289 Ribot, E.M., 80 Rice CslF gene family, 112 Richardson, E.A., 136 Richmond, T.A., 122
Ridolfi, M., 75 Rigau, J., 141, 144 Rignall, T.R., 192 Ringli, C., 133 Rios, I., 189 Rizzatti, A.C.S., 193 Rizzi, L., 45 RNA, 46–47 Roach, B.T., 265, 267 Roberts, A.W., 134 Roberts, K., 133, 149 Robertson, G.H., 104 Robinson, E., 76 Rodrigues, J., 169, 170 Rodriguez-Herrera, R., 220 Roesler, J., 139 Rogowsky, P.M., 144 Rohde, A., 142 Romero, J.L., 398 Römheld, V., 235 Rönnberg-Wästljung A.C., 369 Rooney, P.J., 170 Rooney, W.L., 214, 216, 220, 221, 227, 236 Rose, J.K.C., 137, 166 Rosenberger, A., 98 Rosenfield, C.-L., 104 Rosenow, D.T., 220, 225, 228, 235 Rosentrater,K.A., 105 Rosso, M.G., 133 Rösti, J., 133 Roudier, F., 150 Rowell, R. M., 170 Roy, D.N., 146 Ruan, Y.-L., 123 Rudert, M., 227 Ruegger, M.O., 141, 142 Ruel, K., 146 Ruminal fermentation, 335 Russell, I., 102, 104 Rust (Puccinia purpurea), 221 Ruth, M.F., 184 Ryals, J., 75 Ryan, E., 135 Rytkonen V.M., 359, 367 Saballos, A., 237 Saccharum complex, 249–250 Saccharomyces. cerevisiae strain and
xylose fermentatoin, 172–173 Saddler, J.N. 187 Saeman, J.F., 188

Index 443 Sági, L., 227 Sahm,H., 196 Saiki, R.K., 71 Saiz-Jimenez, C., 170 Sakon, J., 192 Saleh, A., 184 Salnikov, V.V., 123 Sanchez, A.C., 235 San-Clemente, H., 150 Sand bluestem, see Big bluestem
(Andropogon gerardii Vitman) Sandermann, Jr., H., 142 Sargent, T.D., 82 Sarikaya, A., 188 Sarkanen, S., 147 Sarria, R., 135 Sato, Y., 137 Satoh, E., 104 Saulnier,L., 126 Savolainen, O., 75 Saxena, I.M., 120 Scarpa, I.S., 198 Schaffer, R.E., 235 Scharf, S., 71 Schatz, P.F., 145, 146 Scheible, W.-R., 122 Scheijen, M.A., 170 Schellenberg, B., 133 Scheller, H.V., 135 Schena, M., 83 Schertz, K.F., 227, 230 Schiefelbein, J.W., 149, 235 Schindelman,G., 150 Schistocerca gregaria, 218 Schizaphis graminum, 218 Schlicher, M.A., 105 Schlueter, J.A., 220 Schmer, M.R., 56 Schmid, J., 139 Schnell, R.J., 237, 250 Schober, T.J., 99, 104 Schoch, G., 141 Schoenholtz, S., 383 Schreckengost, W.E., 120 Schroeder, S., 227 Schubert, R., 142 Schulein, M., 190 Schulten, H., 170 Schulze, S., 227 Schwanninger, M., 169 Schwarz-Sommer, Z., 79
Scott, J.T., 145 Scott-Craig, J.S., 122 Searchinger,T., 56 Sederoff, R.R., 74, 142, 143, 145, 166 Sedlak, M., 188 Seetharama, N., 220 Seguin, A., 142 Seib, P.A., 98, 105, 236 Seifert, G.J., 133 Sekiya, L., 82 Sekiya, T., 75 Selenopsis invicta, 218 Seltzer, J., 227 Senior, M.L., 75, 76 Senske, G.E., 101 Serraj, R., 234 Setosphaeria turcica, 221 Settles, A.M., 80 Seveno, M., 170 Sewalt,V.J.H., 139 Sewell, M.M., 407, 413 Shah, N., 76 Shallom, D., 192 Shalon, D., 83 Shapouri, H., 45 Sharma, H.C., 219 Sharma, K. K., 219 Sharma, Y., 126 Sharp,R.E., 148 Shaw, P., 135 Sheehan, J.J., 183, 192, 197 Sheikh, S., 230 Shelton, D.R., 101 Shelton, M.C., 106 Sherwood, S.P., 237 Shetty, J.K., 101, 104 Shewry, P.R., 126 Shi, D.X., 191 Shigechi, H., 104 Shikimate pathway, 117 Shimada, M., 190 Shioya, S., 104 Shirley, N.J., 134 Shoham, Y., 192 Shoue, D.A., 136 Sibout, R., 142 Sidebottom,C., 137 Silva,J., 137 Simcox, K., 80 Simmleit, N., 170 Simple sequence length polymorphism, 53

444 Index Simple sequence repeats (SSR), 52–53 Sinapyl alcohol synthesis, 119–120 Sinclair, T.R., 234 Sindhu, A., 149 Singh, K., 235 Singh, M., 220 Singh, V., 105, 106 Single nucleotide polymorphisms (SNP), 54 Single-seed descent (SSD) method, 65–66 Single-stranded DNA conformation
polymorphism (SSCP), 53 Sinorhizobium meliloti, 314 Sipha flava, 218 Siu, R.G.H., 190 Six, Y., 198 Skinner, D., 227 Sklar, P., 76 Skolnick, M., 73 Skoog, K., 194 Slash pine, 412 Sledge, M.K., 235 Smedsgaard, J., 170 Smeltzer,R.H., 141 Smith, A.M., 123 Smith, A.R., 166 Smith, C.M., 219 Smith, C.W., 212 Smith, G.R., 221, 227, 230 Smith, J.S.C., 75 Smith, L.H., 217 Smith, M.R., 104 Smith, O.S., 76 Smith, R.C., 137 Smooth bromegrass (Bromus inermis
Leyss.), 310 Solar energy, 7–8 Somerville, C.R., 80, 121, 122, 123, 129,
130, 148, 235 Søndergaard, I., 169 Song, S., 150 Sonoda, T., 170 Sorensen, I., 134 Sørensen, S., 135, 138 Sorghum Assembled Genomic Island
(SAMI) database, 227 Sorghum brown midrib26 mutant, 119 Sorghum crop, 211
botanical description of, 212–214 cell wall composition of, 236–237 conversion efficiency of, 236 cultivation of
agronomic considerations and, 215–217 harvest and processing systems, 221–223 pests and diseases, 217–221
genetic resources breeding methods, 228–230 genetic map, 227–228 mutants, 226 natural variation and, 225–226 processing and yield factors, 230–234 tissue culture and transformation,
226–227 moisture content and juice extraction
efficiency, 236 panicle architecture of, 213 reproduction of, 214–215 S. bicolor, 212, 213 stress resistance, 234–235 sugar concentration, 237–238 world collection, 225–226
Sorghum Gene Index, 227 Southern green stinkbug (Nezara viridula), 219 Southern yellow pines
breeding cycle and deployment, 410 breeding populations, 408–411 distribution maps for, 399 energy and fuels, 405–406 and forest products industry, 404–405 genetic diversity of, 407–408 growing systems for, 400–403 harvesting and transportation, 403 heritability and, 411 life cycle of, 406–407 pollination bags in, 409 short-rotation bioenergy plantings, 403–404 taxonomy of, 398–399
Spangenberg, G. 142 Speranza, M., 170 Sperisen, C., 142 Sphacelia sorghi, 221 Spider mites (Oligonychus pratensis), 218 Spodiopogon Trin. Miscanthus spp., 274 Spodoptera frugiperda, 193 Spodoptera spp., 218 Spot blotch (Helminthosporium sativa
Pam.), 299 Spreti, N., 170 Srinivasan,R., 105 Stahlberg, J., 191 Staiger,C., 150 Stalbrand, H., 170 Stalker, D.M., 120

Index 445 Stam, M., 135 Stam, P., 76 Stanturf, J., 383 Starch conversion to fermentable sugars,
78–80 Steam explosion pretreatment, 165 Stecca, K., 134 Steduto, P., 233 Steer, M., 135 Steffenson, B.J., 221 Stein, L., 388 Steiner, H.Y., 75 Steinhart, H., 146 Stener, L.G., 387 Stenodiplosis sorghicola, 219 Stephanopoulos, G., 104, 195 Stephens, E., 32 Stephens, J.C., 214 Sterjiades, R., 143 Stern, N., 45 Stettner, C., 80 Stewart, D., 147 Stewart, G.G., 104 Sticklen, M., 148, 198 Stiposorghum, 225 Stokes, B., 59 Stokke, D.D., 199 Stone, B.A., 134 Storme, V., 146 Stott K. G., 364 Stratilova, E., 137 Strauss, S., 225 Stronach, M.S., 137 Strong, D.R., 362 Stuart, P., 397, 404 Stuber, C.W., 73, 75, 76 Šturcová, A., 119 Subramanian, R., 32 Subudhi, P.K., 235 Sudhalakshmi, C., 235 Sugarcane (Saccharum spp.)
actual yields of, 257 anatomy of, 252–254 biomass potential of, 256–257 boiler fuel and cogeneration, 259–260 breeding efforts and, 254–255 breeding in Brazil, 262–264 Caribbean and U.S., 265–266 (Comment
not Clear) cellulosic ethanol and gasification,
260–261
cultivation and harvest, 251–252 energy cane breeding strategies, 262 as energy crop, 257 energy output/input ratio, 261 fiber as feedstock, 258–259 fiber-only model
breeding within Saccharum, 266–267
hybridization and, 267 type II energy cane definition, 266
genetic improvement of, 255, 264–265 production statistics
U.S., 255–256 worldwide, 255–256
sugar and fiber model type I energy cane definition, 264 yield and content, 262–263
taxonomy of, 249–251 Sugarcane Mosaic Virus, 220 Sugiyama, J., 119, 121, 166 Sukumar, N., 119 Sulova, Z., 137 Sumner, L.W., 235 Sun, L., 149 Sun, X.S., 98 Sundberg, B., 146 SUPERGEN project, 289 Surendran, U., 235 Suzuki, K., 127 Suzuki, S., 237 Suzuki, Y., 75 Swain, R.L.B., 197 Swanson, A.F., 236 Swanston, J.S., 98, 105 Sweet sorghums, 222–223 Swennen, R., 227 Switchgrass (Panicum virgatum L.), 295
annual dry matter yield, 298 BFDP-sponsored switchgrass research
projects, 296 as bioenergy crop, 296 bioprocessing and, 299–300 breeding and cultivar development
honeycomb design in, 302 hybrids, 302 node propagation in, 303 population improvement, 301 tissue culture and, 305 traits and, 300–301, 304–305
description of, 296–297 enzymatic saccharification of, 153

446 Index
genomics and transformation, 303–304 mass spectra, 152
Sycamore maple, 121 Synthetic cultivars (Syn1), 69 Syrjanen, K., 127, 147 Syvanen, A.C., 76 Tabuchi, A., 148 Tadesse, Y., 227 Tagliani, L., 227 Taheripour, F., 48 Tahvanainen, L., 359, 367 Takabe,K., 144 Takagi, S., 235 Takahashi, M., 190 Takahashi, S., 198 Takemoto, T., 235 Tanaka, A., 198 Tanaka, K., 122 Tao, Y., 221 Taramino, G., 74 Target/ tester pool, 60 Tarpley, L., 238 Tatout, C., 132 Tauer, C.G., 399 Taylor, F., 45, 101, 197 Taylor, J.R.N., 99 Taylor, N.G., 122 Taylor, R.W., 215 Teal, R.K., 230 TeBeest, D.O., 220 Teeri, T.T., 190, 191 Tenkouano, A., 220 teosinte branched1 (tb1), 200–201 Terashima, N., 144, 147 Terenzi, H.F., 193 Terron, M.C., 170 Tesso, T., 220 Tester, R.F., 101 Tetraploids, 45 Teunissen, P, 101 Tew, T., 221 Tew, T.L., 237 Tewari, J., 150 Teymouri, F., 166, 189 Tharakan P.J., 349, 352, 355, 359 Thibault, S., 75 Thoenes, E., 235 Thole, V., 123 Thoma, S., 235 Thomas, D., 76
Thomas, K.C., 101, 102, 104 Thomas, S.R., 150, 166, 192 Thomas-Hall, S.R., 32 Thompson, K.H., 73 Thompson, K.J., 146 Thompson, L.M., 235 Tidal energy, 8–9 Tierney, M., 122 Tifton 85, 323 Tigerstedt, P.M.A., 387 Tilman, D., 56 Timell, T.E., 128 Timmins, E.M., 170 Timothy grass (Phleum pratense L.), 309 Tingey, S.V., 74, 76 Tjerneld, F., 170 Tomes, D.T., 227, 134 Tominaga, R., 137 Tomita, E., 137 Toole, G.A., 126 Torget, R.W., 189 Torres,M.A., 141 Tracey, P., 48 Trait heritability, 63 Tran, H., 150 Trethewey, R.N., 123 Trichoderma reesei Cel7A
cellulose hydrolysis by, 156 probing cellulase accessibility, 154–155
Trifolium spp., 310 Tripathi, D.P., 221 Triploids, 45 Tripsicum genetic map, 335 Troeh, F.R., 235 Trouche, G., 227 Trull, M.C., 235 Tryptamine alkaloids, 312 Tsai, C.J., 199 Tsao, C.C., 141 Tschaplinski, T.J., 386, 389 Tsuge, S., 170 Tuberolachnus salignus Gmelin, 354 Tuinstra, M. Tuinstra, M.R., 98, 105, 219–221, 235, 236 Tumbleson, M.E., 105 Turhollow, A., 59 Turner, B.T., 55 Turner, S.R., 122, 135 Tuskan, G.A., 80, 166, 369, 378, 386, 388,
389, 407, 413 Tyner, W.E., 48

Index 447 UDP-D-apiose/UDP-D-xylose synthase
(AXS), 111 UDP-D-glucose, 110 UDP-L-rhamnose, 111 Ueda, M., 104, 198 UGE genes, 111 UGTgenes, 121 Uknes, S., 75 Ullmann, P., 141 Um, B.H., 188 Umana, A., 60 Umarani, C., 32 Umezawa, T., 141, 144 Uncatalyzed solvolysis, 165 Undersander, D.J., 217 Underwood, S.A., 184 Unger, P.W., 216 Unlu, M., 233 Unruh, N.C., 227 Upland switchgrass, 297 Uribelarrea, J.-L., 104 Uridine diphosphate-D-glucose
(UDP-Glc), 108 Usadel, B., 133, 170 UXS genes, 111 Vaitheeswaran, V.V., 45 van Arkel, G., 235 van Baar, B.L.M., 170 van de Lee,T., 75 van de Peer, Y., 142 van der Hoeven, R.S., 83 van Doorsselaere, J., 131, 141, 145 van Heems, J.D., 170 van Lijsebettens, M., 135 van Montagu, M., 131, 135 van Zyl, W.H., 186, 194 Vandekerckhove, J., 131 Vander Eycken, J., 146 Vanderhaeghen, R., 135 Vanzin, G.F. 130, 131, 135, 136 Varner, J.E., 141 Venkatesha, R.T., 220 Venkateswaran, K., 219 Venter, C.J., 76 Venuto, B.C., 230 Verma, R., 133, 136 Vermerris, W., 74, 139, 146, 147, 149, 150,
199, 236, 237 Vernhettes, S., 122, 123, 149 Verwijst, T., 349, 352, 355, 359
Vickers, K., 122 Viet, C., 190 Vietor, D., 238 Vietor, R.J., 120 Vignols, F., 141, 144 Vinzant, T.B., 166, 192 Visser, R.G.F., 83 Vogel, K.P., 56 Volk T.A., 349, 352, 355, 359 Voorhees, W.B., 56 Vorwerk, S., 129, 148 Vos, P., 75 Vreugdenhil, D., 83 Vuylsteke, M., 76 Wagner, T.A., 135 Wagner, U., 133 Wagschal, K., 104 Wainscott, M., 123 Walbot, V., 79 Walfridsson, M., 194 Wallace, B., 197 Wallace, D.H., 230 Walters, D.T., 48 Walton, J.D., 122 Wang, W., 70 Wang, D., 76, 98, 104, 105, 236 Wang, H., 51 Wang, H.-B., 147 Wang, L.S., 191 Wang, M., 184 Wang, M.L., 220, 221 Wang, N., 227 Wang, X., 135 Wang, Y., 149, 227 Wang, Z., 227 Wang, Z.Y., 235 Waniska, R.D., 220 Wankat, P.C., 197 Warm-season (C4) grasses, 310 Warrington, J., 76 Wasteneys, G.O. 150 Watson, S.A., 97 Wave as energy sources, 9 Wayne, M.L., 83, 86 Weaver, L.M., 139 Weih, M., 357, 359, 369 Weil, J., 186 Welch, G., 188 Wellner, N.K., 126 Wells, B., 133

448 Index Welsh, J., 74 Werck-Reichhart, D. 141 Wesseler, J., 55 Westgate, P., 186 Wet distillers grains (WDG), 81 Weymann, K., 75 Wheat-mammoth wildrye, 317 Wheeler, N.C., 407, 413 Wheeler, T.R., 126 Whetten, R.W., 142 White E.H., 349, 352, 355, 359 White, R.L., 73 White, T.L., 378, 407, 411 Whitten, B., 134 Whittier, R.F., 80 Wilde, G., 226, 227 Wilde, G.E., 219 Wildryes (Leymus spp.), 310
description of, 316 Wilhelm, W.W., 56 Wilkerson, C.G., 134, 135 Wilkins, M., 223 Willats, W.G.T., 134, 135 William, J.K.G., 74 Williams, C.G., 407 Williams, J., 104 Williams, P., 167 Williams, S., 221 Williams, W.A., 257 Williamson, R.E., 121, 123 Willmitzer, L., 123 Willow (Salix)
as bioenergy crops, 348 breeding programs in
North America, 365–369 Sweden, 363–364 United Kingdom, 364–365
commercial biomass plantations, 357–359 crop management, 352–355 crossability relationships among
species, 361 genome modification and analysis,
369–370 habitat and growth, 349 harvesting of, 355–357 mechanical pollination of female willow
flowers, 360 plantations of, 349 shrubs of, 360–361 taxonomic organization of, 350–352 traits, genetics of, 362–363
traits heritability of, 362 Willow stem sawfly (Janus abbreviatus
Say), 354 Wilson, D.B., 166, 176 Wilson, R.H., 126 Wilson, S.M., 134 Wiltse, C.C., 220 Wilusz, C.J., 70 Winchester, E., 76 Wind as energy sources, 8 Wing, R.A., 227 Wingren, A., 198 Winklmair,A., 80 Withers, S.G., 192 Wittke, W., 121 Wolucka, B.A., 131 Wong, D.W.S., 104 Woo, S.-S., 227 Wood, C.B., 235 Wood, K.V., 170 Wood, M.D., 106 Wood-degrading fungus T. reesei
cellulolytic enzymes action, 168–169 Wood-Jones, A., 136 Woodward, A.M., 170 Wooley, R., 45 Wörgetter, M., 50 Wright, L.L., 59 Wu, K.K., 237 Wu, X., 105, 236 Wu, Y., 148 Wullschleger, S.D., 386, 389 Wyman, C.E., 183, 184, 186, 188, 190,
192, 198, 223 Xia, X.C., 76 Xiang, B.S., 166 Xie, L., 170 Xie, Q., 123 Xoconostle-Cazares, B., 122 Xu, G.W., 221 Xu, W., 235 Xylitol dehydrogenase (XDH), 171 Xyloglucan modification, 115 Xyloglucans (XyGs), 103–104 xylose fermentation, 171 reductase (XR), 171 Yadav, M.P., 106 Yahiaoui, N., 127, 145, 146

Index 449 Yamada,T., 169 Yamaguchi, A., 170 Yamazaki, M., 122 Yan, H., 123 Yan, M., 149 Yan, W., 230 Yang, B., 192, 223 Yang, H., 48 Yang, Y.T., 195 Yasuta, Y., 170 Ye, Z.-H., 136, 141 Yee, W., 45 Yeh, T.F., 169 Yellow sugarcane aphid (Sipha flava), 218 Yennawar, N.H., 148 Yin, B., 123 Yin, T.M., 386, 389 Ying, T. 170 Ying, Y., 170 Yokoi, H., 170 Yong, W., 150 York, S.W., 184 York, W.S., 136 You,K.M., 104 Young, O., 60 Youngs, H., 129, 148 Yu, C.H., 192 Yu, Q., 387 Yu, Z.H., 220 Yuan, M., 123 Zabeau, M., 75, 76, 83, 131 Zablackis, E., 128
Zacchi, G., 106, 170, 198 Zaldivar, J., 184 Zea mays l., 79 Zeef, A.H., 135 Zeng, N., 51 Zeng,W., 135 Zhan, X., 98 Zhang, J.Y., 235 Zhang, L., 227 Zhang, M., 149, 184, 192 Zhang, X., 123 Zhang, Y., 123 Zhang, Y.Z., 191 Zhang, Z., 123 Zhao, R., 105, 236 Zhao, X., 123 Zhao, Z.-Y., 227 Zheng, N., 123 Zhong, R., 136 Zhou, G.-K., 136 Zhou, S.D., 184 Zhou, Y., 149 Zhu, H., 226, 227 Zhu, L., 123 ZmGI database, 129 ZmPox genes, 121 Zody, M.C., 76 Zongo, J.D., 226 Zrenner, R., 123 Zsuffa L., 361, 364, 365 Zugenmaier, P., 119 Zymomonas mobilis, 173–174