Expectation and implementation of flexible bioenergy in ...
129
Expectation and implementation of flexible bioenergy in different countries IEA Bioenergy: Task 44 March 2021 © Andreas Pilz (DBFZ)
-
Upload
khangminh22 -
Category
Documents
-
view
3 -
download
0
Transcript of Expectation and implementation of flexible bioenergy in ...
Expectation and implementation of flexible bioenergy in different
countries
IEA Bioenergy: Task 44
March 2021
© Andreas Pilz (DBFZ)

Expectation and implementation of flexible bioenergy in different countries
Daniela Thrän, Katharina Schering, Uta Schmieder, Kjell Andersson, Paul Deane, Martin Dotzauer, Ilkka Hannula, Christiane Hennig, Ernst Höftberger, Jaap Kiel, Lukas Kranzl,
Pieter Kroon, Nora Lange, Mads Pagh Nielsen, Karolina Norbeck, Amy Philbrook, Ian Rowe, Tilman Schildhauer, Fabian Schipfer, Hanne Siikavirta, Lassi Similä, Giacomo Talluri
The IEA Bioenergy Technology Collaboration Programme (TCP) is organised under the auspices of the International Energy Agency (IEA) but is functionally and legally autonomous. Views, findings and publications of the IEA Bioenergy TCP do not necessarily represent the views or policies of the IEA Secretariat or its individual member countries
IEA Bioenergy: Task 44
March 2021
1
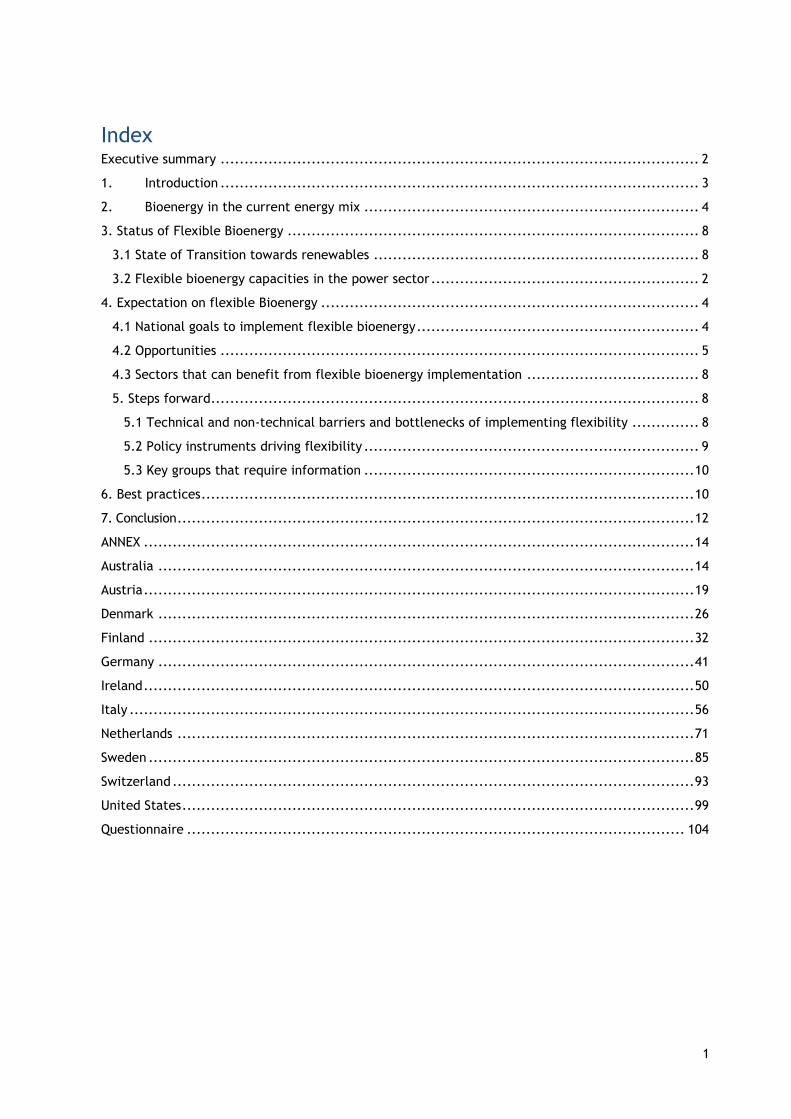
Index Executive summary .................................................................................................... 2
1. Introduction .................................................................................................... 3
2. Bioenergy in the current energy mix ...................................................................... 4
3. Status of Flexible Bioenergy ...................................................................................... 8
3.1 State of Transition towards renewables .................................................................... 8
3.2 Flexible bioenergy capacities in the power sector ........................................................ 2
4. Expectation on flexible Bioenergy ............................................................................... 4
4.1 National goals to implement flexible bioenergy ........................................................... 4
4.2 Opportunities .................................................................................................... 5
4.3 Sectors that can benefit from flexible bioenergy implementation .................................... 8
5. Steps forward...................................................................................................... 8
5.1 Technical and non-technical barriers and bottlenecks of implementing flexibility .............. 8
5.2 Policy instruments driving flexibility ...................................................................... 9
5.3 Key groups that require information ..................................................................... 10
6. Best practices ....................................................................................................... 10
7. Conclusion ............................................................................................................ 12
ANNEX ................................................................................................................... 14
Australia ................................................................................................................ 14
Austria ................................................................................................................... 19
Denmark ................................................................................................................ 26
Finland .................................................................................................................. 32
Germany ................................................................................................................ 41
Ireland ................................................................................................................... 50
Italy ...................................................................................................................... 56
Netherlands ............................................................................................................ 71
Sweden .................................................................................................................. 85
Switzerland ............................................................................................................. 93
United States ........................................................................................................... 99
Questionnaire ........................................................................................................ 104

2
Executive summary
Flexible bioenergy – as defined in IEA Bioenergy Task 44 - is a bioenergy system that can provide multiple services and benefits to the energy system under varying operating conditions and/or loads.
This report compares eleven OECD members in their status and expectation on flexible bioenergy. This includes Australia, Austria, Denmark, Finland, Germany, Ireland, Italy, Netherlands, Sweden, Switzerland and the United States of America.
The actual role of bioenergy in the different countries strongly varies between sectors and countries, from only some percent up to more than 30% of the final energy demand. The heating and cooling sector is of major relevance today, and the expectation of varying renewable energies in the electricity sector lead to additional demand for flexibility. However, the power sector has a major impact in the perception of energy transition. While most of the countries are still in the decision making for climate neutral energy provision systems towards 2050 at the latest, the consideration of flexible bioenergy is still in an early stage.
Dedicated chances for flexible bioenergy are seen in the substitution of fossil fuels, in support of the energy transition providing flexible electricity, and also in different energy system services such as biofuels provision, renewable heat implementation as well as carbon capture and utilisation options and the reduction of grid operation costs. Even though all surveyed countries are OECD members, the status, policy frame and examples are heterogeneous and give different priorities to short term flexible bioenergy and multiproduct systems and longer-term flexibility services as well. Thus, even under the consideration of the phase of system transformation towards fluctuating renewables, as proposed by IEA (https://www.iea.org/topics/system-integration-of-renewables), we still see different expectations between the countries.
To introduce flexible bioenergy there is no blue print at the table. However, most of the countries mentioned best practice examples. Hence, as a first area of action we propose a better mapping and promotion of best practices, as there is a wide variety of options to use biomass in different sectors (https://task44.ieabioenergy.com/best-practices/). Additionally, the countries see the need to encourage demonstration in pilot plants, which requires support by renewable energy research and implementation actions.
Technological barriers are not seen to be a major challenge, but an economic feasible integration of the technologies in the overall energy system. Coherent policy support to integrate flexible bioenergy in the energy system is considered as necessary. To unlock the potential benefits, we propose a stronger link between flexible bioenergy and other options for flexibility, such as demand side management, energy storage, power-to-X and also green hydrogen.
3
1. Introduction
Bioenergy has some unique properties that can address many of the problems related to the on-going transition to a low-carbon energy system. When sustainably sourced and used, bioenergy can
(i) operate as a key element in the coupling of different energy sectors; (ii) provide low-carbon energy to complement wind and solar (residual load and grid
stabilisation); (iii) store electricity chemically into fuels to enable more efficient use of wind and solar; (iv) provide sustainable fuels for sectors where other decarbonisation options are not
available or exceedingly expensive; (v) provide high temperature heat to industry, and low temperature heat for buildings
(and sanitary water) during dark and cold seasons; (vi) coproduce heat, electricity, fuels and other products in a single high-efficiency
processing plant.
There are flexible bioenergy processes in place globally. However, to realize the potential of flexible bioenergy, a focussed implementation approach is required. So, achieving these objectives requires a fundamental shift in the way bioenergy is being used, but there is currently a limited understanding on the details of such change.
Task 44 of IEA Bioenergy contributes to the development and analysis of bioenergy solutions that can provide flexible resources for a low-carbon energy system. The objective is to improve understanding on the types, quality and status of flexible bioenergy, and identification of barriers and future development needs in the context of the entire energy system (power, heat and transport).
According to the understanding of IEA Bioenergy Task 44 the definition of flexible bioenergy and system integration covers different dimensions of flexibility, including temporal flexibility, flexibility in the use of bioenergy, operational flexibility and end-product flexibility. The definition states:
Flexible bioenergy is defined as a bioenergy system than can provide multiple services and benefits to the energy system under varying operating conditions and/or loads. Examples of flexible bioenergy include technologies and concepts providing grid stability for a power system with large amounts of variable wind and solar energy; dispatchable production of energy and other products according to market demand; integrated poly-generation systems combining the production of heat, power, fuels and/or chemicals; long-term storage options such as biofuels and biochemicals; or ancillary services to support system reliability.
To unlock the manifold potentials of flexible bioenergy for future energy supply appropriate policy and market development is required. The implementation of flexible bioenergy is in its infancy and the broad range of secondary benefits that bioenergy can offer is currently not very much understood yet – and additionally also the potentials are often described for certain energy sectors (i.e. electricity) or for certain types of flexibility.
Behind this background, this report gives and overview on the status and the expectation of flexible bioenergy in eleven different countries (most of them participating in IEA Bioenergy Task 44) to see different approaches for flexible bioenergy, but also summarises drivers and barriers. We describe the general role of bioenergy in the power, heating and cooling and transport sectors, followed by an outline of the transition towards renewables and the related status of flexible bioenergy regarding policy framework, obstacles and bottlenecks, as well as the incentives.
The report is strongly linked to the overview on technical options for flexibility and to the collection of best practices. Also available at the website soon (https://task44.ieabioenergy.com/best-practices/). It is based on country-specific information, including statistic information and expert assessment as well. A questionnaire for gathering information was prepared and sent (see Annex for this). Responses were analysed and are presented in this report. The following countries have been involved in the country survey: Australia, Austria, Canada, Denmark, Finland, Germany, Ireland,
4
Italy, Netherlands, New Zealand, Sweden, Switzerland and United States. All those countries are OECD members. No feedback on the questionnaire has been received from Canada and New Zealand. In the following chapters we summarize the outcome of the investigation, and also provide the country specific information, including a list of country specific references, in the Annex.
The report can also, to some extent, serve as a compilation of examples well adapted to the needs of each countries energy system. Thus, the heterogeneity of examples provides also a chance to meet the specific energy needs of certain niches and can accelerate the implementation.
2. Bioenergy in the current energy mix
To better understand the role of bioenergy and to define space for potential flexible bioenergy options a brief overview of bioenergy in the current energy mix is given in the following section. All numbers presented in this section are derived from the countries answers within the questionnaires. The corresponding references are listed in the Annex.
Bioenergy currently plays a role in all energy sectors. It is established in energy supply in all sectors, power, heating and cooling, and transport. However, the importance of bioenergy provision does not only differ between the countries but also the sectors in which bioenergy is used. Here the energy systems are characterised by different supply patterns among the countries, revealing different levels in the transformation towards renewables. This section provides some background information on the current energy supply in countries considered in analysis (Australia, Austria, Denmark, Finland, Germany, Ireland, Italy, Netherlands, Sweden, Switzerland and United States), considering different solid, liquid and gaseous biofuels in the different sectors.
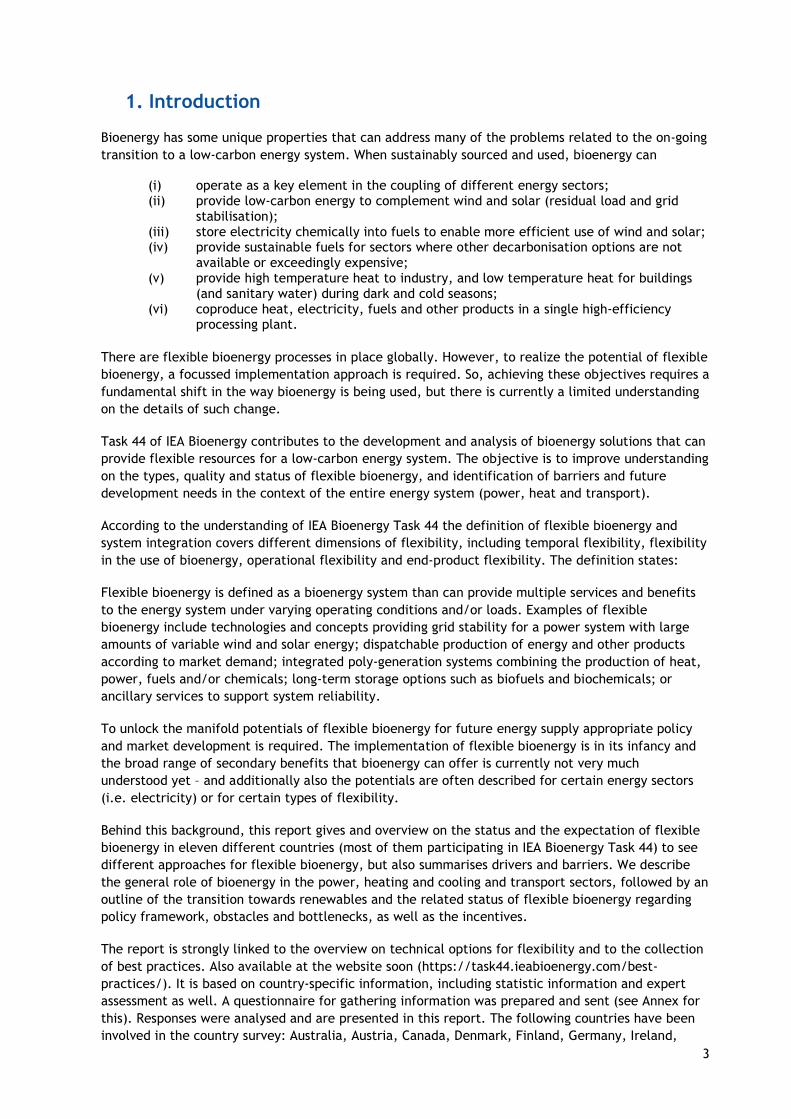
Figure 1 Share of energy provision from biomass over all sectors (*numbers for Finland without transport sector, for United States of America without heating and cooling)
According to Figure 1 Denmark shows the highest share of final energy provision from bioenergy with
0%
10%
20%
30%
40%
Share of energy provided from biomass
5
more than 35%, followed by Finland1 (32%) and Sweden (22%), whereas Switzerland does only provide less than 2% of its final energy demand from biomass. Even though this figure does not distinguish between domestic and imported biomass, it might help to understand the different biomass priorities between the countries and also give an idea which countries can benefit more from mobilising their biomass potential.
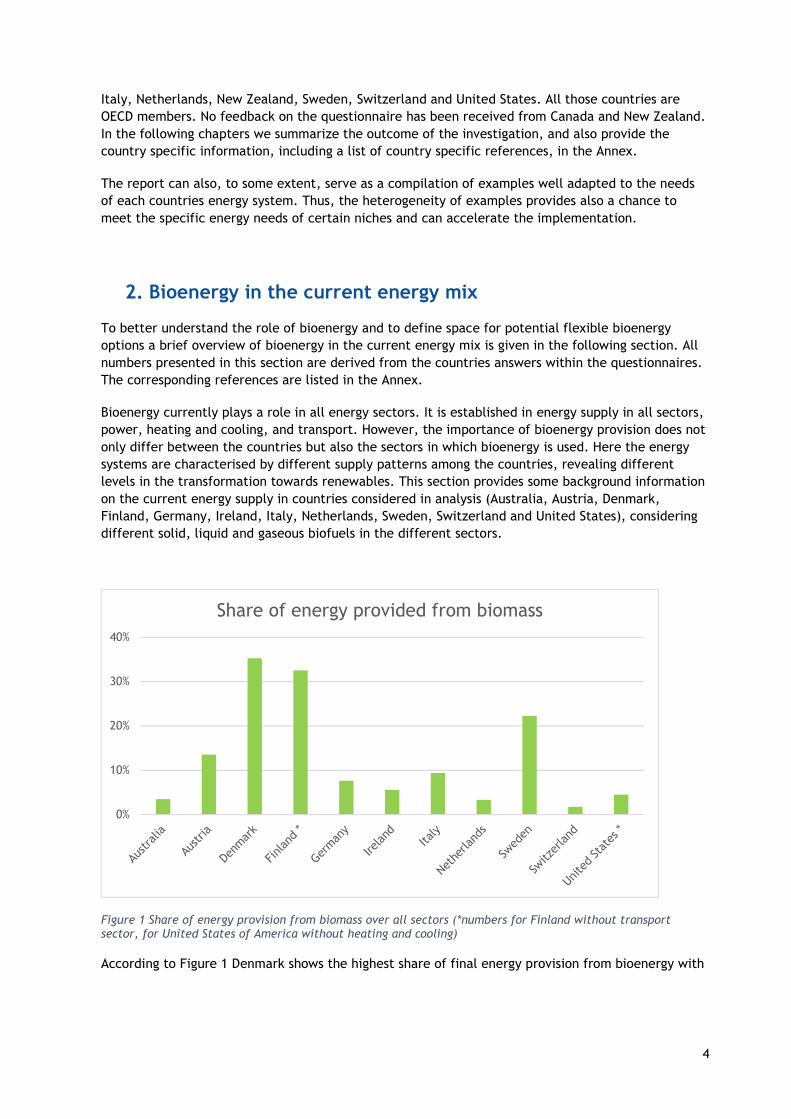
The role of biomass for power provision is very diverse (Figure 2): In several countries, the share of renewable energies is strong in the power sector. Depending on the geography, hydro power is a relevant (and flexible) renewable energy source, what is the case in Austria, Switzerland and Sweden. Wind, photovoltaics and other renewables provide, for example in Germany, more than 35% of the power demand, in the course of a year days with power production exceeding the electricity demand occur. Nevertheless, in most of the country’s renewables have still a minor share in the power provision. With regard to biomass, the share of power demand supplied by biomass and biomass CHP (combined heat and power generation) ranges from 1.4% (United States)2 to 17% (Denmark)3.
Figure 2 Source of power demand. Status quo as of 2018 (In Finland about one quarter of the energy source could not be further specified = not assignable)
1 numbers for Finland without transport sector 2 Numbers derived from data provided in questionnaire for United States 3 Numbers derived from data provided in questionnaire for Denmark
0%
20%
40%
60%
80%
100%
Power demand supplied by... (Status 2018)
Coal Oil
Natural Gas Non-renewable and municipal waste
Other fossil Nuclear
Wind Solar
Water Other Renewables
Biomass not assignable
6
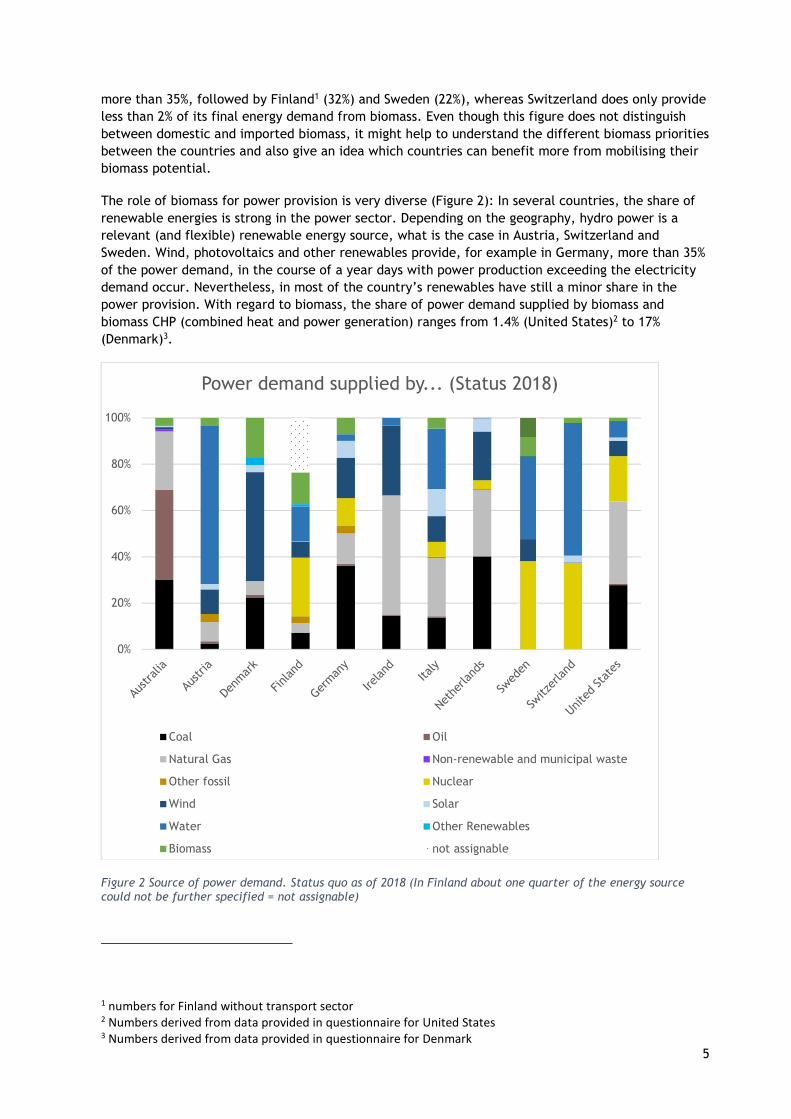
The role of bioenergy in heating and cooling is prominent compared to other uses (Figure 3). While in Sweden almost half (48.8%) of the heating and cooling energy is provided from biomass, in the Netherlands biomass has only a share of about 3.1%. Countries like Ireland and Australia depend strongly on fossil sources. Beside biomass heating systems, most of the countries have also biomass CHP systems implemented. The energy supplied by other renewable resources only play a minor role. The only country with a significant other renewable source for heating and cooling is Sweden, where geothermal energy has some impact.
Figure 3 Source of heating and cooling supply as status per 2018 (no data available for United States, in Finland and Germany around 30 and almost 40% of the energy sources were not specified, these are marked as “not assignable”)
In contrast, fossil fuels remain dominant in the transport sector (Figure 4). Biomass is the only renewable energy source that has an impact in the sector´s energy supply, but in most of the countries only with a minor share: In Australia, for example, 0.5% of transport energy originates from
0%
20%
40%
60%
80%
100%
Heating and cooling demand provided by....Status 2018
Fossil fuels Fossil CHP
Power to heat Non-renwable and municipal waste CHP
Non-renewable an municipal waste Other
Geothermal Solar
Solid Biofuels Gaseous Biofuels
Biomass CHP not assignable

7
biomass, while in most EU countries4, the share of bio-based fuels variates only between 4% (Denmark) and 10.8% (Netherlands). Only Sweden is exemplary with almost one fifth (19.5%) of transport energy from biomass.
Figure 4 Source of transport fuels as status per 2018 (no data provided for Finland)
These three figures underline the diverse role of biomass in the several energy systems of the surveyed countries. In all three sectors biomass is present in different shares in all of the countries. No other renewable energy source has this deep impact on the energy systems. However, the provision of bioenergy is not only influenced by a country’s energy demand, but also by the domestic resource base, which is strongly affected by the size of the area available and used for agriculture and forestry.
The application of bioenergy in base load or demand driven flexible mode depends on the specific market condition for each single plant. However, a more flexible bioenergy provision is currently expected in energy systems with higher shares of fluctuating renewables, and therefore we analysed, if flexible bioenergy is strategically initiated or supported in the energy transition strategies of the different countries.
4 EU countries have to fulfil the obligations of the EU Renewable Energies Directive II, which has to be adopted to national law and is binding for all member states.
0%
20%
40%
60%
80%
100%
Transport fuels demand provided by....Status 2018
Fossil fuels Power based fuels (PtX)
Domestic Biofuels Imported Biofuels
Imported Biomass for fuels production Direct power use
8
3. Status of Flexible Bioenergy
3.1 STATE OF TRANSITION TOWARDS RENEWABLES
The uptake of flexible bioenergy is driven by the motivation that the overall energy system is to be shifted towards renewables. A major driver is the climate impact of fossil-fuelled electricity production. Besides this, resource availability and dependency as well as a nuclear power phase out set the directions and mechanisms for the energy transition.
These different transformation efforts can be seen in the national phase out strategies for fossil fuel power. All information and figures presented in this section are derived from the countries answers within the questionnaires. The corresponding references are listed in the Annex. Several EU countries have set clear goals for certain fossils, e.g. Germany 2038 coal and lignite phase out, others envisaged strategies for all fossils, e.g. Sweden 2045 phase out for all fossils. But also, in the EU not all countries have determined a clear exit date (i.e. Austria, The Netherlands, and Italy). Other countries like the United States do not have phase out plans for coal at all. In Australia, there exists no clear strategy, however it has been mentioned that coal fired power stations are starting to retire and coal also becomes no longer competitive with renewables. In Finland, there is a law to ban the use of coal in the production of electricity and heat after 1th of May 2029, while in the United States there exists no phase out strategy at all.
Another motivating factor for an energy transition towards renewables is economic reasons induced by climate protection policy measures and the support of new technologies in this field. The latest political developments point to the wider acceptance of carbon prices, which raise the prices for fossil fuels and therefore increase the compatibility of bio-based energy. But these developments are rather reluctant and strongly dependent on political decisions.
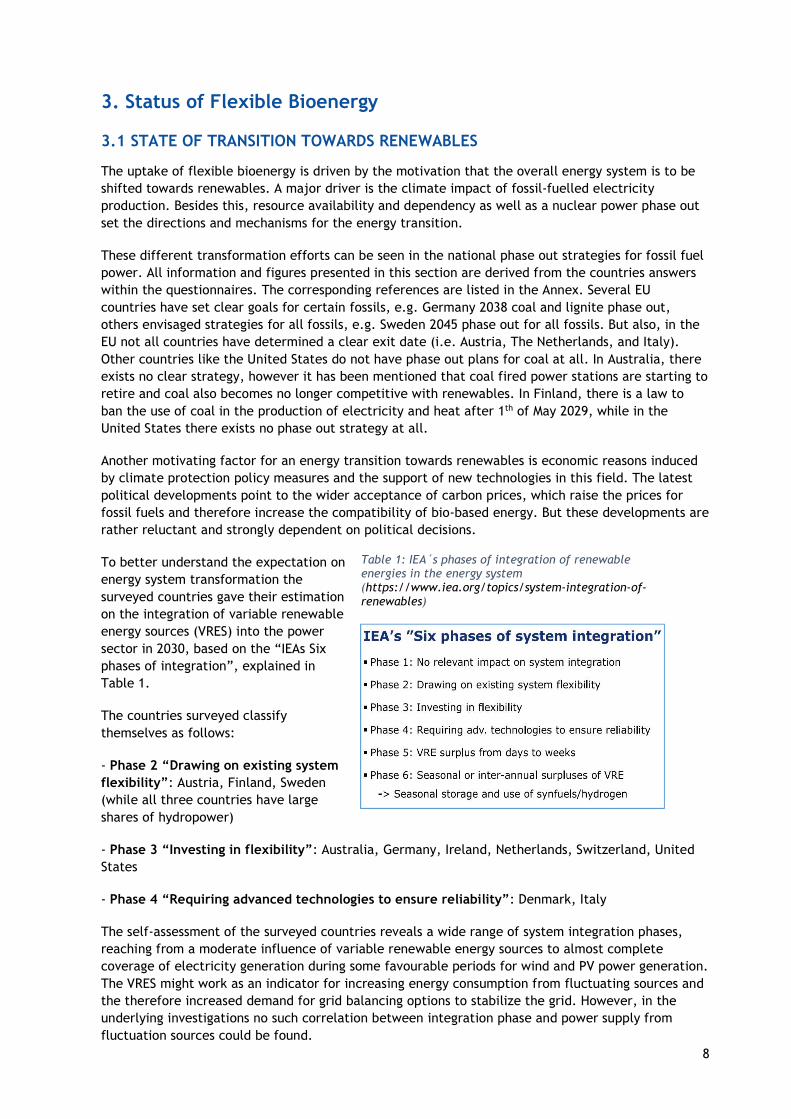
To better understand the expectation on energy system transformation the surveyed countries gave their estimation on the integration of variable renewable energy sources (VRES) into the power sector in 2030, based on the “IEAs Six phases of integration”, explained in Table 1.
The countries surveyed classify themselves as follows:
- Phase 2 “Drawing on existing system flexibility”: Austria, Finland, Sweden (while all three countries have large shares of hydropower)
- Phase 3 “Investing in flexibility”: Australia, Germany, Ireland, Netherlands, Switzerland, United States
- Phase 4 “Requiring advanced technologies to ensure reliability”: Denmark, Italy
The self-assessment of the surveyed countries reveals a wide range of system integration phases, reaching from a moderate influence of variable renewable energy sources to almost complete coverage of electricity generation during some favourable periods for wind and PV power generation. The VRES might work as an indicator for increasing energy consumption from fluctuating sources and the therefore increased demand for grid balancing options to stabilize the grid. However, in the underlying investigations no such correlation between integration phase and power supply from fluctuation sources could be found.
Table 1: IEA´s phases of integration of renewable energies in the energy system (https://www.iea.org/topics/system-integration-of-renewables)
2
The integration approach from IEA sets a focus on the power sector, therefore we also gave attention to this in our questionnaire. But with regard to sector coupling, flexible bioenergy will become also more prominent in the biofuels and biorefinery sector5,6. The definition in Chapter 1 points out these aspects and shows several examples of sector coupling and flexible bioenergy.
3.2 FLEXIBLE BIOENERGY CAPACITIES IN THE POWER SECTOR
Information regarding flexible bioenergy capacities as a specific bioenergy option is only provided by slightly more than half of the countries. Overall, half of the countries surveyed stated they had flexible bioenergy capacities in the electricity, heat or biofuels sector. This may imply, that half of the countries did not yet consider flexible bioenergy in their energy planning. Hence, it is not surprising that also with regard to mentioned measures to ensure grid stability, the respective measures vary from country to country: Besides storage alternatives, market-based balancing was mentioned as the most common measure (at least one of both was named by 10 of the 11 countries surveyed). Other answering options were reserves, flexible power supply or demand, cross-border balancing, balancing at grid level and capacity development.
The actual mechanisms to stabilize the grid were also analysed. Here the underlying question was, if there are similar actions indicating the VRES phase. Here the heterogeneity between the countries is obvious. According to Australian experts the only power grid stabilizing mechanism is to provide storage alternatives in the country, while the United States see only market-based balancing mechanisms. All other countries chose multiple options like Finland, where flexible power supply, cross border balancing and market-based mechanisms played a role. Italy named all, except cross-border balancing, as power grid stabilizing mechanisms. In Denmark storage alternatives and cross-border balancing are most important. Austria favours storage alternatives, market-based balancing and balancing at grid level. For Germany marked-based balancing has the highest priority, followed by flexible power supply, storage alternatives and balancing at grid level. In contrast, in Ireland market-based balancing and balancing at grid level are equally important. In Switzerland storage alternatives have a high priority followed by balancing at grid level and cross-border balancing. In the Netherlands the cross-border balancing plays the most important role with minor roles for market-based balancing and flexible power supply. Moreover, Sweden counts on market-based balancing besides balancing at grid level and flexible power supply.
Overall, the mechanisms for grid stability are very much adapted to each countries energy system and thus hardly comparable. They might be dependent on the size of the power grid, the share of fluctuating power sources already integrated in the system and the geographic location.
In Figure 5 the phase of integrating VRES in the power system is illustrated along with the share of biomass fulfilling the power demand. This picture shows that a high share of biomass in power demand does not necessarily go along with a more advanced phase of VRES integration. For example, comparing Finland and Denmark with relatively high shares of 18 and 13 percent of power production from biomass the integration level differs. Finland sees itself at the stage of drawing on existing flexibility (phase 2) while Denmark indicates to require advanced technologies to ensure reliability. Perhaps this corresponds with different expectations on flexible bioenergy, as countries with a lower
5 Thrän, D., Dotzauer, M., Lenz, V. et al. Flexible bioenergy supply for balancing fluctuating renewables in the heat and power sector—a review of technologies and concepts. Energ Sustain Soc 5, 35 (2015). https://doi.org/10.1186/s13705-015-0062-8 6 Hakkarainen, E., Hannula, I. and Vakkilainen, E. (2019), Bioenergy RES hybrids − assessment of status in Finland, Austria, Germany, and Denmark. Biofuels, Bioprod. Bioref., 13: 1402-1416. https://doi.org/10.1002/bbb.2019

3
share of power demand covered by biomass see themselves in the phase of investing in flexibility. Nevertheless, for countries like the United States this figure might distort the status, as there is a wide variety between federal states concerning the implementation of flexibility measures and the share of biomass used. In Figure 6 the integration phases and availability of information on flexible bioenergy capacities are shown. As the surveyed countries only mentioned to probably have achieved phase four in 2030, the other two phases are not shown in the figure.
Figure 5 Integration phase of Variable Renewable Energy Sources and share of biomass supplying power demand
Figure 6 Consideration of flexible bioenergy for system integration. The length of the bar shows the expected integration phase of variable renewable energy sources in 2030, the colours indicate whether information on flexible bioenergy capacities are available
Germany
Finland
Denmark
Austria
AustraliaIreland
Italy
Sweden
Switzerl
United StatesNetherlands
0%
5%
10%
15%
20%
1 2 3 4 5
Shar
e of
Bio
mas
s &
Bio
mas
s CH
P in
po
wer
dem
and
Level of Integration of Variable Renewable Energy Sources (VRES)
Integration of Variable Renewable Energy Sources (VRES) and share of Biomass & Biomass CHP in
power demand
4
4. Expectation on flexible Bioenergy
4.1 NATIONAL GOALS TO IMPLEMENT FLEXIBLE BIOENERGY
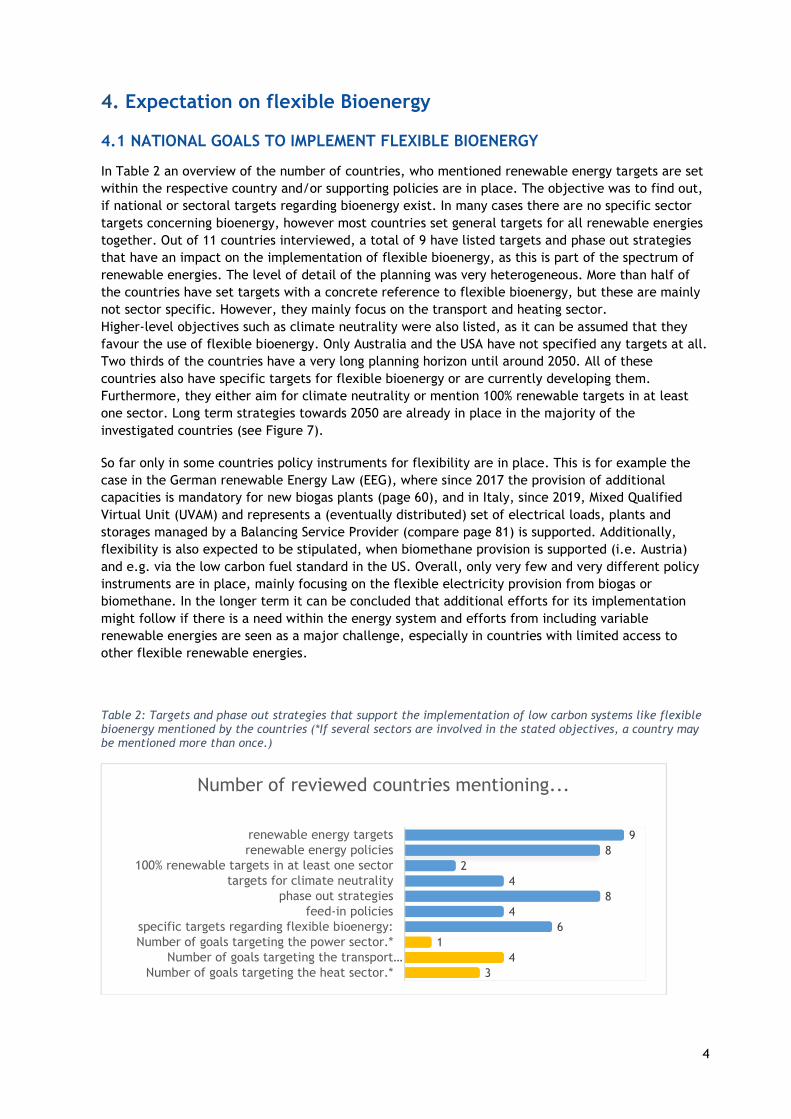
In Table 2 an overview of the number of countries, who mentioned renewable energy targets are set within the respective country and/or supporting policies are in place. The objective was to find out, if national or sectoral targets regarding bioenergy exist. In many cases there are no specific sector targets concerning bioenergy, however most countries set general targets for all renewable energies together. Out of 11 countries interviewed, a total of 9 have listed targets and phase out strategies that have an impact on the implementation of flexible bioenergy, as this is part of the spectrum of renewable energies. The level of detail of the planning was very heterogeneous. More than half of the countries have set targets with a concrete reference to flexible bioenergy, but these are mainly not sector specific. However, they mainly focus on the transport and heating sector. Higher-level objectives such as climate neutrality were also listed, as it can be assumed that they favour the use of flexible bioenergy. Only Australia and the USA have not specified any targets at all. Two thirds of the countries have a very long planning horizon until around 2050. All of these countries also have specific targets for flexible bioenergy or are currently developing them. Furthermore, they either aim for climate neutrality or mention 100% renewable targets in at least one sector. Long term strategies towards 2050 are already in place in the majority of the investigated countries (see Figure 7).
So far only in some countries policy instruments for flexibility are in place. This is for example the case in the German renewable Energy Law (EEG), where since 2017 the provision of additional capacities is mandatory for new biogas plants (page 60), and in Italy, since 2019, Mixed Qualified Virtual Unit (UVAM) and represents a (eventually distributed) set of electrical loads, plants and storages managed by a Balancing Service Provider (compare page 81) is supported. Additionally, flexibility is also expected to be stipulated, when biomethane provision is supported (i.e. Austria) and e.g. via the low carbon fuel standard in the US. Overall, only very few and very different policy instruments are in place, mainly focusing on the flexible electricity provision from biogas or biomethane. In the longer term it can be concluded that additional efforts for its implementation might follow if there is a need within the energy system and efforts from including variable renewable energies are seen as a major challenge, especially in countries with limited access to other flexible renewable energies.
Table 2: Targets and phase out strategies that support the implementation of low carbon systems like flexible bioenergy mentioned by the countries (*If several sectors are involved in the stated objectives, a country may be mentioned more than once.)
98
24
84
61
43
renewable energy targetsrenewable energy policies
100% renewable targets in at least one sectortargets for climate neutrality
phase out strategiesfeed-in policies
specific targets regarding flexible bioenergy:Number of goals targeting the power sector.*
Number of goals targeting the transport…Number of goals targeting the heat sector.*
Number of reviewed countries mentioning...

5
Figure 7 Furthest planning horizon mentioned for targets related to the implementation of (flexible) bioenergy
4.2 OPPORTUNITIES
They are manifold opportunities stated by the different countries:
Australia: This is relatively unknown. It is generally understood that biomass as source is competitive feedstock to fossil for heat/power provision.
Austria: Biogas for electricity are supposed to be upgraded for biomethane injection. Also, biomass gasification for BtL or for gas grid injection is seen as an opportunity.
Denmark: The analysis made by Energinet.dk “system perspective 2035”7 has clarified that Denmark has a huge potential with respect to the implementation of flexible bioenergy systems.
Finland: A study by VTT commissioned by IRENA “Bioenergy from Finnish forests - Sustainable, efficient, modern use of wood” describes some of the current opportunities for flexible bioenergy use are seen with CHP in Finland. Additionally, connection to industrial and residential heat loads is considered as a potential future option for flexible bioenergy systems. A number of studies are on-going to describe the value of flexible bioenergy systems. Flexible BtL-provision is also seen as an opportunity, especially for Nordic countries8.
7 ENERGINET (2018). SYSTEM PERSPECTIVE 2035. Long-term perspectives for efficient use of renewable energy in the Danish energy system. https://en.energinet.dk/-/media/Energinet/Analyser-og-Forskning-RMS/Dokumenter/Analyser/_Analyser-Engelsk/System-Perspective-2035---Main-Report_English.pdf. 8Ikäheimo, Jussi; Pursiheimo, Esa; Kiviluoma, Juha; Holttinen Hannele (2019). The role of power to liquids and biomass to liquids in a nearly renewable energy system. IET Renewable Power Generation 13 (7), 1179-1189
2050
2050
2050
2050
2025
2041
2050
2045
2050
Australia
Austria
Denmark
Finland
Germany
Ireland
Italy
Netherlands
Sweden
Switzerland
United States
2020 2025 2030 2035 2040 2045 2050year
Maximum planning horizon for targets related to the implementation of flexible bioenergy
no goals mentioned
no goals mentioned

6
Germany: An increased proportion of (flexible operating) biogas plants reduces the demand (and therefore the costs) for additional storage technologies and conventional power plants9. An optimal expansion and use of bioenergy plants may reduce the total system costs by approx. 300 million €/a according to estimates. Furthermore, bioenergy can make a positive contribution as a complementary flexibility and CHP option to the decarbonisation of both the electricity and heat markets and at the same time to the security of supply10.
Ireland: This area has not received adequate attention in Ireland. A number of high-level energy system studies have examined energy system configurations that align with the Paris Climate Agreements (source in reference list) however a detailed modelling of flexible bioenergy has not been undertaken. A number of academic publications have investigated the role and use of electro-fuels and power to gas system within the power system context.
Italy: Under the actual legal situation a number of biogas plants could have to redefine their business plan, or even decide to stop operations. Options are to provide low-carbon energy for grid stabilization or act as “peaker” plants to cover residual load, complementing wind and solar. The decree11 explicitly states that, when transforming a biogas power plant to a biomethane production site, it is possible to maintain part of the previous electricity production level. In addition to that, biomethane plants could find a synergy with the installation of electrolyser to chemically store, through methanation process, electricity into fuels and enable a way to use wind and solar surplus energy.
Netherlands: Currently biomass is used as a heating fuel and in CHP installations. A number of coal power stations use biomass for co-firing. One of the coal power plants delivers also heat to district heating and will switch from 80% biomass co-firing to 100% biomass. On the long-term biofuel is seen as a source for materials, biofuels and heat.
Sweden: There is a need for more flexible power because due to a problem with power capacity (MW) resulting from weather depended production and capacity shortage in the electrical grid between the North and South of Sweden and to large cities.
Switzerland: A study called “biomass swarm” suggests to produce biomethane which is injected in the gas grid and reused in CHPs with heat storage. If a sufficiently high number of these CHPs can be jointly operated, they can be used to stabilize the electricity grid while covering the heat demand of the building12. Additional elaboration on concepts on regional level 13 and in connection with waste water treatment14 has been done.
9Lauer, M. (2019). Economic assessment of biogas plants as a flexibility option in future electricity systems. PhD thesis. University of Leipzig. 10Fleischer, B. (2017). Beitrag der Bioenergie zur gekoppelten Elektrizitäts- und Wärmeerzeugung in Deutschland http://www.strise.de/fileadmin/user_upload/Aktuelles/2017_Stgt_Dialog/08_Poster_Fleischer_Bioenergie.pdf. 11MISE, MATTM, & MiPAAF. (2018). D.M. 2 March 2018 - Promozione dell’uso del biometano e degli altri biocarburanti avanzati nel settore dei trasporti. https://www.gse.it/documenti_site/Documenti GSE/Servizi per te/BIOMETANO/NORMATIVA/D.M. MiSE 2 marzo 2018.pdf 12 Buffat, René & Martin, Raubal. (2019). Spatio-temporal potential of a biogenic micro CHP swarm in Switzerland. Renewable and Sustainable Energy Reviews. 103. 443-454. 10.1016/j.rser.2018.12.038. 13 Ballmer, I.; Thees, O.; Lemm, R.; Burg, V. & Erni, M. (2015). Erneuerbare Energien Aargau. Sind die Ziele der nationalen Energiestrategie im Aargau erreichbar? WSL Berichte: Vol. 29. Birmensdorf: Eidg. Forschungs-anstalt für Wald, Schnee und Landschaft WSL. (https://www.dora.lib4ri.ch/wsl/islandora/object/wsl:9090) 14 Biollaz, S.; Calbry-Muzyka, A.; Schildhauer,T.; Witte, J. & A. Kunz. (2017). Direct Methanation of Biogas. Final report. Swiss Federal Office of Energy SFOEBiomass and wood energy Research Programme. https://www.aramis.admin.ch/Default.aspx?DocumentID=45656&Load=true.

7
USA: As in many places in Europe, curtailed electricity is becoming a noticeable phenomenon in certain areas of the country, such as California and Texas. As the deployment of renewables continues, this will likely become more significant. This could possibly represent an opportunity for bioenergy solutions.
When categorizing the answers in seven groups (substituting fossil fuels, supporting energy system transformation, offering flexibility, heat use, biofuels, reducing energy system costs, carbon capture & storage) it can be noted - with the exception of Australia – that all countries have listed options from at least two different categories. The summary in Figure 8 shows that six out of eleven countries see opportunities in replacing fossil fuels and/or supporting the transformation of the energy system. Flexibility that can be gained through bioenergy, as well as using heat, was mentioned by one third. Nevertheless, this list is not intended to be a ranking, as the reasons for the preference of potential fields of use are very diverse. For example, some countries with other flexibility options tend to see the use of biomass more in the heating sector, as the demand for alternatives is greater in that field.
Figure 8 Current and future opportunities for the implementation of flexible bioenergy systems both in and between the different energy sectors
8
4.3 SECTORS THAT CAN BENEFIT FROM FLEXIBLE BIOENERGY IMPLEMENTATION
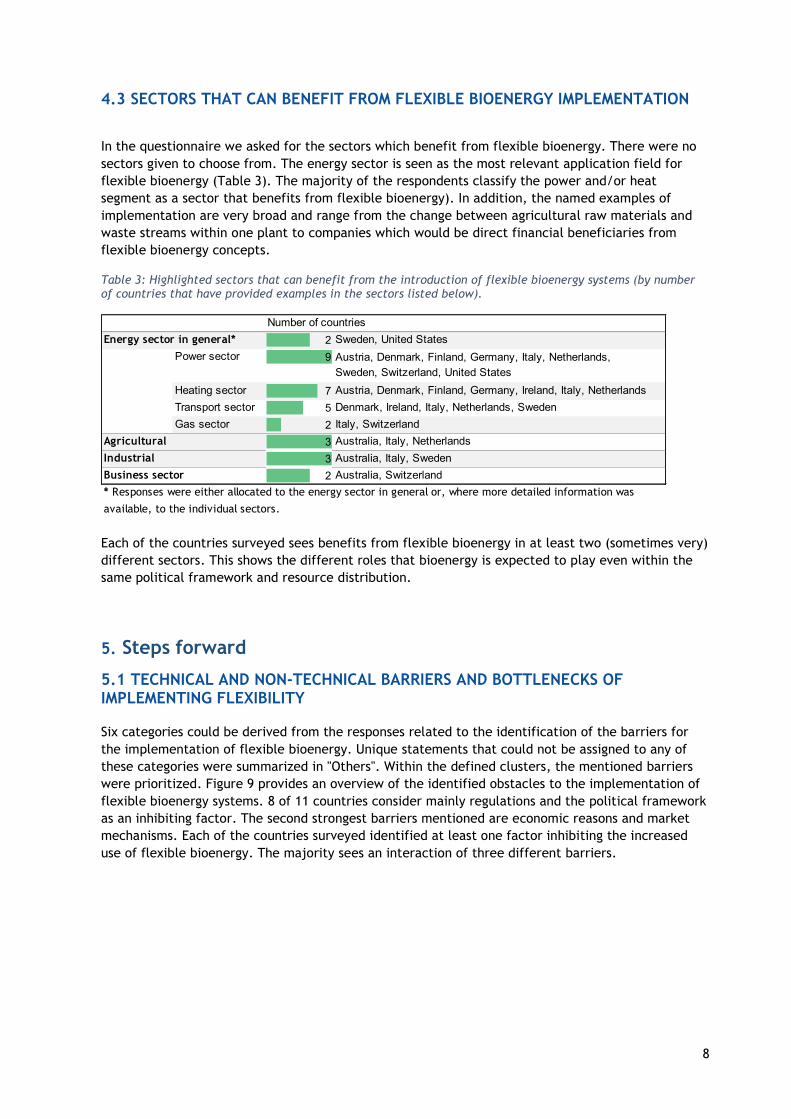
In the questionnaire we asked for the sectors which benefit from flexible bioenergy. There were no sectors given to choose from. The energy sector is seen as the most relevant application field for flexible bioenergy (Table 3). The majority of the respondents classify the power and/or heat segment as a sector that benefits from flexible bioenergy). In addition, the named examples of implementation are very broad and range from the change between agricultural raw materials and waste streams within one plant to companies which would be direct financial beneficiaries from flexible bioenergy concepts.
Table 3: Highlighted sectors that can benefit from the introduction of flexible bioenergy systems (by number of countries that have provided examples in the sectors listed below).
Each of the countries surveyed sees benefits from flexible bioenergy in at least two (sometimes very) different sectors. This shows the different roles that bioenergy is expected to play even within the same political framework and resource distribution.
5. Steps forward
5.1 TECHNICAL AND NON-TECHNICAL BARRIERS AND BOTTLENECKS OF IMPLEMENTING FLEXIBILITY
Six categories could be derived from the responses related to the identification of the barriers for the implementation of flexible bioenergy. Unique statements that could not be assigned to any of these categories were summarized in "Others". Within the defined clusters, the mentioned barriers were prioritized. Figure 9 provides an overview of the identified obstacles to the implementation of flexible bioenergy systems. 8 of 11 countries consider mainly regulations and the political framework as an inhibiting factor. The second strongest barriers mentioned are economic reasons and market mechanisms. Each of the countries surveyed identified at least one factor inhibiting the increased use of flexible bioenergy. The majority sees an interaction of three different barriers.
Number of countries
2 Sweden, United States
Power sector 9
Heating sector 7 Austria, Denmark, Finland, Germany, Ireland, Italy, Netherlands
Transport sector 5 Denmark, Ireland, Italy, Netherlands, Sweden
Gas sector 2 Italy, Switzerland
Agricultural 3 Australia, Italy, Netherlands
Industrial 3 Australia, Italy, Sweden
2 Australia, Switzerland
Austria, Denmark, Finland, Germany, Italy, Netherlands,
* Responses were either allocated to the energy sector in general or, where more detailed information was
available, to the individual sectors.
Business sector
Sweden, Switzerland, United States
Energy sector in general*

9
Figure 9 Country-specific presentation of the categorised barriers. The larger the coloured circle, the more relevant the barrier is. The different colours represent the barrier categories
5.2 POLICY INSTRUMENTS DRIVING FLEXIBILITY As regulatory framework is seen as most important, four categories could be derived from existing and expected incentives (political instruments or other activities), which promote the implementation of flexible bioenergy systems within and between different energy sectors, mentioned within the surveys:
governmental support, financial incentives, legal guidelines, research and economically driven projects.
Accordingly, governmental support with 38 % and legal guidelines with 35 % of the responses represent the strongest incentives.
The importance that the countries assign to legal guidelines and framework conditions is also clearly evident in the incentives for greater flexibility.
10
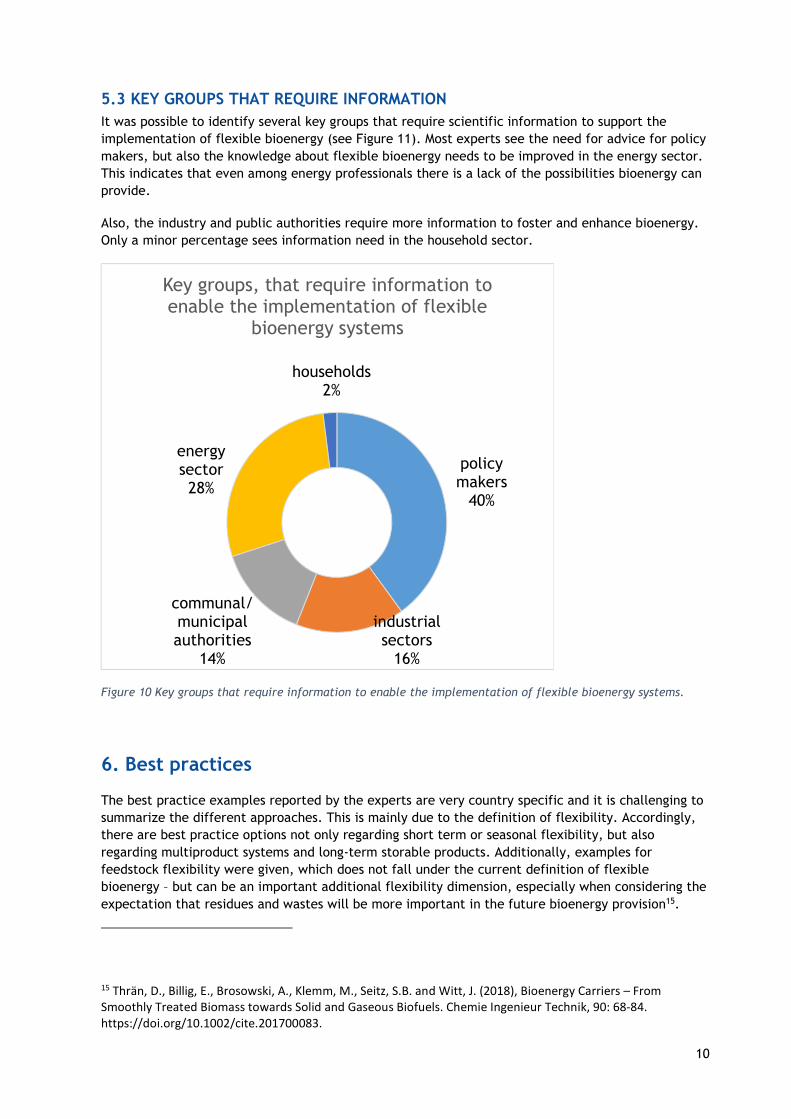
5.3 KEY GROUPS THAT REQUIRE INFORMATION It was possible to identify several key groups that require scientific information to support the implementation of flexible bioenergy (see Figure 11). Most experts see the need for advice for policy makers, but also the knowledge about flexible bioenergy needs to be improved in the energy sector. This indicates that even among energy professionals there is a lack of the possibilities bioenergy can provide.
Also, the industry and public authorities require more information to foster and enhance bioenergy. Only a minor percentage sees information need in the household sector.
Figure 10 Key groups that require information to enable the implementation of flexible bioenergy systems.
6. Best practices
The best practice examples reported by the experts are very country specific and it is challenging to summarize the different approaches. This is mainly due to the definition of flexibility. Accordingly, there are best practice options not only regarding short term or seasonal flexibility, but also regarding multiproduct systems and long-term storable products. Additionally, examples for feedstock flexibility were given, which does not fall under the current definition of flexible bioenergy – but can be an important additional flexibility dimension, especially when considering the expectation that residues and wastes will be more important in the future bioenergy provision15.
15 Thrän, D., Billig, E., Brosowski, A., Klemm, M., Seitz, S.B. and Witt, J. (2018), Bioenergy Carriers – From Smoothly Treated Biomass towards Solid and Gaseous Biofuels. Chemie Ingenieur Technik, 90: 68-84. https://doi.org/10.1002/cite.201700083.
policy makers
40%
industrial sectors
16%
communal/municipal authorities
14%
energy sector28%
households2%
Key groups, that require information to enable the implementation of flexible
bioenergy systems
11
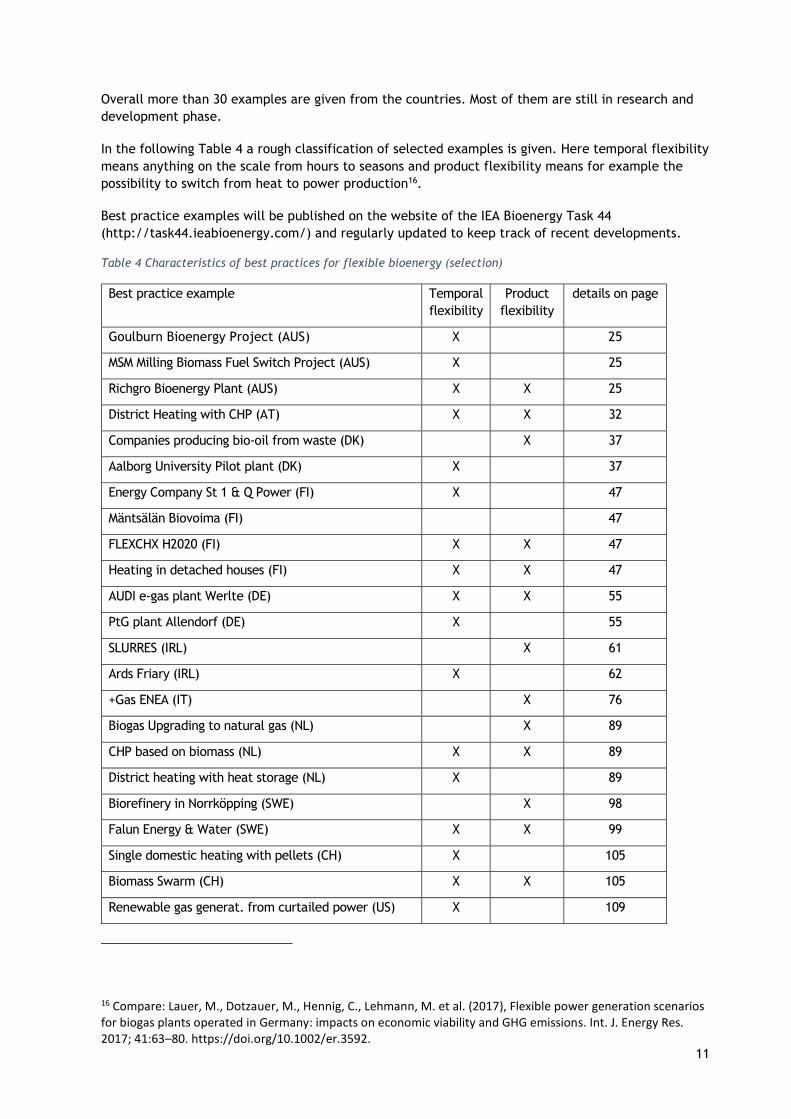
Overall more than 30 examples are given from the countries. Most of them are still in research and development phase.
In the following Table 4 a rough classification of selected examples is given. Here temporal flexibility means anything on the scale from hours to seasons and product flexibility means for example the possibility to switch from heat to power production16.
Best practice examples will be published on the website of the IEA Bioenergy Task 44 (http://task44.ieabioenergy.com/) and regularly updated to keep track of recent developments.
Table 4 Characteristics of best practices for flexible bioenergy (selection)
Best practice example Temporal flexibility
Product flexibility
details on page
Goulburn Bioenergy Project (AUS) X 25
MSM Milling Biomass Fuel Switch Project (AUS) X 25
Richgro Bioenergy Plant (AUS) X X 25
District Heating with CHP (AT) X X 32
Companies producing bio-oil from waste (DK) X 37
Aalborg University Pilot plant (DK) X 37
Energy Company St 1 & Q Power (FI) X 47
Mäntsälän Biovoima (FI) 47
FLEXCHX H2020 (FI) X X 47
Heating in detached houses (FI) X X 47
AUDI e-gas plant Werlte (DE) X X 55
PtG plant Allendorf (DE) X 55
SLURRES (IRL) X 61
Ards Friary (IRL) X 62
+Gas ENEA (IT) X 76
Biogas Upgrading to natural gas (NL) X 89
CHP based on biomass (NL) X X 89
District heating with heat storage (NL) X 89
Biorefinery in Norrköpping (SWE) X 98
Falun Energy & Water (SWE) X X 99
Single domestic heating with pellets (CH) X 105
Biomass Swarm (CH) X X 105
Renewable gas generat. from curtailed power (US) X 109
16 Compare: Lauer, M., Dotzauer, M., Hennig, C., Lehmann, M. et al. (2017), Flexible power generation scenarios for biogas plants operated in Germany: impacts on economic viability and GHG emissions. Int. J. Energy Res. 2017; 41:63–80. https://doi.org/10.1002/er.3592.
12
7. Conclusion
This report compares eleven OECD members in their status and expectation on flexible bioenergy. This includes Australia, Austria, Denmark, Finland, Germany, Ireland, Italy, Netherlands, Sweden, Switzerland and the United States of America.
Flexible bioenergy – as defined in IEA Bioenergy Task 44 - is a bioenergy system that can provide multiple services and benefits to the energy system under varying operating conditions and/or loads. However, even though the IEA Bioenergy Task 44 conducted country surveys with experts in the field, only general data were widely available. Especially data on flexible bioenergy are often inaccessible. This limits the range of conclusions and the comparability of statements. Furthermore, some information represent the expert knowledge and data or information beyond this were not considered important. From the responses to the questionnaires it can be also stated that the development of flexible bioenergy is still in an early stage and clarification of terms, definition and also the different potential benefits from flexible bioenergy is still necessary.
Also in countries which are already in a more advanced phase of integrating variable renewable energy sources comprehensive information on flexible bioenergy was not available and a more coherent policy framework was often still missing. This implies that the energy systems underlie other drivers. When introducing flexible bioenergy, the priorities of using flexibility measures might depend on the actual bioenergy use in the different countries in the sectors power generation, heating and cooling and transport. The specific shares of energy provision from biomass vary between sectors and countries, however the share in power and transport seem to be lower than in heating and cooling sector.
On the one hand, the introduction of variable renewable energies in the electricity sector increases the demand for flexibility – which is stated by different countries as an interesting new operation case, especially for the CHP units. In parallel, policy framework and regulation support an increased use of bioenergy, as demonstrated in the EU-countries with the use of biofuels in transport sector. Here the political framework and regulation support the intake of bioenergy in the system, which might increase the interest in multi-product systems.
Regarding the expectations of bioenergy and especially flexible bioenergy the main driver is to substitute fossil fuels and reach carbon neutrality. The opportunities indicate that bioenergy is expected to be flexible, sustainable and available in different sectors, which is in line with the characteristics of bioenergy. But focusing on the barriers a lack of regulation and insufficient political framework along with market barriers become prominent. These barriers could originate in the diverse implementation possibilities of bioenergy. Analysing the barriers also indicates that certain stakeholders as policy makers and the energy sector require more information. In this field research institutions can be supportive and provide information on technologies, costs and energy system related aspects.
The overall assessment points out the importance of information for the energy sector and policy makers. This can lead to a policy and regulatory framework that supports the use of bioenergy. Market barriers can be addressed by incentivizing bioenergy intake considering multiple benefits like sector coupling, flexibility and resource availability
To introduce flexible bioenergy there is no blue print at the table. However, most of the countries mentioned best practice examples. As a first area of action we propose a better promotion of best practices, as there is a wide variety of options to use biomass in different sectors (https://task44.ieabioenergy.com/best-practices/) and analysis of their replication potential. Additionally, the countries see the need to encourage demonstration in pilot plants, which requires support by renewable energy research, implementation actions but also from an economic point of view. Technological aspects did not seem to be a major challenge, but the economic feasible integration of the technologies in the overall energy system. Therefore, we propose a stronger link

13
between flexible bioenergy and other options for flexibility, such as demand side management, energy storage, power-to-X and also green hydrogen.
14
ANNEX
Australia
Sources:
1. Australian Bureau of Statistics https://www.abs.gov.au/AUSSTATS/[email protected]/Web+Pages/Population+Clock?opendocument&ref=HPKI
2. Geoscience Australia https://www.ga.gov.au/scientific-topics/national-location-information/dimensions/area-of-australia-states-and-territories
3. Parliament of Australia https://www.aph.gov.au/About_Parliament/Parliamentary_Departments/Parliamentary_Library/pubs/MSB/feature/FeatureGDP
4. Australian Energy Update 2019, Department of Environment and Energy https://www.energy.gov.au/sites/default/files/australian_energy_statistics_2019_energy_update_report_september.pdf
5. AUSTRALIAN COLLABORATIVE LAND USE AND MANAGEMENT PROGRAM (ACLUMP) www.abares.gov.au/landusehttps://www.agriculture.gov.au/sites/default/files/abares/aclump/documents/Land%20use%20in%20Australia%20at%20a%20glance%202016.pdf
6. The Australian bioenergy and energy from waste market, CEFC, 2015 https://www.cefc.com.au/media/107567/the-australian-bioenergy-and-energy-from-waste-market-cefc-market-report.pdf
7. Department of the Environment and Energy (2019) Australian Energy Statistics
8. Energy storage Financing speed bumps and opportunities, February 2019. https://www.pwc.com.au/infrastructure/pwc-energy-storage-financing-speed-humps.pdf
9. Renewable Energy Options for Industrial Process Heat, November 2019. https://arena.gov.au/assets/2019/11/renewable-energy-options-for-industrial-process-heat.pdf
10. Biofuels and Transport: An Australian opportunity, Nov 2019 https://arena.gov.au/assets/2019/11/biofuels-and-transport-an-australian-opportunity.pdf
11.https://apps.fas.usda.gov/newgainapi/api/report/downloadreportbyfilename?filename=Biofuels%20Annual_Canberra_Australia_8-15-2017.pdf

15
GENERAL COUNTRY INFORMATION
Population (Millions) 25.6
Surface (km²) 7700000
GDP ($/capita) 57374
Final energy consumption (PJ/a) 4342
Information on electricity prices are not available
In the following Figure 11 the energy flows between resources and consumption side are displayed in a Sankey chart.
Figure 11 Status of the Australian distribution of energy sources in heat, elect. and transp. in PJ

16
Figure 12 Australia: power, heating and cooling and transport energy demand supplied by ...
Australia’s dependence from fossil fuels is especially distinct in the transport sector, 99,5% of all fuels are based on fossil resources. While in heating and cooling around 13% of the energy are biomass based, the share in power sector is about 3,1%.
0%
20%
40%
60%
80%
100%
Australia
Power demand supplied by... (Status 2018)
Non-renewable andmunicipal waste CHPNatural Gas CHP
Oil CHP
Coal CHP
Water
Other Renewables
Geothermal
Biomass CHP
Biomass
Solar
0%
20%
40%
60%
80%
100%
Australia
Heating and cooling demand provided by....
Status 2018
Other
Power to heat
Biomass CHP
Gaseous Biofuels
Solid Biofuels
Solar
Geothermal
0%
20%
40%
60%
80%
100%
Australia
Transport fuels demand provided
by....Status 2018
Direct power use
Power based fuels (PtX)
Imported Biomass forfuels production
Imported Biofuels
Fossil fuels
Domestic Biofuels
17
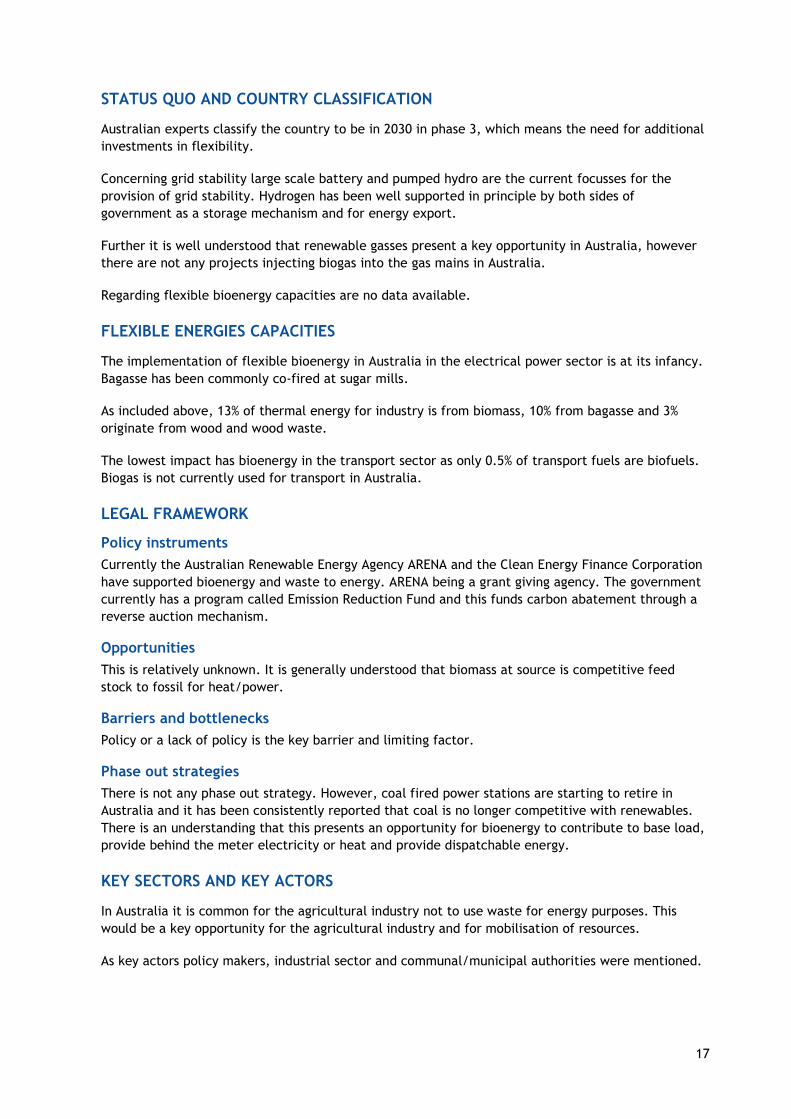
STATUS QUO AND COUNTRY CLASSIFICATION
Australian experts classify the country to be in 2030 in phase 3, which means the need for additional investments in flexibility.
Concerning grid stability large scale battery and pumped hydro are the current focusses for the provision of grid stability. Hydrogen has been well supported in principle by both sides of government as a storage mechanism and for energy export.
Further it is well understood that renewable gasses present a key opportunity in Australia, however there are not any projects injecting biogas into the gas mains in Australia.
Regarding flexible bioenergy capacities are no data available.
FLEXIBLE ENERGIES CAPACITIES
The implementation of flexible bioenergy in Australia in the electrical power sector is at its infancy. Bagasse has been commonly co-fired at sugar mills.
As included above, 13% of thermal energy for industry is from biomass, 10% from bagasse and 3% originate from wood and wood waste.
The lowest impact has bioenergy in the transport sector as only 0.5% of transport fuels are biofuels. Biogas is not currently used for transport in Australia.
LEGAL FRAMEWORK
Policy instruments
Currently the Australian Renewable Energy Agency ARENA and the Clean Energy Finance Corporation have supported bioenergy and waste to energy. ARENA being a grant giving agency. The government currently has a program called Emission Reduction Fund and this funds carbon abatement through a reverse auction mechanism.
Opportunities
This is relatively unknown. It is generally understood that biomass at source is competitive feed stock to fossil for heat/power.
Barriers and bottlenecks
Policy or a lack of policy is the key barrier and limiting factor.
Phase out strategies
There is not any phase out strategy. However, coal fired power stations are starting to retire in Australia and it has been consistently reported that coal is no longer competitive with renewables. There is an understanding that this presents an opportunity for bioenergy to contribute to base load, provide behind the meter electricity or heat and provide dispatchable energy.
KEY SECTORS AND KEY ACTORS
In Australia it is common for the agricultural industry not to use waste for energy purposes. This would be a key opportunity for the agricultural industry and for mobilisation of resources.
As key actors policy makers, industrial sector and communal/municipal authorities were mentioned.
18
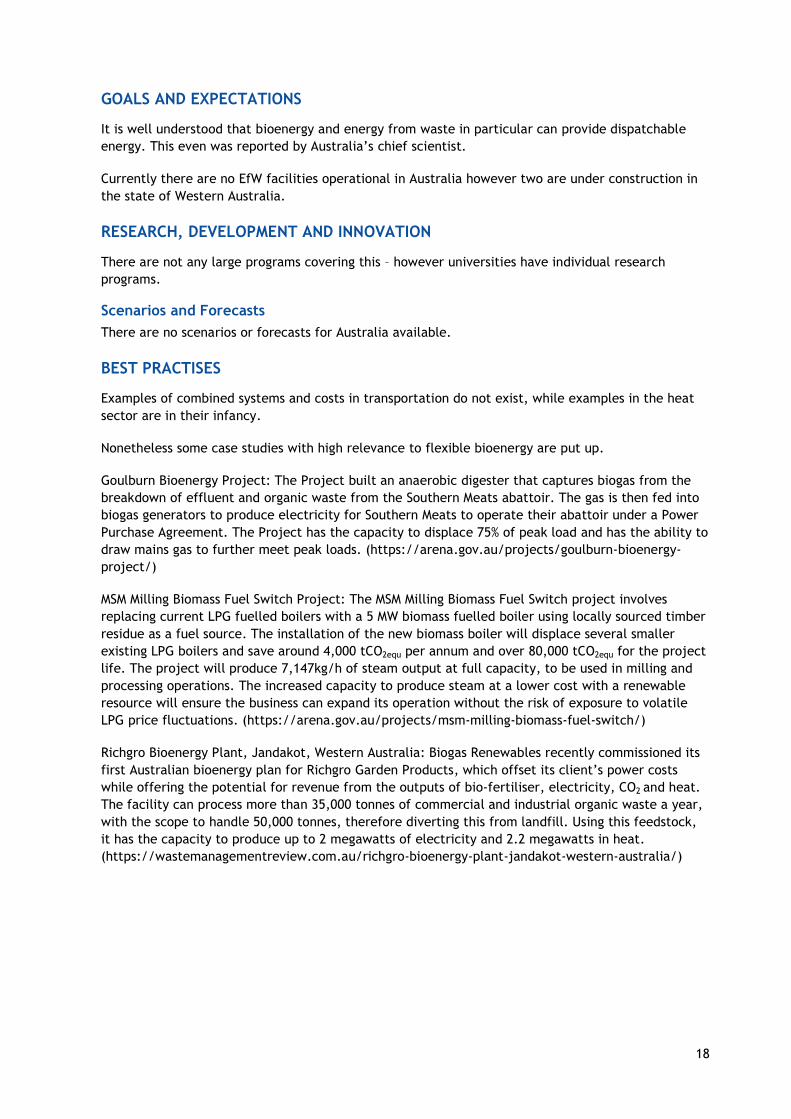
GOALS AND EXPECTATIONS
It is well understood that bioenergy and energy from waste in particular can provide dispatchable energy. This even was reported by Australia’s chief scientist.
Currently there are no EfW facilities operational in Australia however two are under construction in the state of Western Australia.
RESEARCH, DEVELOPMENT AND INNOVATION
There are not any large programs covering this – however universities have individual research programs.
Scenarios and Forecasts
There are no scenarios or forecasts for Australia available.
BEST PRACTISES
Examples of combined systems and costs in transportation do not exist, while examples in the heat sector are in their infancy.
Nonetheless some case studies with high relevance to flexible bioenergy are put up.
Goulburn Bioenergy Project: The Project built an anaerobic digester that captures biogas from the breakdown of effluent and organic waste from the Southern Meats abattoir. The gas is then fed into biogas generators to produce electricity for Southern Meats to operate their abattoir under a Power Purchase Agreement. The Project has the capacity to displace 75% of peak load and has the ability to draw mains gas to further meet peak loads. (https://arena.gov.au/projects/goulburn-bioenergy-project/)
MSM Milling Biomass Fuel Switch Project: The MSM Milling Biomass Fuel Switch project involves replacing current LPG fuelled boilers with a 5 MW biomass fuelled boiler using locally sourced timber residue as a fuel source. The installation of the new biomass boiler will displace several smaller existing LPG boilers and save around 4,000 tCO2equ per annum and over 80,000 tCO2equ for the project life. The project will produce 7,147kg/h of steam output at full capacity, to be used in milling and processing operations. The increased capacity to produce steam at a lower cost with a renewable resource will ensure the business can expand its operation without the risk of exposure to volatile LPG price fluctuations. (https://arena.gov.au/projects/msm-milling-biomass-fuel-switch/)
Richgro Bioenergy Plant, Jandakot, Western Australia: Biogas Renewables recently commissioned its first Australian bioenergy plan for Richgro Garden Products, which offset its client’s power costs while offering the potential for revenue from the outputs of bio-fertiliser, electricity, CO2 and heat. The facility can process more than 35,000 tonnes of commercial and industrial organic waste a year, with the scope to handle 50,000 tonnes, therefore diverting this from landfill. Using this feedstock, it has the capacity to produce up to 2 megawatts of electricity and 2.2 megawatts in heat. (https://wastemanagementreview.com.au/richgro-bioenergy-plant-jandakot-western-australia/)

19
Austria
Sources:
1. Statistik Austria. Bevölkerungsstatistik [Internet]. 2020 [cited 20. December 2019]. http://www.statistik.at/web_de/statistiken/menschen_und_gesellschaft/bevoelkerung/index.html
2. WKO Statistik. Fläche und Benützungsarten [Internet]. 2019 [cited 20. December 2019]. http://wko.at/statistik/bundesland/Fl%C3%A4cheBen.pdf
3. Statistik Austria. Volkswirtschaftliche Gesamtrechnungen. 2020 [cited 20. December 2019]. http://www.statistik.at/web_de/statistiken/wirtschaft/volkswirtschaftliche_gesamtrechnungen/index.html
4. ECB euro reference exchange rate: US Dollar (USD). European Central Bank. [cited 20. December 2019]. https://www.ecb.europa.eu/stats/policy_and_exchange_rates/euro_reference_exchange_rates/html/eurofxref-graph-usd.en.html
5. Statistik Austria. Energiebilanzen [Internet]. 2020 [cited 5. January 2020]. https://www.statistik.at/web_de/statistiken/energie_umwelt_innovation_mobilitaet/energie_und_umwelt/energie/energiebilanzen/index.html
6. BMNT. Grüner Bericht 2019 [Internet]. 2019 [cited 5. January 2020]. https://gruenerbericht.at/cm4/jdownload/send/2-gr-bericht-terreich/2007-gb2019
7. Austrian Biomass Association. Basisdaten Bioenergie 2019. 2019.
8. Hoefnagels R, Kluts I, Junginger M, Visser L, Resch G, Mantau U, u. a. Sustainable and optimal use of biomass for energy in the EU beyond 2020. Annexes of the Final Report. 2017.
9. Krutzler T, Zechmeister A, Stranner G, Wiesenberger H, Gallauner T, Gössl M, u. a. Energie- und Treibhausgas-Szenarien im Hinblick auf 2030 und 2050 - Synthesebericht 2017 [Internet]. 2017 [cited 11. Juli 2018]. http://www.umweltbundesamt.at/fileadmin/site/publikationen/REP0628.pdf
10. E-Control. Assets [Internet]. 2019 [cited 20. December 2019]. https://www.e-control.at/statistik/strom/bestandsstatistik
11. Haas R, Resch G, Burgholzer B, Totschnig G, Lettner G, Auer H, u. a. Analyse der Erfor-dernisse und Konsequenzen eines ambitionierten Ausbaus erneuerbarer Energien. 2017;98.
12. Kranzl L, Müller A, Büchele R. Wärmezukunft 2050: Anforderungen an die Gebäude-sanierung [Internet]. 2018 [cited 11. Juli 2018]. https://eeg.tuwien.ac.at/eeg.tuwien.ac.at_pages/research/downloads/PR_472_TU-Studie_Anforderungen_Gebaeudesanierung_Langfassung.pdf
13. Persson U, Werner S. Quantifying the Heating and Cooling Demand in Europe [Internet]. Halmstadt; 2015. https://heatroadmap.eu/wp-content/uploads/2018/09/STRATEGO-WP2-Background-Report-4-Heat-Cold-Demands.pdf
14. BMNT. Österreichischer Biokraftstoffbericht 2019, bmnt.gv.at . 2020 [cited 7. January 2020]. https://www.bmnt.gv.at/umwelt/luft-laerm-verkehr/biokraftstoffbericht.html
15. Statistik Austria. Versorgungsbilanzen [Internet]. 2019 [cited 20. December 2019]. http://www.statistik.at/web_de/statistiken/wirtschaft/land_und_forstwirtschaft/preise_bilanzen/versorgungsbilanzen/index.html
20
16. bmvfi National Renewable Energy Action Plan 2010 for Austria (NREAP-AT) [Internet]. https://www.buildup.eu/sites/default/files/content/national_renewable_energy_action_plan_austria_en.pdf
17. ÖSG. Bundesgesetz über die Förderung der Elektrizitätserzeugung aus erneuerbaren Energieträgern (Ökostromgesetz 2012 – ÖSG 2012) [Internet]. 2012. https://www.ris.bka.gv.at/GeltendeFassung.wxe?Abfrage=Bundesnormen&Gesetzesnummer=20007386
18. KVO. Verordnung des Bundesministers für Land- und Forstwirtschaft, Umwelt und Wasser-wirtschaft über die Qualität von Kraftstoffen und die nachhaltige Verwendung von Biokraft-stoffen (Kraftstoffverordnung 2012) [Internet]. 2012. https://www.ris.bka.gv.at/GeltendeFassung.wxe?Abfrage=Bundesnormen&Gesetzesnummer=20008075
19. MöStG. Bundesgesetz, mit dem die Mineralölsteuer an das Gemeinschaftsrecht angepasst wird (Mineralölsteuergesetz 1995). 1995. https://www.ris.bka.gv.at/GeltendeFassung.wxe?Abfrage=Bundesnormen&Gesetzesnummer=10004908
20. Winter R, bmlfuw. Biokraftstoffe im Verkehrssektor 2014. 2014.
21. BMNT, BMVIT. #mission2030 Die österreichische Klima- und Energiestrategie [Internet]. 2018 [cited 23. Juli 2018]. https://mission2030.info/wp-content/uploads/2018/06/Klima-Energiestrategie.pdf
22. ÖVP, Die Grünen. Regierungsprogramm 2020-2024. 2020.
23. Misak DK. Versorgungssicherheit in Österreich –. 2018;19.
24. entsoe. ENTSO-E Transparency Platform [Internet]. 2020 [cited 9. January 2020]. https://transparency.entsoe.eu/
GENERAL COUNTRY INFORMATION
Population ( Millions) 8.8
Surface (km²) 84000
GDP ($/capita) 52000
Final energy consumption (PJ/a) 1100
Average spreads between base and peak prices in 2018 (between 8am and 8pm) have been around 19 €/MWh at average daily prices of 46 €/MWh the price Base-Peak-Spread accounts for -27 €/MWh in 2018. Electricity prices between Germany and Austria have been coupled until end of September 2018, prices starting with October 2018 are Austrian prices only.
21
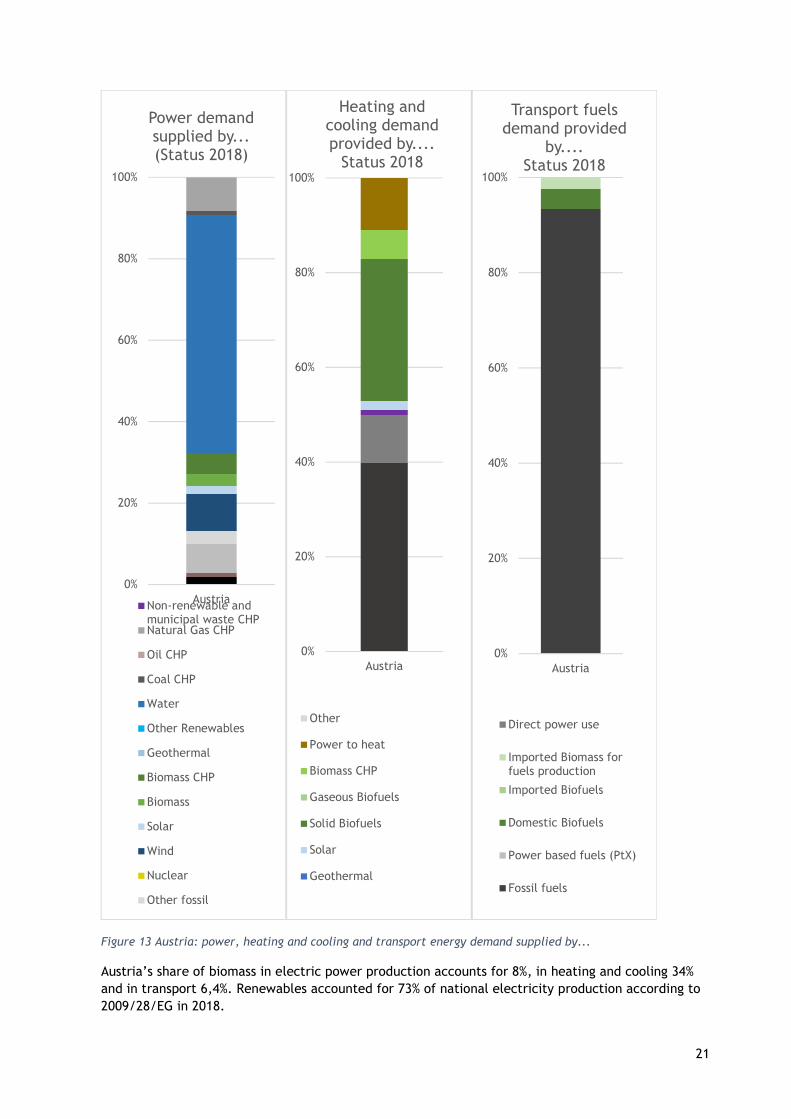
Figure 13 Austria: power, heating and cooling and transport energy demand supplied by...
Austria’s share of biomass in electric power production accounts for 8%, in heating and cooling 34% and in transport 6,4%. Renewables accounted for 73% of national electricity production according to 2009/28/EG in 2018.
0%
20%
40%
60%
80%
100%
Austria
Power demand supplied by... (Status 2018)
Non-renewable andmunicipal waste CHPNatural Gas CHP
Oil CHP
Coal CHP
Water
Other Renewables
Geothermal
Biomass CHP
Biomass
Solar
Wind
Nuclear
Other fossil
0%
20%
40%
60%
80%
100%
Austria
Heating and cooling demand provided by....
Status 2018
Other
Power to heat
Biomass CHP
Gaseous Biofuels
Solid Biofuels
Solar
Geothermal
0%
20%
40%
60%
80%
100%
Austria
Transport fuels demand provided
by....Status 2018
Direct power use
Imported Biomass forfuels production
Imported Biofuels
Domestic Biofuels
Power based fuels (PtX)
Fossil fuels
22
STATUS QUO AND COUNTRY CLASSIFICATION
Austrian experts classify the country in Phase 2, where flexibility issues emerge but the system is able to cope with them through minor operational modifications.
Actual mechanisms to stabilize the grid include (a) short-term balancing based on automatic reserves and manual reserves (seconds), balancing market (minutes), intra-day markets (hours) (b) mid-term balancing based on day-ahead markets (days), hydro planning (months/seasonal) and (c) long-term based on capacity investments.
Austrian grid stabilization capacity draws from the historically grown pumping storage park. In total 8,4 GW turbines are installed with 3,9 GW pumping capacity, 3.200 GWh able to perform a load peak of 10,9 GW. Furthermore, redispatch played an important role with about 4.600 GWh in 2017 of which 90% came from caloric power plants and only 10% from hydraulic plants. Only 64 from 365 days could be performed without redispatch. The national grid provider (APG) highlights a grid extension plan in the magnitude of € 2,9 Mio including 220 km additional grids and 100 km grids for upgrade to higher voltages. The Masterplan 2030 includes the closing of the 380 kV ring in the eastern parts of Austria and an extension between the variable renewable energy producing region in the east and the pumping storage capacities in the western part of the country to tackle these regional bottlenecks.
Greening the gas grid task force is in place to improve the role of renewable gas.
Flexible bioenergy systems in the power and heat sector comprise 388 MW installed in 2018 (CHP with solid and gaseous bioenergy).
Concerning related electricity and heat provision are 3 MWh electricity and 4 MWh heat in place in 2018.
FLEXIBLE ENERGIES CAPACITIES
Electrical power system: The National Renewable Action Plan (NREAP) from 2010 set a 71% renewable electricity target. (16)
Renewables accounted for 73% of national electricity production according to 2009/28/EG in 2018. (5)
The Green Electricity Act sets the following targets of new installations until 2020: Hydro 1,000 MW; Wind 2,000 MW; PV 1,200 MW; Biomass and Biogas 200 MW. To handle the decentralised conversion into electricity through the injection of biomethane into the gas grid the Biomethane Registry Austria was put into operation in 2012. (17)
As of 2019 in total 270 biogas plants are operational with an electrical capacity of 86 MWel and an output of 565 GWhel2018 and 350 GWhth2018 as well as 170 GWhCH4_2018 (and 1,5 Mio t2018 fertilizer).
Furthermore, a capacity of 302 MWel with an output of 2.266 GWhel2018 and 4.023 GWhth2018 of combined heat and power plants (CHP) in the form of district heating (17% of district heating is CHP) are operational. More and more wood gasifiers are used. (7)
Renewables accounted for 10% in transport according to 2009/28/EG in 2018. (5)
Production capacity for biodiesel dropped from 14 plants in 2013 to 9 plants in 2018 with capacities from 650.000 t2013 to 480.000 t2018 and an output of 290.000 t2018. Feedstock input are 60% spent cooking oils and animal fats versus 40% fresh plant oils. Bioethanol production was at about 200.000 t2018 which is about 230% of the domestic demand. Feedstocks are mainly corn (50%) and wheat (40%) as well as triticale and starch sludge. (14)

23
LEGAL FRAMEWORK
Policy instruments
The Emission Reduction Fund, a governmental program, funds carbon abatement through a reverse auction mechanism.
Austria has implemented the relevant European Directives into national law. Hence, there exist a Green Electricity Act (Ökostromgesetz), which has been amended in 2019, a heat strategy (Wärmestrategie), an Energy efficiency act (Energieeffizienzgesetz), several energy and climate plans at federal level, an Act on the support of renewable energies (Erneuerbaren Ausbaugesetz (EAG)), an ecofriendly tax reform and an Energy strategy. Further the EU Green Deal, EU Gas Pact, EU Directives on the Emission Trading System and on Market Design, Energy Efficiency in Buildings and the Energy Union have impact as legal instruments.
Under the Green Electricity Act (Ökostromgesetz), a technology specific support of plants producing electricity on the basis of renewables (solid, liquid, gaseous biomass, wind power, photovoltaics, landfill and sewage gas, geothermic and small hydropower) is provided by means of fixed feed-in tariffs. Biogas plants have mainly been built based on the Ökostromgesetz 2002 in the period of 2004-2008 (increasing average capacity from 30 kWel to 280 kWel) but almost stagnating in the last decade. Most plants will be able to stay in production until the new Act on the support of renewable energies (Erneuerbaren Ausbaugesetz (EAG)) will be put in place, increasingly for upgrade to biomethane injection.
The Environmental Measures Support Act (Umweltförderungsgesetz) defines measures and support for environmental protection. The main topics focus on areas of support, financing, responsibility and procedural regulations. Various general areas of support are covered; the promotion of renewable energies is laid down in detail in the guidelines for domestic environmental support (Umweltförderung im Inland (UFI)). Generally, up to 30% of investment costs can be covered for biomass based systems for the following technologies and sizes: (1) individual biomass units up to 400 kWth, (2) individual biomass units from 400 kWth, (3) biomass CHP, (4) biomass microgrids, (5) local biomass heating.
The implementation of measures relating to buildings mainly lies in the competence of the nine federal regions, however the conclusion of the agreement between federal and state government was able to introduce an essential step to the harmonisation and reinforcement of RE measures in the building sector. The federal state governments have for the most part already implemented the obligations agreed on in the Article 15a B-VG Agreement in the respective state-specific housing support laws. A detailed overview of the housing support laws of all federal states can be found in Annex 1 of the National Renewable Energy Action Plan
The housing support (Wohnbauförderung (WBF)) is the promotional tool with which both the construction of housing as well as the remediation of residential buildings is supported. Since the implementation of building-related measures lies in local competence, the conditions of eligibility in the respective federal states are regulated just as differently as the type and level of housing support.
Furthermore, a subsidy scheme for wood heating form the Climate & Energy Fund for private households applies to the substitution of fossil fuel based heating systems with pellet and wood-chip central heating systems and pellet stoves.
The Fuel Order Amendment (Kraftstoffverordnung( KVO)), changed in 2012, lays down the Biofuels Directive (2003/30/EG), the Renewables Directive (2009/28/EG) and the Fuel Quality Directive (2009/30/EG) in Austrian law. It regulates a biofuel substitution of 5.75%, measured by the energy content of total fossil petrol or diesel introduced or used in the federal territory. By 2020 the
24
substitution target of 8.45% (with regard to energy content) has to be fulfilled with ensuring GHG-mitigation of at least 35% until 2017 and 50% (to 60% for new installations) later. Starting with July 2014, only biofuels meeting the mitigation requirements are allowed to be used for a tax relief determined by the Mineral Oil Duty Act (Mineralölsteuergesetz). (18,19)
Since 2013 the verification of sustainability requirements is mandatory for all Austrian producers using an electronic monitoring system called elNa. The tool was created by the Austrian Environmental Agency to minimize the administrative burden and to facilitate the data transfer with other monitoring systems. Other than the German NABISY-system only transport relevant certificates are covered. (20)
Opportunities
Biogas for electricity are supposed to be upgraded for biomethane injection. Also biomass gasification for BtL or for gas grid injection is seen as an opportunity.
Barriers and bottlenecks
The Feed in tariff for CHP plants using solid biomass of a total capacity of 210 MW end between 2017-2021 (yearly production of 1,3 TWh). 160 MW have been covered by the Act on the support of biomass use (Biomasseförderungsgrundgesetz) for the transition period to the Act on the support of renewable energies (Erneuerbaren Ausbaugesetz (EAG)).
There are no feed-in tariffs in place for biomethane, as well as no integration into the housing support (Wohnbauförderung). There is no level-playing field for renewable gas in transport with e-mobility.
Biomass gasification for BtL or for gas-grid injection: In general, high feedstock prices ask for flexibility of gasifiers in terms of flexible feedstock utilization.
Phase out strategies
So far the Mission2030 climate and energy strategy aims for a complete phase out of fossil oil heating boilers in the next 20-30 years, tantamount to the full decarbonization until 2050. (21)
The government taking up their work in 2020 pledged for a phase-out of coal and oil for heating starting with 2020 (for new buildings, 2021 in case of changing heating installations, 2025 for boiler older than 25 years and 2035 for all boiler), phase-out of gas boilers in new buildings starting with 2025. (22)
KEY SECTORS AND KEY ACTORS
In the electricity sector less importance is seen since large pump storage capacities existent but no dedicated biomass power plants.
For heating and cooling sector seasonal storage via solid but also gaseous bioenergy carriers is provided. Additional revenue streams can be sourced with electricity production but also hybrid systems.
In the transport sector no sign of additional efforts beyond the EU directives are mentioned, eventually for aviation. Also, maritime transport does not play a big role since Austria is land-locked and only transports via the Danube.
GOALS AND EXPECTATIONS
In May 2018 the Austrian Federal Government decided upon the climate and energy strategy Mission2030. It presents a pathway to full decarbonization of the energy system by 2050 with the goals of 100% renewable electricity production in 2030 and augmented sector coupling. The numbers in the tables of this document are mainly derived from the consultation process regarding the
25
related goals and expectations. (21)
In January 2020 a government program of the new Austrian Federal Government for the government period 2020-2024 was published with the pledges to extend Austrian climate and energy politics. Main pledges include climate neutrality until 2040, phase-out of coal and oil for heating starting with 2020 (for new buildings, 2021 in case of changing heating installations, 2025 for boiler older than 25 years and 2035 for all boiler), phase-out of gas boilers in new buildings starting with 2025, an Act on the support of renewable energies (Erneuerbaren Ausbaugesetz (EAG)) with the expansion 2030 targets of 11 TWh PV, 10 TWh Wind, 5 TWh Hydro, 1 TWh biomass and 1 Million roof top PV installations. 5 TWh of green gas (including biomethane and green hydrogen) should be injected into the gas grid. The gas grid will not be extended for heating purposes, only densified. Furthermore, a mobility master plan 2030 will be developed and a 3% rate of building refurbishment are envisaged and a working group for a possible CO2-tax initiated. (22)
The National Renewable Action Plan (NREAP) from 2010 set a 33% renewable heating and cooling target. (16)
The Green Electricity Act sets the following targets of new installations until 2020: Hydro 1,000 MW; Wind 2,000 MW; PV 1,200 MW; Biomass and Biogas 200 MW.
The National Renewable Action Plan (NREAP) from 2010 set a 11% renewable transport target. (16)
By 2020 the substitution target of 8.45% (with regard to energy content) has to be fulfilled with ensuring GHG-mitigation of at least 35% until 2017 and 50% (to 60% for new installations) later.
RESEARCH, DEVELOPMENT AND INNOVATION
Austrian experts support the IEA Solar Heating and Cooling program (SHC) in Task 55 and IEA Bioenergy TCPs.
Other relevant projects are: https://clara-h2020.eu/
https://www.heattofuel.eu/
ReGas4Industry (national FFG project)
Research Studios Austria project “OptFuel”
https://boku.ac.at/map/ivet/arbeitsgruppe-energietechnik-und-energiemanagement/energy-engineering/bioflexnet/
Microbial Electrolysis Cells (MECs) for the reduction of CO2 to liquid and gaseous energy carriers (ACIB Austrian Centre of Industrial Biotechnology)
Case studies with high relevance to flexible bioenergy do not exist.
Scenarios and Forecasts
Some scenarios and forecasts were provided with the questionnaire.
BEST PRACTISES
Examples of flexible bioenergy systems in the heat sector are in place as 17% of district heating is from CHP.
26
Denmark
Sources:
1. Denmark’s Statistic – Statistikbanken - www.statistikbanken.dk (The National Danish Statistics Bank), accessed 2/4-2020).
2. Basisfremskrivning, 2019, The Danish Energy Authorities. https://ens.dk/service/fremskrivninger-analyser-modeller/basisfremskrivninger and enclosures (https://ens.dk/service/fremskrivninger-analyser-modeller/baggrundsbilag-til-fremskrivninger)
3. Energistatistik, 2018, The Danish Energy Authorities. https://ens.dk/service/statistik-data-noegletal-og-kort/maanedlig-og-aarlig-energistatistik
4. Analyse af bioenergi i Danmark, University of Copenhagen and The Danish Energy Authorities - https://ens.dk/sites/ens.dk/files/Bioenergi/bioenergi_-_analyse_2014_web.pdf
5. Security of electricity supply in Denmark, Energinet, 2018. https://ens.dk/sites/ens.dk/files/Globalcooperation/security_of_electricity_supply_in_denmark.pdf
6. Energiscenarier from mod 2020, 2035 og 2050 - analyse. The Danish Energy Authorities, 2014. https://ens.dk/sites/ens.dk/files/Basisfremskrivning/energiscenarier_-_analyse_2014_web.pdf
7. National report 2019 for Denmark. Developments in 2018. Danish Utility Regulators, Oct. 2019. https://forsyningstilsynet.dk/media/6616/national-report-2019-for-denmark.pdf
8. Energy scenarios. The Danish Energy Authorities, 2020, 2035 and 2050. https://ens.dk/sites/ens.dk/files/Analyser/energiscenarier_uk.pdf
9. System perspective 2035, Energinet.dk, 2018. https://en.energinet.dk/systemperspective2035 (full report and background report in Danish can be found here with all enclosures: https://energinet.dk/Analyse-og-Forskning/Analyser/RS-Analyse-Marts-2018-Systemperspektiv-2035
GENERAL COUNTRY INFORMATION
Population ( Millions) 5.8
Surface (km²) 43054
GDP ($/capita) 62888
Final energy consumption (PJ/a) 645
Denmark is divided into DK1 and DK2 (West- and East Denmark). The prices typically differ in these two regions. The average hourly spot prices in 2018 were respectively 44.1 and 46.2 EUR/MWh [7] with no spreads.

27
Figure 14 Denmark: power, heating and cooling and transport energy demand supplied by...
Denmark’s share of biomass in power accounts for 17%, in heating and cooling for 34% and in transport for 4%.
0%
20%
40%
60%
80%
100%
Denmark
Power demand supplied by... (Status 2018)
Non-renewable andmunicipal waste CHPNatural Gas CHP
Oil CHP
Coal CHP
Water
Other Renewables
Geothermal
Biomass CHP
Biomass
Solar
0%
20%
40%
60%
80%
100%
Denmark
Heating and cooling demand provided by....
Status 2018
Other
Power to heat
Biomass CHP
Gaseous Biofuels
Solid Biofuels
Solar
Geothermal
Non-renewable an municipalwasteNon-renwable and municipalwaste CHPFossil CHP
Fossil fuels
0%
20%
40%
60%
80%
100%
Denmark
Transport fuels demand provided
by....Status 2018
Direct power use
Power based fuels (PtX)
Imported Biomass forfuels production
Imported Biofuels
Fossil fuels
Domestic Biofuels
28
STATUS QUO AND COUNTRY CLASSIFICATION
Denmark’s experts classify the country to be in phase 4 - Requiring advanced technologies to ensure reliability through structural surpluses of VRE generation leading to curtailment.
In the existing power grid, Denmark already has advanced compensation stations to cope with the intermittent nature and challenges integrating more uncontrollable renewable energy in the grid. Electrification will occur until 2050 where various technologies such as power2x and heat pumps should help balancing the grid.
We have a strong backup for regulating power from for instance our many minor CHP-plants and further compensation is also installed (see [5]). Many of these plants are operated on solid biomass and a few on biogas. We have had challenges maintaining grid frequency in certain situations. Particularly, after periods of strong wind in West Denmark followed by weak wind. Production from off shore wind can change rapidly within minutes. Also fluctuating power production due to partly cloudy weather from photovoltaics. Our new and projected power lines to our neighbouring countries and GB should also help compensating for such fluctuations.
There are plans for the substitution of natural gas with renewable gas in some of the scenarios – see [7].
FLEXIBLE ENERGIES CAPACITIES
There are no official detailed description of flexible/hybrid bioenergy planning in Denmark as such. However, Energinet.dk the Danish power/gas TSO has described various scenarios [9]. Also, the analysis from the Danish Energy Authorities from 2014 – “Energiscenarier – Analyse” gives some indication of the magnitude of hydrogenation plants and other similar routes to flexible bioenergy systems, however not many details. The expert has not been able to find the figures for the table below.
LEGAL FRAMEWORK
Since the 80’ties Denmark have had various plans for reduction of greenhouse gas emissions. Plans with concrete goals such as the Energy 2000 plan and its follow-up Energy 2005 had concrete greenhouse gas emission reduction goals. These plans have generally been fulfilled up to the 2020 goals. For instance, we have generally reduced the greenhouse gas emissions in the period from 2005-2020 by 20%. Use of biomass in heating plants and co-firing of biomass were important factors in reaching these goals. The Danish government in 2019 made new legislations for supporting biomass combustion in 2019. The supporting arrangement has been changed for new plants where existing plants can still get support in a certain period. The EU goal of minimum 39% renewable energy was also achieved in 2020. The EU directive on annual energy savings from 2014-2020 of 1.5% has also been reached. The goal of 10% renewable energy in transportation has also been reached in 2020. The overall goal for 2050 was set forward with “Klimaloven” in 2014 and were confirmed with “Energiaftalen” in 2018.
In 2019 a new legislation for supporting biomass combustion was amended.
Policy instruments
There is a requirement for legislation driving the best possible development of flexible bioenergy in Denmark. To the expert’s knowledge, there has not been implemented many concrete policy instruments in this field. Denmark does have supporting schemes for energy produced using renewable energy in general though. In the recent political “energy agreement” (i.e. “Energiaftalen”), funds have now also been allocated for projects involving “other green gases” than biogas. Besides this supporting scheme for energy produced using renewable energy in general is in place.
29
Opportunities
The analysis made by Energinet.dk “system perspective 2035” [9] has clarified that Denmark has a huge potential with respect to the implementation of flexible bioenergy systems.
Barriers and bottlenecks
The implementation of flexible bioenergy plants will depend strongly on the chosen energy scenario towards 2050. Currently, solutions have mainly been to substitute coal with combustion of wood pellets. If this development continuous this could restrict the development of flexible bioenergy plants enabling production of the fuels necessary for the transportation sector and for the production of other necessary commodities in Danish society.
Phase out strategies
All use of coal should be phased out in the energy sector by 2030. By 2030 70% of the total energy demand should be covered by renewable energy. By 2050 all fossil fuels including oil derivatives and natural gas should be phased out.
KEY SECTORS AND KEY ACTORS
The fuel-, heat- and power sectors will be able to benefit but in principle, also many other actors could also benefit from the implementation. It is believed that society as a whole could benefit from these systems.
All mentioned key groups are very relevant, for example: policy makers, industrial sectors, communal/municipal authorities.
GOALS AND EXPECTATIONS
More specifically Denmark now pursues the following national and EU-goals:
• Greenhouse gas emissions should be reduced by 70% in 2030 relative to the 1990 level (set forward by the Danish Government and its supporting party’s in June 2019. A recent report from “Klimarådet” published November 2019 (i.e. the Danish Climate Council) states that this goal is achievable but will require further actions to be realized.
• The share of renewable energy in the final primary energy consumption should be 55% by 2030 (“Energiaftalen” – an energy agreement made by most political parties in Denmark). The Danish climate council in November 2019 stated that we are on-track fulfilling this goal.
• The greenhouse gas emissions in the non-quota sector should be reduced by 39% in 2030 relative to the 2005 level (EU, 2018). The Danish climate council in Nov. 2019 evaluated that the goal can be reached but that more actions need to be taken.
• Carbon storage in soil and forest (EU-demand on non-negative net emissions in the periods 2021-2024 and 2026-2030). The Danish climate council in Nov. 2019 evaluated that we are on-track with these requirements.
• New energy savings every year in the period from 2021-2030 of 0.8% of the average final energy consumption in the period 2016-2018 (EU-directive. 2018). The Danish climate council in Nov. 2019 evaluated that the goal can be reached but that more measures must be taken in order to do so.
More than 100% of the electricity should be produced by renewables by 2030 (we will be net exporters of electricity), while 70% of the total energy demand shall be covered by renewable energy.
30
Energy 2000 plan and Energy 2005 shall be fulfilled up to 2020, meaning reduced greenhouse gas emissions from 2005-2020 by 20%. Also, annual energy savings from 2014-2020 of 1.5% should be accountable, as well as 10% share of renewable energy in transportation is expected to be reached.
Goals of biomass use vary depending on the Danish scenarios towards 2050. Specific targets for flexible bioenergy are currently determined. Biomass should support actual reductions of greenhouse gas emissions to reach global goals (stabilization by 2050, the two-degree target in year 2100). Biodiversity, soil, air and water quality should be kept or improved. Use of bioenergy technologies should be used minimizing the cost of introduction. High energy supply safety should be ensured (electricity and fuel supply) and go along with efficient use of resources. No particular targets set for thermal energy, but this area is involved in the overall targets described above.
A share of renewable energy of 7% in the transport sector. This is achievable but the Danish Climate Council have in November 2019 evaluated that further actions must be taken to realize the goal.
RESEARCH, DEVELOPMENT AND INNOVATION
Currently, in Denmark are more than 20 on-going research projects on PtX, more projects have been finalized and even more focusing on other combined flexible biofuel systems.
Scenarios and Forecasts
Scenarios and Forecasts were provided within the questionnaire. However, there are currently 20-30 national on-going projects pursuing different PtX pathways.
BEST PRACTISES
Examples of combined systems and costs in transportation are companies producing bio-oil from waste products. Multiple pilot scale PtX plants are currently being constructed and tested.
Only very limited information on costs. On biogas based power2methanol plants, the selling price for methanol has been estimated in the range of 400-600€/metric ton to reach feasible business cases based on the present worth value of the plants. Some students have made crude estimates regarding the investment cost of such plants.
In the heat sector the following example will be shared. As mentioned, currently these are mainly pilot plants. Over the coming years more plants are projected. Below a photo of our pilot scale plant at Aalborg University synthesizing CO2 from biogas and hydrogen from an electrolysis plant to methanol. The Danish TSO Energinet.dk has proposed a significant utilization of PtX in the future Danish energy supply.

31
Figure 15 Danish pilot scale plant at Aalborg University
Figure 16 Danish pilot scale plant at Aalborg University - testing
Case studies with high relevance to flexible bioenergy are:
• Green lab in Skive (https://www.greenlab.dk/) • The company Rockwool in Øster Doense (near Hobro) has a joint venture on flexible
bioenergy with a company SINTEX and Hydrogenvalley in Hobro. This is done through the Power2Met-project involving Aalborg University and several other project partners: http://hydrogenvalley.dk/power2met/
• The power2gas BioCat project at Avedøre, Copenhagen (http://biocat-project.com/)
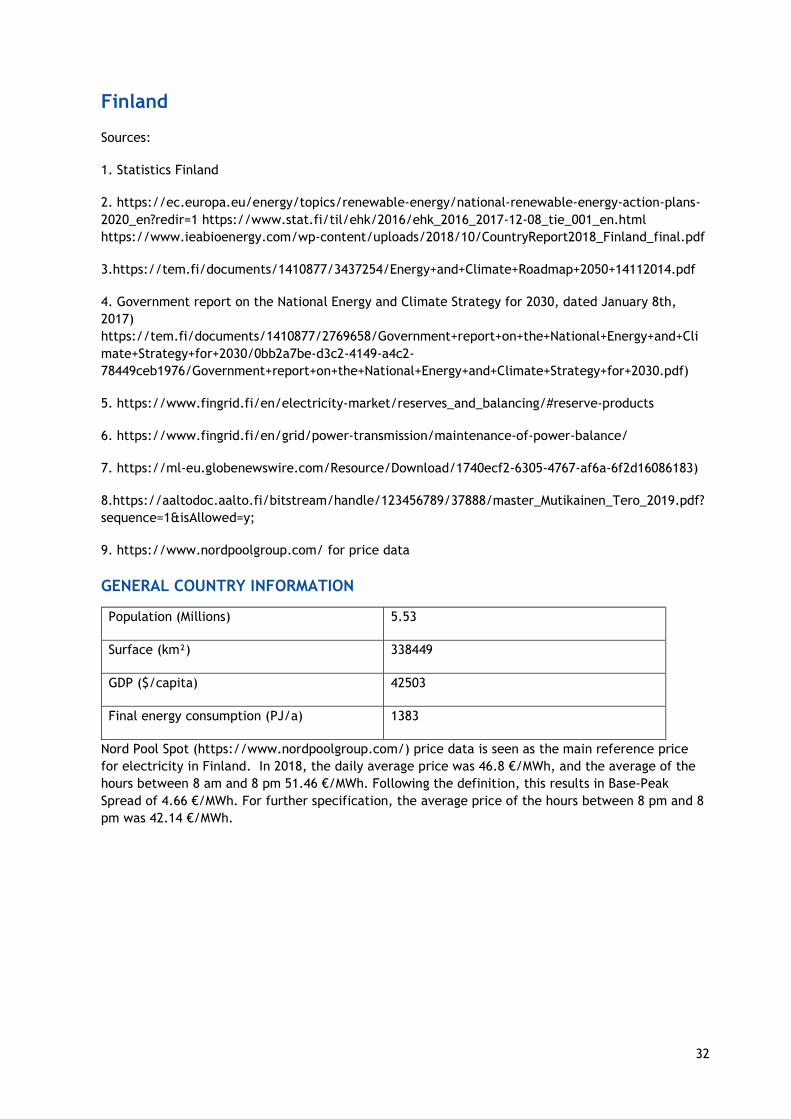
32
Finland
Sources:
1. Statistics Finland
2. https://ec.europa.eu/energy/topics/renewable-energy/national-renewable-energy-action-plans-2020_en?redir=1 https://www.stat.fi/til/ehk/2016/ehk_2016_2017-12-08_tie_001_en.html https://www.ieabioenergy.com/wp-content/uploads/2018/10/CountryReport2018_Finland_final.pdf
3.https://tem.fi/documents/1410877/3437254/Energy+and+Climate+Roadmap+2050+14112014.pdf
4. Government report on the National Energy and Climate Strategy for 2030, dated January 8th, 2017) https://tem.fi/documents/1410877/2769658/Government+report+on+the+National+Energy+and+Climate+Strategy+for+2030/0bb2a7be-d3c2-4149-a4c2-78449ceb1976/Government+report+on+the+National+Energy+and+Climate+Strategy+for+2030.pdf)
5. https://www.fingrid.fi/en/electricity-market/reserves_and_balancing/#reserve-products
6. https://www.fingrid.fi/en/grid/power-transmission/maintenance-of-power-balance/
7. https://ml-eu.globenewswire.com/Resource/Download/1740ecf2-6305-4767-af6a-6f2d16086183)
8.https://aaltodoc.aalto.fi/bitstream/handle/123456789/37888/master_Mutikainen_Tero_2019.pdf?sequence=1&isAllowed=y;
9. https://www.nordpoolgroup.com/ for price data
GENERAL COUNTRY INFORMATION
Population (Millions) 5.53
Surface (km²) 338449
GDP ($/capita) 42503
Final energy consumption (PJ/a) 1383
Nord Pool Spot (https://www.nordpoolgroup.com/) price data is seen as the main reference price for electricity in Finland. In 2018, the daily average price was 46.8 €/MWh, and the average of the hours between 8 am and 8 pm 51.46 €/MWh. Following the definition, this results in Base-Peak Spread of 4.66 €/MWh. For further specification, the average price of the hours between 8 pm and 8 pm was 42.14 €/MWh.

33
Figure 17 Finland: power and heating and cooling supply demand provided by... (no data for transport sector available)
Finland’s share of biomass in power accounts for 13.5% and in heating and cooling for 32.6%. For the transport sector no numbers on the energy sources were available.
0%
20%
40%
60%
80%
100%
Finland
Power demand supplied by... (Status 2018)
not assignable
Biomass
Other Renewables
Water
Solar
Wind
Nuclear
Other fossil
Natural Gas
Oil
Coal
0%
20%
40%
60%
80%
100%
Finland
Heating and cooling demand provided by....
Status 2018
not assignable
Biomass CHP
Gaseous Biofuels
Solid Biofuels
Geothermal
Other
Non-renewable an municipalwasteNon-renwable and municipalwaste CHPPower to heat
Fossil CHP
Fossil fuels
34
STATUS QUO AND COUNTRY CLASSIFICATION
Finland’s experts classify the country in phase 2 flexibility issues emerge but the system is able to cope with them through minor operational modifications.
In Finland, significant amount of flexibility can be extracted from the abundant hydropower resources available in the Nordic power system. In addition, the existing and extensive district heating system enables considerable amount of flexibility. Hence, the categorization is assessed to fall under alternative “Phase 2 - drawing on energy system flexibility”.
In Finland, each operator in the power market plans the balance of its own production and consumption (through s.c. Balance Responsible Parties), and it is the task of the national system operator Fingrid to take care of the national balance between consumption and production for each hour. There are several market-based options for TSO to operate the balance in different timescales, such as annually contracted reserves for disturbances and balancing power market available for 15-minute-periods for up and down regulation. The balance between consumption and production is ensured by activating regulating bids from the balancing power markets and by reserving capacity. ( https://www.fingrid.fi/en/electricity-market/reserves_and_balancing/#reserve-products https://www.fingrid.fi/en/grid/power-transmission/maintenance-of-power-balance/ )
Internal bottlenecks in the Finnish transmission grid have only small economic significance, compared to international congestion that occurs most significantly between northern Sweden and northern Finland. If active, the domestic main bottleneck in the Finnish main grid is often found between southern and northern Finland. The pressure for increasing North-South-transmission is expected to increase in the 2020s due to increasing amount of wind power generation in the North and decreasing thermal power generation capacity in the south. ( https://ml-eu.globenewswire.com/Resource/Download/1740ecf2-6305-4767-af6a-6f2d16086183) https://aaltodoc.aalto.fi/bitstream/handle/123456789/37888/master_Mutikainen_Tero_2019.pdf?sequence=1&isAllowed=y; ) The congestion management of low-voltage distribution networks in Finland belongs to responsible regional network companies. In international comparison, they are relatively strong due to historical popularity of electrical heating, although differences between areas exist.
FLEXIBLE ENERGIES CAPACITIES
Concerning flexible bioenergy capacities, no reasonable data were available.
In Finland, bioenergy has played a central role in energy supply for decades. Especially wood-based fuels have been significant. The share of wood as a primary energy source has risen from less than 15% in 1990 to 27% in 2018.
Focussing on the electricity sector, the share of bioenergy of domestic electricity generation was 17% (11.3 TWh) in 2018. The dominating mode of wood-based electricity generation is combined heat and power production (CHP), 87% (Statistics Finland). The major form of biomass fuel is black liquor, typically used in connection with pulp and paper industry (57%). The share of biogas-based electricity production was very small in comparison, 22 GWh in 2018 (Biokaasulaitosrekisteri), only 0.03% of the domestic production.
Flexibility has not been the primary driver for biomass-based electricity generation. Instead, flexibility needs have been driven primarily by fluctuations in district heat demand. Biomass based CHP plants are directly connected to the power market and therefore are natural providers of market-based flexibility. Key point to be noticed is also the large contribution of low-cost hydropower that acts as a major source of flexibility in the Nordic power market, diminishing the need for other forms of flexibility.
35
The introduction of feed-in premiums for electricity from biogas and forest residues in the beginning of 2010s have contributed to the observed rise in biomass-based electricity generation. Feed-in premiums were also mentioned in National Renewable Energy Action Plan of Finland for promoting energy from renewable sources pursuant to Directive 2009/28/EC that initiated Finland's overall target for the share of renewable energy as 38 per cent of final energy consumption in 2020. This target was reached for the first time already in 2014. The NREAP targets include indicative trajectories for different RES modes, with biomass-based electricity estimated as 12.91 TWh for 2020, meaning the 2018 value was in line with the observed development, considering the annual variation caused by temperatures etc.
(https://ec.europa.eu/energy/topics/renewable-energy/national-renewable-energy-action-plans-2020_en?redir=1
https://www.stat.fi/til/ehk/2016/ehk_2016_2017-12-08_tie_001_en.html
https://www.ieabioenergy.com/wp-content/uploads/2018/10/CountryReport2018_Finland_final.pdf)
In the case of thermal energy, biomass as a storable fuel enables flexibility. However, the main driver for its use in Finland has been heat demand, and targets such as in NREAP have not been set from the perspective of flexibility. Heat storages are generally cost-efficient options for increasing flexibility in thermal energy systems (already existing, e.g. day-night variation), but they are applicable for all forms of heat, not only bioenergy.
During recent decades, there has been significant increase in biomass use as a fuel for district heating and CHP. Especially in the interior parts of Finland, many DH networks with 90% share of biomass exist. In coastal cities and larger networks, bioenergy-based heat competes with other forms of flexibility. Hence, the case of thermal energy can be summarised that flexibility potential exists, but is not currently largely utilised. District cooling can be mentioned as an additional and emerging option.
Bioenergy in transportation has been supported by enforcing a blending obligation for transport fuel distributors, guaranteeing the realization of targeted volumes. For 2020, the biofuel distribution obligation was set to 20% (taking into account RED double counting). However, biofuels production in Finland is driven by production process requirements, not flexibility needs of the energy system.
Regarding flexibility between energy sectors in Finland, biogas is used primarily in heat and power production. In 2017, this amounted 500 GWh. The use of biogas as transportation fuel is rapidly rising, amounting to 31 GWh in 2017. (https://www.gasum.com/kaasusta/biokaasu/biokaasu/)
The scale of forest-based bioenergy for heat and power in Finland is measured in different magnitudes, so it might be understandable that other forms of bioenergy are seen as primary targets rather than biogas, at least currently.
LEGAL FRAMEWORK
National Renewable Energy Action Plan of Finland pursuant to Directive 2009/28/EC promotes energy from renewable sources, provides basis for feed-in premiums and sets targets including indicative trajectories for different RES modes.
The Energy and Climate Roadmap 2050 (2014) notes storage of “surplus” electricity into methane (power-to-gas) and possibility of using electricity to produce hydrogen or methanol fuel for transport
In law (416/2019) use of coal in the production of electricity and heat after 1th of May 2029 is banned.
36
Policy instruments
The introduction of feed-in premiums for electricity from biogas and forest residues in the beginning of 2010s have contributed to the observed rise in biomass-based electricity generation. Feed-in premiums were also mentioned in National Renewable Energy Action Plan of Finland for promoting energy from renewable sources pursuant to Directive 2009/28/EC that initiated Finland's overall target for the share of renewable energy as 38 per cent of final energy consumption in 2020.
Bioenergy in transportation has been supported by enforcing a blending obligation for transport fuel distributors, guaranteeing the realization of targeted volumes.
Opportunities
A study by VTT commissioned by IRENA “Bioenergy from Finnish forests - Sustainable, efficient, modern use of wood” describes some of the central of current opportunities for flexible bioenergy use in Finland.
• General description of bioenergy in connection to CHP • Metsä Fibre bioproduct mill at Äänekoski: combination of traditional and new product, electricity and district heating • Bio-oil production integrated into CHP plant at Joensuu; many potential flexible uses • High-efficiency multifuel CHP plant at Järvenpää (https://www.irena.org/-/media/Files/IRENA/Agency/Publication/2018/Mar/IRENA_Bioenergy_from_Finnish_forests_2018.pdf)
Connection to industrial and residential heat loads is seen as a potential future option for flexible bioenergy systems. For example, the “City Refinery” concept - production of transportation biofuels by gasification and recovery of by-product heat for space heating, is a concrete example of such activity with on-going R&D in Finland (https://www.helen.fi/en/news/2019/city-refinery-vuosaari).
Carbon Capture and Storage (CCS) in combination with bioenergy is considered a promising future concept, e.g. https://www.researchgate.net/publication/333395657_Robust_decision_making_analysis_of_BECCS_bio-CLC_in_a_district_heating_and_cooling_grid
A number of studies are on-going to describe the value of flexible bioenergy systems. VaBiSys (Value-optimised use of biomass in a flexible energy infrastructure) is an on-going ERA-Net project coordinated by VTT. The overall objective of this project is to develop new technologies and concepts that improve the value of bioenergy resources in an energy system that is dominated by variable renewable energy (VRE) such as wind and solar, including analyses of the above-mentioned related concepts. (https://www.researchgate.net/project/Value-optimised-use-of-biomass-in-a-flexible-energy-infrastructure-VaBiSys)
The issue of the provision of renewable energy for the power, district heating, transport and industrial sectors in nine North European countries by integrating a large amount of wind and solar power into the system with power-to-gas and power-to-fuel plants enabling balancing and sector coupling, is dealt with in the following recent publication: Ikäheimo, Jussi; Pursiheimo, Esa; Kiviluoma, Juha; Holttinen Hannele (2019). The role of power to liquids and biomass to liquids in a nearly renewable energy system. IET Renewable Power Generation 13 (7), 1179-1189.
Barriers and bottlenecks
Barriers and bottlenecks include management of several energy resources and their controllability, technical flexibility of biomass plants (freely adjustable output level, quick ramping rate, and low-cost start-up and shutdown of the plant), technical flexibility of gaseous fuel plants (not dominating the fleet in Finland) over solid fuel plants, competing flexibility options (e.g. in large DH or electricity networks), lower operating hours and estimating the value of flexibility.
37
The production in a district heating network being dominated by inflexible primary use (e.g. heat demand of industrial process) limits flexible bioenergy use. This barrier is further active if the industrial heat load largely exceeds that of residential heating, diminishing the potential of flexible use in case of excess industrial heat.
Phase out strategies There is a law (416/2019) to ban use of coal in the production of electricity and heat after 1 May 2029.
KEY SECTORS AND KEY ACTORS
As there are many concepts under development and consideration, providing general answer is not easy. Districts with an aim of self-sufficient renewable energy supply can be proposed as quite general beneficiaries of different flexible bioenergy concepts. Furthermore, companies eligible to develop profitable business case(s) from flexible bioenergy concepts would be direct financial beneficiaries.
Industrial sectors working on bioenergy on a daily-basis or energy sector authorities in general have quite good awareness on the different technological opportunities, or at least on the need to tackle the flexibility issue in general. The information on decision-makers on managerial level in the energy industry could perhaps be a place for feeding information.
Households in single-family buildings with electrical heating have high financial incentives in considering flexible solutions. The level of awareness on flexibility options has been rising along with new solutions such as heat pumps, hourly metering and novel single-house biomass heating options such as pellet-based solutions. In single-family houses, firewood has also traditionally been popular auxiliary flexible source of heating in Finland. The level of awareness of flexible solutions is not that high among citizen customers of district heating companies, however, this is only an assumption not based on research.
GOALS AND EXPECTATIONS
Directive 2009/28/EC initiated Finland's overall target for the share of renewable energy as 38% of final energy consumption in 2020. This target was reached for the first time already in 2014. The NREAP targets include indicative trajectories for different RES modes, with biomass-based electricity estimated as 12.91 TWh for 2020, meaning the 2018 value was in line with the observed development, taking into account the annual variation caused by temperatures etc.
Flexibility has been discussed in programmes setting up policy goals for Finland, and bioenergy solutions has been raised up in this context. For example, the Energy and Climate Roadmap 2050 by Parliamentary Committee published already in 2014 acknowledged than in the future, the intermittent production, i.e. wind and solar power, will increase and the production of large base-load plants will decrease, creating demand for flexibility. The programme mentioned research on the storage of “surplus” electricity into methane (power-to-gas) as one of many potential solutions to tackle the problem. Also, the possibility of using electricity to produce hydrogen or methanol fuel for transport was mentioned in this context. https://tem.fi/documents/1410877/3437254/Energy+and+Climate+Roadmap+2050+14112014.pdf
An intense public discussion on sustainability of biomass and its feasibility as a climate change mitigation measure, especially through EU regulation of the LULUCF sector, can also be mentioned as a driver and climate rule for flexible (and other) bioenergy in Finland.
There certainly are national targets for Finland that influence the implementation of flexible bioenergy systems. However, perhaps the best reference document for the national targets of Finland is the National Energy and Climate Strategy for 2030. As the following points extracted from its summary demonstrate, there are several central high-level targets reaching to 2030 and 2050
38
mentioned.
Emission target: The National Energy and Climate Strategy outlines the actions that will enable Finland to attain the targets specified in the Government Programme and adopted in the EU for 2030, and to systematically set the course for achieving an 80−95 per cent reduction in greenhouse gas emissions by 2050. With minor exceptions, Finland will phase out the energy use of coal by 2029.
The share of transport biofuels will be increased to 30 per cent by 2030, and an obligation to blend light fuel oil used in machinery and heating with 10 per cent of bioliquids will be introduced. The minimum aim is to have 250,000 electric and 50,000 gas-powered vehicles on the roads.
The electricity market will be developed at the regional and the European level. The flexibility of electricity demand and supply and, in general, system-level energy efficiency will be improved. Technology neutral tendering processes will be organised in 2018−2020, on the basis of which aid will be granted to cost-effective new electricity production from renewable energy.
The share of renewable energy in the end consumption will increase to approx. 50 per cent and the self-sufficiency in energy to 55 per cent by 2030. The share of renewable energy use in transport will clearly exceed the Government Programme target. The domestic use of imported oil will be halved as planned. (Government report on the National Energy and Climate Strategy for 2030, dated January 8th, 2017) https://tem.fi/documents/1410877/2769658/Government+report+on+the+National+Energy+and+Climate+Strategy+for+2030/0bb2a7be-d3c2-4149-a4c2-78449ceb1976/Government+report+on+the+National+Energy+and+Climate+Strategy+for+2030.pdf )
Typically, each Government following the elections will update this national strategy, and the process of updating the targets is currently on-going. As climate neutrality by 2035 is highlighted as a target of the Government that started in December 2019, it will probably be reflected in the above numbers.
RESEARCH, DEVELOPMENT AND INNOVATION
On-going publicly funded R&D activities on flexible bioenergy concepts include VaBiSys, BioFlex (https://www.bioflexfuel.fi/), and FLEXCHX (http://www.flexchx.eu/index.htm). Some initiatives run by national TSO Fingrid, can also be mentioned. However, they are not specifically targeted to flexible bioenergy but instead aim at technology-neutrality.
Savon Voima, Tahkovuori: a pilot combining 12 m2 solar thermal collectors + 500 kW wood pellet boiler + 70 kW electric heater to replace a fossil fuel fired DH unit. Solar heat is used to preheat the return flow from district heating grid. https://www.savonvoima.fi/konserni/tietoa-meista/energiantuotanto/nipanen/
Etelä-Savon Energia, Ristiina: 120 m2 solar thermal collectors + wood chip boiler to replace fossil fuel consumption. Solar thermal collectors reduced bioenergy consumption during the summer period. https://www.vexve.com/en/news-events/article/2017/solar-heat-evens-out-peak-loads-and-increases-the-competitiveness-of-district-heating-companies/
Neo-Carbon Energy: The research project studied possible pathways to de-fossilise the whole energy system, PtG technology being one important element in terms of storing energy. http://www.neocarbonenergy.fi/
St1 & QPower, Vantaa: Piloting synthetic fuel production for transportation from biorefinery’s carbon dioxide with biological methanation. https://www.st1.eu/q-power-and-st1-piloting-synthetic-fuel-production-from-biorefinery-carbon-dioxide
39
Scenarios and Forecasts
Specific scenarios and forecasts were not mentioned.
BEST PRACTISES
Examples of combined systems and costs in transportation: Energy company St1 and start-up company Q Power have a project for developing a novel way of making synthetic biomethane from carbon dioxide. https://www.st1.eu/q-power-and-st1-piloting-synthetic-fuel-production-from-biorefinery-carbon-dioxide
Mäntsälän Biovoima: methanation plant connected to biogas plant, decomposition of biowaste from industrial and grocery store sources. Capacity: 19 990 ton/year. http://tuusula.cloudnc.fi/download/noname/%7B275b01b2-8cd6-4847-a149-48ad8292a6e5%7D/29897
VTT and St1 experiment to produce hydrocarbons from industrial carbon dioxide, which can be refined to fossil-free petrol, diesel and chemicals. https://www.vttresearch.com/en/news-and-ideas/vtt-and-st1-pilot-future-bioeconomy-climate-friendly-hydrocarbons-industrial-carbon
FLEXCHX H2020 project coordinated by VTT: Combines biomass gasification with electrolytic hydrogen to enable flexible combined production of power, heat and transport fuels from renewable energy sources. http://www.flexchx.eu/index.htm
BioFlex project coordinated by VTT: Liquid fuels for maritime & flexible large-scale diesel engines [Anja Oasmaa, Sirpa Kallio] https://www.bioflexfuel.fi/
Concerning costs some assessments have been made in various research projects, but few are publicly available.
Examples of flexible bioenergy systems in the heat sector include domestic applications, which are typically wood (or pellet) boilers. The role of bioenergy depends on the application. It can serve either as a base load producer complemented with another heat source, or as an auxiliary heat source to cover peak load periods and work as a source of comfortability.
Detached houses outside the district heating grid are often based on hybrid heating systems, which can include bioenergy based heat production.
For district heating grid applications bioenergy has important role and is a quick way to increase the share of renewables in DH. Past key actions include wood pellet co-combustion with coal in the existing coal-fired power plants, distributed heat production with bioenergy, and the use of biogas (Helsinki energy company, Helen).
High-efficiency bio-CHP enabled by flue gas condenser that makes possible to capture energy from moist fuel that would otherwise be wasted through evaporating the inherent water content of such fuel. (https://www.irena.org/-/media/Files/IRENA/Agency/Publication/2018/Mar/IRENA_Bioenergy_from_Finnish_forests_2018.pdf )
In industrial applications bioenergy has traditionally a key role due to strong pulp and paper industry. Several industries have replaced fossil-fired units with wood chip or pellet-fired units.
In farm-scale applications bioenergy, mainly forest wood chips, covers 44% of the total 11.4 TWh energy consumption in agriculture. https://stat.luke.fi/maa-ja-puutarhatalouden-energiankulutus-2016_fi-0
Small-scale CHP systems are typically located close to agriculture.
40
Some examples of farm-scale biogas production exist, such as Kalmari farm, which produces biogas and upgrades it for transport use: https://www.motiva.fi/en/solutions/renewable_energy/services/greenenergycases/metener_ltd_kalmari_farm.9.html
https://www.google.com/url?sa=t&rct=j&q=&esrc=s&source=web&cd=3&ved=2ahUKEwiS5KTYvLLoAhWKs4sKHct9AbUQFjACegQIBBAB&url=http%3A%2F%2Ftask37.ieabioenergy.com%2Fcase-stories.html%3Ffile%3Dfiles%2Fdaten-redaktion%2Fdownload%2FSuccess%2520Stories%2Fsuccess-story-kalmari2012.pdf&usg=AOvVaw1celt4wri078V-VSKdi5yQ
Applicable to many sectors is biomass drying.
• Case studies with high relevance to flexible bioenergy are: District heating systems as hybrid platforms. In particular in the Nordic countries including Finland, the major relevance in connection to flexible bioenergy is seen in the benefit of district heating and cooling (DHC) networks in their ability to use a wide variety of local and distributed renewable energy sources efficiently, providing a platform for wide renewable energy integration. In VRE-dominated energy systems, DHC networks can serve as a balancing element for variable power production by storing of excess energy to networks. (Source: Hakkarainen et al. 2019: Bioenergy RES hybrids − assessment of status in Finland, Austria, Germany, and Denmark)
• VaBiSys. VaBiSys (Value-optimized use of biomass in a flexible energy infrastructure) is a highly relevant on-going ERA-Net research project run by VTT. The overall objective of the project is to develop new technologies and concepts that improve the value of bioenergy resources in an energy system that is dominated by variable renewable energy (VRE) such as wind and solar.
• BioFlex. project by VTT: Liquid fuels for maritime & flexible large-scale diesel engines [Anja Oasmaa, Sirpa Kallio]
41
Germany
Sources:
1. Destatis (2019): Bevölkerung nach Geschlecht und Staatsangehörigkeit. Stand: 2. Oktober 2019. https://www.destatis.de/DE/Themen/Gesellschaft-Umwelt/Bevoelkerung/Bevoelkerungsstand /Tabellen/zensus-geschlecht-staatsangehoerigkeit-2019.html
2. Destatis (2019): Bodenfläche insgesamt nach Nutzungsarten in Deutschland am 31.12.2018. Stand: 18. November 2019. https://www.destatis.de/DE/Themen/Branchen-Unternehmen/Landwirtschaft-Forstwirtschaft-Fischerei/Flaechennutzung/Tabellen/bodenflaeche-insgesamt.html
3. Thrän, Daniela; Billig, Eric; Brosowski, André; Klemm, Marco; Seitz, Stefanie B.; Witt, Janet (2018): Bioenergy Carriers. From Smoothly Treated Biomass towards Solid and Gaseous Biofuels. In: Chemie Ingenieur Technik 90 (1-2), S. 68–84. DOI: 10.1002/cite.201700083.
4. Monitoringbericht 2019 - Kernaussagender Bundesnetzagentur und des Bundeskartellamtes „in Grafiken“.https://www.bundesnetzagentur.de/SharedDocs/Downloads/DE/Sachgebiete/Energie/Unternehmen_Institutionen/DatenaustauschUndMonitoring/Monitoring/Grafiken_MB2019.pdf?__blob=publicationFile&v=3
5. Schlesinger, Michael; Lindenberger, Dietmar; Lutz, Christian (2014): Entwicklung der Energiemärkte – Energiereferenzprognose. Projekt Nr. 57/12 (Endbericht). Studie im Auftrag des Bundesministeriums für Wirtschaft und Technologie. https://www.bmwi.de/Redaktion/DE/Publikationen/Studien/entwicklung-der-energiemaerkte-energiereferenzprognose-endbericht.pdf?__blob=publicationFile&v=7
6. Destatis (2019): Bruttostromerzeugung in Deutschland für 2016 bis 2018, veränderte Darstellung der Werte der Arbeitsgemeinschaft Energiebilanzen (AGEB). Stand: 6. März 2019. https://www.destatis.de/DE/Themen/Branchen-Unternehmen/Energie/Erzeugung/Tabellen/bruttostromerzeugung.html
7. Bundesministerium für Wirtschaft und Energie (2019): Gesamtausgabe der Graphiken zu Energiedaten. Stand: Oktober 2019. https://www.bmwi.de/Redaktion/DE/Downloads/Energiedaten/energiedaten-gesamt-pdf-grafiken.pdf?__blob=publicationFile&v=40
8. Naumann, Karin; Schröder, Jörg; Oehmichen, Katja; Etzold, Hendrik; Müller-Langer, Franziska; Remmele, Edgar; Thuneke, Klaus; Raksha, Tetyana; Schmidt, Patrick (2019): DBFZ Report Nr. 11. Monitoring Biokraftstoffsektor. https://www.dbfz.de/fileadmin/user_upload/Referenzen/DBFZ_Reports/DBFZ_Report_11_4.pdf
9. Bundesministerium für Wirtschaft und Energie (2019): Gesamtausgabe der Energiedaten – Datensammlung des BMWi. Stand: 09.09.2019 https://www.bmwi.de/Redaktion/DE/Artikel/Energie/energiedaten-gesamtausgabe.html
10. BWK Jahresausgabe 2019 (2019): Jahresübersichten I. Erneuerbare Energien. Heft 06-2019.
11. Bundesministerium für Wirtschaft und Energie (2019): BMWi Erneuerbare Energien in Zahlen. Nationale und internationale Entwicklung im Jahr 2018. https://www.bmwi.de/Redaktion/DE/Publikationen/Energie/erneuerbare-energien-in-zahlen-2018.pdf?__blob=publicationFile&v=16
12.https://www.bmu.de/fileadmin/Daten_BMU/Pools/Broschueren/klimaschutz_zahlen_2019_broschuere_bf.pdf
42
13. https://transparency.entsoe.eu/generation/r2/actualGenerationPerProductionType/show
14. Müller-Langer, Franziska (2019): The Contribution of Advanced Renewable Transport Fuels to Transport Decarbonisation in 2030 and beyond. IEA-EC Project on Decarbonising Transport - Country report for Germany (presentation IEA-EC-Workshop 18.11.2019, Brussels). https://iea-amf.org/app/webroot/files/file/Workshop_Transport_Decarbonisation/09%20Country%20Assessments%20-%20Germany%20-%20Franziska%20Muller-Langer.pdf 10
15. Commission on Growth, Structural Change and Employment (2019): Structural Change and Employment - Final Report, Federal Ministry for Economic Affairs and Energy (BMWi). https://www.bmwi.de/Redaktion/EN/Publikationen/commission-on-growth-structural-change-and-employment.pdf?__blob=publicationFile&v=3
16. https://www.energy-charts.de/power_inst_de.htm?year=2018&period=annual&type=power_inst
17. BMWi (11.11.2019): Referentenentwurf „Gesetz zur Reduzierung und zur Beendigung der Kohleverstromung und zur Änderung weiterer Gesetze (Kohleausstiegsgesetz)“. https://www.erneuerbareenergien.de/sites/default/files/2019-11/referentenentwurf-kohleausstiegsgesetz-11-11-2019.pdf
18. https://www.iea.org/newsroom/news/2019/february/will-system-integration-of-renewables-be-a-major- challenge-by-2023.html?utm_campaign=IEA+newsletters
19. http://www.epexspot.com/en/market-data/dayaheadauction/
20. Götze, Thomas (EWE NETZ GmbH (2017)): Die AUDI e-Gas-Anlage in Werlte, ein P2G-Projekt am Standort einer Biogasanlage (Präsentation). Think Big! Sektorkopplung visionär. 10. Niedersächsische Energietage am 07./08.11.2017. https://www.efzn.de/fileadmin/documents/Niedersaechsische_Energietage/Vortr%C3%A4ge/2017/Goetze.pdf 18 https://www.audi-technology-portal.de/en/mobility-for-the-future/audi-future-lab-mobility_en/audi-future-energies_en/audi-e-gas_en
21. http://www.schmack-biogas.com/de/aktuelles/vermarktungsstart-fuer-synthetisches-erdgas-aus-der-power-to-gas.html
22. Lauer, M. (2019): Economic assessment of biogas plants as a flexibility option in future electricity systems. PhD thesis. University of Leipzig.
23. Fleischer, B. (2017): Beitrag der Bioenergie zur gekoppelten Elektrizitäts- und Wärmeerzeugung in Deutschland (Präsentation) http://www.strise.de/fileadmin/user_upload/Aktuelles/2017_Stgt_Dialog/08_Poster_Fleischer_Bioenergie.pdf
24. https://www.bmwi.de/Redaktion/DE/Downloads/C-D/dialogprozess-gas-2030-erste-bilanz.pdf?__blob=publicationFile&v=4 23 The Information is about flexible biogas plant, because there is official information about the flexible premium available.
25. https://www.swlb.de/solar-heat-grid
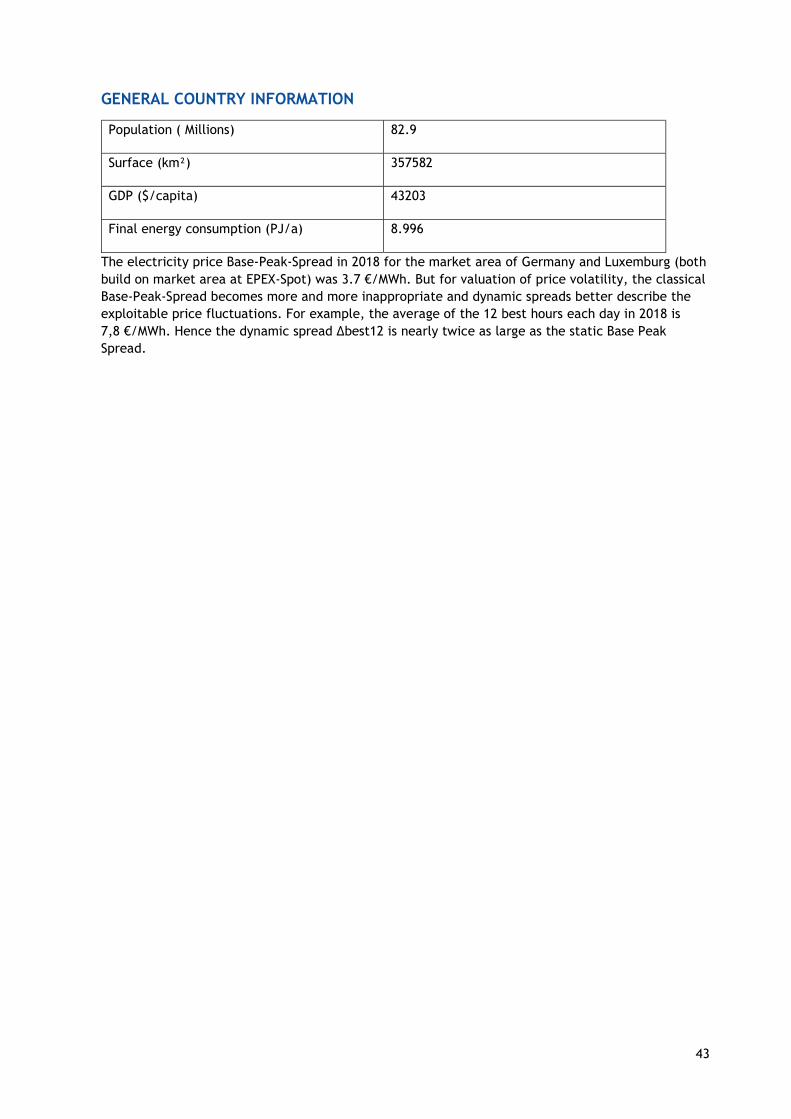
43
GENERAL COUNTRY INFORMATION
Population ( Millions) 82.9
Surface (km²) 357582
GDP ($/capita) 43203
Final energy consumption (PJ/a) 8.996
The electricity price Base-Peak-Spread in 2018 for the market area of Germany and Luxemburg (both build on market area at EPEX-Spot) was 3.7 €/MWh. But for valuation of price volatility, the classical Base-Peak-Spread becomes more and more inappropriate and dynamic spreads better describe the exploitable price fluctuations. For example, the average of the 12 best hours each day in 2018 is 7,8 €/MWh. Hence the dynamic spread Δbest12 is nearly twice as large as the static Base Peak Spread.
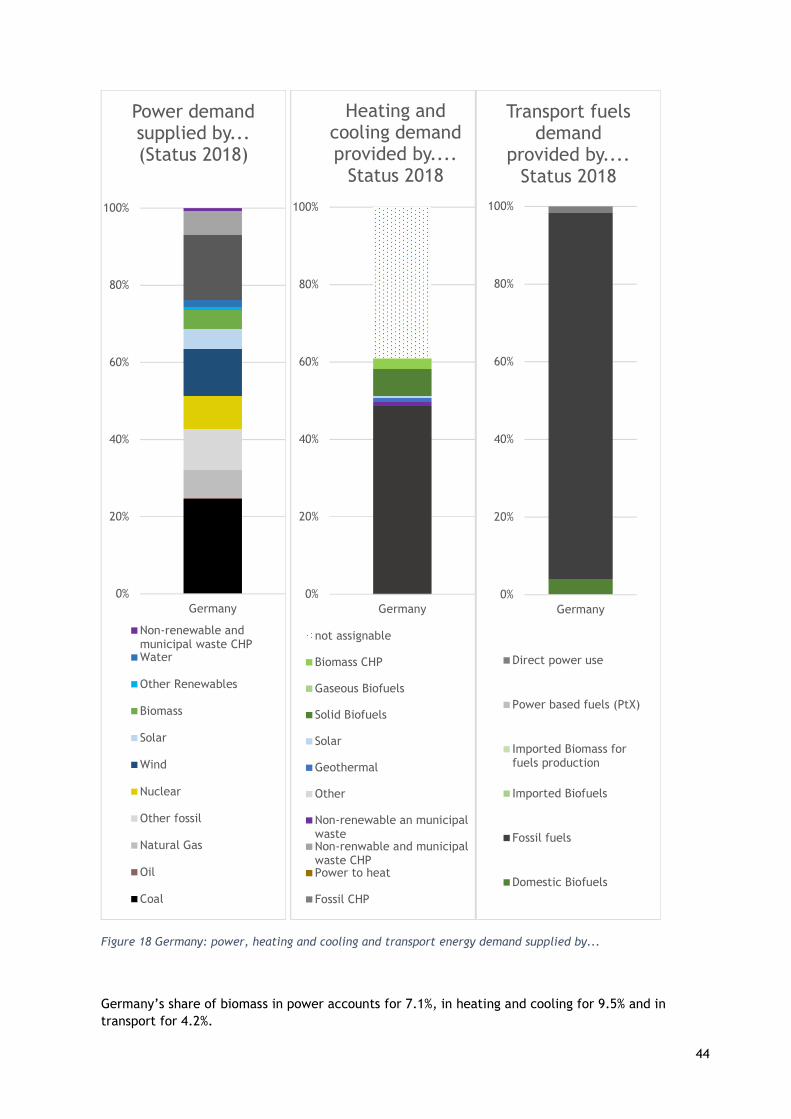
44
Figure 18 Germany: power, heating and cooling and transport energy demand supplied by...
Germany’s share of biomass in power accounts for 7.1%, in heating and cooling for 9.5% and in transport for 4.2%.
0%
20%
40%
60%
80%
100%
Germany
Power demand supplied by... (Status 2018)
Non-renewable andmunicipal waste CHPWater
Other Renewables
Biomass
Solar
Wind
Nuclear
Other fossil
Natural Gas
Oil
Coal
0%
20%
40%
60%
80%
100%
Germany
Heating and cooling demand provided by....
Status 2018
not assignable
Biomass CHP
Gaseous Biofuels
Solid Biofuels
Solar
Geothermal
Other
Non-renewable an municipalwasteNon-renwable and municipalwaste CHPPower to heat
Fossil CHP
0%
20%
40%
60%
80%
100%
Germany
Transport fuels demand
provided by....Status 2018
Direct power use
Power based fuels (PtX)
Imported Biomass forfuels production
Imported Biofuels
Fossil fuels
Domestic Biofuels
45
STATUS QUO AND COUNTRY CLASSIFICATION
Germany is according to experts in phase 3, where the need for additional investments in flexibility is crucial.
Current mechanisms for grid stabilisation are the shutdown and power reduction of fossil and renewable generators, the start-up of fossil power plants and the flexibilization of biogas CHP plants. Another option is to redirect electricity flows through imports and exports. The main bottlenecks are the transformers and lines.
Gas for sector integration plays also a role in Germany. The Federal Ministry for Economic Affairs and Energy organized a “Dialogue Process Gas 2030” and presented the first results in October 2019. The main findings describe gas in general a very versatile energy carrier, which is a main pillar of sector coupling. It is also highlighted that the infrastructures for gas, electricity and heat should be developed together, to achieve the potentials for synergies instead of reinforce existing or creating new path dependencies. For most of gas applications flexibility is described as a key feature. No matter what sector is in focus. Thus gas fired cogeneration, gas boilers or power-to-gas approaches, they all show links to flexibility in their certain uses (https://www.bmwi.de/Redaktion/DE/Downloads/C-D/dialogprozess-gas-2030-erste-bilanz.pdf?__blob=publicationFile&v=4).
FLEXIBLE ENERGIES CAPACITIES
The history of demand driven power generation by bioenergy plants started in Germany 2012 with the revision of the main funding instrument, the renewable energy law (Erneuerbare Energien Gesetz EEG). Within that revision a new bonus “flexibility premium” was introduced, to motivate plant operators to invest in additional capacities. Within the framework of a further revision in 2014, this flexibility premium was limited to an overall amount of 1.35 GW of additional capacities since the amendment came into force. Also in 2014, the flexibility surcharge for new plants was established to settle the simultaneously introduced obligation for a flexible e.g. oversized plant layout and the consequential increased costs for new installations. Until mid-2019 additional capacities of about 1.3 GW were build up, mostly by increasing the capacity of existing plants.
However, there is already a huge amount of additional capacity that could also make it possible to generate a much larger amount of total capacity according to demand. But publicly available data gives the impression, that just a small fraction of that potentially flexible capacities adapt their generation patterns according to demand e.g. price-curves. It can be estimated, that for Germany the bandwidth of flexible generation in real terms is about 200 MW for the load-data of 2018, published by ENTSO-E.
In Germany there are no special goals for flexible generation or supply of heating or cooling. As heating and cooling are very fluctuating demands over the day and over the year – heating and cooling technologies are either quite flexible in operation or they are combined with hot water or ice storage options to compensate missing flexibility of generation units.
In the transport sector, the key to fulfil the RED and FQD targets is the GHG-based quota system which was implemented starting in 2015. Due to this system fuel supplier companies will be obligated to sell the respective biofuel with its fossil counterpart gasoline or diesel (which is usually done through blending), in order to produce a fuel mix which achieves a 3.5%/4%/6% GHG mitigation (compared to fossil gasoline and diesel mix) for the entire fuel sector from 2015/2017/2020 onwards. Target continues after 2020 at the level of 6%. In case of non-fulfilment of obligations, penalties of about 0.47 €/kg CO2equ are binding. Biofuels that are counted within the quota, are fully energy taxed. Moreover, the BundesImmissionsSchutzVerordnung (BImSchV) (Federal Imissions protection by-law) regulations provide for instance the frame for a maximum limit of conventional biofuels and minimum quotas for advanced biofuels as well as counting of electricity for transport.
46
According to the German climate protection plan in transport, the GHG mitigation has to be about 40-42% until 2030 (c.t. 1990, i.e. reduction about 65-68 million tons). The general frame for renewables in transport until 2030 is set with the Renewable Energy Directive II (RED II, 2018/2001/EU, set of 14% renewable fuels in transport by 2030 and frame for dedicated fuels and sustainability criteria). In addition, the Effort Sharing Regulation (ESR 2018/842) which sets binding annual emission reductions by member states from 2021 to 2030 is important. Recently, Germany has started the transposition process of the RED II and ESR into national laws and regulations. Moreover, the current draft of a climate package as base for a climate protection law will be the base allowing to reach the targets until 2030 or not.
It is very likely that the GHG quota will be continued from 2021 onwards and further CO2-related instruments will come into action. Further information in German can be found, for example, in DBFZ Report No. 11 "Monitoring Biofuels Sector" and on the Power to Gas Platform of the German Energy Agency (dena).
There is no significant amount of flexible bioenergy in the electricity sector yet. It is impossible to quantify the flexible amount of power generation at the moment. If all existing plants would operate demand driven, the potential would be 30 TWh in 2030 and 2050. (11)
For the heat sector no data regarding flexible bioenergy systems are available. While heat pumps and stoves are quite common in new single houses. In 2030 possibly 1 GWth stove-combinations and 1 MWth CHP. For 2050 there are 10 GWth stove-combinations and 10 GWth CHP estimated.
Data regarding related heat provision are estimated as follows: in 2030: 100 GWh and 1 GWh bioenergy and other RES, in 2050: 1 TWh and 10 TWh bioenergy and other RES.
With an increasing share of volatile, renewable generation technologies in the energy system, flexible bioenergy can help to promote their implementation in the system. As the only storable renewable energy source, it enables electricity to be provided in line with demand. Furthermore, biogas upgraded to methane could also be used in the heat sector via the gas grid.
LEGAL FRAMEWORK
In Germany, as well as in other European countries, the relevant European Directives were adopted into national legislation. These are the Renewable Energy Act (Erneuerbare Energien Gesetz (EEG)) for the power sector mainly, which introduced “flexibility premium” in 2012 and limiting “flexibility premium” and establishing in 2014, the GHG quota system that emerged in 2015, which of a fuel mix that achieves a 6% GHG mitigation in 2020 and sets penalties for the case of non-fulfilment of obligations of about 0.47 €/kg CO2equ.Furthermore, the Bundes-Immissionsschutz-Gesetz und Verordnungen (BImSchG und BImSchV), federal immissions protection by-law) which set the maximum limit of conventional biofuels and minimum quotas for advanced biofuels as well as counting of electricity for transport.
Further the Renewable Energy Directive II (RED II, 2018/2001/EU) targets 14% renewable fuels in transport by 2030 and the EU Effort Sharing Regulation (ESR 2018/842) sets binding annual emission reductions.
Climate package as base for a Climate protection Law will be the base allowing to reach the targets until 2030. It is very likely that the GHG quota will be continued from 2021 onwards and further CO2-related instruments will come into action.
Policy instruments
Within the German renewable energies act (Erneuerbare Energien Gesetz (EEG)), dating from 2012 onwards, there is an option to gain a bonus on the biogas production if a certain part of the
47
installation can produce biogas and electricity flexible according to market needs.
Opportunities
Regarding Lauer, M. (2019): Economic assessment of biogas plants as a flexibility option in future electricity systems. PhD thesis. University of Leipzig) an increased proportion of (flexible operating) biogas plants reduces the demand (and therefor the costs) for additional storage technologies and conventional power plants. Further it enables the system integration of volatile renewable energies, but leads to costs that exceed the benefits of additional biogas plants for the electricity system.
With reference to Fleischer (Fleischer, B. (2017): Beitrag der Bioenergie zur gekoppelten Elektrizitäts- und Wärmeerzeugung in Deutschland (Präsentation) http://www.strise.de/fileadmin/user_upload/Aktuelles/2017_Stgt_Dialog/08_Poster_Fleischer_Bioenergie.pdf) an optimal expansion and use of bioenergy plants reduces total system costs by approx. 300 million €/a. Additionally bioenergy can make a positive contribution as a complementary flexibility and CHP option from a system point of view in the future. It contributes to decarbonisation in both the electricity and heat markets and at the same time to security of supply.
Barriers and bottlenecks
For so far there are no relevant technical barriers, but as described above the market conditions, doesn’t create an attractive setting for serving huge amounts of flexibility, even if they would improve over the next decades depending on the speed of energy system transformation.
Regulatory bottlenecks are first of all, the reduced cap for the additional capacity promoted by the flexible premium within the EEG. So in 2018 German legislator reduce that cap from 1.35 GW to 1.0°GW for additional capacity installed after July 2014 (reference date for the introduction of the initial cap). In August 2019, the cumulated new capacity reached this cap and now only plants can expand their capacity within sixteen month of a transitional regulation. Because planning, authorization and practical installation take several months, the activity for new flexibility extensions will regress and finally stops end of 2020.
Phase out strategies
Until 2038 coal-fired power generation should phase out. This applies both to lignite and coal. By 2023 all nuclear power generation phases out.
KEY SECTORS AND KEY ACTORS
To establish a common understanding of flexible bioenergy systems the German government has put in place research programs that emphasis on the cooperation of different research institutions to ensure the knowledge transfer to policy makers (such as ministries, business partners and wider public). Other opportunities are provided through the national platform on mobility for example, which focus on specific sectors and have linkage to (flexible) bioenergy.
GOALS AND EXPECTATIONS
The goals for flexible bioenergy use address different sectors but up to now, they have strong focus on the power sector. The expectations here manly point at the ability to generate power in a demand driven way, so that the increasing variability by growing amounts of wind and PV can be balanced to some amount. The regulatory framework, foremost the EEG, was adapted in two ways. First, as described above, there were special remuneration components (flexible premium or flexible surcharge) to support the installation of additional capacities. As a more general aspect, the amendment of the EEG 2012 started to shift the remuneration scheme from fixed feed-in-tariffs to a market premium-model, were some of remuneration is replaced by market profits. So plant-operators, start to “see” price signals from energy exchange and can adjust their production patterns according to the demand, which is, to some extent, translated into prices. Nevertheless the recent price volatility and the possible extra earnings just ranges around 10 €/MWh for best twelve

48
hours of an average day. If price volatility is an indicator for flexibility demand and consequential the foundation for extra earnings, price signals did not reflect a high demand for flexibility yet. It is very likely, that this will change for the next decades because Germany decide to exit power generation from nuclear and coal until 2023 respectively 2038. Shout down of all nukes is already regulated by law and a new legal regulation for coal power plants is under negotiation (see next sub item).
The overall objective is to achieve the most possible greenhouse gas neutrality by 2050. The targets for reducing total emissions by 2030 are broken down by sector.
By 2050, the share of renewable energies in gross electricity consumption is to be at least 80%; in the heating and transport sectors, the targets are defined with 14% and 10% by 2020 only.
The heat demand of buildings is to be reduced by 20% by 2020, the gross electricity consumption by 25% (compared to 2008) and the final energy consumption in the transport sector by 40% by 2050 (compared to 2005).
RESEARCH, DEVELOPMENT AND INNOVATION
The Deutsches Biomasseforschungszentrum (German Biomass Research Centre) has numerous projects on the use of biomass in electricity, heating and cooling and transport sector. Currently about 300 projects are finished or/and ongoing.
Scenarios and Forecasts
Several scenarios and forecasts for 2030 and a few for 2050 exist from different research institutions and have been provided.
BEST PRACTISES
Examples of combined systems and costs in transportation comprise i.e.:
Audi e-gas plant in Werlte: Opened in 2013, the Audi e-gas plant in Werlte in northern Germany generates synthetic natural gas from CO2 and renewable electricity from bioenergy, wind power and photovoltaics. The input power reaches 6 MW. On the one hand, hydrogen is generated as a product from surplus electricity from renewable sources, which will be used to power fuel cell cars in the medium term. The addition of CO2 from the neighbouring biogas plant, which uses organic waste as a substrate, also produces methane that can be fed into the natural gas grid and used as fuel. These processes produce 1.000 tonnes of methane per year and bind 2.800 tons of CO2.
Power-to-Gas plant in Allendorf (Eder): The demonstrator of the Allendorf (Eder) Power-to-Gas plant, which was developed as part of the BioPower2Gas project, is generating electricity-based and biologically produced fuel since March 2015. It converts surplus electricity from renewable energies into hydrogen, which is then converted into methane using CO2 from a biogas plant. Afterwards, it is fed into the natural gas grid. Since the successful certification of the synthetic natural gas in July 2015, it is used as fuel for Audis natural gas vehicles. No cost assessments available.
Flexibility for heating and cooling is not a sincere question in the field of heating and cooling supply, but, there are interesting concepts together with sector coupling with power supply, as bio-CHP technologies based on solid biofuels are limited in part load and load changing speeds. So a lot of development is in work in this field and biomass is also used in hybrid-technologies to compensate fluctuating renewable heating and cooling from other resources. Flexible solid biofuel CHP as well as flexible renewable hybrid heating and cooling are just under development or installed in very few demonstration cases.
Case studies with high relevance to flexible bioenergy are:
49
Flexible Biogas plant – state of the art concept: Flexible biogas plant in Saxony which is part of an unpublished manuscript (Hensel et.al. Further operation of flexible practice biogas plants - Realisable bid prices in EEG 2017, 2020, under review). The plant expand its capacity in 2019 from 562 kW (parted in two CHPU) with 800 kW. So, the power quotient (ratio of installed capacity and rated capacity) after flexibilization is nearly 2.2. The plant also need to enlarge the gas storage by 6.000 m³, the heat storage by 50 m³. The commissioning of the plant was 2007, so there are still 9 years left, until plant drop out of the remuneration scheme (20 years + short year after commissioning). With nearly double installed capacity compared to the rated capacity, the plant now can focus its power generation onto the twelve most valuable hours of a day. Usually the price-patterns at the power exchange show a twin-peaked shape and thus plants often run for two blocks (once forenoon, once in the afternoon or early evening). For this example, the overall investment for flexibilization is roughly 1.130 thousand Euro and increases the specific costs for production 14,93 ct/kWh to 21,00 ct/kWh. On the other hand, the plant can gain the flexible premium and market extra earnings. Because the flexibilization is also a precondition to bid for tenders which allow a subsequent funding of 10 years. This point is very crucial for the biogas plant inventory as a whole. For the reason that new constructions are not valuable under the current conditions, the preservation of the existing is an option to maintain the contributions of biogas plants to the power sector for the coming years.
SolarHeatGrid - municipal utility of Ludwigsburg-Kornwestheim: The municipal utility of Ludwigsburg-Kornwestheim is putting a hybrid heating system into practice, where solar heat and biomass were combined together with a large heat storage. The solely collector surface measures 14,800 m³ and can serve up to 9 MW thermal power with a calculated annual production of 5.5 GWh. The existing biomass cogeneration power-plant has a rated thermal input of 14,6 MW of which 2.1 MW for electricity and 9,8 MW for thermal output. The municipal utility also install a heat storage with a volume of 2,400 m³ to buffer intermittent heat amounts served by the solar collector field. The project was funded by the German Ministry for the Environment, Nature Conversation and Nuclear Safety by 10 Billion Euro for the extension of the heat piping, the solar heating collector field and the water based heat storage. The municipal Utility also plan to utilize the heat storage for two purposes. First to balance daily variations of solar heat harvest and second to uncouple to some extent the power as well as the heat generation from the wood based cogeneration plant.
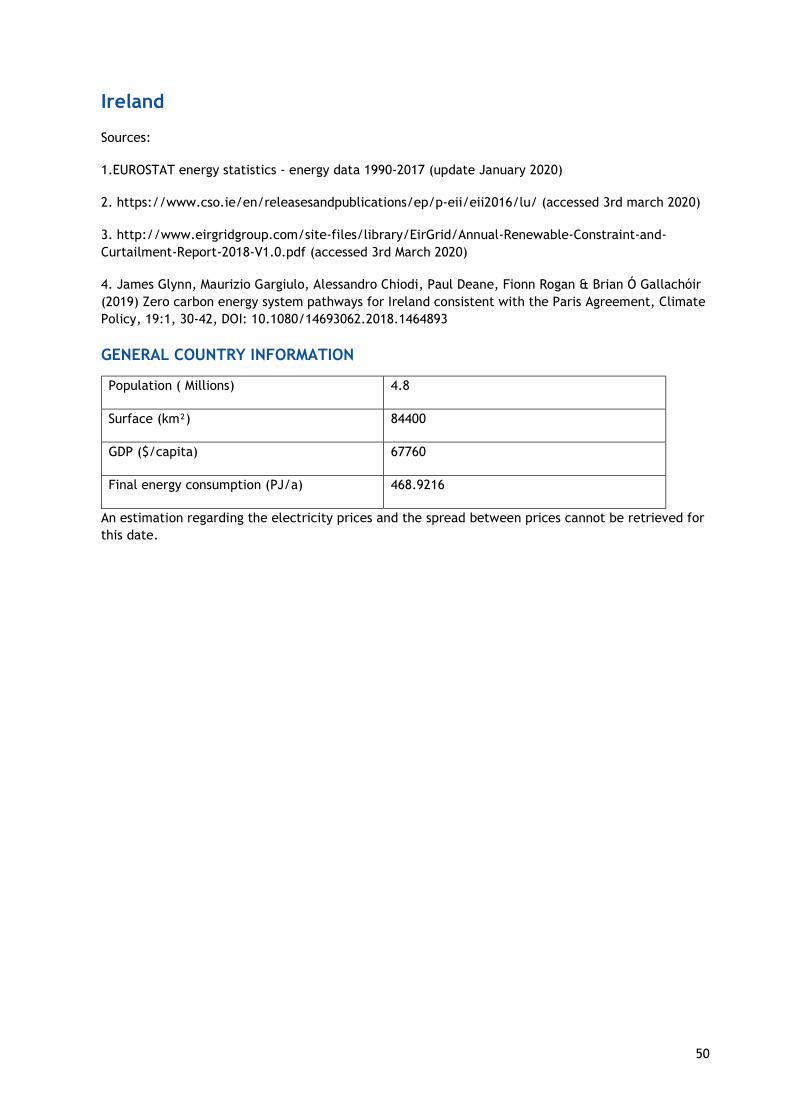
50
Ireland
Sources:
1.EUROSTAT energy statistics - energy data 1990-2017 (update January 2020)
2. https://www.cso.ie/en/releasesandpublications/ep/p-eii/eii2016/lu/ (accessed 3rd march 2020)
3. http://www.eirgridgroup.com/site-files/library/EirGrid/Annual-Renewable-Constraint-and-Curtailment-Report-2018-V1.0.pdf (accessed 3rd March 2020)
4. James Glynn, Maurizio Gargiulo, Alessandro Chiodi, Paul Deane, Fionn Rogan & Brian Ó Gallachóir (2019) Zero carbon energy system pathways for Ireland consistent with the Paris Agreement, Climate Policy, 19:1, 30-42, DOI: 10.1080/14693062.2018.1464893
GENERAL COUNTRY INFORMATION
Population ( Millions) 4.8
Surface (km²) 84400
GDP ($/capita) 67760
Final energy consumption (PJ/a) 468.9216
An estimation regarding the electricity prices and the spread between prices cannot be retrieved for this date.
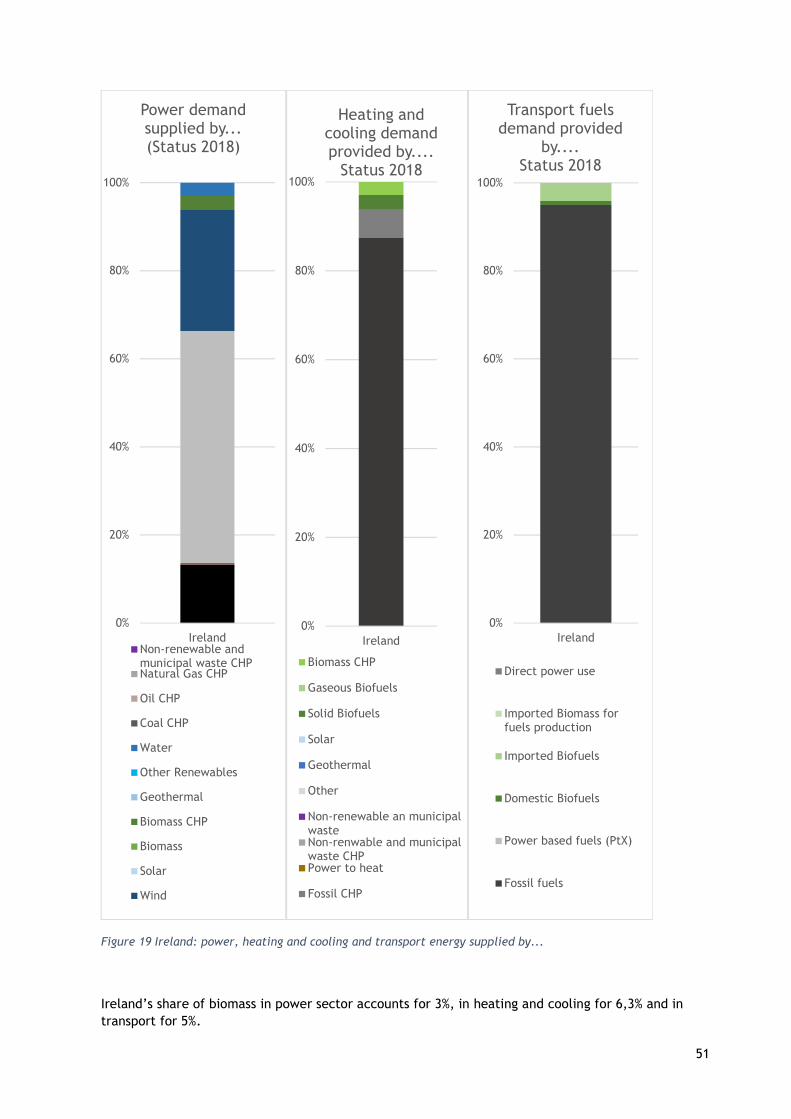
51
Figure 19 Ireland: power, heating and cooling and transport energy supplied by...
Ireland’s share of biomass in power sector accounts for 3%, in heating and cooling for 6,3% and in transport for 5%.
0%
20%
40%
60%
80%
100%
Ireland
Power demand supplied by... (Status 2018)
Non-renewable andmunicipal waste CHPNatural Gas CHP
Oil CHP
Coal CHP
Water
Other Renewables
Geothermal
Biomass CHP
Biomass
Solar
Wind
0%
20%
40%
60%
80%
100%
Ireland
Heating and cooling demand provided by....
Status 2018
Biomass CHP
Gaseous Biofuels
Solid Biofuels
Solar
Geothermal
Other
Non-renewable an municipalwasteNon-renwable and municipalwaste CHPPower to heat
Fossil CHP
0%
20%
40%
60%
80%
100%
Ireland
Transport fuels demand provided
by....Status 2018
Direct power use
Imported Biomass forfuels production
Imported Biofuels
Domestic Biofuels
Power based fuels (PtX)
Fossil fuels

52
STATUS QUO AND COUNTRY CLASSIFICATION
Ireland is according to experts in phase 3, where the need for additional investments in flexibility is crucial.
The TSO in Ireland is very proactive in the field of grid stability and has set up studies on system services. The overall aim of the DS3 Programme is to put in place the required changes to system policies, tools and performance to support the realisation of 75% System Non-Synchronous Penetration (SNSP) on the island of Ireland by 2020. Due to Ireland’s isolated island status and the dramatic increase in wind penetration levels in recent years, the level of non-synchronous power on the SEM system has risen at a faster rate than in any other region in Europe over this timeframe. In order to address some of the potential problems resulting from these unprecedented levels of intermittent renewables, the DS3 Programme was established by the Single Electricity Market Committee (SEMC) to provide for the introduction of a number of new system services by the TSOs, EirGrid and SONI, to ensure a safe and secure energy system, while also facilitating increased levels of non-synchronous generation (primarily renewables). To date, the DS3 Programme has enabled EirGrid and SONI to increase levels of instantaneous system non-synchronous penetration (SNSP) from 50% to 65%, with the aim of increasing this incrementally to 75% in 2020. The DS3 programme has therefore been overwhelmingly successful in facilitating the integration of renewables on the SEM system, which in terms of SNSP is unprecedented.
FLEXIBLE ENERGIES CAPACITIES
The level of bioenergy (2.2%) in Ireland is very low in the power system. Its contribution to flexibility is limited and there are no plans or goals in place. Currently solid biomass enters the power system via co-firing of peat fired power plant. The majority of these plants are due for closure between 2020 and 2023 thereafter the role of biomass in the power system is uncertain. One plant is likely to seek planning to move to 100% biomass when its current planning approval expires in 2023, thus maintaining some fuel diversity and possibly an indigenous fuel source if sufficient biomass can be produced locally. In the wider energy system context most of the growth in renewable energy in Ireland has come from wind. Wind provided 55% of all renewable energy in 2018. Solid biomass and bioliquids were the next largest sources of growth. Bioenergy, including biomass, landfill gas, biogas and bioliquids, collectively accounted for 36% of renewable energy in 2018.
In thermal Energy production solid biomass is used in some Saw/Timber Mills, CHP plant and industrial application but overall use is small. Renewable heat energy is dominated by solid biomass use (78%), in particular in industry. RES-H as a share of total heat energy doubled between 2005 and 2017, increasing from 3.4% to 6.7%. Even though the share doubled, the actual amount of renewable heat energy used only increased by two thirds. The difference was due to the reduction in overall heat energy demand between 2005 and 2017. This highlights that greater energy efficiency in buildings helps Ireland to meet the national renewable heat target and the binding overall renewable energy target, as well as our energy efficiency target and our greenhouse gas emissions targets. In 2018 this trend reversed and RES-H reduced to 6.5%, even though the amount of renewable heat energy used increased. This was because the total amount of fossil energy used for heat increased by more than the amount of renewable energy did.
Transport has by far the highest fossil fuel dependency, lowest degree of electrification and lowest share of renewable energy compared with the other major economic sectors (residential, industry, services), or compared with the other modes (heat, electricity). In 2018, 97% of transport energy was from oil-based products. Ireland has done relatively well at encouraging bio liquids in transport mainly biodiesel and to a lesser extend bio-ethanol. Since 2010, suppliers of oil products as road transport fuels in Ireland are required to blend biofuels with the fossil fuel they sell. This scheme is known as the Biofuels Obligation Scheme and is administered by the National Oil Reserves Agency. Fuel suppliers are granted certificates for each litre of biofuel blended that meets the minimum sustainability requirements laid out in the RED and in the indirect land-use change Directive.19 First-generation biofuels that meet the sustainability requirements are awarded one certificate per litre.

53
Two certificates are supplied for each litre of advanced biofuels and biofuels from waste, in line with the weightings specified in the RED. Virtually all biodiesel used in Ireland has qualified for double certificates since 2012, with 100% qualifying since 2016. No bio-gasoline qualified for double certificates before 2017, but in 2017 a small amount, just over 1%, did. In 2018 the share of bio-gasoline qualified for double certificates jumped to 18%. SEAI uses the National Oil Reserves Agency data for the amounts of biofuels used in Ireland.
LEGAL FRAMEWORK
There are no goals or expectation for flexible bioenergy currently. The main policy drivers have been renewable energy targets (EU Directives- (2009/28/EC)) and Emissions Reduction Targets for areas outside of electricity (EU Effort Sharing Decision- Decision No 406/2009/EC).
Policy instruments
Recent policy support or bioenergy has typically been for renewable heat with little focus on the flexibility benefits for the power system. This is likely because volumes are small.
Opportunities
This area has not received adequate attention in Ireland. A number of high levels energy system studies have examined energy system configurations that align with the Paris Climate Agreements (source in refs) however the detailed modelling of flexible bioenergy has not been undertaken. A number of academic publications have investigated the role and use of electro-fuels and power to gas system within the power system context.
Barriers and bottlenecks
Barriers are mainly non-technical and lack of visibility and policy support. Power system flexibility tend to focus on Interconnection, inherent flexibility and storage options. System wide levels of Bioenergy in general are small.
Phase out strategies
As stated in Ireland’s National Energy and Climate Action plan Ireland is committed to delivering an early and complete phase-out of coal and peat fired electricity generation. There is also an ambition to ‘effectively’ ban the installation of oil boilers from 2022 and the installation of gas boilers from 2025 in all new dwellings through the introduction of new regulatory standards for home heating systems. Progressively phase out oil and gas boilers in existing dwellings through a combination of incentives, information and regulatory measures.
KEY SECTORS AND KEY ACTORS
The transport and heating sectors would benefit most from bioenergy development. The power sector tends to focus in interconnection and traditional energy storage for flexibility rather than bioenergy.
Also policy makers and industrial sectors are seen as key stakeholders for future action.
GOALS AND EXPECTATIONS
There are no goals or expectation for flexible bioenergy currently. The main policy drivers have been renewable energy targets (EU Directives- (2009/28/EC)) and Emissions Reduction Targets for areas outside of electricity (EU Effort Sharing Decision- Decision No 406/2009/EC).
RESEARCH, DEVELOPMENT AND INNOVATION
Ireland takes a technology agnostic approach when funding energy RD&D. General prioritisation of areas to be funded is decided on the basis of an exercise run by the Department of Business,

54
Enterprise & Innovation (which focuses on all sectors of the economy) and also an annual Cross-Government consultation which is run by the Sustainable Energy Authority of Ireland (SEAI) (which focuses specifically on the energy sector and its connections to other sectors). This coordinated approach ensures that energy research funding is highly targeted. Funding is available to all relevant areas, and recent research projects include those in areas such as: bioenergy, wind energy, ocean energy, carbon capture & storage (CCS), smart grids, hydrogen, solar energy, energy in transport, energy in agriculture, energy efficiency, renewable energy and ICT for energy. R&D tends to be academic publications which mainly focus on PtX, biogas and smaller systems for example https://www.sciencedirect.com/science/article/abs/pii/S0306261918301387
Scenarios and Forecasts
Some numbers and forecasts for 2030 and 2050 have been submitted with the questionnaire.
BEST PRACTISES
Examples of combined systems and costs in transportation were not submitted.
Examples of flexible bioenergy systems in the heat sector: Ireland has very low levels of bioenergy and the contribution to system flexibility is not quantified. A recent Support Scheme for Renewable Heat incentivises the installation and use of biomass and anaerobic digestion heating systems. The scheme includes detailed sustainability criteria in line with the recast Renewable Energy Directive. Government will continue financial supports for the continued mobilisation of biomass from forests by providing assistance for measures such as forest road construction, knowledge transfer groups and decision support tools. Wood fibre used for energy generation will continue to be used in the forest products sector to dry sawn timber reducing the dependency on fossil fuels. Use of biomass for heat and electricity generation will continue to use small diameter material which facilitates the sustainable management of forests where harvesting is regulated by the Forestry Act 2014. Forests felled are replanted ensuring that biomass is harvested from sustainable resources. The Irish Forest estate is forecasted to increase the supply of wood biomass for energy and wood-based panels from 1.8 million cubic metres currently, to over 4 million cubic metres by 2035. Significantly more volumes in excess of these figures will be used by the sawmilling sector. Where demand exceeds available domestic supply biomass and will be imported from third countries from sustainable sources which also must satisfy the requirements of the EU timber regulation. ..
Case studies with high relevance to flexible bioenergy:
SLURRES is a low-cost technology and business model to mobilize livestock slurries for community based Anaerobic Digestion. The study was a collaboration between University of Limerick (UL) and TCBB Resource, and was funded by the SEAI Research, Development & Demonstration Funding Program TCBB RESOURCE is an R&D company that works with Irish State agencies, universities and companies to commercialize renewable energy technologies. One of Ireland’s biggest biomass sources are the solid residues in livestock slurries, wastewater sludges and similar materials. These materials have historically been treated as wastes and were processed for disposal. These valuable resources however can be used for energy recovery and nutrient recycling. This project was undertaken to develop the technology that will facilitate use of these materials as renewable energy resources as opposed to waste. The Concept: On a farm, sawdust is blended into animal slurries with the mixture filtered through a very high-pressure filtration process to remove the solids. The filtered solids are a compost-like material that can be cost-effectively collected and transported to a renewable energy site to convert into gas or electricity. This process is a very low-cost process that minimizes the cost of renewable energy for the surrounding community. At the farm, the residual slurry liquor is clarified to facilitate precipitation of the residual ammonia, which is removed in a crystalline form that can be used as a fertilizer. The treated water is quite pure, and can then be discharged with no environmental impact.

55
Support from the SEAI Research, Development & Demonstration Funding Program provided the resources to answer key questions related to development of a separation technology that could efficiently remove solids to a standard that allowed ammonia removal from the residual liquors. https://www.seai.ie/case-studies/slurries/
Ards Friary in Creeslough, Co. Donegal upgrade. Prior to this project, the building heating requirements were met by two 300 kW boilers, while a smaller 176 kW boiler was used for summer domestic hot water generation. These have now been replaced by a lead 250 kW biomass boiler, fueled by timber sourced and chipped on the estate, and supported by a 250 kW LPG condensing boiler for standby and top up. The biomass boiler is configured to burn wood with moisture contents of between 30% and 50%, and has a rated operational efficiency of 92% at full load more information https://www.seai.ie/case-studies/wood-fired-heat-generation-and-building-energy-upgrade/
Coillte: Forest Logistics Energy Optimization Project. Coillte Forest’s core business is supplying logs to sawmills and panel board manufacturing facilities. Coillte Project Manager, Mike O’Shea, carried out a comprehensive market analysis in 2011 on the current transport operations with a view to introducing improvements and efficiencies. https://www.seai.ie/case-studies/forest-logistics-energy-optimisation-project-at-coillte/

56
Italy
1. ISTAT Indicatori demografici. 2019, 4–7.
2. https://www.istat.it/it/archivio/137001 (accessed 7/5/2020)
3. https://data.worldbank.org/indicator/NY.GDP.PCAP.CD?locations=IT (accessed 7/5/2020)
4. https://ec.europa.eu/eurostat/databrowser/view/t2020_34/default/table?lang=en (accessed 7/5/2020)
5. FAO COUNTRY REPORT Italy 2015. 2014, 70.
6. N.1, G.D.L.; BIOMASSE STATO DELL’ARTE DELLA BIOENERGIA IN ITALIA. 2014, 1–108.
7. CREA L’agricoltura italiana conta 2019; 2020; ISBN 978-88-8145-415-0.
8. Mancini, A.M.; Berton, C.M.; Apote, C.L.D.; Pari, C.L.; Sandro, E.; Andrea, S.D. Biomasse ed energia - Disponibilità delle biomasse. Progett. Biomasse 2009.
9. Bozzetto, S.; Pezzaglia, M.; Rossi, L. Considerazioni sul potenziale del “biogas fatto bene” italiano ottenuto dalla digestione anaerobica di matrici agricole; Lodi, 2016;
10. Terna Annuario Statistico 2018 - Produzione; 2019; https://www.terna.it/it/sistema-elettrico/statistiche/pubblicazioni-statistiche
11. Terna Annuario Statistico 2018 - Dati generali; 2019; Terna. (2018). Annuario Statistico 2018 - Impianti di generazione. https://www.terna.it/it/sistema-elettrico/statistiche/pubblicazioni-statistiche
12. Eurostat. (2019). SHARES detailed results 2018 - Italy. https://ec.europa.eu/eurostat/web/energy/data/shares
13. Agrillo, A., Verme, M. dal, Liberatore, P., Lipari, D., Lucido, G., Maio, V., & Surace, V. (2019). RAPPORTO STATISTICO 2018 - Fonti Rinnovabili. https://www.gse.it/dati-e-scenari/statistiche
14. OCSIT. (2016). Italy Location and Quantity of Fuels Emergency Stocks. http://www.ocsit.it/en/content/italy-–-location-emergency-stocks-–-1-april-2016
15. Council of European Energy Regulators. (2018). Status Review of Renewable Support Schemes in Europe for 2016 and 2017 | Public report. December, 126. https://www.ceer.eu/documents/104400/-/-/80ff3127-8328-52c3-4d01-0acbdb2d3bed
16. Terna. (2019). Annuario Statistico 2018 -Impianti di generazione. https://www.terna.it/it/sistema-elettrico/statistiche/pubblicazioni-statistiche
17. Terna. (2018). RAPPORTO PUBBLICO ANNO 2017 - STORAGE LAB - SPERIMENTAZIONE DI PROGETTI PILOTA DI ACCUMULO ENERGETICO DI TIPO POWER INTENSIVE.
18. Terna. (2018). RAPPORTO PUBBLICO ANNO 2017 - II ANNO DI SPERIMENTAZIONE - SPERIMENTAZIONE DI PROGETTI PILOTA DI ACCUMULO ENERGETICO A BATTERIE DI TIPO ENERGY INTENSIVE.
19. Osservatorio Sistemi di Accumulo. (2019). ELABORAZIONE ANIE RINNOVABILI DATI GAUDì - FONTE TERNA.
20. COWI, Ecofys, Thema, Vito, & Energyville. (2016). IMPACT ASSESSMENT STUDY ON DOWNSTREAM

57
FLEXIBILITY, PRICE FLEXIBILITY, DEMAND RESPONSE & SMART METERING - Final Report (Issue ENER/B3/2015-641).
21. Heat Roadmap Europe 2050. (2015). 2015 Final Heating & Cooling Demand in Italy. https://heatroadmap.eu/wp-content/uploads/2018/11/HRE4-Country_presentation-Italy.pdf
22. Eurostat. (2020). Energy balance flow for Italy 2018. https://ec.europa.eu/eurostat/cache/sankey/energy/sankey.html?geos=IT&year=2018&unit=TJ&fuels=RA000&highlight=_4_5_6_8_&nodeDisagg=010100000000
0&flowDisagg=true&translateX=133.64603837214725&translateY=51.85221663007712&scale=0.8615237662477769&language=EN
23. Bozzetto, S., Pezzaglia, M., Rossi, L., & Pecorino, B. (2016). Considerazioni sul potenziale del “biogas fatto bene” italiano ottenuto dalla digestione anaerobica di matrici agricole. http://www.consorziobiogas.it/pubblicazioni-in-evidenza.htm
24. GRUPPO DI LAVORO N.1. (2014). TAVOLO DI FILIERA PER LE BIOENERGIE - STATO DELL’ARTE DELLA BIOENERGIA IN ITALIA.
25. Ministry of Economic Development, Ministry of the Environment and Protection of Natural Resources and the Sea, & Transport, M. of I. and. (2019). INTEGRATED NATIONAL ENERGY AND CLIMATE - Italy (Issue December). https://www.mise.gov.it/index.php/it/198-notizie-stampa/2040668-pniec2030
26. ENTSO-E. (2019). Regional Investment Plan (2017) Regional Group Continental Central South. https://www.entsoe.eu/Documents/TYNDP documents/TYNDP2018/rgip_CCE_Full.pdf
27. IRENA. (2018). Renewable Energy Prospects for the European Union. https://www.irena.org/publications/2018/Feb/Renewable-energy-prospects-for-the-EU
28. E3M, ICCS-NTUA, IIASA, & EuroCARE. (2016). EU Reference Scenario 2016 - Energy, transport and GHG emissions Trends to 2050. https://doi.org/10.2833/001137
29. GME. (2019). Italian Day Ahead Market 2018 Historical Dataset. https://www.mercatoelettrico.org/en/download/DatiStorici.aspx
30. MISE, & MATTM. (2017). Strategia Energetica Nazionale (SEN), 2017. Mise; Mattm, 10 November 2017, 1–308.
31. MiSE. (2019). DM 28/06/2019 - Capacity market. 1–5. https://www.mise.gov.it/index.php/it/normativa/decreti-ministeriali/2039896-decreto-ministeriale-28-giugno-2019-capacity-market
32. CdP, Terna S.p.A., Snam, & Ambrosetti. (2019). The energy transition in Italy and the role of the gas and power sectors. https://download.terna.it/terna/The_Energy_Transition_8d752160d62f6a6.pdf
33. Terna S.p.A. (2019). Rapporto adeguatezza Italia 2019. https://download.terna.it/terna/Rapporto Adeguatezza Italia 2019_8d71cb7ff32ad37.pdf
34. Terna S.p.A. (2020). Piano di sviluppo 2020. https://www.terna.it/en/electric-system/grid/national-electricity-transmission-grid-development-plan
35. ARERA. (2019). DELIBERAZIONE - 156/2019/R/EEL (Issue 16 APRIL 2019). https://www.arera.it/it/docs/19/156-19.htm

58
36. Energy&Strategy Group, & PoliMi. (2019). ELECTRICITY MARKET REPORT 2019. www.energystrategy.it
37. Terna S.p.A. (2004). Codice di trasmissione dispacciamento, sviluppo e sicurezza della rete. https://www.terna.it/it/sistema-elettrico/codici-rete
38. Energy&Strategy Group, PoliMi, & RSE. (2019). Analisi dello stato attuale e delle possibili evoluzioni dei mercati elettrici in Italia. www.energystrategy.it
39. Falck Renewables. (2014). Falck Renewables SpA: avviato a Rende, in Calabria, il primo impianto ibrido - solare termodinamico a concentrazione e biomasse. https://www.falckrenewables.eu/
40. Enel. (2016). Cornia 2: ibrido da record per l’energia efficiente. https://corporate.enel.it/it/megamenu/media/news/2016/05/cornia-2-ibrido-da-record-per-lenergia-efficiente/
41. GSE. (2016). Rapporto Statistico - Energia da fonti rinnovabili in Italia - Anno 2016. https://www.gse.it/documenti_site/Documenti GSE/Rapporti statistici/Rapporto statistico GSE - 2016.pdf
42. GSE. (2016). Valutazione del potenziale nazionale e regionale di applicazione della cogenerazione ad alto rendimento e del teleriscaldamento efficiente. https://ec.europa.eu/energy/sites/ener/files/documents/it_potenziale_car_tlr_nazionale_e_regionale_dic_2016.pdf
43. GSE. (2020). TELERISCALDAMENTO E TELERAFFRESCAMENTO 2018 - Nota di approfondimento GSE. https://www.gse.it/documenti_site/Documenti GSE/Rapporti statistici/Nota TLR 2019.pdf
44. ACEA Pinerolese. (n.d.). IL BIOMETANO E LE FRONTIERE FUTURE. Retrieved May 29, 2020, from https://www.aceapinerolese.it/ambiente/il-biometano-dai-rifiuti-organici/
45. CORDIS. (n.d.). ProGeo Factsheet. Retrieved May 29, 2020, from https://cordis.europa.eu/project/id/717957/reporting
46. ENEA. (n.d.). The + GAS Project. Retrieved May 29, 2020, from http://www.piugas.enea.it/PIUGAS/default.asp?lingua=en&node_id=1
47. Sundseth, K., Midthun, K., Aarlott, M., & Werner, A. (2018). REMOTE - D2.1 - Remote area Energy supply with Multiple Options for integrated hydrogen-based Technologies. https://www.remote-euproject.eu/remote18/rem18-cont/uploads/2019/03/REMOTE-D2.1.pdf
48. ARERA. (2020). DOCUMENTO PER LA CONSULTAZIONE 39/2020/R/GAS - RETI DI TRASPORTO E DISTRIBUZIONE DEL GAS NATURALE : PROGETTI PILOTA DI OTTIMIZZAZIONE DELLA GESTIONE E UTILIZZI INNOVATIVI - Linee di intervento. https://www.arera.it/it/docs/20/039-20.htm
49. Terna, & Snam. (2019). Documento di Descrizione degli Scenari 2019. https://download.terna.it/terna/DDS libro 09 30 17h15_8d745ced8696c60.pdf
50. Ministero dello Sviluppo Economico. (2019). Ministerial Decree DM 4/7/2019. https://www.gse.it/documenti_site/Documenti GSE/Servizi per te/FER ELETTRICHE/NORMATIVE/DM 4 luglio 2019 - Incentivazione dell’energia elettrica prodotta dagli impianti.pdf
51. MISE. (2016). Ministerial Decree DM 23/6/2016. https://www.gse.it/documenti_site/Documenti GSE/Servizi per te/FER ELETTRICHE/NORMATIVE/DM 23 giugno 2016.PDF
52. MiSE. (n.d.). M.D. 06/07/2012. Gazzetta Ufficiale n.159, 10/07/2012, 1–65. https://www.gse.it/documenti_site/Documenti GSE/Servizi per te/FER
59
ELETTRICHE/NORMATIVE/_DM_6_LUGLIO_2012.pdf
53. Mathieu, C., & Eyl-Mazzega, M.-A. (2019). Biogas and Biomethane in Europe - Lessons from Denmark, Germany and Italy (Issue Études de l’Ifri).
54. MISE, MATTM, & MiPAAF. (2018). D.M. 2 March 2018 - Promozione dell’uso del biometano e degli altri biocarburanti avanzati nel settore dei trasporti. https://www.gse.it/documenti_site/Documenti GSE/Servizi per te/BIOMETANO/NORMATIVA/D.M. MiSE 2 marzo 2018.pdf
55. MISE, & MATTM. (2017). Strategia Energetica Nazionale (SEN), 2017. Mise; Mattm, 10 November 2017, 1–308.
56. CREA. (2019). POSIZIONE DEL MINISTERO DELLE POLITICHE AGRICOLE ALIMENTARI, FORESTALI E DEL TURISMO E SUL PIANO CLIMA –ENERGIA E SULLA RED II. https://www.politicheagricole.it/flex/cm/pages/ServeAttachment.php/L/IT/D/3%252F5%252F7%252FD.f76b97704a12e3cd7d17/P/BLOB%3AID%3D14188/E/pdf
57. Terna. (2018). Annuario Statistico 2018 - Impianti di generazione. https://www.terna.it/it/sistema-elettrico/statistiche/pubblicazioni-statistiche
GENERAL COUNTRY INFORMATION
Population ( Millions) 60.39
Surface (km²) 302073
GDP ($/capita) 34483
Final energy consumption (PJ/a) 4876.37
According to GME (Italian Electric Market Supervisor) the 2018 average value of Base-Peak-Spread is 3.12 €/MWh. The maximum value reached 16.13 €/MWh on 27/02/2018, while the minimum value reached -8.54 €/MWh on 01/04/2018 [29]. The calculation is based on PUN (Single National Price) values, and the whole year trend for the average daily value of the Base-Peak-Spread is reported in Figure 20.

60
Figure 20 Yearly and Daily Average value trends for Base-Peak Spread in 2018, Italy (PUN-based) – Authors’ elaboration on [29] data
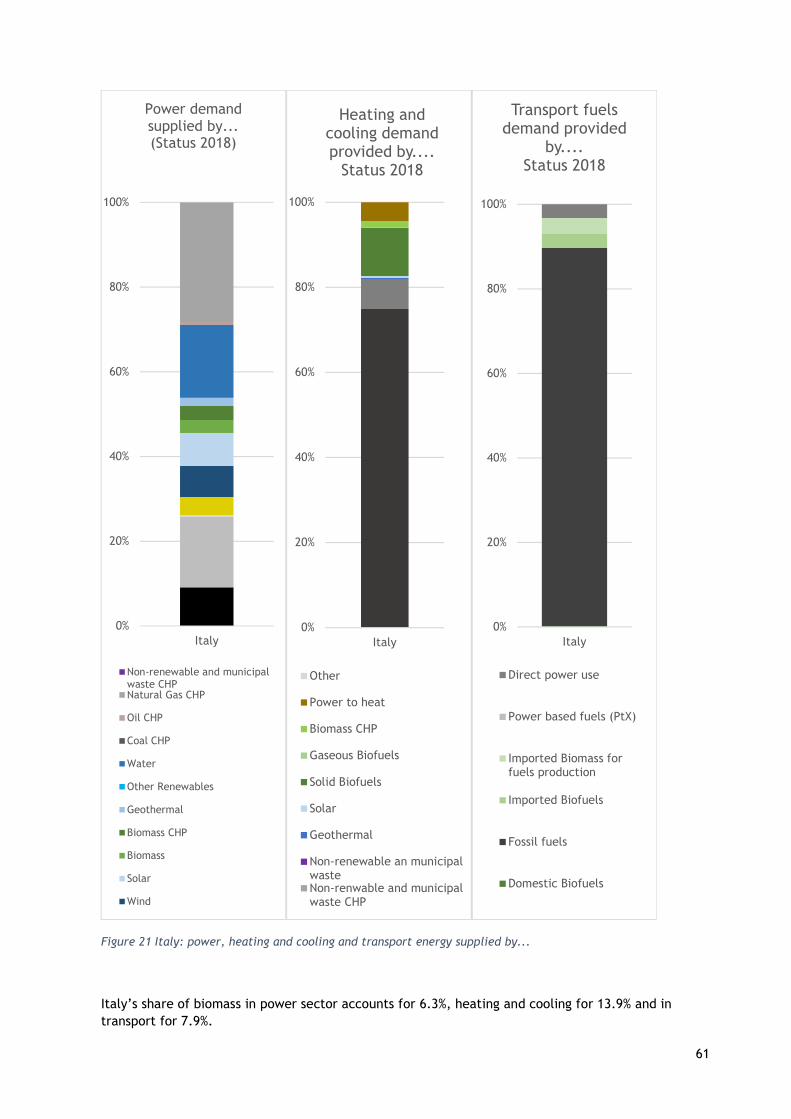
61
Figure 21 Italy: power, heating and cooling and transport energy supplied by...
Italy’s share of biomass in power sector accounts for 6.3%, heating and cooling for 13.9% and in transport for 7.9%.
0%
20%
40%
60%
80%
100%
Italy
Power demand supplied by... (Status 2018)
Non-renewable and municipalwaste CHPNatural Gas CHP
Oil CHP
Coal CHP
Water
Other Renewables
Geothermal
Biomass CHP
Biomass
Solar
Wind
0%
20%
40%
60%
80%
100%
Italy
Heating and cooling demand provided by....
Status 2018
Other
Power to heat
Biomass CHP
Gaseous Biofuels
Solid Biofuels
Solar
Geothermal
Non-renewable an municipalwasteNon-renwable and municipalwaste CHP
0%
20%
40%
60%
80%
100%
Italy
Transport fuels demand provided
by....Status 2018
Direct power use
Power based fuels (PtX)
Imported Biomass forfuels production
Imported Biofuels
Fossil fuels
Domestic Biofuels
62
STATUS QUO AND COUNTRY CLASSIFICATION
Italian experts see the country in phase 4, requiring advanced technologies to ensure reliability and structural surpluses of VRE generation leading to curtailment
The penetration of V-RES in the Italian power system is expected to reach 34% in 2030, as reported in Table 4. This will require investments in advanced technologies, with forecasted deployment of 14 GW / 2.7 TWh of Electrical Storage (cumulative values arising from electrochemical storages, both at distributed and utility-scale level, pumped hydro and others) and 7.7 GW of Demand Side Management active services, as reported in Table 5. Several other intervention measures are already projected in terms of Transmission Grid upgrades and part of them are described in phase out strategies.
Grid stability: The ancillary services needed to grant adequacy and secure the management of the Italian power system are distinguished between “market” and “non-market” resources. Market resources are collected on the Dispatchment Services Market (MSD – Mercato dei Servizi di Dispacciamento) and activated when needed by Terna, the Italian TSO which is also entitled for dispatchment activities management. Non-market resources are either mandatorily provided by a group of generation plants that fulfil specific technical and operational requirements (I.e., it is mandatory for all the “Relevant production units”, which are all the dispatchable generation units with a nominal power of 10 MVA or higher. Then, depending on the specific ancillary service, further specification requests on minimum power variation, minimum power gradient and minimum service time could be defined.) or are collected out of the market through dedicated auctions and paid on an ad-hoc basis. Ancillary services can also be classified based on their purpose; this allows to distinguish between:
System services, granting safety, adequacy and efficiency of the system, such as Interruptible Loads, clearance of Network congestions during dispatchment planning phase
Network services for frequency stabilization, such as Primary Frequency Regulation, Secondary Frequency Regulation, Tertiary Frequency Regulation and Balancing
Network services for voltage stabilization, such as Primary Voltage Regulation and Secondary Voltage Regulation.
Table 5 and Figure 22 summarize the main information about the various ancillary services developed in the Italian power system; in the following part of this section they are described more in-depth, with regards to technical specifications and requirements to be fulfilled by the power generators to be allowed to participate.
Table 5 Summary of main Ancillary services characteristics (Authors’ own elaboration from [36])
Service Class
Ancillary Service Authorized resources
Particip. Method
Payment Method
Frequency Regulation
Primary Reserve Relevant units Mandatory Optional
Secondary Reserve Relevant units MSD
Pay-as-bid (€/MWh)
Tertiary Reserve Relevant units MSD
Pay-as-bid (€/MWh)
Balancing Relevant units MSD
Pay-as-bid (€/MWh)
Network operational limits
Network congestions clearance
Relevant units MSD Pay-as-bid (€/MWh)
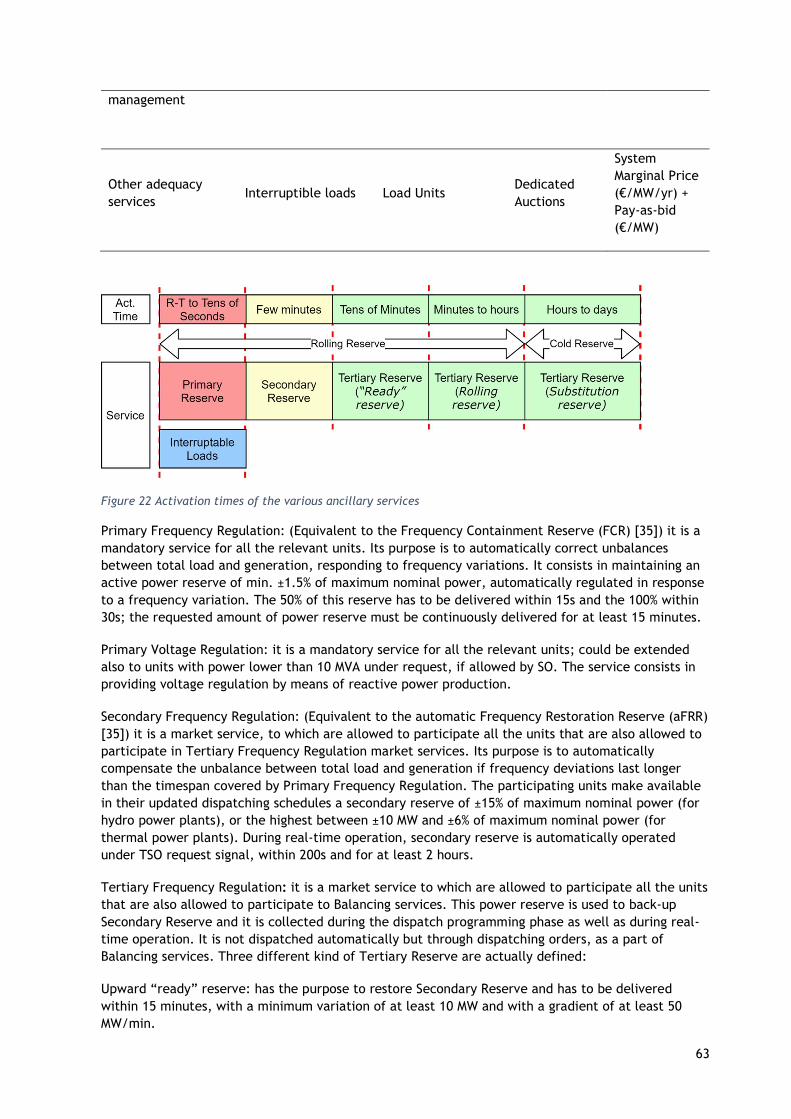
63
management
Other adequacy services
Interruptible loads Load Units Dedicated Auctions
System Marginal Price (€/MW/yr) + Pay-as-bid (€/MW)
Figure 22 Activation times of the various ancillary services
Primary Frequency Regulation: (Equivalent to the Frequency Containment Reserve (FCR) [35]) it is a mandatory service for all the relevant units. Its purpose is to automatically correct unbalances between total load and generation, responding to frequency variations. It consists in maintaining an active power reserve of min. ±1.5% of maximum nominal power, automatically regulated in response to a frequency variation. The 50% of this reserve has to be delivered within 15s and the 100% within 30s; the requested amount of power reserve must be continuously delivered for at least 15 minutes.
Primary Voltage Regulation: it is a mandatory service for all the relevant units; could be extended also to units with power lower than 10 MVA under request, if allowed by SO. The service consists in providing voltage regulation by means of reactive power production.
Secondary Frequency Regulation: (Equivalent to the automatic Frequency Restoration Reserve (aFRR) [35]) it is a market service, to which are allowed to participate all the units that are also allowed to participate in Tertiary Frequency Regulation market services. Its purpose is to automatically compensate the unbalance between total load and generation if frequency deviations last longer than the timespan covered by Primary Frequency Regulation. The participating units make available in their updated dispatching schedules a secondary reserve of ±15% of maximum nominal power (for hydro power plants), or the highest between ±10 MW and ±6% of maximum nominal power (for thermal power plants). During real-time operation, secondary reserve is automatically operated under TSO request signal, within 200s and for at least 2 hours.
Tertiary Frequency Regulation: it is a market service to which are allowed to participate all the units that are also allowed to participate to Balancing services. This power reserve is used to back-up Secondary Reserve and it is collected during the dispatch programming phase as well as during real-time operation. It is not dispatched automatically but through dispatching orders, as a part of Balancing services. Three different kind of Tertiary Reserve are actually defined:
Upward “ready” reserve: has the purpose to restore Secondary Reserve and has to be delivered within 15 minutes, with a minimum variation of at least 10 MW and with a gradient of at least 50 MW/min.
64
Rolling reserve: has the purpose to restore Secondary Reserve and Upward “ready” reserve. It has to be delivered within 15 minutes and must be sustained for at least 120 minutes, with a minimum variation of at least 10 MW and with a gradient of at least 0.2 MW/min.
Substitution reserve: (Equivalent to the Replacement Reserve [35]) with a minimum variation of at least 10 MW and with a gradient of at least 0.2 MW/min. It must be delivered within 120 minutes and could be sustained with no time limits.
Balancing: it is a market service to which can participate all the dispatchable relevant units, with the same minimum technical characteristics needed to participate in the rolling Reserve of Tertiary Frequency Regulation. It is used to restore Secondary Reserve, solve network congestions and compensate the unbalance between total load and generation. The needed resources are collected on the MSD Market.
Interruptible Loads: This service is collected through dedicated auctions and involves consumption units (loads). It could be “real-time” if activated within 200ms or “delayed” if activated within 5s.
Clearance of Network congestions during dispatchment planning phase: it is a market service to which can participate all the dispatchable relevant units that can change their scheduling plan by at least 10 MW with a gradient of 0.2 MW/min. By participating, the unit allow the SO to use its available power and change its dispatching programs, up to maximum power or down to minimum technically allowed power.
FLEXIBLE ENERGIES CAPACITIES
No specific goals are in place for flexible electrical energy production from bioenergy.
Taking into account CHP plants or CHP district heating as a source of flexibility, some subsidy mechanisms were set in the previous years. As an example, the Ministerial Decree 6/7/2012 [52], which defined feed-in tariffs for electricity produced by RES (bioenergy feed-in tariffs ranged between 85 and 257 €/MWh), set also the following specific premiums for sustainable bioenergy-powered (non-waste) High Efficiency CHP:
• 40 €/MWh for bioenergy-powered plants
• 40 €/MWh for bioenergy plants where the produced heat is used for District Heating
The feed-in tariffs set by the decree were paid for a 20 years period to new plants (in some cases also to revamped plants). On top of that, bioenergy-powered plants are granted dispatch priority.
The following Ministerial Decree D.M. 23/6/2016 removed the premium for High Efficiency CHP plants and slightly reduced the value of feed-in tariffs for electricity produced by RES [51].
The last Ministerial Decree D.M. 04/07/2019, which further modified feed-in tariffs for electricity produced by new RES power plants, does not take into account electricity from bioenergy [50].
Anyway, power network adequacy and flexibility are assured by grid code specification and some flexibility services are traded on the Dispatching Services Market as well as on the Balancing Market. Bioenergy-powered plants could as well trade in power network flexibility services, if they can cope with grid code requirements.
Anyway, the existence of the above-mentioned Feed-In Tariffs somehow prevents this kind of flexibility-oriented operations, that need the plant not to operate at its maximum power, in order to be able to adjust its output following the requests of TSO. This, together with the fact that most of the time Feed-In Tariffs are higher than flexibility services tariffs, would lead at least to investment uncertainties or revenue losses.

65
During 2019, a pilot action started, aiming to evaluate the possibility to allow smaller plants and other subjects to give flexibility services to the power network. The new regulated subject which has been created is called Mixed Qualified Virtual Unit (the Italian acronym for that is UVAM) and represents a (eventually distributed) set of electrical loads, plants and storages managed by a Balancing Service Provider. The total power of the aggregate must be higher than 1 MVA (otherwise the threshold is set at 10 MVA) and the single units could be of smaller size. There have already been two auctions that assigned around 1,000 MW divided between 27 different Balancing Service Providers [36].
Finally, Italian natural gas TSO, SNAM, together with power network TSO Terna, started some sector-coupling preliminary evaluations, preparing a joint report that highlighted the use of programmable RES as one of the research topics that could address the need for adequacy increase, arising from the growing V-RES penetration in the power network. The possibility of using power-to-gas technologies is clearly stated in the report; anyway, the evaluation of its contribution to the general scenario has not been defined yet and it is postponed to a following period [49].
No specific goals are in place for flexible thermal energy production from bioenergy. Taking into account CHP plants or CHP district heating operation as a source of flexibility, some subsidy mechanisms were set in the previous years. The general framework is described in the above section, given the fact that the subsidies were mostly related to the electrical energy output of the plant.
No specific goals are in place for flexible bioenergy use in transport.
specific strategy/role of renewable gas in facilitating flexibility within and between energy sectors: Regarding renewable gas and integration between sectors no other targets for biomethane are proposed in the 2017 NES or in the 2019 NECP for sectors other than transport.
Anyway, while the transport sector could serve as a lever for the initial development of biomethane, other applications are also expected to develop, in view of the flexibility of use of biomethane and its huge potential.
So far, the Guarantees of Origin are the only tool that the two documents mention to support the use of biomethane in non-transport sectors. At this stage, this seems to suggests that either the support scheme will be updated when the target for biomethane in the transportation sector is reached (as stated in the preamble of the 2018 Biomethane Decree) or that the GOs are expected to be sufficient in order to incentivize biomethane production for its use in other sectors [49].
Moreover the Italian NECP highlighted the potential support that a ‘hybrid’ electric-gas energy system could offer to a robust development of non-programmable renewable sources, in synergy with the development of renewable gas (biomethane, hydrogen and synthetic methane). In the same period, Italian regulation authority ARERA prepared a consultation document which set the general characteristics for innovative pilot projects to be selected in a forthcoming call for proposal. These projects should be involving gas networks, Power to Gas technology use and renewable gas injection into the gas grid, for transport and storage purposes [53].
LEGAL FRAMEWORK
The legal framework comprises the Ministerial Decree 6/7/2012 [52], which defined feed-in tariffs for electricity produced by RES (bioenergy feed-in tariffs ranged between 85 and 257 €/MWh) and set also the following specific premiums for sustainable bioenergy-powered (non-waste) High Efficiency CHP 40 €/MWh for bioenergy-powered plants and 40 €/MWh for bioenergy plants where the produced heat is used for District Heating.
Policy instruments
No policy instruments specifically fostering bioenergy flexibility are in place up to date; anyway, the Italian NECP expects that the various forms of power-to-gas could play a key role and fosters their

66
development.
On the market side the new capacity market, launched in late 2019, is expected to be the main channel to collect new storage systems and generation capacity investments.
On regulation and policy side, in the last years calls for pilot projects have been activated in order to evaluate the possible contribution of new subject to power system flexibility, such as the UVAM pilot briefly described in section best practices. Moreover, Italian regulation authority ARERA prepared a consultation document with proposed guidelines for a forthcoming call for innovative pilot projects involving Power to Gas technology use and renewable gas injection into the gas grid, for transport and storage purposes [48].
On a more general view, the Energy Efficiency Certificates scheme (EECs, or, in Italian, Titoli Efficienza Energetica – TEE) is a supporting scheme that applies to High Efficiency CHP units. It rewards primary energy savings obtained by CHP units when compared with two separate heating and power generators. EECs are tradable or there is the possibility to have them collected by GSE. Anyway, the EEC scheme applies with no distinction made on the primary energy source used.
As reported, the 2018 Biomethane Decree allow the possibility to maintain part of the previous electricity production levels when transforming a biogas-powered generation plant to a biomethane production site.
Moving to a longer term perspective, the Italian NECP also foresees the great potential of a ‘hybrid’ electric-gas energy system, taking into account the development of renewable gas (biomethane, hydrogen and synthetic methane) to support the robust development of non-programmable renewable sources [25].
Opportunities
At this time no incentive schemes or feed-in tariffs are in place for newly deployed bioenergy plants for electricity production, while the oldest among the existing ones could already be approaching the end of their incentivized period.
Thus, in the coming years, a number of plants could have to redefine their business plan, or even decide to stop operations. Within this framework, there is an opportunity for these plants to provide low-carbon energy for grid stabilization or act as “peaker” plants to cover residual load, complementing wind and solar.
Biogas-powered power plants are of course inscribed in the same framework; moreover, the Biomethane Decree [54] explicitly states that, when transforming a biogas power plant to a biomethane production site, it is possible to maintain part of the previous electricity production level.
In addition to that, biomethane plants could find a synergy with the installation of electrolyser to chemically store, through methanation process, electricity into fuels and enable a way to use wind and solar surplus energy.
Barriers and bottlenecks
Mainly, non-technical barriers hamper bioenergy plants flexibility implementation. Within power sector, among all, one of the main barriers is the feed-in tariff, in place for already existing power plants, together with the dispatchment priority and the lack of incentives for bioenergy participation in the Balancing market.
Moreover, the 2017 National Energy Strategy stated that bioenergy contribution should be focused toward sectors different than power generation, e.g. to the transport sector [55]. The Italian NEPC, issued in 2019, didn’t provide specific goals for flexible bioenergy in the power sector; it mentioned P2G importance, but it seems to foresee a delayed start for the use of this technology, in later years
67
than 2030.
Phase out strategies
The 2017 Italian National Energy Strategy confirmed the political commitment to phase-out coal from power generation in 2025 [30]. This commitment, together with the forecasted additional growth of V-RES in the power sector, is expected to reduce power system adequacy under acceptable levels. Thus, the Italian TSO, Terna, has been appointed to define a set of measures with the aim to restore appropriate adequacy levels through analysis and scenario forecasts. Finally, they were defined [32] and are consisting of:
• Transmission Grid and Interconnections upgrades, in order to reduce congestions and remove constraints.
• Installation of 4,500 MVAr of Synchronous Compensators [33]
• Deployment of 5.4 GW of natural gas-powered plants (60% of this capacity should be installed in North Region, while the rest should be shared between South, Central and Sardinia)
• Installation of 3 GW of utility-level electro-chemical storages (mostly installed in the South and Central Region)
• Activation of 1 GW of Demand Side Response capacity [33]
Terna highlights that the new gas-powered generation capacity will mostly be used for load peak management and less and less as a baseload. Thus, long-term price signals, released through the newly defined Italian Capacity Market, would be crucial for the operators to be able to plan new plants-related investments [32].
The first two auctions for the Capacity Market took place in November 2019 to gather capacity that should be ready and deployed within 2022 (1.8 GW) and 2023 (4 GW). All the offers made by operator were accepted at the maximum price; this situation highlights the problems faced by the Italian power system in terms of adequacy, both now and – expectably more – with coal phase-out [34].
It is also stated in [33] that, in order to reach the coal phase-out objective by 2025, it will be essential to reduce the authorization time needed to allow new grid infrastructure and new generation capacity projects (especially thermal and pumped hydro) to start.
KEY SECTORS AND KEY ACTORS
The power network would benefit from the flexibility and ancillary services that the use of bioenergy could provide to it. In fact, this could work synergistically with the coal phase-out strategy, as one of the many actions needed to help maintaining power system adequacy while reducing its fossil footprint. Moreover, this could activate positive mechanisms that would finally deliver an increased, while still sustainable, solid biomass uptake from forests, which are actually underutilized [56].
The biogas sector could also be one that would benefit the most from the implementation of bioenergy flexibility measures: since this sector is expected to shift more and more toward biomethane production, this could finally lead to a generalized situation where electricity generation could be no more profitable, especially when subsidized period would end. Within this framework, there is the opportunity to bring these power generation units – which CAPEX costs would most probably already be amortized – to trade for ancillary services in the power network. To materialize this opportunity, there is the need for proper policies to be in place, that could help to define a viable business case for the plant owners.
Policy makers need information about the potential for bioelectricity to deliver adequacy services
68
that could, at least to some extent, substitute the ones that are delivered by coal plants at the time. In 2018 the biomass-powered generators fleet accounted for 4.2 GW, among which the majority is powered by solid biomass (1.7 GW), followed by biogas (1.4 GW) and vegetable oil (1.1 GW).
The 2019 Italian NEPC, together with the consultation document 39/2020/R/GAS prepared by ARERA [48] shown that policy makers are already aware of the potential of chemically storing wind and solar excess electricity into a fuel, using P2X technologies. Anyway, it is important to send out clearly the message that, in order to timely develop such technologies, there is a strong need for clear and stable policy measures, that would allow investors to correctly and securely plan their investments.
GOALS AND EXPECTATIONS
No specific goals for flexible bioenergy are in place; anyway Italian NECP expects that, alongside pumping and electrochemical storage, the various forms of power-to-gas could play a key role and their development should be promoted. Being more specific, hydrogen synthesis from excess renewable electricity is expected to be particularly interesting when used for storage or injected into the gas network, subject where appropriate to methanation [25].
The Italian NECP underpins the vital importance of gas system for the national energy system, potentially becoming the centrepiece of a ‘hybrid’ electric-gas energy system; it also takes into account the development of renewable gas (biomethane, hydrogen and synthetic methane) to boost the use of alternative fuels in the transport sector and to support the robust development of non-programmable renewable sources, by ensuring that energy demand is met, especially at peak times [25].
To this aspect, the creation of a vast storage capacity and of storage solutions that envisage the use of alternative forms of energy (hydrogen/synthetic methane), both concentrated on network service and distributed, is seen as vital in order to offset critical issues and to make sufficient flexibilities available [25].
The new capacity market, launched in late 2019, is expected to be the main channel to promote new investments towards new storage systems and generation capacity [25].
Italian regulation authority ARERA prepared a consultation document which set some guidelines and general criteria to be developed regarding the characteristics of innovative pilot projects involving gas networks. The projects should last 3 year max and can be related to several topics, among which Power to Gas technology use and renewable gas injection into the gas grid, for transport and storage purposes. A grant ranging between 3 M€ and 5 M€ for each pilot awarded is envisaged, covering 40-50% of total project costs [48].
Coming to the H&C sector, the NECP reports a GSE estimate for an incremental economic potential of High Efficiency CHP in the industrial and service sectors of about 14 TWh for heat and 10 TWh for electricity [25]. Within this framework, it then highlights the need for the evaluation of the possible benefits of electricity-thermal coupling that could be produced by fuelling High Efficiency CHP systems using biomethane. The same GSE report, calculated an untapped potential for CHP-based, biomass-powered District Heating of 1.2 TWh in terms of delivered thermal energy [42].
The potential of High Efficiency CHP and district heating systems to enable storage in the form of thermal energy is also planned to be assessed with pilot projects; no specific reference to biomass as one of the RES of choice is present in the document [25].
RESEARCH, DEVELOPMENT AND INNOVATION
Some of the latest projects are:
69
ProGeo: A Horizon 2020 project started in June 2016 and ended in May 2019, with total budget of € 3,493,750, led by PLC SYSTEM SRL. Aim of the project was to develop and operate a 500 kW Power-to-Gas modular unit able to store electricity by converting CO2 into synthetic methane (stated production: 21 Nm3/h CH4) with high flexibility, thanks to fast start-ups and shutdowns. The prototypal plant has been deployed in Pinerolo (TO) within ACEA biogas plant (Organic waste feedstock [44]). The patented product is thought to be offered to owners and managers of small Thermoelectric Generation (< 50 MWth) plants, to gain the possibility to store energy and to reduce CO2 emissions, producing an additional revenue source from synthetic-CH4 generation [45].
+gas: The project, developed by a partnership composed by three R&D labs (ENEA Cross-tec, ENEA L.A. and CRPA Lab) and two industrial partners (Biometano Estense and idro meccanica) has been financed by a Regional Development Fund grant. The project started in September 2016 and ended in August 2018 and aimed to use surplus power from PV and Wind sources to produce H2 by means of an electrolyser and use it as an additional input for an Anaerobic Digestion biogas plant. Hydrodynamic cavitation has been used to dissolve H2 within the aqueous phase, and then biological methanation has been used to produce CH4, thus increasing yields [46].
REMOTE: REMOTE is a H2020 project with the objective to demonstrate the technical and economic feasibility of two fuel cells-based H2 energy storage solutions. The project started in January 2018 and will end in December 2021; it is coordinated by Politecnico di Torino (IT). One of the demo sites is located in Ambornetti, an off-grid high mountain village located at the south west of Turin; scope of the plant is to provide power generation for the community entirely by renewables: 40 kW from photovoltaic, 50 kW from local biomass, using an innovative concept of modular gasification. With biomass available on site all year long, the CHP generator can be considered a constant power generator, and the hydrogen storage has been preliminarily sized to provide one day of energetic autonomy (i.e., 260 kWh equivalent net energy). Because of the dual use of the CHP generator, energy management will also need to balance overall energy needs, making the Power-to-Power system an integral part of a complex system; it will be used to harmonize energy generation with load requirements, to manage the intermittency of photovoltaic production and to integrate unit power provided by the biomass generator in the energy management [47].
Scenarios and Forecasts
Within the questionnaire scenarios and forecasts have been submitted.
BEST PRACTISES
Examples of combined systems and costs in transportation: We are not aware of commercial or demonstration plants using combined systems which are operating at the time.
As reported above, the project +Gas, participated by ENEA, developed a pilot biogas plant coupled with a RES-powered electrolyser, which H2 stream output was used to combine with the CO2 inside the biogas reactor, to raise the yield of CH4 in the biogas via methanation process. The biogas output was then purified to obtain bio-CH4, that has finally successfully been used to power a public service coach for a test drive.
No cost assessment available. The flexible bioenergy systems currently in place having heat provision as one of the main purposes are mostly CHP systems. In 2018 9.89 TWh of thermal energy have been provided by bioenergy-powered CHP plants, divided between the various sources as described in Table 6
In 2016, 0.95 TWh of the total 9.68 TWh of thermal energy provided by bioenergy-powered CHP plants have been used for District Heating, corresponding to a total of 225 MW of installed thermal power, around 3% of total installed thermal power for Italian District Heating [41] [42].
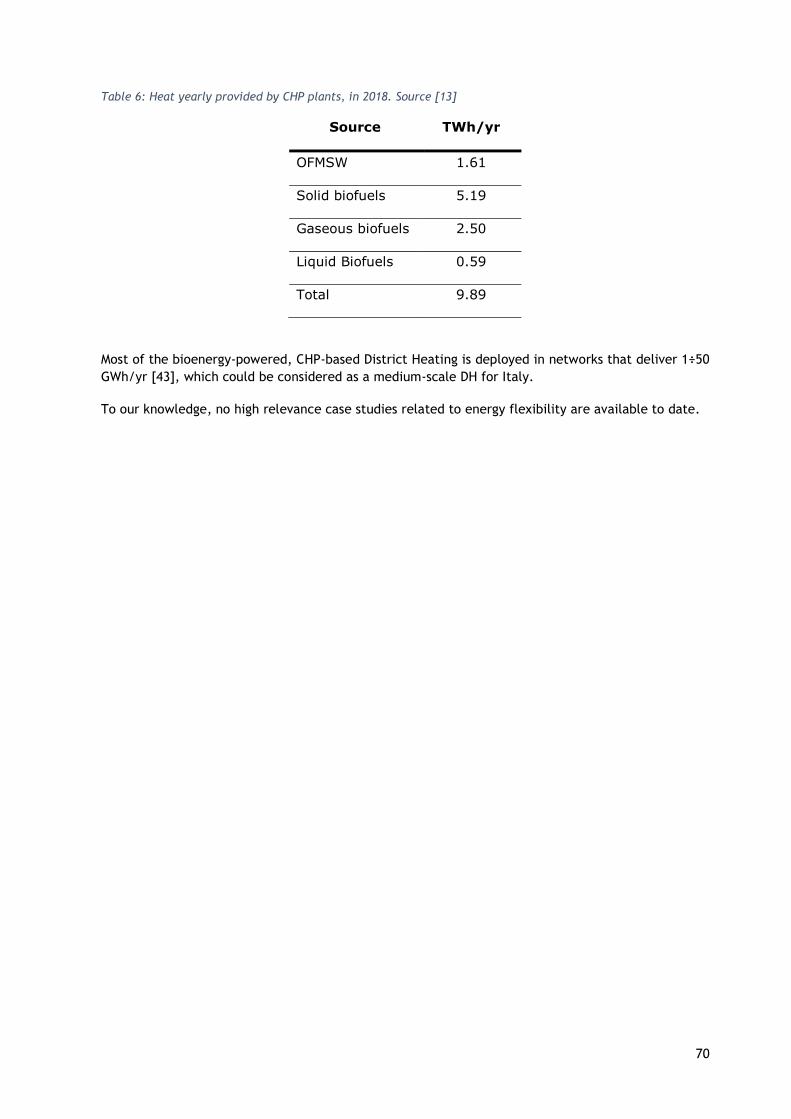
70
Table 6: Heat yearly provided by CHP plants, in 2018. Source [13]
Source TWh/yr
OFMSW 1.61
Solid biofuels 5.19
Gaseous biofuels 2.50
Liquid Biofuels 0.59
Total 9.89
Most of the bioenergy-powered, CHP-based District Heating is deployed in networks that deliver 1÷50 GWh/yr [43], which could be considered as a medium-scale DH for Italy.
To our knowledge, no high relevance case studies related to energy flexibility are available to date.
71
Netherlands
Sources:
1.CBS (2019a): Regionale kerncijfers Nederland. Statistics Netherlands – CBS, 20 December 2019. https://opendata.cbs.nl/statline/#/CBS/nl/dataset/70072ned/table?ts=1583836543123
2. CBS (2019b): Opbouw binnenlands product (bbp); nationale rekeningen. Statistics Netherlands – CBS, 24 June 2019. https://opendata.cbs.nl/statline/#/CBS/nl/dataset/84087NED/table?ts=1583837144976
3. Eurostat (2020): Euro/ECU exchange rates - annual data. 24 February 2020. https://appsso.eurostat.ec.europa.eu/nui/show.do?dataset=ert_bil_eur_a&lang=en
4. CBS (2019c): Energiebalans; aanbod, omzetting en verbruik. Statistics Netherlands – CBS, 13 December 2019. https://opendata.cbs.nl/statline/#/CBS/nl/dataset/83140NED/table?ts=1583842498833
5. CBS (2019d): Regionale kerncijfers Nederland. Statistics Netherlands – CBS, 20 December 2019. https://opendata.cbs.nl/statline/#/CBS/nl/dataset/70072ned/table?ts=1583843133594
6. CBS (2018a): Bodemgebruik; uitgebreide gebruiksvorm, per gemeente. Statistics Netherlands – CBS, 7 September 2018. https://opendata.cbs.nl/statline/#/CBS/nl/dataset/70262ned/table?ts=1583843742789
7. Oldenburger, J. (2019): Stand van zaken bos in Nederland. Probos,Wageningen, November 2019. http://probos.nl/images/pdf/rapporten/Rap2019_Factsheet_Stand_van_zaken_bos_in_Nederland.pdf
8. Probos (2020): Kerngegevens bos en hout in Nederland; boscertificering. Website data on certificated forests in the Netherlands, last viewed 10 March 2020. http://www.bosenhoutcijfers.nl/nederlands-bos/boscertificering/
9. CBS (2020a): Landbouw; gewassen, dieren en grondgebruik naar regio. Statistics Netherlands – CBS, 3 March 2020. https://opendata.cbs.nl/statline/#/CBS/nl/dataset/80780ned/table?ts=1583851401942
10. CBS (2019e): Hernieuwbare energie in Nederland 2018. Statistics Netherlands – CBS, Den Haag, 2019.
11. CBS (2019e): Biomassa; verbruik en energieproductie uit biomassa per techniek. Statistics Netherlands – CBS, 19 December 2019. https://opendata.cbs.nl/statline/#/CBS/nl/dataset/82004NED/table?ts=1584185428319
12. CBS (2019f): Energiebalans; aanbod, omzetting en verbruik. Statistics Netherlands – CBS, 13 December 2019. https://opendata.cbs.nl/statline/#/CBS/nl/dataset/83140NED/table?ts=1584199814290
13. NEA (2019): Rapportage Energie voor Vervoer in Nederland 2018; Naleving verplichtingen wet- en regelgeving Energie voor Vervoer. Versie 1.1. Nederlandse Emissieautoriteit (NEa), Den Haag, 18 June 2019. https://www.emissieautoriteit.nl/onderwerpen/rapportages-ev-2018/documenten/publicatie/2019/07/03/rapportage-energie-voor-vervoer-in-nederland-2018
14. CBS (2020b): Vloeibare biotransportbrandstoffen; aanbod, verbruik en bijmenging. Statistics Netherlands – CBS, 29 January 2020. https://opendata.cbs.nl/statline/#/CBS/nl/dataset/71456ned/table?ts=1584201356096
72
15. Kroon, P. (2020): Biomassa gegevens voor energietransitiemodel (ETM) van Quintel (draft), TNO, Petten, 14 January 2020.
16. CBS (2019g): Energiebalans; aanbod en verbruik. Statistics Netherlands – CBS, 13 December 2019. https://opendata.cbs.nl/statline/#/CBS/nl/dataset/83140NED/table?ts=1584367536956
17. PBL (2019): Klimaat- en EnergieVerkenning 2019 (KEV 2019). Adjusted not published detail data. (National Climate and energy outlook 2019; in Dutch) PBL, CBS, TNO, Planbureau voor de Leefomgeving (PBL), Den Haag 2019. https://www.pbl.nl/sites/default/files/downloads/pbl-2019-klimaat-en-energieverkenning-2019-3508.pdf
18. Energieactueel (2016): TenneT blij met batterijsysteem voor inpassen groene stroom. Newsitem on website. Mentions the contracting of a total of 350 MW on and off control power for 2016. http://www.energieactueel.nl/tennet-blij-met-batterijsysteem-voor-inpassen-groene-stroom/
19. TenneT (2020): Ondersteunende diensten. Internet message. https://www.tennet.eu/nl/elektriciteitsmarkt/ondersteunende-diensten/
20. Energy Storage NL (2019): Nationaal Actieplan Energieopslag en Conversie 2019. Werkpaarden voor de energietransitie. Energy Storage NL, Zoetermeer, 2019 https://www.fme.nl/nl/system/files/publicaties/ESNL%20NAPEOC%202019%20web.pdf
21. CBS (2020c): Energiebalans; aanbod en verbruik. Statistics Netherlands – CBS, 10 January 2020. https://opendata.cbs.nl/statline/#/CBS/nl/dataset/83989NED/table?ts=1584983608416
22. CBS (2019h): Energiebalans; aanbod, omzetting en verbruik. Statistics Netherlands – CBS, 13 December 2019. https://opendata.cbs.nl/statline/#/CBS/nl/dataset/83140NED/table?ts=1584998515791
23. CBS (2020d): Aardolieproductenbalans; aanbod, verbruik en voorraad. Statistics Netherlands – CBS, 4 March 2020. https://opendata.cbs.nl/statline/#/CBS/nl/dataset/83403NED/table?ts=1584999393649
24. Ouden, B. den, et. al. (2020): Klimaatneutrale energiescenario’s 2050; Scenariostudie ten behoeve van de integrale infrastructuurverkenning 2030-3020, Berenschot and Kalavasta, Berenschot Groep B.V., Utrecht, March 2020. https://zoek.officielebekendmakingen.nl/blg-930033
25. NEA (2019): Rapportage Energie voor Vervoer in Nederland 2018. Naleving verplichtingen wet- en regelgeving Energie voor Vervoer. Nederlandse Emissieautoriteit (NEa), Den Haag, 18 June 2019.
26. EZK (2020): Wet van 11 December 2019, houdende Regels voor het produceren van elektriciteit met behulp van kolen (Wet verbod op kolen bij elektriciteitsproductie), Staatsblad, 19 December 2019. https://wetten.overheid.nl/BWBR0042905/2019-12-20
27. EZK (2020): Voortgang SDE++ en eerste openstelling SDE++ 2020. Brief aan de voorzitter van de Tweede Kamer, DGKE-E / 20023501, Ministerie van Economische Zaken en Klimaat, 17 February 2020.
28. Gasunie and Tennet (2019): Infrastructure Outlook 2050. A joint study by Gasunie and TenneT on an integrated energy infrastructure in the Netherlands and Germany, N.V. Nederlandse Gasunie, Groningen, February 2019.
29. Entsoe (2018): Continuing frequency deviation in the Continental European Power System originating in Serbia/Kosovo: Political solution urgently needed in addition to technical. Press release, 6 March, 2018 https://preview.entsoe.eu/news/2018/03/06/press-release-continuing-frequency-deviation-in-the-continental-european-power-system-originating-in-serbia-kosovo-political-solution-urgently-needed-in-addition-to-technical/

73
30. Corre Energy (2019): Website with information on a compressed air Electricity storage of 300 MW (3-4 GWh) in the Netherlands named CAES Zuidwending. Last viewed 6 June 2020. https://correenergystorage.nl/caes-het-project/?lang=nl
31. Energie Actueel (2016): TenneT blij met batterijsysteem voor inpassen groene stroom. Internet news item, 16 February 2016. http://www.energieactueel.nl/tennet-blij-met-batterijsysteem-voor-inpassen-groene-stroom/
32. NPOT (2020): 10 Innovatieve waterstofprojecten in Nederland. NPT procestechnologie, internet news item, 7 June 2020. https://nptprocestechnologie.pmg.be/nl/dossier/MPTbe2003S09_00
33. Geijp, J. (2019): Stop op nieuwe wind- en zonneparken in grote delen van Groningen en Drenthe. Dagblad van het Noorden.,3 October 2019. https://www.dvhn.nl/economie/Voorlopig-geen-nieuwe-wind-en-zonneparken-in-grote-delen-van-Groningen-en-Drenthe-24882927.html
34. EPEX (2019): Traded volumes soar to an all-time high in 2018. 10 January 2019. https://www.epexspot.com/en/news/traded-volumes-soar-all-time-high-2018
35. Gorre, J., F. Ortloff, C. van Leeuwen (2019): Production costs for synthetic methane in 2030 and 2050 of an optimized Power-to-Gas plant with intermediate hydrogen storage. Applied Energy, Volume 253, 1 November 2019. https://www.sciencedirect.com/science/article/pii/S0306261919312681
36. Scheepers, M.J.J., et. al. (2020a): Towards a sustainable energy system for the Netherlands in 2050. TNO 2020 P10338, TNO, Amsterdam, May 2020 http://publications.tno.nl/publication/34636734/bgfjKg/TNO-2020-P10338.pdf
37. Scheepers, M.J.J., A. Faaij, R. van den Brink, et. al. (2020b): Scenario's voor klimaatneutraal energiesysteem: slimme combinaties van energie-opties leiden tot duurzame en betaalbare energiehuishoudens. TNO, Amsterdam, White Paper, May 2020. http://publications.tno.nl/publication/34636594/KRZna2/TNO-2020-scenario.pdf
38. Sijm, J., et. Al. (2017a): The demand for flexibility of the power system in the Netherlands, 2015-2050, Report of phase 1 of the FLEXNET project. ECN-E-17-037 ECN, Amsterdam, November 2017. https://publications.ecn.nl/ECN-E--17-037
39. Sijm, J., et. Al. (2017b): The supply of flexibility for the power system in the Netherlands, 2015-2050, Report of phase 2 of the FLEXNET project. ECN-E-17-044, ECN, Amsterdam, November 2017. https://publications.ecn.nl/ECN-E--17-044
40. Sijm, J., A. van der Welle (2017c): Maatschappelijk afwegingskader voor de inzet van flexibiliteitsopties in elektriciteitsnetten. Rapport van fase 3 van het FLEXNET project. ECN-E--17-052, ECN, Amsterdam, November 2017. https://publicaties.ecn.nl/ECN-E--17-052
41. Sijm, J., et. Al. (2017d): Demand and supply of flexibility in the power system of the Netherlands, 2015-2050. Summary report of the FLEXNET project. ECN, Amsterdam, November 2017 https://publications.ecn.nl/ECN-E--17-053
42. Braungardt S., V. Bürger, J. Zieger T. Kenkmann (2018): Contribution of Renewable Cooling to the Renewable Energy Target of the EU. On behalf of Netherlands Enterprise Agency (RVO.nl). Oeko-Institut e.V., Freiburg, July, 2018. https://www.rvo.nl/sites/default/files/2018/07/Contribution%20of%20Renewable%20Cooling%20to%20the%20Renewable%20Energy%20Target%20of%20the%20EU.pdf
43. Greenchoice (2017): Greenchoice maakt stroomnet stabile met biogas. zet biogas in voor stabilisering elektriciteitsnet. Press-release, 3 May 2017
74
https://www.greenchoice.nl/nieuws/artikelen/greenchoice-maakt-stroomnet-stabiel-met-biogas/
44. Pno Consultants (2018): ONderzoek ombouw Engie-kolencentrale naar biomassa. Newsitem PNO Consultants site, 1 October 2018. https://www.pnoconsultants.com/nl/nieuws/engie-kolencentrale-biomassa/
45. Gasunie (2019): GTS en RNB’s faciliteren groen gas. Website Gasunie transport services, Groningen, 2 January 2019 https://www.gasunietransportservices.nl/aangeslotenen/systeembeheerders/groen-gas-invoeder-worden
46. Vertogas (2020): Nieuwsbrief januari 2020. Vertogas, Groningen, 27 January 2020. https://www.vertogas.nl/hoofdmenu/nieuws/nieuwsbrief-januari-2020
GENERAL COUNTRY INFORMATION
Population ( Millions) 17.28
Surface (km²) 41543
GDP ($/capita) 103618
Final energy consumption (PJ/a) 2405
Information on electricity prices and the price spread can be retrieved from the following data:
Price volatility:
2018 mean value based on the monthly based values: Day-Ahead NL base € 39,31 /MWh / Peak € 46,19 /MWh Intraday NL base € 40.58 / MWh / Peak € 40.00 /MWh
MONTHLY NL BASE: Arithmetic mean of the market clearing prices for the delivery periods (starting) between 0h00 CET (including) and 24h00 CET (excluding) for all days of the month for the EPEX SPOT NL day-ahead market.
MONTHLY NL PEAK: Arithmetic mean of the market clearing prices for the delivery periods (starting) between 8h00 CET (including) and 20h00 CET (excluding) for all weekdays (Monday to Friday) for the EPEX SPOT NL day-ahead market. https://www.epexspot.com/en/basicspowermarket https://www.tennet.eu/company/publications/technical-publications/

75
Figure 23 Netherlands: power, heating and cooling and transport energy demand supplied by...
In the Netherlands the share of biomass in power sector is 2%, in heating and cooling 3.1% and in transport 10.8%.
0%
20%
40%
60%
80%
100%
Netherlands
Power demand supplied by... (Status 2018)
Non-renewable andmunicipal waste CHPNatural Gas CHP
Oil CHP
Coal CHP
Water
Other Renewables
Geothermal
Biomass CHP
Biomass
Solar
Wind
0%
20%
40%
60%
80%
100%
Netherlands
Heating and cooling demand provided by....
Status 2018
Other
Power to heat
Biomass CHP
Gaseous Biofuels
Solid Biofuels
Solar
Geothermal
Non-renewable an municipalwasteNon-renwable and municipalwaste CHPFossil CHP
0%
20%
40%
60%
80%
100%
Netherlands
Transport fuels demand provided
by....Status 2018
Direct power use
Power based fuels (PtX)
Imported Biomass for fuelsproduction
Imported Biofuels
Fossil fuels
Domestic Biofuels
76
STATUS QUO AND COUNTRY CLASSIFICATION
The Netherlands are according to experts in phase 3, where the need for additional investments in flexibility is crucial. (see SDE++)
The first way to stabilize the Dutch electricity network is, that it is connected directly with the electric network of 24 other EU countries: from Denmark, to Poland, Romania, Bulgaria and Spain (and since 2015 Turkey) but without for instance Sweden and the UK). Countries like Albania and via Gibraltar (Morocco, Algeria and Tunisia) have also the same (AC) frequency. Other European countries are also connected (by DC), but not at the same frequency. If there is a shortage of electricity production the frequency of the electricity will go down from 50 Hz to a lower value. For properly function of the net, the range should stay between 47.6-52.4. In Europe the ENTSO-E coordinates the international cooperation of European Transmission System Operators (TSOs). The Dutch TSO is TenneT. Next to the current situation ENTSO-E collects Network Development plants and also electricity storage plants.
The Netherlands itself is connected on 4 places to Germany, on 2 places to Belgium and with 3 DC (direct current) sea cable to the UK (BridNet), Norway (NorNEd) and Denmark (COBRA-cable).
Of course also national stabilizations is necessary. If not produced in the Netherlands itself, it can be imported (or exported) on day ahead contracts. The Netherlands has Emergency Power contracts for the supply of additional power or for reducing power consumption. And there were already situations with a lot of wind energy where the electricity prices went below zero. Not only by the amount of wind energy (high winds) but also because gas power plants were running to be able to deliver additional power (if the storm increased and wind power had to shut down).
A surplus of electricity can be stored in hydropower in for instance Norway. The Netherlands itself has very limited storage capacity. For instance, a 10 MWel battery storage in Vlissingen [31] and plans for a 300 MWel Compressed air electricity storage (CAES) in Zuidwending [30]. There are also a number of hydrogen initiatives like a 20 MW electrolyser in Delfzijl, a 1 MW hydrogen electricity storage in Zuidwending (power to gas), a 1 MW electrolyser on wind energy at an offshore platform, a 2 MW electrolyser integrated with a 4.8 MW wind turbine, and several project related to the transport [32].
There are some problems with the electricity network in the Netherlands. In the North East part of the country (South Groningen and East and South Drenthe) it is not possible to connect all the planned new areas with solar panels or wind turbines to the network via high voltage substations. They have to wait 5 to 10 years [33]. In other parts of Drenthe and parts of Overijssel there is limited capacity.
There are some investments foreseen in this region. Also, the capacity around Amsterdam is extended (electricity demand for data centres) on around 3.5 GW transport capacity for wind power in the North Sea (including offshore transformer stations), to be completed in 2023.
A study of Gasunie and TenneT (electricity transport) concluded that, although there is a lot of electricity storage in Europe, only gas storage can deliver enough seasonal storage capacity [28].
FLEXIBLE ENERGIES CAPACITIES
In the electric power system, there is a lot of gas used. Combined with import and export capacity this gives enough flexibility. Biomass is and has been used in coal power plants (it substantially declined in 2017 and 2018, but it rises again due to new subsidy scheme). So currently biomass for flexibility in this sector is no issue.
In the Netherlands wood has been used as a heating fuel for decades: wood residues at production locations and as cheap fuel for households with the possibility to collect it yourself. Biogas and
77
biomass boilers (at other locations) mainly resulted from sustainable energy subsidy schemes (for instance the Dutch: SDE, SDE+, ISDE).
In case of biomass use for thermal energy production. Biomass is the base load plant and a gas boiler gives the flexibility. If biomass is the only energy source varying the power input and output is used (part load if less energy is used). In greenhouses there is also a hot water storage used.
Only in a very limited number of private houses, biomass is used as a flexible fuel. This is the case for some “all electric” houses with solar panels (PV) and a heat pump for house heating and hot water and no connection to the gas grid. In case of a very cold winter, wood can be used to deliver the additional heat.
The use of biofuels in transport is related to a mandatory percentage of biofuel in the use of gasoline and diesel in road and rail transport. And from 2018 onwards also for non-road mobile equipment, agricultural tractors, forestry machines and pleasure craft. To reach the targets for sustainable energy and CO2 reduction the current percentage is 16.4% in 2020 use. Which is substantially higher than the EU target of 10% [25]. There is no direct relation between the targets and flexibility.
However, some flexible bioenergy capacities are installed and scenarios for 2030 and 2050 are indicated below:
Flexible bioenergy systems in the power sector: 2018: 400 MW installed Co-firing in coal power plants, biomass CHP, manure digestion and other biogas (10) 2030: 130 MW All the coal power plants must be closed in 2030. In the scenario it is not (yet) assumed that they will go on as a 100% flexible biomass electricity (and heat) plant (17) 2050: CHP not interesting due to high wind and solar share. Small biogas streams might be neglected.
Related electricity provision: 2018: 2.370.000 MWh (10) 2030: 490.000 MWh (17) 2050: - (36)
Flexible bioenergy systems in the heat sector: 2018: 5.600 MW (10) 2030: 7500 MW Including ~20% heat from CHP and ~20% heat from boilers and stoves in households (households ~50% of MW installed) (17) 2050: 14.500 MW (36)
Related heat provision: 2018: 980.000 MWh, Households ~77% of MW installed (10) 2030: 20.000.000 MWh (30) 2050: 72.000.000 MWh (36)
Flexible bioenergy in the biofuels sector: 2018: 13 MW (10) 2030: 80 MW Only biogas injected in the gas grid is considered. Capacity calculated from production and 6000 full load hours/year. (30) 2050: 100 MW (36)
Related biofuel production: 2018: 80.000 MWh (10) 2030: 500.000 MWh (30) 2050: 630.000 MWh (36)
78
Concerning renewable gas and sector coupling the main strategy is to get the renewable gas into the gas grid. So it can be used maximum useful. In small farms the gas is put in a gas engine, the electricity is sold and most heat is thrown away. The injected green gas can get an SDE subsidy or take part in the mandatory percentage of biomass in transport fuels
LEGAL FRAMEWORK
One core element of the Dutch legal framework is Stimulation of Sustainable Energy Transition (SDE subsidy).
At 29 September 2020 a new subsidy scheme (SDE++; Subsidy Scheme sustainable energy ++) will follow up the SDE+. In several rounds projects can apply to a production subsidy for 12 or 15 years. SDE++ contains, compared to SDE+, also energy saving options. There is one option to increase flexibility. A subsidy for an electric boilers: “The SDE++ focuses on the use of electric boilers in making optimal use of peaks of sustainable electricity production (flexible capacity). This is based on 2000 full load hours in accordance with the advice of the PBL” [27]. The subsidy pays the difference between the value of the heat (related to the gas price) and the cost of the installation and the electricity (the mean value of the 2000 hours with the lowest electricity price in a model calculation until 2030). In the SDE++ methodology the actual subsidy can be corrected (between limits) for real world electricity and gas prices.
The SDE++ contains also a new subsidy for hydrogen production from electricity, also for a maximum of 2000 full load hours per year [27].
So both subsidy measures focus on additional electricity consumption during periods of low electricity prices (much solar and/or wind power). Because the SDE++ subsidy finances the unprofitable top, the subsidy requirements for sustainable electricity production decrease if the electricity prices are higher. So removing a part of the cheap electricity with SDE++ might also lower the needed amount of SDE++ subsidy for other projects.
The SDE++ subsidy support the amount of sustainable energy, reduces the CO2 emissions and makes the Netherlands more sustainable. It helps to reach the Dutch targets for sustainable energy and CO2 emissions.
Policy instruments
There is no such specific policy measure. The Dutch electricity market is liberalized, the same situation as in Germany and other EU member states. The historical situation was that after a lot of mergers, only 4 large electricity companies remained each with his own region. The production was coordinated by the SEP. After liberalization the companies had to split up between electricity production and distribution. Electricity production is now in the hands of a number of large European production companies, and a number of smaller ones. The electricity distribution is done by 4 large electricity network operators and 3 smaller ones. The high voltage network is owned by the Dutch-German Transmission System Operator (TSO) TenneT. The responsibility, that the production matches the demand, lies with TenneT, which has (daily) contracts with the production companies.
The network operators conducted an extensive study of the effects of electric vehicles, heat pumps and solar-PV to the distribution network in 2017 [38, 39, 40, 41]. This extensive study has several conclusions:
On national level there is an increasing need for flexibility due to increasing variability of residual power load (what wind and sun cannot deliver), in particular beyond 2030. There is also an increasing need for flexible peak load capacity, and there will be an increasing number of hours with a VRE (variable renewable energy) surplus [41].

79
Concerning the regional grid level. The expected percentage of overloaded assets as a result of the adoption of EV, HP and PV seems limited until 2030. About 7-8% of the distribution transformers will be overloaded and 2-3% of the LV cables. Beyond 2030, the incidence of grid overloads is more significant, but most likely not alarming with the right investment strategy; ~ 40% of the distribution transformers will be overloaded. To prevent this, additional yearly investment are needed of 2-5% until 2030 and 7% until 2050, compared to the normal amount. It might be smart to look at the trade-off between grid reinforcement and deployment of flexibility [41].
On a national level cross-border trade becomes the dominant flexibility option in future years, but its size depends on available interconnection capacity as well as on the available potential and costs of alternative, domestic flexibility options. Non-VRE power generation becomes less important to meet future flexibility needs but gas-fired units may remain important as back-up capacity (given the 85% GHG reduction target in 2050 in this study). Curtailment of VRE power generation becomes a major flexibility option, only far beyond 2030 depending to the availability of alternative options (in particular power trade and demand response). Demand response has a large potential to meet future flexibility needs, but the role of demand curtailment is negligible [41].
Energy storage plays generally a limited role in meeting future flexibility needs of the power system (due to its relatively high costs) but in specific cases it may be more significant. The main reason is that the costs of these storage functions are generally high compared to alternative options such as power trade, demand response, VRE curtailment or – at the regional network level – grid reinforcement. Storage might be interesting when it provides short-cycle storage functions to meet flexibility/balancing needs due to the uncertainty (‘forecast error’) of the residual load on the intraday and balancing markets [41].
If storage has also other functions, it might be interesting. Examples may include storage options such as power-to-gas (aimed primarily at reducing CO2 emissions) or using EV batteries for storage functions (although the potential of these options to provide flexibility to the power system is likely higher through demand response than by energy storage) [41].
The study does not mentions flexible biomass options, although they might be part in the daily trading market. But this is in the high voltage network of TenneT market and not in the field of the network operators, so not in the scope of the study [41].
Opportunities
Currently biomass (as energy carrier) is used as a heating fuel and in CHP installations. A number of coal power stations use biomass for co-firing. One of the coal power plants delivers also heat to district heating and will switch from 80% biomass co-firing to 100% biomass. On the long term biofuel is seen as a source for materials, biofuels and heat.
The main long-term situation is that the Netherlands will put a lot of offshore wind energy on the North Sea and there will also be a lot of solar PV. The Figure 24 below shows the total demand (orange), and what will be the residual demand after wind and sun electricity are corrected (blue) [38], [41]. Only 9% will come from other sources (gas, biomass, coal with CCS). This scenario leads to a greenhouse gas emission reduction in 2050 of 85%. For more reduction additional wind and sun will be implemented for hydrogen production and synthetic transport fuels (see [36], [37] with 95% reduction). In the 95 case, with more focus on the Paris agreement, residual load will even be lower. Due to the low number of full load hours, gas fired power stations will be more attractive than solid fired power stations, because gas power plants have much lower investment costs.
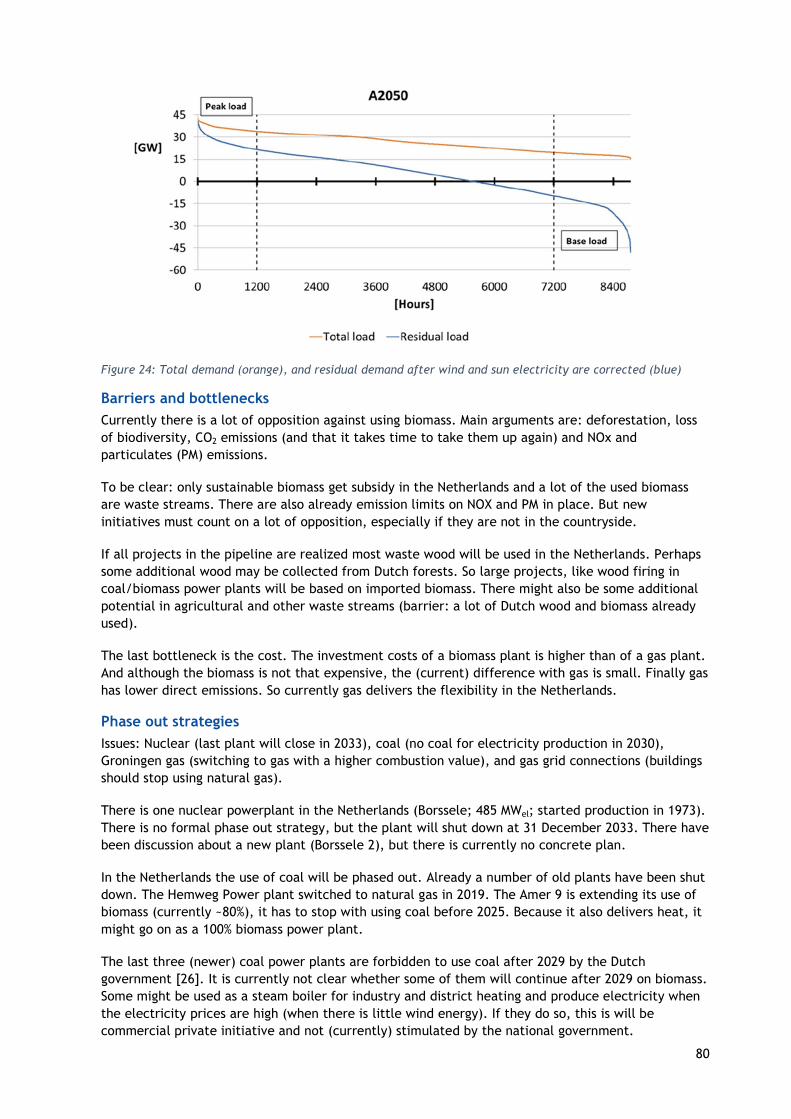
80
Figure 24: Total demand (orange), and residual demand after wind and sun electricity are corrected (blue)
Barriers and bottlenecks
Currently there is a lot of opposition against using biomass. Main arguments are: deforestation, loss of biodiversity, CO2 emissions (and that it takes time to take them up again) and NOx and particulates (PM) emissions.
To be clear: only sustainable biomass get subsidy in the Netherlands and a lot of the used biomass are waste streams. There are also already emission limits on NOX and PM in place. But new initiatives must count on a lot of opposition, especially if they are not in the countryside.
If all projects in the pipeline are realized most waste wood will be used in the Netherlands. Perhaps some additional wood may be collected from Dutch forests. So large projects, like wood firing in coal/biomass power plants will be based on imported biomass. There might also be some additional potential in agricultural and other waste streams (barrier: a lot of Dutch wood and biomass already used).
The last bottleneck is the cost. The investment costs of a biomass plant is higher than of a gas plant. And although the biomass is not that expensive, the (current) difference with gas is small. Finally gas has lower direct emissions. So currently gas delivers the flexibility in the Netherlands.
Phase out strategies
Issues: Nuclear (last plant will close in 2033), coal (no coal for electricity production in 2030), Groningen gas (switching to gas with a higher combustion value), and gas grid connections (buildings should stop using natural gas).
There is one nuclear powerplant in the Netherlands (Borssele; 485 MWel; started production in 1973). There is no formal phase out strategy, but the plant will shut down at 31 December 2033. There have been discussion about a new plant (Borssele 2), but there is currently no concrete plan.
In the Netherlands the use of coal will be phased out. Already a number of old plants have been shut down. The Hemweg Power plant switched to natural gas in 2019. The Amer 9 is extending its use of biomass (currently ~80%), it has to stop with using coal before 2025. Because it also delivers heat, it might go on as a 100% biomass power plant.
The last three (newer) coal power plants are forbidden to use coal after 2029 by the Dutch government [26]. It is currently not clear whether some of them will continue after 2029 on biomass. Some might be used as a steam boiler for industry and district heating and produce electricity when the electricity prices are high (when there is little wind energy). If they do so, this is will be commercial private initiative and not (currently) stimulated by the national government.
81
In the Netherlands the largest gas field is Groningen (Slochteren). This has a lower energy content than other natural gas fields. Because it is so large most of the gas users in the Netherlands use Groningen gas quality gas. Gas from other fields and imported gas is mixed with nitrogen to reach Groningen quality. There is a second gas network in the Netherlands for high calorific natural gas for large industry and power plants
Because there is a large problem with natural gas extraction related earthquakes and damage to buildings and houses in Groningen, the government decided some years ago to lower the extracted amount. Smaller industries and greenhouses are currently switching from Groningen quality to high calorific natural gas. Due to the damage and the public opinion in 2019 it was decided to stop with gas extraction in Groningen 8 years earlier, already in 2022.
Due to climate change and the lowering (and stopping) of the Groningen gas field the government decided that buildings should no longer use natural gas in future. New houses should not get a gas connection from 1 July 2018 on. Although exceptions are still made.
Almost all 7 Million houses in the Netherlands have a gas grid connection. The government wants that in 2021 yearly 50 000 buildings get disconnected from the natural gas grid. In 2030 this should be 200 000 per year. Solutions are additional heat insulation and electric cooking in combination with electric heat pumps or district heating from wood boilers, waste incineration plants, industrial waste heat, geothermal heat, etc.. In some cases the owners can choose for a wood boiler or stove.
KEY SECTORS AND KEY ACTORS
Flexible bioenergy power plants (or CHP) can stabilize the electricity price and therefore lead to lower prices for all electricity user, for instance households but also industry. In the long term the number of full load hours will be too low to invest in this type of electricity production, with the current state of know how.
Flexible biomass heat is essential in district heating. If the network contains only thermal solar heat or heat pumps is cannot deliver the necessary heat in winter time. This is of special interest for space heating situations like households, and sectors like trade, services and government. It might also be interesting for the agricultural sector.
Co-production of energy (methane or heat) and biofuel (or bio feedstock) is interesting. Flexible switching from 100% energy to 100% biofuel production is less interesting because the full investment of both routes is necessary and the price difference of the additional production might not be enough to pay for the double investment. So the fuel production sector might not be interesting. In case the flexible discussion is about switching in one plant between different agricultural feedstocks and waste streams, flexibility might be very interesting because some streams might only be available a part of the year.
Because municipal authorities have to make a plan for their city or village to switch from natural gas to a more sustainable energy (heat) source, they are very interested in flexible bioenergy systems. But there is currently a lot of discussion about using biomass for energy in the Netherlands, so they also need good arguments on sustainability and greenhouse gas effect.
GOALS AND EXPECTATIONS
There are (and have been targets) for the amount of sustainable energy in the Netherlands. The current target is 14% of the final energy use in 2020 (and 27% in 2030). Due to the fact that the EU sets targets on finale energy use and not on primary energy use (primary was used the first Dutch targets) it became more interesting to use the same amount of biomass in house heating (replacing natural gas) than using it in a coal power plant (replacing coal). House heating is direct finale energy. For producing electricity, you have first to multiply with the efficiency of the power plant. So the policy focus changed from replacing as much as possible fossil fuels to replacing fossil fuel use
82
for final energy. Last year it was expected that the Netherlands would reach 11.4% in 2020. Due to the Corona crisis the percentage might end up higher.
Currently, there is no governmental policy related to flexibility and bioenergy use.
In relation to the flexible biomass issue the only thing that can be mentioned, is the start with an SDE subsidy for the adding of green gas to the natural gas network some years ago. Before that you could get subsidy for electricity produced with green gas (CHP with a gas engine), but a lot of the waste heat was not used. By improving it to natural gas and adding it to the natural gas network more fossil fuel is substituted
RESEARCH, DEVELOPMENT AND INNOVATION
At TNO in Petten research is done on the gasification of biomass and waste streams. This results in gas with a number of hydrocarbons, CO2, CO, H2 and CH4. Research is done on the separation of these hydrocarbons (BTX or/and ethylene), and on converting the hydrocarbons into additional syngas (for making liquid products/fuels). The remaining methane can be injected in the gas grid.
Research is also done in the Netherlands on seaweed. Next to research on growing, harvesting and storage, the focus is on the extraction of valuable compounds. The remaining biomass can be used for digestion and biogas production.
Power to Gas in the Netherlands focuses currently mainly on hydrogen, there was one small experimental power to methane demonstration plant of DNV GL in Rozenburg in 2015. So no combinations with biomass.
In a number of cases biomass heat installations are combined with a heat storage. The reason is to keep the plant running at minimum power, when there is low demand, or to have additional heat for peak demand. When there is more peak demand a natural gas boiler is often used. In future a district heating system might be further extended with geothermal heat, solar water heaters and heat pumps. There are already studies/ideas for those combinations. Out of the around 20 geothermal project in the Netherlands, there is no information of also biomass is used for the local heat demand.
In case of a high electricity price heat storage is used to run the CHP installation and the heat is used on a later moment. Because this is already common practice for gas engines CHP in greenhouses, this is not a special research object.
Scenarios and Forecasts
Some data on scenarios and forecasts are available.
BEST PRACTISES
Examples of combined systems and costs in transportation are currently not ongoing.
The Netherlands participated in the Power to Gas project (Store&Go; https://www.storeandgo.info/) in which in Italy a demo installation was built for converting electricity from wind energy with CO2 captured from air into liquid LNG.
In the Netherlands there are a number of projects in which biogas from digestion is upgraded to natural gas quality, which is injected in the Dutch gas grid. The green gas producer gets green gas certificates (groencertificaten; GvO’s). If the producer does not get an SDE+ subsidy for green gas, he can also claim bio tickets (biotickets). At other locations vehicles run on CNG from the gas grid. It is possible to connect the bio tickets to this use of CNG. In that way the bio tickets count for the
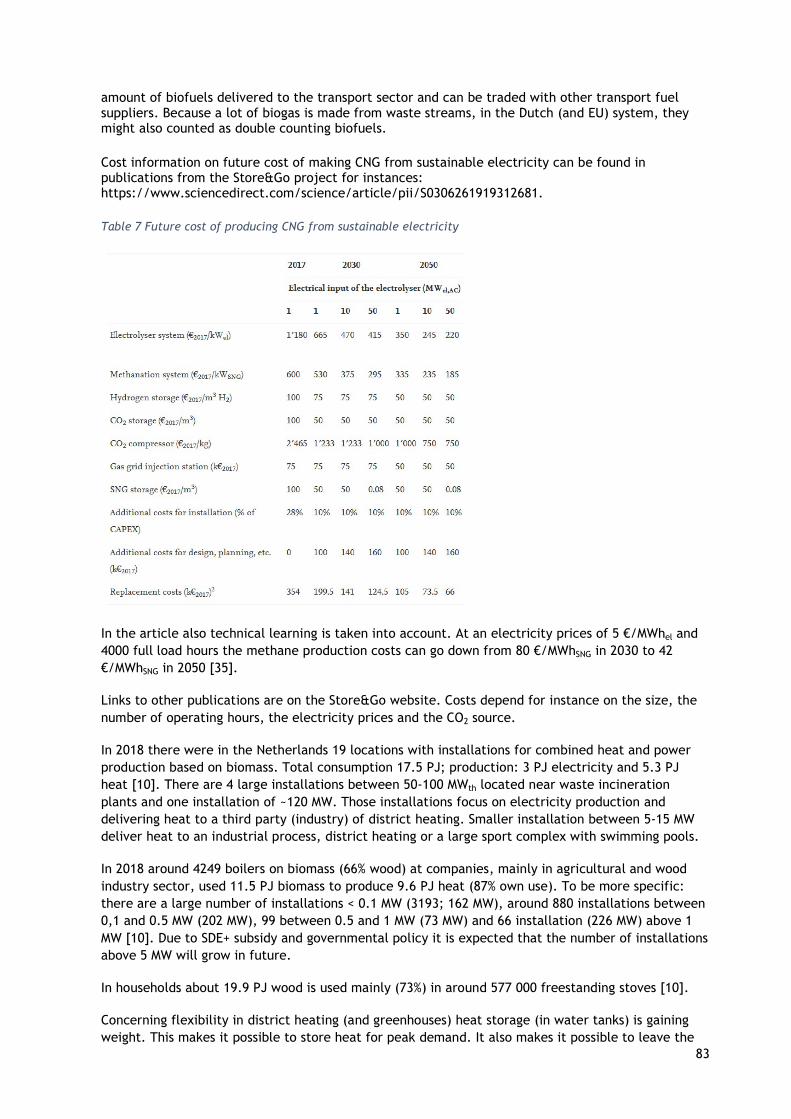
83
amount of biofuels delivered to the transport sector and can be traded with other transport fuel suppliers. Because a lot of biogas is made from waste streams, in the Dutch (and EU) system, they might also counted as double counting biofuels.
Cost information on future cost of making CNG from sustainable electricity can be found in publications from the Store&Go project for instances: https://www.sciencedirect.com/science/article/pii/S0306261919312681.
Table 7 Future cost of producing CNG from sustainable electricity
In the article also technical learning is taken into account. At an electricity prices of 5 €/MWhel and 4000 full load hours the methane production costs can go down from 80 €/MWhSNG in 2030 to 42 €/MWhSNG in 2050 [35].
Links to other publications are on the Store&Go website. Costs depend for instance on the size, the number of operating hours, the electricity prices and the CO2 source.
In 2018 there were in the Netherlands 19 locations with installations for combined heat and power production based on biomass. Total consumption 17.5 PJ; production: 3 PJ electricity and 5.3 PJ heat [10]. There are 4 large installations between 50-100 MWth located near waste incineration plants and one installation of ~120 MW. Those installations focus on electricity production and delivering heat to a third party (industry) of district heating. Smaller installation between 5-15 MW deliver heat to an industrial process, district heating or a large sport complex with swimming pools.
In 2018 around 4249 boilers on biomass (66% wood) at companies, mainly in agricultural and wood industry sector, used 11.5 PJ biomass to produce 9.6 PJ heat (87% own use). To be more specific: there are a large number of installations < 0.1 MW (3193; 162 MW), around 880 installations between 0,1 and 0.5 MW (202 MW), 99 between 0.5 and 1 MW (73 MW) and 66 installation (226 MW) above 1 MW [10]. Due to SDE+ subsidy and governmental policy it is expected that the number of installations above 5 MW will grow in future.
In households about 19.9 PJ wood is used mainly (73%) in around 577 000 freestanding stoves [10].
Concerning flexibility in district heating (and greenhouses) heat storage (in water tanks) is gaining weight. This makes it possible to store heat for peak demand. It also makes it possible to leave the
84
boiler burning at the lowest load when heat demand is low. Combinations of a biomass boiler with a large number of full load hours and a gas boiler with a lower number of hours for peak demand, maintenance and malfunctions are also common in the Netherlands.
There are some houses with an electric heat pump and a pellet of wood stove.
Case studies with high relevance to flexible bioenergy
1. In 2017 the Bioflex initiative started with Greenchoice and Peaks. In cooperation with TenneT the target is to stabilize the electricity net with the use of biogas digestion installations. Those installation produce electricity with a gas engine. Farmers get a box connected to their system and it the frequency of the electricity grid is out of balance this automatically increases or lowers the production of the digester installation. Bioflex reduces the number of fossil power plants that need to be on standby for stability [43].
2. In the Netherlands, the production of electricity (only) from coal will be forbidden after 2029. One of the 3 (newest) coal power plants is testing steam exploded biomass pellets as a sustainable energy source. Those pellets are water-repellent, more compact and cheaper to transport and store than fresh biomass. In time the power plants want to switch to 100% biomass and not only produce power (when electricity prices are high) but also deliver heat to the surrounding industry in the Rotterdam/Europoort area [44].
3. A way of using the current flexibility and transport options is to make a green gas with comparable properties as natural gas and inject this in the natural gas network. The network has its own storage capacity (by its gas pipe volume) and there are gas storage location connected to this network. There might be difference in the physical transportation (of the molecules) and use, but with certification the green gas can be stored for longer time and used everywhere in the network. Rules for injection gas in the network are published in the Netherlands [45] and in 2019 (*also due to subsidy) the number of registered producers went up from 42 to 55 and the volume raised from 115 Mio m³ in 2018 to 144 Mio m³ in 2019 [46]. The gas is mainly produced by digestion. In future green gas can also be produced from gasification of solid biomass (or biomass containing waste) and from CO2 and sustainable produced hydrogen (from wind or solar electricity.
85
Sweden
Sources:
1. https://www.skogsindustrierna.se/skogsindustrin/branschstatistik/sveriges-och-varldens-skogar/
2. https://www.scb.se/hitta-statistik/sverige-i-siffror/miljo/marken-i-sverige/
3. https://www.energimyndigheten.se/statistik/den-officiella-statistiken/statistikprodukter/arlig-energistatistik-el-gas-och-fjarrvarme/
4. https://www.skogsstyrelsen.se/globalassets/om-oss/publikationer/2017/rapport-201710-bioenergi-pa-ratt-satt.pdf
5. http://swedishsmartgrid.se/globalassets/publikationer/flexibilitet_i_ny_tid_2.pdf
6. https://www.energimyndigheten.se/globalassets/statistik/bostader/energistatistik-for-smahus-flerbostadshus-och-lokaler-2016.pdf
7. https://www.energimyndigheten.se/nyhetsarkiv/2019/varma-sommaren-2018-okade-anvandningen-av-fjarrkyla/
8. https://www.energiforetagen.se/statistik/fjarrvarmestatistik/tillford-energi/
9.https://www.energiforetagen.se/globalassets/energiforetagen/statistik/fjarrvarme/tillford-energi/fjarrvarmens-branslemix-2018.pdf
10.https://www.scb.se/contentassets/36fb782741284c4590d11d437f515c89/en0105_2018a01_sm_en11sm1901.pdf sid 39
11. http://www.varmemarknad.se/pdf/Varmemarknad_Sverige_sammanfattning.pdf
12. https://www.energiforetagen.se/globalassets/energiforetagen/sa-tycker-vi/fardplaner-fossilfritt-sverige/fardplan-el-20190802.pdf
13. https://bioenergitidningen.se/biokraft/209-biokraftvarmeverk-i-sverige
14. https://www.svd.se/bors/news_detail.php?newsid=29f79cc3-0047-43bc-a85f-9dbf19888813
15. https://www.energimyndigheten.se/statistik/energilaget/?currentTab=1#mainheading, Energiläget I siffror
16. Tomas Ekbom, Swedish Bioenergy Association
GENERAL COUNTRY INFORMATION
Population ( Millions) 10.3
Surface (km²) 447435
GDP ($/capita) 42440
Final energy consumption (PJ/a) 1436
The submitted information concerning electricity price and price spread are based on data for 2018 and 2019. Electricity prices have since decreased considerably and price volatility has increased as well, due to very quick new deployment of wind power. In 2020, for the first time, Sweden hade
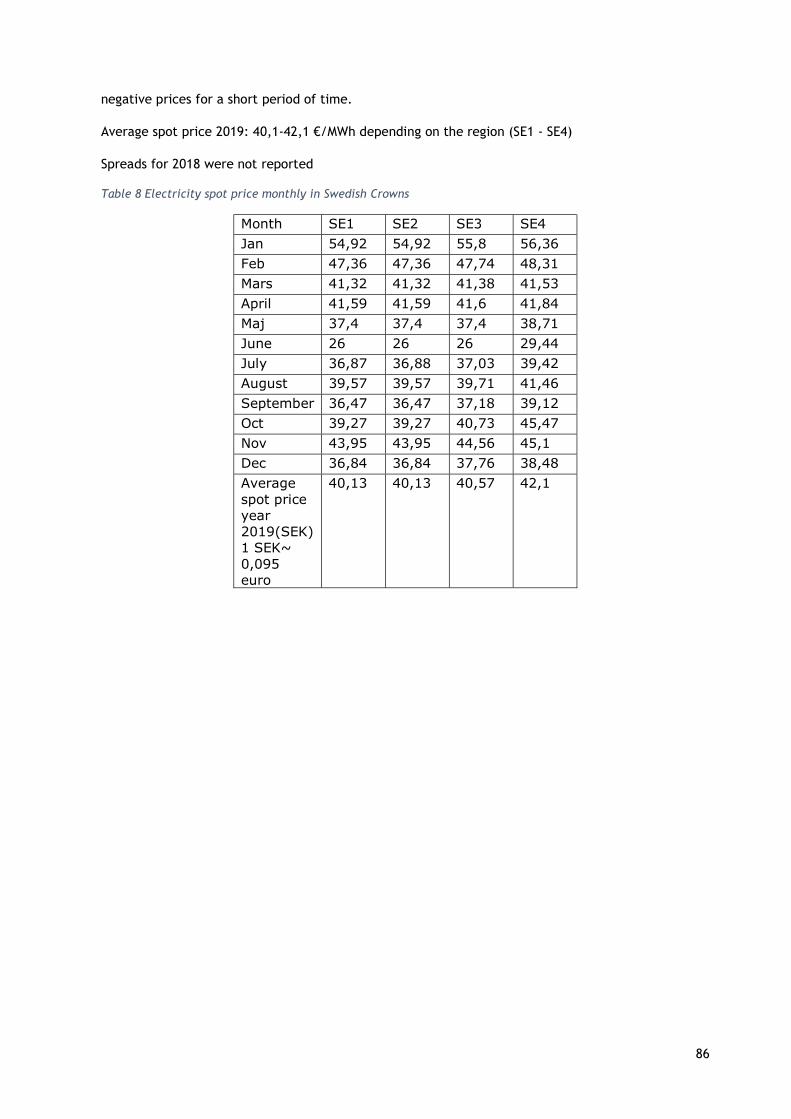
86
negative prices for a short period of time.
Average spot price 2019: 40,1-42,1 €/MWh depending on the region (SE1 - SE4)
Spreads for 2018 were not reported
Table 8 Electricity spot price monthly in Swedish Crowns
Month SE1 SE2 SE3 SE4 Jan 54,92 54,92 55,8 56,36 Feb 47,36 47,36 47,74 48,31 Mars 41,32 41,32 41,38 41,53 April 41,59 41,59 41,6 41,84 Maj 37,4 37,4 37,4 38,71 June 26 26 26 29,44 July 36,87 36,88 37,03 39,42 August 39,57 39,57 39,71 41,46 September 36,47 36,47 37,18 39,12 Oct 39,27 39,27 40,73 45,47 Nov 43,95 43,95 44,56 45,1 Dec 36,84 36,84 37,76 38,48 Average spot price year 2019(SEK) 1 SEK~ 0,095 euro
40,13 40,13 40,57 42,1
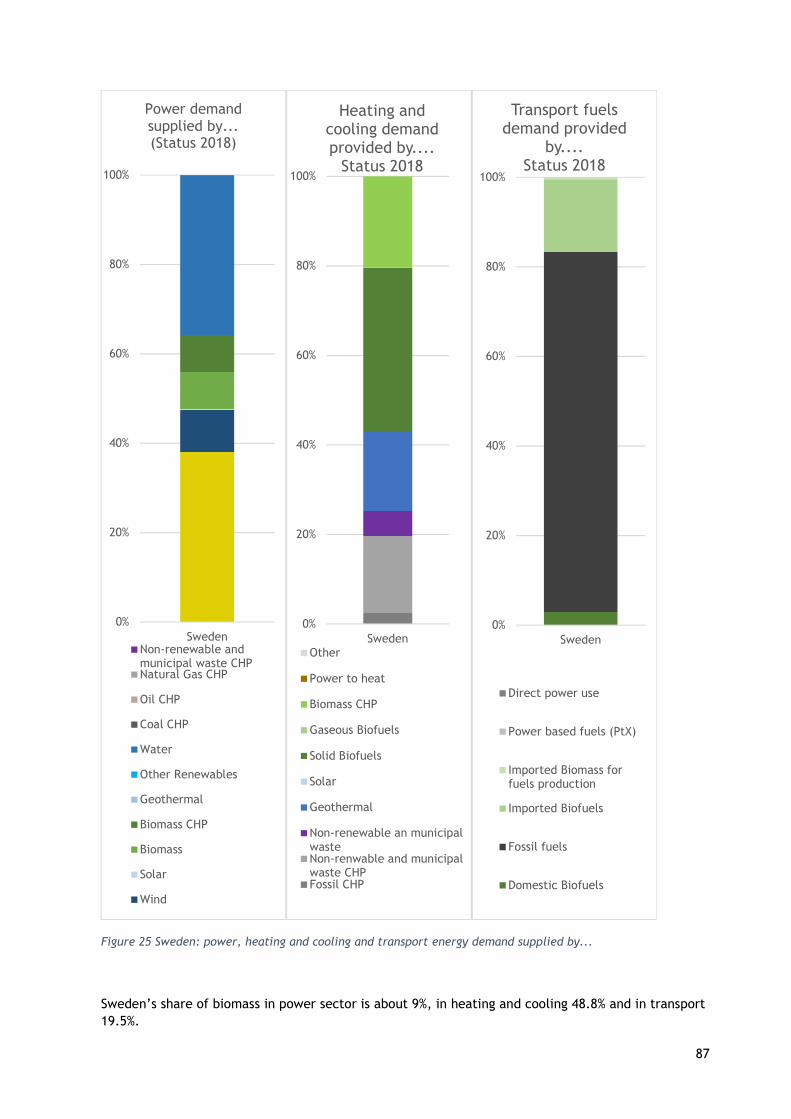
87
Figure 25 Sweden: power, heating and cooling and transport energy demand supplied by...
Sweden’s share of biomass in power sector is about 9%, in heating and cooling 48.8% and in transport 19.5%.
0%
20%
40%
60%
80%
100%
Sweden
Power demand supplied by... (Status 2018)
Non-renewable andmunicipal waste CHPNatural Gas CHP
Oil CHP
Coal CHP
Water
Other Renewables
Geothermal
Biomass CHP
Biomass
Solar
Wind
0%
20%
40%
60%
80%
100%
Sweden
Heating and cooling demand provided by....
Status 2018
Other
Power to heat
Biomass CHP
Gaseous Biofuels
Solid Biofuels
Solar
Geothermal
Non-renewable an municipalwasteNon-renwable and municipalwaste CHPFossil CHP
0%
20%
40%
60%
80%
100%
Sweden
Transport fuels demand provided
by....Status 2018
Direct power use
Power based fuels (PtX)
Imported Biomass forfuels production
Imported Biofuels
Fossil fuels
Domestic Biofuels
88
STATUS QUO AND COUNTRY CLASSIFICATION
The Swedish experts see the country in phase 2, drawing on existing system flexibility where flexibility issues emerge but the system is able to cope with them through minor operational modifications.
So far, the Swedish authorities have done little to handle this. We have an advantage with our high share of hydropower and rather strong power interconnections to neighbour countries (Finland, Norway, Denmark, Lithuania, Poland, Germany). Thus it would be phase 2. Investments in flexibility is investigated. A lot of phantasies about storing electricity in the cars and different types of user flexibility, etc..
Sweden has a high share of hydropower which gives basic flexibility and stabilizes the grid on national level. Hydro power stations can usually be turned on an off at short notice.
FLEXIBLE ENERGIES CAPACITIES
As mentioned above Sweden has a high share of hydropower which gives basic flexibility. However, there are capacity issues in some of the big cities, partly because new regulation has forced the closure of some fossil based CHPs. New CHP capacity with biomass and waste can remedy this situation, but investments take time.
For thermal energy production there is no support system, except very high carbon dioxide tax on fossil fuels. This tax has almost doubled the price of heating oil, and indirectly created the market for district heating (bio based), pellets heating and heat pumps. Subsequently, fossil heating has almost disappeared from the market.
Renewable gas is not much, 2 TWh were produced 2018. Today mainly used for up-grading to transport fuel. Not much used for electricity production (however, see about Malmö below).
Flexible bioenergy capacities:
Flexible bioenergy systems in the power sector: 4500 MW installed (2018), 4600 (2030), 5000 (2050) (13) This number is for the total installed capacity in bio-power. It can of course be used in a flexible way, but both for district heating and the forest industry, the two groups where almost all turbines are located, the primary energy demand is heat and bio-electricity is a “by-product”. CHPs in district heating could be used in condensing mode if they were supplemented with coolers, and partly be used as reserve or balancing units.
Related electricity provision: 15,5 TWh (2018), 2030: 15 TWh, 2050: 20 TWh (14)
Flexible bioenergy systems in the heat sector: 21.000 MW installed (2018), 2030 and 2050: lower. This is the total heat capacity in district heating and in industry (mainly large boilers in forest industry).
Related heat provision: 108 TWh (2018), 2030: 110 TWh, 2050: 110 TWh (1)
Renewable gas: 2018: 2 TWh
LEGAL FRAMEWORK
Policy instruments
89
Being investigated. When Stockholm and Malmö had pressing issues concerning regional capacity, the solution was short-term negotiations between central and local governments, the regional grid owners and the local heat and power producers, resulting in two investments, in Stockholm in an old CHP unit, earlier used for oil but now converted to bio-oil, and in Malmö retrofitting of a former fossil gas CHP to biogas. Discussions are on-going about how to implement a general framework to further investments in local production units to guarantee capacity. But nothing is yet taking place for balancing on the national level.
The support to renewable electricity production has been through a quota system called ”electricity certificate system” introduced in 2003, still running but will be dismantled in the next couple of years. The system is technology neutral, as it is the same for biopower, wind, solar, new hydro etc. Every distributor of electricity has to have certificates in relation to his/her volume of delivered power. The certificates are issued to the producers of qualified renewable power (during 15 years from start of production) - one per each MWh produced. They are then sold to the distributors on the market, who have a certain quota obligation for renewable electricity. The values have been around 1.5 - 2.5 €cents/KWh. But now the price has gone down drastically because of excess production of wind power at a low cost. The goal is the total number of required certificates and set in TWh for 2030. Because the system has “over-delivered” and the prices of certificates are nearing zero, the system will be closed.
As the certificates are awarded solely for production of electricity, regardless of the price or demand on the market, it favours variable electricity production from wind and solar, and doesn’t give any extra incentive for effect (balancing) or capacity (e.g. in city regions with increased demand and low production of variable power).
Opportunities
We need more flexible power because we have a problem with power capacity (MW) due to a lot of weather depended production and capacity shortage in the electrical grid between the north and south of Sweden and to large cities.
Barriers and bottlenecks
When it comes to CHP the electricity price is to low right now. To offer power instead of energy isn’t worth anything in Sweden. We need to have some kind of support system for planned, weather independent power on the national scale.
Phase out strategies
All fossil fuels shall be phased out. The national target is climate neutrality by 2045, which requires total phase out of fossil fuels.
KEY SECTORS AND KEY ACTORS
The energy sector, but most the industry. Policy makers and municipal authorities also play a role as stakeholders.
GOALS AND EXPECTATIONS
The goal is a climate neutral economy by 2045, not including natural sinks. The power sector is almost fossil free, but nuclear power will be closed down by 2040 and need to be compensated for. Heating is almost fossil free already, and transport targets are ambitious by 2030 – minus 70% GHG emissions compared to 2010. Reduction quota - which means that the quota is calculated on the GHG emissions reduction (life cycle based) on the used biofuels. This favours the most climate efficient fuels in blending. Separate quotas for diesel and petrol markets. Beside this total tax exemption for high blends pure biofuels: E85, ED95, B100, HVO100, biogas.
RESEARCH, DEVELOPMENT AND INNOVATION
Two of the latest projects are:
90
Modular engineering for efficient photosynthetic biosynthesis of 1-butanol from CO2 in cyanobacteria. https://pubs.rsc.org/en/Content/ArticleLanding/2019/EE/C9EE01214A#!divAbstract
BioFlex – Bio-based flexible production of transportation fuels in a combined pyrolysis and gasification plant. https://f3centre.se/en/research/bioflex-bio-based-flexible-production-of-transportation-fuels-in-a-combined-pyrolysis-and-gasification-plant/
Scenarios and Forecasts
Several data on scenarios and forecasts have been provided.
BEST PRACTISES
Examples of combined systems and costs in transportation: In Norrköping there is a biorefinery by Agroetanol which use grain and bakery wastes and other smaller quantities of crop wastes with fermentation to high-grade ethanol for use as E855 (mixture of gasoline and ethanol) and ED95 (diesel-adapted ethanol fuel) at the same time as producing carbon dioxide as by-product for use in beverages. The remainder of the solids are used for farmers as feed for animals with high-protein content. There is in addition a small plant in Gothenburg by NEOT and St1 which also produces ethanol but only from bakery wastes. The oil refinery where it is located has interest to use the separated carbon dioxide in the future for applications.
The other combined systems are e.g. the tall oil based biorefinery in Piteå which produces raw tall diesel and tall oil pitch for heating plants while also producing resins and possibly other green chemicals found in the tall oil. Another example is the biogas plants which are combined with heat and power production. The latest is the 60 GWh biogas plant south of Stockholm which uses municipal wastes for anaerobic digestion and upgrading to bio-CNG while producing power, heat and bio-fertilizer. There are of course other examples but the main ones have here been described. In the not so distant future there could be systems built with CO2-enhanced diesel production and systems where hydrogen is used, separately or with CO2 to produce fuels.
However, the Swedish Energy Agency is the authority which handles both permits for sustainability as well as reporting of climate reduction performance and deliveries of these fuels where information also is gathered on costs which are used when assessing if the current tax exemption is not leading to over-compensation. These values are not public in the broad sense but available at the agency for analysis.
Sweden has multiple systems as examples of flexible bioenergy systems in the heat sector. See the enclosed maps that show BioHeat (Figure 27), Bio-CHP (Figure 26) and Biorefineries (Figure 28).

91
Figure 26: Bio CHP plants in Sweden in 2019
Figure 27: Bioheat plants in Sweden in 2019
Figure 28: Biorefineries in Sweden in 2019
Case studies with high relevance to flexible bioenergy
1.Falun Energy & Water – Combined bioenergy plant – Power, heat and pellet production. https://smartcitysweden.com/best-practice/289/falun-energy-water-combined-bioenergy-plant/

92
2. SCA has a long-term goal to manufacture liquid biofuel from residual forest products of 260,000 m3, a volume corresponding to all fuel used in domestic flights in Sweden. https://www.sca.com/en/energy/products/liquid-biofuels/
3.BTC - A SCALABLE SOLUTION FOR OUR PLANET - To meet the needs of tomorrow, biopower plants that consume half the biomass, produce on-demand, and are cost-effective are needed. Phoenix BioPower has found the solution to achieve this; we call it the BTC* technology. By converting biomass residues** into electricity in a clean and efficient process, the BTC technology enables profitable and plannable renewable power. A unique opportunity to drastically improve the health of our planet and reliability of our energy system. The BTC Technology produces power from biomass twice as efficiently as traditional stem cycle technologies. In other words, half as much biomass is used per unit electricity produced and operating costs are cut almost by half. This results in a profitable plant that generates renewable power and heat on-demand. As a co-generation technology, waste heat from the process can be used for industrial and commercial uses to also replace fossil energy. https://phoenixbiopower.com/

93
Switzerland
Sources:
1.Schweizer Gesamtenergiestatistik. https://www.bfe.admin.ch/bfe/de/home/versorgung/statistik-und-geodaten/energiestatistiken/gesamtenergiestatistik.html
2. Report for Selected Countries and Subjects: Switzerland". Washington, DC, U.S.: International Monetary Fund. Retrieved 1 October 2018
3. IEA Key World Energy Statistics 2019
4. Swiss Agriculture Pocket Statistics 2015, Federal statistic agency, 2015
5. Schweizerisches Landesforstinventar. Ergebnisse der dritten Erhebung 2004–2006. Brändli, U.-B. (Red.), 2010, ISBN 978-3-905621-47-1
6. Thees et al., Biomassepotenziale der Schweiz für die energetische Nutzung. Ergebnisse des Schweizerischen Energiekompetenzzentrums SCCER BIOSWEET, WSL Berichte 57, 2017
7. Swiss Federal Office of Energy, Schweizerische Gesamtenergiestatistik 2017
8. https://www.ieabioenergy.com/wp-content/uploads/2018/10/CountryReport2018_Switzerland_final.pdf
9. https://www.bfe.admin.ch/bfe/en/home/politik/energiestrategie-2050.html
10.https://www.satw.ch/fileadmin/user_upload/documents/02_Themen/05_Energie/SATW_powersystems_EN.pdf
11. https://www.psi.ch/sites/default/files/import/lea/HomeEN/Final-Report-ISCHESS-Project.pdf
12. https://www.eda.admin.ch/aboutswitzerland/en/home/wirtschaft/energie/energie---fakten-und-zahlen.html
13. https://www.bfe.admin.ch/bfe/en/home/supply/renewable-energy/hydropower/large-scale-hydropower.html
14. https://www.newsd.admin.ch/newsd/message/attachments/48801.pdf
15. https://www.psi.ch/sites/default/files/import/eem/PublicationsTabelle/2014-STEM-PSI-Bericht-14-06.pdf
16. https://sjes.springeropen.com/track/pdf/10.1186/s41937-019-0037-3
GENERAL COUNTRY INFORMATION
Population ( Millions) 8.57
Surface (km²) 41285
GDP ($/capita) 64649
Final energy consumption (PJ/a) 1001
Information on electricity prices and price spread have not been available.
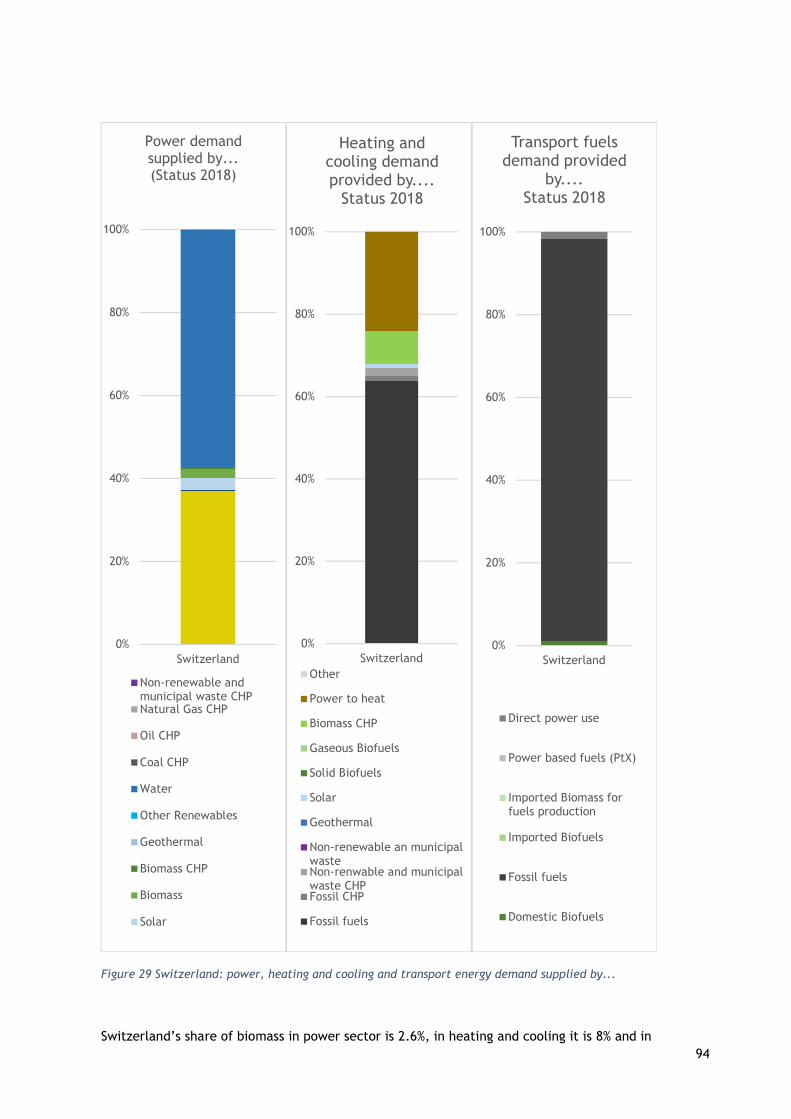
94
Figure 29 Switzerland: power, heating and cooling and transport energy demand supplied by...
Switzerland’s share of biomass in power sector is 2.6%, in heating and cooling it is 8% and in
0%
20%
40%
60%
80%
100%
Switzerland
Power demand supplied by... (Status 2018)
Non-renewable andmunicipal waste CHPNatural Gas CHP
Oil CHP
Coal CHP
Water
Other Renewables
Geothermal
Biomass CHP
Biomass
Solar
0%
20%
40%
60%
80%
100%
Switzerland
Heating and cooling demand provided by....
Status 2018
Other
Power to heat
Biomass CHP
Gaseous Biofuels
Solid Biofuels
Solar
Geothermal
Non-renewable an municipalwasteNon-renwable and municipalwaste CHPFossil CHP
Fossil fuels
0%
20%
40%
60%
80%
100%
Switzerland
Transport fuels demand provided
by....Status 2018
Direct power use
Power based fuels (PtX)
Imported Biomass forfuels production
Imported Biofuels
Fossil fuels
Domestic Biofuels
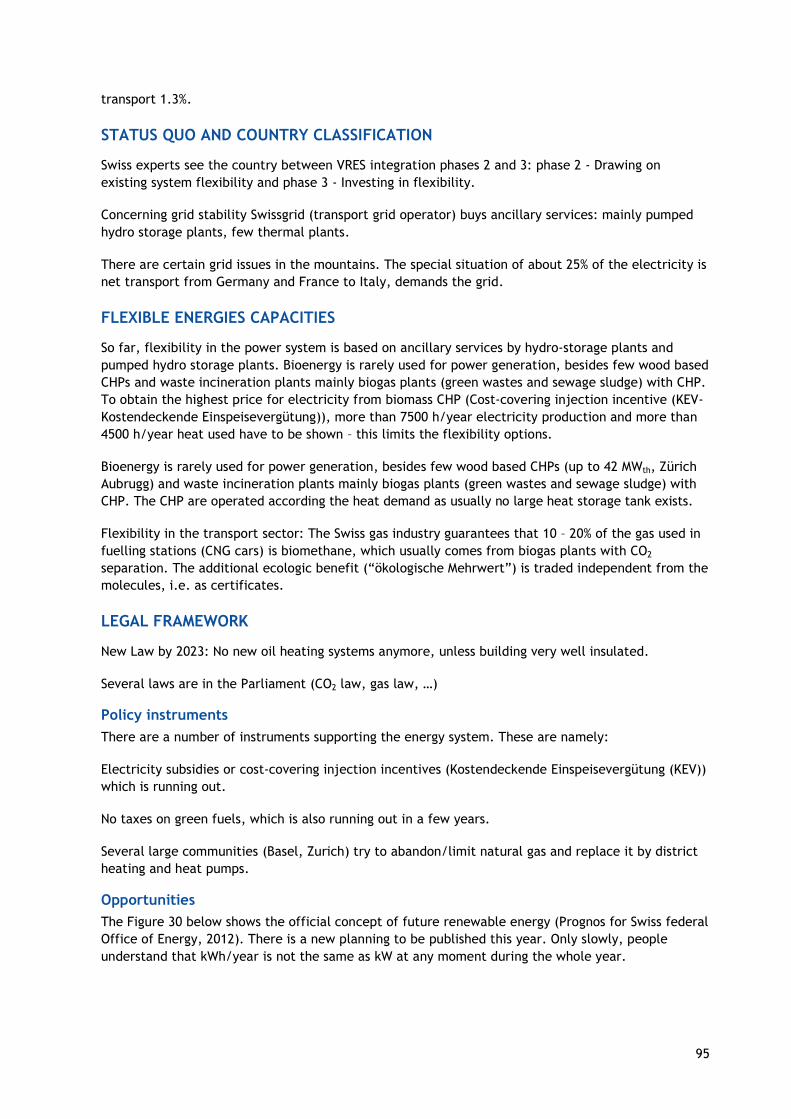
95
transport 1.3%.
STATUS QUO AND COUNTRY CLASSIFICATION
Swiss experts see the country between VRES integration phases 2 and 3: phase 2 - Drawing on existing system flexibility and phase 3 - Investing in flexibility.
Concerning grid stability Swissgrid (transport grid operator) buys ancillary services: mainly pumped hydro storage plants, few thermal plants.
There are certain grid issues in the mountains. The special situation of about 25% of the electricity is net transport from Germany and France to Italy, demands the grid.
FLEXIBLE ENERGIES CAPACITIES
So far, flexibility in the power system is based on ancillary services by hydro-storage plants and pumped hydro storage plants. Bioenergy is rarely used for power generation, besides few wood based CHPs and waste incineration plants mainly biogas plants (green wastes and sewage sludge) with CHP. To obtain the highest price for electricity from biomass CHP (Cost-covering injection incentive (KEV- Kostendeckende Einspeisevergütung)), more than 7500 h/year electricity production and more than 4500 h/year heat used have to be shown – this limits the flexibility options.
Bioenergy is rarely used for power generation, besides few wood based CHPs (up to 42 MWth, Zürich Aubrugg) and waste incineration plants mainly biogas plants (green wastes and sewage sludge) with CHP. The CHP are operated according the heat demand as usually no large heat storage tank exists.
Flexibility in the transport sector: The Swiss gas industry guarantees that 10 – 20% of the gas used in fuelling stations (CNG cars) is biomethane, which usually comes from biogas plants with CO2 separation. The additional ecologic benefit (“ökologische Mehrwert”) is traded independent from the molecules, i.e. as certificates.
LEGAL FRAMEWORK
New Law by 2023: No new oil heating systems anymore, unless building very well insulated.
Several laws are in the Parliament (CO2 law, gas law, …)
Policy instruments
There are a number of instruments supporting the energy system. These are namely:
Electricity subsidies or cost-covering injection incentives (Kostendeckende Einspeisevergütung (KEV)) which is running out.
No taxes on green fuels, which is also running out in a few years.
Several large communities (Basel, Zurich) try to abandon/limit natural gas and replace it by district heating and heat pumps.
Opportunities
The Figure 30 below shows the official concept of future renewable energy (Prognos for Swiss federal Office of Energy, 2012). There is a new planning to be published this year. Only slowly, people understand that kWh/year is not the same as kW at any moment during the whole year.
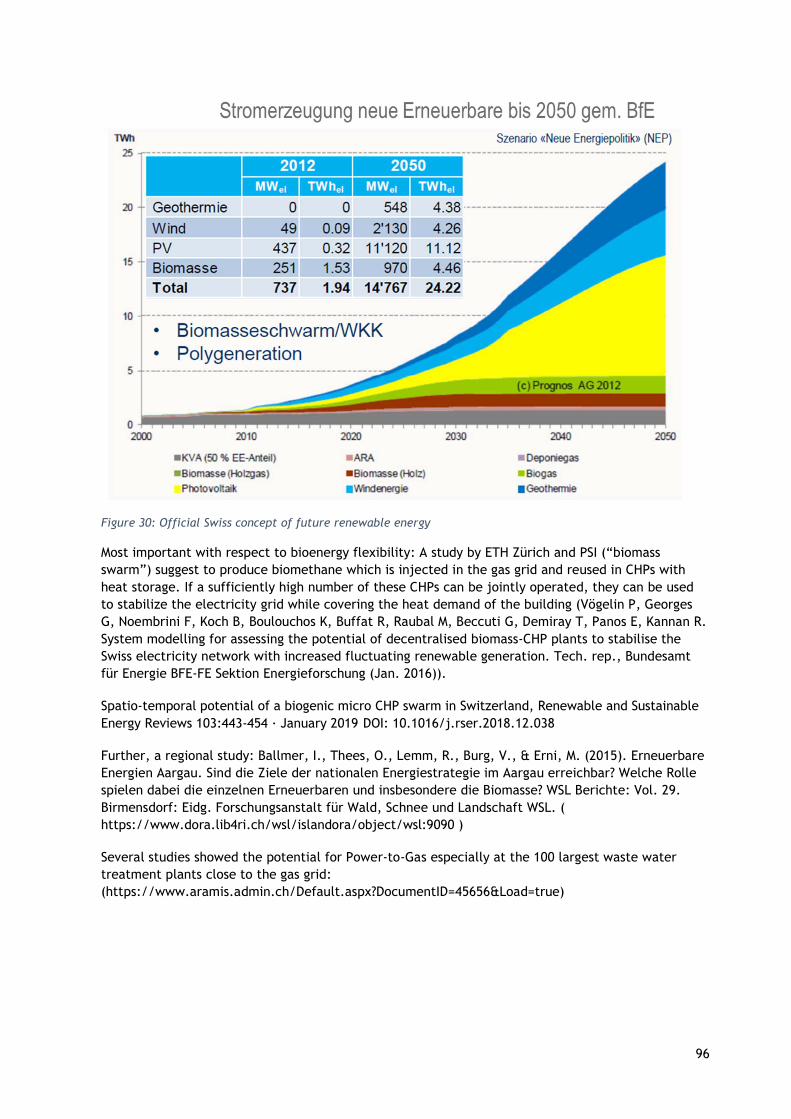
96
Figure 30: Official Swiss concept of future renewable energy
Most important with respect to bioenergy flexibility: A study by ETH Zürich and PSI (“biomass swarm”) suggest to produce biomethane which is injected in the gas grid and reused in CHPs with heat storage. If a sufficiently high number of these CHPs can be jointly operated, they can be used to stabilize the electricity grid while covering the heat demand of the building (Vögelin P, Georges G, Noembrini F, Koch B, Boulouchos K, Buffat R, Raubal M, Beccuti G, Demiray T, Panos E, Kannan R. System modelling for assessing the potential of decentralised biomass-CHP plants to stabilise the Swiss electricity network with increased fluctuating renewable generation. Tech. rep., Bundesamt für Energie BFE-FE Sektion Energieforschung (Jan. 2016)).
Spatio-temporal potential of a biogenic micro CHP swarm in Switzerland, Renewable and Sustainable Energy Reviews 103:443-454 · January 2019 DOI: 10.1016/j.rser.2018.12.038
Further, a regional study: Ballmer, I., Thees, O., Lemm, R., Burg, V., & Erni, M. (2015). Erneuerbare Energien Aargau. Sind die Ziele der nationalen Energiestrategie im Aargau erreichbar? Welche Rolle spielen dabei die einzelnen Erneuerbaren und insbesondere die Biomasse? WSL Berichte: Vol. 29. Birmensdorf: Eidg. Forschungsanstalt für Wald, Schnee und Landschaft WSL. ( https://www.dora.lib4ri.ch/wsl/islandora/object/wsl:9090 )
Several studies showed the potential for Power-to-Gas especially at the 100 largest waste water treatment plants close to the gas grid: (https://www.aramis.admin.ch/Default.aspx?DocumentID=45656&Load=true)
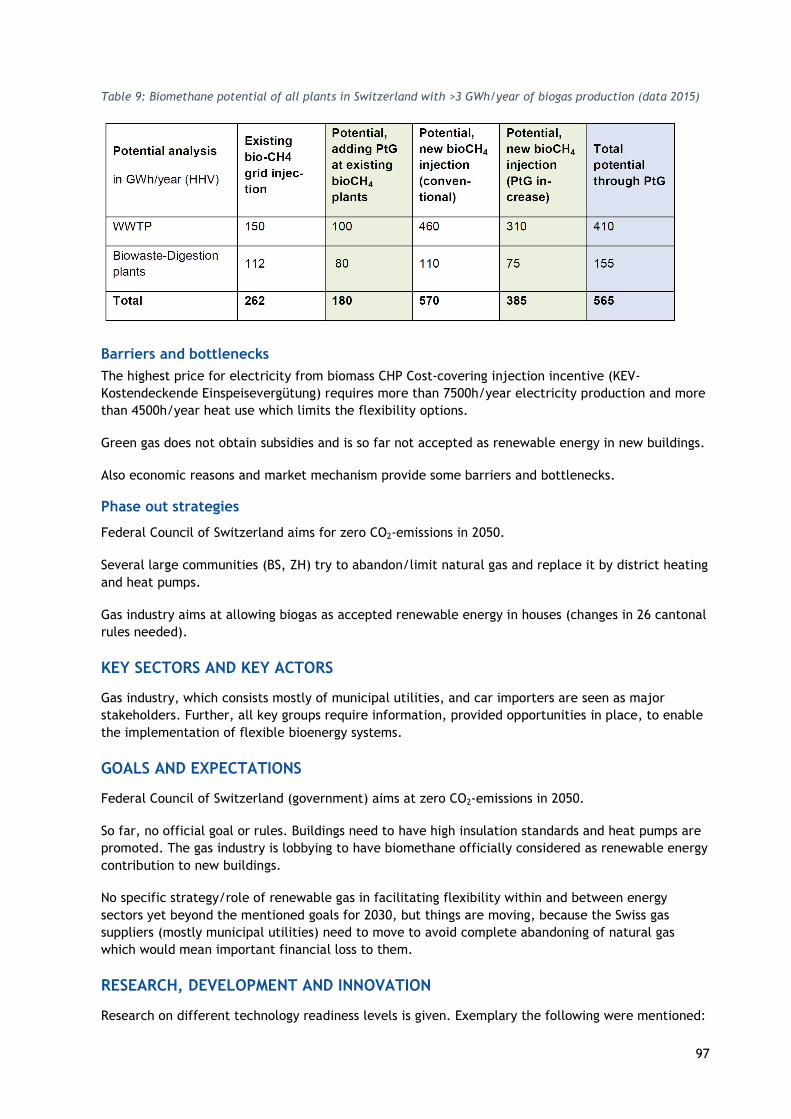
97
Table 9: Biomethane potential of all plants in Switzerland with >3 GWh/year of biogas production (data 2015)
Barriers and bottlenecks
The highest price for electricity from biomass CHP Cost-covering injection incentive (KEV-Kostendeckende Einspeisevergütung) requires more than 7500h/year electricity production and more than 4500h/year heat use which limits the flexibility options.
Green gas does not obtain subsidies and is so far not accepted as renewable energy in new buildings.
Also economic reasons and market mechanism provide some barriers and bottlenecks.
Phase out strategies
Federal Council of Switzerland aims for zero CO2-emissions in 2050.
Several large communities (BS, ZH) try to abandon/limit natural gas and replace it by district heating and heat pumps.
Gas industry aims at allowing biogas as accepted renewable energy in houses (changes in 26 cantonal rules needed).
KEY SECTORS AND KEY ACTORS
Gas industry, which consists mostly of municipal utilities, and car importers are seen as major stakeholders. Further, all key groups require information, provided opportunities in place, to enable the implementation of flexible bioenergy systems.
GOALS AND EXPECTATIONS
Federal Council of Switzerland (government) aims at zero CO2-emissions in 2050.
So far, no official goal or rules. Buildings need to have high insulation standards and heat pumps are promoted. The gas industry is lobbying to have biomethane officially considered as renewable energy contribution to new buildings.
No specific strategy/role of renewable gas in facilitating flexibility within and between energy sectors yet beyond the mentioned goals for 2030, but things are moving, because the Swiss gas suppliers (mostly municipal utilities) need to move to avoid complete abandoning of natural gas which would mean important financial loss to them.
RESEARCH, DEVELOPMENT AND INNOVATION
Research on different technology readiness levels is given. Exemplary the following were mentioned:
98
Renewable natural gas production by direct methanation of biogas with PtG: TRL 5 fluidized bed catalytic methanation in Zurich [Witte et al.]
TRL 6-7 biological methanation electrochaea in Solothurn (EU project Store&Go)
TRL 8-9 biological methanation microbe Energy in Dietikon planned/under construction.
Scenarios and Forecasts
No scenarios or forecasts have been provided.
BEST PRACTISES
Examples of combined systems and costs in transportation: Renewable natural gas production by direct methanation of biogas with PtG: TRL 5 fluidized bed catalytic methanation in Zurich [Witte et al.]
There is a techno-economic analysis of such systems [Witte et al. 2019], similar results were found for the planned 2 MWel PtG plant in Diektikon.
Examples of flexible bioenergy systems in the heat sector: many single house domestic heating systems are based on pellets: 500 kWth Pellet fired CHP (e.g. Rheinfelden) 3-4 MWth Wood fired CHP (Stans), Small wood fired district heating Large wood fired district heating (Schwyz, Basel, Zurich, …)
Case studies with high relevance to flexible bioenergy
A study by ETH Zürich and PSI (“biomass swarm”) suggest to produce biomethane which is injected in the gas grid and reused in CHPs with heat storage. If a sufficiently high number of these CHPs can be jointly operated, they can be used to stabilize the electricity grid while covering the heat demand of the building: Vögelin P, Georges G, Noembrini F, Koch B, Boulouchos K, Buffat R, Raubal M, Beccuti G, Demiray T, Panos E, Kannan R. System modelling for assessing the potential of decentralised biomass-CHP plants to stabilise the Swiss electricity network with increased fluctuating renewable generation. Tech. rep., Bundesamt für Energie BFE-FE Sektion Energieforschung (Jan. 2016). Please insert your information here.
Spatio-temporal potential of a biogenic micro CHP swarm in Switzerland, Renewable and Sustainable Energy Reviews 103:443-454 · January 2019 DOI: 10.1016/j.rser.2018.12.038
Further, a regional study: Ballmer, I., Thees, O., Lemm, R., Burg, V., & Erni, M. (2015). Erneuerbare Energien Aargau. Sind die Ziele der nationalen Energiestrategie im Aargau erreichbar? Welche Rolle spielt dabei die einzelnen Erneuerbaren und insbesondere die Biomasse? WSL Berichte: Vol. 29. Birmensdorf: Eidg. Forschungsanstalt für Wald, Schnee und Landschaft WSL. ( https://www.dora.lib4ri.ch/wsl/islandora/object/wsl:9090 )
Several studies showed the potential for Power-to-Gas especially at the 100 largest waste water treatment plants close to the gas grid: (https://www.aramis.admin.ch/Default.aspx?DocumentID=45656&Load=true)

99
United States
Sources:
1. US Census
2. World Bank
3. EIA 2018
4. World Energy Balances OECD/IEA 2018
5. https://www.eia.gov/electricity/annual/html/epa_10_01.html
6. EIA 2018
GENERAL COUNTRY INFORMATION
Population ( Millions) 330
Surface (km²) 9800000
GDP ($/capita) 62795
Final energy consumption (PJ/a) 106825

100
Figure 31 United States: power and transport energy demand supplied by... (no data available for heating and cooling sector)
United States share of biomass in power sector accounts for 1.4% and in transport for 9.7%. For heating and cooling sector no data were available.
0%
20%
40%
60%
80%
100%
United States
Power demand supplied by... (Status 2018)
Non-renewable andmunicipal waste CHPNatural Gas CHP
Oil CHP
Coal CHP
Water
Other Renewables
Geothermal
Biomass CHP
Biomass
Solar
Wind
Nuclear
0%
20%
40%
60%
80%
100%
United States
Transport fuels demand provided
by....Status 2018
Direct power use
Power based fuels (PtX)
Imported Biomass forfuels production
Imported Biofuels
Fossil fuels
Domestic Biofuels
101
STATUS QUO AND COUNTRY CLASSIFICATION
American experts see the country in VRES implementation phase 3, Investing in flexibility
Grid stability: Certain markets leverage demand side resources, which can offer bids that reflect their flexibility to adjust their load in response to market schedules and dispatches. Bottlenecks: Curtailment is growing in ERCOT and CAISO
Nothing has been established to facilitate flexibility within and between energy sectors, though significant interest and R&D exists in both the public and private sector.
FLEXIBLE ENERGIES CAPACITIES
Unfortunately no information have been provided.
LEGAL FRAMEWORK
The legal framework in the United States is not very ambitious concerning bioenergy.
Policy instruments
Low Carbon Fuel Standard could incentivize the implementation of flexible bioenergy opportunities that generate renewable natural gas that was produced from biogas and renewable hydrogen.
Opportunities
As in many places in Europe, curtailed electricity is becoming a noticeable phenomenon in certain areas of the country, such as California and Texas. As the deployment of renewables continues, this will likely become more significant. This could possibly represent an opportunity for bioenergy solutions.
Barriers and bottlenecks
The comparably higher cost and political/social opposition are the main obstacles to overcome. There are few incentives in the US to deploy such technologies.
Phase out strategies
Phase out strategies do not exist.
KEY SECTORS AND KEY ACTORS
Certain power markets and state initiatives that call for increased penetration of renewable energy could benefit from this low-carbon option for dispatchable energy.
State public utility commissions that are considering renewable portfolio standards that wish to integrate more biomass into their generation mix.
GOALS AND EXPECTATIONS
None
RESEARCH, DEVELOPMENT AND INNOVATION
Programs within Department of Energy (DOE) Office of Energy Efficiency and Renewable Energy, ARPAe, as well as the Office of Fossil Energy
102
SoCal Gas is investing somewhat significantly into Power-to-Gas technologies.
Scenarios and Forecasts
No scenarios and forecasts have been provided for this report.
BEST PRACTISES
Examples of combined systems and costs in transportation Renewable natural gas generation from curtailed renewable energy. Several projects in the nation though nothing commercial yet. These efforts span both the public and private sector.
Case studies with high relevance to flexible bioenergy
1. Power-to-gas efforts occurring at the several national laboratories in collaboration with SoCal Gas and Electrochaea.
2. Efforts within DOE on the use of curtailed electricity to generate biofuels and bioproducts or other forms of energy storage.

103

104
Questionnaire
Contact (name and email address)
Please insert your information here.
1.1.1 Overview on status quo / frame condition for bioenergy integration
General Country Information
Table 10: General country information
Country Data sources please use numbers and insert full reference into last chapter
Population (millions) Sources as numbers
Overall surface area (km2) Sources as numbers
GDP ($/capita) Sources as numbers
Final energy consumption (PJ/a)
Table 11: Land use
Table 12: Biomass potential and use in 2018
Overall use of biomass for energy provision (PJ/a) Definition: Primary energy consumption of biomass for all sectors in 2018
Sources as numbers
Current Land Use Overall share of forest (%)
Overall share of agriculture (%)
Overall share of other land (%)
Data sources please use numbers and insert full reference into last chapter
Overall land Sources as numbers
Land for bioenergy Definition: Share of land current used for bioenergy feedstock production.
Sources as numbers
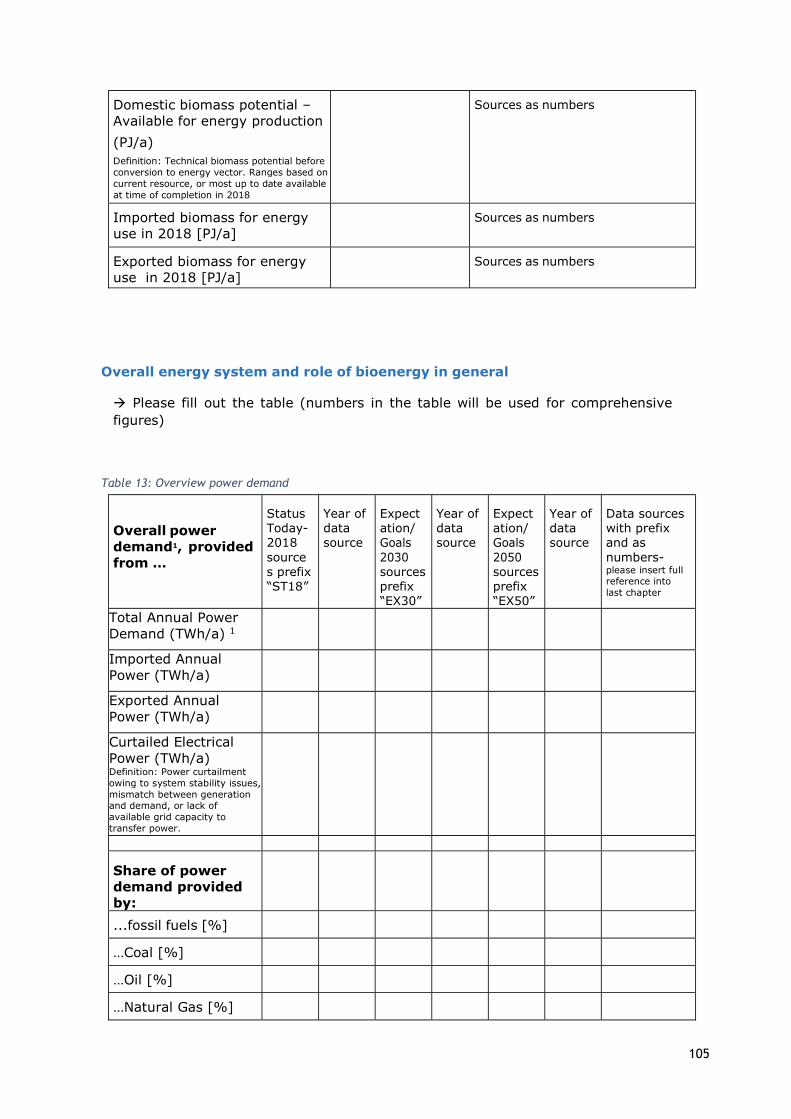
105
Domestic biomass potential – Available for energy production
(PJ/a) Definition: Technical biomass potential before conversion to energy vector. Ranges based on current resource, or most up to date available at time of completion in 2018
Sources as numbers
Imported biomass for energy use in 2018 [PJ/a]
Sources as numbers
Exported biomass for energy use in 2018 [PJ/a]
Sources as numbers
Overall energy system and role of bioenergy in general
Please fill out the table (numbers in the table will be used for comprehensive figures)
Table 13: Overview power demand
Overall power demand1, provided from …
Status Today- 2018 sources prefix “ST18”
Year of data source
Expectation/ Goals 2030 sources prefix “EX30”
Year of data source
Expectation/ Goals 2050 sources prefix “EX50”
Year of data source
Data sources with prefix and as numbers-please insert full reference into last chapter
Total Annual Power Demand (TWh/a) 1
Imported Annual Power (TWh/a)
Exported Annual Power (TWh/a)
Curtailed Electrical Power (TWh/a) Definition: Power curtailment owing to system stability issues, mismatch between generation and demand, or lack of available grid capacity to transfer power.
Share of power demand provided by:
...fossil fuels [%]
…Coal [%]
…Oil [%]
…Natural Gas [%]
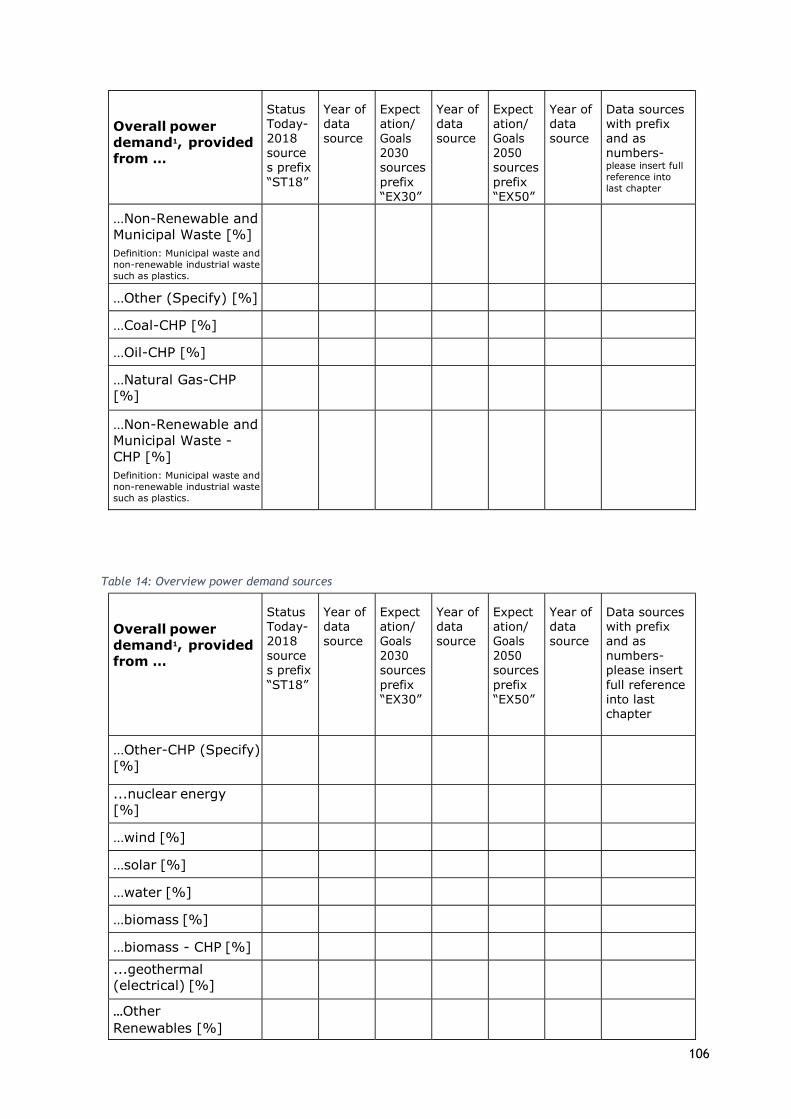
106
Overall power demand1, provided from …
Status Today- 2018 sources prefix “ST18”
Year of data source
Expectation/ Goals 2030 sources prefix “EX30”
Year of data source
Expectation/ Goals 2050 sources prefix “EX50”
Year of data source
Data sources with prefix and as numbers-please insert full reference into last chapter
…Non-Renewable and Municipal Waste [%] Definition: Municipal waste and non-renewable industrial waste such as plastics.
…Other (Specify) [%]
…Coal-CHP [%]
…Oil-CHP [%]
…Natural Gas-CHP [%]
…Non-Renewable and Municipal Waste - CHP [%] Definition: Municipal waste and non-renewable industrial waste such as plastics.
Table 14: Overview power demand sources
Overall power demand1, provided from …
Status Today- 2018 sources prefix “ST18”
Year of data source
Expectation/ Goals 2030 sources prefix “EX30”
Year of data source
Expectation/ Goals 2050 sources prefix “EX50”
Year of data source
Data sources with prefix and as numbers-please insert full reference into last chapter
…Other-CHP (Specify) [%]
...nuclear energy [%]
…wind [%]
…solar [%]
…water [%]
…biomass [%]
…biomass - CHP [%]
...geothermal (electrical) [%]
…Other Renewables [%]
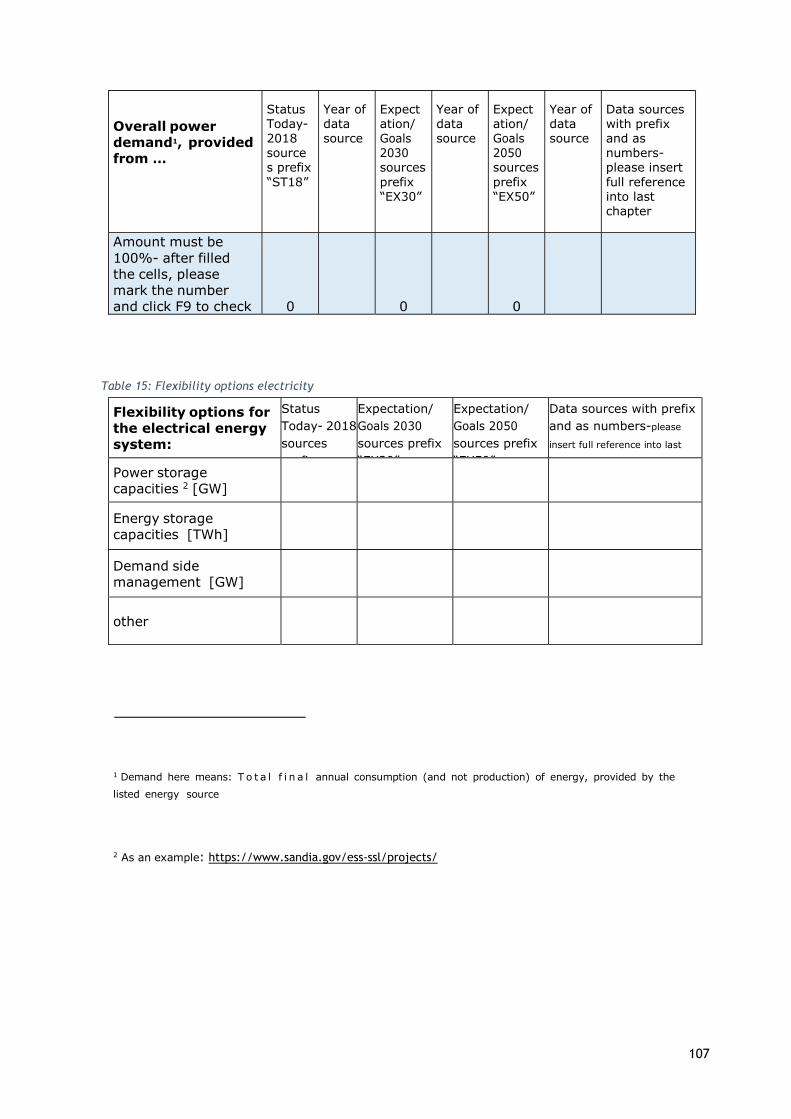
107
Overall power demand1, provided from …
Status Today- 2018 sources prefix “ST18”
Year of data source
Expectation/ Goals 2030 sources prefix “EX30”
Year of data source
Expectation/ Goals 2050 sources prefix “EX50”
Year of data source
Data sources with prefix and as numbers-please insert full reference into last chapter
Amount must be 100%- after filled the cells, please mark the number and click F9 to check
0
0
0
Table 15: Flexibility options electricity
Flexibility options for the electrical energy system:
Status Today- 2018 sources prefix
Expectation/ Goals 2030 sources prefix “EX30”
Expectation/ Goals 2050 sources prefix “EX50”
Data sources with prefix and as numbers-please
insert full reference into last
chapter Power storage capacities 2 [GW]
Energy storage capacities [TWh]
Demand side management [GW]
other
1 Demand here means: T o t a l f i n a l annual consumption (and not production) of energy, provided by the
listed energy source
2 As an example: https://www.sandia.gov/ess-ssl/projects/
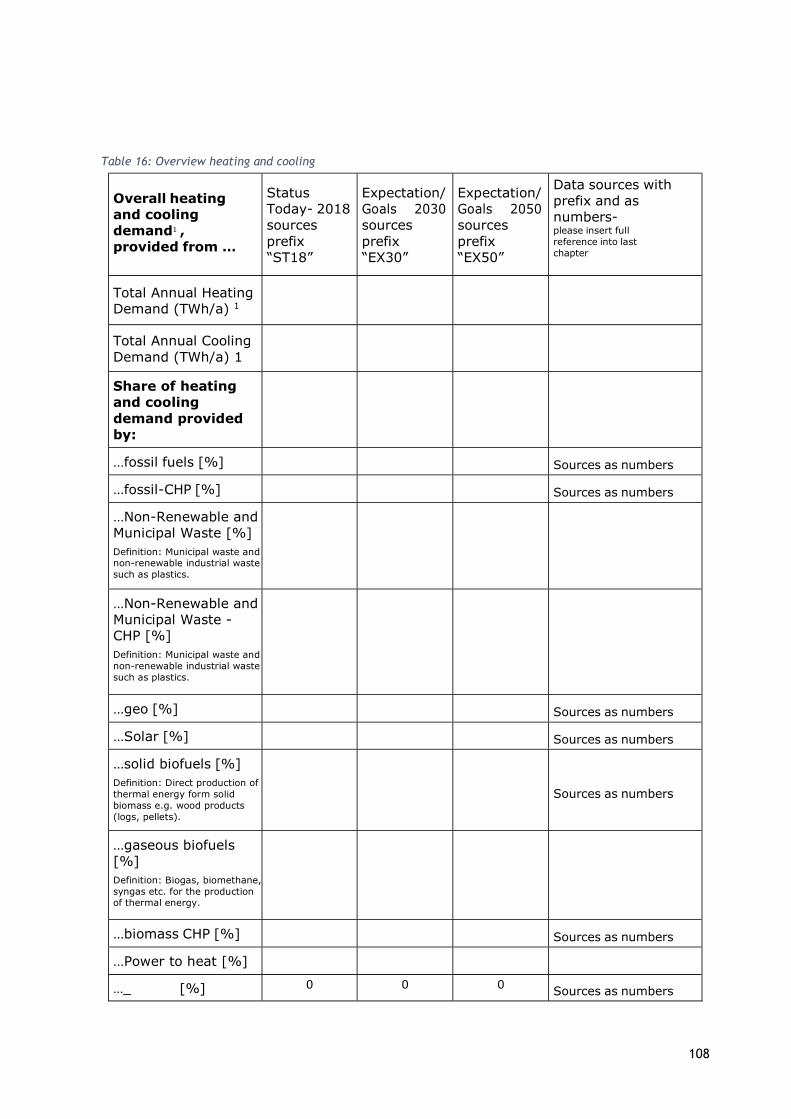
108
Table 16: Overview heating and cooling
Overall heating and cooling demand1 , provided from …
Status Today- 2018 sources prefix “ST18”
Expectation/ Goals 2030 sources prefix “EX30”
Expectation/ Goals 2050 sources prefix “EX50”
Data sources with prefix and as numbers- please insert full reference into last chapter
Total Annual Heating Demand (TWh/a) 1
Total Annual Cooling Demand (TWh/a) 1
Share of heating and cooling demand provided by:
…fossil fuels [%] Sources as numbers
…fossil-CHP [%] Sources as numbers
…Non-Renewable and Municipal Waste [%] Definition: Municipal waste and non-renewable industrial waste such as plastics.
…Non-Renewable and Municipal Waste - CHP [%] Definition: Municipal waste and non-renewable industrial waste such as plastics.
…geo [%] Sources as numbers
…Solar [%] Sources as numbers
…solid biofuels [%] Definition: Direct production of thermal energy form solid biomass e.g. wood products (logs, pellets).
Sources as numbers
…gaseous biofuels [%] Definition: Biogas, biomethane, syngas etc. for the production of thermal energy.
…biomass CHP [%] Sources as numbers
…Power to heat [%]
…_ [%] 0 0 0 Sources as numbers

109
Overall heating and cooling demand1 , provided from …
Status Today- 2018 sources prefix “ST18”
Expectation/ Goals 2030 sources prefix “EX30”
Expectation/ Goals 2050 sources prefix “EX50”
Data sources with prefix and as numbers- please insert full reference into last chapter
Amount must be 100%- after filled the cells, please mark the number and click F9 to check
0
0
0
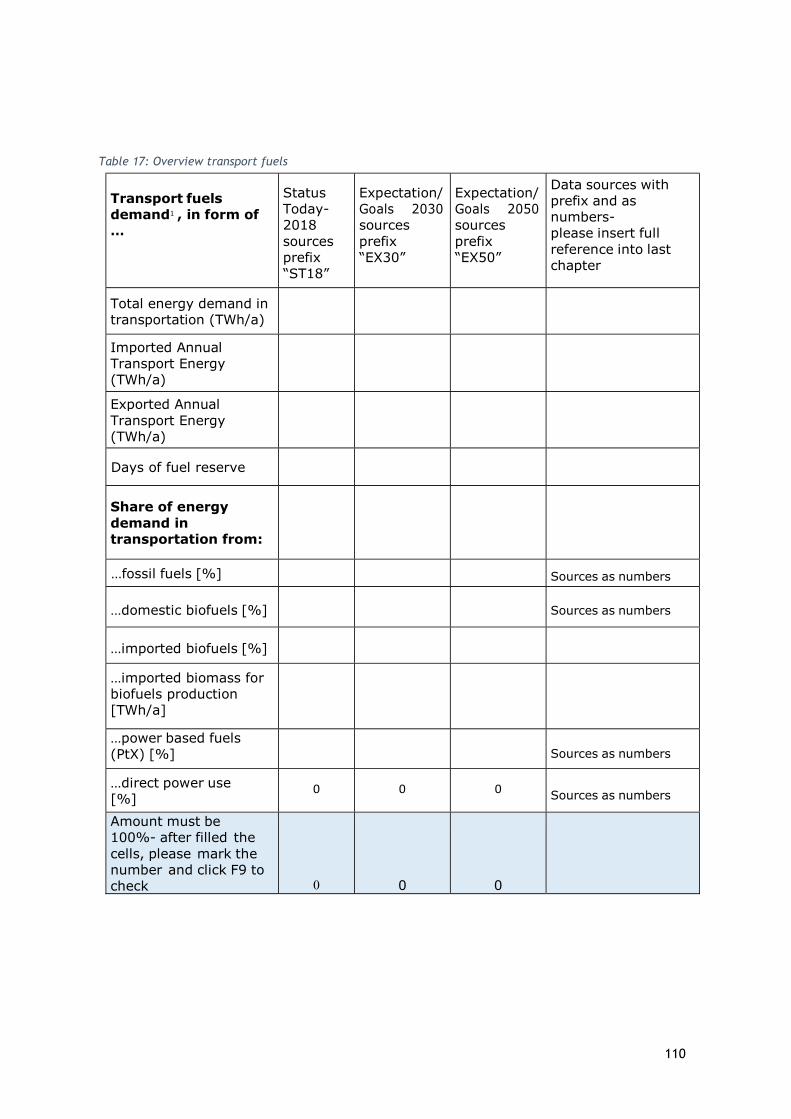
110
Table 17: Overview transport fuels
Transport fuels demand1 , in form of …
Status Today- 2018 sources prefix “ST18”
Expectation/ Goals 2030 sources prefix “EX30”
Expectation/ Goals 2050 sources prefix “EX50”
Data sources with prefix and as numbers- please insert full reference into last chapter
Total energy demand in transportation (TWh/a)
Imported Annual Transport Energy (TWh/a)
Exported Annual Transport Energy (TWh/a)
Days of fuel reserve
Share of energy demand in transportation from:
…fossil fuels [%] Sources as numbers
…domestic biofuels [%] Sources as numbers
…imported biofuels [%]
…imported biomass for biofuels production [TWh/a]
…power based fuels (PtX) [%]
Sources as numbers
…direct power use [%]
0 0 0 Sources as numbers
Amount must be 100%- after filled the cells, please mark the number and click F9 to check
0
0
0
111
Background information
(Please provide a text answering the following questions):
(a) Please describe the history of flexible bioenergy use in your region (Were there any goals set, were these goals achieved, which mechanisms were crucial in achieving these goals)?
□ Electrical power system
Please insert your information here.
□ Thermal Energy production
Please insert your information here.
□ Transport
Please insert your information here.
(b) What are the goals and expectations of flexible bioenergy use, and how well are they supported with laws and regulations (i.e. climate rules, key drivers)?
Please insert your information here.
(c) Are there clear phase out strategies for certain fossil energy carriers (if, so – how do they look like)?
Please insert your information here.
112
Flexible Power generation
(d) How would you categorize the country with regard to the integration of Variable Renewable Energy Sources (VRES)3 into the power sector in 2030:
□ Phase 1 - No relevant impact on system integration □ Phase 2 - Drawing on existing system flexibility □ Phase 3 - Investing in flexibility □ Phase 4 - Requiring advanced technologies to ensure reliability
(e) What are the actual mechanisms to stabilize the grid (from seconds to hours); are there bottlenecks in certain regions?
Please insert your information here.
3 https://www.iea.org/articles/will-system-integration-of-renewables-be-a-major-challenge-by-2023
(f) What is the electricity price Base-Peak-Spread [€/MWh] (arithmetic average of the hours between 8 am and 8 pm minus the daily average, according to EPEX-Spot4) in 2018?
Please insert your information here.
Flexible Bioenergy in Transportation
(g) Are there any examples of combined systems (of bioenergy and other renewables) in your region that produce or facilitate the use of renewable energy in transportation? (Use of biogenic CO2 to produce renewable transport fuel e.g. Audi e-gas in Werlte)
Please insert your information here.
113
(h) Do you have any cost assessments of combined systems?
Please insert your information here.
Flexible Bioenergy in Heat
(i) What flexible bioenergy systems are currently in place in your region? At what scale is flexible bioenergy typically implemented in your region? (Single house system, commercial, industrial, small scale district heating, large district heating, CHP systems)
Please insert your information here.
4 http://www.epexspot.com/en/market-data/dayaheadauction/

114
115
Implementation of flexible bioenergy systems
Describe the following aspects for your country:
(j) technical and non-technical barriers and bottlenecks of implementing flexibility of bioenergy plants
Please insert your information here.
(k) please describe current and future opportunities for the implementation of flexible bioenergy systems both in and between the different energy sectors. (For example: studies and figures describing the (future) value of flexible electricity from biomass in future markets)
Please insert your information here.
(l) existing and expected policy instruments or other activities driving the implementation of flexible bioenergy systems within and between different energy sectors
Please insert your information here.
(m) research and development on bioenergy hybrid systems (biomass + solar heating systems, combined fuel production from PtX and biomass etc.)
Please insert your information here.
(n) highlight important sectors that can benefit the most from the implementation of flexible bioenergy systems?
Please insert your information here.
116
(o) which key groups require information (opportunities in place) to enable the implementation of flexible bioenergy systems? (for example: policy makers, industrial sectors, communal/municipal authorities)
Please insert your information here.
(p) Is there a specific strategy/role of renewable gas in facilitating flexibility within and between energy sectors in your region?
Please insert your information here.

117
Provide information on flexible / hybrid bioenergy capacities and plannings (if information is available)
Table 18: Flexible/ hybrid capacities and plannings
Status Today - 2018 use sources prefix “ST18”
Expectation/ Goals 2030 use sources prefix “EX30”
Expectation/ Goals 2050 use sources prefix “EX50”
Data sources with prefix and as numbers - please insert full reference into last chapter
Flexible bioenergy / hybrid systems in the power sector (in MW installed)
…and the related electricity provision (in MWh)
Flexible bioenergy/hybrid systems in the heat sector (in MW installed)
…and the related heat provision (in MWh)
Flexible bioenergy/hybrid systems in the biofuels sector (in MW installed)
…and the related biofuel production (in MWh)

118
Examples and industries applying flexibility concepts
Please provide examples of three case studies form your region with high relevance to flexible bioenergy.
1. Please insert your information here.
2. Please insert your information here.
3. Please insert your information here.

1
References: