INTRODUCTION TO BIOENERGY - Taylor & Francis eBooks
51
-
Upload
khangminh22 -
Category
Documents
-
view
0 -
download
0
Transcript of INTRODUCTION TO BIOENERGY - Taylor & Francis eBooks


INTRODUCTION TOBIOENERGY

ENERGY AND THE ENVIRONMENT
SERIES EDITOR
Abbas Ghassemi New Mexico State University
PUBLISHED TITLES
Introduction to BioenergyVaughn Nelson and Kenneth Starcher
Introduction to Renewable Energy, Second EditionVaughn Nelson and Kenneth Starcher
Environmental Impacts of Renewable EnergyFrank R. Spellman
Geothermal Energy: Renewable Energy and the Environment, Second Edition
William E. Glassley
Energy Resources: Availability, Management, and Environmental ImpactsKenneth J. Skipka and Louis Theodore
Finance Policy for Renewable Energy and a Sustainable EnvironmentMichael Curley
Wind Energy: Renewable Energy and the Environment, Second EditionVaughn Nelson
Solar Radiation: Practical Modeling for Renewable Energy ApplicationsDaryl R. Myers
Solar and Infrared Radiation MeasurementsFrank Vignola, Joseph Michalsky, and Thomas Stoffel
Forest-Based Biomass Energy: Concepts and ApplicationsFrank Spellman
Solar Energy: Renewable Energy and the EnvironmentRobert Foster, Majid Ghassemi, Alma Cota,
Jeanette Moore, and Vaughn Nelson
Vaughn Nelson Kenneth Starcher
Boca Raton London New York
CRC Press is an imprint of theTaylor & Francis Group, an informa business
INTRODUCTION TOBIOENERGY

Vaughn Nelson Kenneth Starcher
Boca Raton London New York
CRC Press is an imprint of theTaylor & Francis Group, an informa business
INTRODUCTION TOBIOENERGY

CRC PressTaylor & Francis Group6000 Broken Sound Parkway NW, Suite 300Boca Raton, FL 33487-2742
© 2016 by Taylor & Francis Group, LLCCRC Press is an imprint of Taylor & Francis Group, an Informa business
No claim to original U.S. Government works
Printed on acid-free paperVersion Date: 20160113
International Standard Book Number-13: 978-1-4987-1698-7 (Hardback)
This book contains information obtained from authentic and highly regarded sources. Reasonable efforts have been made to publish reliable data and information, but the author and publisher cannot assume responsibility for the validity of all materials or the consequences of their use. The authors and publishers have attempted to trace the copyright holders of all material reproduced in this publication and apologize to copyright holders if permission to publish in this form has not been obtained. If any copyright material has not been acknowledged please write and let us know so we may rectify in any future reprint.
Except as permitted under U.S. Copyright Law, no part of this book may be reprinted, reproduced, transmit-ted, or utilized in any form by any electronic, mechanical, or other means, now known or hereafter invented, including photocopying, microfilming, and recording, or in any information storage or retrieval system, without written permission from the publishers.
For permission to photocopy or use material electronically from this work, please access www.copyright.com (http://www.copyright.com/) or contact the Copyright Clearance Center, Inc. (CCC), 222 Rosewood Drive, Danvers, MA 01923, 978-750-8400. CCC is a not-for-profit organization that provides licenses and registration for a variety of users. For organizations that have been granted a photocopy license by the CCC, a separate system of payment has been arranged.
Trademark Notice: Product or corporate names may be trademarks or registered trademarks, and are used only for identification and explanation without intent to infringe.
Library of Congress Cataloging‑in‑Publication Data
Names: Nelson, Vaughn, author. | Starcher, Kenneth, author.Title: Introduction to bioenergy / Vaughn Nelson and Kenneth Starcher.Description: Boca Raton : Taylor & Francis, 2016. | Series: Energy and the environment | Includes bibliographical references and index.Identifiers: LCCN 2015049135 | ISBN 9781498716987 (alk. paper)Subjects: LCSH: Biomass energy.Classification: LCC TP339 .N45 2016 | DDC 333.95/39--dc23LC record available at http://lccn.loc.gov/2015049135
Visit the Taylor & Francis Web site athttp://www.taylorandfrancis.com
and the CRC Press Web site athttp://www.crcpress.com

v
ContentsPreface.......................................................................................................................xiAcknowledgments .................................................................................................. xiiiAuthors .....................................................................................................................xv
Chapter 1 Introduction ..........................................................................................1
1.1 Numbers ....................................................................................11.2 Carbon Cycle .............................................................................21.3 Climate Change .........................................................................31.4 Biomass Production ...................................................................41.5 Land Use ....................................................................................51.6 Food and Fiber Production ........................................................71.7 Wood ........................................................................................ 111.8 Sustainable Use........................................................................ 111.9 Bioenergy ................................................................................. 12Problems.. ........................................................................................... 14References .......................................................................................... 15Recommended Resources................................................................... 15
Chapter 2 Energy ................................................................................................ 17
2.1 Introduction ............................................................................. 172.2 Definitions of Energy and Power ............................................. 172.3 Heat .......................................................................................... 192.4 Thermodynamics ..................................................................... 192.5 Energy Dilemma in Light of the Laws of Thermodynamics .....................................................................20
2.5.1 Conservation ...............................................................202.5.2 Efficiency ....................................................................20
2.6 Use of Fossil Fuels ...................................................................232.6.1 Petroleum....................................................................272.6.2 Natural Gas ................................................................292.6.3 Coal ............................................................................30
2.7 Nuclear ..................................................................................... 322.8 Finite Resource ........................................................................ 332.9 Summary ................................................................................. 35Problems.. ...........................................................................................36References .......................................................................................... 38Recommended Resources................................................................... 39

vi Contents
Chapter 3 Sun ...................................................................................................... 41
3.1 Solar Power .............................................................................. 413.2 Electromagnetic Spectrum ...................................................... 41
3.2.1 Visible .........................................................................443.2.2 Blackbody Radiation ..................................................44
3.3 Energy Balance of the Earth ...................................................443.4 Earth–Sun Motion ...................................................................48
3.4.1 Earth Motion .............................................................. 493.4.2 Sun Position ................................................................50
3.5 Insolation ................................................................................. 523.6 Solar Resource ......................................................................... 52Problems.. ........................................................................................... 55References .......................................................................................... 56Recommended Resources................................................................... 56
Chapter 4 Climate Change .................................................................................. 57
4.1 Climate Change-A ................................................................... 584.2 Greenhouse Effect ................................................................... 594.3 Atmospheric Carbon Dioxide ..................................................604.4 Intergovernmental Panel on Climate Change.......................... 624.5 Global Warming ...................................................................... 634.6 Information and Comments .....................................................644.7 Geoengineering .......................................................................664.8 Effect on the Biosphere ........................................................... 67Problems.. ........................................................................................... 67References ..........................................................................................68Recommended Resources...................................................................69
Chapter 5 Plants .................................................................................................. 71
5.1 Plant Basics .............................................................................. 715.2 Biomass Resource .................................................................... 715.3 Valuable Parts of the Plants ..................................................... 74
5.3.1 Food/Fiber or Fuel ......................................................775.3.2 Value or Use Decides What Gets Planted ........................................................................ 78
5.4 Where Can They Grow ........................................................... 785.5 Multi Seasonal ......................................................................... 795.6 Multipurpose ........................................................................... 815.7 Perennial Grasses .................................................................... 82Problems.. ........................................................................................... 83References ..........................................................................................84Recommended Resources...................................................................85

viiContents
Chapter 6 Soil......................................................................................................87
6.1 Formation and Composition ....................................................906.1.1 Parent Material ...........................................................906.1.2 Climate .......................................................................906.1.3 Living Organisms .......................................................946.1.4 Landscape Position .....................................................946.1.5 Time ...........................................................................95
6.2 Soil Use, Preparation ...............................................................956.3 Soil Conservation ....................................................................966.4 Sustainability ...........................................................................97Problems.. ...........................................................................................98References ..........................................................................................99Recommended Resources...................................................................99
Chapter 7 Constraints........................................................................................ 101
7.1 Water ...................................................................................... 1017.2 Agronomy .............................................................................. 1097.3 Biomass Logistics .................................................................. 1107.4 Other Constraints .................................................................. 111
7.4.1 Food Security ........................................................... 1117.4.2 Environmental .......................................................... 1117.4.3 Social ........................................................................ 1147.4.4 Economics ................................................................ 115
Problems.. ......................................................................................... 116References ........................................................................................ 116Recommended Resources................................................................. 117
Chapter 8 Heat and Power ................................................................................. 119
8.1 Introduction ........................................................................... 1198.2 Stoves ..................................................................................... 122
8.2.1 Cook Stoves ..............................................................1248.2.2 Wood Stoves ............................................................. 1258.2.3 Pellet Stoves.............................................................. 126
8.3 Heat and Electricity ............................................................... 1278.3.1 Wood Pellets ............................................................. 1298.3.2 Plantations ................................................................ 1308.3.3 Municipal Solid Waste ............................................. 1318.3.4 Landfill Gas .............................................................. 1338.3.5 Biogas ....................................................................... 133
8.4 Biodigestors ........................................................................... 138Problems.. ......................................................................................... 139References ........................................................................................ 140Recommended Resources................................................................. 141

viii Contents
Chapter 9 Biofuels ............................................................................................. 143
9.1 Ethanol ................................................................................... 1459.1.1 Process ...................................................................... 1489.1.2 Lignocellulosic ......................................................... 149
9.2 Biodiesel ................................................................................ 1509.2.1 Composition ............................................................. 1529.2.2 Process ...................................................................... 1539.2.3 Examples .................................................................. 153
9.3 Microalgae ............................................................................. 1549.4 Biomethane ............................................................................ 1589.5 Biorefinery ............................................................................. 1589.6 Comments .............................................................................. 159Problems.. ......................................................................................... 161References ........................................................................................ 162Recommended Resources................................................................. 163
Chapter 10 Secondary Uses ................................................................................ 165
10.1 Energetics .............................................................................. 16510.2 By-Products ........................................................................... 16610.3 Greenhouse Gas Emissions ................................................... 170Problems.. ......................................................................................... 172References ........................................................................................ 173Recommended Resources................................................................. 174
Chapter 11 Institutional Issues ............................................................................ 175
11.1 United States .......................................................................... 17511.2 World ..................................................................................... 177
11.2.1 Global Bioenergy Partnership .................................. 17711.2.2 Scope ........................................................................ 17811.2.3 UN Environment Programme .................................. 178
11.3 Regulations ............................................................................ 17911.4 Environmental Issues ............................................................ 18011.5 Politics ................................................................................... 18111.6 Incentives ............................................................................... 182
11.6.1 United States ............................................................ 18311.6.1.1 Federal Support ........................................ 18511.6.1.2 State Support ............................................. 18811.6.1.3 Green Power ............................................. 18811.6.1.4 Net Metering ............................................. 189
11.6.2 Other Countries ........................................................ 19111.7 Externalities (Social Costs/Benefits) ..................................... 19111.8 Transmission .......................................................................... 193
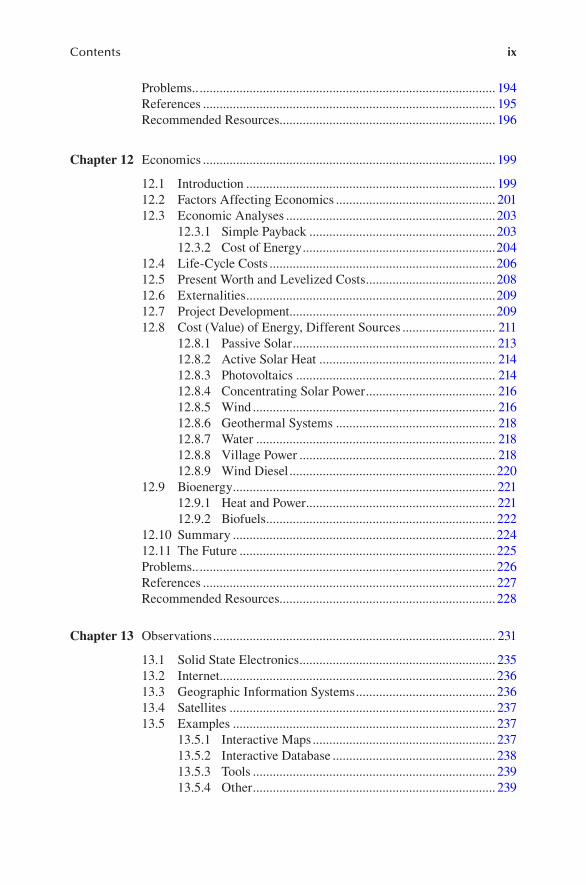
ixContents
Problems.. ......................................................................................... 194References ........................................................................................ 195Recommended Resources................................................................. 196
Chapter 12 Economics ........................................................................................ 199
12.1 Introduction ........................................................................... 19912.2 Factors Affecting Economics ................................................ 20112.3 Economic Analyses ...............................................................203
12.3.1 Simple Payback ........................................................20312.3.2 Cost of Energy ..........................................................204
12.4 Life-Cycle Costs ....................................................................20612.5 Present Worth and Levelized Costs .......................................20812.6 Externalities ...........................................................................20912.7 Project Development ..............................................................20912.8 Cost (Value) of Energy, Different Sources ............................ 211
12.8.1 Passive Solar ............................................................. 21312.8.2 Active Solar Heat ..................................................... 21412.8.3 Photovoltaics ............................................................ 21412.8.4 Concentrating Solar Power ....................................... 21612.8.5 Wind ......................................................................... 21612.8.6 Geothermal Systems ................................................ 21812.8.7 Water ........................................................................ 21812.8.8 Village Power ........................................................... 21812.8.9 Wind Diesel ..............................................................220
12.9 Bioenergy ............................................................................... 22112.9.1 Heat and Power ......................................................... 22112.9.2 Biofuels ..................................................................... 222
12.10 Summary ...............................................................................22412.11 The Future .............................................................................225Problems.. .........................................................................................226References ........................................................................................ 227Recommended Resources.................................................................228
Chapter 13 Observations ..................................................................................... 231
13.1 Solid State Electronics ........................................................... 23513.2 Internet................................................................................... 23613.3 Geographic Information Systems .......................................... 23613.4 Satellites ................................................................................ 23713.5 Examples ............................................................................... 237
13.5.1 Interactive Maps ....................................................... 23713.5.2 Interactive Database ................................................. 23813.5.3 Tools ......................................................................... 23913.5.4 Other ......................................................................... 239
x Contents
13.6 Predictions ............................................................................. 23913.7 Science ...................................................................................24013.8 Authors’ Predictions .............................................................. 24113.9 On the Down Side..................................................................242Problems.. .........................................................................................244References ........................................................................................245Recommended Resources.................................................................245
Appendix ............................................................................................................... 247
Index ...................................................................................................................... 253

xi
PrefaceThe big questions: How do we use science and technology such that spaceship Earth will be a place for all life to exist? How do we address the two major problems of overconsumption and overpopulation? We are citizens of the planet Earth and within your lifetime there will be major decisions regarding the following: energy (includes food), water, minerals, land, environment, and war (which I can state will happen with 99.9% probability). The previous statement on war was written over 30 years ago when Nelson first taught introductory courses on wind energy and solar energy. Since then, the United States has been involved in a number of armed con-flicts, so the prediction of war was easily fulfilled. The armed conflict over resources has already started; Oil War I (Gulf War) and Oil War II (Iraq War). A sustainable energy future primarily fueled by renewable energy is paramount to reduce the pos-sibility of Oil War III over dwindling supplies of petroleum with China supporting one side of the conflict and the United States supporting the other side. This is also the opinion of one of our Chinese colleagues who is working on renewable energy.
We are over 7.4 billion (September 2015) and heading toward 11 billion people and we are all part of an uncontrolled experiment on the effect of human activities on the Earth’s environment. This has led to global problems: climate change due to greenhouse gas emissions, deforestation, collapse of fish stocks due to overfishing, loss of habitat and extinction of species, lack of water resources, expansion of des-erts, degradation of ecosystems due to pollution and fragmentation, and other lesser problems. Thus, we have passed the point of sustainable use of the Earth’s resources. Renewable energy is part of the solution to the problem of finite resources of fossil fuels and the environmental impact from greenhouse gases. Renewable energy is now part of national policies with significant goals of generation of energy within the next decades. This is because there is a large amount of renewable energy in all parts of the world, in contrast to fossil fuels and minerals, it is sustainable, and it reduces greenhouse gas emissions. Renewable energy provided approximately 20% of global energy consumption in 2014, with over half of that due to bioenergy. The use of bio-energy for liquid fuels has grown remarkably as production of ethanol increased from 28.5 × 10⁹ L in 2004 to 94 × 109 L in 2014 and biodiesel increased from 2.4 × 10⁹ L in 2004 to 29.7 × 10⁹ L in 2014. The growth of renewable energy sources for genera-tion of electricity has grown at 20 or more percent per year because the starting point was small for wind and solar energy. At the end of 2014, the installed capacity of wind farms was 360 GW and the installed capacity of PV was 180 GW; in 2014, 59% of new electric plant capacity was from renewables (includes hydro).
The different sources and uses of bioenergy from solid, liquid, gas, and secondary products are covered in this book, along with background on energy and the Sun. The other aspects discussed are climate, plants, soil, and water and how they affect the production of bioenergy. Institutional issues and economics are discussed and observations are the general comments of the authors.
xiii
AcknowledgmentsWe are deeply indebted to colleagues, present and past, at the Alternative Energy Institute (AEI), West Texas A&M University (WTAMU), the Wind Energy Group at the Agricultural Research Service, and the U.S. Department of Agriculture, Bushland, Texas (program terminated in 2013). The students in our classes and the students who have worked at AEI have provided insight and feedback. There are many others who have worked with us at AEI and USDA, especially the numerous international researchers and interns. Thanks to the Instructional Innovation and Technology Laboratory, WTAMU for the computer drawings.
Vaughn wants to express gratitude to his wife Beth, who has put up with him all these years.
Ken credits his wife Madeleine with making him get up each morning and mak-ing it well worthwhile to come home each evening. He has never really had a “job,” but the lifetime of involvement in renewables has been worth all the years of doing it.

xv
AuthorsVaughn Nelson has been involved with renewable energy, primarily wind energy, since the early 1970s. He is the author of three books and four CDs (material essentially equivalent to monographs, for example, Wind Water Pumping), and has published over 50 articles and reports. He has been the principal investigator of numerous grants, and has addressed over 60 workshops and seminars at the local to international level. His primary work has concerned wind resource assessment, edu-cation and training, applied R&D, and rural applications of wind energy. Currently, he is retired from West Texas A&M University (WTAMU). He was the Director of Alternative Energy Institute (AEI) from its inception in 1977 through 2003 and then returned for another year in July 2009. In 2001, he retired as Dean of the Graduate School, Research and Information Technology, WTAMU. He served on State of Texas Committees, most notably the Texas Energy Coordination Council during its 11 years of existence. He has received three awards from the American Wind Energy Association, one of which was the Lifetime Achievement Award in 2003. In 2010, he received an award as a Texas Wind Legend from the Texas Renewable Industries Association, and, in 2013, he received an award for Outstanding Wind Leadership in Education from Wind Powering America, and served on the board of directors for state and national renewable energy organizations. One of the projects was a renewable energy demonstration building at the AEI Wind Test Center. In the series, Energy and the Environment, Dr. Nelson is the author of Wind Energy (2009), 2nd ed. (2013), CRC Press, Introduction to Renewable Energy (2011), CRC Press, and, with Kenneth Starcher, the 2nd ed. (2015), CRC Press.
He has earned the following degrees: PhD in physics, University of Kansas, EdM, Harvard University, and BSE, Kansas State Teachers College, Emporia. He was at the Departamento de Física, Universidad de Oriente, Cumana, Venezuela for two years.
Kenneth Starcher began his college career and involvement with renewables in the same semester, Fall 1976. It led to a BS in physics/computer science at West Texas State University (1980) and then, in 1980–1981, he was at Texas Tech University taking courses in electrical engineering, electronics, and physics. He received an MS in engineering technology at WTAMU (1995), and then took some courses in agricultural economics at WTAMU.
Ken has been a field worker for most of the projects at AEI since 1980. He has been the educational funnel for on-site training and public information for students and public workshops for AEI. He has been a trainer at wind and solar training work-shops locally, nationally, and internationally. He has served as a research technician, research associate, assistant director, director, and associate director (training, edu-cation, and outreach) for AEI over the past 35 years.
Ken served as a board member of the American Wind Energy Association, was on the Executive Board of Class 4 Winds and Renewables, was chosen as the Individual

xvi Authors
Member of the Year for the Texas Renewable Energy Association in 2005, was the small wind educator at the Small Wind Conference in 2010, and awarded an Outstanding Wind Leadership Education Award from Wind Powering America, 2013.
Ken has installed and operated more than 85 different renewable energy systems, ranging in scale from 50 W to 500 kW. He has served as a consultant for wind com-panies in the United States and produced wind resources maps for counties, states, Honduras, and Thailand.

1
1 Introduction
The conversion of solar energy by the fundamental process of photosynthesis is the basis for life. Photosynthesis primarily converts carbon dioxide and water to carbo-hydrates and oxygen and then the heterotrophs consume the primary producers to sustain their lives, through the food chain or food web. Algae, plants, and bacteria in the ocean generate about the same amount of carbohydrates and oxygen as the land plants, due to the high productivity of algae. Chemoautotrophic bacteria are not dependent on photosynthesis as they obtain their energy from chemical reactions, and they are not important for the production and consumption of bioenergy. These bacteria are the primary source of the food chain in vents in the deep oceans, a sig-nificant scientific discovery.
Of course, humans at the top of the food chain are also dependent on biomass for fiber, wood, and energy. In terms of the mass of the Earth, the thin layer of biomass is inconsequential, but it is significant in the regulation of the atmosphere and temperature of the Earth. There are three aspects for biomass: overall biomass (which is essentially steady state; growth, storage, decay), production/consumption of food and fiber and bioenergy. Since dry biomass is mainly carbon, the processes and exchanges (carbon cycle) for the biosphere can be counted in terms of the mass of carbon.
1.1 NUMBERS
Students and those interested in data analysis, estimation of energy production, and the problems are expected to understand elementary math, be able to use spread-sheets, and to estimate or calculate quantities using formulas. You must remember that many of the quantities (e.g., in the next section on the carbon cycle) are esti-mates. Some rough estimates may differ by a factor of 10 or more and you need to refer to the scientific and technical literature for the range or error in the data. Most data have units and we will use the International System of Units (SI) and for some cases English units will be in parenthesis. Tons in this book are metric tons (1000 kg), so be careful to note in the literature whether they are using metric ton, short ton (2000 lbs), or long ton (2400 lbs).
We will use exponents to indicate large and small numbers. The exponent indi-cates how many times the number is multiplied by itself, or how many places the decimal point needs to be moved. Powers of 10 will be very useful in order of mag-nitude problems, which are rough estimates.
1 1 1 1 1
1 1 1 1
3
3 3
0 0 0 0 000
0 0 0 00
= × × =
= =− / .

2 Introduction to Bioenergy
For large and small numbers, we will use powers of 10 and/or prefixes of powers of 1000.
Factor Name Symbol Factor Name Symbol
10−12 pico p 103 kilo K
10−9 nano n 106 mega M
10−6 micro μ 109 giga G
10−3 milli m 1012 tetra T
1 1015 peta P
1018 exa E
Note: There is a discrepancy between the use of billions in the United States (109) and England (1012).
In terms of consumption, production, supply, and demand, estimates are needed and in many cases an order of magnitude (OM) calculation will suffice. By order of magnitude, we mean an answer (one significant or at most two significant digits) to a power of 10. For problems and estimations, the answers cannot be more accurate than the least accurate data input, so significant digits must be used. More informa-tion on exponents, OM calculations, significant digits, and steps for solving problems and presenting results is presented in Appendix A1, Mathematics.
1.2 CARBON CYCLE
The carbon cycle of the Earth (Figure 1.1) is the biochemical exchange between the major reservoirs: atmosphere, biosphere, soil (pedosphere), ocean, burial in sedi-ments (source of fossil fuels), and crust (lithosphere, stored carbon in limestone, and rocks). The exchange between the reservoirs is fairly balanced, however, the rates differ. Humans are increasing the amount of carbon dioxide in the atmosphere in real time; however, the balance rate is hundreds of years between the atmosphere and the oceans. There have been changes of CO2 in the atmosphere due to volcanic activity, temperature of the atmosphere, and of course now the impact of humans due to the burning of fossil fuels, deforestation and agriculture practices, and production of cement. Volcanoes may cause brief cooling due to sulfur dioxide and other particle emissions, which reflect more sunlight, however, the sulfur dioxide lasts only a few years in the atmosphere.
The ocean [1] contains a large reservoir of carbon (38,000 Gt) followed by fossil fuels (1500 Gt), the atmosphere (730 Gt), and crust (100 Pt, limestone is calcium carbonate, CaCO3), however, the exchange rate between the atmosphere and the ocean is low (2 Gt/yr) and the burial rate in sediments is smaller (0.2 Gt/yr). The net transport of carbon into the ocean is around 1.4 Gt/yr. The carbon production due to human activity is around 9 Gt/yr, with combustion of fossil fuels at 7 Gt/yr and deforestation at 2 Gt/yr. The total carbon sink is around 5 Gt/yr due to photosynthe-sis and soils (30%), the oceans (25%), and sediments and rocks (<1%), which leaves the difference of 4 Gt/yr in the atmosphere. So, humans are affecting the carbon cycle, and since there is not enough increase in the carbon sinks of biomass and

3Introduction
oceans, there is an increase of carbon dioxide, a greenhouse gas, in the atmosphere. Note that the ratio of carbon dioxide to carbon is 3.66, and so an emission of 1000 tons of CO2 is equivalent to adding 366 tons of C to the atmosphere.
1.3 CLIMATE CHANGE
Climate change is now the common term since it does not have the same negative or political impact as global warming. Some in industry and some politicians deny that there is global warming and some accept that there is climate change but deny that it is due to humans [2]. Industry maintains that we cannot reduce the production of CO2 because of economics and because the science for CO2 and global warming is not completely certain. Remember that the same comments were said about the ozone problem and addiction to tobacco. A well-funded campaign to deny global warming and to deny that humans are part of the problem has impacted public opinion and the political process as the number of Americans skeptical of global warming increased from 12% in 2001 to 28% in 2010 (25% in 2014).
The U.S. policy under the G.W. Bush administration was in sharp disagreement with that of the other industrialized countries, and the reasons were that it would
FIGURE 1.1 Carbon cycle. Note: Crust reservoir contains 100 Pt. (Adapted from Oak Ridge National Laboratory, https://public.ornl.gov/site/gallery/originals/BioComponents_Carbon.jpg.)

4 Introduction to Bioenergy
cost too much and not enough provisions were made to curtail future emissions from developing countries. An interesting comment by Robert Romer [3] in 1976 was that “human activities do not now have a large effect on the global climate, however, this calculation should not be considered as justification for complacency.” So, within 40 years we are doing an uncontrolled experiment on the atmosphere of the Earth, and now most predictions on global warming and climate change are for problems by 2050–2100 and maybe even catastrophe in the next century unless carbon dioxide emissions to the atmosphere are reduced to 1990 levels. In the United States, the proposed regulations (2014) by the Environmental Projection Agency on emission of carbon dioxide are strongly opposed, especially by the coal industry.
For meteorologists, climate refers to the average of 30 or more years. Of course, the climate has and will change, for example, there was the snowball earth and the very warm earth when the sea level was over 30 m higher than today. Civilization developed in the Holocene, an interglacial period beginning around 10,000 years ago and now we are entering the Anthropocene, the epoch where the impact of humans is noted on a global scale. The results of this uncontrolled experiment will be within physical laws and global warming will affect the climate. The question is at what level will greenhouse gases in the atmosphere result in serious climate impacts. See Chapter 4 for more detailed information on climate change and global warming.
An increase in atmospheric CO2 stimulates photosynthesis and assists plants in dry areas to use groundwater more efficiently. This would increases the biomass and be a carbon sink. However, the amount of increase depends critically on water and nutrient availability. Warmer temperatures will shift growing seasons, regions for crop production, precipitation, and the possible detrimental effects of heat waves. Climate models show 30% or more reduction in precipitation in the subtropics, which means the major deserts will increase in size. Even in wetter areas, extreme storms will increase which will mean more flooding, a negative effect. “Based on many studies covering a wide range of regions and crops, negative impacts of climate change on crop yields have been more common than positive impacts (high confi-dence)” [4, p. 4].
1.4 BIOMASS PRODUCTION
The average estimate of global biomass (1990–2008) is around 600 Gt C. The den-sity of standing phytomass ranges from 5 t/ha for tundra to 1000 t/ha for tropical rain forests, which have three fifths of that phytomass. The density of bacteria in the soil ranges from 10 to 1000 g/m2 and for soil macrofauna the range is 5–15 g/m2. The vertebrate biomass is dominated by domestic animals (primarily cattle, water buffalo, and pigs) with a live weight of around 600 megatons (Mt) or 125 Mt C [5].
Satellites are used to estimate global biomass production for land (54%) and oceans (46%), with the land production (excluding areas with permanent ice cover) around 430 g of carbon/(m2/yr), and for the oceans, production is around 140 g of carbon/(m2/yr). These numbers can be compared to average production per area for different sources of biomass: forests (tropical, temperature), cultivated crops, and microalgae. Gross primary productivity (GPP) is the total amount of new phyto-mass that is photosynthesized during a given time period, and the global GPP is

5Introduction
around 120 Gt/yr of carbon (Gt/yr C). Autotrophic respiration (RA) is reoxidation which limits amount of sunlight converted to plant tissue. The net primary produc-tion (NPP) is equal to GPP—RA. The spatial variability of NPP range from 1000 g/(m2/yr) C in equatorial zones, 400–600 g/(m2/yr) C in temperature mid-latitudes, and less than 300 g/(m2/yr) C in the interior of Asia and Australia along with Siberia and western North America [5].
1.5 LAND USE
Humans have transformed the land of the Earth for permanent fields, plantations, and the use of and the conversion of grasslands and even forests to pasture for ani-mals (Table 1.1). Arable land plus permanent plantations for growing fruit, tea, coffee, cacao, and palms take about 12% of the ice-free surface of the Earth and the pastures and grasslands used by humans comprise another 24% of the area. The area for modern energy infrastructure: mines, refineries, etc. is estimated at 7.5 megahectares (Mha) [5, p. 182].
Since the land area is essentially fixed, the data on land use and cover and how it changes over time are important for developing sustainable polices on use. The Food and Agricultural Organization (FAO) has developed a land cover database with a resolution around 1 km2 [6]. The database shows grassland at 13%; however, humans also use land classified as shrubs and sparse vegetation (Figure 1.2) for animals.
As population has grown, the amount of land converted to crops has grown accord-ingly and farmland more than doubled from 1700 to 1900, with larger increases in the United States (177 Mha in 1850–336 Mha in 1900), Canada, and South America. For those same countries along with Australia and Russia, the amount of farm-land continued to increase from 1900 to 2000, around 300 Mha. A large expansion occurred in Brazil where the tropical savanna (Cerrado) was converted to cropland resulting in an increase by a factor of 30.
The FAO estimate of the amount of forest was 3.4 gigahectares (Gha) for 1990 and it was over 4 Gha for 2010, the difference is mainly due to a new definition of forest cover not an actual increase. In Europe and the eastern part of North America, for-ests were converted to farmland and pastures, however with the higher productivity
TABLE 1.1Estimates of Land Cover for Surface Area of the Earth, GhaLand 13,500
Agricultural 4900
Arable 1400
Permanent plantations 150
Pasture 3350
Forest 4000
Urban 600
Other 4000

6 Introduction to Bioenergy
from the major cereal producing areas, some of this land has converted back to for-est. There has been major deforestation due to conversion to farmland and pastures in the tropics. In the Amazon Basin in Brazil, the estimated forest lost from 1970 to 2014 is around 76 Mha, an area larger than the state of Texas. The state of Rondônia (Figure 1.3) in western Brazil became one of the most deforested areas, an estimated 7 Mha. Image is from NASA site for World of Change [7] and there are global maps about changes of Earth’s climate by month [8].
Wildfires are caused by lightning, however most fires are started by humans and some are continual as flaring of natural gas. NASA has images of active fires by day, 8 day, and month. (http://neo.sci.gsfc.nasa.gov/view.php?datasetId=MOD14A1_M_FIRE.)
Artificialsurfaces, 0.6
Cropland,12.6
Grassland,13.0
Trees, 27.7Shrubs,
9.5 Herbaceousvegetation, 1.4
Sparsevegetation, 7.7
Bare, 15.2
Snow andglaciers, 9.7
Water bodies,2.6
FIGURE 1.2 Land cover, in percentage, for the Earth.
FIGURE 1.3 Deforestation in the Amazon Basin, Rondônia, Brazil. Satellite photo taken in 2012. (Adapted from NASA, World of Change, http://earthobservatory.nasa.gov/Features/WorldOfChange/images/amazon/amazon_deforestation_20120718_lrg.jpg.)

7Introduction
After logging in the tropics cleared debris is generally burned as land is converted for pastures and crops, which increases the carbon dioxide in the atmosphere. Indigenous people use slash and burn for producing food, but because of the small scale this had no impact on the climate.
1.6 FOOD AND FIBER PRODUCTION
It is somewhat difficult to estimate the percentage of biomass for food, fiber, and bioenergy in the developing world as the sources are grown and traded locally. However, for developed countries fairly reliable data are available on food produc-tion and land use is now monitored by satellites. As of 2009 the average food con-sumption was 2800 Cal/day (Cal = 1000 cal) with Europe having an average value of 3370 Cal/day. Most of the information [9] in this section is from the UN FAO with the source of data from the FAO Statistics Division. Information for the European Union is available from Eurostat [10]. Humans use or appropriate around 40% of the NPP of the world. Global crop production has increased by a factor of three over the past 50 years, due to higher yields, more irrigation, and expansion of arable land by 67 Mha (107 Mha increase in developing countries, 40 Mha decrease in developed countries). The World Bank has statistics by country on agricultural land (permanent crops and pastures) and percent of that land which irrigated [11], for example, the percent of agricultural land for China is 55%, India is 60%, and the United States is 45%. Note that there is a major rush to obtain arable land in developing countries by nations, corporations, and others [12,13]. A main aspect of agriculture is the process of maximizing yields by plant and animal breeding, fertilization, and irrigation.
The total global production for food is around 6000 Mt/yr (Figure 1.4) and fiber is around 30 Mt/yr and the land area for food production is 1300 Mha and land area for fiber is 36 Mha. Table 1.2 includes production and land area for countries with large populations. As expected these nine countries are generally the major produc-ers for the different sources of food. If the European Union was treated as a country,
41%
50%
5%
3% 1%
Cereal
Plants
Animals
Fish
Eggs and milk
Cereal, 2476
Plants, 3027
Animals, 296Fish, 148 Eggs and milk, 69
FIGURE 1.4 Food production, Mt, for different sources for year 2010. (From Statistical Yearbook 2013, Part 3 feeding the world, UN FAO. http://www.fao.org/docrep/018/i3107e/i3107e03.pdf.)

8 Introduction to Bioenergy
TAB
LE 1
.2Pr
oduc
tion
of C
rops
for
Wor
ld a
nd C
ount
ries
wit
h La
rge
Popu
lati
ons
(201
0 D
ata)
Land
Cer
eal
Oilc
rop
Puls
eTo
p R
oot
and
Tube
rVe
geta
ble
Suga
rTr
eenu
tFr
uita
Cit
rus
Frui
t
Popu
lati
on(1
06 )A
rea
(Mha
)Pr
o(M
t)La
nd(M
ha)
Pro
(Mt)
Land
(Mha
)Pr
o(M
t)La
nd(M
ha)
Pro
(Mt)
Land
(Mha
)Pr
o(M
t)La
nd(M
ha)
Pro
(Mt)
Land
(Mha
)Pr
o(M
t)La
nd(M
ha)
Pro
(Mt)
Land
(Mha
)Pr
o(M
t)La
nd(M
ha)
Chi
na13
7095
749
890
2828
3.9
2.8
162
9.2
540
23.5
90.
23.
10.
712
211
.324
2.12
Indi
a12
6531
740
210
012
3917
.226
.645
2.2
100
7.3
0.7
1.0
756.
410
1.00
Uni
ted
Stat
es32
095
340
257
1937
2.6
1.4
190.
535
1.1
290.
51.
00.
526
1.1
100.
33
Indo
nesi
a25
019
085
1725
100.
30.
328
1.5
101.
10.
30.
815
0.6
20.
06
Bra
zil
205
852
7519
1425
3.2
3.5
292.
011
0.5
0.2
0.8
392.
321
0.90
Paki
stan
190
8835
131
30.
91.
64
0.2
50.
40.
020.
026
0.7
20.
20
Nig
eria
180
9226
163
83.
43.
083
8.1
121.
80.
70.
310
1.7
30.
74
Ban
glad
esh
160
1550
128
0.5
40.
5
Rus
sia
150
1710
6032
38
1.4
1.0
212.
113
0.8
220.
9
Subt
otal
4090
5174
1633
356
105
158
3340
399
2672
637
602
64
297
2572
5
Res
t of W
orld
3010
8126
864
337
6511
236
3834
927
318
1916
93
85
312
3151
3
Wor
ld71
0013
,300
2497
693
170
270
68.8
78.3
748
53.6
1044
55.6
229
4.7
13.9
9.3
609
5612
38.
75
Not
e:
Bla
nk s
pace
s m
ean
they
are
not
in th
e to
p 20
pro
duce
rs.
a D
oes
not i
nclu
de m
elon
s.

9Introduction
that would reduce the rest of the world values in Table 1.2, as the European Union is a major producer for everything, except for rice and fiber. The European Union pro-duces around 60 Mt/yr of sugar, which would reduce the rest of the world to 109 Mt in the table. Five countries produce around 75% of the fiber (primarily cotton) and India and Bangladesh produce over 90% of the jute.
Production of food and fiber varies due to weather and other factors, so the values will fluctuate from the data presented and in the tables (year 2010 only). Cereals (maize, rice, wheat, and millet) are the most important food source for humans and for 2010 the production was estimated at 2.5 Gt (Figure 1.5), of which around 1 Gt was consumed by humans, 0.75 Gt was animal feed, and the remainder was for biofuels, industry, seed, or wasted. Rice is the primary food for more than half the world’s population. Maize (corn in the United States, wheat is called corn in the United Kingdom) and soybeans are extensively used as animal feed. The most important oil crops (palm oil, soybean, rapeseed, and sunflower seed) account for approximately 75% of the world production, 170 Mt.
The production of meat (296 Mt) is the largest user of agricultural land with pigs being the top product (Table 1.3). Eggs, milk, and processed milk add another 69 Mt. There has been a shift in diet in the developing countries toward the consumption of more meat, dairy products, and eggs. The demand for poultry has increased at about three times the rate of population growth over each of the past five decades. The estimated number of domesticated animals is over 30 × 109 (Table 1.4).
Fish, crustaceans, and mollusks production (Table 1.5) is around 150 Mt/yr with aquaculture from both inland and marine over half the total. Human consumption is around 130 Mt/yr providing around 17% of human animal consumption. Most of the fish not used for direct human consumption is processed into fishmeal and oil for feed, mainly for aquaculture (carnivorous species) and animals, even household pets. Some of the fishmeal is used for fertilizer.
0100200300400500600700
Coarse grainRiceWheat
Africa
North Ameri
ca Asia
EuropeOcea
nia
Latin Ameri
ca an
d Caribbean
FIGURE 1.5 Production of cereals, Mt, by region for 2010. (Adapted from UN Food and Agriculture, http://www.fao.org/home/en/.)

10 Introduction to Bioenergy
There are two negative aspects that must be considered, especially with the expected population increase of 2 × 10⁹ people. The use of grain for the production of ethanol means less food for humans and probably an increase for the price of food. The conversion of grain to meat means a loss of calories due to feed conversion ratio (Table 1.4). There will be different definitions for feed conversion ratio; weight of feed to produce 1 unit of weight, weight of dry feed to produce 1 unit of weight, or kg of feed to produce 1 kg of protein. For example, for milk the ratio is 1.05:1 on dry matter basis and 2:1 on fed basis.
The amount of feed for animals has increased due to animal feeding operations or confined animal feeding industry (feedyard, feedlot, sheds, and coops). For example,
TABLE 1.4Estimated Number of Domesticated Animals and Efficiency; Feed Conversion Ratio
Animal Number Million Conversion Ratio
Cattle 1470 8
Buffaloes 199
Horses, asses, mules 111
Camels 22
Pigs 981 3.5
Sheep and goats 2283
Chicken 21,814 2
Other birds 2184
Salmon 1.2
Milk (dry matter eff) 1.1
Source: Numbers from UN FAO, Global Livestock Production and Health Atlas, 2013 data, http://kids.fao.org/glipha/#.
TABLE 1.3Meat and Dairy Production (2010 Data) for the World
Total(Mt)
Beef and Buffalo(Mt)
Pig(Mt)
Sheep and Goat(Mt)
Poultry(Mt)
Egg and Milk(Mt)
Africa 17.3 6.8 1.2 2.9 4.7 2.7
North America 46.6 12.0 10.2 0.08 19.6 5.8
Latin America and Caribbean
46.3 17.4 6.6 0.4 21.3 7.2
Asia 123.5 16.6 62.1 7.7 34.9 42.6
Europe 56.6 11.0 27.0 1.3 16.2 10.5
Oceania 5.8 2.8 0.5 1.1 1.1 0.3
World 296.1 67.8 109.4 13.5 99.1 69.1
Source: Adapted from UN Food and Agriculture, http://www.fao.org/home/en/.

11Introduction
in the region of the Texas High Plains, Eastern New Mexico, and the Oklahoma Panhandle of the United States, the estimated number per year for confined animal feeding are 2.1 million cattle, 2.4 million pigs, and 350,000 dairy cows. The region is a major producer of irrigated crops from the Ogallala aquifer, but because of the large feeding industry, additional grain is imported from other areas of the United States for animal feeding and for ethanol plants.
1.7 WOOD
In the past, wood was the major source of energy in the world, and even today around 2.6 billion people rely on wood (fuel wood), charcoal, and dung for cooking and heating. Fuel wood consumption has increased 250% since 1960, faster than the growth in population in some countries. For example, in some countries in Africa and Asia, fuel wood and charcoal provide 50% to over 90% of the energy. Also, col-lection of fuel wood is primarily the work of women and children. For example, in the Sahel region of Africa, women walk on average 20 km (12 mi) per day to collect wood, and in the towns, families spend a third of their income on wood or charcoal. However, it takes 10 kg of wood to make 1 kg of charcoal. Dung from cows, buf-falos, yaks, and even camels, is the other major source of energy for heating and cooking in rural areas. In some cases, the fresh manure may be mixed with straw and water, flattened into patties, and dried. Open fires in confined spaces present a major health problem, so efficient stoves save lives and energy; however, the problem for many poor people is the cost of the stoves.
1.8 SUSTAINABLE USE
The negative impact of humans on the environment is significant and to continue on the present path means less availability to harvest the biomass of the Earth. How can food be provided for another 2 × 10⁹ people? We have to have sustainable use of the biosphere and an equitable method of food distribution.
TABLE 1.5Fishery Production for the World and by Region (2010 Data)
Capture Aquaculture
Inland(Mt)
Marine(Mt)
Inland(Mt)
Marine(Mt)
World 11.2 77.4 41.7 18.1
Africa 2.6 5.1 1.3
North America 5.5 0.3 0.3
Latin America and Caribbean 0.5 11.2 0.8 1.1
Asia 7.7 41.0 38.8 14.7
Europe 0.4 13.4 0.5 2.1
Oceania 1.1 0.2
Source: Adapted from UN Food and Agriculture, http://www.fao.org/home/en/.

12 Introduction to Bioenergy
Loss of topsoil by erosion, overgrazing, and deforestation, along with pollution of the air, land, and water, is a major problem. The collection of wood for fuel and for the increased consumption of charcoal leads to deforestation and degradation of the land and in some areas exacerbates the problems of drought and desertification.
The conversion of land for livestock has been a major factor in deforestation in Latin America and the Caribbean and overgrazing in other regions has changed dry and arid land to deserts. Large scale livestock operations and confined animal feeding, mostly in the developed countries are a source of negative environmental effluents. Agriculture also contributes to greenhouse gas emissions.
1.9 BIOENERGY
When people think of renewable energy, most think of solar (photovoltaic), wind, and hydro and do not realize that bioenergy is a major component of renewable energy, even in industrialized countries. Of course, we consume food to obtain the energy for life, however, we will refer to bioenergy as the source or production of energy beyond food, for example, for thermal (heat) energy, power, liquid fuels, and biogas.
Bioenergy shares some of the characteristics of other renewable energy resources. The advantages of renewable energy are sustainable (nondepletable), ubiquitous (found everywhere across the world in contrast to fossil fuels and minerals), and essentially nonpolluting. Note that wind turbines and photovoltaic panels do not need water for the generation of electricity, in contrast to steam plants fired by fossil fuels and nuclear power. Bioenergy has the advantage that the energy is stored in the biomass, so variability is not the same problem as for solar and wind, although there is the variability of growth and harvest by season for some sources.
The disadvantages of renewable energy are variability and low density, which, in general, results in higher initial cost. For bioenergy, the density (energy content per volume) is low and hence it has to be converted to a different form, for example liquid fuel, and in general the moisture content is a problem. For different forms of renewable energy, other disadvantages or perceived problems are odor and effluents from biomass, visual pollution, avian and bat mortality with wind turbines, and brine from geothermal. Wherever a large renewable facility is to be located, there will be perceived and real problems to the local people. For conventional power plants using fossil fuels, for nuclear energy, and even for renewable energy, there is the problem of not in my backyard (NIMBY).
Of course we consume food to obtain the energy for life, however, we will refer to bioenergy as the source or production of energy beyond food, for example, for ther-mal (heat), power, and liquid fuels. In general, around 30% of the primary energy of the world is bioenergy, and in some developing countries, it can be 70%–90%. Even in developed countries, the contribution from bioenergy can reach 20% due to a large forest industry, for example, Sweden, Latvia, and Finland around 25% of the total energy consumption is from bioenergy. In some of the developed countries, the contribution of bioenergy has been increasing.
Asia uses almost 50% of the global bioenergy followed by Africa at 26%, most of it as heat for cooking and space heating, 46 EJ (2011 data). In the European Union,

13Introduction
the bioenergy component of renewable energy is 65% (2012 data), and in the United States, it is 53% (Figure 1.6), around 4% of the total energy consumption. However, the total energy consumption in the United States has decreased from 100 quads while the use of natural gas and renewables has increased and coal has decreased. In the United States, that 53% due to biomass is from wood, biofuels, and waste, both solid and liquid. In the United States, the biomass resource is large (Figure 1.7); however, there are limitations in terms of converting present agricultural crops to bioenergy. For the United States, biomass maps are available by source: crop, forest, primary mill, and secondary mill residues; urban wood waste; and methane from landfills, manure, and wastewater. In some areas of the world, including the United States, fast-growing trees for bioenergy are now a crop. Of course, moisture content will be higher for biomass, so drying or other methods are used to reduce moisture. Note that the moisture content of peat is high.
The major processes for the production, conversion, and use of bioenergy will be covered in later chapters. The energy content and logistics are important factors in determining the economics of bioenergy. For more technical details, Sustainable Bioenergy Production [14] major sections are fundamental of engineering analysis and design of bioenergy production systems, sustainable biomass production and supply logistics, sustainable bioenergy processing, and sustainable biorefinery sys-tems. Genetic engineering will be used to increase yield and efficacy of bioenergy crops for biofuels.
Energetics has to be considered for all energy systems, including bioenergy sys-tems. The terms energy balance, energy payback ratio, or energy ratio are also used. Energetics is the calculation of the energy content of the end product compared to the total energy input to produce that product. If the energetics is small, that energy system should be carefully scrutinized, especially if it receives economic subsidies. Again, it does not matter what the economics (dollars) are because in the final analysis physical laws triumph.
Petroleum36%
Natural gas27%
Coal19%
Nuclear8% Biomass
5%
Hydro3%
Wind2%
Solar0%Geothermal
0%
Other10%
Total 97.6 Quadrillion Btu Total = 9.3 Quadrillion Btu
FIGURE 1.6 Energy and renewable energy consumption in the United States. (Diagram from Energy Information Administration, DOE, 2014.)

14 Introduction to Bioenergy
PROBLEMS
1. What is the global mass of humans? What is the global dry mass? How much carbon is in humans? How does that compare to the amount of ter-restrial carbon in biomass?
2. Population is 7.1 × 10⁹. Assume that the energy needed is 2800 cal/per-son/day. What is the energy needed by people for one year? Use joules in answer.
3. Estimated population increase by 2100 is 2 × 10⁹. How much additional energy per year will be needed? Use joules in answer.
4. Approximately how many hectares of forest in the world have been cleared for crop and pastures from 2000 to 2015?
5. How much land area of the Earth is used for pasture? 6. What is the estimated carbon content for the world for cattle and water buf-
falo? Assume mass of cow=750 kg, mass of buffalo=400 kg. 7. Outside of the crust of the Earth, what is the largest reservoir of carbon,
where? 8. How big is the estimated carbon reservoir for fossil fuels? 9. What are two major problems with deforestation of the Amazon? 10. What is your approximate energy input/day? Use kilocalories. 11. What is the major source of food in the world? See Figure 1.4. 12. What country is the major producer of wheat, maize (corn in the United
States), and rice?
�ousandtons/year>500250–500150–250100–15050–100<50
This map was produced by theNational Renewable Energy Laboratory
This study estimates the biomass resources currently available in theUnited States by county. It includes the following feedstock categories; cropresidues (5 year average 2003–2007), forest and primary mill residues(2007), secondary mill and urban wood waste (2002), methane emissionsfrom landfills (2008), domestic wastewater treatment (2007), and animalmanure (2002). For more information on the data development, please refer tohttp://www.nrel.gov/docs/fy06osti/39181.pdf. Although, the documentcontains the methodology for the develpoment of an older assessment, theinformation is applicable to this assessment as well. The difference is only inthe data’s time period.
FIGURE 1.7 Biomass resources by county for the United States. (Map from NREL, http://www.nrel.gov/biomass.)

15Introduction
13. List the top two countries for the production of oil crops, for vegetables. 14. What percent of fishery production is from aquaculture? Which region or
country has the biggest production? 15. What are two negative aspects of the consumption of more meat by humans? 16. In your opinion, what are the two most important factors for the sustainable
use of the biosphere by humans?
REFERENCES
1. World Ocean Review. 2010. http://worldoceanreview.com/en/. WOR 1, Living with oceans; WOR 2, The future of fish—The fisheries of the future; WOR 3, Marine resources, oppor-tunities and risks. Series published by Maribus. Free, can download or order.
2. N. Oreskes and E. M. Conway. 2011. Merchants of Doubt: How A Handful of Scientists Obscured the Truth on Issues form Tobacco Smoke to Global Warming. Bloomsbury, New York.
3. Robert H. Romer. 1976. Energy, An Introduction to Physics. Freeman, New York. 4. Climate change 2014. Impacts, adaptation, and vulnerability, summary for policy-
makers. 2014. IPPC Working Group II. http://ipcc-wg2.gov/AR5/images/uploads/WG2AR5_SPM_FINAL.pdf.
5. V. Smil. 2013. Harvesting the Biosphere, What we Have Taken from Nature. MIT Press, Cambridge, MA.
6. Global Land Cover Share. 2014. UN Food and Agriculture Organization. http://www.fao.org/uploads/media/glc-share-doc.pdf.
7. NASA, Earth Observatory, World of Change. http://earthobservatory.nasa.gov/Images/?eocn=topnav&eoci=images.
8. NASA, Global Observatory, global maps by month and year, data starting in 2000 to present; aerosol optical depth, aerosol size, carbon monoxide, chlorophyll, cloud frac-tion, fire, land surface temperature, land surface temperature anomaly, net primary productivity, net radiation, sea surface temperature, sea surface temperature anomaly, snow cover, total rainfall, vegetation, water vapor. http://earthobservatory.nasa.gov/GlobalMaps/?eocn=topnav&eoci=globalmaps.
9. Statistical Yearbook 2013. Part 3 feeding the world, UN FAO. http://www.fao.org/docrep/018/i3107e/i3107e03.pdf.
10. European Commission, Eurostat, category: Agriculture, forestry and fisheries. http://epp.eurostat.ec.europa.eu/statistics_explained/index.php/Category:Agriculture,_ forestry_and_fisheries.
11. World Bank. http://data.worldbank.org/indicator/AG.LND.AGRI.ZS/countries. 12. L. Cotula. 2013. The Great African Land Grab? Agricultural Investments and the
Global Food System. Zed Books, London. 13. J.K. Bourne, Jr. 2014. The next breadbasket. Why big corporations are grabbing up land
on the planet’s hungriest continent. Nat. Geo. 226, p. 47. 14. L. Wang, Ed. 2014. Sustainable Bioenergy Production. CRC Press, New York.
RECOMMENDED RESOURCES
Books
C. Hand. 2013. Biomass Energy (Innovative Technologies), Abdo Pub Co. Edina, MN.E. Dahlquist, Ed. 2013. Biomass as Energy Source: Resources, Systems and Applications
(Sustainable Energy Developments). CRC Press, New York.S. Capareda. 2013. Introduction to Biomass Energy Conversions. CRC Press, New York.

16 Introduction to Bioenergy
Links
If all the ice melted. Interactive map, National Geographic. http://ngm.nationalgeographic.com/2013/09/rising-seas/if-ice-melted-map.
NASA, Global Observatory, World of Change: All Images. http://earthobservatory.nasa.gov/Images/category.php?cat_id=1567.

Introduction 1 World Ocean Review. 2010. http://worldoceanreview.com/en/. WOR 1, Living with oceans;WOR 2, The future of fish—The fisheries of the future; WOR 3, Marine resources, opportunitiesand risks. Series published by Maribus. Free, can download or order. 2 N. Oreskes and E. M. Conway . 2011. Merchants of Doubt: How A Handful of ScientistsObscured the Truth on Issues form Tobacco Smoke to Global Warming. Bloomsbury, NewYork. 3 Robert H. Romer. 1976. Energy, An Introduction to Physics. Freeman, New York. 4 Climate change 2014. Impacts, adaptation, and vulnerability, summary for policymakers.2014. IPPC Working Group II. http://ipcc-wg2.gov/AR5/images/uploads/WG2AR5_SPM_FINAL.pdf. 5 V. Smil . 2013. Harvesting the Biosphere, What we Have Taken from Nature. MIT Press,Cambridge, MA. 6 Global Land Cover Share. 2014. UN Food and Agriculture Organization.http://www.fao.org/uploads/media/glc-share-doc.pdf. 7 NASA, Earth Observatory, World of Change.http://earthobservatory.nasa.gov/Images/eocn=topnav&eoci=images. 8 NASA, Global Observatory, global maps by month and year, data starting in 2000 to present;aerosol optical depth, aerosol size, carbon monoxide, chlorophyll, cloud fraction, fire, landsurface temperature, land surface temperature anomaly, net primary productivity, net radiation,sea surface temperature, sea surface temperature anomaly, snow cover, total rainfall,vegetation, water vapor.http://earthobservatory.nasa.gov/GlobalMaps/?eocn=topnav&eoci=globalmaps. 9 Statistical Yearbook 2013. Part 3 feeding the world, UN FAO.http://www.fao.org/docrep/018/i3107e/i3107e03.pdf. 10 European Commission, Eurostat, category: Agriculture, forestry and fisheries.http://epp.eurostat.ec.europa.eu/statistics_explained/index.php/Category:Agriculture,_forestry_and_fisheries. 11 World Bank. http://data.worldbank.org/indicator/AG.LND.AGRI.ZS/countries. 12 L. Cotula . 2013. The Great African Land Grab? Agricultural Investments and the GlobalFood System. Zed Books, London. 13 J.K. Bourne, Jr. 2014. The next breadbasket. Why big corporations are grabbing up land onthe planet's hungriest continent. Nat. Geo. 226, p. 47. 14 L. Wang , Ed. 2014. Sustainable Bioenergy Production. CRC Press, New York. C. Hand . 2013. Biomass Energy (Innovative Technologies), Abdo Pub Co. Edina, MN. E. Dahlquist , Ed. 2013. Biomass as Energy Source: Resources, Systems and Applications(Sustainable Energy Developments). CRC Press, New York. S. Capareda . 2013. Introduction to Biomass Energy Conversions. CRC Press, New York. If all the ice melted. Interactive map, National Geographic.http://ngm.nationalgeographic.com/2013/09/rising-seas/if-ice-melted-map. NASA, Global Observatory, World of Change: All Images.http://earthobservatory.nasa.gov/Images/category.php?cat_id=1567.
Energy 1 K.A. Summer . 1986. The perpetual search for perpetual motion. Am. Heritage Invent.Technol. 58. 2 G. Zorpette . 1999. Waiting for the supercar. Sci. Am. 46. 3 Night sky of Earth. http://antwrp.gsfc.nasa.gov/apod/ap010827.html. 4 A. Ghassemi , Series Ed. 2011. Energy and the environment. Vaughn Nelson , Introduction toRenewable Energy. ( Vaughn Nelson and Kenneth Starcher , 2nd Ed., 2015., Vaughn Nelson ,Wind Energy, 2nd Ed., 2013; R. Foster , M. Ghassemi , and A. Cota . 2010. Solar Energy.William Glassley, Geothermal Energy, 2nd Ed., 2014; CRC Press, New York. 5 Annual Energy Outlook. 2013. http://www.eia.gov/forecasts/aeo/executive_summary.cfm.

6 M.K. Hubbert . 1969. Energy resources. In: Resources and Man. National Academy ofSciences°National Research Council, Report of Committee on Resources and Man, Freeman,San Francisco, pp. 157–242; also in Energy resources of the Earth, Sci. Am., p. 60, 1971. 7 K. S. Deffeyes . 2005. Beyond Oil, The View from Hubbert’s Peak. Hill and Wang, New York. 8 K. S. Deffeyes . 2001. Hubbert’s Peak, The Impending World Oil Shortage. PrincetonUniversity Press, Princeton, NJ. 9 J. Darley . 2004. High Noon for Natural Gas. Chelsea Green, White River Junction, VT. 10 B. Powers . 2012. Cold, Hungry and in the Dark: Exploding the Natural Gas Supply Myth.New Society Publishers, Gabriola Island, BC, Canada. 11 R.W. Bentley . 2002. Global oil and gas depletion: An overview, Energy Policy 189.http://www.oilcrisis.com/bentley/depletionOverview.pdf. 12 M.R. Simmons . 2005. Twilight in the Desert: The Coming Saudi Oil Shock and the WorldEconomy. John Wiley, New Jersey. 13 International Atomic Energy Agency. Power reactor information system, comprehensivedatabase on power reactors in operation, under construction or those being decommissioned.http://www.iaea.org/pris/. Also see nuclear power reactors in the world, Data Series No. 2,2014.Ed. http://www-pub.iaea.org/MTCD/Publications/PDF/rds-2-34_web.pdf. 14 U.S. Energy Information Administration, U.S. Nuclear Generation and Generating Capacity.http://www.eia.gov/nuclear/generation/. 15 Nuclear Energy Institute. http://www.nei.org. 16 EIA/ARI world shale gas and shale oil resource assessment. 2013.http://www.advres.com/pdf/A_EIA_ARI_2013%20World%20Shale%20Gas%20and%20Shale%20Oil%20Resource%20Assessment.pdf. 17 BP statistical review of world energy. 2015. Data Workbook—Statistical Review 2015.http://www.bp.com/en/global/corporate/about-bp/energy-economics/statistical-review-of-world-energy.html. 18 World Energy Council. Data energy resources. http://www.worldenergy.org/data/resources/. 19 M.T. Klare . 2001. Resource Wars: The New Landscape of Global Conflict. MetropolitanBooks, New York. 20 M.T. Klare . 2012. The Race for What’s Left: The Global Scramble for the World’s LastResources. Metropolitan Books, New York. A. McKillop , Ed., with S. Newman . 2005. The Final Energy Crisis. Pluto Press, London. C.J. Campbell . 2005. Oil Crisis. Multi-Science. Essex, UK. J. Goodell . 2006. Big Coal. Houghton Mifflin, Boston. M.T. Klare . 2004. Blood and Oil. Metropolitan Books, New York. T. Hartmann . 1999. The Last Hours of Ancient Sunlight. Three Rivers Press, New York. P. Tertzakian . 2006. A Thousand Barrels A Second. McGraw-Hill, New York. R.L. Garwin and G. Charpak . 2001. Megawatts and Megatons. Knopf, New York. BP statistical review of world energy. 2014. http://www.bp.com/en/global/corporate/about-bp/energy-economics/statistical-review-of-world-energy.html. Earth, a graphic look at the state of the world, a great site for overview on all aspects.http://www.theglobaleducationproject.org/earth/energy-supply.php. Energy Information Administration, U.S. Department of Energy. http://www.eia.doe.gov. TheEIA site contains a lot of information on U.S. and international energy resources andproduction. Reports and data files can be downloaded in both PDF and spreadsheet formats. International Atomic Energy Agency. http://www.iaea.org. International Energy Agency. http://www.eia.org. Peak Oil. http://www.peakoil.com. United Nations. Information on population and projections on population.http://www.un.org/esa/population/unpop.htm. U.S. Census. Information on world population. http://www.census.gov. World Energy Council. Survey of energy resources. 2007.http://www.worldenergy.org/documents/ser2007_final_online_version_1.pdf;http://www.worldenergy.org/publications/survey_of_energy_resources_2007/default.asp. Worldmapper. Shows morphed countries of the world where size depends on topical data, suchas population, oil exports, oil imports, and others. http://www.worldmapper.org.

Sun 1 D. Meadows , J. Randers , and D. Meadows . 2004. Limits to Growth, the 30-year Update.Chelsea Green River Publishing, White River Junction, VT. 2 R. Foster , M. Ghassemi , and A. Cota . 2010. Solar Energy, Renewable Energy and theEnvironment. CRC Press, Boca Raton, Florida, Chapter 2. 3 SoDa: Service energy service for Professionals. 2015. http://www.soda-is.com/eng/index.html. 4 SolarGIS. http://solargis.info/doc/free-solar-radiation-maps-GHI. 5 3Tier, a Vaisala Company.https://www.google.com/maps/d/viewer?mid=zJuaSgXp_WLc.kzhA8d4O7_mk&hl=en. 6 NASA. Atmospheric Science Data Center, surface meteorology and solar energy.http://eosweb.larc.nasa.gov/cgi-bin/sse/sse.cgi?+s01. 7 NREL, RReDC. http://www.nrel.gov/rredc/solar_resource.html. 8 NREL. http://www.nrel.gov/gis/solar.html. NREL, MIDC SOLPOS Calculator. Solar position and intensity from time and place.http://www.nrel.gov/midc/solpos/solpos.html. Sustainable by design, http://www.susdesign.com; shareware, also output tables, SunAngle,SunPosition, Sol path, interactive, http://www.susdesign.com/tools.php.
Climate Change 1 NOAA National Climatic Data Center, Paleoclimatology.http://www.ncdc.noaa.gov/paleo/abrupt/data2.html. 2 N. Oreskes and E.M. Conway . 2010. Merchants of Doubt: How A Handful of ScientistsObscured the Truth on Issues from Tobacco Smoke to Global Warning. Bloomsbury Press,New York. 3 Climate change 2013. The physical science basis, summary for policymakers, technicalsummary and frequently asked questions. 2013. IPPC Working Group I.http://www.climatechange2013.org/images/report/WG1AR5_SummaryVolume_FINAL.pdf. 4 R.H. Romer . 1976. Energy, An Introduction to Physics. Freeman, New York. 5 Intergovernmental Panel on Climate Change. http://www.ipcc.ch/index.htm. 6 Climate change 2014. Impacts, adaptation, and vulnerability, summary for policymakers.2014. IPPC Working Group II. http://ipcc-wg2.gov/AR5/images/uploads/WG2AR5_SPM_FINAL.pdf. 7 Climate change 2014.report. Approved summary for policymakers. 2014. IPPC FifthAssessment Synthesis Report. http://www.ipcc-syr.nl. 8 J. Hansen . 2009. Storms of My Grandchildren, the Truth About the Coming ClimateCatastrophe and Our Last Chance to Save Humanity. Bloomsbury, New York. 9 U.S. EPA factsheet. The Clean Power Plan. http://www.epa.gov/airquality/cpp/fs-cpp-by-the-numbers.pdf. 10 M. Walsh .2015. 2016 candidates weigh in on Clean Power Plan. Yahoo Politics.https://www.yahoo.com/politics/2016-candidates-weigh-in-on-clean-power-plan-125853850086.html. 11 2012. Global Weirdness; Severe Storms, Deadly Heat Waves, Relentless Drought, RisingSeas, and the Weather of the Future. Climate Central, Pantheon Books, New York. Goodsource for high school teachers and students. 12 C. Hamilton . 2013. Earthmasters, the Dawn of the Age of Climate Engineering. YaleUniversity Press, New Haven. 13 Intergovernmental Panel on Climate Change. 2014. Fifth Assessment report.http://www.ipcc.ch. Al Gore . 2007. An Inconvenient Truth: The Crisis of Global Warming. Viking, New York. Climate Change, Evidence & Causes. 2014. National Academy of Sciences and Royal Society,download booklet at http://nas-sites.org/americasclimatechoices/events/a-discussion-on-climate-change-evidence-and-causes/.

D. Jamieson . 2014. Reason in A Dark Time, Why The Struggle Against Climate Change Failedand What It Means for Our Future. Oxford University Press. D.R. Archer . 2011. Global Warming: Understanding the Forecast, 2nd Ed. Wiley, New York. E. Kolbert . 2006. Field Notes from A Catastrophe, Man, Nature, and Climate Change.Bloomsbury, New York. G.L. Foster and E.J. Rohling . 2013. Relationship between sea level and climate forcing by CO2on geological timescales. Proceedings of the National Academy of Sciences.http://www.pnas.org/content/110/4/1209.full. G. Schmidt and J. Wolfe . 2009. Climate Change, Picturing the Science. W.W. Norton, NewYork. J. Lovelock . 2006. The Revenge of Gaia, Earth’s Climate Crisis & The Fate of Humanity.Perseus Book Group, New York. R. Ayers . 2001. How economists have misjudged global warming. World Watch,September/October, 12. S.R. Weart . 2008. The Discovery of Global Warming. Harvard University Press, Boston. T.R. Karl and K.E. Trenbrith . 1999. The human impact on climate. Sic Am, 281(6), 100. T. Flannery . 2006. The Weather Makers, How Man is Changing the Climate and What it Meansfor Life on Earth. Atlantic Monthly Press, New York. Carbon Capture & Storage Association. http://www.ccsassociation.org. Carbon Trust, Reports. http://www.carbontrust.com/resources/reports. D. Biello . 2014. Can carbon capture technology be part of the climate solution?Environment360.http://e360.yale.edu/feature/can_carbon_capture_technology_be_part_of_the_climate_solution/2800/. Environmental Protection Agency. http://www.epa.gov/climatechange/index.html. Global Carbon Atlas, Interactive. http://www.globalcarbonatlas.org/?q=en/content/welcome-carbon-atlas. Global sea level rise map. http://geology.com/sea-level-rise/. Global warming: Early warning signs. http://www.climatehotmap.org. If all the ice melted. Interactive map, National Geographic.http://ngm.nationalgeographic.com/2013/09/rising-seas/if-ice-melted-map. MIT Carbon Capture & Sequestration Technologies. CCS Project Database.http://sequestration.mit.edu/tools/projects/index.html. National Climate Data Center, NOAA. http://www.ncdc.noaa.gov/monitoring-references/faq/global-warming.php. National Snow & Ice Data Center. http://nsidc.org. Part of Cooperative Institute for Research inEnvironmental Sciences, University of Colorado, Boulder. Natural Resources Defense Council. Global warming solutions.http://www.nrdc.org/globalWarming. U.S. Global Change Research Program. http://www.globalchange.gov. Union of Concerned Scientists. Global warming. http://www.ucsusa.org/global_warming.
Plants International Renewable Energy Agency. 2014. Global bioenergy supply and demand projects;a working paper for Remap 2030.http://www.irena.org/remap/IRENA_REmap_2030_Biomass_paper_2014.pdf. Biomass Feedstocks. Oakridge National Laboratory. U.S. DOE, EERE.http://www.energy.gov/eere/bioenergy/biomass-feedstocks. European Biofuels Technology Platform. http://www.biofuelstp.eu. NREL, biomass maps. 2014. http://www.nrel.gov/gis/biomass.html. NREL has someinternational resource assessments. http://www.nrel.gov/international/biomass_resource.html. USDA, NRCS, Plants Database, Alternative Crops. http://plants.usda.gov/alt_crops.html. Filterby geography (includes U.S. territories and protectorates, Canada, Greenland, St. Pierre andMiquelon), some maps with range.

Oklahoma State University, Dept. Plant and Soil Sciences, Switchgrass. http://switch-grass.okstate.edu. Prairie Lands Biomass Project: Home Grown Energy.http://www.iowaswitchgrass.com/home.html. M.J. Williams and J. Douglas . 2011. Technical Note No. 4. Planting and managing giantMiscanthus as a biomass energy crop. NRCS, USDA.http://www.nrcs.usda.gov/Internet/FSE_DOCUMENTS/stelprdb1044768.pdf. eXtension. 2014. Miscanthus (Miscanthus × giganteus) for biofuel production.http://www.extension.org/pages/26625/miscanthus-miscanthus-x-giganteus-for-biofuel-production#.VMKbJlpR-ap. C. Kole , C.P. Joshi , and D.R. Shonnard Eds. 2012. Handbook of Bioenergy Crop Plants. CRCPress, New York. F. Rkossilo-Calle , P. De Groot , S.L. Hemstock , and J. Woods . 2015. The BiomassAssessment Handbook. Routledge, New York. N. El Bassam. 2010. Handbook of Bioenergy Crops: A Complete Reference to Species,Development and Applications. Routledge, New York. ArcGIS, Woods Hole US Biomass.http://www.arcgis.com/home/webmap/viewer.html?webmap=f7535ebbb05b4eaf8ef019dbeb42be19. COMPETE. http://www.compete-bioafrica.net/index.html. Current land use.http://www.compete-bioafrica.net/current_land/current_land.html. Geo-Wiki. Biomass datasets. http://biomass.geo-wiki.org/login.php?menu=home. NREL Bioenergy Atlas, biofuels, biopower. http://maps.nrel.gov/bioenergyatlas/. Lots ofinformation. A. Milbrandt and C. Uriarte . 2012. Bioenergy assessment toolkit. NREL.http://www.nrel.gov/docs/fy13osti/56456.pdf. Arundo Donas as bioenergy crop. http://biothekecologic.com/arundo-k12/?lang=en. Asian Biomass Office. http://www.asiabiomass.jp/english/. Bioenergy Crops. http://bioenergycrops.com/agronomy-and-crops/. BioFuels Journal, http://www.biofuelsjournal.com/. Online magazine with Biodiesel, Ethanol,Biomass and research topics. BioTrade2020plus. http://www.biotrade2020plus.eu. Lignocellulosic biomass. ECN. Database for biomass and waste. https://www.ecn.nl/phyllis2/. Energy for field energy crops-a handbook for energy producers. http://www.aebiom.org/wp-content/uploads/file/Publications/Handbook%20for%20energy%20producers.pdf. European Biofuels Technology Platform. http://www.biofuelstp.eu. European Biomass Association. http://www.aebiom.org. European Biomass Industry Association. http://www.eubia.org. Friends of the Earth Europe. 2014. Burning land: How much land will be required for Europe’sbioenergy?http://www.foeeurope.org/sites/default/files/publications/foee_bioenergy_land_footprint_briefing_may2014.pdf. G. Berndes and C. Tattersall Smith . 2013. Biomass feedstocks for energy markets. IEABioenergy. http://www.ieabioenergytask43.org/wp-content/uploads/2013/09/Task_43_Overview_report_2013.pdf. IEA Bioenergy. http://www.ieabioenergy.com. Iowa State University. Ethanol usage projections & corn balance sheet (mil. Bu).https://www.extension.iastate.edu/agdm/crops/outlook/cornbalancesheet.pdf. M.A. Martinez . 2014. Crops for biofuels. Biothek, biologic fuel.http://biothekecologic.com/energy-crops-for-biofuels/?lang=en. NCAT. Switchgrass as a bioenergy crop. https://attra.ncat.org/attra-pub/summaries/summary.php?pub=311. New dedicated energy crops for solid biofuels. http://www.aebiom.org/wp/wp-content/uploads/file/Publications/Dedicated_energy_crops_for_solid_biofuels_2008_January.pdf. Renewable Energy World. http://www.renewableenergyworld.com/rea/home/bioenergy. Monthlyjournal of all renewable topics, but section of bioenergy.
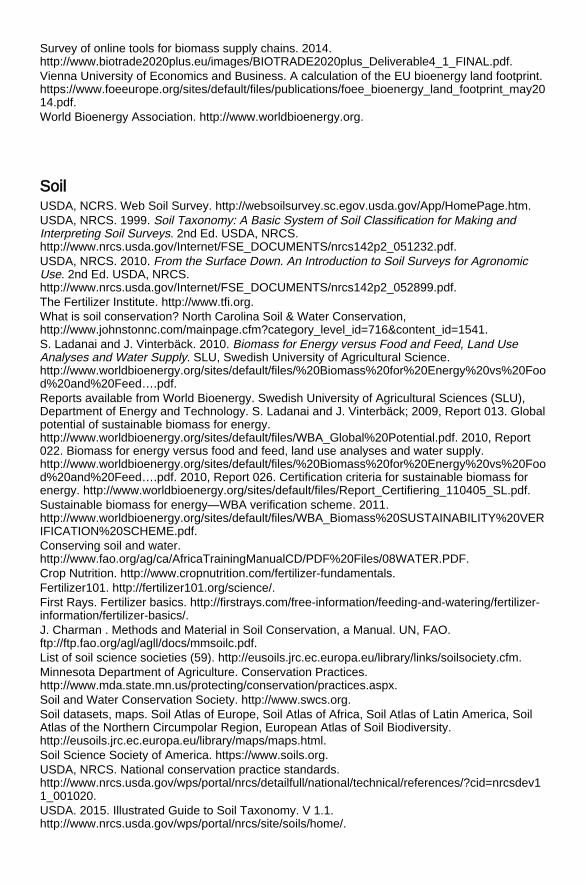
Survey of online tools for biomass supply chains. 2014.http://www.biotrade2020plus.eu/images/BIOTRADE2020plus_Deliverable4_1_FINAL.pdf. Vienna University of Economics and Business. A calculation of the EU bioenergy land footprint.https://www.foeeurope.org/sites/default/files/publications/foee_bioenergy_land_footprint_may2014.pdf. World Bioenergy Association. http://www.worldbioenergy.org.
Soil USDA, NCRS. Web Soil Survey. http://websoilsurvey.sc.egov.usda.gov/App/HomePage.htm. USDA, NRCS. 1999. Soil Taxonomy: A Basic System of Soil Classification for Making andInterpreting Soil Surveys. 2nd Ed. USDA, NRCS.http://www.nrcs.usda.gov/Internet/FSE_DOCUMENTS/nrcs142p2_051232.pdf. USDA, NRCS. 2010. From the Surface Down. An Introduction to Soil Surveys for AgronomicUse. 2nd Ed. USDA, NRCS.http://www.nrcs.usda.gov/Internet/FSE_DOCUMENTS/nrcs142p2_052899.pdf. The Fertilizer Institute. http://www.tfi.org. What is soil conservation? North Carolina Soil & Water Conservation,http://www.johnstonnc.com/mainpage.cfm?category_level_id=716&content_id=1541. S. Ladanai and J. Vinterbäck. 2010. Biomass for Energy versus Food and Feed, Land UseAnalyses and Water Supply. SLU, Swedish University of Agricultural Science.http://www.worldbioenergy.org/sites/default/files/%20Biomass%20for%20Energy%20vs%20Food%20and%20Feed….pdf. Reports available from World Bioenergy. Swedish University of Agricultural Sciences (SLU),Department of Energy and Technology. S. Ladanai and J. Vinterbäck; 2009, Report 013. Globalpotential of sustainable biomass for energy.http://www.worldbioenergy.org/sites/default/files/WBA_Global%20Potential.pdf. 2010, Report022. Biomass for energy versus food and feed, land use analyses and water supply.http://www.worldbioenergy.org/sites/default/files/%20Biomass%20for%20Energy%20vs%20Food%20and%20Feed….pdf. 2010, Report 026. Certification criteria for sustainable biomass forenergy. http://www.worldbioenergy.org/sites/default/files/Report_Certifiering_110405_SL.pdf. Sustainable biomass for energy—WBA verification scheme. 2011.http://www.worldbioenergy.org/sites/default/files/WBA_Biomass%20SUSTAINABILITY%20VERIFICATION%20SCHEME.pdf. Conserving soil and water.http://www.fao.org/ag/ca/AfricaTrainingManualCD/PDF%20Files/08WATER.PDF. Crop Nutrition. http://www.cropnutrition.com/fertilizer-fundamentals. Fertilizer101. http://fertilizer101.org/science/. First Rays. Fertilizer basics. http://firstrays.com/free-information/feeding-and-watering/fertilizer-information/fertilizer-basics/. J. Charman . Methods and Material in Soil Conservation, a Manual. UN, FAO.ftp://ftp.fao.org/agl/agll/docs/mmsoilc.pdf. List of soil science societies (59). http://eusoils.jrc.ec.europa.eu/library/links/soilsociety.cfm. Minnesota Department of Agriculture. Conservation Practices.http://www.mda.state.mn.us/protecting/conservation/practices.aspx. Soil and Water Conservation Society. http://www.swcs.org. Soil datasets, maps. Soil Atlas of Europe, Soil Atlas of Africa, Soil Atlas of Latin America, SoilAtlas of the Northern Circumpolar Region, European Atlas of Soil Biodiversity.http://eusoils.jrc.ec.europa.eu/library/maps/maps.html. Soil Science Society of America. https://www.soils.org. USDA, NRCS. National conservation practice standards.http://www.nrcs.usda.gov/wps/portal/nrcs/detailfull/national/technical/references/?cid=nrcsdev11_001020. USDA. 2015. Illustrated Guide to Soil Taxonomy. V 1.1.http://www.nrcs.usda.gov/wps/portal/nrcs/site/soils/home/.
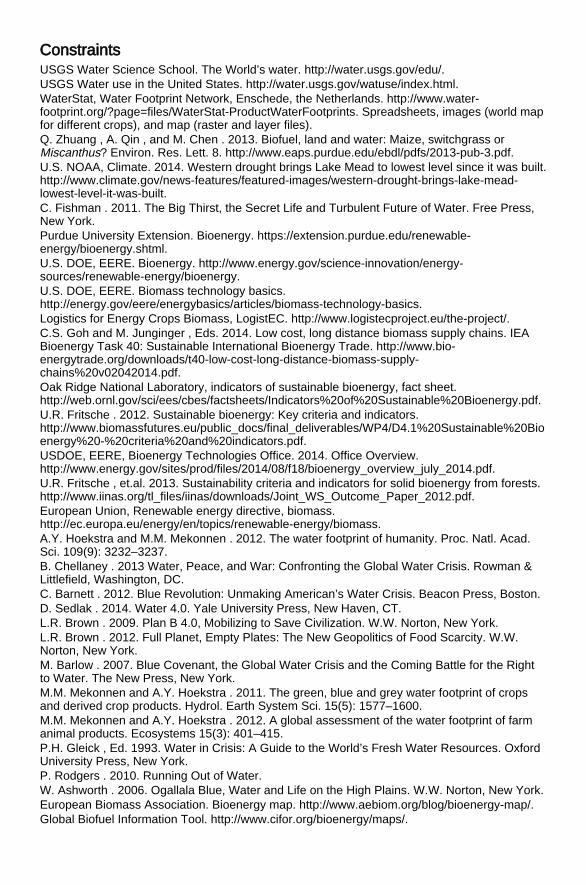
Constraints USGS Water Science School. The World’s water. http://water.usgs.gov/edu/. USGS Water use in the United States. http://water.usgs.gov/watuse/index.html. WaterStat, Water Footprint Network, Enschede, the Netherlands. http://www.water-footprint.org/?page=files/WaterStat-ProductWaterFootprints. Spreadsheets, images (world mapfor different crops), and map (raster and layer files). Q. Zhuang , A. Qin , and M. Chen . 2013. Biofuel, land and water: Maize, switchgrass orMiscanthus? Environ. Res. Lett. 8. http://www.eaps.purdue.edu/ebdl/pdfs/2013-pub-3.pdf. U.S. NOAA, Climate. 2014. Western drought brings Lake Mead to lowest level since it was built.http://www.climate.gov/news-features/featured-images/western-drought-brings-lake-mead-lowest-level-it-was-built. C. Fishman . 2011. The Big Thirst, the Secret Life and Turbulent Future of Water. Free Press,New York. Purdue University Extension. Bioenergy. https://extension.purdue.edu/renewable-energy/bioenergy.shtml. U.S. DOE, EERE. Bioenergy. http://www.energy.gov/science-innovation/energy-sources/renewable-energy/bioenergy. U.S. DOE, EERE. Biomass technology basics.http://energy.gov/eere/energybasics/articles/biomass-technology-basics. Logistics for Energy Crops Biomass, LogistEC. http://www.logistecproject.eu/the-project/. C.S. Goh and M. Junginger , Eds. 2014. Low cost, long distance biomass supply chains. IEABioenergy Task 40: Sustainable International Bioenergy Trade. http://www.bio-energytrade.org/downloads/t40-low-cost-long-distance-biomass-supply-chains%20v02042014.pdf. Oak Ridge National Laboratory, indicators of sustainable bioenergy, fact sheet.http://web.ornl.gov/sci/ees/cbes/factsheets/Indicators%20of%20Sustainable%20Bioenergy.pdf. U.R. Fritsche . 2012. Sustainable bioenergy: Key criteria and indicators.http://www.biomassfutures.eu/public_docs/final_deliverables/WP4/D4.1%20Sustainable%20Bioenergy%20-%20criteria%20and%20indicators.pdf. USDOE, EERE, Bioenergy Technologies Office. 2014. Office Overview.http://www.energy.gov/sites/prod/files/2014/08/f18/bioenergy_overview_july_2014.pdf. U.R. Fritsche , et.al. 2013. Sustainability criteria and indicators for solid bioenergy from forests.http://www.iinas.org/tl_files/iinas/downloads/Joint_WS_Outcome_Paper_2012.pdf. European Union, Renewable energy directive, biomass.http://ec.europa.eu/energy/en/topics/renewable-energy/biomass. A.Y. Hoekstra and M.M. Mekonnen . 2012. The water footprint of humanity. Proc. Natl. Acad.Sci. 109(9): 3232–3237. B. Chellaney . 2013 Water, Peace, and War: Confronting the Global Water Crisis. Rowman &Littlefield, Washington, DC. C. Barnett . 2012. Blue Revolution: Unmaking American’s Water Crisis. Beacon Press, Boston. D. Sedlak . 2014. Water 4.0. Yale University Press, New Haven, CT. L.R. Brown . 2009. Plan B 4.0, Mobilizing to Save Civilization. W.W. Norton, New York. L.R. Brown . 2012. Full Planet, Empty Plates: The New Geopolitics of Food Scarcity. W.W.Norton, New York. M. Barlow . 2007. Blue Covenant, the Global Water Crisis and the Coming Battle for the Rightto Water. The New Press, New York. M.M. Mekonnen and A.Y. Hoekstra . 2011. The green, blue and grey water footprint of cropsand derived crop products. Hydrol. Earth System Sci. 15(5): 1577–1600. M.M. Mekonnen and A.Y. Hoekstra . 2012. A global assessment of the water footprint of farmanimal products. Ecosystems 15(3): 401–415. P.H. Gleick , Ed. 1993. Water in Crisis: A Guide to the World’s Fresh Water Resources. OxfordUniversity Press, New York. P. Rodgers . 2010. Running Out of Water. W. Ashworth . 2006. Ogallala Blue, Water and Life on the High Plains. W.W. Norton, New York. European Biomass Association. Bioenergy map. http://www.aebiom.org/blog/bioenergy-map/. Global Biofuel Information Tool. http://www.cifor.org/bioenergy/maps/.

Nations and even states or regions have interactive maps for bioenergy. The list is notcomprehensive. NREL. BioEnergy Atlas. http://maps.nrel.gov/bioenergyatlas/. Tableau public. 2013. Feedstock supply and price projection UDA baseline projection, millionsof dry tons.http://public.tableausoftware.com/profile/michael.hilliard5790#!/vizhome/FeedstockSupply2013Baseline/NationalBiomass. U.S. DOE. Bioenergy, Knowledge Discovery Framework. https://bioenergykdf.net. U.S. EIA. U.S. Energy Mapping System. http://www.eia.gov/state/maps.cfm?v=Renewable. BEFSCI. 2007. Testing framework for sustainable biomass (“Cramer Criteria”)—TheNetherlands. http://www.fao.org/bioenergy/20536-06144295874a6d8a5da1b5203aa32916a.pdf. Bioenergy and biofuels: Opportunities and constraints.http://www.unep.org/dewa/agassessment/docs/10505_Bioenergy.pdf. Biomass Technology Group. Sustainability criteria & certification Systems for biomassproduction. http://rpd-mohesr.com/uploads/custompages/sustainability_criteria_and_certification_systems.pdf. European Commission, Joint Research Centre, biofuels and bioenergy.https://ec.europa.eu/jrc/en/research-topic/biofuels-and-bioenergy. European Commission. ECOFYS. 2011. Inventory of data sources and methodologies to helpEconomic Operators identify land status relating to EU sustainability criteria for biofuels andbioliquids.http://ec.europa.eu/energy/sites/ener/files/2011_bsc_inventory_of_data__sources_and_methodologies.pdf. Human appropriation of the world’s fresh water supply.http://www.globalchange.umich.edu/globalchange2/current/lectures/freshwater_supply/freshwater.html. International Assessment of Agricultural Knowledge, Science and Technology for Development.http://www.unep.org/dewa/Assessments/Ecosystems/IAASTD/tabid/105853/Default.aspx. International Energy Agency, IEA Bioenergy Task 40. Sustainable International BioenergyTrade—Securing Supply and Demand. http://www.bioenergytrade.org/index.html. M. Khanna et al., Economics of a new generation of energy crops: Implications for land use andgreen house gases. http://are.berkeley.edu/~zilber11/Khanna.pdf. Power Point. National Renewable Energy Laboratory, http://www.nrel.gov/learning/re_biomass.html. Oak Ridge National Laboratory, Center for BioEnergy Sustainability.http://web.ornl.gov/sci/ees/cbes/. U.S. Department of Agriculture, Alternative Farming Systems Information Center,http://afsic.nal.usda.gov/farm-energy-options/bioenergy-and-biofuels. U.S. Energy Information Administration, biomass.http://www.eia.gov/energyexplained/index.cfm?page=biomass_home. Water Footprint. www.waterfootprint.org.
Heat and Power European bioenergy outlook. 2014. European Biomass Association. http://www.aebiom.org. U.S. Energy Information Administration. Total Energy>data 10. Renewable energy>Table 10.1.http://www.eia.gov/beta/MER/index.cfm?tbl=T10.01#/?f=A&start=200001. S.N. Oswalt and W.B. Smith . 2014. U.S. forest resource facts and historical trends.http://www.fia.fs.fed.us/library/brochures/docs/2012/ForestFacts_1952-2012_Metric.pdf. S.N. Oswalt , W.B. Smith , P.D. Miles , and S.A. Pugh . 2012. Forest resources of the UnitedStates, 2012: A technical document supporting the forest service update of the 2010 RPAAssessment. http://www.srs.fs.usda.gov/pubs/gtr/gtr_wo091.pdf. U.S. billion ton update: Biomass supply for a bioenergy and bioproducts industry. 2011. U.S.DOE, EERE. http://www1.eere.energy.gov/bioenergy/pdfs/billion_ton_update.pdf. International Energy Agency. Energy Atlas. http://www.iea.org/statistics/ieaenergyatlas/.

Global Alliance for Clean Cookstoves. http://cleancookstoves.org/home/index.html. Ashden Award Case Study, TIDE, India. Summary.http://www.ashden.org/files/TIDE%20full_0.pdf. TIDE, India. 2008. Energy efficient stoves. http://tide-india.org/energy_efficient_stoves.html. Proyecto Mirador, La Estufa Dos Por Tres (Cookstove two for three).http://www.proyectomirador.org. U.S. Environmental Protection Agency. Burn Wise. http://www.epa.gov/burnwise/. C.S. Goh and M. Junginer Eds. 2012. Low cost, long distance biomass supply chains. IEABioenergy. https://www.svebio.se/sites/default/files/t40-low-cost-long-distance-biomass-supply-chains.pdf. U.S. Environmental Protection Agency. 2007. Biomass combined catalog of heat and powertechnologies. http://www.epa.gov/chp/documents/biomass_chp_catalog.pdf. International Energy Agency, Bioenergy.http://www.iea.org/topics/renewables/subtopics/bioenergy/. P. Lamers et al. 2012. Global wood chip trade for energy. IEA Bioenergy.http://www.bioenergytrade.org/downloads/t40-global-wood-chips-study_final.pdf. K.L. Abt et al. 2015. Effect of policies on pellet production and forests in the U.S. South.http://www.srs.fs.usda.gov/pubs/47281. Municipal solid waste generation, recycling and disposal in the United States: Facts and figuresfor 2012. http://www.epa.gov/epawaste/nonhaz/municipal/index.htm. Environmental Protection Agency. 2013. An overview of landfill gas energy in the United Sates.http://www.epa.gov/lmop/documents/pdfs/overview.pdf. Environmental Protection Agency. Landfill Gas Energy Project Development Handbook.http://www.epa.gov/lmop/publications-tools/handbook.html. Environmental Protection Agency. Project profiles and spreadsheets of projects and suggestedproject sites are available. http://www.epa.gov/lmop/projects-candidates/index.html. H. Terraza and F. Grajales . The landfill gas-to-energy initiative for Latin American and theCaribbean. 2006. World Bank-ESMAPhttps://openknowledge.worldbank.org/bitstream/handle/10986/17972/esm3180PAPER001gastoenergy01PUBLIC1.pdf?sequence=1. World Bank, Projects & Operations. Search landfill gas.http://www.worldbank.org/projects/search?lang=en&searchTerm=landfill%20gas. Opportunities for and benefits of CHP at wastewater treatment facility. Market analysis andlessons from the field. 2011. Environmental Protection Agencyhttp://www.epa.gov/chp/documents/wwtf_opportunities.pdf. European Biogas Association. http://european-biogas.eu. German Energy Agency. Biogaspartner. http://www.biogaspartner.de/en/europe.html. Biogas. http://www.biogas-info.co.uk/maps/index2.htm. UCDavis. 2014. Biodigester turns campus waste into campus energy.http://news.ucdavis.edu/search/news_detail.lasso?id=10849. 4-1 Biogas Systems: Sanitation and Acceptance. http://www.ewb-usa.org/files/2015/05/4-in-1-househould-biogas.pdf. American Biogas Council. Operational biogas systems in the U.S. http://www.americanbio-gascouncil.org/biogas_maps.asp. NREL. RE Atlas. https://maps.nrel.gov. U.S. Energy Information Administration. Energy Mapping System.http://www.eia.gov/state/maps.cfm. An introduction to biodigestors. http://www.slideshare.net/raddieman/an-introduction-to-biodigestors. Bioenergy knowledge discovery framework. The Bioenergy KDF supports the development of asustainable bioenergy industry by providing access to a variety of data sets, publications, andcollaboration and mapping tools that support bioenergy research, analysis, and decisionmaking. In the KDF, users can search for information, contribute data, and use the tools andmap interface to synthesize, analyze, and visualize information in a spatially integrated manner. Biomass heating: A guide to small log and wood pellet systems.http://www.biomassenergycentre.org.uk/pls/portal/docs/PAGE/BEC_TECHNICAL/BEST%20PRACTICE/36491_FOR_BIOMASS_1.PDF.

Candela de la Sota et al. 2014. Effectiveness of improved cookstoves to reduce indoor airpollution in developing countries. The case of the Cassamance Natural Subregion, WesternAfrica. JGEP, 2(1), 1–5. Coppice agroforestry-perennial silviculture for the 21st century. Case studies.http://www.coppiceagroforestry.com/case-studies.html. Ecological sustainability of solid wood bioenergy feedstock supply chains: Local, national andinternational perspectives. 2014. http://www.bioenergytrade.org/downloads/t40-sustainable-wood-energy-2014.pdf. Heating without global warming, market developments and policy considerations for renewableheat. 2014.http://www.iea.org/publications/freepublications/publication/FeaturedInsight_HeatingWithoutGlobalWarming_FINAL.pdf. IEA, World Energy Outlook. 2006. Ch 15 Energy for cooking in developing countries.https://www.iea.org/publications/freepublications/publication/cooking.pdf. J. Schure , G.P. DKamela , A. van der Goes , R. McNally . 2014. An approach to promoteREDD+ compatible wood-fuel value chains. http://cleancookstoves.org/binary-data/RESOURCE/file/000/000/260-1.pdf. K. Kline and M. Coleman . 2010. Woody energy crops in the southeastern United States: Twocenturies of practitioner experience.http://web.ornl.gov/sci/ees/cbes/Publications/Kline_Coleman_%20Woody%20energy%20crops%20in%20the%20southeastern%20United%20States%20Two%20centuries%20of%20practitioner%20experience.pdf. Lawrence Berkeley National Laboratory. Cookstove projects, overview.http://cookstoves.lbl.gov/index.php. Low-Tech Magazine. Well-tended fires outperform modern cooking stoves.http://www.lowtechmagazine.com/2014/06/thermal-efficiency-cooking-stoves.html. R. Miller . 2010. Power point. Woody energy crops.http://florence.uwex.edu/files/2010/05/WoodEnergyCrops.pdf. R.S. Zalesny et al. 2011. Chapter 2. Woody biomass from short rotation energy crops. Am.Chem. Soc. http://www.srs.fs.usda.gov/pubs/ja/2011/ja_2011_zalesny_002.pdf. S. Malla and G.R. Timilsina . Household cooking fuel choice and adoption of improvedcookstoves in developing countries, a review. http://www-wds.worldbank.org/external/default/WDSContentServer/WDSP/IB/2014/06/03/000158349_20140603155910/Rendered/PDF/WPS6903.pdf. T. Bucholz , C.D. Canham , and S.P. Hamburg . 2011. Forest biomass and bioenergy:Opportunities and constraints in the Northeastern United States. Cary Institute of EcosystemStudies.http://www.caryinstitute.org/sites/default/files/public/downloads/news/report_biomass.pdf. Technology roadmap, bioenergy for heat and power.http://www.iea.org/publications/freepublications/publication/2012_Bioenergy_Roadmap_2nd_Edition_WEB.pdf2012. U.S. EPA, Burn Wise, pellet stove fact sheet.http://www.epa.gov/burnwise/pdfs/PelletStoveFS08-04-11.pdf. U.S. Forest Service. Maps of forest types. http://www.fia.fs.fed.us/library/maps/. United Nations Environment Programme. Cook Stove in Kenya, a local solution to a globalproblem.http://www.unep.org/tunza/youth/Actions/CookStoveinKenyaalocalsolutiontoaglobal/tabid/6289/Default.aspx. What is coppicing? http://www.coppice.co.uk. Wood Heat. http://www.woodheat.org/index.php. Woody biomass feedstock for the bioenergy and bioproducts industries. Indiana Department ofNatural Resources. http://www.in.gov/dnr/forestry/files/fo-WoodyBiomass_final.pdf. World Energy Outlook. 2014. Traditional use of biomass database. Xcel spreadsheet.http://www.worldenergyoutlook.org/resources/energydevelopment/energyaccessdatabase/.

Biofuels U.S. Billion-ton update, biomass supply for a bioenergy and bioproducts industry. 2011. U.S.DOE, EERE. http://www1.eere.energy.gov/bioenergy/pdfs/billion_ton_update.pdf. Technology roadmap, biofuels for transport. International Energy Agency. 2011.http://www.iea.org/publications/freepublications/publication/Biofuels_Roadmap_WEB.pdf.Foldout. http://www.iea.org/publications/freepublications/publication/Biofuels_foldout.pdf. L. Wang Ed. 2014. Sustainable Bioenergy Production. CRC Press, New York. G.W. Huber and B.E. Dale . 2009. Grassoline at the pump. Sci Am. 301, 52. How ethanol is made. Renewable Fuels Association. http://www.ethanolrfa.org/pages/how-ethanol-is-made. L.C. Basso , T.O. Basso , and S.N. Rocha . 2011. Chapter 5. Ethanol production in Brazil: Theindustrial process and its impact on yeast fermentation. http://cdn.intechopen.com/pdfs-wm/20058.pdf. Marco Aurelio Dos Santos Bernardes, Ed. Biofuel Production-RecentDevelopments and Prospects. InTech, Croatia. Cellulosic biofuels industry progress report 2012–2013. Advanced ethanol council.http://ethanolrfa.org/page/-/PDFs/AEC%20Cellulosic%20Biofuels%20Industry%20Progress%20Report%202012-2013.pdf?nocdn=1. European Biodiesel Board. Statistics. http://www.ebb-eu.org/stats.php. N. Wahl et al. 2012. Insights into Jatropha projects worldwide.http://english.rvo.nl/sites/default/files/2013/12/2012%20Insights%20into%20Jatropha%20Projects%20Worldwide%20INOCAS.pdf. G. Pahl . 2008. Biodiesel, Growing A New Energy Economy, 2nd Ed. Chelsea Green Pub. Co.,White River Junction, VT. FACT/ADPP Jatropha Project, Mozambique.https://sites.google.com/site/mozambiquejatropha/home. A. Sugrue . 2011. Jatropha oil for local development in Mozambique. Final evaluation report.https://sites.google.com/site/mozambiquejatropha/documents-1/evaluation-end-report. O.A. Valdés Rodriguez , A. Pérez Vaquez , and C. Munoz Gamboa . 2014. Drivers andconsequences of the first Jatropha curcas plantations in Mexico. Sustainability, 6, p. 3732.www.mdpi.com/journal/sustainability. Y. Chisti . 2007. Biodiesel from microalgae, research review paper. Biotechnol Adv. 24, 294. R. Avant . Biomass energy. In: Texas Renewable Energy Resource Assessment, 2008,Chapter 5. Available from Texas State Energy Conservation Office,http://www.seco.cpa.state.tx.us/publications/renewenergy/. Solix BioSystems. http://solixbiosystems.com. European Biofuels Technology Platform. Biogas/Biomethane for use as a transport fuel.http://www.biofuelstp.eu/biogas.html. Energy Vision Publications. http://energy-vision.org/resources/ev-publications/. 2015. The foodcart of the 21st century. U.S. DOE, EERE, integrated biorefineries. http://energy.gov/eere/bioenergy/integrated-biorefineries. F. Cherubini and G. Jungmeier . 2010. LCA of a biorefinery concept producing bioethanol,bioenergy and chemicals from switchgrass. Int. J. Life Cycle Asses. 15, 53. D. Biello . 2010. Biofuel from bacteria. Sci. Am. 302, 21.http://www.scientificamerican.com/article/biofuel-from-bacteria/. K. Miyamoto , Ed. 1997. Chapter 5 Hydrogen production. In Renewable biological systems foralternative sustainable energy production (UN FAO Agricultural Services Bulletin—128),http://www.fao.org/docrep/w7241e/w7241e0g.htm. NREL Hydrogen Production and Delivery.http://www.nrel.gov/hydrogen/proj_production_delivery.html. A. Sarin . 2012. Biodiesel: Production and Properties. Royal Society of Chemistry. Cambridge,UK.

EurObserv’ER. GIS. http://observer.cartajour-online.com/Interface_Standard/[email protected]?NOM_PROJET=barosig&NOM_USER=&Langue=Langue2&Login=OK&Pass=OK. European Biomass Industry Association. European map for renewable energy and energyefficiency. http://www.eubia.org/index.php/projects/ongoing-projects/10-projects/ongoing-projects/66-repowermap. Global Biofuel Information Tool. http://www.cifor.org/bioenergy/maps/. International Energy Agency. Energy Atlas. http://www.iea.org/statistics/ieaenergyatlas/. Natural Resources Defense Council. Renewable energy map.http://www.nrdc.org/energy/renewables/map_geothermal.asp#map. NREL. Bioenergy Atlas, BioFuels and BioPower. http://maps.nrel.gov/bioenergyatlas/. U.S. DOE, EERE. Integrated biorefineries. http://www.energy.gov/eere/bioenergy/integrated-biorefineries. U.S. DOE. Bioenergy, Knowledge Discovery Framework. https://bioenergykdf.net. Advanced Ethanol Council. Lignocellulosic. http://advancedethanol.net. Anaerobic Digestion and Bioresources Association. http://adbioresources.org. Biomass Combined Heat and Power Partnership. http://www.epa.gov/chp/technologies.html. Biomass Energy Data Book. 4th ed. http://cta.ornl.gov/bedb/index.shtml. Biomass Power Association. http://www.usabiomass.org. Biomethane Feed-in Project in Europe. http://www.biogaspartner.de/en/europe/list-of-projects-in-europe.html. Biomethane Injection Projects in Germany. http://www.biogaspartner.de/en/project-map/list-of-projects-in-germany.html. Department of Energy. Energy efficiency and renewable energy, bioenergy program.http://www.energy.gov/eere/bioenergy/bioenergy-technologies-office. EPURE, European Renewable Ethanol. http://www.epure.org. EurObserv’ER Report. 2014. The state of renewable energies in Europe. http://www.energies-renouvelables.org/observ-er/stat_baro/barobilan/barobilan14_EN.pdf. European Biofuels Technology Platform. http://www.biofuelstp.eu/index.html. European Biomass Association. http://www.aebiom.org. Global Renewable Fuels Alliance. http://globalrfa.org. Google images. Many photos of dung for fuel are available. International Energy Agency. http://www.iea.org/topics/renewables/subtopics/bioenergy/. Technology roadmap, biofuels for transport. List of commercial scale anaerobic digestion plants, world. http://www.iea-biogas.net/plant-list.html. National Biodiesel Board. http://www.biodiesel.org. WBA Global Bioenergy Statistics 2014. World Bioenergy Association. http://www.worldbioenergy.org. B. Armantrout and L. Estill . 2015. Backyard Biodiesel: How to Brew Your Own Fuel. NewSociety Publication Gabriola Island, BC, Canada. T. DeMartin . 2014. Biodiesel: Homebrewers Guidebook. CreateSpace Independent Pub.Amazon. A. Patel . 2013. Biodiesel Basics: A Simple Biodiesel Handbook. Bull City Publishing, Durham,NC. W.H. Kemp . 2006. Biodiesel Basics and Beyond: A Comprehensive Guide to Production anduse for the Home and Farm. Aztext Press, Tamworth, Ontario, Canada. D. Sieg . 2012. Making algae biodiesel at home. CreateSpace Independent Pub. Amazon. C. Reddy and G. O’Neal . 2015. Jet fuel from algae? Woods Hole Oceanographic Institution.http://www.whoi.edu/oceanus/feature/jet-fuel-from-algae. National Algae Association. http://cta.ornl.gov/bedb/index.shtml. National Renewable Energy Laboratory. http://www.nrel.gov/biomass/. Oilgae, algae energy. http://www.oilgae.com. Renewable Fuels Association. http://www.ethanolrfa.org. Also has a map of ethanol plantlocations. Annual industry outlook, 2014 plus previous years.http://www.ethanolrfa.org/pages/annual-industry-outlook.

Renewable Natural Gas Coalition. http://www.rngcoalition.com. U.N. Food and Agricultural Organization. http://www.fao.org/statistics/en/. U.S. Energy Information Administration. Renewable and alternative fuels.http://www.eia.gov/renewable/.
Secondary Uses M. Inman . 2013. The true cost of fossil fuels. Sci. Am. 308, April, p. 59. Also available,http://archives.cerium.ca/IMG/pdf/lecturestremblayINMAN_-_The_true_cost_of_fossil_fuels_IMP.pdf. R. Slade and A. Bauen . 2013. Micro-algae cultivation for biofuels: Cost, energy balance,environmental impacts and future prospects. Biomass and Bioenergy, 53, 29.http://www.sciencedirect.com/science/article/pii/S096195341200517X. S.E. Baumert . 2014. Life Cycle Assessment of Carbon and Energy Balances in JatrophaProduction Systems of Burkina Faso. Dissertation, Rheinischen Friedrich-Wilhelms-Universitätzu Bonn, Germany. Renewable Fuels Association. Industry Resources: Co-products.http://ethanolrfa.org/pages/industry-resources-coproducts. J. Giuntoli , A. Agostini , R. Edwards , and L. Mareli . 2014. Solid and gaseous bioenergypathways: input values and GHG emissions. EC JRC Science and Policy Reports.https://ec.europa.eu/jrc/sites/default/files/eur26696_online_final_v3.pdf. IEA Bioenergy Task 38 on Climate Change Effects of Biomass and Bioenergy Systems.http://task38.org. Click on FAQ for Answers to Ten Frequently Asked Questions aboutBioenergy, Carbon Sinks And Their Role in Global Climate Change. Comparing the carbon intensity of corn ethanol and petroleum: Past, present, and future. 2013.Renewable Fuels Assn. http://www.ethanolrfa.org/page/-/rfa-association-site/studies/LCA_Summary.pdf?nocdn=1. D. Ronca . How carbon capture works. How Stuff Works.http://science.howstuffworks.com/environmental/green-science/carbon-capture1.htm. U.S. DOE. Carbon utilization and storage atlas. http://www.natcarbviewer.com. Also see article;http://energy.gov/fe/articles/does-carbon-utilization-and-storage-atlas-estimates-least-2400. Carbon Capture & Sequestration Technologies http://sequestration.mit.edu/tools/projects/. European Biofuels Technology Platform. Biomass with CO2 capture and storage (Bio-CCS).The way forward for Europe. http://www.biofuelstp.eu/downloads/bioccsjtf/EBTP-ZEP-Report-Bio-CCS-The-Way-Forward.pdf. Charles E. Wyman Ed. 2013. Aqueous Pretreatment of Plant Biomass for Biological andChemical Conversion to Fuels and Chemicals. John Wiley & Sons, New York. Roland A. Jansen . 2012 Second Generation Biofuels and Biomass, Essential Guide forInvestors, Scientists and Decision Makers. John Wiley & Sons, New York. Global Carbon Capture and Storage Institute. http://www.globalccsinstitute.com/projects/large-scale-ccs-projects#map. MIT Carbon Capture & Sequestration Technologies. Map of CCS projects worldwide.https://sequestration.mit.edu/tools/projects/ccs_map.html. See Reference 9. A. Bartosová et al. Secondary products from the bioethanol production.http://www.mtf.stuba.sk/docs/internetovy_casopis/2012/sirotiak.pdf. Biofuels Journal. http://www.biofuelsjournal.com. Biomass and Bioenergy. Journal. http://www.journals.elsevier.com/biomass-and-bioenergy. Carbon Capture & Storage Association. http://www.ccsassociation.org. D. Hansen and C.A.S. Hall . 2011. New studies in EROI (energy return on energy invested).Special issue of Sustainability, Vol. 3.http://www.mdpi.com/journal/sustainability/special_issues/New_Studies_EROI. Global CCS Institute. http://www.globalccsinstitute.com. H.P.S. Makkar Ed. 2012. Biofuel co-product is as livestock feed, opportunities and challenges.UN FAO. http://www.fao.org/docrep/016/i3009e/i3009e.pdf.

J. Ye and P. Takahashi . 2007. Biophotolysis-based hydrogen production by cyanobacteria andgreen microalgae. FORMATEX. http://www.formatex.org/microbio/pdf/Pages79-89.pdf. P.R. Adler , S.J. DelGrosso , and W.J. Parton . 2007. Life cycle assessment of net greenhouse-gas flux for bioenergy cropping systems. J. Eco. Soc. Am., 17(3), 675.http://www.esajournals.org/doi/full/10.1890/05-2018. R. Sanders . 2015. UC Berkeley News Center. Electricity from biomass with carbon capturecold make western U.S. carbon-negative. http://news.berkeley.edu/2015/02/09/electricity-from-biomass-with-carbon-capture-could-make-western-u-s-carbon-negative/. S.A. Banwart et al. 2014. The global challenge for soil carbon.http://www.cabi.org/Uploads/CABI/OpenResources/45322/chapter-1.pdf. U.S. DOE. Making algal biofuel production more efficient, less expensive.http://www.energy.gov/eere/articles/making-algal-biofuel-production-more-efficient-less-expensive.
Institutional Issues U.S. EPA. Renewable Fuel Standard. http://www.epa.gov/otaq/fuels/renewablefuels/index.htm. U.S. EPA. Renewable Fuels: Regulations & Standards.http://www.epa.gov/otaq/fuels/renewablefuels/regulations.htm. Oak Ridge National Laboratory. Center for BioEnergy Sustainability.http://web.ornl.gov/sci/ees/cbes/. Oak Ridge National Laboratory. Fact Sheet. Indicators of Sustainable Bioenergy.http://web.ornl.gov/sci/ees/cbes/factsheets/Indicators%20of%20Sustainable%20Bioenergy.pdf. J. Lane . 2014. Biofuels mandates around the World: 2015.http://www.biofuelsdigest.com/bdigest/2014/12/31/biofuels-mandates-around-the-world-2015/. The global bioenergy partnership sustainability indicators for bioenergy, first edition. 2011. UNFAO. Global Bioenergy Partnership.http://www.cleanenergyministerial.org/Portals/2/pdfs/The_GBEP_Sustainability_Indicators_for_Bioenergy_FINAL.pdf. G.M. Souza , R. Victoria , C. Joly , and L. Verdade Eds. 2014. Bioenergy & sustain-ability:Bridging the gaps. (Vol. 72, p. 792) Paris: SCOPE. ISBN 978-2-9545557-0-6. Available online.http://bioenfapesp.org/scopebioenergy/index.php, or http://bioen-fapesp.org/scopebioenergy/index.php/chapters. UN Environment Programme. UNEP Year book 2014: Emerging issues in our globalenvironment. http://www.unep.org/yearbook/2014/. UNEP Year book 2014 emerging issues update. Realizing the potential of citizen science.http://www.unep.org/yearbook/2014/PDF/chapt6.pdf. American Society for Testing and Materials. Screen process.http://www.astm.org/Standards/E1528.htm; Phase I, http://www.astm.org/Standards/E1527.htm;Phase II, http://www.astm.org/Standards/E1903.htm. Renewable Energy Policy Network for the 21st Century, Global Status Report, GSR PolicyTable. http://www.ren21.net/RenewablePolicy/GSRPolicyTable.aspx. REN21 Interactive map. http://www.ren21.net/status-of-renewables/ren21-interactive-map/.Search by topic (economy, policies, renewable energy markets, shares, targets) and technology(bioenergy, geothermal, hydropower, non-technology specific, ocean, solar, wind). H. Scheer . 1998. Energy subsidies—A basic perspective. Proceedings of the 2nd Conferenceon Financing Renewable Energies. Bonn, Germany. Nov. 16–18. International Energy Agency, Has information on energy subsidies plus online database.http://www.worldenergyoutlook.org/resources/energysubsidies/#d.en.8595. A. Ochs , E. Anderson , and R. Rogers . 2012. Fossil Fuel and Renewable Energy Subsidies onthe Rise. Worldwatch Institute, Vital Signs. http://vitalsigns.worldwatch.org/vs-trend/fossil-fuel-and-renewable-energy-subsidies-rise. D. Clement , M. Lehman , J. Hamrin , and R. Wiser . 2005. International tax incentives forrenewable energy: Lessons for public policy, Center for Resource Solutions, draft report.http://www.resource-solutions.org/lib/librarypdfs/IntPolicy-Renewable_Tax_Incentives.pdf.

The Database of State Incentives for Renewable Energy (DSIRE). http://www.dsireusa.org. U.S. Congressional Budget Office. 2013. Testimony on Federal financial support for fuels andenergy technologies. https://www.cbo.gov/publication/43993. Ethanol Laws and Incentives, U.S. DOE, EERE. http://www.afdc.energy.gov/fuels/laws/ETH. U.S. DOE, EERE. Green power markets, renewable energy certificates, REC prices.http://apps3.eere.energy.gov/greenpower/markets/certificates.shtml?page=5. J. Heeter , K. Belyeu , and K. Kuskova-Burns . 2013. Status and trends in the U.S. voluntarygreen power market (2013 data). NREL/TPl-6A20-63052.http://www.nrel.gov/docs/fy15osti/63052.pdf. U.S. DOE, EERE, The Green Power Network. Green Power Markets.http://apps3.eere.energy.gov/greenpower/markets/pricing.shtml?page=0. U.S. DOE, EERE. The Green Power Network. Greenhouse Gas (GHG) Offsets.http://apps3.eere.energy.gov/greenpower/markets/carbon.shtml?page=0. European Biofuels Technology Platform. Biofuels and Sustainability Issues. http://bio-fuelstp.eu/sustainability.html#links. Public Utility Commission of Texas, CREZ Transmission Program Information Center.http://www.texascrezprojects.com. Maps with transmission lines and substations are providedfor the five CREZ zones. Carbon Trading, http://www.carbontradewatch.org/issues.html. Climate Change, http://www.epa.gov/climatechange/index.html. D. Koplow , Fueling global warming, federal subsidies to oil in the United States,http://www.greenpeace.org/usa/Global/usa/report/2007/7/fueling-global-warming.pdf. Database of State Incentives for Renewables &Efficiency, www.dsireusa.org. Excellent site. DOE Energy Efficiency and Renewable Energy, www.eere.energy.gov/. Energy Information Administration. Interactive map for all power plants plus resource potential.http://www.eia.gov/state/maps.cfm?v=Renewable. Fresh Energy, http://www.fresh-energy.org/. Global Subsidies Initiative. https://www.iisd.org/GSI/. Green Power Markets, Net Metering Policies, http://apps3.eere.energy.gov/greenpower/mar-kets/netmetering.shtml. Green Power Network, http://apps3.eere.energy.gov/greenpower/. High Plains Express Transmission Project. 2007.http://www.rmao.com/wtpp/HPX/HPX_Stakeholder_111407.pdf. IRENA, Evaluating renewable energy policy: Review of criteria and indicators for assessment.http://www.irena.org/DocumentDownloads/Publications/Evaluating_RE_Policy.pdf. K. Couture , C. Cory , C. Kreycik , and E. Williams . 2010. A policymaker’s guide to feed-in-tariffpolicy design. NREL/TP-62A-44849. http://www.nrel.gov/docs/fy10osti/44849.pdf. National Electric Transmission Corridor, http://energy.gov/oe/services/electricity-policy-coordination-and-implementation/transmission-planning/national-2. Net metering, green power, air emission, transmission. Sustainable Development. http://sustainabledevelopment.un.org. U.S. DOE, EERE. http://energy.gov/eere/office-energy-efficiency-renewable-energy.
Economics J.H. Wood , G.R. Long , and D.F. Morehouse . 2004. Long-term world oil supply scenarios, thefuture is neither as bleak or rosy as some assert,http://www.eia.gov/pub/oil_gas/petroleum/feature_articles/2004/worldoilsupply/oilsupply04.html. J.M. Cohen , T.C. Schweizer , S.M. Hock , and J.B. Cadogan . 1989. A methodology forcomputing wind turbine cost of electricity using utility economic assumptions. Windpower ‘89Proc. American Wind Energy Association, http://www.awea.org/. R.J. Brown and R.R. Yanuck . 1980. Life Cycle Costing, A Practical Guide for EnergyManagers. Fairmont Press, Atlanta, GA. Vaughn Nelson and Kenneth Starcher . 2015. Introduction to Renewable Energy, 2nd Ed. CRCPress, New York.

Renewable power generation costs in 2012: An overview. 2013. International RenewableEnergy Agency.http://www.irena.org/DocumentDownloads/Publications/Overview_Renewable%20Power%20Generation%20Costs%20in%202012.pdf. D. Feldman et al. 2012. Photovoltaic (PV) pricing trends: Historical, recent, and neat-termprojections. SunShot, DOE/GO-102012-3839. http://www.nrel.gov/docs/fy13o-sti/56776.pdf. L. Stoddard , J. Abiecunas , and R. O’Connell . 2006. Economic, energy, and environmentalbenefits of concentrating solar power in California. http://www.nrel.gov/docs/fy06osti/39291.pdf. Ivanpah Solar Electric Generating System. 2014.http://www.brightsourceenergy.com/stuff/contentmgr/files/0/3eac1a9fed7f13fe4006aaab8c088277/attachment/ivanpah_white_paper_0414.pdf. Renewable energy technologies: Cost analysis series, concentration solar power. 2012.International Renewable Energy Agency. http://costing.irena.org/media/2794/re_tech-nologies_cost_analysis-csp.pdf. R. Wiser and M. Bolinger . 2013 Wind technologies market report. U.S. DOE, EERE.http://emp.lbl.gov/sites/all/files/2013_Wind_Technologies_Market_Report_Final3.pdf. Renewable energy costs, technologies and markets. 2012. International Renewable EnergyAgency. http://costing.irena.org/irena-costing.aspx. A number of charts are available. Micro-hydro power, practical action. http://practicalaction.org/energy. S. Khennas and A. Barnett . 1999. Micro-hydro power: An option for socio-economicdevelopment. http://www.afghaneic.net/renewable/16%20smail.pdf. U.S. Department of Agriculture, Economic Research Service, Bioenergy.http://www.ers.usda.gov/topics/farm-economy/bioenergy.aspx. U.S. Billlion-ton update, biomass supply for a bioenergy and bioproducts industry. 2011. U.S.DOE, EERE. http://www1.eere.energy.gov/bioenergy/pdfs/billion_ton_update.pdf. J.M. Urbanchuk . 2015. Contribution of the ethanol industry to the economy of the United Statesin 2014. ABF Economics. http://ethanolrfa.3cdn.net/94596be2e72251b795_nkm6ii26n.pdf. Iowa State University, Extension and Outreach. Ethanol profitability. http://www.esten-sion.iastate.edu/agdm/energy/xls/d1-10ethanolprofitability.xlsx. OpenEI, Transparent Cost Database. http://en.openei.org/wiki/Transparent_Cost_Database. T. Koizumi . 2014. Biofuels and Food Security, Biofuel Impact on Food Security in Brazil, Asiaand Major Producing Countries. Springer, New York. Fueling global warming subsidies for oil. 2005.http://www.greenpeace.org/usa/Global/usa/report/2007/7/fueling-global-warming.pdf. International Energy Outlook 2014, U.S. Energy Information Administration.http://www.eia.gov/forecasts/ieo/pdf/0484(2014).pdf. The Oil Age Poster. http://www.oilposter.org. Global Subsidies Initiative, iisd. 2013. C. Charles , et.al. Biofuels-At what cost? A review ofcosts and benefits of EU biofuels policies.http://www.iisd.org/gsi/sites/default/files/biofuels_subsidies_eu_review.pdf. NREL, Energy Analysis, Models and Tools. http://www.nrel.gov/analysis/models_tools.html;Energy technology cost and performance data for distributed generation.http://www.nrel.gov/analysis/tech_cost_data.html. U.S. DOE EERE. Interactive: Transparent cost database.http://en.openei.org/wiki/Transparent_Cost_Database. Very informative as gives values; box &whisker or scatter. U.S. Federal Budget, U.S. DOE. http://energy.gov/eere/about-us/office-budget. USDA Foreign Agricultural Service. 2014. Malaysia Biofuels Annual.http://gain.fas.usda.gov/Recent%20GAIN%20Publications/Biofuels%20Annual_Kuala%20Lumpur_Malaysia_6-25-2014.pdf. International Renewable Energy Agency. PV. http://www.irena.org/DocumentDownloads/Publications/RE_Technologies_Cost_Analysis-SOLAR_PV.pdf. CSP. http://costing.irena.org/media/2794/re_technologies_cost_analysis-csp.pdf. Biomass for power generation.http://www.irena.org/DocumentDownloads/Publications/RE_Technologies_Cost_Analysis-BIOMASS.pdf.

Hydropower.http://www.irena.org/DocumentDownloads/Publications/RE_Technologies_Cost_Analysis-HYDROPOWER.pdf. Wind.http://www.irena.org/DocumentDownloads/Publications/RE_Technologies_Cost_Analysis-WIND_POWER.pdf. Technology briefs: Ocean Energy, OTEC, Salinity Gradient, Tidal Energy, Wave Energy.http://www.irena.org/menu/index.aspx?mnu=Subcat&PriMenuID=36&CatID=141&SubcatID=445. The cost of wind energy in the U.S.http://www.awea.org/Resources/Content.aspx?ItemNumber=5547#CostofWindEnergy. NREL. Energy technology cost and performance data for distributed generation. Hasinformation on capital cost, operation and maintenance, utility scale capacity factors, useful life,land use by system technology, and LCOE calculator. http://www.nrel.gov/analy-sis/tech_cost_data.html. U.S. Environmental Protection Agency. Renewable energy cost database.http://www.epa.gov/cleanenergy/energy-resources/renewabledatabase.html. U.S. DOE, EERE. Alternate Fuels Data Center. Fuel Prices.http://www.afdc.energy.gov/fuels/prices.html.
Observations D.J. Suson , L.D. Hewett , J. McCoy , and V. Nelson . 1999. Creating a virtual physicsdepartment. Am. J. Phys. 67(6), 520. MOOC List. https://www.mooc-list.com. A.C. Clarke . 1984. Profiles of the Future, Ch 2 Hazards of Prophecy: The Failure ofImagination. Holt, Rinehart, and Winston, New York. J. Naisbitt . 1982. Megatrends, Ten New Directions Transforming our Lives. Warner, New York. A. Toffler . 1970. Future Shock, Bantam Books, New York. B. Bueno de Mesquita . 2009. The Predictioneer’s Game, Using the Logic of Brazen Self-Interest to See and Shape the Future. Random House, New York. Toward the year 2018. 1968. Edited by the Foreign Policy Association. Cowles EducationCorp., New York. R. Kurzweil . 1999. The Age of Spiritual Machines. Viking, New York. R. Kurzweil . 2005. The Singularity is Near: When Humans Transcend Biology. Viking, NewYork. K.E. Drexler and C. Peterson with G. Pergamit . 1991. Unbounding the Future, theNanotechnology Revolution. William Morrow, New York. Global Footprint Network.http://www.footprintnetwork.org/en/index.php/GFN/page/world_footprint/. J. Hansen . 2009. Storms of My Grandchildren, the Truth About the Coming ClimateCatastrophe and Out Last Chance to Save Humanity. Bloomsbury, New York. Stockholm International Peace Research Institute. http://www.sipri.org. M.T. Klare . 2001. Resources Wars, the New Landscape of Global Conflict. Metropolitan Books,New York. W. Youngquist . 1997. GeoDestinies, The Inevitable Control of Earth Resources Over Nationsand Individuals. National Book, Portland, OR. REN21 Renewable Energy Policy Network for the 21st Century. 2015. Renewables 2014 globalstatus report. http://www.ren21.net/wp-content/uploads/2015/06/GSR2015_KeyFindings_lowres.pdf. K. Börner . 2014. Visual Insights: A Practical Guide to Making Sense of Data. MIT Press,Cambridge, MA. K. Higgs . 2014. Collision Course, Endless Growth on a Finite Planet. MIT Press, Cambridge. P.F. Sale . 2014. Our Dying Planet, An Ecologist’s View of the Crisis We Face. CaliforniaUniversity Press, Los Angles.

M. Lima . 2013. Visual Complexity: Mapping Patterns of Information. Princeton ArchitecturalPress, Princeton, NJ. P. Sabin . 2013. The Bet, Paul Ehrlich, Julian Simon, and our Gamble over Earth’s Future. YaleUniversity Press, New Haven. S. Solomon . 2011. Water: The Epic Struggle for Wealth, Power and Civilization. HarperPerennial, New York. A. Lovins . 2011. Reinventing Fire: Bold Business Solutions for the New Energy Era. ChelseaGreen Publishing, White River Junction, VT. A.Y. Hoestra . 2008. Globalization of Water: Sharing the Planet’s Freshwater Resources. Wiley-Blackwell, New York. Global sea level rise map. http://geology.com/sea-level-rise/. There are a number of books on the future and forecasts. Economists and others disparagedthe Limits to Growth because the dire forecasts did not happen within the time frame predicted.However, the basic tenet is still applicable as there are limits to growth. D.H. Meadows , J. Randers , and D.L. Meadows . 2012. Limits to Growth: The 30-Year Update.Chelsea Green Publishing, White River Junction, VT. J. Randers . 2012. 2052: A Global Forecast for the Next Forty Years. Chelsea GreenPublishing, White River Junction, VT. G. Friedman . 2010. The Next 100 Years: A Forecast for the 21st Century. Anchor, New York.