Management swing potential for bioenergy crops
16
INVITED REVIEW Management swing potential for bioenergy crops SARAH C. DAVIS*, † , ROBERT M. BODDEY ‡ , BRUNO J. R. ALVES ‡ , ANNETTE L. COWIE § , BRENDAN H. GEORGE § , STEPHEN M. OGLE ¶ , PETE SMITH**, MEINE VAN NOORDWIJK †† andMARK T. VAN WIJK ‡‡ ,§§ *Energy Biosciences Institute, University of Illinois, Urbana, IL, USA, †Ohio University, Voinovich School for Leadership and Public Affairs, Athens, OH, USA, ‡EMBRAPA Agrobiologia, Rio de Janeiro, Brazil, §Rural Climate Solutions, University of New England & NSW Department of Primary Industries, Armidale, NSW, Australia, ¶Natural Resource Ecology Laboratory, Colorado State University, Fort Collins, CO, USA, **Institute of Biological and Environmental Sciences, University of Aberdeen, Aberdeen, Scotland, ‡‡Department of Plant Sciences, World Agroforestry Centre, ICRAF, Bogor, Indonesia, ‡‡Wageningen University, Wageningen, The Netherlands, §§International Livestock Research Institute, Nairobi, Kenya Abstract Bioenergy crops are often classified (and subsequently regulated) according to species that have been evaluated as environmentally beneficial or detrimental, but in practice, management decisions rather than species per se can determine the overall environmental impact of a bioenergy production system. Here, we review the green- house gas balance and ‘management swing potential’ of seven different bioenergy cropping systems in temper- ate and tropical regions. Prior land use, harvesting techniques, harvest timing, and fertilization are among the key management considerations that can swing the greenhouse gas balance of bioenergy from positive to nega- tive or the reverse. Although the management swing potential is substantial for many cropping systems, there are some species (e.g., soybean) that have such low bioenergy yield potentials that the environmental impact is unlikely to be reversed by management. High-yielding bioenergy crops (e.g., corn, sugarcane, Miscanthus, and fast-growing tree species), however, can be managed for environmental benefits or losses, suggesting that the bioenergy sector would be better informed by incorporating management-based evaluations into classifications of bioenergy feedstocks. Keywords: biofuel, corn, greenhouse gas, legume trees, mallee, Miscanthus, oil palm, soybean biodiesel, sugarcane, Zea mays Received 26 July 2012 and accepted 2 October 2012 Introduction Bioenergy development is intended, in part, to offset greenhouse gas (GHG) emissions to the atmosphere, but analyses of the GHG balances of bioenergy crops have concluded vastly different magnitudes of this benefit (Davis et al., 2009). Some analyses indicate that the GHG emissions associated with bioenergy agriculture can be significant, thus negating the intended mitigation (e.g., Crutzen et al., 2008; Searchinger et al., 2008), and others find substantial emissions savings compared with fossil fuel use (e.g., Farrell et al., 2006; Adler et al., 2007). These diverse findings are the result of differing assumptions about the geography, system boundaries, inventories, and land use associated with a given bioen- ergy cropping system (Cherubini et al., 2009; Davis et al., 2009), but real differences among species and management regimes are also clearly evident (Melillo et al., 2009; EPA, 2010; Bird et al., 2011). Both the production and environmental impacts of each species considered for bioenergy are dependent on a suite of management decisions. For example, the choice between conventional tillage and minimum till- age in annual cropping systems affects the fossil fuel energy used in farm operations, and can influence the production potential (i.e., yield) and the amount of soil organic carbon (SOC) that is retained (Sisti et al., 2004; Kim & Dale, 2005; Adler et al., 2007; Olchin et al., 2008). For every bioenergy feedstock, there are management considerations that can aid or inhibit the potential of the crop to mitigate GHG emissions. We call this manage- ment effect the ‘management swing potential’, and assert that this is a key component of bioenergy devel- opment that deserves more attention when assessing the sustainability of bioenergy. Here, we first review the traits of biomass species that are generally viewed as favorable for bioenergy. We then explore how these characteristics can be affected by management choices. Finally, we review six case studies, three in temperate regions and three in tropical regions, that exemplify the management swing potential Correspondence: Sarah C. Davis, tel. + 740-593-1000, fax + 740-593- 4398, e-mail [email protected] Published 2013 This article is a US Government work and is in the public domain in the USA 623 GCB Bioenergy (2013) 5, 623–638, doi: 10.1111/gcbb.12042
Transcript of Management swing potential for bioenergy crops

I NV I T ED REV I EW
Management swing potential for bioenergy cropsSARAH C . DAV I S * , † , ROBERT M . BODDEY ‡ , B RUNO J . R . ALVES ‡ , ANNETTE L . COWIE § ,B RENDAN H . GEORGE § , S T EPHEN M . OGLE ¶ , P ETE SM ITH * * , ME INE VAN NOORDWI JK † †
and MARK T. VAN WIJK‡‡ , §§
*Energy Biosciences Institute, University of Illinois, Urbana, IL, USA, †Ohio University, Voinovich School for Leadership and
Public Affairs, Athens, OH, USA, ‡EMBRAPA Agrobiologia, Rio de Janeiro, Brazil, §Rural Climate Solutions, University of
New England & NSW Department of Primary Industries, Armidale, NSW, Australia, ¶Natural Resource Ecology Laboratory,
Colorado State University, Fort Collins, CO, USA, **Institute of Biological and Environmental Sciences, University of Aberdeen,
Aberdeen, Scotland, ‡‡Department of Plant Sciences, World Agroforestry Centre, ICRAF, Bogor, Indonesia, ‡‡Wageningen
University, Wageningen, The Netherlands, §§International Livestock Research Institute, Nairobi, Kenya
Abstract
Bioenergy crops are often classified (and subsequently regulated) according to species that have been evaluated
as environmentally beneficial or detrimental, but in practice, management decisions rather than species per se
can determine the overall environmental impact of a bioenergy production system. Here, we review the green-
house gas balance and ‘management swing potential’ of seven different bioenergy cropping systems in temper-
ate and tropical regions. Prior land use, harvesting techniques, harvest timing, and fertilization are among the
key management considerations that can swing the greenhouse gas balance of bioenergy from positive to nega-tive or the reverse. Although the management swing potential is substantial for many cropping systems, there
are some species (e.g., soybean) that have such low bioenergy yield potentials that the environmental impact is
unlikely to be reversed by management. High-yielding bioenergy crops (e.g., corn, sugarcane, Miscanthus, andfast-growing tree species), however, can be managed for environmental benefits or losses, suggesting that the
bioenergy sector would be better informed by incorporating management-based evaluations into classifications
of bioenergy feedstocks.
Keywords: biofuel, corn, greenhouse gas, legume trees, mallee, Miscanthus, oil palm, soybean biodiesel, sugarcane, Zea mays
Received 26 July 2012 and accepted 2 October 2012
Introduction
Bioenergy development is intended, in part, to offset
greenhouse gas (GHG) emissions to the atmosphere, but
analyses of the GHG balances of bioenergy crops have
concluded vastly different magnitudes of this benefit
(Davis et al., 2009). Some analyses indicate that the
GHG emissions associated with bioenergy agriculture
can be significant, thus negating the intended mitigation
(e.g., Crutzen et al., 2008; Searchinger et al., 2008), and
others find substantial emissions savings compared
with fossil fuel use (e.g., Farrell et al., 2006; Adler et al.,
2007). These diverse findings are the result of differing
assumptions about the geography, system boundaries,
inventories, and land use associated with a given bioen-
ergy cropping system (Cherubini et al., 2009; Davis
et al., 2009), but real differences among species and
management regimes are also clearly evident (Melillo
et al., 2009; EPA, 2010; Bird et al., 2011).
Both the production and environmental impacts of
each species considered for bioenergy are dependent on
a suite of management decisions. For example, the
choice between conventional tillage and minimum till-
age in annual cropping systems affects the fossil fuel
energy used in farm operations, and can influence the
production potential (i.e., yield) and the amount of soil
organic carbon (SOC) that is retained (Sisti et al., 2004;
Kim & Dale, 2005; Adler et al., 2007; Olchin et al., 2008).
For every bioenergy feedstock, there are management
considerations that can aid or inhibit the potential of the
crop to mitigate GHG emissions. We call this manage-
ment effect the ‘management swing potential’, and
assert that this is a key component of bioenergy devel-
opment that deserves more attention when assessing
the sustainability of bioenergy.
Here, we first review the traits of biomass species that
are generally viewed as favorable for bioenergy. We
then explore how these characteristics can be affected
by management choices. Finally, we review six case
studies, three in temperate regions and three in tropical
regions, that exemplify the management swing potentialCorrespondence: Sarah C. Davis, tel. + 740-593-1000, fax + 740-593-
4398, e-mail [email protected]
Published 2013
This article is a US Government work and is in the public domain in the USA 623
GCB Bioenergy (2013) 5, 623–638, doi: 10.1111/gcbb.12042

for a diverse range of bioenergy cropping systems, and
then explore one case study where a management
swing potential was not evident.
Favorable traits of candidate bioenergy crop species
Differences among species in potential benefits for GHG
mitigation have become a prominent topic of debate in
both scientific literature and policy decisions that
address the impact of bioenergy crops (Heaton et al.,
2008a; EPA, 2010; Hertel et al., 2010; Davis et al., 2012).
The GHG emissions of a bioenergy production chain
depend in part on species choice because some species
have greater physiological limitations and require more
intensive management (with greater inputs) than others.
Fertilization requirements, for example, can be an
important determinant of GHG emissions in the form of
N2O (e.g., Smeets et al., 2009). Some species also inher-
ently have a greater potential to sequester SOC than
others (Sartori et al., 2006; Anderson-Teixeira et al., 2009;
Davis et al., 2012).
As the knowledge of bioenergy crop alternatives
mounts, it has become evident that there are general-
ized traits common to many of the species that are
viewed as the most viable and renewable options for
bioenergy. The primary characteristic that maximizes
energy yield is biomass production; very simply,
high-yielding crops produce more biomass that can be
used for solid or liquid fuel. Plant yield potentials
vary by region; thus, ‘high yield’ is best defined rela-
tive to other crops that would grow in similar condi-
tions. Greater biomass yields result in a smaller land
footprint per unit of energy product. In addition to
high yields, the following traits are also favorable for
bioenergy:
� Low input requirements
Biomass sources that require low amounts of fertilizer,
herbicide, pesticide, farm machinery, and irrigation
reduce the energy inputs and GHG costs of agricultural
production.
� Low soil emissions
Crops that inherently have low rates of decomposition
and denitrification that contribute to GHG emissions
have a lower environmental impact.
� Low cost
Crops that can be grown at a low cost increase the profit
margin of the biomass used for bioenergy and reduce the
risk associated with investment in bioenergy production.
� Easy establishment
The ease with which land can be prepared for a bioener-
gy crop can substantially affect the environmental
impact of that crop. If land preparation, farm equipment
and machinery, labor, and establishment time of a crop
are all minimal, there is a greater likelihood of optimiz-
ing yield and minimizing environmental impact
(through energy use, GHG emissions, erosion, nutrient
loss, and soil disturbance). Crops that are well under-
stood and already widely produced (e.g., corn in the
United States) have been adopted quickly for bioenergy
because there was less risk in the establishment phase
than there would be for a new crop.
� Tolerance of extreme and/or variable environments
Plant tolerance to extreme or variable environmental
conditions reduces the risk of yield losses. Plants that
can tolerate drought, for example, can potentially be
grown in regions where other crops cannot, thus reduc-
ing land competition. Other plants can tolerate extreme
temperature fluctuations (e.g., frost tolerance) and there-
fore carry less risk of crop damage that can lead to yield
and quality losses.
� High nutrient-use efficiency (NUE) and/or water-useefficiency (WUE)
Crops that are highly efficient at recycling nutrients or
use less water per unit of production are less likely to
require fertilizer or irrigation, and thus reduce cost,
energy requirements, and GHG emissions per unit of
biomass. A specific consideration is the nutrient con-
tent of the harvested biomass (high in the case of
fruits or seeds, lower in the case of vegetative
parts, lowest where starch-rich storage tissues are
harvested).
� Ecosystem service provisions
Crop systems that retain C and other nutrients; pro-
vide habitat for wildlife; or improve soil, air, and/or
water quality by definition reduce environmental
impacts by maintaining or increasing ecosystem
services.
� Coproducts
Bioenergy crops that yield coproducts or by-products
from harvest and/or processing biomass can enhance
profitability, and also provide environmental benefits
by reducing the energy that is required to generate the
product through an independent production chain. For
Published 2013
This article is a US Government work and is in the public domain in the USA, GCB Bioenergy, 5, 623–638
624 S . C. DAVIS et al.

example, bagasse that is a coproduct of sugarcane pro-
cessing for biofuel is often used for heat and power in
fuel conversion plants. Without this coproduct, heat
and power would have to be generated from another
source.
There are few bioenergy crops that have all of the
characteristics described above, but a cropping system
that is high yielding for a given region and inherently
has a combination of any of these traits is more likely to
emerge as a suitable bioenergy candidate than one that
lacks most of these qualities. Examples of crops that are
already in use or heavily researched for bioenergy
are provided in Table 1 with relevant characteristics
identified.
Many policies that govern bioenergy have been
decided based on evaluations of the environmental
costs and benefits associated with species that are pro-
posed or currently in use for bioenergy (e.g., RFS2;
EPA, 2010). There are fewer policy delineations that are
based on the characteristics of cropping systems alone.
While species designations are easily transferable cate-
gories, the characteristics of management strategies may
prove to be more important metrics for classifying bio-
energy alternatives.
In contrast to the species-based classification that
has been adopted in bioenergy legislation, the forestry
sector has produced standards that guide management
and harvesting practices (e.g., Forest Stewardship
Council, 2010; Manomet Center for Conservation Sci-
ences, 2010). One key consequence of this focus on
management was an awareness of the significant
potential for deforestation to contribute to C emissions
or, inversely, the potential for managed forests to accu-
mulate C. Policies that govern the bioenergy sector
might benefit from emulating the forestry sector regu-
lations that focus on management instead of categoriz-
ing crops by species.
Our synthesis of the literature provides estimates for
the effects of management on GHG emissions, but these
estimates are constrained by assumptions that will only
be overcome with additional measurements in bioener-
gy cropping systems as they grow across the global
landscape. Effects on SOC will be reviewed in many of
the case studies included here because increasing SOC
can result in greater sequestration of atmospheric CO2,
but the uncertainty associated with estimated changes
in SOC must be acknowledged. This uncertainty is dis-
cussed in detail in a case study of palm oil, but similar
biases apply to other cropping systems as well.
How can management increase or decrease the
environmental impact of a crop?
Management choices can define the characteristics of a
cropping system as much as species differences. Each of
the traits that were outlined in the previous section
either dictates management needs or is determined by a
management choice. For example, a crop that has lower
NUE may require greater N fertilization to achieve
yields similar to that of a crop with high NUE. Nitrogen
fertilizer may be a necessity for the survival of the plant,
but in some cases fertilization is a management choice
that maximizes the crop yield while potentially compro-
mising other environmental benefits (e.g., Renouf et al.,
2008).
Management affects the viability of cropping systems
for bioenergy through feedbacks to the traits defined
above. Management choices occur at different spatial
scales; some choices are made at the regional scale, such
as whether a forest can be cleared for agriculture,
whereas others, such as crop husbandry practices, are
made at the field scale. Some examples of management
choices that are relevant at both scales are as follow:
� Previous land use at site of crop establishment
If the time-averaged C stock of the bioenergy produc-
tion system, above- and belowground, is greater than
Table 1 Characteristics of bioenergy crops generally associated with net environmental benefits
Crop
High
yield
Low
input
Low
emission
Low
cost
Easily
established Tolerant
High
NUE
Ecosystem
services Coproduct
Corn grain ✓ ✓ ✓ ✓
Perennial grasses ✓ ✓ ✓ ✓ ✓ ✓
Oil palm ✓ ✓ ✓
Rapeseed
Residues ✓ ✓ ✓ ✓ ✓
Soybean ✓ ✓ ✓ ✓ ✓ ✓
Sugarcane ✓ ✓ ✓ ✓ ✓ ✓ ✓
Waste ✓ ✓ ✓ ✓ ✓ ✓
Wheat ✓ ✓ ✓ ✓
Trees ✓ ✓ ✓ ✓ ✓ ✓ ✓
Published 2013
This article is a US Government work and is in the public domain in the USA, GCB Bioenergy, 5, 623–638
MANAGEMENT SWING POTENTIAL 625

that of the preceding land use, the first production cycle
(s) (depending on the accounting rules) can be credited
with C sequestration; if it is lower, a ‘C debt’ needs to
be repaid by GHG emission savings from bioenergy
use. Negligible or negative C debts avoid pay-back
times incurred by land-use change to biofuel crops.
� Biomass removal
The amount of biomass removed is directly related to
the yield of a cropping system (Dale et al., 2011), but
also influences the subsequent input requirements, har-
vesting energy requirement, emissions from the system,
ecosystem services, and cobenefits that can be produced.
� Drainage
The way soil is managed to control plant available
water can have a very strong effect on yield, emissions,
and ecosystem services. Installation of effective drainage
can determine the ease with which a particular crop-
ping system can be established.
� Tillage
Soil disturbance caused by tillage affects the soil C
stocks as well as the fossil fuel energy input required
(due to the energy demand of mechanized tillage).
� Cover or rotating crops
Cover crops can yield coproducts while also affecting
soil C sequestration and emissions associated with soil
respiration during fallow periods, wildlife habitat, soil
quality, and erosion. Rotating crops can also affect these
traits, with the greatest influence often on soil quality.
� Nutrient management
The amount and timing of fertilizer or irrigation water
that is applied to cropping systems can have a strong
influence on emissions (especially N2O emissions,
where complex interactions with stubble retention have
been described (Wang et al., 2011)).
� Harvest frequency and intensity
The timing and intensity of harvest can affect yields,
nutrient use, soil quality, emissions, and cobenefits.
Timing is most applicable to nonannual cropping sys-
tems that can be harvested at different intervals or in
different seasons. Intensity is applicable to the amount
of disturbance required at a location and is inversely
related to the land area required for production.
It is clear that management decisions can affect the
characteristics of a bioenergy cropping system to either
enhance the biomass production system so that it
becomes favorable for bioenergy or inhibit the environ-
mental benefits of biomass production. In this way,
management has the ability to ‘swing’ the traits of a
cropping system toward net benefits (e.g., reduction in
GHG emissions), or toward environmental impacts (e.g.,
increased GHG emissions).
Following, we present case studies of diverse bioener-
gy cropping systems to demonstrate the magnitude of
the management swing potential for different systems.
The potential effect of management on GHG fluxes of
each case is summarized from previously published lit-
erature, and reflects the difference in the net GHG emis-
sions estimated for a bioenergy production chain. The
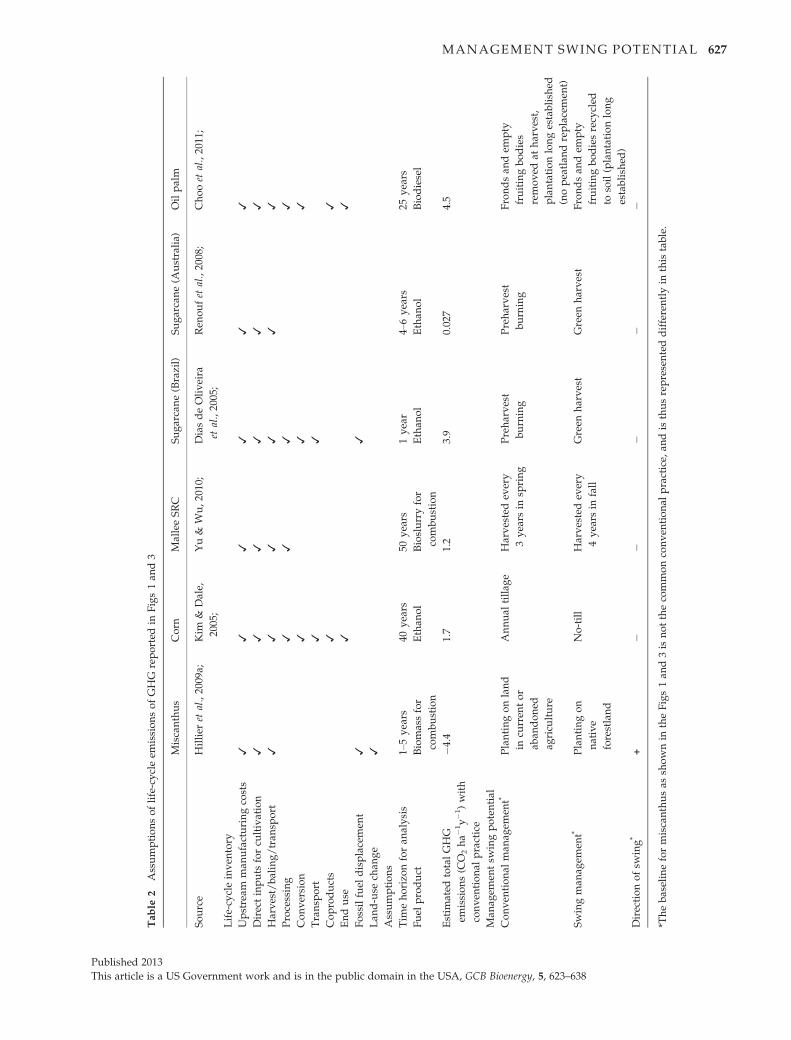
assumptions of life-cycle estimates vary for the different
case studies (Table 2), but the effect of a single manage-
ment change on life-cycle emissions is clearly evident.
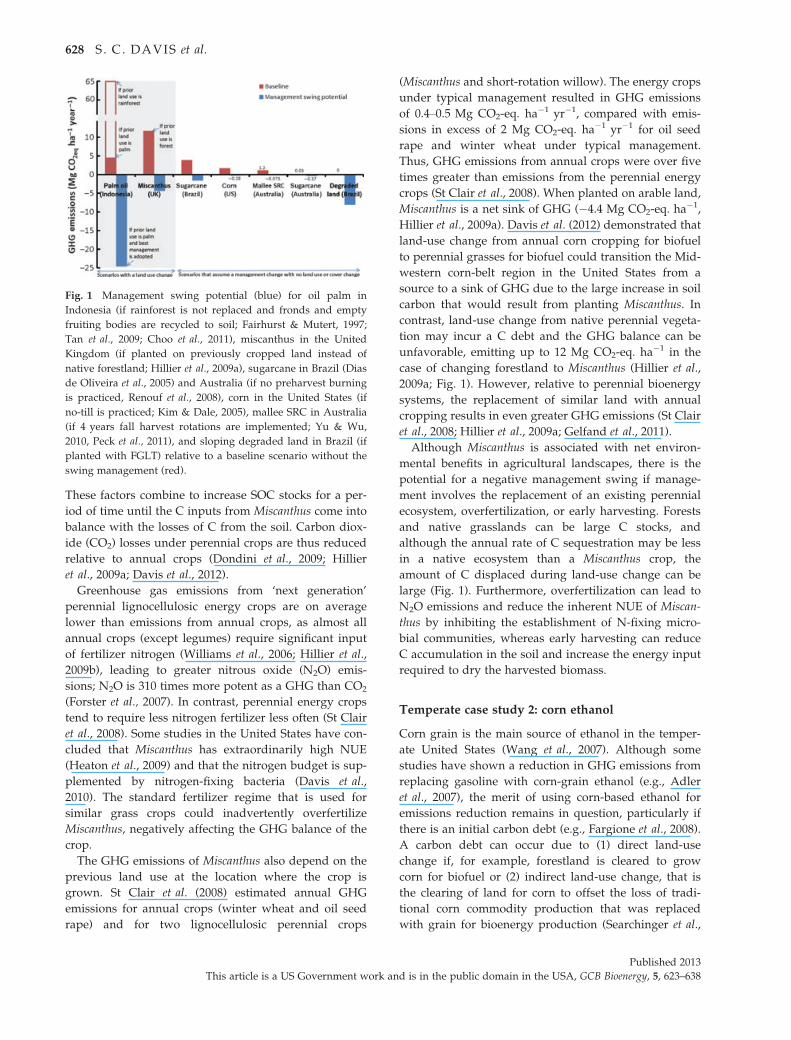
The magnitude of the management swing potential for
each case is summarized in Fig. 1.
Temperate case study 1: Miscanthus
Miscanthus can grow for 15–30 years without having to
be replanted. It is highly efficient in recycling nutrients
because the plants senesce prior to harvest and nutri-
ents are translocated to underground storage organs.
Peak autumn yields of mature stands of Miscanthus
range from 14 Mg ha�1 in the United Kingdom to
50 Mg ha�1 in warmer latitudes of the United States
(Heaton et al., 2008b). The current practice is to delay
harvest until late winter or early spring to obtain higher
dry matter content (reduced moisture) and lower min-
eral content. Delayed harvest results in a reduction in
yield, due to litterfall, of around 23–53% depending on
location and harvest time (Lewandowski & Kicherer,
1997; Lewandowski et al., 2003). This management
choice increases the C that is ultimately sequestered in
the soil because the litterfall that occurs between the
time of peak aboveground biomass and the time of har-
vest contributes C to the soil.
The perennial nature of Miscanthus is in contrast to
annual crops, where the soil is usually plowed at least
once per year (except in no-till and minimum tillage
systems which still occupy limited areas globally; Smith
et al., 2008). Soil disturbance can encourage oxidation
and erosion of soil organic matter, so the production of
perennial energy crops like Miscanthus results in a lower
rate of soil C loss than annual crop production. Miscan-
thus also tends to add more litter to the soil than annual
crops (as aboveground biomass remains all year round
rather than during a specific crop season), and the litter
tends to be more recalcitrant (Hastings et al., 2009a,b).
Published 2013
This article is a US Government work and is in the public domain in the USA, GCB Bioenergy, 5, 623–638
626 S . C. DAVIS et al.
Tab
le2
Assumptionsoflife-cycleem
issionsofGHG
reported
inFigs1an
d3
Miscanthus
Corn
MalleeSRC
Sugarcane(Brazil)
Sugarcane(A
ustralia)
Oilpalm
Source
Hillier
etal.,2009a;
Kim
&Dale,
2005;
Yu&
Wu,2010;
DiasdeOliveira
etal.,2005;
Ren
oufet
al.,2008;
Chooet
al.,2011;
Life-cycleinven
tory
Upstream
man
ufacturingcosts
✓✓
✓✓
✓✓
Directinputs
forcu
ltivation
✓✓
✓✓
✓✓
Harvest/baling/tran
sport
✓✓
✓✓
✓✓
Processing
✓✓
✓✓
Conversion
✓✓
✓
Transp
ort
✓✓
Coproducts
✓✓
Enduse
✓✓
Fossilfuel
displacemen
t✓
✓
Lan
d-use
chan
ge
✓
Assumptions
Tim
ehorizo
nforan
alysis
1–5years
40years
50years
1year
4–6years
25years
Fuel
product
Biomassfor
combustion
Ethan
ol
Bioslurryfor
combustion
Ethan
ol
Ethan
ol
Biodiesel
Estim
ated
totalGHG
emissions(C
O2ha�
1y�1)with
conven
tional
practice
�4.4
1.7
1.2
3.9
0.027
4.5
Man
agem
entsw
ingpotential
Conven
tional
man
agem
ent*
Plantingonland
incu
rren
tor
aban
doned
agricu
lture
Annual
tillag
eHarvestedev
ery
3years
insp
ring
Preharvest
burning
Preharvest
burning
Frondsan
dem
pty
fruitingbodies
removed
atharvest,
plantationlongestablish
ed
(nopeatlan
dreplacemen
t)
Swingman
agem
ent*
Plantingon
native
forestland
No-till
Harvestedev
ery
4years
infall
Green
harvest
Green
harvest
Frondsan
dem
pty
fruitingbodiesrecycled
tosoil(plantationlong
establish
ed)
Directionofsw
ing*
+�
��
��
*Thebaselineformiscanthusas
shownin
theFigs1an
d3is
notthecommonconven
tional
practice,
andis
thusrepresenteddifferentlyin
this
table.
Published 2013
This article is a US Government work and is in the public domain in the USA, GCB Bioenergy, 5, 623–638
MANAGEMENT SWING POTENTIAL 627
These factors combine to increase SOC stocks for a per-
iod of time until the C inputs from Miscanthus come into
balance with the losses of C from the soil. Carbon diox-
ide (CO2) losses under perennial crops are thus reduced
relative to annual crops (Dondini et al., 2009; Hillier
et al., 2009a; Davis et al., 2012).
Greenhouse gas emissions from ‘next generation’
perennial lignocellulosic energy crops are on average
lower than emissions from annual crops, as almost all
annual crops (except legumes) require significant input
of fertilizer nitrogen (Williams et al., 2006; Hillier et al.,
2009b), leading to greater nitrous oxide (N2O) emis-
sions; N2O is 310 times more potent as a GHG than CO2
(Forster et al., 2007). In contrast, perennial energy crops
tend to require less nitrogen fertilizer less often (St Clair
et al., 2008). Some studies in the United States have con-
cluded that Miscanthus has extraordinarily high NUE
(Heaton et al., 2009) and that the nitrogen budget is sup-
plemented by nitrogen-fixing bacteria (Davis et al.,
2010). The standard fertilizer regime that is used for
similar grass crops could inadvertently overfertilize
Miscanthus, negatively affecting the GHG balance of the
crop.
The GHG emissions of Miscanthus also depend on the
previous land use at the location where the crop is
grown. St Clair et al. (2008) estimated annual GHG
emissions for annual crops (winter wheat and oil seed
rape) and for two lignocellulosic perennial crops
(Miscanthus and short-rotation willow). The energy crops
under typical management resulted in GHG emissions
of 0.4–0.5 Mg CO2-eq. ha�1 yr�1, compared with emis-
sions in excess of 2 Mg CO2-eq. ha�1 yr�1 for oil seed
rape and winter wheat under typical management.
Thus, GHG emissions from annual crops were over five
times greater than emissions from the perennial energy
crops (St Clair et al., 2008). When planted on arable land,
Miscanthus is a net sink of GHG (�4.4 Mg CO2-eq. ha�1,
Hillier et al., 2009a). Davis et al. (2012) demonstrated that
land-use change from annual corn cropping for biofuel
to perennial grasses for biofuel could transition the Mid-
western corn-belt region in the United States from a
source to a sink of GHG due to the large increase in soil
carbon that would result from planting Miscanthus. In
contrast, land-use change from native perennial vegeta-
tion may incur a C debt and the GHG balance can be
unfavorable, emitting up to 12 Mg CO2-eq. ha�1 in the
case of changing forestland to Miscanthus (Hillier et al.,
2009a; Fig. 1). However, relative to perennial bioenergy
systems, the replacement of similar land with annual
cropping results in even greater GHG emissions (St Clair
et al., 2008; Hillier et al., 2009a; Gelfand et al., 2011).
Although Miscanthus is associated with net environ-
mental benefits in agricultural landscapes, there is the
potential for a negative management swing if manage-
ment involves the replacement of an existing perennial
ecosystem, overfertilization, or early harvesting. Forests
and native grasslands can be large C stocks, and
although the annual rate of C sequestration may be less
in a native ecosystem than a Miscanthus crop, the
amount of C displaced during land-use change can be
large (Fig. 1). Furthermore, overfertilization can lead to
N2O emissions and reduce the inherent NUE of Miscan-
thus by inhibiting the establishment of N-fixing micro-
bial communities, whereas early harvesting can reduce
C accumulation in the soil and increase the energy input
required to dry the harvested biomass.
Temperate case study 2: corn ethanol
Corn grain is the main source of ethanol in the temper-
ate United States (Wang et al., 2007). Although some
studies have shown a reduction in GHG emissions from
replacing gasoline with corn-grain ethanol (e.g., Adler
et al., 2007), the merit of using corn-based ethanol for
emissions reduction remains in question, particularly if
there is an initial carbon debt (e.g., Fargione et al., 2008).
A carbon debt can occur due to (1) direct land-use
change if, for example, forestland is cleared to grow
corn for biofuel or (2) indirect land-use change, that is
the clearing of land for corn to offset the loss of tradi-
tional corn commodity production that was replaced
with grain for bioenergy production (Searchinger et al.,
Fig. 1 Management swing potential (blue) for oil palm in
Indonesia (if rainforest is not replaced and fronds and empty
fruiting bodies are recycled to soil; Fairhurst & Mutert, 1997;
Tan et al., 2009; Choo et al., 2011), miscanthus in the United
Kingdom (if planted on previously cropped land instead of
native forestland; Hillier et al., 2009a), sugarcane in Brazil (Dias
de Oliveira et al., 2005) and Australia (if no preharvest burning
is practiced, Renouf et al., 2008), corn in the United States (if
no-till is practiced; Kim & Dale, 2005), mallee SRC in Australia
(if 4 years fall harvest rotations are implemented; Yu & Wu,
2010, Peck et al., 2011), and sloping degraded land in Brazil (if
planted with FGLT) relative to a baseline scenario without the
swing management (red).
Published 2013
This article is a US Government work and is in the public domain in the USA, GCB Bioenergy, 5, 623–638
628 S . C. DAVIS et al.

2008). The large amounts of nitrogen fertilizer that are
used in corn cropping systems are another large source
of GHG emissions. Regardless of the controversy, corn
grain is a major feedstock for bioenergy production in
the United States, and will likely continue to be a key
source of transportation fuel until later generation feed-
stocks are available for mass production of bioenergy.
Several management options are available for reduc-
ing the GHG footprint of corn production systems.
Alternative management options include less intensive
tillage practices, improved fertilizer management, and
residue conservation (Smith et al., 2008). No-till has
been estimated to increase carbon sequestration over
20 years by 44 g m�2 yr�1 with continuous corn, and
90 g m�2 yr�1 if grown in rotation with soybeans (West
& Post, 2002). When assessed in the context of a bioen-
ergy production system, no-till management can ‘swing’
the impact of producing corn ethanol from a net source
of GHG to a net sink of GHG (Kim & Dale, 2005; Fig. 1).
Improving agronomic practices can also increase carbon
sequestration. Examples of such improvements in corn
production systems include (1) adding hay or pasture in
the crop rotation, (2) optimizing fertilization rates, (3)
limiting bare fallow, and (4) planting more productive
corn varieties. Estimates of C sequestration under these
management regimes range from 9 to 24 g m�2 yr�1
over a 20-year time period (Smith et al., 2008). The con-
tinual development of higher yielding corn varieties
over the last half of a century has led to a fairly constant
increase in soil C stocks (Buyanovsky & Wagner, 1998).
There is however a maximum SOC that will eventually
be reached even with improved management decisions.
It should also be noted that if increasing yields are asso-
ciated with increasing N fertilization, this can enhance
N2O emissions.
Nitrous oxide emissions from soils in corn production
systems are high due to high N-fertilizer input, which
limits the net GHG benefit of using corn-grain ethanol
as a replacement for fossil fuel (Crutzen et al., 2008;
Ogle et al., 2008). There are, however, practices that can
limit N2O emissions from corn production. For example,
Akiyama et al. (2010) reviewed the literature for prac-
tices that enhance the efficiency of N-fertilizer use in
crops, and found that nitrification inhibitors reduce soil
N2O emissions on average by 38%, and polymer-coated
fertilizers reduce emissions by 35% on average. Reduc-
ing N2O emissions can have a significant effect on the
GHG footprint of a bioenergy crop that requires signifi-
cant N-fertilizer inputs.
Temperate case study 3: short-rotation coppice trees
Increasing the planting of perennial vegetation in
cleared agricultural landscapes in Australia is being
promoted in pursuit of environmental objectives includ-
ing biodiversity conservation, dryland salinity media-
tion, and C sequestration (Roberts et al., 2009; PMSEIC,
2010). Large-scale implementation is dependent on
these systems being profitable (Bell, 2005), and biomass
production is suggested as a possible income source.
Many native shrub and tree species have been exam-
ined and field tested and are considered suitable for
biomass production in Australia including Eucalyptus
spp., Acacia spp., and Atriplex nummularia (Olsen et al.,
2004; Bennell et al., 2009). In this case study, we focus
on the opportunities for coppicing mallee species (e.g.,
Eucalyptus polybractea, E. loxophleba ssp lissophloia, and
E. kochii) to be grown as a dedicated energy crop. These
crops have the capacity to provide significant biomass
with the potential to displace up to 15% of Australia’s
gasoline (as ethanol) or 9% of current electricity genera-
tion (Farine et al., 2012). Mallee species are not suitable
for solid wood products, and grow in environments
unfit for commercial plantation timber species; so they
do not compete with conventional forestry for land
resources. Besides biomass for energy production, mal-
lees can also be used for biochar and/or to produce co-
products including eucalyptus oil (Hobbs & Bartle,
2009; George & Nicholas, 2012).
Mallees are a hardy group of small multistemmed
Eucalyptus tree species found in low rainfall areas
across southern Australia (Olsen et al., 2004). Many mal-
lee species have a significant capacity to coppice,
enhancing their potential role in biomass production
systems where they can be established and then regu-
larly harvested without replanting. Their capacity to
survive and grow with limited inputs in dry landscapes
led to significant interest in intercropping mallees with
cereal crops where salinity was evident (Bartle, 2009).
Mallee trees are commonly planted in belts of two to
four rows that are spaced at intervals wide enough to
accommodate cereal crop planting and harvesting
equipment. As with any crop, growth rates of mallees
are determined by the species, soil, rainfall, and nutrient
availability. Significant variation in yields within and
between sites has been reported in the literature, with
the productivity of 4-year-old coppiced stands ranging
from 10 to 100 Mg ha�1 (Peck et al., 2011). In dryland
areas of eastern Australia it is likely that yields will be
at the lower end of the spectrum and often less than
10 Mg ha�1 yr�1 (Milthorpe et al., 1994); this is still high
relative to other species grown in the region.
Growing short-rotation coppice (SRC) trees as an
intercrop may lead to competition for limited resources.
It is clear that crop or pasture yields decline with prox-
imity to mallee belts due to the competition for water
and nutrients, although the yield decline may be miti-
gated by benefits of shelter from wind. Across multiple
Published 2013
This article is a US Government work and is in the public domain in the USA, GCB Bioenergy, 5, 623–638
MANAGEMENT SWING POTENTIAL 629

sites in the Western Australian wheat belt region, Peck
et al. (2011) and Sudmeyer et al. (2012) reported an aver-
age competition zone between mallee SRC and the crop-
ping area that extended 10–12 m from the edge of the
mallees. The average yield reduction for the cereal crop
across this zone was �50% in areas adjacent to unhar-
vested mallees. The area of competition reduced to 8 –
9 m when the mallees were regularly harvested. The
reduction in competition was dependent on the fre-
quency and seasonal timing of harvest, with competi-
tion increasing 3 years after harvest. When harvesting
occurred in the fall season, there was a reduction in
competition between the mallees and the crops predom-
inantly due to the increased soil water availability dur-
ing the following winter (Sudmeyer et al., 2012). The
pattern and amount of water consumed during biomass
production will vary not only between species but also
planting regimes (Wildy et al., 2004). Current recom-
mendations are to grow narrow (two row) belts of mal-
lees with wide interrow spacing (4–8 m) to optimize
water use and reduce competition between the mallee
SRC and cereal crops (Peck et al., 2011). In lower rainfall
areas, especially those with variable annual rainfall,
Sudmeyer et al. (2012) recommend a 4–5 m unplanted
buffer between the harvested mallees and other crops to
reduce input costs and avoid the zone of strongest com-
petition next to the mallees.
Allowing mallees to grow for 4 years between harvest
increases competition with wheat relative to a 3-year
harvest system, but it also increases the biomass pro-
duction and the shelter value. Harvesting mallees at 4-
year intervals, in autumn, gives the greatest biomass
yield relative to the impact on wheat yield. Adopting
this management practice results in a ‘swing’ of net
GHG emissions per unit area (Fig. 1) relative to 3-year
harvests in spring. The life-cycle GHG emission of oil
mallee intercropped with wheat is based on previously
published results (Yu et al., 2009; Peck et al., 2011;
assumptions shown in Table 2). We account for the dis-
placed wheat production, i.e., the forgone wheat yield
from the area planted to mallees, and from reduced
wheat yields in the cropped area adjacent to the tree
belts, due to competition from the oil mallees.
The continued harvesting of the coppice mallees will
certainly reduce their competition with crops for water.
However, in continually removing the biomass it is
important that the nutrient status of the soil is main-
tained and this may require inputs that carry an energy
and GHG cost. In forest systems managed for biomass
production, the retention of leaf material is recom-
mended (Farine et al., 2012), but all leaf material is
removed during harvest of coppicing mallee systems.
Thus, there is potentially a need to fertilize (George &
Cowie, 2011) and/or include species that have the
capacity to fix nitrogen (e.g., Acacia spp.) to maintain
soil nutrient status (Richards et al., 2010).
The GHG mitigation opportunities from the utilization
of woody biomass are significant (Tucker et al., 2009; Fro-
ese & Shonnard, 2010), and a major driver for industry
development (Bartle & Abadi, 2010). Coppicing mallee
systems have the capacity to produce significant amounts
of biomass with small GHG emissions (Yu et al., 2009).
Yu et al. (2008) found that little nonrenewable energy
was utilized during the production of coppice mallee bio-
mass (<3% of GHG emissions) and the majority of energy
consumed was associated with harvest and transport of
the biomass (�80% of energy inputs). Thus, the low
inputs to the mallee SRC system yield a significant return
on energy invested. Recent studies indicate an energy
return on investment (ratio of output energy: input
energy) for coppice mallee SRC systems of >40 (Wu et al.,
2008), which compared very favorably with oilseed pro-
duction in the same environment.
The mallee SRC system provides a good example of
the importance and complexity of the management
swing potential. The choice of how the plantings are
established and maintained and the competition that
they create with other crops (e.g., wheat) are all critical
aspects of management, especially in relation to compe-
tition for water. In designing, implementing, and inte-
grating a mallee SRC biomass production system in low
rainfall areas, the management becomes critical to
ensure that identified production and GHG goals are
achieved. Regular harvesting (e.g., every fourth year,
during autumn) of mallee SRC systems, that optimizes
the removal of biomass and reduces competition for
limited resources (e.g., water), will produce biomass
with a greater proportion of leaf material but will also
reduce potential competition with other crops. Manage-
ment will need to be adaptive and innovative to realize
a swing potential that achieves a beneficial GHG bal-
ance along with other identified goals.
Subtropical–Tropical case study 1: sugarcane
� Burning vs. green harvest and residue retention
Burning of a sugarcane crop prior to harvest removes
very large volumes of senescent leaves (trash), most of
which are attached to the stems and greatly hinder
manual cutting. The practice of preharvest burning was
introduced in Brazil in the 1940s because of labor short-
ages and soon became almost universal practice. The
smoke and soot produced is not only an agent for global
warming but also a public health risk (Godoi et al.,
2004; Arbex et al., 2007), and since the 1990s there has
been a gradual reduction in sugarcane burning,
required by law since 2003 in the State of S~ao Paulo. In
Published 2013
This article is a US Government work and is in the public domain in the USA, GCB Bioenergy, 5, 623–638
630 S . C. DAVIS et al.

2010 Brazil harvested 9.1 million ha of sugarcane of
which approximately 55% was subjected to preharvest
burning and manual harvest whereas the remainder
was mechanically harvested ‘green’ (without burning).
National mean cane yield is ~80 Mg millable cane
ha�1. With this productivity, 12–15 Mg (dry weight) of
trash (unused biomass) is produced (Souza et al., 2005;
Luca et al., 2008; de Figueiredo & La Scala, 2011). As a
result of burning this trash (~45% C), emissions would
be less than 20–25 Mg ha�1 of CO2 (maximum based on
100% conversion efficiency). When all trash is con-
served, it will in warm regions of Brazil gradually
decompose from one harvest to the next (12 months
later), resulting in similar CO2 emissions. In studies per-
formed on unburned cane in the north east of Brazil, it
was estimated that over 95% of the trash present at har-
vest decomposed before the next harvest 12 months
later (Resende et al., 2006). However, in the cooler drier
winters of S~ao Paulo, decomposition is much slower.
S~ao Paulo State is responsible for almost 60% of cane
production in Brazil (mean yield in 2010 of 85 Mg ha�1)
on 55% of the area (IBGE, 2012). Campos (2003) working
in S~ao Paulo State found that over a 6-year period the
quantity of residual trash on the soil surface stabilized
at between 4.5 and 5.5 Mg dry matter (2–2.5 Mg C)
ha�1 in unburned cane. Thereafter, a mean of 13 Mg
dry matter ha�1 of trash from cane is produced. GHG
mitigation thus increases as a result of the change from
preharvest burning to trash conservation because of the
C in trash that is added to the soil surface.
When preharvest burning is abandoned, the manage-
ment practice changes from manual harvesting of
burned cane to mechanical harvest of green cane. The
impact of the use of mechanical harvesters on soil com-
paction can be severe as was apparent in the higher soil
bulk density of unburned plots observed by Souza et al.
(2005) and Luca et al. (2008). Plantation managers know
that compaction caused by heavy harvesting machines
will reduce yields and inhibit root growth, leading to a
reduction in the residual C inputs to the SOC pool.
Based on available data, we estimate that the manage-
ment change from preharvest burning to green-cane
harvesting for most plantations which are on Ferralsols
(>60% of all cane plantations) would result in SOC accu-
mulation of 0.5–1 Mg C ha�1 yr�1 for the first 10 years,
and half that rate (0.25–0.5 Mg C ha�1 yr�1) for the next
10 years. Subsequent increases are likely to be very
slow. Site-specific data will be needed to provide pre-
cise estimates of the SOC accumulation rate, which
depends on previous history (how many years of
burned cane or crop or pasture cultivation occurred
before the management change), yield (determined lar-
gely by rainfall and pest and fertilizer management),
and other edapho-climatic factors such as soil texture.
It is likely that there will be an impact of the switch-
ing from burned to green-cane harvesting on N2O emis-
sions also. In Brazil, N2O emissions of sugarcane that
has undergone preharvest burning are equivalent to
~465 kg CO2 ha�1 (Dias de Oliveira et al., 2005). Austra-
lian studies suggest that the removal of trash from the
soil surface decreased N2O emissions by 24–30%,
depending on the area studied (Wang et al., 2008).
Applying urea fertilizer to the surface trash that is left
after a green harvest, instead of applying to the bare soil
surface, increases N-fertilizer loss and reduces N2O
emission through denitrification, but in many cases urea
inputs are being increased to compensate for this (Lara-
Cabezas et al., 1999). The presence of the trash conserves
soil water which is likely to increase N2O emissions and
soil compaction (Ball et al., 1999) due to the traction of
heavy harvesting machines. On the other hand, the
presence of trash has been shown to promote CH4
uptake by the soil (Weier, 1998).
The management shift from burning to trash conser-
vation has an effect on SOC stocks, soil N2O, and CH4
emissions, but there is also a substantial reduction in
direct emissions from burning. This reduction is par-
tially offset by an increase in diesel fuel use (mechanical
harvesters), but even after accounting for the diesel fuel
used by harvesting equipment when cane is harvested
green (~40 L to harvest 70 Mg cane h�1), the emissions
from burning results in far greater GHG than without
burning (Soares et al., 2009). Sanhueza (2009) suggested
that the black C (soot) produced during burning could
make large contributions to global warming, more than
doubling total GHG emissions in the agricultural phase
of production. Galdos et al. (2010) estimated that this
pollutant could be equivalent to an emission of over
5.5 Mg CO2 eq ha�1 which would reduce the bioethanol
displacement of fossil fuel emissions from 13.2 (Soares
et al., 2009) to 7.7 Mg CO2 eq ha�1. In view of this, the
debate about the contribution of SOC increases to total
GHG mitigation when burning is replaced by green-
cane harvesting becomes considerably less important.
Changing from preharvest burning to trash conserva-
tion has a very significant and favorable impact on GHG
mitigation of sugar cane for bioethanol in Brazil. The
elimination of gaseous and particulate emissions associ-
ated with preharvest burning results in a substantial
management swing from net GHG emissions to a net
GHG sink with the use of ethanol from sugarcane that
replaces fossil fuel (Dias de Oliveira et al., 2005; Fig. 1).
Tropical case study 2: Fast-growing legume trees on
degraded lands
Degraded lands have been proposed as ideal for bioen-
ergy feedstock production. In 1990, an FAO report
Published 2013
This article is a US Government work and is in the public domain in the USA, GCB Bioenergy, 5, 623–638
MANAGEMENT SWING POTENTIAL 631

suggested that 27% of all land area in Latin America,
and 236 million ha in Brazil, was either severely or very
severely degraded (Bot et al., 2000). The report defined
severely degraded land as that with ‘biotic functions
largely destroyed; non-reclaimable at the farm level’
and very severely degraded as ‘biotic functions fully
destroyed, non-reclaimable at the farm level’. It is clear
that much of the degraded area so classified in Brazil
includes areas of planted pastures, which total at least
50 Mha of mostly gently rolling country in the Cerrado
region that can be recovered with carefully managed
sugarcane and/or production of other crops. There is
much degraded land however that will not support con-
ventional crops in the deforested hillsides of the Atlan-
tic coastal region. The steep slopes and relatively high
rainfall (>1000 mm), much of it from sudden tropical
storms, cause widespread gully and sheet erosion. An
alternative management strategy, planting fast-growing
legume trees (FGLT), has been proposed to restore
degraded hillsides of the Atlantic forest region and pro-
duce biomass for bioenergy.
Planting of FGLTs (e.g., species of Acacia, Mimosa,
and Gliricidia among many others) in degraded tropical
areas that have sloping topography can lead to the
recovery of hillsides. If rhizobium-inoculated seeds are
utilized, the seedlings are already nodulated, and fixing
nitrogen when transplanted. This technology has been
widely used in the Atlantic forest region for recovery of
degraded land and in Amazonia for revegetating mine
wastes and tailings (Chaer et al., 2011). Seedlings are
also inoculated with arbuscular mycorrhizal fungi
(AMF), the spores of which can be almost completely
absent in areas where subsoil is exposed by machinery
or severe erosion. In areas within the Atlantic forest
region of Brazil where rainfall is abundant and there is
no marked dry season, full ground cover is usually
attained 18 months after planting. Experience has
shown that the key to the success of this technology is
the prior inoculation of the tree seeds with selected rhi-
zobium and AMF.
Recent studies have assessed the impact of transplant-
ing FGLT on SOC accumulation of sloped and degraded
land. At a site on the coast of the State of Rio de Janeiro
near Angra dos Reis, an area where all topsoil had been
removed on a steep slope, seedlings inoculated with rhi-
zobium and AMF of the species Acacia mangium, A. au-
riculiformis, Enterolobium contortisiliquum, Gliricidia
sepium, Leucaena leucocephala, Mimosa caesalpiniifolia, and
Paraserianthes falcataria were planted (Macedo et al.,
2008). After 13 years it was estimated that SOC stocks
to a depth of 60 cm increased by 23 Mg C ha�1, a mean
of 1.7 Mg C ha�1 yr�1. In another study, degraded pas-
ture land was reclaimed using mixtures of N2-fixing
legume trees grown from preinoculated (rhizobium and
AMF) seedlings and nonfixing legumes and nonle-
gumes (Jensen et al., 2011). The mixtures ranged from 0
to 75% N2-fixing legume trees. In a period of 6 years,
the accumulated C in plots with 75% N2-fixing trees
reached 47, 18 Mg ha�1 in trunk wood alone compared
with only 16 Mg ha�1 (4 Mg ha�1 in trunk wood) in
plots with only non-N2-fixing species (Fig. 2A). The
plots with 50 or 75% N2-fixing species accumulated
10 Mg ha�1 of SOC (0–60 cm) more than those with 0%
(Fig. 2B; Jensen et al., 2011).
Whereas SOC accumulation is expected to asymptoti-
cally approach a limit within 20–30 years, regular har-
vesting of trunk wood for bioenergy production could
mitigate up to 3 Mg C (11 Mg CO2) ha�1 yr�1. At the
same time, this FGLT technology provides an array of
valuable ecosystem services including reduction in ero-
sion, increased rainfall infiltration, and improved water
quality which lead to important reductions in silt
% N2-fixing legume tree0 25 50 75
C s
tock
in tr
ees
+ lit
ter (
Mg
C h
a–1 )
0
10
20
30
40
50 47
16
25
38
10
16
18
2.2
8
13
14
2.8
9
8
26
424
5
RootsLitterTrunkCanopy
% N2-fixing legume tree0% 25% 50% 75%
Soil
carb
on s
tock
(Mg
ha–1)
0
20
40
60
80
100
70.6 b79.2 ab
83.9 a 80.8 abLSD
(a)
(b)
Fig. 2 Total C stocks (A) in biomass and (B) in soil (0–60 cm)
under different mixtures of N2-fixing legume, non-N2-fixing
legume, and nonlegume trees after 6 years of growth on a
degraded pasture site (Valenc�a, Rio de Janeiro). Data from Bod-
dey et al. (2008). The same letter above the bars indicates that
the difference between the means was not significantly differ-
ent at P < 0.05.
Published 2013
This article is a US Government work and is in the public domain in the USA, GCB Bioenergy, 5, 623–638
632 S . C. DAVIS et al.

deposits to rivers and in flash floods which claim many
lives and cost millions of dollars in destroyed farm land
and housing every year in many countries of the devel-
oping world.
The GHG flux of degraded lands in tropical regions
depends on management decisions and there is a man-
agement swing potential associated with well-managed
FGLT that can be grown for bioenergy in the degraded
lands of Brazil (Fig. 1). No life-cycle assessment of the
production of this system has yet been completed; the
GHG change in this case is based solely on terrestrial
fluxes.
Tropical case study 3: oil palm
Oil palm is productive, profitable, and expanding in
area (Corley & Tinker, 2003), but its success as an agri-
cultural commodity is reason for environmental con-
cern. Current production of South-East Asian palm oil
and use as biofuel is far from C neutral (Reijnders &
Huijbregts, 2008; Sheil et al., 2009; Reijnders, 2011). Use
of peat soils causes CO2 emissions that exceed the
amount sequestered in harvested products (Couwen-
berg et al., 2010; Hooijer et al., 2010; Hergoualc’h & Ver-
chot, 2011); 5% of peat soils in the portfolio of a palm
oil production facility is sufficient to reduce the average
‘emissions saving’ ratio to values below the standards
set by the EU Renewable Energy Directive (Khasanah
et al., 2012). Due to consumer pressure and environmen-
tal concerns of major stakeholders in the palm oil value
chain, new deforestation and use of peat soils for oil
palm has been reduced under voluntary agreements of
the Roundtable on Sustainable Palm Oil (http://www.
rspo.org/; Tan et al., 2009; Laurance et al., 2010; Choo
et al., 2011). Land-use change from low-C-stock vegeta-
tion on mineral soils is seen as the future of sustainable
palm oil, and according to some authors can lead to net
gains of SOC stocks (Germer & Sauerborn, 2008; Verho-
even & Setter, 2010; Flynn et al., 2011; Hassan et al.,
2011; Patthanaissaranukool & Polprasert, 2011; Siangiae-
o et al., 2011).
Environmental sustainability of palm oil is mostly
determined by land use or land-use change, and main-
tenance of soil quality (Parish et al., 2008). Land-use
change driven by increases in oil palm production areas
is the most important factor to consider when analyzing
GHG emissions of palm oil production (Parish et al.,
2008; Stichnothe & Schuchardt, 2011). If peatland is
deforested and drained, C and N2O emissions increase
dramatically (Hooijer et al., 2006). IPCC assumes N2O
emissions of 8 kg N2O ha�1 yr�1 (uncertainty range 0–
24 kg) for tropical organic forest soils (IPCC, 2006).
Yearly N2O emissions from a secondary peatland forest
in Kalimantan, Indonesia, can be as high as 143 kg ha�1
(Couwenberg et al., 2010). With the replacement of rain-
forest and grassland, CO2eq values are estimated to be
between 425 and 1850 kg CO2eq Mg�1 of fresh fruit
bunch production (Fig. 1; Stichnothe & Schuchardt,
2011). It is estimated that it would take between 75 and
93 years for the carbon emissions saved through use of
biofuel to compensate for the carbon lost through defor-
estation. If peatland was replaced, the carbon balancing
would take more than 600 years, but can also be infi-
nitely long as annual peat emissions exceed CO2 savings
from biofuel use derived from palm oil on peat soils
(Danielson et al., 2009).
Estimates of SOC gains in oil palm plantations should
be considered with caution as few studies on the bio-
physical performance of oil palm production after land-
use change have been carried out and the literature is
based on isolated case studies and unconstrained mod-
eling exercises at best (Adachi et al., 2011; Nair et al.,
2011). Empirical data of both initial SOC and trends
over time during a production cycle are needed to ver-
ify the claims that C stocks will increase and validate or
improve the models used. As part of the Second Assess-
ment Report of the IPCC, Paustian et al. (1997) summa-
rized known effects of land-use change on SOC across
climatic zones and soil types. Subsequent literature has
led to some refinement: Don et al. (2011) in a global
meta-analysis of 385 studies on land-use change in the
tropics found that the highest SOC losses were caused
by the replacement of primary forest with cropland
(�25%) and perennial crops (�30%), but replacement of
forest with grassland also reduced SOC stocks by 12%.
If it were a simple additive system, one might thus
expect the replacement of grasslands with perennial
crops to lead to a decrease in SOC by about 18%.
Another recent meta-analysis (Powers et al., 2011)
focused on ‘paired plot’ literature and found little con-
sistency in SOC change, with both ‘forest to grassland’
and ‘grassland to forest’ transitions leading to statisti-
cally significant SOC gain; this suggests a selection bias
in the results that get published. Both reviews confirm
that complete data sets that combine soil bulk density
and SOC are scarce, and that spatial extrapolation is
hindered by inadequate representation of tropical soils.
In Sumatra, van Noordwijk et al. (1997) estimated that
SOC losses occurred when native ecosystems were
replaced with croplands. Losses were similar but less
than those documented by Don et al. (2011) because per-
manently cropped upland soils are relatively scarce in
Sumatra where intensifying land management practices
have begun to favor permanent tree crops (van Noo-
rdwijk et al., 2008). Imperata grasslands and areas for-
merly used for shifting cultivation may not have
substantially lower SOC content than forests (Santoso
et al., 1997). It thus appears that the expectation that
Published 2013
This article is a US Government work and is in the public domain in the USA, GCB Bioenergy, 5, 623–638
MANAGEMENT SWING POTENTIAL 633

shifting palm oil production to ‘degraded forests’ or
‘grasslands’ will lead to a net gain in SOC stocks is
unsubstantiated, and the main ‘swing potential’, apart
from avoidance of peat soils, would lie with the above-
ground C stock of the preceding vegetation on the land
that is chosen for oil palm. With the aboveground time-
averaged C stock of oil palm plantations at around
40 Mg C ha�1 (Dewi et al., 2009), the threshold for
avoiding C debt issues is reached at a 40 Mg C ha�1
level on vegetation C maps.
Once an oil palm plantation has been established,
good management practices can make a large difference
in the greenhouse gas emissions of palm oil production.
Compared with other tropical cropping systems, the
amount of organic residues, in the form of pruned
fronds, returned to soil in oil palm plantations is large,
and is estimated to be in the range 10–15 Mg ha�1 yr�1
of dry matter (DM; Santoso, 1996; Fairhurst & Mutert,
1997). This is more than the 8 Mg ha�1 yr�1 of DM
roughly needed to sustain soil organic matter in humid
tropical environments (Fairhurst & Mutert, 1997). A
comparison of different management practices in
Malaysian oil palm plantations showed that the emis-
sions from production and processing of one ton of
fresh fruit bunches can be more than 460 kg CO2eq in
the worst case and 110 kg CO2eq Mg�1 of bunches in
the best case (Stichnothe & Schuchardt, 2011). Cocom-
posting of empty fruit bunches and palm oil mill efflu-
ents and application of the resulting compost back into
the field minimizes emissions in the best case.
It is clear that even good management practices can-
not compensate for the greenhouse gas emissions
resulting from the removal of native forest (Fig. 1).
However, once an oil palm plantation is present (which
is of course the case now in large areas in South-East
Asia), oil palm production scores high on many envi-
ronmental indicators (Fig. 1; De Vries et al., 2010). Oil
palm requires 7–11 times less land area than soybean,
rapeseed, and sunflower to produce the same amount
of oil.
Other potential ‘swing’ management practices for
palm oil as biofuel feedstock are the use of methane
trapping in processing mills and the use of fertilizer to
increase yields. Methane traps are technically feasible
for new mills, but require investment and integration in
the design of processing plants. Eliminating methane
emissions would result in a large GHG reduction. Fertil-
ization decisions can also affect GHG emissions of palm
oil cropping systems. Depending on the N2O/N-fertil-
izer emission ratio that is used in the accounting
schemes (Hoefnagels et al., 2010), the additional yield
associated with N-fertilizer use may increase or
decrease the ‘emission footprint’ per unit bioenergy
derived.
Temperate/tropical crop with no swing potential:
soybean for biodiesel
Soybean (Glycine max) is widely consumed as human
food and is easy to grow in both tropical and temperate
climates. In recent years, especially in Brazil, there has
been a push for soybean biodiesel production (Volpi,
2010). Biodiesel and the increasing demand for soybean-
based animal fodder are the main causes for the rapid
expansion of soybean in Brazil. With an average agricul-
tural yield of 1.5–3.0 Mg ha�1 yr�1, an oil content of
about 17–20% and an oil production per ha of about 500
–700 L, soybean is a modest source of oil (Nogueira,
2010) and has limited environmental benefits relative to
other biofuel crops (De Vries et al., 2010).
Soybean is widely used because it is easy to grow.
Soybeans have a high NUE due to a symbiotic relation-
ship with rhizobium bacteria that fix nitrogen from the
atmosphere: it therefore needs little N fertilizer. Produc-
tion and transport of N fertilizer can cost a considerable
amount of the total fossil energy required for agricul-
tural production. For example, N fertilizer for rapeseed
accounts for 65% of the crop’s energy requirement. For
soybean, energy costs for fertilizer can be as low as 5%
of the total energy requirement (De Vries et al., 2010).
Despite the benefits of nitrogen fixation, soybean bio-
diesel production is strongly dependent on the use of
nonrenewable resources in the agricultural production,
transport, and industrial processing stages. This leads to
a relatively low fraction of the fuel that is actually
renewable (around 30%; Cavalett & Ortega, 2009).
Research performed in the Londrina region, Paran�a
State in Brazil concluded that to produce 1 kg of soy-
bean (with 18% vegetable oil) about 1.38 MJ of fossil
fuel is required. Assuming a yield of 4 Mg ha�1, this
equates to a fossil energy cost for soybean oil of
7.66 MJ kg�1 (Gazzoni et al., 2006). A study across four
different sites in Brazil estimated an average oil yield of
880 L per ha and an average energy-output/fossil fuel-
input energy ratio of 3.3 (Nogueira, 2010). Another
Brazilian study assumed a productivity of 552 kg of
soybean biodiesel per hectare and estimated 2.30 for the
energy-output/fossil fuel-input ratio (Cavalett & Orte-
ga, 2009). In temperate regions of the United States, an
output/input energy ratio in the range 3.2–3.4 was esti-
mated for whole grain soybean, but in the output/input
energy ratio is only 1.0–1.2 when estimated for the oil
product. Soybean has low energy efficiency relative to
crops like oil palm. Financially viable biodiesel produc-
tion can only be achieved if yields are above 2 Mg ha�1
(Vera-Diaz et al., 2008). Model studies indicate that only
roughly 20% of the Amazon Region (outside of pro-
tected areas) can provide yields greater than 2 Mg ha�1
(Vera-Diaz et al., 2008).
Published 2013
This article is a US Government work and is in the public domain in the USA, GCB Bioenergy, 5, 623–638
634 S . C. DAVIS et al.

These calculations do not include any effect of direct
or indirect land-use changes caused by expansion of
soybean areas. Expansion of soybean farms is likely to
lead to negative direct and indirect impacts of land-use
change. However, only a part of these impacts can be
allocated to biodiesel production, as animal fodder pro-
duction is the main driver for soybean growth (Volpi,
2010). It should be noted that biodiesel is usually a
coproduct of a system also supplying soy meal.
Soybean exemplifies a crop that has several of the
ideal characteristics for bioenergy crops (Table 1), but
due to the low yield there is no evidence for a manage-
ment swing potential that can reverse the emissions of
this production system. Management of soybean thus
far indicates that there is very little potential to ‘swing’
the environmental consequences of soybean biodiesel in
a beneficial direction.
Discussion and Conclusion
To address the concomitant problems of climate change
and increasing energy demands, a shift from human
reliance on fossil fuels to more diversified and renew-
able energy sources is necessary. Bioenergy is already
used in many regions of the world for heat and electric-
ity although conversion of biomass to liquid fuels is also
on the rise (Somerville et al., 2010). Species that are cur-
rently cultivated for bioenergy vary geographically from
palm in the tropics (Wicke et al., 2008) to grasses in tem-
perate regions (DOE, 2006) and coppicing woody tree
species in northern and southern latitudes (Weih, 2004).
The environmental benefits and risks of feedstock
sources vary widely, and can be altered significantly by
management choices.
Crop species themselves are neither exclusively posi-
tive nor negative, rather it is how they are managed
for bioenergy that will determine their impacts. Here,
we reviewed examples of the management swing
potential for different bioenergy cropping systems.
Even though the assumptions used to calculate life-
cycle emissions of biofuel production systems vary
(Table 2), it is clear that a single management change
often has the potential to reverse the net emissions of
the entire production chain (Figs 1 and 3). Greenhouse
gas emissions can be calculated on an area basis or on
an energy basis; GHG emissions per unit energy are
more indicative of the mitigation potential and allow
for a clearer comparison against the emissions associ-
ated with the production and use of conventional fossil
fuels (Fig. 3). Only managements that require the
replacement of native forest lands result in greater
GHG emission per MJ than gasoline or diesel. The pro-
duction of most bioenergy feedstocks results in lower
GHG emissions than fossil fuel production, but certain
management choices can actually lead to net negative
CO2eq emissions.
The reference case against which bioenergy produc-
tion scenarios are compared can alter the apparent ben-
efit for GHG reduction. The baseline case can be
defined in terms of the previous land management, the
previous energy production scenario, or the native eco-
system that would otherwise dominate a landscape.
Here, the change in GHG emissions associated with the
management swing potential is calculated based on a
comparison between a typical bioenergy cropping sce-
nario and the same scenario with a single difference in
management. The conditions for the baseline vary
among the case studies (Table 2) and it should be noted
that a different baseline condition, the initial land use
for example, will alter the magnitude of the swing effect
estimated here. The oil palm case study provides an
example of this where adoption of the best management
practices result in a ‘swing’ of GHG emissions only if
the prior land use is not native forest (Figs 1 and 3).
There was evidence of a management swing potential
in six of the seven case studies reviewed here. The net
GHG sink of Miscanthus can be negated by a poor land
management decision (Fig. 3), but would also be
affected by early harvesting or overfertilization. The net
GHG emissions of corn production for biofuel can be
offset by management decisions that reduce tillage
(Fig. 3), retain residual biomass onsite, or alter fertiliza-
Fig. 3 Management swing potential (blue) for oil palm in
Indonesia (if rainforest is not replaced and fronds and empty
fruiting bodies are recycled to soil; Fairhurst & Mutert, 1997;
Choo et al., 2011), miscanthus in the United Kingdom (if
planted on previously cropped land instead of native forest-
land; Hillier et al., 2009a), sugarcane in Brazil (Dias de Oliveira
et al., 2005) and Australia (if no preharvest burning is prac-
ticed, Renouf et al., 2008), corn in the United States (if no-till is
practiced; Kim & Dale, 2005), and mallee SRC in Australia (if
4 years fall harvest rotations are implemented; Yu & Wu, 2010,
Peck et al., 2011) relative to a baseline scenario without the
swing management (red) and conventional fossil fuels (black).
Published 2013
This article is a US Government work and is in the public domain in the USA, GCB Bioenergy, 5, 623–638
MANAGEMENT SWING POTENTIAL 635

tion timing and rates. In the case of mallee SRC, the
timing of harvest can determine whether the production
system is a net source or sink of C (Figs 1 and 3). In
tropical regions, the management switch to green-har-
vested sugarcane without preharvest burning can
reverse the climate change impact associated with this
cropping system (Figs 1 and 3). Fast-growing legume
trees can be used to reclaim sloping degraded lands
while capturing and storing C (Fig. 2), but production
as a dedicated energy crop has yet to be demonstrated
and no life-cycle assessments of this cropping system
have been completed. The estimates for FGLT shown in
Fig. 1 reflect only the terrestrial C emissions. In the case
of palm oil, prior land management and the recycling of
fruiting bodies and fronds are critical management con-
siderations that determine whether this energy produc-
tion system is a net source or sink of GHG.
Not all cropping systems, however, have manage-
ment options that can ‘swing’ the environmental
impact. Soybean serves as an example of this because,
although it has high NUE – a trait favorable for bioener-
gy crops, it has a low yield relative to other crops and
thus the production of soybean incurs a large C foot-
print per unit area of land.
The international debate about the benefits of biofuels
is not likely to be resolved with a generalized view of
bioenergy impact assessment because management
approaches vary regionally. The case studies reviewed
here clearly indicate that a diversified assessment
approach is needed to account for many management
practices that can swing the overall impact of bioenergy
crop production from negative to positive or vice versa.
The management swing potential is a key part of the
sustainability puzzle, but is underrepresented in the
policy debates that will decide the future role of bioen-
ergy in mitigating climate change.
Acknowledgments
This work is the product of a meeting held at Rothamsted in2011 and was cofunded by the UK Biotechnology and Biologi-cal Sciences Research Council (BBSRC) and the Energy Tech-nologies Institute (ETI).
References
Adachi M, Ito A, Ishida A, Kadir W, Ladpala P, Yamagata Y (2011) Carbon budget
of tropical forests in Southeast Asia and the effects of deforestation: an approach
using a process-based model and field measurements. Biogeosciences, 8,
2635–2647.
Adler PR, Del Grosso SJ, Parton WJ (2007) Life-cycle assessment of net greenhouse-
gas flux for bioenergy cropping systems. Ecological Applications, 17, 675–691.
Akiyama H, Yan X, Yagi K (2010) Evaluation of effectiveness of enhanced-efficiency
fertilizers as mitigation options for N2O and NO emissions from agricultural
soils: meta-analysis. Global Change Biology, 16, 1837–1846.
Anderson-Teixeira KJ, Davis SC, Masters MD, DeLucia EH (2009) Changes in soil
organic carbon under biofuel crops. Global Change Biology BioEnergy, 1, 75–96.
Arbex MA, Martins LC, deOliveira RC et al. (2007) Air pollution from biomass burn-
ing and asthma hospital admissions in a sugar cane plantation area in Brazil.
Journal of Epidemiology and Community Health, 61, 395–400.
Ball BC, Scott A, Parker JP (1999) Field N2O, CO2, and CH4 fluxes in relation to
tillage, compaction and soil quality in Scotland. Soil and Tillage Research, 53,
29–39.
Bartle J (2009) Integrated production systems. In: Agronomy for Sustainable Develop-
ment (eds Nuber I, George B, Reid R), pp. 267–280. CSIRO Publishing, Colling-
wood, Australia.
Bartle J, Abadi A (2010) Toward sustainable production of second generation bioen-
ergy feedstocks. Energy & Fuels, 24, 2–9.
Bell S (2005) Constructing sustainable rural landscapes: oil mallees and the Western
Australian wheatbelt. Geographical Research, 43, 194–208.
Bennell M, Hobbs T (2009) Evaluating agroforestry species and industries for lower
rainfall regions of southeastern Australia. Florasearch, 1a, 221.
Bird DN, Cowie A, Cherubini F, Jungmeier G (2011) Using a Life Cycle Assessment
Approach to Estimate the Net GHG Emissions of Bioenergy. IEA Bioenergy, Paris,
France, 20pp.
Boddey RM, Soares LH B, Alves BJR, Urquiaga S (2008) Bio-ethanol production in
Brazil. Chapter 13. In: Biofuels, Solar and Wind as Renewable Energy Systems: Benefits
and Risks (ed. Pimentel D), pp 321–356. Springer, New York.
Bot A, Nachtergaele R, Young A (2000) Land Resource Potential and Constraints at
Regional and Country Levels. Land and Water Development Division, Food and
Agriculture Organization of the United Nations, Rome.
Buyanovsky G, Wagner G (1998) Carbon cycling in cultivated lands and its global
significance. Global Change Biology, 4, 131–141.
Campos DC (2003) Potencialidade do sitema de colheita sem queima da cana-de-acucar para
o sequestro de carbono. Universidade de Sao Paulo, Sao Paulo, SP, Brazil.
Cavalett O, Ortega E (2009) Integrated environmental assessment of biodiesel pro-
duction from soybean in Brazil. Journal of Cleaner Production, 18, 53–70.
Chaer G, Resende AS, Campello E, de Faria S, Boddey RM (2011) Nitrogen-fixing
legume tree species for the reclamation of severely degraded lands in Brazil. Tree
Physiology, 31, 139–149.
Cherubini F, Bird ND, Cowie A, Jungmeier G, Schlamadinger B, Woess-Gallasch S
(2009) Energy- and greenhouse gas-based LCA of biofuel and bioenergy systems: key
issues, ranges and recommendations. Resources Conservation & Recycling, 53, 434–447.
Choo Y, Muhamad H, Hashim Z, Subramaniam V, Puah C, Tan Y (2011) Determina-
tion of GHG contributions by subsystems in the oil palm supply chain using the
LCA approach. International Journal of Life Cycle Assessment, 16, 669–681.
Corley R, Tinker B (2003) The Oil Palm. 4th edn. Blackwell Science, Oxford.
Couwenberg J, Dommain R, Joosten H (2010) Greenhouse gas fluxes from tropical
peatlands in South-east Asia. Global Change Biology, 16, 1715–1732.
Crutzen PJ, Mosier AR, Smith KA, Winiwarter W (2008) N2O release from agro-bio-
fuel production negates global warming reduction by replacing fossil fuels. Atmo-
spheric Chemistry and Physics, 8, 389–395.
Dale VH, Kline KL, Wright LL, Perlack RD, Downing M, Graham RL (2011) Interac-
tions among bioenergy feedstock choices, landscape dynamics, and land use. Eco-
logical Applications, 21, 1039–1054.
Danielson F, Beukema H, Burgess ND et al. (2009) Biofuel plantations on forested
lands: double jeopardy for biodiversity and climate. Conservation Biology, 23, 348–
358.
Davis SC, Anderson-Teixeira KJ, DeLucia EH (2009) Life-cycle analysis and the ecol-
ogy of biofuels. Trends in Plant Science, 14, 140–146.
Davis SC, Parton WJ, Dohleman FG, Smith CM, Del Grosso S, Kent AD, DeLucia EH
(2010) Comparative biogeochemical cycles of bioenergy crops reveal nitrogen-fix-
ation and low greenhouse gas emissions in a Miscanthus 9 giganteus agro-ecosys-
tem. Ecosystems, 13, 144–156.
Davis SC, Parton WJ, Del Grosso SJ, Keough C, Marx E, Adler PR, DeLucia EH
(2012) Impact of second-generation biofuel agriculture on greenhouse gas emis-
sions in the corn-growing regions of the US. Frontiers in Ecology and the Environ-
ment, 10, 69–74.
De Vries S, van de Ven G, van Ittersum M, Giller K (2010) Resouce use efficiency
and environmental performance of nine major biofuel crops, processed by first-
generation conversion techniques. Biomass and Bioenergy, 34, 588–601.
Dewi S, Khasanah N, Rahayu S, Ekadinata A, van Noordwijk M (2009) Carbon Foot-
print of Indonesian Palm Oil Production: A Pilot Study. World Agroforestry Centre -
ICRAF SEA Regional Office, Bogor, Indonesia.
Dias de Oliveira ME, Vaughan BE, Rykiel EJ Jr (2005) Ethanol as fuel: energy, carbon
dioxide balances, and ecological footprint. BioScience, 55, 593–602.
DOE (2006) Breaking the biological barriers to cellulosic ethanol: A joint research
agenda. US Department of Energy. Report SC-0095.
Published 2013
This article is a US Government work and is in the public domain in the USA, GCB Bioenergy, 5, 623–638
636 S . C. DAVIS et al.

Don A, Schumacher J, Freibauer A (2011) Impact of tropical land-use change on soil
organic carbon stocks - a meta-analysis. Global Change Biology, 17, 1658–1670.
Dondini M, Hastings A, Saiz G, Jones MB, Smith P (2009) The potential of Miscan-
thus to sequester carbon in soil: comparing field measurements in Carlow, Ireland
to model predictions. Global Change Biology Bioenergy, 1, 413–425.
EPA (2010) Renewable Fuel Standard Program (RFS2) Regulatory Impact Analysis. US
Environmental Protection Agency, Washington, DC.
Fairhurst T, Mutert E (1997) The Industrial Use of Oil Palm Fibre: Possible Effects on
Plant Nutrient Cycles and Sustainability. In: International Planters Conference on
Plantation Management for 21st Century. Incorp. Soc. Planters, Kuala Lumpur.
Fargione J, Hill J, Tilman D, Polasky S, Hawthorne P (2008) Land clearing and the
biofuel carbon debt. Science, 319, 1235–1238.
Farine D, O’Connell D, Raison R et al. (2012) An assessment of biomass for bioelec-
tricity and biofuel, and for greenhouse gas emission reduction in Australia. GCB
Bioenergy, 4, 148–175.
Farrell A, Plevin R, Turner B, Jones AD, O’Hare M, Kammen DM (2006) Ethanol can
contribute to energy and environmental goals. Science, 311, 506–508.
de Figueiredo EB, La Scala N Jr (2011) Greenhouse gas balance due to the conver-
sion of sugarcane areas from burned to green harvest in Brazil. Agriculture Ecosys-
tems and Environment, 141, 77–85.
Flynn H, Mila i Canals L, Keller E et al. (2012) Quantifying global greenhouse gas
emissions from land use change for crop production. Global Change Biology, 18,
1622–1635.
Forest Stewardship Council (2010) U.S. National Forest Management Standard, Doc-
ument no. FCS-US 2010 FSC-US Forest Management Standard (v1.0) pp122.
Available at: http://ic.fsc.org/fsc-us-forest-management-standard-v1.299.htm
(accessed 8 November 2012)
Forster P, Ramaswamy V, Artaxo P et al. (2007) Changes in atmospheric constituents
and in radiative forcing. In: Climate Change 2007: The Physical Science Basis. Contri-
bution of Working Group I to the Fourth Assessment Report of the Intergovernmental
Panel on Climate Change (eds Solomon S, Qin D, Manning M, Chen Z, Marquis M,
Averyt K, Tignor M, Miller HL). Cambridge University Press, Cambridge, UK
and New York, NY, USA.
Froese R, Shonnard D (2010) An evaluation of greenhouse gas mitigation options for
coal-fired power plants in the US Great Lakes States. Biomass and Bioenergy, 34,
251–262.
Galdos MV, Cerri CC, Lal R, Bernoux M, Feigl BE, Cerri CEP (2010) Net greenhouse
gas fluxes in Brazilian ethanol production systems. Global Change Biology Bioener-
gy, 2, 37–44.
Gazzoni D, Felici P, Coronato R (2006) Energy balance of soybean and sunflower cul-
tures for biodiesel. Congresso da Rede Brasileira de Tecnologia do Biodiesel, 1, 12–17.
Gelfand I, Zenone T, Jasrotia P, Chen J, Hamilton S, Robertson G (2011) Carbon debt
of Conservation Reserve Program (CRP) grasslands converted to bioenergy pro-
duction. PNAS, 108, 13864–13869.
George B, Cowie A (2011) Bioenergy systems, soil health and climate change. In: Soil
Health and Climate Change (eds Singh B, Cowie A, Chang K), pp. 369–397.
Springer.
George B, Nicholas I (2012) Developing options for integrated food-energy systems -
volume 1. In: Promising Resources and Systems for Producing Bioenergy Feedstocks,
pp. 24. International Energy Agency Bioenergy Task 43, Tamworth, Australia.
Germer J, Sauerborn J (2008) Estimation of the impact of oil palm plantation estab-
lishment on greenhouse gas balance. Environment, Development and Sustainability,
10, 697–716.
Godoi RHM, Godoi AFL, Worobiec A, Andrade SJ, de Hoog J, Santiago-Silva MR,
Van Grieken R (2004) Characterisation of sugar cane combustion particles in the
Araraquara region, southeast Brazil. Microchimica Acta, 145, 53–56.
Hassan M, Jaramillo P, Griffin W (2011) Life cycle GHG emissions from Malaysian
oil palm bioenergy development: the impact on transportation sector’s energy
security. Energy Policy, 39, 2615–2625.
Hastings A, Clifton-Brown J, Wattenbach M, Mitchell CP, Smith P (2009a) Improved
process descriptions for leaf area index development and photosynthesis rates in
Miscanthus 9 giganteus: towards more robust yield predictions under different
climatic and soil conditions. Global Change Biology Bioenergy, 1, 154–170.
Hastings A, Clifton-Brown J, Wattenbach M, Mitchell CP, Stampfl P, Smith P (2009b)
Future energy potential of Miscanthus in Europe. Global Change Biology Bioenergy,
1, 180–196.
Heaton EA, Dohleman FG, Long SP (2008a) Meeting US biofuel goals with less land:
the potential of Miscanthus. Global Change Biology, 14, 2000–2014.
Heaton EA, Flavell RB, Mascia PN, Thomas SR, Dohleman FG, Long SP (2008b) Her-
baceous energy crop development: recent progress and future prospects. Current
Opinion in Biotechnology, 19, 202–209.
Heaton EA, Dohleman FG, Long SP (2009) Seasonal nitrogen dynamics of Miscan-
thus 9 giganteus and Panicum virgatum. Global Change Biology Bioenergy, 1,
297–307.
Hergoualc’h K, Verchot L (2011) Stocks and fluxes of carbon associated with land
use change in Southeast Asian tropical peatlands: a review. Global Biogeochemical
Cycles, 25, 1–3.
Hertel TW, Golub AA, Jones AD, O’Hare M, Plevin R, Kammen DM (2010) Effects
of US maize ethanol on global land use and greenhouse gas emissions: estimating
market-mediated responses. BioScience, 60, 223–231.
Hillier J, Whittaker C, Dailey G et al. (2009a) Greenhouse gas emissions from four
bioenergy crops in England and Wales: integrating spatial estimates of yield and
soil carbon balance in life cycle analyses. Global Change Biology Bioenergy, 1,
267–281.
Hillier J, Hawes C, Squire G, Hilton A, Wale S, Smith P (2009b) The carbon foot-
prints of food crop production. International Journal of Agricultural Sustainability, 7,
107–118.
Hobbs T, Bartle J (2009) Prioritization of regional woody crop industries. In: Regional
Industry Potential for Woody Biomass Crops in Lower Rainfall Southern Australia (eds
Hobbs T, Bennell M, Bartle J), pp. 256. RIRDC, Canberra, Australia.
Hoefnagels R, Smeets E, Faaij A (2010) Greenhouse gas footprints of different biofuel
production systems. Renewable and Sustainable Energy Reviews, 14, 1661–1694.
Hooijer A, Silvius M, Woesten H, Page S (2006) PEATCO2, Assessment of CO2 emis-
sions from drained peatlands in SE Asia. Delft Hydraulics. Report no. Q3943.
Hooijer A, Page S, Canadell J, Silvius M, Kwadijk J, Wosten H, Jauhiainen J (2010)
Current and future CO2 emissions from drained peatlands in Southeast Asia. Bio-
geosciences, 7, 1505–1514.
IBGE (2012) Instituto Brasileiro de Geografia e Estat�ıstica. Retrieved February 7th,
2012, from http://www.sidra.ibge.gov.br/bda/
IPCC (2006) Guidelines for National Greenhouse Gas Inventories. Agriculture, Forestry and
Other Land Use, Volume 4 [Chapter 11]. Institute for Global Environmental Strate-
gies (IGES), Hayama, Kanagawa, Japan.
Jensen E, Peoples M, Boddey RM, Gresshoff P, Hauggaard-Nielsen H, Alves BJR,
Morrison M (2011) Legumes for mitigation of climate change and feedstock in
a bio-based economy - A review. Agronomy for Sustainable Development, 32,
329–364.
Khasanah N, van Noordwijk M, Ekadinata A et al. (2012) The Carbon Footprint of
Indonesian Palm Oil Production. Technical Brief 25: palm oil series. World Agrofor-
estry Centre (ICRAF), Southeast Asia Regional Program, Bogor, Indonesia.
Kim S, Dale BE (2005) Environmental aspects of ethanol derived from no-tilled corn
grain: non-renewable energy consumption and greenhouse gas emissions. Biomass
and Bioenergy, 28, 475–489.
Lara-Cabezas AR, Trivellin PCO, Bendassolli JA, Santana DG, Gascho GJ (1999) Cali-
bration of a semi-open static collector for determination of ammonia volatilization
from nitrogen fertilizers. Communications in Soil Science and Plant Analysis, 30, 389
–406.
Laurance W, Koh L, Butler R et al. (2010) Improving the performance of the roundta-
ble on sustainable palm oil for nature conservation. Conservation Biology, 24, 377–
381.
Lewandowski I, Kicherer A (1997) Combustion quality of biomass: practical rele-
vance and experiments to modify the biomass quality of Miscanthus 9 giganteus.
European Journal of Agronomy, 6, 163–177.
Lewandowski I, Scurlock JMO, Lindvall E, Christou M (2003) The development and
current status of perennial rhizomatous grasses as energy crops in the US and
Europe. Biomass and Bioenergy, 25, 335–361.
Luca EF, Feller C, Cerri CC, Barthes B, Chaplot V, Campos DC, Manchini C (2008)
Avaliacao de atributos fisicos e estoques de carbono e nitrogenio em solos com
queima e sem queima de canavial. Revista Brasileira de Ciencia do Solo, 32, 789–800.
Macedo M, Resende AS, Garcia P et al. (2008) Changes in soil C and N stocks and
nutrient dynamics 13 years after recovery of degraded land using leguminous
nitrogen-fixing trees. Forest Ecology and Management, 255, 1516–1524.
Manomet Center for Conservation Sciences (2010) Massachusetts Biomass Sustain-
ability and Carbon Policy Study: Report to the Commonwealth of Massachusetts
Department of Energy Resources. Brunswick, Maine. Report NCI-2010-03.
Melillo J, Reilly J, Kicklighter D et al. (2009) Indirect emissions from biofuels: how
important are they? Science, 326, 5958.
Milthorpe P, Hillan J, Nicol H (1994) The effect of time of harvest, fertilizer and irri-
gation on dry matter and oil production of blue mallee. Industrial Crops and Prod-
ucts, 3, 165–173.
Nair P, Saha S, Nair V, Haile S (2011) Potential for greenhouse gas emissions from
soil carbon stock following biofuel cultivation on degraded lands. Land Degrada-
tion and Development, 22, 395–409.
Published 2013
This article is a US Government work and is in the public domain in the USA, GCB Bioenergy, 5, 623–638
MANAGEMENT SWING POTENTIAL 637

Nogueira L (2010) Does biodiesel make sense? Energy, 36, 3659–3666.
Ogle S, Del Grosso S, Adler PR, Parton WJ (2008) Soil nitrous oxide emissions with
crop production for biofuel: implications for greenhouse gas mitigation. Biofuel,
Food, and Feed Tradeoffs, http://www.farmfoundation.org/news/articlefiles/371-
2-Ogle.pdf, accessed 2 July 2012, 11-18.
Olchin G, Ogle S, Frey S, Filley T, Paustian K (2008) Residue carbon stabilization in
soil aggregates of no-till and tillage management of dryland cropping systems.
Soil Biology and Biochemistry, 72, 507–513.
Olsen G, Cooper D, Huxtable D, Carslake J, Bartle JR (2004) Search project report.
Section 1 - summary. Pp. 98. Western Australian Government, Perth, Australia.
Parish F, Sirin A, Charman D, Joosten H, Minaveva T, Silvius-Mas L, eds. (2008)
Assessment on Peatlands, Biodiversity and Climate Change. Global Environment Cen-
tre of Kuala Lumpur and Wetlands International, Wageningen.
Patthanaissaranukool W, Polprasert C (2011) Carbon mobilization in oil palm planta-
tion and milling based on a carbon-balanced model - a case study in Thailand.
Environment Asia, 4, 17–26.
Paustian K, Andren O, Janzen H et al. (1997) Agricultural soils as a sink to mitigate
CO2 emissions. Soil Use and Management, 13, 230–244.
Peck A, Sudmeyer R, Huxtable D, Bartle J, Mendham D (2011) Productivity of mallee
agroforestry systems under various harvest and competition management regimes. Aus-
tralian Government; Rural Industries Research and Development Corporation.
Report no. 10; RIRDC Project No. PRJ-000729, Canberra, Australia.
PMSEIC (2010) Challenges at Energy-Water-Carbon Intersections. pp. 88. Prime Minis-
ter’s Science, Engineering and Innovation Council, Canberra, Australia.
Powers J, Corre M, Twine T, Veldkamp E (2011) Geographic bias of field observa-
tions of soil carbon stocks with tropical land-use changes precludes spatial
extrapolation. PNAS, 108, 6318–6322.
Reijnders L (2011) The life cycle emission of greenhouse gases associated with plant
oils used as biofuel. Renewable Energy, 36, 879–880.
Reijnders L, Huijbregts M (2008) Palm oil and the emission of carbon-based green-
house gases. Journal of Cleaner Production, 16, 477–482.
Renouf MA, Wegener MK, Nielsen LK (2008) An environmental life cycle assess-
ment comparing Australian sugarcane with US corn and UK sugar beet as pro-
ducers of sugars for fermentation. Biomass and Bioenergy, 32, 1144–1155.
Resende AS, Xavier RP, Oliveira OC, Urquiaga S, Alves BJR, Boddey RM (2006)
Long-term effects of pre-harvest burning and nitrogen and vinasse applications
on yield of sugarcane and soil carbon and nitrogen stocks on a plantation in Per-
nambuco, N.E. Brazil. Plant and Soil, 281, 339–351.
Richards A, Forrester DI, Bauhus J, Scherer-Lorenzen M (2010) The influence of
mixed tree plantations on the nutrition of individual species: a review. Tree Physi-
ology, 30, 1190–1208.
Roberts AM, Helmers MJ, Fillery IRP (2009) The adoptability of perennial-based
farming systems for hydrologic and salinity control in dryland farming systems
in Australia and the United States of America. Crop & Pasture Science, 60, 83–99.
Sanhueza E (2009) Potential emissions of Kyoto and no-Kyoto climate active com-
pounds in the production of sugarcane ethanol. Interciencia, 34, 8–16.
Santoso D (1996) Soil fertility management for reclamation of Imperata grasslands
by smallholder agroforestry. Agroforestry Systems, 18, 1–202.
Santoso D, Adiningsih S, Mutert E, Fairhurst T, van Noordwijk M (1997) Site
improvement and soil fertility management for reclamation of Imperata grass-
lands by smallholder agroforestry. Agroforestry Systems, 36, 181–202.
Sartori F, Lal R, Ebinger MH, Parrish DJ (2006) Potential soil carbon sequestration
and CO2 offset by dedicated energy crops in the USA. Critical Reviews in Plant Sci-
ences, 25, 441–472.
Searchinger T, Heimlich R, Houghton RA et al. (2008) Use of US croplands for biofu-
els increases greenhouse gases through emissions from land-use change. Science,
319, 1238–1240.
Sheil D, Casson A, Meijaard E et al. (2009) The Impacts and Opportunities of Oil Palm in
Southeast Asia. Center for International Forestry Research (CIFOR), Bogor, Indonesia.
Siangiaeo S, Gheewala S, Unnanon K, Chidthaisong A (2011) Implications of land
use change on the life cycle greenhouse gas emissions from palm biodiesel pro-
duction in Thailand. Energy for Sustainable Development, 15, 1–7.
Sisti C, dos Santos H, Kohhann R, Alves BJR, Urquiaga S, Boddey RM (2004) Change
in carbon and nitrogen stocks in soil under 13 years of conventional or zero till-
age in southern Brazil. Soil & Tillage Research, 76, 39–58.
Smeets EMW, Bouwman LF, Stehfest E, van Vuureen DP, Posthuma A (2009) Contri-
bution of N2O to the greenhouse gas balance of first-generation biofuels. Global
Change Biology, 15, 1–23.
Smith P, Martino D, Cai Z et al. (2008) Greenhouse gas mitigation in agriculture. Phil
Trans Royal Society B, 363, 789–813.
Soares LH, Alves BJR, Urquiaga S, Boddey RM (2009) Mitigac�~ao das emissoes de
gases efeito estufa pelo uso de etanol de cana de cana de ac��ucar produzido no
Brasil. Embrapa Agrobiiologia. Report no. Circular Tecnico 27.
Somerville C, Youngs H, Taylor C, Davis SC, Long SP (2010) Feedstocks for Ligno-
cellulosic Fuels. Science, 13, 790–792.
Souza ZM, Prado RM, Paixao ACS, Cesarin LG (2005) Sistemas de colheita e manejo
da palhada de cana de ac��ucar. Pesquisa Agropecuaria Brasileira, 40, 271–278.St Clair S, Hiller J, Smith P (2008) Estimating the pre-harvest greenhouse gas costs of
energy crop production. Biomass and Bioenergy, 32, 442–452.
Stichnothe H, Schuchardt F (2011) Life cycle assessment of two palm oil production
systems. Biomass and Bioenergy, 35, 3976–3984.
Sudmeyer RA, Daniels T, Jones H, Huxtable D (2012) The extent and cost of mallee–
crop competition in unharvested carbon sequestration and harvested mallee bio-
mass agroforestry systems. Crop and Pasture Science, 63, 555–569.
Tan K, Lee K, Mohamed A, Bhatia S (2009) Palm oil: addressing issues and towards
sustainable development. Renewable and Sustainable Energy Reviews, 13, 420–427.
Tucker SN, Tharumarajah A, May B et al. (2009) Life Cycle Inventory of Australian For-
estry and Wood Products. pp. 84. CSIRO, Melbourne, Australia.
van Noordwijk M, Woomer P, Cerri CC, Bernoux M, Nugroho K (1997) Soil carbon
in the humid tropical forest zone. Geoderma, 79, 187–225.
van Noordwijk M, Suyamto DA, Lusiana B, Ekadinata A, Hairiah K (2008) Facilitat-
ing agroforestation of landscapes for sustainable benefits: tradeoffs between car-
bon stocks and local development benefits in Indonesia according to the
FALLOW model. Agriculture, Ecosystems & Environment, 126, 98–112.
Vera-Diaz MC, Kaufmann RK, Nepstad DC, Schlesinger P (2008) An interdisciplin-
ary model of soybean yield in the Amazon Basin: the climatic, edaphic, and eco-
nomic determinants. Ecological Economics, 65, 420–431.
Verhoeven J, Setter T (2010) Agricultural use of wetlands: opportunities and limita-
tions. Annals of Botany, 105, 155–163.
Volpi G (2010) Biofuels in Brazil and land use change. Journal of Biobased Materials
and Bioenergy, 4, 211–220.
Wang M, Wu M, Huo H (2007) Life-cycle energy and greenhouse gas emission
impacts of different corn ethanol plant types. Environmental Research Letters, 2,
1–13.
Wang WJ, Moody PW, Reeves SH, Salter B, Dalal RC (2008) Proceedings of the 2008
Conference of the Australian Society of Sugar Cane Technologists. pp 87–94.
Townsville, Queensland, Australia.
Wang WJ, Dalal RC, Reeves SH, Butterbach-Bahl K, Kiese R (2011) Greenhouse gas
fluxes from an Australian subtropical cropland under long-term contrasting man-
agement regimes. Global Change Biology, 17, 3089–3101.
Weier KL (1998) Sugarcane fields: sources or sinks for greenhouse gas emissions?
Australian Journal of Agricultural Research, 49, 1–10.
Weih M (2004) Intensive short rotation forestry in boreal climates: present and future
perspectives. Canadian Journal of Forest Research, 34, 1369–1378.
West T, Post W (2002) Soil organic carbon sequestration rates by tillage and crop
rotation: a global data analysis. Soil Science Society of America Journal, 66, 1930–
1946.
Wicke B, Dornburg V, Junginger M, Faaij A (2008) Different palm oil production sys-
tems for energy purposes and their greenhouse gas implications. Biomass and Bio-
energy, 32, 1322–1337.
Wildy D, Pate J, Sefcik LT (2004) Water-use efficiency of a mallee eucalypt growing
naturally and in short-rotation coppice cultivation. Plant and Soil, 262, 111–128.
Williams AG, Audsley E, Sandars DL (2006) Determining the Environmental Burdens &
Resource Use in the Production of Agricultural & Horticultural Commodities. Natural
Resource Management Institute, Cranfield University, Cranfield, UK.
Wu H, Fu Q, Giles , R.; Bartle , J (2008) Production of mallee biomass in Western
Australia: energy balance analysis. Energy & Fuels, 22, 190–198.
Yu Y, Wu H (2010) Bioslurry as a fuel. 2. Life-cycle energy and carbon footprints of
bioslurry fuels from mallee biomass in western Australia. Energy & Fuels, 24, 5660
–5668.
Yu Y, Bartle J, Wu H (2008) Production of Mallee Biomass in Western Australia: Life
Cycle Greenhouse Gas Emissions. In: Chemeca 2008: Towards a Sustainable Australa-
sia. pp 1260–1272. Engineers Australia, Barton, ACT.
Yu Y, Bartle J, Li CZ, Wu H (2009) Mallee biomass as a key bioenergy souce in
Western Australia: importance of biomass supply chain. Energy & Fuels, 23,
3290–3299.
Published 2013
This article is a US Government work and is in the public domain in the USA, GCB Bioenergy, 5, 623–638
638 S . C. DAVIS et al.