Faradaic electro-swing reactive adsorption for CO2 capture
18
3530 | Energy Environ. Sci., 2019, 12, 3530--3547 This journal is © The Royal Society of Chemistry 2019 Cite this: Energy Environ. Sci., 2019, 12, 3530 Faradaic electro-swing reactive adsorption for CO 2 capture† Sahag Voskian and T. Alan Hatton * Carbon capture is one of the foremost methods for curtailing greenhouse gas emissions. Incumbent technologies are inherently inefficient due to thermal energy losses, large footprint, or degradation of sorbent material. We report a solid-state faradaic electro-swing reactive adsorption system comprising an electrochemical cell that exploits the reductive addition of CO 2 to quinones for carbon capture. The reported device is compact and flexible, obviates the need for ancillary equipment, and eliminates the parasitic energy losses by using electrochemically activated redox carriers. An electrochemical cell with a polyanthraquinone–carbon nanotube composite negative electrode captures CO 2 upon charging via the carboxylation of reduced quinones, and releases CO 2 upon discharge. The cell architecture maximizes the surface area exposed to gas, allowing for ease of stacking of the cells in a parallel passage contactor bed. We demonstrate the capture of CO 2 both in a sealed chamber and in an adsorption bed from inlet streams of CO 2 concentrations as low as 0.6% (6000 ppm) and up to 10%, at a constant CO 2 capacity with a faradaic efficiency of 490%, and a work of 40–90 kJ per mole of CO 2 captured, with great durability of electrochemical cells showing o30% loss of capacity after 7000 cylces. Broader context There is a clear scientific consensus on the role of anthropogenic greenhouse gas (GHG) emissions in the unusually wild fluctuations of global climate patterns over the last century, to which carbon dioxide is the largest contributor. This has generated a scientific tide in the study of carbon removal techniques over the last three decades, which has slowly gathered momentum, culminating in the 2015 Paris Agreement, which heavily emphasized the role of carbon removal by tackling emissions or via negative emissions technologies. While a path forward for carbon capture is being shaped by a mix of incumbent actors and newcomers, the great majority of the proposed processes rely on conventional concepts. Moreover, most of these processes have a large balance of plant which hinders their potential to flexibly adapt to the multi-scale nature of carbon capture. Herein, we demonstrate a new approach which presents a paradigm shift in adsorption type processes and carbon capture. The electro-swing basis of our process allows its linear scaling with desired capacity and lends it geometric flexibility. It also allows carbon capture from streams of any concentration, and its release into any carrier streams, including pure CO 2 , with a low balance of plant. Introduction With the alarming increase in the atmospheric concentration of carbon dioxide (CO 2 ) and its implications for global climate pattern developments, 1,2 mitigation of climate change through curtailment of anthropogenic CO 2 emissions has been one of the most urgent socioeconomic and scientific problems in the global arena over the last decade. 3 To this end, a number of technologies have been developed for the large-scale capture of CO 2 from combustion and other industrial processes to produce high-purity CO 2 streams for storage or valorization. 4 The most mature of these technologies are solvent scrubbing, mainly amine scrubbing, 5 and oxyfuel combustion, 6 which target high CO 2 concentration streams (410%). These approaches have a large footprint and, when retrofitted to a process, can require major modifications to the plant. Consequently, there has been a major effort to develop new materials and processes for high efficiency CO 2 -capture, including sorbents for pressure and temperature swing adsorption systems, 7 and membranes for selective transport of the CO 2 . 8 Furthermore, many potential applications of carbon capture require compact devices due to space limitations, such as in the direct capture of CO 2 from tailpipe exhausts on board mobile sources, in which there is growing interest given the large contribution of transportation exhaust to greenhouse gas emissions (33.5% of U.S. CO 2 emissions in 2016). 9 In addition to the capture of CO 2 from direct combustion processes, there is a need to remove CO 2 from enclosed spaces Department of Chemical Engineering, Massachusetts Institute of Technology, Cambridge, MA 02139, USA. E-mail: [email protected] † Electronic supplementary information (ESI) available. See DOI: 10.1039/c9ee02412c Received 28th July 2019, Accepted 30th September 2019 DOI: 10.1039/c9ee02412c rsc.li/ees Energy & Environmental Science PAPER Open Access Article. Published on 01 October 2019. Downloaded on 1/10/2022 10:20:00 PM. This article is licensed under a Creative Commons Attribution-NonCommercial 3.0 Unported Licence. View Article Online View Journal | View Issue
-
Upload
khangminh22 -
Category
Documents
-
view
3 -
download
0
Transcript of Faradaic electro-swing reactive adsorption for CO2 capture

3530 | Energy Environ. Sci., 2019, 12, 3530--3547 This journal is©The Royal Society of Chemistry 2019
Cite this: Energy Environ. Sci.,
2019, 12, 3530
Faradaic electro-swing reactive adsorption forCO2 capture†
Sahag Voskian and T. Alan Hatton *
Carbon capture is one of the foremost methods for curtailing greenhouse gas emissions. Incumbent
technologies are inherently inefficient due to thermal energy losses, large footprint, or degradation of
sorbent material. We report a solid-state faradaic electro-swing reactive adsorption system comprising
an electrochemical cell that exploits the reductive addition of CO2 to quinones for carbon capture. The
reported device is compact and flexible, obviates the need for ancillary equipment, and eliminates the
parasitic energy losses by using electrochemically activated redox carriers. An electrochemical cell with
a polyanthraquinone–carbon nanotube composite negative electrode captures CO2 upon charging
via the carboxylation of reduced quinones, and releases CO2 upon discharge. The cell architecture
maximizes the surface area exposed to gas, allowing for ease of stacking of the cells in a parallel passage
contactor bed. We demonstrate the capture of CO2 both in a sealed chamber and in an adsorption bed
from inlet streams of CO2 concentrations as low as 0.6% (6000 ppm) and up to 10%, at a constant CO2
capacity with a faradaic efficiency of 490%, and a work of 40–90 kJ per mole of CO2 captured, with
great durability of electrochemical cells showing o30% loss of capacity after 7000 cylces.
Broader contextThere is a clear scientific consensus on the role of anthropogenic greenhouse gas (GHG) emissions in the unusually wild fluctuations of global climate patternsover the last century, to which carbon dioxide is the largest contributor. This has generated a scientific tide in the study of carbon removal techniques over thelast three decades, which has slowly gathered momentum, culminating in the 2015 Paris Agreement, which heavily emphasized the role of carbon removal bytackling emissions or via negative emissions technologies. While a path forward for carbon capture is being shaped by a mix of incumbent actors andnewcomers, the great majority of the proposed processes rely on conventional concepts. Moreover, most of these processes have a large balance of plant whichhinders their potential to flexibly adapt to the multi-scale nature of carbon capture. Herein, we demonstrate a new approach which presents a paradigm shift in adsorptiontype processes and carbon capture. The electro-swing basis of our process allows its linear scaling with desired capacity and lends it geometric flexibility. It also allowscarbon capture from streams of any concentration, and its release into any carrier streams, including pure CO2, with a low balance of plant.
Introduction
With the alarming increase in the atmospheric concentrationof carbon dioxide (CO2) and its implications for global climatepattern developments,1,2 mitigation of climate change throughcurtailment of anthropogenic CO2 emissions has been one ofthe most urgent socioeconomic and scientific problems in theglobal arena over the last decade.3 To this end, a number oftechnologies have been developed for the large-scale captureof CO2 from combustion and other industrial processes toproduce high-purity CO2 streams for storage or valorization.4
The most mature of these technologies are solvent scrubbing,
mainly amine scrubbing,5 and oxyfuel combustion,6 whichtarget high CO2 concentration streams (410%). These approacheshave a large footprint and, when retrofitted to a process, canrequire major modifications to the plant. Consequently, there hasbeen a major effort to develop new materials and processes forhigh efficiency CO2-capture, including sorbents for pressure andtemperature swing adsorption systems,7 and membranes forselective transport of the CO2.8 Furthermore, many potentialapplications of carbon capture require compact devices due tospace limitations, such as in the direct capture of CO2 fromtailpipe exhausts on board mobile sources, in which there isgrowing interest given the large contribution of transportationexhaust to greenhouse gas emissions (33.5% of U.S. CO2 emissionsin 2016).9
In addition to the capture of CO2 from direct combustionprocesses, there is a need to remove CO2 from enclosed spaces
Department of Chemical Engineering, Massachusetts Institute of Technology,
Cambridge, MA 02139, USA. E-mail: [email protected]
† Electronic supplementary information (ESI) available. See DOI: 10.1039/c9ee02412c
Received 28th July 2019,Accepted 30th September 2019
DOI: 10.1039/c9ee02412c
rsc.li/ees
Energy &EnvironmentalScience
PAPER
Ope
n A
cces
s A
rtic
le. P
ublis
hed
on 0
1 O
ctob
er 2
019.
Dow
nloa
ded
on 1
/10/
2022
10:
20:0
0 PM
. T
his
artic
le is
lice
nsed
und
er a
Cre
ativ
e C
omm
ons
Attr
ibut
ion-
Non
Com
mer
cial
3.0
Unp
orte
d L
icen
ce.
View Article OnlineView Journal | View Issue

This journal is©The Royal Society of Chemistry 2019 Energy Environ. Sci., 2019, 12, 3530--3547 | 3531
for ventilation purposes in buildings and car cabins, or forcabin environmental control systems on board spacecraft andsubmarines, where the maximum allowed CO2 concentration inhabitable spaces is 5000 ppm (or 0.5%).10 The first of suchsystems was developed by Winnick et al., for the electrochemicalcapture of CO2 in spacecraft cabins using molten carbonates.11
However, the low concentration of CO2 in such applicationsposes a challenge, mainly due to the low driving forces for masstransfer and the large quantities of other species present in airin addition to CO2.12 Thus, carbon capture is a multi-scaleproblem, where the CO2-rich streams to be treated vary greatlyin volume, concentration and composition, and different criterianeed to be fulfilled to ensure optimal processing depending onwhether sources are industrial or small-scale (e.g., power plantsor oil and gas heaters), concentrated or dilute (exhausts fromcombustion or air in confined spaces), and clean or contaminatedwith other pollutants.
Many of the CO2-capture chemical processes that involve acapture agent such as amines or solid sorbents require temperatureand/or pressure swings to release the captured CO2 and regeneratethe agents for further capture. These swings result in inefficienciesdue to energy wasted in heating solvents and sorbents, pressurizingfeed gas, or drawing a vacuum for desorption. Electrochemicalsystems can minimize such parasitic energy losses as they can beoperated at near isothermal conditions, with significantly higherefficiencies than their thermal-swing (TSA) and pressure-swing (PSA)adsorption counterparts.13 One mode of electrochemical capture ofCO2 is through the use of a redox-active carrier.
Electrochemically mediated selective transport of chemicalspecies was first reported by Ward et al.,14 where a redox-activecarrier (ferrous ion) was used to transport nitric oxide across amembrane. Since then, a number of systems have been developedfor transporting chemical species by redox-active carriers that areactivated at one electrode, to bind with the target species, anddeactivated at the opposite electrode, to release the target andregenerate the carrier.15,16 Systems that have been proposed forthe concentration of CO2 through this approach have been basedon a number of different carrier molecules, such as quinones,17–20
4,40-bipyridine,21 and thiolates.22,23 Quinones are of particularinterest to this work for their superior electrochemical performance,serving as redox-active carriers for CO2 in electrochemicallymediated separation processes. DuBois et al. demonstratedthis possibility, and studied the thermodynamics of an electro-chemical CO2 pumping system that utilizes quinones.18 Morework followed, where Scovazzo et al. demonstrated the electro-chemical separation of CO2 from o1% concentration gasmixtures using 2,6-di-tert-butyl-1,4-benzoquinone as a carrierin ionic liquid (IL) and organic solvent electrolytes media,19
while Gurkan et al. screened a number of ILs to serve as suitableelectrolytes for quinone carriers in an electrochemically mediatedselective transport system for CO2.20 All of these systems, however,require the transport of the electrolyte and the dissolved carriermolecules between two electrodes in an electrochemical cell forcapture and release of CO2. This limits their implementation ina number of applications where the requirement for flowsystems and pumping, and the large footprint, are problematic.
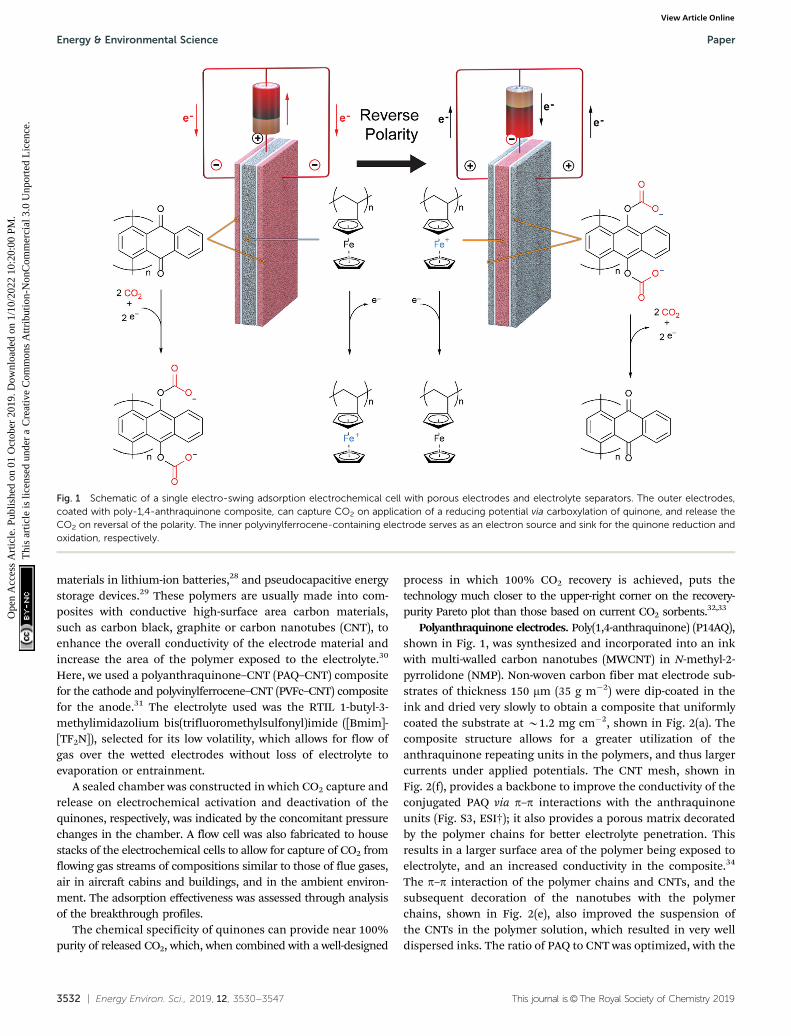
In this work, we develop a compact electrochemical devicefor CO2 capture that eliminates the requirement for complexflow systems, and that can be effective in the treatment of bothhigh and low concentration feed streams. A quinone-utilizingfaradaic electrochemical cell that fulfils these requirementsand operates as an Electro-Swing Adsorption (ESA) process isillustrated schematically in Fig. 1. The cell is comprised oftwo cathode electrode substrates coated with a CO2-bindingquinone–carbon nanotube (Q–CNT) composite sandwiching ananode electrode substrate coated with a ferrocene–CNT (Fc–CNT)composite, with separator membranes between the electrodes.This cell architecture is employed to maximize the CO2-bindingsurface area of the cell exposed to gas flow in a parallel passageadsorbent contactor design where stacks of these cells formparallel gas channels. The Fc–CNT electrode serves as an electronsource and sink for the reduction and oxidation, respectively, ofthe Q–CNT electrodes to regulate the uptake and release of theCO2. Wetting of porous non-woven carbon fiber mats used as theelectrode substrates by a room temperature ionic liquid (RTIL)electrolyte enables effective ionic currents to pass through theelectrolyte on activation and deactivation of the electrodes, andpermits the diffusion of CO2 into the electrolyte-wetted cathodesduring capture.
The effectiveness of the electro-swing concept for CO2 captureand release was demonstrated in a sealed system in which cellpolarity was cycled to regulate the activation and deactivation ofthe carrier, i.e. reduction and oxidation of the redox activequinone. This was in lieu of the advection of the carrier electrolytesolution between two electrodes with a difference in potential.19 Theperformance of flow-through modules constructed with stacks ofthe assembled electrode cells was also assessed. The CO2 captureprocesses were modelled to provide greater insight into theoperational principles for this technology.
Ultimately, the goal of this work was to demonstrate anelectrochemically activated packed parallel passage contactoradsorption system for the removal of CO2 from flue gas andother CO2-rich streams. The regeneration of the bed takes placeon reversal of the polarity of the stack in an ESA, with analogiesto PSA systems, where adsorption takes place at high pressureand desorption at a lower pressure,24 or TSA systems, whereadsorption takes place at low temperatures and the fixed bed isregenerated at higher temperatures.25
Results and discussionDesign of the electrochemical cell
Thin films of crystallized organic compounds have been studiedas a means of immobilizing CO2 redox-active carriers ontoelectrode substrates.26 Redox-active polymers have long beenthe preferred electrode material when using organic moleculesin electrochemical cells, however, because polymers are lesssoluble in the electrolyte than their corresponding redox-activerepeating units, and thus the self-discharge of the cell can beavoided, and its cycling performance improved.27 For example,quinone polymers have been investigated as suitable cathode
Paper Energy & Environmental Science
Ope
n A
cces
s A
rtic
le. P
ublis
hed
on 0
1 O
ctob
er 2
019.
Dow
nloa
ded
on 1
/10/
2022
10:
20:0
0 PM
. T
his
artic
le is
lice
nsed
und
er a
Cre
ativ
e C
omm
ons
Attr
ibut
ion-
Non
Com
mer
cial
3.0
Unp
orte
d L
icen
ce.
View Article Online
3532 | Energy Environ. Sci., 2019, 12, 3530--3547 This journal is©The Royal Society of Chemistry 2019
materials in lithium-ion batteries,28 and pseudocapacitive energystorage devices.29 These polymers are usually made into com-posites with conductive high-surface area carbon materials,such as carbon black, graphite or carbon nanotubes (CNT), toenhance the overall conductivity of the electrode material andincrease the area of the polymer exposed to the electrolyte.30
Here, we used a polyanthraquinone–CNT (PAQ–CNT) compositefor the cathode and polyvinylferrocene–CNT (PVFc–CNT) compositefor the anode.31 The electrolyte used was the RTIL 1-butyl-3-methylimidazolium bis(trifluoromethylsulfonyl)imide ([Bmim]-[TF2N]), selected for its low volatility, which allows for flow ofgas over the wetted electrodes without loss of electrolyte toevaporation or entrainment.
A sealed chamber was constructed in which CO2 capture andrelease on electrochemical activation and deactivation of thequinones, respectively, was indicated by the concomitant pressurechanges in the chamber. A flow cell was also fabricated to housestacks of the electrochemical cells to allow for capture of CO2 fromflowing gas streams of compositions similar to those of flue gases,air in aircraft cabins and buildings, and in the ambient environ-ment. The adsorption effectiveness was assessed through analysisof the breakthrough profiles.
The chemical specificity of quinones can provide near 100%purity of released CO2, which, when combined with a well-designed
process in which 100% CO2 recovery is achieved, puts thetechnology much closer to the upper-right corner on the recovery-purity Pareto plot than those based on current CO2 sorbents.32,33
Polyanthraquinone electrodes. Poly(1,4-anthraquinone) (P14AQ),shown in Fig. 1, was synthesized and incorporated into an inkwith multi-walled carbon nanotubes (MWCNT) in N-methyl-2-pyrrolidone (NMP). Non-woven carbon fiber mat electrode sub-strates of thickness 150 mm (35 g m�2) were dip-coated in theink and dried very slowly to obtain a composite that uniformlycoated the substrate at B1.2 mg cm�2, shown in Fig. 2(a). Thecomposite structure allows for a greater utilization of theanthraquinone repeating units in the polymers, and thus largercurrents under applied potentials. The CNT mesh, shown inFig. 2(f), provides a backbone to improve the conductivity of theconjugated PAQ via p–p interactions with the anthraquinoneunits (Fig. S3, ESI†); it also provides a porous matrix decoratedby the polymer chains for better electrolyte penetration. Thisresults in a larger surface area of the polymer being exposed toelectrolyte, and an increased conductivity in the composite.34
The p–p interaction of the polymer chains and CNTs, and thesubsequent decoration of the nanotubes with the polymerchains, shown in Fig. 2(e), also improved the suspension ofthe CNTs in the polymer solution, which resulted in very welldispersed inks. The ratio of PAQ to CNT was optimized, with the
Fig. 1 Schematic of a single electro-swing adsorption electrochemical cell with porous electrodes and electrolyte separators. The outer electrodes,coated with poly-1,4-anthraquinone composite, can capture CO2 on application of a reducing potential via carboxylation of quinone, and release theCO2 on reversal of the polarity. The inner polyvinylferrocene-containing electrode serves as an electron source and sink for the quinone reduction andoxidation, respectively.
Energy & Environmental Science Paper
Ope
n A
cces
s A
rtic
le. P
ublis
hed
on 0
1 O
ctob
er 2
019.
Dow
nloa
ded
on 1
/10/
2022
10:
20:0
0 PM
. T
his
artic
le is
lice
nsed
und
er a
Cre
ativ
e C
omm
ons
Attr
ibut
ion-
Non
Com
mer
cial
3.0
Unp
orte
d L
icen
ce.
View Article Online

This journal is©The Royal Society of Chemistry 2019 Energy Environ. Sci., 2019, 12, 3530--3547 | 3533
highest current per mass of active material (polymer) obtainedat a 1 : 3, PAQ : CNT ratio by weight (Fig. S4, ESI†). The cyclicvoltammograms in Fig. 3 shown in green (under N2) and red(under CO2) indicate the strong redox activity of these electrodesurfaces; the differences in the current response followingpotential scans are discussed later.
Polyvinylferrocene electrode. A counter electrode with areduction potential more positive than the oxidative CO2 releasepotential of PAQ–CNT is required to make an electrochemicalcell that can effectively capture and release CO2. Therefore, the
anode electrode material for the electrochemical cell withPAQ–CNT cathode was a composite of polyvinylferrocene and CNT(PVFc–CNT), shown in Fig. 1. This was prepared by dispersingMWCNTs in a solution of PVFc in NMP. The optimum ratio ofthe composite was found to be 1 : 1, PVFc : CNT, by weight. Theelectrode substrate was dip-coated in the ink and dried slowlyto yield a composite that uniformly coated the substrate atB1.4 mg cm�2, as shown in Fig. 4. The CVs of the PVFc–CNTelectrode in N2 and CO2 saturated [Bmim][TF2N] are identical,and are indicated by the blue line in Fig. 3. PVFc–CNT has areduction potential of E0 = �0.03 V, against ferrocene (Fc).
The electrochemical cell. The PAQ–CNT electrodes wereassembled into an electrochemical cell in which CO2 was ableto be captured and released upon potential swings. This wasaccomplished by layering a PVFc–CNT counter electrodebetween the two PAQ–CNT electrodes to balance the charge ofthese electrodes, as shown in Fig. 5(d). In a CO2-rich environment,this afforded a polymer-based battery with an electrochemicalwindow of B1.2 V, where all the charge from the ferroceneoxidation, at its reduction potential, was balanced by the chargetransferred to the two-electron reduction of quinone, at its firstreduction potential. This window is defined by the reductionpotential of PVFc–CNT and the first reduction potential ofPAQ–CNT, shown in Fig. 3 as DV1. However, in the absence ofCO2 or other such electrophiles, mainly under N2, PAQ retainsits two one-electron reductions, with half of the charge of theferrocene oxidation being balanced by the reduction of quinoneat the first potential and the other half by its reduction at the
Fig. 2 (a) SEM micrograph of the cathode non-woven carbon mat coated with P14AQ–CNT, with details of coated and uncoated areas. (b, c and f) SEMmicrographs of increasing magnification of carbon fibers coated with P14AQ–CNT. (d) SEM micrograph of the uncoated carbon fibers. (e) TEM ofPAQ–CNT showing the amorphous polyanthraquinone decorating the MWCNT, a result of the p–p interaction.
Fig. 3 Superimposed CVs of PVFc–CNT ( ) and P14AQ–CNT ( ) underN2 and ( ) under CO2 in [Bmim][TF2N], at 20 mV s�1, vs. Fc, at T B 21 1C.The two potential windows are shown; DV1 under CO2 and DV2 under N2.
Paper Energy & Environmental Science
Ope
n A
cces
s A
rtic
le. P
ublis
hed
on 0
1 O
ctob
er 2
019.
Dow
nloa
ded
on 1
/10/
2022
10:
20:0
0 PM
. T
his
artic
le is
lice
nsed
und
er a
Cre
ativ
e C
omm
ons
Attr
ibut
ion-
Non
Com
mer
cial
3.0
Unp
orte
d L
icen
ce.
View Article Online

3534 | Energy Environ. Sci., 2019, 12, 3530--3547 This journal is©The Royal Society of Chemistry 2019
second potential. This results in a wider electrochemical window,shown in Fig. 3 as DV2, and the behavior of the cell resembles thatof an asymmetric pseudocapacitor.35
The capacities of the anode and cathodes of the cell,evaluated by gravimetric charge calibration of the two electrodecomposite materials (Fig. S5, ESI†), were balanced by requiringthat mP14AQ–CNT = 1.12mPFVc–CNT, which allowed for some excessPVFc–CNT.
Carbon capture
Two different types of units were fabricated to demonstrate theeffectiveness of the electro-swing process. The first was a sealed
chamber into which the electrodes were inserted. Changes inpressure were measured as CO2 was adsorbed and thenreleased on cycling of the potential applied to the electrodes.The second approach used a flow adsorption in which the CO2
exiting the device was monitored, with the breakthrough pointreflecting the overall capacity of the electrodes. All carboncapture experiments were conducted at T B 21 1C.
CO2 capture and release in a batch system. An electrochemicalcell (4 cm2 of total exposed area) with the three layers, such asthat illustrated in Fig. 1, was tested for the capture and release ofCO2 in a sealed chamber, shown in Fig. 5. This cell had B4.8 mgof PAQ–CNT deposited, i.e. 5.8 mmol of quinone, or a capacity for11.6 mmol of CO2. From the monitored pressure changes in thechamber of known internal void volume, the number of moles ofCO2 captured and released upon charge and discharge of the cellat constant potentials, were calculated. The chamber was purgedwith CO2 at the desired concentrations and sealed at atmosphericpressure. The pressure inside was allowed to equilibrate atconstant temperature before the electrochemical experimentswere started.
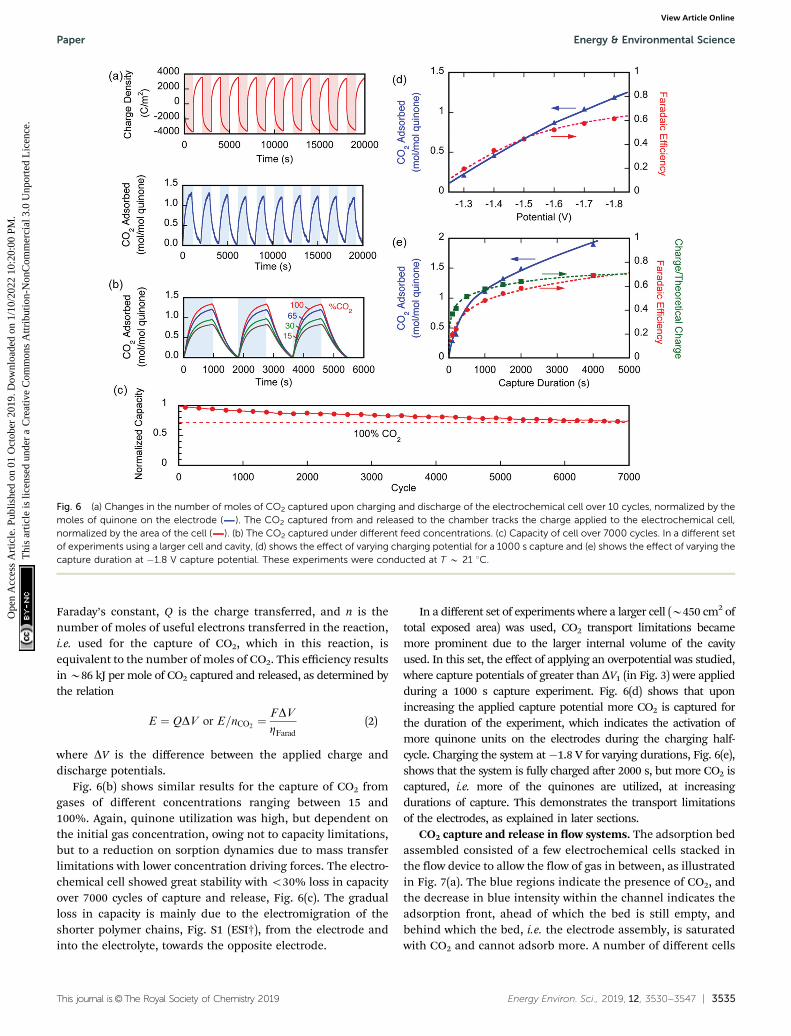
The performance of the electrochemical cell was evaluatedin chronoamperometric (potentiostatic) experiments, with captureat 1.3 V and release at 0.5 V, i.e. DV = 0.8 V. Fig. 6(a) shows thechange in the number of moles of CO2 captured from pure gasover 10 cycles (blue), along with the charge transferred to andfrom the cell (red). It shows that B65% of the quinone unitswere utilized, i.e. 7.4 mmol of CO2 captured. This may be due toincomplete charging of the quinones that are not exposed toelectrolyte. From the charge transferred during charging anddischarge (B800 mC), and the moles of CO2 captured andreleased, a faradaic efficiency
ZFarad ¼nF
Q(1)
of up to 90% was estimated, with some of the charge lost todouble layer charging of the porous electrodes. Here, F is
Fig. 4 (a) SEM micrograph of the anode non-woven carbon mat coatedwith PVFc–CNT with details of coated and uncoated areas. (b and c) SEMmicrographs of carbon fibers coated with PVFc–CNT, the squares indicates theregion which is magnified in the next micrograph. (d) SEM micrograph of themagnified polymer-coated CNTs from a different area on the electrode.
Fig. 5 (a) Custom-made sealed chamber for closed system experiments with pressure transducer to monitor the changes in pressure as CO2 isadsorbed and desorbed upon cycling of the cell potential. The internal of the sealed chamber (b) with and (c) without the insulating cup. (d) Layers of theelectrochemical cell assembled in the sealed chamber.
Energy & Environmental Science Paper
Ope
n A
cces
s A
rtic
le. P
ublis
hed
on 0
1 O
ctob
er 2
019.
Dow
nloa
ded
on 1
/10/
2022
10:
20:0
0 PM
. T
his
artic
le is
lice
nsed
und
er a
Cre
ativ
e C
omm
ons
Attr
ibut
ion-
Non
Com
mer
cial
3.0
Unp
orte
d L
icen
ce.
View Article Online
This journal is©The Royal Society of Chemistry 2019 Energy Environ. Sci., 2019, 12, 3530--3547 | 3535
Faraday’s constant, Q is the charge transferred, and n is thenumber of moles of useful electrons transferred in the reaction,i.e. used for the capture of CO2, which in this reaction, isequivalent to the number of moles of CO2. This efficiency resultsin B86 kJ per mole of CO2 captured and released, as determined bythe relation
E ¼ QDV or E=nCO2¼ FDV
ZFarad(2)
where DV is the difference between the applied charge anddischarge potentials.
Fig. 6(b) shows similar results for the capture of CO2 fromgases of different concentrations ranging between 15 and100%. Again, quinone utilization was high, but dependent onthe initial gas concentration, owing not to capacity limitations,but to a reduction on sorption dynamics due to mass transferlimitations with lower concentration driving forces. The electro-chemical cell showed great stability with o30% loss in capacityover 7000 cycles of capture and release, Fig. 6(c). The gradualloss in capacity is mainly due to the electromigration of theshorter polymer chains, Fig. S1 (ESI†), from the electrode andinto the electrolyte, towards the opposite electrode.
In a different set of experiments where a larger cell (B450 cm2 oftotal exposed area) was used, CO2 transport limitations becamemore prominent due to the larger internal volume of the cavityused. In this set, the effect of applying an overpotential was studied,where capture potentials of greater than DV1 (in Fig. 3) were appliedduring a 1000 s capture experiment. Fig. 6(d) shows that uponincreasing the applied capture potential more CO2 is captured forthe duration of the experiment, which indicates the activation ofmore quinone units on the electrodes during the charging half-cycle. Charging the system at �1.8 V for varying durations, Fig. 6(e),shows that the system is fully charged after 2000 s, but more CO2 iscaptured, i.e. more of the quinones are utilized, at increasingdurations of capture. This demonstrates the transport limitationsof the electrodes, as explained in later sections.
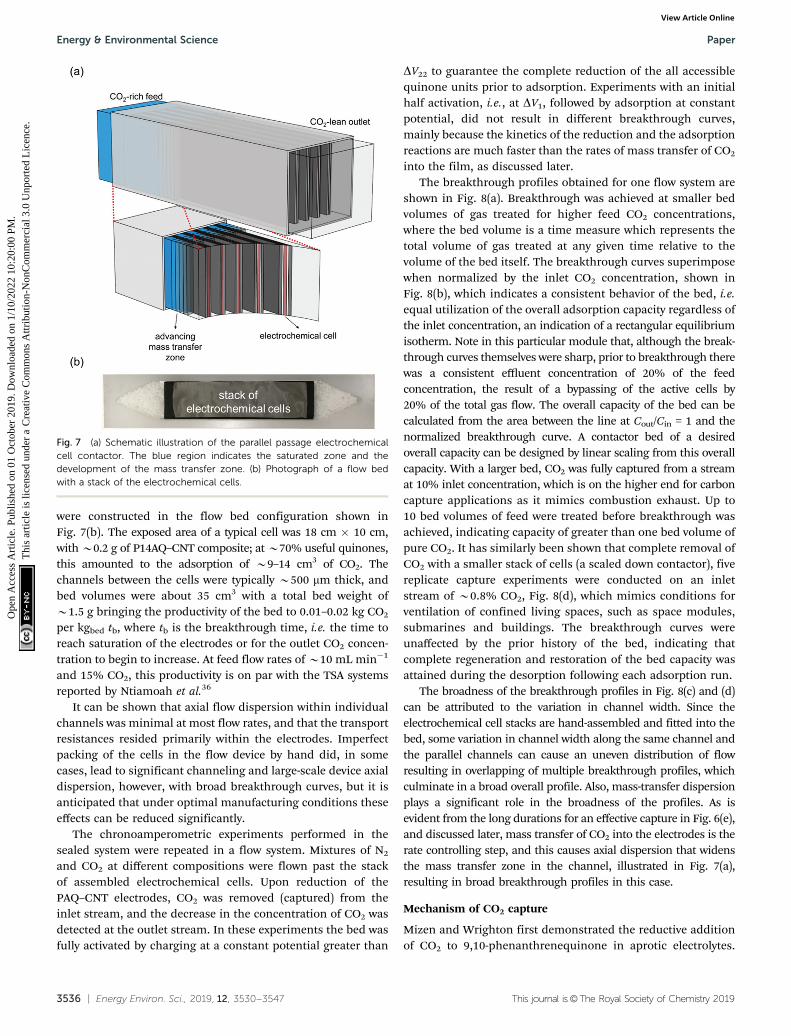
CO2 capture and release in flow systems. The adsorption bedassembled consisted of a few electrochemical cells stacked inthe flow device to allow the flow of gas in between, as illustratedin Fig. 7(a). The blue regions indicate the presence of CO2, andthe decrease in blue intensity within the channel indicates theadsorption front, ahead of which the bed is still empty, andbehind which the bed, i.e. the electrode assembly, is saturatedwith CO2 and cannot adsorb more. A number of different cells
Fig. 6 (a) Changes in the number of moles of CO2 captured upon charging and discharge of the electrochemical cell over 10 cycles, normalized by themoles of quinone on the electrode ( ). The CO2 captured from and released to the chamber tracks the charge applied to the electrochemical cell,normalized by the area of the cell ( ). (b) The CO2 captured under different feed concentrations. (c) Capacity of cell over 7000 cycles. In a different setof experiments using a larger cell and cavity, (d) shows the effect of varying charging potential for a 1000 s capture and (e) shows the effect of varying thecapture duration at �1.8 V capture potential. These experiments were conducted at T B 21 1C.
Paper Energy & Environmental Science
Ope
n A
cces
s A
rtic
le. P
ublis
hed
on 0
1 O
ctob
er 2
019.
Dow
nloa
ded
on 1
/10/
2022
10:
20:0
0 PM
. T
his
artic
le is
lice
nsed
und
er a
Cre
ativ
e C
omm
ons
Attr
ibut
ion-
Non
Com
mer
cial
3.0
Unp
orte
d L
icen
ce.
View Article Online
3536 | Energy Environ. Sci., 2019, 12, 3530--3547 This journal is©The Royal Society of Chemistry 2019
were constructed in the flow bed configuration shown inFig. 7(b). The exposed area of a typical cell was 18 cm � 10 cm,with B0.2 g of P14AQ–CNT composite; at B70% useful quinones,this amounted to the adsorption of B9–14 cm3 of CO2. Thechannels between the cells were typically B500 mm thick, andbed volumes were about 35 cm3 with a total bed weight ofB1.5 g bringing the productivity of the bed to 0.01–0.02 kg CO2
per kgbed tb, where tb is the breakthrough time, i.e. the time toreach saturation of the electrodes or for the outlet CO2 concen-tration to begin to increase. At feed flow rates of B10 mL min�1
and 15% CO2, this productivity is on par with the TSA systemsreported by Ntiamoah et al.36
It can be shown that axial flow dispersion within individualchannels was minimal at most flow rates, and that the transportresistances resided primarily within the electrodes. Imperfectpacking of the cells in the flow device by hand did, in somecases, lead to significant channeling and large-scale device axialdispersion, however, with broad breakthrough curves, but it isanticipated that under optimal manufacturing conditions theseeffects can be reduced significantly.
The chronoamperometric experiments performed in thesealed system were repeated in a flow system. Mixtures of N2
and CO2 at different compositions were flown past the stackof assembled electrochemical cells. Upon reduction of thePAQ–CNT electrodes, CO2 was removed (captured) from theinlet stream, and the decrease in the concentration of CO2 wasdetected at the outlet stream. In these experiments the bed wasfully activated by charging at a constant potential greater than
DV22 to guarantee the complete reduction of the all accessiblequinone units prior to adsorption. Experiments with an initialhalf activation, i.e., at DV1, followed by adsorption at constantpotential, did not result in different breakthrough curves,mainly because the kinetics of the reduction and the adsorptionreactions are much faster than the rates of mass transfer of CO2
into the film, as discussed later.The breakthrough profiles obtained for one flow system are
shown in Fig. 8(a). Breakthrough was achieved at smaller bedvolumes of gas treated for higher feed CO2 concentrations,where the bed volume is a time measure which represents thetotal volume of gas treated at any given time relative to thevolume of the bed itself. The breakthrough curves superimposewhen normalized by the inlet CO2 concentration, shown inFig. 8(b), which indicates a consistent behavior of the bed, i.e.equal utilization of the overall adsorption capacity regardless ofthe inlet concentration, an indication of a rectangular equilibriumisotherm. Note in this particular module that, although the break-through curves themselves were sharp, prior to breakthrough therewas a consistent effluent concentration of 20% of the feedconcentration, the result of a bypassing of the active cells by20% of the total gas flow. The overall capacity of the bed can becalculated from the area between the line at Cout/Cin = 1 and thenormalized breakthrough curve. A contactor bed of a desiredoverall capacity can be designed by linear scaling from this overallcapacity. With a larger bed, CO2 was fully captured from a streamat 10% inlet concentration, which is on the higher end for carboncapture applications as it mimics combustion exhaust. Up to10 bed volumes of feed were treated before breakthrough wasachieved, indicating capacity of greater than one bed volume ofpure CO2. It has similarly been shown that complete removal ofCO2 with a smaller stack of cells (a scaled down contactor), fivereplicate capture experiments were conducted on an inletstream of B0.8% CO2, Fig. 8(d), which mimics conditions forventilation of confined living spaces, such as space modules,submarines and buildings. The breakthrough curves wereunaffected by the prior history of the bed, indicating thatcomplete regeneration and restoration of the bed capacity wasattained during the desorption following each adsorption run.
The broadness of the breakthrough profiles in Fig. 8(c) and (d)can be attributed to the variation in channel width. Since theelectrochemical cell stacks are hand-assembled and fitted into thebed, some variation in channel width along the same channel andthe parallel channels can cause an uneven distribution of flowresulting in overlapping of multiple breakthrough profiles, whichculminate in a broad overall profile. Also, mass-transfer dispersionplays a significant role in the broadness of the profiles. As isevident from the long durations for an effective capture in Fig. 6(e),and discussed later, mass transfer of CO2 into the electrodes is therate controlling step, and this causes axial dispersion that widensthe mass transfer zone in the channel, illustrated in Fig. 7(a),resulting in broad breakthrough profiles in this case.
Mechanism of CO2 capture
Mizen and Wrighton first demonstrated the reductive additionof CO2 to 9,10-phenanthrenequinone in aprotic electrolytes.
Fig. 7 (a) Schematic illustration of the parallel passage electrochemicalcell contactor. The blue region indicates the saturated zone and thedevelopment of the mass transfer zone. (b) Photograph of a flow bedwith a stack of the electrochemical cells.
Energy & Environmental Science Paper
Ope
n A
cces
s A
rtic
le. P
ublis
hed
on 0
1 O
ctob
er 2
019.
Dow
nloa
ded
on 1
/10/
2022
10:
20:0
0 PM
. T
his
artic
le is
lice
nsed
und
er a
Cre
ativ
e C
omm
ons
Attr
ibut
ion-
Non
Com
mer
cial
3.0
Unp
orte
d L
icen
ce.
View Article Online

This journal is©The Royal Society of Chemistry 2019 Energy Environ. Sci., 2019, 12, 3530--3547 | 3537
Quinones undergo two reversible one-electron reductions inaprotic electrolytes, at two reduction potentials, as shown inScheme 1(a) for anthraquinone. But in the presence of CO2, asingle two-electron quasi-reversible reduction takes place at thefirst reduction potential, as shown in Scheme 1(b), where theCO2 molecule carboxylates the quinone resulting in a carbonatesalt.37 Upon the first reduction of a quinone molecule, a semi-quinone radical anion is produced. Some semiquinones, withsufficient electron density, i.e. sufficient Lewis base strength,can react with CO2 in a nucleophilic addition to form a
carbonate salt. Semiquinones with lower electron density –due to attached electron withdrawing groups – do not havethe nucleophilic strength to react with CO2.38 A semiquinonecarboxylated by the reductive addition of CO2 has its negativecharge isolated from the rest of the molecule by a s-bond,rendering the carboxylated quinone aromatic ring(s) relativelyneutral. Hence, the two-electron reduction of the parent qui-none under CO2 occurs at the first reduction potential. Thesecond reduction generates another nucleophilic center, i.e. thesecond oxygen of the quinone, which reacts with a second CO2
Fig. 8 (a) Breakthrough profiles obtained at four inlet concentrations. (b) Same breakthrough profiles in (a) normalized by the inlet concentrations.(c) Breakthrough profile obtained from a large system operating at B10% inlet concentration. (d) Breakthrough profiles obtained from five replicate runsof a smaller system operating at B0.8% inlet concentration. These experiments were conducted at T B 21 1C.
Scheme 1 (a) Two single-electron reduction waves of anthraquinone in the absence of electrophiles. (b) One two-electron reduction wave ofanthraquinone in the presence of CO2.
Paper Energy & Environmental Science
Ope
n A
cces
s A
rtic
le. P
ublis
hed
on 0
1 O
ctob
er 2
019.
Dow
nloa
ded
on 1
/10/
2022
10:
20:0
0 PM
. T
his
artic
le is
lice
nsed
und
er a
Cre
ativ
e C
omm
ons
Attr
ibut
ion-
Non
Com
mer
cial
3.0
Unp
orte
d L
icen
ce.
View Article Online
3538 | Energy Environ. Sci., 2019, 12, 3530--3547 This journal is©The Royal Society of Chemistry 2019
molecule to form a bis(carbonate) dianion salt – the quinol dianiondiadduct. A similar behavior is observed when quinones are reducedin protic electrolyte media and the reduced quinones react withprotons to form two hydroxyl groups via a two-electron reduction.39
The nucleophilic addition reaction of reduced quinonesoccurs only with electrophiles with sufficient Lewis acidity, suchas CO2, and not N2, hence the great selectivity in adsorption.Furthermore, water, in the treated gas stream, has minimaleffect on carbon capture, mainly because the hydrophobicity ofthe IL used presents a considerable mass transfer resistance forwater with very little retention,40 and any residual water in the ILphase merely stabilizes the reduced quinones,41 with no significantchange to the electrochemical or chemical steps of the carboncapture process.20 While the presence of oxygen can cause theoxidation of some reduced quinones with a sufficiently negativereduction potential, through the formation of the superoxide radicalanion O2
��, it is possible to avoid any reactions with oxygen in thefeed stream by carefully tuning the electron density of the quinonepolymer.42
The cyclic voltammogram (CV) of the PAQ–CNT compositeon the electrode substrate in [Bmim][TF2N] saturated with N2,the green line in Fig. 3, shows two redox couples correspondingto the two reduction potentials of anthraquinone. The cathodicand anodic peaks, however, are broader than those reported forsolutions of quinone molecules in electrolytes,20 which can beascribed to the slower electron exchange between differently-reduced redox units, i.e. neutral quinone, semiquinone (radicalanion) and quinol dianion, along the p-conjugated backbone ofthe polymer,43 and also to the diffusion and electromigration ofelectrolytic species into and out of the porous PAQ–CNT film.44
The expected disappearance of the second redox couple of theCV under CO2 was observed, as shown by the red line in Fig. 3,and attributed to the carboxylation of the reduced quinoneunits along the polymer chain facilitating the second electronreduction of anthraquinone at the first reduction potential,with the consequent increase in the current at that potential.The PAQ–CNT electrode can therefore be used to remove CO2
selectively from a gas mixture via nucleophilic addition, andregenerated via an electrochemical oxidation, with release ofthe CO2, as shown earlier. The two reduction potentials underN2 are E0
1 = �1.21 V and E02 = �1.63 V, vs. Fc. Under CO2 these
two potentials coalesce to yield a single quasi-reversible redoxcouple at the first reduction potential observed under N2, i.e. E0
1.The separation of the oxidation and reduction peaks in the
CVs reported is large, indicating sluggish electron transfer tothe quinone repeat units on the polymer, and a thick diffusion
layer in the porous electrode.44 While the ratio of polymer toCNT was optimized for the greatest gravimetric capacity, it isnot the ideal ratio for conductivity. Some of the conductivitytakes place through the backbone of the polymer, which con-tributes to the slow electron transfer. This, however, does notpresent a problem in the design of the contactor separationunit, since the rate limiting step in the CO2 capture process isthe transport of CO2 and not electron transfer.
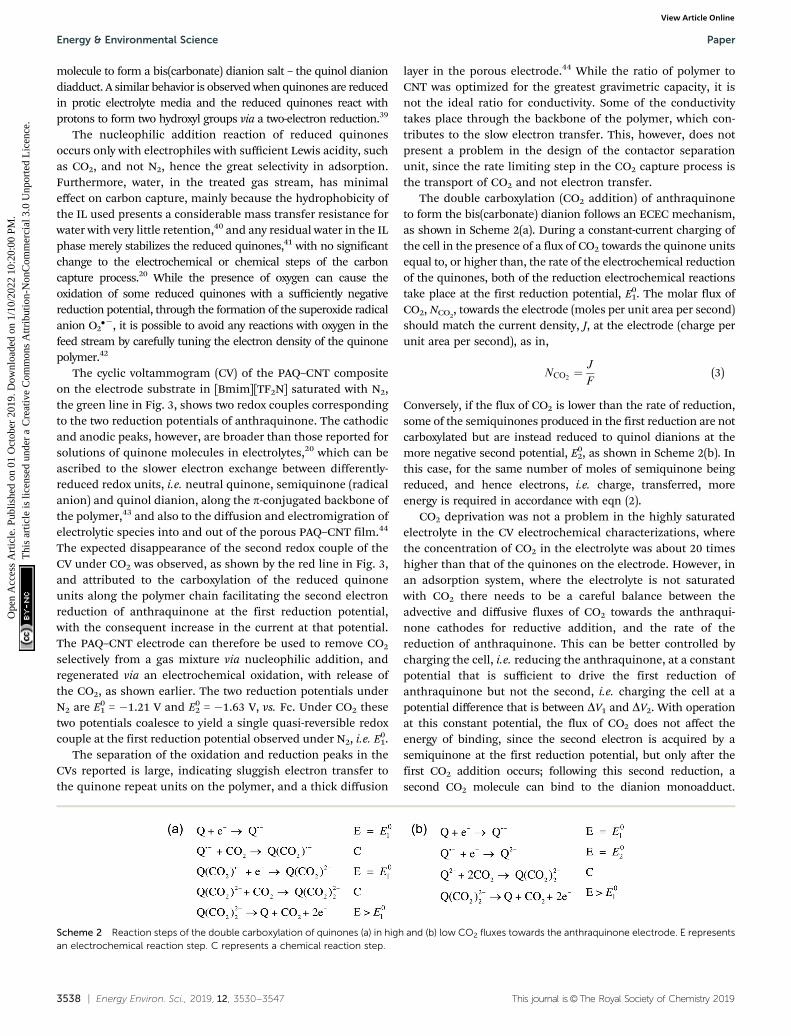
The double carboxylation (CO2 addition) of anthraquinoneto form the bis(carbonate) dianion follows an ECEC mechanism,as shown in Scheme 2(a). During a constant-current charging ofthe cell in the presence of a flux of CO2 towards the quinone unitsequal to, or higher than, the rate of the electrochemical reductionof the quinones, both of the reduction electrochemical reactionstake place at the first reduction potential, E0
1. The molar flux ofCO2, NCO2
, towards the electrode (moles per unit area per second)should match the current density, J, at the electrode (charge perunit area per second), as in,
NCO2¼ J
F(3)
Conversely, if the flux of CO2 is lower than the rate of reduction,some of the semiquinones produced in the first reduction are notcarboxylated but are instead reduced to quinol dianions at themore negative second potential, E0
2, as shown in Scheme 2(b). Inthis case, for the same number of moles of semiquinone beingreduced, and hence electrons, i.e. charge, transferred, moreenergy is required in accordance with eqn (2).
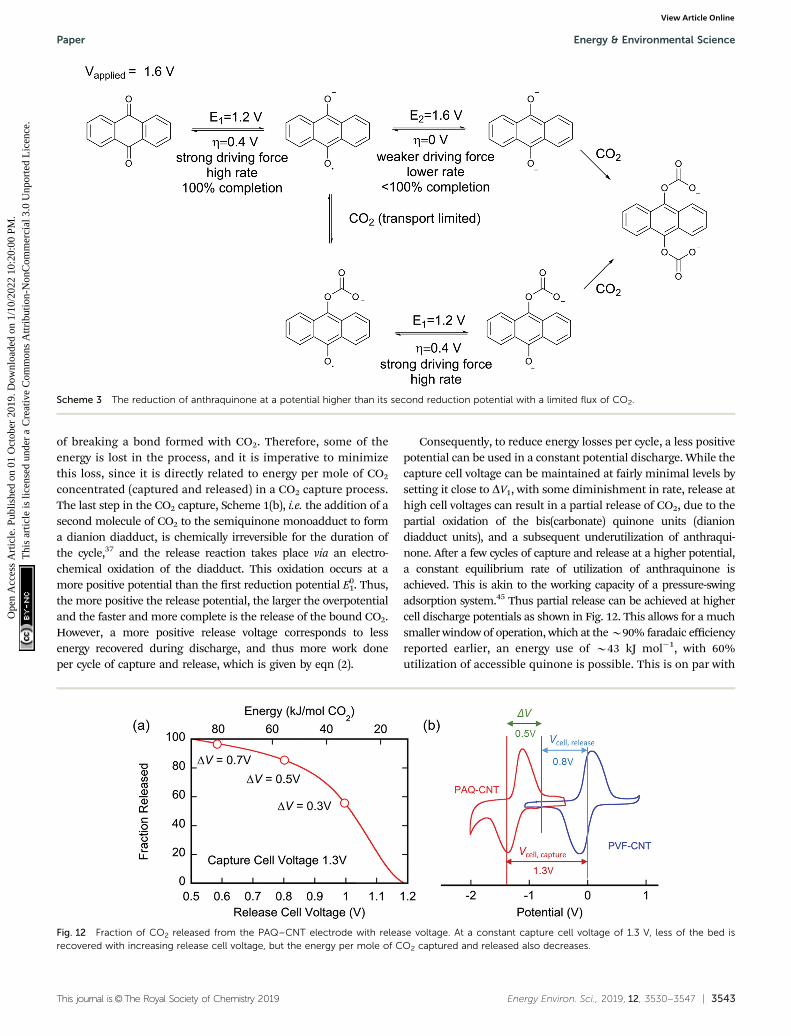
CO2 deprivation was not a problem in the highly saturatedelectrolyte in the CV electrochemical characterizations, wherethe concentration of CO2 in the electrolyte was about 20 timeshigher than that of the quinones on the electrode. However, inan adsorption system, where the electrolyte is not saturatedwith CO2 there needs to be a careful balance between theadvective and diffusive fluxes of CO2 towards the anthraqui-none cathodes for reductive addition, and the rate of thereduction of anthraquinone. This can be better controlled bycharging the cell, i.e. reducing the anthraquinone, at a constantpotential that is sufficient to drive the first reduction ofanthraquinone but not the second, i.e. charging the cell at apotential difference that is between DV1 and DV2. With operationat this constant potential, the flux of CO2 does not affect theenergy of binding, since the second electron is acquired by asemiquinone at the first reduction potential, but only after thefirst CO2 addition occurs; following this second reduction, asecond CO2 molecule can bind to the dianion monoadduct.
Scheme 2 Reaction steps of the double carboxylation of quinones (a) in high and (b) low CO2 fluxes towards the anthraquinone electrode. E representsan electrochemical reaction step. C represents a chemical reaction step.
Energy & Environmental Science Paper
Ope
n A
cces
s A
rtic
le. P
ublis
hed
on 0
1 O
ctob
er 2
019.
Dow
nloa
ded
on 1
/10/
2022
10:
20:0
0 PM
. T
his
artic
le is
lice
nsed
und
er a
Cre
ativ
e C
omm
ons
Attr
ibut
ion-
Non
Com
mer
cial
3.0
Unp
orte
d L
icen
ce.
View Article Online

This journal is©The Royal Society of Chemistry 2019 Energy Environ. Sci., 2019, 12, 3530--3547 | 3539
When the first reduction is allowed in a CO2-lean environment ata constant potential, the current observed after the initial surge,which results from the first reduction, is proportional to the fluxof CO2 towards the anthraquinone electrode. Nevertheless, thiscurrent ultimately diminishes due to the decrease in the numberof semiquinones available to react with CO2. In a CO2-richenvironment, at constant potential charging, the observed currentafter the initial surge is proportional to the transport of CO2 into theelectrode and the rate of the addition reaction which follows thenucleophilic addition mechanism between semiquinones anddissolved CO2,
R = kCQ��CCO2,IL (4)
where R is the rate of the reaction and k is the rate constant.The electrochemical steps proceed at a faster rate than thechemical reactions, but both types of reactions have rates thatare faster than the rate of diffusion of CO2 in the IL, leading to alarge Damkohler number,
Da ¼ kCQCCO2L
DCO2;IL� 1 (5)
where CQ is the initial concentration of anthraquinone repeatunits on the electrode, CCO2
is the concentration of CO2 in theIL, L is the thickness of the IL-wetted porous electrode, which isabout 150 mm, and DCO2,IL is the diffusion coefficient of CO2 inthe IL and is about 4 � 10�10 m2 s�1. While it is the semi-quinone that participates in the reaction here, the initialconcentration CQ is a good approximation for estimating theorder of magnitude of Da. The rate constant can be estimatedto be 102 M�1 s�1,37 resulting in Da B104. Large values of Daindicate that mass transfer will control the process and thus thecharging and subsequent carboxylation of the quinones can beassumed to be in equilibrium with the prevailing CO2 concentrationat any position and at any time. Therefore, with a reduced thicknessof the electrodes, the CO2 mass transfer rates will approach that ofthe nucleophilic addition reaction.
Modeling of CO2 capture
To further understand the behavior of the cell during constant-current and constant-potential charging at various CO2 concen-trations, a two-dimensional model of the cell and the adjacentgap was set up in COMSOLs, with the geometry shown in Fig. 9.The model accounted for all the chemical and electrochemicalreactions described in Scheme 2, in addition to the electrochemicaloxidation of the ferrocene. The equilibrium potentials of all electro-chemical reactions were predicted by the Nernst equation
E ¼ E0 � RT
nFlog
red½ �ox½ �
� �(6)
where E0 is the standard reduction potential, n is the numberof moles of electrons involved, R is the gas constant, T is thetemperature, [red] is the concentration of the reduced species and[ox] is the concentration of the reactant with high oxidation number.In the first two electrochemical reactions shown in Scheme 2(a),the reduced species are Q�� and Q(CO2)2�, while the species ofhigher oxidation number in these two reactions are Q and
Q(CO2)�� respectively. The standard reduction potential forboth reactions is E0
1. While the first of the two electrochemicalreactions in Scheme 2(b) is the same as that of Scheme 2(a), thesecond reaction has Q2� as the reduced species and Q�� as thespecies with higher oxidation number, with a standard reductionpotential of E0
2. Likewise, in the anode oxidation reaction, Fc+
(ferrocenium) is the oxidized species and Fc (ferrocene) is thereduced species at E0 = �0.03 V. The current densities of thesereactions were described by the Butler–Volmer equation,
i ¼ i0 eaFZRT
� �� e�
1�að ÞFZRT
� � !(7)
where Z is the overpotential and a, the symmetry factor, wasapproximated to be 0.5 for all the electrochemical reactions. Theexchange current, i0, is given by
i0 = k0[red]a[ox](1�a) (8)
The governing mass transfer equations for all the speciesinvolved in the electrochemical reaction, including the supportingelectrolyte cations and anions, is
@Ci
@tþr �Ni ¼ Ri (9)
where Ci is the concentration of the species, Ri is the rate ofreaction in which the species is involved and Ni is the flux, which iszero for all immobilized faradaic species: anthraquinone in itsdifferent oxidation and binding states, and ferrocene. For mobilespecies, mainly the supporting electrolyte ions, the flux is given by
Ni = �DirCi � ziuiFCirF (10)
where zi is the valence, ui is the molar mobility, F is Faraday’sconstant and F is the electric potential. The current density canbe obtained from the flux of charged mobile species in theelectrolyte
i ¼ FXi
ziNi (11)
Fig. 9 Cross-section of the electrochemical cell used in the simulations.
Paper Energy & Environmental Science
Ope
n A
cces
s A
rtic
le. P
ublis
hed
on 0
1 O
ctob
er 2
019.
Dow
nloa
ded
on 1
/10/
2022
10:
20:0
0 PM
. T
his
artic
le is
lice
nsed
und
er a
Cre
ativ
e C
omm
ons
Attr
ibut
ion-
Non
Com
mer
cial
3.0
Unp
orte
d L
icen
ce.
View Article Online

3540 | Energy Environ. Sci., 2019, 12, 3530--3547 This journal is©The Royal Society of Chemistry 2019
and the overall electroneutrality is maintained by ensuring thatXi
ziCi ¼ 0 (12)
The boundary conditions for these equations are ground(F = 0 V) for the anthraquinone electrode (colored grey inFig. 9), and either constant current or constant potential at theferrocene electrode (pink). The electrochemical model is thesame for both sealed and flow systems, although the transportof CO2 in the gas phase (shown as a transparent block) isdifferent in the two scenarios.
In the sealed system, CO2 transport occurs via diffusiontoward the electrode only, while in flow CO2 is also advecteddown the channel. In the sealed system, the partial pressure ofthe gas decreases during capture, while in flow the CO2
concentration changes along the gas channel with time, andthe concentration of the gas leaving the device is a measure ofthe total effectiveness of the adsorption bed capacity andtransport and kinetic limitations within the system. The totaltransport of CO2 is modelled by transport equations in each ofthe two phases, gas and IL. In the gas phase, the mass transfergoverning equation in the sealed system is given by
@CCO2 ;gas
@t¼ DCO2;gasr2CCO2 ;gas (13)
where CCO2,gas is the concentration of CO2 in the gas phase,obtained from its partial pressure and the ideal gas law. Thisgoverning equation has a no-flux boundary condition at thethree walls
@CCO2;gas
@O
����walls
¼ 0 (14)
and at the gas–IL interface, the fluxes normal to the interfaceare set to be equal
DCO2 ;gasdCCO2;gas
dx¼ DCO2;IL
dCCO2;IL
dx(15)
where CCO2,IL is the concentration of dissolved CO2 in the ILphase. In the flow system, the flux of CO2 has an advectivecomponent as well and the governing equation becomes
@CCO2;gas
@t¼ DCO2;gasr2CCO2 ;gas þ urCCO2;gas (16)
where u is the velocity of the gas flowing in the channel. Theinlet is set at a constant concentration inflow and the outlet atzero gauge pressure. The mass transfer governing equation fordissolved CO2 in the IL phase, for both sealed and flow systems,is given by
@CCO2;IL
@t¼ DCO2;ILr2CCO2;IL þ R (17)
where R is a bulk reaction term describing the rate of thechemical reactions shown in Scheme 2(a). Simple rate equations,first order in all reactants, are used. A no-flux boundary conditionis set at the walls. At the gas–electrode interface, the concentrationof dissolved CO2 is set to
CCO2,IL = bCCO2,gas (18)
where b is the adjusted Henry’s constant which accounts for theequilibrium partition of CO2 between the gas and IL phases.
The purpose of this simulation is to obtain a semi-quantitative analysis of the behavior of the cell under differentconditions, and, therefore, order of magnitude estimates aremade for the electrochemical parameters of the model.
Model results for batch system. The simulation of constant-current charging at 0–5% CO2 concentrations in the sealedsystem in which the gas channel shown in Fig. 9 served as a gasheadspace, shows results that are consistent with the afore-mentioned mechanism of CO2 capture. In addition to the cellvoltage, the concentrations of all the cathode quinonic specieswere studied during the charging process. Fig. 10 shows the cellvoltages at 0–5% CO2 and the concentration profiles of cathodespecies at 0, 2, and 5% CO2. The cell voltage profiles inFig. 10(a) show that as the concentration of CO2 increases, lessof the cell charging occurs at the higher potential. At 0% CO2
the cell simply traverses both reduction potentials of thequinone, and the species profiles in Fig. 10(b) show twoconsecutive conversions; the first is the reduction of quinoneto semiquinone, and the second is the reduction of semiqui-none to quinol dianion. The second reaction starts only after allthe quinone is converted to semiquinone, and to furtheraccommodate the incoming electrons at the constant current,the second, more energetic reduction takes place until allfaradaic reactions are exhausted. Here, the simulation wasstopped just short of full conversion to avoid numerical com-plications that arise from the exhaustion of faradaic material,i.e. complete charging. At 2% CO2, upon generation of thesemiquinone, shown in Fig. 10(c), the modest diffusive flux ofCO2 allows for the formation of the semiquinone monoadductwhich soon accepts a second electron at the first reductionpotential of quinone, hence extending the cell charging periodspent at the lower potential. This dianion monoadduct canthen react with a second CO2 molecule, to form the dianiondiadduct. But, upon the depletion of CO2 in the vicinity of thecathode, due to a charging rate that is faster than the diffusiveflux of CO2 into the electrolyte at 2% headspace concentration,the semiquinone is converted to the dianion at the highersecond potential, while the concentrations of the dianionmonoadduct and the dianion diadduct remain constant. Thisis reflected in the potential profile at 2% CO2 in Fig. 10(a).However, at 5% CO2, the diffusive flux of CO2 is adequate, andbarely any semiquinone can be detected since it is converted tosemiquinone monoadduct, and other subsequent species, soonafter generation, shown in Fig. 10(d). Here, all the electro-chemical reactions take place at the first potential and noneof the semiquinone is converted to quinol dianion.
Hence, the optimum charging method of the cell, i.e. CO2
capture, is to operate at a constant potential just larger than thefirst potential window DV1. The greater the charging voltage,the faster the reduction reaction due to the larger overpotential.For practical reasons, and to avoid large current surges, the cellcan be charged at a constant current until the desired chargingpotential difference is reached. This will be between DV1 andDV2 based on the rate of charging desired. At this point the bed
Energy & Environmental Science Paper
Ope
n A
cces
s A
rtic
le. P
ublis
hed
on 0
1 O
ctob
er 2
019.
Dow
nloa
ded
on 1
/10/
2022
10:
20:0
0 PM
. T
his
artic
le is
lice
nsed
und
er a
Cre
ativ
e C
omm
ons
Attr
ibut
ion-
Non
Com
mer
cial
3.0
Unp
orte
d L
icen
ce.
View Article Online

This journal is©The Royal Society of Chemistry 2019 Energy Environ. Sci., 2019, 12, 3530--3547 | 3541
is activated for capture by making half the total capture capacityavailable. Then the cell can be set at that constant potentialuntil saturation of the cathodes is achieved. The second half ofthe capture capacity is made available as more CO2 flows in.
It is also possible to fully activate the bed by charging at apotential difference DVHigh 4 DV1, at which point the cells aredisconnected and allowed to saturate with no further supplyof current, until breakthrough is achieved, and the bed isregenerated by discharging the cell and releasing pure CO2.The energy recovered however, cannot exceed QDV1, resultingin an energy loss of greater than Q(DVHigh � DV1).
Model results for flow system. The model described abovewas also used to simulate the capture of CO2 from a channelunder flow conditions. The gas flowed parallel to the electrodesin the cell, a cross-section of which is shown in Fig. 9. Thesimulated concentration profiles in the channel and the qui-none electrode are shown as a function of the number of bedvolumes in Fig. 11(a). The gas phase profiles are consistent witha dispersed plug flow in the channels, with a reasonably sharpadsorption front, while the linear CO2 profiles in the electrode area result of the significant diffusional limitations in this region. Ofparticular interest is the depletion of unbound quinonic speciesin the cathode as removal of CO2 from the channel proceeds; asthe cathode becomes saturated with CO2, the concentration ofCO2 increases along the length of the channel until break-through is achieved at around 8 bed volumes, after whichfurther saturation is allowed until the outlet concentration isequal to the inlet concentration at around 10 bed volumes.Fig. 11(b) and (c) show the breakthrough profiles as a functionof cell voltage for a given feed concentration, and of feed
concentration for a given cell voltage, respectively. The numberof bed volumes required increases with decreasing feed con-centrations, a result of the fixed overall bed capacity and therectangular nature of the adsorption isotherm of this system. Inthe absence of transport and reaction limitations, all break-through curves should collapse when the bed volume is multipliedby the feed fraction of the adsorbate; the fact that this is not exactlyso in Fig. 11(d) indicates that mass transfer limitations do play arole in the uptake of CO2 by the activated electrodes. Nevertheless,the overall capacity, indicated by the trapezoidal area underCout/Cin = 1 and the breakthrough curves, remained constant. How-ever, the effect of a stronger driving force on improved mass transferis evident in Fig. 11(b), where at charging potentials that are closer toDV2, more of the dianion is generated in a Nernstian distribution,which provides two reaction sites for CO2. This results in a strongerdriving force in the adsorption of CO2 and hence improved masstransfer, which yields a sharper breakthrough profile.
Fig. 11(e) and (f) show the current across the electrochemicalcell during the capture experiments in (c) and (b) respectively.Fig. 11(e) shows that at low potential charging, i.e. 1.3 V, aninitial spike in current is observed which results from thereduction of the quinones on the electrodes to semiquinone, asexplained earlier. This is followed by a region of constant currentwhich is proportional to the flux of CO2 into the electrodes, sinceit reacts with the semiquinones and allows them to accept asecond electron at the low potential. As the electrodes becomesaturated and all the semiquinone is depleted, the currentdecreases. This region of constant current followed by the sharpdecrease is very broad for the 10% case, but much shorter for the50% case, where there is a brief transition from the initial spike
Fig. 10 Simulation of charging the electrochemical cell at different CO2 concentrations at constant current. (a) Potential difference of the cell. Thechange in concentration of quinone with charge is shown at (b) 0%, (c) 2% and (d) 5% CO2.
Paper Energy & Environmental Science
Ope
n A
cces
s A
rtic
le. P
ublis
hed
on 0
1 O
ctob
er 2
019.
Dow
nloa
ded
on 1
/10/
2022
10:
20:0
0 PM
. T
his
artic
le is
lice
nsed
und
er a
Cre
ativ
e C
omm
ons
Attr
ibut
ion-
Non
Com
mer
cial
3.0
Unp
orte
d L
icen
ce.
View Article Online
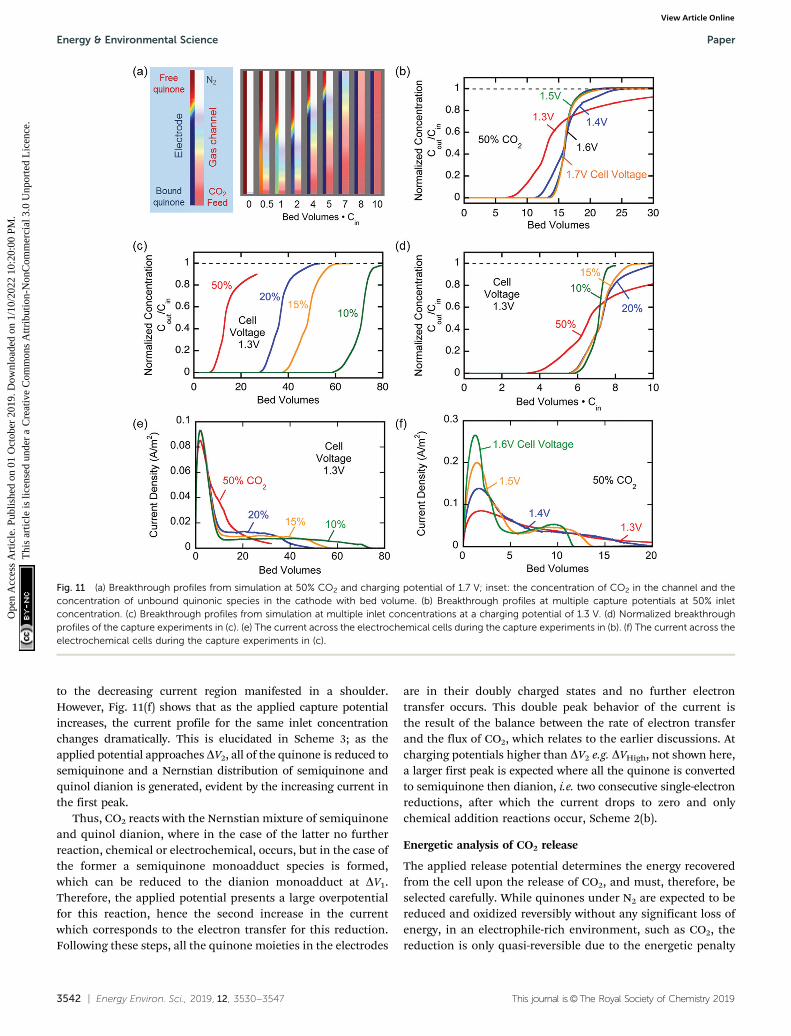
3542 | Energy Environ. Sci., 2019, 12, 3530--3547 This journal is©The Royal Society of Chemistry 2019
to the decreasing current region manifested in a shoulder.However, Fig. 11(f) shows that as the applied capture potentialincreases, the current profile for the same inlet concentrationchanges dramatically. This is elucidated in Scheme 3; as theapplied potential approaches DV2, all of the quinone is reduced tosemiquinone and a Nernstian distribution of semiquinone andquinol dianion is generated, evident by the increasing current inthe first peak.
Thus, CO2 reacts with the Nernstian mixture of semiquinoneand quinol dianion, where in the case of the latter no furtherreaction, chemical or electrochemical, occurs, but in the case ofthe former a semiquinone monoadduct species is formed,which can be reduced to the dianion monoadduct at DV1.Therefore, the applied potential presents a large overpotentialfor this reaction, hence the second increase in the currentwhich corresponds to the electron transfer for this reduction.Following these steps, all the quinone moieties in the electrodes
are in their doubly charged states and no further electrontransfer occurs. This double peak behavior of the current isthe result of the balance between the rate of electron transferand the flux of CO2, which relates to the earlier discussions. Atcharging potentials higher than DV2 e.g. DVHigh, not shown here,a larger first peak is expected where all the quinone is convertedto semiquinone then dianion, i.e. two consecutive single-electronreductions, after which the current drops to zero and onlychemical addition reactions occur, Scheme 2(b).
Energetic analysis of CO2 release
The applied release potential determines the energy recoveredfrom the cell upon the release of CO2, and must, therefore, beselected carefully. While quinones under N2 are expected to bereduced and oxidized reversibly without any significant loss ofenergy, in an electrophile-rich environment, such as CO2, thereduction is only quasi-reversible due to the energetic penalty
Fig. 11 (a) Breakthrough profiles from simulation at 50% CO2 and charging potential of 1.7 V; inset: the concentration of CO2 in the channel and theconcentration of unbound quinonic species in the cathode with bed volume. (b) Breakthrough profiles at multiple capture potentials at 50% inletconcentration. (c) Breakthrough profiles from simulation at multiple inlet concentrations at a charging potential of 1.3 V. (d) Normalized breakthroughprofiles of the capture experiments in (c). (e) The current across the electrochemical cells during the capture experiments in (b). (f) The current across theelectrochemical cells during the capture experiments in (c).
Energy & Environmental Science Paper
Ope
n A
cces
s A
rtic
le. P
ublis
hed
on 0
1 O
ctob
er 2
019.
Dow
nloa
ded
on 1
/10/
2022
10:
20:0
0 PM
. T
his
artic
le is
lice
nsed
und
er a
Cre
ativ
e C
omm
ons
Attr
ibut
ion-
Non
Com
mer
cial
3.0
Unp
orte
d L
icen
ce.
View Article Online
This journal is©The Royal Society of Chemistry 2019 Energy Environ. Sci., 2019, 12, 3530--3547 | 3543
of breaking a bond formed with CO2. Therefore, some of theenergy is lost in the process, and it is imperative to minimizethis loss, since it is directly related to energy per mole of CO2
concentrated (captured and released) in a CO2 capture process.The last step in the CO2 capture, Scheme 1(b), i.e. the addition of asecond molecule of CO2 to the semiquinone monoadduct to forma dianion diadduct, is chemically irreversible for the duration ofthe cycle,37 and the release reaction takes place via an electro-chemical oxidation of the diadduct. This oxidation occurs at amore positive potential than the first reduction potential E0
1. Thus,the more positive the release potential, the larger the overpotentialand the faster and more complete is the release of the bound CO2.However, a more positive release voltage corresponds to lessenergy recovered during discharge, and thus more work doneper cycle of capture and release, which is given by eqn (2).
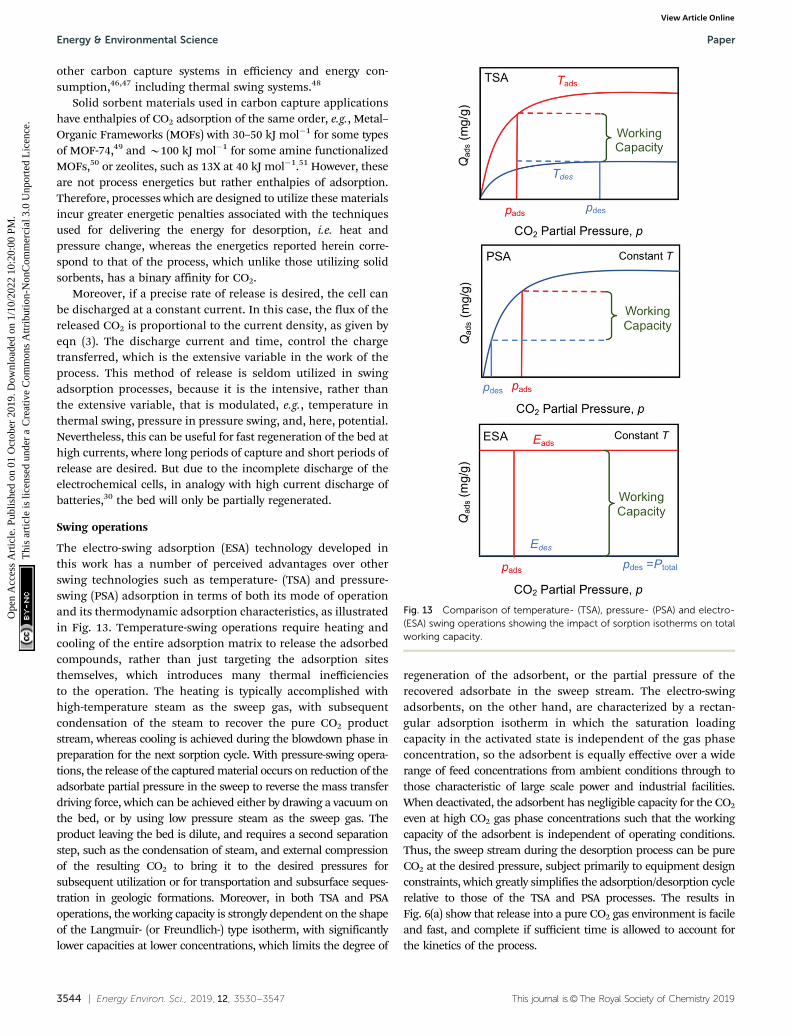
Consequently, to reduce energy losses per cycle, a less positivepotential can be used in a constant potential discharge. While thecapture cell voltage can be maintained at fairly minimal levels bysetting it close to DV1, with some diminishment in rate, release athigh cell voltages can result in a partial release of CO2, due to thepartial oxidation of the bis(carbonate) quinone units (dianiondiadduct units), and a subsequent underutilization of anthraqui-none. After a few cycles of capture and release at a higher potential,a constant equilibrium rate of utilization of anthraquinone isachieved. This is akin to the working capacity of a pressure-swingadsorption system.45 Thus partial release can be achieved at highercell discharge potentials as shown in Fig. 12. This allows for a muchsmaller window of operation, which at the B90% faradaic efficiencyreported earlier, an energy use of B43 kJ mol�1, with 60%utilization of accessible quinone is possible. This is on par with
Scheme 3 The reduction of anthraquinone at a potential higher than its second reduction potential with a limited flux of CO2.
Fig. 12 Fraction of CO2 released from the PAQ–CNT electrode with release voltage. At a constant capture cell voltage of 1.3 V, less of the bed isrecovered with increasing release cell voltage, but the energy per mole of CO2 captured and released also decreases.
Paper Energy & Environmental Science
Ope
n A
cces
s A
rtic
le. P
ublis
hed
on 0
1 O
ctob
er 2
019.
Dow
nloa
ded
on 1
/10/
2022
10:
20:0
0 PM
. T
his
artic
le is
lice
nsed
und
er a
Cre
ativ
e C
omm
ons
Attr
ibut
ion-
Non
Com
mer
cial
3.0
Unp
orte
d L
icen
ce.
View Article Online
3544 | Energy Environ. Sci., 2019, 12, 3530--3547 This journal is©The Royal Society of Chemistry 2019
other carbon capture systems in efficiency and energy con-sumption,46,47 including thermal swing systems.48
Solid sorbent materials used in carbon capture applicationshave enthalpies of CO2 adsorption of the same order, e.g., Metal–Organic Frameworks (MOFs) with 30–50 kJ mol�1 for some typesof MOF-74,49 and B100 kJ mol�1 for some amine functionalizedMOFs,50 or zeolites, such as 13X at 40 kJ mol�1.51 However, theseare not process energetics but rather enthalpies of adsorption.Therefore, processes which are designed to utilize these materialsincur greater energetic penalties associated with the techniquesused for delivering the energy for desorption, i.e. heat andpressure change, whereas the energetics reported herein corre-spond to that of the process, which unlike those utilizing solidsorbents, has a binary affinity for CO2.
Moreover, if a precise rate of release is desired, the cell canbe discharged at a constant current. In this case, the flux of thereleased CO2 is proportional to the current density, as given byeqn (3). The discharge current and time, control the chargetransferred, which is the extensive variable in the work of theprocess. This method of release is seldom utilized in swingadsorption processes, because it is the intensive, rather thanthe extensive variable, that is modulated, e.g., temperature inthermal swing, pressure in pressure swing, and, here, potential.Nevertheless, this can be useful for fast regeneration of the bed athigh currents, where long periods of capture and short periods ofrelease are desired. But due to the incomplete discharge of theelectrochemical cells, in analogy with high current discharge ofbatteries,30 the bed will only be partially regenerated.
Swing operations
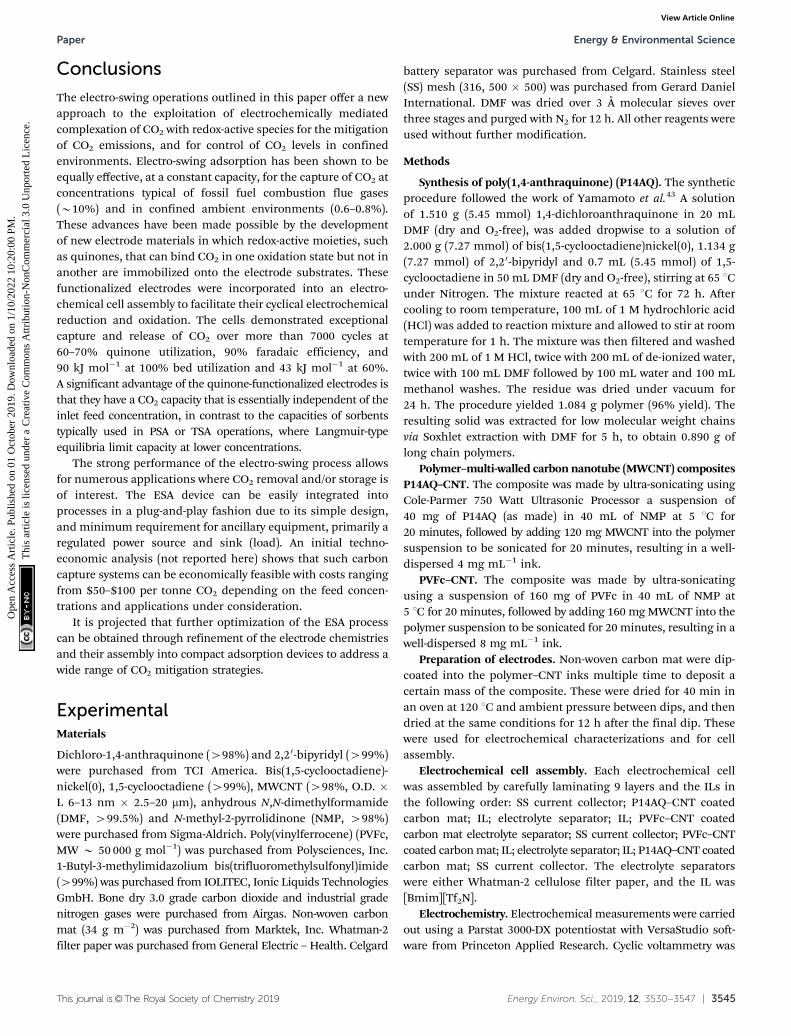
The electro-swing adsorption (ESA) technology developed inthis work has a number of perceived advantages over otherswing technologies such as temperature- (TSA) and pressure-swing (PSA) adsorption in terms of both its mode of operationand its thermodynamic adsorption characteristics, as illustratedin Fig. 13. Temperature-swing operations require heating andcooling of the entire adsorption matrix to release the adsorbedcompounds, rather than just targeting the adsorption sitesthemselves, which introduces many thermal inefficienciesto the operation. The heating is typically accomplished withhigh-temperature steam as the sweep gas, with subsequentcondensation of the steam to recover the pure CO2 productstream, whereas cooling is achieved during the blowdown phase inpreparation for the next sorption cycle. With pressure-swing opera-tions, the release of the captured material occurs on reduction of theadsorbate partial pressure in the sweep to reverse the mass transferdriving force, which can be achieved either by drawing a vacuum onthe bed, or by using low pressure steam as the sweep gas. Theproduct leaving the bed is dilute, and requires a second separationstep, such as the condensation of steam, and external compressionof the resulting CO2 to bring it to the desired pressures forsubsequent utilization or for transportation and subsurface seques-tration in geologic formations. Moreover, in both TSA and PSAoperations, the working capacity is strongly dependent on the shapeof the Langmuir- (or Freundlich-) type isotherm, with significantlylower capacities at lower concentrations, which limits the degree of
regeneration of the adsorbent, or the partial pressure of therecovered adsorbate in the sweep stream. The electro-swingadsorbents, on the other hand, are characterized by a rectan-gular adsorption isotherm in which the saturation loadingcapacity in the activated state is independent of the gas phaseconcentration, so the adsorbent is equally effective over a widerange of feed concentrations from ambient conditions through tothose characteristic of large scale power and industrial facilities.When deactivated, the adsorbent has negligible capacity for the CO2
even at high CO2 gas phase concentrations such that the workingcapacity of the adsorbent is independent of operating conditions.Thus, the sweep stream during the desorption process can be pureCO2 at the desired pressure, subject primarily to equipment designconstraints, which greatly simplifies the adsorption/desorption cyclerelative to those of the TSA and PSA processes. The results inFig. 6(a) show that release into a pure CO2 gas environment is facileand fast, and complete if sufficient time is allowed to account forthe kinetics of the process.
Fig. 13 Comparison of temperature- (TSA), pressure- (PSA) and electro-(ESA) swing operations showing the impact of sorption isotherms on totalworking capacity.
Energy & Environmental Science Paper
Ope
n A
cces
s A
rtic
le. P
ublis
hed
on 0
1 O
ctob
er 2
019.
Dow
nloa
ded
on 1
/10/
2022
10:
20:0
0 PM
. T
his
artic
le is
lice
nsed
und
er a
Cre
ativ
e C
omm
ons
Attr
ibut
ion-
Non
Com
mer
cial
3.0
Unp
orte
d L
icen
ce.
View Article Online
This journal is©The Royal Society of Chemistry 2019 Energy Environ. Sci., 2019, 12, 3530--3547 | 3545
Conclusions
The electro-swing operations outlined in this paper offer a newapproach to the exploitation of electrochemically mediatedcomplexation of CO2 with redox-active species for the mitigationof CO2 emissions, and for control of CO2 levels in confinedenvironments. Electro-swing adsorption has been shown to beequally effective, at a constant capacity, for the capture of CO2 atconcentrations typical of fossil fuel combustion flue gases(B10%) and in confined ambient environments (0.6–0.8%).These advances have been made possible by the developmentof new electrode materials in which redox-active moieties, suchas quinones, that can bind CO2 in one oxidation state but not inanother are immobilized onto the electrode substrates. Thesefunctionalized electrodes were incorporated into an electro-chemical cell assembly to facilitate their cyclical electrochemicalreduction and oxidation. The cells demonstrated exceptionalcapture and release of CO2 over more than 7000 cycles at60–70% quinone utilization, 90% faradaic efficiency, and90 kJ mol�1 at 100% bed utilization and 43 kJ mol�1 at 60%.A significant advantage of the quinone-functionalized electrodes isthat they have a CO2 capacity that is essentially independent of theinlet feed concentration, in contrast to the capacities of sorbentstypically used in PSA or TSA operations, where Langmuir-typeequilibria limit capacity at lower concentrations.
The strong performance of the electro-swing process allowsfor numerous applications where CO2 removal and/or storage isof interest. The ESA device can be easily integrated intoprocesses in a plug-and-play fashion due to its simple design,and minimum requirement for ancillary equipment, primarily aregulated power source and sink (load). An initial techno-economic analysis (not reported here) shows that such carboncapture systems can be economically feasible with costs rangingfrom $50–$100 per tonne CO2 depending on the feed concen-trations and applications under consideration.
It is projected that further optimization of the ESA processcan be obtained through refinement of the electrode chemistriesand their assembly into compact adsorption devices to address awide range of CO2 mitigation strategies.
ExperimentalMaterials
Dichloro-1,4-anthraquinone (498%) and 2,20-bipyridyl (499%)were purchased from TCI America. Bis(1,5-cyclooctadiene)-nickel(0), 1,5-cyclooctadiene (499%), MWCNT (498%, O.D. �L 6–13 nm � 2.5–20 mm), anhydrous N,N-dimethylformamide(DMF, 499.5%) and N-methyl-2-pyrrolidinone (NMP, 498%)were purchased from Sigma-Aldrich. Poly(vinylferrocene) (PVFc,MW B 50 000 g mol�1) was purchased from Polysciences, Inc.1-Butyl-3-methylimidazolium bis(trifluoromethylsulfonyl)imide(499%) was purchased from IOLITEC, Ionic Liquids TechnologiesGmbH. Bone dry 3.0 grade carbon dioxide and industrial gradenitrogen gases were purchased from Airgas. Non-woven carbonmat (34 g m�2) was purchased from Marktek, Inc. Whatman-2filter paper was purchased from General Electric – Health. Celgard
battery separator was purchased from Celgard. Stainless steel(SS) mesh (316, 500 � 500) was purchased from Gerard DanielInternational. DMF was dried over 3 Å molecular sieves overthree stages and purged with N2 for 12 h. All other reagents wereused without further modification.
Methods
Synthesis of poly(1,4-anthraquinone) (P14AQ). The syntheticprocedure followed the work of Yamamoto et al.43 A solutionof 1.510 g (5.45 mmol) 1,4-dichloroanthraquinone in 20 mLDMF (dry and O2-free), was added dropwise to a solution of2.000 g (7.27 mmol) of bis(1,5-cyclooctadiene)nickel(0), 1.134 g(7.27 mmol) of 2,20-bipyridyl and 0.7 mL (5.45 mmol) of 1,5-cyclooctadiene in 50 mL DMF (dry and O2-free), stirring at 65 1Cunder Nitrogen. The mixture reacted at 65 1C for 72 h. Aftercooling to room temperature, 100 mL of 1 M hydrochloric acid(HCl) was added to reaction mixture and allowed to stir at roomtemperature for 1 h. The mixture was then filtered and washedwith 200 mL of 1 M HCl, twice with 200 mL of de-ionized water,twice with 100 mL DMF followed by 100 mL water and 100 mLmethanol washes. The residue was dried under vacuum for24 h. The procedure yielded 1.084 g polymer (96% yield). Theresulting solid was extracted for low molecular weight chainsvia Soxhlet extraction with DMF for 5 h, to obtain 0.890 g oflong chain polymers.
Polymer–multi-walled carbon nanotube (MWCNT) compositesP14AQ–CNT. The composite was made by ultra-sonicating usingCole-Parmer 750 Watt Ultrasonic Processor a suspension of40 mg of P14AQ (as made) in 40 mL of NMP at 5 1C for20 minutes, followed by adding 120 mg MWCNT into the polymersuspension to be sonicated for 20 minutes, resulting in a well-dispersed 4 mg mL�1 ink.
PVFc–CNT. The composite was made by ultra-sonicatingusing a suspension of 160 mg of PVFc in 40 mL of NMP at5 1C for 20 minutes, followed by adding 160 mg MWCNT into thepolymer suspension to be sonicated for 20 minutes, resulting in awell-dispersed 8 mg mL�1 ink.
Preparation of electrodes. Non-woven carbon mat were dip-coated into the polymer–CNT inks multiple time to deposit acertain mass of the composite. These were dried for 40 min inan oven at 120 1C and ambient pressure between dips, and thendried at the same conditions for 12 h after the final dip. Thesewere used for electrochemical characterizations and for cellassembly.
Electrochemical cell assembly. Each electrochemical cellwas assembled by carefully laminating 9 layers and the ILs inthe following order: SS current collector; P14AQ–CNT coatedcarbon mat; IL; electrolyte separator; IL; PVFc–CNT coatedcarbon mat electrolyte separator; SS current collector; PVFc–CNTcoated carbon mat; IL; electrolyte separator; IL; P14AQ–CNT coatedcarbon mat; SS current collector. The electrolyte separatorswere either Whatman-2 cellulose filter paper, and the IL was[Bmim][Tf2N].
Electrochemistry. Electrochemical measurements were carriedout using a Parstat 3000-DX potentiostat with VersaStudio soft-ware from Princeton Applied Research. Cyclic voltammetry was
Paper Energy & Environmental Science
Ope
n A
cces
s A
rtic
le. P
ublis
hed
on 0
1 O
ctob
er 2
019.
Dow
nloa
ded
on 1
/10/
2022
10:
20:0
0 PM
. T
his
artic
le is
lice
nsed
und
er a
Cre
ativ
e C
omm
ons
Attr
ibut
ion-
Non
Com
mer
cial
3.0
Unp
orte
d L
icen
ce.
View Article Online
3546 | Energy Environ. Sci., 2019, 12, 3530--3547 This journal is©The Royal Society of Chemistry 2019
conducted in a standard three-electrode glass cell with a poly-mer–CNT coated substrate as working electrode, platinum wire asthe counter electrode and Leakless Ag|AgCl Reference Electrode(purchased from eDAQ). The IL electrolyte was stored atB20 mbar and purged with N2 or CO2 for 30 min beforerecording the CV. All CV measurements were compensatedfor internal resistance of the cell. Ferrocene was added at theend of CV experiments for reference adjustment. Potentiostaticand galvanostatic experiments were conducted in a two-electrode mode. All electrochemical and experiments wereconducted at T B 21 1C.
Microscopy. Non-woven carbon mats were imaged usinghigh-resolution scanning electron microscope (HR-SEM), ZeissMerlin. The electron high tension was between 3–6 kV, and thehigh efficiency secondary electron (HE-SE2) detector was usedin an analytic column mode. Diluted suspensions of P14AQ–CNT (0.1 mg mL�1) were dropcast onto holey-carbon transmissionelectron microscopy (TEM) grid for imaging using HR-TEM, JEOL2010 Advanced High Performance TEM.
Gas mixes. Mixtures of N2 and CO2 were made for the sealedchamber batch and the open flow capture and release experi-ments. These were made by controlling the flow rates usingAalborg Mass Flow Controller GFC-17 (0–50 mL min�1) for theCO2 and (0–50 mL min�1) for the N2 for experiments with 45%CO2 and (0–1000 mL min�1) for experiments with o5% CO2.
Sealed chamber capture and release. The electrochemicalcell(s) were placed in an insulating sealed chamber that wascharged with different CO2 concentrations (with nitrogen as thebalance) at B1 atm and B21 1C by purging for 2 h. Potentialdifference was applied across the power feed-throughs thatwere connected to the electrochemical cells, and the decreaseand increase in pressure in the chamber, upon capture andrelease, respectively, was monitored using a Omegas PXM409-USBH pressure transducer with a range of 0–15 psia and anaccuracy of 0.08% BSL.
Flow capture and release experiments. The assembled electro-chemical cells were stacked in a flow cell with the P14AQ–CNTelectrode sides tracing parallel passages. The stack of these cells,separated by B500 mm, was placed in a gas flow chamber (theexperimental setup) and gas was flown past them. Mixtures ofnitrogen and carbon dioxide at B10 mL min�1 and various inletconcentrations of CO2 at T B 21 1C were studied. The bed volumeof the system was 70 cm3. The concentration of CO2 in themixture at the outlet was measured using CO2-Meter SprintIRs
with an accuracy of 100 ppm.
Conflicts of interest
There are no conflicts to declare.
Acknowledgements
This work was supported by an MIT Energy Initiative Seed Fundgrant, and by Eni Eni S.p.A. We thank Jonathan Thomas andZiad Mansour for their assistance in coating and assembly of
electrodes, and Michael J. Tarkanian and Mark Belanger fortheir guidance and help with the fabrication of the adsorptionbeds. This work made use of the DMSE microscopy facility andmachine shop, and the Edgerton Student Shop at MIT.
References
1 F. Giorgi, P. H. Whetton, R. G. Jones, J. H. Christensen,L. O. Mearns, B. Hewitson, H. vonStorch, R. Francisco andC. Jack, Geophys. Res. Lett., 2001, 28, 3317–3320.
2 W. Cai, A. Santoso, G. Wang, S.-W. Yeh, S.-I. An, K. M. Cobb,M. Collins, E. Guilyardi, F.-F. Jin, J.-S. Kug, M. Lengaigne,M. J. McPhaden, K. Takahashi, A. Timmermann, G. Vecchi,M. Watanabe and L. Wu, Nat. Clim. Change, 2015, 5, 849–859.
3 J. Tollefson and K. R. Weiss, Nature, 2015, 528, 315–316.4 M. E. Boot-Handford, J. C. Abanades, E. J. Anthony, M. J.
Blunt, S. Brandani, N. Mac Dowell, J. R. Fernandez, M. C. Ferrari,R. Gross, J. P. Hallett, R. S. Haszeldine, P. Heptonstall,A. Lyngfelt, Z. Makuch, E. Mangano, R. T. J. Porter,M. Pourkashanian, G. T. Rochelle, N. Shah, J. G. Yao andP. S. Fennell, Energy Environ. Sci., 2014, 7, 130–189.
5 G. T. Rochelle, Science, 2009, 325, 1652–1654.6 F. L. Horn and M. Steinberg, Fuel, 1982, 61, 415–422.7 J. Wang, L. Huang, R. Yang, Z. Zhang, J. Wu, Y. Gao,
Q. Wang, D. O’Hare and Z. Zhong, Energy Environ. Sci.,2014, 7, 3478–3518.
8 A. Brunetti, F. Scura, G. Barbieri and E. Drioli, J. Membr. Sci.,2010, 359, 115–125.
9 United States Environmental Protection Agency, Inventory ofU.S. Greenhouse Gas Emissions and Sinks: 1990–2016, 2018.
10 ASHRAE, ASHRAE 62.1-2016, Ventilation for Acceptable IndoorAir Quality, 2016.
11 J. Winnick, H. Toghiani and P. D. Quattrone, AIChE J., 1982,28, 103–111.
12 S. Choi, M. L. Gray and C. W. Jones, ChemSusChem, 2011, 4,628–635.
13 M. C. Stern, F. Simeon, H. Herzog and T. A. Hatton, EnergyEnviron. Sci., 2013, 6, 2505.
14 W. J. Ward, Nature, 1970, 227, 162–163.15 N. Jemaa, H. J. Walls, R. D. Noble, D. E. Wedman and
C. A. Koval, AIChE J., 1993, 39, 867–875.16 P. A. Terry, R. D. Noble, D. Swanson and C. A. Koval, AIChE J.,
1997, 43, 1709–1716.17 W. L. Bell, A. Miedaner, J. C. Smart, D. L. DuBois and
C. E. Verostko, J. Aerosp., 1988, 97, 544–552.18 D. L. DuBois, A. Miedaner, W. Bell and J. C. Smart, Electro-
chemical and Electrocatalytic Reactions of Carbon Dioxide,Elsevier, 1993.
19 P. R. Scovazzo, J. Electrochem. Soc., 2003, 150, D91–D98.20 B. Gurkan, F. Simeon and T. A. Hatton, ACS Sustainable
Chem. Eng., 2015, 3, 1394–1405.21 R. Ranjan, J. Olson, P. Singh, E. D. Lorance, D. A. Buttry and
I. R. Gould, J. Phys. Chem. Lett., 2015, 6, 4943–4946.22 P. Singh, J. H. Rheinhardt, J. Z. Olson, P. Tarakeshwar, V. Mujica
and D. A. Buttry, J. Am. Chem. Soc., 2017, 139, 1033–1036.
Energy & Environmental Science Paper
Ope
n A
cces
s A
rtic
le. P
ublis
hed
on 0
1 O
ctob
er 2
019.
Dow
nloa
ded
on 1
/10/
2022
10:
20:0
0 PM
. T
his
artic
le is
lice
nsed
und
er a
Cre
ativ
e C
omm
ons
Attr
ibut
ion-
Non
Com
mer
cial
3.0
Unp
orte
d L
icen
ce.
View Article Online
This journal is©The Royal Society of Chemistry 2019 Energy Environ. Sci., 2019, 12, 3530--3547 | 3547
23 J. H. Rheinhardt, P. Singh, P. Tarakeshwar and D. A. Buttry,ACS Energy Lett., 2017, 2, 454–461.
24 P. Xiao, J. Zhang, P. Webley, G. Li, R. Singh and R. Todd,Adsorption, 2008, 14, 575–582.
25 T. Harada, F. Simeon, E. Z. Hamad and T. A. Hatton, Chem.Mater., 2015, 27, 1943–1949.
26 D. H. Apaydin, E. D. Głowacki, E. Portenkirchner andN. S. Sariciftci, Angew. Chem., Int. Ed., 2014, 53, 6819–6822.
27 Z. Song and H. Zhou, Energy Environ. Sci., 2013, 6, 2280.28 Z. Song, Y. Qian, M. L. Gordin, D. Tang, T. Xu, M. Otani,
H. Zhan, H. Zhou and D. Wang, Angew. Chem., 2015, 127,14153–14157.
29 Y. Zhou, B. Wang, C. Liu, N. Han, X. Xu, F. Zhao, J. Fan andY. Li, Nano Energy, 2015, 15, 654–661.
30 S. Muench, A. Wild, C. Friebe, B. Haupler, T. Janoschka andU. S. Schubert, Chem. Rev., 2016, 116, 9438–9484.
31 D. S. Achilleos and T. A. Hatton, ACS Appl. Mater. Interfaces,2016, 8, 32743–32753.
32 M. Hefti, L. Joss, Z. Bjelobrk and M. Mazzotti, FaradayDiscuss., 2016, 192, 153–179.
33 L. Riboldi and O. Bolland, Int. J. Greenhouse Gas Control,2015, 39, 1–16.
34 X. Mao, F. Simeon, D. S. Achilleos, G. C. Rutledge andT. A. Hatton, J. Mater. Chem. A, 2013, 1, 13120.
35 T. Brousse, D. Belanger and J. W. Long, J. Electrochem. Soc.,2015, 162, A5185–A5189.
36 A. Ntiamoah, J. Ling, P. Xiao, P. A. Webley and Y. Zhai, Ind.Eng. Chem. Res., 2016, 55, 703–713.
37 M. B. Mizen and M. S. Wrighton, J. Electrochem. Soc., 1989,136, 941.
38 T. Nagaoka, N. Nishii, K. Fujii and K. Ogura, J. Electroanal.Chem., 1992, 322, 383–389.
39 P. S. Guin, S. Das and P. C. Mandal, Int. J. Electrochem.,2011, 2011, 1–22.
40 P. Bonhte, A. P. Dias, N. Papageorgiou, K. Kalyanasundaramand M. Gratzel, Inorg. Chem., 1996, 35, 1168–1178.
41 P. A. Staley, E. M. Lopez, L. A. Clare and D. K. Smith, J. Phys.Chem. C, 2015, 119, 20319–20327.
42 Q. Li, C. Batchelor-McAuley, N. S. Lawrence, R. S. Hartshorneand R. G. Compton, ChemPhysChem, 2011, 12, 1255–1257.
43 T. Yamamoto and H. Etori, Macromolecules, 1995, 28, 3371–3379.44 R. G. C. Ian Streeter, G. G. Wildgoose and L. Shao, Sens.
Actuators, B, 2008, 133, 462–466.45 D. M. Douglas, M. Ruthven, S. Farooq and K. S. Knaebel,
Pressure swing adsorption, VCH Publishers, 1994.46 M. C. Stern, F. Simeon, H. Herzog and T. A. Hatton, Energy
Procedia, 2013, 37, 1172–1179.47 M. C. Stern and T. A. Hatton, RSC Adv., 2014, 4, 5906.48 A. Ntiamoah, J. Ling, P. Xiao, P. A. Webley and Y. Zhai, Ind.
Eng. Chem. Res., 2016, 55, 703–713.49 M. Ding, R. W. Flaig, H.-L. Jiang and O. M. Yaghi, Chem. Soc.
Rev., 2019, 48, 2783–2828.50 T. M. McDonald, J. A. Mason, X. Kong, E. D. Bloch, D. Gygi,
A. Dani, V. Crocella, F. Giordanino, S. O. Odoh, W. S. Drisdell,B. Vlaisavljevich, A. L. Dzubak, R. Poloni, S. K. Schnell,N. Planas, K. Lee, T. Pascal, L. F. Wan, D. Prendergast,J. B. Neaton, B. Smit, J. B. Kortright, L. Gagliardi, S. Bordiga,J. A. Reimer and J. R. Long, Nature, 2015, 519, 303–308.
51 J. S. Lee, J. H. Kim, J. T. Kim, J. K. Suh, J. M. Lee andC. H. Lee, J. Chem. Eng. Data, 2002, 47, 1237–1242.
Paper Energy & Environmental Science
Ope
n A
cces
s A
rtic
le. P
ublis
hed
on 0
1 O
ctob
er 2
019.
Dow
nloa
ded
on 1
/10/
2022
10:
20:0
0 PM
. T
his
artic
le is
lice
nsed
und
er a
Cre
ativ
e C
omm
ons
Attr
ibut
ion-
Non
Com
mer
cial
3.0
Unp
orte
d L
icen
ce.
View Article Online