Breeding for high protein content inrice
10
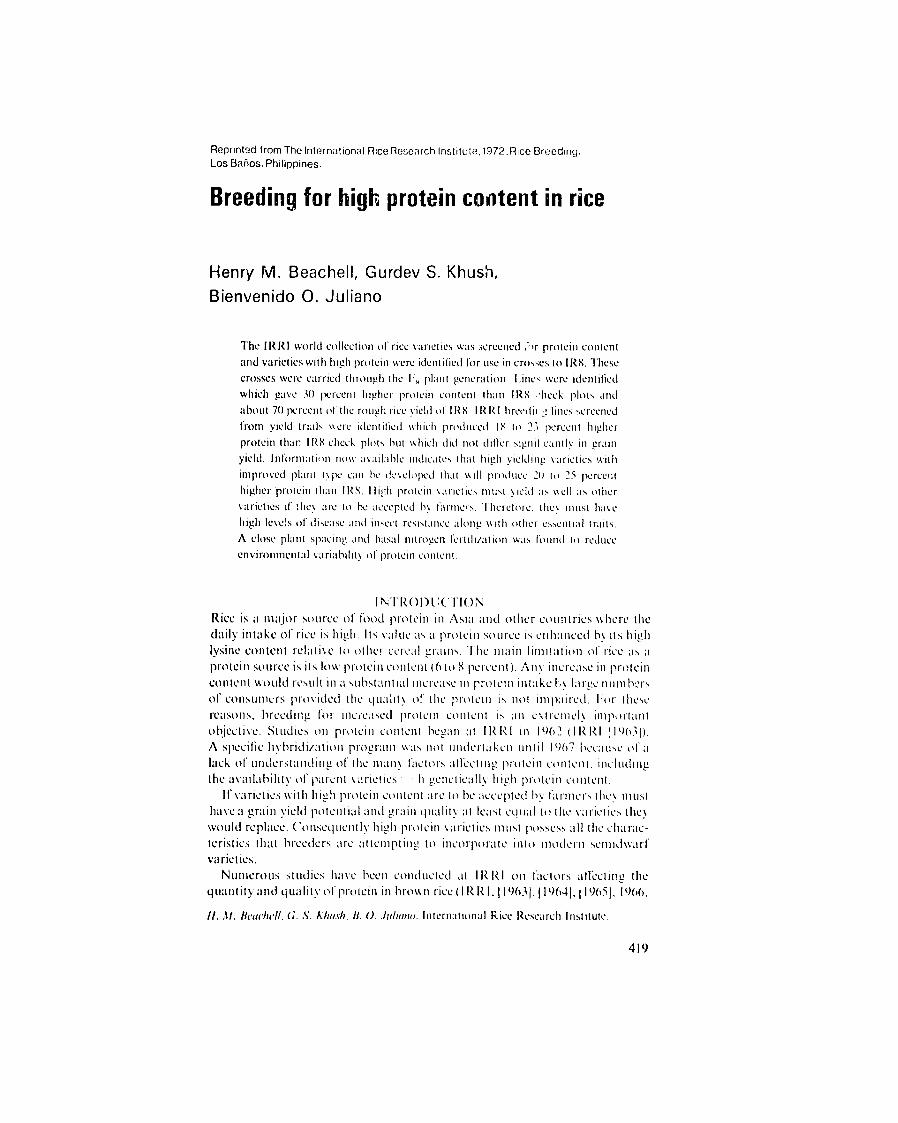
Reprinted from The International Rice Research Institute. 1972.Rice Breeding. Los Bahos. Philippines. Breeding for high protein content in rice Henry M. Beachell, Gurdev S. Khush, Bienvenido 0. Juliano The IRRI world collection o1 rice va'rietes was s:creened ,")r protein conlent and varieties with high prolcin were identified for use in cro,-;cs Io IR8. These crosses were carried through the I, plant generation linc were identified which gave 3(0 percent higher protein contcnt i than I , hCck plots and about 70 percent of' the rough rice yield of' IR. IR I breedil line,, screenCd from yield trial kkcrc identitied wkhich produced I8 to 23 percent higher protein thar IRX check plots but hich did not differ signil caittly i grain yield. Ilformiation 1lo %available indicates that high ieldilg karietics with improved plait t\pc Can be dcscloped that \kill produce 210it) 2S perccrnt higher protein ihin IR. protein s ll e \ ell i ltlher Ilili %arietie wl tld i varieties if they arcto b - accepted by arinelllrs. 'hcre tore. the2 InIUst hae high levels of disease and inect along %% resistance ith other cs',cnlial trails. A close plant spacing and basal nitrogen Ilrtil i/,itl O waS I'ulnd to reducC environmental \ariablil o1" protein conicill. I NTROI) (TION Rice is ait iajor source of'f ood protein it Asia and other coutries .i ere the daily intake of rice is hih. Its value as a protein source is Ctt'ticed hK its hi&gl Ivsine content rclative to other cereal trai The illail 1ituiatillo of rice as , protein source is its loss proteiti coitetnt (6 to 8 percent). An'\ increase in protcii contetI \would resilt in l substathtial incrcasc in proteilt inltakc,\ larte tUi-bers of' consumers ltOCidel the lualit, of the 1Ioteit! is iot imp1aired. IMr these reasons, brediig Cor ilcised pmtroteil contlctt is all cXtlitRc inlipotatit objective. Studies ott prteMin content begati al, R RI ill 1902 1R RI 11931). A specific hvbridiation prigrattll wasli th0 Ulndertakil until 19067 eccausc ofI a lack of tIndcrsianding of the illail\ factors allccitig prlcitti cotteit. including the availability of patlit siilics .h1gecltically ligh 1protein conteit. If' varieties with hiih protc ittll are" to b e acIcepted b' i1Cr th'\ 1ttLs have a grain 'ield polCitial aid Vraiti quality at feast cutial to the arictic ite\ would replace. (Cotisequentlv high priteii \ai clies liist pos,,ss all the charac- terislics that breeders are attemptiig to itncorporate 11to tttuierl WtILidkar'f varieties. Nlinicrotis stludies ha y Ceell coitdtuctLd at IRIRI on factors all'ecti ii tile qua.tntity and qu;ialitv o1"protein in brown rice([RRI, 119631119641, 119651. 1906. II. Al. Ieachll. G.'. K/no/h. B. 0. J/lian,. Ilnternionival Rice Rescarchilstitute. 419
-
Upload
khangminh22 -
Category
Documents
-
view
0 -
download
0
Transcript of Breeding for high protein content inrice
Reprinted from The International Rice Research Institute. 1972.Rice Breeding. Los Bahos. Philippines.
Breeding for high protein content inrice
Henry M. Beachell, Gurdev S. Khush, Bienvenido 0. Juliano
The IRRI world collection o1 rice va'rietes was s:creened ,")r protein conlent and varieties with high prolcin were identified for use in cro,-;cs Io IR8. These
crosses were carried through the I, plant generation linc were identified which gave 3(0 percent higher protein contcnt i than I , hCck plots and
about 70 percent of' the rough rice yield of' IR. IR I breedil line,,screenCd from yield trial kkcrc identitied wkhich produced I8 to 23 percent higher
protein thar IRX check plots but hich did not differ signil caittly i grain yield. Ilformiation 1lo %available indicates that high ieldilg karietics with
improved plait t\pc Can be dcscloped that \kill produce 210it) 2S perccrnt
higher protein ihin IR. protein s ll e \ ell i ltlherIlili %arietie wl tld i varieties if they arcto b- accepted by arinelllrs. 'hcre tore. the2 InIUst hae
high levels of disease and inect along %%resistance ith other cs',cnlial trails. A close plant spacing and basal nitrogen Ilrtil i/,itlO waS I'ulnd to reducC
environmental \ariablil o1" protein conicill.
I NTROI) (TION
Rice is ait iajor source of'f ood protein it Asia and other coutries .i ere the daily intake of rice is hih. Its value as a protein source is Ctt'ticed hK its hi&gl Ivsine content rclative to other cereal trai The illail 1ituiatillo of rice as , protein source is its loss proteiti coitetnt (6 to 8 percent). An'\ increase in protcii contetI \would resilt in l substathtial incrcasc in proteilt inltakc,\ larte tUi-bers of' consumers ltOCidel the lualit, of the 1Ioteit! is iot imp1aired. IMr these reasons, brediig Cor ilcised pmtroteil contlctt is all cXtlitRc inlipotatit
objective. Studies ott prteMin content begati al, R RI ill 1902 1R RI 11931). A specific hvbridiation prigrattll wasli th0 Ulndertakil until 19067 eccausc ofI a lack of tIndcrsianding of the illail\ factors allccitig prlcitti cotteit. including the availability of patlit siilics .h1gecltically ligh 1protein conteit.
If' varieties with hiih protc ittll are"to be acIcepted b' i1Cr th'\ 1ttLs
have a grain 'ield polCitial aid Vraiti quality at feast cutial to the arictic ite\ would replace. (Cotisequentlv high priteii \ai clies liist pos,,ss all the charac
terislics that breeders are attemptiig to itncorporate 11to tttuierl WtILidkar'f varieties.
Nlinicrotis stludies ha y Ceell coitdtuctLd at IRIRI on factors all'ecti ii tile qua.tntity and qu;ialitv o1"protein in brown rice([RRI,119631119641, 119651. 1906.
II. Al. Ieachll. G.'. K/no/h. B. 0. J/lian,. Ilnternionival Rice Rescarchilstitute.
419

BIENVENIDO 0. JULIANOHENRY M. BEACHELL, GURDEV S. KHUSH,
was centered in the1967a, 1967b, 1968, 1970a, 1971). Most of the early work
chemistry department where nuch information on the knowledge of rice
protein was obtained. At present, the breeding program and other phases of
the protein improvement work are carried out in a coordinated program among
several IRRI departments. A contract with the National Institutes of Health
(Contract PH-43-67-726), which started in 1967, resulted in the expansion of the
program to its present level.
PROTEIN SCREENING PROCEDURES
We measure protein in brown rice in all screening trials rather than in milled are highlyrice since the protein contents of brown rice and of milled rice
removecorrelated (Juliano et al., 1964). Furthermore, it is difficult to bran
For example, in a 1968 variety-fertilizer experimentuniformly in milling. rice protein content of four improved plant type
(IRRI, 1968), the brown 7.3 percent. High
varieties averaged 8.2 percent and that of the milled rice,
protein rice tends to have a lower percentage loss in protein in milling than low
protein rice (IRRI, 1970a). Grain samples used for evaluating the protein content of individual plants
10 fully developed brown-rice grains selectedfrom pedigree rows are based on
at random from the grain produced by a single plant. This sampling technique are taken from appears to be reasonably reliable. Usually three to six plants
each pedigree row. Likewise 20 brown-rice grains are used to determine the
protein content of samples from yield trials. Any yield trial sample that shows a
high or a low value is re-examined. A more reliable technique for sampling
yield trial plots would be usLful. Samjuies are ground in a Wig-L-Bug
amalgamator so small samples must be used.
In preparing experimental plots for protein experiments, every effort should
be made to maintain soil uniformity. Land to be uied should be planted to a
single variety the season before. A relatively low nitrogen fertilizer rate should
be used on the experiments as well as on the preceding rice crop.
SCREENING THE WORLD COLLECTION
The IRRI worla collection of -ice varieties was screened for protein content
starting in 1966 to identify genetically high protein varieties to be used in the
breeding program (Juliano et al., 1968). The mean protein values of the 7,760 overall mean of 10.6 percent.varieties ranged from 5 to 17 percent, with an
There were 126 accessions which showed at least 13.5 percent protein based on
brown rice samples (wzt basis), or a mean of 14 percent for two different crops.
Six varieties, selected from the 126 accessions, showed high protein content
through four crop seasons (Table I). They were subsequently used as parents in BPl-76 and BPI-76-1 none of the crosses with IR8 made in 1967. Aside from
126 high protein varieties screeneo from the world collection have value as
commercial varieties in the Philippines. BPI-76-1 was crossed to IR8 and
420

BREEDING FOR HIGH PROTEIN IN RICE
Table 1. Protein content (of brown rice at 12% moisture) of six varieties screened from the IRRI
world collection that were used as parents in crosses with IR8.
Protein(")
1967
Variety Origin Planting seed
1966 wet season Dry Wet
sehson season
Chok-jye-bi-chal Korea 15.1 15.0 15.4 15.5
Chow-sung Korea 15.3 14.6 15.4
Santo Korea 16.7 14.2 1,.8 13.7
Rikuto Norin 20 Japan 13.5 14.014.5 14.3
Omirt 39 Hungary 14.7 13.6 12.8 14.3
Crythroecros Kom Korea 16.2 11.5 13.5 14.3
IR12-178 (Mon GCim Vang A x l-geo-tze) and selections from both croases were screened along with lines from the other high protein crosses.
HYBRIDIZATION PROGRAM The six high protein parent varieties listed in Table I are all japonica varieties. except Ornirt 39 from lungary which is classified as an indica variety (I RRI,
1970b). These six varieties came from temperate regions and are not adapted to
a tropical climate. They mature very early, total dry matter production is low and they are susceptible to several important diseases and insects. The extremely
high protein content ofthe six varieties maY be due Inpart It.an environment
genotype interaction brought about by their low grain yield and low total dry
matter production. On the other hand, these varieties appear to possess genes for high protein since sonie of their hybrid progeny show higher than normal protein content combined with imnp oved plant type and higher total dry matter production. The six high protein crosses have been :advanccd through the F, generation. Most of the lines appear to be lixed for most plant and grain
characters and many have been tested iinreplicated yield trials. There was a wide segregation of plant types coming from the crosses. Some
sterility was encountered but this was not a serious problem. Rigid selection
pressure lbr improved plant type and high protein cont nt was exercised each
generation siarting with the F, plant generation. While protein contents as
high as the high protein parents were seldom observed, there were many lines
that produced consistently higher protein !hlan the IRS check rows. The range
and average protein content of plants selected fro,n each generation are shown
for the IR 1103 cross in Table 2. The data for IRI 100, IRI 101. IRI 1(12. IRI 104.
and IR 1105 were similar. Many of the hybrid lines gave higher protein values
than I R8 check plants each generation. Likewise, the average protein content
of the plant selections made from these crosses was higher than that of the
IR8 check row plants in each L_-eation (F3 to 1:,,)for each cross.
421

1 2 °/o moisture) of lines from highTable 2. Summary of single-plant brown rice protein analyses (at
protein cross IRA 103.
Protein content (",)
1R8'IRl103"
Season Generation MeanYear
Range Mean Range
F 16.0 16.0 10.0 10.0 1967 Wet
8.0F, 6.8 12.8 9.7 6.3 9.91968 Dry
F. 7.2 !4.0 10.1 6.4 11.3 8.4 1968 Wet
6.5 15.9 10.8 7.1 11.1 8.7 1969 Dry 1%
7.9 15.3 11.2 7.6 10.1 8.7 1969 Wet 1,
!:7 7.0 15.0 101.4 7.5 10.8 8.7 1970 Dry
8.4Fs 6.9 15.2 10.6 6. 11.71970 Wet
5 J. 13.2 6.49.7 9.2 7.5 1971 Dry
qIR8 x Chow-sung. 'Check rows.
Table 3. Summary of protein content (brown ike at 12% moisture) and other data on high protein
lines and IR8 grown in pedigree rows.
Protein content (",)
: F, :,, I:, rough :,Seeding to rice yield fertility
Line heading Avg. of Bulk (g/pla n t { ",, (days) two plants sample
4o.2 89104 8.5 7.5 7.5IR8"
IRS .%(ho-.sung 44.4 94
IR1 ;03-1-3 1(12 10.7 10.6 11.1 1It) 10.7 1(.7 49.1 88
IR 1103-2-3-1-3 100 1I. 39.6 90102 10.6 11.6IR 1103-2-3-1-5
IR 1103-15-8-4 1(19 11.6 11.4 11.3 32.1 84 8710.1 11.7 45.5
IR 1103-15-8-5 11)5 11.6 32.5 89
IR 1103-52-2 103 10.9 9.5 9.2
10.7 1().0 10.5 33.6 89IR 1103-66-4 85
36.6 85IR 1103-68-6 104 11.) 9.9 10.3
IR,x ('rrhroc'erosKorn 52.1 89
IR 1104-1(17-2 10, 9.9 8.6 7.6
IRS x Rikuto Norin 20 35.4 92
IR 1100-67-5 103 13.0 9.9 10.1
IRx Onzirl 39 44.7 83
IRI 1101-14-3 85 9.8 7.7 8.3 8.7 34.3 91
IRI 111-18-3 95 9.9 9.1 1(.5 35.1 80
IRI 101-29-3 79 12.7 9.2
IRI 101-38-4 76 12.0 1(.8 1(.5 41.4 87 8770 12.8 11.9 11.4 37.8IR1101-44-3
11.1 10.9 311.5 7912.3IR1101-45-2 80
"Protein values are averages of plants from IR8 check rows grown in nursery each season.

BREii)IN(; FOR HIIGHl PROTEIN IN RICE
The average protein contents of selected lines based oi the F, to [F, seed
generation are shown in Tahle 3. The protein conCn t of six lines exceeded thait of the IR8 check plants by 3.5 to 4.5 percentage points or from 41.2 to 52.9
percent. In the F,, geuenlion these lines exceeded IR 8 1y from 1.7 to 4.4
percentage points or 22.7 to 5X.7 percent. The average rough rice yield her plant of tie six lines averaged 77 percent of the yield of IR8. There wcre four lines
which averaged about the saie rough rice ield as IRS and a\ciaged 3.1
percentage points higher protein (4 1.3 percent iorc).
ENVIR( )NINT ANI) PR)IIlN (()NTE NI
is caused envirnmnl fatorsactConsiderable variabilit, in proten content
such is season of tile .Neill,r et or dr) scason), plallt population deli\ and
time and rate of niltiogen fertili/cr applied. tsually protein content Is higher
during the Wet se..ason0 thall during the dr\ season, ptbl bccausc grain
yields are higher during the dr\ season.
ItR8 plants sho\%Cd diffcences in prolein content of as much ais 75 percent
within a sea.on when a 3(0x 3),.1n plalit spacing and split application ofnit rogen
fertili/cr (basal aiid lop dressing) wore used. We reduced this \ariahi litv\ in the
1971 dry season by using a.closer plant spacing (2( x 20 cm) and b\ applying
all nitrogei, feriilizcr basally bcfore Iransplanting. The conbincd efl'ect of' the
closer plant spicing and the basal N treatment \as a reduction in p'!ein
content and red uced variabilivt as shown in Tables 2and 3. In the 'uit nrC. we will
plant pedigree nurseries at a spacing of 20 x 201 cm and possibly gro\ as Ima n\
as three rows of' each selection rather thin; .1uLsta single I. Plants to be
evaluated for protcin coiitent \would be saxcd fron the center row of each li ne. Table 4 shows the effect of' platit population densit\ on prolcili content in an
experiment conducted by the IR I agrononiv department. The protein colntent
of IR8 varied romn 6.1 to 9.0 percent ill the dry season and from 6.9 to 9.5
percent in the wet season. I R I27-S0-1. ailox' tillerinu it aerict\, shovcd all even
greater variation betx centa close spacing and wvidC spacing.
Tabic 4. Percentage (if hrovn rice protein at 12% moisture of IR8 and IR1127-80-1 (unfertili/ed) at different plant densities. (Data are aierages of three replications.)
Prolcin (",,
)r\ selson Ve' Weavon
Plant spacing (cm) IR, I R 127-9i-1 IRS IR 127.514.1
Broadcast 6. t 01 75 20 x 20 6.4 0.4 7.6 7.8
30 x 30 6.7 7.5 76 5.4
40 x 40 6.6 8.6 7.9 8,5
50 x 50 7.1) ).3 8.7 9.0
I00 x 100 i 10l) '.5 11.3
423

S. KIIUSHI, BIENVENIDO 0. JULIANO iENRY M. BEACHELL, GURDEV
Table 5. Percentage of brown rice protein of two varieties as
affected by time of nitrogen application? IRRI, 1969-1970.
1969 wet season' 1970 dry sea son'
Application time IR8 IR20 IR8 IR20
8.3 8.98.8 9.2
50'%, basal and 50",, at pamicle initiation 8.6 9.6 8.6 9.2
50", basal and 50'',, at
Basal
9.99.0 9.5 8.9heading
15 times of harvest each with three
replications. "60 kg/ha N applied. LSI) (5",,) = 0.7. '150
kg/ha N applied. LS) (5"',) : 0.5.
"Data are averages over
Late application of nitrogen fertilizer tends to increase protein content and
agronomy department (IRRI, 1971,variability as well. Trials by the 1RRI
p. !31-132) have shown the wide differences that occur in protein content between
basal application and split application (Table 5). In our future pedigree nurseries
and in preliminary yield trials nitrogen will be applied basally. Lines found to
have higher protein at moderate nitrogen levels should eventually be tested at
high levels and with split application to determine their overall response. Rate
of nitrogen applied and protein content appear to be positively correlated.
YILD TRIALS FOR PROTEIN CONTENTSCREFNING The varieties and breeding lines grown in most yield trials at IRRI are screened
for protein content. From this screening program, IIR480-5-9 (Nahng Mon S4/2 as t highidentified by the agronomy departmentx Taich ung Native 1) was
a replicated varietyprotein line (IRRI, 1971). IR480-5-9 yielded 6.7 t/ha in
yield trial at IRRI in 1967 dry season in which IRS yielded 7.2 tha. This line
is not suitable for farm production in the Philippines because of susceptibility
leaf blight. leafhoppers, and planthoppers. The higher proteinto bacterial content of I ,480-5-9 has been confirmed in later experiments. Other lines
A Tlaichungshowing high protein content are IR160-27-3 (Nahng Mon S4
Native I) and 1It667-98 (IRS x jYukara xTaichung Native I]). A sister line of
IR160-27-3 has been named Sinaloa A68 in Mexico and is being grown coi
but no infornation is available on tile comparative protein contentmerciall, of Sinaloa A68 and other commercial varieties. The lines from Nahng Mon S4
crosses produce satisfactory milled rice yields and they have attractive grain
appearance. type being widely tested in Korea, gaveline with IR8 plantIR667-98, a
higher protein content than leading japonica varieties in several 1970 variety
as well as in two IRRI yield trials in thefertilizer trials conducted in Korea
Further testing of IR667-98 is required to substantiate1971 dry season. these findings.
424

BREEDING FOR IlGH PROTEIN IN RICE
YIELD OF HIGH PROTEIN LINES
Selected F, plant lines from high protein crosses, grown in a single-plot
observational yield trial are shown in Table 6. A 20- x 20-cm plant spacing was
used in this test and all nitrogen was applie, basally. The IRX check plots
yielded 4.75 to 5.64 t/ha and with protein contents from 6.0 to 6.6 percent.
Several lines in this test approached the yield of IRS and had considerably
higher proteil contents than IRS.
Many of [Ihe same lines were grown in a replicated yield trial (Table 7).
A 20- x 20-cm plant spacing was used and 120 kg/ha N was applied basally.
Six hybrid lines in this test did not differ sign ifican ly in yield of rough rice
from IRS, but had a significantly higher protein content: IR 16t)-27-3. IR 773A I36-2, 11P1-76-1, two IR1006 (I R8 x BPI-76-1) lines, and ;m irr:id],tW i R8 line
obained from tlie Phililppine Atomic Research Center. In the same replicated yield trial there were six lines from the high proteii
crosses (I RII 100to IkII05) which averaged 30.1 percent higher protein than
IR.but thei: average yield was 31 perc.ent low.er than IR8. They arc shown in
Table 7 alog with four other lines from the high protein crosses thl a'craged
only 8.2 percent higher protein than IR8 with grain yields 24.1 percent lo, er
than IR8. The two groups o'lincs did not show statistically significant diferences
in grain yield but showed highly significant diflerences ifprotein content.
Apparently this significant difference in protein con tent is gencticaly controlled.
The results of five 1971 dry season yield trials in which IRS, IR480i-5-9, and
IR 160-27-3 \ere grown are shown ;n Table 8. The average yields of' IR48t)-5-t)
Table 6. Grain yield, protein (at 12% moisture), and other data from brecaing lines ani iarities
groAn insingle obserational yield tri-i plots. IRRI, 1971 dry ,ason.
Yield Protein
Seeding ic Plant Rough Brown coment An~ose 'rIit rice rice
Line no. heading anies ht rice (davs)elr(no.) {tIIa) .la) protem ri n Millertidtd C J e p.
tdas) tha 1 ki 1kgim rice ric .
IR 1102-25-3' 93 13 112 4.23 3.19 322 10.1 85 25.6 I.
I R 1113-64-4 103 12 82 3.54 2.72 169) 6.2 5.0) 20.9 I. 2 0 9.3 8.8 27.4IR 1104- i6-2 76 8 76 3.53 2.69
1R480-5-9" 96 10 87 4.71 3.52 722 . 7.3 22.' L.
IR8" 114 13 73 5.15 3.9s . .,3 6.2 537 28.5 I. 24.0 .IR 160-25-3' 104 II 98 4.85 3.66 ,"4 8.03 6.98
IRI 1105-15.7' 77 12 73 4.50 3.56 235 8.0 7 1 254 1. 8.8 8.3 Wa\s 1.IRI 100-111-2 102 13 90 4.23 3.21 2> 6
I.IR 1103-1-3-7 96 II 103 4.71 3.71 238 91 8.1 28.4
3.57 2.75 209 7.6 6.0 27.') I.IR 1103-15-8 108 9 87 76 28.5 1.IRI103-1-3-5 97 II 99 4.28 1.40 265 7.8
IR667-98-1 88 II 75 5.53 4.31 353 82 7.0 19.1 1.
"Averageof four plots. 'Gelatinization temn.perature, L -- low. 'I R8 xSanto. 'IR8 xChok.-j.e-hi-chal.
425

GURDEV S. ;.IjUSH, BIENVENIDO 0. JULIANOHENRY M. BEACIIELL,
Table 7. Average rough and brown rice yields and protein content (at 12% moisture) of brown and
1971 dry season. milled rice and other data of lines grown in replicated yield trial, IRRI,
Yield Protein
Rough Brown Bro.n cotent ( AinyloselkantSeeding to Pne Gel.rice iroen Milled tenmp.rice rice ph BrownLine no. heading rice rice(days) (cm) (i/ha) (t/ha)
13 96 4.16 3.24 330 10.2 9.3 25.6 L IRI 100-18-3 74
4.9 " 9.5 8.9 22.8 L87 38.1 362IRI 101-64-I 73 15 27.8 1.
104 12 193 7.01 5.35 392 7.3 6.7IR8
12 85 6.61 5.10 42',1 8.4 7.8 23.4 L IR773AI-36-2 89
9.6 8.4 27.6 L12 89 4.91 3.81 366IRI 103-49-4 99
8.3 7.6 27.6 LII 96 6.92 5.46 453IRI006-26-1 99
6.9 27.4 L6.35 4.91 393 8.0IR1M)6-33-1 I100 II 95
9.1 21.890 10 92 6.04 4.57 416 8.4 L IR480-5-9
468 8.5 7.8 23.1 L10 99 7.02 5.50IR160-27-3 97
111 4.90 3.89 351) 9.0 8.3 25.9 L IR 1103-1-3 95 12
8.8 26.5 L5.13 3.29 303 9.2IRI103-2-3 89 15 93
24.8 L 101 10 ( 91 4.61 3.57 350 9.8 8.7
IR 1103-15-8 10 129 6.02 4.58 394 8.6 7.8 25.1 It/I
BPI-76-1 92 7.6 6.6 18.0 L83 6.73 5.26 4(10IR 1103-52-2 95 12
30 6.0 28.2 L6.54 5 6.9IRI 103-64-4 I01 13 99
L low, 11/I - high/intiernediaie."Average of three plot. 'Gelatinization lemperature,
and IR160-27-3 do not differ significantly from IR8 but they exceed IR8 in
protein content by a margin of 23 and 18 percent, respe lively.
PROPERTIESHI(H1l PROTEIN CONTENT AN!) OTIER GRAIN high protein breeding
A taste-panel evaluation of cooked milled rice of some
U. Ofiate of the University of the Philippines,lines conducted by Dr. Liz
College of Agriculture, showed no significant differences in color scores among
cross that differed by as much as 4 percentage points of lines from the same
contentin the raw grain. The lines compared had similar amylose
protein has a
(IRRI, 1971). Presumably, an increase in protein content of 2 percent
negligible effect on the color of milled rice.
Anino acid analysis of F4 brown rice grains of the lines with the lowest
and the highest protein contents among the six crosses, IRI 1(00 to IRI 105,
showed a decrease in lysine and tryptophan values as protein content iIcreascd
caused by either(IRRI, 1971). It appears that increases in protein content
otlthe anino acidgenetic or environmental Factors have sinilar effects
11.4 tocomposition of rice protein. Milled rice of F, seeds of Jivc lincs with
I .S ,, protein containcd 3.3 to 4.0",, lysine, 3.4 to 4.1 ",,thrconinc, 0.9 to 1.2",,
Iryptophan, and 3.0 to 4.6",, sulfur amino acids in the protein (IRRI, 1971).
lysine content in theirThese res'Its show that if both parents have normal
points in protein does not necessarilyprotein. an increase of 2 percentage
result in a lowering in lysine content, since the lines with similar protein content
426

IREEI)ING FOR Il(HIPROTEIN IN RICE
Table 8. Summary of mean rough and brown rice yields, protein content (at 12% moisture), mi:ing
And other data on IR8 and two high protein lines. IRRI, 1971 dry season.
Yield Protein (,)
Rough Brown Brown rice Brown Milled Brown Total ilead
Line rice rice protein rice rice rice milled rice
(t/ha) (t/ha) (kg/ha) rice (",,) C
Replicated yield trial' ( 120 kg/hii N) 7.4 7.0 78 5 7.9 49.6IR8 7.12 5.51 408
IRI60-27-3 6.56 5.06 43(0 8.5 7.8 77.1 67.8 44.9 05.5 51.6IR480-5-9 6.04 4.57 402 9.1 8.4 75.6
Variety xjertilizer trial' (60 AKgiha N) 410 7.2 6.7 77.9 68.1 47.9IR8 7.30 5.69
76.4 69.3 35.8
1R480-5-9 6.31 4.75 413 8.7 8.4 67.2 1R160-27-3 6.86 5.24 409 7.8 7.6
75.2 44.9
I ariety x fertilizer trial' (120 kgiha N)
IRK 7.13 5.52 475 8.6 8.0 77.8 08.3 41.0 10.2 9.9 76.8 68.5 39.31R160-27-3 7.07 5.43 554
IR480-5-9 7.51 5.68 602 11.6 10.3 75.7 (7.1 51.3
VarietyI x spacing xlertdizer experimen r ( 120 kg 'ta N)
IR8 5.64 4.37 315 7.2 77.5 68.4 52.4
IR160-27-3 6.19 4.77 415 8.7 8.2 77.1 70.1 48.2 8.3 76.3 68.4 53.6IR480.5-9 6.31 4.81 433 91.0
Ohserrationalyield trial' (80 kg/ia N;
IR8 5.14 3.94 213 6.2 5.4 70.7 66.9 46.7
1R160-27-3 4.85 3.60 289 7.9 6.9 75.4 66.8 38.7
8.0 7.5 74.7 64.4 41.81R480-5-9 4.71 3.52 282
lean of/ive trials
IR8 6.40) 4.97 358 7.3
IR160-27-3 6.24 4.84 412 8.6
1R480-5-9 6.18 4.59 416 9.0
"Four replications. (h replications.'Agronony department trial.
show a range in lysine content aid one tnay select progenies with high lysine vaI cs.
When high protein lines of divergent ori.in ar? combined intfurther hybridiz
ations there may be a further ;ncreasc in protein content. Crosses are being
made x hich combine the dilierent high protein sources. These crosses also
include combinations with high yiclding, diseasc- and insect-resistanlt lines.
An increase in protein content of 25 percent without any reduction in grain
yield appears to be a reachable goal.
LITF.RATUR. (TIT-D
-IRRI (Int. Rice Res. Illst.). 119631. An al report 19+'61-196 '.oas Ifios. Ph iippines. 55 p.
. 11964]. Annual report 1963. L.os Baios. Philippines. 1; ; p. 11965). Annual report 194. Los Bafios. Philippines. 3 ' 1
427
KHUSH, BIENVENIDO 0. JULIANOHENRY M. BEACHELL, GURDEV S.
1966. Annual report 1965. Los Baios, Philippines. 357 p.
1967a. Annual report 1966. Los Ba~ios, Philippines. 302 p.
1967b. Annual report 1967. Los Bafos, Philippines. 308 p.
. 1968. Annual report 1968. Los Baios, Philippines. 402 p. Bains, Philippines. 266 p.-- . 1970a. Annual report 1969. L.os
Catalog of rice cultivars and breeding lines (Ory:u sativa L.) in the world collection19701. p.of the International Rice Research Institute. Los Baios, Philippines. 28!
1971. Annual repo-t for 1970. Los Baios,Philippines. 265 p..
Juliano, B. 0., G. B.Cagampang, L. J.Cruz, and R.G.Santiago. 1964. Some physicochemical
properties of rice inSoutheast Asia. Cereal Chem. 41:275-286. high protein
Juliano, B.0., C.C. Ignacio, V. M. Panganiban, and C.M.Perez. 1968. SLrcenig fo,
rice varieties. Cereal Sci.Today 13:299-301, 313.
Discussion: Dreeding for high protein content in rice
P. A. LwiFuw-KI'-SoNG: Ilave you analyzed F, material for protein content? F, seeds.H. M. Beachell: No analysis was done on
A. 0. ABIFARIN: I-low much of the brown rice protein is left after milling?
milled rice in protein content by more thanB. 0. Juliano: Brown rice dots not exceed removal of 10 percent by
one percentage point. With brown rice of 8 percent protein,
weight as bran-polish during milling leaves about 84 percent of brown rice protein in the
milled rice. At about I I percent protein, the loss of brown rice protein during milling is
only about 12 percent oased on 10 percent weight removal, leaving 88 percent of its protein
in milled rice. E. A. Sii)i)iQ: Do you find differences in the levels of protein increase among varieties
with increasing rates of applied nitrogen? If so, is it anyway related to the endosperm
texture (packing of starch granules)? B. 0. Juliano Yes, increased protein content from applied fertilizer ritrogen improves
grain translucency and the hardness of any variety.
T. 1-1.1OtINsroN : Breeding for higher protein content is also an important phase of the
rice improvement programs in thL U.S. Determining the protein and lysine content of
promising lines isa routine part of the quality testing procedure. Several U.S. researchers
have reported that the protein content of brown rice in different crosses did not appear to
F2 plants and F, lines indicated that the heritability ofbe simply inherited. Studies on protein content was low.
428