Heritability Estimates and Associations for Protein Content and ...
74
AN ABSTRACT OF THE THESIS OF POLAT SOLEN for the MASTER OF SCIENCE (Name) (Degree) AGRONOMIC CROP SCIENCE presented on (Major) A,1 /1,.3 Title: HERITABILITY ESTIMATES AND ASSOCIATIONS FOR PROTEIN CONTENT AND GRAIN YIELD INVOLVING FOUR WINTER WHEAT CROSSES (TRITICUM AESTIVUM VILL., HOST) Abstract approved: Redacted for privacy Warren E. Krofnsitad Four agronomically and genetically diverse winter wheat parents were utilized as the experimental organisms. Atlas 66 and NB 68513 were selected as cultivars with a high and stable protein content when grown under different environmental condidtions. They are interme- diate for grain yield when grown in the Pacific Northwest. Yamhill and Hyslop represented low protein, high yielding cultivars adapted to the Pacific Northwest. Data were obtained from crosses between the two high protein cultivars and the two low protein cultivars based on the performance of the parents and the F1 and F2 generations. These experimental populations were grown in 1971 at the Pendleton Experiment Station and the Central Oregon Experimental site at Madras, Oregon.
-
Upload
khangminh22 -
Category
Documents
-
view
5 -
download
0
Transcript of Heritability Estimates and Associations for Protein Content and ...

AN ABSTRACT OF THE THESIS OF
POLAT SOLEN for the MASTER OF SCIENCE(Name) (Degree)
AGRONOMIC CROP SCIENCE presented on(Major)
A,1 /1,.3
Title: HERITABILITY ESTIMATES AND ASSOCIATIONS FOR
PROTEIN CONTENT AND GRAIN YIELD INVOLVING FOUR
WINTER WHEAT CROSSES (TRITICUM AESTIVUM VILL.,
HOST)
Abstract approved: Redacted for privacyWarren E. Krofnsitad
Four agronomically and genetically diverse winter wheat parents
were utilized as the experimental organisms. Atlas 66 and NB 68513
were selected as cultivars with a high and stable protein content when
grown under different environmental condidtions. They are interme-
diate for grain yield when grown in the Pacific Northwest. Yamhill
and Hyslop represented low protein, high yielding cultivars adapted
to the Pacific Northwest.
Data were obtained from crosses between the two high protein
cultivars and the two low protein cultivars based on the performance
of the parents and the F1 and F2 generations. These experimental
populations were grown in 1971 at the Pendleton Experiment Station
and the Central Oregon Experimental site at Madras, Oregon.

Measurements were made on an individual plant basis for pro-
tein content, grain yield, 50 kernel weight, kernels per spike, tillers
per plant and plant height.
Differences among and within crosses were determined by the
analysis of variance. Information concerning the nature of inheri-
tance was obtained by comparing the F1
and F2 means in relation to
performance of the parents; the frequency distribution of the genera-
tions for protein content; and by determining broad and narrow sense
heritability estimates for the six characters studied. The existence
of possible phenotypic associations among the six characters studied
was determined by using correlation coefficients. In order to evalu-
ate the possible direct and indirect effects of grain yield and the com-
ponents of yield on protein content, path coefficient analyses were
employed.
Significant differences were observed among and within crosses
at both the Pendleton and Madras sites for most characters measured.
The F1
and F2 mean values were found to be near the mid-parent
of the two parents in all four crosses for plant height, 50 kernel weight
and kernels per spike. There were several exceptions depending on
the particular cross and specific character. Protein content mean
values were also intermediate between the two parents for the F1
and
F2 generations. In crosses involving Hyslop, the mean values tended
to be near the highest parent. Little or no transgressive segregation
was noted in the F2 generation.

Evidence of non additive gene action was noted both for grain
yield and tiller number in the F1
and F2 generations with the mean
values exceeding the highest parent in all crosses for grain yield at
the Pendleton site. Tillers per plant at Pendleton and both tillers per
plant and grain yield at Madras also showed some degree of hybrid
vigor, but the magnitude depended on the particular cross.
The high broad and narrow sense heritability estimates obtained
both at Pendleton and Madras for all traits suggested that there was a
large amount of genetic variation present for the characters studied.
The narrow sense estimates further suggested that a high percentage
of the total genetic variation was due to genes which function in an
additive manner.
Significant negative correlations were noted between protein
content and grain yield including some of the components of yield. In
evaluating the direct and indirect effects with path coefficient analysis,
these negative associations resulted from the large negative indirect
effects of 50 kernel weight and kernels per spike on protein content
via grain yield at the Madras site. At the Pendleton site, where
moisture became a limiting factor, the negative association resulted
largely as the indirect effect of 50 kernel weight on protein content
through grain yield.
The large environmental influence on protein content was par-
ticularly striking at the Pendleton site. With the spring application of

nitrogen, a delay in maturity for Hyslop and Yamhill was noted and
with the subsequent loss of moisture, shriveled grain resulted and
hence a higher protein content with lower grain yield. This resulted
in the grain protein of Hyslop and Yamhill being higher than that of
Atlas 66 and NB 68513.
The results of this study suggest that it may be necessary to
compromise in attempting to develop high protein lines with maximum
yield. However, it should be possible to increase the protein content
two to three percent and still maintain the yielding ability of Hyslop
and Yamhill.

Heritability Estimates and Associations for ProteinContent and Grain Yield Involving Four
Winter Wheat Crosses (Triticumaestivum Vill. , Host)
by
Polat So len.
A THESIS
submitted to
Oregon State University
in partial fulfillment ofthe requirements for the
degree of
Master of Science
June 1973

APPROVED:
Redacted for privacyProfessor of Agronomy
in charge of major
Redacted for privacy
Head of Department ofL'Ag'ronomic Crop Science
Redacted for privacy
Dean of Graduate School
Date thesis presented 4,.? /9'X3
Typed by Susie Kozlik for Polat Solen

In dedication to my mother and father

ACKNOWLEDGEMENTS
The writer wishes to express his sincere appreciation and thanks
to Dr. W. E. Kronstad for his guidance and willing assistance during
the course of the research and preparation of this thesis.
Thanks are also expressed to Drs. R. V. Frakes and R.
Bogart for serving as committee members.
Appreciation is also extended to Dr. Mary McCoy for her
willingness to review the manuscript.
The author is also very grateful to the Government of Turkey
and to the Rockefeller Foundation for sponsoring his studies at Oregon
State University.

TABLE OF CONTENTS
INTRODUCTION
Page
1
LITERATURE REVIEW 3
Nature of Inheritance Influencing Protein 3
Relationship Between Protein, Grain Yield and SomeComponents of Grain Yield 8
Influence of Environment on Protein 11
MATERIALS AND METHODS 16
EXPERIMENTAL RESULTS 20Analysis of Variance 20Nature of Inheritance 23Associations 32
DISCUSSION 39
SUMMARY 49
BIBLIOGRAPHY 52
APPENDIXPedigrees and Description of the Four Parental Lines 57

LIST OF TABLES
Table page
1 Summary of the observed mean squares fromanalysis of variance for protein content, yield perplant, 50 kernel weight, kernels per spike, tillersper plant and plant height obtained at Pendleton,Oregon
2 Summary of the observed mean squares from analysisof variance for protein content, yield per plant, 50kernel weight, kernels per spike, tillers per plantand plant height obtained at Madras, Oregon
21
22
3 Mean values for protein content, yield per plant, 50kernel weight, kernels per spike, tillers perplant and plant height obtained at Pendleton, Oregon 24
4 Mean values for protein content, yield per plant,50 kernel weight, kernels per spike, tillers perplant and plant height obtained at Madras, Oregon 26
5 Broad and narrow sense heritability estimates forprotein content, yield per plant, 50 kernel weight,kernels per spike, tillers per plant and plant heightobtained at Pendleton and Madras, Oregon
6 Phenotypic correlation coefficients among six char-acters: protein content, yield per plant, 50 kernelweight, kernels per spike, tillers per plant andplant height obtained at Pendleton, Oregon
32
34
7 Phenotypic correlation coefficients among sixcharacters: protein content, yield per plant, 50kernel weight, kernels per spike, tillers perplant and plant height obtained at Madras, Oregon 34
8 Direct and indirect interrelationships of grain yieldand some components of yield influencing total proteincontent at Pendleton, Oregon
9 Direct and indirect interrelationships of grain yieldand some components of yield influencing total proteincontent at Madras, Oregon
35
37

LIST OF FIGURES
Figure Page
1 Frequency distribution of four parent populationsfor protein content (%) at Pendleton (A) and Madras(B), Oregon
2 Frequency distribution of parents, Fl, and F2populations from the crosses (A) Yamhill x Atlas66, (B) Yamhill x NB 68513, (C) Hyslop x Atlas66, and (D) Hyslop x NB 68513 for protein con-tent (%) at Pendleton, Oregon
3 Frequency distribution of parents, F1 and F2populations from the crosses (A) Yamhill x Atlas66, (B) Yamhill x NB 68513, (C) Hyslop x Atlas66, and (D) Hyslop x NB 68513 for protein content(%) at Madras, Oregon
26
27
31

Table
1
APPENDIX TABLES
Page
Some environmental factors associated with the twoexperimental sites 58
2 Mean values of all entries at two locations for sixcharacters 58

HERITABILITY ESTIMATES AND ASSOCIATIONS FORPROTEIN CONTENT AND GRAIN YIELD INVOLVING
FOUR WINTER WHEAT CROSSES (TRITICUMAESTIVUM VILL., HOST)
INTRODUCTION
Mankind in today's world faces not only the threat of inadequate
food supplies, but also the likelihood that increased sources of food
may be inferior in nutritional properties. Cereal grains and particu-
larly wheat are widely adapted to many areas of the world and currently
are the staple food for many of the developing countries. If through
plant breeding, new cultivars of wheat can be developed which combine
high grain yield with increased protein content, a major contribution
can be achieved. Should increases in protein quantity be realized, it
will then be necessary to evaluate the quality aspects of this increased
protein content in later studies.
Plant breeders rely on genetic variability for the improvement
of plant species to better meet his needs. In the past, breeders have
been very successful in utilizing such variability to increase the pro-
duction of cereal grains. The recent dramatic increase in wheat yields
with the development of the semi-dwarf cultivars is an excellent ex-
ample of how genetic variability can be explored.
Grain protein is influenced both by genetic and environmental
factors as are other plant characters and may account in part for the
lack of success in developing high protein cultivars. There is also

2
the possibility that grain yield and protein content may be negatively
associated. Therefore, in order to make progress selecting for both
high grain yield and also acceptable protein levels in wheat, the plant
breeder must know how much of the total variation observed in segre-
gating populations is due to genetic factors. Also he must be aware of
any possible negative associations which might exist between yield and
protein content.
The major objectives of this study were to determine the nature
of inheritance influencing protein content, grain yield and the compo-
nents of yield; to investigate the possible associations of these charac-
ters including the possible direct and indirect associations which may
exist; and to evaluate how much the environment may influence the
efficiency of selection at two diverse locations.

3
LITERATURE REVIEW
Many research workers have been interested in the protein con-
tent of wheat grain, particularly because protein is one of the major
factors determining bread quality. Perhaps of even more importance
is that wheat flour in some form is a major source of protein in the
diet of millions of people. If the protein content of wheat could be in-
creased, it might improve the nutritional aspects of wheat as a food.
Therefore, if plant breeders could combine high grain yields with in-
creased protein, a major contribution could be achieved. Unfortun-
ately, many investigators have noted that a negative relationship exists
between grain protein and grain yield in some wheat populations.
Information concerning the inheritance, the relationship between
grain yield and its components and the influence of environment on
protein content is needed if plant breeders are to develop high yielding,
high protein cultivars and perhaps avoid, to a degree, the reported
negative relationship between yield and protein content.
Nature of Inheritance Influencing Protein
The genetic variability for protein content in wheat was clearly
demonstrated in 1954 by Middleton et al. (26). Protein content of
thirteen soft red winter wheat cultivars were compared in a series of
tests during a three year period. Large varietal differences were

4
observed with Atlas 50 and Atlas 66 being superior in yield and protein
content. In a similar study significant differences were found in pro-
tein content among cultivars Atlas 50, Atlas 66, Wichita and Comanche
(12).
Recent studies in Mexico (43) showed that the protein content of
grain can vary from 11.63% to 18.67% with an average of 15.25% in
489 wheat lines grown under the same environmental conditions. In
1970, 7,000 wheat cultivars from the world collection were screened
for protein by Johnson et al. (14). There were great varietal differ-
ences in protein content of wheat cultivars, varying from 6% up to 22%.
Inheritance of protein in wheat has been studied in an effort to
better understand the nature of this character. Several investigators
(18, 19, 35) have attempted to study the number of genetic factors in-
volved in the inheritance of protein content in wheat. Normal distri-
bution of F2
segregating populations have been reported by Stuber
et al. (35) and Johnson et al. (18). They concluded that there was
more than one major gene conditioning high protein content in the
populations studied. Most inheritance studies have considered protein
content as a quantitatively inherited character.
Davis et al. (4) determined broad sense heritability estimates for
protein content in four crosses of winter wheat in which Atlas 66 was used
as the high protein progenitor. The heritability estimates ranged from
54% to 69% depending upon the cross. High heritability values indicated

5
the presence of considerable genetic variability for protein content,
and hence selection for high and low protein content would be effective
depending upon the particular cross.
Kaul and Sosulski (20) studied a cross between Selkirk X Gabo,
and Hsu and Sosulski (13) used a four parent diallel cross of spring
wheat for evaluation of protein content. In both studies high broad
sense heritability estimates were obtained. The heritability values
ranged from 42 % to 71% and 79% to 82%, respectively.
In 1962 Haunold et al. (11) calculated the narrow sense herita-
bility estimates for grain protein in wheat by using standard unit method
( a modification of parent progeny regression method by coding data
in standard units) and the regression of F3 on F2. Larger herita-
bility estimates were obtained from the standard unit method. With
heritability values ranging from 58% for Atlas 66 X Wichita and 41% for
Atlas 66 X Comanche the values obtained from the regression
method were 36% and 25%, respectively.
Lofgren et al. (24) calculated narrow sense heritabilities for
protein content in wheat using the regression and standard unit method.
Information was obtained on four crosses involving Atlas 50, Atlas 66,
Triumph and Kaw utilizing the regression of F4 onF3 and F5 on F4 gener-
ations for two consecutive years. The values obtained by the standard
unit method ranged from 16% to 73% for the four crosses, whereas
values obtained by the regression method ranged from 24% to 68%.

In general, values were larger where the standard unit method was
used.
Schlehuber et al. (30) studied the narrow sense heritability
values for protein content by regressing the F5 on F4 in a Triumph X
CI 12406 cross. The narrow sense heritability estimate for protein
was 47%.
Parental and early generation populations from the cross PI
56219 X Conley were evaluated for a number of baking quality proper-
ties involving protein (23). Narrow sense heritability values were
determined by regression of F5 and. F6 generation means on F2 line
values. The values for protein content were 37% and 70%, respectively.
They concluded that great differences for heritabilities were an indi-
cation of environment X genotype interaction which could reduce ef-
fectiveness of early generation selection for this trait under certain
conditions.
Also Stuber et al. (35) calculated broad and narrow sense herita-
bility estimates for protein content and other agronomic characters
in wheat. The average of P1, P2, and. F1 variances was
used as a measure of the nonheritable variances in obtaining broad
sense heritabilities. The broad sense heritability estimates were
based on F2 and the backcross variances. The narrow sense herita-
bility estimate for protein content (82%) was as large as broad sense
heritability values. In fact, some of the narrow sense heritability

7
estimates for other agronomic characters were larger than broad
sense heritability values.
Interrelationships between grain protein content and other quality
characters of wheat were studied in F2 and F3 generations of Itana X
Atlas 66 cross (37). The narrow and broad sense heritability esti-
mates were low. The values for protein content obtained utilizing the
regression method of F3 on F2 and the components of variance were
15% and 24% respectively.
Dokic et al. (6) found largely a non additive influence on protein
content in several crosses of wheat. They reported that there was no
additive effect of genes on protein content in these crosses. In another
study Hsu and Sosulski (13) found a slight over-dominance intraallelic gene
action for protein content, and that both dominant and recessive genetic
factors were contributing to the expression of this trait.
In 1972 eight wheat cultivars were evaluated for combining ability
with regard to protein content (2). Both specific and general com-
bining ability were significant. However, specific combining ability
was more important than general combining ability for this trait.
Five spring wheat crosses were evaluated on the basis of gene
action for grain protein by Chapman and McNeal (3). There was no
epistatic effect for the inheritance of protein content. Two crosses out
of five showed significant dominant type gene action., In all crosses

8
under investigation, the additive genetic effect was highly significant.
Transgressive segregation for protein content in wheat has also
been reported by several investigators (9, 13, 35).
Relationship Between Protein, GrainYield and Some Components
of Grain Yield
Association between yield and protein content has been investi-
gated by many research workers. Some investigators reported that
increased protein content in the hybrid progeny was not associated
with a decrease in grain production (6, 10, 16, 17, 26). However,
results from the majority of studies suggest that depending on the
populations evaluated and the environmental factors present during
the growing season, negative associations between these two charac-
ters were generally observed.
Four cultivars were utilized to determine the possible relation-
ship between yield and protein content over a two year period by
Haunold et al. (12). The relationship between yield and protein content
was not consistent and depended upon the year and variety. The cor-
relation between yield and protein in Atlas 50 and Atlas 66 in 1958 was
low and negative but statistically not significant. In 1959 a highly
significant negative correlation was found for Atlas 66 and Comanche.
Davis et al. (4) evaluated four crosses between Atlas 66, Leap,
Malakoff Nittany 3 and Chancellor to determine the inheritance of

protein, texture and grain yield. Genotypic and phenotypic correla-
tions were determined for these characters.
9
A negative relationship
between percent protein and yield was observed in three out of four
populations.
Terman and others (39) studied yield and protein relationships
in wheat as affected by nitrogen and moisture. They found a highly
significant negative relationship between yield and protein at each level
of nitrogen applied. Kivi (21) also found a negative relationship be-
tween grain yield and protein content of 42 spring wheat cultivars.
There was a wide variation in protein content among cultivars produc-
ing medium yield, and selection could have increased protein content
without reducing yield excessively.
A significant negative association was also observed between
yield and protein in both F2 and F3 generations involving a cross
between Itana X Atlas 66 (37). Johnson et al. (18) also reported that
yield and protein tended to be negatively associated.
McNeal and others (25) studied grain and plant nitrogen rela-
tionships in crosses of eight spring wheat cultivars. They selected
high and low protein lines from the extraneous of the F3 distribution.
Bulk populations of high and low protein lines were seeded at three
locations. A significant negative association was observed between
grain yield and grain nitrogen content.
10
Duffield et al. (8) found that a negative r elation existed between yield
and protein content in segregating populations of NB 65579 X OIL
60111 cross. By selecting simultaneously for both high protein and
high yield, improvements could be made for both traits.
Since protein analysis is expensive and time consuming, plant
breeders have been interested in determining if protein content might
be associated with other more easily identified agronomic characters
that might help in the selection process.
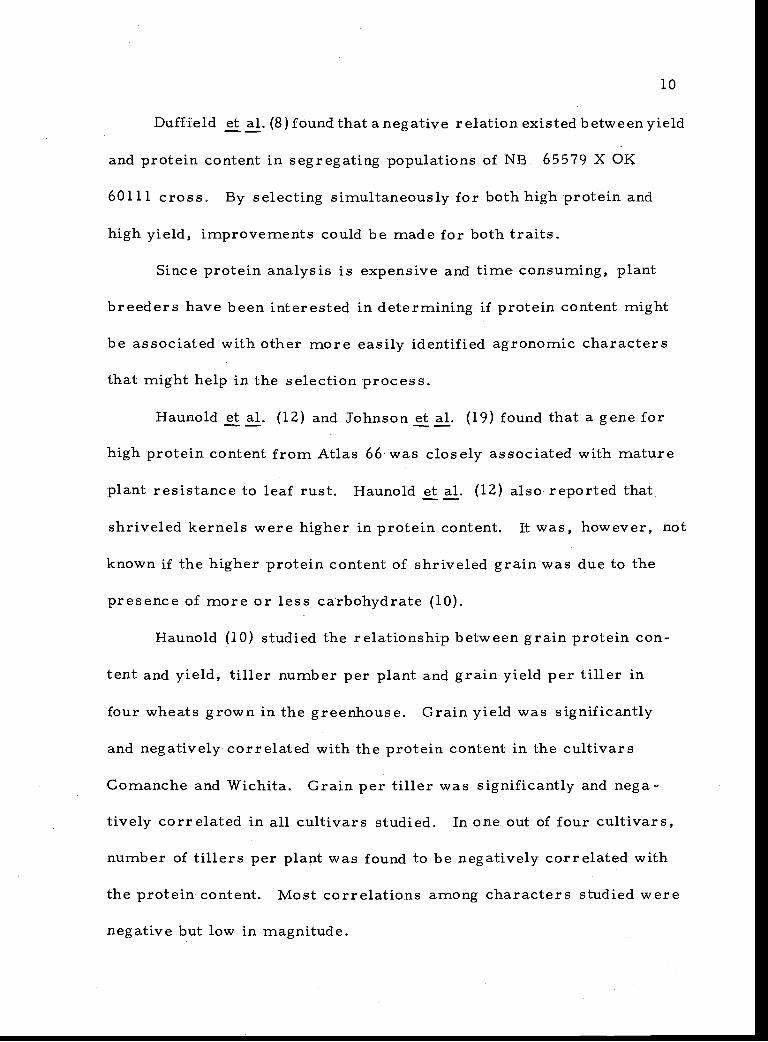
Haunold et al. (12) and Johnson et al. (19) found that a gene for
high protein content from Atlas 66 was closely associated with mature
plant resistance to leaf rust. Haunold et al. (12) also reported that
shriveled kernels were higher in protein content. It was, however, not
known if the higher protein content of shriveled grain was due to the
presence of more or less carbohydrate (10).
Haunold (10) studied the relationship between grain protein con-
tent and yield, tiller number per plant and grain yield per tiller in
four wheats grown in the greenhouse. Grain yield was significantly
and negatively correlated with the protein content in the cultivars
Comanche and Wichita. Grain per tiller was significantly and nega-
tively correlated in all cultivars studied. In one out of four cultivars,
number of tillers per plant was found to be negatively correlated with
the protein content. Most correlations among characters studied were
negative but low in magnitude.

11
In 1962 Stuber et al. (35) reported both phenotypic and genotypic
correlation coefficients between grain protein and other plant and seed
characteristics in F2 generation of a Wichita X Atlas 66 cross. The
genotypic correlation was greater than phenotypic correlation values.
The correlation coefficients between protein content and plant height,
number of tillers per plant, grain per spike and grain yield per plant
were highly significant and negative. Grain protein content had a
highly significant positive correlation with flowering data. All pheno-
typic correlations were low. Therefore, selection could not be effec-
tive for high protein content based on seed and plant characteristics.
Genotypic correlation of grain protein content with plant height was
high in magnitude. Thus selection for high protein based on plant
height may be effective if environmental effects could be reduced.
The simple correlations among 14 quality and four agronomic
characters were evaluated for 112 F4 lines in a Triumph X CI 12406
cross (30). Correlation coefficients were low and statistically non-
significant between protein content and grain yield, test weight, height
and heading date.
Influence of Environment on Protein Content
Environmental factors have been shown to have a major influence
in determining protein content in wheat. Austin and Kumari (1) studied
the influence of several environment factors on the protein content of

12
several Indian wheat cultivars. They observed a highly significant
environmental effect with the varietal effect being much smaller. The
mean protein content for 13 New Puso wheats tested ranged from
11.75% to 12. 39%. Some varieties were consistent with respect to
protein content regardless of the environment in which they were
grown.
Terman et al. (39) studied yield and protein relationships in
wheat as effected by nitrogen and moisture at several locations. Pro-
tein content of hard red winter wheat cultivars varied more widely be-
tween locations than among varieties at each location. Similar findings
have been reported by other investigators (29, 31).
Johnson et al. (16, 19) reported that a single wheat genotype
could produce grain protein varying from 8 to 18 percent depending
upon the environment in which it is grown and the particular cultivars.
Due to this strong influence of the environment on protein content, the
genetic differences among the cultivars for protein content have not
been easily separated (19, 23).
The effect of environment and rate and type of nitrogen applica-
tion on protein and lysine was determined on the content of six spring
wheat cultivars when grown at four locations (38). Both protein and
lysine were greatly influenced by environmental factors, nitrogen con -
tent ranged from 3. 7% to 5.1% depending upon variety and location.

13
Hence the influence of environment should be considered when evalu-
ating genotypes collected from different locations for this trait.
The International Winter Wheat Performance Nursery (IWWPN)
was established to determine the influence of the environment on
several characters of wheat (33). According to the results obtained
from 21 sites in 1970, the Frondoso derivatives, Atlas 66, Purdue
4930 A6-28-2-1 and NB 67730 consistently had a higher protein content
than other varieties tested. However, the protein content of these
cultivars varied between 14.2% to 21.5% for Atlas 66, 14. 3% to 19.5%
for Purdue 4930 A6 -28 -2 -1 and 13.6% to 20.5% for NB 67730 depending
on the locations. The results were similar to those reported from the
1971 International Winter Wheat Performance Nursery (34).
The intraplant and interplant variation for grain protein content
in Atlas 66 x Wichita and the F1
progeny resulting from this cross was
determined (36). Variations were found to exist between plants of the
same cultivar as well as within portions of individual spikes. In the
same study the environmental effect was found to be more pronounced
among high protein cultivars than low protein cultivars. Significant
correlations were not found between yield and protein or flowering date
and protein. Therefore, variation among plants resulting from the
high protein parent Atlas 66 could not be attributed to those characters
noted.

14
The vegetative parts of plants were analyzed by Seth et al. (32)
at different stages of development for nitrogen content to determine
the nitrogen utilization of high and low protein cultivars of wheat.
There was no significant difference in total nitrogen content of
vegetative parts of high and low protein cultivars before heading.
Later a rapid increase in nitrogen content in the spikes of the high
protein cultivars was observed.
Swaninathan and others (38) observed a gradual increase in pro-
tein content with an increasing rate of nitrogen. The average protein
content of six spring wheat cultivars was 16.88% when 200 kg/ha of
nitrogen was added and 13. 66% average protein content for the control
plots. Similar findings have been reported by a number of investiga-
tors (22, 28,. 29, 31, 42).
Finlay and Shepherd (9) reviewed the literature and concluded
that high protein was the result of efficient and complete translocation
of nitrogen from plant to grain.
Johnson et al. (15, 16, 18) investigated several wheat cultivars
and five experimental high protein lines to evaluate possible relation-
ships between plant nitrogen and the protein content of the grain.
Differences in nitrogen content of these vegetative parts of the plant
and the protein content of the grain were noted, but these differences
were not found to be associated. Actually they found that low protein
lines were higher in nitrogen than high protein lines, but these

15
differences were not significant. Therefore, the nitrogen uptake and
the translocation of nitrogen were separate and independent physiologi-
cal systems in the wheat plant.
Different results were obtained in another study when selected
high and low protein F3 bulk populations of eight spring wheat crosses
were analyzed (25). Both high and low protein levels of the F3 bulk
populations produced the same amount of above ground plant nitrogen
and each translocated the same percentage of nitrogen to the grain.
However, grain nitrogen content of high protein F3 bulk populations
was significantly higher than lower protein lines but they were lower
in yield. A possible explanation was that the high grain nitrogen content
in these high protein populations resulted in the distribution of the
same amount of nitrogen to a smaller amount of grain yield.
Most of the research workers have agreed that correlations be-
tween protein and other agronomic characters were usually too low to
be predictive. Also, due to the strong influence of environment on
protein content, the genetic differences among cultivars have not been
easily separated.

16
MATERIALS. AND METHODS
Four agronomic and genetic diverse winter wheat parents were
used as the experimental organisms. The parental lines were Yamhill
(CI 14563), Hyslop (CI 14564), Atlas 66 (CI 12561) and NB 68513
(CI 10574). These four parents will be referred to as P1, P2, P3
and
respectively. A detailed pedigree for each line is given in theP4,
Appendix.
Hyslop and Yamhill are low protein,soft white, winter, high
yielding cultivars adapted to the Pacific Northwest. Atlas 66 and NB
68513 are high protein, red, winter cultivars which are intermediate
for grain yield when grown in the Pacific Northwest.
Crosses were made in 1970 and 1971 with the F1
generation
grown for F2 seed production in 1971. In the fall of 1971, F1
and F2
generations, along with the parents were planted in a split plot design
with crosses being the main plots and generations the sub plots.
Parents were planted with each group of crosses resulting in sixteen
entries per replication with four replications. Individual plots con-
sisted of 25 plants for the parents and F1
plants and F2 entires con-
sisted of 4 rows with 25 plants per row. In order to provide uniform
competition, parents, F1
and F2 populations were blended with a semi-
dwarf brown chaffed experimental line and planted as a solid seeding.
Plots were established at the Pendleton Experiment Station and Central

17
Oregon Experiment Station site located at Madras, Oregon. Soil type,
rainfall during growing season,fertility and weed control procedures
are listed in Table 1 in the Appendix. In order to minimize any pos-
sibility of moisture stress at Madras, the experiment was irrigated
seven times with a total of 356 mm of water applied during the growing
season.
Protein content was determined by the Udy dye binding capacity
method (27, 41). The amount of protein was expressed as a percent of
dry matter (a 0.5 thample from an individual plant). Forty samples
were subjected to both Udy and Kjeldahl determinations with similar
protein values observed for both methods. Periodical checks with
samples of known protein content were used during the protein analysis
to ensure consistent results.
Plant height was obtained by measuring the distance between the
secondary crown and the tip of the tallest tiller, excluding awns. Grain
yield was obtained by weighing the grain from each plant and fifty ker-
nel weights from each plant were noted. Tiller number was determined
by counting the number of tiller bearing spikes. Number of kernels
per spike was determined by the following formula:
Kernels per spike 50 x grain yield/50 kernel weighttillers per plant
Measurements were made on a single plant basis for the parents, F1' s

18
s' . Ten plants representing parents and F1
and 50 F2 plants perF2
replication were sampled.
Data for the six characters from each location were analyzed
separately. Each cross was considered as one group in the analysis
of variance. The general error term (entries x replication) was used
to test differences among crosses and within crosses. The mean
values of the parents, F1
and F2 generation of each cross were com-
pared using Duncan Multiple Range Test at the five percent level.
Broad and narrow sense heritability values were calculated for
each character. Broad sense heritability estimates were obtained
from the analysis of variance using the formula suggested by Thomas
and Kernkarrip (40).
Narrow sense heritability estimates were calculated by the stan-
dard unit method using the F1' means on the means of the mid parent,
and F2's means on the means of Fit s.
All possible phenotypic correlations among the six characters
were computed at two locations. The simple correlations for the four
crosses were further analysed by path coefficient analysis (5). By
this method, direct and indirect relationships were determined between
protein and other characters studied. The path coefficient (P = stan-
dard partial regression coefficient) was determined by the following
formula:

19
Sib' =b -s
y
where b' = standard partial regression coefficient, b = regression co-
efficient,efficient, Si = standard deviation of independent variable, and S
standard deviation of dependent variable.

20
EXPERIMENTAL RESULTS
Analysis of Variance
Differences among all 16 entries were highly significant for the
six characters at both locations (Tables 1 and 2). When each cross
was considered as a group, differences among crosses were also
significant (p=0. 01) for tillers per plant, protein content, 50 kernel
weight and kernels per spike at both locations. The differences among
crosses for grain yield were highly significant only at the Pendleton
site. There were significant differences (p=0. 05) among crosses for
plant height at Madras, but similar differences were not observed in
height at Pendleton.
Differences within crosses (among F1, F2 generations and the
parents of a given cross) were partitioned for each cross. For gener-
ations within each cross, significant differences (p=0.01) were ob-
served for plant height, protein content, 50 kernel weight and kernels
per spike at both locations. Grain yield was also found to be signifi-
cantly different for generations at the Pendleton site. At Madras, the
crosses P1 x P3 and P2 x P3 were significantly greater for grain
yield while there were no significant differences within generations
for the other crosses. For tillers per plant, significant differences
were observed at Pendleton only for generations within P1 x P3 and
P2 x P3. Opposite results were obtained at Madras where generations

Table 1. Summary of the observed mean squares from analysis of variance for protein content, yieldper plant, 50 kernel weight, kernels per spike, tillers per plant, and plant height obtained atPendleton, Oregon.
Source of Variation D. F
Observed mean squaresProteincontent
Yield perplant
50 kernelweight
Kernels perspike
Tillers perplant
Plantheight
Replication 3 4.97** 2.14 .080** 7.27 .58 3..50
Entries 15 9.04** 13.46** .120** 57. 69 ** 1.76** 523.02**
Among crosses 3 10.37** 8.56** .060** 50.27** 2.21** 1.09
Within crosses 12 8.70** 14.67** .140** 59.55** 1.65** 6.26
Within P1 x P31 3
3 2.89** 14.79** .090** 33.82** 2.37** 499.61**
Within P1 x P4 3 9.05** 10.88** 200** 98.33** .67 317.07**
Within P2 x P3 3 6.44** 24.63** .160** 36.23** 3.30** 975.37**
Within, P2 x P4 3 16.44** 8.34** .12o** 69.80** .25 713.67**
Replication x Entries 45 .46 .83 .008 4.60. _22 3.61
Total 63 --- --- --- - --
Coefficient of variation 5.10 13.17 5.24 5.96 8.67 1.62
* Significant at the 5% level** Significant at the 1% level

Table 2. Summary of the observed mean squares from analysis of variance for protein content, yield,per plant, 50 kernel weight kernels per spike, tillers per plant, and plant height obtained atMadras, Oregon.
Source of Variation D. F
Observed mean squaresProteincontent
Yield perplant
50 kernelweight
Kernels perspike
Tillers perplant
Plantheight
Replication 3 .53 9.63** .070** 134. 24** . 19 372.58**
Entries 15 16.83** 2.41** .121** 93.15** 1.33** 194.49**
Among crosses 3 5.30** .80 .020** 32. 13 ** 2.70** 36.68**
Within crosses 12 19.72** 2.82** .147** 108.40** .99** 231.45**
Within P1 x P3 3 22.87** 3. 72 ** .086** 101.72** .10 205.17**
Within P1 x P4 3 26. 64** 1.66 .268** 162.44** 2. 13 ** 152.9**
Within P2 x P3 3 12. 74** 4. 38 ** .069** 59. 32** .22 362. 36 **
Within P2 x P4 3 16.61** 1.51 . 160** 110. 11 ** 1.51** 205.25**
Replication x Entries 45 .24 . 73 .003 5.07 .21 5.51
Total 63
Coefficient of variation 3.17 16.75 2.43 7.20 12.76 2.66
* Significant at the 5% level** Significant at the 1% level
23
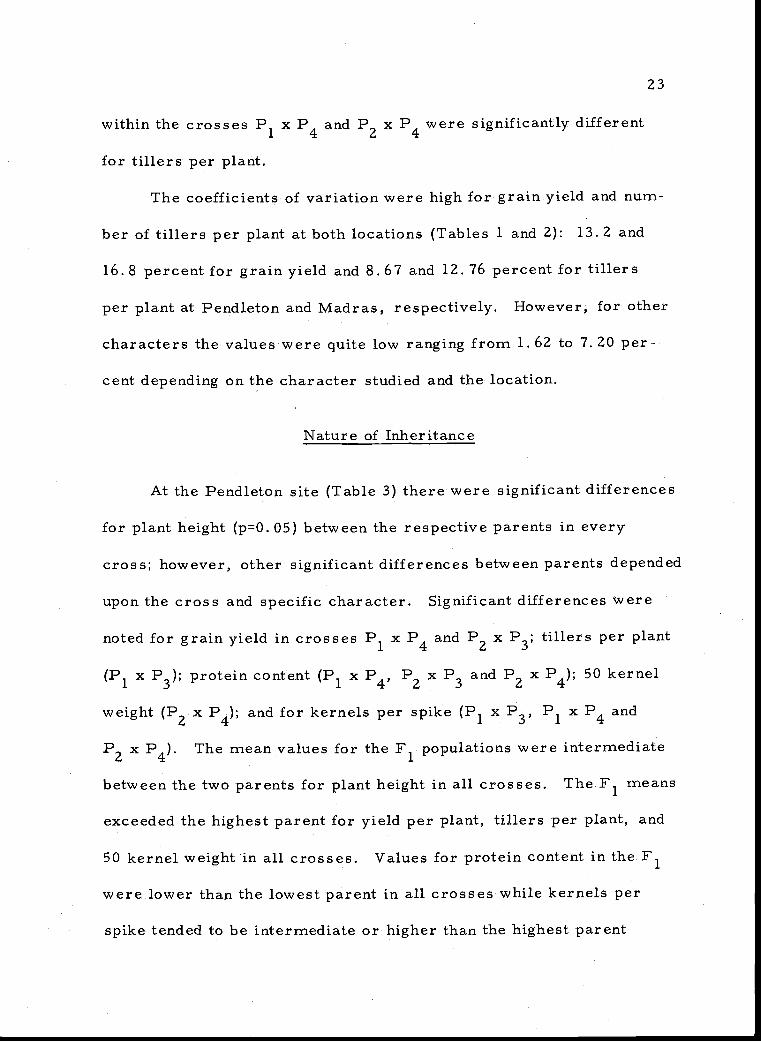
within the crosses P1 x P4 and P2 x P4 were significantly different
for tillers per plant.
The coefficients of variation were high for grain yield and num-
ber of tillers per plant at both locations (Tables 1 and 2): 13.2 and
16.8 percent for grain yield and 8.67 and 12.76 percent for tillers
per plant at Pendleton and Madras, respectively. However, for other
characters the values were quite low ranging from 1.62 to 7.20 per-
cent depending on the character studied and the location.
Nature of Inheritance
At the Pendleton site (Table 3) there were significant differences
for plant height (p=0.05) between the respective parents in every
cross; however, other significant differences between parents depended
upon the cross and specific character. Significant differences were
noted for grain yield in crosses P1 x P4 and P2
x P3; tillers per plant
(P1 x P3); protein content (P1 x P4, P2 x P3 and P2 x P4); 50 kernel
weight (P2 x P4); and for kernels per spike (P1 x P3, P1 x P4 and
P2 P4)x P4). The mean values for the Fl populations were intermediate
between the two parents for plant height in all crosses. The F1
means
exceeded the highest parent for yield per plant, tillers per plant, and
50 kernel weight in all crosses. Values for protein content in the F1
were lower than the lowest parent in all crosses while kernels per
spike tended to be intermediate or higher than the highest parent

24
Table 3. Mean values for protein content, yield per plant, 50 kernel weight, kernels per spike,tillers per plant and plant height obtained at Pendleton, Oregon.
Mean ValuesProteincontentS')
Yield perplant(gm)
50 kernelweight
(gm)
Kernels perspike
Tillers perplant
Plantheight(cm)
Yamhill (P1) 15. 27a* 6. 17b 1. 60bc 40. 47a 4. 71c 103. 1 ld
Atlas 66 (P3) 14. 70a b 5.89b 1.51c 34.41b 5.45b 128.00a
F1
13. 30b 10. 08a 1. 86a 40. 38a 6. 58a 125. 18b
F2 14.02b 6.97b 1.68b 37. 13b 5.48b 120. 85c
Yamhill (Pi) 15.27a 6. 17b 1. 60cd 40.47a 4. 71b 103. 11c
NB 68513 (P4) 12. 34b 4.52c 1.54c 29. 18d 4. 90ab 122. 29a
F1
12.02b 8.39a 2.03a 36.86b 5.53a 121.59a
F2 12.50b 5.45b 1.79b 32.40c 4.62b 116.93b
Hyslop (P2) 15. 70a 4. 85c 1.41c 35.29b 4.91b 93. 33d
Atlas 66 (P3) 14.70b 5.89b 1.51c 34.41b 5.45b 128.00a
F1
12.74c 10.49a 1. 85a 40. 38a 7. 00a 124. 54b
F2 13. 84bc 6.29b 1.70b 33.78b 5.39b 117.06c
Hyslop (P2) 15. 70a 4. 85b 1. 41c 35.29b 4.91a 93. 33c
NB 68513(P4) 12.34b 4.52b 1.54b 29.18c 4.90a 122.29a
F1
11. 00c 7.73a 1.82a 39.08a 5.41a 120.50a
F2 12. 12b 5.47b 1.66b 32.71b 4.90a 115. 45b
* Ranking of the mean values using Duncan Multiple Range Test at the 5% level.

25
depending on the cross. The F2 mean values were generally lower
than the F1
values and intermediate between the two parents. There
were exceptions with protein content where the F2 consistently ex-
ceeded the F1
for all crosses. Also, F2
mean values for 50 kernel
weight exceeded the highest parent in all crosses.
At Madras (Table 4) the parents were significantly different for
most traits involving all four crosses. The only exceptions were
tillers per plant for the crosses P1 x P3 and P2 x P3
and for grain
yield in the cross P2 x P4. The F1
mean values tended to be inter-
mediate between the two parents; however, there were examples where
the F1 exceeded the highest parent (50 kernel weight). This latter
situation was not as prevalent at the Madras site when compared with
the Pendleton location, particularly for grain yield and tillers per
plant. The F2 mean values were observed to be intermediate or near
the top parent and usually less than the Fl mean values. This de-
pended on the cross and the particular character with a number of ex-
ceptions being observed.
To further understand the nature of inheritance and environ-
mental influence on protein in wheat grain, frequency distributions for
the parents are presented for the Pendleton and Madras sites (Figure
1 -A. and B). A large environmental effect Was noted at the Pendleton
site (Figure 1-A). The varieties overlapped one another with the
mean values of Yamhill and Hyslop exceeding those of Atlas 66 and

26
Table 4. Mean values for protein content, yield per plant, 50 kernel weight, kernels per spike,tillers per plant and plant height obtained at Madras, Oregon.
Mean Values
Proteincontent
jya.1
Yield perplant
50 kernelweightvxL(ca)_._Kernels per
spikeTillers per
plantPlantheight
Yamhill (Pi) 11.94c* 5.72a 2.34ab 39.41a 3.06a 77.78b
Atlas 66 (P3) 17.76a 3.58bc 2.05c 27.34c 3.15a 93.50a
F1
15.38b 5.26ab 2.37a 31.81b 3.27a 92.33a
F2 15.28b 4.28b 2.26b 31.31b 3.01a 88.77a
Yamhill (Pi) 11.94c 5.72a 2.34b 39.41a 3.06b 77.78b
NB 68513 (P4) 18.25a 4.28b 1.88c 23.88c 4.77a 88.57a
F1 14.96b 5.56ab 2.46a 31.77b 3.59b 91.41a
F2 14.77b 5.20ab 2.37b 30.39b 3.52b 89.81a
Hyslop (P2) 13.40c 5.56ab 2.26b 36.50a 3.33a 74.07c
Atlas 66 (P3) 17.76a 3.58c 2.05c 27.34c 3. 15a 93.50a
Fl 15.23b 5.97a 2.35a 33.76ab 3.70a 94.86a
F2 15.50b 4.95ab 2.27ab 32. Olb 3.35a 88.72b
Hyslop (P2) 13.40c 5.56a 2.26a b 36.50a 3.30c 74.07b
NB 68513 (P4) 18.25a 4.28a 1. 88c 23. 88c 4. 77a 88. 57a
F1 16.74b 5.29a 2.33a 28.12b 3.98b 87.14a
F2 16.60b 5.59a 2.23b 29.21b 4.28ab 89.17a
* Ranking of the mean values using Duncan Multiple Range Test at the 5% level.

Figure 1. Frequency distribution of four parent populations forprotein content: Yamhill (open circle); Hyslop (opensquare); Atlas 66 (asterix); and NB 68513 (solid circle).A) Pendleton, Oregon, B) Madras, Oregon.

50
401za_J 30
ae
z 20
a_ 10
50
40z-Ja- 30ae
1--z 20w
a 10
27
A
B
10 12 14 16 18PROTEIN CONTENT (%)
20
10 12 14 16 18
P ROTEI N CONTENT (%)

28
NB 68513. This was contrary to previous results where the protein
levels of Yamhill and Hyslop were generally between 9 and 10 percent
protein at this site. With such a high degree of environmental varia-
tion any genetic interpretation would be difficult.
The four parents grown at the Madras site tended to form two
distinct classes (Figure 1-B). NB 68513 and Atlas 66 represent the
higher protein class which ranged on an individual plant basis between
16.08 and 18.25 percent protein. Yamhill and Hyslop protein per-
centages varied from 9.63 to 13.40 percent.
Figures 2-A, B, C, and D represent the parents, F1 and F2
frequency distribution observed at the Pendleton site for protein
content. As noted before, the large environmental effect precludes
an accurate evaluation of the nature of inheritance. This can be noted
for the respective parents and F1
populations in all four crosses. In
all crosses, the mean value of the F1 was lower than the means of the
parents and F2
populations. The F2 generation tended to have greater
variation than either the parents or F1' s; however, in none of the
crosses does the F2 'population exceed the highest percent for the high
parent.
At Madras, the parents were distinctively different in all crosses
with no overlapping between the low and high classes (Figure 1-B).
In all crosses, the F1
frequency distribution tended to span both the
high and low parent distributions but did not exceed the high parent

Figure 2. Frequency distribution of parents, F1 and F2 populationsfor protein content at Pendleton, Oregon: (A) Yamhill xAtlas 66; (B) Yamhill x NB 68513; (C) Hyslop x Atlas 66;(D) Hyslop x NB 68513: Yamhill (open circle); Hyslop(open square); Atlas 66 (asterix); NB 68513 (solid circle);Fi (open star); and F2 (solid star).

50
40z-Ja- 30
z 20
a_ 10
50
1-40z-J
30;e-
20
za_ ICI
A
10 12 14 16 18 20PROTEIN CONTENT (%)
10 12 14 16 18 20PROTEIN CONTENT (%)
50
1_40z
G-30;t-
z-20C.)Cr
a_ 10
8 10 12 14 16 18
PROTEIN CONTENT (%)20
8 10 12 14 16 18PROTEIN CONTENT (%)
20

30
(Figure 3-A, B, C, and D). In the cross Yamhill and NB 68513, the
F2 distribution did exceed the low parent distribution (Figure 3-B).
In the crosses Hyslop x Atlas 66 and Hyslop x NB 68513, the F2 popu-
lation tended to be skewed toward the distribution of the highest parent
(Figure 3-C and D). This is also true for the F1
in the cross between
Hyslop and NB 68513 (Figure 3-C) and to a lesser degree with the
cross between Hyslop and Atlas 66 (Figure 3-D).
Both broad and narrow sense heritability estimates were calcu-
lated to obtain additional information regarding the nature of gene
action controlling the six measured characters. High broad sense
heritability estimates ranging from 63% for tillers per plant to 97%
for plant height were obtained for each character at the. Pendleton site
(Table 5). At Madras, however, the broad sense heritability values
for plant height (89%), protein content (92%), 50 kernel weight (91%)
and kernels per spike (74%) were quite high while yield per plant (37%)
and tillers per plant (47%) were lower (Table 5).
The narrow sense heritability estimates were calculated utilizing
the standard unit method for both F1
on mid-parent and F2 on F1
for
both locations. In general, the narrow sense heritability estimates
of F2 on F1 were larger than those obtained from using the F1
on mid-
parent estimates (Table 5). The narrow sense heritability estimates
were high and consistent for protein content and plant height at both
locations while estimates for the other characters were not as

Figure 3. Frequency distribution of parents, F1 and F2 populationsfor protein content at Madras, Oregon: (A) Yamhill x Atlas66; (B) Yamhill x NB 68513; (C) Hyslop x Atlas 66; (D)Hyslop x NB 68513: Yamhill (open circle); Hyslop (opensquare); Atlas 66 (asterix); NB 68513 (solid circle); F1(open star); and F2 (solid star).

50
1-40z
a30ae
2- 20
a 10
50
1-40z4
a-30ae
z20
a 10
A
8 10 12 14 16 18
PROTEIN CONTENT (%)20
10 12 14 16 18 20PROTEIN CONTENT (%)
50
2- 40
a.
30
z- 20
a_ 10
50
40z
a 30
ae
1 20zw
w 10
10 12 14 16 18PROTEIN CONTENT (%)
20
4/
D
8 10 12 14 16 18PROTEIN CONTENT (%)
20

32
consistent. In some comparisons the narrow sense heritability es-
timates exceeded those determined for the broad sense heritability
values.
Table 5. Broad and narrow sense heritability estimates for protein content, yield per plant, 50 kernelweight, kernels per spike, tillers per plant and plant height obtained at Pendleton andMadras, Oregon.
Broadsense
PendletonF
1on
midparentF2 on Fl Broad
sense
MadrasF
1on
mid agent=02
F2 on F1
Protein content 82 78 95 92 68 95
Yield per plant 79 73 85 37 41 07
50 kernel weight 78 73 89 91 02 93
Kernels per spike 74 32 69 81 43 90
Tillers per plant 63 17 10 47 70 91
Plant height 97 65 80 89 76 40
As sociations
The existence of possible phenotypic relationships between the
six characters studied were examined by determining all possible
correlation coefficients using the mean values for the parents, F1 and
F2 populations. There were significant positive correlations between
yield per plant and tillers per plant, 50 kernel weight and kernels per
spike at the Pendleton location (Table 6). Plant height was found to be
positively associated with tillers per plant and negatively associated
with protein content. Tillers per plant and 50 kernel weight were
positively associated. Of particular interest is the large negative

33
association between protein content and 50 kernel weight. Even though
not significant, a negative association was found between yield per
plant and protein content.
Significant positive associations were observed between plant
height and protein content, yield per plant with 50 kernel weight and
kernels per spike, and between tillers per plant and protein and 50
kernel weight and kernels per spike at the Madras location (Table 7).
There were significant negative correlations between plant height and
kernels per spike, tillers per plant with 50 kernel weight and kernels
per spike and with protein content and 50 kernel weight and kernels
per spike. A large negative correlation was also detected between
protein content and yield per plant.
Direct and indirect effects of the five measured characters on
total grain protein for the 16 entries grown for each location were
determined. At Pendleton (Table 8), a significant negative correlation
between protein content and plant height (r=-0.61) was largely the
result of a negative indirect effect by the way of grain yield (-1.21).
The negative direct and indirect effects were cancelled somewhat by
the positive indirect effect of number of tillers per plant (0.89).
The relationship between yield per plant and protein content
(r=-0.29) was not significant even though a large negative direct effect
(-2.97) was observed. The indirect effect of tillers per plant (1.49)

34
Table 6. Phenotypic correlation coefficients among six characters:protein content, yield per plant, 50 kernel weight, kernelsper spike, tillers per plant and plant height obtained atPendleton, Oregon.
Yieldper plant
50 kernelweight
Kernelsper spike
Tillersper plant
Plantheight
Protein content -0.29 -0.67** 0.23 -0.22 -0. 61 **
Yield per plant 0. 78** 0.72** 0.87** 0.41
50 kernel weight 0.39 0.52* 0.47
Kernels per spike 0.47 0.17
Tillers per plant -0.53*
* Significant at the 5% level.** Significant at the 1% level.
Table 7. Phenotypic correlation coefficients among six characters:protein content, yield per plant, 50 kernel weight, kernelsper spike, tillers per plant and plant height obtained atMadras, Oregon.
Yieldper plant
50 kernelweight
Kernelsper spike
Tillers Plantper plant height
Protein content -0. 73 ** -0. 71 ** -0.97** 0.62** 0. 71 **
Yield per plant 0.75* 0. 71 ** -0.08 -0.45
50 kernel weight 0. 70 ** 0.54* -0.17
Kernels per spike -0.68** -0, 68 **
Tillers per plant -0.25
* Significant at the 5% level.** Significant at the 1% level.

35
Table 8. Direct and indirect interrelationships of grain yield andsome components of yield influencing total protein content atPendleton, Oregon.
Protein (%) and yield per plantDirect effect (P) -2.97600
via plant height -0.07002via tillers per plant 1.49223via 50 kernel weight 0.21917via kernels per spike 1.03703
TOTAL (r) -0.2925
Protein (%) and 50 kernel weightDirect effect (P) 0.28219
via plant height -0.08125via yield per plant -2.31134via tillers per plant 0.88159via kernels per spike 0.56573
TOTAL (r) -0.66503
Protein (%) and kernels per spikeDirect effect (P) 1.44612
via plant height 0.02877via yield per plant -2.13651via tillers per plant 0.78429via 50 kernel weight 0.11002
TOTAL (r) 0.23269
Protein (%) and tillers per plantDirect effect (P) 1.68374
via plant height -0.08125via yield per plant -2.63375via 50 kernel weight 0.14781via kernels per spike 0.67360
TOTAL (r) -0.21902
Protein (%) and plant heightDirect effect (P) -0.17156
via yield per plant -1.21457via tillers per plant 0.88738via 50 kernel weight 0.13364via kernels per spike -0.24252
TOTAL (r) -0.60764
Correlation (r)R2R = 0.98883
Residual = 0.01117

36
and kernels per spike (1.04) were similar in value while the direct
effect of yield per plant on protein content was negative.
The negative correlation between protein content and tillers per
plant (r=-0.22)resulted from a large indirect negative effect of grain
yield (-2.63). The 'positive direct effect of tillers per plant (1.68)
and indirect positive effect of kernels per spike (0.67) tended to can-
cel the large portion of the indirect negative effect of yield on protein.
The significant negative relationship between protein content and
50 kernel weight (r=-0.67) was mainly due to the negative indirecteffect
of grain yield ( -2. 31). Some portion of this negative effect is cancelled
by indirect positive effects of tillers per plant (0.88) and kernels per
spike (0.57).
The positive correlation between protein content and number of
kernels per spike (r=0.23) was attributed to the cancellation of the in-
direct negative effect of grain yield ( -2. 14) by direct positive effect of
tillers per plant (0. 78). The small residual effect indicated that the
five traits studied accounted for 98.8% of the total variation in
protein content in those populations.
At Madras, a significant positive correlation between protein
content and plant height (r =0. 72) was the result of a large positive in-
direct effect via kernels per spike (1.07)(Table 9). This large posi-
tive effect was reduced by negative indirect effects of grain yield per
plant (-0.42) and tillers per plant ( -0. 20). The relationship between

37
Table 9. Direct and indirect interrelationships of grain yield andsome components of yield influencing total protein contentat Madras, Oregon.
Protein (%) and yield per plantDirect effect (P) 0.93210
via plant height -0.06269
via tillers per plant 0.06618via 50 kernel weight -0.54441via kernels per spike -1.12061
TOTAL (r) 0.72943
Protein (%) and 50 kernel weightDirect effect (P) -0.72539
via plant height -0.02173via yield per plant 0.69955via tillers per plant 0.43791via kernels per spike -0.10132
TOTAL (r) -0.71098
Protein (%) and kernels per spikeDirect effect (P) -1.58234
via plant height -0.09414via yield per plant 0.66011via tillers per plant 0.54679via 50 kernel weight -0,50488
TOTAL (r) -0.97446
Protein (%) and tillers per plantDirect effect (P) -0.80747
via plant height 0.03441via yield per plant -0.07640via 50 kernel weight 0.39403via kernels per spike 1.07148
TOTAL (r) 0.61605
Protein (%) and plant heightDirect effect (P) 0.13902
via yield per plant -0.42034via tillers per plant -0.19787via 50 kernel weight 0.12042via kernels per spike 1.07381
TOTAL (r) 0.71504
Correlation (r)R2 = 0.98112
Residual = 0.01888

38
grain yield and protein content (r=-0.23) was significant and negative,
even though the direct effect (0.93) was large and positive. The in-
direct negative effects of 50 kernel weight ( -0. 54) and kernels per
spike (-1.12) cancelled the direct positive effect of grain yield on pro-
tein. The significant positive correlation between protein content and
tillers per plant (0.62) resulted from the negative direct effect of
tillers per plant on protein (-0.81). This, in turn, resulted from a
large positive indirect effect of 50 kernel weight (0.89) and kernels
per spike (1.07) which cancelled the large negative direct effect of
tillers per plant.
The significant negative relationship between protein content and
50 kernel weight (r=-0.71)was attributed to the direct effect of 50 ker-
nel weight on protein ( -0. 73) and the negative indirect effect of kernels
per spike (-1.10). A portion of these negative effects was reduced
by the positive indirect effects of grain yield and tillers per plant.
The highly significant negative correlation between protein content and
kernels per spike (r=-0.97)was due to the direct effect (-1.58) and the
indirect effect of 50 kernel weight (-0.50). These large negative direct
and indirect effects were reduced by the positive indirect effects of
grain yield (0. 66) and tillers per plant ( -0. 50). The small residual
effect indicated that the five characters studied accounted for 98. 1%
of the total variation in protein content.

39
DISCUSSION
The expression of a character in a plant population is influenced
by differences among genotypes, environment and the genotype-environ-
ment interactions. Plant breeders rely upon the genetic variability
for improvements of the plant species through breeding. Such im-
provements can be accomplished more efficiently if the plant breeder
can base his selection on a knowledge of the inheritance, relationship
with the other characters and the influence of environment on the
agronomic and quality characters.
Wheat, being one of the most widely adapted cereal grains, offers
perhaps the greatest potential in many developing countries for pro-
viding an adequate food supply. The two most important characters
which will determine the success of wheat in removing the food deficit
are grain yield and protein content. Much has been written concerning
the "Green Revolutio&' and the major breakthrough in grain yields;
however, the question is now being raised if in addition to being an
energy source, wheat might also become a better source of protein.
Concern has been expressed and supported by some research
data that a negative relationship exists between grain yield and protein
content. If such a relationship does exist then it may be difficult for
the plant breeder to increase both yield and protein content in a single
cultivar. In approaching this problem, the breeder first needs to

40
evaluate how much genetic variability he has present in the population
for grain yield and protein content. Secondly, does indeed a negative
association exist between these two characters and if so what is the
basis of this negative relationship? Also, to what extent does the en-
vironment influence the expression of protein in the wheat kernel?
Broad sense heritability estimates derived from the components
of variance ranged from37% to 97% depending upon the character and
the location. The estimates obtained at Pendleton for grain yield and
protein content were 79% and 82%, respectively. At the Madras site,
estimates were somewhat lower for grain yield (37%) and higher for
protein content (92%). These values suggested that considerable gene-
tic variation existed for both traits within these populations and the
plant breeder should be able to make considerable improvement in
increasing grain yield and protein content. The broad sense herita-
bility estimates obtained in this study for protein content were similar
to those reported by Davis et al. (4), Kaul and Sosulski (20) and Hsu
and Sosulski (13). However, the estimates for grain yield were gen-
erally higher than those reported in the literature, particularly at the
Pendleton site.
The breeder of self-pollinating species such as wheat can only
utilize the additive type of gene action. Therefore, narrow sense
heritability estimates provide more accurate predictions as to how the
total genetic variation can be used in the improvement of a particular

41
trait. With protein content, it would be very desirable if the narrow
sense heritability estimates are high since it is very time consuming
to run chemical analyses on a large number of segregating progeny.
In this study, narrow sense estimates for protein content calculated
by regression of the F1
means on the mid-parents and the F2 means
on the F1 were very high. The estimates for the two generations were
78% and 95% at the Pendleton site and 68% and 95%, respectively, at
Madras. High estimates were also noted at Pendleton for grain yeild
(73% and 85%), but much lower values particularly when F2 means
were regressed on F1 (7.0%) were obtained at Madras.
Both high broad and narrow sense heritability estimates were
noted for those traits other than protein content and grain yield. How-
ever, a number of inconsistent results were noted, particularly the
narrow sense heritability estimates for the two generations involving
grain yield and 50 kernel weights at the Madras site where there were
large differences between the two estimates. Also, several narrow
sense heritability estimates were higher than those obtained for the
broad sense estimates (Table 5).
Several workers have reported that the mean values for protein
content of F1
and F2 populations were similar to the mid parent of
the two parents (3, 13, 20, 35). This situation would suggest that
protein content was controlled largely by additive gene action. The
observations noted in this study from the Madras site would support

42
the conclusion that protein content in wheat is controlled largely by
additive gene action as the mean values for the1
and F2 were sirrii2qr
in magnitude to the mid parents in three crosses. In the cross between
Hyslop and NB 68513, the F1
and F2 mean values were skewed toward
the high protein parent. Also, in this same cross several of the F2
progeny appeared to exceed the highest parent; however, due to the
limits imposed by the protein analysis, values above 20% were ques-
tionable so such data were recorded as being 20%. Progeny in the F2
exceeded the lowest parent in the cross between Yamhill and NB
68513.
Due to the large environmental effect noted at Pendleton, any
attempt to determine the nature of the gene action would be difficult;
however, it was observed that the F1
and F2 means were skewed to-
ward the low protein parents which at this site were Atlas 66 and NB
68513. The fact that Yamhill and Hyslop had the higher protein con-
tent at this site further suggests a strong environmental effect which
makes any genetic interpretations impossible.
When grain yield is considered, the F1
means exceeded the
highest parent in all four crosses at Pendleton suggesting that non-
additive gene action greatly influenced the expression of grain yield.
The F2 means were less than the F1
means indicating that inbreeding
depression was a factor in subsequent generations. Even in the F2' s,
the mean values exceeded the highest parent suggesting that

43
considerable nonadditive gene action existed in this generation. There
may also have been an interaction of the F1 and F2 generations with
the environment which tended to inflate these mean values. This latter
conclusion is based on the nature of gene action observed in the F1
and
F2 populations at Madras. Only in one cross (Hyslop x Atlas 66) did
the F1
exceed the highest parent with the others being very close to
the highest parent. The F2 mean values varied depending on the
cross. In the Hyslop x NB 68513 cross, the F2 mean exceeded the F1
and the highest parent. Yamhill x NB 68513 and Hyslop x Atlas 66
crosses showed the F2 means were close to the highest parent whereas
in the Yamhill x Atlas 66 cross the F2 mean was near the mid-parent
of the two parents. It would appear that there was less nonadditive
gene action at the Madras site; however, the large environmental
effects noted at the Pendleton site may be biasing the gene action es-
timates.
If a negative relationship should exist between protein content and
grain yield in wheat, the degree of selection pressure applied to either
or both of these two characters may have to be compromised. Several
investigators have reported that protein content and grain yield are
independent and that it should be possible to maximize both factors by
selecting simultaneously (6, 10, 16, 17, 26). This finding is not in
agreement with the results of most protein studies in wheat where a
significant negative correlation between these two characters has been
44
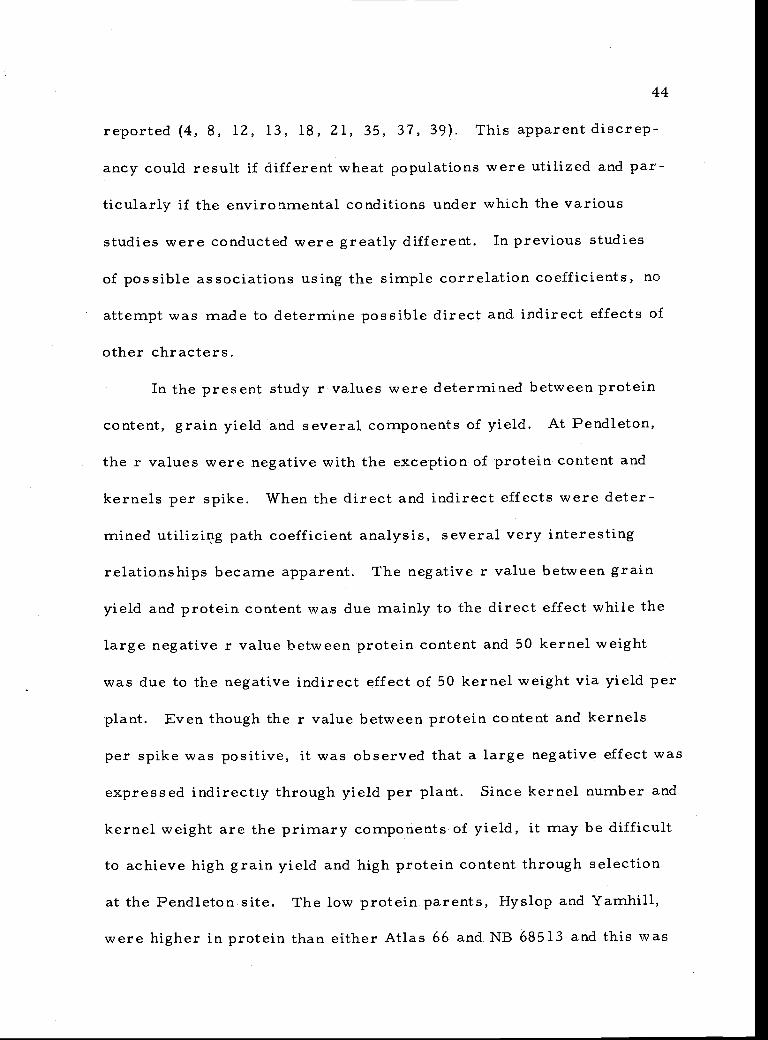
reported (4, 8, 12, 13, 18, 21, 35, 37, 39). This apparent discrep-
ancy could result if different wheat populations were utilized and par-
ticularly if the environmental conditions under which the various
studies were conducted were greatly different. In previous studies
of possible associations using the simple correlation coefficients, no
attempt was made to determine possible direct and indirect effects of
other chracters.
In the present study r values were determined between protein
content, grain yield and several components of yield. At Pendleton,
the r values were negative with the exception of protein content and
kernels per spike. When the direct and indirect effects were deter-
mined utilizing path coefficient analysis, several very interesting
relationships became apparent. The negative r value between grain
yield and protein content was due mainly to the direct effect while the
large negative r value between protein content and 50 kernel weight
was due to the negative indirect effect of 50 kernel weight via yield per
plant. Even though the r value between protein content and kernels
per spike was positive, it was observed that a large negative effect was
expressed indirectly through yield per plant. Since kernel number and
kernel weight are the primary components of yield, it may be difficult
to achieve high grain yield and high protein content through selection
at the Pendleton site. The low protein parents, Hyslop and Yamhill,
were higher in protein than either Atlas 66 and NB 68513 and this was

45
attributed to kernel weight. Hyslop and Yamhill are later maturing
varieties than either Atlas 66 or NB 68513. With the spring applica-
tion of nitrogen, a further delay in maturity resulted coupled with a
loss in moisture which shriveled the kernel of these varieties. This
was reflected in lower 50 kernel weights and hence lower grain yield.
The shriveling caused the starch component of the kernel to be reduced
resulting in a higher percentage of total protein. This large environ-
mental influence did not provide a reliable expression of the charac-
ters studied.
The Madras site was irrigated throughout the growing season
so the moisture stress experienced at Pendleton did not occur. Even
so, a negative correlation was obtained between protein content and
grain yield; however, unlike Pendleton, that significant negative cor-
relation was not due to the direct effect of grain yield, but to the in-
direct negative effects of kernels per spike and 50 kernel weight.
These latter two components also had large direct negative effects on
grain protein. It would appear that even at the Madras site it would
be difficult to select for maximum yield and protein content at the
same time.
From the results obtained for the wheat populations evaluated in
this study, it is apparent that progress can be made to develop wheat
cultivars which combine high yields with acceptable levels of grain
protein.

46
The high heritability estimates indicated that there was a large
amount of genetic variation present in these populations for the six
characters measured. Genetic variation associated with protein con-
tent was largely additive which should enable the plant breeder to
practice efficient selection in the F2 generation. A. similar situation
was true for plant height, 50 kernel weight and kernels per spike.
This was in contrast to grain yield and tillers per plant where much
of the genetic variation in the F1
and F2 was attributed to non additive
gene action. Since this latter form of genetic variation cannot be
utilized in self-pollinated species and frequently masks the additive
effects, selection for these characters should be delayed until the F3
and possibly the F4 generations.
A second factor which will influence the rate of progress in de-
veloping high yielding, high protein lines is the negative association
noted between these characters at both experimental sites. Upon ex-
amining this negative relationship in more detail, this association was
expressed as the result of a large negative direct effect of the yield
components, kernel weight and kernel number on protein content.
Since these were the two primary components of yield, the plant
breeder must compromise and evaluate resulting progeny as to what
levels of yield can be achieved with acceptable protein content. Based
on the performance of the mean values observed in the F2 generation
in this study, it would appear that protein percentages can be raised,

47
through breeding by two or three percent without greatly influencing
grain yield. This increase would greatly assist the protein deficient
areas in the developing countries; however, it must be emphasized that
this increase involves protein quantity and not quality. More detailed
studies involving the nutritional properties of this protein will be re-
quired before its food value can be assessed.
Also, certain cultural practices particularly rate and date of
nitrogen application can greatly influence protein content. In Pendleton,
where a spring application of nitrogen was applied to ensure the ex-
pression of protein the usually low protein lines, Hyslop and Yamhill
responded by exceeding the protein level of Atlas 66 and NB 68513. The
latter two lines did not appear to respond as their protein levels were
actually lower at Pendleton than at the irrigated site at Madras. The
large increase in protein content of Hyslop and Yamhill was due to a
delay in maturity and a loss of moisture which resulted in shriveling
of the grain in both varieties. Atlas 66 and NB 68513, both earlier
maturing lines, were not influenced to the same degree.
Another approach for producing high yielding and high protein
wheat cultivars may be F1
hybrids. At the Madras site yields of F1' s
were close to or exceeded the highest parent while the protein content
of Fi's was near the mid.parent or close to the highest parent, If Fi's
can be economically produced then the wheat breeder can utilize both

48
additive and non additive gene action for increasing protein content
and yield in wheat.
49
SUMMARY
Crosses were made between high protein cultivars (Atlas 66 and
NB 68513) and low protein cultivars (Hyslop and Yamhill) and the per-
formance of these parents as well as the F1
and F2 generations were
studied at two locations in Oregon: Pendleton Experiment Station and
Central Oregon experimental site at Madras. Data were obtained for
protein content, grain yield, 50 kernel weight, kernels per spike,
tillers per plant, along with plant height.
Significant differences were observed among and within crosses
at both the Pendleton and Madras sites for most characters measured.
The F1
and F2 mean values were found to be near the mid-parent of
the two parents in all four crosses for plant height, 50 kernel weight
and kernels per spike. There were several exceptions depending on
the particular cross for tillers per plant and grain yield. Protein
content mean values were also intermediate between the two parents for
the F1
and F2 generations. In crosses involving Hyslop, the mean
values tended to be near the highest parent. Little or no transgressive
segregation was noted in the F2 generation.
Evidence for non additive gene action was noted both for grain
yield and tiller number in the F1
and F2
generations with the mean
values exceeding the highest parent in all crosses for grain yield at
the Pendleton site. Both tillers per plant and grain yield at Pendleton

50
also showed some degree of non additive gene action, but was depen-
dent on the cross,
The high broad and narrow sense heritability estimates obtained
both at Pendleton and Madras for all traits suggested that there is a
large amount of genetic variation present for the characters studied.
The narrow sense estimates further suggest that a high percentage of
the total genetic variation was due to additive gene action.
Significant negative correlations were noted between protein
content and grain yield including some of the components of yield. In
evaluating the direct and indirect effects with path coefficient analysis,
these negative associations were the result of the large negative in-
direct effects of 50 kernel weight and kernels per spike on protein con-
tent via grain yield at the Madras site. At the Pendleton site where
moisture became a limiting factor, the negative association resulted
largely as the indirect effect of 50 kernel weight on protein content
through grain yield.
The large environmental influence on protein content was par-
ticularly striking at the Pendleton site. With the spring application
of nitrogen, a delay in maturity of Hyslop and Yamhill was noted.
With the subsequent loss of moisture, shriveled grain with a higher
protein content resulted and hence a lower grain yield was realized.
Based on the performance of the mean values observed in the F2
generations at the Madras site, yields were close to the highest parent

51
whereas the protein content was near the mid-parent. Even though
there was a negative relationship between protein content and grain
yield at this location, it would appear that protein percentages can be
increased by two to three percent through breeding without greatly
influencing yield.
52
BIBLIOGRAPHY
Austin, A. and V. J. Kumari. 1963. Influence of environment andvariety on the protein content of some improved Indian varieties.Sci. and Cult. 29:31-32.
Bains, K. S., K. S. Gill, and Sehgal. 1972. Combining ability inrelation to relative dominance of eight wheat cultivars for per-centage grain protein and pelshenke value. Z. Pflanzenzuehtq.67:273-278.
Chapman, S. R. and F. H. McNeal. 1970. Gene effects for grainprotein in five spring wheat crosses. Crop Sci. 10:45-46.
CIMMYT. 1969. News Letter 4:Nos. 7-8.
Davis, W. H. , G. K. Middleton, and T. T. Hebert. 1961. Inheri-tance of protein texture and yield in wheat. Crop Sci. 1:235-238.
Dewey, D. R. and K. H. Lu. 1959. A correlation and path coeffi-cient analysis of components of crested wheat grass seedproduction. Agron. J. 9:515-518.
Dokic, A. , J. Dumanovic, and S. Ratcovic. 1969. The effect ofparental pair on the behavior of protein content in wheat hybrids.Savremena Poljoprivreda 17:111-117.
Drozd, D. 1970. Studies on the inheritance of total protein level inwheat grain. Genetics Polonica 11:321 -339.
Duffield, R. D., L. I. Croy, and E. L. Smith. 1972. Inheritanceof nitrate reductase activity, grain protein and straw proteinin a hard red winter wheat cross. Agron. J. 64:249-251.
Finlay, K. W. and K. W. Shepherd, Editors. 1968. Proceedings ofthe third international wheat genetic symposium. p. 457-461.
Haunold, A. 1960. Variability and inheritance of grain protein con-tent in winter wheat. Unpublished Ph. D. thesis, University ofNebraska.
Haunold, A. , V. A. Johnson, and J. W. Schmidt. 1962. Geneticmeasurements of protein in the grain of T. aestivum L. Agron.J. 54:203-206.

53
12. Haunold, A. , V. A. Johnson, and J. W. Schmidt. Variation inprotein content of grain in four varieties of T. aestivum L.Agron. J. 54:121-125. 1962.
13. Hsu, C. S. and F. W. Sesulski. Inheritance of protein contentand sedimentation value in a diallel cross of spring wheat.(T. aestivum), Can. J. Genet. Cytol. 11:967-976. 1969.
14. Johnson, V. A. , P. J. Mattern, and J. W. Schmidt. Proceedingsof the nutrition society. 29:20-31. 1970.
15. Nitrogen relations during spring growth invarieties of T. aestivum L. differing in grain protein content.Crop Sci. 7:664-667. 1967.
16. Johnson, V. A. , P. J. Mattern, D. A. Whited, and J. W. Schmidt.Breeding for protein content and quality in wheat. In: New ap-proaches to breeding for improved plant protein: proceedings ofa panel meeting on new approaches to breeding for plant proteinimprovement, Restanga, Sweden 1968, Vienna, 1969, p. 29-40.(International Atomic Energy Agency, ST1/PUB/212).
17. Johnson, V. A. , J. W. Schmidt, P. J. Mattern, and A. Haunold.Agronomic and quality characteristics of high protein F2--derivedfamilies from a soft red winter--hard red winter wheat cross.Crop Sci. 3:7-10. 1963.
18. Johnson, V. A. , J. W. Schmidt, and P. J. Mattern. Cerealbreeding for better protein impact. Economic Botany 22:16-25.1968.
19. Johnson, V. A. , D. A. Whited, P, J. Mattern, and J. W. Schmidt.Proc. 3rd int. wheat genet. symp. , 1968. p. 457-461.
20. Kaul, A. K. and F. W. Sosulski. Inheritance of four proteincontent in Selkirk x Gabe cross. Can. J. Genet. Cytol. 7:12-17. 1965.
21. Kivi, E. I. Variation of protein content in a breeding materialof spring wheat. Peat Pl. News 2:15-19. 1969.
22. Koehler, F. E. Proceedings 12th annual fertilizer conferenceof Pacific Northwest. 1961.

54
23. Lebsock, K. L. , C. C. Fifield, G. M. Gurney, and W. T.Greenaway. Variation and evaluation of mixing tolerance, pro-tein content and sedimentation value in early generations of springwheat, T. aestivum L.., Crop Sci. 4:171-174.. 1964.
24. Lefgren, J. R. , K. F. Finney, E. G. Heyne, L. C. Bolte, R. C.Hoseney, and M. D. Shogren. Heritability estimates of proteincontent and certain agronomic properties in bread wheats, T.aestivum L.. Crop Sci. 8:563-567. 1968.
25. McNeal, F. , M. A. Berg, C. F. McGuire, V. R. Steward, andD. E. Balridge. Grain and plant nitrogen relationship in eightspring wheat crosses of T. aestivum L. Crop Sci. 12:599-602.1972.
26. Middleton, G. K. , C. E. Bede, and B. B. Bayles. A comparisonof the quantity and quality of protein in certain varieties of softwheat. Agron. J. 46:500-502. 1954.
27. Mosberg, R. Evaluation of protein quality and quantity by dyebinding capacity: a tool in plant breeding. In: New approachesto breeding for improved plant protein: Proceedings of a panelmeeting on new approaches to breeding for plant protein improve-ment. Rostangs, Sweden 1968, Vienna, 1969, p. 151-160.(International Atomic Energy .Agency, ST1/PUB/212).
28. Nelson, C. E. A management experiment with Gaines wheatunder irrigation station circular 435. Wash. Ag. Exp. Sta.Ins. of Agric. Sci. W. S. U. 1964.
29. Russell, J. S. Some observations on the influence of nitrogenfertilizer applied at seeding on the nitrogen content of wheatgrain. Aus. J. Exp. Agric. An. Husb. 4:345-351. 1964.
30. Schlehuber, A. M. , D. C. Abbott, B. R. Jackson, and B. C.Curtis. Correlated inheritance of and quality factors in hard redwinter wheat crosses. Crop Sci. 7:13-16. 1964.
31. Schlehuber, A. M. and B. B. Tucker. Factors affecting theprotein content of wheat. Cereal Science Today 4:240-242. 1959.
32. Seth, J. , T. T. Hebert, and G. K. Middleton. Nitrogen utiliza-tion in high and low protein wheat varieties. Agron. J. 52:207-209. 1960.

55
Strokie, J. E. V. A. Johnson, J. W. Schmidt, and P. J. Mattern.1971. Results of first international winter wheat performancenursery. Research Bulletin, p. 245, University of Nebraska,College of Ag.
. 1971. Results of second international winterwheat performance nursery. Research Bulletin, p. 245, Univer-sity of Nebraska, College of Ag.
Stuber, C. W. , V. A. Johnson, and J. W. Schmidt. 1962. Grainprotein content and its relationship to other plant and seedcharacters in the parents and progeny of a cross of T. aestivumL. Crop Sci. 2:506-508.
. 1962. Infra plant and inter plant variation of grainprotein content in the parents and the F
1of a cross of T.
aestivum L. Crop Sci. 2:286-289.
Sunderman D. W. , M. Wise, and E. M. Sneed. 1969. Interrelation-ships of wheat protein content, four sedimentation value farine-graf, peak time and dough mixing and baking characteristics inF2 and F3 generations of winter wheat, T. aestivum. Crop Sci.5:537-540.
Swaminathan, M. S. A. Austin, A. K. Kaul, and M. S. Naik. 1969.Genetic and agronomic enrichment of the quantity and qualityof proteins in cereals and pulses. In: New approaches tobreeding for improved plant protein: proceedings of a panelmeeting on new approaches to breeding for plant protein improve-ments, Rostanga, Sweden, 1968, Vienna, 1969, p. 71-86.(International Atomic Energy Agency, ST1/PUB/212).
Terman G. L. , R. E. Ramig, A. F. Dreier, and R. A. Olson.1969. Yield protein relationships in wheat grain as effected bynitrogen and water. Agron. J. 61:755-759.
Thomas, H. L. and M. F. Kernkamp. 1954. The use of heritabilityratios and correlation coefficients for measuring combiningability with smooth bromegrass, Bromus inermis Leyss. Agron.J. 46:553-556.
Udy, D. C. 1956. Estimation of protein in wheat flour by ion-binding.Cereal Chem. 33:190-197.

56
42. Performance of barley, oats and wheat varieties testedin Umatilla, Union and Wallowa counties. Circular of Informa-tion 614, Ag. Exp. Stations O. S.U. 1966.
43. CIMMYT News Letter 4:Nos. 7-8. 1969.

APPENDIX

57APPENDIX I
Pedigrees and Descriptions of the Four Parental Lines
1. Yamhill (CI 14563) is a soft white, winter wheat developed
from the cross 'Heines VIII'/Alba' (Redmond) at the Oregon Agricul-
tural Experimental Station. It is mid-tall, stiff straw, high yielding
cultivar with low grain protein content when grown under recommended
cultural practices.
2. Hyslop (CI 14564) is a soft white winter wheat developed at
the Oregon Agricultural Experimental Station from a cross between
'Nord Desprez' and Pullman Selection 101 (CI 13438) with an additional
back cross to Pullman Selection 101. It is a semi-dwarf, stiff straw,
high yielding cultivar with low grain protein content when grown under
recommended cultural practices.
3. Atlas 66 (CI 12561) is an intermediate wheat developed from
the cross Frondoso x (Redhart 3 x Noll 28) at North Carolina Agricul-
tural Experiment Station. It is a tall, intermediate in yield cultivar
with a stable protein content when grown under different environmental
conditions.
4. NB 68513 (CI 10574) is a hard red winter wheat from the
cross Warrior/Atlas 66/3/Comanche/CI 13348. It is a tall, inter-
mediate in yield cultivar with high stable protein content when grown
under different environmental conditions. It was developed at the
Nebraska Agricultural Experiment Station.

58
Appendix Table 1. Some environmental factors associated with the two experimental sites.
location Soil Type Rainfall Nitrogen Application Weed Control
Pendleton Walla Wallasilt loam
Madras Madras loam
474 mm 60( 1)* 25( 3 )*** K,armex .27 kg/ha
irrigated 100(2)** 40(3) 2-4. D 1.1 kg/ha
* Fertilizer applied at planting time** Fertilizer applied during tillering
*** Fertilizer applied at late boot stage
Appendix Table 2. Mean values of all entries at two locations for six characters.
Character
Location
Pendleton Madras
Plant height (cm)
Tillers per plant
Yield per plant (gm)
Protein content (%)
50 kernel weight (gm)
Kernels per plant
116.98
5.40
6.86
13.29
1.70
36.00
88.01
3.59
5.10
15.48
2.26
31.29