Comparative analysis of QTLs affecting plant height and flowering among closely-related diploid and...
10
Comparative analysis of QTLs affecting plant height and flowering among closely-related diploid and polyploid genomes Ray Ming, Terrye A. Del Monte, Eduardo Hernandez, Paul H. Moore, James E. Irvine, and Andrew H. Paterson Abstract: Quantitative trait loci (QTLs) affecting plant height and flowering were studied in the two Saccharum spe- cies from which modern sugarcane cultivars are derived. Two segregating populations derived from interspecific crosses between Saccharum officinarum and Saccharum spontaneum were genotyped with 735 DNA markers. Among the 65 significant associations found between these two traits and DNA markers, 35 of the loci were linked to sugarcane ge- netic maps and 30 were unlinked DNA markers. Twenty-one of the 35 mapped QTLs were clustered in eight genomic regions of six sugarcane homologous groups. Some of these could be divergent alleles at homologous loci, making the actual number of genes implicated in these traits much less than 35. Four QTL clusters controlling plant height in sug- arcane corresponded closely to four of the six plant-height QTLs previously mapped in sorghum. One QTL controlling flowering in sugarcane corresponded to one of three flowering QTLs mapped in sorghum. The correspondence in loca- tions of QTLs affecting plant height and flowering in sugarcane and sorghum reinforce the notion that the simple sor- ghum genome is a valuable “template” for molecular dissection of the much more complex sugarcane genome. Key words: DNA markers, genetic map, quantitative trait loci, Saccharum. Résumé : Des locus quantitatifs (QTL) déterminant la hauteur et la floraison ont été examinés chez les deux espèces du genre Saccharum dont sont dérivés les cultivars modernes de la canne à sucre. Deux populations en ségrégation, dé- rivées de croisements interspécifiques entre le S. officinarum et le S. spontaneum, ont été génotypés à l’aide de 735 marqueurs moléculaires. Des 65 associations significatives trouvées entre ces deux caractères et les marqueurs, 35 des locus marqueurs ont été placés sur des cartes génétiques de la canne à sucre tandis que 30 marqueurs ne montraient aucune liaison. Vingt et un des 35 QTL positionnés sur les cartes étaient groupés au sein de huit régions génomiques chez six groupes de chromosomes homologues. Certains de ces locus pourraient être des allèles divergents pour des lo- cus homologues, réduisant ainsi le nombre de gènes contrôlant ces caractères à bien moins que 35. Quatre régions re- groupant des QTL influençant la hauteur chez la canne à sucre étaient très proches de quatre des six QTL qui contrôlent la hauteur chez le sorgho. Un QTL contrôlant la floraison chez la canne à sucre correspondait à l’un des trois QTL déterminant la floraison chez le sorgho. La grande similitude quant à la localisation des QTL affectant la hauteur et la floraison chez la canne à sucre et le sorgho vient renforcer le point de vue selon lequel le génome simple du sorgho constitue un génome modèle utile pour la dissection moléculaire du génome beaucoup plus complexe de la canne à sucre. Mots clés : marqueurs moléculaires, carte génétique, locus quantitatifs, Saccharum. [Traduit par la Rédaction] 803 Ming et al. Introduction Plant height and flowering are particularly important traits for biomass crops like sugarcane (Saccharum spp.). In con- trast to increasing yield by reducing height in cereal crops, increased plant height enhances sugar yield in sugarcane. The record plant height (length) for 24-month-old sugarcane was 30 feet in Hawaii (K.K. Wu, personal communication). Flowering in sugarcane terminates vegetative growth and significantly reduces sucrose yield (Coleman 1968; Long Genome 45: 794–803 (2002) DOI: 10.1139/G02-042 © 2002 NRC Canada 794 Received 28 January 2002. Accepted 4 June 2002. Published on the NRC Research Press Web site at http://genome.nrc.ca on 18 July 2002. Corresponding Editor: F. Belzile. R. Ming, 1 T.A. Del Monte, and A.H. Paterson. 2,3 Plant Genome Mapping Laboratory, Department of Soil and Crop Sciences, Texas A&M University, College Station, TX 77843, U.S.A. E. Hernandez and J.E. Irvine. Texas A&M Agricultural Research and Extension Center, Weslaco, TX 78596, U.S.A. P.H. Moore. USDA–ARS, Pacific Basin Agriculture Research Center, Aiea, HI 96701, U.S.A. 1 Present address: Hawaii Agriculture Research Center, 99-193 Aiea Heights Drive, Aiea, HI 96701, U.S.A. 2 Present address: Center for Applied Genetic Technologies, University of Georgia, Athens, GA 30602, U.S.A. 3 Corresponding author (e-mail: [email protected]).
-
Upload
independent -
Category
Documents
-
view
0 -
download
0
Transcript of Comparative analysis of QTLs affecting plant height and flowering among closely-related diploid and...

Comparative analysis of QTLs affecting plantheight and flowering among closely-related diploidand polyploid genomes
Ray Ming, Terrye A. Del Monte, Eduardo Hernandez, Paul H. Moore,James E. Irvine, and Andrew H. Paterson
Abstract: Quantitative trait loci (QTLs) affecting plant height and flowering were studied in the two Saccharum spe-cies from which modern sugarcane cultivars are derived. Two segregating populations derived from interspecific crossesbetween Saccharum officinarum and Saccharum spontaneum were genotyped with 735 DNA markers. Among the 65significant associations found between these two traits and DNA markers, 35 of the loci were linked to sugarcane ge-netic maps and 30 were unlinked DNA markers. Twenty-one of the 35 mapped QTLs were clustered in eight genomicregions of six sugarcane homologous groups. Some of these could be divergent alleles at homologous loci, making theactual number of genes implicated in these traits much less than 35. Four QTL clusters controlling plant height in sug-arcane corresponded closely to four of the six plant-height QTLs previously mapped in sorghum. One QTL controllingflowering in sugarcane corresponded to one of three flowering QTLs mapped in sorghum. The correspondence in loca-tions of QTLs affecting plant height and flowering in sugarcane and sorghum reinforce the notion that the simple sor-ghum genome is a valuable “template” for molecular dissection of the much more complex sugarcane genome.
Key words: DNA markers, genetic map, quantitative trait loci, Saccharum.
Résumé : Des locus quantitatifs (QTL) déterminant la hauteur et la floraison ont été examinés chez les deux espècesdu genre Saccharum dont sont dérivés les cultivars modernes de la canne à sucre. Deux populations en ségrégation, dé-rivées de croisements interspécifiques entre le S. officinarum et le S. spontaneum, ont été génotypés à l’aide de 735marqueurs moléculaires. Des 65 associations significatives trouvées entre ces deux caractères et les marqueurs, 35 deslocus marqueurs ont été placés sur des cartes génétiques de la canne à sucre tandis que 30 marqueurs ne montraientaucune liaison. Vingt et un des 35 QTL positionnés sur les cartes étaient groupés au sein de huit régions génomiqueschez six groupes de chromosomes homologues. Certains de ces locus pourraient être des allèles divergents pour des lo-cus homologues, réduisant ainsi le nombre de gènes contrôlant ces caractères à bien moins que 35. Quatre régions re-groupant des QTL influençant la hauteur chez la canne à sucre étaient très proches de quatre des six QTL quicontrôlent la hauteur chez le sorgho. Un QTL contrôlant la floraison chez la canne à sucre correspondait à l’un destrois QTL déterminant la floraison chez le sorgho. La grande similitude quant à la localisation des QTL affectant lahauteur et la floraison chez la canne à sucre et le sorgho vient renforcer le point de vue selon lequel le génome simpledu sorgho constitue un génome modèle utile pour la dissection moléculaire du génome beaucoup plus complexe de lacanne à sucre.
Mots clés : marqueurs moléculaires, carte génétique, locus quantitatifs, Saccharum.
[Traduit par la Rédaction] 803
Ming et al.Introduction
Plant height and flowering are particularly important traitsfor biomass crops like sugarcane (Saccharum spp.). In con-trast to increasing yield by reducing height in cereal crops,
increased plant height enhances sugar yield in sugarcane.The record plant height (length) for 24-month-old sugarcanewas 30 feet in Hawaii (K.K. Wu, personal communication).Flowering in sugarcane terminates vegetative growth andsignificantly reduces sucrose yield (Coleman 1968; Long
Genome 45: 794–803 (2002) DOI: 10.1139/G02-042 © 2002 NRC Canada
794
Received 28 January 2002. Accepted 4 June 2002. Published on the NRC Research Press Web site at http://genome.nrc.ca on18 July 2002.
Corresponding Editor: F. Belzile.
R. Ming,1 T.A. Del Monte, and A.H. Paterson.2,3 Plant Genome Mapping Laboratory, Department of Soil and Crop Sciences,Texas A&M University, College Station, TX 77843, U.S.A.E. Hernandez and J.E. Irvine. Texas A&M Agricultural Research and Extension Center, Weslaco, TX 78596, U.S.A.P.H. Moore. USDA–ARS, Pacific Basin Agriculture Research Center, Aiea, HI 96701, U.S.A.
1Present address: Hawaii Agriculture Research Center, 99-193 Aiea Heights Drive, Aiea, HI 96701, U.S.A.2Present address: Center for Applied Genetic Technologies, University of Georgia, Athens, GA 30602, U.S.A.3Corresponding author (e-mail: [email protected]).
I:\gen\gen4505\G02-042.vpTuesday, July 16, 2002 8:16:21 AM
Color profile: Generic CMYK printer profileComposite Default screen
1976; Singh and Reddy 1976; Rao 1977). However, floweringis required to recombine alleles and create variation neededto develop new varieties by traditional breeding (James 1980;Stevenson 1965). In addition to a large genetic component,the physiological and environmental factors that affect theflowering of sugarcane include daylength, night tempera-ture, physiological age, soil moisture, and nutritional status(Clements and Awanda 1965; Coleman 1959; James andMiller 1972; Major 1980; and Yeu 1980).
The study of quantitative trait loci (QTLs) affecting plantheight and flowering contributes to our understanding offundamental principles of plant development, and has practi-cal applications in crop improvement. QTLs for plant heightand flowering have been identified in many crops and modelplants, including sugarcane’s close relatives sorghum (Sor-ghum bicolor) and maize (Zea mays) (Austin and Lee 1996;Beavis et al. 1991; Bohuon et al. 1998; Lin et al. 1995;Osborn et al. 1997). In sorghum and milo, classical geneticstudies suggested that height and flowering are each con-trolled by four loci (Dw1–4 and Ma1–4, respectively), withresidual variation in each trait suggesting the possibility ofadditional genes of smaller effect (Quinby and Karper 1945,1954). Six QTLs affecting plant height and three QTLs af-fecting flowering have been mapped in a Sorghuminterspecific F2 population (Lin et al. 1995), and four QTLsaffecting plant height have been mapped in a differentsorghum intraspecific F2 population (Pereira et al. 1994). Inmaize, a total of 29 mutants were identified that influencedplant height (Sheridan 1988) and 105 QTLs were mapped in22 different populations, whereas a total of 64 QTLs or mu-tations were reported to affect flowering across 16 maizepopulations (Lin et al. 1995; Ribaut et al. 1996). Despite thenominally large number of QTLs mapped in maize, 51% ofthe QTLs controlling plant height were clustered in sevenchromosomal regions, and 47% of the QTLs controllingflowering were in five regions (Lin et al. 1995), suggestingthat these QTLs may represent variation in a smaller numberof genes.
In this study, QTLs affecting plant height and floweringwere mapped in two interspecific sugarcane populations. Foursugarcane genetic maps were aligned with the sorghum linkagemap (Ming et al. 1998, 2002a), which facilitated the QTLanalysis for agronomically important traits in sugarcane.
Materials and methods
Plant materialsTwo interspecific segregating populations, each created by
P. Tai (USDA–ARS, Canal Pt., Fla.) were evaluated for fieldperformance and analyzed with DNA markers. (i) Two hun-dred sixty-four plants from Saccharum officinarum ‘GreenGerman’ (GG, 2n = 97 – 117) × Saccharum spontaneum ‘IND81-146’ (IND, 2n = 52–56) were designated the GI popula-tion. (ii) Two hundred thirty-nine plants from S. spontaneum‘PIN 84-1’ (PIN, 2n = 96) × S. officinarum ‘Muntok Java’(MJ, 2n = 140) were designated the PM population. The tax-onomic classification of these parental varieties has beendiscussed previously (Ming et al. 2001, 2002a). In sugar-cane, 2n + n transmission predominates in S. officinarum(2n = 80) × S. spontaneum F1 and BC1 crosses, a phenomenonknown as “female restitution”, (Bremer 1923; Price 1957).
However, the chromosome numbers of a sampling of theprogenies from these two crosses were 2n = 73–85 for GIand 2n = 99–121 for PM, indicating n + n transmission(Burner 1997). Both populations were grown from Novem-ber 1994 to February 1996 at the Texas A & M AgriculturalResearch and Extension Center, Weslaco, Tex., in three rep-lications as randomized complete block designs with rows1.5 m apart and plants 0.6 m apart in the row. Replicationscomprised vegetatively propagated clones.
Phenotypic data collectionPlant height data were taken on individual plants to the
top visible dewlap for both populations in fall 1995. The av-erage value of the three replications of each plant was usedfor analysis.
Flowering data were collected on 2 February 1996 using abinary scale as follows: 0, no flower; 1, any stage after flow-ering had been initiated.
RFLP analysisDNA extractions were as previously described (Chittenden
et al. 1994). DNA probes used for QTL mapping were se-lected based on preliminary analysis of 1255 single-doseRFLP markers on 85 plants. Probes for mapping the fullpopulations were picked at 20 cM or smaller intervals for amore comprehensive search of the genome. A total of 186probes generating 243, 232, 122, and 138 single dose mark-ers for GG, IND, MJ, and PIN, respectively, were mapped inboth populations. Linkage map construction was done aspreviously described (Ming et al. 1998).
Genomic and cDNA probes derived from several specieswithin the grass family were used in sorghum and sugarcanegenome mapping. The first two to four letters of the probename were designed to distinguish the sources (which spe-cies) and types (genomic or cDNA) of the probes as follows:sugarcane genomic clones (SG); sugarcane cDNA clonesderived from (i) cell suspension culture (CDSC), (ii) germi-nating lateral buds (CDSB), and (iii) germinating sett roots(CDSR); sorghum genomic clones (pSB and SHO); maizegenomic clones (BNL and UMC); maize cDNA clones (CSU);rice genomic clones (RG); rice cDNA clones (RZ); barleycDNA clones (BCD); and oat cDNA clones (CDO). After anumber that was assigned to the probe by the original lab, alower-case letter represented a particular locus detected bythe probe, because multiple loci were usually detected byany given probes in sugarcane. The last capital letter of theDNA marker name represents the parental cultivar from whichthis polymorphic marker was derived.
Data analysesSAS programs (SAS Institute Inc. 1989) were used to calcu-
late correlations among traits (CORR) and perform analysesof variance (GLM). When flanking markers were available,MAPMAKER/QTL version 1.1 was used to calculate LODscores by interval mapping. Significance thresholds of LOD >2.5 (interval mapping) or P < 0.003 (analysis of variance)were used to declare QTLs. Because flowering data werescored as 0 and 1, χ2 tests were performed to identify marker–trait association at the significance level of P < 0.003 (Gomezand Gomez 1984). The allele effect of each single-dose QTLwas the average difference in phenotype of individuals dif-
© 2002 NRC Canada
Ming et al. 795
I:\gen\gen4505\G02-042.vpTuesday, July 16, 2002 8:16:22 AM
Color profile: Generic CMYK printer profileComposite Default screen
fering by one copy of the indicated allele (one dose vs. zerodoses). When two or more loci detected by the same probewere each associated with a trait at P < 0.01 by single factorANOVA, these loci were combined to form double- (0–2 cop-ies), triple- (0–3), or quadruple-dose (0–4) genotypes. Theallele effect of each single-dose QTL was the average differ-ence in phenotype of individuals differing by one copy ofthe indicated allele (single vs. zero doses, or double vs. sin-gle dose). Linear, quadratic, cubic, and quartic trends formarker dosage were tested using the CONTRAST statementof the SAS GLM procedure. The total phenotypic varianceexplained was obtained from SAS GLM by including all sig-nificant single- and multiple-dose QTLs in a full model.
Results
Trait correlation and distributionPlant height and flowering were significantly correlated in
GI (r = 0.56, P < 0.001), but not in PM (r = –0.15, P = 0.05).Their inter-relationship in GI suggests that some genomicregions influence both traits.
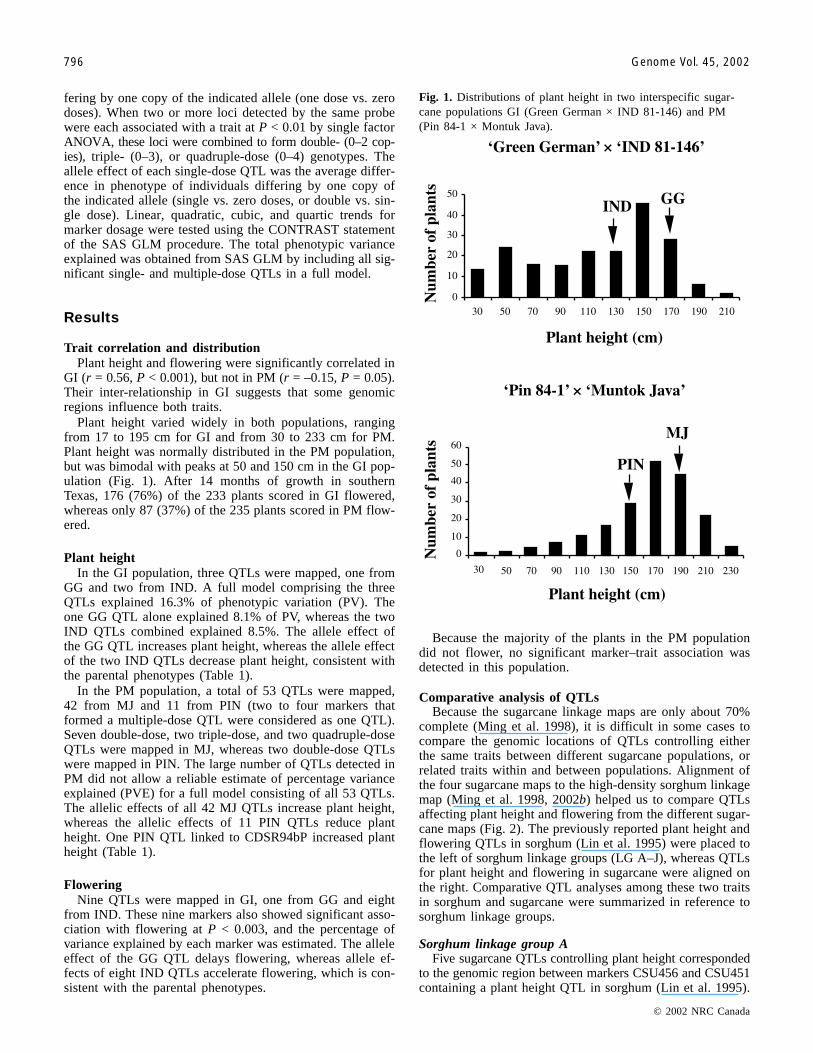
Plant height varied widely in both populations, rangingfrom 17 to 195 cm for GI and from 30 to 233 cm for PM.Plant height was normally distributed in the PM population,but was bimodal with peaks at 50 and 150 cm in the GI pop-ulation (Fig. 1). After 14 months of growth in southernTexas, 176 (76%) of the 233 plants scored in GI flowered,whereas only 87 (37%) of the 235 plants scored in PM flow-ered.
Plant heightIn the GI population, three QTLs were mapped, one from
GG and two from IND. A full model comprising the threeQTLs explained 16.3% of phenotypic variation (PV). Theone GG QTL alone explained 8.1% of PV, whereas the twoIND QTLs combined explained 8.5%. The allele effect ofthe GG QTL increases plant height, whereas the allele effectof the two IND QTLs decrease plant height, consistent withthe parental phenotypes (Table 1).
In the PM population, a total of 53 QTLs were mapped,42 from MJ and 11 from PIN (two to four markers thatformed a multiple-dose QTL were considered as one QTL).Seven double-dose, two triple-dose, and two quadruple-doseQTLs were mapped in MJ, whereas two double-dose QTLswere mapped in PIN. The large number of QTLs detected inPM did not allow a reliable estimate of percentage varianceexplained (PVE) for a full model consisting of all 53 QTLs.The allelic effects of all 42 MJ QTLs increase plant height,whereas the allelic effects of 11 PIN QTLs reduce plantheight. One PIN QTL linked to CDSR94bP increased plantheight (Table 1).
FloweringNine QTLs were mapped in GI, one from GG and eight
from IND. These nine markers also showed significant asso-ciation with flowering at P < 0.003, and the percentage ofvariance explained by each marker was estimated. The alleleeffect of the GG QTL delays flowering, whereas allele ef-fects of eight IND QTLs accelerate flowering, which is con-sistent with the parental phenotypes.
Because the majority of the plants in the PM populationdid not flower, no significant marker–trait association wasdetected in this population.
Comparative analysis of QTLsBecause the sugarcane linkage maps are only about 70%
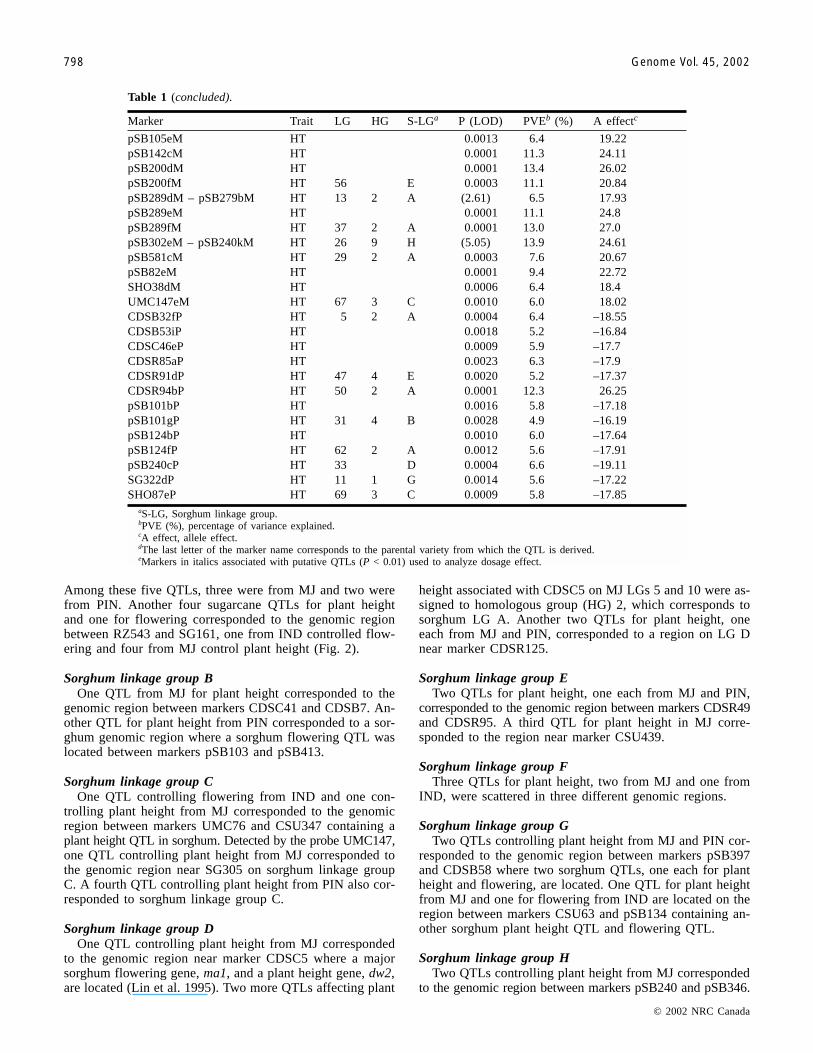
complete (Ming et al. 1998), it is difficult in some cases tocompare the genomic locations of QTLs controlling eitherthe same traits between different sugarcane populations, orrelated traits within and between populations. Alignment ofthe four sugarcane maps to the high-density sorghum linkagemap (Ming et al. 1998, 2002b) helped us to compare QTLsaffecting plant height and flowering from the different sugar-cane maps (Fig. 2). The previously reported plant height andflowering QTLs in sorghum (Lin et al. 1995) were placed tothe left of sorghum linkage groups (LG A–J), whereas QTLsfor plant height and flowering in sugarcane were aligned onthe right. Comparative QTL analyses among these two traitsin sorghum and sugarcane were summarized in reference tosorghum linkage groups.
Sorghum linkage group AFive sugarcane QTLs controlling plant height corresponded
to the genomic region between markers CSU456 and CSU451containing a plant height QTL in sorghum (Lin et al. 1995).
© 2002 NRC Canada
796 Genome Vol. 45, 2002
Fig. 1. Distributions of plant height in two interspecific sugar-cane populations GI (Green German × IND 81-146) and PM(Pin 84-1 × Montuk Java).
I:\gen\gen4505\G02-042.vpTuesday, July 16, 2002 8:16:22 AM
Color profile: Generic CMYK printer profileComposite Default screen

© 2002 NRC Canada
Ming et al. 797
Marker Trait LG HG S-LGa P (LOD) PVEb (%) A effectc
CSU415iGd FL 0.0002 8.1 –0.31RZ543dG HT 0.0005 8.1 29.38BCD1107aI FL 1 3 C 0.0015 11.9 0.31CDSB31eI FL 14 15 G 0.0021 5 0.21CDSC46bI FL 0.0001 8.4 0.28CDSR125aI FL 4 2 A 0.0004 6.2 0.24CSU415gI FL 0.0004 6.8 0.26CSU81cI FL 0.0026 5.8 0.26pSB101dI FL 0.0006 6.3 0.24pSB188aI FL 0.0010 6.4 0.25CDS24aI HT 23 9 H 0.0017 7.3 –24.42pSB341cI HT 10 6 F 0.0025 5.0 –20.67CDSB2bM HT 0.0001 9.7 22.28CDSB31kM HT 15 15 G 0.0001 7.9 21.33CDSB32nM HT 18 1 G 0.0001 19.6 34.55CDSB35eM HT 0.0001 13.6 27.69CDSB44eM HT 11 3 C 0.0010 6.2 19.23CDSB44fM HT 0.0001 9.7 23.05CDSB53fM - CSU440bM HT 17 F (2.81) 7.2 18.45CDSB53jM HT 0.0001 7.7 20.57CDSB57jM HT 0.0001 9.4 22.85CDSB67cM HT 0.0013 6.3 17.68CDSC24cM HT 0.0005 7.2 20.22CDSC42cM HT 0.0002 7.6 20.29CDSC42gM HT 8 F 0.0001 12.9 27.02CDSC42kM HT 0.0007 6.4 18.83CDSC42lM HT 0.0028 5.0 16.39CDSC45fM HT 0.0001 8.6 21.85CDSC46fM HT 0.0001 10.1 23.39CDSC49bM HT 31 4 B 0.0009 6.3 18.6CDSC52cM - CDSR128bM HT 32 2 A (4.44) 13.3 23.4CDSC5aM HT 5 2 A 0.0017 6.0 18.7CDSC5bM HT 10 2 A 0.0004 7.1 19.28CDSC5kM HT 0.0001 13.0 26.48CDSC5eMe HT 34 5 D 0.0049 4.6 15.91CDSR125bM HT 34 5 D 0.0001 10.7 25.23CDSR125gM HT 0.0001 17.0 30.95CDSR128cM - pSB289fM HT 37 2 A (7.11) 18.8 30.15CDSR133fM HT 39 J 0.0001 10.1 23.52CDSR146eM - CDSR146bM HT 40 H (3.17) 9.2 20.43CDSR157eM HT 0.0001 16.9 37.79CDSR15fM HT 42 2 A 0.0001 8.2 21.54CDSR25eM HT 0.0004 9.3 21.32CDSR35hM - CDSR96fM HT (8.57) 22.6 37.75CDSR46kM HT 0.0023 8.9 20.12CDSR70gM HT 27 9 H 0.0001 8.6 21.42CDSR91cM HT 41 4 E 0.0011 6.3 18.57CSU28dM HT 0.0021 5.1 16.28CSU39cM HT 0.0014 8.2 20.02CSU419fM HT 0.0006 6.7 18.88CSU428bM HT 0.0001 11.8 25.16CSU428dM HT 0.0003 6.8 19.14CSU440aM HT 0.0001 12.9 25.84CSU440bM HT 17 F 0.0009 6.1 18.35CSU440fM HT 21 F 0.0087 3.8 15.13CSU453cM HT 0.0001 8.1 21.45pSB101cM HT 0.0001 8.5 21.6
Table 1. Biometric parameters of QTLs associated with flowering time and plant height.
I:\gen\gen4505\G02-042.vpTuesday, July 16, 2002 8:16:23 AM
Color profile: Generic CMYK printer profileComposite Default screen
© 2002 NRC Canada
798 Genome Vol. 45, 2002
Among these five QTLs, three were from MJ and two werefrom PIN. Another four sugarcane QTLs for plant heightand one for flowering corresponded to the genomic regionbetween RZ543 and SG161, one from IND controlled flow-ering and four from MJ control plant height (Fig. 2).
Sorghum linkage group BOne QTL from MJ for plant height corresponded to the
genomic region between markers CDSC41 and CDSB7. An-other QTL for plant height from PIN corresponded to a sor-ghum genomic region where a sorghum flowering QTL waslocated between markers pSB103 and pSB413.
Sorghum linkage group COne QTL controlling flowering from IND and one con-
trolling plant height from MJ corresponded to the genomicregion between markers UMC76 and CSU347 containing aplant height QTL in sorghum. Detected by the probe UMC147,one QTL controlling plant height from MJ corresponded tothe genomic region near SG305 on sorghum linkage groupC. A fourth QTL controlling plant height from PIN also cor-responded to sorghum linkage group C.
Sorghum linkage group DOne QTL controlling plant height from MJ corresponded
to the genomic region near marker CDSC5 where a majorsorghum flowering gene, ma1, and a plant height gene, dw2,are located (Lin et al. 1995). Two more QTLs affecting plant
height associated with CDSC5 on MJ LGs 5 and 10 were as-signed to homologous group (HG) 2, which corresponds tosorghum LG A. Another two QTLs for plant height, oneeach from MJ and PIN, corresponded to a region on LG Dnear marker CDSR125.
Sorghum linkage group ETwo QTLs for plant height, one each from MJ and PIN,
corresponded to the genomic region between markers CDSR49and CDSR95. A third QTL for plant height in MJ corre-sponded to the region near marker CSU439.
Sorghum linkage group FThree QTLs for plant height, two from MJ and one from
IND, were scattered in three different genomic regions.
Sorghum linkage group GTwo QTLs controlling plant height from MJ and PIN cor-
responded to the genomic region between markers pSB397and CDSB58 where two sorghum QTLs, one each for plantheight and flowering, are located. One QTL for plant heightfrom MJ and one for flowering from IND are located on theregion between markers CSU63 and pSB134 containing an-other sorghum plant height QTL and flowering QTL.
Sorghum linkage group HTwo QTLs controlling plant height from MJ corresponded
to the genomic region between markers pSB240 and pSB346.
Marker Trait LG HG S-LGa P (LOD) PVEb (%) A effectc
pSB105eM HT 0.0013 6.4 19.22pSB142cM HT 0.0001 11.3 24.11pSB200dM HT 0.0001 13.4 26.02pSB200fM HT 56 E 0.0003 11.1 20.84pSB289dM – pSB279bM HT 13 2 A (2.61) 6.5 17.93pSB289eM HT 0.0001 11.1 24.8pSB289fM HT 37 2 A 0.0001 13.0 27.0pSB302eM – pSB240kM HT 26 9 H (5.05) 13.9 24.61pSB581cM HT 29 2 A 0.0003 7.6 20.67pSB82eM HT 0.0001 9.4 22.72SHO38dM HT 0.0006 6.4 18.4UMC147eM HT 67 3 C 0.0010 6.0 18.02CDSB32fP HT 5 2 A 0.0004 6.4 –18.55CDSB53iP HT 0.0018 5.2 –16.84CDSC46eP HT 0.0009 5.9 –17.7CDSR85aP HT 0.0023 6.3 –17.9CDSR91dP HT 47 4 E 0.0020 5.2 –17.37CDSR94bP HT 50 2 A 0.0001 12.3 26.25pSB101bP HT 0.0016 5.8 –17.18pSB101gP HT 31 4 B 0.0028 4.9 –16.19pSB124bP HT 0.0010 6.0 –17.64pSB124fP HT 62 2 A 0.0012 5.6 –17.91pSB240cP HT 33 D 0.0004 6.6 –19.11SG322dP HT 11 1 G 0.0014 5.6 –17.22SHO87eP HT 69 3 C 0.0009 5.8 –17.85
aS-LG, Sorghum linkage group.bPVE (%), percentage of variance explained.cA effect, allele effect.dThe last letter of the marker name corresponds to the parental variety from which the QTL is derived.eMarkers in italics associated with putative QTLs (P < 0.01) used to analyze dosage effect.
Table 1 (concluded).
I:\gen\gen4505\G02-042.vpTuesday, July 16, 2002 8:16:23 AM
Color profile: Generic CMYK printer profileComposite Default screen

© 2002 NRC Canada
Ming et al. 799
Fig. 2. Comparative mapping of plant height and flowering QTLs in sorghum and sugarcane. Bars and whiskers indicate 1- and 2-LODlikelihood intervals. Plant height QTLs were marked as HT and flowering as FL. QTLs mapped in sugarcane were shown to the rightside of the sorghum linkage group and QTLs in sorghum shown to the left. Solid lines connect homologous loci on different sugarcaneand sorghum linkage groups. Individual sorghum linkage groups are represented by LGs A–J. Sugarcane linkage groups (Lgs, to bedistinguished from sorghum LGs) from four parental varieties are indicated by the last letter of the marker name: G, Green German;M, Muntok Java; I, IND 81-146; P, PIN 84-1. Approximate map positions of double-dose (*) markers are inferred by the methodof Da Silva et al. (1995). Only regions that either contain or are homologous to QTLs are shown.
I:\gen\gen4505\G02-042.vpTuesday, July 16, 2002 8:16:23 AM
Color profile: Generic CMYK printer profileComposite Default screen

Another two QTLs controlling plant height, one each fromMJ and IND, were scattered on other genomic regions.
Sorghum linkage group JTwo QTLs for plant height, one from MJ and one from
PIN, corresponded to the region between markers CDSR133and pSB124 adjacent, but not corresponding, to a plant heightQTL in sorghum.
Among the total of 35 QTLs placed on the map affectingplant height and flowering, 21 of them clustered in 8 genomicregions, corresponding to other QTLs within and betweenmapping populations, and between sugarcane and sorghum.
These 21 QTLs can be categorized into three groups. Group1 consists of those QTLs mapped in the same populationthat corresponded across the two sugarcane species. Two tofive QTLs controlling plant height in MJ and PIN corre-sponded to sorghum genomic regions between markers CSU456 and CSU 451 on LG A, between markers CDSC49 andCDSR95 on LG E, and between markers CDSC19 and SG322on LG G. Group 2 consists of those QTLs controlling flow-ering and plant height corresponding to each other acrosssugarcane species and mapping populations. Five QTLs inIND and MJ corresponded to a region between markers BNL9.11 and SG161 on LG A. Two QTLs in IND and MJ corre-
© 2002 NRC Canada
800 Genome Vol. 45, 2002
Fig 2 (continued).
I:\gen\gen4505\G02-042.vpTuesday, July 16, 2002 8:16:24 AM
Color profile: Generic CMYK printer profileComposite Default screen

sponded to a region between markers UMC76 and CSU347on LG C. Finally, group 3 consists of corresponding QTLscontrolling plant height and flowering in both sorghum andsugarcane. Five QTLs controlling plant height in MJ andPIN corresponded to a sorghum QTL mapped between markersCSU456 and CSU51 on LG A. A plant height QTL in PINcorresponded to a sorghum QTL on LG B. One QTL con-trolling plant height in MJ corresponded to a major flower-ing gene, ma1, and a plant height QTL (dw2) in sorghum onLG D. Three QTLs controlling plant height and one control-ling flowering in MJ corresponded to two plant height andone flowering sorghum QTLs on LG G.
Dosage effects of individual QTLsIn 11 cases, multiple homologous genomic regions con-
tained QTLs associated with the same trait. Although werecognize that the specific genes influencing phenotype inhomologous regions may or may not be the same, analysisof the dosage effect of such regions is important in planningstrategies for marker-assisted improvement of sugarcane.Multiple-dose QTL genotypes (see Materials and methods)were subjected to trend analysis (Gomez and Gomez 1984).Strictly additive dosage effects would result in a significant(non-zero) linear trend. Non-additive QTL dosage effectswould show as significant higher-order trends. Seven putativedouble-dose QTLs for plant height were identified, five fromMJ and two from PIN (Fig. 3). All except one (pSB101b,gP)showed significant (P < 0.05) quadratic relationships. Twotriple-dose and two quadruple-dose QTLs affecting plant heightwere reported previously (Ming et al. 2001).
Discussion
Sugarcane flowering is a complex process involving atleast five different developmental stages distinguished byhaving different photoperiod requirements (Clements andAwanda 1965; Coleman 1959; Moore 1971; Moore and Nuss1987). The total of nine QTLs mapped in the GI population
may reflect the large number of genes involved in sugarcaneflowering. Only one QTL was identified in ‘Green German’,explaining 8.1% of phenotypic variation. This suggests thatadditional undetected QTLs, as well as environmental fac-tors, contributed to flowering in sugarcane.
Identification of QTLs controlling flowering in breedingpopulations could potentially assist breeders in selecting andmaintaining low-flowering elite lines. Flowering in commer-cial sugarcane varieties can significantly reduce sugar yield,particularly in regions like Hawaii where sugarcane is grownfor longer than 12 months/cycle. Early flowering plants termi-nate vegetative growth early, reducing sugar yield, whereaslate or sparsely flowering plants extend the plant growth pe-riod. More synchronous flowering could improve sugar yieldand reduce the need for application of costly growth regulatorsto prevent flowering (K. K. Wu, personal communication).
The number of loci controlling plant height varies amongdifferent species or germplasm. Among the close relatives ofsugarcane, the known genes and QTLs affecting plant heightrange from six in sorghum to 105 in maize; however, 51% ofthe maize QTLs were clustered in seven genomic regions(Lin et al. 1995; Pereira and Lee 1995; Ribaut et al. 1996;Sheridan 1988). Other factors being equivalent, the numberof QTLs detected in a mapping population should be posi-tively correlated with the size of the population (Lander andBotstein 1989). Although the GI population size was fairlylarge (264 individuals), only 3 QTLs were mapped for plantheight, which explains only 16.3% of the PV, versus 53 QTLsin the PM population of 239 individuals. The large portionof the PV unaccounted for in GI suggests that most QTLscontrolling plant height were not detected. The discrepancyof the PVE for plant height QTLs in GI might be due to bothhigher-dosage QTLs that were not detectable with a manageablepopulation size in an autopolyploid and environmental effects.
Seventeen of the 32 (53.1%) plant height QTLs on themap formed 6 clusters. Some of these could be divergent al-leles at homologous loci (Fig. 2). If this proves to be thecase, the actual number of plant height QTLs detected in the
© 2002 NRC Canada
Ming et al. 801
Fig 2 (concluded).
I:\gen\gen4505\G02-042.vpTuesday, July 16, 2002 8:16:24 AM
Color profile: Generic CMYK printer profileComposite Default screen

PM population would be much less than the 53 QTLs listedin Table 1. Adding further support to this notion were the 11multiple-dose QTLs detected by single probes in PM.
Plant height was significantly correlated with sugar yieldin GI (r = 0.49, P < 0.001) and PM (r = 0.34, P < 0.0001).Four genomic regions containing plant height QTLs also af-fected sugar yield in GI and PM near marker CDSR15 onsorghum LG A, near marker UMC147 and between markersUMC76 and pSB600 on LG C, and near marker CDSR91 onLG E (Ming et al. 2002b). The inter-relationship of plantheight and sugar yield was bridged through a component ofsugar yield – stalk length. The correlation coefficients be-tween plant height and stalk length were 0.64 (P < 0.0001)in GI and 0.56 (P < 0.0001) in PM.
Non-additive gene effects were prevalent in multiple doseQTLs controlling plant height. Of the 11 multiple-dose QTLs,all but one showed significant non-additive (non-linear) dos-age effect. By contrast, double-dose QTLs controlling sugarcontent were mostly additive (Ming et al. 2001). The triple-and quadruple-dose QTLs showed diminishing returns as thedosage increased (Fig. 3).
Some possible pleiotropic QTLs influenced both plant heightand flowering of sugarcane, consistent with previous obser-
vations in sorghum (Lin et al. 1995; see Fig. 2), maize(Austin and Lee 1996; Koester et al. 1993), and rice (Li etal. 1995). In these two sugarcane populations, threegenomic regions contained both plant height and floweringQTLs (Fig. 2). Only in two genomic regions, correspondingto sorghum LGs D and H, were multiple QTLs mapped spe-cifically for plant height.
Some QTLs affecting plant height and flowering in sugar-cane corresponded to those found in sorghum. Sugarcaneplant height QTLs corresponded to four of the six QTLsmapped in sorghum, whereas flowering QTLs correspondedto one of the three QTLs mapped in sorghum. Chromosomalrearrangement in sugarcane or sorghum after their divergencecomplicates the comparative analysis of QTLs. A plant heightQTL was mapped between markers CDSC5 and CSU34 onLG D in sorghum, and two plant height QTLs were associ-ated with CDSC5, but mapped on different linkage groups insugarcane. These corresponding plant height QTLs might bederived from the same ancestral genes. However, two of thethree sugarcane QTLs were mapped on LGs 5 and 10 corre-sponding to LG A, whereas the other QTL was not mappedto any linkage group, suggesting that inter-chromosomal re-arrangement involving this locus might have occurred afterthe divergence of the two genera. Nevertheless, overwhelmingevidence pointed to the colinear relationship between sugar-cane and sorghum genomes (Dufour et al. 1997; Guimarãeset al. 1997; Ming et al. 1998), and QTLs controlling heightand flowering were conserved among sorghum, maize, andrice (Lin et al. 1995; Paterson et al. 1995). Results of QTLmapping for plant height and flowering in these two sugar-cane interspecific populations add further support to the con-servation of gene synteny across the grass family (Devos andGale 1997). It should be noted that our results are based onthe phenotypic data of one year at one location, and someQTLs for plant height and flowering we reported here couldwell be unique to these two particular populations and (or)this particular environment.
Acknowledgements
We thank K.K. Wu and Jody Moore for helpful commentson the manuscript, Teresa De La Garza for technical assistance,and the following organizations for funding: the AmericanSugar Cane League, Australian Sugar Research and Devel-opment Corp., Cenicana, Centro de Tecnologia Copersucar,Florida Sugar Cane League, Hawaiian Sugar Planters’ Associa-tion, Mauritius Sugar Industry Research Institute, NationalScience Foundation Plant Genome Research Program,USDA Plant Genome Program, Texas Higher Education Co-ordinating Board, and Texas and Georgia Agricultural Ex-periment Stations.
References
Austin, D.F., and Lee, M. 1996. Genetic resolution and verificationof quantitative trait loci for flowering and plant height with re-combinant inbred lines of maize. Genome, 39: 957–968.
Beavis, W.D., Grant, D., Albertsen, M., and Fincher, R. 1991.Quantitative trait loci for plant height in four maize populationsand their associations with qualitative genetic loci. Theor. Appl.Genet. 83: 141–145.
© 2002 NRC Canada
802 Genome Vol. 45, 2002
Fig. 3. Dosage effects of QTLs for plant height (cm). Lowercaseletters after the probe name represent the loci detected by thisprobe; the capital letter M or P represents parental variety MJ orPIN. Phenotypic effects of allele substitution at each locus areshown in Table 1. Pl and Pq are the probabilities that linear andquadratic components, respectively, of the dosage curve are equalto zero. The triple- and quadruple-dose QTLs published previ-ously were not shown (Ming et al. 2001).
I:\gen\gen4505\G02-042.vpTuesday, July 16, 2002 8:16:25 AM
Color profile: Generic CMYK printer profileComposite Default screen

© 2002 NRC Canada
Ming et al. 803
Bohuon, E.J.R., Ramsay, L.D., Craft, J.A., Arthur, A.E., Marshall,D.F., Lydiate, D.J., and Kearsey, M.J. 1998. The association offlowering time quantitative trait loci with duplicated regions andcandidate loci in Brassica oleracea. Genetics, 150: 393–401.
Bremer, G. 1923. A cytological investigation of some species andspecies-hybrids of the genus Saccharum. Genetica, 5: 273–326.
Burner, D.M. 1997. Chromosome transmission and meiotic behaviorin various sugarcane crosses. J. Am. Soc. Sugar Cane Technol.17: 38–50.
Chittenden, L.M., Schertz, K.F., Lin, Y.R., Wing, R.A., and Pater-son, A.H. 1994. A detailed RFLP map of Sorghum bicolor ×S. propinquum, suitable for high-density mapping, suggests an-cestral duplication of Sorghum chromosomes or chromosomalsegments. Theor. Appl. Genet. 87: 925–933.
Clements, H.F., and Awanda, M. 1965. Experiments on the artifi-cial induction of flowering in sugarcane. Proc. Int. Soc. SugarCane Technol. 12: 795–812.
Coleman, R.E. 1959. Factors involved in the flowering of sugar-cane. Proc. Int. Soc. Sugar Cane Technol. 10: 805–813.
Coleman, R.E. 1968. Physiology of flowering in sugarcane. Proc.Int. Soc. Sugar Cane Technol. 13: 992–1000.
Da Silva, J., Honeycutt, R.J., Burnquist, W., Al-Janabi, S.M.,Sorrells, M.E., Tanksley, S.D., and Sobral, B.W.S. 1995. Saccharumspontaneum L. ‘SES 208’ genetic linkage map combining RFLP-and PCR-based markers. Mol. Breed. 1: 165–179.
Devos, K.M., and Gale, M.D. 1997. Comparative genetics in thegrasses. Plant Mol. Biol. 35: 3–15.
Dufour, P., Deu, M., Grivet, L., D’Hont, A., Paulet, F., Bouet, A.,Lanaud, C., Glaszmann, J.C., and Hamon, P. 1997. Construction of acomposite sorghum genome map and comparison with sugarcane, arelated complex polyploid. Theor. Appl. Genet. 94: 409–418.
Gomez, K.A., and Gomez, A.A. 1984. In Statistical procedures foragricultural research. Edited by K.A. Gomez and A.A. Gomez.John Wiley & Sons, New York, N.Y. pp. 225–233.
Guimarães, C.T., Sills, G.R., and Sobral, B.W.S. 1997. Compara-tive mapping of Andropogoneae: Saccharum L. (sugarcane) andits relation to sorghum and maize. Proc. Natl. Acad. Sci. U.S.A.94: 14 261 – 14 266.
James, N.I. 1980. Sugarcane. In Hybridization of crop plant. Editedby W.R. Fehr and H.H. Hodley. American Society of Agronomyand Crop Science Society of America, Madison, Wis. pp. 617–629.
James, N.I., and Miller, J.D. 1972. Photoperiod control in the USDAsugarcane crossing program. Proc. Int. Soc. Sugar Cane Technol.14: 334–340.
Koester, R.P., Sisco, P.H., and Stuber, C.W. 1993. Identification ofquantitative trait loci controlling days to flowering and plantheight in two near isogenic lines of maize. Crop Sci. 33: 1209–1216.
Lander, E.S., and Botstein, D. 1989. Mapping Mendelian factorsunderlying quantitative traits using RFLP linkage maps. Genet-ics, 121: 185–199.
Li, Z.-K., Pinson, S.R.M., Stansel, J.W., and Park, W.D. 1995.Identification of quantitative trait loci (QTLs) for heading dateand plant height in cultivated rice (Oryza sativa L.) Theor. Appl.Genet. 91: 374–381.
Lin, Y.-R., Schertz, K.F., and Paterson, A.H. 1995. Comparativeanalysis of QTLs affecting plant height and maturity across thePoaceae, in reference to an interspecific sorghum population.Genetics, 141: 391–411.
Long, A.C. 1976. A large varietal difference in cane deteriorationdue to flowering. Proc. S. Afr. Sugar Technol. Assoc. 50: 78–81.
Major, D.J. 1980. Photoperiod response characteristic controllingflowering in nine plant species. Can. J. Plant Sci. 60: 777–784.
Ming, R., Liu, S.-C., Lin, Y.-R., Da Silva, J., Wilson, W., Braga,D., van Deynze, A., Wenslaff, T.F., Wu, K.K., Moore, P.H.,Burnquist, W., Sorrells, M.E., Irvine, J.E., and Paterson, A.H.1998. Detailed alignment of Saccharum and Sorghum chromo-somes: comparative organization of closely-related diploid andpolyploid genomes. Genetics, 150: 1663–1682.
Ming, R., Liu, S.-C., Moore, P.H., Irvine, J.E., and Paterson, A.H.2001. Comparative QTL analysis in a complex autopolyploid:Genetic control of sugar content in sugarcane. Genome Res. 11:2075–2084.
Ming, R., Liu, S.-C., Bowers, J.E., Moore, P.H., Irvine, J.E., and Pat-erson, A.H. 2002a. Construction of a Saccharum consensus geneticmap from two interspecific crosses. Crop Sci. 42: 270–283.
Ming, R., Wang, Y.-W., Draye, X., Moore, P.H., Irvine, J.E., andPaterson, A.H. 2002b. Molecular dissection of complex traits inautopolyploids: mapping QTLs affecting sugar yield and relatedtraits in sugarcane. Theor. Appl. Genet. In press.
Moore, P.H. 1971. Investigation of the flowering of Saccharum. I.Ontogeny of the inflorescence. Can. J. Bot. 49: 677–682.
Moore, P.H., and Nuss, K.J. 1987. Flowering and flower synchroniza-tion. In Sugarcane improvement through breeding. Edited by D.J.Heinz. Elsevier Press, Amsterdam, The Netherlands. pp. 273–310.
Osborn, T.C., Kole, C., Parkin, I.A.P., Sharpe, A.G., Kuiper, M.,Lydiate, D.J., and Trick, M. 1997. Comparison of floweringtime genes in Brassica rapa, B. napus and Arabidopsis thaliana.Genetics, 146: 1123–1129.
Paterson, A.H., Lin, Y.-R., Li, Z.-K., Schertz, K.F., Doebley, J.,Pinson, S.R.M., Liu, S.-C., Stansel, J.W., and Irvine, J.E. 1995.Convergent domestication of cereal crops by independent muta-tions at corresponding genetic loci. Science (Washington, D.C.),269: 1714–1718.
Pereira, M.G., and Lee, M. 1995. Identification of genomic regionsaffecting plant height in sorghum and maize. Theor. Appl. Genet.90: 380–388.
Pereira, M.G., Lee, M., Bramel-Cox, P., Woodman, W., Doebley, J.,and Whitkus, R. 1994. Construction of an RFLP map in sorghumand comparative mapping in maize. Genome, 37: 236–243.
Price, S. 1957. Cytological studies in Saccharum and allied genera II.Chromosome numbers in interspecific hybrids. Bot. Gaz. 118:146–159.
Quinby, J.R., and Karper, R.E. 1945. The inheritance of three genesthat influence time of floral initiation and maturity date in milo.J. Am. Soc. Agron. 37: 916–936.
Quinby, J.R., and Karper, R.E. 1954. Inheritance of height in sor-ghum. Agron. J. 46: 211–216.
Rao, P.S. 1977. Effects of flowering in yield and quality of sugar-cane. Exp. Agric. 13: 381–387.
Ribaut, J., Hoisington, D., Deutsch, J.A., Jiang, C., and Gonzalez deLeon, D. 1996. Identification of quantitative trait loci underdrought conditions in tropical maize. 2. Flowering parameters andthe anthesis-silking interval. Theor. Appl. Genet. 92: 905–914.
SAS Institute Inc. 1989. SAS/STAT user’s guide version 6. 4th edi-tion. SAS Institute Inc., Gary, N.C.
Sheridan, W.F. 1988. Maize developmental genetics: genes ofmorphogenesis. Annu. Rev. Genet. 22: 353–285.
Singh, S., and Reddy, M.S. 1976. Effect of inhibition of floweringon improvement of cane yield and juice quality under Coimbatoreconditions. J. Agric. Sci. Camb. 87: 375–380.
Stevenson, G.C. 1965. Genetics and breeding of sugarcane. Longmans,London, U.K. pp. 39–71.
Yeu, W.K. 1980. Studies of flowering of sugarcane in south Hainan,China. Proc. Int. Soc. Sugar Cane Technol. 17: 1301–1306.
I:\gen\gen4505\G02-042.vpTuesday, July 16, 2002 8:16:25 AM
Color profile: Generic CMYK printer profileComposite Default screen