A global analysis of QTLs for expression variations in rice shoots at the early seedling stage
43
This is an Accepted Article that has been peer-reviewed and approved for publication in the The Plant Journal, but has yet to undergo copy-editing and proof correction. Please cite this article as an “Accepted Article”; doi: 10.1111/j.1365-313X.2010.04303.x Received Date : 13-Feb-2010 Revised Date : 25-Jun-2010 Accepted Date : 08-Jul-2010 Article type : Full Paper A global analysis of QTLs for expression variations in rice shoot at early seedling stage Jia Wang † , Huihui Yu † , Weibo Xie, Yongzhong Xing, Sibin Yu, Caiguo Xu, Xianghua Li, Jinghua Xiao & Qifa Zhang * National Key Laboratory of Crop Genetic Improvement, National Center of Plant Gene Research , Huazhong Agricultural University, Wuhan 430070, China † These authors contributed equally to this work. * For correspondence (Fax: 86-27-87287092; Phone: 86-27-87282429; e-mail: [email protected]) Running head: eQTL analysis in rice shoot Keywords: rice, SFP, eQTL, eQTL hotspots, TFs, seedling-vigor
-
Upload
independent -
Category
Documents
-
view
0 -
download
0
Transcript of A global analysis of QTLs for expression variations in rice shoots at the early seedling stage

This is an Accepted Article that has been peer-reviewed and approved for publication in the The Plant Journal, but has yet to undergo copy-editing and proof correction. Please cite this article as an “Accepted Article”; doi: 10.1111/j.1365-313X.2010.04303.x
Received Date : 13-Feb-2010
Revised Date : 25-Jun-2010
Accepted Date : 08-Jul-2010
Article type : Full Paper
A global analysis of QTLs for expression variations in rice shoot at
early seedling stage
Jia Wang†, Huihui Yu†, Weibo Xie, Yongzhong Xing, Sibin Yu, Caiguo Xu,
Xianghua Li, Jinghua Xiao & Qifa Zhang*
National Key Laboratory of Crop Genetic Improvement, National Center of Plant
Gene Research , Huazhong Agricultural University, Wuhan 430070, China
†These authors contributed equally to this work.
*For correspondence (Fax: 86-27-87287092; Phone: 86-27-87282429; e-mail:
Running head: eQTL analysis in rice shoot
Keywords: rice, SFP, eQTL, eQTL hotspots, TFs, seedling-vigor

Summary
Analyses of QTLs for expression levels (eQTLs) of the genes reveal genetic
relationship between expression variation and the regulator, thus unlocking the
information for identifying the regulatory network. Oligo-nucleotide expression
microarrays hybridized with RNA can simultaneously provide data for molecular
markers and transcript abundance. In this study, we used Affymetrix GeneChip Rice
Genome Array to analyze eQTLs in rice shoots at 72 h after germination from 110
recombinant inbred lines (RILs) derived from a cross between Zhenshan 97 and
Minghui 63. Totally 1,632 single feature polymorphisms (SFPs) plus 23 PCR markers
were identified and placed into 601 recombinant bins, spanning 1,459 cM in length,
which were used as markers to genotype the RILs. We obtained 16,372 expression
traits (e-traits) each with at least one eQTL, resulting in 26,051 eQTLs in total,
including both cis- and trans-eQTLs. We also identified 171 eQTL hotspots among
rice genome, each of which controls transcript variations of many e-traits. Gene
Ontology analysis revealed enrichment of certain functional categories of genes in
some of the eQTL hotspots. In particular, eQTLs for e-traits involving DNA
metabolic process was significantly enriched in several eQTL hotspots on
chromosomes 3, 5 and 10. Several e-traits colocalizing with cis-eQTLs showed
significant correlations with hundreds of e-traits, indicating possible co-regulation.
We also detected correlations between the QTLs for shoot dry weight and eQTLs,
revealing possible candidate genes for the trait. These results provided clues for
identification and characterization of regulatory network in the whole genome at the
transcriptional level.
Introduction
Understanding of the functional genome involves multiple layers. Availability of the
genome sequences, which are accumulating rapidly in recent years, is the prerequisite
that provides the structural information of the genes and genome. There have also
been large efforts in recent years in various organisms collectively termed functional
genomics with the long term goal to characterize the function of the complete set of
annotated genes. Large mutant libraries have been generated in several plant species
toward saturating the genomes with T-DNA insertions to achieve the goal of obtaining
at least one insertion for every annotated gene (Jeon et al., 2000; Alonso et al., 2003;
Wu et al., 2003; Krishnan et al., 2009). Tremendous efforts have also been invested in
the last two decades to identify genes and QTLs using high density molecular marker
linkage maps, resulting in hundreds of mapped genes and QTLs in a large number of
organisms including many plant species. Map-based cloning has been practiced to
isolate mapped genes. In plants, many genes controlling important processes of
growth and development as well as agriculturally important traits have been isolated
(Xing and Zhang, 2010). These genes have provided windows for viewing how genes
and the genome function, and for understanding the causal relationships between
genes and phenotypes (or traits).
Wright (1968) proposed a net-like structure for the relationship between genome
and characters, such that each character is controlled by a large number of genes and
substitution of a single gene would in turn affect an array of characters. Progress in
functional analyses of genes supports such a net-like view. Thus, understanding the
relation between a gene and a character requires characterization of the regulatory
network, which is much more complex than a simple gene to character relationship.
There has been rapid progress in the technologies for investigating pathways of

gene regulation, and data generated have started to shed light on the understanding of
regulatory network. One of the techniques is the genetic analysis of expression levels
measured by transcript abundance of individual genes using high density molecular
marker linkage maps. Such analyses determine map positions of the loci regulating
the transcript abundance of the genes, which are referred to as eQTLs (Hansen et al.,
2008; Kliebenstein, 2009). eQTLs so identified would provide information on the
number, relative effects and genomic locations of the loci regulating the expression of
the genes. At the whole genome level, this information would collectively provide
starting points for characterizing the regulatory network of the gene expression.
Microarray-based genome-wide expression profiling can be used as a platform for
eQTL analysis. Hybridization of microarrays with RNA samples from individuals in a
segregating population provides data for the expression level of individual genes, and
the expression polymorphisms in the mapping population can also provide
high-throughout markers for map construction that can be used for mapping eQTLs
(West et al., 2007; Potokina et al., 2008). eQTL mapping has been well underway in
many sequenced model organisms, including yeast (Brem et al., 2002; Brem and
Kruglyak, 2005), mouse (Schadt et al., 2003; Ghazalpour et al., 2006; Ghazalpour et
al., 2008), human beings (Cheung et al., 2003; Monks et al., 2004; Goring et al.,
2007) and Arabidopsis (DeCook et al., 2006; Kliebenstein et al., 2006; Keurentjes et
al., 2007; West et al., 2007), as well as unsequenced plant species, including wheat
(Jordan et al., 2007) and barley (Potokina et al., 2008). Surprisingly, however, there
has been no similar study reported in rice.
Rice, a major staple food crop, has been adopted as a model of monocot species in
plant science research. In this study, we employed 110 RILs from a cross between two
indica (Oryza sativa L. ssp. indica) varieties Zhenshan 97 and Minghui 63, the

parents of Shanyou 63, the most widely cultivated rice hybrid in China. Genetic
populations derived from this cross have been intensively studied for genetic and
molecular bases of grain yield, heterosis, quality, plant height, heading date, disease
resistances, seedling vigor and response to low-N stress (Yu et al., 1997, 2002; Tan et
al., 1999, 2000, 2001; Chen et al., 2002, 2003; Cui et al., 2002, 2003; Hua et al.,
2002, 2003; Xing et al., 2002; Xu et al., 2004; Lian et al., 2005). Hundreds of QTLs
for these traits have been mapped, and genes controlling resistance to bacterial blight
and grain yield were cloned using genetic materials derived from this cross (Sun et al.,
2004; Xue et al., 2008). In our study, Affymetrix GeneChip Rice Genome Array was
hybridized with RNA samples from shoots of the RILs at 72 h after germination, and
eQTLs were identified using the high-density genetic map based on single feature
polymorphisms (SFPs). The eQTLs detected were associated with the QTLs for
phenotypic traits (pQTLs) of seedling vigor obtained previously by aligning eQTL
hotspots with pQTLs. These data provided opportunities for resolving the
transcriptional regulatory network at the whole genome level, and for identifying and
cloning genes controlling variations of quantitative traits.
Results
SFP detection and genetic map construction
Shoots from germinating seeds of 110 RILs derived from a cross between Zhenshan
97 and Minghui 63 at 72 h after germination were collected for RNA isolation, which
was hybridized with Affymetrix arrays. A total of the 226 Affymetrix arrays were
generated by hybridizing with RNA samples from 110 RILs each with two biological
replicates, and the two parents each with three biological replicates. Analysis of the
dataset from perfect match (PM) probes using the SFP detection program SFPdet

based on a median polish method (Tukey, 1977) (Figure S1) identified 3,504 raw
SFPs. After filtering and processing, 2,421 SFPs distributed in 1,731 probesets were
obtained. Only one SFP per probeset with the least missing data was selected and
used in subsequent analyses.
The 1,731 SFP markers were ordered by their physical locations in the rice genome,
based on TIGR Rice Genome Pseudomolecules Release 5.0 (TIGR5.0) (Ouyang et al.,
2007). There were three big gaps in previous RFLP (restriction fragment length
polymorphism) and SSR (simple sequence repeat) genetic map, located on
chromosomes 2, 4 and 9, resulting in 15 linkage groups (Xing et al., 2002). Similar
big gaps also existed in the distribution of the SFP markers. We thus resorted to PCR
markers to reduce the gaps by developing CAPS (cleaved amplified polymorphic
sequence) markers based on SNPs (single nucleotide polymorphisms) that were
identified by comparing PCR fragments from the two parents. This effort obtained 23
markers in the gap regions (Table S1). These PCR-based markers and SFPs were
treated equally in map construction and eQTL mapping.
We removed from the analysis 99 SFP markers that produced recombination rates
≥0.3 with flanking markers, to avoid ones that could not be incorporated into the
genetic map. Examination of the data showed that expression values for 61 of the 99
probesets were detected “Present” only in less than one third of the 110 RILs, thus
were error-prone in SFP identification. The remaining 38 SFP markers could not be
incorporated likely for two reasons. First, both Zhenshan 97 and Minghui 63 are
indica whose genomic sequence is remarkably different from the reference japonica
genome of Nipponbare, including inversions or transpositions, in addition to Indels
(insertions/deletions) or SNPs (Han and Xue, 2003). Second, non-specific probes
resulting from genome duplications may produce false or incorrectly located SFPs as
demonstrated by Luo et al. (2007). Markers producing double recombinants between
adjacent markers were set to missing in the corresponding RILs, except the three
markers in the very big gaps, Os.8125.1.S1_x_at8, S0224 and S0226 (Table S2, S4).
Consequently genotype data produced by 1,655 markers in the 110 RILs were
accepted (Table S2). Assuming that two RILs with identical recombinant genotype in
adjacent makers each had a unique recombination point, the assay of the 110 RILs
with the 1,655 markers produced a total of 2,742 recombination breakpoints, about
2.0 breakpoints per chromosome per line. We compared the SFP genotypes of the 110
RILs with those assayed by RFLPs/SSRs (Table S3), and they were highly consistent
(Figure S2).
These SFP/PCR markers were grouped into 601 marker recombination bins
(Table S4), each referring to a set of markers by which a RIL has a unique genotype
except the missing data, with an average of 2.75 markers per bin. In case two or more
markers were identified in a bin, we selected the marker with least missing data to
represent that bin. As a result, the total missing marker data in all 601 bins for all 110
RILs were 1.66%. The genetic linkage map based on the bins was constructed using
the R/qtl package function est.map with Haldane map function (Broman et al., 2003).
The length of the map was 1,459 cM, with an average resolution of 2.43 cM per bin,
corresponding to 619 kb (TIGR5.0). The haplotypes and genetic positions of the 601
marker bins for all the 110 RILs are shown in Figure 1. The steps of the SFP detection
and the bin map construction are summarized in Table 1. In the genetic map, there are
still three big gaps with genetic distance ≥ 20 cM (20.0 cM and 27.1 cM on chr 2, and
22.2 cM on chr 9), located in the regions where RFLP/SSR markers could not link the
chromosomes in the previous map.
Distribution of e-traits
Totally 25,965 (45.25%) of the 57,381 probesets were identified as “Present” for at
least one third of the 110 RILs using the algorithm of MAS 5.0 (Liu et al., 2002),
which were viewed as expression traits (e-traits). To obtain an overview for the
distributions of the e-traits, we used the t-test like statistic τ as proposed by
Bessarabova et al. (2010) to distinguish between one-modal (normal) and wider
(bi-nomal or multi-mormal) distirbutions. To do so, we simulated normal distribution
data for 10,000 populations each containing 110 numbers (μ=0, σ=1), resulting in a
threshold τ = 3.22 (P=0.01). By this analysis, distributions for 6,320 (24.3%) of the
e-traits exhibited bi-nomal distributuons (τ >3.22) of various patterns (Figure S3). The
remaining 19,645 (75.7%) e-traits were considerred to be one-model (τ ≤ 3.22), of
which 14,681 featured normality (P<0.01) as analyzed using Shapiro-Wilk normality
test (Royston ,1995).
We also tested transgressive segregation using the method described by Brem and
Kruglyak (2005). The distributions of expression levels of 8,006 (30.8%) e-traits in
the RILs significantly (P<0.05, 1,000 permutations) fall outside the ranges of parental
values.
Identification of eQTLs
Composite interval mapping (CIM) (Zeng, 1993, 1994) was applied to identify
eQTLs of the expression values of the e-traits with a walking speed of 2 cM along the
genetic map of the 601 bins. A logarithm of odds (LOD) threshold 3.12, obtained by
global permutation test, was applied to declare the eQTLs. If the genetic distance of
two adjacent peaks was more than 20 cM, and the depth of the valley of two adjacent
peaks exceeded 2 LOD, the two peaks were regarded as two distinct eQTLs for the
e-trait. The eQTL support interval of 1.5 LOD drop on each side from the maximum
LOD value was estimated and the maximum support interval size was set to 10 cM

from each side.
We obtained 29,116 eQTLs at a genome-wide significant level P≤0.05, and
18,334 (70.65%) of the total 25,965 e-traits had at least one eQTL. Only the probesets
each with TIGR5.0 unique locus support were used for subsequent analysis, resulting
in 26,051 significant eQTLs for 16,372 e-traits (Table S5). The number of eQTLs for
each e-trait varied from 1 to 6. We anchored the genetic map to the physical map of
rice genome (TIGR5.0) based on physical/genetic locations of the markers, and
plotted the e-traits and their corresponding eQTLs according to their genetic locations
(Figure 2).
Cis/trans regulators were identified according to the genetic locations of the e-traits
and their corresponding eQTLs. A cis-eQTL was defined if its e-trait was located in
the eQTL support interval within the accepted drop of 1.5 LOD from the peak LOD
value, otherwise it was a trans-eQTL. However, proper support intervals could not be
defined for some of the eQTLs located in the tips of the chromosomes, in which case
a cis was defined if the distance of an e-trait and its e-QTL was less than 10 cM, or it
was trans otherwise. Totally 4,464 cis-eQTLs were assessed, as shown in the diagonal
of Figure 2. The cis-eQTLs tended to have higher LOD scores than trans-eQTLs as
indicated by the color key in Figure 2. Also cis-eQTLs in general had greater effects
on the e-traits: 63.4% of the cis-eQTLs individually explained >20% of the
expression variation of the corresponding e-traits, 14.7% explained 40% to 60% and
10.2% explained >80%, while 95.8% trans-eQTLs accounted for <20% variation of
the e-traits and only 0.23% trans-eQTL explained >80% (Figure 3). As expected, an
e-trait with a very large effect eQTL (LOD>40) typically shows a bimodal
distribution, and most of bimodal e-traits had a cis-eQTL with very large effect as
evaluated by LOD and variance explained.

Inspection of the estimated genetic effects of the eQILs showed that 3.0% of the
eQTLs had an addictive effect ≥ 0.5 (Table S5), corresponding to a 2-fold change
(log2(2)=1) between the two homozygotes. And 91.8% of them could individually
explain ≥50% variations of the e-traits, the majority of which were cis-eQTLs.
eQTL hotspots
It is also clear from Figure 2 that some regions, e.g. regions on chromosomes 3, 5 and
10, had larger numbers of eQTLs as indicated by the thick horizontal lines. The
distribution of the eQTLs deviated significantly (χ2= 6924.86, P<2.2e-16) from
random occurrence on the 12 chromosomes. The standardized residues for numbers
of the eQTLs, each of which followed a normal distribution asymptotically, on
chromosomes 3, 5 and 10 were much larger than those of other chromosomes (Table
2). Thus some regions on these chromosomes are enriched for eQTLs, indicating that
there may exist major regulators that control expression of sets of genes.
We investigated the distribution of eQTLs along the genome by dividing the whole
genome into 1 cM partitions, and the number of eQTLs in each segment was counted.
A permutation test was used to assess the statistical significance of deviation of the
observed eQTL distribution per cM from the expectation based on chance events
assuming a uniform distribution throughout the genome. In the permutation, each
eQTL was randomly assigned to a 1 cM interval in the map, and the resulting number
of eQTLs in each interval was counted. The results of 1,000 permutations showed that
with P≤0.01, the cutoff number of eQTLs per cM by chance alone would be 39, and a
larger number would be regarded as an e-QTL hotspot. Thus, 171 potential eQTL
hotspots were identified by this test (Figure 4).
To evaluate whether there were functional enrichments in the eQTL hotspots,
Bioconductor topGO package (Alexa et al., 2006) was used to resolve the e-traits

(probesets) whose eQTLs were mapped in the hotspots into different biological
processes according to TIGR5.0 Gene Ontology (GO) annotation. Fisher’s exact test
was applied to assess the statistical significance of over-representation of the 137
Gene ontology biological process categories (level 5) against all the e-traits mapped
to the hotspots (Wang et al., 2010). A hotspot was considered to be enriched for a
particular GO term if the P-value from Fisher’s exact test was ≤0.01 and there were at
least 5 genes in this GO in the hotspot. Using this criterion, we identified 21
functional terms enriched in 37 of the 171 eQTL hotspots (Table S6).
In particular, we found that DNA metabolism process (GO: 0006259) was
significantly enriched in e-traits mapped to five hotspots (chr 3: 401-402 cM; chr 5:
717-718 cM; chr 10: 1205-1206 cM, 1243-1244 cM, 1,244-1,245 cM) (Table S6).
Totally 455 e-traits with eQTLs corresponding to 365 TIGR5.0 annotated loci were in
the category of DNA metabolism process in our dataset. Two of the three hotspots on
chromosome 10, 1243-1244 cM and 1,244-1,245 cM, were adjacent and combined as
one 1243-1245 cM. There were one or two cis-eQTLs whose corresponding e-traits
involving DNA metabolism in each of the three hotspots chr 3: 401-402 cM, chr 5:
717-718 cM, and chr 10: 1243-1,245 cM, suggesting a possible regulatory network
for DNA metabolism in each case with the one having the cis-eQTL as a putative
regulator. But there was no cis-eQTL for genes in this functional category in chr 10:
1205-1206 cM, suggesting that the DNA metabolism process mapped to 1205-1206
cM was regulated by genes functioning in other category (ies). We individually
calculated correlations of expression levels of DNA metabolism genes between the
e-traits having cis-eQTLs and the putative target e-traits with trans-eQTLs in the
three hotspots. The results showed that expression levels of the probesets
Os.21451.1.S1_a_at in 401-402 cM, Os.53059.1.S1_x_at and Os.23359.1.S1_at in

717-718 cM, and Os.6722.1.S1_at in 1243-1,245 cM were highly correlated with
most of the putative target e-traits with the trans-eQTL(s) in the same intervals of the
hotspots (Figure S4). It is likely that genes represented by these four probesets may
function, among others, as master regulators of the DNA metabolism process.
Expression relationship of potential regulator and the targets
Transcription factors (TFs) and their regulatory targets may provide ideal models for
understanding cis-acting and trans-regulating network. If the polymorphism resides at
the locus of a TF, which affects the expression of the TF directly by altering a
functional motif in the promoter region or the stability of the mRNA, this TF would
be the cause of a cis-eQTL. Transcript abundance of its modulating targets involved
in various pathways may be affected, causing a cascade reaction of gene expression.
Therefore, the TF would be a trans-eQTL for the targeted genes.
To investigate the extent of such regulation, we downloaded all the rice TFs from
Rice TFDB (http://ricetfdb.bio.unipotsdam.de/v2.1/) (Riano-Pachon et al., 2007).
Totally, 1,078 probesets for 939 unique genes were annotated as TFs. We used their
expression levels as e-traits to analyze eQTLs, resulting in a total of 1,722 eQTLs,
including 235 (13.6 %) cis-eQTLs. We calculated correlations of the transcript levels
between the 235 TFs and the e-traits with trans-eQTLs located in these TF-containing
genomic regions (1.5 LOD-drop support intervals). To evaluate the statistical
significance of the correlations, a permutation test was conducted by calculating
correlations of the transcript levels between two randomly selected sets of 1,000
e-traits producing 1,000,000 correlation coefficients, giving 0.75 or -0.66 as
thresholds for significant correlation at P=0.01. After removing the TFs that are
significantly correlated with less than 5 e-traits, 19 TFs were significantly correlated
with 6 to 30 e-traits (Table S7).
We also did similar calculation for the 4,464 genes with cis-eQTLs, 99 genes
showed significant correlations with 30 or more e-traits that had trans-eQTLs located
in these gene regions, including 24 genes showing co-expression with 100-425
e-traits (Table S8). These data indicated that genes other than TFs also play important
roles as master regulators for gene expression at the whole genome level.
eQTLs and phenotypic QTLs
Variation of gene expression levels constitutes one of the major causes for variations
of trait manifestation (Ashikari et al., 2005; Chu et al., 2006; Frary et al., 2000). It is
highly likely that many of the eQTLs would be the causes of phenotypic change. We
thus assessed relatedness of the eQTLs with phenotypic variations, or phenotypic
QTLs (pQTLs) in this population.
Cui et al. (2002) employed the same RIL population to detect pQTLs for
seedling-vigor traits. We extracted data of the same 110 RILs for shoot dry weight
from that analysis, which was closest to the tissue used in this eQTL study. Plant dry
weight was the most important indicator for the status of rice seedling growth and
development. Thus analysis of association between phenotypic variation and eQTLs
would help dissect the genetic factors controlling early growth characteristics of rice.
The genetic map composed of 601 bins was used to identify pQTLs. Three pQTLs
were resolved for this trait (Table S9), which is less than 7 detected by Cui et al.
(2002). Two of the pQTLs were in common between these two analyses, and the
support intervals of the two pQTLs mapped in this study were much narrower (Figure
5), indicating improved mapping precision.
To reveal possible relationship between the pQTLs and eQTLs, their distributions
were compared along the whole genome (Figure 5). The support intervals of all three
pQTLs SDW4, SDW5-1, SDW5-2 for shoot dry weight overlapped with the eQTL

hotspots, suggesting the possibility that genes underlying the eQTL hotspots may
contribute to the phenotypic variations. To assess the possibility of causal
polymorphisms for pQTLs in the segregation population, we also calculated
correlations between the phenotype values of the traits and expression levels of
e-traits in the regions where support intervals of cis-eQTLs and trans-eQTLs
overlapped pQTLs. Typically the expression levels of several probesets underneath
each of the cis-eQTLs overlapping pQTLs were significantly (P<0.001) correlated
with the phenotypic values of the trait. The absolute values for the majority of the
correlation coefficients were 0.3-0.4 (Table S10). Such correlations may be useful for
identifying candidate genes contributing to the trait variation. The e-trait with
trans-eQTLs also displayed significant expression correlation with shoot dry weight.
Especially, SDW5-1, with larger effect on the trait, had the smaller support interval (6
cM), and 93 e-traits with trans-eQTLs in the support interval showed significant
correlations (r ranges 0.3-0.5) (Table S10). It suggested that the genes with cis-eQTL
in the pQTL regions would be associated with early growth characteristics by
regulating lots of genes with trans-eQTLs. Testing this hypothesis still requires
subsequent functional analysis of the likely candidate genes.
Discussion
Molecular markers and the genetic map of the RIL population
Gene expression microarrays hybridized with RNA provide data that can be used
simultaneously for developing molecular markers and measuring gene expression
abundance in a segregating population. West et al. (2006) described two types of
genetic markers from Affymetrix GeneChip expression data to generate haplotypes
for 148 RILs in Arabidopsis, GEMs (gene expression markers) and SFPs. They used
two methods to detect SFPs, parental min-max and RIL distribution (West et al.,
2006). It was demonstrated that SFPs developed using the RIL distribution method
offer more complete genome coverage than GEMs and greater marker precision than
SFPs based on parental min-max method. Potokina et al. (2008) applied a simple
algorithm to identify transcript derived markers, including both SFPs and GEMs,
from transcript-level variation across 139 double-haploid (DH) lines in barley.
Because GEMs are based on extreme allele-specific expression difference, only
cis-acting GEMs will place a gene at its correct genetic map location, while
trans-regulated GEMs will map a gene to another genetic location (Luo et al., 2007),
which will cause problems if they are used as markers in genetic mapping of QTLs
and eQTLs (Wang et al., 2009). In this study, we focused on SFPs based on single
probe hybridization intensity, which ignored GEMs. We applied a median polish
method to minimize variation due to differential gene expression that impacts the
probeset as a whole (Xie et al., 2009), which is similar to SFPdev used by West et al.
(2006). However, the method (SFP RIL distribution) they used is too stringent and a
smaller number of SFP markers would be obtained when applied in our study (data
not shown). We applied a more robust version of K-means in clustering, and used
normally distributed Z-scores to define the boundary of the two groups as described
by Luo et al. (2007) and Potokina et al. (2008). We used strict criteria to control false
discovery rate and distorted allele frequency to avoid poorly reproducible SFPs. It
was demonstrated that the method of SFP detection used in this study, a combination
of modifications of previously used methods, is more robust and effective in SFP
identification.
Using the gene expression microarrays hybridized with RNA in shoot tissue from
110 RILs at 72 h after germination, we detected 1,632 SFP markers and constructed a

high-density genetic map with a very low percentage of missing marker data.
Compared to previous RFLP/SSR marker map, the bin map constructed with SFPs
increased the density from 8.7 cM (Xing et al., 2002) to 2.4 cM between adjacent
markers and with higher accuracy. Still we faced difficulty in some genomic regions,
and obtained 23 PCR-based markers to fill the gaps which greatly helped the map
construction. This is especially the case for the gap on chromosome 2, otherwise this
chromosome would still be two disconnected segments. eQTL analysis also revealed
very low density of eQTLs located in some big gap regions. This is due to the very
low level of DNA polymorphisms between the two parents, Zhenshan 97 and
Minghui 63, in these regions, indicating likely common origin of these genomic
regions between the two parents in the breeding history.
The results also showed that the length of the SFP bin map constructed in this study
is much shorter than RFLP/SSR map reported previously (Xing et al., 2002). An
explanation is that there were false double crossovers between adjacent markers that
were incorporated in previous map without the knowledge of the DNA sequences that
became available only recently. Setting the markers producing double recombinants
between adjacent markers to “missing” would improve the quality of the map as true
double recombinants would be extremely rare, and the effect should be negligible. We
thus concluded that the high-density genetic map based on the SFP markers detected
in this study is of high quality.
The implication of the results in regulatory network of transcription
One of the objectives of eQTL analysis is to provide information for possible
regulatory network, just like the QTL analyses do for the identification of genes
controlling quantitative traits. The results of this analysis provide enormous amount
of information for further investigating the regulatory network at the stage covered by

the tissue. The eQTL hotspots have been presumed as containing master regulators
that are involved in various regulatory pathways (Brem et al., 2002; Keurentjes et al.,
2007; West et al., 2007; Potokina et al., 2008). The most obvious objects sought after
for finding regulatory network may be the TFs and their downstream targets.
Surprisingly, however, the results showed that gene products other than TFs play
large roles in regulating gene expression as evaluated by numbers of co-expressing
genes (Yvert et al, 2003). Since a number of methods are now available for assaying
the interaction of the regulator and its targets, there is no technical difficulty for
validating whether the trans-eQTLs identified indeed represent a regulatory network,
with the e-traits with cis-eQTL as the regulator and the e-traits with trans-eQTL as
the downstream targets.
An interesting feature revealed by the analysis is the enrichment of genes in certain
functional categories among the e-traits with trans-eQTLs mapped to eQTL hotspots
where one or two e-traits with cis-eQTL(s) in the same functional class. Further
analysis showed that the expression of the cis-eQTL was significantly correlated with
most of the e-traits. This is exemplified by the analysis of eQTL hotspots which
identified the enrichment of the term DNA metabolism. This suggested the likelihood
that cis-eQTL(s) not only regulates the expression of itself, it may also regulate the
expression levels of a large number of e-traits, although the function of this gene as a
regulator has yet to be investigated.
Moreover, the eQTL plot indicated that e-traits regulated by trans-eQTLs may also
have effects on regulation of other e-traits, which in turn may be regulators of still
other e-traits. Thus full characterization of the regulatory network should aim at
identifying the members involved in various orders of the regulatory hierarchies, and
their interplays in the regulatory pathways.
Biological processes and regulatory activities at the germination stage
Germination is the starting point of the life cycle featured by growth of an embryonic
plant contained within a seed leading to the formation of the seedling. Germination of
seeds is a multifactorial process involving an array of metabolic events (Vázquez et
al., 1991). Soon after imbibitions, repair of DNA damaged during maturation drying
and rehydration and synthesis of mitochondrial DNA take place. Moreover, DNA
synthesis is also associated with post-germinative cell division. New mRNAs are
transcribed as germination proceeds, and the majority of these are likely to encode
proteins essential for normal cellular metabolism (Bewley, 1997; Vazquez-Ramos and
Sanchez, 2003; Howell et al., 2009). GO analysis showed that eQTLs for the e-traits
involved in a few particular functional pathways were enriched in some hotspots,
notably DNA metabolism process and RNA metabolism process, indicating that these
processes are highly active at this stage. Therefore, the results may help unveil the
molecular basis of the complex processes in germination and early seedling.
Implication for identifying genes for pQTLs
Natural variation in transcripts provides an important cause of phenotypic variation
(Frary et al., 2000; Ashikari et al., 2005; Chu et al., 2006). Associating eQTLs with
phenotypic variation or pQTLs may provide an approach for identifying causal genes
of important traits thus enhance the understanding of the molecular mechanisms of
quantitative traits. Such association can be established by aligning the support
intervals of eQTLs with that of pQTLs, and the eQTLs in the pQTL support intervals
may contribute to the phenotypic variations. A cis-eQTL would reflect the
relationship between genotype and phenotype. In Arabidopsis, some cloned genes
were shown to be cis-eQTLs, such as QTLs for flowering time and development
(Johanson et al., 2000; Caicedo et al., 2004), confirming that identifying cis-eQTLs

in pQTL intervals may provide an effective strategy for QTL cloning.
By reanalyzing the data of shoot dry weight available from this same population
(Cui et al., 2002), we remapped the QTLs using the high density genetic map
constructed in this study. The alignment showed that master regulators may exist in a
region where pQTL and eQTL hotspot overlapped that controls hundreds of genes
with trans-eQTLs involved in various physiological pathways thus causing
measurable phenotypic variations. The genes whose expression was significantly
correlated with cis-eQTL in the support interval of pQTLs for shoot dry weight may
provide candidates for the functional genes. However, detailed functional analysis of
individual candidate genes is necessary for identification of the genes for the pQTLs
as well as the possibility of master regulators.
Experimental procedures
Plant materials
The seeds of 110 RILs and the parents Zhenshan 97 and Minghui 63 were first soaked
in water for 48 h in a chamber (Conviron S10H, Controlled Environment Limited,
Winnipeg, Canada) set at 25°C/85% relative humidity/dark, and transferred to another
chamber (Conviron PVG36, Controlled Environment Limited, Winnipeg, Canada) for
pre-germination (35°C, 85% relative humidity, dark). Germination of the seeds was
checked every 2 h and germinated seeds were transferred to a growth chamber
(Conviron S10H) and incubated for 72 h (25°C, 85% relative humidity, dark). Shoots
from 15 seedlings per line were bulk-harvested and frozen in liquid nitrogen for RNA
extracting. Two biological replications for each RIL and three for each parent were
sampled, one replication at a time.
RNA isolation, purification, labeling, microarray hybridization and scanning were
conducted by the CapitalBio Corporation (Beijing, China) according to Affymetrix
standard protocols (http://www.affymetrix.com/products/arrays/specific/rice.affx).
Microarray data handling
All the 226 raw Affymetrix CEL files were read into R2.8.1 platform
(http://www.R-project.org) by Bioconductor (http://www.bioconductor.org/) package
affy (Gautier et al., 2004; Gentleman et al., 2004; R Development Core Team, 2008).
For SFP detection, the chip data were subjected to robust multi-array average (RMA)
background correction (Irizarry et al., 2003). Then, the 631,066×226 PM probe
values were extracted, quantile normalized (Bolstad et al., 2003) and logarithmic
transformed. For eQTL analysis, the expression signals of all 57,381 probesets were
estimated using the RMA algorithm (Irizarry et al., 2003). We utilized MAS 5.0 to
perform the Wilcoxon signed rank-based gene expression presence/absence detection
algorithm for all probesets (Liu et al., 2002). Probesets identified as “Present” in at
least one third of RIL chip data (110 RILs × 2 replicates) were regarded as expression
traits (e-traits) and only these detected as expressed probesets were used in eQTL
analysis.
Detection of SFPs
We developed a program SFPdet written in R language (can be required from the
authors) to detect SFPs between the two genotypes including the following steps:
(1) Every normalized and log2 transformed probeset matrix consisting of 11 PM
probes in the 226 chips was subjected to median polish analysis to extract the
residuals.
(2) For every probe, 226 residuals were divided into two clusters using the package
cluster function pam, partitioning (clustering) of the data into k clusters “around
medoids”, a more robust version of K-means (Kaufman and Rousseeuw, 1990).

(3) Probes with two non-overlapping clusters were identified. The means (m1, m2) and
standard deviations (s1, s2) of each cluster were calculated. The probability of every
member of each cluster belonging to the other cluster was estimated using Z-scores
Zi=(xi-mj)/sj, where xi is the score of a member from cluster i and mj and sj are the
mean and standard deviation of cluster j. We used a |Zi|≥2.576 (P≤0.01) to obtain
99% probability that one member of a cluster i does not belong to the other, smaller Z
score was treated as a missing datum. This is similar to the method described by Luo
et al. (2007) and Potokina et al. (2008).
(4) A probe was identified as a SFP marker if the clustering of 226 samples meets the
following criteria: a) ≤ 3 missing data points in the 226 chips; b) data for ≥ 5 of 6
parental samples were consistently separated into clusters according to their
genotypes; c) ≤ 165 (0.75) of 220 RIL samples were grouped to the same cluster. The
first two criteria would control false discovery rate and the last criterion control the
distorted allele frequency.
SFPs were identified using the SFPdet program based on the PM probes. Two
replicates of the RILs were genotyped separately with the SFP markers.
For further analyses, data generated by the SFP markers were filtered. Physical
positions (TIGR5.0) of the probes in the genome were determined as described by
Xie et al. (2009). Probes each with a unique location in the rice genome were used for
SFP confirmation. A genotype was assigned to a RIL if the SFP marker had identical
genotypes in both biological replicates, or one of the two replicates had a missing
datum and the other had an unambiguous genotype, otherwise the RIL was scored as
missing. To ensure quality of the markers, SFP markers assigning more than 10% of
the RILs as missing were not included in the analysis.
Development of PCR-based markers
To reduce the gaps in the SFP genetic map, PCR-based markers were explored based
on SNPs between the two parents. Primers were designed in the big gaps to produce
~500 bp amplified fragments from both parents, which were sequenced to identify
SNPs. CAPS markers were developed using the dCAPS Finder 2.0
(http://helix.wustl.edu/dcaps/dcaps.html), and used to genotype the RILs by
comparing to the parents. If there were no appropriate restriction enzymes for
developing CAPS markers, the amplified RIL samples were directly sequenced for
assaying the SNPs.
Construction of the genetic map
The selected SFP and PCR-based markers were ordered by their physical locations in
the rice genome (TIGR5.0). Related sequences of the RFLPs and SSRs previously
mapped in this RIL population (Xing et al., 2002) were obtained from Gramene
(http://www.gramene.org), and were located to the rice genome (TIGR5.0) by
BLAST analysis (Altschul et al., 1997). Only markers (200 in total) with the physical
locations in agreement with their genetic positions were retained (Table S3).
Before constructing the genetic map, all the SFP/PCR markers were grouped and
integrated into recombination bins. As some breakpoints could not be determined due
to missing data for some markers, we applied the following method to group markers.
All markers were ordered by their physical positions in the rice genome (TIGR5.0), if
a marker genotype of a RIL was the same as the bin in which the previous marker
was assigned to, except the missing data, the marker was defined as a member of the
same bin, otherwise it belonged to the next bin. For each bin, we used the marker
with least missing data to represent the bin. Genetic positions of the bins were
calculated using the R/qtl package function est.map with the default Haldane map
function (Broman et al., 2003).

eQTL and pQTL mapping
For each e-trait, transcript levels were averaged over the two microarray replicates for
each RIL. Composite interval mapping (CIM) (Zeng, 1993, 1994) analysis with a
walking speed of 2 cM was employed to analyze each e-trait using the procedure of
SRmapqtl and Zmapqtl of QTL cartographer Version 1.17 (Basten et al., 2004). A
global permutation threshold (GPT) approach was applied to obtain a genome-wide
threshold for statistically significant eQTLs (West et al., 2007; Potokina et al., 2008).
A representative null distribution of 100,000 maximum likelihood ratio test (LRT)
statistics (100 randomly selected e-traits×1000 permutations) was applied for all
25,965 e-traits. The GPT was computed at 0.05 significant level giving LRT value
14.36, corresponding to LOD value 3.12 as the threshold. For pQTL mapping, the
two replicate data for shoot dry weight from Cui et al. (2002) were averaged for CIM.
Accession codes
NCBI Gene Expression Omnibus (GEO): microarray data have been submitted under
accession number GSE22564.
Acknowledgements
This research was supported by grants from the National Program on Key Basic
Research Project, National Special Key Project of China on Functional Genomics of
Major Plants and Animals, and the National Natural Science Foundation of China.
Reference
Alexa, A., Rahnenfuhrer, J. and Lengauer, T. (2006) Improved scoring of functional groups
from gene expression data by decorrelating GO graph structure. Bioinformatics, 22,

1600-1607.
Alonso, J.M., Stepanova, A.N., Leisse, T.J., Kim, C.J., Chen, H., Shinn, P., Stevenson,
D.K., Zimmerman, J., Barajas, P., Cheuk, R., Gadrinab, C., Heller, C., Jeske, A.,
Koesema, E., Meyers, C.C., Parker, H., Prednis, L., Ansari, Y., Choy, N., Deen, H.,
Geralt, M., Hazari, N., Hom, E., Karnes, M., Mulholland, C., Ndubaku, R., Schmidt,
I., Guzman, P., Aguilar-Henonin, L., Schmid, M., Weigel, D., Carter, D.E., Marchand,
T., Risseeuw, E., Brogden, D., Zeko, A., Crosby, W.L., Berry, C.C. and Ecker, J.R.
(2003) Genome-wide insertional mutagenesis of Arabidopsis thaliana. Science, 301,
653-657.
Altschul, S.F., Madden, T.L., Schaffer, A.A., Zhang, J., Zhang, Z., Miller, W. and
Lipman, D.J. (1997) Gapped BLAST and PSI-BLAST: a new generation of protein
database search programs. Nucleic Acids Res., 25, 3389-3402.
Ashikari, M., Sakakibara, H., Lin, S., Yamamoto, T., Takashi, T., Nishimura, A., Angeles,
E.R., Qian, Q., Kitano, H. and Matsuoka, M. (2005) Cytokinin oxidase regulates rice
grain production. Science, 309, 741-745.
Basten, C.J., Weir, B.S. and Zeng, Z.B. (2004) QTL Cartographer, Version 1.17. Raleigh,
NC: Department of Statistics, North Carolina State University.
Bessarabova, M., Kirillov, E., Shi, W.W., Bugrim, A., Nikolsky, Y. and Nikolskaya, T.
(2010) Bimodal gene expression patterns in breast cancer. BMC Genomics, 11 (Suppl 1):S8.
Bewley, J.D. (1997) Seed germination and gormancy. Plant Cell, 9, 1055-1066.
Bolstad, B.M., Irizarry, R.A., Astrand, M. and Speed, T.P. (2003) A comparison of
normalization methods for high density oligonucleotide array data based on variance and

bias. Bioinformatics, 19, 185-193.
Brem, R.B., Yvert, G., Clinton, R. and Kruglyak, L. (2002) Genetic dissection of
transcriptional regulation in budding yeast. Science, 296, 752-755.
Brem, R.B. and Kruglyak, L. (2005) The landscape of genetic complexity across 5,700 gene
expression traits in yeast. Proc. Natl Acad. Sci. USA, 102, 1572-1577.
Broman, K.W., Wu, H., Sen, S. and Churchill, G.A. (2003) R/qtl: QTL mapping in
experimental crosses. Bioinformatics, 19, 889-890.
Caicedo, A.L., Stinchcombe, J.R., Olsen, K.M., Schmitt, J. and Purugganan, M.D. (2004)
Epistatic interaction between Arabidopsis FRI and FLC flowering time genes generates a
latitudinal cline in a life history trait. Proc. Natl Acad. Sci. USA, 101, 15670-15675.
Chen, H., Wang, S. and Zhang, Q. (2002) New gene for bacterial blight resistance in rice
located on chromosome 12 identified from Minghui 63, an elite restorer line.
Phytopathology, 92, 750-754.
Chen, H., Wang, S., Xing, Y., Xu, C., Hayes, P.M. and Zhang, Q. (2003) Comparative
analyses of genomic locations and race specificities of loci for quantitative resistance to
Pyricularia grisea in rice and barley. Proc. Natl Acad. Sci. USA, 100, 2544-2549.
Cheung, V.G., Conlin, L.K., Weber, T.M., Arcaro, M., Jen, K.Y., Morley, M. and
Spielman, R.S. (2003) Natural variation in human gene expression assessed in
lymphoblastoid cells. Nat. Genet., 33, 422-425.
Chu, Z., Yuan, M., Yao, J., Ge, X., Yuan, B., Xu, C., Li, X., Fu, B., Li, Z., Bennetzen, J.L.,
Zhang, Q. and Wang, S. (2006) Promoter mutations of an essential gene for pollen
development result in disease resistance in rice. Genes Dev., 20, 1250-1255.

Cui, K.H., Peng, S.B., Xing, Y.Z., Xu, C.G., Yu, S.B. and Zhang, Q. (2002) Molecular
dissection of seedling-vigor and associated physiological traits in rice. Theor. Appl. Genet.,
105, 745-753.
Cui, K.H., Peng, S.B., Xing, Y.Z., Yu, S.B., Xu, C.G. and Zhang, Q. (2003) Molecular
dissection of the genetic relationships of source, sink and transport tissue with yield traits
in rice. Theor. Appl. Genet., 106, 649-658.
DeCook, R., Lall, S., Nettleton, D. and Howell, S.H. (2006) Genetic regulation of gene
expression during shoot development in Arabidopsis. Genetics, 172, 1155-1164.
Frary, A., Nesbitt, T.C., Grandillo, S., Knaap, E., Cong, B., Liu, J., Meller, J., Elber, R.,
Alpert, K.B. and Tanksley, S.D. (2000) fw2.2: a quantitative trait locus key to the
evolution of tomato fruit size. Science, 289, 85-88.
Gautier, L., Cope, L., Bolstad, B.M. and Irizarry, R.A. (2004) affy--analysis of Affymetrix
GeneChip data at the probe level. Bioinformatics, 20, 307-315.
Gentleman, R.C., Carey, V.J., Bates, D.M., Bolstad, B., Dettling, M., Dudoit, S., Ellis, B.,
Gautier, L., Ge, Y., Gentry, J., Hornik, K., Hothorn, T., Huber, W., Iacus, S., Irizarry,
R., Leisch, F., Li, C., Maechler, M., Rossini, A.J., Sawitzki, G., Smith, C., Smyth, G.,
Tierney, L., Yang, J.Y. and Zhang, J. (2004) Bioconductor: open software development
for computational biology and bioinformatics. Genome Biol., 5, R80.
Ghazalpour, A., Doss, S., Kang, H., Farber, C., Wen, P.Z., Brozell, A., Castellanos, R.,
Eskin, E., Smith, D.J., Drake, T.A. and Lusis, A.J. (2008) High-resolution mapping of
gene expression using association in an outbred mouse stock. PLoS Genet., 4, e1000149.
Ghazalpour, A., Doss, S., Zhang, B., Wang, S., Plaisier, C., Castellanos, R., Brozell, A.,

Schadt, E.E., Drake, T.A., Lusis, A.J. and Horvath, S. (2006) Integrating genetic and
network analysis to characterize genes related to mouse weight. PLoS Genet., 2, e130.
Goring, H.H., Curran, J.E., Johnson, M.P., Dyer, T.D., Charlesworth, J., Cole, S.A.,
Jowett, J.B., Abraham, L.J., Rainwater, D.L., Comuzzie, A.G., Mahaney, M.C.,
Almasy, L., MacCluer, J.W., Kissebah, A.H., Collier, G.R., Moses, E.K. and Blangero,
J. (2007) Discovery of expression QTLs using large-scale transcriptional profiling in
human lymphocytes. Nat. Genet., 39, 1208-1216.
Han, B. and Xue, Y.B. (2003) Genome-wide intraspecific DNA-sequence variations in rice.
Curr. Opin. Plant Biol., 6, 134-138.
Hansen, B., Halkier, B. and Kliebenstein, D. (2008) Identifying the molecular basis of
QTLs: eQTLs add a new dimension. Trends Plant Sci., 13, 72-77.
Howell, K.A., Narsai, R., Carroll, A., Ivanova, A., Lohse, M., Usadel, B., Millar, A.H. and
Whelan, J. (2009) Mapping metabolic and transcript temporal switches during
germination in rice highlights specific transcription factors and the role of RNA instability
in the germination process. Plant Physiol., 149, 961-980.
Hua, J., Xing, Y., Wu, W., Xu, C., Sun, X., Yu, S. and Zhang, Q. (2003) Single-locus
heterotic effects and dominance by dominance interactions can adequately explain the
genetic basis of heterosis in an elite rice hybrid. Proc. Natl Acad. Sci. USA, 100,
2574-2579.
Hua, J.P., Xing, Y.Z., Xu, C.G., Sun, X.L., Yu, S.B. and Zhang, Q.F. (2002) Genetic
dissection of an elite rice hybrid revealed that heterozygotes are not always advantageous
for performance. Genetics, 162, 1885-1895.

Irizarry, R.A., Hobbs, B., Collin, F., Beazer-Barclay, Y.D., Antonellis, K.J., Scherf, U.
and Speed, T.P. (2003) Exploration, normalization, and summaries of high density
oligonucleotide array probe level data. Biostatistics, 4, 249-264.
Jeon, J.S., Lee, S., Jung, K.H., Jun, S.H., Jeong, D.H., Lee, J., Kim, C., Jang, S., Yang, K.,
Nam, J., An, K., Han, M.J., Sung, R.J., Choi, H.S., Yu, J.H., Choi, J.H., Cho, S.Y.,
Cha, S.S., Kim, S.I. and An, G. (2000) T-DNA insertional mutagenesis for functional
genomics in rice. Plant J., 22, 561-570.
Johanson, U., West, J., Lister, C., Michaels, S., Amasino, R. and Dean, C. (2000)
Molecular analysis of FRIGIDA, a major determinant of natural variation in Arabidopsis
flowering time. Science, 290, 344-347.
Jordan, M.C., Somers, D.J. and Banks, T.W. (2007) Identifying regions of the wheat
genome controlling seed development by mapping expression quantitative trait loci. Plant
Biotechnol. J., 5, 442-453.
Kaufman, L. and Rousseeuw, P.J. (1990) Finding groups in data: an introduction to cluster
analysis. New York: Wiley.
Keurentjes, J.J., Fu, J., Terpstra, I.R., Garcia, J.M., van den Ackerveken, G., Snoek,
L.B., Peeters, A.J., Vreugdenhil, D., Koornneef, M. and Jansen, R.C. (2007)
Regulatory network construction in Arabidopsis by using genome-wide gene expression
quantitative trait loci. Proc. Natl Acad. Sci. USA, 104, 1708-1713.
Kliebenstein, D. (2009) Quantitative genomics: analyzing intraspecific variation using global
gene expression polymorphisms or eQTLs. Annu. Rev. Plant Biol., 60, 93-114.
Kliebenstein, D.J., West, M.A., van Leeuwen, H., Kim, K., Doerge, R.W., Michelmore,

R.W. and St Clair, D.A. (2006) Genomic survey of gene expression diversity in
Arabidopsis thaliana. Genetics, 172, 1179-1189.
Komsta, L. (2006). Processing data for outliers. R News, 6, 10-13.
Krishnan, A., Guiderdoni, E., An, G., Hsing, Y.I., Han, C.D., Lee, M.C., Yu, S.M.,
Upadhyaya, N., Ramachandran, S., Zhang, Q., Sundaresan, V., Hirochika, H., Leung,
H. and Pereira, A. (2009) Mutant resources in rice for functional genomics of the grasses.
Plant Physiol., 149, 165-170.
Lian, X.M., Xing, Y.Z., Yan, H., Xu, C.G., Li, X.H. and Zhang, Q.F. (2005) QTLs for low
nitrogen tolerance at seedling stage identified using a recombinant inbred line population
derived from an elite rice hybrid. Theor. Appl. Genet., 112, 85-96.
Liu, W.M., Mei, R., Di, X., Ryder, T.B., Hubbell, E., Dee, S., Webster, T.A., Harrington,
C.A., Ho, M.H., Baid, J. and Smeekens, S.P. (2002) Analysis of high density expression
microarrays with signed-rank call algorithms. Bioinformatics, 18, 1593-1599.
Luo, Z.W., Potokina, E., Druka, A., Wise, R., Waugh, R. and Kearsey, M.J. (2007) SFP
genotyping from affymetrix arrays is robust but largely detects cis-acting expression
regulators. Genetics, 176, 789-800.
Monks, S.A., Leonardson, A., Zhu, H., Cundiff, P., Pietrusiak, P., Edwards, S., Phillips,
J.W., Sachs, A. and Schadt, E.E. (2004) Genetic inheritance of gene expression in human
cell lines. Am. J. Hum. Genet., 75, 1094-1105.
Ouyang, S., Zhu, W., Hamilton, J., Lin, H., Campbell, M., Childs, K., Thibaud-Nissen, F.,
Malek, R.L., Lee, Y., Zheng, L., Orvis, J., Haas, B., Wortman, J. and Buell, C.R.
(2007) The TIGR Rice Genome Annotation Resource: improvements and new features.

Nucleic Acids Res., 35, D883-887.
Potokina, E., Druka, A., Luo, Z., Wise, R., Waugh, R. and Kearsey, M. (2008) Gene
expression quantitative trait locus analysis of 16 000 barley genes reveals a complex
pattern of genome-wide transcriptional regulation. Plant J., 53, 90-101.
R Development Core Team (2008) R: A Language and Environment for Statistical
Computing: R Foundation for Statistical Computing, Vienna, Austria. Available at:
http://www.R-project.org, ISBN 3-900051-07-0.
Riano-Pachon, D.M., Ruzicic, S., Dreyer, I. and Mueller-Roeber, B. (2007) PlnTFDB: an
integrative plant transcription factor database. BMC Bioinformatics, 8, 42.
Rieseberg, L.H., Widmer, A., Arntz, A.M. and Burke, J.M. (2003) The genetic architecture
necessary for transgressive segregation is common in both natural and domesticated
populations. Philos T Roy Soc B, 358, 1141-1147.
Royston, P., (1995) Remark AS R94: A remark on Algorithm AS 181: The W test for
normality. Applied Statistics, 44, 547–551
Schadt, E.E., Monks, S.A., Drake, T.A., Lusis, A.J., Che, N., Colinayo, V., Ruff, T.G.,
Milligan, S.B., Lamb, J.R., Cavet, G., Linsley, P.S., Mao, M., Stoughton, R.B. and
Friend, S.H. (2003) Genetics of gene expression surveyed in maize, mouse and man.
Nature, 422, 297-302.
Sun, X., Cao, Y., Yang, Z., Xu, C., Li, X., Wang, S. and Zhang, Q. (2004) Xa26, a gene
conferring resistance to Xanthomonas oryzae pv. oryzae in rice, encodes an LRR receptor
kinase-like protein. Plant J., 37, 517-527.
Tan, Y.F., Li, J.X., Yu, S.B., Xing, Y.Z., Xu, C.G. and Zhang, Q.F. (1999) The three

important traits for cooking and eating quality of rice grains are controlled by a single
locus in an elite rice hybrid, Shanyou 63. Theor. Appl. Genet., 99, 642-648.
Tan, Y.F., Sun, M., Xing, Y.Z., Hua, J.P., Sun, X.L., Zhang, Q.F. and Corke, H. (2001)
Mapping quantitative trait loci for milling quality, protein content and color characteristics
of rice using a recombinant inbred line population derived from an elite rice hybrid. Theor.
Appl. Genet., 103, 1037-1045.
Tan, Y.F., Xing, Y.Z., Li, J.X., Yu, S.B., Xu, C.G. and Zhang, Q.F. (2000) Genetic bases of
appearance quality of rice grains in Shanyou 63, an elite rice hybrid. Theor. Appl. Genet. ,
101, 823–829.
Tukey, J.W. (1977) Exploratory data analysis. Reading, Massachusetts: Addison-Wesley.
Vázquez, E., Montiel, F. and Vázquez-Ramos, J.M. (1991) DNA ligase activity in
deteriorated maize embryo axes during germination: a model relating defects in DNA
metabolism in seeds to loss of germinability. Seed Sci. Res., 1, 269-273.
Vazquez-Ramos, J.M. and Sanchez, M.D. (2003) The cell cycle and seed germination. Seed
Sci. Res., 13, 113-130.
Wang, M., Hu, X., Li, G., Leach, L.J., Potokina, E., Druka, A., Waugh, R., Kearsey, M.J.
and Luo, Z. (2009) Robust detection and genotyping of single feature polymorphisms
from gene expression data. PLoS Comput. Biol., 5, e1000317.
Wang, L., Xie, W., Chen, Y., Tang, W., Yang, J., Ye, R., Liu, L., Lin, Y., Xu, C., Xiao, J.
and Zhang, Q. (2010) A dynamic gene expression atlas covering the entire life cycle of
rice. Plant J, 61, 752–766.
West, M.A.L., Kim, K., Kliebenstein, D.J., Leeuwen, H., Michelmore, R.W., Doerge, R.W.

and Clair, D.A. (2007) Global eQTL mapping reveals the complex genetic architecture of
transcript-level variation in Arabidopsis. Genetics, 175, 1441-1450.
West, M.A.L., Leeuwen, H., Kozik, A., Kliebenstein, D.J., Doerge, R.W., Clair, D.A. and
Michelmore, R.W. (2006) High-density haplotyping with microarray-based expression
and single feature polymorphism markers in Arabidopsis. Genome Res., 16, 787-795.
Wright, S. (1968) Evolution and the genetics of populations. Chicago: University of Chicago
Press.
Wu, C., Li, X., Yuan, W., Chen, G., Kilian, A., Li, J., Xu, C., Zhou, D.X., Wang, S. and
Zhang, Q. (2003) Development of enhancer trap lines for functional analysis of the rice
genome. Plant J., 35, 418-427.
Xie, W., Chen, Y., Zhou, G., Wang, L., Zhang, C., Zhang, J., Xiao, J., Zhu, T. and Zhang,
Q. (2009) Single feature polymorphisms between two rice cultivars detected using a
median polish method. Theor. Appl. Genet., 119, 151-164.
Xing, Y. and Zhang, Q. (2010) Genetic and molecular basis of rice yield. Annu. Rev. Plant
Biol., 61, 421-442.
Xing, Y.Z., Tan, Y.F., Hua, J.P., Sun, X.L., Xu, C.G. and Zhang, Q. (2002)
Characterization of the main effects, epistatic effects and their environmental interactions
of QTLs on the genetic basis of yield traits in rice. Theor. Appl. Genet., 105, 248-257.
Xu, C.G., Li, X.Q., Xue, Y., Huang, Y.W., Gao, J. and Xing, Y.Z. (2004) Comparison of
quantitative trait loci controlling seedling characteristics at two seedling stages using rice
recombinant inbred lines. Theor. Appl. Genet., 109, 640-647.
Xue, W., Xing, Y., Weng, X., Zhao, Y., Tang, W., Wang, L., Zhou, H., Yu, S., Xu, C., Li, X.
and Zhang, Q. (2008) Natural variation in Ghd7 is an important regulator of heading date
and yield potential in rice. Nat. Genet., 40, 761-767.
Yu, S.B., Li, J.X., Xu, C.G., Tan, Y.F., Gao, Y.J., Li, X.H., Zhang, Q. and Saghai Maroof,
M.A. (1997) Importance of epistasis as the genetic basis of heterosis in an elite rice hybrid.
Proc. Natl Acad. Sci. USA, 94, 9226-9231.
Yu, S.B., Li, J.X., Xu, C.G., Tan, Y.F., Li, X.H. and Zhang, Q. (2002) Identification of
quantitative trait loci and epistatic interactions for plant height and heading date in rice.
Theor. Appl. Genet., 104, 619-625.
Yvert, G., Brem, R.B., Whittle, J., Akey, J.M., Foss, E., Smith, E.N., Mackelprang, R.
and Kruglyak, L. (2003) Trans-acting regulatory variation in Saccharomyces cerevisiae
and the role of transcription factors. Nat. Genet., 35, 57-64.
Zeng, Z.B. (1993) Theoretical basis for separation of multiple linked gene effects in mapping
quantitative trait loci. Proc. Natl Acad. Sci. USA, 90, 10972-10976.
Zeng, Z.B. (1994) Precision mapping of quantitative trait loci. Genetics, 136, 1457-1468.
Supporting information
Figure S1. An example of median polish.
Figure S2. Comparison of genotyping of R001 with 1,655 SFP/PCR markers (left)
and 200 RFLP/ SSR markers (right).
Figure S3 Fifteen types patterns of bimodal distributions displayed by 24.3% of the
e-traits.
Figure S4. Distributions of correlation coefficients in hotspots involving DNA
metabolism process.
Table S1. Information of the 23 PCR-based markers used in this study.
Table S2. Genotypes and map information for all 1,655 SFP/PCR markers for the 110
RILs from Zhenshan 97 × Minghui 63 cross.
Table S3. Genotypes and map information for 200 RFLP/SSR markers in previous
study for the 110 RILs.
Table S4. Genotypes and map information for 601 marker bins for the 110 RILs.
Table S5. Details of 26,051 significant gene expression quantitative trait loci (eQTLs)
(P<0.05), affecting the expression of 16,372 rice unique probesets.
Table S6. Significant GO terms in each eQTL hotspot.
Table S7. The number of potential target genes for TFs with cis-eQTL in its supported
interval.
Table S8. The number of potential target genes for e-traits with cis-eQTL in its
supported interval.
Table S9. The QTLs identified for shoot dry weight.
Table S10. Correlations between phenotype values of shoot dry weight and
expression levels of the e-traits located in the 1.5 LOD-drop support intervals in
overlapped regions between cis/trans-eQTLs with pQTLs.

Tables
Table 1. The number of markers obtained in SFP detection and genetic bin map
construction obtained in each of the steps.
Process Markers
Pre-genotypinga 3,504
Post-genotypingb 2,421
Number of probesets with SFPsc 1,731
With addition of PCR-based markersd 1,754
Filtering unincorporated markerse 1,655
Grouping into binsf 601
aRunning the program SFPdet to obtain candidate SFP markers.
bGenotyping each RIL according to the genotypes of the two replicates and removing the SFP
markers with >10% missing data.
cSelecting the SFP with least missing data in a probeset.
d23 PCR-based markers added to fill in the gaps.
eFiltering the markers unincorporated into the genetic map and correcting some double crossover
genotypes.
fGrouping all the markers into bins according to the recombination breakpoints and calculating
genetic distance.
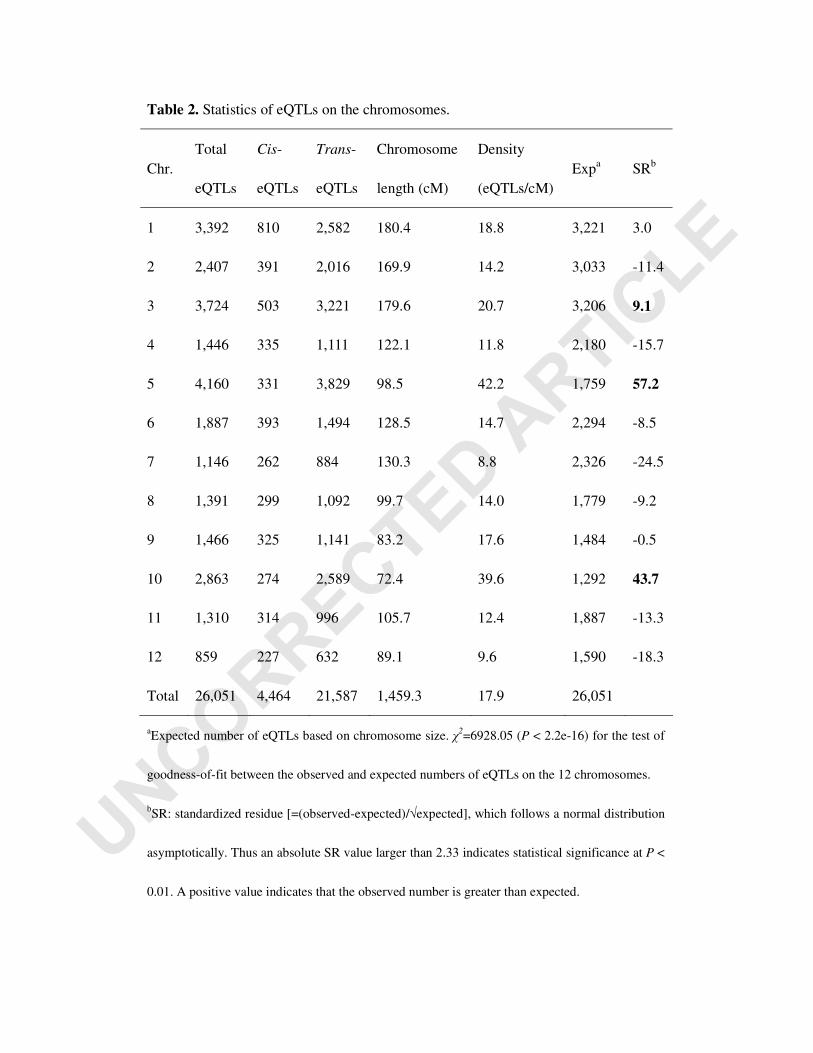
Table 2. Statistics of eQTLs on the chromosomes.
Chr. Total
eQTLs
Cis-
eQTLs
Trans-
eQTLs
Chromosome
length (cM)
Density
(eQTLs/cM) Expa SRb
1 3,392 810 2,582 180.4 18.8 3,221 3.0
2 2,407 391 2,016 169.9 14.2 3,033 -11.4
3 3,724 503 3,221 179.6 20.7 3,206 9.1
4 1,446 335 1,111 122.1 11.8 2,180 -15.7
5 4,160 331 3,829 98.5 42.2 1,759 57.2
6 1,887 393 1,494 128.5 14.7 2,294 -8.5
7 1,146 262 884 130.3 8.8 2,326 -24.5
8 1,391 299 1,092 99.7 14.0 1,779 -9.2
9 1,466 325 1,141 83.2 17.6 1,484 -0.5
10 2,863 274 2,589 72.4 39.6 1,292 43.7
11 1,310 314 996 105.7 12.4 1,887 -13.3
12 859 227 632 89.1 9.6 1,590 -18.3
Total 26,051 4,464 21,587 1,459.3 17.9 26,051
aExpected number of eQTLs based on chromosome size. χ2=6928.05 (P < 2.2e-16) for the test of
goodness-of-fit between the observed and expected numbers of eQTLs on the 12 chromosomes.
bSR: standardized residue [=(observed-expected)/√expected], which follows a normal distribution
asymptotically. Thus an absolute SR value larger than 2.33 indicates statistical significance at P <
0.01. A positive value indicates that the observed number is greater than expected.

Figure legends
Figure 1. Haplotypes and genetic positions of 601 marker bins for 110 RILs.
The big color box shows the haplotypes, in which each row represents a RIL, and a
column corresponds to one of the bins, arranged (left to right) in physical order based
on rice TIGR5.0. The 12 rice linkage groups are laid end-to-end and are separated by
vertical black lines. The genetic position of each bin in the genome is depicted at the
bottom. The length of the genetic map is 1,459 cM. Red boxes, Zhenshan 97
genotype; Blue boxes, Minghui 63 genotype; White boxes, missing genotype.
Figure 2. eQTLs identified using shoot tissue of germinating seeds of RILs from
a cross between Zhenshan 97 and Minghui 63.
The x-axis shows the genomic positions of expressed probesets (e-traits), and y-axis
indicates the genetic positions of eQTLs. Rice 12 chromosomes are separated by grey
lines. The color-key reflects the logarithm of the odds (LOD) scores (LOD scores
greater than 100 are set to 100). LOD scores more than 3.12 were adopted as the
cutoff point for eQTLs.
Figure 3. Distribution of R2 values for cis-eQTLs and trans-eQTLs individually.
(a) The histogram of R2 values for 4,464 cis-eQTLs.
(b) The histogram of R2 values for 21,587 trans-eQTLs.

Figure 4. Distribution of eQTLs in the rice genome.
The x-axis indicates genomic locations by chromosomal order. The number of eQTLs
(y-axis) is plotted against genome location in intervals of 1 cM. The horizontal line
indicates the threshold for eQTL hotspots, represented by the maximum number of
eQTLs expected to fall into any interval by chance alone with genome-wide P=0.05.
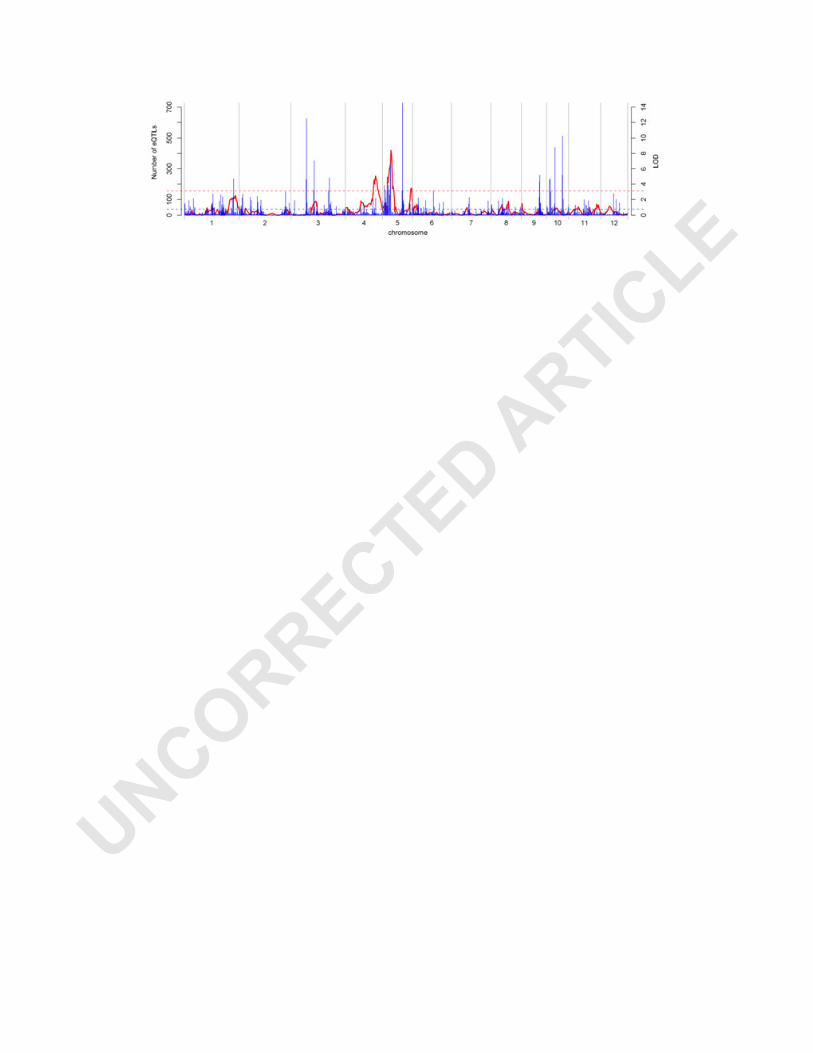
Figure 5. Comparative distributions of eQTL hotspots and pQTLs for shoot dry
weight.
Numbers of eQTLs in intervals of 1 cM are given in blue. LOD statistics of pQTLs
for shoot dry weight along the 12 chromosomes are indicated in red. The left y-axis
shows the number of eQTLs, with the horizontal blue line showing the global eQTL
hotspot threshold 39. The right y-axis shows the LOD scores of QTLs for shoot dry
weight, with the horizontal red line indicating the LOD threshold 3.12.